1 Predictability of Northwest Pacific climate during summer and the role of the Tropical Indian Ocean J. S. Chowdary 1 , Shang-Ping Xie 1,2 , Jing-Jia Luo 3 , Jan Hafner 1 , Swadhin Behera 3 , Yukio Masumoto 3,4 , and Toshio Yamagata 3,4 1 International Pacific Research Center, University of Hawaii at Manoa, Honolulu, Hawaii 2 Department of Meteorology, University of Hawaii at Manoa, Honolulu, Hawaii 3 Frontier Research Center for Global Change, JAMSTEC, Yokohama, Japan 4 Department of Earth and Planetary Science, The University of Tokyo, Tokyo Climate Dynamics June 17, 2009, Submitted September 30, 2009, Revised ____________________ Corresponding author: J. S. Chowdary, IPRC, SOEST, University of Hawaii at Manoa, Honolulu, HI 96822 E-mail: [email protected]

Welcome message from author
This document is posted to help you gain knowledge. Please leave a comment to let me know what you think about it! Share it to your friends and learn new things together.
Transcript
1
Predictability of Northwest Pacific climate during summer and
the role of the Tropical Indian Ocean
J. S. Chowdary1, Shang-Ping Xie1,2, Jing-Jia Luo3, Jan Hafner1, Swadhin Behera3,
Yukio Masumoto3,4, and Toshio Yamagata3,4
1 International Pacific Research Center, University of Hawaii at Manoa, Honolulu,
Hawaii
2 Department of Meteorology, University of Hawaii at Manoa, Honolulu, Hawaii
3 Frontier Research Center for Global Change, JAMSTEC, Yokohama, Japan
4 Department of Earth and Planetary Science, The University of Tokyo, Tokyo
Climate Dynamics
June 17, 2009, Submitted
September 30, 2009, Revised
____________________
Corresponding author: J. S. Chowdary, IPRC, SOEST, University of Hawaii at Manoa,
Honolulu, HI 96822
E-mail: [email protected]
2
ABSTRACT
A seasonal forecast system based on a global, fully coupled ocean-atmosphere
general circulation model is used to (i) evaluate the interannual predictability of the
Northwest Pacific climate during June-August following El Niño [JJA(1)], and
(ii) examine the contribution from the tropical Indian Ocean (TIO) variability. The model
retrospective forecast for 1983-2006 captures major modes of atmospheric variability
over the Northwest Pacific during JJA(1), including a rise in sea level pressure (SLP), an
anomalous anticyclone at the surface, and a reduction in subtropical rainfall, and
increased rainfall to the northeast over East Asia. The anomaly correlation coefficient
(ACC) for the leading principal components (PCs) of SLP and rainfall stays above 0.5 for
lead time up to 3-4 months. The predictability for zonal wind is slightly better. An
additional experiment is performed by prescribing the SST climatology over the TIO. In
this run, designated as NoTIO, the Northwest Pacific anticyclone during JJA(1) weakens
considerably and reduces its westward extension. Without an interactive TIO, the ACC
for PC prediction drops significantly.
To diagnose the TIO effect on the circulation, the differences between the two
runs (Control minus NoTIO) are analyzed. The diagnosis shows that El Nino causes the
TIO SST to rise and to remain high until JJA(1). In response to the higher than usual SST,
precipitation increases over the TIO and excites a warm atmospheric Kelvin wave, which
propagates into the western Pacific along the equator. The decrease in equatorial SLP
drives northeasterly wind anomalies, induces surface wind divergence, and suppresses
convection over the subtropical Northwest Pacific. An anomalous anticyclone forms in
the Northwest Pacific, and the intensified moisture transport on its northwest flank causes
3
rainfall to increase over East Asia. In the NoTIO experiment, the Northwest Pacific
anticyclone weakens but does not disappear. Other mechanisms for maintaining this
anomalous circulation are discussed.
Keywords ENSO, Tropical Indian Ocean, atmospheric Kelvin wave, Northwest Pacific
climate and rainfall prediction
4
1. Introduction
Boreal summer (JJA) is the major rainy season for East Asia, and prediction of
summer rainfall is of great socio-economic value to this highly populated region.
Summer rainfall variability in subtropical/mid-latitude (20°-40°N) East Asia is tied to the
westward extension of the subtropical high (anticyclone) in the Northwest (NW) Pacific
(10°-30°N) (Huang et al. 2004), both in turn correlate with the El Niño-Southern
Oscillation (ENSO) (Zhang et al. 1996; Harrison and Larkin 1996; Wang et al. 2003).
The great flood in the summer of 1998 in the Yangtze River Valley is an example. This
delayed response to ENSO is puzzling given the weak sea surface temperature (SST)
anomalies in the equatorial Pacific during JJA following an ENSO event. [Hereafter, we
denote summers during the developing and decay years of El Niño as JJA(0) and JJA(1),
respectively]. Noting that the local correlation between SST and precipitation is weak or
negative over the NW Pacific during summer, Xie et al. (2009) suggest that the delayed
response to ENSO over the subtropical NW Pacific and East Asia during JJA(1) is due to
the persistent warming of the tropical Indian Ocean (TIO; Yang et al. 2007). The purpose
of the present study is two-fold—to assess the skill in predicting JJA(1) atmospheric
anomalies over the NW Pacific and to investigate the TIO SST contributions to the skill.
The study will use a dynamical forecast system based on a state-of-the-art coupled
ocean-atmosphere general circulation model (GCM).
El Niño induces SST warming over the TIO and tropical Atlantic. A basin-wide
warming, which peaks one season after the peak phase of El Niño, is due to net surface
heat gains (Klein et al. 1999; Du et al. 2009) over large parts of the TIO, except for the
southwestern basin where downwelling ocean Rossby waves are important (Xie et al.
5
2002; Huang and Kinter 2002; Luo et al. 2005b; Schott et al. 2009). There is
observational evidence that during spring and early summer following El Niño, flux
changes due to wind anomalies is part of the internal ocean-atmosphere interaction in the
TIO and is anchored by the slow propagation of south TIO Rossby waves (Izumo et al.
2008; Du et al. 2009). The El Niño-induced TIO warming persists into the spring and
early summer and affects the surrounding climate including the NW Pacific (Annamalai
et al. 2005; Yang et al. 2007; Xie et al. 2009; Park et al. 2009).
Anticyclonic anomalies develop in the lower troposphere over the NW Pacific
during the mature El Niño phase and persist through the following summer (Harrison and
Larkin 1996). The anomalous anticyclone is a key system that links the eastern central
Pacific warming and the East Asian winter monsoon (Wang et al. 2000). During JJA(1),
rainfall decreases over the subtropical NW Pacific but increases over the mid-latitude
Meiyu/Baiu frontal system (Zhang et al. 1996; Kawamura 1998; Wang et al. 2000, 2003).
The SST anomalies are negative (positive) east (west) of the anticyclone center over the
NW Pacific in the summer following El Niño.
Wang et al. (2000) propose a local air-sea interaction mechanism for the
development of the NW Pacific anticyclone, with a positive thermodynamic feedback
between the anomalous anticyclone and sea surface cooling in the presence of mean
northeasterly trades. This local feedback is not applicable to the persistence of the
summer anticyclone because there is a very weak (or negative) correlation between local
SST and rainfall. Xie et al. (2009) propose that the summer NW Pacific anticyclone is
instead induced remotely by the TIO SST warming by an atmospheric Kelvin
wave-induced Ekman divergence mechanism described as follows. The TIO surface
6
warming causes tropospheric temperature (TT) to increase by a moist adiabatic
adjustment in deep convection, emanating a baroclinic Kelvin wave into the Pacific. This
equatorial atmospheric Kelvin wave induces northeasterly surface wind anomalies over
the subtropical NW Pacific, and the resultant divergence in the subtropics triggers
suppressed convection. The anomalies of convection and anticyclone are then amplified
by this interaction. This mechanism spotlights the importance of the TIO basin-wide
warming remote influence on the JJA(1) NW Pacific anticyclone. Lee et al. (2005) also
hinted at the importance of the TIO warming, suggesting that enhanced convection over
the Bay of Bengal in summer and subsidence in the NW Pacific help maintain the
anticyclonic circulation. The TIO influence on NW Pacific climate has been studied
previously using atmospheric GCMs (Annamalai et al. 2005; Lau and Ploshay 2009) and
a coupled GCM under idealized initial conditions (Yang et al. 2007).
The present study investigates the role of the TIO in climate variability over the
NW Pacific and East Asia during JJA(1) using a coupled ocean-atmosphere model
forecast system. Assimilating only observed SSTs in the coupled model for initial
condition generation, the forecast system displays skillful forecasts of tropical SST
anomalies at lead as large as 16-24 months (Luo et al. 2008). Our evaluation of the
system’s forecasts over the NW Pacific indicates that even at leads of several months it
has skill in predicting atmospheric anomalies during summer, including the anomalous
anticyclone following El Niño. Twin forecast experiments are conducted, one set with an
interactive air-sea coupling in the TIO and one with the prescription of climatological
SST over the TIO. We show that an interactive TIO contributes to increasing the skill of
atmospheric anomaly forecasts over the NW Pacific by as much as 50%. The use of a
7
realistic forecast system enables us to study the predictability of the NW Pacific climate
and TIO contributions in a realistic setting, extending previous observational and
atmospheric GCM studies.
The rest of the paper is organized as follows. Section 2 provides a description of
the model, experimental design and data, and a preliminary assessment of model skill
during JJA. Section 3 presents a case study of climate anomalies during summer 1998.
Section 4 evaluates model skill in predicting NW Pacific anomalies and the role of the
TIO basin-wide warming during summer following El Niño and section 5 provides a
summary.
2. Model and preliminary assessment
Our analysis is based on output from the Scale Interaction Experiment (SINTEX)
global ocean-atmosphere coupled GCM (Gualdi et al. 2003) modified and improved at
the Frontier Research Center for Global Change (SINTEX-F), Japan (Luo et al. 2005a).
The atmospheric component is the ECHAM 4.6 (Roeckner et al. 1996) with T106
spectral resolution and 19 vertical hybrid sigma-pressure levels. The oceanic component
is OPA8.2 with 2° resolution in longitude, and a latitudinal resolution that increases to
0.5° within 2° of the equator. It has 31 layers in the vertical (Madec et al. 1998). The
SINTEX-F has shown remarkable skill in simulating Indian and Pacific Ocean climate
variability (Luo et al. 2005ab, 2008; Yamagata et al. 2004; Masson et al. 2005; Behera et
al. 2005; Tozuka et al. 2005). We perform nine-member ensemble retrospective forecasts
for 12 target months from the first day of each month during 1983-2006. The nine
members are generated on the basis of three different coupling physics (i.e., three
8
different models) with three different initial conditions for each model (Luo et al. 2008).
A simple initialization method is adopted by assimilating the observed SSTs in the
coupled model to generate well-balanced ocean-atmosphere initial conditions for
forecasts, which reduces the initial shock. Details of the model and initialization are
discussed by Luo et al. (2005ab, 2008). The results presented here are based on the
nine-member ensemble mean anomalies.
In the control run, the atmosphere and global ocean are fully interactive. An
additional TIO air-sea decoupled run (NoTIO) is performed where the monthly mean
climatology of Reynolds et al. (2002) SST is prescribed in the TIO between 25°S and
25°N. By decoupling the ocean and atmosphere in the TIO, we aim to isolate its effect on
climate elsewhere. Forecast anomalies are computed for each ensemble member relative
to its own climatology (see also Luo et al. 2008).
Model results are compared with Reynolds et al. (2002) SST, with the National
Centers for Environmental Prediction (NCEP) reanalysis 2 (Kanamitsu et al. 2002) for
sea level pressure (SLP), geopotential height and winds at the surface and 850 hPa level,
and with the Center for Climate Prediction merged analysis of precipitation (CMAP; Xie
and Arkin 1996). Here, tropospheric temperature is represented by the geopotential height
anomaly difference between 200 and 850 hPa. In general, the model reproduces the
observations well. Thus, this forecast model is used to evaluate the predictability of the
NW Pacific climate in summer following El Niño and to test the TIO basin-wide
warming effects on the summer anticyclone over the subtropical NW Pacific. The latter
tests the Indian Ocean capacitor hypothesis (Xie et al. 2009) from a TIO decoupling
experiment in the forecast coupled GCM. We first evaluate the skill of the model at one,
9
three, and six months lead prediction of the seasonal (JJA) SST and precipitation
anomalies over the Pacific Ocean.
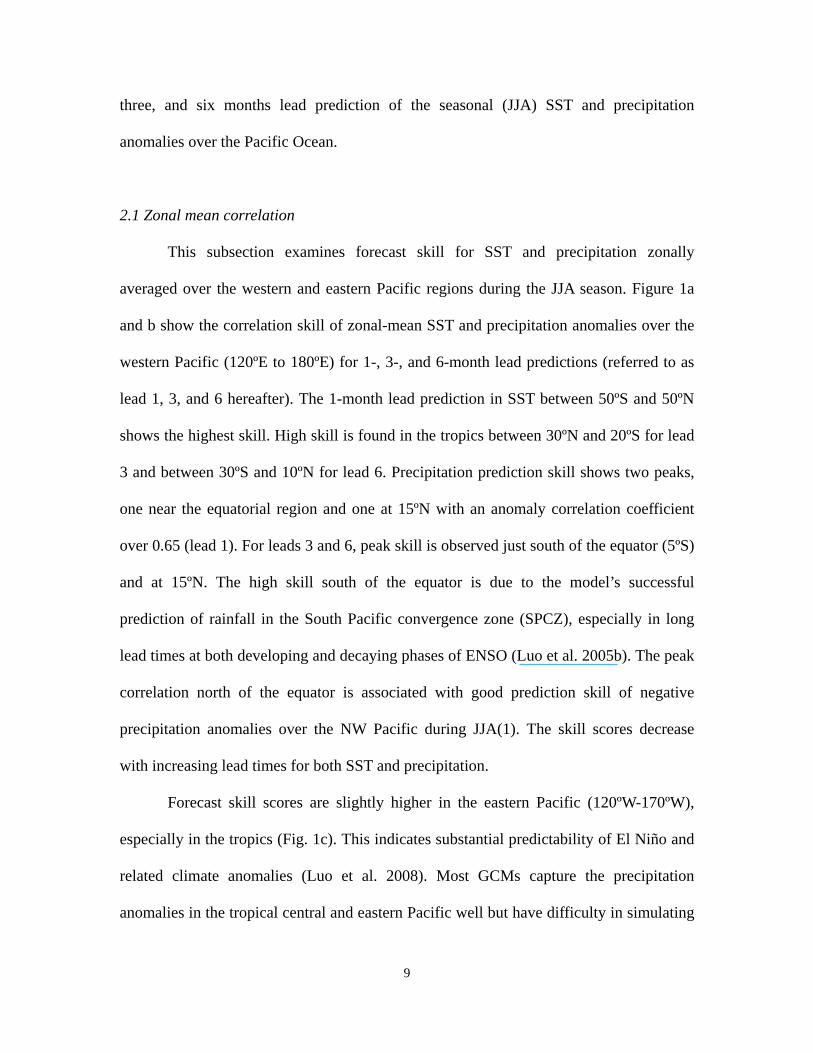
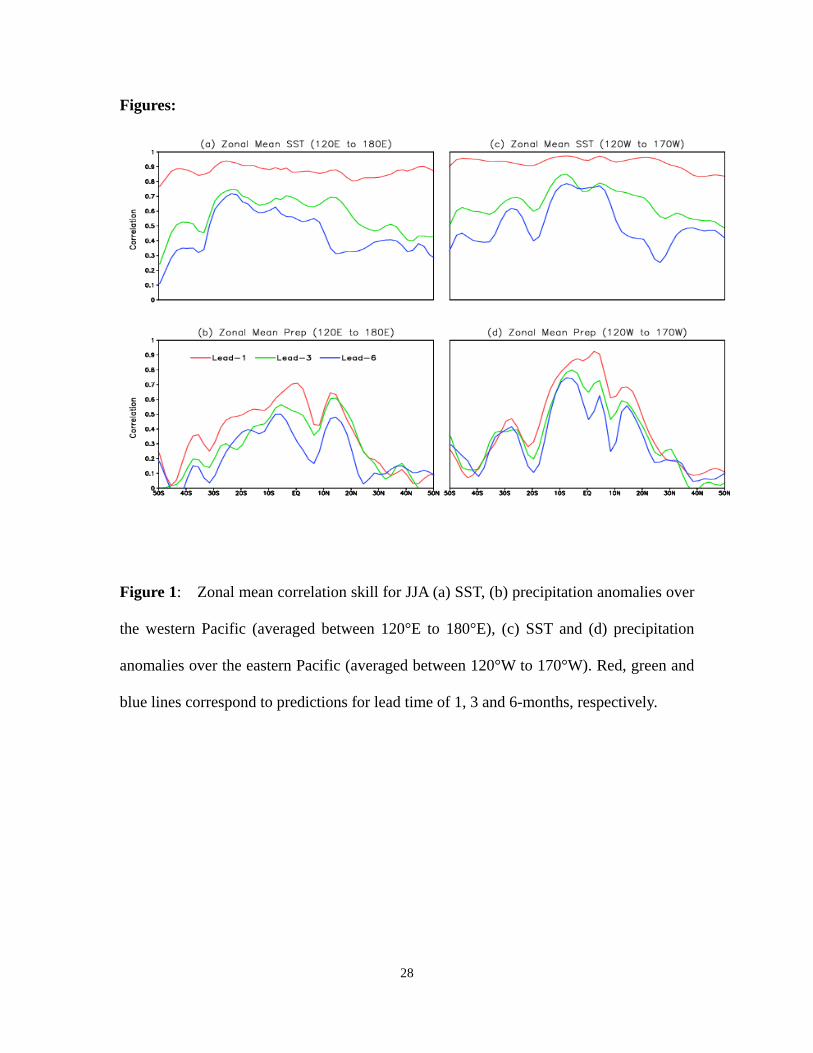
2.1 Zonal mean correlation
This subsection examines forecast skill for SST and precipitation zonally
averaged over the western and eastern Pacific regions during the JJA season. Figure 1a
and b show the correlation skill of zonal-mean SST and precipitation anomalies over the
western Pacific (120ºE to 180ºE) for 1-, 3-, and 6-month lead predictions (referred to as
lead 1, 3, and 6 hereafter). The 1-month lead prediction in SST between 50ºS and 50ºN
shows the highest skill. High skill is found in the tropics between 30ºN and 20ºS for lead
3 and between 30ºS and 10ºN for lead 6. Precipitation prediction skill shows two peaks,
one near the equatorial region and one at 15ºN with an anomaly correlation coefficient
over 0.65 (lead 1). For leads 3 and 6, peak skill is observed just south of the equator (5ºS)
and at 15ºN. The high skill south of the equator is due to the model’s successful
prediction of rainfall in the South Pacific convergence zone (SPCZ), especially in long
lead times at both developing and decaying phases of ENSO (Luo et al. 2005b). The peak
correlation north of the equator is associated with good prediction skill of negative
precipitation anomalies over the NW Pacific during JJA(1). The skill scores decrease
with increasing lead times for both SST and precipitation.
Forecast skill scores are slightly higher in the eastern Pacific (120ºW-170ºW),
especially in the tropics (Fig. 1c). This indicates substantial predictability of El Niño and
related climate anomalies (Luo et al. 2008). Most GCMs capture the precipitation
anomalies in the tropical central and eastern Pacific well but have difficulty in simulating
10
anomalies over the western Pacific or Maritime Continent (Kang et al. 2002). Figure 1d
shows a precipitation correlation up to 0.9 at 1-month lead near the equator. Both SST
and precipitation show reasonable skill near the equator for 3 and 6 months lead
predictions.
Forecast skill of SST for other seasons has been examined in Luo et al. (2005b,
2008). Using a multi-model ensemble (of which SINTEX-F is part), Wang et al. (2008)
examine the forecast skill over the Indo-western Pacific region at one-month lead,
reporting higher skill for precipitation and circulation during JJA(1) than JJA(0). The
present paper extends these studies by evaluating the skill of SINTEX in predicting
atmospheric anomalies for JJA(1) at various lead times and by studying the TIO effect.
3. A case study of 1998 summer
This section examines the forecasts for JJA 1998, followed by a statistical
evaluation of the forecasts for 1983-2006 in the next section. The 1997-98 El Niño is
recognized as the strongest event on instrumental records. While SST anomalies in the
eastern equatorial Pacific turn negative in May 1998 (McPhaden 1999), pronounced El
Niño-induced anomalies persist through the 1998 summer, especially in the TIO-NW
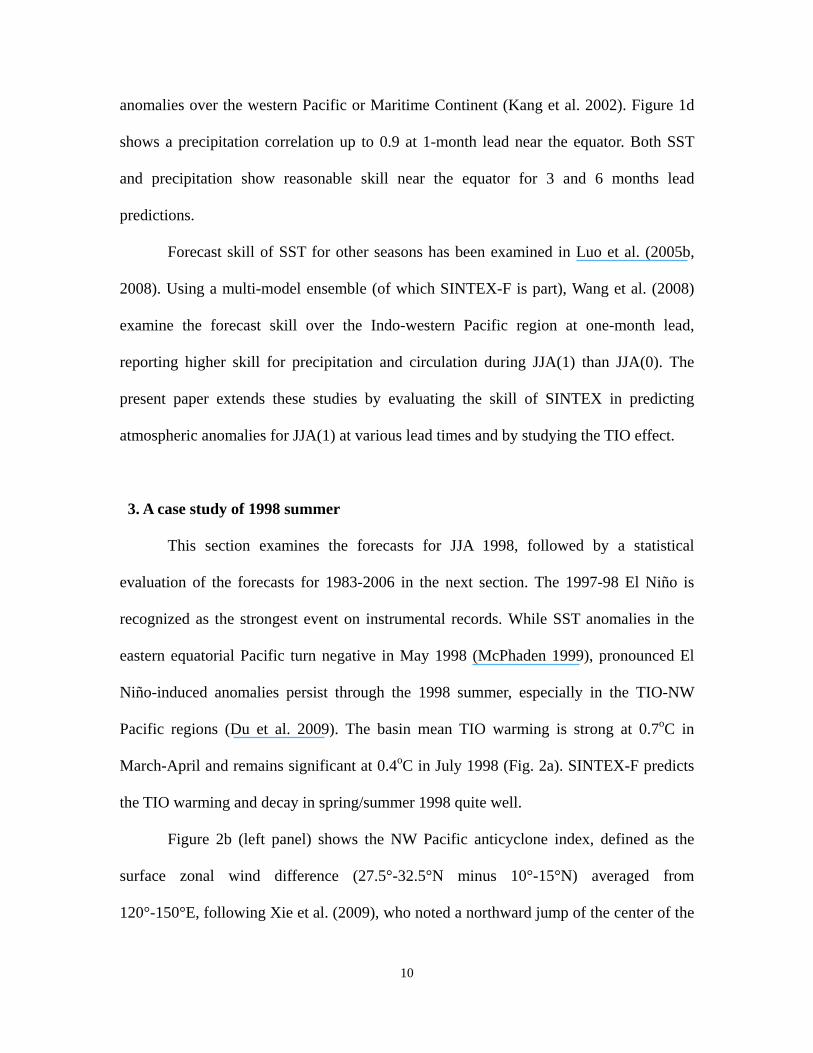
Pacific regions (Du et al. 2009). The basin mean TIO warming is strong at 0.7oC in
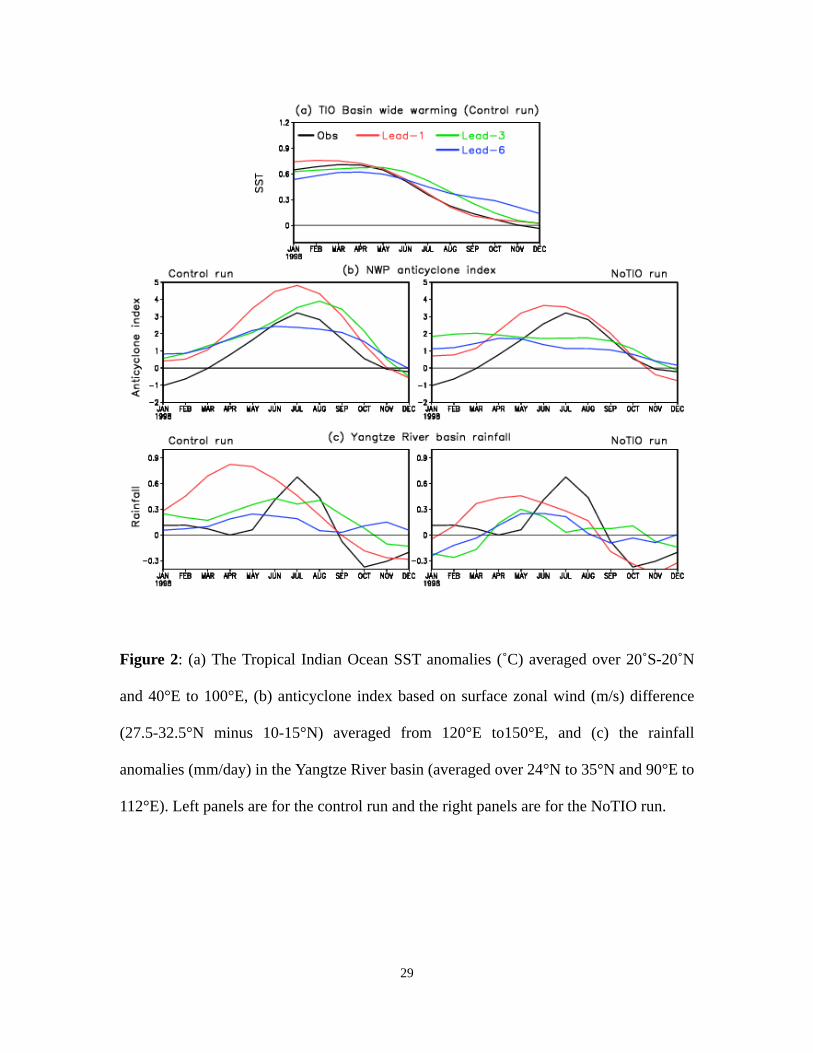
March-April and remains significant at 0.4oC in July 1998 (Fig. 2a). SINTEX-F predicts
the TIO warming and decay in spring/summer 1998 quite well.
Figure 2b (left panel) shows the NW Pacific anticyclone index, defined as the
surface zonal wind difference (27.5°-32.5°N minus 10°-15°N) averaged from
120°-150°E, following Xie et al. (2009), who noted a northward jump of the center of the
11
anomalous anticyclone during April-May following El Niño. This index is designed to
properly capture the summer circulation anomalies. The temporal evolution of the
anticyclone index is well predicted in the model and includes a peak around summer
1998, although the peak amplitude index is slightly too high in the hindcast. In the
NoTIO run, the predicted anticyclone index is reduced in magnitude, especially at longer
lead times (Fig. 2b; right panel), suggestive of a TIO effect.
The Yangtze River basin witnessed major floods during JJA 1998. The model
predicts the precipitation increase over the Yangtze River basin (Fig. 2c; averaged over
24°N to 35°N and 90°E to 112°E), but with an excessive peak in April-May for the one
month lead. On the other hand, the predicted rainfall anomalies are too weak for the 3-
and 6-month leads. These errors illustrate the difficulty in simulating Meiyu rainfall over
China. In NoTIO, predicted rainfall anomalies decrease for all leads. The TIO effect on
the NW anticyclone is related to the Yangtze River rainfall through the southerlies on the
northwest flank of the circulation.
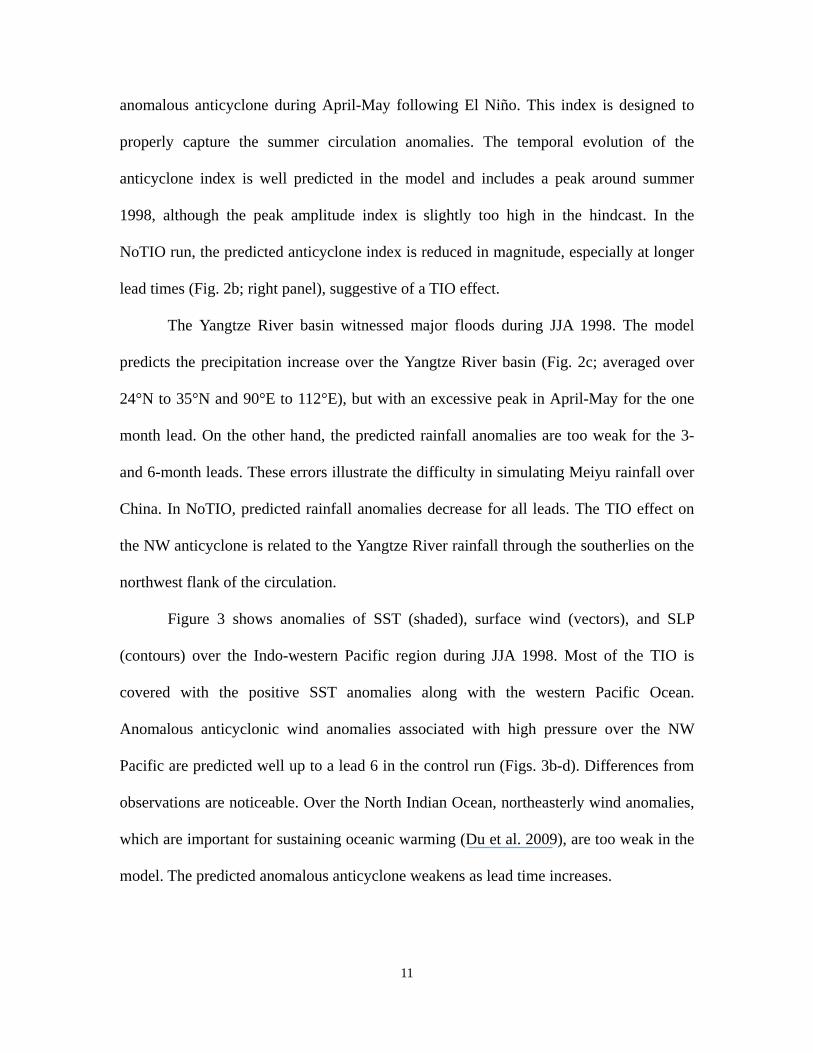
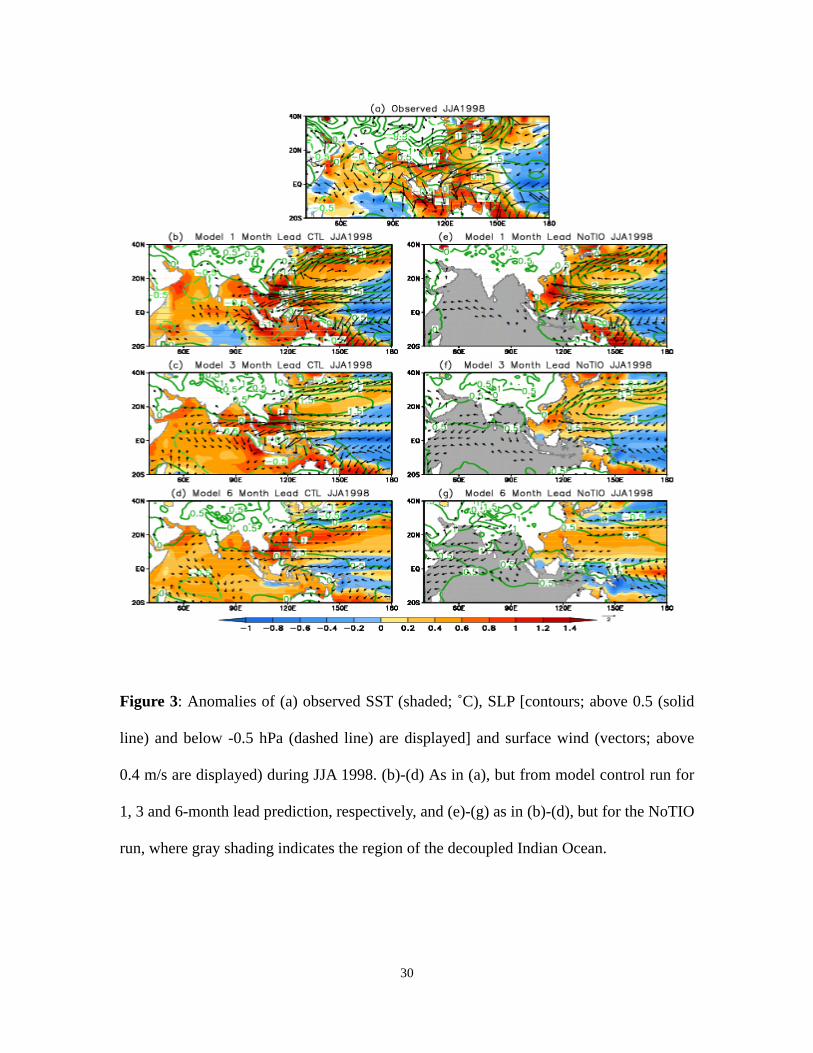
Figure 3 shows anomalies of SST (shaded), surface wind (vectors), and SLP
(contours) over the Indo-western Pacific region during JJA 1998. Most of the TIO is
covered with the positive SST anomalies along with the western Pacific Ocean.
Anomalous anticyclonic wind anomalies associated with high pressure over the NW
Pacific are predicted well up to a lead 6 in the control run (Figs. 3b-d). Differences from
observations are noticeable. Over the North Indian Ocean, northeasterly wind anomalies,
which are important for sustaining oceanic warming (Du et al. 2009), are too weak in the
model. The predicted anomalous anticyclone weakens as lead time increases.
12
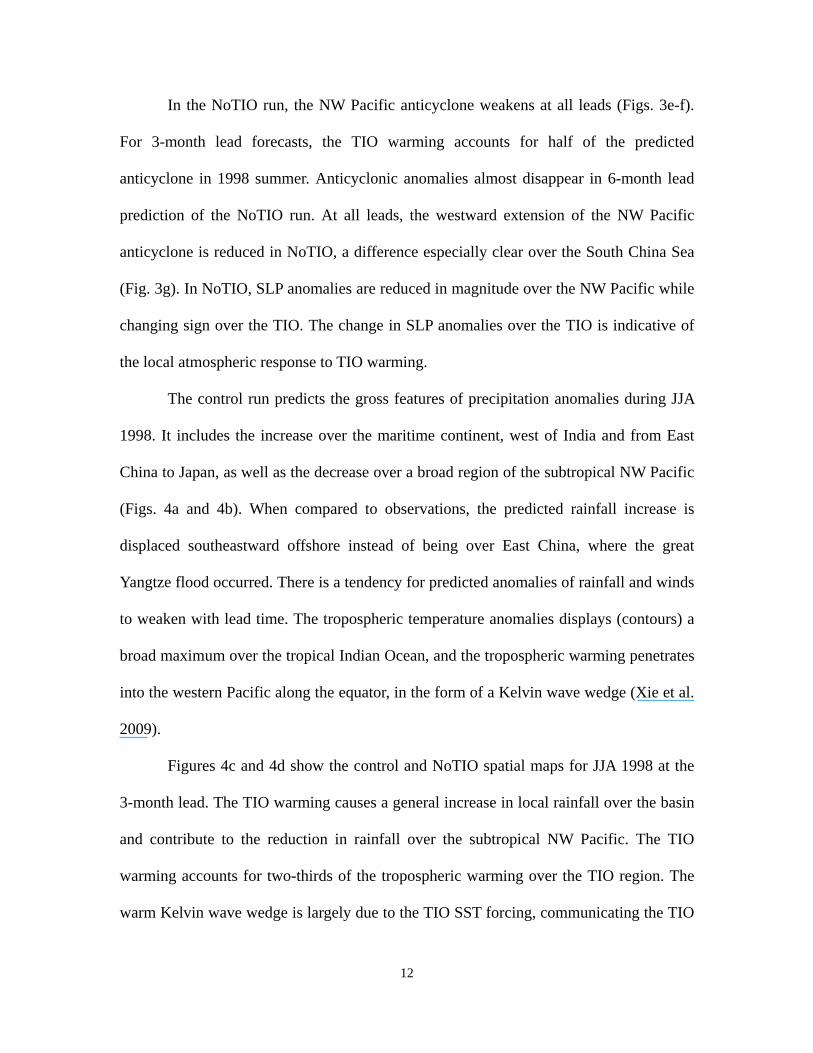
In the NoTIO run, the NW Pacific anticyclone weakens at all leads (Figs. 3e-f).
For 3-month lead forecasts, the TIO warming accounts for half of the predicted
anticyclone in 1998 summer. Anticyclonic anomalies almost disappear in 6-month lead
prediction of the NoTIO run. At all leads, the westward extension of the NW Pacific
anticyclone is reduced in NoTIO, a difference especially clear over the South China Sea
(Fig. 3g). In NoTIO, SLP anomalies are reduced in magnitude over the NW Pacific while
changing sign over the TIO. The change in SLP anomalies over the TIO is indicative of
the local atmospheric response to TIO warming.
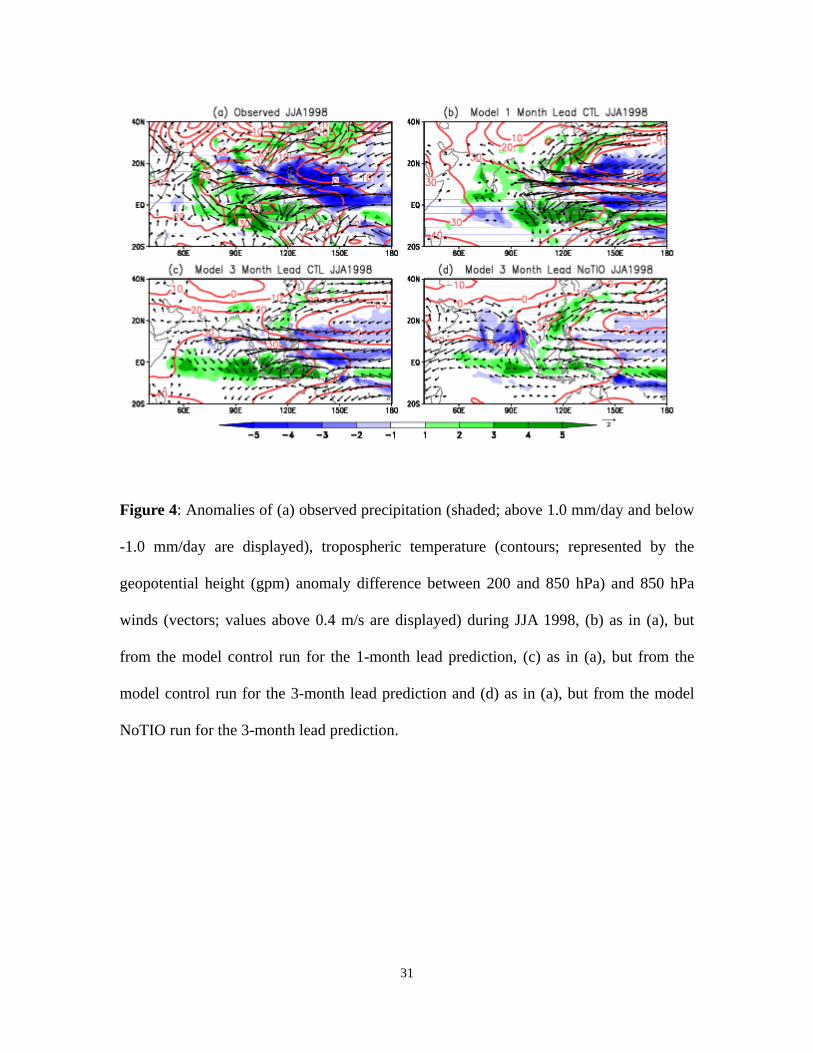
The control run predicts the gross features of precipitation anomalies during JJA
1998. It includes the increase over the maritime continent, west of India and from East
China to Japan, as well as the decrease over a broad region of the subtropical NW Pacific
(Figs. 4a and 4b). When compared to observations, the predicted rainfall increase is
displaced southeastward offshore instead of being over East China, where the great
Yangtze flood occurred. There is a tendency for predicted anomalies of rainfall and winds
to weaken with lead time. The tropospheric temperature anomalies displays (contours) a
broad maximum over the tropical Indian Ocean, and the tropospheric warming penetrates
into the western Pacific along the equator, in the form of a Kelvin wave wedge (Xie et al.
2009).
Figures 4c and 4d show the control and NoTIO spatial maps for JJA 1998 at the
3-month lead. The TIO warming causes a general increase in local rainfall over the basin
and contribute to the reduction in rainfall over the subtropical NW Pacific. The TIO
warming accounts for two-thirds of the tropospheric warming over the TIO region. The
warm Kelvin wave wedge is largely due to the TIO SST forcing, communicating the TIO
13
influence into the western Pacific. This supports the hypothesis of Xie et al. (2009) based
on observational analysis. In the NoTIO run, the magnitude of the tropospheric warming
is reduced over the TIO and equatorial western Pacific. The model experiment shows that
suppressed or weak convection over the Indian Ocean is responsible for the weakening of
tropospheric warming over the Indo-western Pacific region. The TIO warming intensifies
the southwesterlies over the east China (Fig. 4c), which intensify moisture transport but
do not lead to enhanced rainfall over the continent possibly because of model deficiencies
in cumulus and cloud parameterization schemes.
4. Statistical evaluation
The results from the summer 1998 hindcast indicate that i) the model has
significant skill in predicting Indo-western Pacific climate in JJA(1) and ii) there are
considerable contributions from the TIO SST warming. This section extends this case
study and evaluates the prediction over the Indo-western Pacific region for the entire
24-year period of the retrospective forecast experiments.
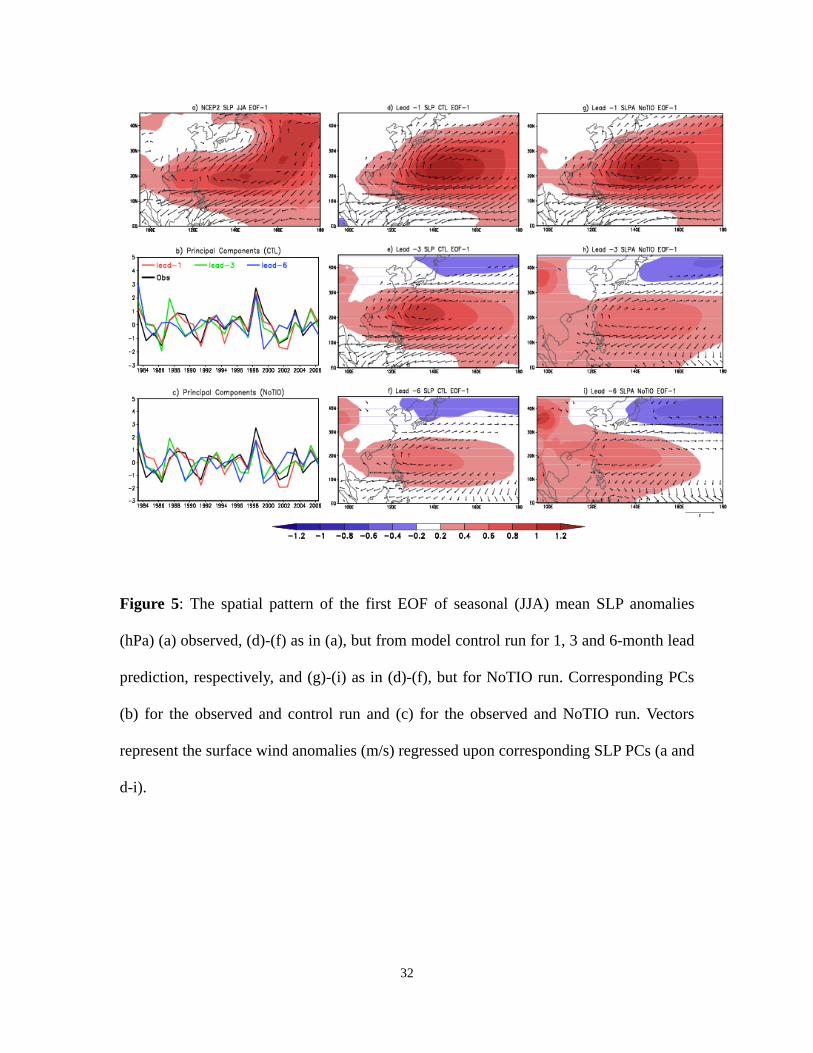
4.1. EOF and PCs
In this section we compare the empirical orthogonal functions (EOFs) of SLP, and
precipitation over the NW Pacific between observations and model forecast to determine
to what extent the model can predict the observed leading modes of JJA(1). We use the
anomaly correlation coefficients (ACC) between observed and model PCs to evaluate
prediction skill. For up to 6-month lead, the model prediction captures the first two
leading modes of SLP and rainfall variability for JJA. The observed first mode for NW
14
Pacific SLP represents the decay phase of ENSO, with a belt of increase centered at 20°N
and a weak decrease over Japan (Fig. 5a). The model captures the subtropical SLP
increase quite well up to a lead of 6 months while the predicted anomaly magnitude
decreases with increasing lead time. The spatial patterns are better organized in the
control than in the NoTIO run, especially for long lead prediction (Fig. 5f and i). For lead
greater than 2 months, marked differences between the control and NoTIO runs appear in
the equatorial waveguide: the warm Kelvin wave from the TIO creates a wedge-like
feature with weak SLP anomalies in the control run while the positive SLP anomalies
extend to the equator in NoTIO run. As a result, the meridional pressure gradient in the
control is much larger on the south flank of the anticyclone with stronger easterly wind
anomalies.
Figure 5 also shows wind regressions (vectors) against first SLP PC for
observations and for each lead month prediction. Associated with the high pressure, an
anomalous anticyclonic circulation centered at 20°N extends from the date line to west of
110°E in observations and in the control run, similar to the 1998 summer case study. With
longer lead times, the anticyclone extends westward much less in the NoTIO run. The
zonal wind divergence around the South China Sea is well established in control run for
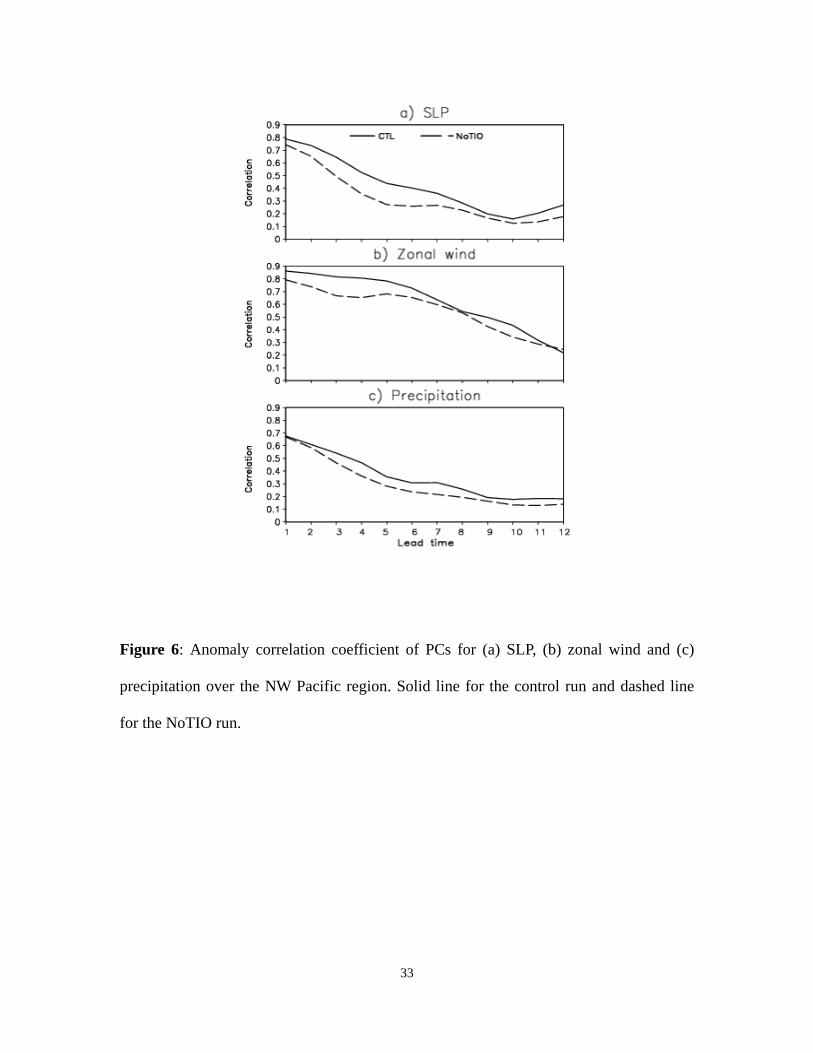
all the lead months. The ACC skill for SLP PC-1 decays with increasing lead but is
significantly higher in the control than in the NoTIO run (Fig. 6a). At 4-month lead, the
ACC still exceeds 0.5 in the control but falls below 0.4 in the NoTIO run.
We also conducted EOF analysis for zonal wind over the NW Pacific region (not
shown). The first mode corresponds to JJA(1) as in Fig. 5. Its ACC remains high at 0.7
even at 6-month lead in the control (Fig. 6b), illustrating high prediction skill for the NW
15
Pacific anticyclone. The skill scores are generally higher in the control than in the NoTIO
run.
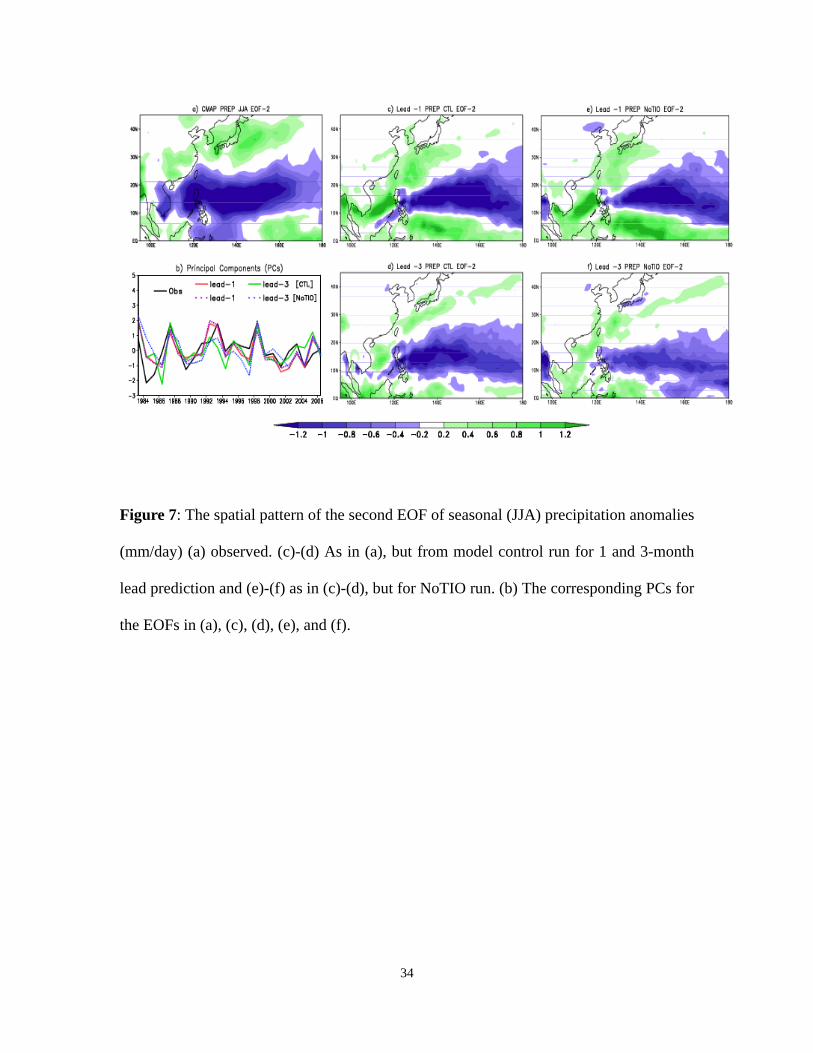
The second EOF mode1 of precipitation resembles the JJA(1) regression upon the
NDJ(0) east Pacific SST anomalies (Xie et al. 2009). The model predicts this JJA(1)
mode of precipitation in terms of spatial pattern except over the Indochina Peninsula, and
the South China Sea, where the model predicts a rainfall increase instead of the observed
decrease (Fig. 7). This error is consistent with a too weak westward extension of the
anomalous anticyclone over the NW Pacific. The moisture supply by the southwesterlies
on the northwest flank of the anticyclone leads to enhanced precipitation over the
northeast China and Japan. In the absence of the TIO warming, the northward extension
of the NW Pacific anticyclone is limited to a certain extent and resultant weak negative
rainfall anomalies are present over the Japan region (Figs. 4d and 7f).
The ACC for the JJA(1) mode is slightly weaker for rainfall than for SLP and
zonal wind. An interactive TIO helps improve the prediction of the JJA(1) rainfall mode.
The ACC remains about 0.5 at 4-month lead in the control but drops below 0.4 in the
NoTIO run (Fig. 6c). Precipitation anomalies are generally weaker in the NoTIO run than
in the control.
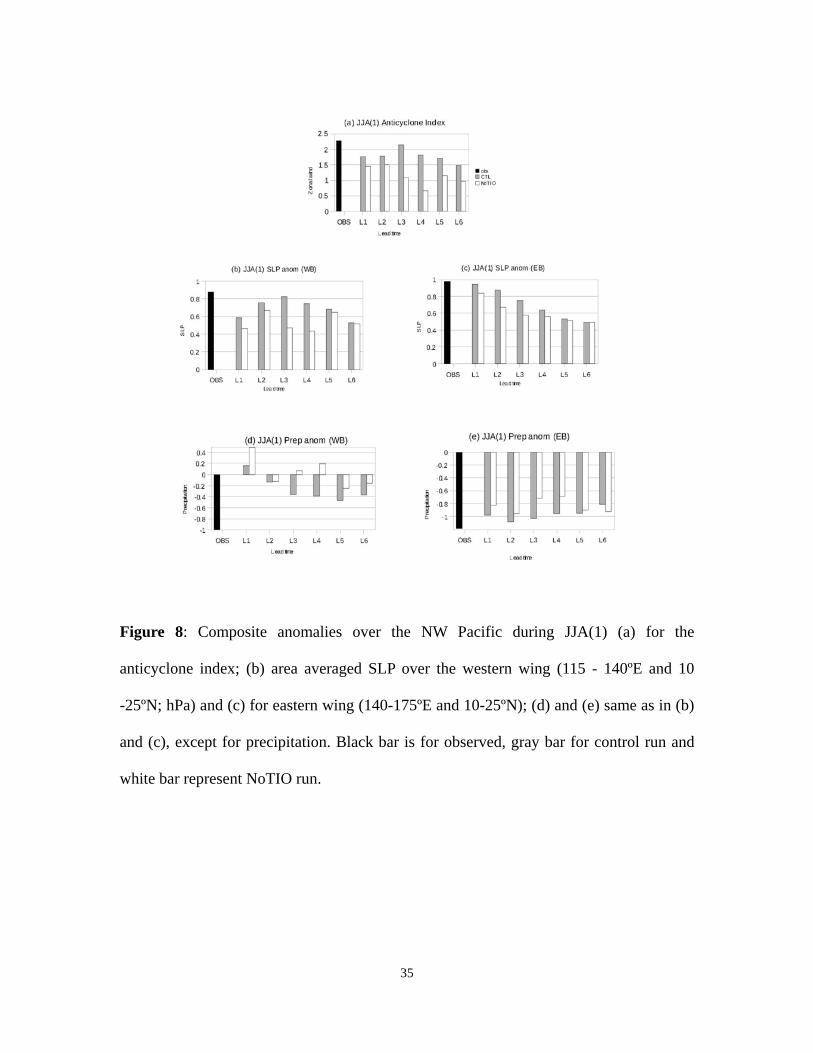
4.2. Regional indices
To further assess the prediction skill of the model over the NW Pacific we used
regional indices (western wing [115°-140°E and 10°-25°N] and eastern wing
[140°-175°E and 10°-25°N]) of SLP, precipitation, and SST for JJA composites after El
1 The first EOF mode corresponds to the developing phase of ENSO JJA(0), which is captured well by the model (not shown).
16
Niño episodes (1983, 1987, 1992, 1998 and 2003) and the anticyclone index. We made
composites of the seasonal mean anomalies based on NDJ(0) Niño-3.4 SST index and
TIO basin-wide (JJA(1)) warming. Summer seasons in which TIO basin-wide warming
was absent after El Niño years are ignored (1988 and 1995). The anomalous anticyclonic
circulation (index) and associated high pressure anomalies over the NW Pacific are
predicted well up to 6 months ahead in the control run (Fig. 8a-c). At all leads, the
magnitude of the predicted anticyclonic index is weak in the NoTIO run compared with
that in the control run. The difference between the two runs in SLP prediction is notable
for both western and eastern wings. Likewise, precipitation prediction over the eastern
wing decreases with increasing lead time, and the magnitude is slightly larger in the
control than in the NoTIO run (Fig. 8e). Over this region, rainfall anomalies are directly
related to the anomalous anticyclonic circulation through positive feedback. Rainfall
prediction is very weak over the western wing of NW Pacific in JJA(1) composites. This
is associated with very weak northeasterlies extending from the NW Pacific. The
difference between the observed and predicted rainfall is very large over this region. The
prediction of SST anomalies is consistent with observations with magnitude is slightly
weaker in the NoTIO run over the both western and eastern wings (not shown). It is noted
that without TIO SST warming in the model, the predictability of the NW Pacific climate
(SST, SLP, and anticyclonic circulation) is significantly reduced during JJA(1).
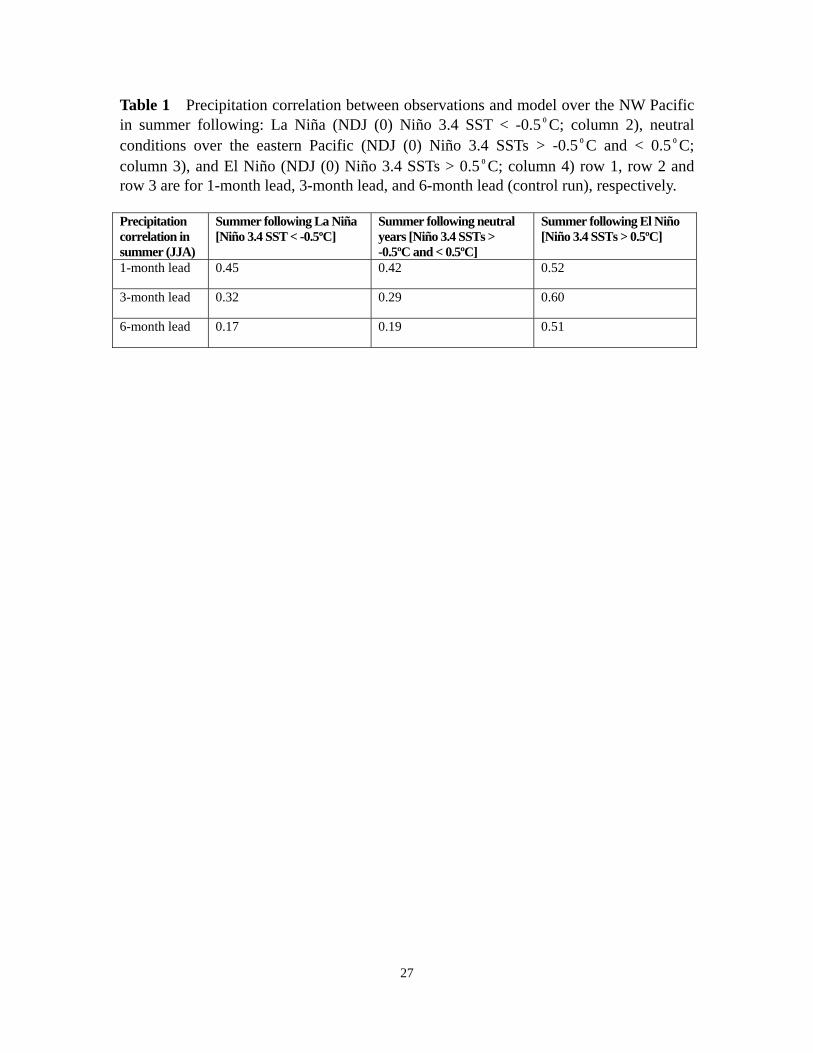
The correlation skill of the model rainfall prediction (control run) at different lead
months over the NW Pacific is shown in Table 12 for summers following (i) El Niño
2 An equal number of summers is considered for correlation analysis in each category (1984, 1986, 1989, 1996, 1999, 2000 and 2006 for summers after La Niña; 1990, 1991,1993, 2001, 2002, 2004 and 2005 for summers after weak/normal SST anomalies over east Pacific and 1983, 1987, 1988, 1992, 1998, 2003 and 2005 for summers after El Niño years). Note that the summers of 1988 and 1995 are included in
17
[NDJ (0) Niño 3.4 SSTs > 0.5ºC], (ii) La Niña [NDJ(0) Niño 3.4 SST < -0.5ºC], and (iii)
neutral conditions [NDJ(0) Niño 3.4 SSTs > -0.5ºC and < 0.5ºC]. The area (125-175ºE
and 8-18ºN) selected for the correlation analysis is based on the spatial distribution of JJA
rainfall EOF (Fig. 7). The better correlation in summers following El Niño episodes
demonstrate the delayed impact of El Niño over the NW Pacific rainfall through the TIO
effect. Some skill is also noticed in the summers after the La Niña peaks. The correlation
is low when eastern Pacific SST anomalies are close to zero in the preceding winter.
Thus, the model shows superior skill in predicting the summer climate anomalies over the
Indo-western Pacific region after El Niño events.
4.3. Composite analysis: Role of the TIO
This subsection also uses composite analysis and isolates TIO effects by
analyzing the control-NoTIO differences for five summers (1983, 1987, 1992, 1998 and
2003) after El Niño. The observed patterns of winds, SST, and precipitation anomalies
are well reproduced in the control run (not shown).
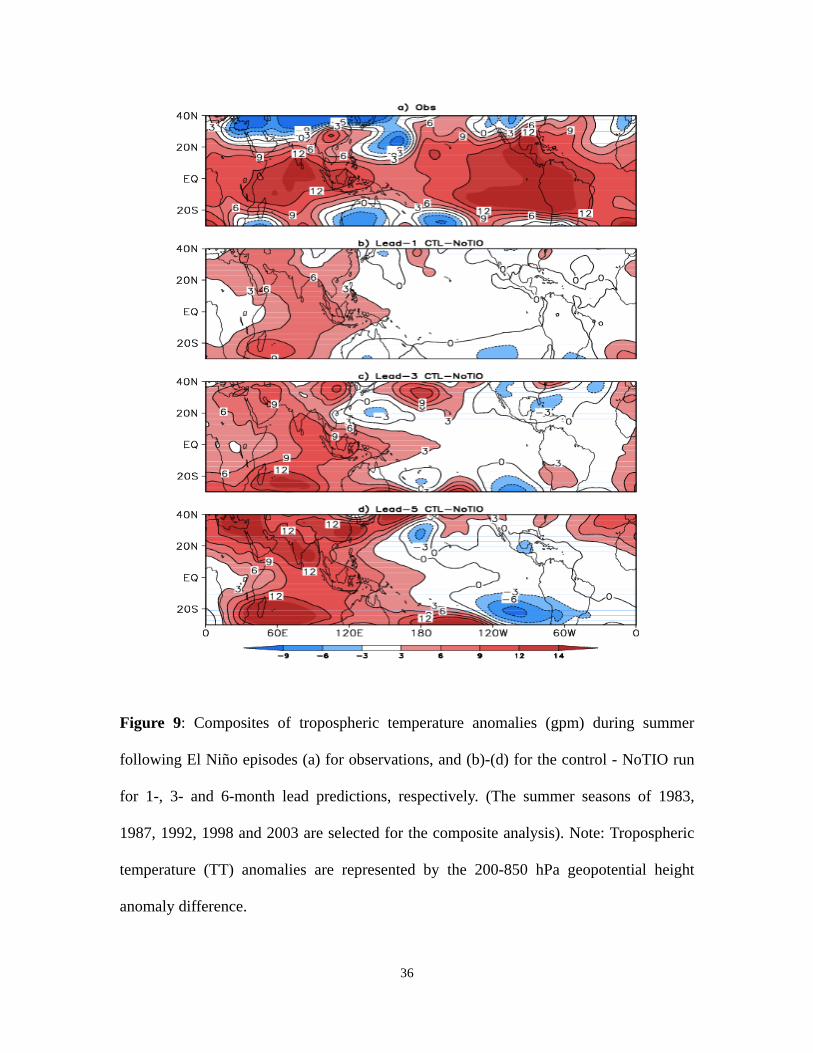
Figure 9a shows the observed tropospheric temperature anomalies. The TT
warming is found in the entire equatorial belt with a maxima over the TIO and eastern
Pacific region. The control minus NoTIO difference displays a Matsuno-Gill (Matsuno
1966; Gill 1980) pattern consistent with forcing by the SST warming over the TIO. The
TIO warming induces a local rainfall increase, in particular, from the eastern Arabian Sea
and Bay of Bengal (Fig. 11c). In the TT field, a wedge-like Kelvin wave penetrates into
the western Pacific along the equator, accompanied by a Rossby wave-like, off-equatorial
maxima that extend westward from the western TIO (Fig. 9). correlation but not in the composite analysis after El Niño.
18
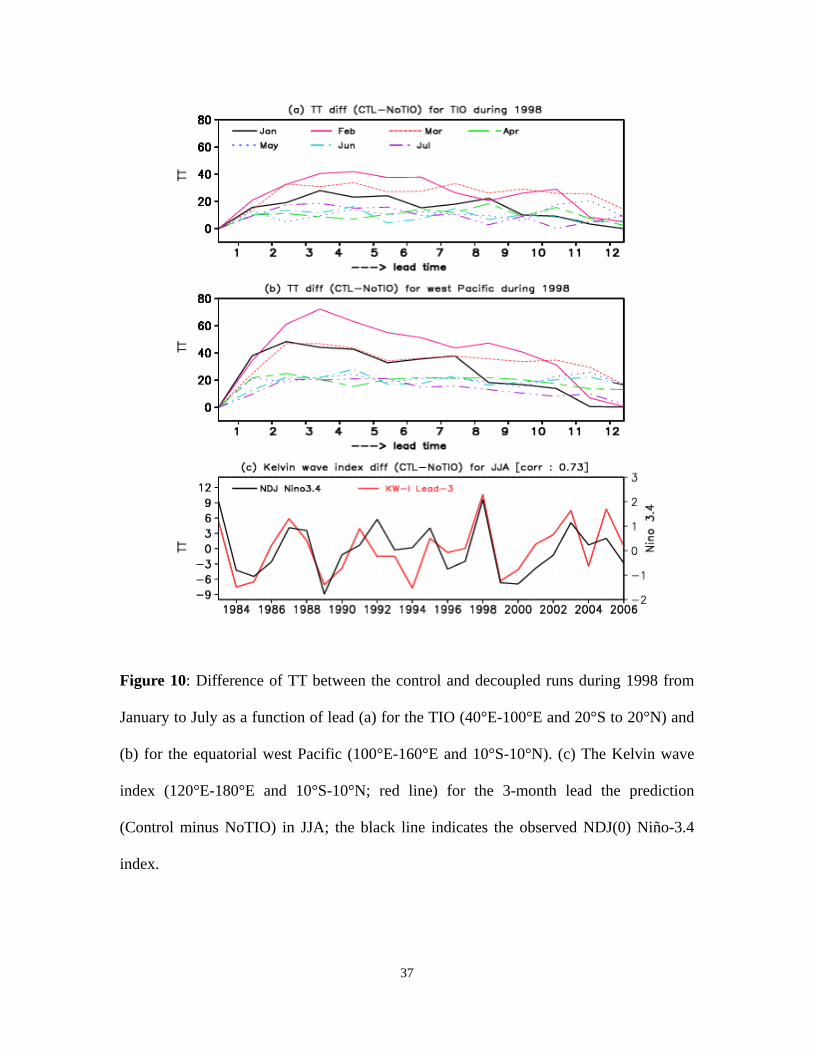
The control-NoTIO difference in TT appears to increase from lead 1 to 3. This is
confirmed through examination of its evolution as a function of lead time for 1998 (Fig.
10a-b), evaluated over the TIO and in the warm Kelvin wave wedge over the equatorial
western Pacific. TIO-induced TT warming increases rapidly for the first month and
reaches equilibrium around lead 3. This indicates that the model is not fully adjusted to
the SST changes in the NoTIO run for the 1-month lead forecast. This explains why the
difference between the control and NoTIO prediction is much less pronounced at the lead
1 than at lead 3. We define a Kelvin wave index with TT anomalies averaged in the
western equatorial Pacific region (120°-180°E and 10°S-10°N; Fig. 10c). The
TIO-induced Kelvin wave in JJA(1), measured as the control-NoTIO difference at lead 3,
is highly correlated (0.73) with the NDJ(0) Niño3.4 index. This shows the delayed effect
of El Niño via TIO warming. The TIO warming accounts for 46% of variability in the
JJA(1) Kelvin wave index at the 3-month lead, in support of the hypothesis by Xie et al.
(2009).
The TT warming weakens but does not disappear in the western equatorial Pacific
in the NoTIO run (e.g., see summer 1998 in Fig. 4d), which helps to maintain the
anomalous anticyclone by surface frictional divergence over the subtropical NW Pacific.
SST warming over the tropical Atlantic and/or changes in land surface properties (e.g.,
Yulaeva and Wallace 1994) may contribute to the tropical TT warming in the NoTIO run.
The remaining TT warming along the equator, together with the SST cooling (up to
-0.4oC in magnitude) over the subtropical NW Pacific east of 140oE, appears to maintain
the anomalous anticyclone.
19
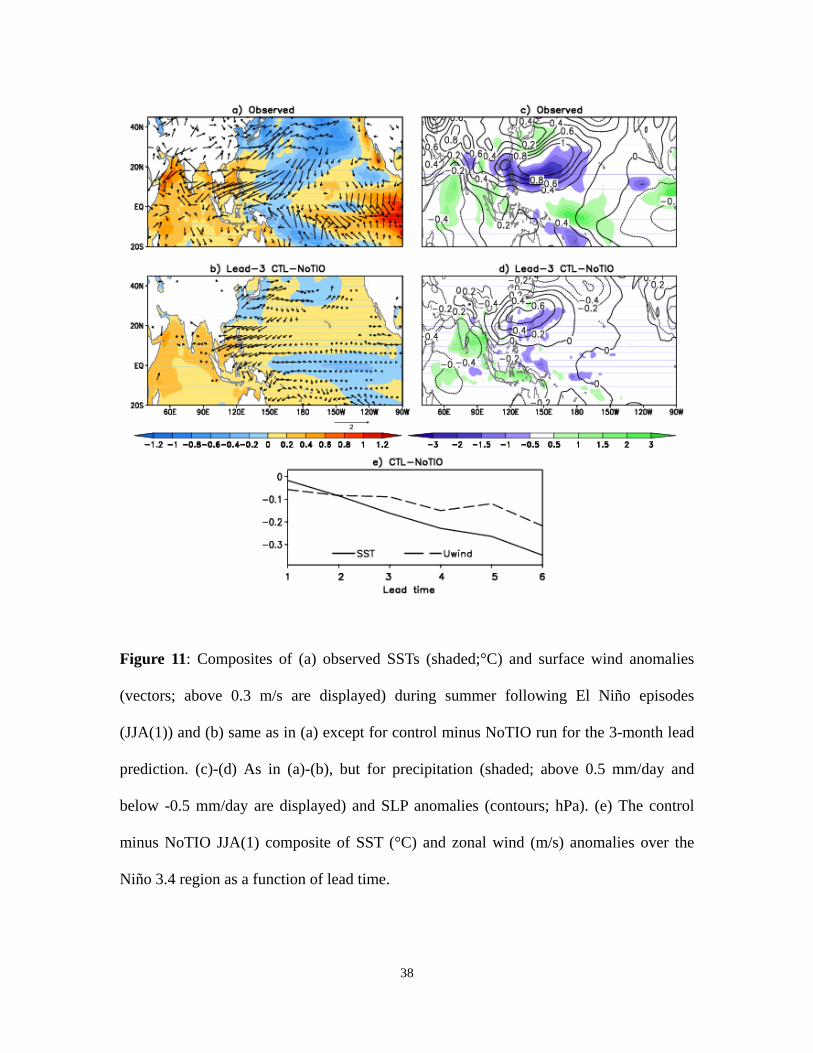
At lead 3, the control-NoTIO differences in TT (Fig. 9c), surface wind, SLP, and
precipitation (Fig. 11b) are consistent with the Kelvin wave-induced Ekman divergence
(WIED) mechanism of Xie et al. (2009). The warm Kelvin wave wedge lowers SLP in
the equatorial western Pacific, forcing anomalous northeasterlies on the northern flank.
Over the subtropical NW Pacific, the Kelvin wave-induced divergence suppresses
convection and their interaction amplifies the surface anticyclonic circulation. The TIO
effect is especially pronounced in the far western Pacific, including the South China Sea,
where the anomalous northeasterlies relax the southwest monsoon and cause SSTs to rise
(Fig. 11). The TIO effect accounts for about 50% of the anomalous SLP increase over the
subtropical NW Pacific (Fig. 11d). During the summers following La Niña the TIO
exhibits basin scale cooling (Figure not shown). The negative TT signals are weak and
display broad zonal extent over the Indo-western Pacific region. Therefore, the
underlying mechanisms for La Niña cases may be different for NW Pacific atmospheric
variability.
The Kelvin wave response to the TIO warming is accompanied by anomalous
easterlies, causing SSTs to cool over the eastern equatorial Pacific. This equatorial Pacific
cooling increases with lead time (Fig. 11e), which is consistent with previous studies of
TIO influences on El Niño (Annamalai et al. 2005; Kug et al. 2006). Luo et al. (2009)
discuss the TIO effect on the prediction on ENSO termination in SINTEX-F in more
detail.
20
5. Summary and discussion
We used the SINTEX-F coupled GCM hindcast to assess the predictability of
atmospheric anomalies during the summers following El Niño over the NW Pacific and
investigate the contribution by TIO warming. The model reproduces the JJA(1) EOF
modes of SLP, zonal wind, and rainfall quite well. The model is capable of predicting the
SLP increase, anomalous anticyclone, and rainfall decrease over the subtropical NW
Pacific during JJA(1) for both the major event of the 1998 summer and for the 24-year
duration of the hindcast. The model predicts the general rainfall increase from East China
to Japan, which is fed by the southwesterly moisture advection on the northwest flank of
the anticyclone and broadly consistent with the Pacific-Japan teleconnection pattern of
Nitta (1987). The model maintains useful ACC scores (>0.5) at leads up to 3-4 months
for the SLP and rainfall PCs. The ACC score is better for the zonal wind PC, staying
above the 0.5 threshold up to a 6-month lead. The ACC scores are significantly higher
and the predicted atmospheric variance is greater in the control than in the NoTIO run,
which confirms the TIO effect. An interactive TIO extends the useful (ACC>0.5)
prediction of NW Pacific anomalies by 1-2 months.
The El Niño-induced rise in TIO SST persists through JJA(1) and causes a general
increase in local precipitation and excites a baroclinic response characterized by
tropospheric warming. A Gill-Matsuno pattern emerges in the control - NoTIO difference
in tropospheric temperature with a wedge-like, warm Kelvin wave propagating into the
equatorial western Pacific. The warm Kelvin wave appears to trigger suppressed
convection and anticyclonic circulation via surface wind divergence over the subtropical
NW Pacific, which is consistent with Xie et al. (2009). Overall, the TIO warming
21
strengthens the NW Pacific anticyclonic circulation by up to 50% and helps it to expand
westward through the South China Sea. The TIO-induced warm Kelvin wave also helps
cool the east equatorial Pacific through easterly wind anomalies and Bjerknes feedback
(Kug et al. 2006; Luo et al. 2009). This TIO feedback on the equatorial Pacific increases
with lead time.
Our results show that TIO warming is an important, but not the only, cause of
atmospheric anomalies over the NW Pacific during JJA(1). The NW Pacific anticyclone
weakens but does not disappear completely in the NoTIO run. Local SST cooling (Wang
et al. 2000) and the lingering warm SST over the eastern Pacific and North Atlantic warm
pool (Shen et al. 2001) are other possible causes. Separate experiments decoupling the
NW Pacific are required to study the impact of the local SST forcing. The TT warming on
the equator may still be the mechanism for remote SST forcing to induce an anticyclonic
response over the NW Pacific via equatorial wave adjustment. How such remote forcing
could work is an interesting topic for future research.
Acknowledgments This work is supported by the U.S. National Science Foundation, the
Japan Agency for Marine-Earth Science and Technology, and the National Aeronautics
and Space Administration (NASA). We thank anonymous reviewers for their valuable
comments that helped to improve our manuscript and H. Annamalai, and J. P. McCreary
for helpful discussions. We acknowledge M. Izumi, and G. Speidel for careful editing of
the revised manuscript. The authors also thank Nat Johnson and Edwin K. Schneider for
helpful comments and corrections. Figures are prepared in Grads. IPRC/SOEST
publication #xxx/yyy.
22
References
Annamalai H, Liu P, Xie S-P (2005) Southwest Indian Ocean SST variability: Its local
effect and remote influence on Asian Monsoons. J Clim 18:4150-4167
Behera S. K, Luo J-J, Masson S, Delecluse P, Gualdi S, Navarra A, Yamagata T (2005)
Paramount impact of the Indian Ocean dipole on the East African short rain: A
CGCM study. J Clim 18: 4514-4530
Du Y, Xie S.-P, Huang G, Hu K.-M (2009) Role of air-sea interaction in the long
persistence of El Niño-induced North Indian Ocean warming. J Clim 22:2023-2038
Gill AE (1980) Some simple solutions for heat-induced tropical circulation. Q J R Meteor
Soc 106:447-462
Gualdi S, Navarra A, Guilyardi E, Delecluse P (2003) Assessment of the tropical
Indo-Pacific climate in the SINTEX CGCM. Ann Geophys 46:1-26
Harrison D, Larkin N.K (1996) The COADS sea level pressure signal: A near-global El
Niño composite and time series view, 1946-1993. J Clim 9:3025-3055
Huang B, Kinter III JL (2002) Interannual variability in the tropical Indian Ocean. J
Geophys Res 107:3199. doi:10.1029/2001JC001278
Huang R, Chen W, Yang B, Zhang R (2004) Recent advances in studies of the interaction
between the East Asian winter and summer monsoons and ENSO cycle. Adv Atmos
Sci 21:407-424
Izumo T, Montégut CdB, Luo J-J, Behera SK, Masson S, and Yamagata T (2008) The role
of the western Arabian Sea upwelling in Indian Monsoon rainfall variability. J Clim
21:5603-5623
23
Kanamitsu M, Ebisuzaki W, Woollen J, Yang S-K, Hnilo JJ, Fiorino M, Potter GL (2002)
NCEP/DOE AMIP-II reanalysis (R-2). Bull Amer Meteor Soc 83:1631-1643
Kang IS, Jin K et al (2002) Intercomparison of atmospheric GCM simulated anomalies
associated with the 1997/98 El Niño. J Clim 15:2791-2805
Kawamura R (1998) A possible mechanism of the Asian summer-ENSO coupling. J
Meteor Soc Japan 76:1009-1027
Klein SA, Soden BJ, Lau N-C (1999) Remote sea surface temperature variations during
ENSO: Evidence for a tropical atmospheric bridge. J Clim 12:917-932
Kug J-S, Li T, An S-I, Kang I-S, Luo J-J, Masson S, Yamagata T (2006) Role of the
ENSO-Indian Ocean coupling on ENSO variability in a coupled GCM. Geophys Res
Lett 33, L09710. doi:10.1029/2005GL024916.
Lau NC, Ploshay JJ (2009) Simulation of synoptic- and subsynoptic-scale phenomena
associated with the East Asian summer monsoon using a high-resolution GCM. Mon
Wea Rev, 137:137-160
Lee E-J, Jhun J-G, Park C-K (2005) Remote connection of the northeast Asian summer
rainfall variation revealed by a newly defined monsoon index. J. Clim 18: 4381-4393
Luo J-J, Masson S, Roeckner E, Madec M, Yamagata T (2005a) Reducing climatology
bias in an ocean-atmosphere CGCM with improved coupling physics. J Clim 18:
2344-2360.
Luo J-J, Masson S, Behera SK, Yamagata T (2008) Extended ENSO predictions using a
fully coupled ocean-atmosphere model. J Clim 21:84-93
Luo J-J, Masson S, Behera SK, Shingu S, Yamagata T (2005b) Seasonal climate
predictability in a coupled OAGCM using a different approach for ensemble
24
forecasts. J Clim 18: 4474-4497
Luo J-J, Zhang R, Behera SK, Masumoto Y, Jin FF, Lukas R, Yamagata T (2009)
Interaction between El Niño and extreme Indian Ocean Dipole. J. Clim, In Press.
Luo J-J, Behera SK, Masumoto Y, Sakuma H, Yamagata T (2008) Successful prediction
of the consecutive IOD in 2006 and 2007. Geophys Res Lett 35:L14S02.
doi:10.1029/2007GL032793
Madec G, Delecluse P, Imbard M, Levy C (1998) OPA version 8.1 ocean general
circulation model reference manual. LODYC/IPSL Tech Note 11: 91 pp
Masson S et al (2005) Impact of barrier layer on winter-spring variability of the southeastern
Arabian Sea. Geophys Res Lett 32: L07703. doi:10.1029/2004GL021980.
Matsuno T, (1966) Quasi-geostrophic motions in the equatorial area. J. Meteor. Soc.
Japan, 44:25-43
McPhaden MJ (1999) Genesis and evolution of the 1997-98 El Niño. Science 283:
950-954
Nitta T (1987) Convective activities in the tropical western Pacific and their impact on
the Northern Hemisphere summer circulation. J Meteor Soc Japan 65:373-390
Park H-S, Chiang JCH, Lintner BR, Zhang GJ (2009) The delayed effect of major El
Niño events on Indian monsoon rainfall. J Clim, In revision.
Reynolds RW, Rayner NA, Smith TM, Stokes DC, Wang W (2002) An improved in situ
and satellite SST analysis for climate. J Clim 15:1609-1625
Roeckner E et al (1996) The atmospheric general circulation model ECHAM-4: Model
description and simulation of present-day climate. Max-Planck-Institut für
Meteorologie Rep 218:90 pp
25
Schott FA, Xie S-P, McCreary JP (2009) Indian Ocean circulation and climate variability.
Rev Geophys 47: RG1002. doi:10.1029/2007RG000245
Shen X, Kimoto M, Sumi A, Numaguti A, Matsumoto J (2001) Simulation of the 1998
East Asian summer monsoon by the CCSR/NIES AGCM. J Meteor Soc Japan 79:
741-757
Tozuka T, Luo J-J, Masson S, Behera SK, Yamagata T (2005) Annual ENSO simulated in
a coupled ocean-atmosphere model. Dyn Atmos Oceans 39:41-60
Wang B, Wu R, Li T (2003) Atmosphere-warm ocean interaction and its impacts on the
Asian-Australian monsoon variation. J. Clim 16:1195-1211.
Wang B, Wu R, Fu X (2000) Pacific-east Asian teleconnection: How does ENSO affect
east Asian climate?. J Clim 13:1517-1536
Wang B et al (2008) Advance and prospect of seasonal prediction: Assessment of the
APCC/CliPAS 14-model ensemble retroperspective seasonal prediction (1980-2004).
Clim Dyn. doi:10.1007/s00382-008-0460-0
Xie P, Arkin PA (1996) Analyses of global monthly precipitation using gauge observations,
satellite estimates, and numerical model predictions. J. Clim 9: 840-858
Xie S-P, Annamalai H, Schott FA, McCreary JP (2002) Structure and mechanisms of
South Indian Ocean climate variability. J. Clim 15:864-878
Xie S-P, Hu K, Hafner J, Tokinaga H, Du Y, Huang G, Sampe T (2009) Indian Ocean
capacitor effect on Indo-Western Pacific climate during the summer following El
Niño. J Clim 22:730-747
26
Yamagata T, Behera SK, Luo J-J, Masson S, Jury M, Rao SA (2004) Coupled
ocean-atmosphere variability in the tropical Indian Ocean. Earth Climate: The
Ocean-Atmosphere Interaction, Geoph Monogr No. 147, Amer Geoph Uni, 189-212
Yang J, Liu Q, Xie S-P, Liu Z, Wu L (2007) Impact of the Indian Ocean SST basin mode on the
Asian summer monsoon. Geophys Res Lett 34:L02708. doi:10.1029/2006GL028571
Yulaeva E, Wallace JM (1994) The signature of ENSO in global temperature and
precipitation fields derived from the microwave sounding unit. J Clim 7:1719-1736
Zhang R, Sumi A, Kimoto M (1996) Impacts of El Niño on the East Asian monsoon: A
diagnostic study of the '86/87 and '91/92 events. J Meteor Soc Jap 74:49-62
27
Table 1 Precipitation correlation between observations and model over the NW Pacific in summer following: La Niña (NDJ (0) Niño 3.4 SST < -0.5ºC; column 2), neutral conditions over the eastern Pacific (NDJ (0) Niño 3.4 SSTs > -0.5ºC and < 0.5ºC; column 3), and El Niño (NDJ (0) Niño 3.4 SSTs > 0.5ºC; column 4) row 1, row 2 and row 3 are for 1-month lead, 3-month lead, and 6-month lead (control run), respectively. Precipitation correlation in summer (JJA)
Summer following La Niña [Niño 3.4 SST < -0.5ºC]
Summer following neutral years [Niño 3.4 SSTs > -0.5ºC and < 0.5ºC]
Summer following El Niño [Niño 3.4 SSTs > 0.5ºC]
1-month lead 0.45 0.42 0.52
3-month lead 0.32 0.29 0.60
6-month lead 0.17 0.19 0.51
28
Figures:
Figure 1: Zonal mean correlation skill for JJA (a) SST, (b) precipitation anomalies over
the western Pacific (averaged between 120°E to 180°E), (c) SST and (d) precipitation
anomalies over the eastern Pacific (averaged between 120°W to 170°W). Red, green and
blue lines correspond to predictions for lead time of 1, 3 and 6-months, respectively.
29
Figure 2: (a) The Tropical Indian Ocean SST anomalies (˚C) averaged over 20˚S-20˚N
and 40°E to 100°E, (b) anticyclone index based on surface zonal wind (m/s) difference
(27.5-32.5°N minus 10-15°N) averaged from 120°E to150°E, and (c) the rainfall
anomalies (mm/day) in the Yangtze River basin (averaged over 24°N to 35°N and 90°E to
112°E). Left panels are for the control run and the right panels are for the NoTIO run.
30
Figure 3: Anomalies of (a) observed SST (shaded; ˚C), SLP [contours; above 0.5 (solid
line) and below -0.5 hPa (dashed line) are displayed] and surface wind (vectors; above
0.4 m/s are displayed) during JJA 1998. (b)-(d) As in (a), but from model control run for
1, 3 and 6-month lead prediction, respectively, and (e)-(g) as in (b)-(d), but for the NoTIO
run, where gray shading indicates the region of the decoupled Indian Ocean.
31
Figure 4: Anomalies of (a) observed precipitation (shaded; above 1.0 mm/day and below
-1.0 mm/day are displayed), tropospheric temperature (contours; represented by the
geopotential height (gpm) anomaly difference between 200 and 850 hPa) and 850 hPa
winds (vectors; values above 0.4 m/s are displayed) during JJA 1998, (b) as in (a), but
from the model control run for the 1-month lead prediction, (c) as in (a), but from the
model control run for the 3-month lead prediction and (d) as in (a), but from the model
NoTIO run for the 3-month lead prediction.
32
Figure 5: The spatial pattern of the first EOF of seasonal (JJA) mean SLP anomalies
(hPa) (a) observed, (d)-(f) as in (a), but from model control run for 1, 3 and 6-month lead
prediction, respectively, and (g)-(i) as in (d)-(f), but for NoTIO run. Corresponding PCs
(b) for the observed and control run and (c) for the observed and NoTIO run. Vectors
represent the surface wind anomalies (m/s) regressed upon corresponding SLP PCs (a and
d-i).
33
Figure 6: Anomaly correlation coefficient of PCs for (a) SLP, (b) zonal wind and (c)
precipitation over the NW Pacific region. Solid line for the control run and dashed line
for the NoTIO run.
34
Figure 7: The spatial pattern of the second EOF of seasonal (JJA) precipitation anomalies
(mm/day) (a) observed. (c)-(d) As in (a), but from model control run for 1 and 3-month
lead prediction and (e)-(f) as in (c)-(d), but for NoTIO run. (b) The corresponding PCs for
the EOFs in (a), (c), (d), (e), and (f).
35
Figure 8: Composite anomalies over the NW Pacific during JJA(1) (a) for the
anticyclone index; (b) area averaged SLP over the western wing (115 - 140ºE and 10
-25ºN; hPa) and (c) for eastern wing (140-175ºE and 10-25ºN); (d) and (e) same as in (b)
and (c), except for precipitation. Black bar is for observed, gray bar for control run and
white bar represent NoTIO run.
36
Figure 9: Composites of tropospheric temperature anomalies (gpm) during summer
following El Niño episodes (a) for observations, and (b)-(d) for the control - NoTIO run
for 1-, 3- and 6-month lead predictions, respectively. (The summer seasons of 1983,
1987, 1992, 1998 and 2003 are selected for the composite analysis). Note: Tropospheric
temperature (TT) anomalies are represented by the 200-850 hPa geopotential height
anomaly difference.
37
Figure 10: Difference of TT between the control and decoupled runs during 1998 from
January to July as a function of lead (a) for the TIO (40°E-100°E and 20°S to 20°N) and
(b) for the equatorial west Pacific (100°E-160°E and 10°S-10°N). (c) The Kelvin wave
index (120°E-180°E and 10°S-10°N; red line) for the 3-month lead the prediction
(Control minus NoTIO) in JJA; the black line indicates the observed NDJ(0) Niño-3.4
index.
38
Figure 11: Composites of (a) observed SSTs (shaded;°C) and surface wind anomalies
(vectors; above 0.3 m/s are displayed) during summer following El Niño episodes
(JJA(1)) and (b) same as in (a) except for control minus NoTIO run for the 3-month lead
prediction. (c)-(d) As in (a)-(b), but for precipitation (shaded; above 0.5 mm/day and
below -0.5 mm/day are displayed) and SLP anomalies (contours; hPa). (e) The control
minus NoTIO JJA(1) composite of SST (°C) and zonal wind (m/s) anomalies over the
Niño 3.4 region as a function of lead time.
Related Documents