Predicting State-Wide Votes on Ballot Initiatives to Ban Battery Cages and Gestation Crates Katie Smithson, Max Corbin, Jayson L. Lusk, and F. Bailey Norwood After California voters decided in a state initiative to ban gestation crates and battery cages, some are asking whether other states will host similar initiatives and if they will pass. This study addresses this question by using voting data in California to predict how voters in other states would respond to a similar initiative. Results suggest that a number of states allow such initiatives and possess a demographic profile favorable to the initiative’s passage. However, because these states host only a small portion of the livestock population, the impact of such initiatives on the well-being of farm animals is questionable. Key Words: animal welfare, battery cage, demographics, gestation crate, state initiatives JEL Classifications: H7, K2, Q1 The vast majority of egg and pork production takes place in confined production facilities, where layers and hens face extensive restric- tions on their movement. Small groups of layers are housed in battery cages, providing each bird only a fraction of the space needed to move about and fully stretch their limbs. Sows are confined to solitary gestation crates or stalls so small the sow cannot turn around. While pro- viding many of animals’ biological needs, these cages deny most behavioral needs, resulting in a low level of welfare compared with other production methods (Bracke et al., 2002a, 2002b; De Mol et al., 2006). Not surprisingly, pictures of these cages disturb the general pub- lic. Capitalizing on this public sentiment, animal advocacy organizations have petitioned for bal- lot initiatives and lobbied for legislation banning restrictive cages. As a result, eight states have banned cages for layers, sows, or both. Some bans are the re- sult of initiatives and some of legislation. Three times an initiative to ban restrictive cages has been held and in each case—Florida in 2002, Arizona in 2006, and California in 2008—the initiative passed. The California initiative re- ceived considerable attention, and its passing suggested initiatives in other states would re- alize similar success, motivating the United Egg Producers (UEP) to recently strike a deal with the Humane Society of the United States (HSUS) to enlarge and enrich the cages used for layers, resulting in the Egg Products Inspection Act Amendments of 2013 bill currently before the House and Senate. This bill requires that Katie Smithson and Max Corbin are research assis- tants, Jayson L. Lusk is the Willard Sparks Endowed Chair of Agribusiness, and F. Bailey Norwood is an associate professor, all in the Department of Agricul- tural Economics at Oklahoma State University, Still- water, Oklahoma. The authors acknowledge funding from NIFA and the Oklahoma Agricultural Experiment Station. Journal of Agricultural and Applied Economics, 46,1(February 2014):107–124 Ó 2014 Southern Agricultural Economics Association

Prediciting State-Wide Votes
Aug 15, 2015
Welcome message from author
This document is posted to help you gain knowledge. Please leave a comment to let me know what you think about it! Share it to your friends and learn new things together.
Transcript
Predicting State-Wide Votes on Ballot
Initiatives to Ban Battery Cages
and Gestation Crates
Katie Smithson, Max Corbin, Jayson L. Lusk,
and F. Bailey Norwood
After California voters decided in a state initiative to ban gestation crates and battery cages,some are asking whether other states will host similar initiatives and if they will pass. Thisstudy addresses this question by using voting data in California to predict how voters in otherstates would respond to a similar initiative. Results suggest that a number of states allow suchinitiatives and possess a demographic profile favorable to the initiative’s passage. However,because these states host only a small portion of the livestock population, the impact of suchinitiatives on the well-being of farm animals is questionable.
Key Words: animal welfare, battery cage, demographics, gestation crate, state initiatives
JEL Classifications: H7, K2, Q1
The vast majority of egg and pork production
takes place in confined production facilities,
where layers and hens face extensive restric-
tions on their movement. Small groups of layers
are housed in battery cages, providing each bird
only a fraction of the space needed to move
about and fully stretch their limbs. Sows are
confined to solitary gestation crates or stalls so
small the sow cannot turn around. While pro-
viding many of animals’ biological needs, these
cages deny most behavioral needs, resulting in
a low level of welfare compared with other
production methods (Bracke et al., 2002a,
2002b; De Mol et al., 2006). Not surprisingly,
pictures of these cages disturb the general pub-
lic. Capitalizing on this public sentiment, animal
advocacy organizations have petitioned for bal-
lot initiatives and lobbied for legislation banning
restrictive cages.
As a result, eight states have banned cages
for layers, sows, or both. Some bans are the re-
sult of initiatives and some of legislation. Three
times an initiative to ban restrictive cages has
been held and in each case—Florida in 2002,
Arizona in 2006, and California in 2008—the
initiative passed. The California initiative re-
ceived considerable attention, and its passing
suggested initiatives in other states would re-
alize similar success, motivating the United
Egg Producers (UEP) to recently strike a deal
with the Humane Society of the United States
(HSUS) to enlarge and enrich the cages used for
layers, resulting in the Egg Products Inspection
Act Amendments of 2013 bill currently before
the House and Senate. This bill requires that
Katie Smithson and Max Corbin are research assis-tants, Jayson L. Lusk is the Willard Sparks EndowedChair of Agribusiness, and F. Bailey Norwood is anassociate professor, all in the Department of Agricul-tural Economics at Oklahoma State University, Still-water, Oklahoma.
The authors acknowledge funding from NIFA andthe Oklahoma Agricultural Experiment Station.
Journal of Agricultural and Applied Economics, 46,1(February 2014):107–124
� 2014 Southern Agricultural Economics Association
battery cages be replaced with housing sys-
tems that double the space allotted to each
hen and to provide environmental enrich-
ments like scratching areas and nesting boxes
(Feinstein, 2013). It is presumed that most
farmers will use enriched or colony cages to meet
these specifications. The legislation is described
by the agribusiness newspaper Feedstuffs as
‘‘the result of an agreement negotiated be-
tween HSUS and UEP two years ago to tran-
sition the egg industry away from conventional
cage housing to enriched colony cages’’ (Smith,
2013a). With the support of both the HSUS and
UEP, such legislation seemed destined to pass,
but now that other livestock groups have op-
posed the measure, its future remains unclear
(Wyant, 2013).
A nationwide agreement over gestation crates
in hog production has not occurred. The debate
over gestation crates will thus continue, and
state-level initiatives and lobbying to ban the
crates are expected. The question is: which
states are the next targets? Obviously, states
that do not allow initiatives can only exploit
the ballot box indirectly, through lobbying—but
lobbying has worked for states like Michigan,
Colorado, Oregon, Maine, and Ohio. The ability
of an animal advocacy group to influence policy
through lobbying or initiatives depends on
public support for cage bans, and public sup-
port is related to demographics (among other
things). A state whose demographics resemble
California, Florida, or Arizona is likely to
support bans on battery cages and gestation
crates.
The purpose of this study is to use data from
the California initiative (commonly referred to
as ‘‘Prop two’’) to project whether similar ref-
erenda for gestation crates might pass in other
states. After analyzing the relationship between
a California county’s demographics and their
voting behavior for Prop two, this relationship
is assumed to hold for other states, allowing
statistical models to project the fate of a Prop
two measure in other states based on their
demographics.
Survey work has shown that demographic
factors do influence views on animal welfare.
States with a higher population density, higher
income, more educated public, stronger support
for Democratic politicians, older citizens, more
females, and less Evangelical Protestants have
all been shown to have increased concern for the
well-being of farm animals (Prickett, Norwood,
and Lusk, 2010; Videras, 2006).
Admittedly, similar demographics across
different states may not represent identical
preferences for farm animal care. The aver-
age Democrat in California will not share
identical views with the average Democrat in
Virginia, and the faith of Evangelical Protes-
tants may have a different flavor in Alabama
than in California. However, the fact that citi-
zens of different counties do often share po-
litical parties, ethnicities, and versions of the
Christian faith suggests these similarities can
be used to predict voting behavior. The voting
behavior of a demographic in one state should
reveal something about the behavior of the
same demographic in another state.
Views on animal welfare are expected to
evolve over time. When Floridians first voted to
ban gestation crates in 2002, citizens in other
states read about this peculiar initiative and for
the first time learned how sows were housed.
By the time similar initiatives reached Arizona
and California, voters were better prepared
for the issue. Just as the same demographic
manifests itself differently across regions, the
same categories of people may vote differently
across time. As an example, the initiative in
Arizona did not earn itself a special episode
on the Oprah Winfrey Show; the initiative in
California did.
Marketing and political science studies have
demonstrated that individual preferences are
profoundly influenced by a minority of in-
dividuals referred to as ‘‘influencers’’ (Katz
and Lazarsfeld, 2006; Keller and Berry, 2003).
This implies that the idiosyncratic personal-
ities of these influencers can be manifested in
overall voting behavior, perhaps causing vot-
ing behavior to differ across states. However,
an influencer in California can have an effect
on voters in Nebraska. There is no reason to
believe the orbit of influencers is confined
only to their state, especially with today’s In-
ternet. As a result, there is little reason to
expect the voting behavior of the same demo-
graphic in two states to be independent of one
Journal of Agricultural and Applied Economics, February 2014108
another. No two states are identical, but what
happens in one state provides insights into
other states.
Using California data to project voting be-
havior on a hypothetical initiative in other
states can be considered a thought experiment:
an abstract, hypothetical scenario providing a
useful index of each state’s concern for animal
welfare as determined by their demographic
profiles. There are a number of states where
initiatives are not allowed, yet this study can
still illuminate our understanding of those states
also. For example, Minnesota, North Carolina,
and Iowa are the three largest hog states but do
not allow initiatives—yet these industries can
still be affected by legislation sponsored by
politicians with a personal interest in animal
welfare or politicians influenced by a particular
lobby. The absence of an initiative does not
mean constituents have no influence nor does it
imply constituent demographics are irrelevant.
Which of these state’s constituents will be the
most or least accepting of gestation crate bans
according to the state’s demographics? This re-
search has an answer.
Because the debate regarding battery cages
is likely to be resolved by the recent UEP/HSUS
agreement, discussion will focus primarily on
gestation crates. However, no law about battery
cages has been signed, and until such law
passes, state-level initiatives to ban battery
cages are a possibility. Moreover, the results
of this research are relevant to every aspect of
the farm animal welfare debate, because they
concern not just predicted voting behavior, but
general public sentiments about animal welfare
issues.
Our statistical models project approval rates
should a measure like California’s Prop two be
held in each state. The exact wording of Prop
two is provided in the next section, along with
a discussion of state laws regarding initiatives
and referenda as well as hog populations across
states. The third section describes the methods
and data, the fourth section reveals the regres-
sion estimates, and the fifth section predicts the
percent of voters approving a Prop two-like
measure in each state. The final section dis-
cusses the implications of the results for the
hog industry.
Prop Two, Initiatives, and Hog Populations
The statistical model used in this study is taken
from voting behavior in California’s Proposi-
tion two (hereafter, Prop two). It is thus prudent
to explicitly remark on the wording of the
proposition, which read:
‘‘. . .a person shall not tether or confine any
covered animal, on a farm, for all or the
majority of any day, in a manner that prevents
such animals from (a) lying down, standing
up, and fully extending his or her limbs; and
(b) turning around freely (California Secre-
tary of State, 2008).’’
The wording of this proposition makes it clear
that the battery cages used to produce 95% of
U.S. eggs, and gestation stalls used to produce
the vast majority of U.S. pork, would be pro-
hibited. A more detailed reading of the propo-
sition shows that farrowing crates may still be
used, because the definition of a ‘‘covered an-
imal’’ does not include sows that are birthing or
nursing. Initially, most believed that this prop-
osition would only allow cage-free egg pro-
duction. Then, an egg producer who wished to
use colony cages (larger and enriched cages)
began a contentious debate over whether it
would be allowed under Prop two. After all, a
hen in a large cage may still have ample room
to turn around and extend its limbs. This question
has yet to be settled, but given the fact that the
HSUS and UEP are seeking a nationwide con-
version of cage to colony cage facilities, the future
of colony cages in California seems optimistic.
The passing of Prop two has real conse-
quences for food. Pork production costs increase
by 2.3% without gestation crates. Depending
on whether an egg farmer replaces battery cages
with enriched/colony cages or cage-free pro-
duction, Prop two raises their production costs
by 10–25% (Norwood and Lusk, 2011; Seibert
and Norwood, 2011; Sumner et al., 2008).
If more state-level initiatives do take place
after Prop two, to what extent would the
wording of the initiative resemble that of Prop
two? Because colony cages fulfill Prop two
requirements, subsequent initiatives would not
have to be altered to accommodate the recent
agreement between the UEP and HSUS. Also,
Smithson et al.: Animal Welfare Initiatives 109
new initiatives are likely to target both the hog
and the veal industries, so there is no reason
to suspect the wording of the initiative would
apply exclusively to hogs. Finally, history sug-
gests animal advocacy groups will only attempt
to ban restrictive cages. There is no reason to
believe HSUS will seek to provide outdoor ac-
cess for hogs, access to bedding, and the like.
HSUS has themselves stated, ‘‘We’re not going
to come in and try to write regulations because
that isn’t our role. . .. Our aim is to end the worst
abuses, and a gestation crate in the pork industry
is the worst abuse’’ (Kilian, 2008). An initiative
to ban something can be easily articulated on
a ballot, but it is far more difficult to write an
initiative describing the proper inches of straw,
hay, or sawdust that sows, piglets, barrows, and
farrows will receive. A narrative on the proper
amount of ‘‘outdoor’’ access is equally difficult
to place on a ballot. Everything considered, if
animal advocacy groups petition for new ini-
tiatives, the wording of the initiative is expected
to mimic that of Prop two closely or at a mini-
mum imply the same ultimate consequence (i.e.,
a ban on battery cages).
Although the results will say something
about every state, they are obviously most rel-
evant to states that allow initiatives, have the larg-
est hog populations, and have not yet hosted an
initiative. An ‘‘initiative’’ is a formal policy term,
referring to a specific proposition citizen’s vote
for or against. To place an initiative on a ballot,
groups must gather signatures expressing their
support for the issue, and the rules for gath-
ering petitions vary across states. For example,
California requires groups to gather a number
of signatures greater than 5% of the last votes
cast for governor, groups must gather these sig-
natures within a 20-month time period, and the
petition must be completed four months before
the election date. Some states have geographical
distribution requirements. For example, in
Missouri, signatures exceeding 5% of the votes
cast for governor in the last election must be
achieved in six of its nine congressional districts.
Other states like Illinois specify the type of
items an initiative may address, and in Illinois,
the regulation of livestock farms is not among
these items (Initiative & Initiative Institute at
the University of Southern California, 2011).
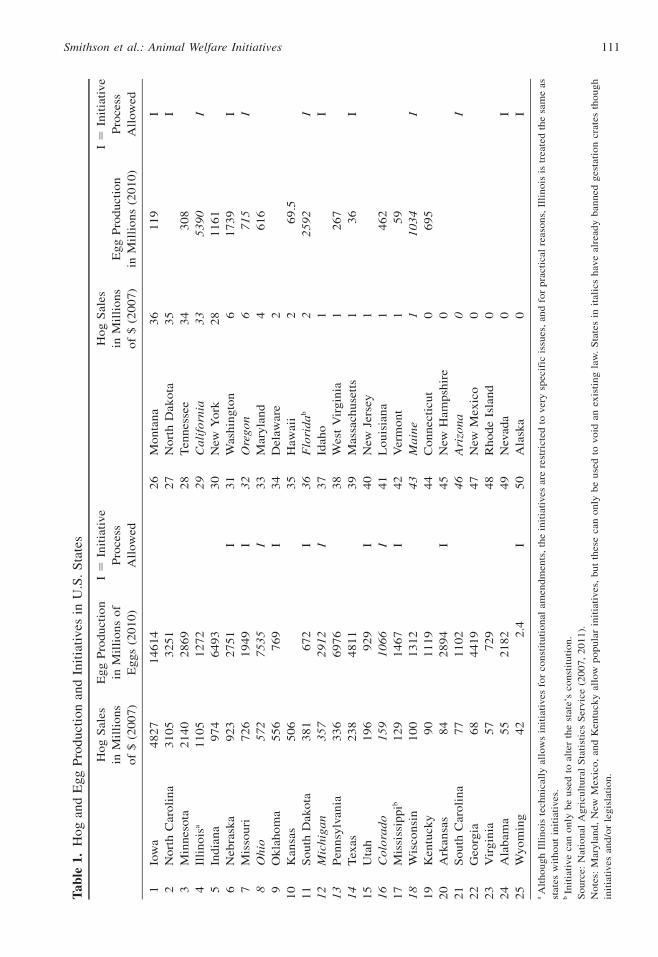
Table 1 lists the 50 U.S. states, sorted
according to hog production, and indicating
whether an initiative is allowed in each state.
Twenty-three states allow initiatives. Although
New Mexico, Kentucky, and Maryland allow
‘‘popular referenda,’’ these only allow citizens
to repeal a passed measure (all states with ini-
tiatives also allow popular referenda) and are
hence less relevant to the present study. Of
these initiative states, Florida and Mississippi
only allow initiatives to alter the state consti-
tution, not a law. This is why the gestation crate
ban was enshrined in the Florida state consti-
tution, which seemed odd to many people at the
time.
Because the possibility of initiatives is es-
pecially relevant for the hog industry, Table 1
lists the hog revenues in each state, but to fa-
cilitate discussion, egg production is listed as
well. In the top five hog-producing states, only
Illinois allows initiatives. The narrow range
of items an Illinois initiative can address is so
limiting that it is, for practical reasons, often
not even considered an initiative state. Because
an Illinois initiative cannot refer to farm regu-
lations, it is considered a noninitiative state for
the purpose of this analysis.
Notice Ohio is the second largest egg-
producing state but only the eighth largest hog-
producing state. Ohio allows initiatives, and
after an awkward public relations battle, Ohio
producers sought a compromise with HSUS to
prevent an initiative, where a defeat of the
livestock industry was likely. Ohio producers
sought to pre-empt a ballot initiative by HSUS
by offering one of their own, which would have
delegated decisions about animal production
decisions to a specially appointed committee.
This ballot initiative passed, but did not—as
producers had hoped—keep the HSUS from
pursing their interest in ultimately banning
cages. The resulting compromise prohibits new
egg facilities from using battery cages, and ges-
tation crates cannot be used after 2026.
After the Ohio compromise was a nation-
wide agreement for eggs but not hogs. Both the
UEP and HSUS have lobbied congress (Fatka,
2012) to phase out battery cages in 15–18
years—approximately 2026, the time horizon
for the Ohio compromise, and that is not a
Journal of Agricultural and Applied Economics, February 2014110
Tab
le1.
Ho
gan
dE
gg
Pro
du
ctio
nan
dIn
itia
tives
inU
.S.
Sta
tes
Ho
gS
ales
inM
illi
on
s
of
$(2
00
7)
Eg
gP
rod
uct
ion
inM
illi
on
so
f
Eg
gs
(20
10
)
I5
Init
iati
ve
Pro
cess
All
ow
ed
Ho
gS
ales
inM
illi
on
s
of
$(2
00
7)
Eg
gP
rod
uct
ion
inM
illi
on
s(2
01
0)
I5
Init
iati
ve
Pro
cess
All
ow
ed
1Io
wa
48
27
14
61
42
6M
on
tan
a3
61
19
I
2N
ort
hC
aro
lin
a3
10
53
25
12
7N
ort
hD
ako
ta3
5I
3M
inn
eso
ta2
14
02
86
92
8T
enn
esse
e3
43
08
4Il
lin
ois
a1
10
51
27
22
9C
ali
forn
ia3
35
39
0I
5In
dia
na
97
46
49
33
0N
ewY
ork
28
11
61
6N
ebra
ska
92
32
75
1I
31
Was
hin
gto
n6
17
39
I
7M
isso
uri
72
61
94
9I
32
Ore
go
n6
71
5I
8O
hio
57
27
53
5I
33
Mar
yla
nd
46
16
9O
kla
ho
ma
55
67
69
I3
4D
elaw
are
2
10
Kan
sas
50
63
5H
awai
i2
69
.5
11
So
uth
Dak
ota
38
16
72
I3
6F
lori
da
b2
25
92
I
12
Mic
hig
an
35
72
91
2I
37
Idah
o1
I
13
Pen
nsy
lvan
ia3
36
69
76
38
Wes
tV
irg
inia
12
67
14
Tex
as2
38
48
11
39
Mas
sach
use
tts
13
6I
15
Uta
h1
96
92
9I
40
New
Jers
ey1
16
Co
lora
do
15
91
06
6I
41
Lo
uis
ian
a1
46
2
17
Mis
siss
ipp
ib1
29
14
67
I4
2V
erm
on
t1
59
18
Wis
con
sin
10
01
31
24
3M
ain
e1
10
34
I
19
Ken
tuck
y9
01
11
94
4C
on
nec
ticu
t0
69
5
20
Ark
ansa
s8
42
89
4I
45
New
Ham
psh
ire
0
21
So
uth
Car
oli
na
77
11
02
46
Ari
zon
a0
I
22
Geo
rgia
68
44
19
47
New
Mex
ico
0
23
Vir
gin
ia5
77
29
48
Rh
od
eIs
lan
d0
24
Ala
bam
a5
52
18
24
9N
evad
a0
I
25
Wy
om
ing
42
2.4
I5
0A
lask
a0
I
aA
lth
ou
gh
Illi
no
iste
chn
ical
lyal
low
sin
itia
tives
for
con
stit
uti
on
alam
end
men
ts,
the
init
iati
ves
are
rest
rict
edto
ver
ysp
ecif
icis
sues
,an
dfo
rp
ract
ical
reas
on
s,Il
lin
ois
istr
eate
dth
esa
me
as
stat
esw
ith
ou
tin
itia
tives
.b
Init
iati
ve
can
on
lyb
eu
sed
toal
ter
the
stat
e’s
con
stit
uti
on
.
So
urc
e:N
atio
nal
Ag
ricu
ltu
ral
Sta
tist
ics
Ser
vic
e(2
00
7,
20
11
).
No
tes:
Mar
yla
nd
,N
ewM
exic
o,
and
Ken
tuck
yal
low
po
pu
lar
init
iati
ves
,bu
tth
ese
can
on
lyb
eu
sed
tovo
idan
exis
tin
gla
w.
Sta
tes
init
alic
sh
ave
alre
ady
ban
ned
ges
tati
on
crat
esth
ou
gh
init
iati
ves
and
/or
legis
lati
on
.
Smithson et al.: Animal Welfare Initiatives 111
coincidence. It seems plausible that Ohio, the
second largest egg producer, feared being un-
able to compete with other states where battery
cages are allowed and thus pushed for all states
to ban battery cages. Because Ohio does not
lead the nation in hog production like it does
eggs, a similar push for banning gestation
crates is absent. It is expected, then, that HSUS
will push for initiatives in other states, hoping
to ban gestation crates in enough states that
enthusiasm for a nationwide ban among the hog
industry will intensify.
Is such a strategy feasible? Assuming an
Illinois initiative is impractical, Nebraska is the
next largest initiative state in terms of hog
production. Requirements for an initiative are
daunting in Nebraska too: signatures must not
only be at least 7% of all registered voters, but
must exceed 5% in 38 of 93 counties; this last
requirement seems impossible. Nebraska is a
rural state with only two major cities, each city
comprising only one county. The third largest
city has only 50,137 people, and rural Nebraska
counties are highly unlikely to pass any mea-
sure sponsored by HSUS. Banning gestation
crates in Nebraska seems unlikely, but the
models we develop here at least allow one to
use more than just their intuition to judge the
likelihood of success in a state like Nebraska.
A salient difference between the gestation
crate and the battery cage debate is that gesta-
tion crates are of smaller value to hog pro-
ducers. Gestation crates do lower the cost of
raising hogs, but not as much as battery cages
save in egg production (Norwood and Lusk,
2011). If animal advocacy organizations can
ban crates in enough states, even if those states
contain few hogs, the hog industry may decide
the negative exposure from the initiatives is not
worth the small increase in costs from alter-
natives to gestation crates and may agree to a
nationwide ban. Thus, HSUS could still ach-
ieve its objectives by banning crates in states
like Massachusetts, Nevada, Utah, and Wash-
ington. Moreover, the present discussion of
initiatives should not cause us to forget the
possibility of direct legislation, which should
also be influenced by state demographics. It is
impossible to predict how the gestation crate
debate will unfold, but it is also impossible to
deny that citizen sentiment toward the crates,
which can be partially predicted with de-
mographic data, will play a role.
Some studies have recorded people’s pref-
erences for the types of animal welfare changes
required by Prop two. Richards, Allender, and
Fang (2011) study how advertising changes
people’s value for cage-free eggs in an experi-
ment, and Tonsor and Wolf (2010) investigate
support for Prop two measure but in hypothet-
ical surveys. Lusk (2010) measures how in-
store demand for cage and cage-free eggs was
influenced by Prop two’s passing in California.
These are interesting studies, providing insight
into attitudes toward animal welfare, but none
of them study actual votes cast by citizens for
a Prop two measure. Only Videras (2006) an-
alyzed actual votes, and it is this study we
mimic in California.
Method and Data
The objectives of this study are to estimate the
statistical relationships between county de-
mographics and votes cast for Prop two in the
2008 California election and then to use these
relationships to predict the outcome of a similar
vote in other states. The method involves a two-
step process. First, the voting record of the
2008 Prop two initiative in California is used in
conjunction with demographic data to construct
a regression model of voting behavior. This
model describes how the percent of voters
who approve of Prop two is influenced by de-
mographics. Second, the parameters of this
regression are assumed to be stable across other
states and are used to project voting patterns in
other states if a measure resembling Prop two
were placed on a ballot. Our approach is similar
to the methods used in environmental eco-
nomics on benefits transfer, where economists
use results from a study in one region or area to
project benefits in another (e.g., Smith, Van
Houtven, and Pattanayak, 2002).
The theoretical structure of the statistical
models is quite simple: people can be grouped
according to measurable demographics, and
different demographic groups have their own
distinct voting patterns. This empirical fact was
made salient in a 2012 poll, which found
Journal of Agricultural and Applied Economics, February 2014112
presidential candidate Mitt Romney earned 0%
of black voters (Demby, 2012), but the vote for
whites was considerably higher. To suggest that
ethnicity might also impact initiatives to ban
animal cages seems hardly a stretch, especially
considering survey work showing differing
levels of stated support for animal welfare laws
across ethnicities, income levels, gender, edu-
cation, age, and religious beliefs (Prickett, 2007),
empirical work showing how demographics
affect food preferences (Albisu, Gracia, and
Sanjuan, 2011), but more importantly the work
by Videras (2006) on the relationship between
demographics and the Florida initiative to ban
gestation crates.
The only theoretical structure needed is the
notion that some demographics might influence
voting behavior, but this structure can be nested
within any of the theories regarding voting
behavior. Three such theories are the rational
voter hypothesis, the expressive voter hypoth-
esis, and the ethical voter hypothesis (Mueller,
2003).
The rational voter hypothesis, sometimes
referred to as the Rochester model, treats vot-
ing decisions much like shopping decisions,
where voters support whatever initiatives or
candidates provide them with the highest
expected utility. It is only the outcome of the vote
that matters (Amadae and Bueno de Mesquita,
1999), and if different demographics receive
different streams of utility from banning gestation
crates and battery cages, then demographics will
be correlated with votes cast for Prop two. In-
dividuals in rural areas might oppose Prop two
because they feel it may harm rural economic
growth and thus their personal income. The urban
poor may oppose it in fear food prices will in-
crease. Of course, if the benefits of voting de-
pend solely on the outcome, a person might be
for or against Prop two but would have little
incentive to vote, because the probability their
vote will decide the fate of Prop two is almost
zero (they are probably more likely to die in
a car crash on the way to the polls than they are
to influence the outcome).
People do vote, however. Turnout for Cal-
ifornia in 2008 was almost 80% (Field Research
Corporation—California Opinion Index Secre-
tary of State, 2009). This suggests that better
explanations of voting behavior might be
found in what is called the Michigan model of
voting, in which a person’s personality, po-
litical identification, social identity, and ethi-
cal beliefs determine how a person votes. This
model suggests that people may choose to vote,
and vote for certain candidates and initiatives,
regardless of how the election outcome impacts
them personally. Instead, the individual pays
heed to their duty as a citizen, a member of a
political party, a religious order, and a moral
community (Miller and Shanks, 1996).
One genre of the Michigan model is the
expressive voter hypothesis, where voters re-
ceive benefits from voting in addition to the
election outcome. Call it loyalty to one’s po-
litical party or the desire to express one’s
opinion, but the point is that people will pay a
cost to vote for the mere act of voting, re-
gardless of the expected outcome. This means
that people who supported Barack Obama for
president out of a sense of self-identity may
also vote for Prop two, in the belief that elect-
ing Obama and passing Prop two are outcomes
consistent with their political identity, their
values, and the social groups they align with. In
this sense voting is like attending a football
game. The game has virtually no consequence
in the person’s life other than the enjoyment
from watching the game and knowing ‘‘their
team’’ was victorious. Grouping citizens into
economic, political, religious, and ethnic groups
is like parsing people into their various identi-
ties, which should exhibit different voting pat-
terns. Like the rational voter hypothesis, the
expressive voter hypothesis predicts that de-
mographic variables and voting behavior should
be correlated.
Because animal welfare is an ethical issue,
the ethical voter hypothesis—another mani-
festation of the Michigan model—should be
particularly important. Many people really do
care about farm animals and want them treated
humanely not because it benefits them directly,
but because it is ‘‘the right thing to do.’’ How-
ever, not every demographic holds the same
ethical values. A higher income allows one to
focus more on the well-being of animals in
addition to oneself. Different political parties
hold different values on regulation (and
Smithson et al.: Animal Welfare Initiatives 113
regulation in general contains some ethical no-
tions). Religion certainly involves ethics, and
different ethnicities pass down different ethical
beliefs from one generation to another. To the
extent that the ethical voter hypothesis is valid
and various demographics reflect different eth-
ical beliefs, demographics and voting behavior
for Prop two should be correlated.
These three theories all suggest demographics
and voting behavior are correlated, and most read-
ers probably see some truth in all three. Because
this study is concerned with how people vote and
not why, it is irrelevant whether just one or more
than one theory reflects why and how people vote.
The next section estimates a regression us-
ing demographic variables as explanatory var-
iables in predicting the percent of individuals in
each California county voting in favor of Prop
two. Theories of voting behavior do not reveal
which demographic variables should be included,
so we select a wide range of demographics, so
long as they meet one important criteria: they
must be observable in all 50 states. Otherwise,
the regression for California cannot be used to
predict outcomes in other states. That said, it
should be recognized that there are many other
variables (like spending by special interest groups
in support of or opposition to Prop two) that could
provide more accurate predictions of voting pat-
terns within California. Further research focusing
on California solely would want to consider a
larger array of variables than those in Table 2.
California contains 58 counties, and the
share of individuals in each county voting for
Prop two constitutes the dependent variable.
When they entered the ballot box to vote for
Prop two, they were also given the opportunity
to vote for their preferred presidential nominee.
It is likely that those who voted for candidate
Obama were also more likely to vote for Prop
two. Other demographic variables are compiled
from various sources; these include income,
value of the person’s home, gender, religion,
ethnicity, age, population density, and prox-
imity to farms. Table 2 provides descriptive
statistics of these variables, which are used as
explanatory variables in a regression model.
A few remarks about these variables are
warranted. Home values are used in addition to
household incomes because home values reflect
current income, past income, and expectations
of future income (but because it is an imperfect
measure of wealth, the variable current house-
hold income is also included). Income and house
prices are not adjusted for differences in cost of
living across regions, because higher living costs
generally reflect more valuable amenities (it costs
more to live at the beach because the beach itself
is highly valued). The percentages for white,
black, and Hispanic ethnicities can exceed 100%,
because someone may identify with both whites
and Hispanics. Population density is measured by
people per square mile and lack of exposure to
farms by the population per farm in the county.
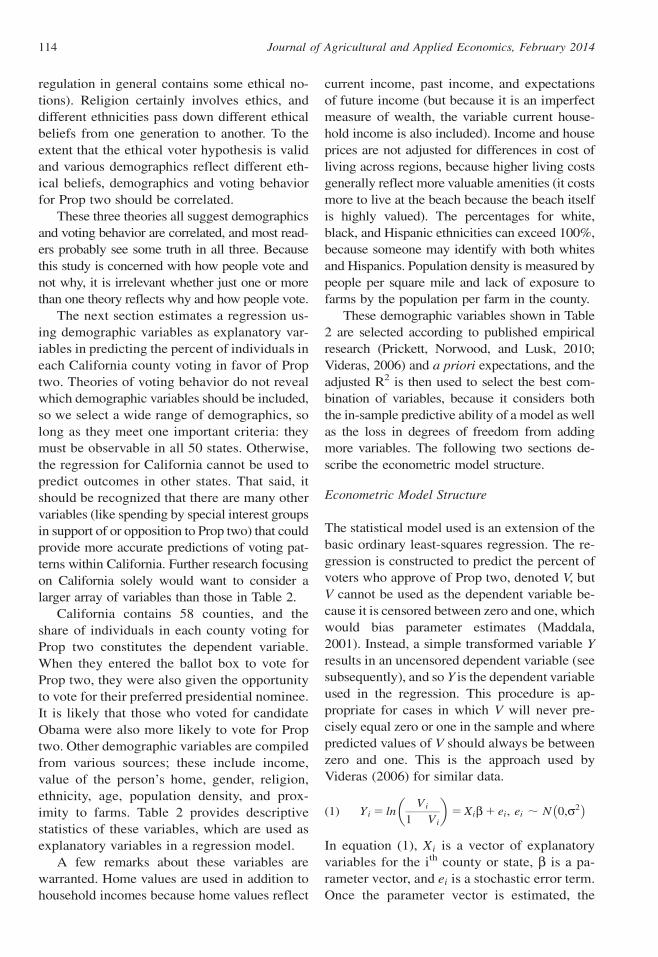
These demographic variables shown in Table
2 are selected according to published empirical
research (Prickett, Norwood, and Lusk, 2010;
Videras, 2006) and a priori expectations, and the
adjusted R2 is then used to select the best com-
bination of variables, because it considers both
the in-sample predictive ability of a model as well
as the loss in degrees of freedom from adding
more variables. The following two sections de-
scribe the econometric model structure.
Econometric Model Structure
The statistical model used is an extension of the
basic ordinary least-squares regression. The re-
gression is constructed to predict the percent of
voters who approve of Prop two, denoted V, but
V cannot be used as the dependent variable be-
cause it is censored between zero and one, which
would bias parameter estimates (Maddala,
2001). Instead, a simple transformed variable Y
results in an uncensored dependent variable (see
subsequently), and so Y is the dependent variable
used in the regression. This procedure is ap-
propriate for cases in which V will never pre-
cisely equal zero or one in the sample and where
predicted values of V should always be between
zero and one. This is the approach used by
Videras (2006) for similar data.
(1) Yi 5 lnVi
1� Vi
� �5 Xib 1 ei, ei ; N 0,s2
� �
In equation (1), Xi is a vector of explanatory
variables for the ith county or state, b is a pa-
rameter vector, and ei is a stochastic error term.
Once the parameter vector is estimated, the
Journal of Agricultural and Applied Economics, February 2014114
predicted Vi is acquired first by taking the in-
verse of equation (1).
(2) Vi 5eXib1ei
1 1 eXib1ei
The expected value of equation (2) is a non-
linear function of a random error ei. So al-
though equation (1) can be estimated using
simple ordinary least squares, the expected
value of V goes by a highly nonlinear equation,
which can be approximated using bootstraps.
Other models could be used. A simple logit
model could be used where the zero/one de-
pendent variable is used to determine if a
county voted in favor of the measure (but this
excludes valuable information on the actual
vote shares) or by using the share of votes for
each county as the dependent variable (logit
models do not have to have discrete dependent
variables). If the latter estimate was used, the
logit would be specified such that the percent of
votes is said to be Vi 5 eXib1ei
1 1 eXib1ei. However,
this is the same specification as in equation (2),
so our model and the logit model are built on
the same basic assumptions.
The reader might suspect a Tobit regression
would be valid, considering the variable Vi is
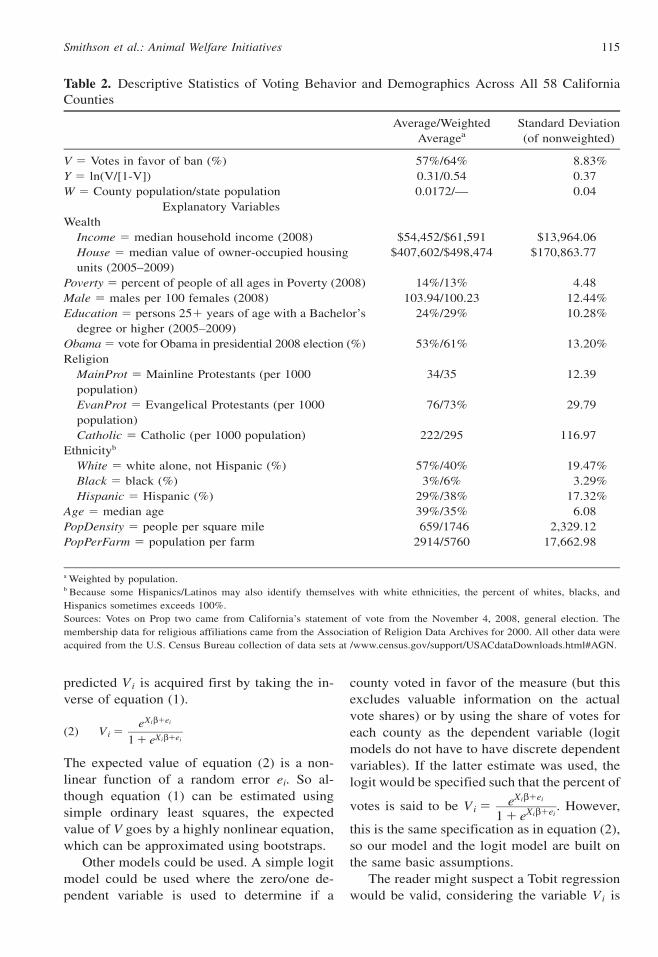
Table 2. Descriptive Statistics of Voting Behavior and Demographics Across All 58 CaliforniaCounties
Average/Weighted
Averagea
Standard Deviation
(of nonweighted)
V 5 Votes in favor of ban (%) 57%/64% 8.83%
Y 5 ln(V/[1-V]) 0.31/0.54 0.37
W 5 County population/state population 0.0172/— 0.04
Explanatory Variables
Wealth
Income 5 median household income (2008) $54,452/$61,591 $13,964.06
House 5 median value of owner-occupied housing
units (2005–2009)
$407,602/$498,474 $170,863.77
Poverty 5 percent of people of all ages in Poverty (2008) 14%/13% 4.48
Male 5 males per 100 females (2008) 103.94/100.23 12.44%
Education 5 persons 251 years of age with a Bachelor’s
degree or higher (2005–2009)
24%/29% 10.28%
Obama 5 vote for Obama in presidential 2008 election (%) 53%/61% 13.20%
Religion
MainProt 5 Mainline Protestants (per 1000
population)
34/35 12.39
EvanProt 5 Evangelical Protestants (per 1000
population)
76/73% 29.79
Catholic 5 Catholic (per 1000 population) 222/295 116.97
Ethnicityb
White 5 white alone, not Hispanic (%) 57%/40% 19.47%
Black 5 black (%) 3%/6% 3.29%
Hispanic 5 Hispanic (%) 29%/38% 17.32%
Age 5 median age 39%/35% 6.08
PopDensity 5 people per square mile 659/1746 2,329.12
PopPerFarm 5 population per farm 2914/5760 17,662.98
a Weighted by population.b Because some Hispanics/Latinos may also identify themselves with white ethnicities, the percent of whites, blacks, and
Hispanics sometimes exceeds 100%.
Sources: Votes on Prop two came from California’s statement of vote from the November 4, 2008, general election. The
membership data for religious affiliations came from the Association of Religion Data Archives for 2000. All other data were
acquired from the U.S. Census Bureau collection of data sets at /www.census.gov/support/USACdataDownloads.html#AGN.
Smithson et al.: Animal Welfare Initiatives 115
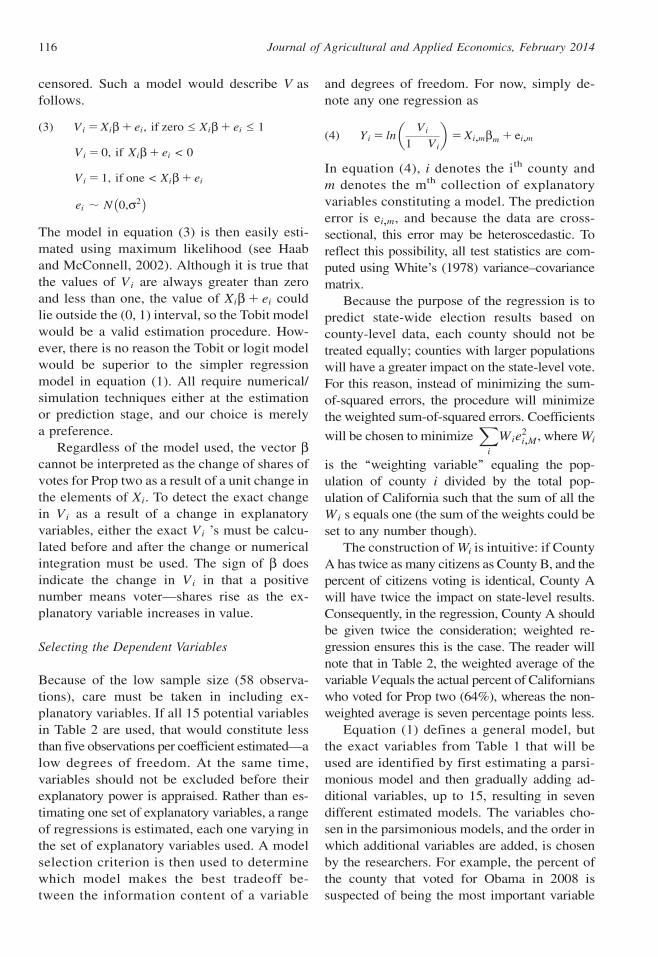
censored. Such a model would describe V as
follows.
(3) Vi 5 Xib 1 ei, if zero £ Xib 1 ei £ 1
Vi 5 0, if Xib 1 ei < 0
Vi 5 1, if one < Xib 1 ei
ei ; N 0,s2� �
The model in equation (3) is then easily esti-
mated using maximum likelihood (see Haab
and McConnell, 2002). Although it is true that
the values of Vi are always greater than zero
and less than one, the value of Xib 1 ei could
lie outside the (0, 1) interval, so the Tobit model
would be a valid estimation procedure. How-
ever, there is no reason the Tobit or logit model
would be superior to the simpler regression
model in equation (1). All require numerical/
simulation techniques either at the estimation
or prediction stage, and our choice is merely
a preference.
Regardless of the model used, the vector bcannot be interpreted as the change of shares of
votes for Prop two as a result of a unit change in
the elements of Xi. To detect the exact change
in Vi as a result of a change in explanatory
variables, either the exact Vi ’s must be calcu-
lated before and after the change or numerical
integration must be used. The sign of b does
indicate the change in Vi in that a positive
number means voter—shares rise as the ex-
planatory variable increases in value.
Selecting the Dependent Variables
Because of the low sample size (58 observa-
tions), care must be taken in including ex-
planatory variables. If all 15 potential variables
in Table 2 are used, that would constitute less
than five observations per coefficient estimated—a
low degrees of freedom. At the same time,
variables should not be excluded before their
explanatory power is appraised. Rather than es-
timating one set of explanatory variables, a range
of regressions is estimated, each one varying in
the set of explanatory variables used. A model
selection criterion is then used to determine
which model makes the best tradeoff be-
tween the information content of a variable
and degrees of freedom. For now, simply de-
note any one regression as
(4) Yi 5 lnVi
1� Vi
� �5 Xi,mbm 1 ei,m
In equation (4), i denotes the ith county and
m denotes the mth collection of explanatory
variables constituting a model. The prediction
error is ei,m, and because the data are cross-
sectional, this error may be heteroscedastic. To
reflect this possibility, all test statistics are com-
puted using White’s (1978) variance–covariance
matrix.
Because the purpose of the regression is to
predict state-wide election results based on
county-level data, each county should not be
treated equally; counties with larger populations
will have a greater impact on the state-level vote.
For this reason, instead of minimizing the sum-
of-squared errors, the procedure will minimize
the weighted sum-of-squared errors. Coefficients
will be chosen to minimizeX
i
Wie2i,M, where Wi
is the ‘‘weighting variable’’ equaling the pop-
ulation of county i divided by the total pop-
ulation of California such that the sum of all the
Wi s equals one (the sum of the weights could be
set to any number though).
The construction of Wi is intuitive: if County
A has twice as many citizens as County B, and the
percent of citizens voting is identical, County A
will have twice the impact on state-level results.
Consequently, in the regression, County A should
be given twice the consideration; weighted re-
gression ensures this is the case. The reader will
note that in Table 2, the weighted average of the
variable Vequals the actual percent of Californians
who voted for Prop two (64%), whereas the non-
weighted average is seven percentage points less.
Equation (1) defines a general model, but
the exact variables from Table 1 that will be
used are identified by first estimating a parsi-
monious model and then gradually adding ad-
ditional variables, up to 15, resulting in seven
different estimated models. The variables cho-
sen in the parsimonious models, and the order in
which additional variables are added, is chosen
by the researchers. For example, the percent of
the county that voted for Obama in 2008 is
suspected of being the most important variable
Journal of Agricultural and Applied Economics, February 2014116
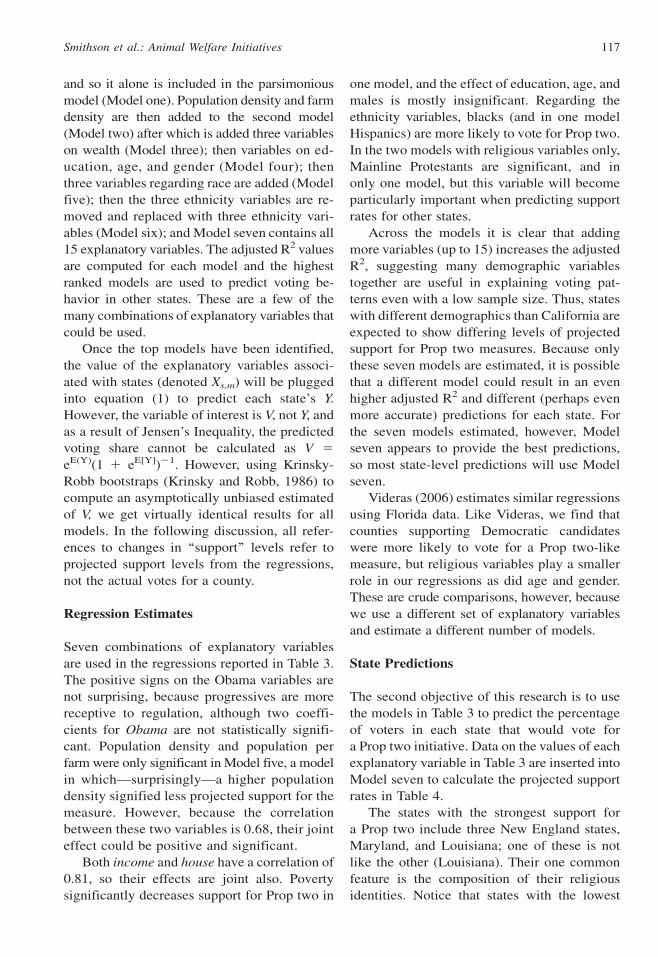
and so it alone is included in the parsimonious
model (Model one). Population density and farm
density are then added to the second model
(Model two) after which is added three variables
on wealth (Model three); then variables on ed-
ucation, age, and gender (Model four); then
three variables regarding race are added (Model
five); then the three ethnicity variables are re-
moved and replaced with three ethnicity vari-
ables (Model six); and Model seven contains all
15 explanatory variables. The adjusted R2 values
are computed for each model and the highest
ranked models are used to predict voting be-
havior in other states. These are a few of the
many combinations of explanatory variables that
could be used.
Once the top models have been identified,
the value of the explanatory variables associ-
ated with states (denoted Xs,m) will be plugged
into equation (1) to predict each state’s Y.
However, the variable of interest is V, not Y, and
as a result of Jensen’s Inequality, the predicted
voting share cannot be calculated as V 5
eE(Y)(1 1 eE[Y])21. However, using Krinsky-
Robb bootstraps (Krinsky and Robb, 1986) to
compute an asymptotically unbiased estimated
of V, we get virtually identical results for all
models. In the following discussion, all refer-
ences to changes in ‘‘support’’ levels refer to
projected support levels from the regressions,
not the actual votes for a county.
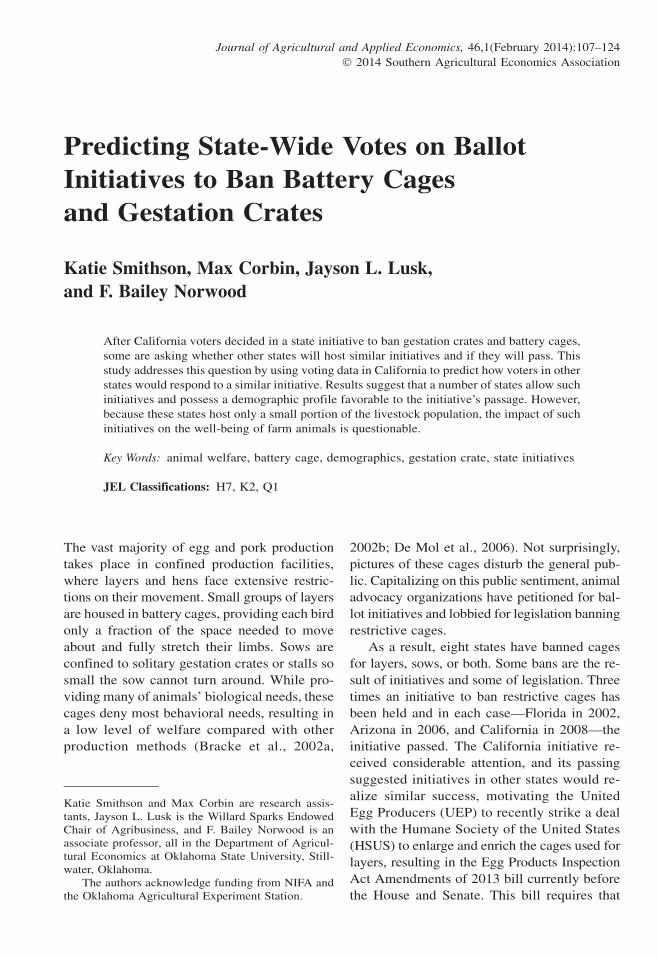
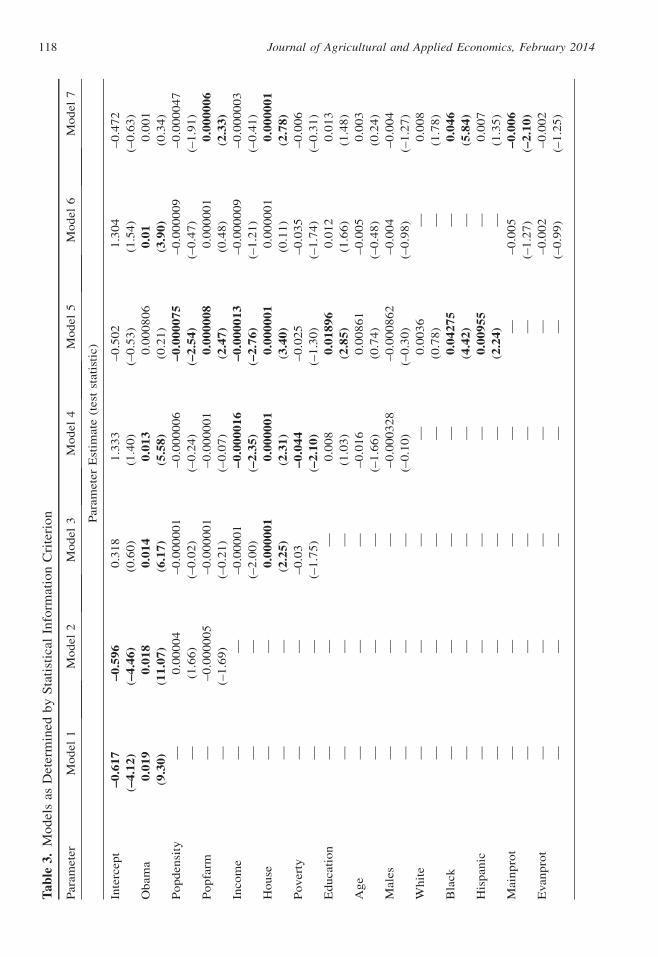
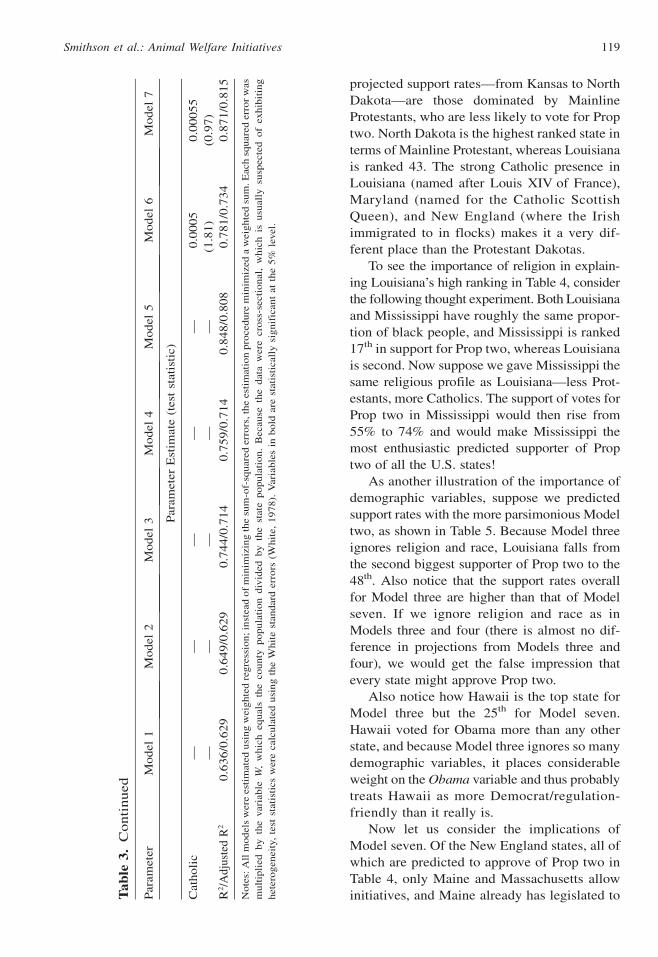
Regression Estimates
Seven combinations of explanatory variables
are used in the regressions reported in Table 3.
The positive signs on the Obama variables are
not surprising, because progressives are more
receptive to regulation, although two coeffi-
cients for Obama are not statistically signifi-
cant. Population density and population per
farm were only significant in Model five, a model
in which—surprisingly—a higher population
density signified less projected support for the
measure. However, because the correlation
between these two variables is 0.68, their joint
effect could be positive and significant.
Both income and house have a correlation of
0.81, so their effects are joint also. Poverty
significantly decreases support for Prop two in
one model, and the effect of education, age, and
males is mostly insignificant. Regarding the
ethnicity variables, blacks (and in one model
Hispanics) are more likely to vote for Prop two.
In the two models with religious variables only,
Mainline Protestants are significant, and in
only one model, but this variable will become
particularly important when predicting support
rates for other states.
Across the models it is clear that adding
more variables (up to 15) increases the adjusted
R2, suggesting many demographic variables
together are useful in explaining voting pat-
terns even with a low sample size. Thus, states
with different demographics than California are
expected to show differing levels of projected
support for Prop two measures. Because only
these seven models are estimated, it is possible
that a different model could result in an even
higher adjusted R2 and different (perhaps even
more accurate) predictions for each state. For
the seven models estimated, however, Model
seven appears to provide the best predictions,
so most state-level predictions will use Model
seven.
Videras (2006) estimates similar regressions
using Florida data. Like Videras, we find that
counties supporting Democratic candidates
were more likely to vote for a Prop two-like
measure, but religious variables play a smaller
role in our regressions as did age and gender.
These are crude comparisons, however, because
we use a different set of explanatory variables
and estimate a different number of models.
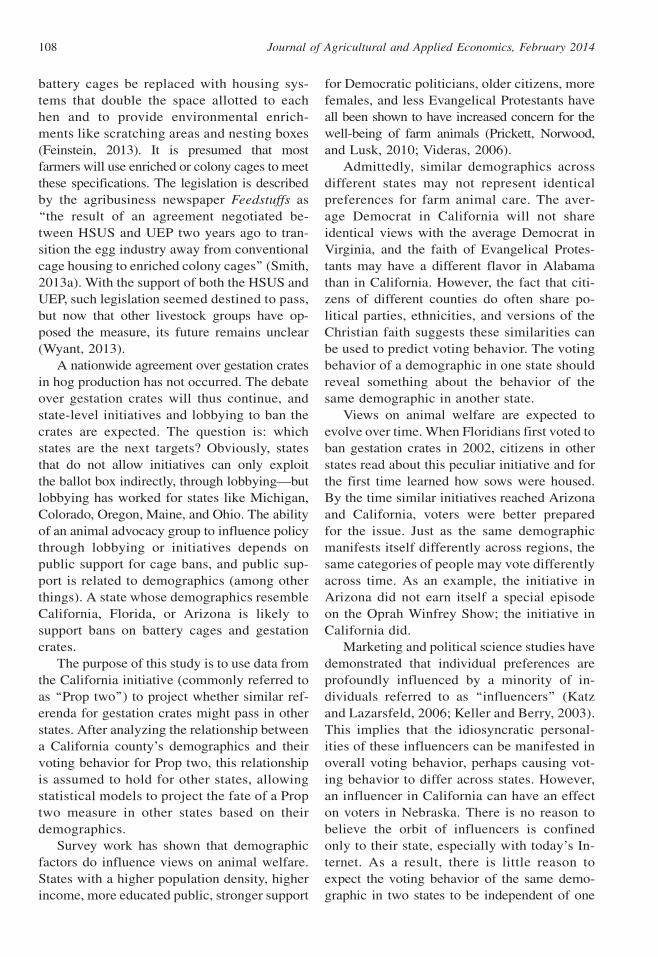
State Predictions
The second objective of this research is to use
the models in Table 3 to predict the percentage
of voters in each state that would vote for
a Prop two initiative. Data on the values of each
explanatory variable in Table 3 are inserted into
Model seven to calculate the projected support
rates in Table 4.
The states with the strongest support for
a Prop two include three New England states,
Maryland, and Louisiana; one of these is not
like the other (Louisiana). Their one common
feature is the composition of their religious
identities. Notice that states with the lowest
Smithson et al.: Animal Welfare Initiatives 117
Tab
le3.
Model
sas
Det
erm
ined
by
Sta
tist
ical
Info
rmat
ion
Cri
teri
on
Par
amet
erM
od
el1
Mo
del
2M
od
el3
Mo
del
4M
od
el5
Mo
del
6M
od
el7
Par
amet
erE
stim
ate
(tes
tst
atis
tic)
Inte
rcep
t–
0.6
17
–0
.59
60
.31
81
.33
3–
0.5
02
1.3
04
–0
.47
2
(–4
.12
)(–
4.4
6)
(0.6
0)
(1.4
0)
(–0
.53
)(1
.54
)(–
0.6
3)
Obam
a0
.01
90
.01
80
.01
40
.01
30
.00
08
06
0.0
10
.00
1
(9.3
0)
(11
.07
)(6
.17
)(5
.58
)(0
.21
)(3
.90
)(0
.34
)
Po
pd
ensi
ty—
0.0
00
04
–0
.00
00
01
–0
.00
00
06
–0
.00
00
75
–0
.00
00
09
–0
.00
00
47
—(1
.66
)(–
0.0
2)
(–0
.24
)(–
2.5
4)
(–0
.47
)(–
1.9
1)
Po
pfa
rm—
–0
.00
00
05
–0
.00
00
01
–0
.00
00
01
0.0
00
00
80
.00
00
01
0.0
00
00
6
—(–
1.6
9)
(–0
.21
)(–
0.0
7)
(2.4
7)
(0.4
8)
(2.3
3)
Inco
me
——
–0
.00
00
1–
0.0
00
01
6–
0.0
00
01
3–
0.0
00
00
9–
0.0
00
00
3
——
(–2
.00
)(–
2.3
5)
(–2
.76
)(–
1.2
1)
(–0
.41
)
Ho
use
——
0.0
00
00
10
.00
00
01
0.0
00
00
10
.00
00
01
0.0
00
00
1
——
(2.2
5)
(2.3
1)
(3.4
0)
(0.1
1)
(2.7
8)
Pover
ty—
—–
0.0
3–
0.0
44
–0
.02
5–
0.0
35
–0
.00
6
——
(–1
.75
)(–
2.1
0)
(–1
.30
)(–
1.7
4)
(–0
.31
)
Ed
uca
tio
n—
——
0.0
08
0.0
18
96
0.0
12
0.0
13
——
—(1
.03
)(2
.85
)(1
.66
)(1
.48
)
Ag
e—
——
–0
.01
60
.00
86
1–
0.0
05
0.0
03
——
—(–
1.6
6)
(0.7
4)
(–0
.48
)(0
.24
)
Mal
es—
——
–0
.00
03
28
–0
.00
08
62
–0
.00
4–
0.0
04
——
—(–
0.1
0)
(–0
.30
)(–
0.9
8)
(–1
.27
)
Wh
ite
——
——
0.0
03
6—
0.0
08
——
——
(0.7
8)
—(1
.78
)
Bla
ck—
——
—0
.04
27
5—
0.0
46
——
——
(4.4
2)
—(5
.84
)
His
pan
ic—
——
—0
.00
95
5—
0.0
07
——
——
(2.2
4)
—(1
.35
)
Mai
np
rot
——
——
—–
0.0
05
–0
.00
6
——
——
—(–
1.2
7)
(–2
.10
)
Evan
pro
t—
——
——
–0
.00
2–
0.0
02
——
——
—(–
0.9
9)
(–1
.25
)
Journal of Agricultural and Applied Economics, February 2014118
projected support rates—from Kansas to North
Dakota—are those dominated by Mainline
Protestants, who are less likely to vote for Prop
two. North Dakota is the highest ranked state in
terms of Mainline Protestant, whereas Louisiana
is ranked 43. The strong Catholic presence in
Louisiana (named after Louis XIV of France),
Maryland (named for the Catholic Scottish
Queen), and New England (where the Irish
immigrated to in flocks) makes it a very dif-
ferent place than the Protestant Dakotas.
To see the importance of religion in explain-
ing Louisiana’s high ranking in Table 4, consider
the following thought experiment. Both Louisiana
and Mississippi have roughly the same propor-
tion of black people, and Mississippi is ranked
17th in support for Prop two, whereas Louisiana
is second. Now suppose we gave Mississippi the
same religious profile as Louisiana—less Prot-
estants, more Catholics. The support of votes for
Prop two in Mississippi would then rise from
55% to 74% and would make Mississippi the
most enthusiastic predicted supporter of Prop
two of all the U.S. states!
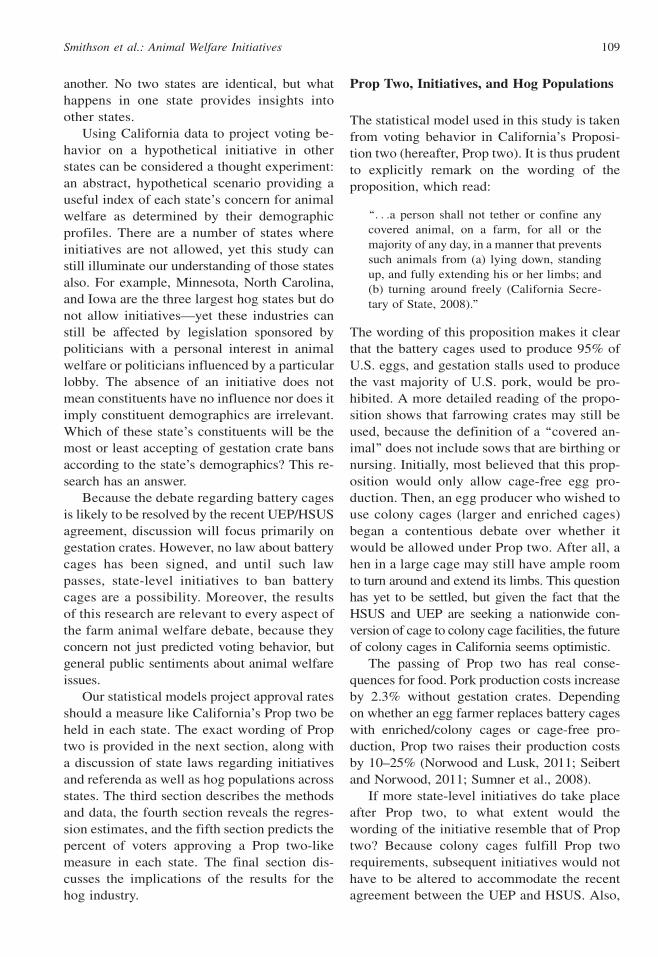
As another illustration of the importance of
demographic variables, suppose we predicted
support rates with the more parsimonious Model
two, as shown in Table 5. Because Model three
ignores religion and race, Louisiana falls from
the second biggest supporter of Prop two to the
48th. Also notice that the support rates overall
for Model three are higher than that of Model
seven. If we ignore religion and race as in
Models three and four (there is almost no dif-
ference in projections from Models three and
four), we would get the false impression that
every state might approve Prop two.
Also notice how Hawaii is the top state for
Model three but the 25th for Model seven.
Hawaii voted for Obama more than any other
state, and because Model three ignores so many
demographic variables, it places considerable
weight on the Obama variable and thus probably
treats Hawaii as more Democrat/regulation-
friendly than it really is.
Now let us consider the implications of
Model seven. Of the New England states, all of
which are predicted to approve of Prop two in
Table 4, only Maine and Massachusetts allow
initiatives, and Maine already has legislated toTab
le3.
Co
nti
nu
ed
Par
amet
erM
od
el1
Mo
del
2M
od
el3
Mo
del
4M
od
el5
Mo
del
6M
od
el7
Par
amet
erE
stim
ate
(tes
tst
atis
tic)
Cat
ho
lic
——
——
—0
.00
05
0.0
00
55
——
——
—(1
.81
)(0
.97
)
R2/A
dju
sted
R2
0.6
36
/0.6
29
0.6
49
/0.6
29
0.7
44
/0.7
14
0.7
59
/0.7
14
0.8
48
/0.8
08
0.7
81
/0.7
34
0.8
71
/0.8
15
No
tes:
All
mo
del
sw
ere
esti
mat
edu
sin
gw
eig
hte
dre
gre
ssio
n;
inst
ead
of
min
imiz
ing
the
sum
-of-
squ
ared
erro
rs,th
ees
tim
atio
np
roce
du
rem
inim
ized
aw
eig
hte
dsu
m.E
ach
squ
ared
erro
rw
as
mu
ltip
lied
by
the
var
iab
leW
,w
hic
heq
ual
sth
eco
un
typ
op
ula
tio
nd
ivid
edb
yth
est
ate
po
pu
lati
on
.B
ecau
seth
ed
ata
wer
ecr
oss
-sec
tio
nal
,w
hic
his
usu
ally
susp
ecte
do
fex
hib
itin
g
het
ero
gen
eity
,te
stst
atis
tics
wer
eca
lcu
late
du
sin
gth
eW
hit
est
and
ard
erro
rs(W
hit
e,1
97
8).
Var
iab
les
inb
old
are
stat
isti
call
ysi
gn
ific
ant
atth
e5
%le
vel
.
Smithson et al.: Animal Welfare Initiatives 119
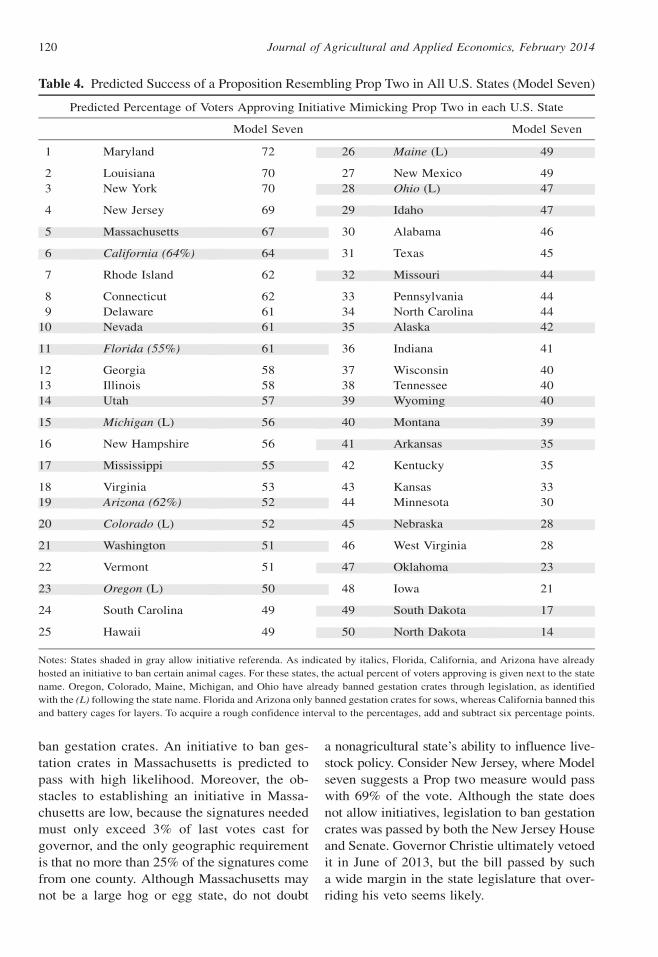
ban gestation crates. An initiative to ban ges-
tation crates in Massachusetts is predicted to
pass with high likelihood. Moreover, the ob-
stacles to establishing an initiative in Massa-
chusetts are low, because the signatures needed
must only exceed 3% of last votes cast for
governor, and the only geographic requirement
is that no more than 25% of the signatures come
from one county. Although Massachusetts may
not be a large hog or egg state, do not doubt
a nonagricultural state’s ability to influence live-
stock policy. Consider New Jersey, where Model
seven suggests a Prop two measure would pass
with 69% of the vote. Although the state does
not allow initiatives, legislation to ban gestation
crates was passed by both the New Jersey House
and Senate. Governor Christie ultimately vetoed
it in June of 2013, but the bill passed by such
a wide margin in the state legislature that over-
riding his veto seems likely.
Table 4. Predicted Success of a Proposition Resembling Prop Two in All U.S. States (Model Seven)
Predicted Percentage of Voters Approving Initiative Mimicking Prop Two in each U.S. State
Model Seven Model Seven
1 Maryland 72 26 Maine (L) 49
2 Louisiana 70 27 New Mexico 49
3 New York 70 28 Ohio (L) 47
4 New Jersey 69 29 Idaho 47
5 Massachusetts 67 30 Alabama 46
6 California (64%) 64 31 Texas 45
7 Rhode Island 62 32 Missouri 44
8 Connecticut 62 33 Pennsylvania 44
9 Delaware 61 34 North Carolina 44
10 Nevada 61 35 Alaska 42
11 Florida (55%) 61 36 Indiana 41
12 Georgia 58 37 Wisconsin 40
13 Illinois 58 38 Tennessee 40
14 Utah 57 39 Wyoming 40
15 Michigan (L) 56 40 Montana 39
16 New Hampshire 56 41 Arkansas 35
17 Mississippi 55 42 Kentucky 35
18 Virginia 53 43 Kansas 33
19 Arizona (62%) 52 44 Minnesota 30
20 Colorado (L) 52 45 Nebraska 28
21 Washington 51 46 West Virginia 28
22 Vermont 51 47 Oklahoma 23
23 Oregon (L) 50 48 Iowa 21
24 South Carolina 49 49 South Dakota 17
25 Hawaii 49 50 North Dakota 14
Notes: States shaded in gray allow initiative referenda. As indicated by italics, Florida, California, and Arizona have already
hosted an initiative to ban certain animal cages. For these states, the actual percent of voters approving is given next to the state
name. Oregon, Colorado, Maine, Michigan, and Ohio have already banned gestation crates through legislation, as identified
with the (L) following the state name. Florida and Arizona only banned gestation crates for sows, whereas California banned this
and battery cages for layers. To acquire a rough confidence interval to the percentages, add and subtract six percentage points.
Journal of Agricultural and Applied Economics, February 2014120
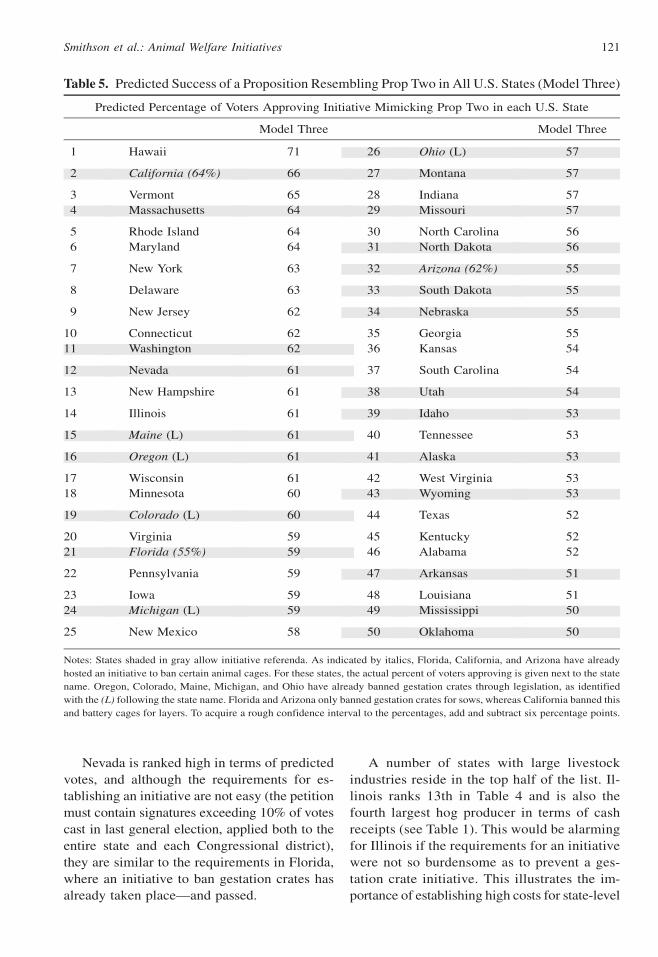
Nevada is ranked high in terms of predicted
votes, and although the requirements for es-
tablishing an initiative are not easy (the petition
must contain signatures exceeding 10% of votes
cast in last general election, applied both to the
entire state and each Congressional district),
they are similar to the requirements in Florida,
where an initiative to ban gestation crates has
already taken place—and passed.
A number of states with large livestock
industries reside in the top half of the list. Il-
linois ranks 13th in Table 4 and is also the
fourth largest hog producer in terms of cash
receipts (see Table 1). This would be alarming
for Illinois if the requirements for an initiative
were not so burdensome as to prevent a ges-
tation crate initiative. This illustrates the im-
portance of establishing high costs for state-level
Table 5. Predicted Success of a Proposition Resembling Prop Two in All U.S. States (Model Three)
Predicted Percentage of Voters Approving Initiative Mimicking Prop Two in each U.S. State
Model Three Model Three
1 Hawaii 71 26 Ohio (L) 57
2 California (64%) 66 27 Montana 57
3 Vermont 65 28 Indiana 57
4 Massachusetts 64 29 Missouri 57
5 Rhode Island 64 30 North Carolina 56
6 Maryland 64 31 North Dakota 56
7 New York 63 32 Arizona (62%) 55
8 Delaware 63 33 South Dakota 55
9 New Jersey 62 34 Nebraska 55
10 Connecticut 62 35 Georgia 55
11 Washington 62 36 Kansas 54
12 Nevada 61 37 South Carolina 54
13 New Hampshire 61 38 Utah 54
14 Illinois 61 39 Idaho 53
15 Maine (L) 61 40 Tennessee 53
16 Oregon (L) 61 41 Alaska 53
17 Wisconsin 61 42 West Virginia 53
18 Minnesota 60 43 Wyoming 53
19 Colorado (L) 60 44 Texas 52
20 Virginia 59 45 Kentucky 52
21 Florida (55%) 59 46 Alabama 52
22 Pennsylvania 59 47 Arkansas 51
23 Iowa 59 48 Louisiana 51
24 Michigan (L) 59 49 Mississippi 50
25 New Mexico 58 50 Oklahoma 50
Notes: States shaded in gray allow initiative referenda. As indicated by italics, Florida, California, and Arizona have already
hosted an initiative to ban certain animal cages. For these states, the actual percent of voters approving is given next to the state
name. Oregon, Colorado, Maine, Michigan, and Ohio have already banned gestation crates through legislation, as identified
with the (L) following the state name. Florida and Arizona only banned gestation crates for sows, whereas California banned this
and battery cages for layers. To acquire a rough confidence interval to the percentages, add and subtract six percentage points.
Smithson et al.: Animal Welfare Initiatives 121
initiatives—if the goal is to prevent a Prop two
event.
Approximately 47% of Ohio citizens are pre-
dicted to vote to ban restrictive livestock cages.
Ohio is the eighth biggest hog producer and the
second largest egg-producing state, illustrating
both why HSUS targeted Ohio and why Ohio
agriculture capitulated before an initiative could
be held (47% is close to a 50–50% chance of
passing). Michigan and Colorado have legislated
gestation crates away before an initiative could
be held. Installing an initiative in Michigan or
Colorado is not overly expensive, and given the
projected support for Prop two in both states, it is
clear why they sought to avoid an initiative.
Utah voters are predicted to support Prop
two, and the requirements for a Utah initiative
are low enough that a Utah Prop two would not be
surprising. The state of Washington was consid-
ering an initiative on battery cages, which may be
irrelevant if the HSUS and UEP can continue their
alliance—and one now wonders whether Wash-
ington will pursue a gestation crate initiative given
its demographics are favorable to its approval.
The hypothetical initiative in North Caro-
lina would fail with a predicted vote of 44% for
Prop two, but like Maine, is not far from
passing, yet North Carolina raises more hogs
than any other state besides Iowa. Although
North Carolina does not allow initiatives, en-
vironmental groups have demonstrated an
ability to threaten the hog industry (Environ-
mental Defense Fund, 2000). Could animal
advocacy groups do likewise? Given that
Smithfield Foods, who owns almost all the state’s
hogs, has voluntarily committed to replacing
gestation crates with group pens on the North
Carolina farms it owns (Smith, 2013b), one
cannot say gestation crates are immune from
animal advocacy groups. Iowa is the biggest
hog-producing state, does not allow initia-
tives, and exhibits a very low support rate of
21%, perhaps making the most powerful hog
state immune from gestation crate bans.
At the bottom of the list are the Dakotas
with percentages under 20%. The Dakotas are
the highest and second highest ranked in terms
of Mainline Protestants, have the smallest
number of people per farm, and are among the
highest in terms of white ethnicities. In areas of
rural white Protestants, Prop two stands little
chance of passing.
How accurate are the percentages in Table
4? One measure can be found in the fact that
two other states besides California have hosted
a similar initiative for gestation crates. Although
the votes occurred before 2008, they are never-
theless a useful test for discerning whether the
relationship between demographics and voting
behavior is relatively stable across states and
time. Florida passed their measure with 55% of
the actual vote, whereas Table 4 predicts 61%,
which seems close enough to deem the pre-
diction accurate. Although the Arizona measure
is predicted to pass and it did, the difference is ten
percentage points. We leave the reader to decide
whether these are accurate predictions or not.
Implications for Hogs
The egg industry’s weakness is Ohio. It is the
second largest egg-producing state, 63% of its
voters are projected to vote in favor of an ini-
tiative resembling Prop two, and Ohio’s laws
make initiatives possible and relatively in-
expensive. For these reasons, the egg and pork
industries were worried HSUS would be able to
ban gestation crates and battery cages through
an initiative resembling Prop two and capitu-
lated to prevent a public defeat and to negotiate
favorable terms. The Ohio egg lobby, we suspect
however cannot prove, sought to force other states
to also phase out the battery cage. Otherwise,
Ohio would be hobbled by higher production
costs. Regardless of the reason, the UEP has
joined with the HSUS to pursue a nationwide ban.
It is worth noting that the hog industry has
no counterpart to Ohio; there is no single state
serving as a weak link resisting gestation
crates. The top seven hog-producing states are
insulated from gestation crate bans by the ab-
sence of initiatives, high costs to installing an
initiative, and/or state demographics opposed
to a Prop two initiative. These seven states
comprise 77% of all hog production (as mea-
sured by sales revenue), and so more than three-
fourths of the hog industry is well defended
against initiatives. This suggests a nationwide
ban on gestation crates, following as a result of
state-level initiatives, is unlikely.
Journal of Agricultural and Applied Economics, February 2014122
There are still ways the HSUS and other
animal advocacy groups might increase pres-
sure on the hog industry, and given the rela-
tively small benefit of gestation crates in terms
of production costs, a nationwide gestation crate
ban might be achieved with only minor state
victories by the HSUS. Consider the following
scenario. The HSUS targets Massachusetts,
Nevada, Utah, and Washington, where initia-
tives can be reasonably established and where
a majority of voters might approve a measure
like Prop two. Although these four states host
small hog populations, news of the gestation
crate ban would be covered by media across the
country—and not all publicity is good publicity.
The hog industry would then begin to
wonder whether the benefits of gestation crates
are worth the bad publicity. Research has esti-
mated gestation crates to reduce costs by only
2.3% compared with farms where gestation
crates are replaced with group pens (Seibert
and Norwood, 2011). Compare this with the
benefit of battery cages in egg production,
which reduce costs by 25% compared with
cage-free egg production (Sumner et al., 2008)
and 10–15% compared with enriched cages
(Norwood and Lusk, 2011). Considering costs
only, ceteris paribus, pork producers have less
to lose from Prop two than egg producers.
Even if bad publicity from bans in Massa-
chusetts, Nevada, Utah, and Washington are not
enough to convince the hog industry to replace
gestation crates with group pens, additional
pressure from alternative organizations may.
The federal government has considered re-
quiring all government purchases of pork be
produced without gestation crates, and al-
though the proposal received little support, it
could be revived with more fervor. More res-
taurants may require their food supplies be
produced without gestation crates. A state court
may someday decide that gestation crates vio-
late their anticruelty laws, as New Jersey once
considered (Norwood and Lusk, 2011).
Although an economist might ask whether
consumers will begin replacing conventional
pork with crate-free pork, there is little evi-
dence of this occurring. Certainly, some crate-
free pork is sold in stores like Whole Foods, but
as a percentage of pork production, crate-free
pork is virtually nonexistent. If gestation crates
are banned, it will likely be the result of pressure
from interest groups and citizens at the ballot
box, not the average grocery store shopper.
The bottom line for the hog industry is this.
Over three-fourths of U.S. hog production is
insulated from state-level initiatives banning
gestation crates. The question is whether the
bad publicity from initiatives in other states and
groups, combined with the relatively small
benefit of gestation crates, is strong enough to
induce the hog industry as a whole to volun-
tarily discard gestation crates. The answer to
this question is unknown. What this study does
show is that a state-level initiative to ban ges-
tation crates in Massachusetts, Nevada, Utah,
and Washington is a real possibility.
[Received May 2012; Accepted September 2013.]
References
Albisu, L.M., A. Gracia, and A.I. Sanjuan. ‘‘De-
mographics and Food Consumption: Empirical
Evidence.’’ The Oxford Handbook of: The
Economics of Food Consumption and Policy.
J.L. Lusk, J. Roosen, and J.F. Shogren, eds.
New York, NY: Oxford Publishing, 2011.
Amadae, S.M., and B.B. de Mesquita. ‘‘The
Rochester School: The Origins of Positive Po-
litical Theory.’’ Annual Review of Political
Science 2(1999):269–95.
Bracke, M.B.M., B.M. Spruijt, J.H.M. Metz, and
W.G.P. Schouten. ‘‘Decision Support System for
Overall Welfare Assessment in Pregnant Sows
A: Model Structure and Weighting Procedure.’’
Journal of Animal Science 80(2002a):1819–34.
———. ‘‘Decision Support System for Overall
Welfare Assessment in Pregnant Sows B: Val-
idation by Expert Opinion.’’ Journal of Animal
Science 80(2002b):1819–34.
California Secretary of State. 2008. Internet site:
www.sos.ca.gov/elections/sov/2008_general/
sov_complete.pdf (Accessed April 13, 2011).
De Mol, R.M., W.G.P. Schouten, E. Evers, H.
Drost, H.W.J. Houwers, and A.C. Smits. ‘‘A
Computer Model for Welfare Assessment of
Poultry Production Systems for Laying Hens.’’
Netherlands Journal of Agricultural Science
54(2006):157–68.
Demby, G. ‘‘Mitt Romney Is Capturing Zero
Percent of the Black Vote, According to New
Poll.’’ The Huffington Post. August 21, 2012.
Smithson et al.: Animal Welfare Initiatives 123
Internet site: www.huffingtonpost.com/2012/
08/21/mitt-romney-black-vote_n_1820329.html
(Accessed October 10, 2012).
Environmental Defense Fund. 2000. Environ-
mentalists Applaud Action Requiring Smith-
field Foods to Eliminate NC Hog Lagoons.
Internet site: www.edf.org/news/environmentalists-
applaud-action-requiring-smithfield-foods-
eliminate-nc-hog-lagoons (Accessed August 30,
2013).
Fatka, J. ‘‘Senate Hearing Tackles Egg Bill.’’
Feedstuffs. Page 1. July 30, 2012.
Feinstein, D. Feinstein Bill Sets National Stan-
dards for Egg Industry. Internet site: www.
feinstein.senate.gov/public/index.cfm/press-
releases?ID5fdf4f2eb-5ff2-467a-a4c8-b9e1fd63880e
(Accessed June 28, 2013).
Field Research Corporation—California Opinion
Index. 2009. Internet site: http://field.com/
fieldpollonline/subscribers/COI-09-Jan-Mail-
Ballot-Voting-Rise.pdf (Accessed September
4, 2013).
Haab, T.C., and K.E. McConnell. Valuing Envi-
ronmental and Natural Resources. Northampton,
MA: Edward Elgar, 2002.
Initiative & Initiative Institute at the University
of Southern California. Internet site: www.
iandrinstitute.org (Accessed August 7, 2011).
Katz, E., and P.F. Lazarsfeld. Personal Influence.
New Brunswick, NJ: Transaction Publishers, 2006.
Keller, E., and J. Berry. The Influentials. New
York, NY: The Free Press, 2003.
Kilian, E. ‘‘Pork Industry Culture to Change.’’
Feedstuffs 80,21(2008):8.
Krinsky, I., and A. Leslie Robb. ‘‘On Approxi-
mating the Statistical Properties of Elastici-
ties.’’ The Review of Economics and Statistics
68(1986):715–19.
Lusk, J.L. ‘‘The Effect of Proposition 2 on the
Demand for Eggs in California.’’ Journal of
Agricultural and Food Industrial Organization
8(2010):Article 3.
Maddala, G.S. Introduction to Econometrics.
New York, NY: John Wiley and Sons, 2001.
Miller, W.E., and J. Merrill Shanks. The New
American Voter. Cambridge, MA: Harvard
University Press, 1996.
Mueller, D.C. Public Choice III. Cambridge, UK:
Cambridge University Press, 2003.
National Agricultural Statistics Service. 2007 Cen-
sus of Agriculture. United States Department of
Agriculture. Internet site: http://quickstats.nass.
usda.gov (Accessed August 4, 2011).
———. 2011. Chicken and Eggs 2010 Summary.
United States Department of Agriculture.
Internet site: http://usda.mannlib.cornell.edu/usda/
current/ChickEgg/ChickEgg-02-25-2011.txt
(Accessed August 4, 2011).
Norwood, F.B., and J.L. Lusk. Compassion, by the
Pound. Oxford, UK: Oxford Publishing, 2011.
Prickett, R. ‘‘Consumer Preferences for Farm
Animal Welfare: Results from a Telephone
Survey of U.S. Households.’’ Master’s thesis.
Oklahoma State University, 2007.
Prickett, R., F.B. Norwood, and J.L. Lusk.
‘‘Consumer Preferences for Farm Animal
Welfare: Results from a Telephone Survey of
U.S. Households.’’ Animal Welfare (South
Mimms, England) 19(2010):335–47.
Richards, T., W. Allender, and D. Fang. ‘‘Media
Advertising and Ballot Initiatives: The Case of
Animal Welfare Regulation.’’ Contemporary
Economic Policy 31(2011):145–62. doi:10.1111/
j.1465-7287.2011.00292.x.
Sawa, T. ‘‘Information Criteria for Discrimination
among Alternative Regression Models.’’ Econ-
ometrica 46(1978):1273–91.
Seibert, L., and F. Bailey Norwood. ‘‘Production
Costs and Animal Welfare for Four Stylized
Hog Production Systems.’’ Journal of Applied
Animal Welfare Science 14(2011):1–17.
Smith, R. ‘‘Hen Housing Bill Expected Soon.’’
Feedstuffs, February 4, 2013a, p. 19.
———. ‘‘Sow Barn Conversion ‘Exciting.’’’
Feedstuffs, June 3, 2013b, p. 1.
Smith, V., K.G. Van Houtven, and S.K. Pattanayak.
‘‘Benefit Transfer via Preference Calibration:
‘Prudential Algebra’ for Policy.’’ Land Eco-
nomics 78(2002):132–52.
Sumner, D., T. Rosen-Molina, W. Matthews,
J. Mench, and K. Richter. ‘‘Economic Effects of
Proposed Restrictions on Egg-laying Hen
Housing in California.’’ Paper presented at Uni-
versity of California Agricultural Issues Center,
July 2008.
Tonsor, G.T., and C.A. Wolf. ‘‘Drivers of Resident
Support for Animal Care Oriented Ballot Ini-
tiatives.’’ Journal of Agricultural and Applied
Economics 43(2010):419–28.
Videras, J. ‘‘Religion and Animal Welfare: Evidence
from Voting Data.’’ Journal of Socio-Economics
35(2006):652–59.
White, H. ‘‘A Heteroscedastic-consistent Matrix
Estimator and a Direct Test for Hetero-
scedasticity.’’ Econometrica 48(1978):817–38.
Wyant, S. ‘‘Livestock Groups Equate HSUS/UEP
Bill to Government Takeover of Farms.’’
AgriPulse.com. Internet site: www.agri-pulse.com/
HSUS_UEP_legislation_012312.asp (Accessed
August 30, 2013).
Journal of Agricultural and Applied Economics, February 2014124
Related Documents