Predatory Incentives and Predation Policy: The American Airlines Case * Connan Snider UCLA September 22, 2009 Abstract Two major issues have led courts and antitrust enforcers to take a highly skeptical view when assessing claims of anticompetitive predation. First, predation is an inherently dynamic and strategic phenomenon but the practical tools available to identify predatory behavior are based on a static, competitive view of markets. Second, there is understandable concern about the potential distortionary implications of punishing firms for competing too intensely. This paper analyzes these problems in the context of the U.S. airline industry, where there have been frequent allegations of predatory conduct. I first argue, via an explicit dynamic industry model, that certain features of the industry do make it fertile ground for predatory incentives to arise. Specifically, differences in cost structures between large, hub and spoke carriers and small, low cost carriers give incentives for the large carriers to respond aggressively to low cost carriers. I estimate the model parameters and use it to quantify the welfare and behavioral implications of predation policy for a widely discussed case: U.S. vs. American Airlines (2000). To do this, I solve and simulate the model under a menu of counterfactual antitrust predation policies, similar to those employed in practice. I find, for the example of the American case, the potential problems of predation policy are not as severe as the problem of predatory behavior itself. JEL Classification Numbers : K2, L1, L4 Keywords: predatory pricing, low cost airlines, airline industry * I would like to give special thanks to my advisor Pat Bajari for his guidance and support. I would also like to thank Tom Holmes, Kyoo-il Kim, Minjung Park, Amil Petrin, Bob Town and the participants of the Department of Economics Applied Micro Workshop and Applied Micro Seminar. All remaining errors are my own. Correspondence: [email protected] 1

Welcome message from author
This document is posted to help you gain knowledge. Please leave a comment to let me know what you think about it! Share it to your friends and learn new things together.
Transcript
Predatory Incentives and Predation Policy:
The American Airlines Case∗
Connan Snider
UCLA
September 22, 2009
Abstract
Two major issues have led courts and antitrust enforcers to take a highly skeptical viewwhen assessing claims of anticompetitive predation. First, predation is an inherently dynamicand strategic phenomenon but the practical tools available to identify predatory behavior arebased on a static, competitive view of markets. Second, there is understandable concern aboutthe potential distortionary implications of punishing firms for competing too intensely. Thispaper analyzes these problems in the context of the U.S. airline industry, where there havebeen frequent allegations of predatory conduct. I first argue, via an explicit dynamic industrymodel, that certain features of the industry do make it fertile ground for predatory incentivesto arise. Specifically, differences in cost structures between large, hub and spoke carriers andsmall, low cost carriers give incentives for the large carriers to respond aggressively to low costcarriers. I estimate the model parameters and use it to quantify the welfare and behavioralimplications of predation policy for a widely discussed case: U.S. vs. American Airlines (2000).To do this, I solve and simulate the model under a menu of counterfactual antitrust predationpolicies, similar to those employed in practice. I find, for the example of the American case, thepotential problems of predation policy are not as severe as the problem of predatory behavioritself.
JEL Classification Numbers: K2, L1, L4Keywords: predatory pricing, low cost airlines, airline industry
∗I would like to give special thanks to my advisor Pat Bajari for his guidance and support. I would also like tothank Tom Holmes, Kyoo-il Kim, Minjung Park, Amil Petrin, Bob Town and the participants of the Department ofEconomics Applied Micro Workshop and Applied Micro Seminar. All remaining errors are my own. Correspondence:[email protected]
1
snider
Typewritten Text
snider
Typewritten Text
snider
Typewritten Text
1 Introduction
In May of 2000 the U.S. Department of Justice (DOJ) sued American Airlines alleging itengaged in anticompetitive, predatory behavior in four markets out of American’s primaryhub at Dallas-Fort Worth International Airport.1 In each of these markets, American hadresponded to the entry of a small “low cost” rival with aggressive capacity additions andfare cuts. The DOJ argued these aggressive responses 1) represented sacrifices of short runprofits that 2) were to be recouped through increased monopoly power after the rivals hadexited the market; the two necessary elements of proving a predation claim. The courtfound the DOJ’s sacrifice argument unconvincing and dismissed the case.
The ruling in the American case is representative of the prevailing skepticism amongcourts and antitrust agencies regarding predation claims.2 This skepticism reflects, first, thehigh cost of false positives. Firms are accused of predatory conduct after they are perceivedto have offered consumers deals that were too good in hopes of driving competitors out ofbusiness and increasing markups. The expected welfare loss of uncertain monopolization ismitigated by the current certain welfare gain. More importantly, any attempt to implementa policy preventing this type of behavior risks “chilling the very behavior antitrust laws weredesigned to encourage”.3
The high cost of false positives is compounded by the lack of tests, grounded in ap-propriate economic theory, with which to distinguish predatory behavior from legitimatecompetition. Predation has long been recognized as a dynamic and strategic phenomenon(Bork 1978 ) and, while modern strategic theory has discovered plausible mechanisms forrational predatory behavior, it has, for the most part, not delivered the tools that wouldallow these theories to be implemented in the analysis of real market data ( Bolton, Brodley,and Riorden 2003 is an exception).4 In the absence of these tools, most courts have beenforced to rely on static, competitive, cost-based tests to decide cases. The most prominentexample of such tests is the “Areeda-Turner” rule, which finds predatory liability when afirm is found to have priced below a measure of marginal cost.
This paper quantifies the behavioral and welfare implications of a menu of typical pre-dation policies for the American Airlines case. I focus on empirically assessing the impactof policy for a single market: Dallas-Fort Worth to Wichita, one of the markets in whichthe DOJ alleged predation against American. Focusing on a single market allows for moredirect comparison with actual practice. Moreover, analyzing a market from an actual casemakes the analysis more practically relevant since this is a market chosen by the U.S. gov-
1United States of America v. AMR Corporation, American Airlines, Inc., and American Eagle HoldingCorporation. 140 F. Supp. 2d 1141 (2001).
2The ruling was upheld on appeal. United States v. AMR Corp., 335 F. 3d 1109 (10th Cir. 2003)3Matsushita Electric Industrial Co., v. Zenith Radio (1986) 106 S. Ct. 1348-1367.4There is a large literature exploring predation as an equilibrium phenomenon. Examples include
Milgrom and Roberts (1983) , Saloner (1989) , Fudenberg and Tirole (1990) , Bolton and Scharfstein (1990).
2
ernment as an example of one that requires intervention. Also, rather than searching foroptimal antitrust policy, I instead focus my analysis on evaluating the efficacy of static costbased tests of liability and the chilling effect of proposed remedies.
To assess the implications of predation policy, I proceed in three steps. First, I introducea dynamic model of price and capacity competition in the airline industry. In the model,cost asymmetries among firms give rise to behavior that is predatory in the sense that itis motivated, in part, by incentives to drive a rival from the market. Second I develop anestimation strategy to recover the parameters of the game for the Dallas Wichita market.To do this, I construct a sample of Dallas-Fort Worth markets and firms and assume the datain these markets is generated by equilibrium of the same game, conditional on observablevariables, as the one being played in Wichita. I then exploit a revealed preference argumentto recover the parameters that rationalize observed behavior as an equilibrium of the game.Third, I use the estimated parameters to solve and simulate equilibrium in the Wichitamarket under various predation policy regimes.
Predation is an investment of short run profits, through intensified competition, wherethe expected returns come in the form of future increased pricing power, through eliminationof competitors. It is therefore a dynamic decision and any account of equilibrium predationrequires two components reflecting this fact. The first is a mechanism through which thefirm may cause the exit of rivals and earn a return on the investment. If a potentialpredator is unable to affect the decisions of its rivals then the marginal value of investmentis zero. The second is a mechanism through which the investment can be made. If periodsare not linked over time through firm decisions then competing aggressively today can notaffect behavior in the future.
In the airline industry, entry of a new firm into a market is often met with aggressivefare cutting and capacity expansion by incumbents. This has led to frequent allegations ofpredation in the industry. The scenario that has aroused concern among industry regula-tors and antitrust enforcers has involved the entry of small a small low cost carrier into aroute dominated by a hub and spoke incumbent, as in the American case. The approachto predation taken in this paper focuses on how fundamental asymmetries between thesetwo types of carriers affect the dynamics of competition and lead to predatory incentives.Specifically, I focus on differences in marginal and fixed costs between the two types. Lowcost carriers have lower variable and marginal costs because they offer fewer service ameni-ties and have lower labor costs and generally leaner operations. Hub carriers have loweravoidable fixed costs due to previous sunk investments in building a large route networkand the ability to allocate fixed costs over the large network. I also allow differences in thecosts of moving capacity in and out of a route to play a role. These differences may arisedue to differences in route and network size and differences in financial position.
The basic theoretical model I introduce is similar to the models of capacity constrainedcompetition of Besanko and Doraszelski (2005) and Besanko, Doraszelski, Lu, and Satterth-
3
waite (2008), which are themselves variants of the Erickson and Pakes (1995) framework. Iassume carriers compete by setting prices for differentiated products, reflecting the conven-tional wisdom that low cost carriers offer inferior flight quality relative to full service hubcarriers. Firms face capacity constraints in the form of marginal costs that increase steeplyin the carrier’s load factor, the ratio of passengers to available seats. The dynamics of themodel are then driven by capacity constraints, the costs of adjusting capacity, and the
avoidable fixed cost of operating. Carriers make capacity and entry/exit decisions, fullyinternalizing the impact of the decisions on its own and its opponents future actions andthe implications of these actions for profitability.
Predatory incentives arise as a result of asymmetries in costs between incumbents andentrants. Relative to their small low cost rivals, large hub incumbents have lower avoidablefixed costs and higher marginal costs. Because they have lower marginal costs, competitionfrom low cost carriers have a large impact on the profitability of the incumbents. At thesame time, higher avoidable fixed costs means these low cost carriers are less committedto the market and thus more likely to exit. The costs of adjusting capacity then providethe means through which carriers can make predatory investments. Flooding a routewith capacity allows a carrier to commit to aggressive pricing in the future. The featurethat differentiates the airline industry from other industries with capital investment is thatcapacity adjustment is costly enough to provide a degree of commitment, but cheap enoughthat the carrier can reverse course after the exit of the rival.
The incentives of this model are similar to deep pockets/long purse stories of predation(e.g. Fudenberg and Tirole 1985 , Bolton and Scharfstein 1990 [? ]).5 In these theories,some firms have deeper pockets in the sense they are able to tolerate taking larger lossesor losses for a longer period than their rivals due to better cash flow or credit sources,etc.. One criticism of these theories is that there is generally not a good story for whywe ever actually observe predation. That is, a carrier that knows it will be preyed uponshould not enter the market. In this model predation is observed along the equilibriumpath because whether or not an entrant is preyed upon is uncertain as is the success of thestrategy. Firms weigh these probabilities and enter when the expected value of doing sois greater than its expected costs, so the frequency of equilibrium predation and entry aredetermined jointly in equilibrium. I exploit revealed preference arguments to estimate theparameters of the model. That is, I estimate the model by assuming behavior observed ina sample of markets is optimal, in the sense of Nash equilibrium, and then backing out theparameters that rationalize this assumption. A primary strength of my empirical approachis the measurement of economic costs. In the airline industry, routes are usually connectedto other routes so production costs for any one product in any one market depends onproduction of other products in other markets. This means the variable, fixed, and total costfunctions for a particular product are not well defined. In such a situation, any approach
5See Ordover and Saloner (1989) for a discussion of these types of theories.
4
that does not make use of observed behavior to infer costs has not only the textbook problemarising from the difference between accounting and economic costs but also necessarily relieson arbitrary “fully allocated” accounting measures. Indeed, in the American case the judgefound the DOJ’s argument, based on American’s complex managerial accounting system,unconvincing largely due to these issues.
Despite the inherently dynamic nature of predation, in practice the problem is almostalways examined from a static perspective. The best example of this is the use of staticcost based tests of predatory sacrifice. These tests ask whether a measure of the revenuegenerated by an action is greater than a measure of the cost of the action. If the answeris no, this is evidence of an investment in causing the exit of a rival. In environmentswith imperfect competition or dynamics these tests will be, at best, proxies for predatoryincentives. For example, the classic Areeda Turner test, which compares price to marginalcost, is neither necessary nor sufficient for predation in such environments. Firms withmarket power are, by definition, setting prices above marginal cost. A price above marginalcost, but below the static profit maximizing price, can then still represent a sacrifice. Onthe other hand, when dynamics are important, firms may price below static marginal costin the absence of predatory incentives. Benkard (2003) provides such an example withcompetition in the presence of learning-by-doing in the aircraft industry.
To analyze the implications of these tests I first compare American’s behavior in theDallas-Fort Worth-Wichita market against two cost-based tests, similar to those commonlyused in antitrust enforcement, an incremental cost test and an avoidable cost test. Theincremental cost test compares the extra revenue generated by an addition of capacitywith the cost of the addition. The avoidable cost test compares the revenue earned ata particular level of production with the cost savings that could be achieved by taking adifferent level, i.e. the avoidable costs. Since these tests are only proxies, an importantquestion in any given case is how well these tests capture predatory incentives. To evaluatetheir performance, I compare the results against a measure of predatory incentives basedon a definition of predation proposed by Ordover and Willig (1981) and operationalizedby Cabral and Riorden (1997). They define an act as predatory if it is optimal when itsimpact on a rival’s likelihood of exit is taken into account, but suboptimal otherwise. Thisdefinition is easily implemented using the model.
Static cost tests also play an important role in the calculation of the damages arising froma predation violation. Calculating these damages requires constructing a counterfactual forthe market but for the predatory acts. The counterfactual often considered is the marketin the absence of the cost test violation. I therefore also compare the damages implied bythe 2 cost tests and compare them with the damages implied by the definition test.
The second important concern in enforcing predation standards is the potential dis-tortionary impact of trying to punish or prevent predation. To analyze these potentialdistortions, I use the model to simulate the impact of the Department of Transportation’s
5
solution to the predation problem, the Fair Competition Guidelines. These guidelines,drafted in the late 1990’s and ultimately never enacted, proposed restrictions on the re-sponses a dominant incumbent could pursue in response to the entry of a low cost rival.Here, an explicit equilibrium model of predation is useful for exploring the full consequencesof policy. In equilibrium, the welfare effects of these policies depend on both the impact ofthe restrictions as binding constraints on firms behavior, e.g. actual predation, as well astheir impact as restrictions on potential behavior, e.g. the threat of predation. The potentialproblem with these rules is then the fundamental problem of predation policy: Any one-size-fits-all standard that prevents predation is also likely to have unintended consequencespossibly including the prevention of or disincentive for legitimate, intense competition.
To preview results, I find the model is able to largely match the behavior from the Dallas-Wichita market using estimated parameters. Using the test of predation based on theOrdover and Willig (1981) definition, I find evidence of predatory incentives in the marketand that this test is in agreement with the DOJ’s time line for predation. The proposedstatic cost tests capture these incentives surprisingly well. In particular, the avoidablecost test is in agreement with the definition test, while the incremental cost test gives afalse positive and a false negative. Simulations under the Fair Competition Guideline typerestrictions reveal interesting equilibrium consequences. The restrictions prevent Americanfrom attempting to monopolize the market, however, they also dull Vanguard’s competitiveincentives resulting in reduced probability of intensely competitive market structures. Ialso find an unintended pro-competitive consequence: the rules reduce the likelihood ofmonopoly because, without the threat of being preyed upon, Vanguard is more likely toenter the market. Overall, the restrictions I examine are welfare improving on net.
This paper represents the first attempt to analyze predation by connecting a dynamicequilibrium model to real market data. In so doing I contribute to the small numberof empirical studies of predation. Genesove and Mullin (1996) and Scott-Morton (1995)develop tests for predation and apply them to the late nineteenth and early twentiethcentury U.S. sugar and British shipping industries, respectively. This paper also provides acounterpoint to the studies of Bamberger and Carlton (2007) and Ito and Lee (2004), whoexamine the impact of large carrier responses to low cost entry on the likelihood of low costexit and find no evidence of predation at an industry level.
This paper also contributes to the large literature on the economics of the airline industryand is the first that explicitly considers the role of capacity choices in competition. In thepaper, I consider the implications of the model for predation policy, however, it has broaderapplication to other important industry questions. For example one of the surprises ofthe post-deregulation airline industry was the lack of responsiveness of incumbent carriersto the threat of entry. The theory of contestable markets (Baumol, Panzer and Willig1981) predicted that incumbent pricing would be constrained by potential entry because,if it was not, then actual entry would follow. However, potential entry appears to have
6
little effect on airline pricing. Similarly, Goolsbee and Syverson (2008) find no evidencethat incumbents attempt to deter entry. The model presented here suggests the natureof capacity costs, cheap enough to move quickly but expensive enough to provide somecommitment, make responding to actual entry more efficient than responding to potentialentry. These positive features also have potentially broader normative implications tomerger analysis. The model suggests a merger that changes the cost structure of themerged firm will have implications for merged firm responses to entry as well as the entrybehavior of potential entrants in the markets affected by the merger.
Finally, I contribute to the growing literature applying structural techniques to dynamicgame models. The interest in these applications has been spurred by recently developedtechniques for estimating these models (Aguirregabiria and Mira (2007), Bajari, Benkard,and Levin (2007) , Pesendorfer and Schmidt-Dengler (2008)). Early contributions byBenkard (2003, aircraft) and Gowrisankaran and Town (1997, hospitals) required consider-able ingenuity and were computationally intensive; estimation required completely solvingthe game for each candidate parameter vector or devising alternative identification strate-gies. The new techniques take a two step approach to estimation that allows parametersto be recovered without solving the game. This feature has allowed the estimation of muchricher models with many players and/or many state variables. Recent applications in-clude Aguirregabiria and Ho (2008, airlines), Bersteneau and Ellickson (2004, retail stores),Collard-Wexler (2006, concrete), Holmes (2007, discount retailers), Ryan (2006, portlandcement), and Sweeting (2007, radio stations).
The rest of the paper proceeds as follows: Section 2 motivates my approach to predationwith a brief description of competition at Dallas-Fort Worth and the American case Section3 describes the model of price and capacity competition among airlines. Section 4 discussesthe data, empirical strategy, and estimation. Section 5 introduces price cost tests forpredation and simulates equilibrium in the model under the but-for scenarios, the scenariosin which violation of the rules are absolutely prohibited, and compares welfare criteria undereach alternative rule. Section 6 concludes.
2 Background: American at Dallas-Fort Worth
Dallas-Fort Worth International Airport (DFW) opened in 1974 after the Civil Aeronauticsboard, the regulator of the pre-deregulation industry decided that the existing airport,Love Field in Dallas, was inadequate for the future travel demands of the Dallas-Fort Worthmetroplex market. Soon after opening all carriers, with the exception of Southwest Airlines,moved their operations from Love Field to DFW. As of the beginning of 2008 DFW covered30 square miles, operating 4 main terminals with 155 gates, serviced by 21 airlines, andproviding service to 176 destinations. In 2008, DFW was the sixth largest airport in theworld in terms of passenger traffic, serving 167,000 daily, and the third largest in terms of
7
combined passenger and cargo traffic.Immediately following industry deregulation in 1979, American Airlines moved its
headquarters from New York to Dallas and began making DFW its primary hub. Alsoin 1979, in response to expansion plans by Southwest at Love Field, congressman JimWright of Fort Worth sponsored a bill that restricted service from Love Field so that onlymarkets within Texas and the 4 contiguous states to be served from that location. The“Wright Amendment” has been amended several times since 1979, however, Southwest’soperations out of Dallas remain severely restricted.67 This has allowed American to avoidthe “Southwest effect”, the intense price and quality competition that accompanies entryinto a market by Southwest, to a degree at DFW.
By 1993, American’s DFW hub operation accounted for 56 percent of all traffic fromDallas’s two major airports. Until 2004, when Delta dismantled its DFW hub as part abankruptcy reorganization plan, DFW was one of only three major airports to be a hubfor 2 major airlines. In 1993, Delta served 28 percent of traffic in the Dallas Fort Wortharea. Delta now flies to DFW only from its other domestic hubs and through service fromregional affiliates.
2.1 Entry and Low Fare Competition at DFW:1993-2000
Like other dominant hub carriers, American has enjoyed a substantial “hub premium” onflights originating or terminating at DFW.8 There is also evidence that economies of net-work density result in substantially lower operating costs for markets out of a carrier’shub (Caves, Christensen, and Treathway 1986, Berry, Carnall, and Spiller 2006 ). Thesefactors contribute to DFW being a disproportionately important source of profits for Amer-ican. From 1993-2000, operations out of DFW have accounted for between 48% and 60%of American’s available seat miles but between 61% and 80% of American’s profits.
Beginning in the early 90’s, the competitive advantage of hub carriers was being erodedby the continued growth of Southwest as well as widespread entry of new “low cost” car-riers (LCC) . The business model of these carriers, inspired by the success of Southwest,exploited lower operating costs than the majors to provide point to point service with lowprices. American Vice President of Marketing and Planning, Michael Gunn, testified thatSouthwest’s costs were 30% lower (in 2000) than American’s. For other LCCs that do notoffer the same quality standards as Southwest, the difference may be even larger; In 1994American estimated that LCC Valujet had a cost per available seat mile of about 4.5 centscompared to American’s cost of around 8.5 cents. These cost advantages allow LCCs to be
6Southwest has declined repeated invitations to move its operations to DFW.
7The Wright Amendment is slated for full repeal in 20148There is a large literature documenting and analyzing the hub premium. See Borenstein (1995) for an
example and Borenstein (2007) for a breif literature review.
8
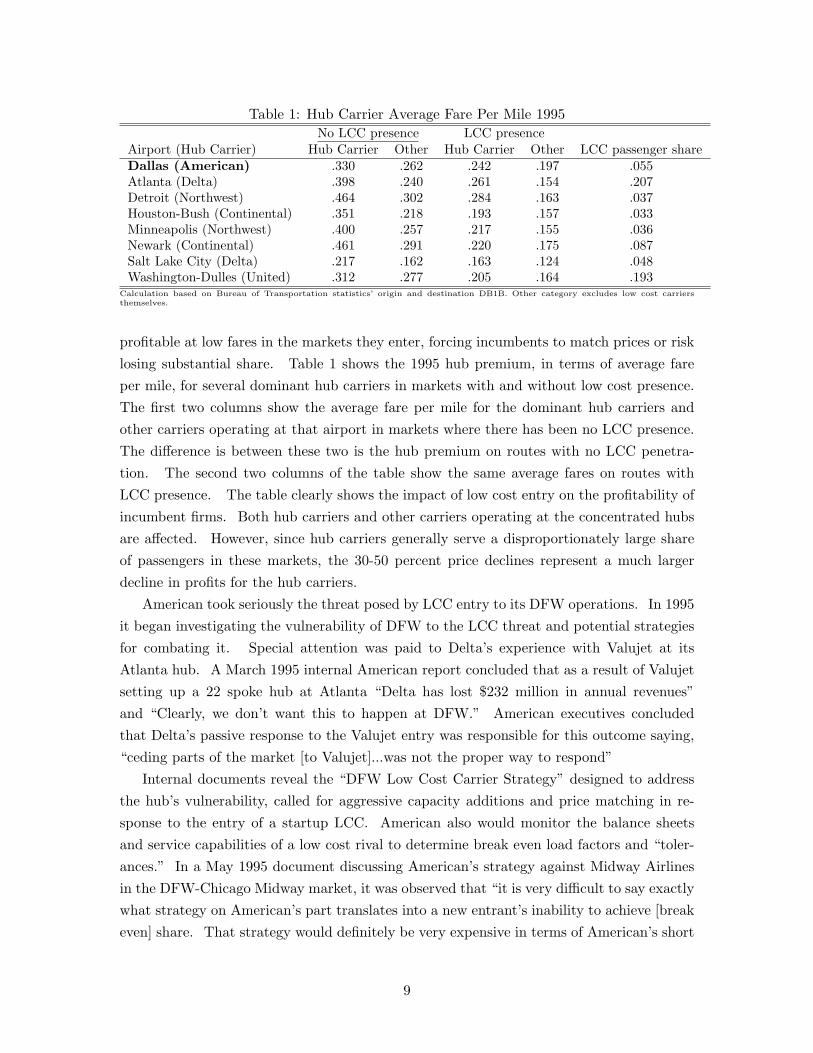
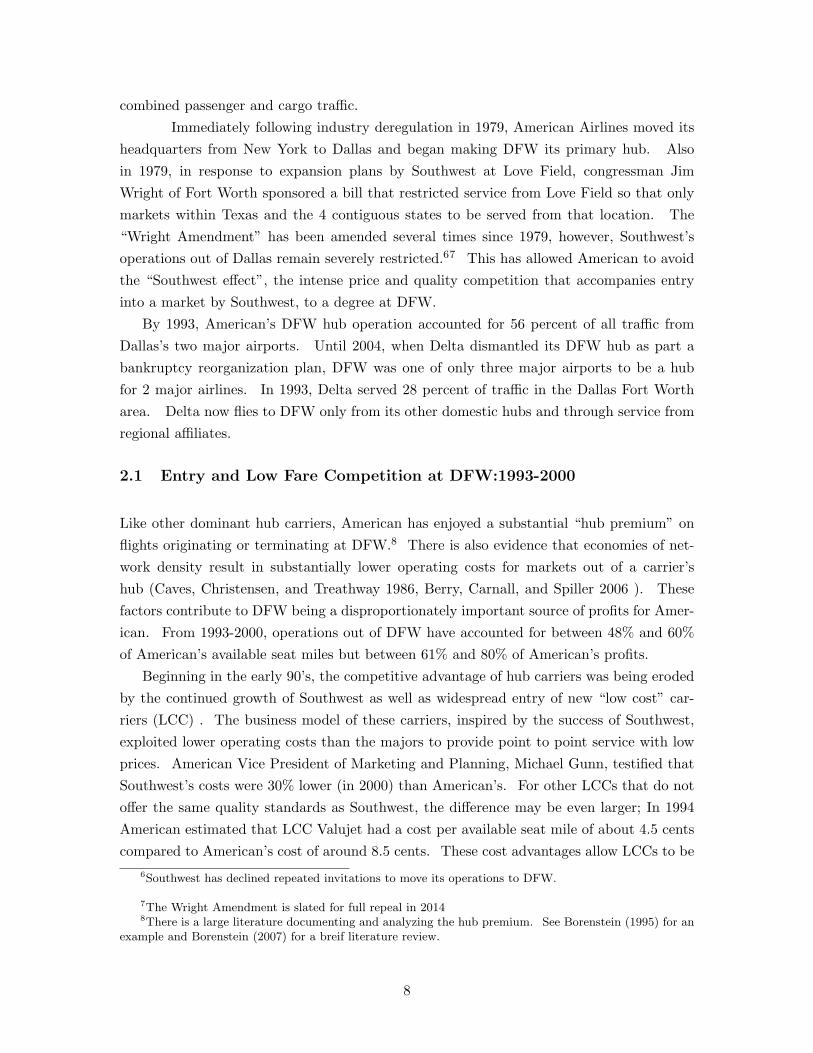
Table 1: Hub Carrier Average Fare Per Mile 1995No LCC presence LCC presence
Airport (Hub Carrier) Hub Carrier Other Hub Carrier Other LCC passenger shareDallas (American) .330 .262 .242 .197 .055Atlanta (Delta) .398 .240 .261 .154 .207Detroit (Northwest) .464 .302 .284 .163 .037Houston-Bush (Continental) .351 .218 .193 .157 .033Minneapolis (Northwest) .400 .257 .217 .155 .036Newark (Continental) .461 .291 .220 .175 .087Salt Lake City (Delta) .217 .162 .163 .124 .048Washington-Dulles (United) .312 .277 .205 .164 .193
Calculation based on Bureau of Transportation statistics’ origin and destination DB1B. Other category excludes low cost carriersthemselves.
profitable at low fares in the markets they enter, forcing incumbents to match prices or risklosing substantial share. Table 1 shows the 1995 hub premium, in terms of average fareper mile, for several dominant hub carriers in markets with and without low cost presence.The first two columns show the average fare per mile for the dominant hub carriers andother carriers operating at that airport in markets where there has been no LCC presence.The difference is between these two is the hub premium on routes with no LCC penetra-tion. The second two columns of the table show the same average fares on routes withLCC presence. The table clearly shows the impact of low cost entry on the profitability ofincumbent firms. Both hub carriers and other carriers operating at the concentrated hubsare affected. However, since hub carriers generally serve a disproportionately large shareof passengers in these markets, the 30-50 percent price declines represent a much largerdecline in profits for the hub carriers.
American took seriously the threat posed by LCC entry to its DFW operations. In 1995it began investigating the vulnerability of DFW to the LCC threat and potential strategiesfor combating it. Special attention was paid to Delta’s experience with Valujet at itsAtlanta hub. A March 1995 internal American report concluded that as a result of Valujetsetting up a 22 spoke hub at Atlanta “Delta has lost $232 million in annual revenues”and “Clearly, we don’t want this to happen at DFW.” American executives concludedthat Delta’s passive response to the Valujet entry was responsible for this outcome saying,“ceding parts of the market [to Valujet]...was not the proper way to respond”
Internal documents reveal the “DFW Low Cost Carrier Strategy” designed to addressthe hub’s vulnerability, called for aggressive capacity additions and price matching in re-sponse to the entry of a startup LCC. American also would monitor the balance sheetsand service capabilities of a low cost rival to determine break even load factors and “toler-ances.” In a May 1995 document discussing American’s strategy against Midway Airlinesin the DFW-Chicago Midway market, it was observed that “it is very difficult to say exactlywhat strategy on American’s part translates into a new entrant’s inability to achieve [breakeven] share. That strategy would definitely be very expensive in terms of American’s short
9
term profitability.” In a February 1996 meeting CEO Robert Crandall commented on thestrategy, “there is no point to diminish profit unless you get them out.”
There is also evidence that low cost carriers consider how incumbents will respond totheir entry. For example, the strategic motto of low cost carrier Access Air was “stay offelephant paths...don’t eat the elephant’s food...keep the elephants more worried about eachother than they are about you” to avoid aggressive responses from the elephants, the majorhub carriers. In accordance with this motto Access Air entered only large destinations thatwere not hubs. A variant strategy, attributed to LCC Morris Air , was adopted by manyLCCs, including Vanguard after its experience with American. The strategy was to enteronly large markets with only a very small presence at first, so as to not provoke a responsefrom dominant hub carriers.
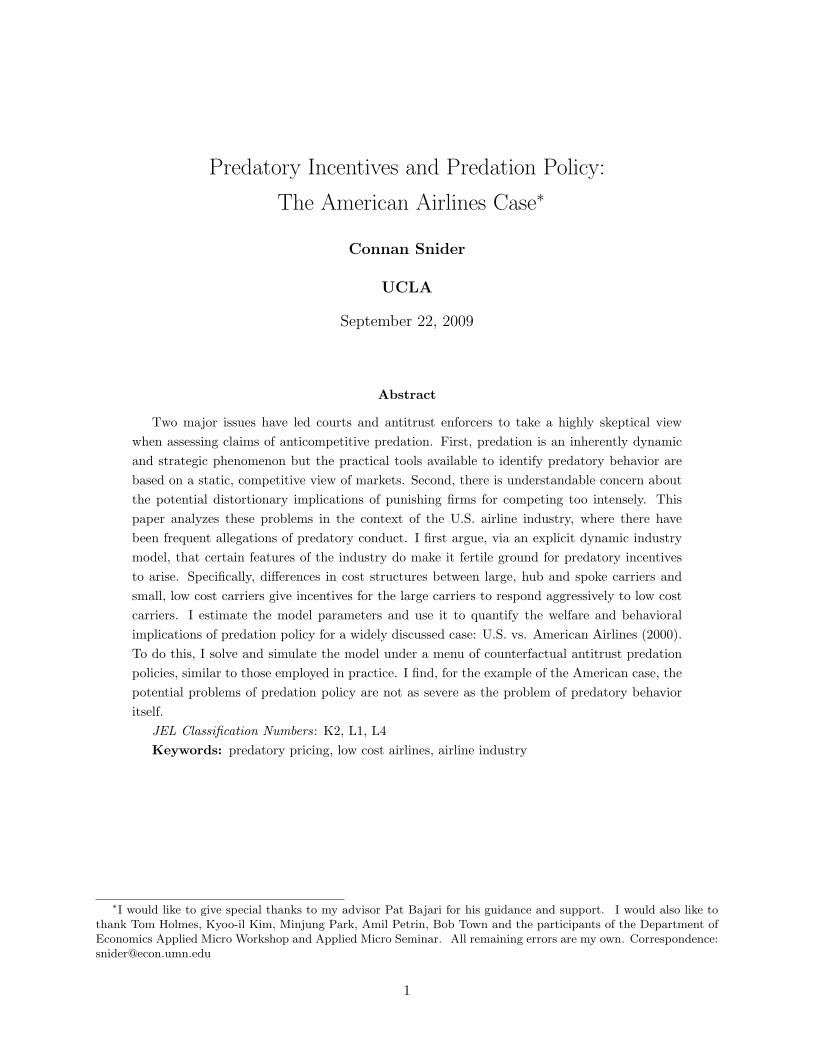
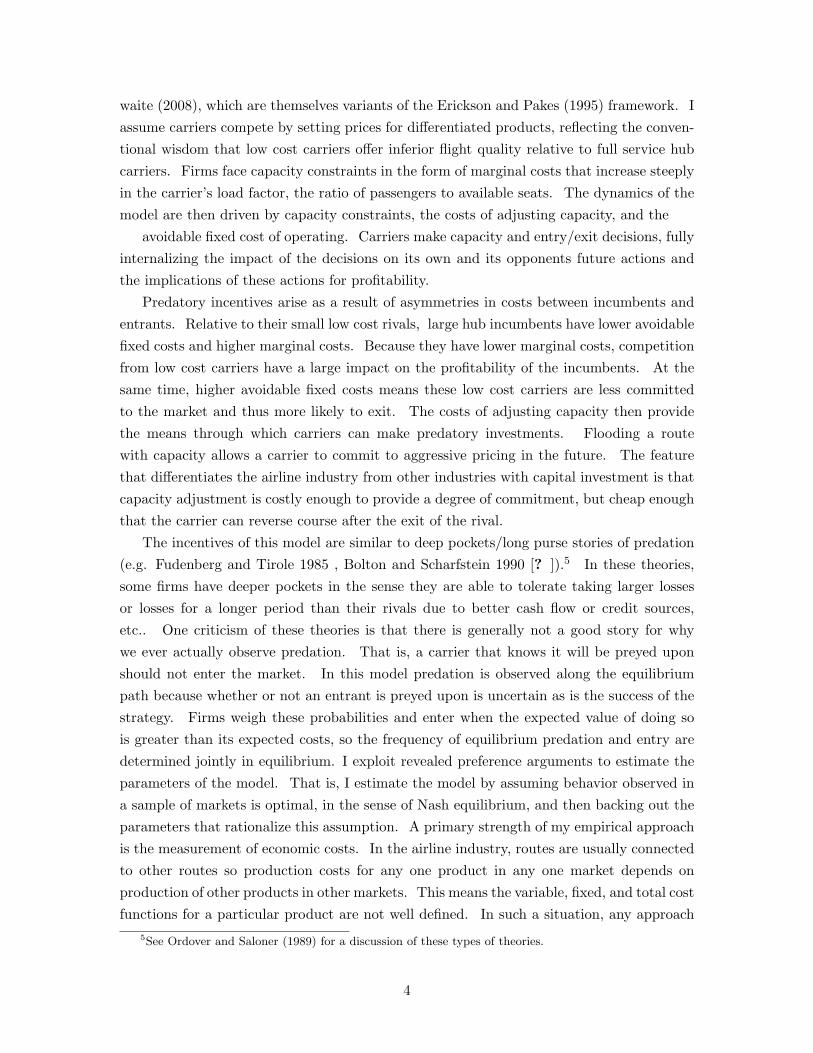
This evidence suggests predation, if it occurs, and entry are determined simultaneouslyby an equilibrium process. Over the period 1993-2000, DFW experienced entry from 10low cost carriers into 17 non-stop markets. Figure 1 gives a snapshot of American’s priceand capacity responses to these episodes of entry. The figure shows market prices andcapacities in the quarter preceding entry on the horizontal axes and the same quantitiesfor 3 quarters after entry (1 year later). The markets in question in the DOJ’s suitare highlighted. The figure shows a considerable amount of heterogeneity in American’sprice and capacity responses to predation, which further suggests the importance of thesimultaneous determination of entry and the response to entry. The figure also showsAmerican often responded to low cost entry by lowering fares to compete with the newentrant. Capacity responses, however, were typically more restrained except in a few cases.These were the markets singled out by the Justice Department in its case. These are alsothe cases that motivate my model.
American responded with large capacity additions only in markets where the value ofremoving the LCC rival was high and/or the LCC seemed weak. In the Dallas to Atlanta(ATL) market, American faced entry from AirTran, which after merging with Valujet hada strong presence at Atlanta, as discussed above. Furthermore, Delta operated its primaryhub at Atlanta and controlled a large share of passengers in the market, making American’sexposure relatively small. American responded similarly passively to the entry of Fron-tier in the Denver (DEN) market. Frontier had and continues to have a strong hubbingoperation at Denver, while competing with major carrier United, which also operates ahub at Denver. The figure also shows American responded passively to entry in the LasVegas (LAS) and Orlando (MCO) markets. Demand in these markets is driven by lowmargin leisure customers and the routes, particularly Las Vegas, are famously competitive.Removing a rival would thus not have much impact on American’s share or margins.
American did respond with large capacity increases to the entry of Western Pacific intothe Colorado Springs (COS) market in June of 1995. Following a general strategy, dueto limited aircraft availability, Western decreased its capacity in the Dallas to Colorado
10
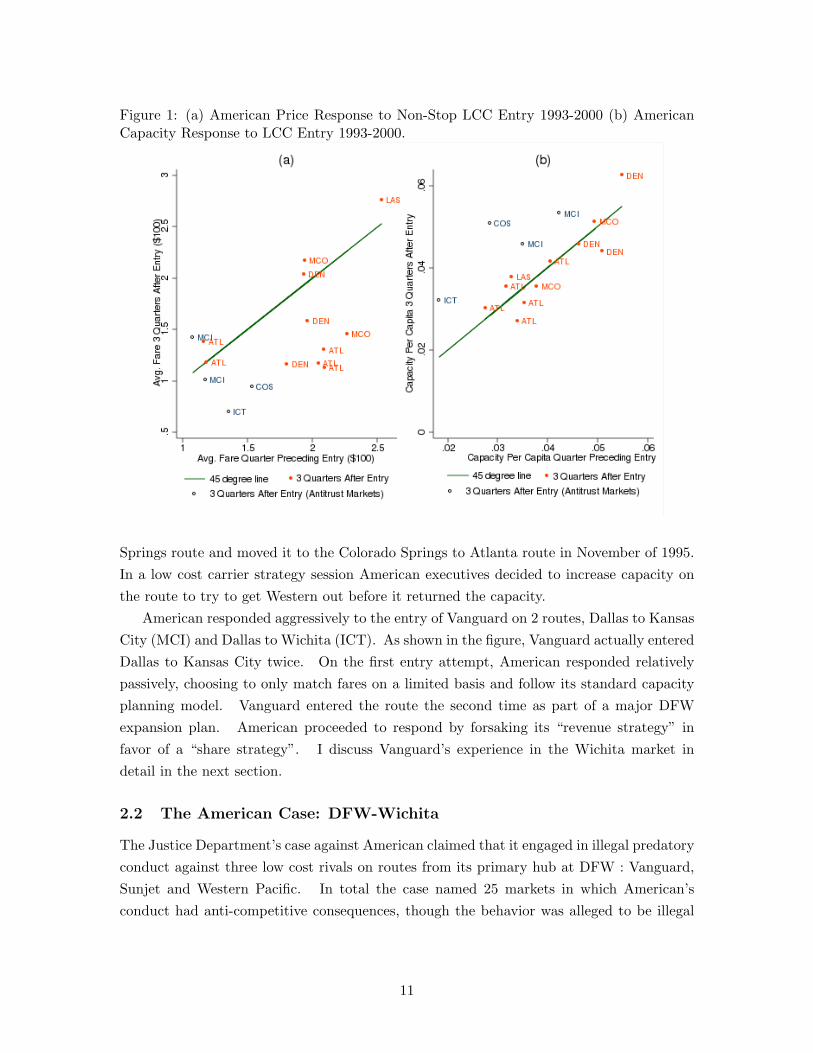
Figure 1: (a) American Price Response to Non-Stop LCC Entry 1993-2000 (b) AmericanCapacity Response to LCC Entry 1993-2000.
Springs route and moved it to the Colorado Springs to Atlanta route in November of 1995.In a low cost carrier strategy session American executives decided to increase capacity onthe route to try to get Western out before it returned the capacity.
American responded aggressively to the entry of Vanguard on 2 routes, Dallas to KansasCity (MCI) and Dallas to Wichita (ICT). As shown in the figure, Vanguard actually enteredDallas to Kansas City twice. On the first entry attempt, American responded relativelypassively, choosing to only match fares on a limited basis and follow its standard capacityplanning model. Vanguard entered the route the second time as part of a major DFWexpansion plan. American proceeded to respond by forsaking its “revenue strategy” infavor of a “share strategy”. I discuss Vanguard’s experience in the Wichita market indetail in the next section.
2.2 The American Case: DFW-Wichita
The Justice Department’s case against American claimed that it engaged in illegal predatoryconduct against three low cost rivals on routes from its primary hub at DFW : Vanguard,Sunjet and Western Pacific. In total the case named 25 markets in which American’sconduct had anti-competitive consequences, though the behavior was alleged to be illegal
11
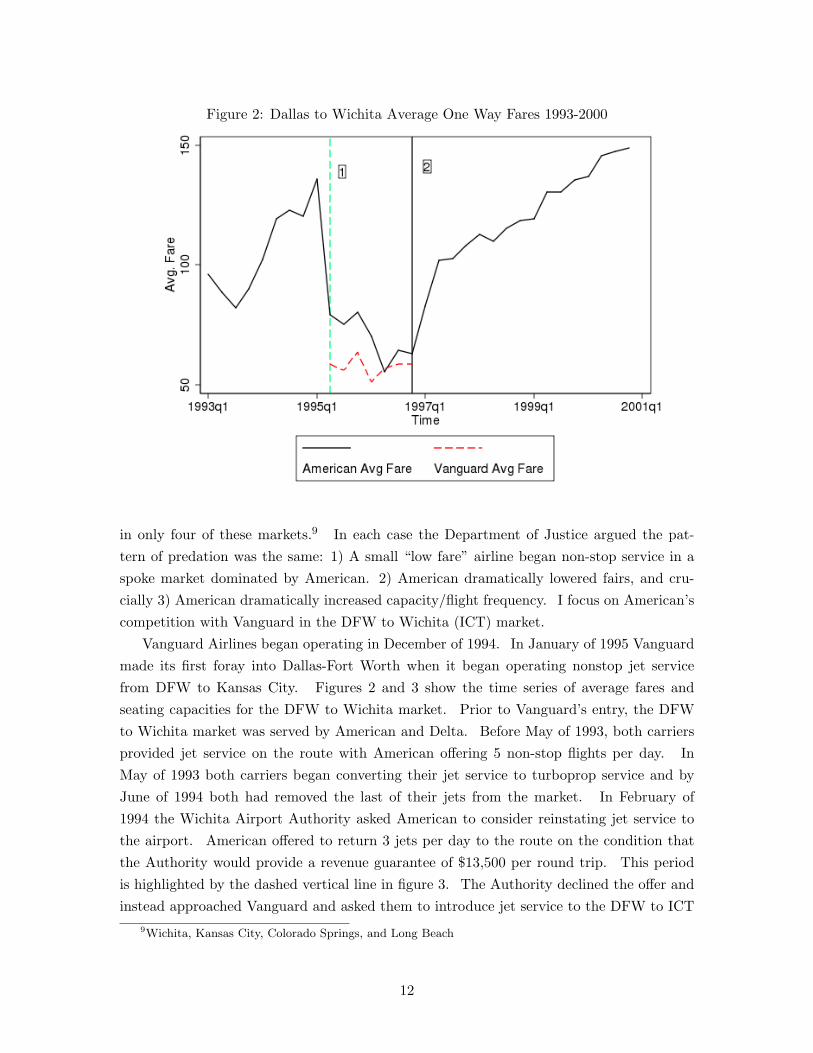
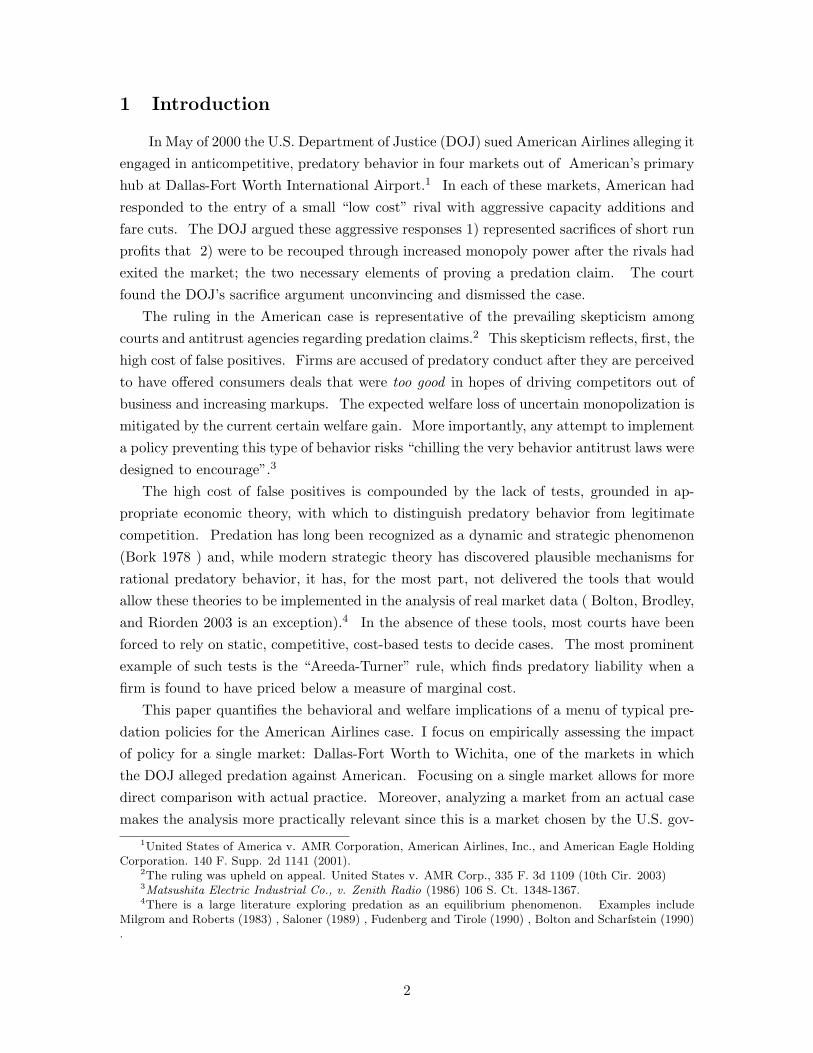
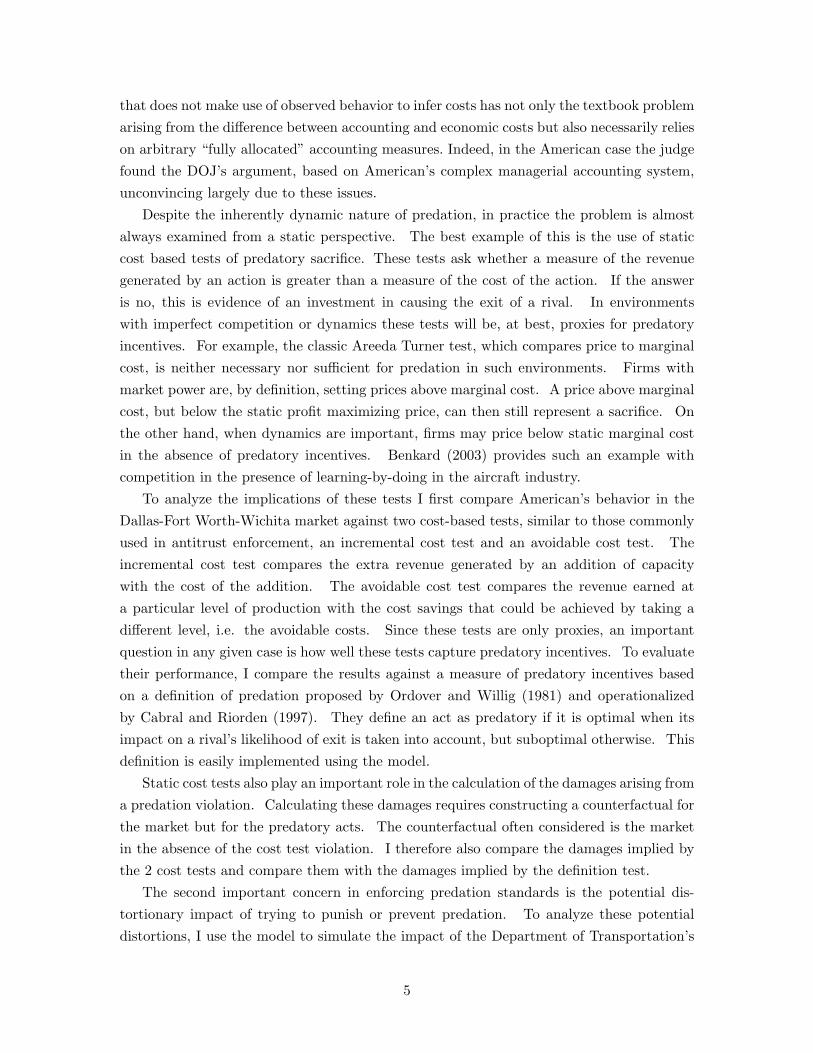
Figure 2: Dallas to Wichita Average One Way Fares 1993-2000
in only four of these markets.9 In each case the Department of Justice argued the pat-tern of predation was the same: 1) A small “low fare” airline began non-stop service in aspoke market dominated by American. 2) American dramatically lowered fairs, and cru-cially 3) American dramatically increased capacity/flight frequency. I focus on American’scompetition with Vanguard in the DFW to Wichita (ICT) market.
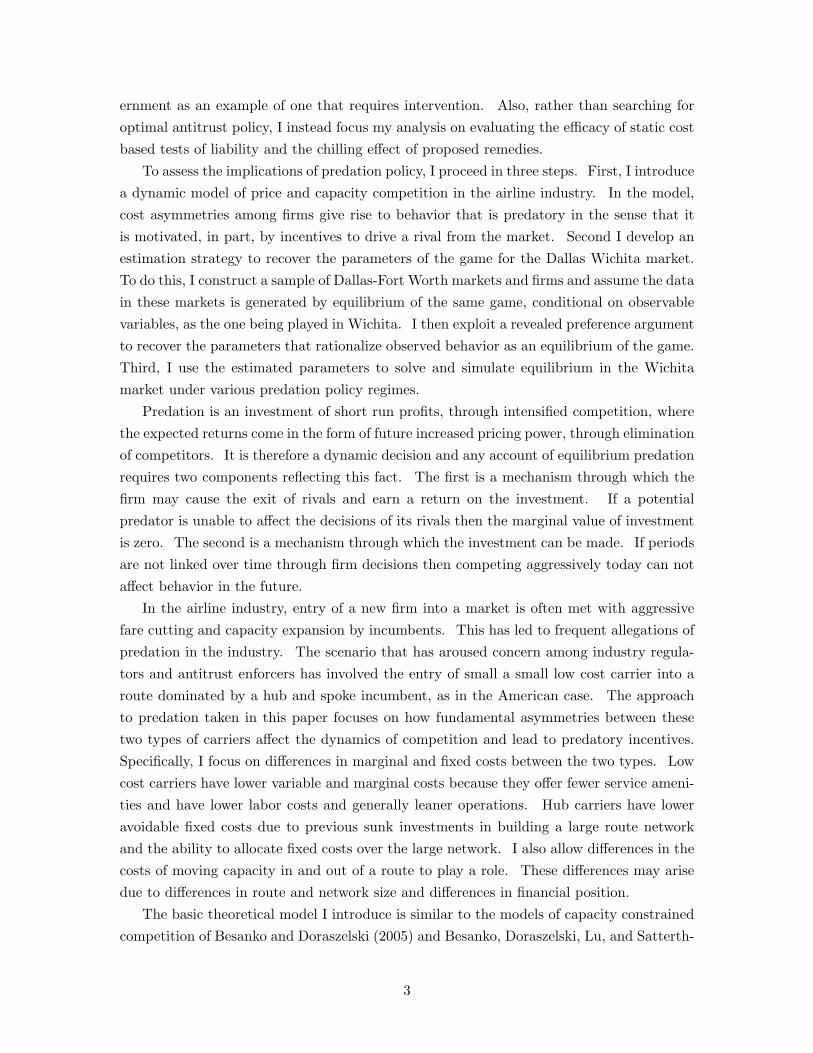
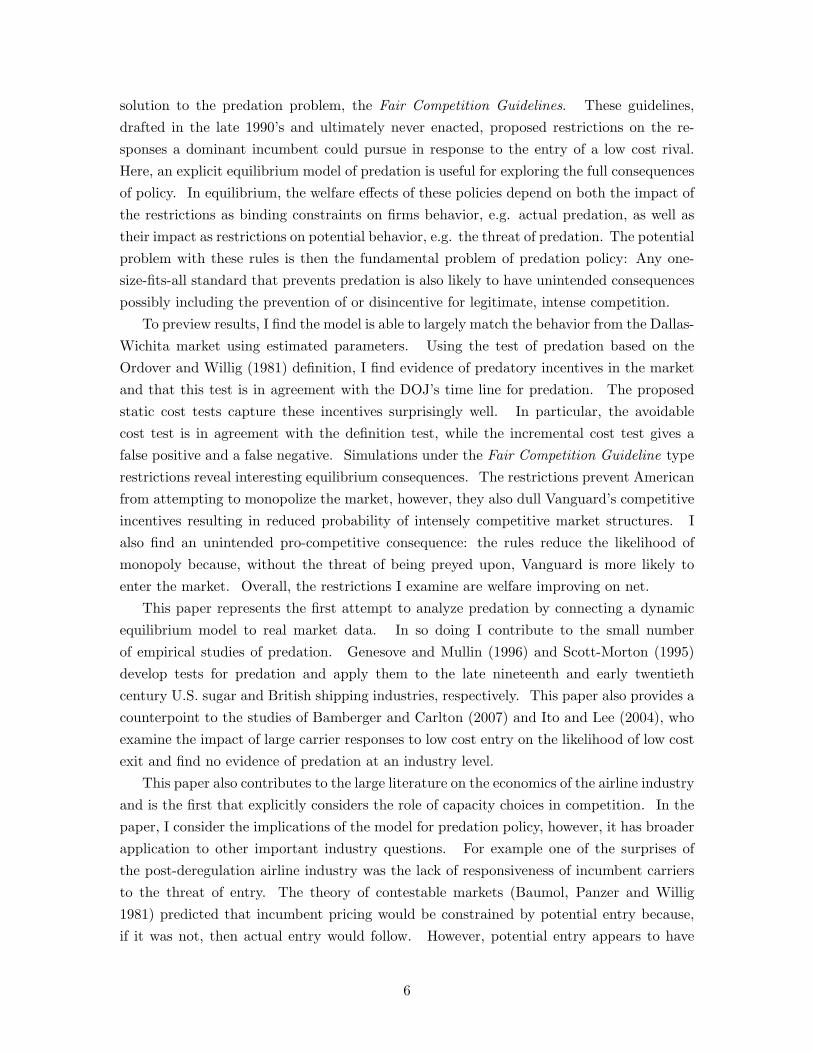
Vanguard Airlines began operating in December of 1994. In January of 1995 Vanguardmade its first foray into Dallas-Fort Worth when it began operating nonstop jet servicefrom DFW to Kansas City. Figures 2 and 3 show the time series of average fares andseating capacities for the DFW to Wichita market. Prior to Vanguard’s entry, the DFWto Wichita market was served by American and Delta. Before May of 1993, both carriersprovided jet service on the route with American offering 5 non-stop flights per day. InMay of 1993 both carriers began converting their jet service to turboprop service and byJune of 1994 both had removed the last of their jets from the market. In February of1994 the Wichita Airport Authority asked American to consider reinstating jet service tothe airport. American offered to return 3 jets per day to the route on the condition thatthe Authority would provide a revenue guarantee of $13,500 per round trip. This periodis highlighted by the dashed vertical line in figure 3. The Authority declined the offer andinstead approached Vanguard and asked them to introduce jet service to the DFW to ICT
9Wichita, Kansas City, Colorado Springs, and Long Beach
12
market.Vanguard noticed the opportunity presented by the lack of jet service and, in April of
1995, entered the DFW-ICT market with 2 non-stop jet flights daily, charging $69 for peakunrestricted one way fares and $39 for off-peak. In line with its standard pricing strategy,American responded to Vanguard’s entry by with one way fares offered at a $20 premiumover Vanguard’s one way fares and round trip fares equal to twice Vanguard’s one way fare.This period is shown by the dashed line labeled 1 in figure 2. Vanguard immediately cutdeeply into American’s share, garnering 44 percent of origin and destination passengers inits first quarter in the market.
Vanguard added a third daily jet flight to the Wichita route in October of 1995. Inresponse to this, American removed its $20 premium on one way fares and began matchingVanguard’s prices. The dashed line labeled 2 in figure 2 highlights this period. Then inJuly of 1996, Vanguard added a fourth daily jet flight as part of a general restructuring planthat called for expanding its presence at DFW. American immediately decided to returnjet service to Wichita, without a revenue guarantee, replacing four of its daily turbopropflights with five jet flights. The aircraft for this addition were “funded by planes sittingidle due to pilot action.”
In November, Vanguard’s then CEO Robert McAdoo resigned and was replaced byJohn Tague. Tague proceeded to restructure Vanguard’s routes, creating a hub and spokenetwork based at Kansas City. He concluded that Vanguard route network was excessivelydissipated and needed a stronger geographic focus. The DFW-ICT, along with almost allother non-Kansas City routes, were eliminated. After Vanguard’s exit, American graduallyraised prices to pre-entry levels and again began to draw down its jet service. As shownin by the black vertical line in the figures, the Justice department alleged that Americanengaged in illegal, predatory capacity additions in the DFW to ICT market in the 4thquarter of 1996.
3 Model
In this section I introduce a dynamic model of price and capacity competition among airlinescompeting in a nonstop market. There model has four important components. First, highmarginal cost/high quality, hub carriers and low marginal cost/ low quality, low cost carrierscompete for non-stop passengers by setting prices for their differentiated offerings. Second,firms must allocate seating capacity to a route to serve passengers because they face capacityconstraints in the form of marginal costs that increase in the ratio of passengers to capacity.Third, moving capacity in and out of markets is costly and these costs potentially differ forhub carriers and low cost carriers. Finally, firms face fixed costs of operating that can beavoided only if the firm exits. These costs may also differ across firms.
Each firm makes choices to maximizes its sum discounted sum of profits. The last
13
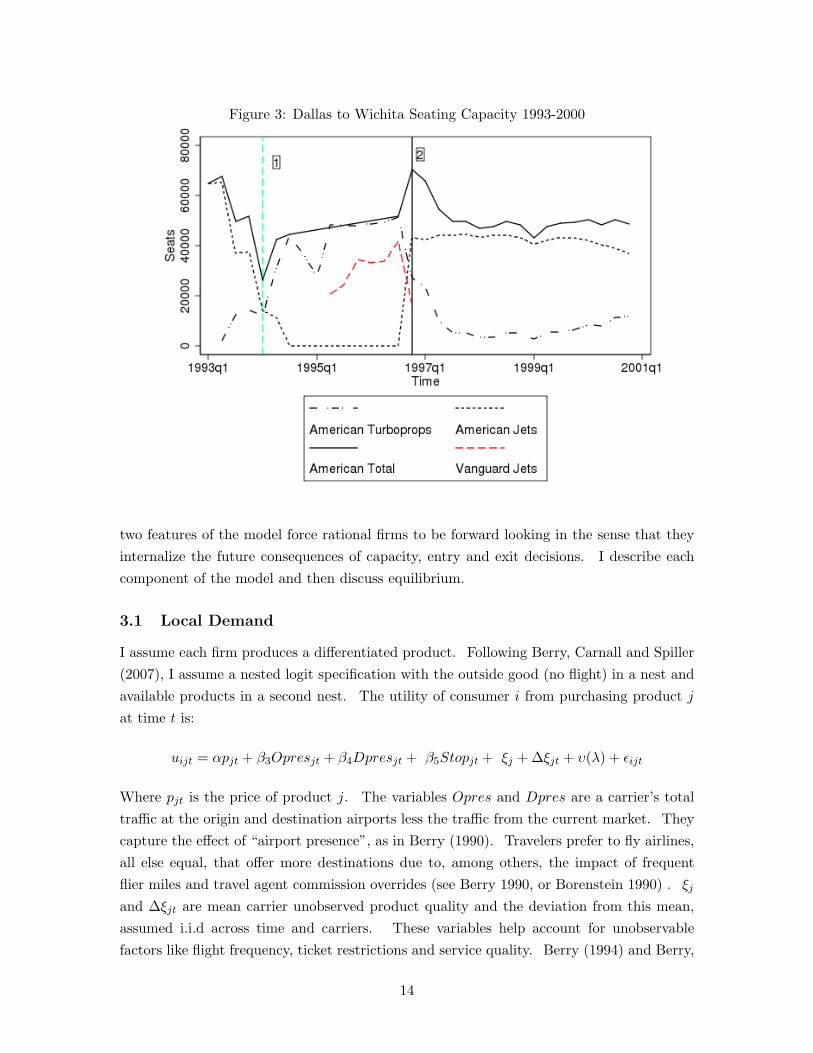
Figure 3: Dallas to Wichita Seating Capacity 1993-2000
two features of the model force rational firms to be forward looking in the sense that theyinternalize the future consequences of capacity, entry and exit decisions. I describe eachcomponent of the model and then discuss equilibrium.
3.1 Local Demand
I assume each firm produces a differentiated product. Following Berry, Carnall and Spiller(2007), I assume a nested logit specification with the outside good (no flight) in a nest andavailable products in a second nest. The utility of consumer i from purchasing product jat time t is:
uijt = αpjt + β3Opresjt + β4Dpresjt + β5Stopjt + ξj + ∆ξjt + υ(λ) + εijt
Where pjt is the price of product j. The variables Opres and Dpres are a carrier’s totaltraffic at the origin and destination airports less the traffic from the current market. Theycapture the effect of “airport presence”, as in Berry (1990). Travelers prefer to fly airlines,all else equal, that offer more destinations due to, among others, the impact of frequentflier miles and travel agent commission overrides (see Berry 1990, or Borenstein 1990) . ξj
and ∆ξjt are mean carrier unobserved product quality and the deviation from this mean,assumed i.i.d across time and carriers. These variables help account for unobservablefactors like flight frequency, ticket restrictions and service quality. Berry (1994) and Berry,
14
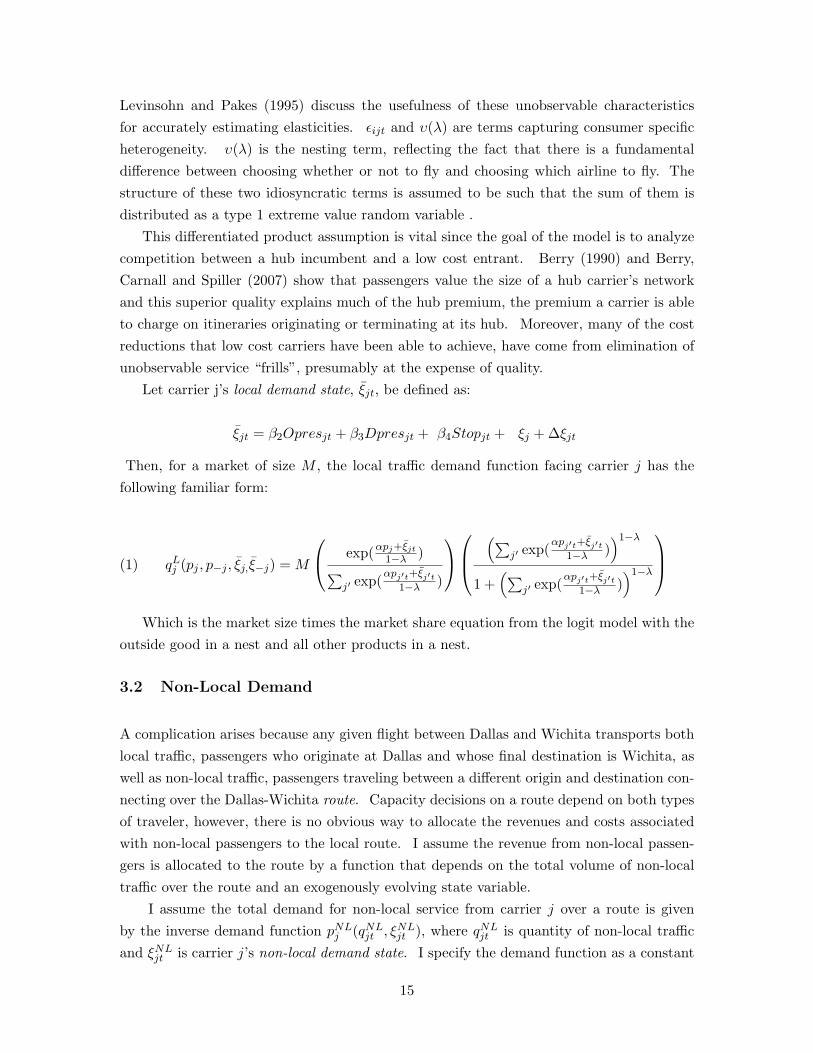
Levinsohn and Pakes (1995) discuss the usefulness of these unobservable characteristicsfor accurately estimating elasticities. εijt and υ(λ) are terms capturing consumer specificheterogeneity. υ(λ) is the nesting term, reflecting the fact that there is a fundamentaldifference between choosing whether or not to fly and choosing which airline to fly. Thestructure of these two idiosyncratic terms is assumed to be such that the sum of them isdistributed as a type 1 extreme value random variable .
This differentiated product assumption is vital since the goal of the model is to analyzecompetition between a hub incumbent and a low cost entrant. Berry (1990) and Berry,Carnall and Spiller (2007) show that passengers value the size of a hub carrier’s networkand this superior quality explains much of the hub premium, the premium a carrier is ableto charge on itineraries originating or terminating at its hub. Moreover, many of the costreductions that low cost carriers have been able to achieve, have come from elimination ofunobservable service “frills”, presumably at the expense of quality.
Let carrier j’s local demand state, ξjt, be defined as:
ξjt = β2Opresjt + β3Dpresjt + β4Stopjt + ξj + ∆ξjt
Then, for a market of size M , the local traffic demand function facing carrier j has thefollowing familiar form:
(1) qLj (pj , p−j , ξj,ξ−j) = M
exp(αpj+ξjt
1−λ )∑j′ exp(
αpj′t+ξj′t1−λ )
(∑j′ exp(
αpj′t+ξj′t1−λ )
)1−λ
1 +(∑
j′ exp(αpj′t+ξj′t
1−λ ))1−λ
Which is the market size times the market share equation from the logit model with the
outside good in a nest and all other products in a nest.
3.2 Non-Local Demand
A complication arises because any given flight between Dallas and Wichita transports bothlocal traffic, passengers who originate at Dallas and whose final destination is Wichita, aswell as non-local traffic, passengers traveling between a different origin and destination con-necting over the Dallas-Wichita route. Capacity decisions on a route depend on both typesof traveler, however, there is no obvious way to allocate the revenues and costs associatedwith non-local passengers to the local route. I assume the revenue from non-local passen-gers is allocated to the route by a function that depends on the total volume of non-localtraffic over the route and an exogenously evolving state variable.
I assume the total demand for non-local service from carrier j over a route is givenby the inverse demand function pNL
j (qNLjt , ξNL
jt ), where qNLjt is quantity of non-local traffic
and ξNLjt is carrier j’s non-local demand state. I specify the demand function as a constant
15
elasticity formpNL
j (qNLjt , ξNL
jt ) = ζ log qNLjt + ξNL
jt
The non-local revenues allocated to the route is then:
(2) pNLjt qNL
jt = (ζ log qNLjt + ξNL
jt )qNLjt
3.3 Variable Costs
Given its capacity level, a non-stop carrier faces a constant marginal cost of carrying passen-gers plus an increasing “soft” capacity constraint. A nonstop carrier’s variable cost functionis:
Cj(qLjt, q
NLjt , qjt) = (wL
j + ωLjt)q
Ljt(3)
+(wNLj + ωNL
jt )qNLjt
+(wlf
1 + υ
) (qjtqjt
)υ
(qjt)
ωLjt and ωNL
jt are mean 0 cost shocks identically and independently distributed over timeand across carriers, qjt is the capacity of carrier j in total seats, and qjt = qL
jt + qNLjt . The
form of the capacity constraint term(
ωlf
1+υ
) (qLjt+qNL
jt
qjt
)υ
(qNLjt + qNL
jt ) is almost identical to
that used in Doraszelski and Besanko (2003) and Doraszelski et. al. (2008). The onlydifference is these papers set ωlf = 1. The constraint is soft in the sense that a carrieris able to violate the constraint though this cost may be high. A hard constraint wouldset the cost of violating the constraint to infinity. In this case a rationing rule would berequired to calculate equilibrium (if it exists). The parameter υ determines how steeplymarginal costs rise in a carrier’s load factor, the ratio of a carrier’s traffic to its capacity.
3.4 Product Market Equilibrium
I restrict the analysis by assuming capacity is the only dynamic variable. Since, condi-tional on capacity choices, pricing and non-local output decisions do not have any impacton the evolution of state variables, the static pricing game and non-local quantity choicecan be solved separately from the capacity choice game. These decisions are determinedsimultaneously as the solution of 2N first order conditions:
qLj (pt, ξt) +
∂qLj (pL
t , ξt)∂pjt
(pL
jt − wLj − ωL
jt − wlf
(qjtqjt
)υ)= 0, j = 1, 2, . . . , N(4)
ζ(1 + log(qNLjt )) + ξNL
jt − wNLj − ωNL
jt − wlf
(qjtqjt
)υ
= 0, j = 1, 2, . . . , N
Let pL(qt, ξt, ξQt ) and qNL(qt, ξt, ξ
Qt ) be the vector implicitly defined solutions to this
16
system of equations. Period profits are then determined by the vector of capacity anddemand states. Define the reduced form profit function πj(qt, ξt, ξ
Qt ) , where
(5) πj(qt, ξt, ξQt ) = (ζ log qNL
j + ξNLjt )qNL
j + pLj q
Lj (pL, ξt)− C
(qLj (pL, ξt), qNL
j , qjt)
3.5 Capacity Choices
Aircraft are highly mobile capital goods. A carrier can physically redeploy assets from onemarket to another in the time it takes to fly the plane between the markets. There isalso an active leasing and secondary market for used aircraft. These facts suggest the costof adding or subtracting capacity from a route is cheap. On the other hand, competitionin the industry is intense and, historically, there has been no shortage of willing entrants.Those surviving in the industry employ sophisticated operations management techniquesto make sure their fleet is as lean as possible. Therefore, changing capacity levels tooquickly or too often incurs high opportunity costs. Tight profit margins also suggest ahigh opportunity cost for the large amount of capital tied up in a plane. Moreover, whilethe secondary market is relatively active, even the most popular aircraft models often takemonths to re-market. Pulvino (1998) shows that firms that have to liquidate large parts oftheir fleets often have to do so at “firesale” prices.
There is good reason to suspect these costs of adjusting capacity varies across carriers.American has a huge route network and a fleet of over 500 planes. Low cost carriers, likeVanguard, have small networks and fleets of size on the order of 10-20 planes. Fledglinglow cost carriers also often have weak balance sheets and lack of proven income sources.
At the beginning of each period given a current capacity level, active firms, incumbentsand new entrants, choose a capacity adjustment, ∆qjt, from a continuous set, [−qjt, Q− qjt].Capacity transitions are deterministic, added in the following period, and can be positiveor negative, provided that negative investment does not exceed total existing capacity.Capacity does not depreciate, so the law of motion is simply:
qjt+1 = qjt + ∆qjt
The costs of adjusting capacity has 2 components. The first is a deterministic componentspecified as a quadratic function; investing or divesting too quickly incurs increasing mar-ginal adjustment costs. The second is a private information draw that shifts up or downthe linear component of costs.
(6) CCap.j (∆qjt, εjt) =
(η+1j + εjt)∆qjt + η+
2j∆q2jt) if ∆qjt > 0
(η−1j + εjt)∆qjt + η−2j∆q2jt) if ∆qjt < 0
17
The parameters ηj determine the slope and curvature of the investment cost function.I allow them to differ according to whether capacity is added or subtracted from a route.The parameters ηj2 determine the penalty exacted on carriers for increasing or decreasingcapacity too quickly.
The capacity cost shocks are assumed i.i.d. over time drawn from mean 0 normaldistributions with commonly known variances that differ across firms:
εjt ∼ Fj = N (0, σKj )
These shocks capture the randomness in the opportunity or real costs of adding or sub-tracting capacity. For example, planes being made available ”due to pilot actions” as theywere for American in the Wichita market.
3.6 Entry and Fixed Costs
At the beginning of each period, prior to the revelation of capacity costs shocks, Entry costsare drawn from a normal distribution with a mean that is a linear function of the carrier’sorigin and destination presence and the carrier’s type and a common standard deviation.
ψj ∼ Ψj = N (γE0j + γE
1 Opresj + γE2 Dpresj , σ
E)
A potential entrant can choose to enter and become an active firm or stay out and disap-pear.10
In the airline industry entry costs are likely to be significant. Entering a route requiresthe carrier to incur administrative and other expenses to, for example, acquire gate spaceby entering into leases either directly from the airport or through subleases from othercarriers at the airport. It is natural to assume these costs will be smaller for carriers thatalready have a large presence at the end points of the market, having already establishedrelationships with airport administrators and having already secured the necessary resourcesto serve other routes. Majority-in-interest agreements at some airports (including DFW)give the major carrier, e.g. American, a say in proposed expansion plans, presumablyleading to differences in these costs across carriers beyond even the observable differencesin presence. Ciliberto and Williams (2008) give a detailed discussion of the determinantsof these costs.
A firm can choose to exit by choosing to sell off all of its capacity. A carrier thatchooses to keep a positive level of capacity pays fixed costs in the following period that isthe sum of two terms. The first is a fixed cost of continuing operations and the second is
10In the data, I define a potential entrant as any firm that has presence at either Dallas or the destinationairport. This means that a potential entrant deciding not to enter today is likely a potential entranttomorrow. For the same reason a firm that exits today often becomes a potential entrant tomorrow. Iassume firms don’t consider the option values of waiting to enter/becoming a potential competitor
18
proportional to the amount of capacity the firm holds
(7) φj + γ q qjt
This specification reflects the fact that at the route level certain expenses are fixed butavoidable, i.e. costs that can not be subsumed into sunk entry costs because they can beavoided by exiting or removing capacity. Also, many system or airport wide expenses, suchas executive pay or operations planning, have to be allocated to individual routes for thepurpose of measuring the performance of routes and making exit and capacity decisions.In its own decision accounting system, American often allocates such expenses proportion-ally according to departures or other traffic measures. Though arguably arbitrary, sinceAmerican bases decisions on these measures, they presumably reflect economic costs fairlywell.
3.7 Bellman Equations
I restrict attention to Markov perfect equilibria of the above game. There are two reasonsfor this. First, most of the existing tools for equilibrium computation (e.g. McGuire andPakes (1995, 2001)) as well as for estimation of structural parameters of the games (e.g.Aguirregabiria and Mira (2007) , Pesendorfer and Jofre-Bonet (2005) , Bajari, Benkard andLevin (2007)) are designed for this class of equilibria. Second, Markov perfection imposessome discipline on the analysis by restricting dynamics to be driven only by fundamentalor “payoff relevant” variables. This gives a firmer foundation to the analysis since beliefrelated variables such as reputation are inherently difficult to measure and thus inherentlymore speculative. This restriction helps answer criticisms of the use of modern strategictheory in the analysis of predation cases (see e.g Bolton, Brodley, and Riorden 2003 andthe reply of Elzinga and Mills 2003). The flip side of this strength is that the model doesnot nest any of the theories that rely on asymmetric information and reputation formationdriving forces.11
Time is discrete and infinite. Within a period, inactive potential entrants see a randomcost of entry and decide whether to pay the cost and become active or disappear. All activefirms, including entering firms see a random shock to the cost of capacity adjustment andmake capacity adjustment decisions that take effect in the following period. A firm canchoose to exit and disappear by choosing to sell off all its capacity. Firms then competefor passengers and realize profits for the period.
Each market is described by market states that evolve over time and type states whichare time invariant. In what follows I omit notation that shows the explicit dependence
11Most theories of equilibrium predation rely on asymmetric information, e.g. Milgrom and Roberts(1983) Saloner (1989) Fudenberg and Tirole (1990) more cites. Cabral and Riorden (1995, 1997) offer arationale, in the same spirit as the one offered here, that does not rely on asymmetric info.
19
of values on these type variables. Let S = (q, ξt, ξQt ) Assuming that firms follow Markov
strategies, the value of a firm that has decided to remain active in the next period and hasviewed its cost draw, εj , can be written as the Bellman’s equation:
V Ij (S, εj) = max
∆qj∈[−qj ,Q−qj ]πj(S)− φj − γ q qj − C q(∆q, εj) + βCVj(S,∆qj)(8)
CVj(S,∆qj) =∫ ∫
V I(S′, ε′j) Pr(dS′|S,∆qj)F (dε′j)
Finally, the value of a potential entrant after viewing its sunk cost of entry and prior toseeing its investment cost can similarly be written:
(9) V Ej (S, ψj) = max
χj∈0,1χj
(−ψj +
∫V I
j (S, εj)F (dεj))
In a Markov perfect equilibrium firms policies are functions only of current payoff rele-vant state variables. These include the market states for all competitor as well as privateinformation capacity shocks, entry cost draws for potential entrants, and scrap value drawsfor incumbents. I write these strategies, entry and capacity choice policies for each stateas Ωj(S, εj , ψj) = (χj(S, ψj),∆qj(S, εj)).
Definition 1 A Markov Perfect Equilibrium is: value functions ,V Ij , policy functions, Ωj
and transition functions for all j ∈ 1, . . . N such that:
V Ij (S, εj) = max
∆qj∈[−qj ,Q−qj ]πj(S)− φj − γ q qj − C q(∆q, εj)(10)
+β∫ ∫
V I(S′, ε′j) Pr(dS′|S,∆qj)F (dε′j)
χj(S, ψj) = arg maxχj∈0,1
χj
(−ψj + β
∫V I
j (S, εj)F (dεj))
(11)
∆qj(S, εj) = arg max∆qj∈[−qj ,Q−qj ]
πj(S)− φj − γ q qj − C q(∆q, εj)(12)
+β∫ ∫
V I(S′, ε′j) Pr(dS′|S,∆qj)F (dε′j)
3.8 Discussion: Aggressive Pricing and Capacity Behavior
In the model, the intensity of price competition and period profits are determined by the“closeness” of firms in characteristic and capacity space. The more similar firms are inthe characteristics, including capacity, of their non-stop product, the greater the marginalimpact of price changes on quantity. The capacity constraint induces a similar effect onthe cost side. When firms have dissimilar capacity levels, the smaller firms are unable
20
to compete as aggressively on prices because doing so incurs steeply increasing marginalcosts. On the demand side the degree to which this closeness matters is measured by theparameter λ. High values of λ correspond to high correlation in utilities among consumerswithin a market and accordingly highly correlated choices. On the cost side, the degreeto which closeness matters depends on the parameter υ. Higher values of υ correspond toharder capacity constraints and more steeply increasing capacity costs.
Profit functions exhibiting these features have been central in the literature of firm andindustry dynamics (See Athey and Schmultzer (2001) or Doraszelski and Pakes (2007) for areview of these results in the EP framework). Total industry profits in these environmentsare greater when 1 firm is dominant causing market equilibrium to tend to asymmetricstructures with a dominant firm and occasional periods of intense competition when thelaggard tries to become the market leader. In the present model, with the possibility ofexit, a dominant firm anticipates these periods of fierce competition and has incentive topreempt them by acting aggressively to cause losses and potential exit by the laggard. Thenature of asymmetries between the firms determine the precise nature of these incentivesand the corresponding market dynamics.
4 Estimation
I will use the above model to simulate equilibrium in the Dallas to Wichita market undervarious antitrust regimes. In this section I discuss how I estimate the game parameters todo these simulations. The time series of relevant variables from an individual market, e.gDFW-ICT, represents a single observation of a Markov perfect equilibrium. In order to doestimation and inference, I need to observe equilibrium in many such markets. To this end,I construct a sample of 81 markets out of Dallas-Fort Worth and argue that these marketsrepresent individual observations of the same MPE.
4.1 Data and Sample Selection
The primary sources of data are from publicly available databases published by the Bureauof Transportation Statistics. The first is origin and destination DB1B. The DB1B containsa quarterly 10% sample of all domestic origin and destination itineraries including numberof connections, carrier and fare paid. I keep those observations originating at Dallas-FortWorth. I further keep only round-trip fares and drop the lowest and highest 2.5% of fares interms of fare per mile to avoid frequent flier tickets and possible coding errors. The DB1Blists three types of carrier for each itinerary, ticking, reporting, and operating. I define thecarrier as the ticketing carrier and, when there is more than one ticketing carrier, I definethe carrier as the listed as the ticketing carrier for the segment out of DFW. I aggregateall remaining fares into passenger weighted, nonstop and connecting fares for each marketcarrier quarter.
21
The second source, also from BTS, is the T100 Origin and Destination database. Thedomestic T100 contains monthly data on traffic for all origins and destinations within theU.S. for carriers with annual revenues greater than $20 million. The variables include:carrier, O&D passengers, seats, departures performed, departures scheduled, and distancefor each route a carrier flies. I collect this data for all months from 1993-2000 and aggregateto make it quarterly. As with the DB1B, I only include routes for which DFW is an originor destination. I define the capacity state as the number of scheduled seats for a quarter. Iconstruct the origin presence variable, Opresjt, by summing all passenger traffic originatingat DFW for carrier j in period t less the traffic from the non-stop market in question.Similarly the destination presence variable, Dpresjtm, is constructed by summing all ofcarrier j’s passenger traffic originating at destination m in period t less the traffic from thenon-stop market. Non-local traffic on a route, qNL
jt , is the T100 measure of total traffic overthe route minus local traffic. To exclude serial entry-reentry, likely driven by network orseasonal factors, I define carrier exit as a carrier’s reported DB1B passenger traffic fallingbelow 100 and entry as a carrier’s reported passenger total going above 100.12
Since my focus is on capacity, pricing, and entry/exit decisions in non-stop marketsfurther sample selection criteria must be used. Airline pricing and capacity decisions reflectthe complicated network nature of the industry, particularly for hubbing carriers. I wantto focus on markets and firms within those markets whose decisions are based on the samemargins that model decisions are based to make the same equilibrium assumption plausible.When network considerations are first order relative to within market considerations thiswill not be true.
In order to concentrate on markets in which non-stop traffic is the primary determinantof pricing, I push competitors with with-stop service as well as competitors whose share ofroute passengers is greater for a with-stop route than a non-stop route, into a competitivefringe and do not analyze their decisions. By similar reasoning, I also only want to considermarkets that are not marginal with respect to providing any nonstop service. Entry andexit decisions in these, usually small routes are also driven more by network considerationsthan by fundamentals in the non-stop market. To deal with this I exclude markets in thebottom quartile of traffic density. Also I eliminate any markets that did not have anynon-stop service at some point in the sample period. This leaves 81 markets remaining inthe sample. Table 2 shows some summary statistics for the sample.
4.2 Estimation Strategy
I estimate the model in two stages. First, I estimate the parameters of the discrete choicedemand system. The demand system is a simple version of those expounded in Berry(1994) and Berry, Levinsohn and Pakes (1995, BLP hereafter) and has been employed inmany applications including applications to air travel demand by Berry, Carnall, and Spiller
12The DB1B is a 10% sample so this corresponds to 1000 passengers on average.
22
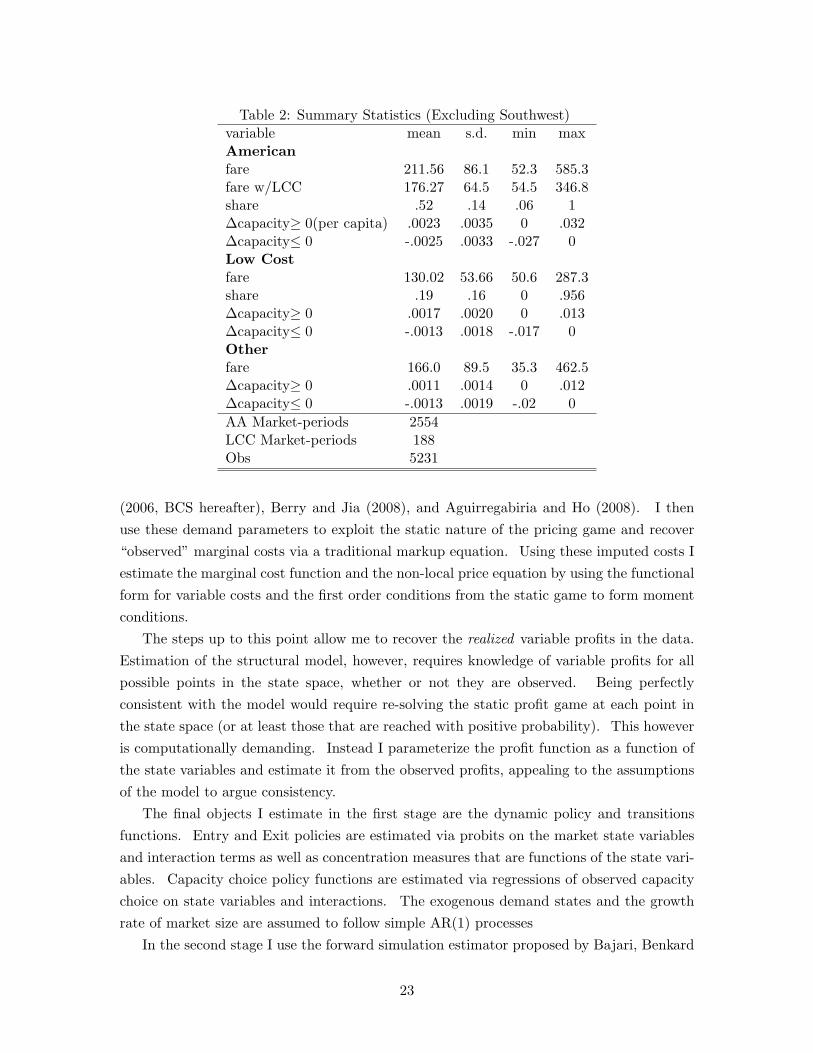
Table 2: Summary Statistics (Excluding Southwest)variable mean s.d. min maxAmericanfare 211.56 86.1 52.3 585.3fare w/LCC 176.27 64.5 54.5 346.8share .52 .14 .06 1∆capacity≥ 0(per capita) .0023 .0035 0 .032∆capacity≤ 0 -.0025 .0033 -.027 0Low Costfare 130.02 53.66 50.6 287.3share .19 .16 0 .956∆capacity≥ 0 .0017 .0020 0 .013∆capacity≤ 0 -.0013 .0018 -.017 0Otherfare 166.0 89.5 35.3 462.5∆capacity≥ 0 .0011 .0014 0 .012∆capacity≤ 0 -.0013 .0019 -.02 0AA Market-periods 2554LCC Market-periods 188Obs 5231
(2006, BCS hereafter), Berry and Jia (2008), and Aguirregabiria and Ho (2008). I thenuse these demand parameters to exploit the static nature of the pricing game and recover“observed” marginal costs via a traditional markup equation. Using these imputed costs Iestimate the marginal cost function and the non-local price equation by using the functionalform for variable costs and the first order conditions from the static game to form momentconditions.
The steps up to this point allow me to recover the realized variable profits in the data.Estimation of the structural model, however, requires knowledge of variable profits for allpossible points in the state space, whether or not they are observed. Being perfectlyconsistent with the model would require re-solving the static profit game at each point inthe state space (or at least those that are reached with positive probability). This howeveris computationally demanding. Instead I parameterize the profit function as a function ofthe state variables and estimate it from the observed profits, appealing to the assumptionsof the model to argue consistency.
The final objects I estimate in the first stage are the dynamic policy and transitionsfunctions. Entry and Exit policies are estimated via probits on the market state variablesand interaction terms as well as concentration measures that are functions of the state vari-ables. Capacity choice policy functions are estimated via regressions of observed capacitychoice on state variables and interactions. The exogenous demand states and the growthrate of market size are assumed to follow simple AR(1) processes
In the second stage I use the forward simulation estimator proposed by Bajari, Benkard
23
and Levin (2007) to estimate the capacity adjustment, fixed, entry, and exit costs. Startingwith an initial state in the data, I use the policy functions estimated in the first stage tosimulate the evolution of the market under the observed policy and a set of alternativepolicies. Estimation is based on inequalities implied by the Markov perfect equilibriumassumption, i.e. the assumption that the observed policies have higher (expected) returnsthan alternative policies. In the demand and variable cost estimates, I am able to exploitthe panel nature of the data to saturate the model with fixed effects to deal with unobservedheterogeneity, however the computational burden of the second stage estimator increasesdramatically in the number of parameters to be estimated. To deal with this, I allowvariable profits, policies, transitions and dynamic cost parameters to vary only accordingto whether a carrier is one of three types: American, Low Cost, or Other.
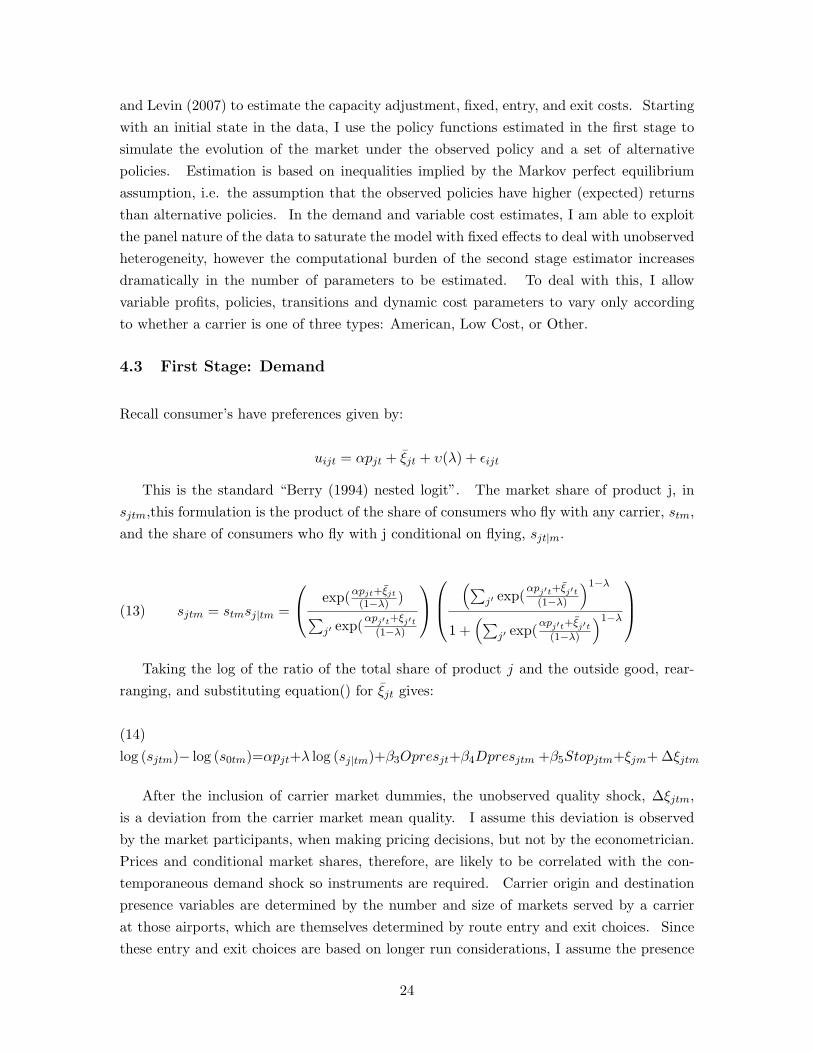
4.3 First Stage: Demand
Recall consumer’s have preferences given by:
uijt = αpjt + ξjt + υ(λ) + εijt
This is the standard “Berry (1994) nested logit”. The market share of product j, insjtm,this formulation is the product of the share of consumers who fly with any carrier, stm,and the share of consumers who fly with j conditional on flying, sjt|m.
(13) sjtm = stmsj|tm =
exp(αpjt+ξjt
(1−λ) )∑j′ exp(
αpj′t+ξj′t(1−λ)
(∑j′ exp(
αpj′t+ξj′t(1−λ)
)1−λ
1 +(∑
j′ exp(αpj′t+ξj′t
(1−λ)
)1−λ
Taking the log of the ratio of the total share of product j and the outside good, rear-
ranging, and substituting equation() for ξjt gives:
(14)log (sjtm)− log (s0tm)=αpjt+λ log (sj|tm)+β3Opresjt+β4Dpresjtm +β5Stopjtm+ξjm+ ∆ξjtm
After the inclusion of carrier market dummies, the unobserved quality shock, ∆ξjtm,is a deviation from the carrier market mean quality. I assume this deviation is observedby the market participants, when making pricing decisions, but not by the econometrician.Prices and conditional market shares, therefore, are likely to be correlated with the con-temporaneous demand shock so instruments are required. Carrier origin and destinationpresence variables are determined by the number and size of markets served by a carrierat those airports, which are themselves determined by route entry and exit choices. Sincethese entry and exit choices are based on longer run considerations, I assume the presence
24
variables are predetermined with respect to the demand shock and are valid instruments.By similar reasoning, I ignore the potential selection issue arising from the fact than carriersmight condition entry and exit decisions on the demand shocks.
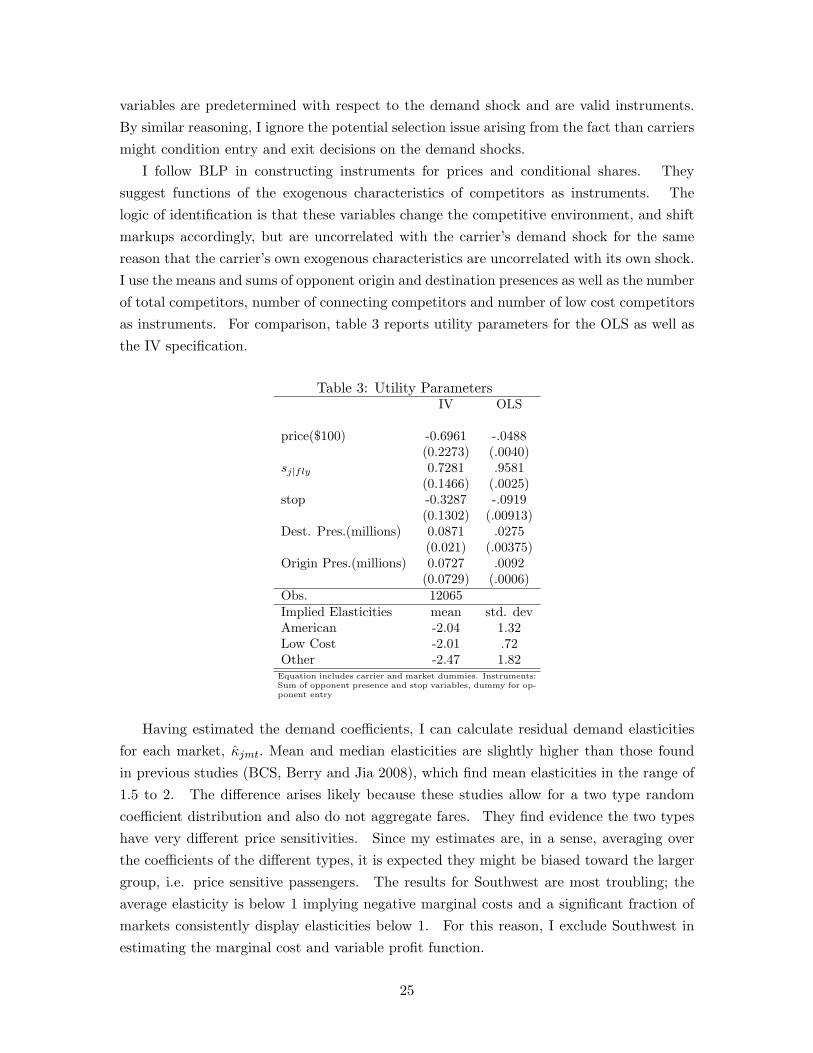
I follow BLP in constructing instruments for prices and conditional shares. Theysuggest functions of the exogenous characteristics of competitors as instruments. Thelogic of identification is that these variables change the competitive environment, and shiftmarkups accordingly, but are uncorrelated with the carrier’s demand shock for the samereason that the carrier’s own exogenous characteristics are uncorrelated with its own shock.I use the means and sums of opponent origin and destination presences as well as the numberof total competitors, number of connecting competitors and number of low cost competitorsas instruments. For comparison, table 3 reports utility parameters for the OLS as well asthe IV specification.
Table 3: Utility ParametersIV OLS
price($100) -0.6961 -.0488(0.2273) (.0040)
sj|fly 0.7281 .9581(0.1466) (.0025)
stop -0.3287 -.0919(0.1302) (.00913)
Dest. Pres.(millions) 0.0871 .0275(0.021) (.00375)
Origin Pres.(millions) 0.0727 .0092(0.0729) (.0006)
Obs. 12065Implied Elasticities mean std. devAmerican -2.04 1.32Low Cost -2.01 .72Other -2.47 1.82Equation includes carrier and market dummies. Instruments:Sum of opponent presence and stop variables, dummy for op-ponent entry
Having estimated the demand coefficients, I can calculate residual demand elasticitiesfor each market, κjmt. Mean and median elasticities are slightly higher than those foundin previous studies (BCS, Berry and Jia 2008), which find mean elasticities in the range of1.5 to 2. The difference arises likely because these studies allow for a two type randomcoefficient distribution and also do not aggregate fares. They find evidence the two typeshave very different price sensitivities. Since my estimates are, in a sense, averaging overthe coefficients of the different types, it is expected they might be biased toward the largergroup, i.e. price sensitive passengers. The results for Southwest are most troubling; theaverage elasticity is below 1 implying negative marginal costs and a significant fraction ofmarkets consistently display elasticities below 1. For this reason, I exclude Southwest inestimating the marginal cost and variable profit function.
25
4.4 First Stage: Variable Costs
Combining the elasticities with the assumption that prices don’t influence the evolutionof state variables, I can back out marginal cost observations using the standard markupequation.
(15) cjtm = pjtm
(1− 1
κjmt
)The variation in the data is insufficient to adequately identify both coefficients in the
capacity cost term separately. Instead, I set υ = 5 to reflect the obvious hard constraintthat a carrier can never fly more passengers than it flies seats as well as the observation thatcarriers fly planes at less than capacity, which suggests increasing marginal costs below thecapacity constraint. Also, without price data for non-local traffic, the constant marginalcost of non-local passengers and the non-local demand state are not separately identified.I therefore normalize this cost to 0. The other cost and non-local profit parameters areestimated using the moments:
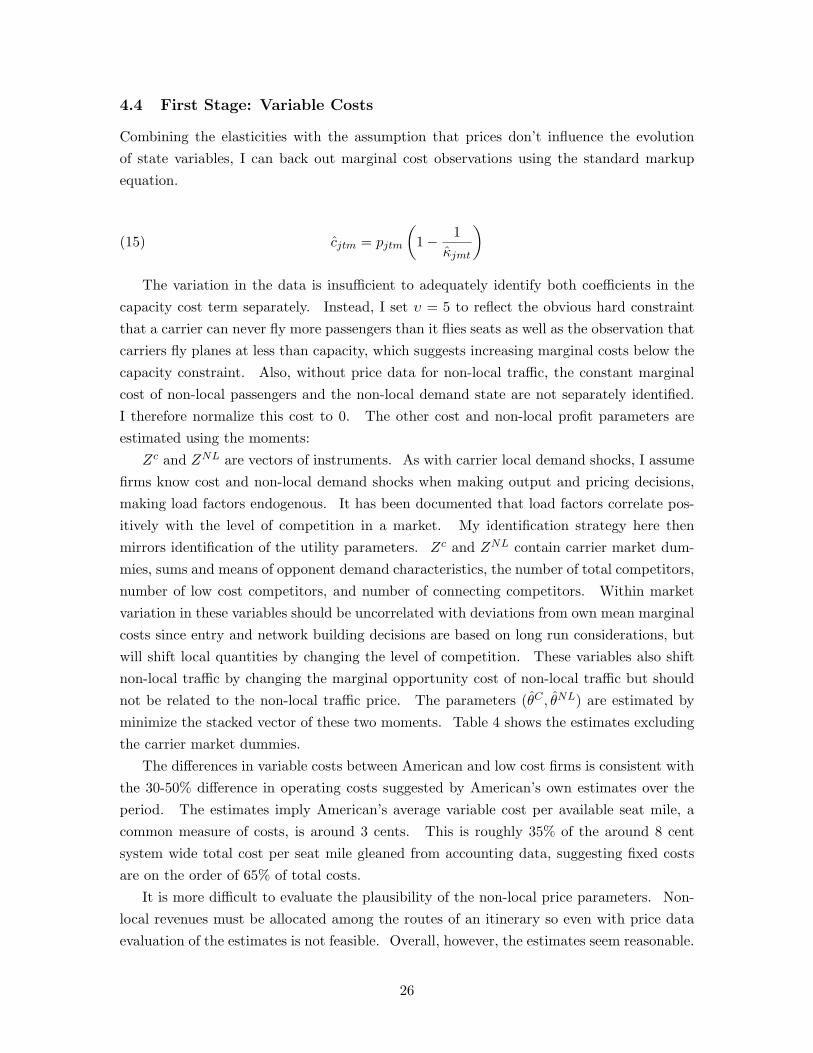
Zc and ZNL are vectors of instruments. As with carrier local demand shocks, I assumefirms know cost and non-local demand shocks when making output and pricing decisions,making load factors endogenous. It has been documented that load factors correlate pos-itively with the level of competition in a market. My identification strategy here thenmirrors identification of the utility parameters. Zc and ZNL contain carrier market dum-mies, sums and means of opponent demand characteristics, the number of total competitors,number of low cost competitors, and number of connecting competitors. Within marketvariation in these variables should be uncorrelated with deviations from own mean marginalcosts since entry and network building decisions are based on long run considerations, butwill shift local quantities by changing the level of competition. These variables also shiftnon-local traffic by changing the marginal opportunity cost of non-local traffic but shouldnot be related to the non-local traffic price. The parameters (θC , θNL) are estimated byminimize the stacked vector of these two moments. Table 4 shows the estimates excludingthe carrier market dummies.
The differences in variable costs between American and low cost firms is consistent withthe 30-50% difference in operating costs suggested by American’s own estimates over theperiod. The estimates imply American’s average variable cost per available seat mile, acommon measure of costs, is around 3 cents. This is roughly 35% of the around 8 centsystem wide total cost per seat mile gleaned from accounting data, suggesting fixed costsare on the order of 65% of total costs.
It is more difficult to evaluate the plausibility of the non-local price parameters. Non-local revenues must be allocated among the routes of an itinerary so even with price dataevaluation of the estimates is not feasible. Overall, however, the estimates seem reasonable.
26
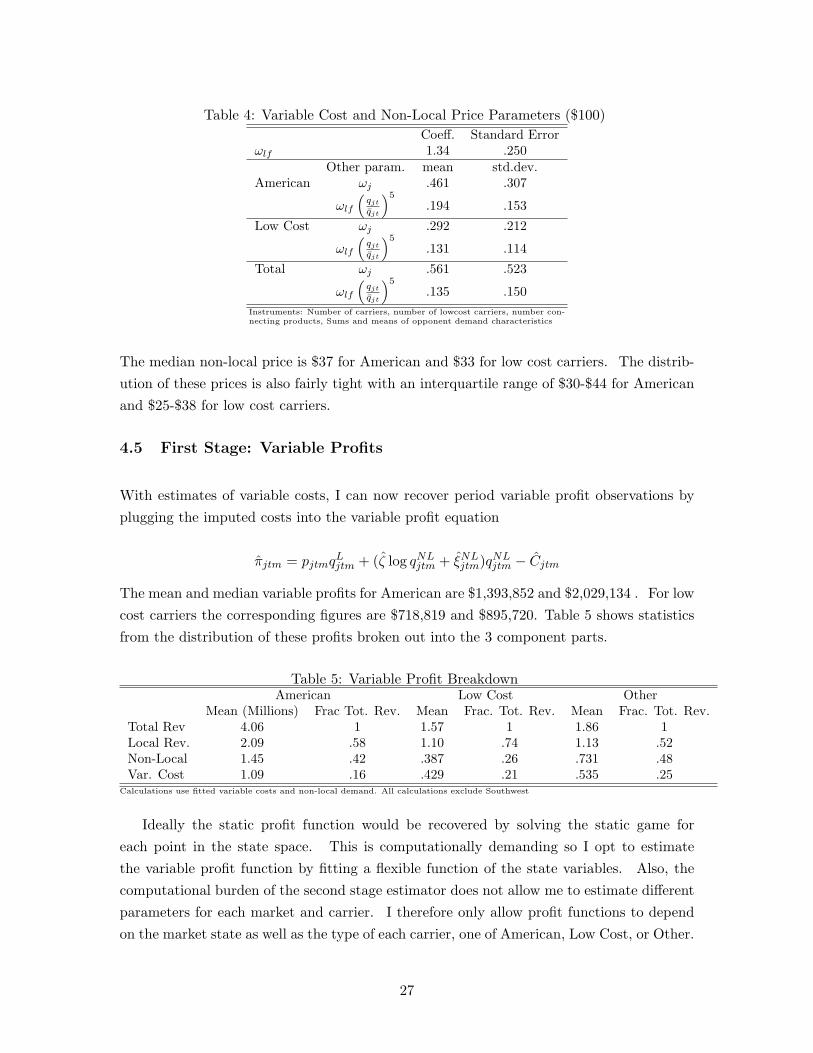
Table 4: Variable Cost and Non-Local Price Parameters ($100)Coeff. Standard Error
ωlf 1.34 .250Other param. mean std.dev.
American ωj .461 .307
ωlf
(qjt
qjt
)5
.194 .153
Low Cost ωj .292 .212
ωlf
(qjt
qjt
)5
.131 .114
Total ωj .561 .523
ωlf
(qjt
qjt
)5
.135 .150Instruments: Number of carriers, number of lowcost carriers, number con-necting products, Sums and means of opponent demand characteristics
The median non-local price is $37 for American and $33 for low cost carriers. The distrib-ution of these prices is also fairly tight with an interquartile range of $30-$44 for Americanand $25-$38 for low cost carriers.
4.5 First Stage: Variable Profits
With estimates of variable costs, I can now recover period variable profit observations byplugging the imputed costs into the variable profit equation
πjtm = pjtmqLjtm + (ζ log qNL
jtm + ξNLjtm)qNL
jtm − Cjtm
The mean and median variable profits for American are $1,393,852 and $2,029,134 . For lowcost carriers the corresponding figures are $718,819 and $895,720. Table 5 shows statisticsfrom the distribution of these profits broken out into the 3 component parts.
Table 5: Variable Profit BreakdownAmerican Low Cost Other
Mean (Millions) Frac Tot. Rev. Mean Frac. Tot. Rev. Mean Frac. Tot. Rev.Total Rev 4.06 1 1.57 1 1.86 1Local Rev. 2.09 .58 1.10 .74 1.13 .52Non-Local 1.45 .42 .387 .26 .731 .48Var. Cost 1.09 .16 .429 .21 .535 .25
Calculations use fitted variable costs and non-local demand. All calculations exclude Southwest
Ideally the static profit function would be recovered by solving the static game foreach point in the state space. This is computationally demanding so I opt to estimatethe variable profit function by fitting a flexible function of the state variables. Also, thecomputational burden of the second stage estimator does not allow me to estimate differentparameters for each market and carrier. I therefore only allow profit functions to dependon the market state as well as the type of each carrier, one of American, Low Cost, or Other.
27
Specifically, I estimate using the following moments:
(16) g3N (θπ) =1T
1M
T∑t=1
M∑m=1
1Nm
Nm∑j=1
fπtype(Stm)(log(πjtm)− log(poptm)− fπ
type(Stm)θ′)
Where fπtype(Sjtm) is a vector of polynomial (quadratic) basis functions in a carrier’s
own state and means and sums of opponent’s states. The actual estimates are difficult tointerpret so I do not include them here.13
4.6 First Stage: Policy Functions
In a Markov Perfect equilibrium, equilibrium policies are functions of the “payoff relevant”state variable alone. While, this restriction provides useful guidance, equilibrium policiesare rarely available in closed form. Without knowing the functional form the optimal wayto proceed is estimate the policies non-parametrically. Data limitations, however, precludethis. I choose to estimate linear functions of the state variables and include relevantinteraction terms.
Table 10, in the back of the paper, reports coefficients from entry and exit probits. Asfound in previous literature, origin and destination presence are very important predictorsof entry likelihood and to a lesser extent, exit likelihoods. As found by Berry (1990), entryby carriers who have no presence at either market endpoint is very rare. In a few markets,there are carriers that appear to repeatedly enter and exit the market. I assume that theseare seasonal routes and exclude those market carrier observations for which there are morethan two total entries.
I estimate the capacity adjustment policy functions using a flexible polynomial specifica-tion. As in the variable profits section, I estimate capacity policies for American, Low Cost,and Other type carriers and treat mean carrier market costs as additional state variables.Formally, I estimate capacity policies via the moments:
(17) g4N (θ∆q) =1T
1M
T∑t=1
M∑m=1
1Nm
Nm∑j=1
f∆qtype(Sjtm)(∆qjtm − f∆q
type(Sjtm)θ∆q′)
Where f∆q(Sjtm) is a vector of selected polynomial terms. As with the variable profitfunction identification rests on there being sufficient variation in the observed states andthe model being correctly specified.
The estimation strategy taken here is inconsistent with the model in two ways. First,in the model, the exit and capacity adjustment decisions are not distinct, a firm exitsby choosing to sell off all of its capacity. Here I estimate, and below use for simulation,
13Estimates are available, upon request, from the author.
28
separately estimated capacity and exit policies. I do this to allow for potential misspec-ification by allowing factors independent of capacity costs to affect exit decisions. Thesecond inconsistency is the failure to correct the capacity policy estimate for the truncationimplied by the assumption that carrier’s can not sell off more capacity than they currentlyhold. The consequences of these choices, however, are minimal. The fitted probability ofchoosing to move to a negative capacity state is low for states observed in the data and theprobability of exit is high for low levels of capacity. In other words, together the exit andcapacity policy tell a carrier to move up or get out at low levels of capacity.
4.7 Second Stage: Fixed,Entry and Capacity Costs
In this section I estimate the dynamic parameters of the game; the parameters describingcapacity, entry and exit costs. I do this by using a forward simulation estimator of the typesuggested in Bajari, Benkard, and Levin (2007). The estimator is based on the inequalitiesimplied by the above Markov Perfect equilibrium assumptions.
Abusing notation, define the value of an incumbent prior to seeing it’s capacity costshock and with all competitors following an arbitrary policy profile Ω by:(18)
V Itype(S| Ω) = EεF
[πj(S)− φj − γ q qj − C q(∆qj(Ωj), εj) +
∫V I
type(S′| Ωj) Pr(dS′|∆qj(Ωj), S,Ω−j)
]Let Ω∗ be a Markov perfect equilibrium strategy profile. Then for each carrier j, Ω∗ mustsatisfy:
V Itype(S| Ω∗
j ,Ω∗−j) ≥ V I
type(S| Ωj ,Ω∗−j) ∀ Ωj , ∀S
The second stage estimator exploits these inequalities by plugging in the estimated reducedform policies for the equilibrium strategies
V Itype(S| Ω∗
j (θFS),Ω∗−j(θFS); θSS , θFS)− V I
type(S| Ωj ,Ω∗−j(θFS); θSS , θFS) ≥ 0 ∀ Ωj , ∀S
where θFS is the vector of parameters estimated in the first stage, Ω∗(θFS) denotes thereduced form estimate of the equilibrium policy profile, and θSS is the vector of dynamiccost parameters including the variance parameter describing the distribution of the linearcapacity cost shocks.
From the above discussion, for any strategy profile, Ω, the value function is linear func-tion of these parameters and has 3 terms. The first term is the expected discounted valueof the flow profits accruing to the firm while it remains an active competitor. The secondterm is the expected discounted stream of capacity adjustment costs the firm incurs. Andthe third term is the expected discounted scrap value (entry cost) an incumbent (potentialentrant) receives (pays) upon exiting (entering) the market. All expectations are rationalin the sense that they are taken with respect to the true underlying transition functions,
29
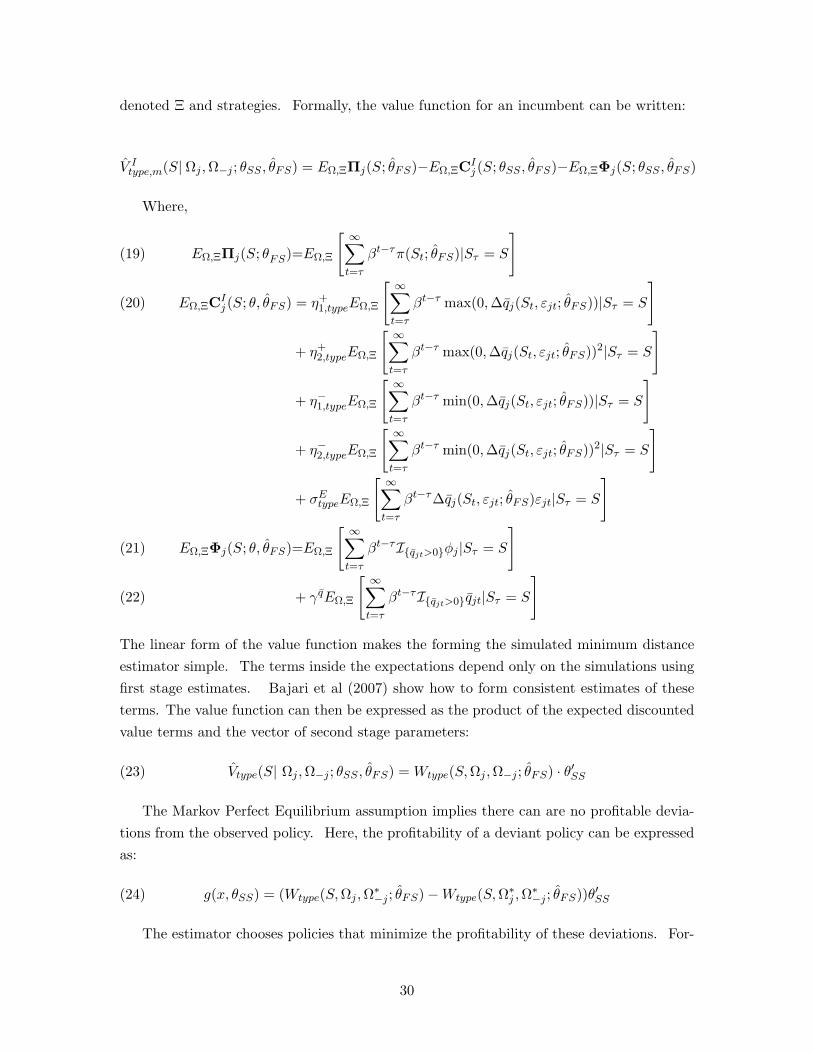
denoted Ξ and strategies. Formally, the value function for an incumbent can be written:
V Itype,m(S| Ωj ,Ω−j ; θSS , θFS) = EΩ,ΞΠj(S; θFS)−EΩ,ΞCI
j (S; θSS , θFS)−EΩ,ΞΦj(S; θSS , θFS)
Where,
EΩ,ΞΠj(S; θFS)=EΩ,Ξ
[ ∞∑t=τ
βt−τπ(St; θFS)|Sτ = S
](19)
EΩ,ΞCIj (S; θ, θFS) = η+
1,typeEΩ,Ξ
[ ∞∑t=τ
βt−τ max(0,∆qj(St, εjt; θFS))|Sτ = S
](20)
+ η+2,typeEΩ,Ξ
[ ∞∑t=τ
βt−τ max(0,∆qj(St, εjt; θFS))2|Sτ = S
]
+ η−1,typeEΩ,Ξ
[ ∞∑t=τ
βt−τ min(0,∆qj(St, εjt; θFS))|Sτ = S
]
+ η−2,typeEΩ,Ξ
[ ∞∑t=τ
βt−τ min(0,∆qj(St, εjt; θFS))2|Sτ = S
]
+ σEtypeEΩ,Ξ
[ ∞∑t=τ
βt−τ∆qj(St, εjt; θFS)εjt|Sτ = S
]
EΩ,ΞΦj(S; θ, θFS)=EΩ,Ξ
[ ∞∑t=τ
βt−τIqjt>0φj |Sτ = S
](21)
+ γ qEΩ,Ξ
[ ∞∑t=τ
βt−τIqjt>0qjt|Sτ = S
](22)
The linear form of the value function makes the forming the simulated minimum distanceestimator simple. The terms inside the expectations depend only on the simulations usingfirst stage estimates. Bajari et al (2007) show how to form consistent estimates of theseterms. The value function can then be expressed as the product of the expected discountedvalue terms and the vector of second stage parameters:
(23) Vtype(S| Ωj ,Ω−j ; θSS , θFS) = Wtype(S,Ωj ,Ω−j ; θFS) · θ′SS
The Markov Perfect Equilibrium assumption implies there can are no profitable devia-tions from the observed policy. Here, the profitability of a deviant policy can be expressedas:
(24) g(x, θSS) = (Wtype(S,Ωj ,Ω∗−j ; θFS)−Wtype(S,Ω∗
j ,Ω∗−j ; θFS))θ′SS
The estimator chooses policies that minimize the profitability of these deviations. For-
30

mally, I randomly draw a set of states and alternative policies from a distribution H togenerate a set of nk inequalities. The true parameters satisfy:
(25) θSS = arg min∫Ig(X(k),θSS)>0g(X
(k), θSS)2dH(X(k))
I follow Bajari et al. and form the sample objective function as:
(26) Qn(θSS) =1nk
nk∑k=1
Ig(x(k),θSS)>0g(x(k), θSS)2
Using the estimated value of incumbency, I can estimate the distribution of sunk entrycosts using the fact that the entry policy satisfies:
(27) Pr(χ∗jt = 1|S) = Pr(ψjt ≤ V Ij (S, ))
The left hand side of the equation is the firm’s entry policy, estimated in the first stage. Itherefore estimate the distribution by simulating the value function for K different statesand estimating the mean and standard deviation of Ψj by:
(28) (γE0j , γ
E1 , γ
E2 , σ
E) = θE = arg minθE
K−1K∑
n=1
(χ∗j (Sn)−Ψ(V Ij (Sn); θE))2
Capacity adjustment costs are identified by comparing the capacity policies to the mar-ginal value of capacity, recovered in the first stage. The estimator asks: Which set ofparameters minimize the implied amount of money left on the table, where money on thetable is the difference between the marginal value of capacity and the marginal cost ofcapacity. American adjusts capacity more often and more quickly than its rivals, despitemore persistent profitability states. Under the assumption proportional fixed costs are thesame across firms, this implies the marginal costs and the curvature of the cost functionrequired to rationalize American’s capacity behavior are lower than its rivals. In practi-cal terms identification is achieved through appropriate choices of alternative policies forsimulation. I choose alternatives by randomly perturbing the coefficients of the first stagecapacity estimates to generate policies that respond more quickly or more sluggishly tochanges in the marginal profitability of capacity.
Fixed costs are identified by comparing a firm’s exit policy to the overall variable prof-itability of remaining in the market. Here, the amount of money left on the table is thevalue of the outside option for a firm that chooses to continue, normalized to zero, or thevalue of staying in the market for a firm that chooses to exit. Identification of fixed costsis weak due to a small number of exit observations. For American the problem is worse.Since American never exits, its fixed costs are not identified without the assumed paramet-
31
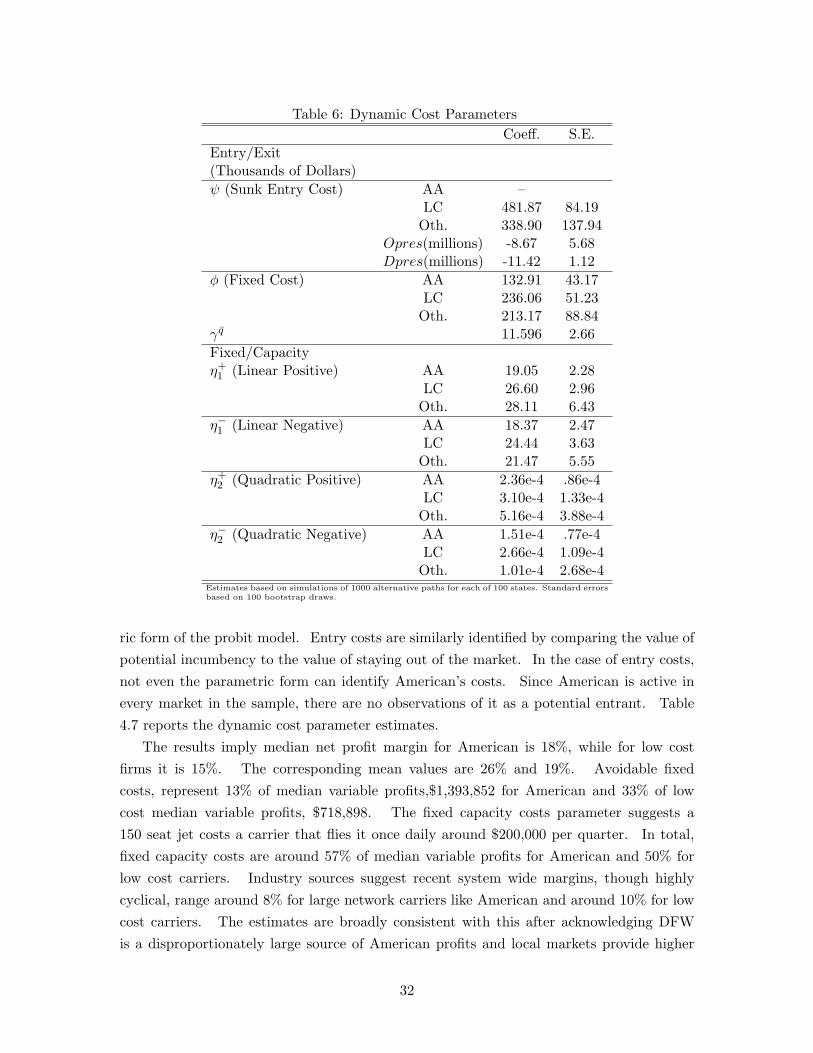
Table 6: Dynamic Cost ParametersCoeff. S.E.
Entry/Exit(Thousands of Dollars)ψ (Sunk Entry Cost) AA –
LC 481.87 84.19Oth. 338.90 137.94
Opres(millions) -8.67 5.68Dpres(millions) -11.42 1.12
φ (Fixed Cost) AA 132.91 43.17LC 236.06 51.23Oth. 213.17 88.84
γ q 11.596 2.66Fixed/Capacityη+1 (Linear Positive) AA 19.05 2.28
LC 26.60 2.96Oth. 28.11 6.43
η−1 (Linear Negative) AA 18.37 2.47LC 24.44 3.63Oth. 21.47 5.55
η+2 (Quadratic Positive) AA 2.36e-4 .86e-4
LC 3.10e-4 1.33e-4Oth. 5.16e-4 3.88e-4
η−2 (Quadratic Negative) AA 1.51e-4 .77e-4LC 2.66e-4 1.09e-4Oth. 1.01e-4 2.68e-4
Estimates based on simulations of 1000 alternative paths for each of 100 states. Standard errorsbased on 100 bootstrap draws.
ric form of the probit model. Entry costs are similarly identified by comparing the value ofpotential incumbency to the value of staying out of the market. In the case of entry costs,not even the parametric form can identify American’s costs. Since American is active inevery market in the sample, there are no observations of it as a potential entrant. Table4.7 reports the dynamic cost parameter estimates.
The results imply median net profit margin for American is 18%, while for low costfirms it is 15%. The corresponding mean values are 26% and 19%. Avoidable fixedcosts, represent 13% of median variable profits,$1,393,852 for American and 33% of lowcost median variable profits, $718,898. The fixed capacity costs parameter suggests a150 seat jet costs a carrier that flies it once daily around $200,000 per quarter. In total,fixed capacity costs are around 57% of median variable profits for American and 50% forlow cost carriers. Industry sources suggest recent system wide margins, though highlycyclical, range around 8% for large network carriers like American and around 10% for lowcost carriers. The estimates are broadly consistent with this after acknowledging DFWis a disproportionately large source of American profits and local markets provide higher
32
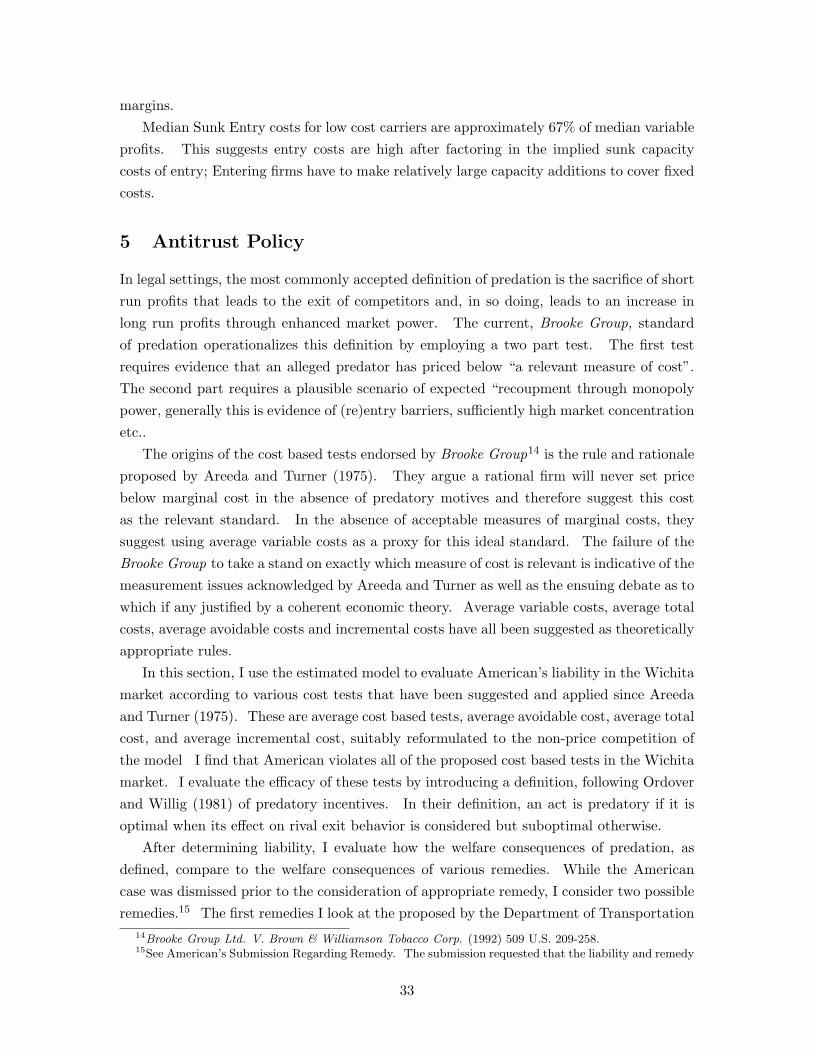
margins.Median Sunk Entry costs for low cost carriers are approximately 67% of median variable
profits. This suggests entry costs are high after factoring in the implied sunk capacitycosts of entry; Entering firms have to make relatively large capacity additions to cover fixedcosts.
5 Antitrust Policy
In legal settings, the most commonly accepted definition of predation is the sacrifice of shortrun profits that leads to the exit of competitors and, in so doing, leads to an increase inlong run profits through enhanced market power. The current, Brooke Group, standardof predation operationalizes this definition by employing a two part test. The first testrequires evidence that an alleged predator has priced below “a relevant measure of cost”.The second part requires a plausible scenario of expected “recoupment through monopolypower, generally this is evidence of (re)entry barriers, sufficiently high market concentrationetc..
The origins of the cost based tests endorsed by Brooke Group14 is the rule and rationaleproposed by Areeda and Turner (1975). They argue a rational firm will never set pricebelow marginal cost in the absence of predatory motives and therefore suggest this costas the relevant standard. In the absence of acceptable measures of marginal costs, theysuggest using average variable costs as a proxy for this ideal standard. The failure of theBrooke Group to take a stand on exactly which measure of cost is relevant is indicative of themeasurement issues acknowledged by Areeda and Turner as well as the ensuing debate as towhich if any justified by a coherent economic theory. Average variable costs, average totalcosts, average avoidable costs and incremental costs have all been suggested as theoreticallyappropriate rules.
In this section, I use the estimated model to evaluate American’s liability in the Wichitamarket according to various cost tests that have been suggested and applied since Areedaand Turner (1975). These are average cost based tests, average avoidable cost, average totalcost, and average incremental cost, suitably reformulated to the non-price competition ofthe model I find that American violates all of the proposed cost based tests in the Wichitamarket. I evaluate the efficacy of these tests by introducing a definition, following Ordoverand Willig (1981) of predatory incentives. In their definition, an act is predatory if it isoptimal when its effect on rival exit behavior is considered but suboptimal otherwise.
After determining liability, I evaluate how the welfare consequences of predation, asdefined, compare to the welfare consequences of various remedies. While the Americancase was dismissed prior to the consideration of appropriate remedy, I consider two possibleremedies.15 The first remedies I look at the proposed by the Department of Transportation
14Brooke Group Ltd. V. Brown & Williamson Tobacco Corp. (1992) 509 U.S. 209-258.15See American’s Submission Regarding Remedy. The submission requested that the liability and remedy
33
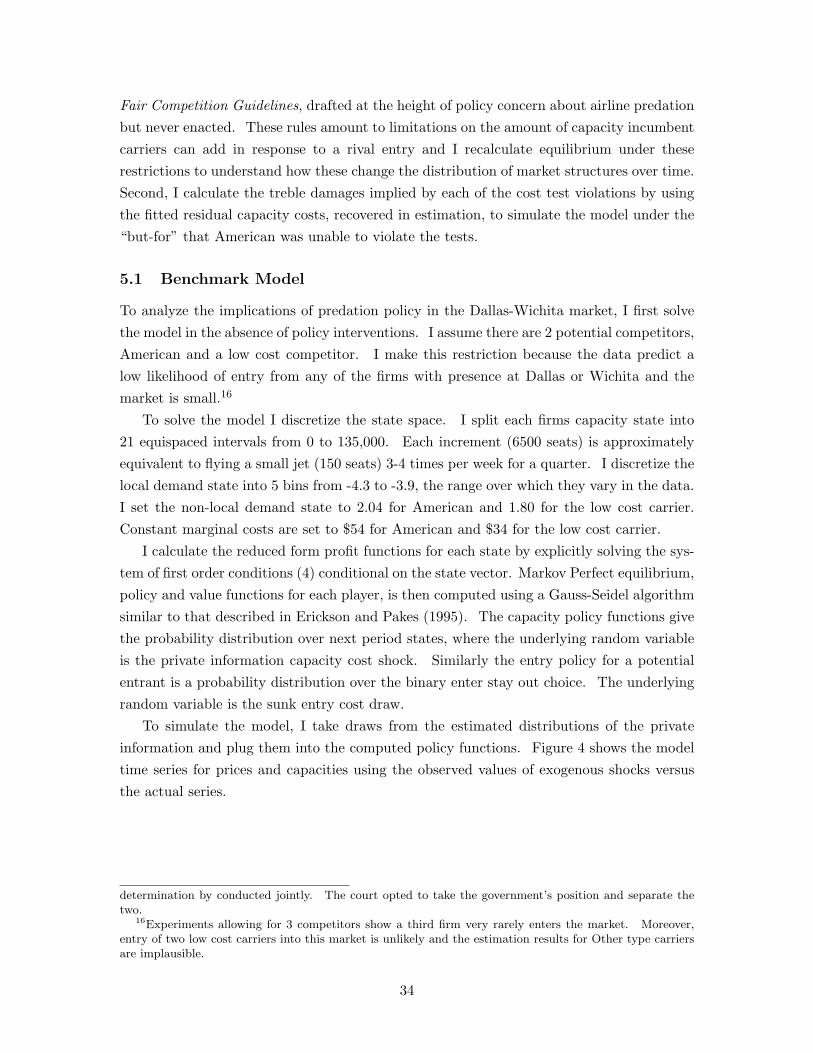
Fair Competition Guidelines, drafted at the height of policy concern about airline predationbut never enacted. These rules amount to limitations on the amount of capacity incumbentcarriers can add in response to a rival entry and I recalculate equilibrium under theserestrictions to understand how these change the distribution of market structures over time.Second, I calculate the treble damages implied by each of the cost test violations by usingthe fitted residual capacity costs, recovered in estimation, to simulate the model under the“but-for” that American was unable to violate the tests.
5.1 Benchmark Model
To analyze the implications of predation policy in the Dallas-Wichita market, I first solvethe model in the absence of policy interventions. I assume there are 2 potential competitors,American and a low cost competitor. I make this restriction because the data predict alow likelihood of entry from any of the firms with presence at Dallas or Wichita and themarket is small.16
To solve the model I discretize the state space. I split each firms capacity state into21 equispaced intervals from 0 to 135,000. Each increment (6500 seats) is approximatelyequivalent to flying a small jet (150 seats) 3-4 times per week for a quarter. I discretize thelocal demand state into 5 bins from -4.3 to -3.9, the range over which they vary in the data.I set the non-local demand state to 2.04 for American and 1.80 for the low cost carrier.Constant marginal costs are set to $54 for American and $34 for the low cost carrier.
I calculate the reduced form profit functions for each state by explicitly solving the sys-tem of first order conditions (4) conditional on the state vector. Markov Perfect equilibrium,policy and value functions for each player, is then computed using a Gauss-Seidel algorithmsimilar to that described in Erickson and Pakes (1995). The capacity policy functions givethe probability distribution over next period states, where the underlying random variableis the private information capacity cost shock. Similarly the entry policy for a potentialentrant is a probability distribution over the binary enter stay out choice. The underlyingrandom variable is the sunk entry cost draw.
To simulate the model, I take draws from the estimated distributions of the privateinformation and plug them into the computed policy functions. Figure 4 shows the modeltime series for prices and capacities using the observed values of exogenous shocks versusthe actual series.
determination by conducted jointly. The court opted to take the government’s position and separate thetwo.
16Experiments allowing for 3 competitors show a third firm very rarely enters the market. Moreover,entry of two low cost carriers into this market is unlikely and the estimation results for Other type carriersare implausible.
34
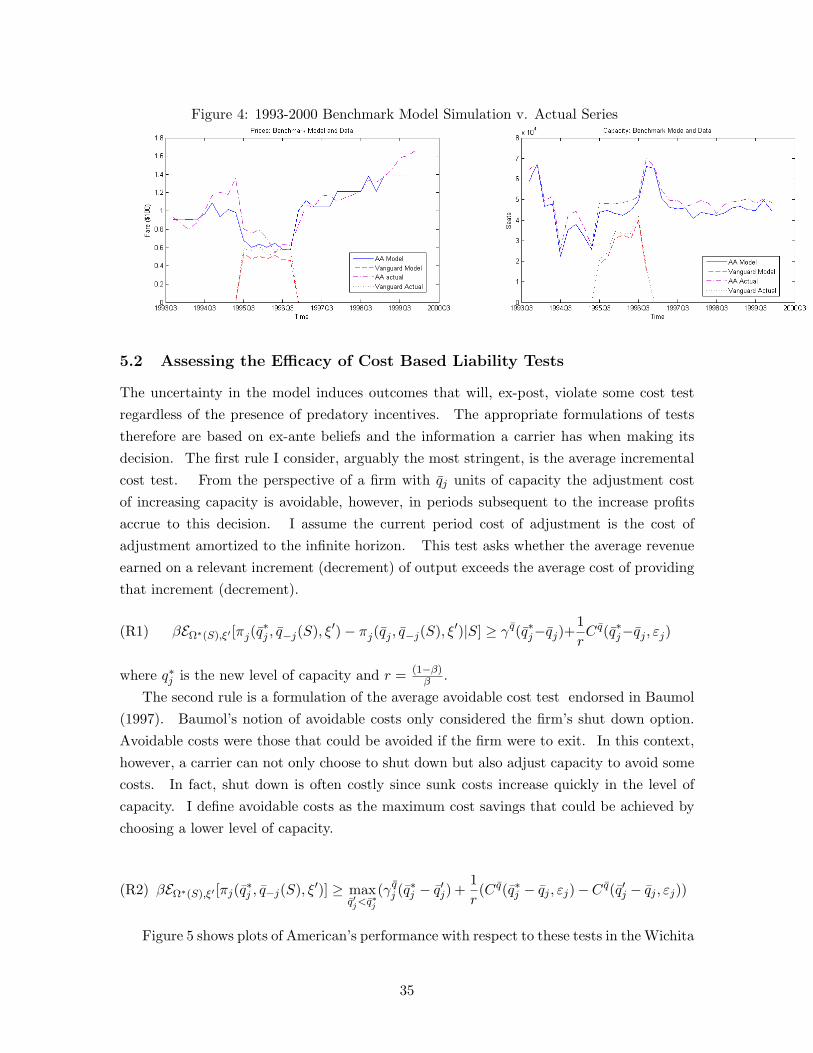
Figure 4: 1993-2000 Benchmark Model Simulation v. Actual Series
5.2 Assessing the Efficacy of Cost Based Liability Tests
The uncertainty in the model induces outcomes that will, ex-post, violate some cost testregardless of the presence of predatory incentives. The appropriate formulations of teststherefore are based on ex-ante beliefs and the information a carrier has when making itsdecision. The first rule I consider, arguably the most stringent, is the average incrementalcost test. From the perspective of a firm with qj units of capacity the adjustment costof increasing capacity is avoidable, however, in periods subsequent to the increase profitsaccrue to this decision. I assume the current period cost of adjustment is the cost ofadjustment amortized to the infinite horizon. This test asks whether the average revenueearned on a relevant increment (decrement) of output exceeds the average cost of providingthat increment (decrement).
(R1) βEΩ∗(S),ξ′ [πj(q∗j , q−j(S), ξ′)− πj(qj , q−j(S), ξ′)|S] ≥ γ q(q∗j−qj)+
1rC q(q∗j−qj , εj)
where q∗j is the new level of capacity and r = (1−β)β .
The second rule is a formulation of the average avoidable cost test endorsed in Baumol(1997). Baumol’s notion of avoidable costs only considered the firm’s shut down option.Avoidable costs were those that could be avoided if the firm were to exit. In this context,however, a carrier can not only choose to shut down but also adjust capacity to avoid somecosts. In fact, shut down is often costly since sunk costs increase quickly in the level ofcapacity. I define avoidable costs as the maximum cost savings that could be achieved bychoosing a lower level of capacity.
(R2) βEΩ∗(S),ξ′ [πj(q∗j , q−j(S), ξ′)] ≥ maxq′j<q∗j
(γ qj (q
∗j − q′j) +
1r(C q(q∗j − qj , εj)−C q(q′j − qj , εj))
Figure 5 shows plots of American’s performance with respect to these tests in the Wichita
35
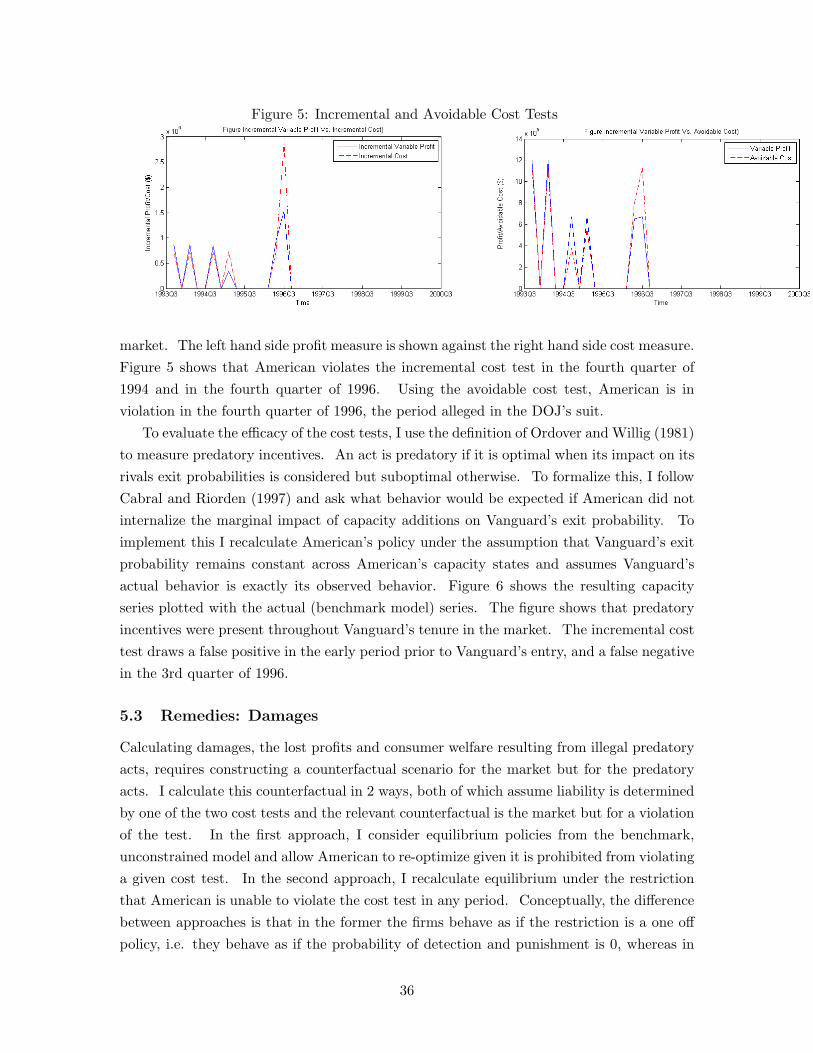
Figure 5: Incremental and Avoidable Cost Tests
market. The left hand side profit measure is shown against the right hand side cost measure.Figure 5 shows that American violates the incremental cost test in the fourth quarter of1994 and in the fourth quarter of 1996. Using the avoidable cost test, American is inviolation in the fourth quarter of 1996, the period alleged in the DOJ’s suit.
To evaluate the efficacy of the cost tests, I use the definition of Ordover and Willig (1981)to measure predatory incentives. An act is predatory if it is optimal when its impact on itsrivals exit probabilities is considered but suboptimal otherwise. To formalize this, I followCabral and Riorden (1997) and ask what behavior would be expected if American did notinternalize the marginal impact of capacity additions on Vanguard’s exit probability. Toimplement this I recalculate American’s policy under the assumption that Vanguard’s exitprobability remains constant across American’s capacity states and assumes Vanguard’sactual behavior is exactly its observed behavior. Figure 6 shows the resulting capacityseries plotted with the actual (benchmark model) series. The figure shows that predatoryincentives were present throughout Vanguard’s tenure in the market. The incremental costtest draws a false positive in the early period prior to Vanguard’s entry, and a false negativein the 3rd quarter of 1996.
5.3 Remedies: Damages
Calculating damages, the lost profits and consumer welfare resulting from illegal predatoryacts, requires constructing a counterfactual scenario for the market but for the predatoryacts. I calculate this counterfactual in 2 ways, both of which assume liability is determinedby one of the two cost tests and the relevant counterfactual is the market but for a violationof the test. In the first approach, I consider equilibrium policies from the benchmark,unconstrained model and allow American to re-optimize given it is prohibited from violatinga given cost test. In the second approach, I recalculate equilibrium under the restrictionthat American is unable to violate the cost test in any period. Conceptually, the differencebetween approaches is that in the former the firms behave as if the restriction is a one offpolicy, i.e. they behave as if the probability of detection and punishment is 0, whereas in
36
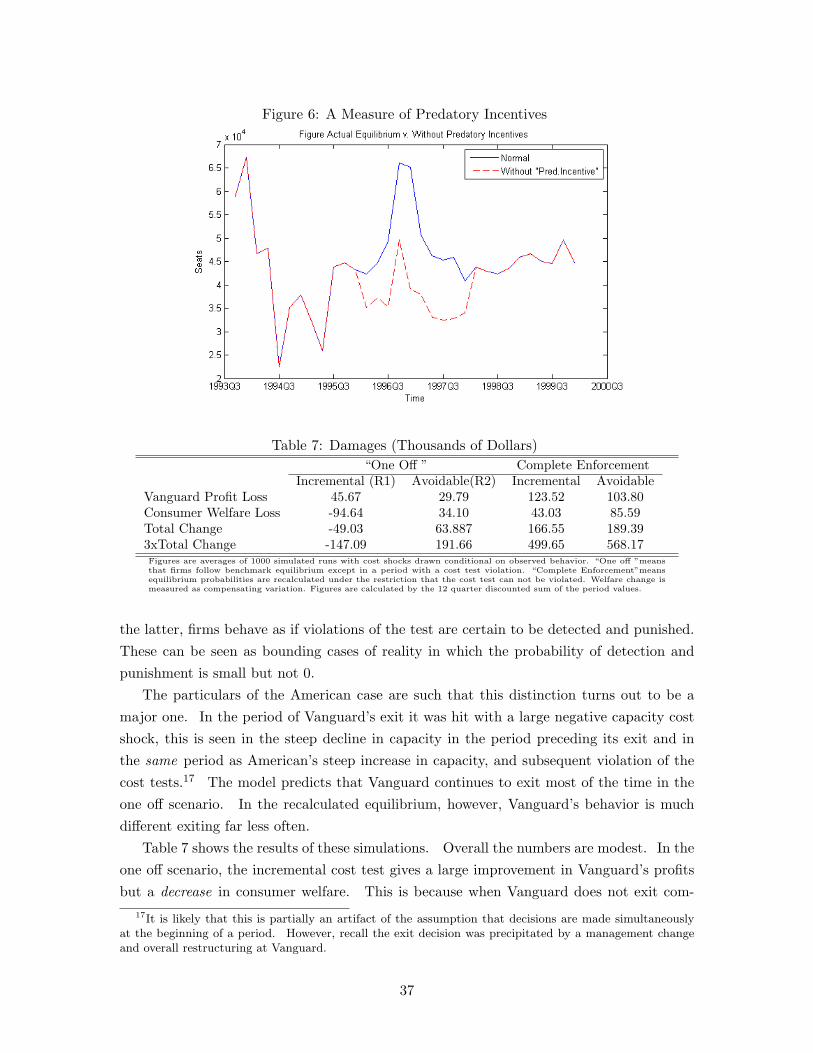
Figure 6: A Measure of Predatory Incentives
Table 7: Damages (Thousands of Dollars)“One Off ” Complete Enforcement
Incremental (R1) Avoidable(R2) Incremental AvoidableVanguard Profit Loss 45.67 29.79 123.52 103.80Consumer Welfare Loss -94.64 34.10 43.03 85.59Total Change -49.03 63.887 166.55 189.393xTotal Change -147.09 191.66 499.65 568.17Figures are averages of 1000 simulated runs with cost shocks drawn conditional on observed behavior. “One off ”meansthat firms follow benchmark equilibrium except in a period with a cost test violation. “Complete Enforcement”meansequilibrium probabilities are recalculated under the restriction that the cost test can not be violated. Welfare change ismeasured as compensating variation. Figures are calculated by the 12 quarter discounted sum of the period values.
the latter, firms behave as if violations of the test are certain to be detected and punished.These can be seen as bounding cases of reality in which the probability of detection andpunishment is small but not 0.
The particulars of the American case are such that this distinction turns out to be amajor one. In the period of Vanguard’s exit it was hit with a large negative capacity costshock, this is seen in the steep decline in capacity in the period preceding its exit and inthe same period as American’s steep increase in capacity, and subsequent violation of thecost tests.17 The model predicts that Vanguard continues to exit most of the time in theone off scenario. In the recalculated equilibrium, however, Vanguard’s behavior is muchdifferent exiting far less often.
Table 7 shows the results of these simulations. Overall the numbers are modest. In theone off scenario, the incremental cost test gives a large improvement in Vanguard’s profitsbut a decrease in consumer welfare. This is because when Vanguard does not exit com-
17It is likely that this is partially an artifact of the assumption that decisions are made simultaneouslyat the beginning of a period. However, recall the exit decision was precipitated by a management changeand overall restructuring at Vanguard.
37

petition among the firms is quite dull. Vanguard’s exit probability is not affected enoughto offset the negative welfare impact under the rule in the cases where Vanguard continuesto exit. Vanguard’s exit policy is materially affected under the complete enforcement sce-nario. The difference in the damages figures highlights the subtleties of constructing anappropriate counterfactual.
5.4 Remedies: “Fair Competition Guidelines”
During the early 1990s entry and growth of the low cost segment was particularly rapid. By1995, they had, together, achieved a 20 percent share of the market.18 In the second halfof the 1990s, however, this growth began to slow, leading policy makers and the customerswho had benefited from the steeply falling fares to look for reasons why. One popularanswer to the question was predatory responses to low cost entry by big incumbents.
From late 1993 to late 1999 there were over 30 complaints of exclusionary, predatoryconduct filed by low cost carriers and investigated by the Department of Transportation.The problem was considered severe enough that in April of 1998 the Department of Trans-portation circulated a draft of proposed “Fair Competition Guidelines” for the industry,stating:
“We have concluded that unfair exclusionary practices have been a key reasonthat competition from new low fair carriers has not been able to penetrateconcentrated hubs.”19
The FCG addressed what was perceived to be the typical “predatory” pattern: 1) A lowcost carrier enters a non-stop hub route of a dominant incumbent 2) The incumbent respondswith steep fare cuts andcapacity increases. The Guidelines would initiate enforcementproceedings whenever one of 3 rules, stated in terms of the incumbent’s passenger andcapacity response relative to the entrant’s capacity, was violated:
1. The major carrier adds capacity and sells such a large number of seats at very lowfares that the ensuing self-diversion of revenue results in lower local revenue thanwould a reasonable alternative response,
2. The number of local passengers that the major carrier carries at the new entrant’slow fares (or at similar fares that are substantially below the major carrier’s previousfares) exceeds the new entrant’s total seat capacity, resulting, through self-diversion,in lower local revenue than would a reasonable alternative response, or
3. The number of local passengers that the major carrier carries at the new entrant’slow fares (or at similar fares that are substantially below the major carrier’s previous
18Market share is defined as share of passenger revenue miles from Bureau of Transportation StatisticsT1 database.
19DOT Fair Competition Guidelines proposal p.7
38
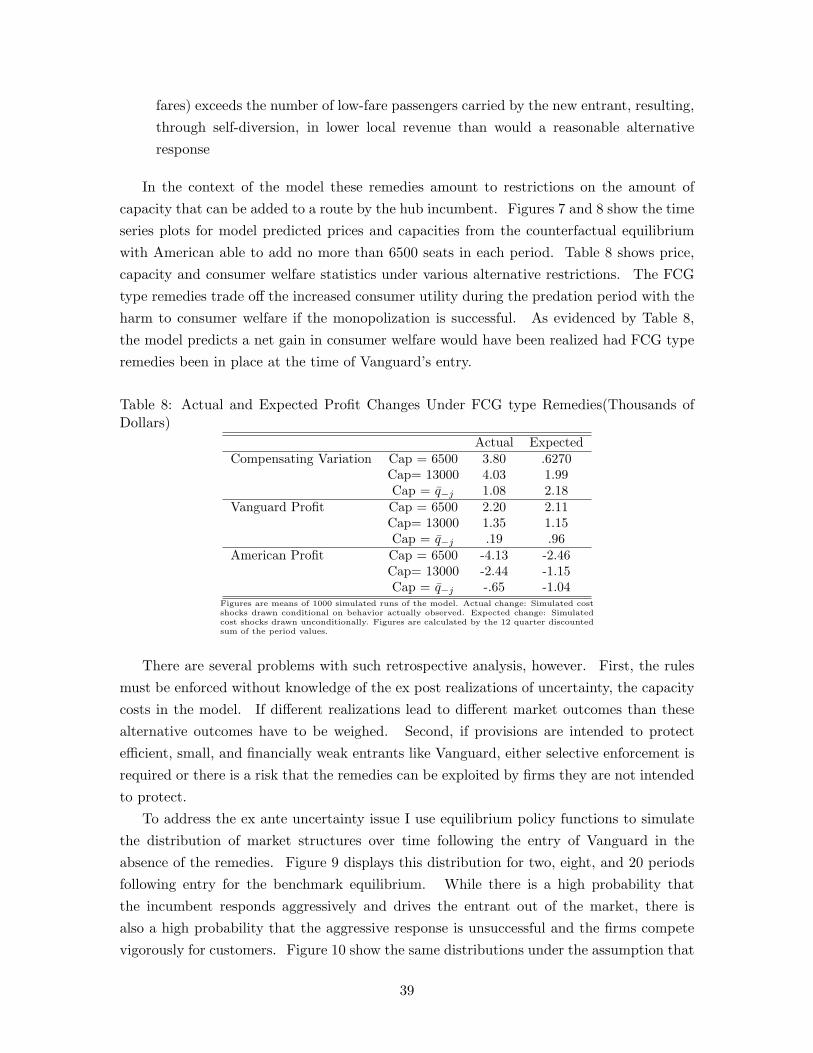
fares) exceeds the number of low-fare passengers carried by the new entrant, resulting,through self-diversion, in lower local revenue than would a reasonable alternativeresponse
In the context of the model these remedies amount to restrictions on the amount ofcapacity that can be added to a route by the hub incumbent. Figures 7 and 8 show the timeseries plots for model predicted prices and capacities from the counterfactual equilibriumwith American able to add no more than 6500 seats in each period. Table 8 shows price,capacity and consumer welfare statistics under various alternative restrictions. The FCGtype remedies trade off the increased consumer utility during the predation period with theharm to consumer welfare if the monopolization is successful. As evidenced by Table 8,the model predicts a net gain in consumer welfare would have been realized had FCG typeremedies been in place at the time of Vanguard’s entry.
Table 8: Actual and Expected Profit Changes Under FCG type Remedies(Thousands ofDollars)
Actual ExpectedCompensating Variation Cap = 6500 3.80 .6270
Cap= 13000 4.03 1.99Cap = q−j 1.08 2.18
Vanguard Profit Cap = 6500 2.20 2.11Cap= 13000 1.35 1.15Cap = q−j .19 .96
American Profit Cap = 6500 -4.13 -2.46Cap= 13000 -2.44 -1.15Cap = q−j -.65 -1.04
Figures are means of 1000 simulated runs of the model. Actual change: Simulated costshocks drawn conditional on behavior actually observed. Expected change: Simulatedcost shocks drawn unconditionally. Figures are calculated by the 12 quarter discountedsum of the period values.
There are several problems with such retrospective analysis, however. First, the rulesmust be enforced without knowledge of the ex post realizations of uncertainty, the capacitycosts in the model. If different realizations lead to different market outcomes than thesealternative outcomes have to be weighed. Second, if provisions are intended to protectefficient, small, and financially weak entrants like Vanguard, either selective enforcement isrequired or there is a risk that the remedies can be exploited by firms they are not intendedto protect.
To address the ex ante uncertainty issue I use equilibrium policy functions to simulatethe distribution of market structures over time following the entry of Vanguard in theabsence of the remedies. Figure 9 displays this distribution for two, eight, and 20 periodsfollowing entry for the benchmark equilibrium. While there is a high probability thatthe incumbent responds aggressively and drives the entrant out of the market, there isalso a high probability that the aggressive response is unsuccessful and the firms competevigorously for customers. Figure 10 show the same distributions under the assumption that
39
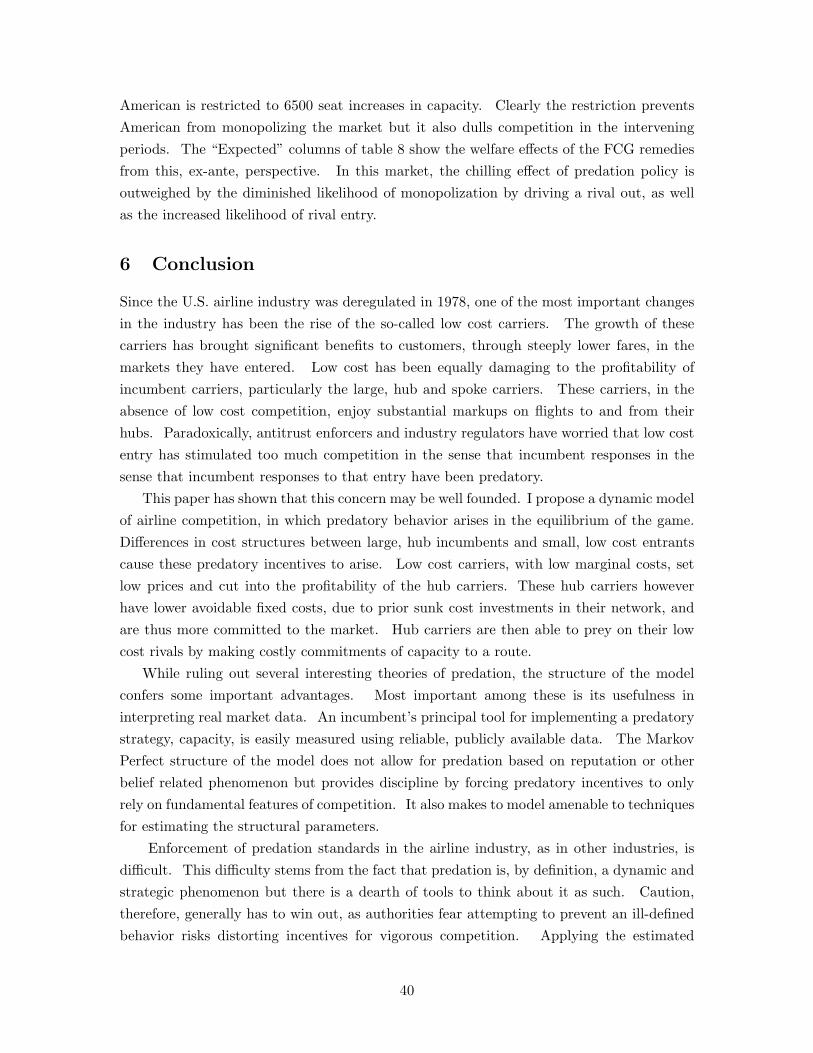
American is restricted to 6500 seat increases in capacity. Clearly the restriction preventsAmerican from monopolizing the market but it also dulls competition in the interveningperiods. The “Expected” columns of table 8 show the welfare effects of the FCG remediesfrom this, ex-ante, perspective. In this market, the chilling effect of predation policy isoutweighed by the diminished likelihood of monopolization by driving a rival out, as wellas the increased likelihood of rival entry.
6 Conclusion
Since the U.S. airline industry was deregulated in 1978, one of the most important changesin the industry has been the rise of the so-called low cost carriers. The growth of thesecarriers has brought significant benefits to customers, through steeply lower fares, in themarkets they have entered. Low cost has been equally damaging to the profitability ofincumbent carriers, particularly the large, hub and spoke carriers. These carriers, in theabsence of low cost competition, enjoy substantial markups on flights to and from theirhubs. Paradoxically, antitrust enforcers and industry regulators have worried that low costentry has stimulated too much competition in the sense that incumbent responses in thesense that incumbent responses to that entry have been predatory.
This paper has shown that this concern may be well founded. I propose a dynamic modelof airline competition, in which predatory behavior arises in the equilibrium of the game.Differences in cost structures between large, hub incumbents and small, low cost entrantscause these predatory incentives to arise. Low cost carriers, with low marginal costs, setlow prices and cut into the profitability of the hub carriers. These hub carriers howeverhave lower avoidable fixed costs, due to prior sunk cost investments in their network, andare thus more committed to the market. Hub carriers are then able to prey on their lowcost rivals by making costly commitments of capacity to a route.
While ruling out several interesting theories of predation, the structure of the modelconfers some important advantages. Most important among these is its usefulness ininterpreting real market data. An incumbent’s principal tool for implementing a predatorystrategy, capacity, is easily measured using reliable, publicly available data. The MarkovPerfect structure of the model does not allow for predation based on reputation or otherbelief related phenomenon but provides discipline by forcing predatory incentives to onlyrely on fundamental features of competition. It also makes to model amenable to techniquesfor estimating the structural parameters.
Enforcement of predation standards in the airline industry, as in other industries, isdifficult. This difficulty stems from the fact that predation is, by definition, a dynamic andstrategic phenomenon but there is a dearth of tools to think about it as such. Caution,therefore, generally has to win out, as authorities fear attempting to prevent an ill-definedbehavior risks distorting incentives for vigorous competition. Applying the estimated
40
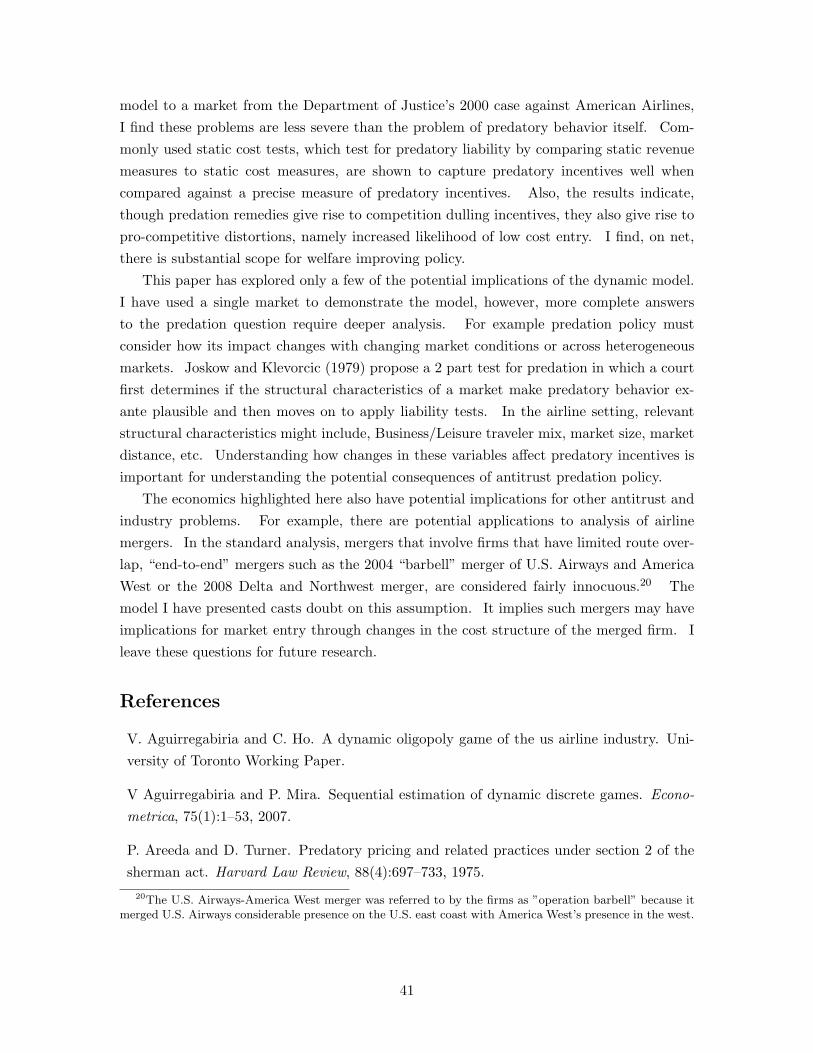
model to a market from the Department of Justice’s 2000 case against American Airlines,I find these problems are less severe than the problem of predatory behavior itself. Com-monly used static cost tests, which test for predatory liability by comparing static revenuemeasures to static cost measures, are shown to capture predatory incentives well whencompared against a precise measure of predatory incentives. Also, the results indicate,though predation remedies give rise to competition dulling incentives, they also give rise topro-competitive distortions, namely increased likelihood of low cost entry. I find, on net,there is substantial scope for welfare improving policy.
This paper has explored only a few of the potential implications of the dynamic model.I have used a single market to demonstrate the model, however, more complete answersto the predation question require deeper analysis. For example predation policy mustconsider how its impact changes with changing market conditions or across heterogeneousmarkets. Joskow and Klevorcic (1979) propose a 2 part test for predation in which a courtfirst determines if the structural characteristics of a market make predatory behavior ex-ante plausible and then moves on to apply liability tests. In the airline setting, relevantstructural characteristics might include, Business/Leisure traveler mix, market size, marketdistance, etc. Understanding how changes in these variables affect predatory incentives isimportant for understanding the potential consequences of antitrust predation policy.
The economics highlighted here also have potential implications for other antitrust andindustry problems. For example, there are potential applications to analysis of airlinemergers. In the standard analysis, mergers that involve firms that have limited route over-lap, “end-to-end” mergers such as the 2004 “barbell” merger of U.S. Airways and AmericaWest or the 2008 Delta and Northwest merger, are considered fairly innocuous.20 Themodel I have presented casts doubt on this assumption. It implies such mergers may haveimplications for market entry through changes in the cost structure of the merged firm. Ileave these questions for future research.
References
V. Aguirregabiria and C. Ho. A dynamic oligopoly game of the us airline industry. Uni-versity of Toronto Working Paper.
V Aguirregabiria and P. Mira. Sequential estimation of dynamic discrete games. Econo-metrica, 75(1):1–53, 2007.
P. Areeda and D. Turner. Predatory pricing and related practices under section 2 of thesherman act. Harvard Law Review, 88(4):697–733, 1975.
20The U.S. Airways-America West merger was referred to by the firms as ”operation barbell” because itmerged U.S. Airways considerable presence on the U.S. east coast with America West’s presence in the west.
41
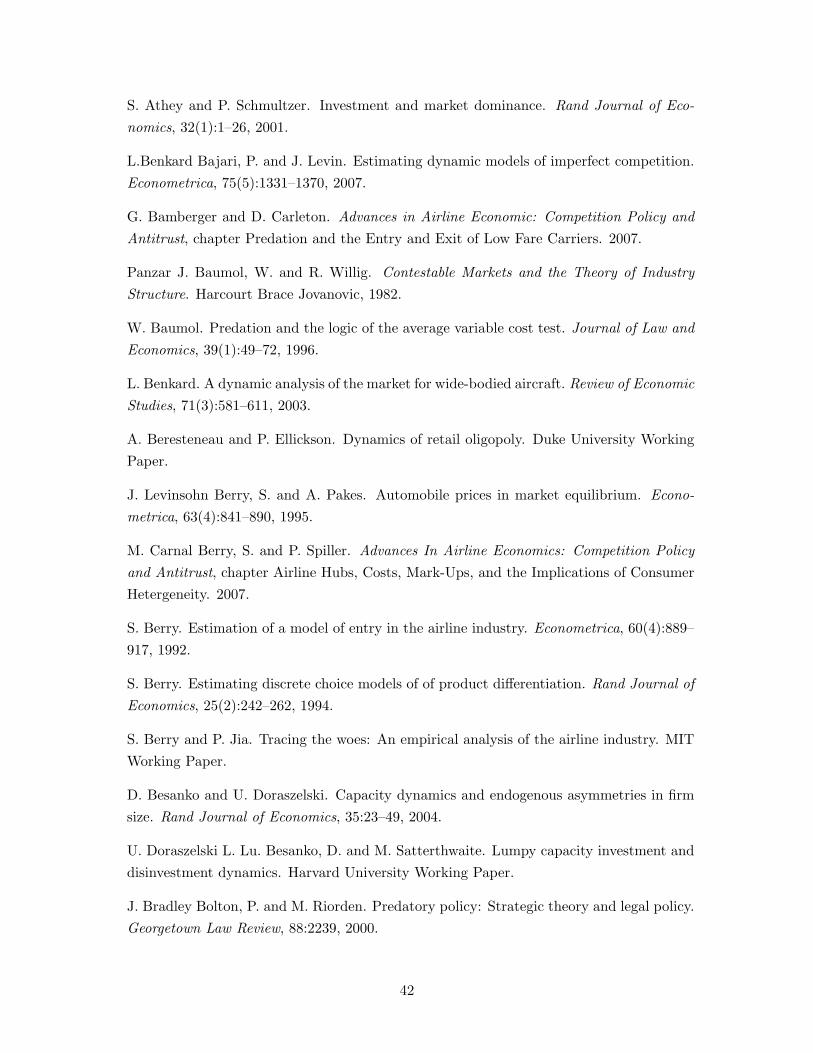
S. Athey and P. Schmultzer. Investment and market dominance. Rand Journal of Eco-nomics, 32(1):1–26, 2001.
L.Benkard Bajari, P. and J. Levin. Estimating dynamic models of imperfect competition.Econometrica, 75(5):1331–1370, 2007.
G. Bamberger and D. Carleton. Advances in Airline Economic: Competition Policy andAntitrust, chapter Predation and the Entry and Exit of Low Fare Carriers. 2007.
Panzar J. Baumol, W. and R. Willig. Contestable Markets and the Theory of IndustryStructure. Harcourt Brace Jovanovic, 1982.
W. Baumol. Predation and the logic of the average variable cost test. Journal of Law andEconomics, 39(1):49–72, 1996.
L. Benkard. A dynamic analysis of the market for wide-bodied aircraft. Review of EconomicStudies, 71(3):581–611, 2003.
A. Beresteneau and P. Ellickson. Dynamics of retail oligopoly. Duke University WorkingPaper.
J. Levinsohn Berry, S. and A. Pakes. Automobile prices in market equilibrium. Econo-metrica, 63(4):841–890, 1995.
M. Carnal Berry, S. and P. Spiller. Advances In Airline Economics: Competition Policyand Antitrust, chapter Airline Hubs, Costs, Mark-Ups, and the Implications of ConsumerHetergeneity. 2007.
S. Berry. Estimation of a model of entry in the airline industry. Econometrica, 60(4):889–917, 1992.
S. Berry. Estimating discrete choice models of of product differentiation. Rand Journal ofEconomics, 25(2):242–262, 1994.
S. Berry and P. Jia. Tracing the woes: An empirical analysis of the airline industry. MITWorking Paper.
D. Besanko and U. Doraszelski. Capacity dynamics and endogenous asymmetries in firmsize. Rand Journal of Economics, 35:23–49, 2004.
U. Doraszelski L. Lu. Besanko, D. and M. Satterthwaite. Lumpy capacity investment anddisinvestment dynamics. Harvard University Working Paper.
J. Bradley Bolton, P. and M. Riorden. Predatory policy: Strategic theory and legal policy.Georgetown Law Review, 88:2239, 2000.
42

S. Borenstein. Hubs and high fares: Dominance and market power in the u.s. airlineindustry. Rand Journal of Economics, 20:344–365, 1989.
S. Borenstein. Airline mergers, airport dominance, and market power. American EconomicReview Papers and Proceedings, 80:400–404, 1990.
S. Borenstein. The evolution of airline competition. Journal of Economic Perspectives,6(2):45–73, 1992.
S. Borenstein and N. Rose. How do airline markets work...or do they? regulatory reformin the airline industry. NBER Working Paper.
S. Borenstein and N. Rose. Competition and price dispersion in the u.s. airline industry.Journal of Political Economy, 102:653–683, 1994.
R. Bork. The Antitrust Paradox. Basic Books, 1978.
L. Cabral and M. Riorden. The learning curve, market dominance, and predatory pricing.Econometrica, 62(5):1115–1140, 1994.
F. Ciliberto and J. Williams. Limited access to airport facilities and market power in theairline industry. University of Virginia Working Paper, 2008.
A. Collard-Wexler. Demand fluctuations and plant turnover in the ready made concreteindustry. Econometrica, Forthcoming, 2009.
Genesove D. and W. Mullin. Predation and its rate of return: The sugar industry, 1887-1914. Rand Journal of Economics, 37(1):47–69, 2006.
U. Doraszelski and A. Pakes. A framework for applied dynamic analysis in io. HarvardUniversity Working Paper, 2006.
A. Edlin and J. Farrell. The Antitrust Revolution: Economics, Competition, and Policy,chapter The American Airlines Case: A Chance to Clarify Predation Policy, pages 502–521.2004.
K. Elzinga and D. Mills. Predatory pricing and strategic theory. Georgetown Law Journal,89:2475, 2001.
R. Erickson and A. Pakes. Markov perfect industry dynamic: A framework for empiricalwork. Review of Economic Studies, 62:53–82, 1995.
D. Fudenberg and J. Tirole. A signal jamming theory of predation. Rand Journal ofEconomics, 17(4):366–377, 1986.
G. Gowrisankaran and R. Town. Dynamic equilibrium in the hospital industry. Journalof Economics and Management Strategy, 123(4):1611–1633, 2008.
43
T. Holmes. The diffusion of wal-mart and the economics of density. Forthcoming Econo-metrica, 2008.
H. Ito and D. Lee. Incumbent responses to lower cost entry: Evindence from the u.s.airline industry. Working Paper, 2004.
P. Joskow and A. Klevorcic. A framework for analyzing predatory pricing policy. YaleLaw Journal, 1979.
P. Milgrom and D. Roberts. Predation, reputation, and entry deterrence. Journal ofEconomic Theory, 27:280–312, 1982.
J. Ordover and G. Saloner. Handbook of Industrial Organization, chapter Predation, Mo-nopolization, and Antitrust, pages 537–596. North Holland, 1989.
J. Ordover and R. Willig. An economic definition of predation: Pricing and productinnovation. Yale Law Journal, 91:8–53, 1981.
Bolton P. and J. Scharfstein. A theory of predation based on agency problems in contract-ing. American Economic Review, 80(1):93–107, 1990.
A. Pakes and P. McGuire. Computing markov-perfect nash equilibria: Numerical impli-cations of a dynamic differentiated product model. Econometrica, 25:555–589, 1996.
A. Pakes and P. McGuire. Stochastic algorithms, symmetric markov perfect equilbriumand the ’curse’ of dimensionality. Econometrica, 69(5):1261–1281, 2001.
M. Pesendorfer and P. Schmidt-Dengler. Asymtotic least squares estimators for dynamicgames. Review of Economic Studies, 75:901–928, 2008.
T. Pulvino. Do asset fire sales exist. Journal of Finance, 53(3), 1998.
S. Ryan. The costs of environmental regulation in a concentrated industry. MIT WorkingPaper, 2006.
G. Saloner. Predation, mergers, and incomplete information. Rand Journal of Economics,18(2):165–187, 1987.
F. Scott-Morton. Entry and predation: Brittish shipping cartels 1979-1929. Journal ofEconomics and Management Strategy, 6(4):679–724, 1997.
44
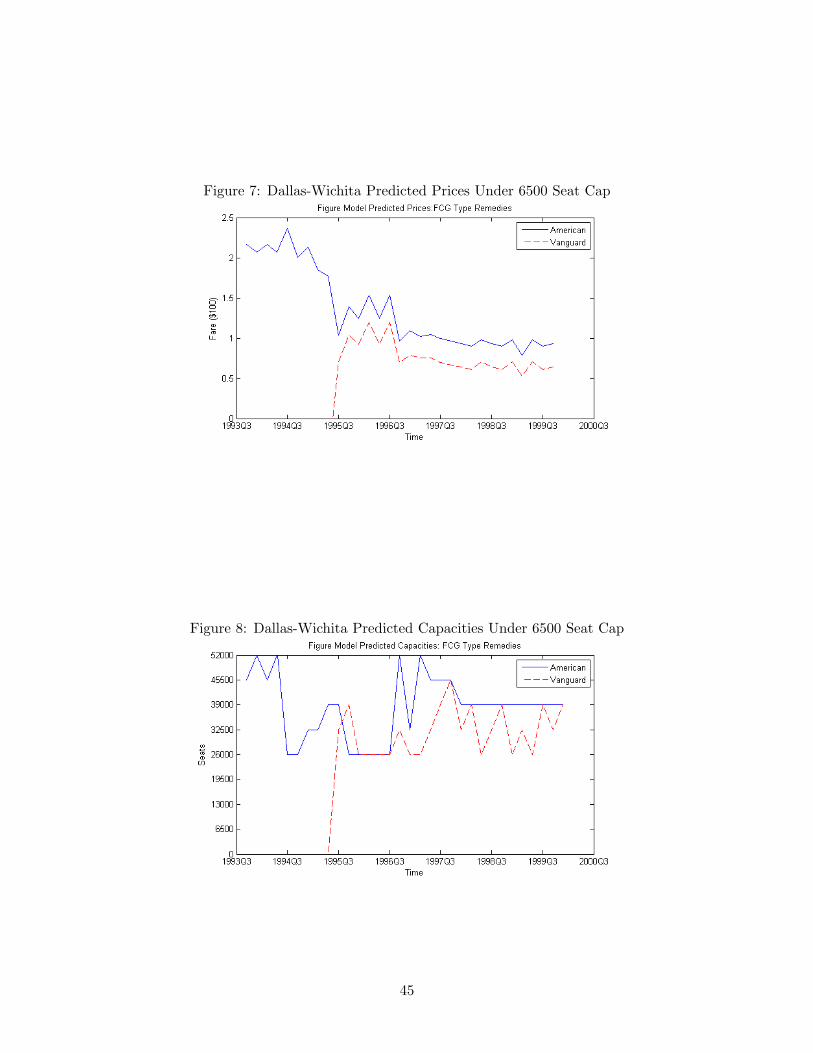
Figure 7: Dallas-Wichita Predicted Prices Under 6500 Seat Cap
Figure 8: Dallas-Wichita Predicted Capacities Under 6500 Seat Cap
45
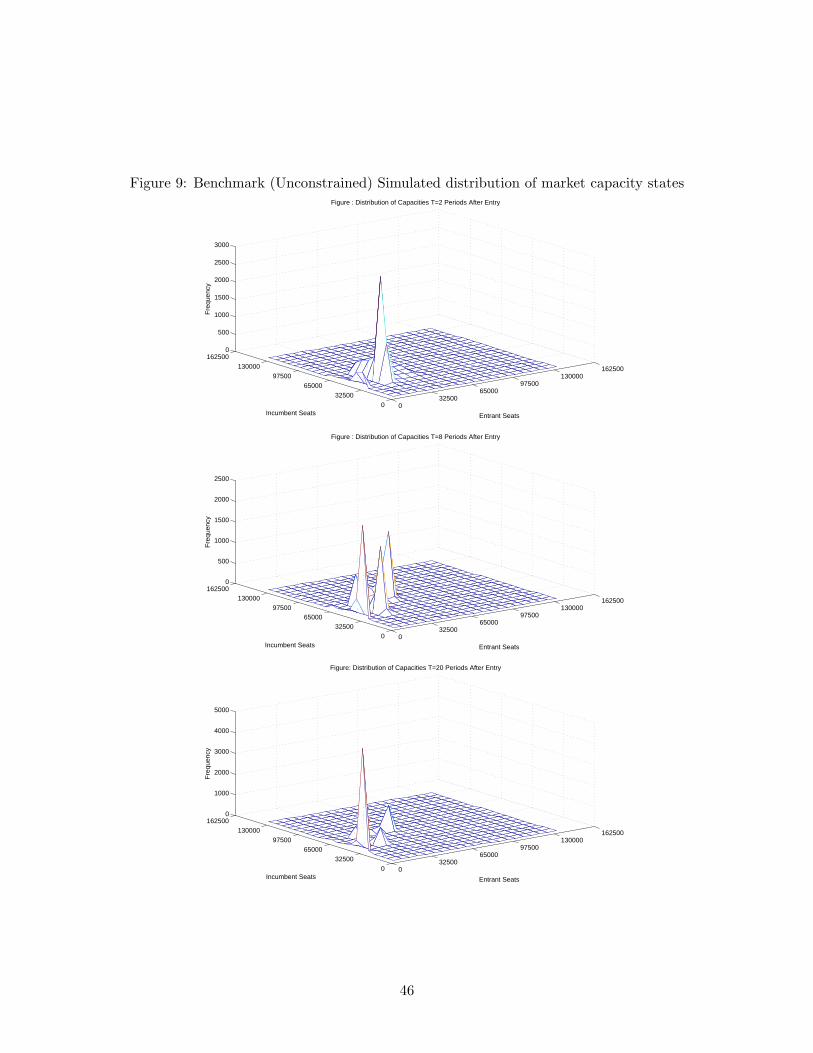
Figure 9: Benchmark (Unconstrained) Simulated distribution of market capacity states
032500
6500097500
130000162500
032500
6500097500
130000
1625000
500
1000
1500
2000
2500
3000
Entrant Seats
Figure : Distribution of Capacities T=2 Periods After Entry
Incumbent Seats
Fre
quen
cy
032500
6500097500
130000162500
032500
6500097500
130000162500
0
500
1000
1500
2000
2500
Entrant Seats
Figure : Distribution of Capacities T=8 Periods After Entry
Incumbent Seats
Fre
quen
cy
032500
6500097500
130000162500
032500
6500097500
130000162500
0
1000
2000
3000
4000
5000
Entrant Seats
Figure: Distribution of Capacities T=20 Periods After Entry
Incumbent Seats
Fre
quen
cy
46
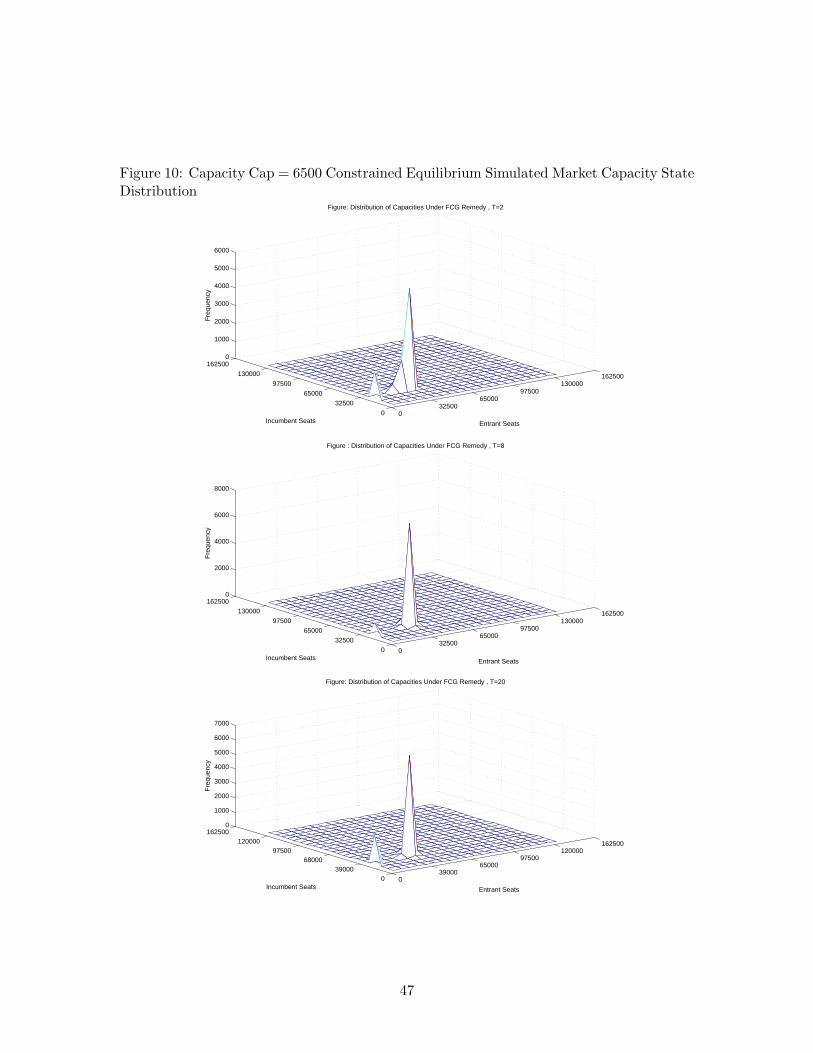
Figure 10: Capacity Cap = 6500 Constrained Equilibrium Simulated Market Capacity StateDistribution
032500
6500097500
130000162500
0
32500
65000
97500
130000
1625000
1000
2000
3000
4000
5000
6000
Entrant Seats
Figure: Distribution of Capacities Under FCG Remedy , T=2
Incumbent Seats
Fre
quen
cy
032500
6500097500
130000162500
0
32500
65000
97500
130000
1625000
2000
4000
6000
8000
Entrant Seats
Figure : Distribution of Capacities Under FCG Remedy , T=8
Incumbent Seats
Fre
quen
cy
039000
6500097500
120000162500
039000
6800097500
120000162500
0
1000
2000
3000
4000
5000
6000
7000
Entrant Seats
Figure: Distribution of Capacities Under FCG Remedy , T=20
Incumbent Seats
Fre
quen
cy
47
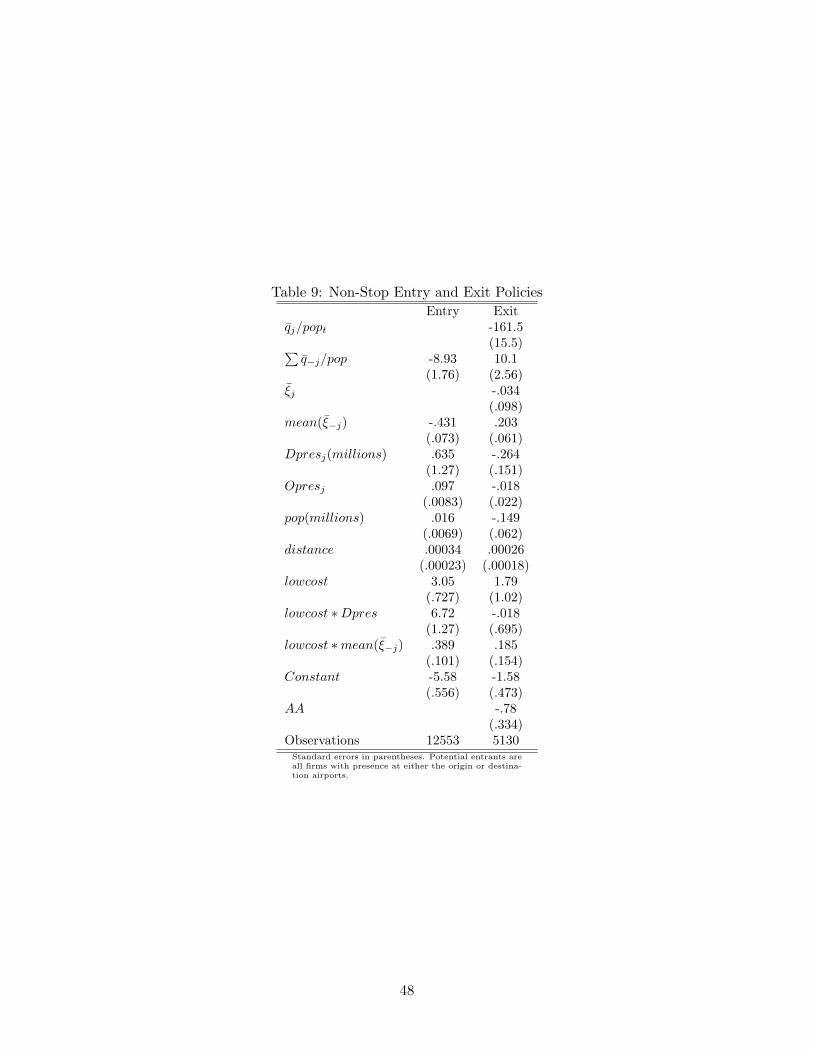
Table 9: Non-Stop Entry and Exit PoliciesEntry Exit
qj/popt -161.5(15.5)∑
q−j/pop -8.93 10.1(1.76) (2.56)
ξj -.034(.098)
mean(ξ−j) -.431 .203(.073) (.061)
Dpresj(millions) .635 -.264(1.27) (.151)
Opresj .097 -.018(.0083) (.022)
pop(millions) .016 -.149(.0069) (.062)
distance .00034 .00026(.00023) (.00018)
lowcost 3.05 1.79(.727) (1.02)
lowcost ∗Dpres 6.72 -.018(1.27) (.695)
lowcost ∗mean(ξ−j) .389 .185(.101) (.154)
Constant -5.58 -1.58(.556) (.473)
AA -.78(.334)
Observations 12553 5130Standard errors in parentheses. Potential entrants areall firms with presence at either the origin or destina-tion airports.
48
Related Documents