Journal of Applied Ecology 2004 41, 1117–1128 © 2004 British Ecological Society Blackwell Publishing, Ltd. Predation by great skuas at a large Shetland seabird colony STEPHEN C. VOTIER*, STUART BEARHOP†, NORMAN RATCLIFFE‡, RICHARD A. PHILLIPS§ and ROBERT W. FURNESS* *Institute of Biomedical and Life Sciences, Graham Kerr Building, University of Glasgow, Glasgow G12 8QQ, UK, †School of Biology and Biochemistry, Queens University, Belfast, Medical Biology Centre, 97 Lisburn Road, Belfast BT9 7BL, UK, ‡ Royal Society for the Protection of Birds, The Lodge, Sandy, Bedfordshire SG19 2NR, UK, and § British Antarctic Survey, ‘Natural Environment Research Council’ High Cross, Madingley Road, Cambridge CB3 0ET, UK Summary 1. Skuas are top predators in marine ecosystems and may have detrimental effects on seabird communities they prey upon. However, predation rates are poorly understood and poorly quantified. Using a bio-energetics model we estimate seabird predation by great skuas, Stercorarius skua, at a large UK colony (Hermaness, Shetland). We inves- tigate the influence of dietary specialization and fishery management on predation and explore the effect of experimental removal of specialist bird predators. 2. Great skuas at Hermaness required 491·5 × 10 6 kJ and 546·6 × 10 6 kJ of energy in each of two breeding seasons. Breeding skuas fell into one of two groups: a small proportion (5%) of specialist bird predators or the vast majority (95%) that fed opportunistically on birds or specialized on fishery discards. During 1999, great skuas consumed ≈80 000 kg of fish, which increased to over 90 000 kg in 2001. About 13 000 seabirds were consumed by great skuas each year, with 26–29% being consumed by specialist bird predators. 3. Although it is difficult to assess, great skuas appear to be having a negative impact on seabird populations. Altering model inputs to test differing scenarios revealed that reductions in fishery discards would result in increased seabird predation rates. How- ever, proposed changes in fishery management over the period of the study did not reduce discarding rates, which instead increased. 4. Synthesis and applications. The use of a bioenergetics model reveals that great skua predation may negatively affect seabird populations. Availability of fishery discards is an important factor influencing seabird predation rates, but predicting the effect of changes in fishery management may be difficult in the short term. Specialist bird predators consume large quantities of seabird prey, but this is less significant at the population level. Although experimental removal of specialist bird predators may reduce predation at a minimal loss of skuas, it is unclear whether conspecifics may replace them and retain high rates of predation. Key-words: bioenergetics, discards, seabird conservation, Stercorarius skua. Journal of Applied Ecology (2004) 41, 1117–1128 Introduction Predatory birds may act on prey populations in com- plex ways, depending upon the predators’ foraging behaviour. In cases where predators are specialized, prey density may drive predator density (Nielsen 1999). The ability of generalist predators to sustain themselves on alternative food may result in predators driving prey population density (Korpimäki 1994; Redpath & Thirgood 1999). Predatory gulls Larus and skuas Stercorarius are dietary generalists, able to exploit a wide range of prey and food made available by human activities. In marine ecosystems their diets consist predominantly of small shoaling fish, larger fish stolen by kleptoparasitism or scavenged at fishing vessels, invertebrates, or bird eggs, chicks and adults (Phillips, Thompson & Hamer 1999; Oro 2003). Among the generalist population, some birds show individual specializations, including feeding almost exclusively on other birds (Spear 1993; Votier et al . 2004a). Correspondence: S. C. Votier, Institute of Biomedical and Life Sciences, Graham Kerr Building, University of Glasgow, Glasgow G12 8QQ, UK (e-mail: [email protected]).

Welcome message from author
This document is posted to help you gain knowledge. Please leave a comment to let me know what you think about it! Share it to your friends and learn new things together.
Transcript

Journal of Applied Ecology
2004
41
, 1117–1128
© 2004 British Ecological Society
Blackwell Publishing, Ltd.
Predation by great skuas at a large Shetland seabird colony
STEPHEN C. VOTIER*, STUART BEARHOP†, NORMAN RATCLIFFE‡, RICHARD A. PHILLIPS§ and ROBERT W. FURNESS*
*
Institute of Biomedical and Life Sciences, Graham Kerr Building, University of Glasgow, Glasgow G12 8QQ, UK,
†
School of Biology and Biochemistry, Queens University, Belfast, Medical Biology Centre, 97 Lisburn Road, Belfast BT9 7BL, UK,
‡
Royal Society for the Protection of Birds, The Lodge, Sandy, Bedfordshire SG19 2NR, UK, and
§
British Antarctic Survey, ‘Natural Environment Research Council’ High Cross, Madingley Road, Cambridge CB3 0ET, UK
Summary
1.
Skuas are top predators in marine ecosystems and may have detrimental effects onseabird communities they prey upon. However, predation rates are poorly understoodand poorly quantified. Using a bio-energetics model we estimate seabird predation bygreat skuas,
Stercorarius skua
, at a large UK colony (Hermaness, Shetland). We inves-tigate the influence of dietary specialization and fishery management on predation andexplore the effect of experimental removal of specialist bird predators.
2.
Great skuas at Hermaness required 491·5
×
10
6
kJ and 546·6
×
10
6
kJ of energy in eachof two breeding seasons. Breeding skuas fell into one of two groups: a small proportion(5%) of specialist bird predators or the vast majority (95%) that fed opportunistically onbirds or specialized on fishery discards. During 1999, great skuas consumed
≈
80 000 kg offish, which increased to over 90 000 kg in 2001. About 13 000 seabirds were consumedby great skuas each year, with 26–29% being consumed by specialist bird predators.
3.
Although it is difficult to assess, great skuas appear to be having a negative impacton seabird populations. Altering model inputs to test differing scenarios revealed thatreductions in fishery discards would result in increased seabird predation rates. How-ever, proposed changes in fishery management over the period of the study did notreduce discarding rates, which instead increased.
4.
Synthesis and applications
. The use of a bioenergetics model reveals that great skuapredation may negatively affect seabird populations. Availability of fishery discards isan important factor influencing seabird predation rates, but predicting the effect ofchanges in fishery management may be difficult in the short term. Specialist bird predatorsconsume large quantities of seabird prey, but this is less significant at the populationlevel. Although experimental removal of specialist bird predators may reduce predationat a minimal loss of skuas, it is unclear whether conspecifics may replace them and retainhigh rates of predation.
Key-words
: bioenergetics, discards, seabird conservation,
Stercorarius skua
.
Journal of Applied Ecology
(2004)
41
, 1117–1128
Introduction
Predatory birds may act on prey populations in com-plex ways, depending upon the predators’ foragingbehaviour. In cases where predators are specialized,prey density may drive predator density (Nielsen 1999).The ability of generalist predators to sustain themselveson alternative food may result in predators driving prey
population density (Korpimäki 1994; Redpath &Thirgood 1999).
Predatory gulls
Larus
and skuas
Stercorarius
aredietary generalists, able to exploit a wide range of preyand food made available by human activities. In marineecosystems their diets consist predominantly of smallshoaling fish, larger fish stolen by kleptoparasitism orscavenged at fishing vessels, invertebrates, or bird eggs,chicks and adults (Phillips, Thompson & Hamer 1999;Oro 2003). Among the generalist population, some birdsshow individual specializations, including feeding almostexclusively on other birds (Spear 1993; Votier
et al
. 2004a).
Correspondence: S. C. Votier, Institute of Biomedical and LifeSciences, Graham Kerr Building, University of Glasgow,Glasgow G12 8QQ, UK (e-mail: [email protected]).

1118
S. C. Votier
et al.
© 2004 British Ecological Society,
Journal of Applied Ecology
,
41
,1117–1128
During periods of declining marine food availability,skuas and large gulls switch to feeding upon other birds(Oro 2003; Votier
et al
. 2004b). A combination of thesefactors, along with historically large populations, isincreasing concern that large gulls and skuas may beadversely affecting seabird populations around the world,through competition for breeding sites (Quintana &Yorio 1998) and predation pressure (Phillips
et al
. 1999;Votier
et al
. 2004b).The great skua,
Stercorarius skua
(Brünnich), breedsonly in the north Atlantic with approximately 60% ofthe world’s population nesting in the UK (Mitchell
et al
. 2004). The population has grown dramaticallyin the past 100 years, probably as a consequence ofreduced persecution and an increase in the abundanceof food in the form of fishery discards (Mitchell
et al
.2004). In addition to fishery discards, UK great skuasfeed on sandeels,
Ammodytes marinus
(Raitt), inverte-brates and extensively on other seabirds (Phillips
et al
.1997a; Votier
et al
. 2003). At St Kilda, Outer Hebrides,great skuas (
≈
230 pairs) were estimated to consume40 800 seabirds in a breeding season (Phillips
et al
. 1999).In Shetland, great skuas appear to feed more exten-sively on sandeels, but a decline in sandeel availabilityhas resulted in an increased reliance on discards andseabird prey (Hamer, Furness & Caldow 1991). In certainparts of Shetland, dramatic declines in populations ofblack-legged kittiwakes,
Rissa tridactyla
(Linnaeus), arein part a result of predation by great skuas (Heubeck,Mellor & Harvey 1997; Oro & Furness 2002). Certainpairs of skuas develop specialized foraging behaviour,feeding almost exclusively on birds (Votier
et al
. 2004a).Proposals to cut quotas for several whitefish species inthe North Sea and the introduction of square mesh(escape) panels in the top of cod ends are likely to resultin a reduction in the quantity of fish discarded in theNorth Sea (Reeves & Furness 2002). This shortfall indiscard availability may be met by great skuas increas-ing the amount of seabird prey they consume (Votier
et al
. 2004b).In this study we use a bio-energetics model described
by Phillips
et al
. (1999) for great skuas at St Kilda, toestimate the amount of prey consumed by great skuasattending the third largest colony in the UK, at Hermaness,Shetland. Using this model, together with sensitivityanalysis and scenario testing, we: (1) quantify the impactof seabird predation by great skuas at Hermaness;(2) compare great skua predation rates in a periodbefore (1999) and after (2001) changes in fishing policy(a reduction in quotas and change in net structure),expected to reduce the availability of discards; (3) testthe generality of the St Kilda model to a differentUK great skua colony; (4) use recent advances inunderstanding pellet production by great skuas to testhow their estimation may influence model outputs;(5) investigate the role of individual foraging specialistsat the population level; and (6) test what effect hypo-thetical removal of specialist bird predators might havefor seabird conservation.
Methods
This study was conducted at Hermaness National NatureReserve, Unst, Shetland (60
°
50
′
N, 0
°
52
′
W) during thebreeding seasons of 1999 and 2001. Hermaness holdsthe third largest concentration of great skuas in Britain,with an estimated 659 pairs in 1999 and 726 pairs in2001 (this study).
Hermaness is a special protection area (SPA) forbreeding seabirds with approximately; 28 000 northernfulmars,
Fulmarus glacialis
(Linnaeus), 32 000 northerngannets,
Morus bassanus
(Linnaeus), 100 Europeanshags,
Phalacrocorax aristotelis
(Linnaeus), 1600 black-legged kittiwakes, 15 000 common guillemots,
Uria aalge
(Pontoppidan), 1500 razorbills,
Alca torda
(Linnaeus),30–80 000 Atlantic puffins,
Fratercula arctica
(Linnaeus),and small numbers of European storm petrels,
Hydrobatespelagicus
(Linnaeus) (Mitchell
et al
. 2004; Pennington
et al
. 2004).
We estimated the energetic requirements of breedingadults, non-breeding adults and chicks throughout theperiod of colony attendance using life-history para-meters (Table 1). A food assimilation efficiency of 0·76,calculated from captive great skuas fed sandeels andwhiting,
Merlangius merlangus
(Linnaeus) (Hilton,Furness & Houston 2000), was used throughout.
To estimate the number of great skuas breeding atHermaness in 1999 we used a value of 631 apparentlyoccupied territories (AOTs) (Lewis 1997), increased by4·5% to 659 on the basis of a change in skua breedingnumbers from study plots mapped in detail over bothyears. A complete census in 2001 (this study) estimated726 AOTs. Non-breeding birds attend the colony atspecific ‘club-sites’ (Klomp & Furness 1992), where wemade counts throughout the breeding season. Thesecounts comprised the mean of eight visits to the threelargest clubs plus 30 birds counted at one small clubvisited only once. Reproductive parameters (mean clutchsize, mean brood size at 20 days and mean brood size atfledging) were obtained from a sample of 109 pairs in1999 and 98 pairs in 2001.
Previous studies have revealed differences in the for-aging strategies of great skuas breeding at Hermaness(Votier
et al
. 2004a). Regurgitated pellets revealed thatthe proportion of bird prey in the diet of breeding pairsformed a bimodal distribution, the majority of birdsproduced no, or very few, bird remains with a smallnumber producing almost exclusively bird pellets. Fur-thermore, many specialist bird predators defended afeeding territory within a seabird colony. Based on thisdistinction we categorized pairs with either >70% ofbird pellets in the diet or defending a feeding territorywithin a seabird colony as specialist bird predators (see

1119
Predation by great skuas
© 2004 British Ecological Society,
Journal of Applied Ecology
,
41
,1117–1128
Votier
et al
. 2004a for more details). The remainder ofthe population comprised a small number of birds feedingas generalists and many more feeding almost exclusivelyon fish. From hereon we combine these groups andrefer to them as fish specialists.
Using published values of basal metabolic rate (BMR)(Bryant & Furness 1995) and estimates for the costof performing specific activities as multiples of BMR(Caldow 1988), we calculated energy requirements ofbreeding adults in terms of field metabolic rate (FMR).Timed watches of a sample of breeding pairs (31 in1999 and 19 in 2001) were conducted between 04:00and 13:30 Greenwich Mean Time (GMT), which wasassumed to be representative of the daily activity.Observations included both bird specialists (7 in 1999and 4 in 2001) and fish specialists (24 in 1999 and 15 in2001). We estimated the relative proportion of timespent performing four specific activities – resting, gen-eral (preening, walking, bathing, long-calling), glidingflight and flapping flight (Table 2). Specialist birdpredators were observed foraging to estimate the pro-portion of time spent performing specific activities. To
estimate the proportion of time spent in flapping orgliding flight for great skuas foraging at sea, we assumedobservations of birds attending a single inshore fishingvessel in 1999 were representative of behaviour at sea.
The estimated FMR:BMR ratios were lower for birdspecialists than fish specialists, but consistent amongyears (Table 2). The values for fish specialists weresimilar to the 3·5 times BMR used by Phillips
et al
. (1999),which was the average estimated by Caldow (1988) forgreat skuas breeding on Foula, Shetland. Despite notincurring the costs of foraging for chicks, we make theassumption that non-breeders are probably less effi-cient foragers than breeders and therefore have similarenergetic requirements (following Cairns
et al
. 1990;Phillips
et al
. 1999). Therefore activity costs for non-breeders were assumed to be similar to those for breed-ing birds, excluding the costs of clutch production andmaintenance.
Energy required for clutch formation for each pair(
E
clf
in kJ) was derived from the equation:
E
clf
= Cls
×
M
egg
×
Cal
egg
×
(1/
E
syn
),
Table 1. Parameters used in bio-energetics model
1999 2001 Source
Breeding pairs 659 726 This studyNon-breeding birds 110 112 This studyPre-breeding period 30 days 30 days Phillips et al. 1999Incubation period 29 days 29 days Furness 1978Chick–rearing period 46·4 days 46·4 days This studyPost-fledging period 18 days 18 days Phillips et al. 1999Adult BMR 538 kJ day−1 538 kJ day−1 Bryant & Furness 1995Adult FMR:BMR ratio
Fish specialists 3·6 3·7 This study (see Table 2)Bird specialists 2·1 2·2 This study (see Table 2)
Mean clutch size 1·83 1·80 This studyMean brood size at 20 days 1·2 1·12 This studyMean breeding success 1·12 0·89 This studyMean fresh egg mass 96 g 96 g Furness 1978Mean egg energy density 6·45 kJ g−1 6·45 kJ g−1 Meathrel & Ryder 1987;
Meathrel, Ryder & Termaat 1987Egg synthesis efficiency 0·75 0·75 Ricklefs 1974, 1983Food assimilation efficiency 0·76 0·76 Hilton et al. 2000Mean chick fledging mass 1170 g 1170 g Phillips, Thompson & Hamer 1997b
Table 2. Daily field metabolic rate (FMR) of breeding adult great skuas calculated from time budget analysis of specific activities(Caldow 1988) during 1999 and 2001
ActivityFMR:BMR ratio
Percentage of time for bird-specialists
Percentage of time for fish-specialists
1999 2001 1999 2001
Resting/incubation 1·5 41·7 41·7 40·3 41·7General 1·97 36·8 38·8 37·5 37·8Gliding flight 3·1 20·8 17·6 5·5 2·6Flapping flight 12·65 0·6 1·7 16·67 17·93High speed flapping flight 26·7 0·1 0·2 0 0Mean FMR:BMR ratio for daily maintenance and activity 2·1 2·2 3·6 3·7

1120
S. C. Votier
et al.
© 2004 British Ecological Society,
Journal of Applied Ecology
,
41
,1117–1128
where Cls is mean clutch size,
M
egg
is mean fresh eggmass, Cal
egg
is average energy density of larid eggs in kJand
E
syn
is egg tissue synthesis efficiency (source refer-ences listed in Table 1).
There is increasing evidence that incubation is a costlypart of any avian breeding attempt (Thomson, Furness& Monaghan 1998). No data exist for great skua meta-bolic rate during incubation, but using data from fivespecies of seabird Tinbergen & Williams (2002) derivedthe equation FMR
INC
= 3·48BM
0·749
, where BM is adultseabird body mass. Since incubation duties are shared,we took the mean published body mass of male andfemale great skuas (Hamer 2001) as 1414 g, which pro-vides an FMR
INC
of 796·65 kJ day
−
1
, or 1·48BMR. Thisvalue was so close to the value of 1·5BMR for restingthat the model retained this estimate.
Energy requirement of chicks from hatching to fledg-ing was estimated from the equation ME
chicks
= 35·15
×
, where
M
C
is chick mass at hatching. Energydemands of each chick for the short period followingfledging and prior to departure from the colony wascalculated using the daily energy requirement of chicksat fledging vs. fledging mass (Drent, Klaassen & Zwaan1992).
A sensitivity analysis was performed on the energeticsmodel, by increasing the values used to parameterizethe model by 1% and also by introducing a range of likelyextremes for all parameters. We also tested the effect ofexperimental removal of specialist bird predators onenergetic requirements of the colony.
The diet of breeding adults was estimated on the basisof pellets collected from marked skua territories (109in 1999 and 98 in 2001) every 5–10 days from late May(incubation) to mid-August (fledging). Non-breederclub-sites were searched for pellets over the same timeperiod. Pellets were identified to the lowest possible taxonusing the categories in Votier
et al
. (2003) and wereremoved to prevent recounting. Pellets of bird prey wereidentified to species, based on feather colour and smell,or any hard parts (legs, skull or bill). It was difficult toidentify the pellets of adult auks (Alcidae) to a species,therefore we assumed that Atlantic puffins and commonguillemots (the only two species positively identified)occurred in similar proportions (but see Discussion).Otoliths in pellets of fish prey were identified usingHärkönen (1986), and measured to the nearest mm.
The proportions of the three main prey types (whitefish,bird and ‘other’) in the diet of chicks were calculatedusing regurgitates produced during handling or fromobserving adults feeding chicks. The relative proportionsof bird species were assumed to be the same as thosefound in pellets of adult breeders.
Using transects to sample skua territories for pelletsthroughout Hermaness, we estimated that around 5%of the population were feeding primarily on birds. The95% that fed mostly on fish, cast small numbers of
pellets containing bird remains. There was a relationshipbetween the proportion of bird prey in the diet and dis-tance to the nearest seabird colony (Spearman’s rank-order correlation
r
s
=
−
0·47,
P
< 0·001,
n
= 71), birdscloser to a seabird colony having more bird in theirdiet. Therefore we estimated the whole colony diet basedon two study areas, one adjacent to seabird colonies(making up 26% of the breeding population) and one inthe centre of the colony and therefore away from sea-bird colonies (making up the remaining 69% of thepopulation).
Contra
Phillips
et al
. (1999) we did not assume onemeal resulted in the production of one pellet. Pelletto meal ratios were obtained from Votier
et al
. (2001)and corrections applied accordingly. Pellets comprisingpasserines typically contained remains of a single bird soin this case we assumed one meal resulted in a single pellet.
From otoliths collected in pellets, 95% of the fish diet atHermaness consisted of whitefish: haddock
Melano-grammus aegelfinus
(Linnaeus), whiting, blue whiting,
Micromesistius poutassou
(Risso), and Norway pout,
Trisopterus esmarkii
(Nilsson). Otolith sizes indicatedthat haddock, whiting and blue whiting were all largefish (often greater than 100 g) and while Norway poutwere much smaller than this (mean of 23·6 g), pelletsof this species contained several otoliths. We usedthe average meal size of 100 g proposed by Furness &Hislop (1981) and mean energy content of 5·2 kJ g
−
1
of fresh mass for gadoid fish (Hislop, Harris & Smith1991).
There are various published values for the energeticcomposition of whole adult birds, but the value of10·9 kJ g
−
1
used by Phillips
et al
. (1999) was used here.Because of the high proportion of indigestible materialin birds we estimated that only around 65% of the freshbody mass was available as food.
Goose barnacle
Lepas
sp. energy content was calcu-lated assuming 40 g meal size and 1·9 kJ g
−
1
calorificcontent (Phillips
et al
. 1999).Rabbits
Oryctolagus cuniculus
(Linnaeus) have a meancalorific value of 6·24 kJ g
−
1
(derived from 4·95 kCal/gdry weight in Moors 1977) and we assumed a meal massof 100 g. While rabbits undoubtedly have a high pro-portion of indigestible material, we are not concernedwith the numbers consumed and therefore present onlythe calorific content per meal. A very small number ofsheep,
Ovis aries
(Linnaeus), pellets were present in thediet of great skuas, and these were assumed to have asimilar energetic value to rabbits.
Sotherland & Rahn (1987) estimated the caloriecontent of a typical avian egg as 29 kJ g
−
1
(dry weight).Eggs found in the diet of great skuas at Hermanessbelonged mostly to kittiwakes and terns, therefore eggmass was assumed to be 50 g (Cramp & Simmons 1983),which corresponds to 14·4 g dry weight, and 417·6 kJper egg.
MC1015⋅
1121
Predation by great skuas
© 2004 British Ecological Society, Journal of Applied Ecology, 41,1117–1128
Mass of all prey consumed
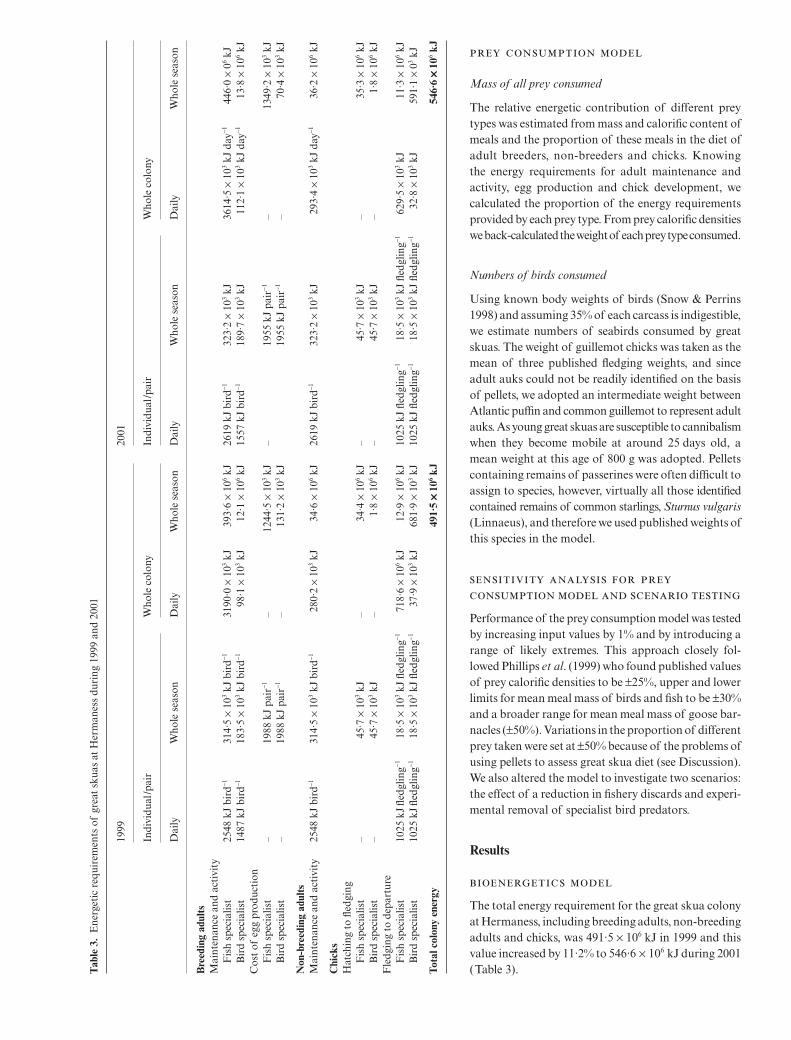
The relative energetic contribution of different preytypes was estimated from mass and calorific content ofmeals and the proportion of these meals in the diet ofadult breeders, non-breeders and chicks. Knowingthe energy requirements for adult maintenance andactivity, egg production and chick development, wecalculated the proportion of the energy requirementsprovided by each prey type. From prey calorific densitieswe back-calculated the weight of each prey type consumed.
Numbers of birds consumed
Using known body weights of birds (Snow & Perrins1998) and assuming 35% of each carcass is indigestible,we estimate numbers of seabirds consumed by greatskuas. The weight of guillemot chicks was taken as themean of three published fledging weights, and sinceadult auks could not be readily identified on the basisof pellets, we adopted an intermediate weight betweenAtlantic puffin and common guillemot to represent adultauks. As young great skuas are susceptible to cannibalismwhen they become mobile at around 25 days old, amean weight at this age of 800 g was adopted. Pelletscontaining remains of passerines were often difficult toassign to species, however, virtually all those identifiedcontained remains of common starlings, Sturnus vulgaris(Linnaeus), and therefore we used published weights ofthis species in the model.
Performance of the prey consumption model was testedby increasing input values by 1% and by introducing arange of likely extremes. This approach closely fol-lowed Phillips et al. (1999) who found published valuesof prey calorific densities to be ±25%, upper and lowerlimits for mean meal mass of birds and fish to be ±30%and a broader range for mean meal mass of goose bar-nacles (±50%). Variations in the proportion of differentprey taken were set at ±50% because of the problems ofusing pellets to assess great skua diet (see Discussion).We also altered the model to investigate two scenarios:the effect of a reduction in fishery discards and experi-mental removal of specialist bird predators.
Results
The total energy requirement for the great skua colonyat Hermaness, including breeding adults, non-breedingadults and chicks, was 491·5 × 106 kJ in 1999 and thisvalue increased by 11·2% to 546·6 × 106 kJ during 2001(Table 3).T
able
3.
Ene
rget
ic r
equi
rem
ents
of
grea
t sk
uas
at H
erm
anes
s du
ring
199
9 an
d 20
01
1999
2001
Indi
vidu
al/p
air
Who
le c
olon
y In
divi
dual
/pai
r W
hole
col
ony
Dai
lyW
hole
sea
son
Dai
lyW
hole
sea
son
Dai
lyW
hole
sea
son
Dai
lyW
hole
sea
son
Bre
edin
g ad
ults
Mai
nten
ance
and
act
ivit
yF
ish
spec
ialis
t 25
48 k
J bi
rd−1
314·
5 ×
103 k
J bi
rd−1
3190
·0 ×
103 k
J39
3·6
× 10
6 kJ
2619
kJ
bird
−132
3·2
× 10
3 kJ
3614
·5 ×
103 k
J da
y−144
6·0
× 06 k
JB
ird
spec
ialis
t 14
87 k
J bi
rd−1
183·
5 ×
103 k
J bi
rd−1
98·1
× 1
03 kJ
12·1
× 1
06 kJ
1557
kJ
bird
−118
9·7
× 10
3 kJ
112·
1 ×
103 k
J da
y−113
·8 ×
106 k
JC
ost
of e
gg p
rodu
ctio
nF
ish
spec
ialis
t –
1988
kJ
pair
−1–
1244
·5 ×
103 k
J–
1955
kJ
pair
−1–
1349
·2 ×
103 k
JB
ird
spec
ialis
t–
1988
kJ
pair
−1–
131·
2 ×
103 k
J19
55 k
J pa
ir−1
–70
·4 ×
103 k
J
Non
-bre
edin
g ad
ults
Mai
nten
ance
and
act
ivit
y25
48 k
J bi
rd−1
314·
5 ×
103 k
J bi
rd−1
280·
2 ×
103 k
J34
·6 ×
106 k
J26
19 k
J bi
rd−1
323·
2 ×
103 k
J29
3·4
× 10
3 kJ
day−1
36·2
× 1
06 kJ
Chi
cks
Hat
chin
g to
fled
ging
Fis
h sp
ecia
list
–45
·7 ×
103 k
J–
34·4
× 1
06 kJ
–45
·7 ×
103 k
J–
35·3
× 1
06 kJ
Bir
d sp
ecia
list
–45
·7 ×
103 k
J–
1·8
× 10
6 kJ
–45
·7 ×
103 k
J–
1·8
× 10
6 kJ
Fle
dgin
g to
dep
artu
reF
ish
spec
ialis
t10
25 k
J fle
dglin
g−118
·5 ×
103 k
J fle
dglin
g−171
8·6
× 10
6 kJ
12·9
× 1
06 kJ
1025
kJ
fledg
ling−1
18·5
× 1
03 kJ
fledg
ling−1
629·
5 ×
103 k
J11
·3 ×
106 k
JB
ird
spec
ialis
t10
25 k
J fle
dglin
g−118
·5 ×
103 k
J fle
dglin
g−137
·9 ×
103 k
J68
1·9
× 10
3 kJ
1025
kJ
fledg
ling−1
18·5
× 1
03 kJ
fledg
ling−1
32·8
× 1
03 kJ
591·
1 ×
03 kJ
Tota
l col
ony
ener
gy49
1·5
×××× 10
6 kJ
546·
6 ××××
106 k
J

1122S. C. Votier et al.
© 2004 British Ecological Society, Journal of Applied Ecology, 41,1117–1128
Following changes in parameter estimates, sensitivityanalysis for the energetic requirements showed verysimilar patterns between years (Table 4). The threeparameters causing the greatest change are size of thebreeding population, adult BMR and food assimilationefficiency. A 1% change in these parameters altered theoutput by almost 1%, revealing the need for accuracyin these estimates. Altering numbers of specialist birdpredators had a minor influence on the bioenergeticsmodel (Table 4).
Mass of all prey consumed
Using estimates of the total energy requirement ofbreeders, non-breeders and chicks (Table 3) along withthe relative contribution of each prey type (Table 5) wecalculated the amount of each prey required (Table 6),according to breeding status, dietary preference andyear. The majority of prey consumed was fish, 80 000kg in 1999, and despite predicted declines in discardrates this amount increased to over 90 000 kg in 2001(87·7% and 89·5% of the total by mass, respectively).The second most abundant prey item was bird (7610 kgin 1999 and 7460 kg in 2001). It was estimated that2900 kg mammal prey was consumed in 1999 and3000 kg in 2001. The 650 kg of goose barnacles esti-mated to be consumed in 1999 contrasted markedlywith 2001 when only 161 kg were consumed.
Adult breeders, excluding bird specialist pairs, con-sumed the bulk of the prey (90% in 1999 and 91% in2001). Bird specialist breeders accounted for a small
proportion of the prey mass consumed (2·4% and2·5% in 1999 and 2001, respectively), with non-breedersrequiring relatively more food in each of the two years(7·2% and 6·7%, respectively).
Fish specialists consumed the vast majority of thefish (92·8% in 1999 and 92·4% in 2001). Fish specialistsalso accounted for the majority of the birds eaten inboth years (69·8% and 72·1%, respectively). Althoughconstituting only 5% of the population, bird specialistsconsumed 23·8% of the total mass of birds in 1999 and22% in 2001, with non-breeders accounting for around6% of the birds in both years. Fish specialists ate mostof the mammals with little annual variation, and non-breeders consumed 12% in 1999 and 9·8% in 2001. Non-breeders fed extensively on goose barnacles, accountingfor 37·7% consumed in 1999 and nearly 50% in 2001.
Numbers of birds consumed
During the 1999 and 2001 breeding seasons, we esti-mated great skuas consumed in excess of 12 500 and13 000 birds, respectively (Table 7; Fig. 1). In both yearsthe predominant prey was adult auks, although theestimate of 7837 consumed in 1999 decreased by9% to 7125 in 2001. Northern fulmar was the nextmost commonly eaten seabird with approximately 3000being eaten in both years. Almost 1000 auk chicks wereeaten in 1999 and this estimate almost doubled in 2001.Passerine birds also increased between 1999 and 2001from 205 to nearly 1000 birds, predominantly commonstarlings. The number of black-legged kittiwakes thatwere consumed declined from over 400 in 1999 to fewerthan 300 in 2001. Three species consumed in 2001 (215
Table 4. Sensitivity analysis for energetic requirements
Parameter
% change following 1% increase
Range of parameter extremes (%)
% change following parameter extremes
1999 2001 1999 2001
Breeding population 0·93 0·93 ±10 ±9·30 ±9·34Number of bird specialists −0·36 −0·36 +25, removal −0·45, −2·92 −0·45, −2·92Non-breeding population 0·07 0·07 ±50 ±3·61 ±3·39Pre-breeding period 0·22 0·23 ±50 ±11·19 ±11·27Incubation period 0·22 0·23 ±10 ±2·16 ±2·18Chick rearing period 0·34 0·35 ±10 ±3·46 ±3·49Post-fledging period 0·13 0·14 ±50 ±6·72 ±6·76Adult BMR 0·85 0·86 ±10 ±8·48 ±8·60FMR: BMR fish specialist 0·82 0·81 ±15 ±12·35 ±12·50FMR: BMR bird specialist 0·03 0·03 ±15 ±0·38 ±0·39FMR: BMR non-breeders 0·07 0·07 ±15 ±1·08 ±1·01Clutch size <0·01 <0·01 ±10 ±0·02 ±0·02Fresh egg mass <0·01 <0·01 ±10 ±0·02 ±0·02Egg energy density <0·01 <0·01 ±10 ±0·02 ±0·02Egg synthesis efficiency <0·01 <0·01 ±10 ±0·02 ±0·02Food assimilation efficiency −0·82 −0·83 ±8 −7·16, +6·10 −6·17, +7·25Brood size at 20 days 0·08 0·07 ±10 ±0·76 ±0·70Brood size at fledging 0·08 0·07 ±10 ±0·77 ±0·71Chick mass at fledging 0·07 0·07 ±10 ±0·77 ±0·71Energy for chick development <0·01 <0·01 ±10 ±0·03 ±0·02

1123P
redation by great skuas
© 2004 B
ritish E
cological Society, Journal of A
pplied E
cology, 41,1117
–1128
Table 5. Prey types in the diet of great skua at Hermaness during 1999 and 2001. Presented here are raw frequencies, frequencies following conversion for meal to pellet ratios (Votier et al. 2001) and the relative energetic contribution of eachprey type (see Methods). The diet composition of adults and chicks are combined in this table
Calorific content (kJ g−1)
Wet meal mass (g)
Meal energy content (kJ)
1999 2001
Adult breeders and chicks combined Adult breeders and chicks combined
Bird specialists Fish specialists Non-breeders Bird specialists Fish specialists Non-breeders
% all meals
% corrected
% energy
% all meals
% corrected
% energy
% all meals
% corrected
% energy
% all meals
% corrected
% energy
% all meals
% corrected
% energy
% all meals
% corrected
% energy
Auk sp. (adult) 10·9 100 1090 52·9 53·4 61·5 5·9 3·7 7·2 4·6 2·8 5·9 39·5 34·9 44·9 6·2 3·8 7·5 2·5 1·5 3·1Northern fulmar (adult & chicks) 10·9 100 1090 20·3 12·2 14·1 7·1 2·6 5·1 4·6 1·7 3·5 14 7·4 9·5 6·9 2·5 4·9 6·5 2·3 4·8Fish 5·2 100 520 12 21·1 11·6 82·5 89·1 84 76·8 81·2 82·5 26·1 40·4 24·8 83·4 90·4 84·2 82·7 87·6 85·2Black-legged kittiwake (adult & chicks) 10·9 100 1090 9·1 5·5 6·3 0 0 0 0·7 0·2 0·5 2·6 1·4 1·8 0·3 0·1 0·2 0 0 0Auk sp. (chick) 10·9 100 1090 2·6 2·6 3 0·1 0·1 0·2 0 0 0 14 12·4 15·9 0·2 0·1 0·2 0·6 0·4 0·8Mammal 6·24 100 624 1·7 3 1·9 2·1 2·3 2·6 4·8 5·1 6·2 0 0 0 1·6 1·7 1·9 4 4·3 5Goose barnacle 1·9 40 76 0·6 1 0·1 1·4 1·5 0·2 8·5 9 1·3 0 0 0 0·5 0·6 0·1 2·8 3 0·4Passerine 10·9 100 1090 0·6 1 1·1 0 0 0 0 0 0 0·6 1 1·3 0·2 0·2 0·4 0 0 0Great skua (chick) 10·9 100 1090 0·4 0·3 0·3 0·3 0·1 0·2 0 0 0 0 0 0 0·2 0·1 0·1 0 0 0Eggs 29 14·4* 417·6 0 0 0 0·6 0·6 0·5 0 0 0 1·2 1·9 0·9 0·4 0·5 0·3 0·9 1 0·8European shag (adult) 10·9 100 1090 0 0 0 0 0 0 0 0 0 0 0 0 0·2 <0·1 0·1 0 0 0European storm petrel (adult) 10·9 100 1090 0 0 0 0 0 0 0 0 0 0·6 0·2 0·3 0 0 0 0 0 0Northern gannet (adult) 10·9 100 1090 0 0 0 0 0 0 0 0 0 1·3 0·5 0·6 0 0 0 0 0 0n = diet samples – – – 264 – – 728 – – 457 – – 249 – 949 – 323 –
*Dry meal mass.
Table 6. Total mass of prey consumed by breeding and non-breeding great skuas at Hermaness in 1999 and 2001
1999 2001
Change from 1999 to 2001 % changeBird specialists Fish specialists Non-breeders Total Bird specialists Fish specialists Non-breeders Total
Auk sp. (adult) 1290·5 3 025·8 288 4 604·4 991·7 3 037·9 156·3 4 185·9 −418·5 −9·1%Fish 296·1 74 136·6 5489·3 79 922·1 882·7 83 953·7 5933·2 90 769·6 +10 847·8 +13·6%Northern fulmar (adult & chicks) 295·1 1 946·3 171·8 2 413·2 209·7 2 056·1 244·2 2 510 +96·8 +4·0%Black-legged kittiwake (adult & chicks) 131·9 0 24·5 156·5 38·9 68·0 0 106·9 −49·6 −31·7%Auk sp. (chick) 63·0 180·9 0 243·8 352·2 57·1 39·1 448·4 +204·6 +83·9%Mammal 52·7 2 480·6 344·1 2 877·3 0 2 673·7 288·9 2 962·6 +85·3 +3·0%Passerine sp. 27·0 0 0 27·0 28·4 100·0 0 128·4 +101·4 +375·6%Goose barnacle 7·0 395·8 243·9 646·8 0 81·3 80 161·3 −485·5 −75·1%Great skua (chick) 6·4 159·5 0 165·9 0 36·4 0 36·4 −129·5 −78·1%Eggs 0 96·7 0 96·7 4·4 87·1 9·6 101·1 +4·4 +4·6%European shag (adult) 0 0 0 0 0 25·0 0 25·0 +25·0 –European storm petrel (adult) 0 0 0 0 5·4 0 0 5·4 +5·4 –Northern gannet (adult) 0 0 0 0 14·2 0 0 14·2 +14·2 –Total 2169·9 82 422·2 6561·7 91 153·7 2527·7 92 176·3 6751·2 101 455·2 +10 301·5 +11·3%

1124S. C. Votier et al.
© 2004 British Ecological Society, Journal of Applied Ecology, 41,1117–1128
European storm petrels, 13 European shags and 3 north-ern gannets) were not present in the diet during 1999.
Published estimates of the breeding population ofseabirds at Hermaness, including estimates of thenon-breeding population (based on life table calcula-tions, Appendix 2; see Supplementary material) arepresented in relation to the number of each speciesconsumed by great skuas in Table 8.
Change in prey consumption model by varying input parameters
The effects of altering input parameters on the preyconsumption model are shown in Appendix 1 (seeSupplementary material). The sensitivity analysis isconsistent between years. In summary, changes in thecalorie content of fish and bird have a considerable
Table 7. Change in number of birds consumed at Hermaness between 1999 and 2001
1999 2001Change from 1999 to 2001 % change
Auk sp. (adult) 7 837 7 125 −712 −9·1%Northern fulmar (adult & chicks) 3 017 3 137 +120 +4·0%Black-legged kittiwake (adult & chicks) 417 285 −132 −31·7%Auk sp. (chick) 999 1 838 +839 +84·0%Passerine sp. 205 973 +768 +374·6%Great skua (chick) 207 45 −162 −78·3%European shag (adult) 0 13 +13 –European storm petrel (adult) 0 215 +215 –Northern gannet (adult) 0 5 +5 –Total birds 12 682 13 636 +954 +7·5%
Fig. 1. Estimated number of birds consumed by great skuas at Hermaness in (a) 1999 and (b) 2001 separated into foragingbehaviour (breeders) and non-breeders. For each sub-group the total number of bird prey are shown in parentheses and columnsshow numbers sub-divided into the lowest identifiable taxon.
1125Predation by great skuas
© 2004 British Ecological Society, Journal of Applied Ecology, 41,1117–1128 T
able
8.
Est
imat
ed s
eabi
rd p
opul
atio
ns a
t H
erm
anes
s an
d pr
opor
tion
eat
en b
y gr
eat
skua
s. N
on-b
reed
ing
popu
lati
on c
alcu
late
d fr
om li
fe t
able
s in
App
endi
x 2
(see
Sup
plem
enta
ry m
ater
ial)
Spec
ies
Popu
lati
on e
stim
ate
of b
reed
ing
seab
irds
at
Her
man
ess
Ann
ual p
erce
ntag
e of
sea
bird
s co
nsum
ed b
y gr
eat
skua
s
Adu
lts
Chi
cks
Gra
nd t
otal
1999
2001
Bre
eder
sN
on-b
reed
ers
Tota
l
Com
mon
gui
llem
ot/r
azor
bill
/Atl
anti
c pu
ffin
com
bine
d78
521
18 5
9097
111
20 1
8311
7 29
47·
5% (
all b
irds
)7·
6% (
all b
irds
)8·
1% (
adul
ts)
7·3%
(ad
ults
)5·
0% (
chic
ks)
9·1%
(ch
icks
)N
orth
ern
gann
et32
772
12 6
3745
409
10 9
7956
388
0<
0·01
% (
all b
irds
)N
orth
ern
fulm
ar27
912
15 6
7843
590
6 00
149
591
6·1%
(al
l bir
ds)
6·3%
(al
l bir
ds)
Bla
ck-l
egge
d ki
ttiw
ake
1 84
640
1 88
6
198
20
8420
·0%
(al
l bir
ds)
13·7
% (
all b
irds
)G
reat
sku
a 6
59 (
1999
)–
738
(19
99)
–28
·0%
(ch
icks
)7·
0% (
chic
ks)
726
(20
01)
646
(20
01)
Eur
opea
n st
orm
pet
rel
Unk
now
n–
––
–E
urop
ean
shag
Unk
now
n–
––
–
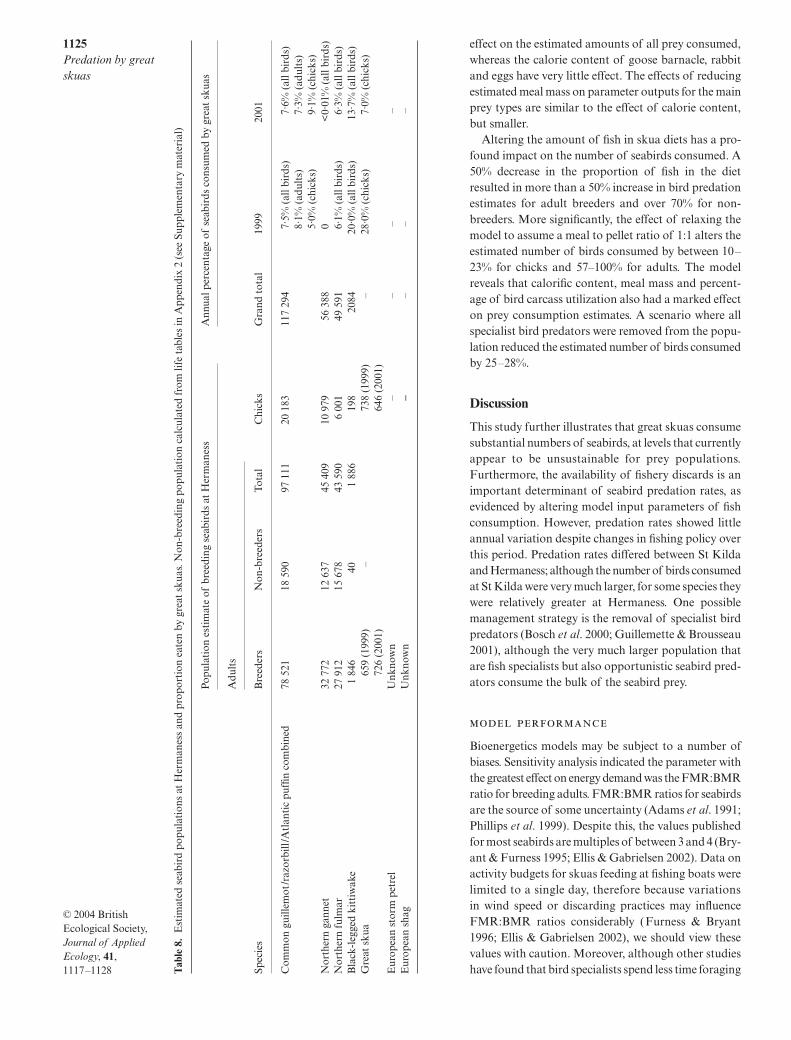
effect on the estimated amounts of all prey consumed,whereas the calorie content of goose barnacle, rabbitand eggs have very little effect. The effects of reducingestimated meal mass on parameter outputs for the mainprey types are similar to the effect of calorie content,but smaller.
Altering the amount of fish in skua diets has a pro-found impact on the number of seabirds consumed. A50% decrease in the proportion of fish in the dietresulted in more than a 50% increase in bird predationestimates for adult breeders and over 70% for non-breeders. More significantly, the effect of relaxing themodel to assume a meal to pellet ratio of 1:1 alters theestimated number of birds consumed by between 10–23% for chicks and 57–100% for adults. The modelreveals that calorific content, meal mass and percent-age of bird carcass utilization also had a marked effecton prey consumption estimates. A scenario where allspecialist bird predators were removed from the popu-lation reduced the estimated number of birds consumedby 25–28%.
Discussion
This study further illustrates that great skuas consumesubstantial numbers of seabirds, at levels that currentlyappear to be unsustainable for prey populations.Furthermore, the availability of fishery discards is animportant determinant of seabird predation rates, asevidenced by altering model input parameters of fishconsumption. However, predation rates showed littleannual variation despite changes in fishing policy overthis period. Predation rates differed between St Kildaand Hermaness; although the number of birds consumedat St Kilda were very much larger, for some species theywere relatively greater at Hermaness. One possiblemanagement strategy is the removal of specialist birdpredators (Bosch et al. 2000; Guillemette & Brousseau2001), although the very much larger population thatare fish specialists but also opportunistic seabird pred-ators consume the bulk of the seabird prey.
Bioenergetics models may be subject to a number ofbiases. Sensitivity analysis indicated the parameter withthe greatest effect on energy demand was the FMR:BMRratio for breeding adults. FMR:BMR ratios for seabirdsare the source of some uncertainty (Adams et al. 1991;Phillips et al. 1999). Despite this, the values publishedfor most seabirds are multiples of between 3 and 4 (Bry-ant & Furness 1995; Ellis & Gabrielsen 2002). Data onactivity budgets for skuas feeding at fishing boats werelimited to a single day, therefore because variationsin wind speed or discarding practices may influenceFMR:BMR ratios considerably (Furness & Bryant1996; Ellis & Gabrielsen 2002), we should view thesevalues with caution. Moreover, although other studieshave found that bird specialists spend less time foraging

1126S. C. Votier et al.
© 2004 British Ecological Society, Journal of Applied Ecology, 41,1117–1128
compared with conspecifics (Pietz 1987; Spear 1993)their energy expenditure has not been quantified. Futuredetailed study of great skua foraging activities would bevaluable, particularly in light of possible future changes tofishery management or changes in the number of spe-cialist bird predators.
Estimates of the breeding population and food assi-milation efficiency both had marked effects on modeloutputs (Table 4). Future studies should ensure accu-rate collection of population estimates as well as moreextensive data on assimilation efficiency to ensure modeloutputs are robust.
Assessing diets in the manner used in this study isknown to be subject to error (Votier et al. 2003), whichcan have serious effects on the prey consumption esti-mates predicted by this model. Phillips et al. (1999) fol-lowed Furness & Hislop (1981) in assuming one pelletwas equivalent to one meal, in the absence of any datato the contrary. However, captive trials suggest thatskuas can produce several pellets per meal (Votier et al.2001). Relaxing the model to assume that one pelletwas equal to one meal dramatically increased the esti-mated numbers of seabirds eaten by skuas. While weacknowledge that using captive birds as a model maynot represent the natural situation, we believe this to bea better estimate than a simple 1:1 meal to pellet ratiosince different prey clearly have different amounts ofindigestible material.
Although the numbers of seabirds consumed at Her-maness are substantial, the effect on different speciesvaries considerably. The percentage of the black-leggedkittiwake population consumed annually was particu-larly high (Table 8). Other studies have shown thatgreat skuas negatively effect kittiwake survival (Oro &Furness 2002) and have caused localized extinctions(Heubeck et al. 1997). Our model supports the evidencethat black-legged kittiwakes are particularly vulnerableto predation by great skuas.
In terms of total numbers, auks are the most abundantseabird prey in the diet of great skuas at Hermaness.Pellets containing remains of adult auks could not alwaysbe identified to species, but the majority did consist offully grown Atlantic puffins. Pellets containing theremains of auk chicks were from guillemots or razorbills;no puffin chicks were recorded. Therefore by feedingon adult puffins, it is possible that the level of predationpressure exerted by great skuas is much more severe thanon the other two species of auk. Given that the annualadult survival of puffins is ≈90% (Harris 1984), predationby great skuas could represent a significant proportionof this mortality, although it is not possible to estimatethe number of non-breeders included in this total.
The estimated number of northern fulmars killedeach year represents around 6% of the local population.Although it is difficult to distinguish between thepellets of adult and young fulmars, since fulmar pelletswere collected throughout the breeding season andbefore chicks fledge, probably a large proportion ofthe birds killed were adults. Skua predation is likely tohave an impact on the breeding population of thisspecies. Given recent evidence that fulmars aredeclining significantly at several Shetland colonies(Pennington et al. 2004), this may in part be due to greatskua predation.
Our model suggests that a 50% reduction in the pro-portion of fish in the diet will increase the number ofseabirds consumed by over 50% for adult breeders andover 70% for non-breeders (Table 8). This would resultin an additional ≈6500 birds being consumed annuallyand demonstrates the importance of fishery discards inthis system. However, despite changes in fishery policyimplemented on 1 January 2001, great skuas did notexhibit a switch to consuming more seabird prey from1999 to 2001. The reductions in overall fishing effortand the introduction of technical measures to reducebycatch after 2000 were expected to reduce discards, butan exceptional recruitment of haddock in the north-westNorth Sea during 2001 (more than double the meandiscarded over the period 1986–2001; Votier et al. 2004b)buffered this effect. This highlights the complex inter-action between commercial fisheries and seabird com-munities that utilize them.
Despite having a larger colony of predators and asmaller colony of potential seabird prey, great skuasat Hermaness consumed far fewer birds than at St Kilda(Phillips et al. 1999). However, comparing the percent-age of the local population of seabirds consumed betweenthe two colonies reveals a different picture. Phillipset al. (1999) estimated the proportion of seabirds con-sumed by great skuas as 2·0% for northern fulmars,15·5% for black-legged kittiwakes and 0·9% for Atlanticpuffins, compared with values of 6·1–6·3%, 13·7–20·0%and <7·5% for Hermaness, respectively. Therefore inrelative terms, predation pressure by great skuas at Her-maness appears greater than at St Kilda, owing to thesmaller seabird numbers at Hermaness.
Skuas and gulls exhibit marked differences in dietchoice among colonies (Pietz 1987; Spear 1993), as hasalready been established between Shetland and StKilda (Phillips et al. 1997a). However, these differenceshave not, to our knowledge, been presented as estimatesof relative prey consumption. When presented in this wayit becomes all the more clear that it is not appropriate

1127Predation by great skuas
© 2004 British Ecological Society, Journal of Applied Ecology, 41,1117–1128
to extrapolate conclusions about predator–prey inter-actions from differing parts of great skuas’ range.
It was estimated that specialist bird predators consti-tuted 5% of the breeding population and accountedfor nearly 30% of the total birds consumed each year.Although the majority of bird prey was consumedopportunistically, the foraging behaviour of individualspecialists may have implications at the populationlevel. During 1999 all of the predated black-leggedkittiwakes were taken by bird specialists. Among themuch reduced kittiwake population at Hermaness, theremaining pairs nest in caves or enclosed cliffs, wheregreat skuas cannot easily forage (Heubeck et al. 1997).The relatively high predation rate by specialist birdpredators on this species may be explained by their abilityto depredate these less accessible birds. Great skuasdefending a feeding territory within puffin colonies atHermaness may also be having a more severe impactthan other members of the population. Harris (1984)found that great black-backed gulls, Larus marinus(Linnaeus), nesting within puffin colonies on St Kildatook a higher proportion of older (breeding) birds thanthose elsewhere, thereby having a more significant impacton puffin population trends.
One management strategy, although controversial,is the removal of specialist bird predators. Removal ofall of the bird specialist predators would reduce thenumber of birds consumed by between 25 and 28%.Therefore our model predicts a substantial reduction inpredation rates by removing only 5% of the population,which would be more effective than random removalof skuas in the population. However, this calculationassumes that after this change, other skuas retain thesame feeding preferences. Because specialist bird pred-ators defend feeding territories, it is unknown whethertheir removal may result in conspecifics swamping sea-bird colonies, or whether fish specialists may occupyvacated territories and switch to feed on seabirds them-selves. Only experimental study would elucidate theseresponses.
Acknowledgements
We thank Paul Harvey, Jonathan Swales, Jeff Stenning,Rachel King, Chris Rodger and Steve Duffield at Scot-tish Natural Heritage for permissions and considerableassistance. We also thank Euan Dunn and three refereesfor helpful comments on an earlier draft. This workwas funded by the RSPB, EC project DISCBIRD anda NERC Post-doctoral Fellowship to Stuart Bearhop.
References
Adams, N.J., Abrams, R.W., Siegfried, W.R., Nagy, K.A. &Kaplan, I.R. (1991) Energy expenditure and food consump-tion by breeding Cape gannets Morus capensis. MarineEcology Progress Series, 70, 1–9.
Bosch, M., Oro, D., Cantos, F.J. & Zabala, M. (2000) Short-termeffects of culling on the ecology and population dynamicsof the yellow-legged gull. Journal of Applied Ecology, 37,369–385.
Bryant, D.M. & Furness, R.W. (1995) Basal metabolic rates ofNorth Atlantic seabirds. Ibis, 137, 219–226.
Cairns, D.K., Montevecchi, W.A., Brit-Friesen, V.L. &Macko, S.A. (1990) Energy expenditures, activity budgetsand prey harvest of breeding common murres. Studies inAvian Biology, 14, 84–92.
Caldow, R.W.G. (1988) Studies on the morphology, feedingbehaviour and breeding biology of skuas with reference tokleptoparasitism. PhD Thesis, University of Glasgow,Glasgow.
Cramp, S. & Simmons, K.E.L. (1983) Handbook of the Birdsof Europe, the Middle East and North Africa: The Birds ofthe Western Palearctic, Vol. 3. Oxford University Press,Oxford.
Drent, R.H., Klaassen, M. & Zwaan, B. (1992) Predictivegrowth budgets in terns and gulls. Ardea, 80, 5–17.
Ellis, H.I. & Gabrielsen, G.W. (2002) Energetics of free-rangingseabirds. Biology of Marine Birds (eds E.A. Schreiber &J. Burger), pp. 359–407. CRC Press, London.
Furness, R.W. (1978) Energy requirements of seabird commu-nities: a bioenergetics model. Journal of Animal Ecology,47, 39–53.
Furness, R.W. & Bryant, D.M. (1996) Effect of wind on fieldmetabolic rates of breeding northern fulmars. Ecology, 77,1181–1188.
Furness, R.W. & Hislop, J.R.G. (1981) Diets and feedingecology of great skuas Catharacta skua during the breedingseason. Journal of Zoology, London, 195, 1–23.
Guillemette, M. & Brousseau, P. (2001) Does culling predatorygulls enhance the productivity of breeding common terns?Journal of Applied Ecology, 38, 1–8.
Hamer, K.C. (2001) Catharacta skua. BWP Update, 3, 91–110.
Hamer, K.C., Furness, R.W. & Caldow, R.W.G. (1991) Theeffect of changes in food availability on the breeding ecol-ogy of great skuas Catharacta skua. Journal of Zoology,London, 223, 175–188.
Härkönen, T. (1986) Guide to the Otoliths of the Bony Fishes ofthe Northeast Atlantic. Danbiu Aps., Hellerup.
Harris, M.P. (1984) The Puffin. T. & A.D. Poyser, Carlton.Heubeck, M., Mellor, R.M. & Harvey, P.V. (1997) Changes in
the breeding distribution and numbers of kittiwakes Rissatridactyla around Unst, Shetland, and the presumed roleof predation by great skuas Catharacta skua. Seabird, 19,12–21.
Hilton, G.M., Furness, R.W. & Houston, D.C. (2000) Acomparative study of digestion in North Atlantic seabirds.Journal of Avian Biology, 31, 36–46.
Hislop, J.R.G., Harris, M.P. & Smith, J.G.M. (1991) Variationin the calorific value and total energy content of the lessersandeel Ammodytes marinus and other fish preyed on byseabirds. Journal of Zoology, London, 224, 501–517.
Klomp, N.I. & Furness, R.W. (1992) Non-breeders as a bufferagainst environmental stress: declines in numbers of greatskuas on Foula, Shetland, and prediction of future recruit-ment. Journal of Applied Ecology, 29, 341–348.
Korpimäki, E. (1994) Rapid or delayed tracking of multi-annualvole cycles by avian predators? Journal of Animal Ecology,63, 619–628.
Lewis, T. (1997) Hermaness and Keen of Hamar NNR’sAnnual Report 1999. Unpublished report, Scottish NaturalHeritage, Lerwick, Shetland.
Meathrel, C.E. & Ryder, J.P. (1987) Intra-clutch variationin the size, mass and composition of ring-billed gull eggs.Condor, 89, 364–368.
Meathrel, C.E., Ryder, J.P. & Termaat, B.M. (1987) Size andcomposition of herring gull eggs: relationship to position in
1128S. C. Votier et al.
© 2004 British Ecological Society, Journal of Applied Ecology, 41,1117–1128
the laying sequence and the body condition of females.Colonial Waterbirds, 10, 55–63.
Mitchell, P.I., Newton, S.F., Ratcliffe, N. & Dunn, T.E. (2004)Seabird Populations of Britain and Ireland. T & A D Poyser,London.
Moors, P.J. (1977) Studies of the metabolism, food consump-tion and assimilation efficiency of a small carnivore, theweasel Mustela nivalis L. Oecologia, 27, 185–202.
Nielsen, Ó.K. (1999) Gyrfalcon predation on ptarmigan:numerical and functional responses. Journal of AnimalEcology, 68, 1034–1050.
Oro, D. (2003) Managing seabird metapopulations in theMediterranean: constraints and challenges. Scientia Marina,67, 13–22.
Oro, D. & Furness, R.W. (2002) Influences of food availabilityand predation on survival of kittiwakes. Ecology, 83, 2516–2528.
Pennington, M., Osborn, K., Harvey, P., Riddington, R.,Okill, D., Ellis, P. & Heubeck, M. (2004) The Birds of Shet-land. Christopher Helm, London.
Phillips, R.A., Catry, P., Thompson, D.R., Hamer, K.C. &Furness, R.W. (1997a) Inter-colony variation in diet andreproductive performance of great skuas Catharacta skua.Marine Ecology Progress Series, 152, 285–293.
Phillips, R.A., Thompson, D.R. & Hamer, K.C. (1997b)The Population and Feeding Ecology of Great Skuas Cathar-acta skua at St Kilda. Report. Scottish Natural Heritage,Edinburgh.
Phillips, R.A., Thompson, D.R. & Hamer, K.C. (1999) Theimpact of great skua predation on seabird populations at StKilda: a bioenergetics model. Journal of Applied Ecology,36, 218–232.
Pietz, P.J. (1987) Feeding and nesting ecology of sympatricsouth polar and brown skuas. Auk, 104, 617–627.
Quintana, F. & Yorio, P. (1998) Competition for nest sitesbetween kelp gulls Larus dominicanus and terns Sternamaxima and S. eurygnatha. Patagonia. Auk, 115, 1068–1071.
Redpath, S.M. & Thirgood, S.J. (1999) Numerical andfunctional responses in generalist predators: hen harriersand peregrines on Scottish grouse moors. Journal of AnimalEcology, 68, 876–892.
Reeves, S.A. & Furness, R.W. (2002) Net loss – seabirds gain?Implications of fisheries management for seabirds scaveng-ing discards in the northern North Sea. RSPB, Sandy.
Ricklefs, R.E. (1974) Energetics of reproduction in birds.Avian Energetics (ed. R.A Paynter), pp. 152–291. NuttalOrnithology Club, Cambridge, MA.
Ricklefs, R.E. (1983) Some considerations on the reproduc-tive energetics of pelagic seabirds. Studies in Avian Biology,8, 84–94.
Snow, D.W. & Perrins, C.M. (1998) The Birds of the WesternPalearctic. Concise Edition, Vol. 1. Oxford University Press,Oxford.
Sotherland, P.R. & Rahn, H. (1987) On the composition ofbird eggs. Condor, 89, 48–65.
Spear, L.B. (1993) Dynamics and effect of western gulls feed-ing in a colony of guillemots and Brandt’s cormorants.Journal of Animal Ecology, 62, 399–414.
Thomson, D.L., Furness, R.W. & Monaghan, P. (1998) Fieldmetabolic rates of kittiwakes Rissa tridactyla during incu-bation and chick rearing. Ardea, 86, 169–175.
Tinbergen, J.M. & Williams, J.B. (2002) Energetics of incubation.Avian Incubation: Behaviour, Environment and Evolution(ed. D.C. Deeming). Oxford Ornithology Series, OxfordUniversity Press, Oxford.
Votier, S.C., Bearhop, S., MacCormick, A., Ratcliffe, N. &Furness, R.W. (2003) Assessing the diet of great skuasCatharacta skua using five different techniques. Polar Biology,26, 20–26.
Votier, S.C., Bearhop, S., Ratcliffe, N. & Furness, R.W. (2001)Pellets as indicators of diet in great skuas Catharacta skua.Bird Study, 48, 373–376.
Votier, S.C., Bearhop, S., Ratcliffe, N. & Furness, R.W.(2004a) Reproductive consequences for great skuas special-izing as seabird predators. Condor, 106, 275–287.
Votier, S.C., Furness, R.W., Bearhop, S., Crane, J.E., Caldow,R.W.G., Catry, P., Ensor, K., Hamer, K.C., Hudson, A.V.,Kalmbach, E., Klomp, N.I., Pfeiffer, S., Phillips, R.A.,Prieto, I. & Thompson, D.R. (2004b) Changes in fisheriesdiscard rates and seabird communities. Nature, 427, 727–730.
Received 21 February 2004; final copy received 9 August 2004
Related Documents