1 Project No. 10-87-(Task2/Phase A-3) 11/01/13 APPENDICES For PRECISION ESTIMATES OF AASHTO T 304, AASHTO T 96, and AASHTO T 11 AND INVESTIGATION OF THE EFFECT OF MANUAL AND MECHANICAL METHOD OF WASHING ON SIEVE ANALYSIS OF AGGREGATES FINAL Report Prepared for National Cooperative Highway Research Program Transportation Research Board National Research Council TRANSPORTATION RESEARCH BOARD NAS-NRC PRIVILEGED DOCUMENT This report, not released for publication, is furnished only for review to members of or participants in the work of the National Cooperative Highway Research Program (NCHRP). It is to be regarded as fully privileged, and dissemination of information included herein must be approved by the NCHRP. Haleh Azari, Ph.D. AASHTO Advanced Pavement Research Program National Institute of Standards and Technology Gaithersburg, Maryland November 2013

Welcome message from author
This document is posted to help you gain knowledge. Please leave a comment to let me know what you think about it! Share it to your friends and learn new things together.
Transcript

1
Project No. 10-87-(Task2/Phase A-3) 11/01/13
APPENDICES
For
PRECISION ESTIMATES OF AASHTO T 304, AASHTO T 96, and AASHTO T 11 AND INVESTIGATION OF THE
EFFECT OF MANUAL AND MECHANICAL METHOD OF WASHING ON SIEVE ANALYSIS OF AGGREGATES
FINAL Report
Prepared for National Cooperative Highway Research Program
Transportation Research Board National Research Council
TRANSPORTATION RESEARCH BOARD
NAS-NRC
PRIVILEGED DOCUMENT
This report, not released for publication, is furnished only for review to members of or participants in the work of the National Cooperative Highway Research Program (NCHRP). It is to be regarded as fully privileged, and dissemination of information included herein must be approved by the NCHRP.
Haleh Azari, Ph.D. AASHTO Advanced Pavement Research Program
National Institute of Standards and Technology Gaithersburg, Maryland
November 2013

2
TABLE OF CONTENT
TABLE OF CONTENT ..............................................................................................................................2
APPENDIX A –PROFICIENCY SAMPLE DATA SHEETS AND INSTRUCTIONS ........................4
APPENDIX B - T 96 COARSE AGGREGATE GRAPHS .................................................................... 13
APPENDIX C - T 304 FINE AGGREGATE GRAPHS ........................................................................ 17
APPENDIX D - T 11 COARSE AND FINE AGGREGATE GRAPHS ............................................... 21
APPENDIX E - PRECISION STATMENTS FOR T 96, T 304 AND T 11 .......................................... 26
APPENDIX F - COARSE AGGREGATE- WASHING METHOD TABLES AND GRAPHS ......... 30
Total Material Passing Scatter Plot Graphs ...................................................................................... 31
Percent Passing Bar Graphs .............................................................................................................. 34
Summaries of Statistics ..................................................................................................................... 37
Statistical Tests of Significance ........................................................................................................ 40
APPENDIX G - FINE AGGREGATE- WASHING METHOD TABLES AND GRAPHS ............... 43
Total Material Passing Scatter Plot Graphs ...................................................................................... 44
Summaries of Statistics ..................................................................................................................... 53
Statistical Tests of Significance ........................................................................................................ 56
APPENDIX H - HOT MIX ASPHALT IGNITOIN OVEN- WASHING METHOD TABLES AND GRAPHS ............................................................................................... 59
Total Material Passing Scatter Plot Graphs ...................................................................................... 60
Percent Passing Bar Graphs .............................................................................................................. 66
Summaries of Statistics ..................................................................................................................... 72
Statistical Tests of Significance ........................................................................................................ 80

3
APPENDIX I - HOT MIX ASPHALT SOLVENT EXTRACTION- WASHING METHOD TABLES AND GRAPHS ............................................................................................... 88
Total Material Passing Scatter Plot Graphs ...................................................................................... 89
Percent Passing Bar Graphs .............................................................................................................. 93
Summaries of Statistics ..................................................................................................................... 99
Statistical Tests of Significance ...................................................................................................... 105

4
APPENDIX A –PROFICIENCY SAMPLE DATA SHEETS AND INSTRUCTIONS

5
AGC Sample Instructions for AGC 169-170
Instructions for Testing and Reporting Coarse Aggregate Proficiency Samples No. 169 And No. 170
Closing Date: October 28, 2010 All tests should be conducted on each of the two samples according to the AASHTO or ASTM Standard Test Methods indicated. To permit an estimate of single-operator precision, the same operator should conduct an individual test on both samples. It is not necessary for all tests to be performed by the same person. Please use the same set of sieves for both samples. Report the results of a single determination only, not the average of two or more. For any tests you choose not to perform, leave the appropriate spaces blank on the data sheet. Note: Please note that samples 169 and 170 are not identical. The program is designed to obtain two independent test results, one for each numbered sample, for each test method that the laboratory chooses to perform. Note also that the coarse aggregate for this round of testing (Samples #169 and #170) contains particles of various compositions. Some particles are rather fragile, especially when wet. The samples are to be evaluated as being obtained from a single source. Laboratories should take appropriate steps to prevent excessive degradation of the samples during testing. Directions for the individual tests on Samples No. 169 and No. 170 are as follows: NOTE: The following steps should be taken in handling the samples if a full series of tests is to be performed on the material provided:
1. Oven-dry the material at 110 ± 5°C (230 ± 9°F) before testing is begun. 2. Perform T11/C117 and T27/C136 on the entire sample. 3. Recombine all the plus 4.75-mm material and then select a representative test sample for
T85/C127. 4. Recombine the material from T85/C127 with the remaining material from Step 3. 4. Oven-dry the recombined material at 110 ± 5°C (230 ± 9°F). Then, separate the material into size
fractions by sieving, and obtain test samples for T96/C131 and T104/C88 in accordance with those test methods.
Materials Finer Than 75-μm Sieve in Mineral Aggregates by Washing, AASHTO T11-05 (Procedure A) or ASTM C117-04 (Procedure A): After oven drying, wash the entire sample in plain water. (Do not use a wetting agent.) Report the percentage finer than the 75-μm (No. 200) sieve to the nearest 0.01 percent. Upon completion of this test, the total oven dry sample mass determined before washing is to be used for the sieve analysis (T27/C136). Sieve Analysis of Fine and Coarse Aggregates, AASHTO T27-06 or ASTM C136-06: Report, to the nearest 0.1 percent, the total material passing each of the following sieves: 25.0, 19.0, 12.5, 9.5, and 4.75 mm. Calculate percentages passing on the basis of the total mass of the initial dry sample. If T11 or C117 was performed, include the mass of the material finer than the 75-µm (No. 200) sieve by washing in the sieve analysis calculation; in other words, use the total oven dry sample mass that was determined prior to washing in T11 or C117 as the basis for calculating all the percentages. Use the same set of sieves for both samples. Specific Gravity and Absorption of Coarse Aggregate, AASHTO T85-10 or Density, Relative Density (Specific Gravity) and Absorption of Coarse Aggregate, ASTM C127-07: Oven-dry the samples at 110 ± 5°C (230 ± 9°F) and determine the bulk, the bulk (SSD) and the apparent specific gravities. [ASTM C127 refers to these results as Relative Density (OD), Relative Density (SSD), and Apparent Relative Density, respectively.] Report these to the nearest 0.001 units. Determine the absorption and report it to the nearest 0.01 percent. Resistance to Degradation of Small-Size Coarse Aggregate by Abrasion and Impact in the Los Angeles Machine, AASHTO T96-02 or ASTM C131-06: Perform the B grading using 11 steel spheres. In determining the loss, wash the material retained on the 1.70-mm (No. 12) sieve and oven-dry at 110 ± 5°C (230 ± 9°F) to a constant mass. Report the percentage of loss by abrasion and impact to the nearest 0.01 percent. Soundness of Aggregate by Use of Sodium Sulfate or Magnesium Sulfate, AASHTO T104-99 or ASTM C88-05: The test may be performed using sodium or magnesium sulfate, or both solutions if desired. Perform five cycles on the following size fractions: passing the 19.0-mm and retained on the 9.5-mm sieve; passing the 9.5-mm and retained on the 4.75-mm sieve. For each size fraction, report the material finer than the designated sieve, expressed to the nearest 0.01 percent of the original weight of the fraction. Do NOT compute the weighted average or weighted percentage loss.

6
AGC Sample Data Sheet for AGC 169-170
AASHTO MATERIALS REFERENCE LABORATORY (AMRL) Coarse Aggregate Proficiency Sample Data Sheet
Closing Date: October 28, 2010
We encourage you to use the online data entry system. Or, you may fax (301) 975-8208 or mail your data sheet to: Ron Holsinger, AMRL / NIST, 100 Bureau Dr., Stop 8619,
Gaithersburg, MD 20899-8619. If your laboratory is not registered to submit results online, or if there are questions, contact AMRL at [email protected] or call 301-975-5450.
Enter Test Results in Rows (1) to (15) Below
Materials Finer Than 75-μm (No. 200) Sieve by Washing: T11 or C117 Sample 169 Sample 170
Mark the Box at the Right to Show the Method Used – T11 , C117
Washing Method? Manual , Mechanical Washing Apparatus If Mechanical, Time for Wash?_____________ (minutes)
Percentage of material finer than the 75-μm sieve by washing (nearest 0.01 percent) ..................... (1)
Sieve Analysis: T27 or C136 (Report the total material PASSING each sieve.)
Mark the Box at the Right to Show the Method Used – T27 , C136
Total Material Passing the 25.0-mm (1-in.) Sieve (nearest 0.1 percent) ............................................ (2)
Total Material Passing the 19.0-mm (3/4-in.) Sieve (nearest 0.1 percent) ......................................... (3)
Total Material Passing the 12.5-mm (1/2-in.) Sieve (nearest 0.1 percent) ......................................... (4)
Total Material Passing the 9.5-mm (3/8-in.) Sieve (nearest 0.1 percent) ........................................... (5)
Total Material Passing the 4.75-mm (No. 4) Sieve (nearest 0.1 percent) .......................................... (6)
Specific Gravity (or Relative Density) and Absorption: T85 or C127
Mark the Box at the Right to Show the Method Used – T85 , C127
Bulk Specific Gravity [or Relative Density, OD for C127] (nearest 0.001) .......................................... (7)
Bulk Specific Gravity, SSD [or Relative Density, SSD for C127] (nearest 0.001) .............................. (8)
Apparent Specific Gravity [or Apparent Relative Density for C127] (nearest 0.001) .......................... (9)
Absorption (nearest 0.01 percent) .................................................................................................... (10)
Los Angeles Abrasion: T96 or C131
Mark the Box at the Right to Show the Method Used – T96 , C131
Percentage of Loss by Abrasion and Impact, B Grading (nearest 0.01 percent) ............................. (11)
SulfateSoundnessTest:T104orC88
MarktheBoxattheRighttoShowtheMethodUsed–T104 ,C88
EnterresultsforSODIUMSULFATEtestinginrows(12)and(13)
Percentage of 19.0 to 9.5-mm fraction passing 8.0-mm sieve (nearest 0.01 percent) ..................... (12)
Percentage of 9.5 to 4.75-mm fraction passing 4.0-mm sieve (nearest 0.01 percent) ..................... (13)
Enter results for MAGNESIUM SULFATE testing in rows (14) and (15)
Percentage of 19.0 to 9.5-mm fraction passing 8.0-mm sieve (nearest 0.01 percent) ..................... (14)
Percentage of 9.5 to 4.75-mm fraction passing 4.0-mm sieve (nearest 0.01 percent) ..................... (15)
Please complete the information below to identify your laboratory.
Lab Name: Lab Number:
City, State:
Tested By:
Lab Phone:
Comments:

7
AGF Sample Instructions for AGF 171-172
Instructions for Testing and Reporting Fine Aggregate Proficiency Samples No. 171 and No. 172
Closing Date: March 10, 2011
All tests should be conducted on each of the two samples according to the AASHTO or ASTM Standard Test Methods indicated. To permit an estimate of single-operator precision, each individual test should be performed on both samples by the same person, but it is not necessary that all tests be performed by the same person. Please use the same set of sieves for both samples. Report the results of a single determination only, not the average of two or more, except in cases where an average is called for in the method. For any tests you do not choose to perform, leave the appropriate spaces on the data sheet blank. Note: Please note that samples 171 and 172 are not identical. The program is designed to obtain two independent test results, one for each numbered sample, for each test method that the laboratory chooses to perform. Also, the samples for sieve testing are provided in small plastic bags (each weighing approximately 500 g) and were processed differently. Sieving sample 171 is air-dried and sample 172 is wet. Please remember to oven dry both samples before testing.
PLEASE USE THE SAMPLES IN THE SMALL PLASTIC BAGS FOR T11/C117 AND T27/C136.
Materials Finer Than 75-µm Sieve by Washing (Procedure B using a wetting agent), AASHTO T11-05 or ASTM C117-04: Oven dry the gradation sample (in the small bag), weigh it, place it in the container, add water and wetting agent, and wash it over the 75-µm (No. 200) sieve (as directed by T11/C117, Procedure B). Determine the amount of material finer than the 75-µm sieve by washing. Report the percentage finer than the 75-µm (No. 200) sieve to the nearest 0.01 percent. Sieve Analysis, AASHTO T27-06 or ASTM C136-06: Oven dry the remaining gradation material again (after the wash) and sieve it (as directed by T27/C136). Report to the nearest 0.1 percent the total material passing each of the following sieves: 4.75-mm, 2.36-mm, 1.18-mm, 600-µm, 300-µm, and 150-µm. Report the percentage passing the 75-µm sieve to the nearest 0.01 percent. Calculate the percents based on the total original oven dry mass before the gradation sample was washed. (The intent is to follow the test methods exactly as written.) Use the same set of sieves for both samples.
PLEASE USE THE LARGE SAMPLES FOR THE REMAINDER OF THE TESTS BELOW. Specific Gravity (Relative Density) and Absorption of Fine Aggregate, AASHTO T84-10 or ASTM C128-07a: Oven dry the sample at 110 ± 5°C (230 ± 9°F) and determine the bulk specific gravity, the bulk specific gravity (SSD) and the apparent specific gravity [or relative density (OD), relative density (SSD), and apparent relative density for C128]. Report these to the nearest 0.001 units. Determine the absorption and report it to the nearest 0.01 percent. Plastic Fines in Graded Aggregates and Soils by Use of the Sand Equivalent Test, AASHTO T176-08 or ASTM D2419-09: Report the average of the three sand equivalent determinations. Special Instructions: After test specimens are obtained (Specimens may be obtained using either the Air Dry or Pre-Wet method according to AASHTO Alternate Method No.1 or No.2, or ASTM Procedure A or B), dry each test specimen to constant mass at 110 ± 5°C (230 ± 9°F) and cool to room temperature before testing. (Moist test specimens produce lower sand equivalent values than corresponding oven dry specimens. We are asking laboratories to oven dry the prepared test specimens before pouring them into the plastic cylinder in order to obtain more consistent results for between laboratory comparisons.) Sulfate Soundness by Use of Sodium Sulfate or Magnesium Sulfate, AASHTO T104-99 or ASTM C88-05: The test may be performed using sodium or magnesium sulfate, or both solutions if desired. Perform five cycles on the following sizes: passing the 2.36-mm and retained on the 1.18-mm sieve; passing the 1.18-mm and retained on the 600-µm sieve; passing the 600-µm and retained on the 300-µm sieve. For each size fraction, report the amount of material finer than the designated sieve as a percentage of the original mass of the fraction to the nearest 0.01 percent. Do NOT compute the weighted, or weighted average, loss. Uncompacted Void Content, AASHTO T304-08 or ASTM C1252-06: Perform Method A on both samples and complete two test runs on each sample. Calculate the uncompacted voids for each test run and record each result to the nearest 0.01 percent. Calculate the average uncompacted voids of the two test runs and report the average to the nearest 0.01 percent.

8
AGF Sample Data Sheet for AGF 171-172 Contact AMRL at [email protected] or call 301-975-5450 if there are questions.
Fine Aggregate Proficiency Sample Data Sheet Closing Date: March 10, 2011
We encourage you to use the online data entry system. Online data entry enables you to submit data, revise data, and receive confirmation. Please check the confirmation page to be sure that the results are entered correctly. Or, you may fax (301) 975-8208 or mail your data sheet to: ron holsinger, amrl / nist, 100 bureau dr., stop 8619, gaithersburg, md 20899-8619. Contact amrl at [email protected] or call 301-975-5450 if there are questions.
Enter results in rows (1) to (23) below
Materials Finer Than 75-μm (No. 200) Sieve by Washing: Method Used? – T11 , C117 Sample 171 Sample 172 (Use the approximately 500-g sample in the small plastic bag.) Washing Procedure? Manual , Mechanical Washing Apparatus If Mechanical, Time for Wash?_____________ (minutes)
Total Oven Dry Mass of Specimen Before Washing (nearest 0.1 g) (1)
Percentage Finer Than the 75-μm Sieve by Washing (nearest 0.01 percent) (2)
Sieve Analysis: Method Used? – T27 , C136
(Use the approx. 500-g sample in the small plastic bag and report the total material PASSING each sieve.)
Total Material Passing the 4.75-mm (No. 4) Sieve (nearest 0.1 percent) (3)
Total Material Passing the 2.36-mm (No. 8) Sieve (nearest 0.1 percent) (4)
Total Material Passing the 1.18-mm (No. 16) Sieve (nearest 0.1 percent) (5)
Total Material Passing the 600-μm (No. 30) Sieve (nearest 0.1 percent) (6)
Total Material Passing the 300-μm (No. 50) Sieve (nearest 0.1 percent) (7)
Total Material Passing the 150-μm (No. 100) Sieve (nearest 0.1 percent) (8)
Total Material Passing the 75-μm (No. 200) Sieve (nearest 0.01 percent) (9)
Specific Gravity (Relative Density) and Absorption: Method Used? – T84 , C128
Procedure Used? Gravimetric (Pycnometer) , Volumetric (Le Chatlier Flask)
Bulk Specific Gravity [or Relative Density, Oven Dry for C128] (nearest 0.001) (10)
Bulk Specific Gravity, SSD [or Relative Density, SSD for C128] (nearest 0.001) (11)
Apparent Specific Gravity [or Apparent Relative Density for C128] (nearest 0.001) (12)
Absorption (nearest 0.01 percent) (13)
Sand Equivalent: Method Used? – T176 , D2419
(See Special Instructions for Testing and Reporting)
Sand Equivalent Value (whole number) (14)
Sulfate Soundness Test: Method Used? – T104 , C88
SODIUM
Material Finer Than the 1.18-mm Sieve, Na (nearest 0.01 percent) (15)
Material Finer Than the 600-μm Sieve, Na (nearest 0.01 percent) (16)
Material Finer Than the 300-μm Sieve, Na (nearest 0.01 percent) (17)
MAGNESIUM
Material Finer Than the 1.18-mm Sieve, Mg (nearest 0.01 percent) (18)
Material Finer Than the 600-μm Sieve, Mg (nearest 0.01 percent) (19)
Material Finer Than the 300-μm Sieve, Mg (nearest 0.01 percent) (20)
Uncompacted Void Content: Method Used? – T304, Method A , C1252, Method A
Uncompacted Voids, Test Run # 1 (nearest 0.01 percent) (21)
Uncompacted Voids, Test Run # 2 (nearest 0.01 percent) (22)
Uncompacted Voids, Average of Two Runs (nearest 0.01 percent) (23)
Please complete the information below to identify your laboratory.
Lab Name: Lab Number:
City, State: Country:
Tested By: Lab Phone:

9
HMAIO Sample Instructions for HMAIO 19-20

10
HMAIO Sample Data Sheet for HMAIO 19-20

11
HMASE Sample Instructions for HMASE 73-74

12
HMASE Sample Data Sheet for HMASE 73-74

13
APPENDIX B - T 96 COARSE AGGREGATE GRAPHS

14
Figure B-1- AGC 121-122
Figure B-2- AGC 125-126
Figure B-3- AGC 129-130
Figure B-4- AGC 133-134
Figure B-5- AGC 137-138
Figure B-6- AGC 141-142

15
Figure B-7- AGC 145-146
Figure B-8- AGC 149-150
Figure B-9- AGC 153-154
Figure B-10- AGC 157-158
Figure B-11- AGC 161-162
Figure B-12- AGC 165-166

16
Figure B-13- AGC 169-170
Figure B-14- AGC 173-174
Figure B-15- AGC 177-178

17
APPENDIX C - T 304 FINE AGGREGATE GRAPHS

18
Figure C-1- AGF 123-124
Figure C-2- AGF 127-128
Figure C-3- AGF 131-132
Figure C-4- AGF 135-136
Figure C-5- AGF 139-140
Figure C-6- AGF 143-144

19
Figure C-7- AGF 147-148
Figure C-8- AGF 151-152
Figure C-9- AGF 155-156
Figure C-10- AGF 159-160
Figure C-11- AGF 163-164
Figure C-12- AGF 167-168

20
Figure C-13- AGF 171-172
Figure C-14- AGF 175-176

21
APPENDIX D - T 11 COARSE AND FINE AGGREGATE GRAPHS

22
AGC Graphs
Figure D-1- AGC 177-178
Figure D-2- AGC 173-174
Figure D-3- AGC 169-170
Figure D-4- AGC 165-166
Figure D-5- AGC 161-162
Figure D-6- AGC 157-158
Figure D-7- AGC 153-154
Figure D-8- AGC 149-150

23
Figure D-9- AGC 145-146
Figure D-10- AGC 141-142
Figure D-11- AGC 137-138
Figure D-12- AGC 133-134
Figure D-13- AGC 129-130
Figure D-14- AGC 121-122

24
AGF Graphs
Figure D-15- AGF 175-176
Figure D-16- AGF 171-172
Figure D-17- AGF 167-168
Figure D-18- AGF 163-164
Figure D-19- AGF 159-160
Figure D-20- AGF 155-156
Figure D-21- AGF 151-152
Figure D-22- AGF 147-148

25
Figure D-23- AGF 143-144
Figure D-24- AGF 139-140
Figure D-25- AGF 135-136
Figure D-26- AGF 131-132
Figure D-27- AGF 127-128
Figure D-28- AGF 123-124

26
APPENDIX E - PRECISION STATMENTS FOR T 96, T 304 AND T 11

27
Precision Estimate for AASHTO T 96 - Resistance to Degradation of Small-Size Coarse Aggregate by Abrasion and Impact in the Los Angeles Machine
E.1 Precision and Bias
E.1.1 Precision – Criteria for judging the acceptability of resistance to degradation results obtained by this method are given in Table E-1.
E.1.1.1 Single-Operator Precision (Repeatability) – The figures in Column 2 of Table E-1 are the coefficients of variation that have been found to be appropriate for the conditions of test described in Column 1. Two results obtained in the same laboratory, by the same operator using the same equipment, in the shortest practical period of time, should not be considered suspect unless the difference in the two results, expressed as a percent of their mean, exceeds the values given in Table E-1, Column 3.
E.1.1.2 Multilaboratory Precision (Reproducibility) – The figures in Column 2 of Table E-1 are the coefficients of variation that have been found to be appropriate for the conditions of test described in Column 1. Two results submitted by two different operators testing the same material in different laboratories shall not be considered suspect unless the difference in the two results, expressed as a percent of their mean, exceeds the values given in Table E-1, Column 3.
Table E-1- Precision Estimates
Statistics Coefficient of
Variation 1s (%)a
Acceptable Range of Two Test Results
d2s (%)a
Single-operator Precision LA Abrasion loss (%)
3.0 8.5
Multilaboratory Precision LA Abrasion Loss (%)
6.2 17.6
aThese values represent the 1s% and d2s% limits described in ASTM Practice C670
Note – The precision estimates given in Table E are based on the analysis of test results from fifteen pairs of AMRL Coarse Aggregate proficiency samples. The data analyzed consisted of results from 290 to 513 laboratories for each of the fifteen pairs of samples. The average percent LA Abrasion loss ranged from 13% to 57%. The details of this analysis are in the NCHRP final report for Task 2/Phase A-3 of Research Project 10-87.
E.1.2 Bias – The bias of the procedure in this test method cannot be determined.

28
Precision Estimate for AASHTO T 304 – Uncompacted Void Content of Fine Aggregate
E.2 Precision and Bias
E.2.1 Precision – Criteria for judging the acceptability of void content obtained by this method are given in Table E-2.
E.2.1.1 Single-Operator Precision (Repeatability) – The figures in Column 2 of Table E-2 are the standard deviations that have been found to be appropriate for the conditions of test described in Column 1. Two results obtained in the same laboratory, by the same operator using the same equipment, in the shortest practical period of time, should not be considered suspect unless the difference in the two results exceeds the values given in Table E-2, Column 3.
E.2.1.2 Multilaboratory Precision (Reproducibility) – The figures in Column 2 of Table E-2 are the standard deviations that have been found to be appropriate for the conditions of test described in Column 1. Two results submitted by two different operators testing the same material in different laboratories shall not be considered suspect unless the difference in the two results exceeds the values given in Table E-2, Column 3.
Table E-2- Precision Estimates
Statistics Standard Deviations
1s a
Acceptable Range of Two Test Results
d2s a Single-operator Precision Uncompacted Voids (%)
0.33 0.95
Multilaboratory Precision Uncompacted Voids (%)
0.81 2.29 aThese values represent the 1s (or 1s%) and d2s (or d2s%) limits described in ASTM Practice C670
Note – The precision estimates given in Table E-2 are based on the analysis of test results from fourteen pairs of AMRL Fine Aggregate proficiency samples. The data analyzed consisted of results from 183 to 535 laboratories for each of the fourteen pairs of samples. The average percent uncompacted voids ranged from 42% to 45%. The details of this analysis are in the NCHRP final report for Task 2/Phase A-3 of Research Project 10-87.
E.2.2 Bias – The bias of the procedure in this test method cannot be determined.

29
Precision Estimate for AASHTO T 11 – Materials Finer Than 75-µm (No. 200) Sieve in Mineral Aggregates by Washing
E.3 Precision and Bias
E.3.1 Precision – Criteria for judging the acceptability of percent material finer than a 75-μm (No. 200) sieve by washing obtained by this method are given in Table E-3.
E.3.1.1 Single-Operator Precision (Repeatability) – The figures in Column 2 of Table E-3 are the standard deviations that have been found to be appropriate for the conditions of test described in Column 1. Two results obtained in the same laboratory, by the same operator using the same equipment, in the shortest practical period of time, should not be considered suspect unless the difference in the two results, exceeds the values given in Table E-3, Column 3.
E.3.1.2 Multilaboratory Precision (Reproducibility) – The figures in Column 2 of Table E-3 are the standard deviations that have been found to be appropriate for the conditions of test described in Column 1. Two results submitted by two different operators testing the same material in different laboratories shall not be considered suspect unless the difference in the two results exceeds the values given in Table E-3, Column 3.
Table E-3- Precision Estimates
Condition of Test Standard Deviation
1s a
Acceptable Range of Two Test Results
d2s a Single-operator Precision Percent finer than75- μm sieve by washing (%)
Coarse Aggregate 0.10 0.28
Fine Aggregate 0.14 0.39 Multilaboratory Precision Percent finer than 75- μm sieve by washing (%)
Coarse Aggregate 0.21 0.59
Fine Aggregate 0.32 0.90 aThese values represent the 1s (or 1s%) and d2s (or d2s%) limits described in ASTM Practice C670
Note – The precision estimates given in Table E are based on the analysis of test results from fourteen pairs of Coarse Aggregate and fourteen pairs of Fine Aggregate of the AMRL Proficiency Sample Program. The data analyzed consisted of results from 552 to 1380 laboratories for each of the fourteen pairs of samples of each coarse and fine aggregates. The average percent finer than 75- μm Sieve was less than 1.5% for coarse aggregate and in a range of 1% to 3% for fine aggregate. The details of this analysis are in the NCHRP final report of Task 2/Phase A-3 of Research Project 10-87.
E.3.2 Bias – The bias of the procedure in this test method cannot be determined.

30
APPENDIX F - COARSE AGGREGATE- WASHING METHOD TABLES AND GRAPHS

31
Total Material Passing Scatter Plot Graphs
AGC 169-170
Figure F-1- Total Material Passing the 25.0-mm (1-in.) Sieve
Figure F-2- Total Material Passing the 19.0-mm (34-in.) Sieve
Figure F-3- Total Material Passing the 12.5-mm (12-in.) Sieve
Figure F-4- Total Material Passing the 9.5-mm (38-in.) Sieve
Figure F-5- Total Material Passing the 4.75-mm (No. 4) Sieve
Figure F-6- Percentage Finer than the 75-µm sieve by washing

32
AGC 173-174
Figure F-7- Total Material Passing the 25.0-mm (1-in.) Sieve
Figure F-8- Total Material Passing the 19.0-mm (34-in.) Sieve
Figure F-9- Total Material Passing the 12.5-mm (12-in.) Sieve
Figure F-10- Total Material Passing the 9.5-mm (38-in.) Sieve
Figure F-11- Total Material Passing the 4.75-mm (No. 4) Sieve
Figure F-12- Percentage Finer than the 75-µm sieve by washing

33
AGC 177-178
Figure F-13- Total Material Passing the 25.0-mm (1-in.) Sieve
Figure F-14- Total Material Passing the 19.0-mm (34-in.) Sieve
Figure F-15- Total Material Passing the 12.5-mm (12-in.) Sieve
Figure F-16- Total Material Passing the 9.5-mm (38-in.) Sieve
Figure F-17- Total Material Passing the 4.75-mm (No. 4) Sieve
Figure F-18- Percentage Finer than the 75-µm sieve by washing

Percent Passing Bar Graphs
Average Percent Passing
Figure F-19- Total Material Passing the 25.0-mm Sieve
Figure F-20- Total Material Passing the 19.0-mm Sieve
Figure F-21- Total Material Passing the 12.5-mm Sieve
Figure F-22- Total Material Passing the 9.5-mm Sieve
Figure F-23- Total Material Passing the 4.75-mm Sieve
Figure F-24- Total Material Passing the 75-µm Sieve
99.6599.799.7599.899.8599.999.95100
100.05
169‐170 173‐174 177‐178 Pooled
Manual Mechanical
84
84.5
85
85.5
86
86.5
87
169‐170 173‐174 177‐178 Pooled
Manual Mechanical
44
46
48
50
52
54
169‐170 173‐174 177‐178 Pooled
Manual Mechanical
0
5
10
15
20
169‐170 173‐174 177‐178 Pooled
Manual Mechanical
0
0.5
1
1.5
2
2.5
3
169‐170 173‐174 177‐178 Pooled
Manual Mechanical
0
0.2
0.4
0.6
0.8
1
1.2
1.4
1.6
169‐170 173‐174 177‐178 Pooled
Manual Mechanical

Repeatability Standard Deviation Percent Passing
Figure F-25- Total Material Passing the 25.0-mm Sieve
Figure F-26- Total Material Passing the 19.0-mm Sieve
Figure F-27- Total Material Passing the 12.5-mm Sieve
Figure F-28- Total Material Passing the 9.5-mm Sieve
Figure F-29- Total Material Passing the 4.75-mm Sieve
Figure F-30- Total Material Passing the 75-µm Sieve
0
0.05
0.1
0.15
0.2
0.25
169‐170 173‐174 177‐178 Pooled
Manual Mechanical
0
0.1
0.2
0.3
0.4
0.5
169‐170 173‐174 177‐178 Pooled
Manual Mechanical
0
0.2
0.4
0.6
0.8
1
169‐170 173‐174 177‐178 Pooled
Manual Mechanical
0
0.1
0.2
0.3
0.4
0.5
0.6
0.7
0.8
0.9
169‐170 173‐174 177‐178 Pooled
Manual Mechanical
0
0.05
0.1
0.15
0.2
0.25
0.3
0.35
169‐170 173‐174 177‐178 Pooled
Manual Mechanical
0
0.05
0.1
0.15
0.2
169‐170 173‐174 177‐178 Pooled
Manual Mechanical

Reproducibility Standard Deviation Percent Passing
Figure F-31- Total Material Passing the 25.0-mm Sieve
Figure F-32- Total Material Passing the 19.0-mm Sieve
Figure F-33- Total Material Passing the 12.5-mm Sieve
Figure F-34- Total Material Passing the 9.5-mm Sieve
Figure F-35- Total Material Passing the 4.75-mm Sieve
Figure F-36- Total Material Passing the 75-µm Sieve
0
0.05
0.1
0.15
0.2
0.25
0.3
169‐170 173‐174 177‐178 Pooled
Manual Mechanical
0
0.1
0.2
0.3
0.4
0.5
0.6
0.7
0.8
169‐170 173‐174 177‐178 Pooled
Manual Mechanical
1.25
1.3
1.35
1.4
1.45
1.5
1.55
169‐170 173‐174 177‐178 Pooled
Manual Mechanical
0
0.2
0.4
0.6
0.8
1
1.2
1.4
169‐170 173‐174 177‐178 Pooled
Manual Mechanical
0
0.1
0.2
0.3
0.4
0.5
0.6
0.7
0.8
169‐170 173‐174 177‐178 Pooled
Manual Mechanical
0
0.1
0.2
0.3
0.4
0.5
169‐170 173‐174 177‐178 Pooled
Manual Mechanical

37
Summaries of Statistics
AGC 169-170 Summaries of Statistics
Table F-1- Summary of statistics of percent passing various sieve sizes from washing AGC 169-170 samples, all washing methods
Sample No./
Washing Method
Size No. of Labs
Average Results
Repeatability Reproducibility
X Y 1s X
samples CV%
Y samples CV%
X samples Y samples
1s CV% 1s CV%
AGC 169‐170
All Methods of
Washing
25.0 mm 1327 99.8 99.8 0.20 0.20 0.20 0.23 0.23 0.30 0.30
19.0 mm 1246 88.4 83.6 0.41 0.46 0.49 0.49 0.56 0.61 0.73
12.5 mm 1307 53.4 51.4 0.78 1.47 1.52 1.57 2.95 1.40 2.71
9.5 mm 1389 15.0 14.1 0.77 5.12 5.45 1.20 8.05 1.36 9.65
4.75 mm 1372 2.5 2.3 0.32 12.36 13.64 0.74 28.97 0.70 30.16
75 µm, washing
1326 1.3 1.1 0.17 13.17 14.86 0.39 30.89 0.38 33.50
Table F-2- Summary of statistics of percent passing various sieve sizes from manual washing of AGC 169-170 samples
Sample No./
Washing Method
Size No. of Labs
Average Results
Repeatability Reproducibility
X Y 1s X
samples CV%
Y samples CV%
X samples Y samples
1s CV% 1s CV%
AGC 169‐170 Manual Washing
25.0 mm 1157 99.8 99.8 0.20 0.20 0.20 0.23 0.23 0.30 0.30
19.0 mm 1090 88.4 83.6 0.41 0.46 0.48 0.49 0.55 0.61 0.72
12.5 mm 1147 53.4 51.4 0.79 1.48 1.54 1.58 2.96 1.39 2.70
9.5 mm 1219 14.9 14.0 0.77 5.14 5.46 1.20 8.04 1.34 9.54
4.75 mm 1206 2.5 2.3 0.32 12.58 13.94 0.73 29.15 0.68 29.87
75 µm, washing
1178 1.2 1.1 0.16 13.21 14.93 0.37 30.18 0.36 32.69
Table F-3- Summary of statistics of percent passing various sieve sizes from mechanical washing of AGC 169-170 samples
Sample No./
Washing Method
Size No. of Labs
Average Results
Repeatability Reproducibility
X Y 1s X
samples CV%
Y samples CV%
X samples Y samples
1s CV% 1s CV%
AGC 169‐170
Mechanical Washing
25.0 mm 126 99.8 99.8 0.21 0.21 0.21 0.21 0.21 0.31 0.31
19.0 mm 116 88.5 83.8 0.38 0.43 0.45 0.44 0.50 0.57 0.68
12.5 mm 117 53.6 51.6 0.76 1.41 1.47 1.50 2.79 1.41 2.73
9.5 mm 121 15.5 14.7 0.81 5.20 5.50 1.01 6.50 1.30 8.85
4.75 mm 118 2.9 2.7 0.29 9.81 10.56 0.65 22.14 0.67 24.71
75 µm, washing
106 1.6 1.4 0.19 11.71 13.31 0.43 27.38 0.42 30.49

38
AGC 173-174 Summaries of Statistics
Table F-4- Summary of statistics of percent passing various sieve sizes from washing of AGC 173-174 samples, all washing methods
Sample No./
Washing Method
Size No. of Labs
Average Results
Repeatability Reproducibility
X Y 1s X
samples CV%
Y samples CV%
X samples Y samples
1s CV% 1s CV%
AGC 173‐174
All Methods
of Washing
25.0 mm 1230 100.0 100.0 0.00 0.00 0.00 0.00 0.00 0.00 0.00
19.0 mm 1350 86.0 86.9 0.44 0.51 0.51 0.67 0.78 0.65 0.75
12.5 mm 1387 51.2 51.7 0.91 1.77 1.75 1.40 2.73 1.55 3.00
9.5 mm 1370 16.6 17.4 0.40 2.40 2.28 0.62 3.74 0.64 3.65
4.75 mm 1404 0.50 0.52 0.09 18.87 17.82 0.18 35.68 0.19 36.71
75 µm washing
1371 0.26 0.27 0.04 15.45 15.12 0.12 44.15 0.12 43.81
Table F-5- Summary of statistics of percent passing various sieve sizes from manual washing of AGC 173-174 samples
Sample No./
Washing Method
Size No. of Labs
Average Results
Repeatability Reproducibility
X Y 1s X
samples CV%
Y samples CV%
X samples Y samples
1s CV% 1s CV%
AGC 173‐174 Manual Washing
25.0 mm 1074 100.0 100.0 0.00 0.00 0.00 0.00 0.00 0.00 0.00
19.0 mm 1189 86.0 86.9 0.44 0.51 0.51 0.68 0.79 0.66 0.76
12.5 mm 1219 51.2 51.7 0.91 1.78 1.77 1.41 2.75 1.56 3.02
9.5 mm 1205 16.5 17.4 0.40 2.42 2.30 0.62 3.75 0.64 3.67
4.75 mm 1240 0.5 0.5 0.09 18.92 17.88 0.17 35.92 0.19 36.35
75 µm washing
1227 0.3 0.3 0.04 15.79 15.44 0.11 44.08 0.11 43.67
Table F-6- Summary of statistics of percent passing various sieve sizes from mechanical washing of AGC 173-174 samples
Sample No./
Washing Method
Size No. of Labs
Average Results
Repeatability Reproducibility
X Y 1s X
samples CV%
Y samples CV%
X samples Y samples
1s CV% 1s CV%
AGC 173‐174
Mechanical Washing
25.0 mm 135 100.0 100.0 0.00 0.00 0.00 0.00 0.00 0.00 0.00
19.0 mm 140 86.1 87.0 0.43 0.50 0.49 0.58 0.67 0.58 0.67
12.5 mm 149 51.5 52.0 0.83 1.62 1.60 1.28 2.48 1.45 2.79
9.5 mm 145 16.8 17.6 0.39 2.34 2.23 0.57 3.37 0.58 3.30
4.75 mm 143 0.6 0.6 0.10 18.07 16.79 0.18 31.58 0.21 34.58
75 µm washing
133 0.3 0.3 0.04 13.00 12.58 0.13 37.99 0.13 37.01

39
AGC 177-178 Summaries of Statistics
Table F-7- Summary of statistics of percent passing various sieve sizes from washing of AGC 177-178 samples, all washing methods
Sample No./
Washing Method
Size No. of Labs
Average Results Repeatability Reproducibility
X Y 1s X
samples CV%
Y samples CV%
X samples Y samples
1s CV% 1s CV%
AGC 177‐178
All Methods
of Washing
25.0 mm 1259 100 100 0 0 0 0 0 0 0
19.0 mm 1416 86.0 84.3 0.46 0.54 0.55 0.72 0.83 0.75 0.89
12.5 mm 1475 48.1 46.9 0.78 1.63 1.67 1.46 3.04 1.56 3.33
9.5 mm 1449 14.6 13.6 0.35 2.41 2.57 0.60 4.10 0.57 4.16
4.75 mm 1411 0.45 0.45 0.07 14.64 14.57 0.18 40.89 0.18 41.22
75 µm washing 1380
0.19 0.19 0.02 12.0 11.89 0.06 30.11 0.06 29.57
Table F-8- Summary of statistics of percent passing various sieve sizes from manual washing of AGC 177-178 samples
Sample No./
Washing
Method
Size No. of Labs
Average Results Repeatability Reproducibility
X Y 1s X
samples CV%
Y samples CV%
X samples Y samples
1s CV% 1s CV%
AGC 177‐178 Manual Washing
25.0 mm 1112 100 100 0 0 0 0 0 0 0
19.0 mm 1240 85.98 84.35 0.47 0.54 0.55 0.72 0.83 0.76 0.90
12.5 mm 1291 48.04 46.92 0.78 1.62 1.66 1.46 3.04 1.57 3.34
9.5 mm 1270 14.54 13.61 0.35 2.40 2.56 0.60 4.11 0.57 4.17
4.75 mm 1239 0.43 0.44 0.07 15.10 14.99 0.18 41.26 0.18 41.77
75 µm washing
1238 0.18 0.18 0.02 12.38 12.29 0.05 28.56 0.05 28.10
Table F-9- Summary of statistics of percent passing various sieve sizes from mechanical washing of AGC 177-178 samples
Sample No./
Washing Method
Size No. of Labs
Average Results
Repeatability Reproducibility
X Y 1s X
samples CV%
Y samples CV%
X samples Y samples
1s CV% 1s CV%
AGC 177‐178
Mechanical Washing
25.0 mm 127 100 100 0 0 0 0 0 0 0
19.0 mm 157 86.06 84.34 0.42 0.49 0.50 0.70 0.82 0.66 0.79
12.5 mm 165 48.15 47.06 0.80 1.67 1.71 1.45 3.01 1.57 3.33
9.5 mm 159 14.69 13.77 0.36 2.44 2.60 0.54 3.67 0.53 3.83
4.75 mm 153 0.54 0.54 0.06 11.79 11.94 0.18 32.63 0.17 32.48
75 µm washing
131 0.25 0.24 0.02 8.98 9.01 0.06 25.71 0.06 26.14

40
Statistical Tests of Significance
AGC 169-170 Statistical test of significance
Table F-10- Statistical t-test for comparison of average percent passing various sieve sizes from mechanical and manual washing of AGC 169-170 samples
Sieve Size percent passing,
Manual Percent passing, Mechanical
Degrees of Freedom computed t
25.0‐mm 99.8 99.8 154 ‐0.47
19.0‐mm 86 86.1 145 ‐1.97
12.5‐mm 52.4 52.6 142 ‐1.55
9.5‐mm 14.5 15.1 150 ‐5.82
4.75‐mm 2.4 2.8 145 ‐6.52
75‐µm washing 1.2 1.5 119 ‐7.5
Note: Critical t for 1% level of significance is 2.61 and for 5% level of significance is 1.98
Table F-11- Statistical F-test for comparison of repeatability standard deviation s of percent passing various sieve sizes from mechanical and manual washing of AGC 169-170 samples
Sieve Size Repeatability
Manual
Repeatability Mechanical
Deg. of Freedom
F Computed
Critical F(α=.01) Critical F(α=.05)
25.0‐mm 0.2 0.21 125 & 1156 1.1 1.34 1.23
19.0‐mm 0.41 0.38 1089 & 115 1.13 1.41 1.27
12.5‐mm 0.79 0.76 1146 & 116 1.09 1.41 1.27
9.5‐mm 0.77 0.81 120 & 1218 1.11 1.35 1.24
4.75‐mm 0.32 0.29 1205 & 117 1.23 1.4 1.27
75‐µm washing 0.16 0.19 105 & 1177 1.29 1.37 1.25
Table F-12- Statistical F-test for comparison of reproducibility standard deviation of percent passing various sieve sizes from mechanical and manual washing of AGC 169-170 samples
Sieve Size Reproducibility
Manual Reproducibility Mechanical
Deg. of Freedom
F Computed
Critical F(α=.01) Critical F(α=.05)
25.0‐mm 0.27 0.26 1156 & 125 1.02 1.39 1.26
19.0‐mm 0.55 0.51 1089 & 115 1.15 1.41 1.27
12.5‐mm 1.49 1.45 1146 & 116 1.05 1.41 1.27
9.5‐mm 1.27 1.16 1218 & 120 1.19 1.4 1.27
4.75‐mm 0.71 0.66 1205 & 117 1.16 1.4 1.27
75‐µm washing
0.37 0.43 105 & 1177 1.38 1.37 1.25

41
AGC 173-174 Statistical test of significance
Table F-13- Statistical t-test for comparison of average percent passing various sieve sizes from mechanical and manual washing of AGC 173-174 samples
Note: Critical t for 1% level of significance is 2.60 and for 5% level of significance is 1.97 Table F-14- Statistical F-test for comparison of repeatability standard deviation of percent passing various sieve sizes from mechanical and manual washing of AGC 173-174 samples
Sieve Size 1s Repeatability std,
Manual 1s Repeatability Std, Mechanical
Degrees of Freedom
Computed F
Critical F(α=.01)
Critical F(α=.05)
25.0‐mm 0 0 134 & 1073 ‐ 1.33 1.23
19.0‐mm 0.44 0.43 1188 & 139 1.06 1.37 1.24
12.5‐mm 0.91 0.83 1218 & 148 1.2 1.35 1.24
9.5‐mm 0.4 0.39 1204 & 144 1.03 1.36 1.24
4.75‐mm 0.09 0.1 142 & 1239 1.26 1.32 1.22
75‐µm washing
0.04 0.04 132 & 1226 1.15 1.33 1.23
Table F-15- Statistical F test for comparison of reproducibility standard deviation of percent passing various sieve sizes from mechanical and manual washing of AGC 173-174
Sieve Size 1s Reproducibility
std, Manual 1s Reproducibility Std,
Mechanical Deg. of Freedom
Computed F
Critical F(α=.01)
Critical F(α=.05)
25.0‐mm 0 0 134 & 1073 ‐ 1.33 1.23
19.0‐mm 0.67 0.58 1188 & 139 1.34 1.37 1.24
12.5‐mm 1.49 1.37 1218 & 148 1.18 1.35 1.24
9.5‐mm 0.63 0.57 1204 & 144 1.2 1.36 1.24
4.75‐mm 0.18 0.2 142 & 1239 1.19 1.32 1.22
75‐µm washing
0.11 0.13 132 & 1226 1.25 1.33 1.23
Sieve Size percent passing,
Manual Percent passing, Mechanical
Deg. of Freedom computed t
25.0‐mm 100 100 ‐ ‐
19.0‐mm 86.4 86.5 186 ‐1.59
12.5‐mm 51.4 51.7 193 ‐2.59
9.5‐mm 17 17.2 188 ‐5.05
4.75‐mm 0.5 0.59 171 ‐5.37
75‐µm washing 0.26 0.34 156 ‐6.95

42
AGC 177-178 Statistical test of significance
Table F-16- Statistical t-test for comparison of average percent passing various sieve sizes from mechanical and manual washing of AGC 177-178 samples
Sieve Size percent passing,
Manual Percent passing, Mechanical
Deg. of Freedom computed t
25.0‐mm 100 100 ‐ ‐
19.0‐mm 85.2 85.2 205 ‐0.66
12.5‐mm 47.5 47.6 209 ‐1
9.5‐mm 14.1 14.2 208 ‐3.46
4.75‐mm 0.44 0.54 194 ‐6.99
75‐µm washing 0.18 0.24 149 ‐10.9
Note: Critical t for 1% level of significance is 2.60 and for 5% level of significance is 1.97
Table F-17- Statistical F-test for comparison of repeatability standard deviation of percent passing various sieve sizes from mechanical and manual washing of AGC 177-178 samples
Sieve Size 1s Repeatability std,
Manual 1s Repeatability Std, Mechanical
Degrees of Freedom
Computed F
Critical F(α=.01)
Critical F(α=.05)
25.0‐mm 0 0 126 & 1111 ‐ 1.34 1.23
19.0‐mm 0.47 0.42 1239 & 156 1.25 1.34 1.23
12.5‐mm 0.78 0.8 164 & 1290 1.06 1.3 1.2
9.5‐mm 0.35 0.36 158 & 1269 1.05 1.3 1.21
4.75‐mm 0.07 0.06 1238 & 152 1.04 1.35 1.23
75‐µm washing
0.02 0.02 1237 & 130 1.04 1.38 1.25
Table F-18- Statistical F test for comparison of reproducibility standard deviation of percent passing various sieve sizes from mechanical and manual washing of AGC 177-178
Sieve Size 1s Reproducibility
std, Manual 1s Reproducibility Std,
Mechanical Deg. of Freedom
Computed F
Critical F(α=.01)
Critical F(α=.05)
25.0‐mm 0 0 126 & 1111 ‐ 1.34 1.23
19.0‐mm 0.74 0.68 1239 & 156 1.17 1.34 1.23
12.5‐mm 1.51 1.51 1290 & 164 1.01 1.33 1.22
9.5‐mm 0.58 0.53 1269 & 158 1.19 1.34 1.23
4.75‐mm 0.18 0.18 1238 & 152 1.05 1.35 1.23
75‐µm washing
0.05 0.06 130 & 1237 1.51 1.33 1.23

43
APPENDIX G - FINE AGGREGATE- WASHING METHOD TABLES AND GRAPHS

44
Total Material Passing Scatter Plot Graphs
AGF 171-172
Figure G-1- Total Material Passing the 4.75-mm (No. 4) Sieve
Figure G-2- Total Material Passing the 2.36-mm (No. 8) Sieve
Figure G-3- Total Material Passing the 1.18-mm (No. 16) Sieve
Figure G-4- Total Material Passing the 600-µm (No. 30) Sieve
Figure G-5- Total Material Passing the 300-µm (No. 50) Sieve
Figure G-6- Total Material Passing the 150-µm (No. 100) Sieve

45
Figure G-7- Total Material Passing the 75-µm (No. 200) Sieve
Figure G-8- Percentage Finer than the 75-um sieve by washing

46
AGF 175-176
Figure G-9- Total Material Passing the 2.36-mm (No. 8) Sieve
Figure G-10- Total Material Passing the 1.18-mm (No. 16) Sieve
Figure G-11- Total Material Passing the 600-µm (No. 4) Sieve
Figure G-12- Total Material Passing the 300-µm (No. 4) Sieve
Figure G-13- Total Material Passing the 150-µm (No. 4) Sieve
Figure G-14- Total Material Passing the 75-µm (No. 4) Sieve

47
Figure G-15- Percentage Finer than the 75-um sieve by washing

48
AGF 179-180
Figure G-16- Total Material Passing the 2.36-mm (No. 8) Sieve
Figure G-17- Total Material Passing the 1.18-mm (No. 16) Sieve
Figure G-18- Total Material Passing the 600-µm (No. 4) Sieve
Figure G-19- Total Material Passing the 300-µm (No. 4) Sieve
Figure G-20- Total Material Passing the 150-µm (No. 4) Sieve
Figure G-21- Total Material Passing the 75-µm (No. 4) Sieve

Figure G-22- Percentage Finer than the 75-um sieve by washing

Figure G-23- Average percent passing from manual and mechanical washing of AGF
99.7
99.75
99.8
99.85
99.9
99.95
100
100.05
171‐172 175‐176 179‐180 Pooled
Manual Vs. Mechanical 4.75‐mm Average Percent Passing
Manual Mechanical
85
85.2
85.4
85.6
85.8
86
86.2
86.4
171‐172 175‐176 179‐180 Pooled
Manual Vs. Mechanical 2.23‐mm Average Percent Passing
Manual Mechanical
70.2
70.4
70.6
70.8
71
71.2
71.4
171‐172 175‐176 179‐180 Pooled
Manual Vs. Mechanical 1.18‐mm Average Percent Passing
Manual Mechanical
51
51.5
52
52.5
53
171‐172 175‐176 179‐180 Pooled
Manual Vs. Mechanical 600‐µm Average Percent Passing
Manual Mechanical
17
17.5
18
18.5
19
19.5
20
20.5
21
171‐172 175‐176 179‐180 Pooled
Manual Vs. Mechanical 300‐µm Average
Percent Passing
Manual Mechanical
0
1
2
3
4
5
6
171‐172 175‐176 179‐180 Pooled
Manual Vs. Mechanical 150‐µm Average Percent Passing
Manual Mechanical
0
0.5
1
1.5
2
171‐172 175‐176 179‐180 Pooled
Manual Vs. Mechanical 75‐µm Average of Total Percent Passing
Manual Mechanical
0
0.5
1
1.5
2
171‐172 175‐176 179‐180 Pooled
Manual Vs. Mechanical ‐75µm Average
Percent Passing by Washing
Manual Mechanical

G-24- Repeatability of percent passing from manual and mechanical washing of AGF
0
0.05
0.1
0.15
171‐172 175‐176 179‐180 Pooled
Manual Vs. Mechanical 4.57‐mm
Repeatability Percent Passing
Manual Mechanical
0
0.1
0.2
0.3
0.4
0.5
171‐172 175‐176 179‐180 Pooled
Manual Vs. Mechanical 2.36‐mm
Repeatability Percent Passing
Manual Mechanical
0
0.1
0.2
0.3
0.4
0.5
171‐172 175‐176 179‐180 Pooled
Manual Vs. Mechanical 1.18 mm
Repeatability Percent Passing
Manual Mechanical
0
0.1
0.2
0.3
0.4
171‐172 175‐176 179‐180 Pooled
Manual Vs. Mechanical 600 µm
Repeatability Percent Passing
Manual Mechanical
0
0.05
0.1
0.15
0.2
0.25
0.3
171‐172 175‐176 179‐180 Pooled
Manual Vs. Mechanical 300 µm Repeatability Percent Passing
Manual Mechanical
0
0.05
0.1
0.15
171‐172 175‐176 179‐180 Pooled
Manual Vs. Mechanical 150 µm
Repeatability Percent Passing
Manual Mechanical
0
0.02
0.04
0.06
0.08
0.1
0.12
171‐172 175‐176 179‐180 Pooled
Manual Vs. Mechanical 75 µm
Repeatability Total Percent Passing
Manual Mechanical
0
0.02
0.04
0.06
0.08
0.1
0.12
171‐172 175‐176 179‐180 Pooled
Manual Vs. Mechanical 75 µm
Repeatability Percent Passing by Washing
Manual Mechanical

G-25- Reproducibility of percent passing from manual and mechanical washing of AGF
0
0.05
0.1
0.15
171‐172 175‐176 179‐180 Pooled
Manual Vs. Mechanical 4.75‐mm Reproducibility Percent Passing
Manual Mechanical
0
0.2
0.4
0.6
0.8
171‐172 175‐176 179‐180 Pooled
Manual Vs. Mechanical 2.36‐mm Reproducibility Percent Passing
Manual Mechanical
0
0.1
0.2
0.3
0.4
0.5
0.6
171‐172 175‐176 179‐180 Pooled
Manual Vs. Mechanical 1.18‐mm Reproducibility Percent Passing
Manual Mechanical
0.7
0.75
0.8
0.85
171‐172 175‐176 179‐180 Pooled
Manual Vs. Mechanical 600 µm
Reproducibility Percent Passing
Manual Mechanical
0
0.5
1
171‐172 175‐176 179‐180 Pooled
Manual Vs. Mechanical 300 µm Reproducibility Percent Passing
Manual Mechanical
0
0.1
0.2
0.3
0.4
171‐172 175‐176 179‐180 Pooled
Manual Vs. Mechanical 150 µm Reproducibility Percent Passing
Manual Mechanical
0
0.1
0.2
0.3
171‐172 175‐176 179‐180 Pooled
Manual Vs. Mechanical 75 µm
Reproducibility Total Percent Passing
Manual Mechanical
0
0.1
0.2
0.3
171‐172 175‐176 179‐180 Pooled
Manual Vs. Mechanical 75 µm Reproducibility Percent Passing by Washing
Manual Mechanical

Summaries of Statistics
AGF 171-172 Summaries of Statistics Table G-1- Summary of statistics for percent passing various sieve sizes after washing of AGF 171-172, all methods combined
Sample No./Washing
Method Size
No. of Labs
Average Results Repeatability Reproducibility
X Y 1s X samples
CV% Y samples
CV%
X samples Y samples
1s CV% 1s CV%
AGF171‐172 All Methods of Washing
4.75 mm 1327 100 99.7 0.1 0.1 0.1 0.04 0.04 0.15 0.15
2.36 mm 1347 85.9 85 0.46 0.54 0.54 0.43 0.5 0.66 0.77
1.18 mm 1347 72.8 69.5 0.43 0.59 0.62 0.29 0.4 0.65 0.94
600 µm 1319 54.8 50.8 0.35 0.64 0.7 0.78 1.42 0.87 1.72
300 µm 1292 19.5 17.4 0.19 1 1.11 0.65 3.33 0.63 3.6
150 µm 1271 5 4.5 0.13 2.64 2.96 0.28 5.49 0.3 6.69
75 µm, total 1292 1.7 1.6 0.1 5.91 6.55 0.18 10.07 0.24 15.15
75 µm, washing 1331 1.6 1.4 0.1 6.17 6.88 0.21 13.33 0.26 18.19
Table G-2- Summary of statistics of percent passing various sieve sizes from manual washing of AGF 171-172 samples
Sample No./Washing Method
Size No. of Labs
Average Results Repeatability Reproducibility
X Y 1s X samples
CV% Y samples
CV%
X samples Y samples
1s CV% 1s CV%
AGF171‐172 Manual Method of Washing
4.75 mm 1217 100 99.7 0.1 0.1 0.1 0.04 0.04 0.15 0.15
2.36 mm 1237 85.9 85 0.46 0.54 0.54 0.42 0.49 0.66 0.77
1.18 mm 1233 72.8 69.5 0.43 0.6 0.62 0.29 0.4 0.66 0.94
600 µm 1207 54.8 50.8 0.35 0.64 0.69 0.78 1.42 0.88 1.72
300 µm 1183 19.4 17.4 0.19 0.99 1.1 0.64 3.31 0.62 3.56
150 µm 1159 5 4.5 0.13 2.6 2.92 0.28 5.49 0.3 6.70
75 µm, total 1182 1.7 1.6 0.1 5.88 6.55 0.18 10.16 0.24 15.38
75 µm washing 1222 1.6 1.4 0.1 6.2 6.94 0.21 13.48 0.26 18.43
Table G-3- Summary of statistics of percent passing various sieve sizes from mechanical washing of AGF 171-172 samples
Sample No./Washing Method
Size No. of Labs
Average Results Repeatability Reproducibility
X Y 1s X samples
CV% Y samples
CV%
X samples Y samples
1s CV% 1s CV%
AGF171‐172 Mechanical Method of Washing
4.75 mm 98 100 99.7 0.12 0.12 0.12 0.04 0.04 0.17 0.17
2.36 mm 99 86.1 85.2 0.47 0.54 0.55 0.45 0.53 0.62 0.73
1.18 mm 102 72.8 69.7 0.38 0.52 0.55 0.28 0.4 0.55 0.8
600 µm 101 54.8 50.9 0.36 0.66 0.71 0.77 1.41 0.82 1.61
300 µm 98 19.6 17.6 0.2 1.01 1.12 0.7 3.57 0.66 3.77
150 µm 99 5.1 4.6 0.14 2.68 2.96 0.28 5.45 0.28 6.04
75 µm 99 1.8 1.7 0.1 5.81 6.24 0.15 8.21 0.18 10.72
75 µm washing 102 1.6 1.5 0.08 4.96 5.29 0.18 11.13 0.21 13.55

AGF 175-176 Summaries of Statistics Table G-4- Summary of statistics for percent passing various sieve sizes after washing of AGF 175-176 samples, all methods combined
Sample No./Washing
Method Size
No. of Labs
Average Results Repeatability Reproducibility
X Y 1s X samples
CV% Y samples
CV%
X samples Y samples
1s CV% 1s CV%
AGF175‐176 All Methods of Washing
4.75 mm 1520 100.0 100.0 0 0.00 0.00 0.00 0.00 0.00 0.00
2.36 mm 1404 85.2 86.7 0.31 0.37 0.36 0.75 0.88 0.66 0.76
1.18 mm 1429 70.4 71.0 0.26 0.37 0.37 0.36 0.51 0.41 0.58
600 µm 1451 52.2 52.0 0.31 0.59 0.59 0.74 1.42 0.76 1.46
300 µm 1426 20.3 20.2 0.26 1.28 1.29 0.79 3.89 0.78 3.88
150 µm 1428 1.6 1.6 0.10 6.20 5.99 0.22 13.85 0.22 13.37
75 µm 1397 0.38 0.4 0.06 15.73 16.02 0.16 42.37 0.16 42.49
75 µm washing 1354 0.31 0.30 0.04 13.33 13.69 0.13 42.29 0.13 43.71
Table G-5- Summary of statistics of percent passing various sieve sizes from manual washing of AGF 175-176 samples
Sample No./Washing
Method Size
No. of Labs
Average Results Repeatability Reproducibility
X Y 1s X samples
CV% Y samples
CV%
X samples Y samples
1s CV% 1s CV%
AGF175‐176 Manual Method of Washing
4.75 mm 1237 100 100 0 0 0 0 0 0 0
2.36 mm 1281 85.2 86.7 0.31 0.37 0.36 0.76 0.89 0.65 0.75
1.18 mm 1304 70.4 71 0.26 0.37 0.37 0.35 0.50 0.41 0.58
600 µm 1300 52.2 52 0.31 0.6 0.6 0.74 1.41 0.76 1.46
300 µm 1325 20.3 20.2 0.26 1.3 1.3 0.79 3.89 0.78 3.88
150 µm 1308 1.55 1.61 0.1 6.2 5.99 0.21 13.74 0.21 13.3
75 µm, total 1280 0.38 0.37 0.06 15.8 16.2 0.16 42.48 0.16 42.8
75 µm washing
1383 0.31 0.30 0.04 13.4 13.8 0.13 42.63 0.13 44.2
Table G-6- Summary of statistics of percent passing various sieve sizes from mechanical washing of AGF 175-176 samples
Sample No./Washing Method
Size No. of Labs
Average Results Repeatability Reproducibility
X Y 1s X samples
CV% Y samples
CV%
X samples Y samples
1s CV% 1s CV%
AGF175‐176 Mechanical Method of Washing
4.75 mm 122 100.0 100.00 0.00 0.00 0.00 0.00 0.00 0.00 0.00
2.36 mm 110 85.45 86.93 0.32 0.38 0.37 0.64 0.74 0.66 0.76
1.18 mm 108 70.47 71.05 0.26 0.36 0.36 0.40 0.57 0.42 0.58
600 µm 113 52.31 52.06 0.27 0.52 0.52 0.79 1.50 0.76 1.45
300 µm 113 20.38 20.36 0.22 1.07 1.07 0.77 3.76 0.74 3.61
150 µm 111 1.63 1.68 0.10 6.31 6.11 0.23 14.02 0.22 13.26
75 µm, total 102 0.45 0.44 0.06 13.75 14.03 0.17 36.60 0.16 36.19
75 µm washing 107 0.37 0.37 0.04 12.06 12.19 0.13 35.18 0.13 35.43

AGF 179-180 Summaries of Statistics Table G-7- Summary of statistics of percent passing various sieve sizes from manual washing of AGF 179-180 samples
Sample No./Washing
Method Size
No. of Labs
Average Results Repeatability Reproducibility
X Y 1s X
samples CV%
Y samples CV%
X samples Y samples
1s CV% 1s CV%
AGF179‐180 All Methods of Washing
4.75 mm 1588 100 100 0.00 0.00 0.00 0.00 0.00 0.00 0.00
2.36 mm 1484 86.80 85.03 0.33 0.38 0.39 0.67 0.78 0.75 0.88
1.18 mm 1493 71.95 70.48 0.21 0.29 0.30 0.40 0.55 0.39 0.56
600 µm 1507 52.17 51.09 0.26 0.51 0.52 0.80 1.54 0.80 1.57
300 µm 1498 20.43 20.05 0.23 1.12 1.14 0.68 3.35 0.68 3.41
150 µm 1475 4.33 4.45 0.12 2.80 2.72 0.34 7.96 0.37 8.24
75 µm, total
1494 1.09 1.31 0.10 9.54 7.98 0.24 22.40 0.26 20.10
75 µm washing
1526 0.95 1.16 0.09 9.82 8.06 0.26 27.06 0.28 24.23
Table G-8- Summary of statistics of percent passing various sieve sizes from manual washing of AGF 179-180 samples
Sample No./Wash
ing Method
Size No. of Labs
Average Results Repeatability Reproducibility
X Y 1s X
samples CV%
Y samples CV%
X samples Y samples
1s CV% 1s CV%
AGF179‐180
Manual Method
of Washing
4.75 mm 1445 100 100 0.00 0.00 0.00 0.00 0.00 0.00 0.00
2.36 mm 1356 86.78 85.01 0.33 0.38 0.39 0.68 0.78 0.76 0.89
1.18 mm 1364 71.95 70.47 0.21 0.29 0.30 0.40 0.55 0.39 0.56
600 µm 1376 52.15 51.07 0.27 0.51 0.52 0.80 1.53 0.80 1.57
300 µm 1364 20.41 20.03 0.23 1.13 1.15 0.68 3.33 0.68 3.41
150 µm 1343 4.32 4.44 0.12 2.83 2.75 0.35 8.05 0.37 8.34
75 µm, total 1355 1.09 1.30 0.10 9.59 8.02 0.25 22.83 0.26 20.36
75 µm washing 1394 0.94 1.15 0.09 9.88 8.11 0.26 27.73 0.28 24.75
Table G-9- Summary of statistics of percent passing various sieve sizes from manual washing of AGF 179-180 samples
Sample No./Washing
Method Size
No. of Labs
Average Results Repeatability Reproducibility
X Y 1s X
samples CV%
Y samples CV%
X samples Y samples
1s CV% 1s CV%
AGF179‐180 Mechanical Method of Washing
4.75 mm 116 100 100 0 0 0 0 0 0 0
2.36 mm 105 87.01 85.23 0.34 0.39 0.40 0.56 0.64 0.66 0.77
1.18 mm 108 72.07 70.62 0.22 0.30 0.31 0.38 0.53 0.33 0.47
600 µm 110 52.39 51.30 0.25 0.47 0.48 0.84 1.60 0.79 1.54
300 µm 111 20.62 20.24 0.21 1.00 1.02 0.67 3.23 0.62 3.09
150 µm 109 4.45 4.58 0.11 2.51 2.44 0.26 5.85 0.27 5.86
75 µm, total
117 1.18 1.40 0.10 8.75 7.37 0.18 15.10 0.20 14.02
75 µm washing 118 1.02 1.24 0.09 9.21 7.56 0.17 16.91 0.19 15.39

Statistical Tests of Significance
AGF 171-172 Statistical test of significance Table G-10- Statistical t-test for comparison of average percent passing of various sieve sizes from mechanical and manual washing of AGF 171-172 samples
Sieve Sizes Average Percent Passing
Deg. of Freedom Computed t Manual Mechanical
4.75‐mm 99.8 99.9 108 ‐0.47
2.36‐mm 85.5 85.6 113 ‐3.2
1.18‐mm 71.2 71.3 123 ‐2.12
600‐µm 52.8 52.8 119 ‐0.64
300‐µm 18.4 18.6 110 ‐2.67
150‐µm 4.8 4.9 115 ‐3.02
75‐µm 1.7 1.7 125 ‐4.6
75‐µm washing 1.5 1.6 127 ‐4.55
Note: Critical t for 1% level of significance is 2.62 and for 5% level of significance is 1.98
Table G-11- Statistical F-test for comparison of repeatability standard deviations of percent passing various sieve sizes from mechanical and manual washing of AGF 171-172 samples
Sieve Sizes 1S Repeatability, Percent Passing Degrees of
Freedom Computed F
Critical F(α=.01)
Critical F(α=.05) Manual Mechanical
4.75‐mm 0.1 0.12 96 & 1217 1.33 1.39 1.26
2.36‐mm 0.46 0.47 97 & 1236 1.02 1.38 1.26
1.18‐mm 0.43 0.38 1232 & 100 1.29 1.44 1.29
600‐µm 0.35 0.36 100 & 1205 1.05 1.38 1.26
300‐µm 0.19 0.2 96 & 1182 1.05 1.39 1.26
150‐µm 0.13 0.14 97 & 1158 1.08 1.39 1.26
75‐µm 0.1 0.1 97 & 1182 1.04 1.39 1.26
75‐µm washing 0.1 0.08 1221 & 101 1.45 1.44 1.29
Table G-12- Statistical F-test for comparison of reproducibility standard deviations of percent passing various sieve sizes from mechanical and manual washing of AGF 171-172 samples
Sieve Sizes 1S Reproducibility, Percent Passing Deg. of
Freedom Computed F Critical F(α=.01)
Critical F(α=.05) Manual Mech.
4.75‐mm 0.11 0.12 96 & 1217 1.28 1.39 1.26
2.36‐mm 0.55 0.55 1236 & 97 1.02 1.45 1.3
1.18‐mm 0.51 0.44 1232 & 100 1.33 1.44 1.29
600‐µm 0.83 0.8 1205 & 100 1.08 1.44 1.29
300‐µm 0.63 0.68 96 & 1182 1.17 1.39 1.26
150‐µm 0.29 0.28 1158 & 97 1.08 1.45 1.3
75‐µm 0.21 0.16 1182 & 97 1.65 1.45 1.3
75‐µm washing 0.24 0.19 1221 & 101 1.47 1.44 1.29

AGF 175-176 Statistical test of significance Table G-13- Statistical t-test for comparison of average percent passing of various sieve sizes from mechanical and manual washing of AGF 175-176 samples
Sieve Sizes Average Percent Passing
Degrees of Freedom Computed t Manual Mechanical
4.75‐mm 100 100 ‐ ‐
2.36‐mm 85.9 86.2 132 ‐3.87
1.18‐mm 70.7 70.8 123 ‐2.15
600‐µm 52.1 52.2 131 ‐1.42
300‐µm 20.2 20.4 134 ‐1.85
150‐µm 1.58 1.65 127 ‐3.14
75‐µm, total 0.38 0.45 117 ‐4.29
75‐µm, washing 0.3 0.37 126 ‐4.97
Note: Critical t for 1% level of significance is 2.61 and for 5% level of significance is 1.98
Table G-14- Statistical F-test for comparison of repeatability standard deviations of percent passing various sieve sizes from mechanical and manual washing of AGF 175-176 samples
Sieve Sizes
1S Repeatability, Percent Passing
Degrees Of Freedom Computed F
Critical F(α=.01)
Critical F(α=.05)
Manual Mechanical
4.75‐mm 0 0 121 & 1382 ‐ 1.34 1.23
2.36‐mm 0.31 0.32 109 & 1279 1.06 1.36 1.25
1.18‐mm 0.26 0.26 1307 & 107 1.07 1.42 1.28
600‐µm 0.31 0.27 1324 & 112 1.35 1.41 1.27
300‐µm 0.26 0.22 1299 & 112 1.46 1.41 1.27
150‐µm 0.1 0.1 110 & 1303 1.13 1.36 1.24
75‐µm, total 0.06 0.06 101 & 1280 1.07 1.38 1.25
75‐µm, washing 0.04 0.04 106 & 1236 1.17 1.37 1.25
Table G-15- Statistical F-test for comparison of reproducibility standard deviations of percent passing various sieve sizes from mechanical and manual washing of AGF 175-176
Sieve Sizes 1S Reproducibility, Percent Passing
Degrees of Freedom Computed F Critical F(α=.01)
Critical F(α=.05) Manual Mechanical
4.75‐mm 0 0 121 & 1382 ‐ 1.34 1.23
2.36‐mm 0.71 0.65 1279 & 109 1.20 1.42 1.28
1.18‐mm 0.38 0.41 107 & 1307 1.13 1.37 1.25
600‐µm 0.75 0.77 112 & 1324 1.06 1.36 1.24
300‐µm 0.79 0.75 1299 & 112 1.09 1.41 1.27
150‐µm 0.21 0.23 110 & 1303 1.11 1.36 1.24
75‐µm, total 0.16 0.16 101 & 1280 1.03 1.38 1.25
75‐µm washing 0.13 0.13 1236 & 106 1.02 1.43 1.28

AGF 179-180 Statistical test of significance Table G-16- Statistical t-test for comparison of average percent passing of various sieve sizes from mechanical and manual washing of AGF 179-180 samples
Sieve Sizes Average Percent Passing
Degrees of Freedom Computed t Manual Mechanical
4.75‐mm 100 100 ‐ ‐
2.36‐mm 85.9 86.12 127 ‐3.56
1.18‐mm 71.21 71.34 128 ‐3.66
600‐µm 51.61 51.84 126 ‐2.89
300‐µm 20.22 20.43 131 ‐3.23
150‐µm 4.38 4.52 143 ‐5.09
75‐µm, total 1.19 1.29 156 ‐4.97
75‐µm, washing 1.05 1.13 166 ‐4.39
Note: Critical t for 1% level of significance is 2.61 and for 5% level of significance is 1.98
Table G-17- Statistical F-test for comparison of repeatability standard deviations of percent passing various sieve sizes from mechanical and manual washing of AGF 179-180 samples
Sieve Sizes
1S Repeatability, Percent Passing
Degrees Of Freedom Computed F
Critical F(α=.01)
Critical F(α=.05)
Manual Mechanical
4.75 mm 0 0 115 & 1444 ‐ 1.35 1.24
2.36 mm 0.33 0.34 104 & 1355 1.05 1.37 1.25
1.18 mm 0.21 0.22 107 & 1363 1.09 1.36 1.25
600 μm 0.27 0.25 1375 & 109 1.16 1.42 1.28
300 μm 0.23 0.21 1363 & 110 1.25 1.42 1.28
150 μm 0.12 0.11 1342 & 108 1.19 1.42 1.28
75 μm total 0.1 0.1 1354 & 116 1.03 1.40 1.27
75 μm washing 0.09 0.09 117 & 1393 1.01 1.35 1.24
Table G-18- Statistical F-test for comparison of reproducibility standard deviations of percent passing various sieve sizes from mechanical and manual washing of AGF 179-180
Sieve Sizes 1S Reproducibility, Percent Passing
Degrees of Freedom Computed F Critical F(α=.01)
Critical F(α=.05) Manual Mechanical
4.75‐mm 0 0 115 & 1444 ‐ 1.35 1.24
2.36‐mm 0.72 0.61 1355 & 104 1.38 1.43 1.29
1.18‐mm 0.4 0.36 1363 & 107 1.21 1.42 1.28
600‐µm 0.8 0.81 109 & 1375 1.04 1.36 1.24
300‐µm 0.68 0.65 1363 & 110 1.12 1.42 1.28
150‐µm 0.36 0.26 1342 & 108 1.85 1.42 1.28
75‐µm, total 0.26 0.19 1354 & 116 1.88 1.40 1.27
75‐µm washing 0.27 0.18 1393 & 117 2.27 1.40 1.27

APPENDIX H - HOT MIX ASPHALT IGNITOIN OVEN- WASHING METHOD TABLES AND GRAPHS

Total Material Passing Scatter Plot Graphs
HMAIO 19-20
Figure H-1- Total Material Passing the 12.5-mm (12 in.) Sieve
Figure H-2- Total Material Passing the 9.5-mm (38 in.) Sieve
Figure H-3- Total Material Passing the 4.75-mm (No. 4) Sieve
Figure H-4- Total Material Passing the 2.36-mm (No. 8) Sieve
Figure H-5- Total Material Passing the 1.18-mm (No. 16) Sieve
Figure H-6- Total Material Passing the 600-µm (No. 30) Sieve

61
Figure H-7- Total Material Passing the 300-µm (No. 50) Sieve
Figure H-8- Total Material Passing the 150-µm (No. 100) Sieve
Figure H-9- Total Material Passing the 75-µm (No. 200) Sieve

62
HMAIO 21-22
Figure H-10- Total Material Passing the 12.5-mm (12 in.) Sieve
Figure H-11- Total Material Passing the 9.5-mm (38 in.) Sieve
Figure H-12- Total Material Passing the 4.75-mm (No. 4) Sieve
Figure H-13- Total Material Passing the 2.36-mm (No. 8) Sieve
Figure H-14- Total Material Passing the 1.18-mm (No. 16) Sieve
Figure H-15- Total Material Passing the 600-µm (No. 30) Sieve

63
Figure H-16- Total Material Passing the 300-µm (No. 50) Sieve
Figure H-17- Total Material Passing the 150-µm (No. 100) Sieve
Figure H-18- Total Material Passing the 75-µm (No. 200) Sieve

64
HMAIO 23-24
Figure H-19- Total Material Passing the 12.5-mm (12 in.) Sieve
Figure H-20- Total Material Passing the 9.5-mm (38 in.) Sieve
Figure H-21- Total Material Passing the 4.75-mm (No. 4) Sieve
Figure H-22- Total Material Passing the 2.36-mm (No. 8) Sieve
Figure H-23- Total Material Passing the 1.18-mm (No. 16) Sieve
Figure H-24- Total Material Passing the 600-µm (No. 30) Sieve

Figure H-25- Total Material Passing the 300-µm (No. 50) Sieve
Figure H-26- Total Material Passing the 150-µm (No. 100) Sieve
Figure H-27- Total Material Passing the 75-µm (No. 200) Sieve

Percent Passing Bar Graphs
Average Percent Passing
Figure H-28- Total Material Passing the 12.5-mm Sieve
Figure H-29- Total Material Passing the 9.5-mm Sieve
Figure H-30- Total Material Passing the 4.75-mm Sieve
Figure H-31- Total Material Passing the 2.36- mm Sieve
Figure H-32- Total Material Passing the 1.18- mm Sieve
Figure H-33- Total Material Passing the 600-µm Sieve
93
93.5
94
94.5
95
95.5
96
19‐20 21‐22 23‐24 Pooled
Manual Mechanical
80
82
84
86
88
90
19‐20 21‐22 23‐24 Pooled
Manual Mechanical
58
59
60
61
62
63
64
19‐20 21‐22 23‐24 Pooled
Manual Mechanical
0
10
20
30
40
50
19‐20 21‐22 23‐24 Pooled
Manual Mechanical
0
5
10
15
20
25
30
19‐20 21‐22 23‐24 Pooled
Manual Mechanical
0
5
10
15
20
25
19‐20 21‐22 23‐24 Pooled
Manual Mechanical

Figure H-34- Total Material Passing the 300-µm Sieve
Figure H-35- Total Material Passing the 150-µm Sieve
Figure H-36- Total Material Passing the 75-µm Sieve
0
2
4
6
8
10
12
14
16
19‐20 21‐22 23‐24 Pooled
Manual Mechanical
0
2
4
6
8
10
12
14
19‐20 21‐22 23‐24 Pooled
Manual Mechanical
0
2
4
6
8
10
12
19‐20 21‐22 23‐24 Pooled
Manual Mechanical

Repeatability Standard Deviation Percent Passing
Figure H-37- Total Material Passing the 12.5-mm Sieve
Figure H-38- Total Material Passing the 9.5-mm Sieve
Figure H-39- Total Material Passing the 4.75-mm Sieve
Figure H-40- Total Material Passing the 2.36- mm Sieve
Figure H-41- Total Material Passing the 1.18- mm Sieve
Figure H-42- Total Material Passing the 600-µm Sieve
0
0.1
0.2
0.3
0.4
0.5
0.6
19‐20 21‐22 23‐24 Pooled
Manual Mechanical
00.050.10.150.20.250.30.350.4
19‐20 21‐22 23‐24 Pooled
Manual Mechanical
00.10.20.30.40.50.60.70.80.9
19‐20 21‐22 23‐24 Pooled
Manual Mechanical
0
0.2
0.4
0.6
0.8
1
1.2
19‐20 21‐22 23‐24 Pooled
Manual Mechanical
0
0.1
0.2
0.3
0.4
0.5
19‐20 21‐22 23‐24 Pooled
Manual Mechanical
00.050.1
0.150.2
0.250.3
0.350.4
0.450.5
19‐20 21‐22 23‐24 Pooled
Manual Mechanical

Figure H-43- Total Material Passing the 300-µm Sieve
Figure H-44- Total Material Passing the 150-µm Sieve
Figure H-45- Total Material Passing the 75-µm Sieve
0
0.1
0.2
0.3
0.4
0.5
19‐20 21‐22 23‐24 Pooled
Manual Mechanical
0
0.1
0.2
0.3
0.4
0.5
19‐20 21‐22 23‐24 Pooled
Manual Mechanical
0
0.1
0.2
0.3
0.4
0.5
19‐20 21‐22 23‐24 Pooled
Manual Mechanical

Reproducibility Standard Deviation Percent Passing
Figure H-46- Total Material Passing the 12.5-mm Sieve
Figure H-47- Total Material Passing the 9.5-mm Sieve
Figure H-48- Total Material Passing the 4.75-mm Sieve
Figure H-49- Total Material Passing the 2.36- mm Sieve
Figure H-50- Total Material Passing the 1.18- mm Sieve
Figure H-51- Total Material Passing the 600-µm Sieve
0
0.1
0.2
0.3
0.4
0.5
0.6
0.7
0.8
19‐20 21‐22 23‐24 Pooled
Manual Mechanical
0
0.1
0.2
0.3
0.4
0.5
19‐20 21‐22 23‐24 Pooled
Manual Mechanical
0
0.2
0.4
0.6
0.8
1
19‐20 21‐22 23‐24 Pooled
Manual Mechanical
0
0.2
0.4
0.6
0.8
1
1.2
1.4
19‐20 21‐22 23‐24 Pooled
Manual Mechanical
0
0.1
0.2
0.3
0.4
0.5
0.6
0.7
19‐20 21‐22 23‐24 Pooled
Manual Mechanical
0
0.1
0.2
0.3
0.4
0.5
0.6
0.7
19‐20 21‐22 23‐24 Pooled
Manual Mechanical

71
Figure H-52- Total Material Passing the 300-µm Sieve
Figure H-53- Total Material Passing the 150-µm Sieve
Figure H-54- Total Material Passing the 75-µm Sieve
0
0.1
0.2
0.3
0.4
0.5
0.6
0.7
0.8
19‐20 21‐22 23‐24 Pooled
Manual Mechanical
0
0.1
0.2
0.3
0.4
0.5
0.6
0.7
0.8
19‐20 21‐22 23‐24 Pooled
Manual Mechanical
0
0.1
0.2
0.3
0.4
0.5
0.6
0.7
0.8
19‐20 21‐22 23‐24 Pooled
Manual Mechanical

72
Summaries of Statistics
HMAIO 19-20 Summaries of Statistics
Table H-1- Summary of statistics of percent passing various sieve sizes from washing of HMAIO 19-20 samples, all washing methods
Sample No./
Washing Method
Size No. of Labs
Average Results
Repeatability Reproducibility
X Y 1s X
samples CV%
Y samples CV%
x samples Y samples
1s CV% 1s CV%
HMAIO 19‐20 All
Methods of
Washing
12.5 mm 684 95.7 92.6 0.49 0.52 0.53 0.65 0.68 0.67 0.72
9.5 mm 670 86.6 83.3 0.29 0.33 0.34 0.34 0.39 0.39 0.47
4.75 mm 676 62.9 62.5 0.75 1.19 1.2 1.04 1.65 0.78 1.25
2.36 mm 621 43 44.3 0.3 0.69 0.67 0.33 0.78 0.42 0.95
1.18 mm 615 26.9 28.4 0.43 1.58 0.43 0.6 2.24 0.74 2.61
600 µm 617 15.9 17.5 0.44 2.76 2.51 0.57 3.58 0.73 4.18
300 µm 635 9.7 11.3 0.41 4.19 3.62 0.6 6.22 0.8 7.09
150 µm 646 7 8.5 0.41 5.85 4.84 0.61 8.77 0.83 9.83
75 µm, Total
649 6.1 7.4 0.4 6.62 5.41 0.61 10.1 0.85 11.5
Table H-2- Summary of statistics of percent passing various sieve sizes from manual washing of HMAIO 19-20 samples
Sample No./
Washing Method
Size No. of Labs
Average Results
Repeatability Reproducibility
X Y 1s X
samples CV%
Y samples CV%
X samples Y samples
1s CV% 1s CV%
HMAIO 19‐20 Manual Washing
12.5 mm 508 95.7 92.6 0.5 0.53 0.54 0.66 0.69 0.69 0.75
9.5 mm 499 86.6 83.3 0.29 0.33 0.34 0.35 0.4 0.39 0.47
4.75 mm 498 62.9 62.5 0.74 1.17 1.18 1.03 1.64 0.79 1.26
2.36 mm 452 43 44.3 0.3 0.71 0.69 0.32 0.75 0.41 0.94
1.18 mm 444 26.8 28.3 0.43 1.6 1.52 0.6 2.24 0.73 2.59
600 µm 444 15.8 17.4 0.44 2.75 2.5 0.58 3.64 0.72 4.14
300 µm 465 9.6 11.2 0.41 4.25 3.67 0.6 6.27 0.79 2.22
150 µm 477 6.9 8.4 0.42 5.99 4.96 0.63 9.03 0.82 9.84
75 µm, Total
475 6 7.3 0.4 6.66 5.44 0.62 10.4 0.84 11.4

73
Table H-3- Summary of statistics of percent passing various sieve sizes from mechanical washing of HMAIO 19-20
Sample No./
Washing Method
Size No. of Labs
Average Results
Repeatability Reproducibility
X Y 1s X
samples CV%
Y samples CV%
X samples Y samples
1s CV% 1s CV%
HMAIO 19‐20
Mechanical Method of Washing
12.5 mm 132 95.7 92.6 0.45 0.47 0.49 0.63 0.65 0.61 0.66
9.5 mm 128 86.7 83.4 0.3 0.34 0.36 0.32 0.37 0.36 0.44
4.75 mm 134 63 62.6 0.79 1.25 1.26 1.04 1.65 0.76 1.21
2.36 mm 127 43.1 44.4 0.29 0.67 0.65 0.34 0.79 0.38 0.86
1.18 mm 127 27 28.6 0.42 1.54 1.45 0.59 2.2 0.7 2.44
600 µm 129 16 17.7 0.44 2.72 2.46 0.52 3.27 0.7 3.92
300 µm 127 10 11.7 0.39 3.93 3.37 0.53 5.3 0.74 6.36
150 µm 124 7.3 8.8 0.37 5.08 4.19 0.52 7.11 0.78 8.84
75 µm, Total
128 6.3 7.7 0.38 6.09 4.97 0.54 8.57 0.81 10.4

74
HMAIO 21-22 Summaries of Statistics
Table H-4- Summary of statistics of percent passing various sieve sizes from washing of HMAIO 21-22 samples, all washing methods
Sample No./
Washing Method
Size No. of Labs
Average Results
Repeatability Reproducibility
X Y 1s X
samples CV%
Y samples CV%
X Y
1s CV% 1s CV%
HMAIO 21‐22 All Methods
of Washing
12.5 mm 729 95.3 95.8 0.23 0.24 0.24 0.26 0.27 0.25 0.26
9.5 mm 716 88.6 89.4 0.26 0.3 0.29 0.29 0.32 0.33 0.37
4.75 mm 701 63 60.2 0.23 0.37 0.39 0.33 0.53 0.32 0.54
2.36 mm 751 39 40.3 0.91 2.33 2.26 0.71 1.81 1.34 3.33
1.18 mm 721 27.3 26.9 0.33 1.21 1.23 0.49 1.81 0.51 1.91
600 µm 714 19.7 19.1 0.35 1.79 1.84 0.53 2.67 0.56 2.92
300 µm 708 14.7 14.3 0.32 2.15 2.21 0.55 3.7 0.55 3.85
150 µm 696 11.8 11.6 0.29 2.43 2.47 0.55 4.69 0.54 4.62
75 µm, Total
704 9.77 9.74 0.26 2.69 2.7 0.55 5.6 0.54 5.53
Table H-5- Summary of statistics for percent passing various sieve sizes from manual washing of HMAIO 21-22 samples
Sample No./
Washing Method
Size No. of Labs
Average Results
Repeatability Reproducibility
X Y 1s X
samples CV%
Y samples CV%
X samples Y samples
1s CV% 1s CV%
HMAIO 21‐22 Manual Washing
12.5 mm 507 95.3 95.8 0.22 0.23 0.23 0.26 0.28 0.24 0.25
9.5 mm 494 88.6 89.4 0.26 0.3 0.3 0.3 0.33 0.33 0.37
4.75 mm 487 62.9 60.2 0.24 0.37 0.39 0.34 0.54 0.32 0.54
2.36 mm 521 39 40.2 0.88 2.26 2.19 0.7 1.79 1.33 3.31
1.18 mm 503 27.2 26.8 0.33 1.2 1.22 0.5 1.84 0.51 1.9
600 µm 498 19.7 19.1 0.35 1.79 1.84 0.52 2.63 0.55 2.89
300 µm 494 14.7 14.3 0.31 2.11 2.17 0.53 3.58 0.54 3.78
150 µm 484 11.7 11.5 0.28 2.36 2.4 0.52 4.42 0.5 4.36
75 µm, Total
486 9.75 9.72 0.25 2.59 2.6 0.51 5.28 0.52 5.31

75
Table H-6- Summary of statistics for percent passing various sieve sizes from mechanical washing of HMAIO 21-22 samples
Sample No./
Washing Method
Size No. of Labs
Average Results
Repeatability Reproducibility
X Y 1s X
samples CV%
Y samples CV%
X samples Y samples
1s CV% 1s CV%
HMAIO 21‐22
Mechanical Method of Washing
12.5 mm 98 95.3 95.7 0.24 0.25 0.25 0.26 0.27 0.23 0.24
9.5 mm 100 88.6 89.4 0.25 0.28 0.27 0.24 0.27 0.3 0.34
4.75 mm 94 63.1 60.2 0.24 0.38 0.39 0.31 0.49 0.3 0.5
2.36 mm 105 39.3 40.3 1 2.54 2.47 0.69 1.75 1.39 3.44
1.18 mm 100 27.5 27 0.34 1.25 1.27 0.46 1.66 0.55 2.05
600 µm 98 20 19.3 0.36 1.79 1.85 0.51 2.57 0.62 3.19
300 µm 96 15.1 14.6 0.33 2.19 2.27 0.54 3.61 0.63 4.31
150 µm 92 12.1 11.8 0.31 2.53 2.59 0.58 4.76 0.65 5.52
75 µm, Total
94 10 9.94 0.27 2.72 2.75 0.57 5.65 0.63 6.31

76
HMAIO 23-24 Summaries of Statistics
Table H-7- Summary of statistics of percent passing various sieve sizes from washing of HMAIO 23-24 samples, all washing methods
Sample No./
Washing Method
Size No. of Labs
Average Results
Repeatability Reproducibility
X Y 1s X
samples CV%
Y samples CV%
X Y
1s CV% 1s CV%
HMAIO 23‐24 All Methods
of Washing
12.5 mm 756 94.8 94 0.29 0.31 0.31 0.38 0.4 0.29 0.3
9.5 mm 731 86.1 82.4 0.35 0.4 0.42 0.46 0.54 0.38 0.46
4.75 mm 701 54.7 64.8 0.15 0.28 0.23 0.19 0.35 0.16 0.25
2.36 mm 764 33.5 35.9 0.95 2.84 2.65 0.89 2.65 1.4 3.9
1.18 mm 734 21.1 21.9 0.28 1.34 1.29 0.44 2.08 0.51 2.33
600 µm 723 15 15.6 0.27 1.79 1.71 0.4 2.65 0.5 3.18
300 µm 728 11.4 12 0.27 2.41 2.29 0.43 3.78 0.53 4.42
150 µm 729 9.33 9.81 0.27 2.93 2.79 0.45 4.86 0.55 5.61
75 µm, Total
735 7.99 8.43 0.27 3.36 3.18 0.47 5.92 0.56 6.6
Table H-8- Summary of statistics of percent passing various sieve sizes from manual washing of HMAIO 23-24 samples
Sample No./
Washing Method
Size No. of Labs
Average Results
Repeatability Reproducibility
X Y 1s X
samples CV%
Y samples CV%
X samples Y samples
1s CV% 1s CV%
HMAIO 23‐24 Manual Washing
12.5 mm 637 94.8 94 0.29 0.31 0.31 0.38 0.4 0.28 0.3
9.5 mm 617 86.1 82.4 0.35 0.4 0.42 0.46 0.54 0.37 0.45
4.75 mm 588 54.6 64.8 0.15 0.28 0.23 0.19 0.35 0.16 0.25
2.36 mm 638 33.4 35.9 0.95 2.84 2.65 0.88 2.62 1.37 3.83
1.18 mm 620 21.1 21.9 0.29 1.36 1.31 0.43 2.04 0.51 2.34
600 µm 608 14.9 15.6 0.27 1.8 1.72 0.38 2.56 0.49 3.14
300 µm 610 11.3 11.9 0.27 2.37 2.26 0.41 3.6 0.51 4.31
150 µm 612 9.27 9.76 0.27 2.92 2.77 0.43 4.64 0.54 5.48
75 µm, Total
615 7.94 8.38 0.26 3.33 3.15 0.46 5.73 0.55 6.51

77
Table H-9- Summary of statistics of percent passing various sieve sizes from mechanical washing of HMAIO 23-24 samples
Sample No./
Washing Method
Size No. of Labs
Average Results
Repeatability Reproducibility
X Y 1s X
samples CV%
Y samples CV%
X samples Y samples
1s CV% 1s CV%
HMAIO 23‐24
Mechanical Method of Washing
12.5 mm 121 94.9 94 0.31 0.33 0.33 0.37 0.39 0.32 0.34
9.5 mm 116 86.2 82.4 0.33 0.39 0.4 0.45 0.53 0.38 0.46
4.75 mm 115 54.7 64.8 0.14 0.26 0.22 0.17 0.32 0.15 0.24
2.36 mm 128 33.8 36.2 0.96 2.86 2.66 0.88 2.61 1.51 4.16
1.18 mm 116 21.4 22.1 0.27 1.28 1.23 0.42 1.95 0.44 2.01
600 µm 117 15.2 15.9 0.27 1.75 1.68 0.39 2.55 0.49 3.08
300 µm 120 11.7 12.2 0.3 2.55 2.44 0.43 3.67 0.55 4.49
150 µm 119 9.65 10.1 0.29 2.99 2.87 0.44 4.56 0.56 5.54
75 µm, Total
122 8.27 8.68 0.29 3.48 3.32 0.46 5.61 0.55 6.39

78
HMAIO 25-26 Summaries of Statistics
Table H-10- Summary of statistics of percent passing various sieve sizes from washing of HMAIO 25-26 samples, all washing methods
Sample No./
Washing Method
Size No. of Labs
Average Results
Repeatability Reproducibility
X Y 1s X
samples CV%
Y samples CV%
X Y
1s CV% 1s CV%
HMAIO 25‐26 All Methods
of Washing
12.5 mm 827 94.8 94.3 0.46 0.48 0.49 0.52 0.55 0.57 0.6
9.5 mm 821 87.2 86.2 0.38 0.43 0.44 0.52 0.59 0.48 0.56
4.75 mm 792 58.8 61 0.2 0.35 0.33 0.37 0.63 0.37 0.61
2.36 mm 814 39 39.5 0.57 1.45 1.44 0.7 1.8 0.81 2.06
1.18 mm 796 26.4 26.2 0.26 0.99 0.99 0.47 1.79 0.47 1.78
600 µm 799 18.1 17.9 0.24 1.33 1.35 0.5 2.78 0.5 2.77
300 µm 798 13.2 13.1 0.24 1.83 1.84 0.52 3.91 0.5 3.81
150 µm 792 10.4 10.5 0.25 2.42 2.41 0.53 5.12 0.52 4.92
75 µm, Total
781 8.76 8.84 0.23 2.67 2.64 0.52 5.92 0.51 5.73
Table H-11- Summary of statistics of percent passing various sieve sizes from manual washing of HMAIO 25-26 samples
Sample No./
Washing Method
Size No. of Labs
Average Results
Repeatability Reproducibility
X Y 1s X
samples CV%
Y samples CV%
X samples Y samples
1s CV% 1s CV%
HMAIO 25‐26 Manual Washing
12.5 mm 670 94.8 94.3 0.46 0.48 0.49 0.53 0.56 0.57 0.6
9.5 mm 664 87.2 86.2 0.38 0.43 0.44 0.52 0.6 0.49 0.57
4.75 mm 640 58.8 61 0.2 0.34 0.33 0.37 0.63 0.37 0.61
2.36 mm 665 38.9 39.4 0.55 1.42 1.41 0.7 1.8 0.8 2.03
1.18 mm 642 26.4 26.2 0.26 0.98 0.99 0.47 1.78 0.46 1.76
600 µm 650 18 17.9 0.24 1.34 1.36 0.49 2.72 0.49 2.77
300 µm 650 13.1 13.1 0.24 1.83 1.84 0.49 3.74 0.48 3.71
150 µm 647 10.4 10.4 0.25 2.4 2.39 0.51 4.92 0.5 4.79
75 µm, Total
636 8.69 8.78 0.23 2.65 2.63 0.5 5.76 0.49 5.58

79
Table H-12- Summary of statistics of percent passing various sieve sizes from mechanical washing of HMAIO 25-26 samples
Sample No./
Washing Method
Size No. of Labs
Average Results
Repeatability Reproducibility
X Y 1s X
samples CV%
Y samples CV%
X samples Y samples
1s CV% 1s CV%
HMAIO 25‐26
Mechanical Method of Washing
12.5 mm 156 94.8 94.4 0.47 0.5 0.5 0.46 0.48 0.55 0.58
9.5 mm 157 87.2 86.3 0.39 0.44 0.45 0.49 0.56 0.44 0.51
4.75 mm 151 58.9 61.1 0.21 0.36 0.35 0.32 0.55 0.34 0.55
2.36 mm 148 39.3 39.7 0.62 1.57 1.55 0.62 1.58 0.82 2.07
1.18 mm 153 26.6 26.4 0.27 1 1.01 0.43 1.6 0.44 1.65
600 µm 148 18.4 18.2 0.24 1.28 1.3 0.46 2.48 0.43 2.37
300 µm 147 13.5 13.4 0.24 1.8 1.81 0.47 3.48 0.45 3.35
150 µm 144 10.8 10.8 0.26 2.46 2.45 0.5 4.63 0.48 4.44
75 µm, Total
144 9.05 9.13 0.24 2.69 2.67 0.49 5.47 0.48 5.27

80
Statistical Tests of Significance
HMAIO 19-20 Statistical test of significance
Table H-13- Statistical t-test for comparison of average percent passing of various sieve sizes from mechanical and manual washing of HMAIO 19-20
Sieve Sizes Average Percent Passing
Degrees of Freedom Computed t Manual Mechanical
12.5‐mm 94.2 94.2 220 0.25
9.5‐mm 85 85 208 ‐2.14
4.75‐mm 62.7 62.8 212 ‐0.81
2.36‐mm 43.6 43.8 207 ‐4.03
1.18‐mm 27.6 27.8 209 ‐4.23
600‐µm 16.6 16.9 218 ‐4.38
300‐µm 10.4 10.8 214 ‐6.54
150‐µm 7.65 8.03 209 ‐5.53
75 µm, Total 6.65 7.02 212 ‐5.35
Note: Critical t for 1% level of significance is 2.60 and for 5% level of significance is 1.97
Table H-14- Statistical F-test for comparison of repeatability standard deviations of percent passing various sieve sizes from mechanical and manual washing of HMAIO 19-20
Sieve Sizes
1S Repeatability, Percent Passing Degrees of
Freedom Computed
F Critical F(α=.01)
Critical F(α=.05)
Manual Mech.
12.5‐mm 0.5 0.45 507 & 131 1.25 1.40 1.27
9.5‐mm 0.29 0.3 127 & 498 1.08 1.37 1.25
4.75‐mm 0.74 0.79 133 & 497 1.14 1.36 1.24
2.36‐mm 0.3 0.29 451 & 126 1.12 1.42 1.28
1.18‐mm 0.43 0.42 443 & 126 1.07 1.42 1.28
600‐µm 0.44 0.44 128 & 443 1.01 1.37 1.25
300‐µm 0.41 0.39 464 & 126 1.09 1.41 1.28
150‐µm 0.42 0.37 476 & 123 1.27 1.42 1.28
75 µm, Total
0.4 0.38 474 & 127 1.07 1.41 1.27

81
Table H-15- Statistical F-test for comparison of reproducibility standard deviations of percent passing various sieve sizes from mechanical and manual washing of HMAIO 19-20
Sieve Sizes
1S Reproducibility, Percent Passing Degrees of
Freedom Computed
F Critical F(α=.01)
Critical F(α=.05)
Manual Mech.
12.5‐mm 0.68 0.62 507 & 131 1.20 1.40 1.27
9.5‐mm 0.37 0.34 498 & 127 1.15 1.41 1.27
4.75‐mm 0.92 0.91 497 & 133 1.02 1.40 1.27
2.36‐mm 0.37 0.36 451 & 126 1.06 1.42 1.28
1.18‐mm 0.67 0.65 443 & 126 1.07 1.42 1.28
600‐µm 0.65 0.62 443 & 128 1.12 1.41 1.27
300‐µm 0.7 0.65 464 & 126 1.18 1.41 1.28
150‐µm 0.73 0.66 476 & 123 1.23 1.42 1.28
75 µm, Total
0.74 0.69 474 & 127 1.15 1.41 1.27

82
HMAIO 21-22 Statistical test of significance
Table H-16- Statistical t-test for comparison of average percent passing various sieve sizes from mechanical and manual washing of HMAIO 21-22 samples
Sieve Sizes Average Percent Passing
Degrees of Freedom Computed t Manual Mechanical
12.5‐mm 95.6 95.5 140 0.67
9.5‐mm 89 89 156 ‐0.51
4.75‐mm 61.6 61.7 138 ‐3.15
2.36‐mm 39.6 39.8 146 ‐1.32
1.18‐mm 27 27.2 141 ‐3.55
600‐µm 19.4 19.6 133 ‐4.00
300‐µm 14.5 14.8 127 ‐5.23
150‐µm 11.6 12 116 ‐4.78
75 µm, Total 9.7 10 121 ‐3.86
Note: Critical t for 1% level of significance is 2.61 and for 5% level of significance is 1.98
Table H-17- Statistical F-test for comparison of repeatability standard deviations of percent passing various sieve sizes from mechanical and manual washing of HMAIO 21-22 samples
Sieve Sizes 1S Repeatability, Percent Passing Degrees of
Freedom Computed F
Critical F(α=.01)
Critical F(α=.05)Manual Mech.
12.5‐mm 0.22 0.24 97 & 506 1.13 1.41 1.28
9.5‐mm 0.26 0.25 493 & 99 1.15 1.47 1.31
4.75‐mm 0.24 0.24 93 & 486 1.01 1.42 1.28
2.36‐mm 0.88 1 104 & 520 1.28 1.40 1.27
1.18‐mm 0.33 0.34 99 & 502 1.10 1.41 1.28
600‐µm 0.35 0.36 97 & 497 1.03 1.41 1.28
300‐µm 0.31 0.33 95 & 493 1.14 1.42 1.28
150‐µm 0.28 0.31 91 & 483 1.22 1.43 1.29
75 µm, Total 0.25 0.27 93 & 485 1.17 1.42 1.28

83
Table H-18- Statistical F-test for comparison of reproducibility standard deviations of percent passing various sieve sizes from mechanical and manual washing of HMAIO 21-22 samples
Sieve Sizes 1S Reproducibility, Percent Passing Degrees of
Freedom Computed F
Critical F(α=.01)
Critical F(α=.05)Manual Mech.
12.5‐mm 0.25 0.25 506 & 97 1.07 1.47 1.31
9.5‐mm 0.31 0.27 493 & 99 1.30 1.47 1.31
4.75‐mm 0.33 0.31 486 & 93 1.17 1.49 1.32
2.36‐mm 1.06 1.09 104 & 520 1.06 1.40 1.27
1.18‐mm 0.51 0.51 99 & 502 1.00 1.41 1.28
600‐µm 0.53 0.57 97 & 497 1.12 1.41 1.28
300‐µm 0.53 0.59 95 & 493 1.22 1.42 1.28
150‐µm 0.51 0.61 91 & 483 1.45 1.43 1.29
75 µm, Total 0.51 0.6 93 & 485 1.35 1.42 1.28
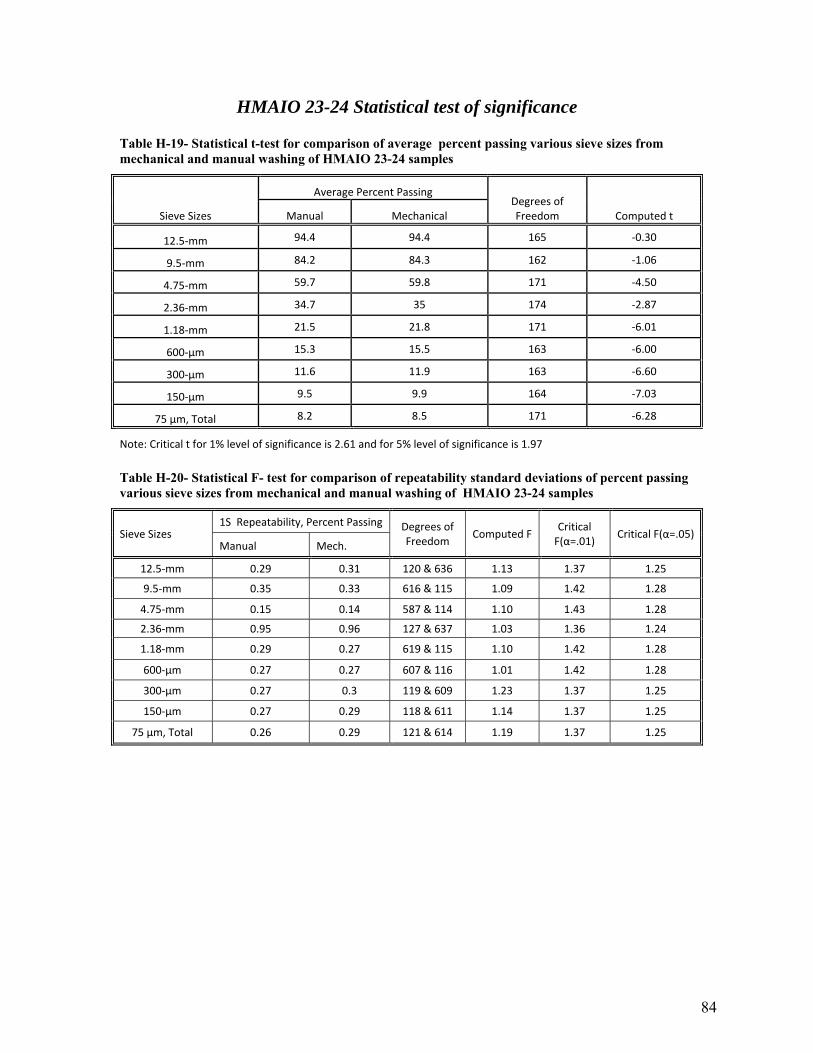
84
HMAIO 23-24 Statistical test of significance
Table H-19- Statistical t-test for comparison of average percent passing various sieve sizes from mechanical and manual washing of HMAIO 23-24 samples
Sieve Sizes
Average Percent Passing Degrees of Freedom Computed t Manual Mechanical
12.5‐mm 94.4 94.4 165 ‐0.30
9.5‐mm 84.2 84.3 162 ‐1.06
4.75‐mm 59.7 59.8 171 ‐4.50
2.36‐mm 34.7 35 174 ‐2.87
1.18‐mm 21.5 21.8 171 ‐6.01
600‐µm 15.3 15.5 163 ‐6.00
300‐µm 11.6 11.9 163 ‐6.60
150‐µm 9.5 9.9 164 ‐7.03
75 µm, Total 8.2 8.5 171 ‐6.28
Note: Critical t for 1% level of significance is 2.61 and for 5% level of significance is 1.97
Table H-20- Statistical F- test for comparison of repeatability standard deviations of percent passing various sieve sizes from mechanical and manual washing of HMAIO 23-24 samples
Sieve Sizes 1S Repeatability, Percent Passing Degrees of
Freedom Computed F
Critical F(α=.01)
Critical F(α=.05)Manual Mech.
12.5‐mm 0.29 0.31 120 & 636 1.13 1.37 1.25
9.5‐mm 0.35 0.33 616 & 115 1.09 1.42 1.28
4.75‐mm 0.15 0.14 587 & 114 1.10 1.43 1.28
2.36‐mm 0.95 0.96 127 & 637 1.03 1.36 1.24
1.18‐mm 0.29 0.27 619 & 115 1.10 1.42 1.28
600‐µm 0.27 0.27 607 & 116 1.01 1.42 1.28
300‐µm 0.27 0.3 119 & 609 1.23 1.37 1.25
150‐µm 0.27 0.29 118 & 611 1.14 1.37 1.25
75 µm, Total 0.26 0.29 121 & 614 1.19 1.37 1.25

85
Table H-21- Statistical F-test for comparison of reproducibility standard deviations of percent passing various sieve sizes from mechanical and manual washing of HMAIO 23-24 samples
Sieve Sizes 1S Reproducibility, Percent Passing Degrees of
Freedom Computed F
Critical F(α=.01)
Critical F(α=.05) Manual Mech.
12.5‐mm 0.35 0.33 120 & 636 1.07 1.37 1.25
9.5‐mm 0.42 0.42 616 & 115 1.01 1.42 1.28
4.75‐mm 0.18 0.16 587 & 114 1.17 1.43 1.28
2.36‐mm 1.23 1.15 127 & 637 1.15 1.36 1.24
1.18‐mm 0.47 0.43 619 & 115 1.21 1.42 1.28
600‐µm 0.44 0.44 116 & 607 1.01 1.37 1.25
300‐µm 0.49 0.46 119 & 609 1.13 1.37 1.25
150‐µm 0.5 0.49 118 & 611 1.07 1.37 1.25
75 µm, Total 0.51 0.5 121 & 614 1.04 1.37 1.25

86
HMAIO 25-26
Statistical test of significance
Table H-22- Statistical t-test for comparison of average percent passing various sieve sizes from mechanical and manual washing of HMAIO 25-26 samples
Sieve Sizes
Average Percent Passing Degrees of Freedom Computed t Manual Mechanical
12.5‐mm 94.5 94.6 247 ‐1.64
9.5‐mm 86.7 86.8 251 ‐1.19
4.75‐mm 59.9 60 249 ‐4.42
2.36‐mm 39.2 39.5 222 ‐5.15
1.18‐mm 26.3 26.5 244 ‐6.70
600‐µm 17.9 18.3 237 ‐8.12
300‐µm 13.1 13.5 226 ‐9.58
150‐µm 10.4 10.8 216 ‐8.80
75 µm, Total 8.7 9.1 215 ‐7.85
Note: Critical t for 1% level of significance is 2.60 and for 5% level of significance is 1.97
Table H-23- Statistical F- test for comparison of repeatability standard deviations of percent passing various sieve sizes from mechanical and manual washing of HMAIO 25-26 samples
Sieve Sizes 1S Repeatability, Percent Passing Degrees of
Freedom Computed F
Critical F(α=.01)
Critical F(α=.05)Manual Mech.
12.5‐mm 0.46 0.47 155 & 669 1.05 1.33 1.22
9.5‐mm 0.38 0.39 156 & 663 1.05 1.33 1.22
4.75‐mm 0.2 0.21 150 & 639 1.09 1.33 1.23
2.36‐mm 0.55 0.62 147 & 664 1.24 1.33 1.23
1.18‐mm 0.26 0.27 152 & 641 1.06 1.33 1.22
600‐µm 0.24 0.24 649 & 147 1.05 1.37 1.25
300‐µm 0.24 0.24 146 & 649 1.03 1.34 1.23
150‐µm 0.25 0.26 143 & 646 1.13 1.34 1.23
75 µm, Total 0.23 0.24 143 & 635 1.12 1.34 1.23

87
Table H-24- Statistical F-test for comparison of reproducibility standard deviations of percent passing various sieve sizes from mechanical and manual washing of HMAIO 25-26 samples
Sieve Sizes 1S Reproducibility, Percent Passing Degrees of
Freedom Computed F
Critical F(α=.01)
Critical F(α=.05) Manual Mech.
12.5‐mm 0.55 0.51 669 & 155 1.17 1.36 1.24
9.5‐mm 0.51 0.47 663 & 156 1.19 1.36 1.24
4.75‐mm 0.37 0.33 639 & 150 1.28 1.37 1.25
2.36‐mm 0.75 0.73 664 & 147 1.07 1.37 1.25
1.18‐mm 0.47 0.43 641 & 152 1.17 1.36 1.24
600‐µm 0.49 0.44 649 & 147 1.23 1.37 1.25
300‐µm 0.49 0.46 649 & 146 1.12 1.37 1.25
150‐µm 0.5 0.49 646 & 143 1.06 1.38 1.25
75 µm, Total 0.5 0.49 635 & 143 1.03 1.38 1.25

88
APPENDIX I - HOT MIX ASPHALT SOLVENT EXTRACTION- WASHING METHOD TABLES AND GRAPHS

89
Total Material Passing Scatter Plot Graphs
HMASE 73-74
Figure I-1- Total Material Passing the 12.5-mm (12 in.) Sieve
Figure I-2- Total Material Passing the 9.5-mm (38 in.) Sieve
Figure I-3- Total Material Passing the 4.75-mm (No. 4) Sieve
Figure I-4- Total Material Passing the 2.36-mm (No. 8) Sieve
Figure I-5- Total Material Passing the 1.18-mm (No. 16) Sieve
Figure I-6- Total Material Passing the 600-µm (No. 30) Sieve

90
Figure I-7- Total Material Passing the 300-µm (No. 50) Sieve
Figure I-8- Total Material Passing the 150-µm (No. 100) Sieve
Figure I-9- Total Material Passing the 75-µm (No. 200) Sieve

91
HMASE 75-76
Figure I-10- Total Material Passing the 12.5-mm (12 in.) Sieve
Figure I-11- Total Material Passing the 9.5-mm (38 in.) Sieve
Figure I-12- Total Material Passing the 4.75-mm (No. 4) Sieve
Figure I-13- Total Material Passing the 2.36-mm (No. 8) Sieve
Figure I-14- Total Material Passing the 1.18-mm (No. 16) Sieve
Figure I-15- Total Material Passing the 600-µm (No. 30) Sieve

92
Figure I-16- Total Material Passing the 300-µm (No. 50) Sieve
Figure I-17- Total Material Passing the 150-µm (No. 100) Sieve
Figure I-18- Total Material Passing the 75-µm (No. 200) Sieve

Percent Passing Bar Graphs
Average Percent Passing
Figure I-19- Total Material Passing the 25.0-mm Sieve
Figure I-20- Total Material Passing the 9.5-mm Sieve
Figure I-21- Total Material Passing the 4.75-mm Sieve
Figure I-22- Total Material Passing the 2.36- mm Sieve
Figure I-23- Total Material Passing the 1.18- mm Sieve
Figure I-24- Total Material Passing the 600-µm Sieve
93
93.5
94
94.5
95
95.5
96
96.5
73‐74 75‐76 Pooled
Manual Mechanical
81
82
83
84
85
86
87
88
89
90
73‐74 75‐76 Pooled
Manual Mechanical
58.5
59
59.5
60
60.5
61
61.5
62
62.5
73‐74 75‐76 Pooled
Manual Mechanical
0
10
20
30
40
50
60
70
73‐74 75‐76 Pooled
Manual Mechanical
20
21
22
23
24
25
26
27
73‐74 75‐76 Pooled
Manual Mechanical
15
15.5
16
16.5
17
17.5
18
18.5
73‐74 75‐76 Pooled
Manual Mechanical

Figure I-25- Total Material Passing the 300-µm Sieve
Figure I-26- Total Material Passing the 150-µm Sieve
Figure I-27- Total Material Passing the 75-µm Sieve
11.8
12
12.2
12.4
12.6
12.8
13
13.2
13.4
13.6
13.8
73‐74 75‐76 Pooled
Manual Mechanical
9.8
10
10.2
10.4
10.6
10.8
11
11.2
11.4
73‐74 75‐76 Pooled
Manual Mechanical
8.7
8.8
8.9
9
9.1
9.2
9.3
9.4
9.5
9.6
73‐74 75‐76 Pooled
Manual Mechanical

Repeatability Standard Deviation Percent Passing
Figure I-28- Total Material Passing the 25.0-mm Sieve
Figure I-29- Total Material Passing the 9.5-mm Sieve
Figure I-30- Total Material Passing the 4.75-mm Sieve
Figure I-31- Total Material Passing the 2.36- mm Sieve
Figure I-32- Total Material Passing the 1.18- mm Sieve
Figure I-33- Total Material Passing the 600-µm Sieve
0
0.05
0.1
0.15
0.2
0.25
0.3
0.35
0.4
0.45
73‐74 75‐76 Pooled
Manual Mechanical
0
0.05
0.1
0.15
0.2
0.25
0.3
0.35
0.4
73‐74 75‐76 Pooled
Manual Mechanical
0
0.05
0.1
0.15
0.2
0.25
0.3
0.35
0.4
73‐74 75‐76 Pooled
Manual Mechanical
0
0.2
0.4
0.6
0.8
1
1.2
73‐74 75‐76 Pooled
Manual Mechanical
0
0.1
0.2
0.3
0.4
0.5
0.6
73‐74 75‐76 Pooled
Manual Mechanical
0
0.1
0.2
0.3
0.4
0.5
0.6
73‐74 75‐76 Pooled
Manual Mechanical

Figure I-34- Total Material Passing the 300-µm Sieve
Figure I-35- Total Material Passing the 150-µm Sieve
Figure I-36- Total Material Passing the 75-µm Sieve
0
0.1
0.2
0.3
0.4
0.5
0.6
73‐74 75‐76 Pooled
Manual Mechanical
0
0.1
0.2
0.3
0.4
0.5
0.6
73‐74 75‐76 Pooled
Manual Mechanical
0
0.05
0.1
0.15
0.2
0.25
0.3
0.35
0.4
0.45
0.5
73‐74 75‐76 Pooled
Manual Mechanical

Reproducibility Standard Deviation Percent Passing
Figure I-37- Total Material Passing the 25.0-mm Sieve
Figure I-38- Total Material Passing the 9.5-mm Sieve
Figure I-39- Total Material Passing the 4.75-mm Sieve
Figure I-40- Total Material Passing the 2.36- mm Sieve
Figure I-41- Total Material Passing the 1.18- mm Sieve
Figure I-42- Total Material Passing the 600-µm Sieve
0
0.1
0.2
0.3
0.4
0.5
73‐74 75‐76 Pooled
Manual Mechanical
0
0.1
0.2
0.3
0.4
0.5
0.6
73‐74 75‐76 Pooled
Manual Mechanical
0
0.1
0.2
0.3
0.4
0.5
73‐74 75‐76 Pooled
Manual Mechanical
0
0.2
0.4
0.6
0.8
1
1.2
1.4
73‐74 75‐76 Pooled
Manual Mechanical
0
0.1
0.2
0.3
0.4
0.5
0.6
0.7
0.8
73‐74 75‐76 Pooled
Manual Mechanical
0
0.1
0.2
0.3
0.4
0.5
0.6
0.7
0.8
73‐74 75‐76 Pooled
Manual Mechanical

98
Figure I-43- Total Material Passing the 300-µm Sieve
Figure I-44- Total Material Passing the 150-µm Sieve
Figure I-45- Total Material Passing the 75-µm Sieve
0.6
0.62
0.64
0.66
0.68
0.7
0.72
73‐74 75‐76 Pooled
Manual Mechanical
0.64
0.65
0.66
0.67
0.68
0.69
0.7
73‐74 75‐76 Pooled
Manual Mechanical
0.6
0.61
0.62
0.63
0.64
0.65
0.66
0.67
0.68
0.69
0.7
73‐74 75‐76 Pooled
Manual Mechanical

99
Summaries of Statistics
HMASE 73-74 Summaries of Statistics
Table I-1- Summary of statistics of percent passing various sieve sizes from washing of HMASE 73-74 samples, all washing methods
Sample No./
Washing Method
Size No. of Labs
Average Results
Repeatability Reproducibility
X Y 1s X
samples CV%
Y samples CV%
x samples Y samples
1s CV% 1s CV%
HMASE 73‐74 All
Methods of
Washing
12.5 mm 47 95.9 96.2 0.17 0.17 0.17 0.18 0.19 0.18 0.19
9.5 mm 50 88.9 89.7 0.26 0.29 0.29 0.33 0.37 0.38 0.43
4.75 mm 50 63.3 60.7 0.34 0.54 0.56 0.42 0.66 0.48 0.80
2.36 mm 53 39.3 39.3 0.46 1.17 1.17 0.66 1.68 0.73 1.86
1.18 mm 52 25.9 25.8 0.35 1.37 1.37 0.54 2.08 0.57 2.22
600 µm 52 17.9 17.9 0.34 1.92 1.92 0.55 3.08 0.59 3.32
300 µm 52 13.6 13.5 0.40 2.93 2.94 0.67 4.90 0.61 4.51
150 µm 52 11.2 11.2 0.38 3.41 3.41 0.68 6.06 0.67 6.03
75 µm, Total
51 9.5 9.5 0.38 4.04 4.05 0.66 6.89 0.61 6.37
Table I-2- Summary of statistics of percent passing various sieve sizes from manual washing of HMASE 73-74 samples
Sample No./
Washing Method
Size No. of Labs
Average Results
Repeatability Reproducibility
X Y 1s X
samples CV%
Y samples CV%
X samples Y samples
1s CV% 1s CV%
HMASE 73‐74 Manual Washing
12.5 mm 194 95.9 96.2 0.16 0.17 0.17 0.19 0.20 0.17 0.17
9.5 mm 209 88.9 89.7 0.26 0.29 0.29 0.37 0.42 0.31 0.35
4.75 mm 194 63.2 60.6 0.31 0.49 0.51 0.44 0.70 0.46 0.77
2.36 mm 219 39.2 39.2 0.49 1.26 1.26 0.85 2.16 0.86 2.19
1.18 mm 204 25.8 25.6 0.29 1.14 1.14 0.66 2.57 0.63 2.47
600 µm 207 17.7 17.7 0.30 1.72 1.73 0.68 3.83 0.65 3.70
300 µm 215 13.3 13.2 0.34 2.53 2.54 0.68 5.15 0.62 4.66
150 µm 218 10.9 10.8 0.34 3.14 3.16 0.70 6.41 0.67 6.23
75 µm, Total
211 9.3 9.2 0.32 3.40 3.43 0.67 7.17 0.65 7.04

100
Table I-3- Summary of statistics of percent passing various sieve sizes from mechanical washing of HMASE 73-74 samples
Sample No./
Washing Method
Size No. of Labs
Average Results
Repeatability Reproducibility
X Y 1s X
samples CV%
Y samples CV%
X samples Y samples
1s CV% 1s CV%
HMASE 73‐74
Mechanical Method
of Washing
12.5 mm 47 95.9 96.2 0.17 0.17 0.17 0.18 0.19 0.18 0.19
9.5 mm 50 88.9 89.7 0.26 0.29 0.29 0.33 0.37 0.38 0.43
4.75 mm 50 63.3 60.7 0.34 0.54 0.56 0.42 0.66 0.48 0.80
2.36 mm 53 39.3 39.3 0.46 1.17 1.17 0.66 1.68 0.73 1.86
1.18 mm 52 25.9 25.8 0.35 1.37 1.37 0.54 2.08 0.57 2.22
600 µm 52 17.9 17.9 0.34 1.92 1.92 0.55 3.08 0.59 3.32
300 µm 52 13.6 13.5 0.40 2.93 2.94 0.67 4.90 0.61 4.51
150 µm 52 11.2 11.2 0.38 3.41 3.41 0.68 6.06 0.67 6.03
75 µm, Total
51 9.5 9.5 0.38 4.04 4.05 0.66 6.89 0.61 6.37

101
HMASE 75-76 Summaries of Statistics
Table I-4- Summary of statistics of percent passing various sieve sizes from washing of HMASE 75-76 samples, all washing methods
Sample No./
Washing Method
Size No. of Labs
Average Results Repeatability Reproducibility
X Y 1s X
samples CV%
Y samples CV%
X Y
1s CV% 1s CV%
HMASE 75‐76, All
Methods of
Washing
12.5 mm
280 94.9 93.7 0.31 0.33 0.33 0.39 0.41 0.45 0.48
9.5 mm 266 86.3 82.2 0.34 0.40 0.42 0.49 0.57 0.43 0.53
4.75 mm
237 54.6 64.8 0.16 0.30 0.25 0.27 0.50 0.24 0.36
2.36 mm
287 35.5 36.1 1.01 2.84 2.79 1.14 3.21 1.17 3.23
1.18 mm
284 22.5 22.1 0.53 2.36 2.41 0.64 2.84 0.74 3.35
600 µm 286 16.3 15.8 0.54 3.33 3.43 0.66 4.04 0.76 4.80
300 µm 281 12.7 12.2 0.50 3.94 4.10 0.63 4.97 0.72 5.92
150 µm 281 10.6 10.1 0.48 4.54 4.74 0.64 6.07 0.69 6.86
75 µm, Total
280 9.2 8.8 0.47 5.07 5.29 0.67 7.26 0.71 8.09
Table I-5- Summary of statistics for percent passing various sieve sizes from manual washing of HMASE 75-76 samples
Sample No./
Washing Method
Size No. of Labs
Average Results
Repeatability Reproducibility
X Y 1s X
samples CV%
Y samples CV%
X samples Y samples
1s CV% 1s CV%
HMASE 75‐76, Manual Washing
12.5 mm 236 94.9 93.7 0.30 0.31 0.32 0.38 0.40 0.45 0.48
9.5 mm 221 86.3 82.2 0.33 0.39 0.41 0.47 0.55 0.41 0.50
4.75 mm 202 54.6 64.8 0.17 0.31 0.26 0.28 0.51 0.24 0.37
2.36 mm 241 35.5 36.1 1.02 2.86 2.81 1.13 3.18 1.18 3.27
1.18 mm 237 22.5 22.1 0.54 2.38 2.42 0.64 2.83 0.75 3.41
600 µm 238 16.3 15.8 0.55 3.36 3.46 0.66 4.08 0.77 4.87
300 µm 233 12.7 12.2 0.51 4.00 4.16 0.61 4.84 0.73 5.98
150 µm 232 10.5 10.1 0.49 4.62 4.81 0.62 5.87 0.70 6.95
75 µm, Total
233 9.2 8.8 0.47 5.12 5.32 0.64 7.02 0.73 8.24

102
Table I-6- Summary of statistics for percent passing various sieve sizes from mechanical washing of HMASE 75-76 samples
Sample No./
Washing Method
Size No. of Labs
Average Results
Repeatability Reproducibility
X Y 1s X
samples CV%
Y samples CV%
X samples Y samples
1s CV% 1s CV%
HMASE 75‐76,
Mechanical Method
of Washing
12.5 mm 44 94.9 93.7 0.39 0.41 0.42 0.42 0.45 0.45 0.48
9.5 mm 45 86.3 82.2 0.37 0.43 0.45 0.59 0.68 0.52 0.64
4.75 mm 35 54.7 64.8 0.14 0.26 0.22 0.24 0.43 0.21 0.32
2.36 mm 46 35.5 36.2 0.99 2.78 2.73 1.20 3.38 1.11 3.07
1.18 mm 46 22.7 22.2 0.52 2.27 2.33 0.65 2.85 0.68 3.09
600 µm 47 16.5 15.9 0.53 3.23 3.34 0.63 3.83 0.72 4.49
300 µm 47 12.8 12.3 0.47 3.67 3.84 0.70 5.48 0.70 5.67
150 µm 48 10.7 10.2 0.43 4.01 4.22 0.72 6.72 0.66 6.41
75 µm, Total
46 9.4 9.0 0.43 4.53 4.76 0.74 7.89 0.65 7.24

103
HMASE 77-78 Summaries of Statistics
Table I-7- Summary of statistics of percent passing various sieve sizes from washing of HMASE 77-78 samples, all washing methods
Sample No./
Washing Method
Size No. of Labs
Average Results Repeatability Reproducibility
X Y 1s X
samples CV%
Y samples CV%
X Y
1s CV% 1s CV%
HMASE 77‐78, All
Methods of
Washing
12.5 mm
283 94.7 94.2 0.37 0.39 0.39 0.43 0.46 0.52 0.55
9.5 mm 272 87.1 85.9 0.28 0.33 0.33 0.36 0.41 0.36 0.42
4.75 mm
257 58.2 60.4 0.16 0.28 0.27 0.28 0.47 0.28 0.47
2.36 mm
291 39.7 39.5 0.74 1.86 1.87 0.85 2.15 0.98 2.49
1.18 mm
271 25.9 26 0.28 1.08 1.07 0.5 1.92 0.49 1.88
600 µm 272 17.6 17.7 0.27 1.53 1.52 0.56 3.15 0.53 3
300 µm 272 12.9 13 0.28 2.15 2.13 0.52 4.02 0.5 3.81
150 µm 274 10.4 10.5 0.26 2.52 2.5 0.57 5.51 0.55 5.23
75 µm, Total
267 8.88 8.96 0.25 2.76 2.74 0.53 6.02 0.52 5.78
Table I-8- Summary of statistics for percent passing various sieve sizes from manual washing of HMASE 77-78 samples
Sample No./
Washing Method
Size No. of Labs
Average Results
Repeatability Reproducibility
X Y 1s X
samples CV%
Y samples CV%
X samples Y samples
1s CV% 1s CV%
HMASE 77‐78, Manual Washing
12.5 mm 225 94.7 94.2 0.38 0.4 0.4 0.43 0.46 0.52 0.55
9.5 mm 216 87.1 85.9 0.28 0.33 0.33 0.35 0.41 0.37 0.43
4.75 mm 205 58.2 60.4 0.16 0.28 0.27 0.27 0.46 0.29 0.47
2.36 mm 234 39.7 39.5 0.7 1.77 1.78 0.85 2.14 1 2.54
1.18 mm 218 25.9 26 0.28 1.07 1.06 0.5 1.92 0.49 1.89
600 µm 220 17.6 17.7 0.26 1.49 1.49 0.56 3.16 0.54 3.07
300 µm 217 12.9 13 0.27 2.07 2.06 0.52 4.05 0.5 3.83
150 µm 223 10.3 10.4 0.26 2.52 2.5 0.57 5.53 0.55 5.32
75 µm, Total
216 8.86 8.93 0.24 2.7 2.68 0.52 5.92 0.52 5.87

104
Table I-9- Summary of statistics for percent passing various sieve sizes from mechanical washing of HMASE 77-78 samples
Sample No./
Washing Method
Size No. of Labs
Average Results
Repeatability Reproducibility
X Y 1s X
samples CV%
Y samples CV%
X samples Y samples
1s CV% 1s CV%
HMASE 77‐78,
Mechanical Method
of Washing
12.5 mm 54 94.6 94.3 0.34 0.36 0.36 0.43 0.46 0.51 0.54
9.5 mm 52 87.2 86 0.28 0.32 0.33 0.36 0.41 0.31 0.36
4.75 mm 48 58.2 60.4 0.17 0.3 0.29 0.31 0.53 0.27 0.44
2.36 mm 53 39.6 39.5 0.89 2.24 2.24 0.89 2.24 0.9 2.28
1.18 mm 49 25.9 26.2 0.29 1.12 1.11 0.51 1.97 0.47 1.82
600 µm 48 17.7 17.8 0.3 1.72 1.71 0.57 3.24 0.48 2.72
300 µm 51 13 13.2 0.31 2.41 2.36 0.52 4.04 0.46 3.5
150 µm 47 10.5 10.7 0.27 2.54 2.49 0.59 5.64 0.49 4.62
75 µm, Total
47 8.95 9.13 0.27 3.06 3 0.6 6.68 0.48 5.26

105
Statistical Tests of Significance
HMASE 73-74 Statistical test of significance
Table I-10- Statistical t-test for comparison of average percent passing of various sieve sizes from mechanical and manual washing of HMASE 73-74
Sieve Sizes Average Percent Passing
Degrees of Freedom Computed t Manual Mechanical
12.5‐mm 94.3 94.3 59 ‐0.31
9.5‐mm 84.3 84.3 56 0.15
4.75‐mm 59.7 59.8 52 ‐1.57
2.36‐mm 35.8 35.8 63 ‐0.21
1.18‐mm 22.3 22.4 66 ‐1.10
600‐µm 16.1 16.1 68 ‐1.17
300‐µm 12.4 12.6 64 ‐1.39
150‐µm 10.3 10.5 66 ‐1.54
75 µm, Total 9 9.2 63 ‐1.80
Note: Critical t for 1% level of significance is 2.66 and for 5% level of significance is 2.00
Table I-11- Statistical F-test for comparison of repeatability standard deviations of percent passing various sieve sizes from mechanical and manual washing of HMASE 73-74
Sieve Sizes
1S Repeatability, Percent Passing Degrees of
Freedom Computed
F Critical F(α=.01)
Critical F(α=.05)
Manual Mechanical
12.5‐mm 0.3 0.39 43 & 235 1.70 1.66 1.43
9.5‐mm 0.33 0.37 44 & 220 1.23 1.66 1.43
4.75‐mm 0.17 0.14 201 & 34 1.39 1.98 1.61
2.36‐mm 1.02 0.99 240 & 45 1.06 1.80 1.51
1.18‐mm 0.54 0.52 236 & 45 1.08 1.80 1.51
600‐µm 0.55 0.53 237 & 46 1.06 1.79 1.50
300‐µm 0.51 0.47 232 & 46 1.16 1.79 1.50
150‐µm 0.49 0.43 231 & 47 1.27 1.78 1.50
75 µm, Total
0.47 0.43 232 & 45 1.21 1.80 1.51

106
Table I-12- Statistical F-test for comparison of reproducibility standard deviations of percent passing various sieve sizes from mechanical and manual washing of HMASE 73-74
Sieve Sizes
1S Reproducibility, Percent Passing Degrees of
Freedom Computed
F Critical F(α=.01)
Critical F(α=.05)
Manual Mechanical
12.5‐mm 0.42 0.44 43 & 235 1.09 1.66 1.43
9.5‐mm 0.45 0.56 44 & 220 1.56 1.66 1.43
4.75‐mm 0.26 0.22 201 & 34 1.37 1.98 1.61
2.36‐mm 1.16 1.16 45 & 240 1.00 1.64 1.42
1.18‐mm 0.7 0.67 236 & 45 1.10 1.80 1.51
600‐µm 0.72 0.67 237 & 46 1.14 1.79 1.50
300‐µm 0.67 0.7 46 & 232 1.08 1.64 1.42
150‐µm 0.66 0.69 47 & 231 1.09 1.63 1.42
75 µm, Total
0.69 0.7 45 & 232 1.03 1.64 1.42

107
HMASE 75-76 Statistical test of significance
Table I-13- Statistical t-test for comparison of average percent passing various sieve sizes from mechanical and manual washing of HMASE 75-76 samples
Sieve Sizes Average Percent Passing
Degrees of Freedom Computed t Manual Mechanical
12.5‐mm 94.27 94.30 119 ‐0.44
9.5‐mm 84.26 84.25 113 0.21
4.75‐mm 59.70 59.77 105 ‐2.22
2.36‐mm 35.80 35.84 128 ‐0.29
1.18‐mm 22.31 22.43 133 ‐1.56
600‐µm 16.06 16.18 138 ‐1.66
300‐µm 12.41 12.56 130 ‐1.96
150‐µm 10.31 10.48 134 ‐2.61
75 µm, Total 8.98 9.18 128 ‐2.55
Note: Critical t for 1% level of significance is 2.61 and for 5% level of significance is 1.98
Table I-14- Statistical F-test for comparison of repeatability standard deviations of percent passing various sieve sizes from mechanical and manual washing of HMASE 75-76 samples
Sieve Sizes 1S Repeatability, Percent Passing Degrees of
Freedom Computed F
Critical F(α=.01)
Critical F(α=.05)Manual Mech.
12.5‐mm 0.30 0.39 43 & 235 1.70 1.66 1.43
9.5‐mm 0.33 0.37 44 & 220 1.23 1.66 1.43
4.75‐mm 0.17 0.14 201 & 34 1.39 1.98 1.61
2.36‐mm 1.02 0.99 45 & 240 1.06 1.80 1.51
1.18‐mm 0.54 0.52 236 & 45 1.08 1.80 1.51
600‐µm 0.55 0.53 237 & 46 1.06 1.79 1.50
300‐µm 0.51 0.47 46 & 232 1.16 1.79 1.50
150‐µm 0.49 0.43 47 & 231 1.27 1.78 1.50
75 µm, Total 0.47 0.43 45 & 232 1.21 1.80 1.51

108
Table I-15- Statistical F-test for comparison of reproducibility standard deviations of percent passing various sieve sizes from mechanical and manual washing of HMASE 75-76 samples
Sieve Sizes 1S Reproducibility, Percent Passing Degrees of
Freedom Computed F
Critical F(α=.01)
Critical F(α=.05)Manual Mech.
12.5‐mm 0.42 0.44 43 & 235 1.09 1.66 1.43
9.5‐mm 0.45 0.56 44 & 220 1.56 1.66 1.43
4.75‐mm 0.26 0.22 201 & 34 1.37 1.98 1.61
2.36‐mm 1.16 1.16 45 & 240 1.00 1.64 1.42
1.18‐mm 0.70 0.67 236 & 45 1.10 1.80 1.51
600‐µm 0.72 0.67 237 & 46 1.14 1.79 1.50
300‐µm 0.67 0.70 46 & 232 1.8 1.64 1.42
150‐µm 0.66 0.69 47 & 231 1.09 1.63 1.42
75 µm, Total 0.69 0.70 45 & 232 1.03 1.64 1.42

109
HMASE 77-78 Statistical test of significance
Table I-16- Statistical t-test for comparison of average percent passing of various sieve sizes from mechanical and manual washing of HMASE 77-78
Sieve Sizes Average Percent Passing
Degrees of Freedom Computed t Manual Mechanical
12.5‐mm 94.4 94.4 81 0.10
9.5‐mm 86.5 86.6 83 ‐1.06
4.75‐mm 59.3 59.3 69 ‐0.73
2.36‐mm 39.6 39.5 79 0.36
1.18‐mm 26 26 71 ‐1.11
600‐µm 17.7 17.7 71 ‐0.97
300‐µm 12.9 13.1 77 ‐2.08
150‐µm 10.4 10.6 68 ‐2.03
75 µm, Total 8.9 9 66 ‐1.67
Note: Critical t for 1% level of significance is 2.64 and for 5% level of significance is 1.99
Table I-17- Statistical F-test for comparison of repeatability standard deviations of percent passing various sieve sizes from mechanical and manual washing of HMASE 77-78
Sieve Sizes
1S Repeatability, Percent Passing Degrees of
Freedom Computed
F Critical F(α=.01)
Critical F(α=.05)
Manual Mechanical
12.5‐mm 0.38 0.34 224 & 53 1.25 1.72 1.46
9.5‐mm 0.28 0.28 215 & 51 1.01 1.74 1.48
4.75‐mm 0.16 0.17 47 & 204 1.16 1.64 1.42
2.36‐mm 0.7 0.89 52 & 233 1.60 1.60 1.40
1.18‐mm 0.28 0.29 48 & 217 1.09 1.63 1.42
600‐µm 0.26 0.3 47 & 219 1.34 1.64 1.42
300‐µm 0.27 0.31 50 & 216 1.37 1.62 1.41
150‐µm 0.26 0.27 46 & 222 1.04 1.64 1.42
75 µm, Total
0.24 0.27 46 & 215 1.31 1.65 1.42

110
Table I-18- Statistical F-test for comparison of reproducibility standard deviations of percent passing various sieve sizes from mechanical and manual washing of HMASE 77-78
Sieve Sizes
1S Reproducibility, Percent Passing Degrees of
Freedom Computed
F Critical F(α=.01)
Critical F(α=.05)
Manual Mechanical
12.5‐mm 0.48 0.48 224 & 53 1.01 1.72 1.46
9.5‐mm 0.36 0.33 215 & 51 1.18 1.74 1.48
4.75‐mm 0.29 0.28 47 & 204 1.08 1.64 1.42
2.36‐mm 0.93 0.89 233 & 52 1.08 1.73 1.47
1.18‐mm 0.49 0.49 217 & 48 1.01 1.77 1.49
600‐µm 0.55 0.53 219 & 47 1.08 1.78 1.50
300‐µm 0.51 0.49 216 & 50 1.06 1.75 1.48
150‐µm 0.56 0.54 222 & 46 1.07 1.79 1.50
75 µm, Total
0.54 0.52 46 & 215 1.07 1.65 1.42
Related Documents