Precise Burst Synchrony in the Superior Colliculus of the Awake Cat during Moving Stimulus Presentation Quentin Pauluis, 1 Stuart N. Baker, 2 and Etienne Olivier 1 1 Laboratory of Neurophysiology, School of Medicine, Universite ´ Catholique de Louvain, B-1200 Brussels, Belgium, and 2 Department of Anatomy, Cambridge University, Cambridge, United Kingdom CB2 3DY This study aimed to characterize the synchrony that occurs between cell discharges in the superior colliculus of the awake cat. We trained cats to perform a visual fixation in the presence of a visual moving stimulus and then recorded 686 pairs of neighboring cells in the superior colliculus during task perfor- mance. A new method to assess the significance of precise discharge synchronization is described, which permits analysis of nonstationary data. Of 181 pairs with sufficient data for quantitative analysis, 125 showed a cross-correlation histo- gram (CCH) with features assessed as significant using this approach. CCHs frequently showed an isolated central peak (41 of 125) or a peak flanked by one or two troughs (68 of 125), and in a few cases an oscillatory pattern of ;65 Hz (16 of 125). This is in contrast to the oscillation frequency reported for the visual cortex and shows that oscillations in the superior collicu- lus probably arise from a cortex-independent mechanism. Our method also permits direct quantification of the correla- tion shift predictors, assessing precise time locking of spikes to the stimulus. Only 1 of 125 cross-correlation shift predictors had a significant central peak, meaning that most of the CCH features were not related to cell discharges time-locked to the stimulus presentation. Further investigation using a burst-jittering method showed that synchrony in the superior colliculus is attribut- able to precise synchronization of short bursts of spikes. Such synchrony could be related to the network dynamics and the common inhibitory feedback from local interneurons, which would act as temporal selectors of the cells with greatest or fastest response. Key words: correlation analysis; coincident event; fast oscil- lations; spike; motion-processing; stimulus-locked responses Synchronous neuronal activity at the millisecond time scale has been described in the mammalian visual cortex (Griffith and Horn, 1963) and in many other regions of the brain (Singer and Gray, 1995). Although this phenomenon has aroused interest for some time, its functional significance remains uncertain and has become an object of speculation and controversy (Usrey and Reid, 1999). Synchrony could be related to information transfer by synfire chains (Abeles, 1991), information storage in potenti- ated synapses (Singer, 1995; Whittington et al., 1997), a time advance coding scheme (Hopfield 1995, 1996), tag transmission in binding theory (Roelfsema and Singer, 1998), or to timed neuro- nal selection for temporal pattern recognition (Laurent, 1996; Parodi et al., 1996). Similarly, coincident bursts have also been suggested to play a role in synaptic plasticity and information processing (Lisman, 1997). Determining the time during an experiment when synchrony occurs could shed light on its possible function (Vaadia et al., 1995; Riehle et al., 1997). However, this is a difficult statistical problem, because it requires a method capable of quantifying the excess of synchronous spikes, termed coincident events (CEs), even when the neural firing rates covary with the animal’s per- formance, behavior, or attention (Pauluis and Baker, 2000). With- out such precise quantification, it is not possible to show that the information provided by the CEs differs from that contained by the firing rate variation. The superior colliculus (SC) has long been known as a senso- rimotor interface that controls rapid orientation movements (Sparks, 1986; Grantyn, 1988). The ventral part of the superficial laminae of the SC receives direct afferent input from the retina and visual cortex layers V and VI pyramidal cells (magnocellular pathway). Cortical projections maintain topographic alignment with the retinal input, so that the central 10° of the visual field are represented proximally by .30% of the SC. Cells in the superfi- cial and intermediate layers are visually responsive, exhibit a phasic response to the onset and offset of a stationary spot of light, and respond vigorously to stimuli moving at 0.5–30°/sec (some- times up to 800°/sec). Conversely, the response of cells in deep layers exhibits dramatic adaptation to repetitive stimulation (Sparks, 1986; Grantyn, 1988). The visual processing of moving visual stimuli performed in the SC suggests that, as in the visual cortex, the SC may be a structure in which synchrony is important for information pro- cessing. However, collicular and corticotectal multiunit cross- correlations observed in the anesthetized cat exhibit much broader peaks than in the cortex (average width at half height, 51 msec; Brecht et al., 1998). Such broad temporal dispersion is thought to be related to a simultaneous activation of both cells or to the presence of large bursts in their discharges, but not espe- cially to a temporally precise coding (Nelson et al., 1992; Nowak et al., 1995). Given the major role of the SC in gaze and attention orienta- Received July 6, 2000; revised Oct. 13, 2000; accepted Oct. 16, 2000. This work was supported by a British Council–Commissariat Ge ´ne ´ral aux Rela- tions Internationales de la Communaute ´ Française de Belgique travel grant. S.N.B. is supported by the United Kingdom Medical Research Council, Christ’s College (Cambridge, UK), and The Wellcome Trust. We thank Anne-Marie Rona for excellent technical assistance in preparing histology. Correspondence should be addressed to Dr. Quentin Pauluis, Laboratory of Neurophysiology, Universite ´ C atholique de L ouvain, Avenue Hippocrate 54, B-1200 Brussels, Belgium. E-mail: pauluis@nef y.ucl.ac.be. Copyright © 2001 Society for Neuroscience 0270-6474/01/210615-13$15.00/0 The Journal of Neuroscience, January 15, 2001, 21(2):615–627

Welcome message from author
This document is posted to help you gain knowledge. Please leave a comment to let me know what you think about it! Share it to your friends and learn new things together.
Transcript
Precise Burst Synchrony in the Superior Colliculus of the AwakeCat during Moving Stimulus Presentation
Quentin Pauluis,1 Stuart N. Baker,2 and Etienne Olivier1
1Laboratory of Neurophysiology, School of Medicine, Universite Catholique de Louvain, B-1200 Brussels, Belgium, and2Department of Anatomy, Cambridge University, Cambridge, United Kingdom CB2 3DY
This study aimed to characterize the synchrony that occursbetween cell discharges in the superior colliculus of the awakecat. We trained cats to perform a visual fixation in the presenceof a visual moving stimulus and then recorded 686 pairs ofneighboring cells in the superior colliculus during task perfor-mance. A new method to assess the significance of precisedischarge synchronization is described, which permits analysisof nonstationary data. Of 181 pairs with sufficient data forquantitative analysis, 125 showed a cross-correlation histo-gram (CCH) with features assessed as significant using thisapproach. CCHs frequently showed an isolated central peak(41 of 125) or a peak flanked by one or two troughs (68 of 125),and in a few cases an oscillatory pattern of ;65 Hz (16 of 125).This is in contrast to the oscillation frequency reported for thevisual cortex and shows that oscillations in the superior collicu-lus probably arise from a cortex-independent mechanism.
Our method also permits direct quantification of the correla-tion shift predictors, assessing precise time locking of spikes tothe stimulus. Only 1 of 125 cross-correlation shift predictorshad a significant central peak, meaning that most of the CCHfeatures were not related to cell discharges time-locked to thestimulus presentation.
Further investigation using a burst-jittering methodshowed that synchrony in the superior colliculus is attribut-able to precise synchronization of short bursts of spikes.Such synchrony could be related to the network dynamicsand the common inhibitory feedback from local interneurons,which would act as temporal selectors of the cells withgreatest or fastest response.
Key words: correlation analysis; coincident event; fast oscil-lations; spike; motion-processing; stimulus-locked responses
Synchronous neuronal activity at the millisecond time scale hasbeen described in the mammalian visual cortex (Griffith andHorn, 1963) and in many other regions of the brain (Singer andGray, 1995). Although this phenomenon has aroused interest forsome time, its functional significance remains uncertain and hasbecome an object of speculation and controversy (Usrey andReid, 1999). Synchrony could be related to information transferby synfire chains (Abeles, 1991), information storage in potenti-ated synapses (Singer, 1995; Whittington et al., 1997), a timeadvance coding scheme (Hopfield 1995, 1996), tag transmission inbinding theory (Roelfsema and Singer, 1998), or to timed neuro-nal selection for temporal pattern recognition (Laurent, 1996;Parodi et al., 1996). Similarly, coincident bursts have also beensuggested to play a role in synaptic plasticity and informationprocessing (Lisman, 1997).
Determining the time during an experiment when synchronyoccurs could shed light on its possible function (Vaadia et al.,1995; Riehle et al., 1997). However, this is a difficult statisticalproblem, because it requires a method capable of quantifying theexcess of synchronous spikes, termed coincident events (CEs),even when the neural firing rates covary with the animal’s per-
formance, behavior, or attention (Pauluis and Baker, 2000). With-out such precise quantification, it is not possible to show that theinformation provided by the CEs differs from that contained bythe firing rate variation.
The superior colliculus (SC) has long been known as a senso-rimotor interface that controls rapid orientation movements(Sparks, 1986; Grantyn, 1988). The ventral part of the superficiallaminae of the SC receives direct afferent input from the retinaand visual cortex layers V and VI pyramidal cells (magnocellularpathway). Cortical projections maintain topographic alignmentwith the retinal input, so that the central 10° of the visual field arerepresented proximally by .30% of the SC. Cells in the superfi-cial and intermediate layers are visually responsive, exhibit aphasic response to the onset and offset of a stationary spot of light,and respond vigorously to stimuli moving at 0.5–30°/sec (some-times up to 800°/sec). Conversely, the response of cells in deeplayers exhibits dramatic adaptation to repetitive stimulation(Sparks, 1986; Grantyn, 1988).
The visual processing of moving visual stimuli performed inthe SC suggests that, as in the visual cortex, the SC may be astructure in which synchrony is important for information pro-cessing. However, collicular and corticotectal multiunit cross-correlations observed in the anesthetized cat exhibit muchbroader peaks than in the cortex (average width at half height, 51msec; Brecht et al., 1998). Such broad temporal dispersion isthought to be related to a simultaneous activation of both cells orto the presence of large bursts in their discharges, but not espe-cially to a temporally precise coding (Nelson et al., 1992; Nowaket al., 1995).
Given the major role of the SC in gaze and attention orienta-
Received July 6, 2000; revised Oct. 13, 2000; accepted Oct. 16, 2000.This work was supported by a British Council–Commissariat General aux Rela-
tions Internationales de la Communaute Française de Belgique travel grant. S.N.B.is supported by the United Kingdom Medical Research Council, Christ’s College(Cambridge, UK), and The Wellcome Trust. We thank Anne-Marie Rona forexcellent technical assistance in preparing histology.
Correspondence should be addressed to Dr. Quentin Pauluis, Laboratory ofNeurophysiology, Universite Catholique de Louvain, Avenue Hippocrate 54, B-1200Brussels, Belgium. E-mail: [email protected] © 2001 Society for Neuroscience 0270-6474/01/210615-13$15.00/0
The Journal of Neuroscience, January 15, 2001, 21(2):615–627
tion (Goldberg and Wurtz, 1972; Wurtz et al., 1982; Robinsonand Kertzman, 1995), we studied spike train correlations in theSC of awake cats. The animals performed a fixation task to acentral target while a light spot moved in the visual field. We usednew quantification methods that relied on instantaneous dis-charge probability estimates to calculate the expected correlationon a single-trial basis (Pauluis and Baker, 2000).
A preliminary account of this work has been presented previ-ously in abstract form (Pauluis et al., 1999).
MATERIALS AND METHODSExperiments were performed on two adult cats selected after a fewweeks of training on gaze orientation tasks. The care and use of animalswas in accordance with the guidelines of the Society for Neuroscienceand the American Physiological Society.
GeneralTwo cats were prepared for chronic gaze recording by undergoing a firstsurgery. Anesthesia was induced with xylazine (2 mg/kg, i.m.) and, after20 min, with ketamine hydrochloride (10 mg/kg, i.m.). Deep anesthesiawas maintained throughout with additional injections of both drugs. Ascleral search coil (three turns of 20-mm-diameter Teflon-insulated stain-less steel wire; Cooner Wire Company, Chatsworth, CA) was implantedunder the conjunctiva. The animal was placed in a Horsley–Clarkeapparatus, and a head implant was constructed from dental cement andanchored to the skull with stainless steel screws. A fixation device wasembedded in dental cement to fix the head during experiments.
After recovery from the surgery, cats underwent a second stereotaxicprocedure under deep anesthesia. A craniotomy was performed to allowaccess of microelectrodes into both SCs, and a stainless steel recordingchamber was added to the head implant on the midline at stereotaxiccoordinate anterior, 12.
Behavioral paradigmsCats were trained to perform fixation and saccade tasks for food reward.The target spots were projected on a tangential screen by oscilloscopescontrolled with an 80486 personal computer (digital-to-analog converterfrequency; 100 Hz).
Moving stimulus paradigm. All trials started with an auditory clickfollowed after 300 msec by the appearance of a small fixation point (FP)of 0.5° and a larger stimulus point (SP) (disk ;3.0°) both at the center ofthe visual field (Fig. 1 A). The cat had 1200 msec to begin fixating and wasrequired to maintain fixation for 500–1200 msec (Fig. 1C). Then, the SPmoved slowly toward the periphery with fixed velocity (5–70°/sec), am-plitude (5–35°), and direction, which could be chosen either specificallyor randomly (Fig. 1 B). The SP was the stimulus for the recorded cells. Atthe end of the ramp, the SP was switched off for 300 msec. A new SPappeared then at the center and started to move after 60 msec. This wasrepeated up to four times. During the whole paradigm the cat was notallowed to follow the stimulus and had to maintain fixation within 3° ofthe FP to receive a food reward.
Cats were typically capable of 2 hr of sustained task performance,performing a total of 300–800 trials in blocks of 20–80.
Recording and data collectionNeuronal discharge was recorded extracellularly with two commerciallyavailable tungsten microelectrodes (impedance, 0.15–0.6 MV at 1 kHz;FHC, Bowdoinham, ME). The two electrodes were mounted on a doublehydraulic microdrive (model MO-95B; Narishige, Tokyo, Japan) fitting asingle recording chamber and were driven independently. Electrodepenetrations were made vertically through a single guide tube (21 gauge;horizontal distance between electrode tips, .300 mm). The guide tubewas inserted afresh each session through the dura to a depth of 5 mmabove the SC. Neural activity was conventionally amplified (gain, 5000 or10,000; Neurolog NL-100 and NL-104; Digitimer), filtered (300 Hz to 6kHz; Neurolog NL-125; Digitimer), and displayed. System noise levelwas 30 mV because of the magnetic search coil fields. Cross-talk betweenthe two channels was never observed.
Eye position was measured with the magnetic search coil technique(magnetic field frequencies, 50 and 75 kHz). The target and stimuluspositions were generated by an 80486 personal computer and data acqui-sition card (model AT-MIO-16E; National Instrument) that also drove
the food reward pump and controlled a constant current stimulus isolator(WPI) for electrical stimulation.
The two independent electrodes were positioned in the SC just belowthe first layer of spontaneously active cells in dim light. As the track wascontinued deeper, cell discharges showed more and more adaptation tothe visual stimulation, preventing reliable recording for more than a fewtrials. For this reason, most of the cells were recorded in the superficialand intermediate layers (a depth of 0.5–2 mm below the SC surface).
After a recording session, if the track location was new or if theelectrode location was uncertain, we used a stimulation paradigm. Afterinitial fixation of a single FP in the center, the FP was turned off and,after an interval of 50 msec, a stimulation train was delivered (500 msecpulse width; 200 Hz; 200 msec duration; 20 mA). At the end of thestimulation train, a new target appeared randomly 10° to the right or tothe left of the FP, and the cat had to fixate this new target for foodreward. The direction and amplitude of evoked short-latency saccadiceye movements permitted precise assessment of the electrode position(Roucoux and Crommelinck, 1976).
All of the data related to the gaze and stimulus positions, to thestimulation, and to the reward were digitized at 2 kHz, whereas theextracellular activities were sampled at 20 kHz (Pentium-Pro 200 MHz;model AT-MIO-64-E3; National Instruments). Some data files weretransferred immediately after the set of trials onto another computer(Pentium-Pro 200 MHz) to assess the fine temporal relationship betweenthe spike trains. If the cell discharges were not correlated, they werediscarded after a few sets. At the end of the recordings for each day, rawdata were stored on digital compact disks for further off-line analysis.
In the final recording session, electrolytic lesions were made withstainless steel electrodes to mark the SC (20 sec, 20 mA anodal pulse).The animal was then anesthetized with xylazine (2 mg/kg, i.m.) followedby pentobarbital sodium (40 mg/kg, i.p.). After transcardial injection ofheparin, the animal was perfused with 0.9% saline and then with potas-sium ferrocyanate diluted in neutral formalin, to color iron deposits. Thebrain was removed and placed into a solution of formalin with 15 andthen 30% sucrose until it sank. The SC was blocked, frozen, and cut into30 mm transversal sections. One section of three was mounted ontochrome–alum-coated slides. Postmortem histological processing con-firmed that the marker lesion sites were located in the anterior two-thirdsof the SC at the expected depth.
Data analysisTo remove movement artifacts and to sort two or more spike waveforms,we used a program based on multiple level discriminators set sequentiallyon a plot of superposed spike waveforms (Matlab 5.0). We compared thissimple method to a more time-consuming principal component analysis(Eggermont, 1990), and they appeared equally efficient. To ensure that asingle cell was recorded, an autocorrelation histogram (ACH) was con-structed (0.1 msec bin width). The waveform was attributed to a singlecell only if the measured absolute refractory period was at least 0.75 msec[minimum interval observed by DeBusk et al. (1997) in the cat striatecortex was 0.73 msec]. From this processing, it was usually possible toisolate one or more waveforms from a single channel and to classify themas originating from a single or multiple units. No attempt was made toseparate overlapping spikes. All the waveforms from a given electrodethat did not satisfy the absolute refractory period criterion were pooledtogether into one channel of multiunit activity.
Before considering the temporal relationship between two differentcell discharges, we checked whether the same cells could have beenrecorded on both electrodes simultaneously. This was achieved by ahigh-precision cross-correlation histogram (CCH) (0.1 msec bin width;lags, 2 msec). If the same cell was recorded on both electrodes, it isexpected that the CCH peak would be very narrow and very high. Therecould be a short time lag because the spike waveforms could be slightlydifferent. Nine recordings were excluded from the analysis because theCCHs exhibited a very narrow central peak (0.1–0.2 msec width).
We also characterized the interspike interval (ISI) distribution by theproportion of ISIs shorter than 3 msec. This proportion was used by Grayand McCormick (1996) to characterize the chattering cells that had27.5 6 10.8% of their ISIs shorter than 3 msec (n 5 11). Although thisproportion has been previously applied to single-unit recordings, weextended its use to the multiunit activities for descriptive purpose only,because only a small number of different cells were present in a singlechannel of multiple unit activity thanks to the spike wave discrimination.The term “bursting train” is used here to describe the recordings in which$25% of the ISIs were shorter than 3 msec.
616 J. Neurosci., January 15, 2001, 21(2):615–627 Pauluis et al. • Precise Burst Synchrony in the Superior Colliculus
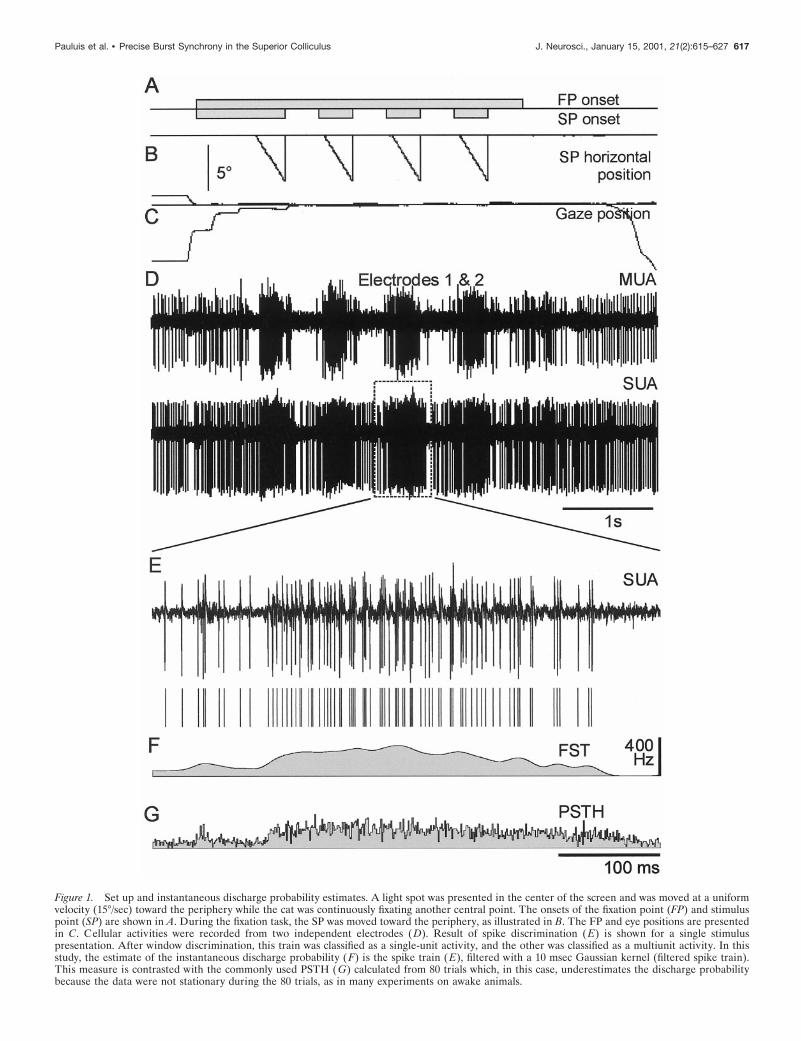
Figure 1. Set up and instantaneous discharge probability estimates. A light spot was presented in the center of the screen and was moved at a uniformvelocity (15°/sec) toward the periphery while the cat was continuously fixating another central point. The onsets of the fixation point (FP) and stimuluspoint (SP) are shown in A. During the fixation task, the SP was moved toward the periphery, as illustrated in B. The FP and eye positions are presentedin C. Cellular activities were recorded from two independent electrodes (D). Result of spike discrimination (E) is shown for a single stimuluspresentation. After window discrimination, this train was classified as a single-unit activity, and the other was classified as a multiunit activity. In thisstudy, the estimate of the instantaneous discharge probability (F) is the spike train ( E), filtered with a 10 msec Gaussian kernel (filtered spike train).This measure is contrasted with the commonly used PSTH ( G) calculated from 80 trials which, in this case, underestimates the discharge probabilitybecause the data were not stationary during the 80 trials, as in many experiments on awake animals.
Pauluis et al. • Precise Burst Synchrony in the Superior Colliculus J. Neurosci., January 15, 2001, 21(2):615–627 617
Other analysis always took place during a period that started 80 msecafter the movement beginning, that is after the strongest effect in the celldischarge caused by movement onset, and ended at the movement offset,that is before the offset response.
Instantaneous discharge probabilit y. To determine the significance ofcross-correlation peaks, one approach is to assume that the time-dependent discharge probability of each cell is equal to its peristimulustime histogram (PSTH). This would correspond to the joint peristimulustime histogram (JPSTH) method (Palm et al., 1988; Aertsen et al., 1989).However, this method encounters problems if the discharge is variablefrom one trial to the next. Because the cat’s attention was changingconsiderably throughout the recording session, there was some trial-to-trial covariation in the neuron firing rate. We therefore chose to useinstead the second alternative i.e., to estimate the instantaneous dis-charge probability directly from the spike train (Abeles, 1982; Palm et al.,1988). These instantaneous discharge probability estimates were used tocalculate the expected correlation on a single-trial basis. Single-trialexpectations were then summed to obtain the expected correlationcaused by firing rate covariation. The assumptions made to estimate theinstantaneous firing rate are then critical for the interpretation of results.Because we analyzed the spike train correlation during a period withoutany sudden change in the stimulus presentation, we expect the instanta-neous firing rate to vary smoothly during this time. Therefore, we used asimple Gaussian kernel estimator to assess the instantaneous dischargeprobability. The spike train was simply filtered by convolution with aGaussian function (SD, 10 msec; Fig. 1 F; Silverman, 1986). This meansthat only synchrony that is more precise than the 10 msec SD of theGaussian kernel used to estimate the instantaneous discharge probabilitywill test as significant using our analysis.
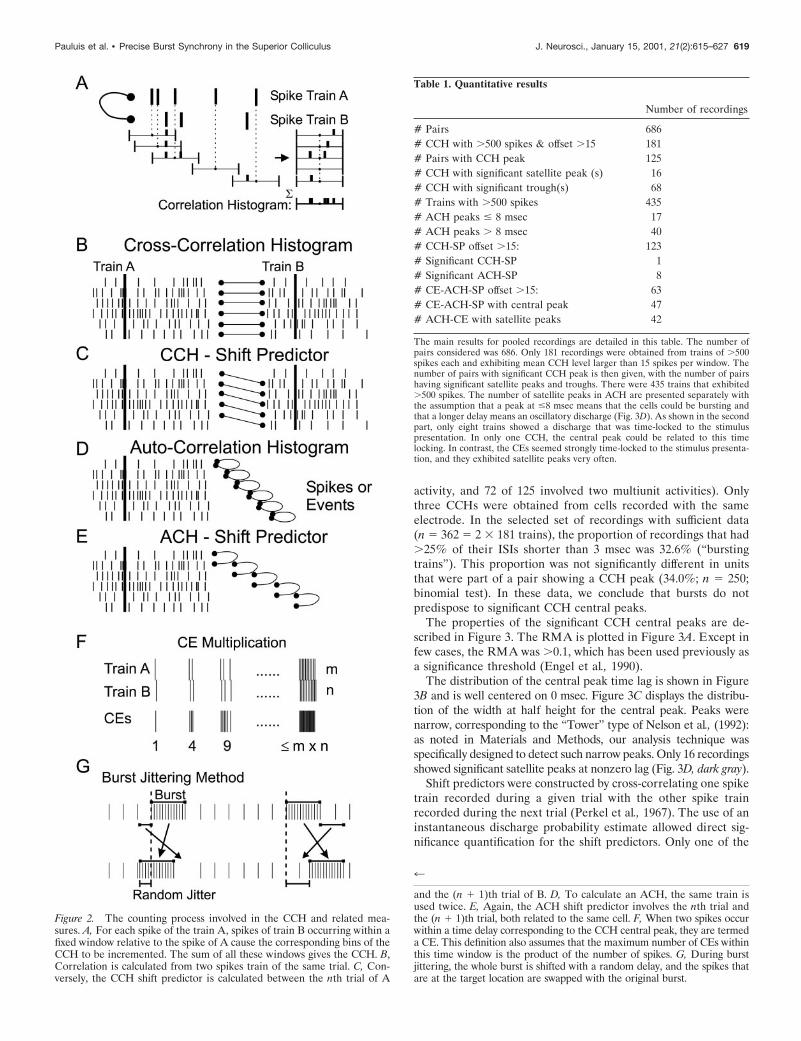
CCH. Synchronization was quantified by means of the CCH (Fig. 2 A).The CCH counts, when divided by the number of trigger spikes, repre-sent the conditional probability of the occurrence of a response spike ifa trigger spike occurred. When two spike trains are independent, theCCH is flat, i.e., the conditional probability remains constant whateverthe time interval. If the CCH is not flat, there is some functionalcorrelation between the cells (Perkel et al., 1967; Moore et al., 1970).
All analysis was performed on the CCH smoothed by means of a 5msec window average, advanced in 1 msec time steps. Significance wasassessed assuming that the spike distribution in each window followed aPoisson distribution, using a threshold of p , 0.001. The probability thatthe number of coincidences c will be at least as many as the numberobserved, C, given that E are expected, was calculated as Equation 1:
P~c $ C! 5 1 2 Oi50
i5C21e2EEi
i! (1)
This method for significance quantification is independent of the binwidth, but still requires that the event probability is very small andindependent from the occurrence of the other events (Poisson process).
To measure stimulus-locked changes in excess synchronization, wecalculated the time-resolved CCH. An example is displayed in Figure 5C.The abscissa X corresponds to time relative to the stimulus movementonset, whereas the ordinate Y is the lag time relative to each spike of cell1. It is exactly as if the CCH was plotted in a gray scale as a function ofperistimulus time, like in a raw JPSTH (Palm et al., 1988; Aertsen et al.,1989). For each trial, we calculated the time-resolved cross-correlationand its expectation function, using the instantaneous frequency estimateof the two cells. The time-resolved cross-correlation and its expectedvalue were then summed across trials and compared (1 msec bins). TheCCH could be extracted from the time-resolved CCH by summing alongthe stimulus-related time axis X (see Fig. 5G).
The peak width was determined from the CCH by the intersections ofthe observed and expected count curves. The high level of confidenceused ( p , 0.001) ensured that the detected peaks were visible to thenaked eye and obviated the need for an additional criterion on the peakamplitude. The peak with the highest amplitude was called the “centralpeak” and was characterized by the relative modulation amplitude(RMA), calculated as the ratio of the peak amplitude to the expectedvalue: (max 2 expect)/expect (Engel et al., 1990, 1991a,b,c; Brecht et al.,1999) and by the peak width at half-height. The RMA is related to thefactor k, which is the ratio of maximum peak count to the expected count:max/expect (Sears and Stagg, 1976; Kirkwood and Sears, 1982). Hence,
RMA 5 (max 2 expect)/expect 5 k 2 1, which has also been describedas the relative peak height (Cope et al., 1987).
If there was more than one central peak within 670 msec, the othersignificant peaks were called “satellite peaks” and were taken as evidencefor an oscillatory correlation.
CCH shif t predictors. When spikes are produced in response to astimulus, the stimulus could synchronize the recorded cells. Thisstimulus-related synchronization was quantified by the shift predictor(Perkel et al., 1967; Palm et al., 1988). These predictors are computedsimilarly as for the CCH (Fig. 2 B), except that the spike trains correlatedare related to two successive trials (Fig. 2C). If the stimulus direction wasvaried (30 recordings), the shift predictor was computed with the nexttrial in the same direction. The expectation of the shift predictor was alsocalculated using the instantaneous discharge probability estimates, asexplained for the time-resolved cross-correlation. Significant peaks in theshift predictor then indicated precise time locking of spikes to thestimulus presentation.
ACH. Autocorrelation histograms were also computed for each spiketrain (Fig. 2 D), and the presence of satellite peaks was used to quantifywhether the discharge was oscillatory (see Fig. 5F,H ). Statistical require-ments for significance were similar to the CCH.
An ACH shift predictor (Fig. 2 E) was computed between the nth and(n 1 1)th trials. The expectation was calculated on a single-trial basis,using the instantaneous discharge probability, as explained for the time-resolved cross-correlation. Significant peaks in the ACH shift predictorindicated that spikes were time-locked to the stimulus.
CEs. If a central peak was observed in the CCH, we used the numberof significant bins of the smoothed histogram to define the time delayduring which a spike occurring in both cells was called a CE. In theexample of Figure 5, four windows centered at 21, 0, 1, and 2 msec weresignificant, so that each time a spike of the second cell occurred between1.5 msec before and 2.5 msec after a spike of cell one, it was consideredas a CE. The CE definition was thus directly related to the CCH peak, incontrast to previous definitions that have used an arbitrary allowedinterval (Grun, 1996; Riehle et al., 1997). The moment of each CE wasdetermined as the mean time between the two spikes: (t1 2 t2)/2 (Pauluisand Baker, 2000). This definition allowed two CEs to occur by chanceexactly at the same moment. If the two cells fired together in a shortburst, the number of CEs would be the product of the number of spikesin each burst (Fig. 2 F). This multiplicative property mirrors the way inwhich bursts of spikes contribute to the CCH.
Once the CEs had been defined, it was possible to calculate their ACHand ACH shift predictor, which we will denote CE–ACH and CE–ACHshift predictor. This allowed the characterization of oscillations andstimulus time locking in the CEs.
Burst perturbation analyses. Many cells recorded in this study showedburst discharges. Spike bursts invalidated the Poisson assumption wemade for statistical testing (Eq. 1). To asses the influence of this firingpattern on our results, we designed a control analysis. The bursts in spiketrains, defined as a succession of ISIs ,3 msec, were located. Thisarbitrary value is convenient and comes from the definition of thechattering cells in the visual cortex (Gray and McCormick, 1996). Thespikes of each burst were deleted and then added back to the spike trainafter a random shift (uniform distribution), which was the same for thespikes belonging to the same burst (Fig. 2G). Any spikes that originallyfell within the new location of the burst were moved to the part of thespike train from which the burst had been removed. This techniqueensured that the number of short ISIs was constant or even increased,whereas the precise timing of the spike bursts was destroyed. All mea-sures were then recalculated to assess the impact of burst precision onour statistical procedures.
The same jittering method was applied to CE trains to test whether thetime precision of CE bursts was relevant to our findings.
RESULTSCorrelation histogramsOf 686 pairs of spike trains tested for cross-correlation, 181 wereselected as having a reasonable amount of data (.500 spikes ineach train and mean cross-correlation count per bin .15). Asignificant central peak in the CCH was found in 125 recordings(Table 1). Fourteen of one hundred twenty-five (14 of 125) CCHsinvolved the activity of two single units, and the others were frommultiunit activities (39 of 125 involved a single and a multiunit
618 J. Neurosci., January 15, 2001, 21(2):615–627 Pauluis et al. • Precise Burst Synchrony in the Superior Colliculus
activity, and 72 of 125 involved two multiunit activities). Onlythree CCHs were obtained from cells recorded with the sameelectrode. In the selected set of recordings with sufficient data(n 5 362 5 2 3 181 trains), the proportion of recordings that had.25% of their ISIs shorter than 3 msec was 32.6% (“burstingtrains”). This proportion was not significantly different in unitsthat were part of a pair showing a CCH peak (34.0%; n 5 250;binomial test). In these data, we conclude that bursts do notpredispose to significant CCH central peaks.
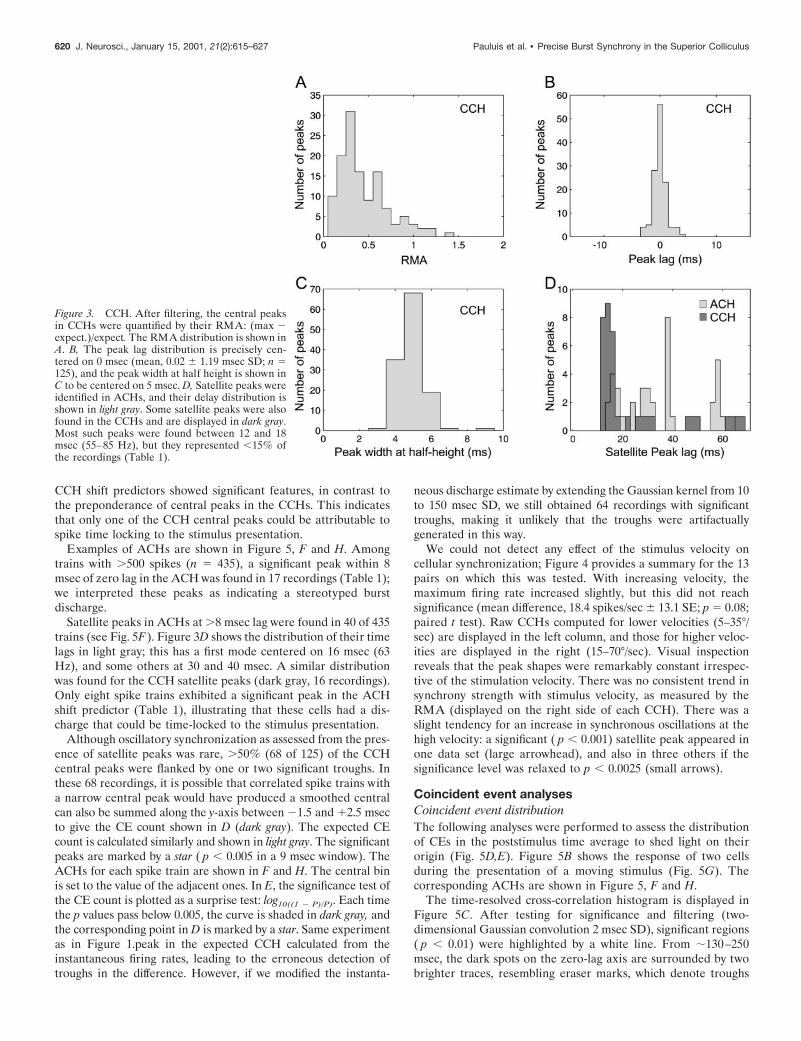
The properties of the significant CCH central peaks are de-scribed in Figure 3. The RMA is plotted in Figure 3A. Except infew cases, the RMA was .0.1, which has been used previously asa significance threshold (Engel et al., 1990).
The distribution of the central peak time lag is shown in Figure3B and is well centered on 0 msec. Figure 3C displays the distribu-tion of the width at half height for the central peak. Peaks werenarrow, corresponding to the “Tower” type of Nelson et al., (1992):as noted in Materials and Methods, our analysis technique wasspecifically designed to detect such narrow peaks. Only 16 recordingsshowed significant satellite peaks at nonzero lag (Fig. 3D, dark gray).
Shift predictors were constructed by cross-correlating one spiketrain recorded during a given trial with the other spike trainrecorded during the next trial (Perkel et al., 1967). The use of aninstantaneous discharge probability estimate allowed direct sig-nificance quantification for the shift predictors. Only one of the
Figure 2. The counting process involved in the CCH and related mea-sures. A, For each spike of the train A, spikes of train B occurring within afixed window relative to the spike of A cause the corresponding bins of theCCH to be incremented. The sum of all these windows gives the CCH. B,Correlation is calculated from two spikes train of the same trial. C, Con-versely, the CCH shift predictor is calculated between the nth trial of A
4
and the (n 1 1)th trial of B. D, To calculate an ACH, the same train isused twice. E, Again, the ACH shift predictor involves the nth trial andthe (n 1 1)th trial, both related to the same cell. F, When two spikes occurwithin a time delay corresponding to the CCH central peak, they are termeda CE. This definition also assumes that the maximum number of CEs withinthis time window is the product of the number of spikes. G, During burstjittering, the whole burst is shifted with a random delay, and the spikes thatare at the target location are swapped with the original burst.
Table 1. Quantitative results
Number of recordings
# Pairs 686# CCH with .500 spikes & offset .15 181# Pairs with CCH peak 125# CCH with significant satellite peak (s) 16# CCH with significant trough(s) 68# Trains with .500 spikes 435# ACH peaks # 8 msec 17# ACH peaks . 8 msec 40# CCH-SP offset .15: 123# Significant CCH-SP 1# Significant ACH-SP 8# CE-ACH-SP offset .15: 63# CE-ACH-SP with central peak 47# ACH-CE with satellite peaks 42
The main results for pooled recordings are detailed in this table. The number ofpairs considered was 686. Only 181 recordings were obtained from trains of .500spikes each and exhibiting mean CCH level larger than 15 spikes per window. Thenumber of pairs with significant CCH peak is then given, with the number of pairshaving significant satellite peaks and troughs. There were 435 trains that exhibited.500 spikes. The number of satellite peaks in ACH are presented separately withthe assumption that a peak at #8 msec means that the cells could be bursting andthat a longer delay means an oscillatory discharge (Fig. 3D). As shown in the secondpart, only eight trains showed a discharge that was time-locked to the stimuluspresentation. In only one CCH, the central peak could be related to this timelocking. In contrast, the CEs seemed strongly time-locked to the stimulus presenta-tion, and they exhibited satellite peaks very often.
Pauluis et al. • Precise Burst Synchrony in the Superior Colliculus J. Neurosci., January 15, 2001, 21(2):615–627 619
CCH shift predictors showed significant features, in contrast tothe preponderance of central peaks in the CCHs. This indicatesthat only one of the CCH central peaks could be attributable tospike time locking to the stimulus presentation.
Examples of ACHs are shown in Figure 5, F and H. Amongtrains with .500 spikes (n 5 435), a significant peak within 8msec of zero lag in the ACH was found in 17 recordings (Table 1);we interpreted these peaks as indicating a stereotyped burstdischarge.
Satellite peaks in ACHs at .8 msec lag were found in 40 of 435trains (see Fig. 5F). Figure 3D shows the distribution of their timelags in light gray; this has a first mode centered on 16 msec (63Hz), and some others at 30 and 40 msec. A similar distributionwas found for the CCH satellite peaks (dark gray, 16 recordings).Only eight spike trains exhibited a significant peak in the ACHshift predictor (Table 1), illustrating that these cells had a dis-charge that could be time-locked to the stimulus presentation.
Although oscillatory synchronization as assessed from the pres-ence of satellite peaks was rare, .50% (68 of 125) of the CCHcentral peaks were flanked by one or two significant troughs. Inthese 68 recordings, it is possible that correlated spike trains witha narrow central peak would have produced a smoothed centralcan also be summed along the y-axis between 21.5 and 12.5 msecto give the CE count shown in D (dark gray). The expected CEcount is calculated similarly and shown in light gray. The significantpeaks are marked by a star ( p , 0.005 in a 9 msec window). TheACHs for each spike train are shown in F and H. The central binis set to the value of the adjacent ones. In E, the significance test ofthe CE count is plotted as a surprise test: log10((1 2 P)/P). Each timethe p values pass below 0.005, the curve is shaded in dark gray, andthe corresponding point in D is marked by a star. Same experimentas in Figure 1.peak in the expected CCH calculated from theinstantaneous firing rates, leading to the erroneous detection oftroughs in the difference. However, if we modified the instanta-
neous discharge estimate by extending the Gaussian kernel from 10to 150 msec SD, we still obtained 64 recordings with significanttroughs, making it unlikely that the troughs were artifactuallygenerated in this way.
We could not detect any effect of the stimulus velocity oncellular synchronization; Figure 4 provides a summary for the 13pairs on which this was tested. With increasing velocity, themaximum firing rate increased slightly, but this did not reachsignificance (mean difference, 18.4 spikes/sec 6 13.1 SE; p 5 0.08;paired t test). Raw CCHs computed for lower velocities (5–35°/sec) are displayed in the left column, and those for higher veloc-ities are displayed in the right (15–70°/sec). Visual inspectionreveals that the peak shapes were remarkably constant irrespec-tive of the stimulation velocity. There was no consistent trend insynchrony strength with stimulus velocity, as measured by theRMA (displayed on the right side of each CCH). There was aslight tendency for an increase in synchronous oscillations at thehigh velocity: a significant ( p , 0.001) satellite peak appeared inone data set (large arrowhead), and also in three others if thesignificance level was relaxed to p , 0.0025 (small arrows).
Coincident event analysesCoincident event distributionThe following analyses were performed to assess the distributionof CEs in the poststimulus time average to shed light on theirorigin (Fig. 5D,E). Figure 5B shows the response of two cellsduring the presentation of a moving stimulus (Fig. 5G). Thecorresponding ACHs are shown in Figure 5, F and H.
The time-resolved cross-correlation histogram is displayed inFigure 5C. After testing for significance and filtering (two-dimensional Gaussian convolution 2 msec SD), significant regions( p , 0.01) were highlighted by a white line. From ;130–250msec, the dark spots on the zero-lag axis are surrounded by twobrighter traces, resembling eraser marks, which denote troughs
Figure 3. CCH. After filtering, the central peaksin CCHs were quantified by their RMA: (max 2expect.)/expect. The RMA distribution is shown inA. B, The peak lag distribution is precisely cen-tered on 0 msec (mean, 0.02 6 1.19 msec SD; n 5125), and the peak width at half height is shown inC to be centered on 5 msec. D, Satellite peaks wereidentified in ACHs, and their delay distribution isshown in light gray. Some satellite peaks were alsofound in the CCHs and are displayed in dark gray.Most such peaks were found between 12 and 18msec (55–85 Hz), but they represented ,15% ofthe recordings (Table 1).
620 J. Neurosci., January 15, 2001, 21(2):615–627 Pauluis et al. • Precise Burst Synchrony in the Superior Colliculus
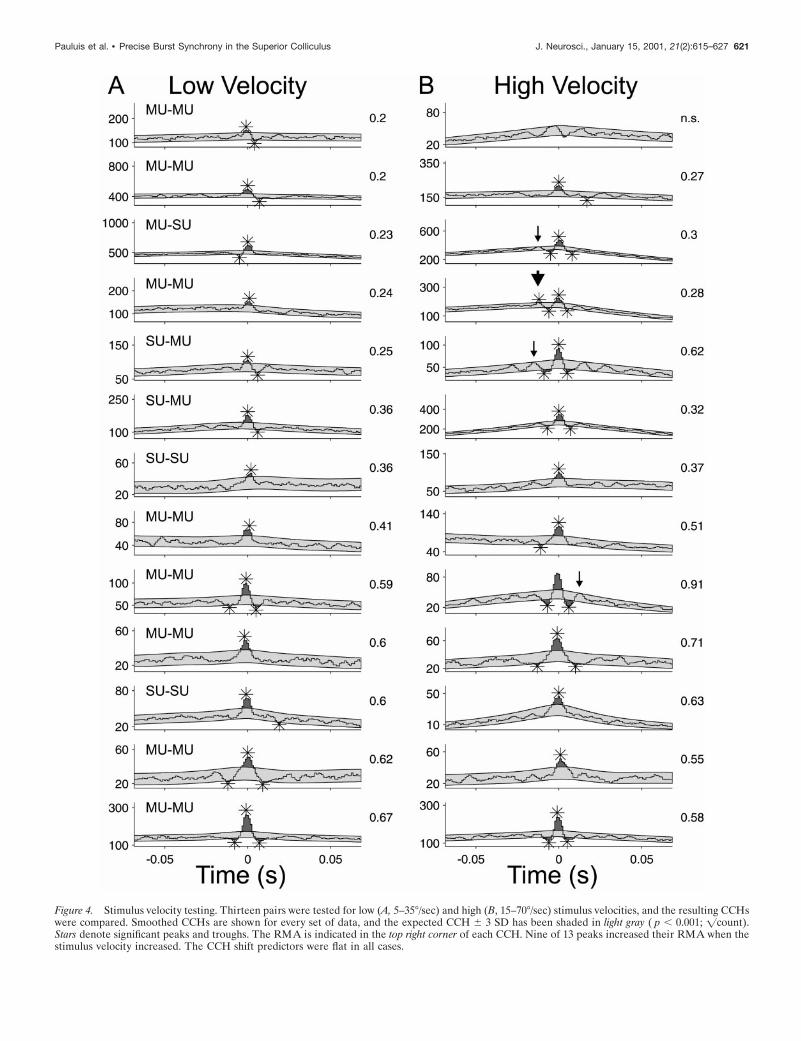
Figure 4. Stimulus velocity testing. Thirteen pairs were tested for low (A, 5–35°/sec) and high (B, 15–70°/sec) stimulus velocities, and the resulting CCHswere compared. Smoothed CCHs are shown for every set of data, and the expected CCH 6 3 SD has been shaded in light gray ( p , 0.001; =count).Stars denote significant peaks and troughs. The RMA is indicated in the top right corner of each CCH. Nine of 13 peaks increased their RMA when thestimulus velocity increased. The CCH shift predictors were flat in all cases.
Pauluis et al. • Precise Burst Synchrony in the Superior Colliculus J. Neurosci., January 15, 2001, 21(2):615–627 621
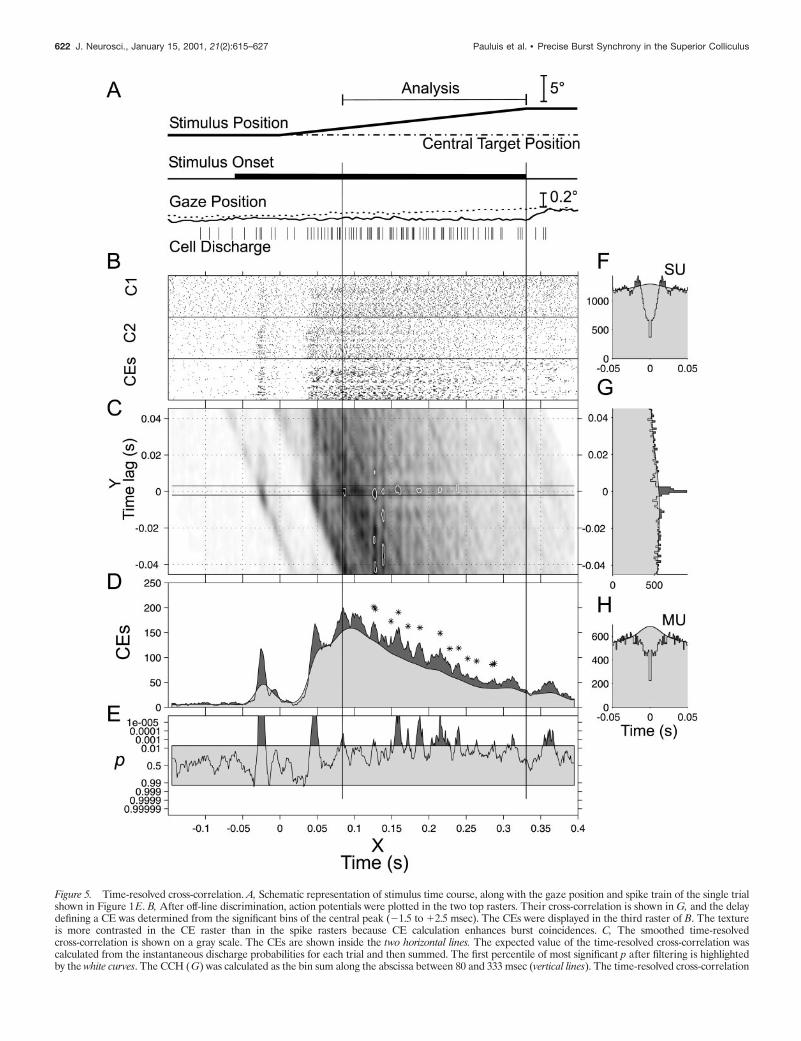
Figure 5. Time-resolved cross-correlation. A, Schematic representation of stimulus time course, along with the gaze position and spike train of the single trialshown in Figure 1E. B, After off-line discrimination, action potentials were plotted in the two top rasters. Their cross-correlation is shown in G, and the delaydefining a CE was determined from the significant bins of the central peak (21.5 to 12.5 msec). The CEs were displayed in the third raster of B. The textureis more contrasted in the CE raster than in the spike rasters because CE calculation enhances burst coincidences. C, The smoothed time-resolvedcross-correlation is shown on a gray scale. The CEs are shown inside the two horizontal lines. The expected value of the time-resolved cross-correlation wascalculated from the instantaneous discharge probabilities for each trial and then summed. The first percentile of most significant p after filtering is highlightedby the white curves. The CCH (G) was calculated as the bin sum along the abscissa between 80 and 333 msec (vertical lines). The time-resolved cross-correlation
622 J. Neurosci., January 15, 2001, 21(2):615–627 Pauluis et al. • Precise Burst Synchrony in the Superior Colliculus
either side of the central peak in the CCH. The raw CCH isplotted in Figure 5G and corresponds to the sum of the time-resolved cross-correlation along the stimulus time axis, between80 and 333 msec. The CCH expectation (calculated from theinstantaneous firing rates) is superimposed in light gray. Thenumber of adjacent significant windows in the CCH is shown bythe two horizontal lines on both sides of 0 msec lag in thetime-resolved cross-correlation histogram (bins, 21 to 12 msec;Fig. 5C). All the points between these two lines were called CEs.Such events were summed and plotted in Figure 5B as rasters(CEs) and in Figure 5D as a PSTH (dark gray curve), on which issuperposed the corresponding expectation (light gray). The coin-cidence count (Fig. 5D) was then tested to quantify CE excesssignificance, assuming that the CEs follow a nonstationary Pois-son distribution with rate equal to the sum of the single-trial CEexpectations (compare Eq. 1). Significant excess in a particulartime window during the period of 80–333 msec is indicated onFigure 5D by a star. Significance is plotted as a surprise measure(cf. Aertsen et al., 1989) in Figure 5E.
Such an analysis shows when CEs were present in excess duringthe poststimulus time. To address the issue of the distribution ofCEs across time and to show how the CE density could vary fromtrial to trial, we computed the CE–ACH shift predictor for thecomplete set of trials in each of the 125 experiments with asignificant CCH peak. Peaks in the CE–ACH shift predictor
indicate that the CEs tended to occur at similar times after thestimulus from one trial to the next. Forty-seven recordings exhib-ited peaks in both the CCH and the CE–ACH shift predictor,suggesting that CEs could be stimulus locked in this way. This isin contrast to the fact that only one CCH shift predictor and onlyeight ACH shift predictors were peaked (Table 1).
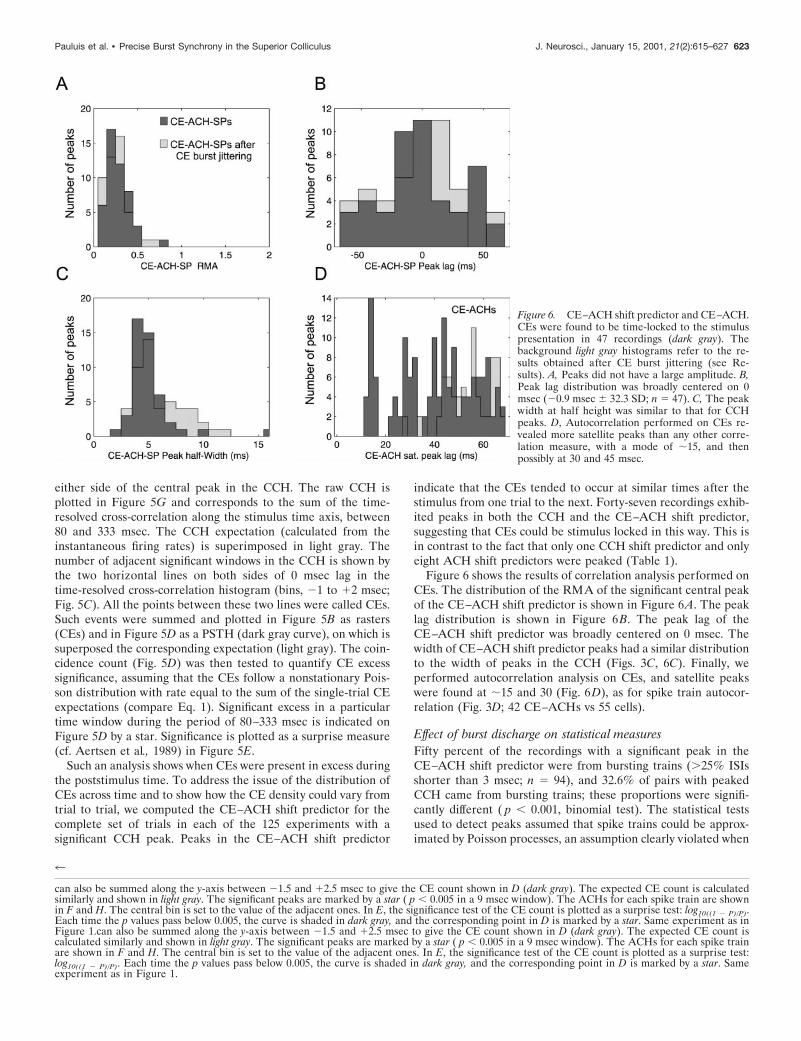
Figure 6 shows the results of correlation analysis performed onCEs. The distribution of the RMA of the significant central peakof the CE–ACH shift predictor is shown in Figure 6A. The peaklag distribution is shown in Figure 6B. The peak lag of theCE–ACH shift predictor was broadly centered on 0 msec. Thewidth of CE–ACH shift predictor peaks had a similar distributionto the width of peaks in the CCH (Figs. 3C, 6C). Finally, weperformed autocorrelation analysis on CEs, and satellite peakswere found at ;15 and 30 (Fig. 6D), as for spike train autocor-relation (Fig. 3D; 42 CE–ACHs vs 55 cells).
Effect of burst discharge on statistical measuresFifty percent of the recordings with a significant peak in theCE–ACH shift predictor were from bursting trains (.25% ISIsshorter than 3 msec; n 5 94), and 32.6% of pairs with peakedCCH came from bursting trains; these proportions were signifi-cantly different ( p , 0.001, binomial test). The statistical testsused to detect peaks assumed that spike trains could be approx-imated by Poisson processes, an assumption clearly violated when
4
can also be summed along the y-axis between 21.5 and 12.5 msec to give the CE count shown in D (dark gray). The expected CE count is calculatedsimilarly and shown in light gray. The significant peaks are marked by a star ( p , 0.005 in a 9 msec window). The ACHs for each spike train are shownin F and H. The central bin is set to the value of the adjacent ones. In E, the significance test of the CE count is plotted as a surprise test: log10((1 2 P)/P).Each time the p values pass below 0.005, the curve is shaded in dark gray, and the corresponding point in D is marked by a star. Same experiment as inFigure 1.can also be summed along the y-axis between 21.5 and 12.5 msec to give the CE count shown in D (dark gray). The expected CE count iscalculated similarly and shown in light gray. The significant peaks are marked by a star ( p , 0.005 in a 9 msec window). The ACHs for each spike trainare shown in F and H. The central bin is set to the value of the adjacent ones. In E, the significance test of the CE count is plotted as a surprise test:log10((1 2 P)/P). Each time the p values pass below 0.005, the curve is shaded in dark gray, and the corresponding point in D is marked by a star. Sameexperiment as in Figure 1.
Figure 6. CE–ACH shift predictor and CE–ACH.CEs were found to be time-locked to the stimuluspresentation in 47 recordings (dark gray). Thebackground light gray histograms refer to the re-sults obtained after CE burst jittering (see Re-sults). A, Peaks did not have a large amplitude. B,Peak lag distribution was broadly centered on 0msec (20.9 msec 6 32.3 SD; n 5 47). C, The peakwidth at half height was similar to that for CCHpeaks. D, Autocorrelation performed on CEs re-vealed more satellite peaks than any other corre-lation measure, with a mode of ;15, and thenpossibly at 30 and 45 msec.
Pauluis et al. • Precise Burst Synchrony in the Superior Colliculus J. Neurosci., January 15, 2001, 21(2):615–627 623
bursts are present. We therefore tested whether the results ob-tained above could have been influenced by the presence of burstsin the spike trains. Rather than attempt to generate a moreappropriate theoretical statistical model for the spike trains, weused the empirical burst-jittering analysis described in Materialsand Methods (Fig. 2G), in which whole bursts were randomlyswapped with other nearby segments of the original spike train.This was designed to destroy precise burst synchronization be-tween the two simultaneously recorded neurons, while maintain-ing the bursting nature of the individual spike trains.
When jittering was applied to bursts in the original spike trains,of 125 CCHs with significant peaks, only 62 remained significantafter the application of a random jitter with maximum size 610
msec. This number remained fairly constant for larger jitters upto 650 msec. We can therefore be confident that at least half ofthe CCH central peaks were caused by burst synchronization andwere not an artifact of cell bursting.
A contrasting result was obtained when burst jittering wasapplied to the CE trains. Of 63 recordings suitable for CE anal-ysis, between 46 and 51 showed significant CE—ACH shift pre-dictors for jitters from 61 to 650 msec; this compared with 47significantly peaked CE–ACH shift predictors in the originaldata. The number of significant peaks was thus essentially unaf-fected by the burst jittering. Measurements made from thesepeaks, for the largest jitter tested (650 msec), are shown in lightgray in Figure 6. Surprisingly, the distribution of most of themeasures was also qualitatively unaffected, even by this consider-able jittering of the bursts. Peaks were no larger (Fig. 6A), similarlytimed (Fig. 6B), and of comparable width (Fig. 6C). The onlydifference was that the jittered CE trains did not show an oscilla-tory peak in the ACH (Fig. 6D; no isolated peak at 16 msec lag).
We conclude that the presence of peaks in many of the CCHsresults from genuine short-term synchronization of bursting spiketrains and is not solely a statistical artifact caused by the presenceof bursts. However, the apparent precise time locking of CEs tothe stimulus, as indicated by the presence of features in theCE–ACH shift predictors, is by contrast likely to result from anartifactual influence of CE bursts on the statistical calculations.
Single-trial analysisAn important advantage of our method based on the instanta-neous discharge rate is that it allows inspection and significanceassessment of single trials, provided that enough spikes werecollected. This is accordingly examined below.
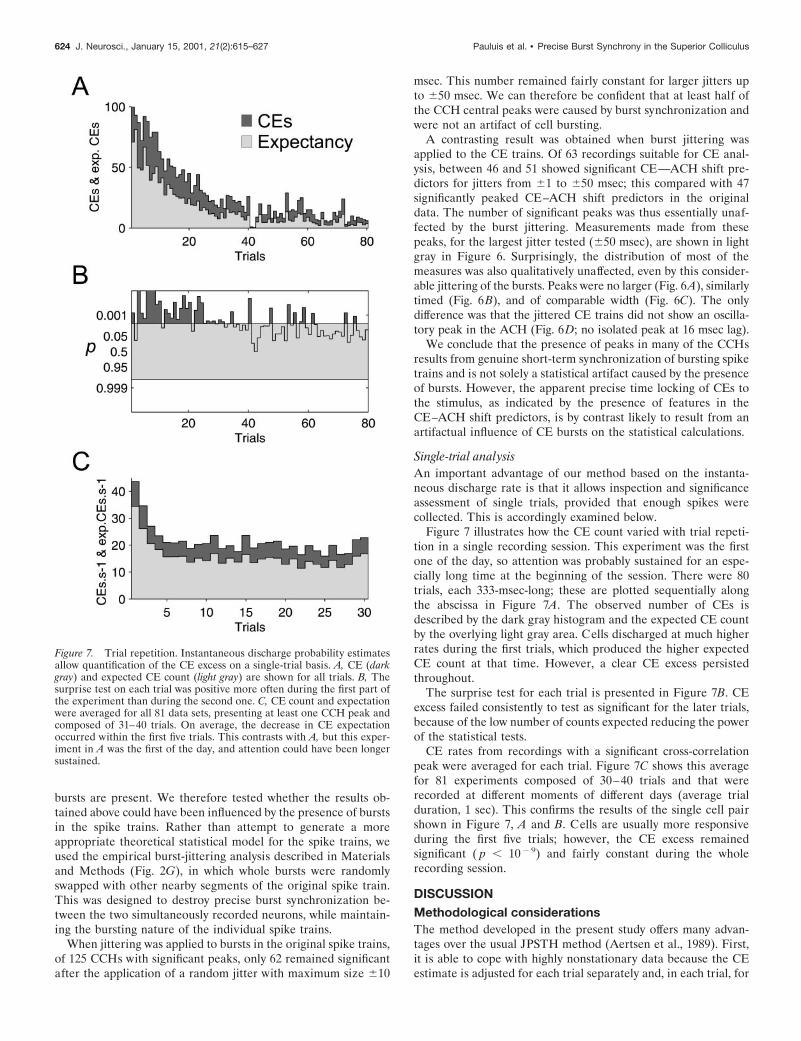
Figure 7 illustrates how the CE count varied with trial repeti-tion in a single recording session. This experiment was the firstone of the day, so attention was probably sustained for an espe-cially long time at the beginning of the session. There were 80trials, each 333-msec-long; these are plotted sequentially alongthe abscissa in Figure 7A. The observed number of CEs isdescribed by the dark gray histogram and the expected CE countby the overlying light gray area. Cells discharged at much higherrates during the first trials, which produced the higher expectedCE count at that time. However, a clear CE excess persistedthroughout.
The surprise test for each trial is presented in Figure 7B. CEexcess failed consistently to test as significant for the later trials,because of the low number of counts expected reducing the powerof the statistical tests.
CE rates from recordings with a significant cross-correlationpeak were averaged for each trial. Figure 7C shows this averagefor 81 experiments composed of 30–40 trials and that wererecorded at different moments of different days (average trialduration, 1 sec). This confirms the results of the single cell pairshown in Figure 7, A and B. Cells are usually more responsiveduring the first five trials; however, the CE excess remainedsignificant ( p , 102 9) and fairly constant during the wholerecording session.
DISCUSSIONMethodological considerationsThe method developed in the present study offers many advan-tages over the usual JPSTH method (Aertsen et al., 1989). First,it is able to cope with highly nonstationary data because the CEestimate is adjusted for each trial separately and, in each trial, for
Figure 7. Trial repetition. Instantaneous discharge probability estimatesallow quantification of the CE excess on a single-trial basis. A, CE (darkgray) and expected CE count (light gray) are shown for all trials. B, Thesurprise test on each trial was positive more often during the first part ofthe experiment than during the second one. C, CE count and expectationwere averaged for all 81 data sets, presenting at least one CCH peak andcomposed of 31–40 trials. On average, the decrease in CE expectationoccurred within the first five trials. This contrasts with A, but this exper-iment in A was the first of the day, and attention could have been longersustained.
624 J. Neurosci., January 15, 2001, 21(2):615–627 Pauluis et al. • Precise Burst Synchrony in the Superior Colliculus
every moment with the requested precision (here 10 msec SD).Nearly every trial can be included securely in the rasters, even ifcell firing rates are much lower or much higher than in the othertrials. Such trials with covariant and unexplained discharge vari-ations are pernicious when included in JPSTH because they arenot described adequately by the PSTH and consequently bias theCE expectation. This leads to the assessment of large cross-correlation peaks caused by patterns of covariant activities(Brody, 1999a,b; Pauluis and Baker, 2000). A way to control forthis problem is to show that the expected CCH offset fits well theobserved CCH offset for the each period of the experiment. Thissimple check is not performed in some CE analysis (Riehle et al.,1997). The method used here is based on the calculation of theCE expectation for each single trial and compensates very simplyfor this kind of problem. Second, it offers a quantitative approachto test significance of any correlation measure, including the shiftpredictors. Their significance was quantified previously by recur-sion or by comparison with the shuffled predictor. Third, whenthis method is coupled to traditional perturbation methods likeburst jittering, it enables direct quantification of the spike or burstprecision. Fourth, it allows trial by trial CE significance calcula-tion, an ability that permitted the quantification of the effect oftrial repetition and of which more sophisticated experimentalparadigms could make use.
Precise burst synchrony in the superior colliculusOne of the main results of the present study is the direct evidencefor precise burst synchrony in the visual response of collicularcells of the awake cat. Lisman (1997) suggested that in someregions, single spikes are just noise. It has been shown recently byLivingstone et al. (1996) that in the primary visual cortex of alertmonkeys only bursts provided a clear indicator of the presence ofa visual stimulus. Burst discharges in the SC have been reportedpreviously by Mandl (1993) in the pretrigeminal cat during mov-ing visual stimulus presentation, and 25% of the responding cellsexhibited a 60–80 Hz burst frequency. We were able to show thatsuch cells synchronize their short spike bursts with a precision offew milliseconds.
In contrast, Brecht et al. (1996, 1998, 1999) reported previouslythat synchrony takes place in the SC of the anesthetized cat witha wide time course: the mean width at half height was 51 msec forcorticotectal interactions, and similar values were found for in-tracollicular interactions (.20 msec). However, Brecht et al.(1999) assessed CCH peaks by fitting a generalized Gabor func-tion to the CCHs (Konig, 1994). Broad peaks could possibly bebetter identified than thin ones because curve fitting favors iden-tification of large trends over narrow peak characterization,whereas our method assumes that wide peaks are caused by firingrate covariation.
In awake cats, the CCH peak width at half height was onaverage 5 msec (Fig. 3C). In awake animals in comparison to theanesthetized state, the temporal relationship changes from acoactivation pattern to precise synchrony, which is very interest-ing because the SC can be regarded as an attentive filter (Gold-berg and Wurtz, 1972; Robinson and Kertzman, 1995; Kustov andRobinson, 1996) and because attentive tasks enhance synchronyin other brain areas (Murthy and Fetz, 1992, 1996a,b; Roelfsemaet al., 1997).
Spike time locking has been described previously in response toa sudden change in the stimulus presentation (Mainen and Se-jnowski, 1995). It has also been reported that most cells in the catLGN and visual cortex could synchronize strongly on a 60 Hz
monitor refresh rate (Wollman and Palmer, 1995). Such evidentcauses of fast stimulus locking are unlikely during our stimuluspresentation because we used an oscilloscope with a positionincrement rate of 100 Hz, and SC oscillations we found had afrequency of 65 Hz. We also took care to start analysis after thefast transient because of the onset of the stimulus displacementand excluded the stimulus offset because such events would havelocked the cell discharge. Although the synchrony between spikesis precise, they are not precisely time locked to the stimuluspresentation.
It was shown recently that fixational eye movements can causelarge response modification in the firing rate of visual cells in theprimary cortex and lateral geniculate nucleus (Gur et al., 1997).Although the SC cells we recorded responded strongly to thevisual stimulus, we cannot exclude that small eye movements wereresponsible for part of the synchronization.
Oscillations in the superior colliculusWe found some evidence of oscillation in the SC at 65 Hz.According to previous simulation work (Traub et al., 1996; Pau-luis et al., 1999), the oscillation frequency would depend on thephysiology of local inhibitory interneurons. Lopez-Barneo andLlinas (1988) estimated the membrane time constant of neuronslocated in the stratum griseum intermediale of the SC in guineapig to be 4.13 6 1.3 (SE) msec (n 5 27), a value two times smallerthan the shortest cortical membrane time constant (Koch et al.,1996). This could explain the fast oscillations in the SC. Theinvolvement of inhibitory interneurons in network oscillations isalso supported by the recent evidence showing inhibitory burstingcells in the intermediate and deep layers of the rabbit superiorcolliculus, which may form mutual inhibitory connections (Zhuand Lo, 2000).
There were 40 oscillatory ACHs, but many of the CCHs ex-hibited no satellite peaks (109 of 125). This would be interpreted,if the recordings had been made in the visual cortex, as a lock-instate (Eckhorn, 1994) that probably corresponds to suboptimalstimuli. Because of constraints on the duration of recordings inawake animals, and especially in cats, our stimulus parametershad to be rapidly adjusted to be close to, but probably did notreach, the optimal. Moreover, attention and motivation decreasedduring the experiment leading to a decrease in the response to thestimulus. Whereas attention modulates the visual response in theSC (Goldberg and Wurtz, 1972), it has been shown that stimula-tion of the mesencephalic reticular formation increases visuallyevoked oscillations in anesthetized and awake cat (Metherate etal., 1992; Munk et al., 1996; Steriade et al., 1996).
Another explanation for our failure to detect oscillations couldbe that although some occurred, their frequency was too irregularto be significant in the CCH. This is supported by the fact that theSC receives both visual afferents from the retina, which have beenshown to oscillate at 61–114 Hz in response to visual targets(Neuenswander and Singer, 1996; Castelo-Branco et al., 1998),and from the visual cortex in which moving stimuli induce typi-cally 30–60 Hz oscillations (Gray et al., 1989; Singer and Gray,1995; Castelo-Branco et al., 1998). Castelo-Branco et al. (1998)suggested that in response to moving stimuli, subcortical (LGN)and cortical oscillations dissociated, but if cortical mechanismsdominated, LGN responses could become phase locked to thecortical oscillations. Some SC cells could receive predominatelyretinal input, showing 65 Hz oscillations, whereas some othersmight receive both kinds equally. However, only a few satellitepeaks were found to be compatible with the known cortical
Pauluis et al. • Precise Burst Synchrony in the Superior Colliculus J. Neurosci., January 15, 2001, 21(2):615–627 625
oscillation frequency, suggesting that in the main SC oscillationsarise from a cortex-independent mechanism (Fig. 3D). Our re-sults are in marked contrast to the low-frequency oscillationspreviously reported in the anesthetized cat (5–20 Hz; Brecht etal., 1999; Chabli et al., 2000).
Trough-peak-trough patternIn our data, symmetrical troughs flanked many of the CCH peaks.Our previous modeling work has shown the conditions needed toreproduce this pattern (Pauluis, 2000). On the basis of this, wesuggest that there are three different states of network dynamicsthat produce qualitatively different cross-correlation features.First, an isolated central peak is evidence for a common input,which may be either excitatory or inhibitory, and arise from eitherlocal or extrinsic circuits (Perkel et al., 1967). Where the centralpeak is flanked by troughs, this may reflect a common inhibitoryfeedback acting with delay on the recorded cells, possibly fromthe local interneurons (Pauluis, 2000). This is however one stepshort of full oscillatory network activity. Finally, there may begenuine oscillations, leading to satellite peaks in the cross-correlation. Modeling work has shown the importance of mutualinhibition between interneurons to produce oscillatory activity(Wilson and Cowan, 1972; van Vreeswijk et al., 1994; Whittingtonet al., 1995; Traub et al., 1996; Wang and Buzsaki, 1996; White etal., 1998; Pauluis et al., 1999). The network state leading to acentral peak flanked by troughs could therefore be an intermedi-ate stage on the way to sustained oscillations. Our results shouldencourage experimenters to test the significance of satellitetroughs to differentiate this pattern from an isolated central peakor a genuine oscillatory CCH.
REFERENCESAbeles M (1982) Quantification, smoothing, and confidence limits for
single-units’ histograms. J Neurosci Methods 5:317–325.Abeles M (1991) Corticonics: neural circuits of the cerebral cortex.
Cambridge, UK: Cambridge UP.Aertsen AMHJ, Gerstein GL, Habib MK, Palm G (1989) Dynamics of
neuronal firing correlation: modulation of “effective connectivity.”J Neurophysiol 61:900–917.
Brecht M, Singer W, Engel AK (1996) Temporal coding in the catsuperior colliculus. Soc Neurosci Abstr 22:1446.
Brecht M, Singer W, Engel AK (1998) Correlation analysis of cortico-tectal interactions in the cat visual system. J Neurophysiol79:2394–2407.
Brecht M, Singer W, Engel AK (1999) Patterns of synchronization in thesuperior colliculus of anesthetized cats. J Neurosci 19:3567–3579.
Brody CD (1999a) Disambiguating different covariation types. NeuralComput 11:1527–1535.
Brody CD (1999b) Correlations without synchrony. Neural Comput11:1537–1551.
Castelo-Branco M, Neuenschwander S, Singer W (1998) Synchroniza-tion of visual responses between cortex, lateral geniculate nucleus, andretina in the anesthetized cat. J Neurosci 18:6395–6410.
Chabli A, Guitton D, Fortin S, Molotchnikoff S (2000) Cross-correlatedand oscillatory visual responses of superficial-layer and tecto-reticularneurones in the cat superior colliculus. Exp Brain Res 131:44–56.
Cope TC, Fetz EE, Matsumura M (1987) Cross-correlation assessmentof synaptic strength of single Ia fibre connections with triceps suraemotoneurones in cats. J Physiol (Lond) 390:161–188.
DeBusk BC, DeBruyn EJ, Snider RK, Kabara JF, Bonds AB (1997)Stimulus-dependent modulation of spike burst length in cat striatecortical cells. J Neurophysiol 78:199–213.
Eckhorn R (1994) Oscillatory and non-oscillatory synchronizations inthe visual cortex and their possible roles in associations of visualfeatures. Prog Brain Res 102:405–426.
Eggermont JJ (1990) The correlative brain. Theory and experiment inneural interaction. Berlin: Springer.
Engel AK, Konig P, Gray CM, Singer W (1990) Stimulus-dependentneuronal oscillation in cat visual cortex: Inter-columnar interaction asdetermined by cross-correlation analysis. Eur J Neurosci 2:588–606.
Engel AK, Konig P, Kreiter AK, Singer W (1991a) Interhemisphericsynchronization of oscillatory neuronal responses in cat visual cortex.Science 252:1177–1179.
Engel AK, Konig P, Singer W (1991b) Direct physiological evidence forscene segmentation by temporal coding. Proc Natl Acad USA88:9136–9140.
Engel AK, Kreiter AK, Konig P, Singer W (1991c) Synchronization ofoscillatory neuronal responses between striate and extrastriate visualcortical areas of the cat. Proc Natl Acad Sci USA 88:6048–6052.
Goldberg ME, Wurtz RH (1972) Activity of superior colliculus in be-having monkey. II. Effect of attention on neuronal responses. J Neuro-physiol 15:560–574.
Grantyn R (1988) Gaze control through superior colliculus: structureand function. In: Neuroanatomy of the oculomotor system (Buttner-Ennever, ed), pp 273–333. New York: Elsevier.
Gray CM, Konig P, Engel AK, Singer W (1989) Oscillatory responses incat visual cortex exhibit inter-columnar synchronization which reflectsglobal stimulus properties. Nature 338:334–337.
Gray CM, McCormick DA (1996) Chattering cells: superficial pyramidalneurons contributing to the generation of synchronous oscillations inthe visual cortex. Science 274:109–113.
Griffith JS, Horn G (1963) Functional coupling between cells in thevisual cortex of the unrestrained cat. Nature 199:893–895.
Grun S (1996) Unitary joint-events in multiple-neuron spiking activity.Thun, Frankfurt am Main: Harri Deutsch.
Gur M, Beylin A, Snodderly DM (1997) Response variability of neuronsin primary visual cortex (V1) of alert monkeys. J Neurosci17:2914–2920.
Hopfield JJ (1995) Pattern recognition computation using action poten-tial timing for stimulus representation. Nature 376:33–36.
Hopfield JJ (1996) Transforming neural computations and representingtime. Proc Natl Acad Sci USA 93:15440–15444.
Kirkwood PA, Sears TA (1982) The effects of single afferent impulseson the probability of firing of external intercostal motoneurones in thecat. J Physiol (Lond) 322:315–336.
Koch C, Rapp M, Segev I (1996) A brief history of time (constants).Cereb Cortex 6:93–101.
Konig P (1994) A method for the quantification of synchrony and oscil-latory properties of neuronal activity. J Neurosci Methods 54:31–37.
Kustov AA, Robinson DL (1996) Shared neural control of attentionalshifts and eye movements. Nature 384:74–77.
Laurent G (1996) Dynamical representation of odors by oscillating andevolving neural assemblies. Trends Neurosci 19:489–496.
Lisman JE (1997) Burst as a unit of neural information: making unreli-able synapses reliable. Trends Neurosci 20:38–43.
Livingstone MS, Freeman DC, Hubel DH (1996) Visual responses in V1of freely viewing monkeys. Cold Spring Harb Symp Quant Biol LXI27–37.
Lopez-Barneo J, Llinas R (1988) Electrophysiology of mammalian tectalneurons in vitro. I. Transient ionic conductances. J Neurophysiol60:853–868.
Mainen ZF, Sejnowski TJ (1995) Reliability of spike timing in neocor-tical neurons. Science 268:1503–1506.
Mandl G (1993) Coding for stimulus by temporal patterning of spikedischarges in visual cells of cat superior colliculus. Vision Res11:1451–1475.
Metherate R, Cox CL, Ashe AH (1992) Cellular bases of neocorticalactivation: modulation of neural oscillations by the nucleus basalis andendogenous acetylcholine. J Neurosci 12:4701–4711.
Moore GP, Segundo JP, Perkel DH, Leviathan H (1970) Statistical signsof synaptic interaction in neurons. Biophys J 10:876–900.
Munk MHJ, Roelfsema PR, Konig P, Engel AK, Singer W (1996) Roleof reticular activation in the modulation of intracortical synchroniza-tion. Science 272:271–274.
Murthy VN, Fetz EE (1992) Coherent 25- to 35-Hz oscillations in thesensorimotor cortex of awake behaving monkey. Proc Natl Acad SciUSA 89:5670–5674.
Murthy VN, Fetz EE (1996a) Oscillatory activity in sensorimotor cortexof awake monkeys: synchronization of local field potentials and relationto behavior. J Neurophysiol 76:3949–3967.
Murthy VN, Fetz EE (1996b) Synchronization of neurons during localfield potential oscillations in sensorimotor cortex of awake monkeys.J Neurophysiol 76:3968–3982.
Nelson JI, Salin PA, Munk MHJ, Arzi M, Bullier J (1992) Spatial andtemporal coherence in cortico-cortical connections: a cross-correlationstudy in areas 17 and 18 in the cat. Vis Neurosci 9:21–37.
Neuenschwander S, Singer W (1996) Long-range synchronization of os-cillatory light responses in the cat retina and lateral geniculate nucleus.Nature 379:728–733.
Nowak LG, Munk MHJ, Nelson JI, James AC, Bullier J (1995) Struc-tural basis of cortical synchronization. I. Three types of interhemi-spheric coupling. J Neurophysiol 74:2379–2400.
Palm G, Aertsen AMHJ, Gerstein GL (1988) On the significance ofcorrelations among neuronal spike trains. Biol Cybern 59:1–11.
Parodi O, Combe P, Ducom JC (1996) Temporal coding in vision: cod-ing by the spike times arrival leads to oscillations in the case of movingtarget. Biol Cybern 74:497–509.
626 J. Neurosci., January 15, 2001, 21(2):615–627 Pauluis et al. • Precise Burst Synchrony in the Superior Colliculus
Pauluis Q (2000) Statistical signs of common inhibitory feedback withdelay. Neural Comput 12:2513–2518.
Pauluis Q, Baker SN (2000) An accurate measure of the instantaneousdischarge probability with application to unitary joint-event analysis.Neural Comput 12:687–709.
Pauluis Q, Baker SN, Olivier E (1999) Emergent oscillations in a real-istic network: the role of inhibition and the effect of the spatiotemporaldistribution of the input. J Comput Neurosci 6:27–48.
Perkel DH, Gerstein GL, Moore GP (1967) Neuronal spike trains andstochastic point process. II. Simultaneous spike trains. J Biophys7:419–440.
Riehle A, Grun S, Diesmann M, Aertsen A (1997) Spike synchroniza-tion and rate modulation differentially involved in motor cortical func-tion. Science 278:1950–1953.
Robinson DL, Kertzman CJ (1995) Covert orienting of attention inmacaques. III. Contributions of the superior colliculus. J Neurophysiol74:713–721.
Roelfsema PR, Singer W (1998) Detecting connectedness. Cereb Cortex8:385–396.
Roelfsema PR, Engel AK, Konig P, Singer W (1997) Visuomotor inte-gration is associated with zero time-lag synchronization among corticalareas. Nature 385:157–161.
Roucoux A, Crommelinck M (1976) Eye movement evoked by superiorcolliculus stimulus in the alert cat. Brain Res 106:349–363.
Sears TA, Stagg D (1976) Short-term synchronizaton of intercostal mo-toneurone activity. J Physiol (Lond) 174:295–315.
Silverman BW (1986) Density estimation for statistics and data analysis.London: Chapman & Hall.
Singer W (1995) Development and plasticity of cortical processing archi-tectures. Science 270:758–764.
Singer W, Gray CM (1995) Visual feature integration and the temporalcorrelation hypothesis. Annu Rev Neurosci 18:555–586.
Sparks DL (1986) Translation of sensory signals into commands forcontrol of saccadic eye movements: role of the primate superior col-liculus. Physiol Rev 66:118–171.
Steriade M, Amzica F, Contreras D (1996) Synchronization of fast(30–40 Hz) spontaneous cortical rhythms during brain activation.J Neurosci 16:392–417.
Traub RD, Whittington MA, Colling SB, Buzsaki G, Jefferys JGR (1996)Analysis of gamma rhythms in the rat hippocampus in vitro and in vivo.J Physiol (Lond) 493:471–484.
Usrey WM, Reid RC (1999) Synchronous activity in the visual system.Annu Rev Physiol 61:435–456.
Vaadia E, Haalman I, Abeles M, Bergaman H, Prut Y, Slovin H, AertsenA (1995) Dynamics of neuronal interactions in monkey cortex in re-lation to behavioural events. Nature 373:515–518.
van Vreeswijk C, Abbott LF, Ermentrout GB (1994) When inhibitionnot excitation synchronizes neural firing. J Comput Neurosci1:313–321.
Wang XJ, Buzsaki G (1996) Gamma oscillation by synaptic inhibition ina hippocampal interneuron network model. J Neurosci 15:6402–6413.
White JA, Chow CC, Ritt J, Soto-Trevino C, Kopell N (1998) Synchro-nization and oscillatory dynamics in heterogeneous, mutually inhibitedneurons. J Comput Neurosci 5:5–16.
Whittington MA, Traub RD, Jeffereys JGR (1995) Synchronized oscil-lations in interneuron networks driven by metabotropic glutamatereceptor activation. Nature 373:612–615.
Whittington MA, Traub RD, Faulkner HJ, Stanford IM, Jefferys JGR(1997) Recurrent excitatory postsynaptic potentials induced by syn-chronized fast cortical oscillations. Proc Natl Acad Sci USA94:12198–12203.
Wilson HR, Cowan JD (1972) Excitatory and inhibitory interactions inlocalized populations of model neurons. Biophys J 12:1–24.
Wollman DE, Palmer LA (1995) Phase locking of neuronal responses tothe vertical refresh of computer display monitor in cat lateral geniculatenucleus and striate cortex. J Neurosci Methods 60:107–113.
Wurtz RH, Goldberg ME, Robinson DL (1982) Brain mechanisms ofvisual attention. Sci Am 246:124–135.
Zhu JJ, Lo F-S (2000) Recurrent inhibitory circuitry in the deep layersof the rabbit superior colliculus. J Physiol (Lond) 523:731–740.
Pauluis et al. • Precise Burst Synchrony in the Superior Colliculus J. Neurosci., January 15, 2001, 21(2):615–627 627
Related Documents