Precipitation reconstruction for Northwestern Tunisia from tree rings R. Touchan a, , D.M. Meko a , A. Aloui b a Laboratory of Tree-Ring Research, The University of Arizona, P.O. Box 210058, Tucson, AZ 85721-0058, USA b Institute of Sylvo-pastoral of Tabarak, Tabarka, 8110 Tabarka, Tunisia article info Article history: Received 15 May 2007 Received in revised form 13 May 2008 Accepted 13 May 2008 Available online 24 June 2008 Keywords: Dendrochronology Drought Reconstruction abstract An October–June precipitation reconstruction was developed from a Pinus halepensis regional tree-ring chronology from four sites in northwestern Tunisia for the period of 1771–2002. The reconstruction is based on a reliable and replicable statistical relationship between climate and tree-ring growth and shows climate variability on both interannual and interdecadal time scales. Thresholds (12th and 88th percentiles) based on the empirical cumulative distribution of observed precipitation for the 1902–2002 calibration period were used to delineate dry years and wet years of the long-term reconstruction. The longest reconstructed drought by this classification in the 232-year reconstruction is 2 years, which occurred in the 19th century. Analysis of 500 mb height data for the period 1948–2002 suggests reconstructed extreme dry and wet events can provide information on past atmospheric circulation anomalies over a broad region including the Mediterra- nean, Europe and eastern Asia. & 2008 Elsevier Ltd. All rights reserved. 1. Introduction Managing water resources requires identifying and characterizing extreme dry and wet periods. High-quality continuous short precipitation time series can be used for this purpose. However, only a limited number of extreme dry and wet events can be identified in a short record, and the information related to probable duration, distribution, and intensity of future extreme events may not be reliable (Meko et al., 1991). Knowledge of local climate variability on time scales of decades to centuries is needed to understand and prepare for dry and wet conditions in the region. Dendrochronology is a valuable tool for the study of climate variability beyond the short period normally covered by instrumental data (Fritts, 1976). Time series of tree-ring growth measurements spanning several centuries serve as proxy records of past climatic conditions (Cook et al., 1999). Such records provide us with knowledge of the past frequency and severity of climatic anomalies, such as drought and wet periods, and can be used to help anticipate the future probability of such events. Few dendrochronological studies have been performed in North Africa, with the exception of Morocco. Morocco has a rich history of dendroclimatic research going back nearly 40 years (e.g. Berger et al., 1979; Chbouki et al., 1995; De Corte, 1979; Esper et al., 2007; Glueck and Stockton, 2001; Helleputte, 1976; Meko, 1985; Munaut, 1978; Stockton, 1985; Till, 1987; Till and Guiot, 1990). Dendrochronological studies have also been carried out in Algeria (Messaoudene, 1989; Messaoudene and Tessier, 1997; Safar et al., 1992) and Tunisia (Aloui, 1982; Aloui and Serre-Bachet, 1987; Serre, 1969; Tessier et al., 1994), but previous studies in Tunisia and Algeria were restricted to analysis of the relationship between annual tree-growth and climate. This paper describes the development of regional tree-ring chronology of Pinus halepensis from northwestern Contents lists available at ScienceDirect journal homepage: www.elsevier.com/locate/jaridenv Journal of Arid Environments ARTICLE IN PRESS 0140-1963/$ - see front matter & 2008 Elsevier Ltd. All rights reserved. doi:10.1016/j.jaridenv.2008.05.010 Corresponding author. Tel.: +1520 621 2992; fax: +1520 6218229. E-mail address: [email protected] (R. Touchan). Journal of Arid Environments 72 (2008) 1887–1896

Welcome message from author
This document is posted to help you gain knowledge. Please leave a comment to let me know what you think about it! Share it to your friends and learn new things together.
Transcript
ARTICLE IN PRESS
Contents lists available at ScienceDirect
Journal of Arid Environments
Journal of Arid Environments 72 (2008) 1887– 1896
0140-19
doi:10.1
� Cor
E-m
journal homepage: www.elsevier.com/locate/jaridenv
Precipitation reconstruction for Northwestern Tunisia from tree rings
R. Touchan a,�, D.M. Meko a, A. Aloui b
a Laboratory of Tree-Ring Research, The University of Arizona, P.O. Box 210058, Tucson, AZ 85721-0058, USAb Institute of Sylvo-pastoral of Tabarak, Tabarka, 8110 Tabarka, Tunisia
a r t i c l e i n f o
Article history:
Received 15 May 2007
Received in revised form
13 May 2008
Accepted 13 May 2008Available online 24 June 2008
Keywords:
Dendrochronology
Drought
Reconstruction
63/$ - see front matter & 2008 Elsevier Ltd.
016/j.jaridenv.2008.05.010
responding author. Tel.: +1520 621 2992; fa
ail address: [email protected] (R.
a b s t r a c t
An October–June precipitation reconstruction was developed from a Pinus halepensis
regional tree-ring chronology from four sites in northwestern Tunisia for the period of
1771–2002. The reconstruction is based on a reliable and replicable statistical relationship
between climate and tree-ring growth and shows climate variability on both interannual
and interdecadal time scales. Thresholds (12th and 88th percentiles) based on the
empirical cumulative distribution of observed precipitation for the 1902–2002 calibration
period were used to delineate dry years and wet years of the long-term reconstruction.
The longest reconstructed drought by this classification in the 232-year reconstruction is
2 years, which occurred in the 19th century. Analysis of 500 mb height data for the period
1948–2002 suggests reconstructed extreme dry and wet events can provide information
on past atmospheric circulation anomalies over a broad region including the Mediterra-
nean, Europe and eastern Asia.
& 2008 Elsevier Ltd. All rights reserved.
1. Introduction
Managing water resources requires identifying and characterizing extreme dry and wet periods. High-qualitycontinuous short precipitation time series can be used for this purpose. However, only a limited number of extreme dry andwet events can be identified in a short record, and the information related to probable duration, distribution, and intensityof future extreme events may not be reliable (Meko et al., 1991). Knowledge of local climate variability on time scales ofdecades to centuries is needed to understand and prepare for dry and wet conditions in the region.
Dendrochronology is a valuable tool for the study of climate variability beyond the short period normally covered byinstrumental data (Fritts, 1976). Time series of tree-ring growth measurements spanning several centuries serve as proxyrecords of past climatic conditions (Cook et al., 1999). Such records provide us with knowledge of the past frequency andseverity of climatic anomalies, such as drought and wet periods, and can be used to help anticipate the future probability ofsuch events.
Few dendrochronological studies have been performed in North Africa, with the exception of Morocco. Morocco has arich history of dendroclimatic research going back nearly 40 years (e.g. Berger et al., 1979; Chbouki et al., 1995; De Corte,1979; Esper et al., 2007; Glueck and Stockton, 2001; Helleputte, 1976; Meko, 1985; Munaut, 1978; Stockton, 1985; Till, 1987;Till and Guiot, 1990). Dendrochronological studies have also been carried out in Algeria (Messaoudene, 1989; Messaoudeneand Tessier, 1997; Safar et al., 1992) and Tunisia (Aloui, 1982; Aloui and Serre-Bachet, 1987; Serre, 1969; Tessier et al., 1994),but previous studies in Tunisia and Algeria were restricted to analysis of the relationship between annual tree-growth andclimate. This paper describes the development of regional tree-ring chronology of Pinus halepensis from northwestern
All rights reserved.
x: +1520 6218229.
Touchan).
ARTICLE IN PRESS
R. Touchan et al. / Journal of Arid Environments 72 (2008) 1887–18961888
Tunisia, and application of the chronology to develop the first dendroclimatic reconstruction of precipitation in Tunisia.This reconstruction is analyzed to test the hypothesis that the drought history as given by the short instrumental record forTunisia adequately represents the conditions of the past few centuries. A 230-year reconstruction for northwestern Tunisiais analyzed for time series features of variability relevant to water resources planning. The association of unusually dryyears and wet years in Tunisia with large-scale atmospheric circulation anomalies is summarized by analysis of 500 mbheight data.
2. Methods and materials
2.1. Study area
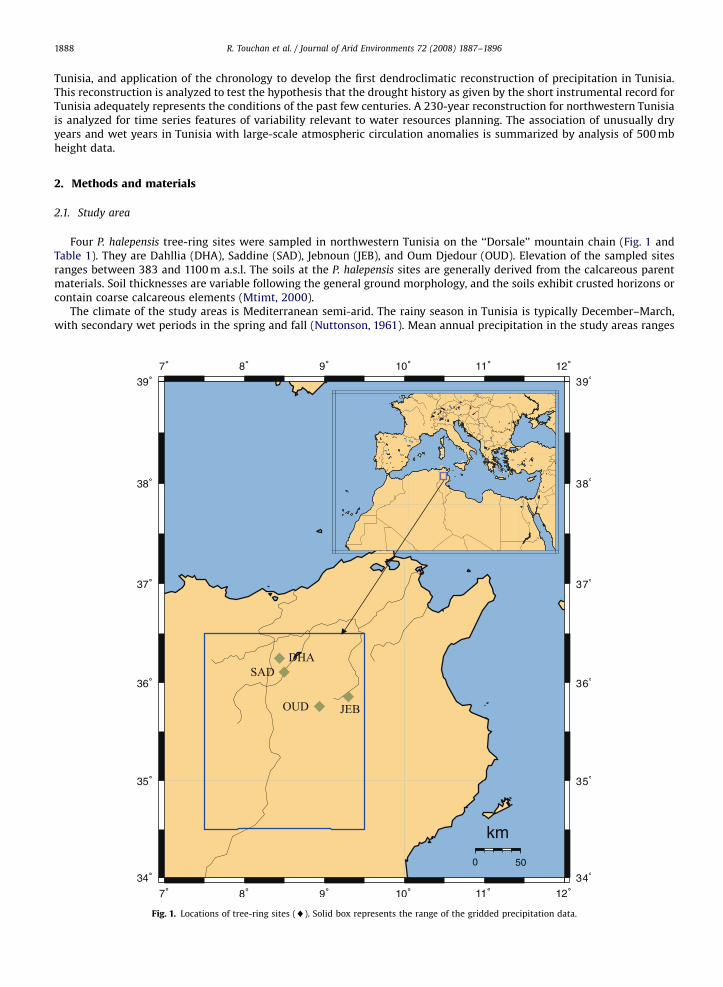
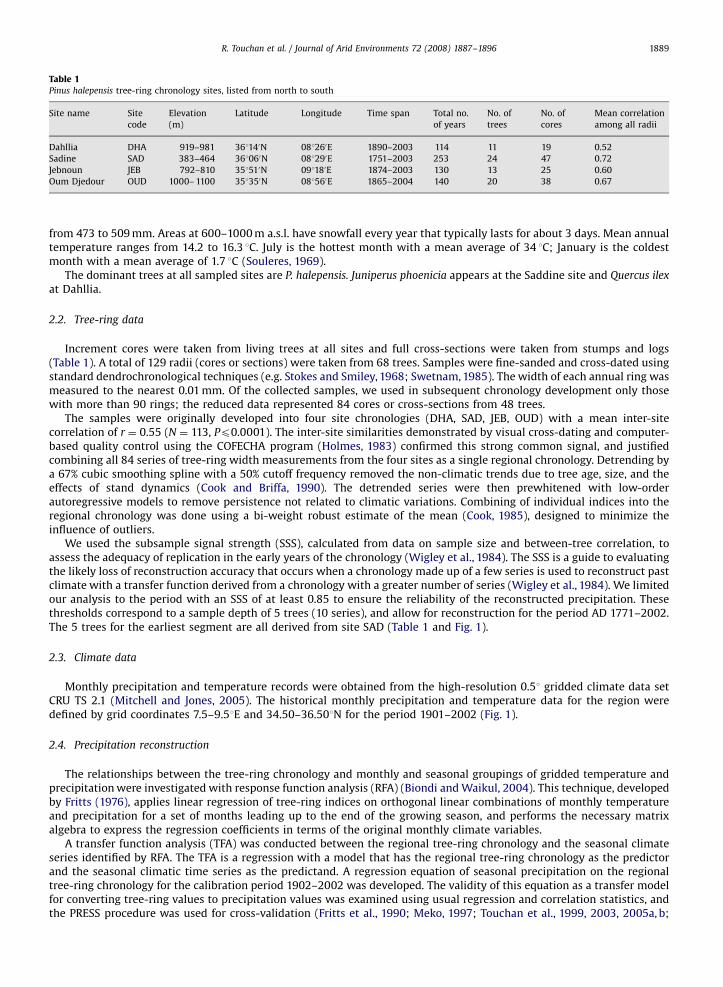
Four P. halepensis tree-ring sites were sampled in northwestern Tunisia on the ‘‘Dorsale’’ mountain chain (Fig. 1 andTable 1). They are Dahllia (DHA), Saddine (SAD), Jebnoun (JEB), and Oum Djedour (OUD). Elevation of the sampled sitesranges between 383 and 1100 m a.s.l. The soils at the P. halepensis sites are generally derived from the calcareous parentmaterials. Soil thicknesses are variable following the general ground morphology, and the soils exhibit crusted horizons orcontain coarse calcareous elements (Mtimt, 2000).
The climate of the study areas is Mediterranean semi-arid. The rainy season in Tunisia is typically December–March,with secondary wet periods in the spring and fall (Nuttonson, 1961). Mean annual precipitation in the study areas ranges
Fig. 1. Locations of tree-ring sites (~). Solid box represents the range of the gridded precipitation data.
ARTICLE IN PRESS
Table 1Pinus halepensis tree-ring chronology sites, listed from north to south
Site name Site
code
Elevation
(m)
Latitude Longitude Time span Total no.
of years
No. of
trees
No. of
cores
Mean correlation
among all radii
Dahllia DHA 919–981 361140N 081260E 1890–2003 114 11 19 0.52
Sadine SAD 383–464 361060N 081290E 1751–2003 253 24 47 0.72
Jebnoun JEB 792–810 351510N 091180E 1874–2003 130 13 25 0.60
Oum Djedour OUD 1000– 1100 351350N 081560E 1865–2004 140 20 38 0.67
R. Touchan et al. / Journal of Arid Environments 72 (2008) 1887–1896 1889
from 473 to 509 mm. Areas at 600–1000 m a.s.l. have snowfall every year that typically lasts for about 3 days. Mean annualtemperature ranges from 14.2 to 16.3 1C. July is the hottest month with a mean average of 34 1C; January is the coldestmonth with a mean average of 1.7 1C (Souleres, 1969).
The dominant trees at all sampled sites are P. halepensis. Juniperus phoenicia appears at the Saddine site and Quercus ilex
at Dahllia.
2.2. Tree-ring data
Increment cores were taken from living trees at all sites and full cross-sections were taken from stumps and logs(Table 1). A total of 129 radii (cores or sections) were taken from 68 trees. Samples were fine-sanded and cross-dated usingstandard dendrochronological techniques (e.g. Stokes and Smiley, 1968; Swetnam, 1985). The width of each annual ring wasmeasured to the nearest 0.01 mm. Of the collected samples, we used in subsequent chronology development only thosewith more than 90 rings; the reduced data represented 84 cores or cross-sections from 48 trees.
The samples were originally developed into four site chronologies (DHA, SAD, JEB, OUD) with a mean inter-sitecorrelation of r ¼ 0.55 (N ¼ 113, Pp0.0001). The inter-site similarities demonstrated by visual cross-dating and computer-based quality control using the COFECHA program (Holmes, 1983) confirmed this strong common signal, and justifiedcombining all 84 series of tree-ring width measurements from the four sites as a single regional chronology. Detrending bya 67% cubic smoothing spline with a 50% cutoff frequency removed the non-climatic trends due to tree age, size, and theeffects of stand dynamics (Cook and Briffa, 1990). The detrended series were then prewhitened with low-orderautoregressive models to remove persistence not related to climatic variations. Combining of individual indices into theregional chronology was done using a bi-weight robust estimate of the mean (Cook, 1985), designed to minimize theinfluence of outliers.
We used the subsample signal strength (SSS), calculated from data on sample size and between-tree correlation, toassess the adequacy of replication in the early years of the chronology (Wigley et al., 1984). The SSS is a guide to evaluatingthe likely loss of reconstruction accuracy that occurs when a chronology made up of a few series is used to reconstruct pastclimate with a transfer function derived from a chronology with a greater number of series (Wigley et al., 1984). We limitedour analysis to the period with an SSS of at least 0.85 to ensure the reliability of the reconstructed precipitation. Thesethresholds correspond to a sample depth of 5 trees (10 series), and allow for reconstruction for the period AD 1771–2002.The 5 trees for the earliest segment are all derived from site SAD (Table 1 and Fig. 1).
2.3. Climate data
Monthly precipitation and temperature records were obtained from the high-resolution 0.51 gridded climate data setCRU TS 2.1 (Mitchell and Jones, 2005). The historical monthly precipitation and temperature data for the region weredefined by grid coordinates 7.5–9.51E and 34.50–36.501N for the period 1901–2002 (Fig. 1).
2.4. Precipitation reconstruction
The relationships between the tree-ring chronology and monthly and seasonal groupings of gridded temperature andprecipitation were investigated with response function analysis (RFA) (Biondi and Waikul, 2004). This technique, developedby Fritts (1976), applies linear regression of tree-ring indices on orthogonal linear combinations of monthly temperatureand precipitation for a set of months leading up to the end of the growing season, and performs the necessary matrixalgebra to express the regression coefficients in terms of the original monthly climate variables.
A transfer function analysis (TFA) was conducted between the regional tree-ring chronology and the seasonal climateseries identified by RFA. The TFA is a regression with a model that has the regional tree-ring chronology as the predictorand the seasonal climatic time series as the predictand. A regression equation of seasonal precipitation on the regionaltree-ring chronology for the calibration period 1902–2002 was developed. The validity of this equation as a transfer modelfor converting tree-ring values to precipitation values was examined using usual regression and correlation statistics, andthe PRESS procedure was used for cross-validation (Fritts et al., 1990; Meko, 1997; Touchan et al., 1999, 2003, 2005a, b;
ARTICLE IN PRESS
R. Touchan et al. / Journal of Arid Environments 72 (2008) 1887–18961890
Weisberg, 1985). A split-sample procedure (Meko and Graybill, 1995; Snee, 1997; Touchan et al., 2003, 2005a, b) thatdivides the full period (AD 1902–2002) into two subsets (1902–1951 and 1952–2002) was also used to verify modelstability. The reduction of error statistic (RE) was calculated to test for skill beyond that possible simply by using thecalibration period mean of observed precipitation as the reconstruction. An RE value of greater than 0 is considered positiveskill (Fritts, 1976).
The calculated transfer function was then applied to the regional chronology to produce the time series of reconstructedOctober–June total precipitation for as many years as the adequately replicated portion of the chronology allowed.
2.5. Identification of dry and wet years
Dry years and wet years were defined as reconstructed precipitation below or above specified thresholds correspondingto percentiles of the observed precipitation for the base period 1902–2002. Percentiles for the thresholds were selectedbased on exploratory scatterplots of reconstructed precipitation on observed precipitation, with consideration that thethreshold must be severe enough to represent a practically significant departure from average conditions. We adoptedsevere enough percentile thresholds such that dry and wet years are unusual events. Of course, ‘‘practical’’ significance willdepend on the user (e.g., farmer, water resources planner) of the data. Multi-year droughts and wet periods were defined byruns of consecutive years below or above the thresholds. A 5-year moving average of reconstructed precipitation was usedas an alternative summary measure of drought severity. An 80% confidence interval for the annual reconstruction wascomputed as 7xE, where E is the cross-validation root-mean-square error of the reconstruction and x is the 0.1 probabilitypoint of the cumulative distribution function of the standard normal distribution. For the 5-year moving-averagereconstruction, the confidence interval was computed as 7xE divided by the square root of 5.
2.6. Large-scale circulation analysis
The atmospheric circulation anomalies responsible for occurrence of unusually wet or dry years were evaluated with500-mb geopotential height anomalies from the National Centers for Environmental Prediction-National Center forAtmospheric Research Reanalysis Project (Kalnay et al., 1996). Composites of October–June geopotential height anomaliesfrom 1968 to 1996 mean were created for the highest and lowest deciles of observed spring precipitation (n ¼ 6) in theperiod 1948–2007.
3. Results
3.1. Chronology
A regional chronology was built using material from four sites in Tunisia (Table 1 and Fig. 1). The tree-ring series of thefour sites show strong similarities in terms of visual cross-dating of the wood and computer-based quality control.Individual trees share a high degree of common variation and so are prime candidates as recorders of climate.
The combined chronology is 254 years long (AD 1751–2004), which is slightly longer than the period deemed suitablefor climate interpretation (AD 1771–2002). Average series intercorrelation among all radii is 0.5. The mean sample segmentlength (MSSL) of the regional chronology is 127 years and is adequate to investigate multi-decadal climate variability(Cook and Peters, 1997).
3.2. Precipitation reconstruction
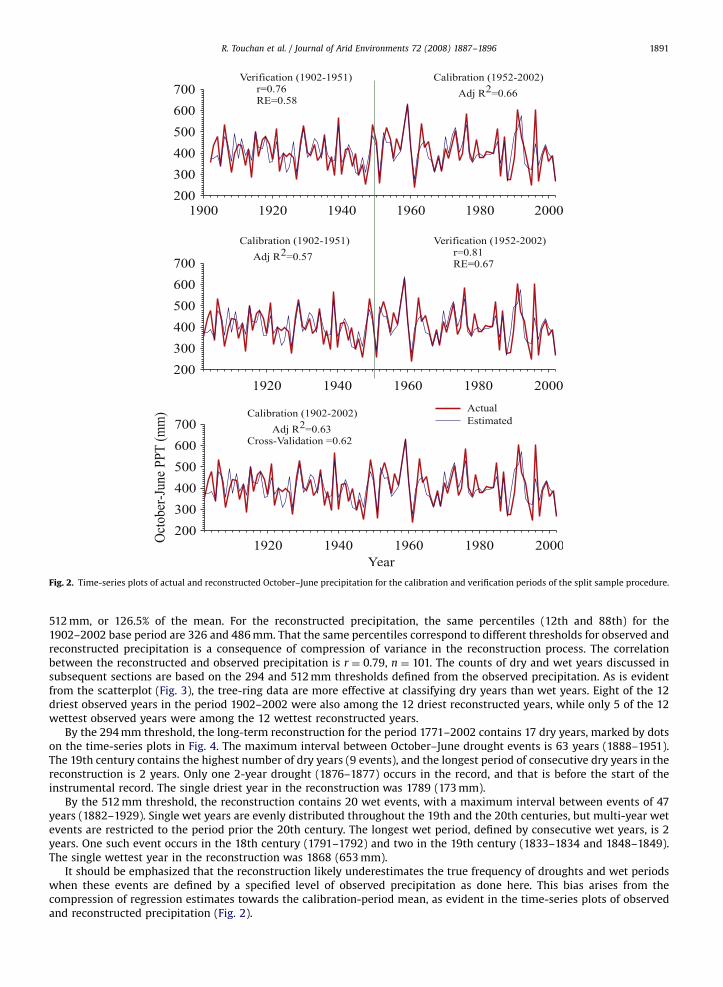
The RFA identified October–June total precipitation as the most appropriate seasonal predictand for reconstruction. Thefinal regression statistics for the 1771–2002 precipitation reconstruction obtained from the relationship between theregional tree-ring chronology (predictor) and precipitation record (predictand) are highly significant (Fig. 2). The predictorvariable accounts for 63% of observed precipitation. Cross-validation using the PRESS procedure indicated that the modelperforms adequately in estimating precipitation data not used to fit the model (prediction R2
¼ 0.61). The split-samplecalibration-validation exercise indicated stability of the relationship over halves of the available instrumental data period.The computed RE statistics indicated skill of reconstruction in the calibration/validation exercises using different sub-periods. On this evidence, the full calibration period (1902–2002) was then used for the final reconstruction model.
3.3. Identification of dry and wet years
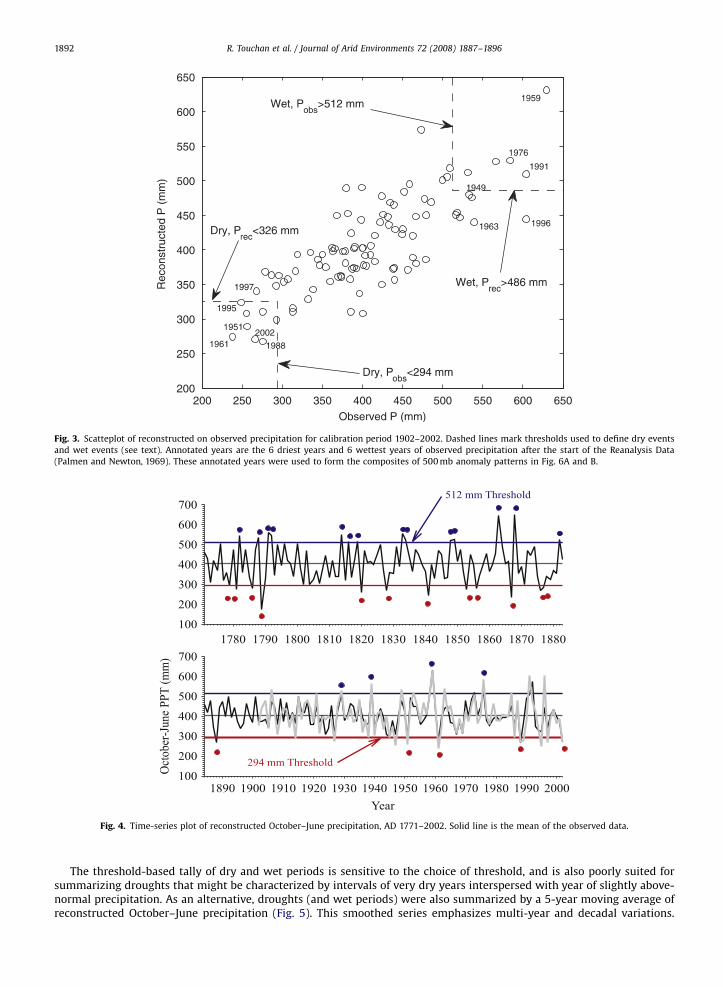
A scatterplot of reconstructed and observed precipitation attests to the strength and linearity of the precipitation signalin the tree-ring data over the range of observed precipitation encountered in the calibration period, and indicates that thereconstruction is somewhat more effective in classifying dry years than wet years (Fig. 3). The 12th and 88th percentiles ofobserved precipitation computed for the base period 1902–2002 were used to delineate dry and wet years, respectively. Forthe observed precipitation, the 12th percentile corresponds to 294 mm or 72.5% of mean; and the 88th percentile to
ARTICLE IN PRESS
Fig. 2. Time-series plots of actual and reconstructed October–June precipitation for the calibration and verification periods of the split sample procedure.
R. Touchan et al. / Journal of Arid Environments 72 (2008) 1887–1896 1891
512 mm, or 126.5% of the mean. For the reconstructed precipitation, the same percentiles (12th and 88th) for the1902–2002 base period are 326 and 486 mm. That the same percentiles correspond to different thresholds for observed andreconstructed precipitation is a consequence of compression of variance in the reconstruction process. The correlationbetween the reconstructed and observed precipitation is r ¼ 0.79, n ¼ 101. The counts of dry and wet years discussed insubsequent sections are based on the 294 and 512 mm thresholds defined from the observed precipitation. As is evidentfrom the scatterplot (Fig. 3), the tree-ring data are more effective at classifying dry years than wet years. Eight of the 12driest observed years in the period 1902–2002 were also among the 12 driest reconstructed years, while only 5 of the 12wettest observed years were among the 12 wettest reconstructed years.
By the 294 mm threshold, the long-term reconstruction for the period 1771–2002 contains 17 dry years, marked by dotson the time-series plots in Fig. 4. The maximum interval between October–June drought events is 63 years (1888–1951).The 19th century contains the highest number of dry years (9 events), and the longest period of consecutive dry years in thereconstruction is 2 years. Only one 2-year drought (1876–1877) occurs in the record, and that is before the start of theinstrumental record. The single driest year in the reconstruction was 1789 (173 mm).
By the 512 mm threshold, the reconstruction contains 20 wet events, with a maximum interval between events of 47years (1882–1929). Single wet years are evenly distributed throughout the 19th and the 20th centuries, but multi-year wetevents are restricted to the period prior the 20th century. The longest wet period, defined by consecutive wet years, is 2years. One such event occurs in the 18th century (1791–1792) and two in the 19th century (1833–1834 and 1848–1849).The single wettest year in the reconstruction was 1868 (653 mm).
It should be emphasized that the reconstruction likely underestimates the true frequency of droughts and wet periodswhen these events are defined by a specified level of observed precipitation as done here. This bias arises from thecompression of regression estimates towards the calibration-period mean, as evident in the time-series plots of observedand reconstructed precipitation (Fig. 2).
ARTICLE IN PRESS
Fig. 3. Scatteplot of reconstructed on observed precipitation for calibration period 1902–2002. Dashed lines mark thresholds used to define dry events
and wet events (see text). Annotated years are the 6 driest years and 6 wettest years of observed precipitation after the start of the Reanalysis Data
(Palmen and Newton, 1969). These annotated years were used to form the composites of 500 mb anomaly patterns in Fig. 6A and B.
Fig. 4. Time-series plot of reconstructed October–June precipitation, AD 1771–2002. Solid line is the mean of the observed data.
R. Touchan et al. / Journal of Arid Environments 72 (2008) 1887–18961892
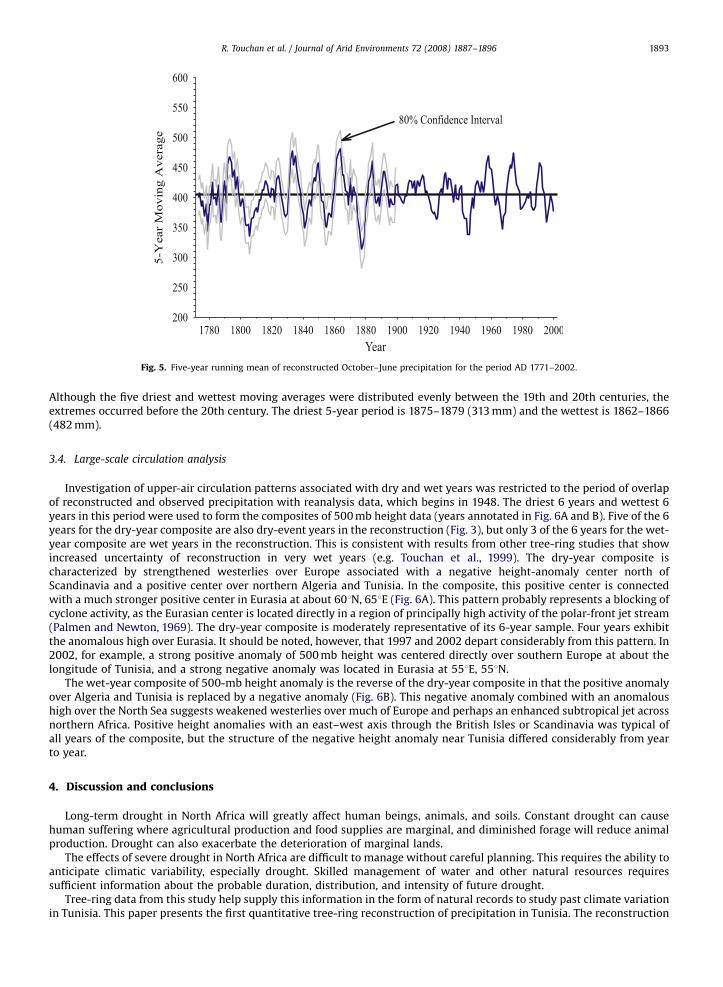
The threshold-based tally of dry and wet periods is sensitive to the choice of threshold, and is also poorly suited forsummarizing droughts that might be characterized by intervals of very dry years interspersed with year of slightly above-normal precipitation. As an alternative, droughts (and wet periods) were also summarized by a 5-year moving average ofreconstructed October–June precipitation (Fig. 5). This smoothed series emphasizes multi-year and decadal variations.
ARTICLE IN PRESS
Fig. 5. Five-year running mean of reconstructed October–June precipitation for the period AD 1771–2002.
R. Touchan et al. / Journal of Arid Environments 72 (2008) 1887–1896 1893
Although the five driest and wettest moving averages were distributed evenly between the 19th and 20th centuries, theextremes occurred before the 20th century. The driest 5-year period is 1875–1879 (313 mm) and the wettest is 1862–1866(482 mm).
3.4. Large-scale circulation analysis
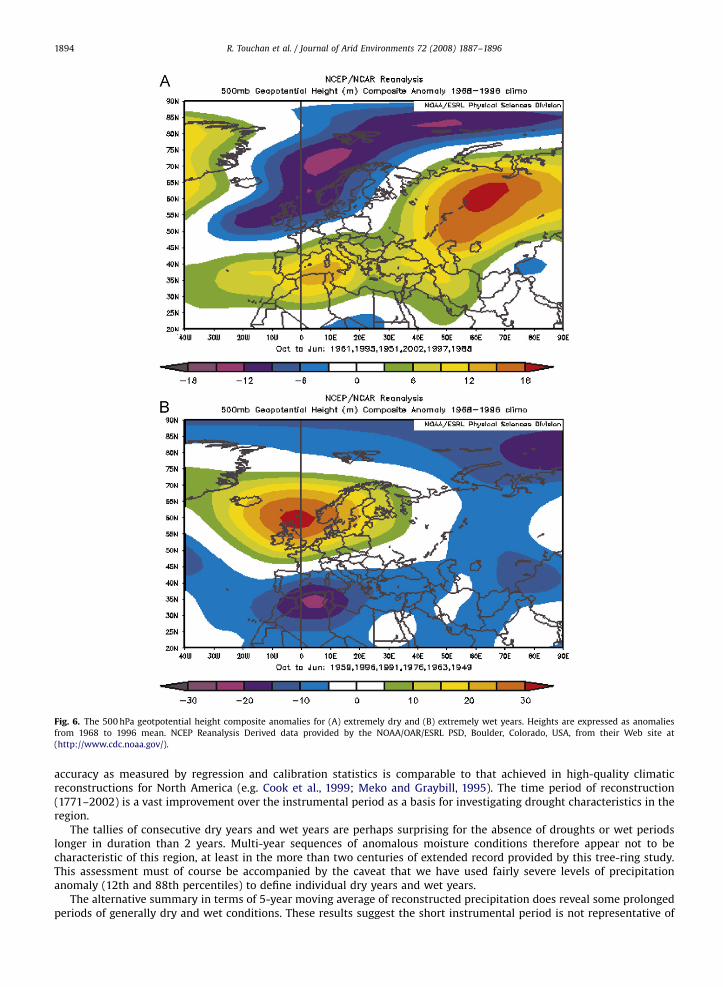
Investigation of upper-air circulation patterns associated with dry and wet years was restricted to the period of overlapof reconstructed and observed precipitation with reanalysis data, which begins in 1948. The driest 6 years and wettest 6years in this period were used to form the composites of 500 mb height data (years annotated in Fig. 6A and B). Five of the 6years for the dry-year composite are also dry-event years in the reconstruction (Fig. 3), but only 3 of the 6 years for the wet-year composite are wet years in the reconstruction. This is consistent with results from other tree-ring studies that showincreased uncertainty of reconstruction in very wet years (e.g. Touchan et al., 1999). The dry-year composite ischaracterized by strengthened westerlies over Europe associated with a negative height-anomaly center north ofScandinavia and a positive center over northern Algeria and Tunisia. In the composite, this positive center is connectedwith a much stronger positive center in Eurasia at about 601N, 651E (Fig. 6A). This pattern probably represents a blocking ofcyclone activity, as the Eurasian center is located directly in a region of principally high activity of the polar-front jet stream(Palmen and Newton, 1969). The dry-year composite is moderately representative of its 6-year sample. Four years exhibitthe anomalous high over Eurasia. It should be noted, however, that 1997 and 2002 depart considerably from this pattern. In2002, for example, a strong positive anomaly of 500 mb height was centered directly over southern Europe at about thelongitude of Tunisia, and a strong negative anomaly was located in Eurasia at 551E, 551N.
The wet-year composite of 500-mb height anomaly is the reverse of the dry-year composite in that the positive anomalyover Algeria and Tunisia is replaced by a negative anomaly (Fig. 6B). This negative anomaly combined with an anomaloushigh over the North Sea suggests weakened westerlies over much of Europe and perhaps an enhanced subtropical jet acrossnorthern Africa. Positive height anomalies with an east–west axis through the British Isles or Scandinavia was typical ofall years of the composite, but the structure of the negative height anomaly near Tunisia differed considerably from yearto year.
4. Discussion and conclusions
Long-term drought in North Africa will greatly affect human beings, animals, and soils. Constant drought can causehuman suffering where agricultural production and food supplies are marginal, and diminished forage will reduce animalproduction. Drought can also exacerbate the deterioration of marginal lands.
The effects of severe drought in North Africa are difficult to manage without careful planning. This requires the ability toanticipate climatic variability, especially drought. Skilled management of water and other natural resources requiressufficient information about the probable duration, distribution, and intensity of future drought.
Tree-ring data from this study help supply this information in the form of natural records to study past climate variationin Tunisia. This paper presents the first quantitative tree-ring reconstruction of precipitation in Tunisia. The reconstruction
ARTICLE IN PRESS
Fig. 6. The 500 hPa geotpotential height composite anomalies for (A) extremely dry and (B) extremely wet years. Heights are expressed as anomalies
from 1968 to 1996 mean. NCEP Reanalysis Derived data provided by the NOAA/OAR/ESRL PSD, Boulder, Colorado, USA, from their Web site at
(http://www.cdc.noaa.gov/).
R. Touchan et al. / Journal of Arid Environments 72 (2008) 1887–18961894
accuracy as measured by regression and calibration statistics is comparable to that achieved in high-quality climaticreconstructions for North America (e.g. Cook et al., 1999; Meko and Graybill, 1995). The time period of reconstruction(1771–2002) is a vast improvement over the instrumental period as a basis for investigating drought characteristics in theregion.
The tallies of consecutive dry years and wet years are perhaps surprising for the absence of droughts or wet periodslonger in duration than 2 years. Multi-year sequences of anomalous moisture conditions therefore appear not to becharacteristic of this region, at least in the more than two centuries of extended record provided by this tree-ring study.This assessment must of course be accompanied by the caveat that we have used fairly severe levels of precipitationanomaly (12th and 88th percentiles) to define individual dry years and wet years.
The alternative summary in terms of 5-year moving average of reconstructed precipitation does reveal some prolongedperiods of generally dry and wet conditions. These results suggest the short instrumental period is not representative of
ARTICLE IN PRESS
R. Touchan et al. / Journal of Arid Environments 72 (2008) 1887–1896 1895
extreme dry conditions, as illustrated by the lowest 5-year running mean in the 1870s. Therefore, we must reject the nullhypothesis that the short instrumental record for Tunisia adequately represents the drought conditions of the past fewcenturies.
This reconstruction of October–June Tunisia precipitation is not significantly correlated with May–August precipitationreconstruction of Touchan et al. (2005b) for the eastern Mediterranean region. This reconstruction is also not significantlycorrelated with Touchan et al. (in preparation) and Esper et al. (2007) November–March precipitation and February–JunePalmer Drought Index reconstruction for Morocco, respectively. The lack of the correlation is probably due to differentatmospheric circulation influences on precipitation in the two regions. The authors also note that the seasonal precipitationsignal as filtered by the tree-ring records differs from one region to another—cool season for this study and Morocco, andwarm season for the eastern Mediterranean. Such differences in seasonal response require further study, but may be due tosite-specific factors such as species, topography, soil depth, and slope. In particular, different tree species were used in thisstudy and in the eastern Mediterranean region. Fritts (1976) has documented species differences in seasonal climateresponse for tree species in North America, but little is yet known about such species dependence for tree species in NorthAfrica to the Eastern Mediterranean. Improved understanding depends on future collections from multiple species and sitesin North Africa.
In order to establish whether our October–June precipitation reconstruction exhibited links with large-scaleatmospheric circulation, we analyzed correlation between our reconstruction and the North Atlantic Oscillation (NAO),but did not find a significant correlation. The NAO has been shown to be strongly related to cool-season precipitationvariations on the Iberian Peninsula (Goodess and Jones, 2002) and the western Mediterranean region (Glueck and Stockton,2001; Xoplaki et al., 2004), but no studies have as yet demonstrated a strong influence on Tunisia precipitation patterns.
The analysis of 500-mb heights does however support large-scale atmospheric teleconnections to dry years and wetyears in Tunisia. Notably, the dry-year composite of 500-mb height anomaly is characterized by strengthened westerliesover Europe associated with a negative anomaly center north of Scandinavia and positive center over northern Algeria andTunisia. The wet-year composite is the reverse of the dry-year composite, with the positive anomaly over Algeria andTunisia replaced by a negative anomaly. These results suggest that inferences of past occurrence of blocking patterns in thewesterlies can be made from tree-ring chronologies in the Mediterranean region. Stronger inferences could probably bemade with augmented tree-ring networks sampling adjacent areas, especially eastern Asia.
Acknowledgments
The authors wish to thank Drs. Toumi Lamjed Directeur general de l’ISPT ( Institut Sylvo-Pastoral de Tabarka), MougouAbdelaziz President de l’IRESA (Institution de la Recherche et l’Enseignement Superieur Agricole), Rejeb Nejib Directeurgeneral de l’INRGREF (Institut national de recherche en genie rural, eaux et forets), Mr. Fekih Salem Ahmed Ridha Directeurgeneral des forets, and all forest technicians of Siliana, Kef and Kasserine for their great help and support in making thisstudy possible. We would like to thank Jim Burns for helping dating one of the sites. We thank Jeffrey Balmat and NesatErkan for their valuable assistance in the field; Jeremy Goral and Julie Wong for their assistance in sample preparation andmeasurement. Funding was provided by the US National Science Foundation, Earth System History (Grant no. 0317288).
References
Aloui, A., 1982. Recherches dendroclimatologiques en Kroumirie (Tunisie) (Dendroclimatological research in Kroumirie (Tunisia).). Ph.D. Dissertation,Universite Aix-Marseille III, 109pp.
Aloui, A., Serre-Bachet, F., 1987. Analyse dendroclimatologique comparee de six populations de chene zeen et d’une population de pin maritime du nord-ouest de la Tunisie(Comparative dendroclimatological analysis of six populations of Algerian oak and one population of maritime pine fromnorthwestern Tunisia). Ecologia Mediterranea 13 (3), 55–74.
Berger, A., Guiot, J., Mathieu, L., Munaut, A., 1979. Cedar tree-rings and climate in Morocco. Tree-ring Bulletin 39, 61–75.Biondi, F., Waikul, K., 2004. Dendroclim 2002: a C++ program for statistical calibration of climate signals in tree-ring chronologies. Computers in
Geoscience 30, 303–311.Chbouki, N., Stockton, C.W., Myers, D., 1995. Spatio-temporal patterns of drought in Morocco. International Journal of Climatology 15, 187–205, 1995.Cook, E. R., 1985. A time-series analysis approach to tree-ring standardization. Ph.D. Dissertation, Dept. of Geosciences, The University of Arizona, Tucson.Cook, E.R., Briffa, K.R., 1990. A comparison of some tree-ring standardization methods. In: Cook, E.R., Kairiukstis, L.A. (Eds.), Methods of Dendrochronology.
Kluwer, Dordrecht, pp. 104–123.Cook, E.R., Peters, K., 1997. Calculating unbiased tree-ring indices for the study of climatic and environmental change. The Holocene 7 (3), 361–370.Cook, E.R., Meko, D.M., Stahle, D.W., Cleaveland, M.K., 1999. Drought reconstructions for the continental United States. Journal of Climate 12, 1145–1162.De Corte, C., 1979. Premiere reconstruction du climat au Moroc a partiere de la dendrochronology. I: Memoire Lic. Sc. Geogr., Insti. D’Astromie et de
Geophysique, U. Catholique de Louvain-la-Neuve.Esper, J., Frank, D., Buntgen, U., Verstege, A., Luterbacher, J., Xoplaki, E., 2007. Long-term drought severity variations in Morocco. Geophysical Research
Letters 34, L17702.Fritts, H.C., 1976. Tree Rings and Climate. Academic Press, New York.Fritts, H.C., Guiot, J., Gordon, G.A., Schweingruber, F., 1990. Methods of calibration, verification, and reconstruction. In: Cook, E.R., Kairiukstis, L.A. (Eds.),
Methods of Dendrochronology: Applications in the Environmental Sciences. Kluwer Academic Publishers, Boston, pp. 163–217.Glueck, M.F., Stockton, C.W., 2001. Reconstruction of the North Atlantic oscillation, 1429–1983. International Journal of Climatology 21, 1453–1465.Goodess, C.M., Jones, P.D., 2002. Links between circulation and changes in the characteristics of Iberian rainfall. International Journal of Climatology 22,
1593–1615.Helleputte, C., 1976. Contribution alletude dendrochronologique du cedre dans le Rif et la Moyen Atlas (Moroc). In: Memoire Lic. Sc. Geogr. Insti.
D’Astromie et de Geophysique, U. Catholique de Louvain-la-Neuve.
ARTICLE IN PRESS
R. Touchan et al. / Journal of Arid Environments 72 (2008) 1887–18961896
Holmes, R.L., 1983. Computer-assisted quality control in tree-ring dating and measurement. Tree-ring Bulletin 43, 69–78.Kalnay, E., et al., 1996. The NCEP/NCAR reanalysis 40-year project. Bulletin of American Meteorological Society 77, 437–471.Messaoudene, M., 1989. Approche dendroclimatologique et productivite de Quercus afares Pomel et Quercus canariensis Willd. dans les massifs forestiers
de l’Akfadou et de Beni-Ghobri en Algerie (Dendroclimatological approach and productivity of Quercus afares Pomel and Quercus canariensis Willd. inthe forested mountains of l’Akfadou and Beni-Ghobri in Algeria). Ph.D. Dissertation, Universite Aix-Marseille III, 114pp.
Messaoudene, M., Tessier, L., 1997. Relations cerne-climat dans des peuplements de Quercus afares Willd et Quercus canariensis Pomel en Algerie,(Tree-ring-climate relationships for populations of Quercus afares Willd. and Quercus canariensis Pomel in Algeria). Annales des Sciences Forestieres 54,347–358.
Meko, D.M., 1985. Temporal and spatial variation of drought in Morocco. In: Proceedings of Drought, Water Management and Food Production, Agadir,Morocco, November, 21–24
Meko, D.M., 1997. Dendroclimatic reconstruction with time varying subsets of tree indices. Journal of Climate 10, 687–696.Meko, D.M., Graybill, D.A., 1995. Tree-ring reconstruction of upper Gila river discharge. Water Resource Bulletin 31, 605–616.Meko, D.M., Hughes, M.K., Stockton, C.W., 1991. Climate change and climate variability: the paleo record. In: Managing Water Resources in the West under
Conditions of Climate Uncertainty. National Academy Press, Washington, D.C, pp. 71–100.Mitchell, T., Jones, P., 2005. An improved method of constructing a database of monthly climate observations and associated high-resolution grids.
International Journal of Climatology 25, 693–712.Mtimt, A., 2000. Soils of Tunisia. Options Mediterraneennes, Serie B 34, 243–268.Munaut, A.V., 1978. Dendroclimatological studies on cedars in Morocco. In: Evolution of Planetary Atmospheres and Climatology of the Earth, Paris,
France, pp. 373–379.Nuttonson, M.Y., 1961. The physical environment and agriculture of Morocco, Algeria, and Tunisia with special reference to their regions containing areas
climatically and latitudinally analogous to Israel. American Institute of Crop Ecology, Washington, DC.Palmen, E., Newton, C.w., 1969. Atmospheric Circulation Systems, Their Structure and Physical Interpretation. Academic Press, New York.Safar, W., Serre-Bachet, F., Tessier, L., 1992. Les plus vieux pins d’Alep vivants connus (the oldest known living Aleppo pines). Dendrochronologia 10, 41–52.Serre, F., 1969. Variations de l’epaisseur des anneux chez le Thuya de Barbarie (Tetraclinis articulata (Vahl) Mast) et climat en Tunisie. Annales de la Faculte
des Sciences de Marseille 42, 193–204.Snee, R.D., 1997. Validation of regression models: methods and examples. Technometrics 19 (4), 415–428.Souleres, G., 1969. Le pin d’Alep en Tunisie. Annales de l’Institut National de Recherches Forestieres de Tunisie, vol. 2, Fasc.1.Imprimerie officielle Tunis.Stockton, C.W., 1985. Current research towards understanding drought. In: Proceedings of Drought, Water Management and Food Production, Agadir,
Morocco, November 21–24Stokes, M.A., Smiley, M., 1968. An Introduction to Tree-ring Dating. University of Chicago Press, Chicago.Swetnam, T.W., 1985. Using dendrochronology to measure radial growth of defoliated trees. Agriculture Handbook No. 639. USDA Forest Service,
Cooperative State Research Service, pp. 1–39.Tessier, L., Nola, P., Serre-Bachet, F., 1994. Deciduous quercus in the mediterranean region: tree-ring/climate relationships. New Phytologist 126, 355–367.Till, C., 1997. The summary response function of Cedrus Atlantica in Morocco. Tree-Ring Bulletin 47, 23–36.Till, C., Guiot, J., 1990. Reconstruction of precipitation in Morocco since 1100 A.D. based on Cedrus atlantica tree-ring widths. Quaternary Research 33,
337–351.Touchan, R., Meko, D.M., Hughes, M.K., 1999. A 396-year reconstruction of precipitation in Southern Jordan. Journal of American Water Resources 35,
45–55.Touchan, R., Garfin, G.M., Meko, D.M., Funkhouser, G., Erkan, N., Hughes, M.K., Wallin, B.S., 2003. Preliminary reconstructions of spring precipitation in
southwestern turkey from tree-ring width. International Journal of Climatology 23, 157–171.Touchan, R., Funkhouser, G., Hughes, M.K., Erkan, N., 2005a. Standardized precipitation indices reconstructed from Turkish tree-ring widths. Climatic
Change 72 (3), 339–353.Touchan, R., Xoplaki, E., Funkhouser, G., Luterbacher, J., Hughes, M.K., Erkan, N., Akkemik, U., Stephan, J., 2005b. Dendroclimatology and large-scale
circulation influences in the eastern Mediterranean and Near East region. Climate Dynamics 25, 75–98.Weisberg, S., 1985. Applied Linear Regression. Wiley, New York.Wigley, T., Briffa, K., Jones, P., 1984. On the average value of correlated time series, with applications in dendroclimatology and hydrometeorology. Journal
of Climate and Applied Meteorology 23, 201–213.Xoplaki, E., Gonzalez-Rouco, J.F., Luterbacher, J., 2004. Wet season Mediterranean precipitation variability: influence of large-scale dynamics and trends.
Climate Dynamics 23, 63–78.
Related Documents