Author's personal copy Precipitates in Al–Cu alloys revisited: Atom-probe tomographic experiments and first-principles calculations of compositional evolution and interfacial segregation Aniruddha Biswas a,b , Donald J. Siegel c,d,⇑ , C. Wolverton a , David N. Seidman a,e a Department of Materials Science and Engineering, Northwestern University, 2220 Campus Drive, Evanston, IL 60208, USA b Materials Science Division, Bhabha Atomic Research Centre, Mumbai 400 085, India c Mechanical Engineering Department, University of Michigan, 2350 Hayward St., Ann Arbor, MI 48109-2125, USA d Applied Physics Program, University of Michigan, 2350 Hayward St., Ann Arbor, MI 48109-2125, USA e Northwestern University Center for Atom-Probe Tomography, Northwestern University, Evanston, IL 60208, USA Received 3 May 2011; received in revised form 8 June 2011; accepted 18 June 2011 Available online 19 July 2011 Abstract Atom-probe tomography, transmission electron microscopy, X-ray diffraction and first-principles calculations are employed to study: (i) compositional evolution of GPII zones and h 0 precipitates; and (ii) solute segregation at a-Al/h 0 interfaces in Al–1.7 at.% Cu (Al–4 wt.% Cu) alloys. GPII zones are observed after aging at 438 K for 8 h, whereas higher aging temperatures, 463 K for 8 h and 533 K for 4 h, reveal only h 0 precipitates. Most GPII zones and h 0 precipitates are demonstrated to be Cu-deficient at the lower two aging temperatures; only the 533 K treatment resulted in h 0 stoichiometries consistent with the expected Al 2 Cu equilibrium composition. For alloys containing 200 at. ppm Si we find evidence of Si partitioning to GPII zones and h 0 precipitates. Significant Si segregation is observed at the coherent a-Al/h 0 interface for aging at 533 K, resulting in an interfacial Si concentration more than 11 times greater than in the a-Al matrix. Importantly, the Si interfacial concentration undergoes a transition from a non-equilibrium delocalized profile to an equilibrium localized profile as the aging temperature is increased from 463 to 533 K. Consistent with these measurements, first-principles calculations predict a strong thermodynamic driving force favoring Si partitioning to Cu sites in h 0 . Silicon segregation at, and partition- ing to, h 0 precipitates results in a decrease in interfacial free energy, and concomitantly an increase in the nucleation current. Our results suggest that Si catalyzes the early stages of precipitation in these alloys, consistent with the higher precipitate number densities observed in commercial Al–Cu–Si alloys. Ó 2011 Acta Materialia Inc. Published by Elsevier Ltd. All rights reserved. Keywords: Three-dimensional atom probe; First-principles electron theory; Interface segregation; Precipitation; Aluminum alloys 1. Introduction The binary Al–Cu system is a well-studied precipitation strengthening system because it forms the basis for a wide range of age-hardening alloys that are technologically important. The precipitation sequence observed on aging these alloys, GPI ! GPII(h 00 ) ! h 0 ! h, is often used as a model system for describing the fundamentals of precipita- tion hardening [1]. This sequence commences with the for- mation of coherent GPI and GPII zones. GPI zones are described as consisting of single layers of pure Cu atoms on {0 0 1} a-Al planes. An accepted structural model of GPII consists of two Cu {0 0 2} layers separated by three Al planes [2,3], with the stoichiometry Al 3 Cu. First-princi- ples calculations [4] also strongly support these structural models. Metastable h 0 , the main strengthening phase, has a body-centered tetragonal crystal structure with the stoi- chiometry Al 2 Cu [5,6]. The precipitation sequence ends 1359-6454/$36.00 Ó 2011 Acta Materialia Inc. Published by Elsevier Ltd. All rights reserved. doi:10.1016/j.actamat.2011.06.036 ⇑ Corresponding author at: Mechanical Engineering Department, Uni- versity of Michigan, 2350 Hayward St., Ann Arbor, MI 48109-2125, USA. E-mail address: [email protected] (D.J. Siegel). www.elsevier.com/locate/actamat Available online at www.sciencedirect.com Acta Materialia 59 (2011) 6187–6204

Welcome message from author
This document is posted to help you gain knowledge. Please leave a comment to let me know what you think about it! Share it to your friends and learn new things together.
Transcript
Author's personal copy
Precipitates in Al–Cu alloys revisited: Atom-probetomographic experiments and first-principles calculationsof compositional evolution and interfacial segregation
Aniruddha Biswas a,b, Donald J. Siegel c,d,!, C. Wolverton a, David N. Seidman a,e
aDepartment of Materials Science and Engineering, Northwestern University, 2220 Campus Drive, Evanston, IL 60208, USAbMaterials Science Division, Bhabha Atomic Research Centre, Mumbai 400 085, India
cMechanical Engineering Department, University of Michigan, 2350 Hayward St., Ann Arbor, MI 48109-2125, USAdApplied Physics Program, University of Michigan, 2350 Hayward St., Ann Arbor, MI 48109-2125, USA
eNorthwestern University Center for Atom-Probe Tomography, Northwestern University, Evanston, IL 60208, USA
Received 3 May 2011; received in revised form 8 June 2011; accepted 18 June 2011Available online 19 July 2011
Abstract
Atom-probe tomography, transmission electron microscopy, X-ray di!raction and first-principles calculations are employed to study:(i) compositional evolution of GPII zones and h0 precipitates; and (ii) solute segregation at a-Al/h0 interfaces in Al–1.7 at.% Cu(Al–4 wt.% Cu) alloys. GPII zones are observed after aging at 438 K for 8 h, whereas higher aging temperatures, 463 K for 8 h and533 K for 4 h, reveal only h0 precipitates. Most GPII zones and h0 precipitates are demonstrated to be Cu-deficient at the lower two agingtemperatures; only the 533 K treatment resulted in h0 stoichiometries consistent with the expected Al2Cu equilibrium composition. Foralloys containing !200 at. ppm Si we find evidence of Si partitioning to GPII zones and h0 precipitates. Significant Si segregation isobserved at the coherent a-Al/h0 interface for aging at 533 K, resulting in an interfacial Si concentration more than 11 times greater thanin the a-Al matrix. Importantly, the Si interfacial concentration undergoes a transition from a non-equilibrium delocalized profile to anequilibrium localized profile as the aging temperature is increased from 463 to 533 K. Consistent with these measurements, first-principlescalculations predict a strong thermodynamic driving force favoring Si partitioning to Cu sites in h0. Silicon segregation at, and partition-ing to, h0 precipitates results in a decrease in interfacial free energy, and concomitantly an increase in the nucleation current. Our resultssuggest that Si catalyzes the early stages of precipitation in these alloys, consistent with the higher precipitate number densities observedin commercial Al–Cu–Si alloys.! 2011 Acta Materialia Inc. Published by Elsevier Ltd. All rights reserved.
Keywords: Three-dimensional atom probe; First-principles electron theory; Interface segregation; Precipitation; Aluminum alloys
1. Introduction
The binary Al–Cu system is a well-studied precipitationstrengthening system because it forms the basis for a widerange of age-hardening alloys that are technologicallyimportant. The precipitation sequence observed on agingthese alloys, GPI ! GPII(h00)! h0 ! h, is often used as a
model system for describing the fundamentals of precipita-tion hardening [1]. This sequence commences with the for-mation of coherent GPI and GPII zones. GPI zones aredescribed as consisting of single layers of pure Cu atomson {0 0 1}a-Al planes. An accepted structural model ofGPII consists of two Cu {0 0 2} layers separated by threeAl planes [2,3], with the stoichiometry Al3Cu. First-princi-ples calculations [4] also strongly support these structuralmodels. Metastable h0, the main strengthening phase, hasa body-centered tetragonal crystal structure with the stoi-chiometry Al2Cu [5,6]. The precipitation sequence ends
1359-6454/$36.00 ! 2011 Acta Materialia Inc. Published by Elsevier Ltd. All rights reserved.doi:10.1016/j.actamat.2011.06.036
! Corresponding author at: Mechanical Engineering Department, Uni-versity of Michigan, 2350 Hayward St., Ann Arbor, MI 48109-2125, USA.
E-mail address: [email protected] (D.J. Siegel).
www.elsevier.com/locate/actamat
Available online at www.sciencedirect.com
Acta Materialia 59 (2011) 6187–6204

Author's personal copy
with the transformation of the h0 phase to the incoherentequilibrium h phase, Al2Cu, that possesses a tetragonalC16 crystal structure.
Given its importance for strengthening Al, a large num-ber of studies of the Al–Cu precipitation sequence havefocused on the properties of metastable h0 precipitates [7–11]. These precipitates exhibit a high-aspect-ratio plate-likemorphology with coherent (0 0 1) h0||{0 0 1}a-Al interfacesparallel to their broad faces and semi-coherent interfacesat their peripheries [7]. This morphology is often rational-ized by a large anisotropy in the interfacial free energy(c) and elastic strain energies between the coherent andsemi-coherent interfaces, with the broad coherent inter-faces possessing a smaller c value than the semi-coherentinterfaces. Aaronson et al. [8,9] estimated the interfacialenergy anisotropy factor to be !12. Recent first-principlescalculations, which decoupled the contributions of interfa-cial and elastic-strain energies, reported an anisotropy fac-tor of !3 [10,11].
The increasing use of Al–Cu alloys in commercial appli-cations (e.g. cast 319 alloys for automobile engine blocks)continues to drive further studies of the properties of h0 pre-cipitates [12–18]. Relatively little is known, however, con-cerning the compositional evolution of h0 precipitatessince its nanometer-scale platelet-like morphology makesquantitative analytical electron microscopy analyses extre-mely di"cult. This is reflected in the scant literature onsolute-atom segregation at the platelets’s cores and at thea-Al matrix/precipitate interfaces. This dearth of informa-tion is unfortunate since this data is essential for the devel-opment of accurate models of precipitation kinetics andstrengthening. For example, segregation at interfaces is aresult of a decrease in c, which leads to a Gibbsian interfa-cial excess of solute (C) and retards precipitate coarsening.Moreover, deviations from the expected precipitate stoichi-ometry, in the form of excess concentrations of solute inthe precipitate core, may indicate the existence of heteroge-neous nucleation [19] and identify mechanisms that limitthe coarsening rate. Since commercial process optimizationtools rely upon accurate predictions of alloy microstructureas a function of processing conditions, it is desirable tounderstand and quantify the impact of nanoscale chemicalcomposition on precipitation kinetics.
Three-dimensional (3-D) atom-probe tomography(APT) is capable of addressing these issues [20], and is cur-rently the most suitable instrument at the subnano- tonano-scale for studying the compositions of nanoscale h0
platelets and their heterophase interfaces with the a-Almatrix. Prior evidence for magnesium segregation at coher-ent a-Al/Al3Sc(L12) heterophase interfaces, utilizing APT,demonstrates the power of this approach for measuringsmall values of C [19]. Nevertheless, prior APT studies ofprecipitation in Al–Cu-based alloys by di!erent groupshave reported di!ering results [21–25]. For instance, Karliket al. [23] have summarized the conflicting results [21,22]pertaining to the compositions of GP zones. Additionally,Shollock et al. [24] and Sano et al. [25] performed
APT analyses of h0 precipitates in Al–1.7Cu–0.34Mg–0.1Ag at.% and Al–2.7Cu–0.5 Mg–0.1Ag–0.26Mn–0.04Zr at.% alloys, respectively, and reported di!erent Cuconcentrations for the h0 phase. Shollock et al. [24]obtained an Al3Cu stoichiometry for the h0 phase, whereasKarlik et al. [23] found a stoichiometry of Al2Cu. Further-more, there have been relatively few APT studies of thetemporal evolution of h0 platelets, with the majority ofstudies focusing on precipitate nucleation. Employingatom-probe field-ion microscopy and APT, respectively,Ringer et al. [26] and Honma et al. [27] investigatedwhether trace additions of tin could enhance h0 nucleation.Similarly, little is known regarding solute interfacial segre-gation in Al–Cu alloys: Cu segregation at a small-anglegrain boundary has been studied in thin films [28], and Sri-vastava et al. [29] studied segregation at equilibrium hprecipitates.
In view of the above, the objective of this work is tostudy the nanoscale chemical composition in the Al–Cuprecipitation sequence, and to elucidate whether these com-positional di!erences correlate with variations in theobserved precipitation kinetics. Specifically, using a combi-nation of 3-D local-electrode atom-probe (LEAP) tomog-raphy, X-ray di!raction (XRD), transmission electronmicroscopy (TEM) and first-principles calculations, weexamine: (i) the compositional evolution of GPII zonesand h0 platelets; and (i) Si solute segregation at coherenta-Al/ h0 interfaces in Al–1.7 at.% Cu (Al–4 wt.% Cu), with!200 at. ppm additions of Si. The ternary Al–Cu–Si systemwas studied to clarify the role of Si in the faster precipita-tion kinetics observed in commercial Si-containing 319alloys [30]. For aging at 438 and 463 K, our analyses revealclear evidence of significant partitioning of Si at the coresof the GPII zones and h0 precipitates, consistent with Siplaying a catalytic role in nucleating these phases. At533 K, the Si core concentration of h0 decreases in favorof forming a Si-rich, localized segregation profile at thecoherent a-Al/h0 interface. We quantify this segregationwith the relative Gibbsian interfacial Si excess, and use thisdata to estimate the segregation-induced reduction of inter-facial free energy. Additionally, first-principles calculationsof solute substitutional energies and partitioning behaviorprovide energetic explanations for the experimentally mea-sured phenomena.
2. Methodologies
2.1. Experimental methods
Aluminum (ALCOA) of two di!erent purities was usedin conjunction with high-purity (99.99%) Cu (Alfa Aesar)to prepare Al–1.7 at.% Cu (Al–4 wt.% Cu) specimens.The first Al source was 99.99% pure, while the secondsource contained two main impurities, !216 at. ppm Siand !267 at. ppm Fe. These alloys were melted in an alu-mina crucible in a resistance-heated furnace and direction-ally solidified in a graphite mold. The high-purity Al alloy
6188 A. Biswas et al. / Acta Materialia 59 (2011) 6187–6204

Author's personal copy
is denoted alloy A and the second (“impure”) one alloy B.Table 1 presents the results of the chemical analyses per-formed by Shiva Technologies Inc. (Syracuse, NY). Thecast samples were homogenized in air at 758 K for 24 h,followed by water quenching. They were subsequently agedin air at one of three di!erent temperatures, 438, 463 and533 K (165, 190 and 260 "C) for 8, 8 and 4 h, respectively.These aging conditions were chosen to study the temporalevolution of the precipitation sequence from GPII to h0.
After the aging treatments the samples were character-ized using a conventional Rigaku X-ray di!ractometer withCu Ka radiation at Northwestern University, and with syn-chrotron radiation at the Advanced Photon Source (APS)at the Argonne National Laboratory, using the Dow–Northwestern–DuPont beam line. Synchrotron radiationwith an energy of 17.477 keV and a wavelength of0.0709 nm was utilized; the samples were polished to a flat-ness of 1 lm.
Specimens for TEM were prepared by punching discswith a 3 mm diameter from thin foils with a thickness of!200 lm, followed by jet polishing with a Struers Tenu-pol-5 at "40 "C, using a 5 vol.% perchloric acid in a meth-anol electrolyte. TEM was performed employing anHitachi 8100 microscope at 200 kV.
APT sample blanks with a square cross-sectional area ofapproximately 300 # 300 lm2 and a 1 cm length were pre-pared by a combination of slicing and mechanical grinding[31,32]. A two-step electropolishing procedure was used formaking tips from these blanks. A 10 vol.% perchloric acidin methanol solution was used for coarse polishing, and thefinal polishing was performed using a solution of 2 vol.%perchloric acid in butoxyethanol.
APT experiments were performed in either the electricalor laser pulsing modes using a Cameca (formerly ImagoScientific Instruments, Madison, WI) LEAP tomograph[33–40] in the Northwestern University Center for Atom-Probe Tomography (NUCAPT). APT data collectionusing the electrical pulsing mode was performed at a spec-imen temperature of 30 ± 0.3 K, with a voltage pulse frac-tion (pulse voltage/steady-state DC voltage) of 20%, apulse repetition rate of 200 kHz and a background gaugepressure of <6.7 # 10"8 Pa (5 # 10"10 torr). For picosec-ond laser (wavelength = 532 nm) pulsing, a pulse repetitionrate of 500 kHz was utilized, with the specimen maintainedat 30 ± 0.3 K. Additionally, we performed a series ofexperiments that involved varying the laser energy perpulse from 0.5 to 4 nJ, and observed no measureable e!ectof laser beam heating of the wire tips because of its highthermal di!usivity. Therefore, we used a laser energy of
2 nJ per pulse, which facilitates collecting datasets of!107–108 atoms per specimen.
Care was taken to establish the equivalence of electricaland laser pulsing, using the same sample. The averagedetection rate ranged from 0.04 to 0.08 ions pulse"1 forthe APT analyses. The LEAP tomographic data wereanalyzed employing IVAS 3.0 (Cameca, Madison, WI).The a-Al/h0 interfaces were delineated with 3.5 at.% Cu iso-concentration surfaces for samples aged at 438 K, and9 at.% Cu isoconcentration surfaces for samples aged at463 or 533 K. E"cient sampling procedures [41] were usedto generate these isoconcentration surfaces. The parame-ters employed for the isoconcentration surfaces are: (i)voxel size = 1 # 1 # 1 nm3; (ii) delocalization distance =3 nm; and (iii) sample count threshold = 3%. Composi-tional information as a function of depth was obtainedwith: (i) 1-D concentration profiles through the regions ofinterest; and (ii) the proximity histogram method [42]. Allerror bars correspond to two standard deviations fromthe mean value for the compositional analyses. The count-ing statistics error, 1=
!!!!N
p, was used for the number density
calculation, where N is the total number of h0 platelets.Additional details concerning experimental and analysisprocedures are given elsewhere [19,43].
2.2. Computational methods
The energies for Si segregation at coherent and semi-coherent a-Al/h0 interfaces, DEseg [44], were evaluated usingfirst-principles calculations based on the PW91 generalizedgradient approximation [45] to density functional theory[46–47], as implemented in the Vienna Ab-initio SimulationPackage [48]. The projector augmented wave method[49–50] was used to describe the core–valence electroninteraction, and tests were performed to ensure that k-point sampling density was su"cient to ensure that segre-gation energies converged to !0.02 eV per solute atom. A300 eV cuto! energy was used for the plane-wave basis.
Segregation was modeled at coherent and semi-coherenta-Al matrix/ h 0 precipitate interfaces using distinctinterfacial supercells (Fig. 1). Both models adopt the exper-imental matrix/precipitate orientation relationship(0 0 1)h0||{0 0 1}Al and [0 1 0]h0||[0 1 0]Al [13], which and arebased on earlier models [10,11]. The coherent system is rep-resentative of the interface at the broad flat faces of the h0
platelet, which exhibits a small misfit strain of 0.7%, asah0 $ aAl. Our model cell consists of two symmetry-equiva-lent Al/h0 interfaces separated by seven planes of Al-{0 0 1} and nine planes of h0, for a total of 108 atoms. Priorstudies indicate that slabs of this thickness yield convergedinterfacial properties [51]. To minimize solute–solute imageinteractions, the dimensions of the supercell parallel to theinterfacial plane (cell vectors a and b) were expanded, result-ing in a 2 # 2 geometry with dimensions |a| = 2ah0 and|b| = 2ah0.
The semi-coherent model (Fig. 1, bottom panel) cap-tures the interfacial properties at the periphery of the h0
Table 1Chemical analyses of the alloys.
Si (wt.%) Cu (wt.%) Fe (wt.%)
Alloy A0.0012 (0.0011 at.%) 4.0 (1.74 at.%) 0.0004 (0.0002 at.%)Alloy B0.022 (0.0216 at.%) 4.0 (1.74 at.%) 0.054 (0.0267 at.%)
A. Biswas et al. / Acta Materialia 59 (2011) 6187–6204 6189
Author's personal copy
platelets. Unlike the coherent system, the semi-coherentinterface must accommodate a 42% lattice-parameter mis-match between aAl and ch0 along one direction (cell vectora) in the interfacial plane. This misfit is minimized utilizinga semi-coherent geometry [11] with |a| = 2ch0 $ 3aAl, yield-ing a "5.1% misfit. In the orthogonal interfacial direction,b, the misfit is the same as in the coherent system, 0.7%,and we apply a double-cell geometry, |b| = 2ah0. In the c-direction (normal to the interface) seven {1 0 0} layers ofAl and h0 separate two symmetry-equivalent interfaces,resulting in a total of 168 atoms.
In both interface models the magnitude of the supercellvector, |c|, normal to the interfacial plane was optimized byminimizing the total energy of the “clean” interface (no sol-ute atoms) with respect to cell length, while allowing for thesimultaneous relaxation of atomic positions. All segrega-tion calculations were performed using these fixed cellparameters. Additionally, atomic positions were relaxedsuch that residual forces on all atoms were <0.02 eV A"1.
In addition to these interfacial calculations, a series ofbulk calculations were performed to estimate 0 K point-defect formation energies and the relative heats of solutionfor substituting Si solute atoms in the Al matrix and h0 pre-cipitates. The defect energies are those for vacancy and
anti-site formation within the bulk h0 phase. These wereevaluated using a 2 # 2 # 2 supercell containing 96 atoms(95 for a vacancy calculation). Calculations of the Si heatof solution in h0 were performed using a 2 # 2 # 2 super-cell. A 4 # 4 # 4 cell (256 atoms) was used to study theenergetics of Si insertion into bulk Al. All bulk calculationsincluded relaxation of internal atomic positions, whilekeeping the external cell parameters fixed. Energies wereconverged with respect to k-point sampling to better than1 meV atom"1.
3. Results
3.1. X-ray analyses: identity of the precipitates
Fig. 2a–d displays XRD powder patterns of the Al–Cualloys in the solutionized or solutionized plus aged condi-tions. Solutionized samples of both alloys were found tobe single-phase solid solutions of Cu in a-Al (Fig. 2a).For aging at 438 or 463 K, conventional XRD experimentsdid not exhibit extra reflections corresponding to a secondphase. Synchrotron radiation experiments on these samplesyielded XRD patterns consistent with the presence of GPIIzones and/or h0 platelets (see below). GPII zones nominallyhave a tetragonal crystal structure, with lattice parametersa = b = 0.404 nm, c = 0.768 nm [3,21]. The h0 phase is alsotetragonal, with lattice parameters a = b = 0.404 nm,c = 0.58 nm [6]. These lattice parameters were used to cal-culate the planar spacings of the GPII zones and h0 phases.Fig. 2b displays XRD patterns for samples aged at 438 Kfor 8 h. The two extra peaks at 2h values of 14.75" and36.07" belong to GPII zones and are indexed as the(1 1 0) and (2 2 4) reflections, respectively, which are high-lighted in the insets. Since the d-spacings of the (1 1 0)planes of h0 and GPII are identical, no conclusive evidencefor the presence of h0 platelets was detected using XRD forsamples aged at 438 K. Alternatively, samples aged at463 K for 8 h and analyzed using synchrotron radiationexhibit evidence for h0 platelets (Fig. 2c). The extra peakobserved at 2h = 23.75" is the (1 2 1) reflection of the h0
phase, as highlighted in the inset. Finally, h0 platelets arevisible for the 533 K for 4 h aging treatment: Fig. 2d andits inset present XRD patterns with the (1 0 1) peak ofthe h0 phase highlighted. No peak corresponding to GPIIzones is detected after aging either at 463 K for 8 h or at533 K for 4 h.
3.2. TEM analyses
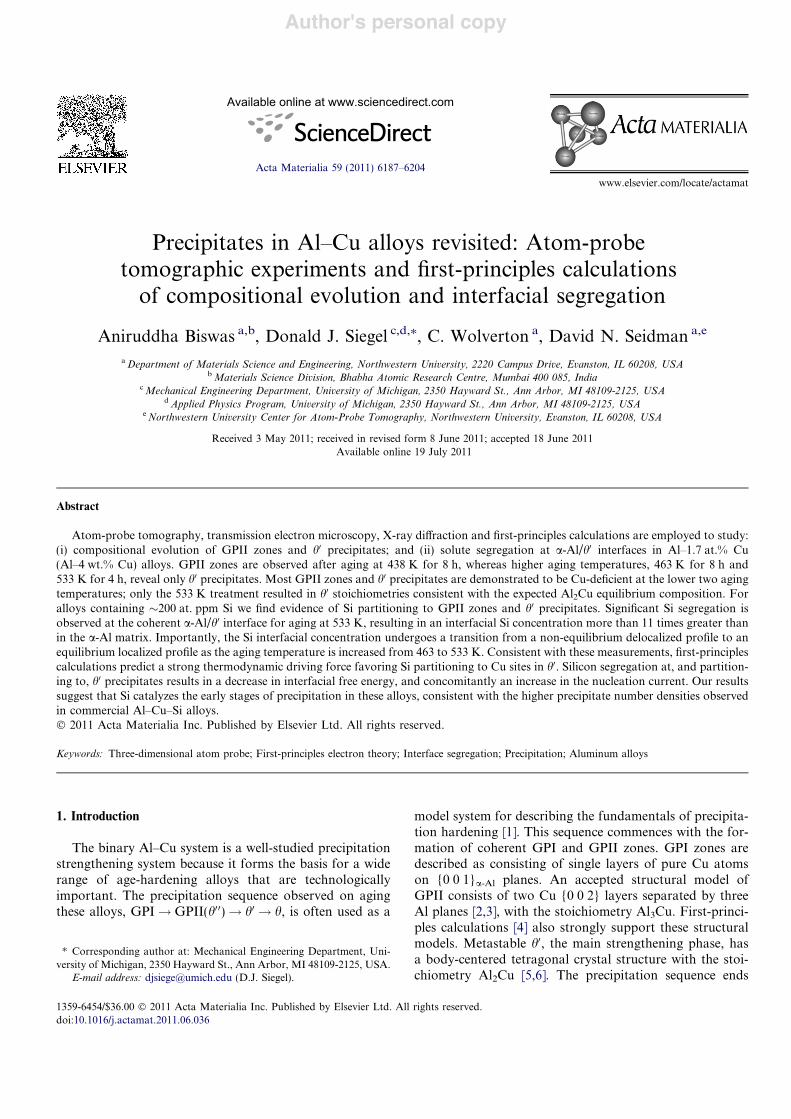
TEM analyses of the aged alloys (Fig. 3) were found tobe consistent with the XRD studies. GPII platelets areobserved in samples aged at 438 K for 8 h, as shown inthe h1 0 0i zone bright-field micrograph in Fig. 3a. Theh1 0 0i streaking associated with the GPII platelets isobserved in the corresponding di!raction pattern. h0 plate-lets are detected in samples aged at 463 K for 8 h or 533 Kfor 4 h, as displayed in the h1 0 0i zone bright-field micro-
Fig. 1. Relaxed supercells used for the Al/h0interfacial segregationcalculations. Top: coherent interface; bottom: semi-coherent interface.Al atoms are grey, Cu atoms are black; shading is used to convey theposition relative to the plane of the page. The red atom in the semi-coherent supercell illustrates the position of a solute at a bulk-like site inthe Al matrix. (Sub)lattice planes are labeled according to their positionrelative to the interface planes. For example: “Ali” identifies the Al planeadjacent to the interface; “Alb” refers to a bulk-like plane in the Al matrix;“h0Cui ” refers to the interfacial Cu layer within the h0 precipitate. Note thatin the semi-coherent interface Al and Cu sites within h0 can reside in thesame planes parallel to the interface. (For interpretation of the referencesto colour in this figure legend, the reader is referred to the web version ofthis article.)
6190 A. Biswas et al. / Acta Materialia 59 (2011) 6187–6204

Author's personal copy
graphs of Fig. 3b and c. No GPII zones were detected insamples aged at the two higher temperatures.1
3.3. LEAP tomographic analyses: mass spectra,microstructure and composition
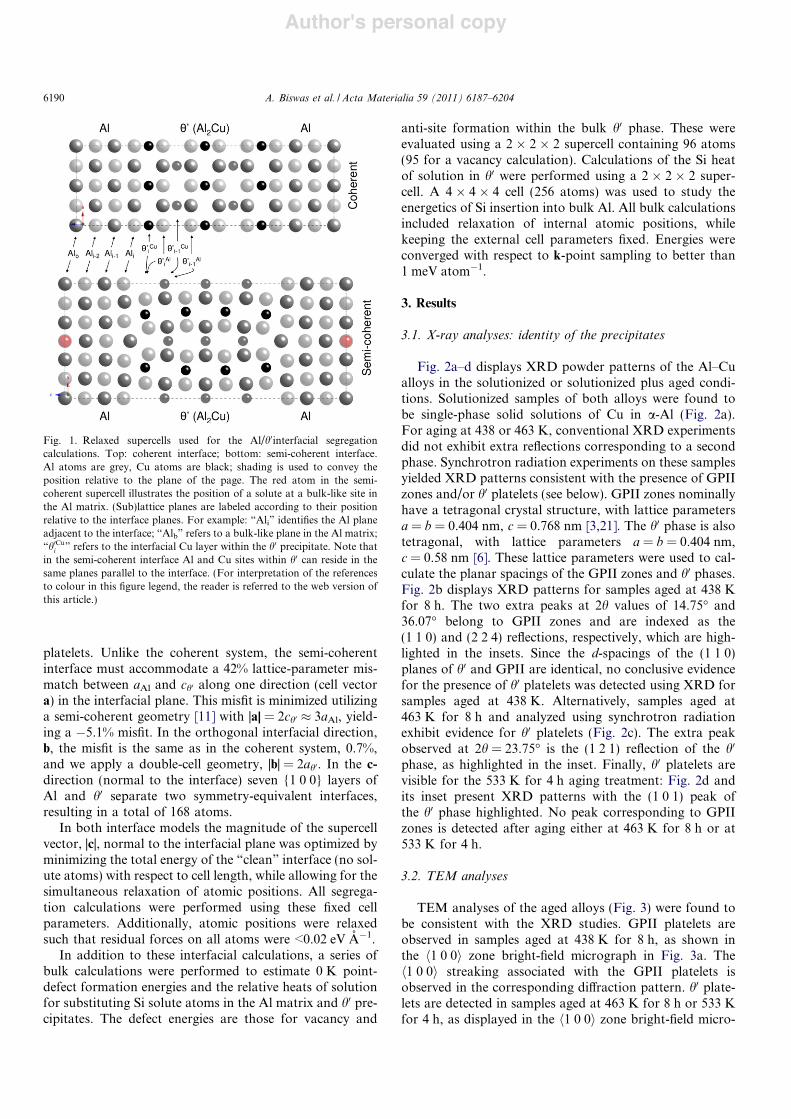
Fig. 4a and b compares the relevant portions of themass-to-charge state (m/n) spectra obtained using electricalor laser pulsing. Aluminum occurs in the singly charged(27Al1+) and doubly charged (27Al2+) states, but the Alhydrides (27Al1H+, 27Al1H%
2 ) that appear due to the pres-ence of residual hydrogen in the ultrahigh-vacuum samplechamber are always singly charged. The two Cu isotopes(63Cu1+ and 65Cu1+, not displayed) and their hydrides arealso present in the singly charged state. Of particular con-
cern is Si, whose major isotope in the singly charged state(28Si1+) may coincide with the singly charged Al hydridepeak (27Al1H+). We find that laser pulsing using2 nJ pulse"1 results in Si being evaporated only in the dou-bly charged state (28Si2+). This, and the absence of a dou-bly charged Al hydride peak, permits us to measure thebulk Si concentration utilizing the doubly charged Si peakat an m/n value of 14 (Fig. 4a). Neither the singly chargedAl hydride peaks nor the 28Si2+ peak can be resolvedemploying electrical pulsing. Furthermore, the proportionof 27Al2+ in the mass spectra is small employing laser puls-ing, presumably because of the smaller standing dc voltage.We therefore conclude that picosecond laser pulsing yieldsbetter mass resolving power (m/Dm) than does electricalpulsing.
None of the four isotopes of the impurity element Fe(present in samples fabricated from alloy B) are detectedin the mass spectra, either in the singly or doubly chargedstates, because Fe has a negligible solid solubility in Al(0.014 at. ppm at 503 K [52]). Iron, however, forms inter-metallic compounds with Al and it is di"cult to detect a
12 13 14 15
(110)! '(110)GPII
36
(224)GPII
(222)Al
0.0
0.1
0.2
0.3
0.4
0.5
2!, degree
(222)Al
Alloy B, 438 K, 8 h
(111)Al
(200)Al
(220)Al (311)Al
(b)
0.0
0.2
0.4
0.6
0.8
1.0
2!, degree
Inte
nsity
(arb
itrar
y un
it)
Alloy A, 463 K, 8 h
(111)Al
(200)Al (220)Al
(311)Al
(222)Al
22 23 24 25
(121)! '
(c)
0
5000
10000
15000
20000
2!, degree
Alloy B, 533 K, 4 h
(111)Al
(200)Al (220)Al
(311)Al
25 30
(101)! '
(d)
10 15 20 25 30 35
15 20 25 30 35 20 30 40 50 60 70 80
30 40 50 60 70 800
1000
2000
3000
4000Alloy B, solutionized
Inte
nsity
(arb
itrar
y un
it)
2!, degree
(111)Al (200)Al
(220)Al
(311)Al
(a)
Fig. 2. (a) Solutionized samples showing a single-phase solid solution of copper in a-Al; (b–d) representative di!raction patterns for samples aged at (i)438 K for 8 h, (ii) 463 K for 8 h and (iii) 533 K for 4 h, respectively. The insets highlight the reflections from the precipitates. (a and d) were obtained usinga conventional di!ractometer; synchrotron radiation was used for (b) and (c).
1 Although only the (1 2 1) reflection is shown in Fig. 2c, synchrotronradiation was able to detect both the (1 2 1) and (1 0 1) reflections in thissample. A conventional X-ray di!ractometer was used to analyze the533 K aged sample shown in Fig. 2d. This technique was capable ofdetecting only the (1 0 1) reflection.
A. Biswas et al. / Acta Materialia 59 (2011) 6187–6204 6191
Author's personal copy
small-volume fraction of an Fe intermetallic phase(s)employing APT.
3.3.1. Aging at 438 K for 8 hConsistent with the XRD and TEM measurements, thin
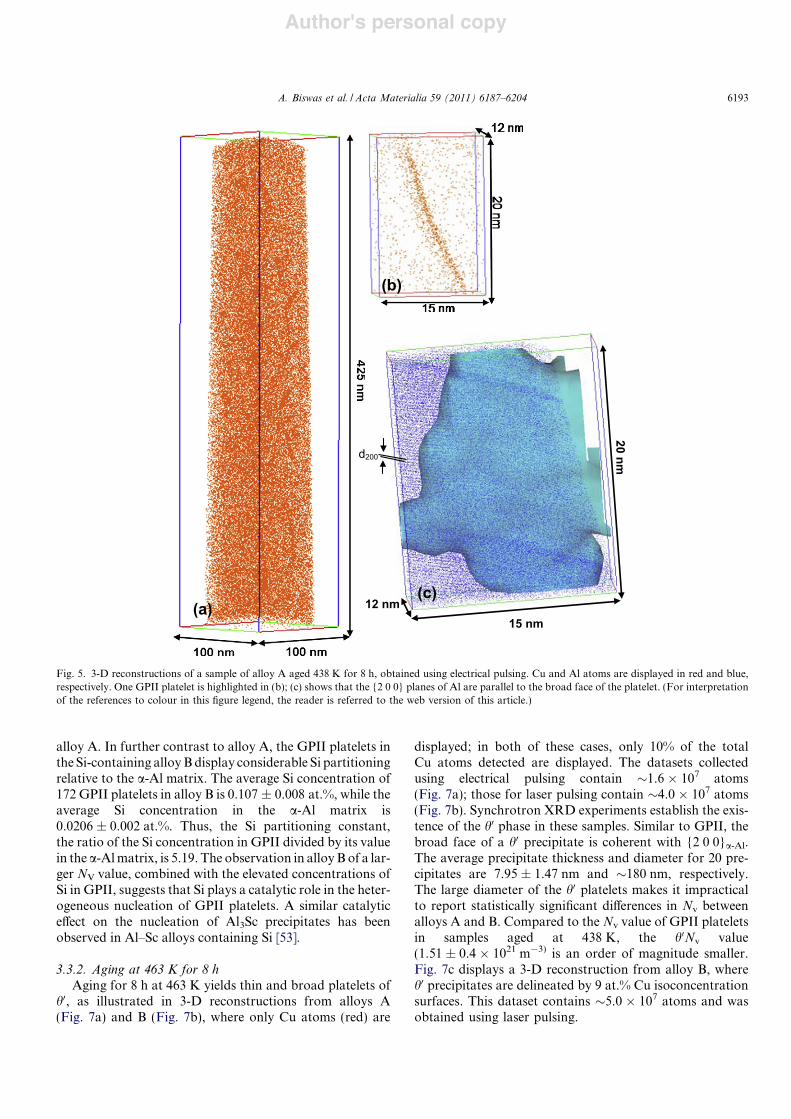
GPII platelets are observed with APT in samples aged at438 K for 8 h. The number density, Nv, of the GPII plate-lets in alloy A is Nv = 1.77 ± 0.1 # 1022 m"3; electrical andlaser pulsing experiments yield similar values of Nv. Fig. 5aexhibits a 3-D APT reconstruction of !9 # 107 atomsobtained from alloy A using electrical pulsing; only !105
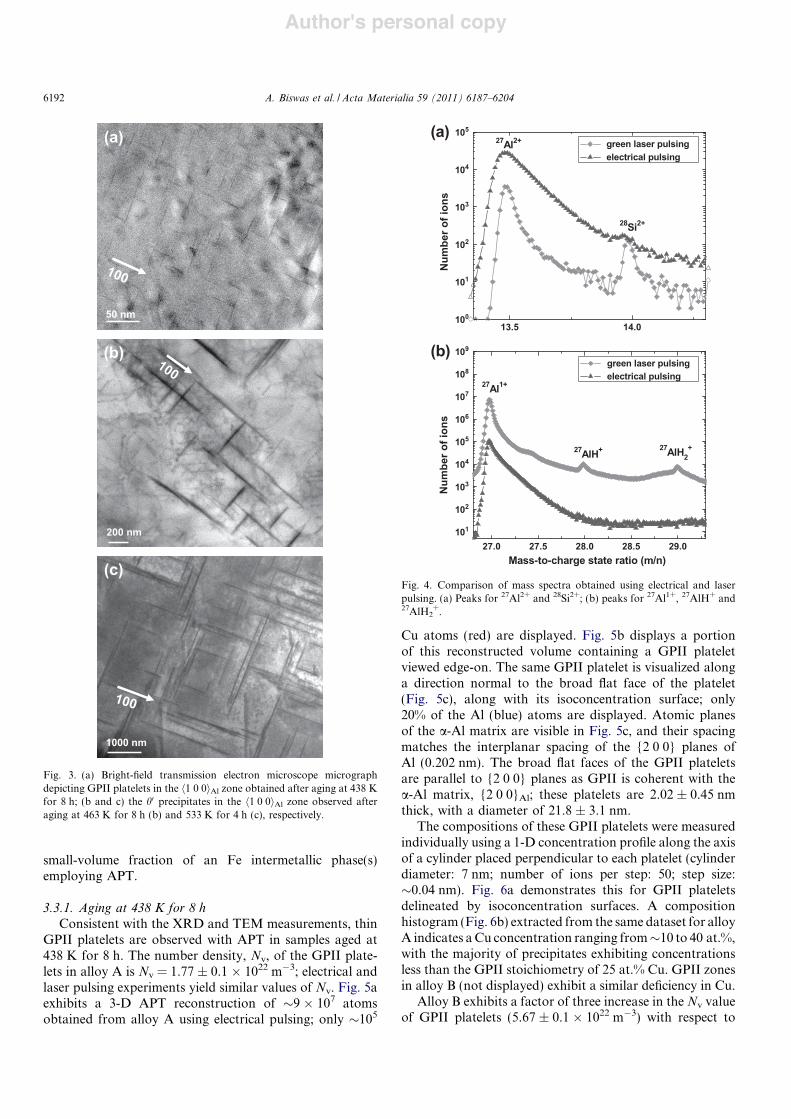
Cu atoms (red) are displayed. Fig. 5b displays a portionof this reconstructed volume containing a GPII plateletviewed edge-on. The same GPII platelet is visualized alonga direction normal to the broad flat face of the platelet(Fig. 5c), along with its isoconcentration surface; only20% of the Al (blue) atoms are displayed. Atomic planesof the a-Al matrix are visible in Fig. 5c, and their spacingmatches the interplanar spacing of the {2 0 0} planes ofAl (0.202 nm). The broad flat faces of the GPII plateletsare parallel to {2 0 0} planes as GPII is coherent with thea-Al matrix, {2 0 0}Al; these platelets are 2.02 ± 0.45 nmthick, with a diameter of 21.8 ± 3.1 nm.
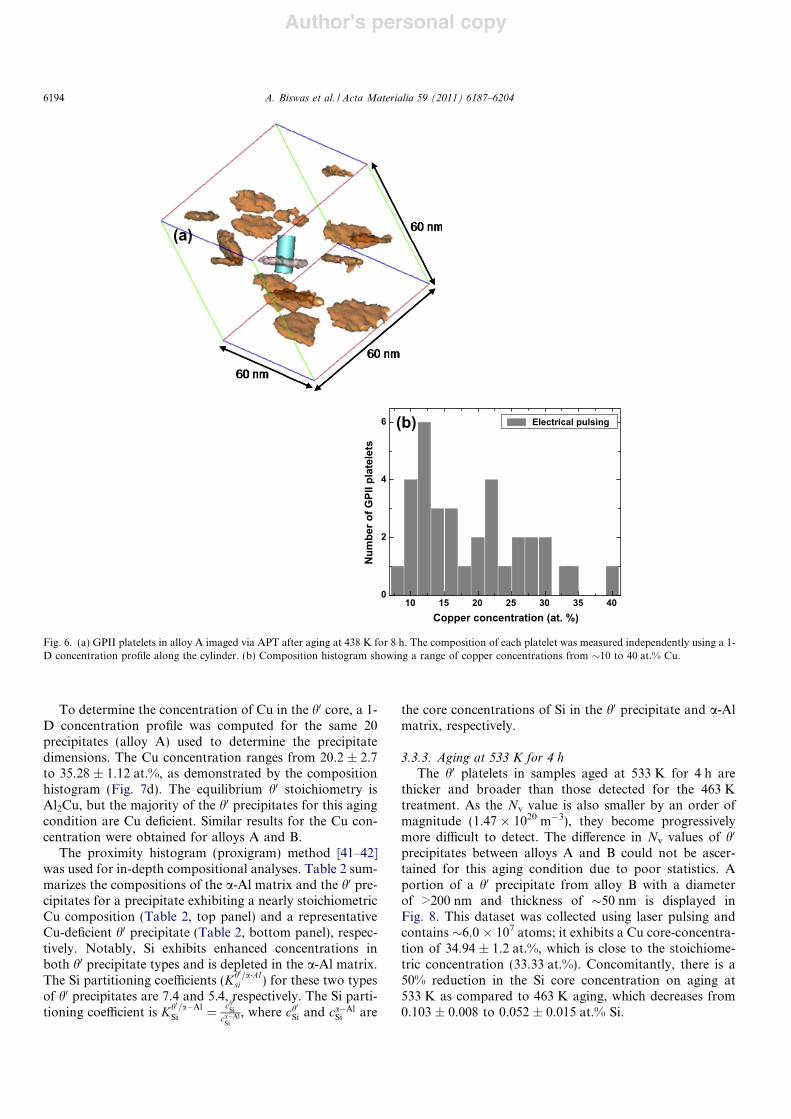
The compositions of these GPII platelets were measuredindividually using a 1-D concentration profile along the axisof a cylinder placed perpendicular to each platelet (cylinderdiameter: 7 nm; number of ions per step: 50; step size:!0.04 nm). Fig. 6a demonstrates this for GPII plateletsdelineated by isoconcentration surfaces. A compositionhistogram (Fig. 6b) extracted from the same dataset for alloyA indicates aCu concentration ranging from!10 to 40 at.%,with the majority of precipitates exhibiting concentrationsless than the GPII stoichiometry of 25 at.% Cu. GPII zonesin alloy B (not displayed) exhibit a similar deficiency in Cu.
Alloy B exhibits a factor of three increase in the Nv valueof GPII platelets (5.67 ± 0.1 # 1022 m"3) with respect to
1000 nm
(c)
100
200 nm
(b) 100
50 nm
(a)
100
Fig. 3. (a) Bright-field transmission electron microscope micrographdepicting GPII platelets in the h1 0 0iAl zone obtained after aging at 438 Kfor 8 h; (b and c) the h0 precipitates in the h1 0 0iAl zone observed afteraging at 463 K for 8 h (b) and 533 K for 4 h (c), respectively.
14.013.5100
101
102
103
104
105
green laser pulsingelectrical pulsing
28Si2+
Num
ber o
f ion
s
27Al2+(a)
27.0 27.5 28.0 28.5 29.0101
102
103
104
105
106
107
108
109
green laser pulsingelectrical pulsing
27AlH2+27AlH+
Num
ber o
f ion
s
Mass-to-charge state ratio (m/n)
27Al1+
(b)
Fig. 4. Comparison of mass spectra obtained using electrical and laserpulsing. (a) Peaks for 27Al2+ and 28Si2+; (b) peaks for 27Al1+, 27AlH+ and27AlH2
+.
6192 A. Biswas et al. / Acta Materialia 59 (2011) 6187–6204
Author's personal copy
alloy A. In further contrast to alloy A, the GPII platelets inthe Si-containing alloyBdisplay considerable Si partitioningrelative to the a-Al matrix. The average Si concentration of172 GPII platelets in alloy B is 0.107 ± 0.008 at.%, while theaverage Si concentration in the a-Al matrix is0.0206 ± 0.002 at.%. Thus, the Si partitioning constant,the ratio of the Si concentration in GPII divided by its valuein the a-Almatrix, is 5.19. The observation in alloy B of a lar-ger NV value, combined with the elevated concentrations ofSi in GPII, suggests that Si plays a catalytic role in the heter-ogeneous nucleation of GPII platelets. A similar catalytice!ect on the nucleation of Al3Sc precipitates has beenobserved in Al–Sc alloys containing Si [53].
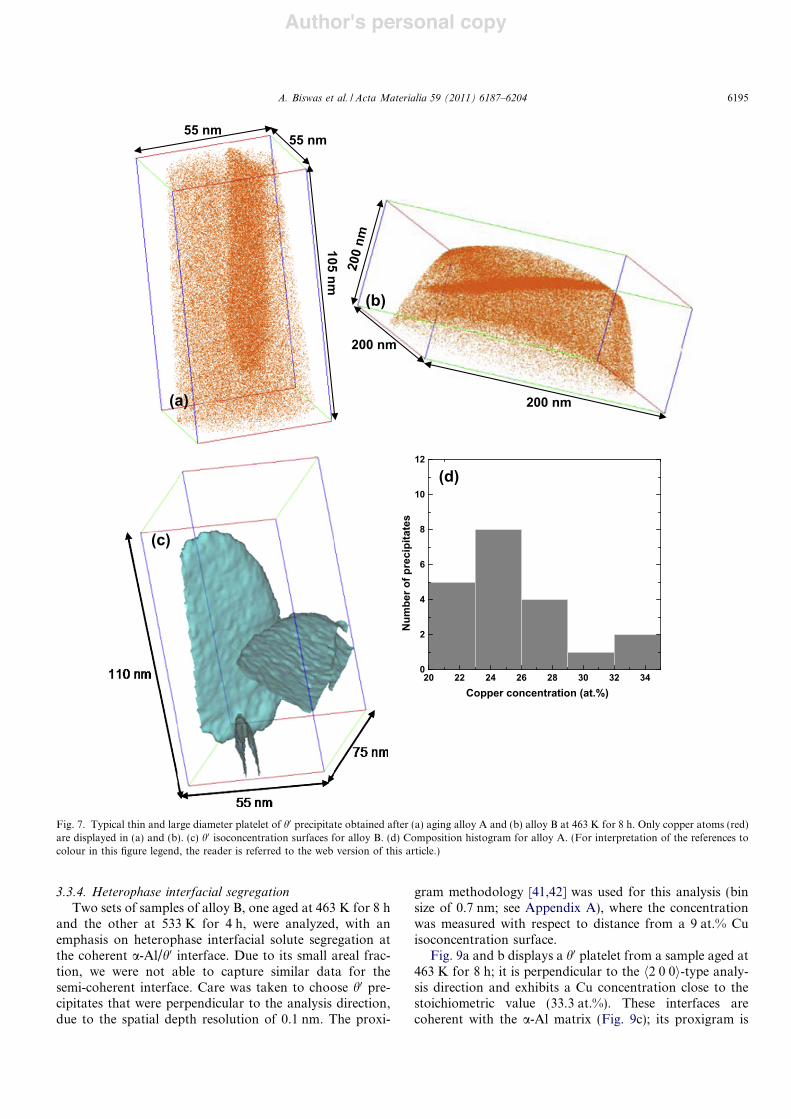
3.3.2. Aging at 463 K for 8 hAging for 8 h at 463 K yields thin and broad platelets of
h0, as illustrated in 3-D reconstructions from alloys A(Fig. 7a) and B (Fig. 7b), where only Cu atoms (red) are
displayed; in both of these cases, only 10% of the totalCu atoms detected are displayed. The datasets collectedusing electrical pulsing contain !1.6 # 107 atoms(Fig. 7a); those for laser pulsing contain !4.0 # 107 atoms(Fig. 7b). Synchrotron XRD experiments establish the exis-tence of the h0 phase in these samples. Similar to GPII, thebroad face of a h0 precipitate is coherent with {2 0 0}a-Al.The average precipitate thickness and diameter for 20 pre-cipitates are 7.95 ± 1.47 nm and !180 nm, respectively.The large diameter of the h0 platelets makes it impracticalto report statistically significant di!erences in Nv betweenalloys A and B. Compared to the Nv value of GPII plateletsin samples aged at 438 K, the h0Nv value(1.51 ± 0.4 # 1021 m"3) is an order of magnitude smaller.Fig. 7c displays a 3-D reconstruction from alloy B, whereh0 precipitates are delineated by 9 at.% Cu isoconcentrationsurfaces. This dataset contains !5.0 # 107 atoms and wasobtained using laser pulsing.
(b)
(a)(c)
15 nm12 nm
20 nmd200
Fig. 5. 3-D reconstructions of a sample of alloy A aged 438 K for 8 h, obtained using electrical pulsing. Cu and Al atoms are displayed in red and blue,respectively. One GPII platelet is highlighted in (b); (c) shows that the {2 0 0} planes of Al are parallel to the broad face of the platelet. (For interpretationof the references to colour in this figure legend, the reader is referred to the web version of this article.)
A. Biswas et al. / Acta Materialia 59 (2011) 6187–6204 6193
Author's personal copy
To determine the concentration of Cu in the h0 core, a 1-D concentration profile was computed for the same 20precipitates (alloy A) used to determine the precipitatedimensions. The Cu concentration ranges from 20.2 ± 2.7to 35.28 ± 1.12 at.%, as demonstrated by the compositionhistogram (Fig. 7d). The equilibrium h0 stoichiometry isAl2Cu, but the majority of the h0 precipitates for this agingcondition are Cu deficient. Similar results for the Cu con-centration were obtained for alloys A and B.
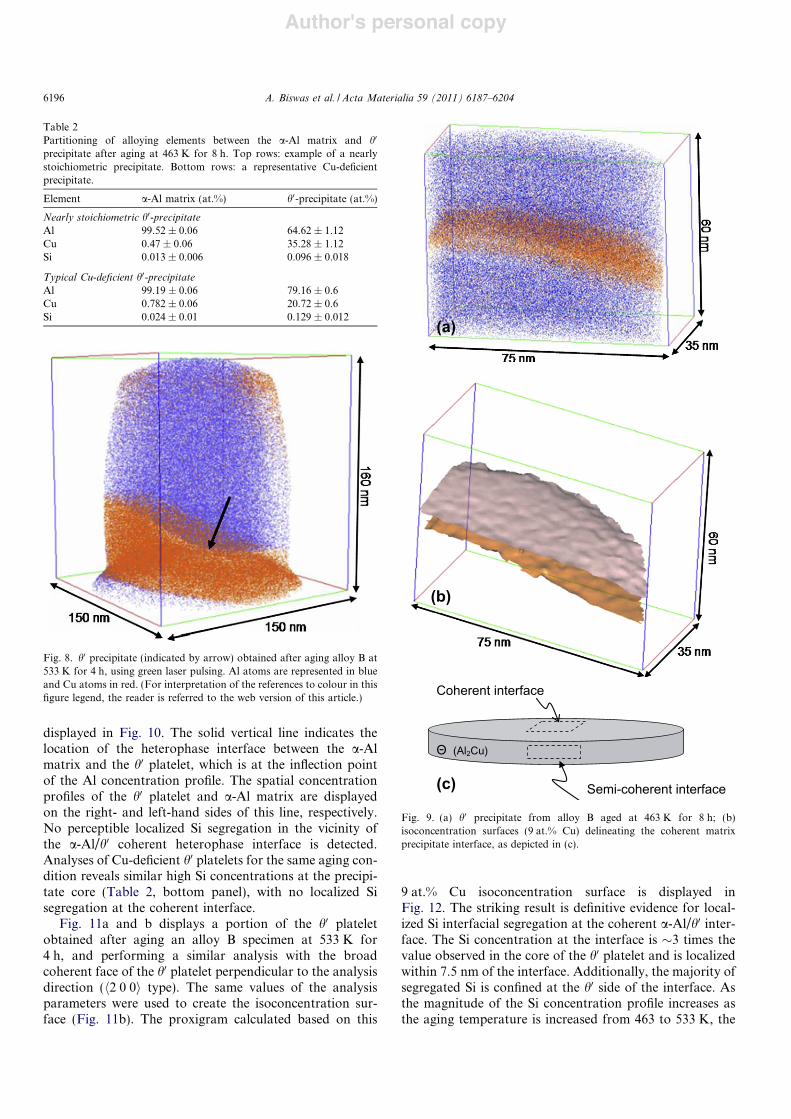
The proximity histogram (proxigram) method [41–42]was used for in-depth compositional analyses. Table 2 sum-marizes the compositions of the a-Al matrix and the h0 pre-cipitates for a precipitate exhibiting a nearly stoichiometricCu composition (Table 2, top panel) and a representativeCu-deficient h0 precipitate (Table 2, bottom panel), respec-tively. Notably, Si exhibits enhanced concentrations inboth h0 precipitate types and is depleted in the a-Al matrix.The Si partitioning coe"cients (Kh0=a-Al
si ) for these two typesof h0 precipitates are 7.4 and 5.4, respectively. The Si parti-tioning coe"cient is Kh0=a"Al
Si & ch0
Si
ca"AlSi
, where ch0
Si and ca"AlSi are
the core concentrations of Si in the h0 precipitate and a-Almatrix, respectively.
3.3.3. Aging at 533 K for 4 hThe h0 platelets in samples aged at 533 K for 4 h are
thicker and broader than those detected for the 463 Ktreatment. As the Nv value is also smaller by an order ofmagnitude (1.47 # 1020 m"3), they become progressivelymore di"cult to detect. The di!erence in Nv values of h0
precipitates between alloys A and B could not be ascer-tained for this aging condition due to poor statistics. Aportion of a h0 precipitate from alloy B with a diameterof >200 nm and thickness of !50 nm is displayed inFig. 8. This dataset was collected using laser pulsing andcontains !6.0 # 107 atoms; it exhibits a Cu core-concentra-tion of 34.94 ± 1.2 at.%, which is close to the stoichiome-tric concentration (33.33 at.%). Concomitantly, there is a50% reduction in the Si core concentration on aging at533 K as compared to 463 K aging, which decreases from0.103 ± 0.008 to 0.052 ± 0.015 at.% Si.
10 15 20 25 30 35 400
2
4
6
Num
ber o
f GPI
I pla
tele
ts
Copper concentration (at. %)
Electrical pulsing(b)
(a)
Fig. 6. (a) GPII platelets in alloy A imaged via APT after aging at 438 K for 8 h. The composition of each platelet was measured independently using a 1-D concentration profile along the cylinder. (b) Composition histogram showing a range of copper concentrations from !10 to 40 at.% Cu.
6194 A. Biswas et al. / Acta Materialia 59 (2011) 6187–6204
Author's personal copy
3.3.4. Heterophase interfacial segregationTwo sets of samples of alloy B, one aged at 463 K for 8 h
and the other at 533 K for 4 h, were analyzed, with anemphasis on heterophase interfacial solute segregation atthe coherent a-Al/h0 interface. Due to its small areal frac-tion, we were not able to capture similar data for thesemi-coherent interface. Care was taken to choose h0 pre-cipitates that were perpendicular to the analysis direction,due to the spatial depth resolution of 0.1 nm. The proxi-
gram methodology [41,42] was used for this analysis (binsize of 0.7 nm; see Appendix A), where the concentrationwas measured with respect to distance from a 9 at.% Cuisoconcentration surface.
Fig. 9a and b displays a h0 platelet from a sample aged at463 K for 8 h; it is perpendicular to the h2 0 0i-type analy-sis direction and exhibits a Cu concentration close to thestoichiometric value (33.3 at.%). These interfaces arecoherent with the a-Al matrix (Fig. 9c); its proxigram is
(c)
105 nm
55 nm55 nm
(a)
200 nm20
0 nm
200 nm
(b)
20 22 24 26 28 30 32 340
2
4
6
8
10
12
Num
ber o
f pre
cipi
tate
s
Copper concentration (at.%)
(d)
Fig. 7. Typical thin and large diameter platelet of h0 precipitate obtained after (a) aging alloy A and (b) alloy B at 463 K for 8 h. Only copper atoms (red)are displayed in (a) and (b). (c) h0 isoconcentration surfaces for alloy B. (d) Composition histogram for alloy A. (For interpretation of the references tocolour in this figure legend, the reader is referred to the web version of this article.)
A. Biswas et al. / Acta Materialia 59 (2011) 6187–6204 6195
Author's personal copy
displayed in Fig. 10. The solid vertical line indicates thelocation of the heterophase interface between the a-Almatrix and the h0 platelet, which is at the inflection pointof the Al concentration profile. The spatial concentrationprofiles of the h0 platelet and a-Al matrix are displayedon the right- and left-hand sides of this line, respectively.No perceptible localized Si segregation in the vicinity ofthe a-Al/h0 coherent heterophase interface is detected.Analyses of Cu-deficient h0 platelets for the same aging con-dition reveals similar high Si concentrations at the precipi-tate core (Table 2, bottom panel), with no localized Sisegregation at the coherent interface.
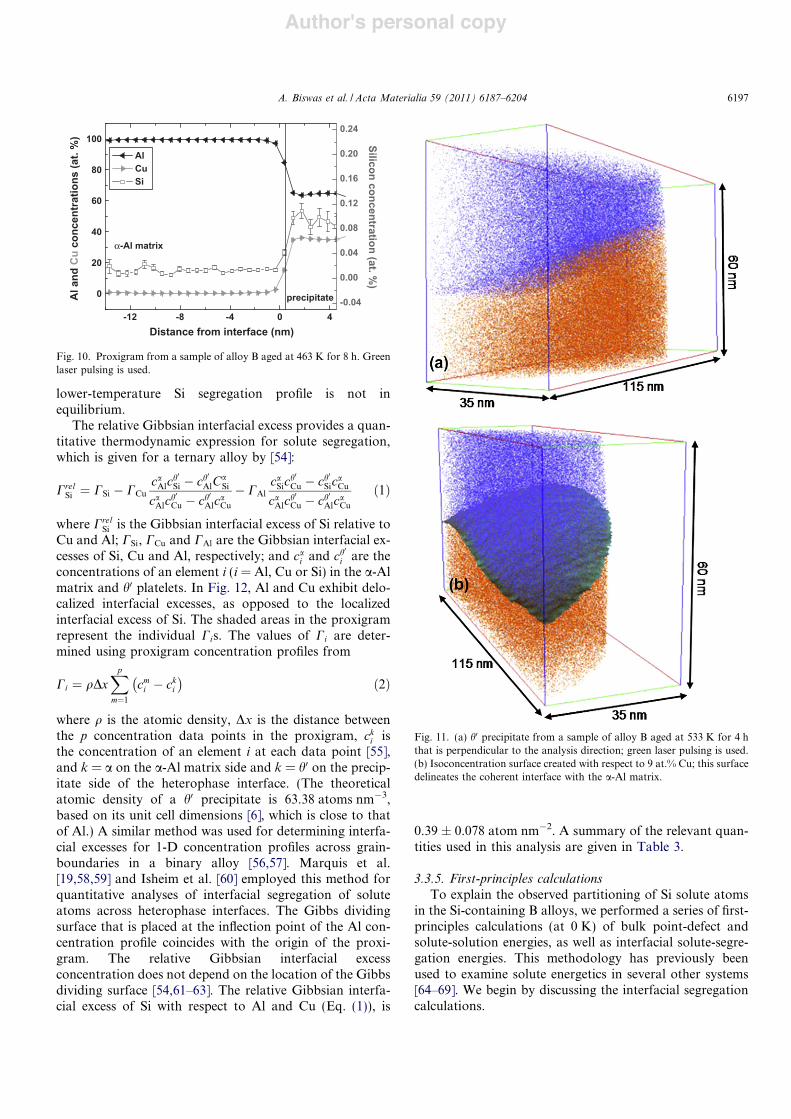
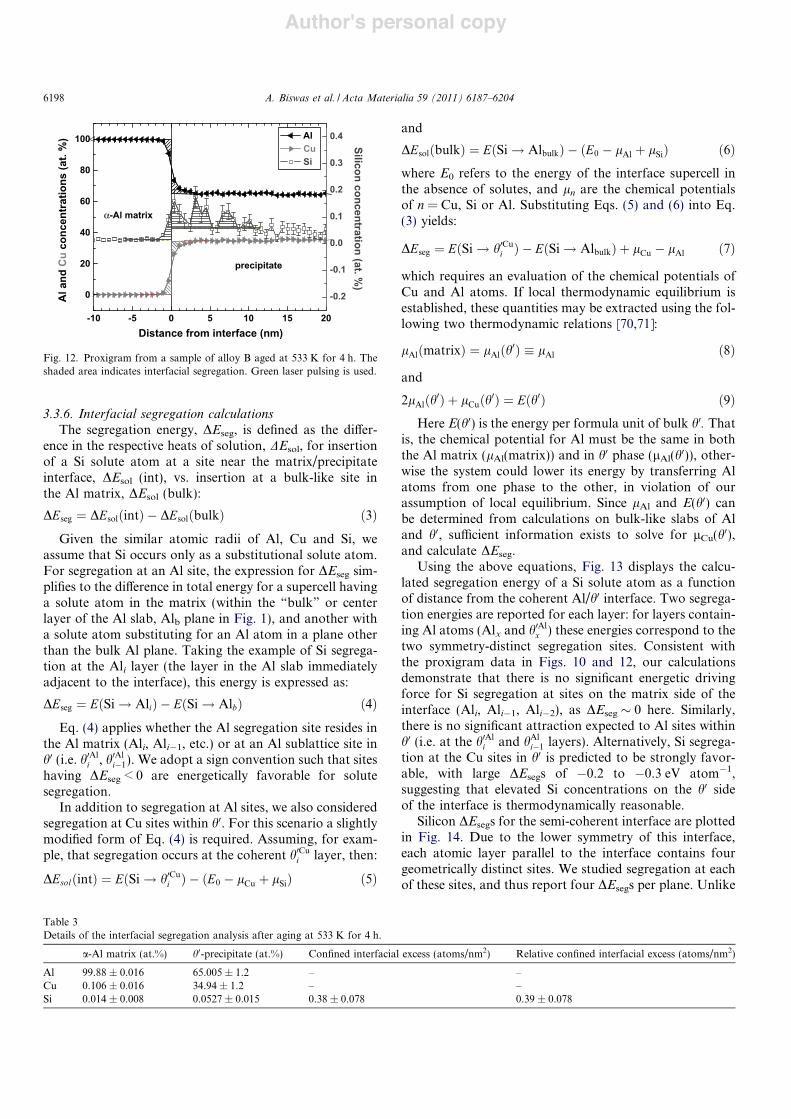
Fig. 11a and b displays a portion of the h0 plateletobtained after aging an alloy B specimen at 533 K for4 h, and performing a similar analysis with the broadcoherent face of the h0 platelet perpendicular to the analysisdirection (h2 0 0i type). The same values of the analysisparameters were used to create the isoconcentration sur-face (Fig. 11b). The proxigram calculated based on this
9 at.% Cu isoconcentration surface is displayed inFig. 12. The striking result is definitive evidence for local-ized Si interfacial segregation at the coherent a-Al/h0 inter-face. The Si concentration at the interface is !3 times thevalue observed in the core of the h0 platelet and is localizedwithin 7.5 nm of the interface. Additionally, the majority ofsegregated Si is confined at the h0 side of the interface. Asthe magnitude of the Si concentration profile increases asthe aging temperature is increased from 463 to 533 K, the
Table 2Partitioning of alloying elements between the a-Al matrix and h0
precipitate after aging at 463 K for 8 h. Top rows: example of a nearlystoichiometric precipitate. Bottom rows: a representative Cu-deficientprecipitate.
Element a-Al matrix (at.%) h0-precipitate (at.%)
Nearly stoichiometric h0-precipitateAl 99.52 ± 0.06 64.62 ± 1.12Cu 0.47 ± 0.06 35.28 ± 1.12Si 0.013 ± 0.006 0.096 ± 0.018
Typical Cu-deficient h0-precipitateAl 99.19 ± 0.06 79.16 ± 0.6Cu 0.782 ± 0.06 20.72 ± 0.6Si 0.024 ± 0.01 0.129 ± 0.012
Fig. 8. h0 precipitate (indicated by arrow) obtained after aging alloy B at533 K for 4 h, using green laser pulsing. Al atoms are represented in blueand Cu atoms in red. (For interpretation of the references to colour in thisfigure legend, the reader is referred to the web version of this article.)
(a)
(b)
! (Al2Cu)
Coherent interface
Semi-coherent interface(c)
Fig. 9. (a) h0 precipitate from alloy B aged at 463 K for 8 h; (b)isoconcentration surfaces (9 at.% Cu) delineating the coherent matrixprecipitate interface, as depicted in (c).
6196 A. Biswas et al. / Acta Materialia 59 (2011) 6187–6204
Author's personal copy
lower-temperature Si segregation profile is not inequilibrium.
The relative Gibbsian interfacial excess provides a quan-titative thermodynamic expression for solute segregation,which is given for a ternary alloy by [54]:
CrelSi & CSi " CCu
caAlch0Si " ch
0
AlCaSi
caAlch0Cu " ch
0
AlcaCu
" CAlcaSic
h0Cu " ch
0
SicaCu
caAlch0Cu " ch
0
AlcaCu
'1(
where CrelSi is the Gibbsian interfacial excess of Si relative to
Cu and Al; CSi, CCu and CAl are the Gibbsian interfacial ex-cesses of Si, Cu and Al, respectively; and cai and ch
0
i are theconcentrations of an element i (i = Al, Cu or Si) in the a-Almatrix and h0 platelets. In Fig. 12, Al and Cu exhibit delo-calized interfacial excesses, as opposed to the localizedinterfacial excess of Si. The shaded areas in the proxigramrepresent the individual Cis. The values of Ci are deter-mined using proxigram concentration profiles from
Ci & qDxXp
m&1
cmi " cki" #
'2(
where q is the atomic density, Dx is the distance betweenthe p concentration data points in the proxigram, cki isthe concentration of an element i at each data point [55],and k = a on the a-Al matrix side and k = h0 on the precip-itate side of the heterophase interface. (The theoreticalatomic density of a h0 precipitate is 63.38 atoms nm"3,based on its unit cell dimensions [6], which is close to thatof Al.) A similar method was used for determining interfa-cial excesses for 1-D concentration profiles across grain-boundaries in a binary alloy [56,57]. Marquis et al.[19,58,59] and Isheim et al. [60] employed this method forquantitative analyses of interfacial segregation of soluteatoms across heterophase interfaces. The Gibbs dividingsurface that is placed at the inflection point of the Al con-centration profile coincides with the origin of the proxi-gram. The relative Gibbsian interfacial excessconcentration does not depend on the location of the Gibbsdividing surface [54,61–63]. The relative Gibbsian interfa-cial excess of Si with respect to Al and Cu (Eq. (1)), is
0.39 ± 0.078 atom nm"2. A summary of the relevant quan-tities used in this analysis are given in Table 3.
3.3.5. First-principles calculationsTo explain the observed partitioning of Si solute atoms
in the Si-containing B alloys, we performed a series of first-principles calculations (at 0 K) of bulk point-defect andsolute-solution energies, as well as interfacial solute-segre-gation energies. This methodology has previously beenused to examine solute energetics in several other systems[64–69]. We begin by discussing the interfacial segregationcalculations.
-12 -8 -4 0 4
0
20
40
60
80
100
"-Al matrix
precipitateAl a
nd C
u co
ncen
tratio
ns (a
t. %
)
AlCuSi
Distance from interface (nm)
-0.04
0.00
0.04
0.08
0.12
0.16
0.20
0.24
Silicon concentration (at. %)
Fig. 10. Proxigram from a sample of alloy B aged at 463 K for 8 h. Greenlaser pulsing is used.
Fig. 11. (a) h0 precipitate from a sample of alloy B aged at 533 K for 4 hthat is perpendicular to the analysis direction; green laser pulsing is used.(b) Isoconcentration surface created with respect to 9 at.% Cu; this surfacedelineates the coherent interface with the a-Al matrix.
A. Biswas et al. / Acta Materialia 59 (2011) 6187–6204 6197
Author's personal copy
3.3.6. Interfacial segregation calculationsThe segregation energy, DEseg, is defined as the di!er-
ence in the respective heats of solution, DEsol, for insertionof a Si solute atom at a site near the matrix/precipitateinterface, DEsol (int), vs. insertion at a bulk-like site inthe Al matrix, DEsol (bulk):
DEseg & DEsol'int( " DEsol'bulk( '3(
Given the similar atomic radii of Al, Cu and Si, weassume that Si occurs only as a substitutional solute atom.For segregation at an Al site, the expression for DEseg sim-plifies to the di!erence in total energy for a supercell havinga solute atom in the matrix (within the “bulk” or centerlayer of the Al slab, Alb plane in Fig. 1), and another witha solute atom substituting for an Al atom in a plane otherthan the bulk Al plane. Taking the example of Si segrega-tion at the Ali layer (the layer in the Al slab immediatelyadjacent to the interface), this energy is expressed as:
DEseg & E'Si ! Ali( " E'Si ! Alb( '4(
Eq. (4) applies whether the Al segregation site resides inthe Al matrix (Ali, Ali"1, etc.) or at an Al sublattice site inh0 (i.e. h0Al
i , h0Ali"1). We adopt a sign convention such that sites
having DEseg < 0 are energetically favorable for solutesegregation.
In addition to segregation at Al sites, we also consideredsegregation at Cu sites within h0. For this scenario a slightlymodified form of Eq. (4) is required. Assuming, for exam-ple, that segregation occurs at the coherent h0Cui layer, then:
DEsol'int( & E'Si ! h0Cui ( " 'E0 " lCu % lSi( '5(
and
DEsol'bulk( & E'Si ! Albulk( " 'E0 " lAl % lSi( '6(
where E0 refers to the energy of the interface supercell inthe absence of solutes, and ln are the chemical potentialsof n = Cu, Si or Al. Substituting Eqs. (5) and (6) into Eq.(3) yields:
DEseg & E'Si ! h0Cui ( " E'Si ! Albulk( % lCu " lAl '7(
which requires an evaluation of the chemical potentials ofCu and Al atoms. If local thermodynamic equilibrium isestablished, these quantities may be extracted using the fol-lowing two thermodynamic relations [70,71]:
lAl'matrix( & lAl'h0( ) lAl '8(
and
2lAl'h0( % lCu'h
0( & E'h0( '9(
Here E(h0) is the energy per formula unit of bulk h0. Thatis, the chemical potential for Al must be the same in boththe Al matrix (lAl(matrix)) and in h0 phase (lAl(h0)), other-wise the system could lower its energy by transferring Alatoms from one phase to the other, in violation of ourassumption of local equilibrium. Since lAl and E(h0) canbe determined from calculations on bulk-like slabs of Aland h0, su"cient information exists to solve for lCu(h0),and calculate DEseg.
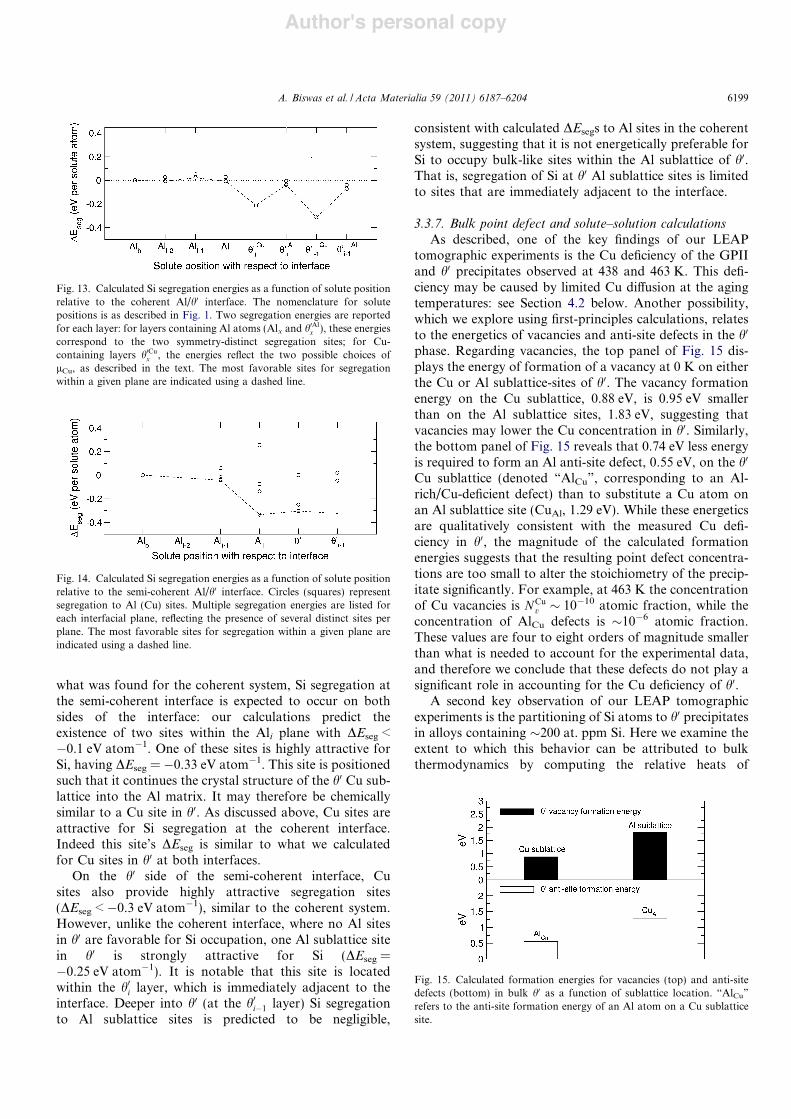
Using the above equations, Fig. 13 displays the calcu-lated segregation energy of a Si solute atom as a functionof distance from the coherent Al/h0 interface. Two segrega-tion energies are reported for each layer: for layers contain-ing Al atoms (Alx and h0Al
x ) these energies correspond to thetwo symmetry-distinct segregation sites. Consistent withthe proxigram data in Figs. 10 and 12, our calculationsdemonstrate that there is no significant energetic drivingforce for Si segregation at sites on the matrix side of theinterface (Ali, Ali"1, Ali"2), as DEseg ! 0 here. Similarly,there is no significant attraction expected to Al sites withinh0 (i.e. at the h0Al
i and hAli"1 layers). Alternatively, Si segrega-
tion at the Cu sites in h0 is predicted to be strongly favor-able, with large DEsegs of "0.2 to "0.3 eV atom"1,suggesting that elevated Si concentrations on the h0 sideof the interface is thermodynamically reasonable.
Silicon DEsegs for the semi-coherent interface are plottedin Fig. 14. Due to the lower symmetry of this interface,each atomic layer parallel to the interface contains fourgeometrically distinct sites. We studied segregation at eachof these sites, and thus report four DEsegs per plane. Unlike
-10 -5 0 5 10 15 20
0
20
40
60
80
100 AlCuSi
Distance from interface (nm)
"-Al matrix
precipitate
-0.2
-0.1
0.0
0.1
0.2
0.3
0.4
Al a
nd C
u co
ncen
tratio
ns (a
t. %
) Silicon concentration (at. %)
Fig. 12. Proxigram from a sample of alloy B aged at 533 K for 4 h. Theshaded area indicates interfacial segregation. Green laser pulsing is used.
Table 3Details of the interfacial segregation analysis after aging at 533 K for 4 h.
a-Al matrix (at.%) h0-precipitate (at.%) Confined interfacial excess (atoms/nm2) Relative confined interfacial excess (atoms/nm2)
Al 99.88 ± 0.016 65.005 ± 1.2 – –Cu 0.106 ± 0.016 34.94 ± 1.2 – –Si 0.014 ± 0.008 0.0527 ± 0.015 0.38 ± 0.078 0.39 ± 0.078
6198 A. Biswas et al. / Acta Materialia 59 (2011) 6187–6204
Author's personal copy
what was found for the coherent system, Si segregation atthe semi-coherent interface is expected to occur on bothsides of the interface: our calculations predict theexistence of two sites within the Ali plane with DEseg <"0.1 eV atom"1. One of these sites is highly attractive forSi, having DEseg = "0.33 eV atom"1. This site is positionedsuch that it continues the crystal structure of the h0 Cu sub-lattice into the Al matrix. It may therefore be chemicallysimilar to a Cu site in h0. As discussed above, Cu sites areattractive for Si segregation at the coherent interface.Indeed this site’s DEseg is similar to what we calculatedfor Cu sites in h0 at both interfaces.
On the h0 side of the semi-coherent interface, Cusites also provide highly attractive segregation sites(DEseg < "0.3 eV atom"1), similar to the coherent system.However, unlike the coherent interface, where no Al sitesin h0 are favorable for Si occupation, one Al sublattice sitein h0 is strongly attractive for Si (DEseg ="0.25 eV atom"1). It is notable that this site is locatedwithin the h0i layer, which is immediately adjacent to theinterface. Deeper into h0 (at the h0i"1 layer) Si segregationto Al sublattice sites is predicted to be negligible,
consistent with calculated DEsegs to Al sites in the coherentsystem, suggesting that it is not energetically preferable forSi to occupy bulk-like sites within the Al sublattice of h0.That is, segregation of Si at h0 Al sublattice sites is limitedto sites that are immediately adjacent to the interface.
3.3.7. Bulk point defect and solute–solution calculationsAs described, one of the key findings of our LEAP
tomographic experiments is the Cu deficiency of the GPIIand h0 precipitates observed at 438 and 463 K. This defi-ciency may be caused by limited Cu di!usion at the agingtemperatures: see Section 4.2 below. Another possibility,which we explore using first-principles calculations, relatesto the energetics of vacancies and anti-site defects in the h0
phase. Regarding vacancies, the top panel of Fig. 15 dis-plays the energy of formation of a vacancy at 0 K on eitherthe Cu or Al sublattice-sites of h0. The vacancy formationenergy on the Cu sublattice, 0.88 eV, is 0.95 eV smallerthan on the Al sublattice sites, 1.83 eV, suggesting thatvacancies may lower the Cu concentration in h0. Similarly,the bottom panel of Fig. 15 reveals that 0.74 eV less energyis required to form an Al anti-site defect, 0.55 eV, on the h0
Cu sublattice (denoted “AlCu”, corresponding to an Al-rich/Cu-deficient defect) than to substitute a Cu atom onan Al sublattice site (CuAl, 1.29 eV). While these energeticsare qualitatively consistent with the measured Cu defi-ciency in h0, the magnitude of the calculated formationenergies suggests that the resulting point defect concentra-tions are too small to alter the stoichiometry of the precip-itate significantly. For example, at 463 K the concentrationof Cu vacancies is NCu
v ! 10"10 atomic fraction, while theconcentration of AlCu defects is !10"6 atomic fraction.These values are four to eight orders of magnitude smallerthan what is needed to account for the experimental data,and therefore we conclude that these defects do not play asignificant role in accounting for the Cu deficiency of h0.
A second key observation of our LEAP tomographicexperiments is the partitioning of Si atoms to h0 precipitatesin alloys containing !200 at. ppm Si. Here we examine theextent to which this behavior can be attributed to bulkthermodynamics by computing the relative heats of
Fig. 13. Calculated Si segregation energies as a function of solute positionrelative to the coherent Al/h0 interface. The nomenclature for solutepositions is as described in Fig. 1. Two segregation energies are reportedfor each layer: for layers containing Al atoms (Alx and h0Al
x ), these energiescorrespond to the two symmetry-distinct segregation sites; for Cu-containing layers h0Cux , the energies reflect the two possible choices oflCu, as described in the text. The most favorable sites for segregationwithin a given plane are indicated using a dashed line.
Fig. 14. Calculated Si segregation energies as a function of solute positionrelative to the semi-coherent Al/h0 interface. Circles (squares) representsegregation to Al (Cu) sites. Multiple segregation energies are listed foreach interfacial plane, reflecting the presence of several distinct sites perplane. The most favorable sites for segregation within a given plane areindicated using a dashed line.
Fig. 15. Calculated formation energies for vacancies (top) and anti-sitedefects (bottom) in bulk h0 as a function of sublattice location. “AlCu”refers to the anti-site formation energy of an Al atom on a Cu sublatticesite.
A. Biswas et al. / Acta Materialia 59 (2011) 6187–6204 6199
Author's personal copy
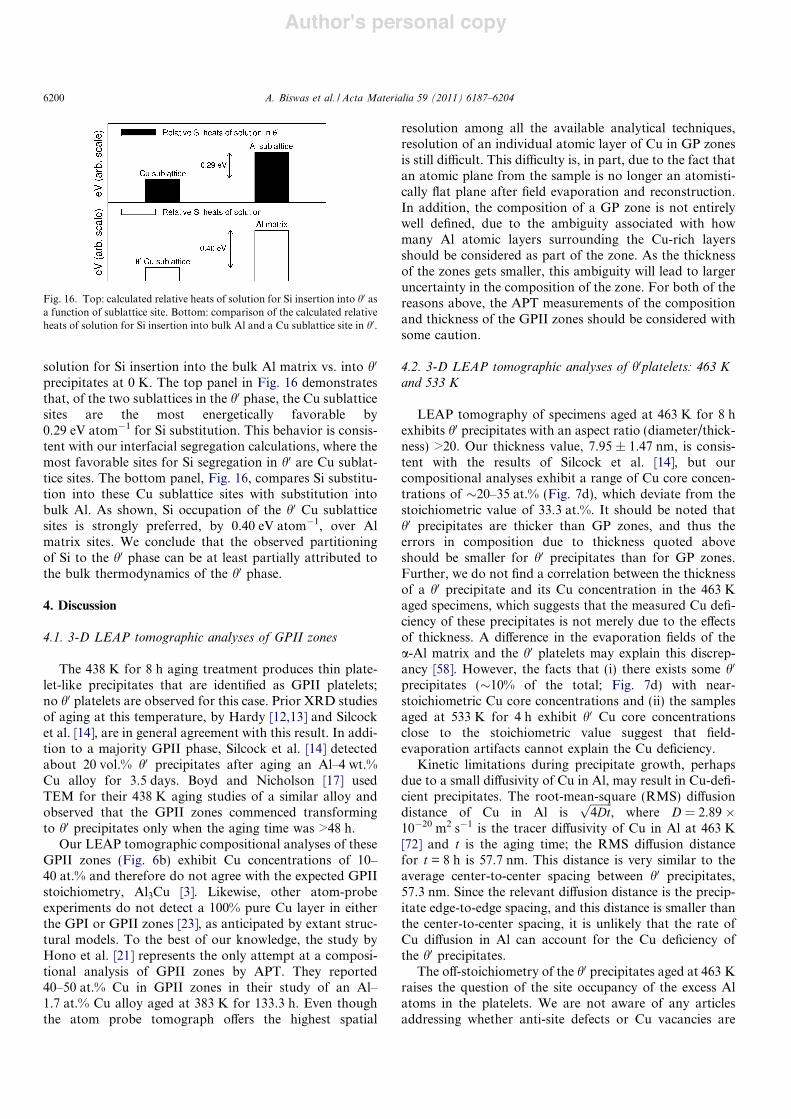
solution for Si insertion into the bulk Al matrix vs. into h0
precipitates at 0 K. The top panel in Fig. 16 demonstratesthat, of the two sublattices in the h0 phase, the Cu sublatticesites are the most energetically favorable by0.29 eV atom"1 for Si substitution. This behavior is consis-tent with our interfacial segregation calculations, where themost favorable sites for Si segregation in h0 are Cu sublat-tice sites. The bottom panel, Fig. 16, compares Si substitu-tion into these Cu sublattice sites with substitution intobulk Al. As shown, Si occupation of the h0 Cu sublatticesites is strongly preferred, by 0.40 eV atom"1, over Almatrix sites. We conclude that the observed partitioningof Si to the h0 phase can be at least partially attributed tothe bulk thermodynamics of the h0 phase.
4. Discussion
4.1. 3-D LEAP tomographic analyses of GPII zones
The 438 K for 8 h aging treatment produces thin plate-let-like precipitates that are identified as GPII platelets;no h0 platelets are observed for this case. Prior XRD studiesof aging at this temperature, by Hardy [12,13] and Silcocket al. [14], are in general agreement with this result. In addi-tion to a majority GPII phase, Silcock et al. [14] detectedabout 20 vol.% h0 precipitates after aging an Al–4 wt.%Cu alloy for 3.5 days. Boyd and Nicholson [17] usedTEM for their 438 K aging studies of a similar alloy andobserved that the GPII zones commenced transformingto h0 precipitates only when the aging time was >48 h.
Our LEAP tomographic compositional analyses of theseGPII zones (Fig. 6b) exhibit Cu concentrations of 10–40 at.% and therefore do not agree with the expected GPIIstoichiometry, Al3Cu [3]. Likewise, other atom-probeexperiments do not detect a 100% pure Cu layer in eitherthe GPI or GPII zones [23], as anticipated by extant struc-tural models. To the best of our knowledge, the study byHono et al. [21] represents the only attempt at a composi-tional analysis of GPII zones by APT. They reported40–50 at.% Cu in GPII zones in their study of an Al–1.7 at.% Cu alloy aged at 383 K for 133.3 h. Even thoughthe atom probe tomograph o!ers the highest spatial
resolution among all the available analytical techniques,resolution of an individual atomic layer of Cu in GP zonesis still di"cult. This di"culty is, in part, due to the fact thatan atomic plane from the sample is no longer an atomisti-cally flat plane after field evaporation and reconstruction.In addition, the composition of a GP zone is not entirelywell defined, due to the ambiguity associated with howmany Al atomic layers surrounding the Cu-rich layersshould be considered as part of the zone. As the thicknessof the zones gets smaller, this ambiguity will lead to largeruncertainty in the composition of the zone. For both of thereasons above, the APT measurements of the compositionand thickness of the GPII zones should be considered withsome caution.
4.2. 3-D LEAP tomographic analyses of h0platelets: 463 Kand 533 K
LEAP tomography of specimens aged at 463 K for 8 hexhibits h0 precipitates with an aspect ratio (diameter/thick-ness) >20. Our thickness value, 7.95 ± 1.47 nm, is consis-tent with the results of Silcock et al. [14], but ourcompositional analyses exhibit a range of Cu core concen-trations of !20–35 at.% (Fig. 7d), which deviate from thestoichiometric value of 33.3 at.%. It should be noted thath0 precipitates are thicker than GP zones, and thus theerrors in composition due to thickness quoted aboveshould be smaller for h0 precipitates than for GP zones.Further, we do not find a correlation between the thicknessof a h0 precipitate and its Cu concentration in the 463 Kaged specimens, which suggests that the measured Cu defi-ciency of these precipitates is not merely due to the e!ectsof thickness. A di!erence in the evaporation fields of thea-Al matrix and the h0 platelets may explain this discrep-ancy [58]. However, the facts that (i) there exists some h0
precipitates (!10% of the total; Fig. 7d) with near-stoichiometric Cu core concentrations and (ii) the samplesaged at 533 K for 4 h exhibit h0 Cu core concentrationsclose to the stoichiometric value suggest that field-evaporation artifacts cannot explain the Cu deficiency.
Kinetic limitations during precipitate growth, perhapsdue to a small di!usivity of Cu in Al, may result in Cu-defi-cient precipitates. The root-mean-square (RMS) di!usiondistance of Cu in Al is
!!!!!!!!4Dt
p, where D = 2.89 #
10"20 m2 s"1 is the tracer di!usivity of Cu in Al at 463 K[72] and t is the aging time; the RMS di!usion distancefor t = 8 h is 57.7 nm. This distance is very similar to theaverage center-to-center spacing between h0 precipitates,57.3 nm. Since the relevant di!usion distance is the precip-itate edge-to-edge spacing, and this distance is smaller thanthe center-to-center spacing, it is unlikely that the rate ofCu di!usion in Al can account for the Cu deficiency ofthe h0 precipitates.
The o!-stoichiometry of the h0 precipitates aged at 463 Kraises the question of the site occupancy of the excess Alatoms in the platelets. We are not aware of any articlesaddressing whether anti-site defects or Cu vacancies are
Fig. 16. Top: calculated relative heats of solution for Si insertion into h0 asa function of sublattice site. Bottom: comparison of the calculated relativeheats of solution for Si insertion into bulk Al and a Cu sublattice site in h0.
6200 A. Biswas et al. / Acta Materialia 59 (2011) 6187–6204

Author's personal copy
energetically favorable in the h0 phase. Furthermore, noinformation is available regarding the ability of h0 precipi-tates to dissolve Al or Cu. Our first-principles calculationsaddress these issues directly. They indicate that the Cu sub-lattice sites are the most energetically favorable sites forvacancy formation in h0, and that the formation of Alanti-sites on the Cu sublattice (AlCu) is more favorable thanthe formation of point defects of the opposite sense (CuAl).Although these point-defect types would appear to favor aCu-deficient/Al-rich h0 stoichiometry, their large formationenergies suggest that they do not have a significant impacton the stoichiometry. Solubility data for Si in h0 is alsounavailable. Based on our first-principles solute-solutioncalculations, we expect that in Si-containing alloys the Siatoms strongly prefer Cu sublattice sites in h0 precipitatesover Al sites in either the Al matrix or the h0 precipitates.Thus, Si will compete with Cu to occupy Cu sublattice sitesin h0, thereby contributing to the observed Cu deficiency ofh0 in Si-containing alloys.
Although Si is one of the main elements in commercialh0-precipitation-strengthened Al–Cu alloys [30,73,74], thereare few studies on the role of Si in the precipitation behav-ior of the h0 phase in Al–Cu alloys. Mitlin et al. [75] inves-tigated the e!ect of Si on an Al–0.86Cu–0.97Si at.% alloyand proposed that Si had a catalytic e!ect on the precipita-tion of h0 precipitates. In support of this hypothesis, theyprovided TEM and electron di!raction evidence for ahighly irregular precipitate morphology: h0 precipitatescontaining Si platelets. However, no chemical analyses ofthese structures were performed. We observe a similar cat-alytic e!ect of Si on GPII platelets at 438 K and 8 h aging,where the Nv value of GPII platelets is a factor of threegreater for the Si-containing alloy compared to the Si-freeone. This e!ect on the precipitation of h0 platelets couldnot, however, be directly verified by the current LEAPtomographic analyses because of the di"culty associatedwith capturing statistically significant numbers of largediameter (P180 nm) h0 platelets.
In addition to reporting evidence of Si atoms in GPIIzones and h0 precipitates, our observation of segregationof Si at the a-Al/h0 coherent interface is another new andsignificant finding. Table 4 summarizes the change in Siconcentration within the a-Al matrix, at the matrix/precip-itate interface and at the h0 core for samples aged at 463 vs.533 K. Additionally, Table 4 displays data for Kh0=a-Al
si : thisratio is 3.8 for the sample aged at 533 K, which is a factorof two less than the value obtained for aging at 463 K (7.4).The smaller value of Kh0=a-Al
sil at 533 K is due to a reduction
in the Si concentration in the h0 platelet core (ch0
Si) compared
to aging at 463 K. While the Si core concentrationdecreases upon increasing aging temperature, the Si con-centration at the coherent heterophase interface respondsin the opposite sense, increasing by nearly a factor of sixwith increasing aging temperature. Assuming that theentropy of segregation is small, the latter is indicative ofa nonequilibrium kinetic e!ect, as an attractive enthalpicinteraction with an interface implies that the Gibbsianexcess of a solute must decrease with increasingtemperature.
Combining the above observations, one possible expla-nation for the behavior of Si in these alloys is as follows:Si catalyzes the nucleation of the GPII zones as manifestedby a threefold increase in the Nv value in the Si-containingalloy B. On further aging [76], h0 platelets evolve by repre-cipitation, preceded by dissolution of GPII zones. TEMstudies [77] have confirmed the heterogeneous nucleationof h0 precipitates on GPII zones with some assistance fromdislocations [76]. The fact that both the GPII zones after a438 K aging treatment, and the h0 platelets on aging at463 K exhibit similar Si core concentrations lends furthercredibility to this explanation. Moreover, first-principlescalculations for Si partitioning demonstrates that Si isstrongly attracted to h0 platelets. Consequently, Si mostlikely catalyzes the nucleation of h0 platelets. The addi-tional thermodynamic driving force provided by stabilizingthe formation of h0 precipitates has the e!ect of decreasingthe net reversible work for forming a critical size nucleus[78]. In addition to this bulk thermodynamic e!ect, segre-gation of Si at the matrix/precipitate interface may alsoimpact the kinetics of precipitate nucleation. In particular,Si may lower the interfacial free energy (c) by migrating tothe interface. Since the nucleation current is influencedstrongly by c, any reduction in c will increase the h0 nucle-ation rate.
4.3. Reduction in interfacial free energy due to segregation ofSi
From the Gibbs adsorption isotherm for a system withtwo phases and n P 3 components [79], a coe"cient forthe reduction of c at a concentration ci due to segregationof component i at the heterophase interface, assuming adilute solution model, is given by [19,56,58,60,80–82]:
@c@ci
$$$$T ;p;l3;...;li"1;li%1;...;ln
& "kBTCrel
i
ci'10(
where Henry’s law for dilute solutions is assumed, li is thechemical potential of component i, kB is Boltzmann’s con-
Table 4Evolution of Si concentration with aging temperature in the a-Al matrix and h0 precipitate core, and at the matrix/precipitate interface.
Si in the a-Al matrix(at.%)
Si at the h0-precipitate core(at.%)
Si partitioning ratioKh0=a-Al
Si & ch0Si
ca-AlSi
Si concentration at the interface(at.%)
463 K–8 h 0.0129 ± 0.003 0.096 ± 0.009 7.4 0.0272 ± 0.004533 K–4 h 0.0140 ± 0.008 0.0527 ± 0.015 3.8 0.1588 ± 0.042
A. Biswas et al. / Acta Materialia 59 (2011) 6187–6204 6201
Author's personal copy
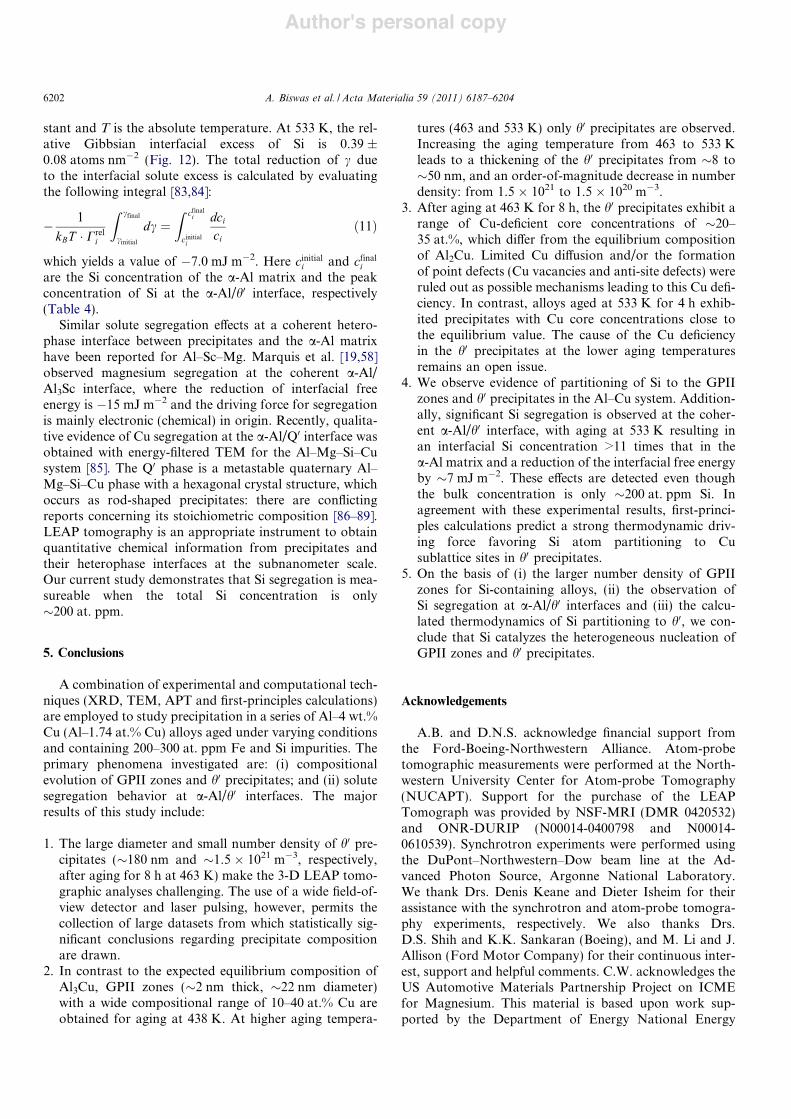
stant and T is the absolute temperature. At 533 K, the rel-ative Gibbsian interfacial excess of Si is 0.39 ±0.08 atoms nm"2 (Fig. 12). The total reduction of c dueto the interfacial solute excess is calculated by evaluatingthe following integral [83,84]:
" 1
kBT * Creli
Z cfinal
cinitial
dc &Z cfinali
cinitiali
dcici
'11(
which yields a value of "7.0 mJ m"2. Here cinitiali and cfinaliare the Si concentration of the a-Al matrix and the peakconcentration of Si at the a-Al/h0 interface, respectively(Table 4).
Similar solute segregation e!ects at a coherent hetero-phase interface between precipitates and the a-Al matrixhave been reported for Al–Sc–Mg. Marquis et al. [19,58]observed magnesium segregation at the coherent a-Al/Al3Sc interface, where the reduction of interfacial freeenergy is "15 mJ m"2 and the driving force for segregationis mainly electronic (chemical) in origin. Recently, qualita-tive evidence of Cu segregation at the a-Al/Q0 interface wasobtained with energy-filtered TEM for the Al–Mg–Si–Cusystem [85]. The Q0 phase is a metastable quaternary Al–Mg–Si–Cu phase with a hexagonal crystal structure, whichoccurs as rod-shaped precipitates: there are conflictingreports concerning its stoichiometric composition [86–89].LEAP tomography is an appropriate instrument to obtainquantitative chemical information from precipitates andtheir heterophase interfaces at the subnanometer scale.Our current study demonstrates that Si segregation is mea-sureable when the total Si concentration is only!200 at. ppm.
5. Conclusions
A combination of experimental and computational tech-niques (XRD, TEM, APT and first-principles calculations)are employed to study precipitation in a series of Al–4 wt.%Cu (Al–1.74 at.% Cu) alloys aged under varying conditionsand containing 200–300 at. ppm Fe and Si impurities. Theprimary phenomena investigated are: (i) compositionalevolution of GPII zones and h0 precipitates; and (ii) solutesegregation behavior at a-Al/h0 interfaces. The majorresults of this study include:
1. The large diameter and small number density of h0 pre-cipitates (!180 nm and !1.5 # 1021 m"3, respectively,after aging for 8 h at 463 K) make the 3-D LEAP tomo-graphic analyses challenging. The use of a wide field-of-view detector and laser pulsing, however, permits thecollection of large datasets from which statistically sig-nificant conclusions regarding precipitate compositionare drawn.
2. In contrast to the expected equilibrium composition ofAl3Cu, GPII zones (!2 nm thick, !22 nm diameter)with a wide compositional range of 10–40 at.% Cu areobtained for aging at 438 K. At higher aging tempera-
tures (463 and 533 K) only h0 precipitates are observed.Increasing the aging temperature from 463 to 533 Kleads to a thickening of the h0 precipitates from !8 to!50 nm, and an order-of-magnitude decrease in numberdensity: from 1.5 # 1021 to 1.5 # 1020 m"3.
3. After aging at 463 K for 8 h, the h0 precipitates exhibit arange of Cu-deficient core concentrations of !20–35 at.%, which di!er from the equilibrium compositionof Al2Cu. Limited Cu di!usion and/or the formationof point defects (Cu vacancies and anti-site defects) wereruled out as possible mechanisms leading to this Cu defi-ciency. In contrast, alloys aged at 533 K for 4 h exhib-ited precipitates with Cu core concentrations close tothe equilibrium value. The cause of the Cu deficiencyin the h0 precipitates at the lower aging temperaturesremains an open issue.
4. We observe evidence of partitioning of Si to the GPIIzones and h0 precipitates in the Al–Cu system. Addition-ally, significant Si segregation is observed at the coher-ent a-Al/h0 interface, with aging at 533 K resulting inan interfacial Si concentration >11 times that in thea-Al matrix and a reduction of the interfacial free energyby !7 mJ m"2. These e!ects are detected even thoughthe bulk concentration is only !200 at. ppm Si. Inagreement with these experimental results, first-princi-ples calculations predict a strong thermodynamic driv-ing force favoring Si atom partitioning to Cusublattice sites in h0 precipitates.
5. On the basis of (i) the larger number density of GPIIzones for Si-containing alloys, (ii) the observation ofSi segregation at a-Al/h0 interfaces and (iii) the calcu-lated thermodynamics of Si partitioning to h0, we con-clude that Si catalyzes the heterogeneous nucleation ofGPII zones and h0 precipitates.
Acknowledgements
A.B. and D.N.S. acknowledge financial support fromthe Ford-Boeing-Northwestern Alliance. Atom-probetomographic measurements were performed at the North-western University Center for Atom-probe Tomography(NUCAPT). Support for the purchase of the LEAPTomograph was provided by NSF-MRI (DMR 0420532)and ONR-DURIP (N00014-0400798 and N00014-0610539). Synchrotron experiments were performed usingthe DuPont–Northwestern–Dow beam line at the Ad-vanced Photon Source, Argonne National Laboratory.We thank Drs. Denis Keane and Dieter Isheim for theirassistance with the synchrotron and atom-probe tomogra-phy experiments, respectively. We also thanks Drs.D.S. Shih and K.K. Sankaran (Boeing), and M. Li and J.Allison (Ford Motor Company) for their continuous inter-est, support and helpful comments. C.W. acknowledges theUS Automotive Materials Partnership Project on ICMEfor Magnesium. This material is based upon work sup-ported by the Department of Energy National Energy
6202 A. Biswas et al. / Acta Materialia 59 (2011) 6187–6204
Author's personal copy
Technology Laboratory under Award Number Nos. DE-FC05-95OR22363, DE-FC05-02OR22910, and DE-FC26-02OR22910.
Appendix A
A.1. Bin size analysis in 3-D atom-probe tomography
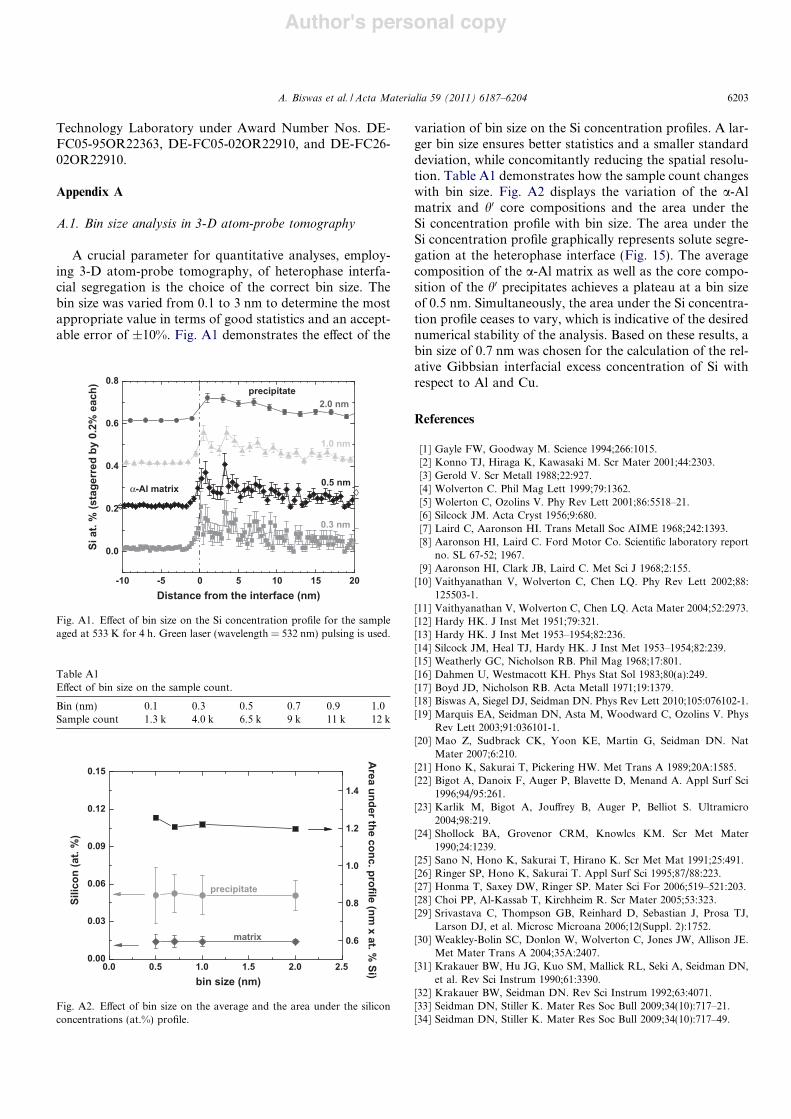
A crucial parameter for quantitative analyses, employ-ing 3-D atom-probe tomography, of heterophase interfa-cial segregation is the choice of the correct bin size. Thebin size was varied from 0.1 to 3 nm to determine the mostappropriate value in terms of good statistics and an accept-able error of ±10%. Fig. A1 demonstrates the e!ect of the
variation of bin size on the Si concentration profiles. A lar-ger bin size ensures better statistics and a smaller standarddeviation, while concomitantly reducing the spatial resolu-tion. Table A1 demonstrates how the sample count changeswith bin size. Fig. A2 displays the variation of the a-Almatrix and h0 core compositions and the area under theSi concentration profile with bin size. The area under theSi concentration profile graphically represents solute segre-gation at the heterophase interface (Fig. 15). The averagecomposition of the a-Al matrix as well as the core compo-sition of the h0 precipitates achieves a plateau at a bin sizeof 0.5 nm. Simultaneously, the area under the Si concentra-tion profile ceases to vary, which is indicative of the desirednumerical stability of the analysis. Based on these results, abin size of 0.7 nm was chosen for the calculation of the rel-ative Gibbsian interfacial excess concentration of Si withrespect to Al and Cu.
References
[1] Gayle FW, Goodway M. Science 1994;266:1015.[2] Konno TJ, Hiraga K, Kawasaki M. Scr Mater 2001;44:2303.[3] Gerold V. Scr Metall 1988;22:927.[4] Wolverton C. Phil Mag Lett 1999;79:1362.[5] Wolerton C, Ozolins V. Phy Rev Lett 2001;86:5518–21.[6] Silcock JM. Acta Cryst 1956;9:680.[7] Laird C, Aaronson HI. Trans Metall Soc AIME 1968;242:1393.[8] Aaronson HI, Laird C. Ford Motor Co. Scientific laboratory report
no. SL 67-52; 1967.[9] Aaronson HI, Clark JB, Laird C. Met Sci J 1968;2:155.[10] Vaithyanathan V, Wolverton C, Chen LQ. Phy Rev Lett 2002;88:
125503-1.[11] Vaithyanathan V, Wolverton C, Chen LQ. Acta Mater 2004;52:2973.[12] Hardy HK. J Inst Met 1951;79:321.[13] Hardy HK. J Inst Met 1953–1954;82:236.[14] Silcock JM, Heal TJ, Hardy HK. J Inst Met 1953–1954;82:239.[15] Weatherly GC, Nicholson RB. Phil Mag 1968;17:801.[16] Dahmen U, Westmacott KH. Phys Stat Sol 1983;80(a):249.[17] Boyd JD, Nicholson RB. Acta Metall 1971;19:1379.[18] Biswas A, Siegel DJ, Seidman DN. Phys Rev Lett 2010;105:076102-1.[19] Marquis EA, Seidman DN, Asta M, Woodward C, Ozolins V. Phys
Rev Lett 2003;91:036101-1.[20] Mao Z, Sudbrack CK, Yoon KE, Martin G, Seidman DN. Nat
Mater 2007;6:210.[21] Hono K, Sakurai T, Pickering HW. Met Trans A 1989;20A:1585.[22] Bigot A, Danoix F, Auger P, Blavette D, Menand A. Appl Surf Sci
1996;94/95:261.[23] Karlik M, Bigot A, Jou!rey B, Auger P, Belliot S. Ultramicro
2004;98:219.[24] Shollock BA, Grovenor CRM, Knowlcs KM. Scr Met Mater
1990;24:1239.[25] Sano N, Hono K, Sakurai T, Hirano K. Scr Met Mat 1991;25:491.[26] Ringer SP, Hono K, Sakurai T. Appl Surf Sci 1995;87/88:223.[27] Honma T, Saxey DW, Ringer SP. Mater Sci For 2006;519–521:203.[28] Choi PP, Al-Kassab T, Kirchheim R. Scr Mater 2005;53:323.[29] Srivastava C, Thompson GB, Reinhard D, Sebastian J, Prosa TJ,
Larson DJ, et al. Microsc Microana 2006;12(Suppl. 2):1752.[30] Weakley-Bolin SC, Donlon W, Wolverton C, Jones JW, Allison JE.
Met Mater Trans A 2004;35A:2407.[31] Krakauer BW, Hu JG, Kuo SM, Mallick RL, Seki A, Seidman DN,
et al. Rev Sci Instrum 1990;61:3390.[32] Krakauer BW, Seidman DN. Rev Sci Instrum 1992;63:4071.[33] Seidman DN, Stiller K. Mater Res Soc Bull 2009;34(10):717–21.[34] Seidman DN, Stiller K. Mater Res Soc Bull 2009;34(10):717–49.
-10 -5 0 5 10 15 20
0.0
0.2
0.4
0.6
0.8
0.3 nm
0.5 nm
1.0 nm
Si a
t. %
(sta
gerr
ed b
y 0.
2% e
ach)
Distance from the interface (nm)
"-Al matrix
precipitate2.0 nm
Fig. A1. E!ect of bin size on the Si concentration profile for the sampleaged at 533 K for 4 h. Green laser (wavelength = 532 nm) pulsing is used.
Table A1E!ect of bin size on the sample count.
Bin (nm) 0.1 0.3 0.5 0.7 0.9 1.0Sample count 1.3 k 4.0 k 6.5 k 9 k 11 k 12 k
0.0 0.5 1.0 1.5 2.0 2.50.00
0.03
0.06
0.09
0.12
0.15
bin size (nm)
Silic
on (a
t. %
)
matrix
precipitate
0.6
0.8
1.0
1.2
1.4
Area under the conc. profile (nm x at. %
Si)
Fig. A2. E!ect of bin size on the average and the area under the siliconconcentrations (at.%) profile.
A. Biswas et al. / Acta Materialia 59 (2011) 6187–6204 6203

Author's personal copy
[35] Bajikar SS, Larson DJ, Kelly TF, Camus PP. Ultramicroscopy1996;65:119.
[36] Kelly TF, Camus PP, Larson DJ, Holzman LM, Bajikar SS.Ultramicroscopy 1996;62:29.
[37] Kelly TF, Larson DJ. Mater Charact 2000;44:59.[38] Seidman DN. Annu Rev Mater Res 2007;37:127.[39] Seidman DN. Rev Sci Instrum 2007;78:031101-1.[40] Kelly TF, Miller MK. Rev Sci Instrum 2007;78:031101.[41] Hellman OC, Blatz du Rivage J, Seidman DN. Ultramicroscopy
2003;95:199.[42] Hellman OC, Vandenbroucke JA, Rusing J, Isheim D, Seidman DN.
Microsc Microanal 2000;6:437.[43] Booth-Morrison C, Weninger J, Sudbrack CK, Mao Z, Noebe RD,
Seidman DN. Acta Mater 2008;56:3422.[44] Siegel DJ, Hamilton JC. Acta Mater 2005;53:87.[45] Perdew JP et al. Phys Rev B 1992;46:6671.[46] Hohenberg P, Kohn W. Phys Rev 1964;136:B864.[47] Kohn W, Sham LJ. Phys Rev 1965;140:A1133.[48] Kresse G, Furthmuller. J Phys Rev B 1996;54:11169.[49] Blochl PE. Phys Rev B 1994;50:17953.[50] Kresse G, Joubert D. Phys Rev B 1999;59:1758.[51] Siegel DJ, Hector Jr LG, Adams JB. Acta Mater 2002;50:619.[52] Saimoto S, Jin H. Mater Sci For 2007;550:339.[53] Beeri O, Dunand DC, Seidman DN. Mater Sci Eng A 2010;527:3501.[54] Dregia SA, Wynblatt P. Acta Metall Mater 1991;39:771.[55] Hellman OC, Seidman DN. Mater Sci Eng A 2002;327:24.[56] Krakauer BW, Seidman DN. Acta Mater 1998;46:6145.[57] Seidman DN. Annu Rev Mater Res 2002;32:235.[58] Marquis EA, Seidman DN, Asta M, Woodward C. Acta Mater
2006;54:119.[59] Marquis EA, Seidman DN. Surf Interf Anal 2004;36:559.[60] Isheim DI, Gagliano MS, Fine ME, Seidman DN. Acta Mater
2006;54:841.[61] The scientific papers of J. Willard Gibbs. New York: Dover; 1961.[62] Cahn JW. In: Johnson WC, Blakely JM, editors. Interfacial segre-
gation metals park. OH: American Society of Metals; 1979. p. 3–38.[63] Sutton AP, Ballu" RW. Interfaces in crystalline materials. Oxford:
Clarendon Press; 1996. p. 349.[64] Siegel DJ, Hamilton JC. Phys Rev B 2003;68:094105.
[65] Siegel DJ, van Schilfgaarde M, Hamilton JC. Phys Rev Lett2004;92:086101.
[66] Siegel DJ. Appl Phys Lett 2005;87:121901.[67] Landa A, Wynblatt P, Siegel DJ, Adams JB, Mryasov ON, Liu X-Y.
Acta Mater 2000;48:1753.[68] Siegel DJ, Hamilton JC. Acta Mater 2005;53:87.[69] Siegel DJ, Hector LG, Adams JB. Surf Sci 2002;498:321.[70] Benedek R, van de Walle A, Gerstl SSA, Asta M, Seidman DN. Phys
Rev B 2005;71:094201.[71] Siegel DJ, Hector Jr LG, Adams JB. Surf Sci 2002;498:321–36.[72] Mehrer H, editor. Di!usion in solid metals and alloys, vol. 26. Berlin:
Springer-Verlag; 1990.[73] Cloutier C, Reeber-Schmansky P, Jones JW, Allison JE. Automotive
alloys III. Warrendale, PA: TMS; 1999.[74] Cloutier C, Jones JW, Allison JE. SAE paper 2000–01-0759. Warren-
dale, PA: SAE International; 1998.[75] Mitlin D, Radmilovic V, Morris Jr JW. Metall Mater Trans A
2000;31A:2697.[76] Haasen P. Physical metallurgy. New York: Press Syndicate of the
University of Cambridge; 1996. p. 220.[77] Hornbogen E. Aluminium 1967;43:115.[78] Christian JW. The theory of transformations in metals and
alloys. Oxford: Pergamon Press; 1981.[79] Defay R, Prigogine I, Bellemans A, Everett DH. Surface tension and
adsorption. New York: Wiley; 1966. p. 89.[80] Krakauer BW. PhD thesis, Northwestern University; 1993.[81] Seidman DN, Krakauer BW, Udler D. J Phys Chem Solids
1994;55:1035.[82] Marquis EA. PhD thesis, Northwestern University; 2002. <http://
arc.nucapt.northwestern.edu/refbase/show.php?record=151>.[83] Krug ME, Dunand DC, Seidman DN. Acta Mater 2011;59:1700.[84] Adusumilli P, Seidman DN, Murray CE; submitted for publication.[85] Matsuda K, Teguri D, Uetani Y, Sato T, Ikeno S. Scr Mater
2002;47:833.[86] Arnberg L, Aurivillius B. Acta Chem Scand A 1980;34:1.[87] Phragmen G. J Inst Met 1950;77:489.[88] Mondolfo LF. Aluminum alloys—structure and properties. Lon-
don: Butterworths; 1976.[89] Wolverton C. Acta Mater 2001;49:3129.
6204 A. Biswas et al. / Acta Materialia 59 (2011) 6187–6204
Related Documents