Pre-service teachers’ empathy and cognitions: Statistical analysis of text data by graphical models q Sharon Tettegah * , Carolyn J. Anderson University of Illinois, Urbana-Champaign, 1310 South Sixth Street, MC-708, Champaign, IL 61820, USA Abstract This research examines empathic dispositions of 178 pre-service teachers. We analyzed open ended responses to animated narrative vignette simulations (ANVs), which served as stimulated experimental situations depicting students in victim and perpetrator scenarios. Empathy was examined by addressing the following questions: (1) Do participants’ responses differ over vignettes? (2) What is the dimensionality of the empathy construct? (3) Is word count an indicator of empathy? (4) Is there a dispositional effect? (5) To what extent do pre-service teachers express empathy? After the text responses of pre-service teachers were coded, log-linear and log-multiplicative association models, which have graphical representations, were used to analyze the data and to develop a context dependent measure of empathy. The results suggest that a single latent variable underlies the responses, and from our measurement model, very few teachers expressed empathy toward the victim in the ANVs. Published by Elsevier Inc. Keywords: Empathy; Concern; Simulations; Narratives; Graphical models; Log-linear models; Log-multiplica- tive association models; Latent variables 0361-476X/$ - see front matter Published by Elsevier Inc. doi:10.1016/j.cedpsych.2006.10.010 q This work was supported in part by the National Center for Supercomputing Applications and the University of Illinois under the auspices of the NCSA/UIUC Faculty Fellows Program award and the Bureau of Educational Research in the College of Education at the University of Illinois. This work was also supported by the National Science Foundation (#SES-0351175) award to the second author. Each author has contributed equally to this paper. * Corresponding author. Fax: +1 2172444572. E-mail addresses: [email protected] (S. Tettegah), [email protected] (C.J. Anderson). Contemporary Educational Psychology 32 (2007) 48–82 www.elsevier.com/locate/cedpsych

Welcome message from author
This document is posted to help you gain knowledge. Please leave a comment to let me know what you think about it! Share it to your friends and learn new things together.
Transcript
Pre-service teachers’ empathy and cognitions:Statistical analysis of text data by
graphical models q
Sharon Tettegah *, Carolyn J. Anderson
University of Illinois, Urbana-Champaign, 1310 South Sixth Street, MC-708, Champaign, IL 61820, USA
Abstract
This research examines empathic dispositions of 178 pre-service teachers. We analyzed openended responses to animated narrative vignette simulations (ANVs), which served as stimulatedexperimental situations depicting students in victim and perpetrator scenarios. Empathy wasexamined by addressing the following questions: (1) Do participants’ responses differ over vignettes?(2) What is the dimensionality of the empathy construct? (3) Is word count an indicator of empathy?(4) Is there a dispositional effect? (5) To what extent do pre-service teachers express empathy? Afterthe text responses of pre-service teachers were coded, log-linear and log-multiplicative associationmodels, which have graphical representations, were used to analyze the data and to develop acontext dependent measure of empathy. The results suggest that a single latent variable underliesthe responses, and from our measurement model, very few teachers expressed empathy towardthe victim in the ANVs.Published by Elsevier Inc.
Keywords: Empathy; Concern; Simulations; Narratives; Graphical models; Log-linear models; Log-multiplica-
tive association models; Latent variables
0361-476X/$ - see front matter Published by Elsevier Inc.
doi:10.1016/j.cedpsych.2006.10.010
q This work was supported in part by the National Center for Supercomputing Applications and the University
of Illinois under the auspices of the NCSA/UIUC Faculty Fellows Program award and the Bureau of
Educational Research in the College of Education at the University of Illinois. This work was also supported by
the National Science Foundation (#SES-0351175) award to the second author. Each author has contributed
equally to this paper.* Corresponding author. Fax: +1 2172444572.E-mail addresses: [email protected] (S. Tettegah), [email protected] (C.J. Anderson).
Contemporary Educational Psychology 32 (2007) 48–82
www.elsevier.com/locate/cedpsych
1. Introduction
The roots of empathy appeared over 250 years ago when German philosophers intel-lectualized (German aesthetics, einfuhlung), and defined it as, an act of imaginativelystepping into another person’s perspective. The perspective-taking of another alsoinvolves considering how things look from someone else’s position as if one were aninsider. While many have argued over whether empathy is affective, cognitive, or mul-tidimensional, what is clear is that it involves a process of perspective-taking and theability to share an affect (Eisenberg & Strayer, 1987). In this article, we will brieflydefine empathy, introduce the theory of teacher empathy and its meaning, and testthe theory by applying cutting-edge latent variable modeling to a set of open-endedtext based responses.
2. The concept of empathy
Since the early 18th century empathy has been theorized in fields of philosophy andmore recently psychology (Davis, 1980, 1983; Eisenberg & Strayer, 1987; Hoffman,2000; Zahn-Waxler, Radke-Yarrow, Wagner, & Chapman, 1992). While philosophicalroots drive the development of empathy as a theory, we will focus on some of the mostrecent theories involving empathy in the educational and psychology literature. Empathyhas sometimes been described as a moral emotion that exists universally in many societies,and a phenomenon that we think, feel, and act on as we encounter victims of violence,accidents, subtle discrimination, and relational aggression. It can also be associated withfeelings of joy, fear, excitement, and sadness (Zhou, Valiente, & Eisenberg, 2003). Regard-less of the behavior that is expressed by others, empathy is something an individual feels asone encounters a situation (e.g., joy, pain) of another. The feelings that one may feel foranother, is often associated with the same or similar experiences or situations that hasoccurred in one’s own life (Hoffman, 2000).
Hoffman (2000) described empathy as involving an affective response with a focus onthe other person more than one’s self. While others have described empathy as a cognitive(Deutsch & Madle, 1975) or emotional process (Mehrabian & Epstein, 1972), more recentliterature suggest that empathy is a multidimensional phenomenon with distinctionsamong its various attributes (e.g., personal distress, empathic concern, perspective-takingand fantasy; Davis, 1980, 1983). A vital aspect of the process involves perspective-takingand feeling. We would expect most individuals to have developed schemas for social per-spective-taking by the time they become adults. Yet, snapshots of observations in schoolswould suggest otherwise.
Research involving peer relations reveal that most students are not empathic and thatschool personnel fail to provide empathic responses toward students who are victimized inschools (Craig, Henderson, & Murphy, 2000). For instance, Hakansson and Montgomery(2003) suggested empathy may include taking on the perspective of another individualsuch as mimicking another’s actions. ‘‘The outcomes of empathy result from these process-es, and may include the empathizer’s affective responses, cognitive understanding, andhelping behaviors’’ (Hakansson & Montgomery, p. 268). While Hakansson and Mont-gomery (2003) described empathy as a process, Eisenberg and others have described empa-thy as an emotional state of arousal, which originates from the understanding ofuneasiness of someone else’s experience (Eisenberg, Shea, Carlo, & Knight, 1991).
S. Tettegah, C.J. Anderson / Contemporary Educational Psychology 32 (2007) 48–82 49
Empathy, as a process and phenomenon, occurs in many environments includinghomes and schools (Hazler, 1997, 1998; Kerem & Fishman, 2001). For example, a parentmay empathize with a 14-year old daughter when the child isolates herself because herclassmates refuse to interact with her when she does not engage in acts she considersimmoral or inappropriate. In another situation, a teacher may empathize with a studentwhen the student accidentally closes his finger in the bathroom door, or perhaps whenanother student deliberately slams his book on a classmate’s foot as he passes by walkingback to his desk. One might ask why empathy is important for educators and others inhelping profession. While we acknowledge the importance of empathy in our everydaylives, we should also understand the need for it in all aspects of human interactions andexperiences.
Zhou et al. (2003) stressed that, ‘‘empathy motivates helping others and the desire forhelping others, as well as inhibits aggression, facilitates people’s social competence forinteracting with others, and provides a sense of connection among people’’ (p. 269). Med-ical and legal professionals recognize empathy as essential for patient and client care. Inconnection, prior studies have documented empathy as necessary for students to haveto reduce relational aggression and other forms of perpetration in our schools (Hazler,1997, 1998). However, little research has investigated the role of empathy in the everydayschool experiences of educators and of those planning to become teachers (Boulton, 1997;Craig et al., 2000; Hazler, Miller, Carney, & Green, 2001; Tettegah, 2004, 2005, 2007;Yoon & Kerber, 2003), despite the fact that empathy has been documented as an impor-tant disposition for educators to possess in order to facilitate positive interactions amongstudents (Good & Brophy, 2000; Noddings, 1988; Sergiovanni, 1994).
3. What is teacher empathy?
Teacher empathy is the ability to express concern and take the perspective of a student,and it involves cognitive and affective domains of empathy. A teacher should be able toperceive the victim’s feelings and take on the perspective of the victim through a consciousor unconscious process. This conscious or unconscious process may involve an awarenessof a student’s feelings and the ability to put herself in the student’s place and feel what thestudent feels. In this sense, empathy differs from sympathy, whose origins are grounded in18th century moral philosophy, which has been defined as sharing the feelings of others(especially feelings of sorrow or anguish). From here is where we develop our theoryand application of empathy. Our theory of empathy involves the process and outcome,as well as cognitive and emotional elements. Eisenberg and her colleagues (1991) stated,
Because empathy and its related responding plays a significant role in promotion of
positive behaviors such as helping and interpersonal understanding, as well, as in
inhibiting aggression and antisocial behaviors, improvements in the measurement
of empathy will benefit research on optimal functioning. (p. 279)
Thus, success in empathic understanding would be a matter of having entered (tempo-rarily, in an act of imagination) the perspective of the other person sufficiently well enoughto be able to represent it credibly to others, especially and above, all in a way that is rec-ognizable and credible to those persons who themselves occupy that perspective.
In the current study we measure cognitive and affective dimensions of empathy usingopen ended text responses that are generated from observations of animated narrative
50 S. Tettegah, C.J. Anderson / Contemporary Educational Psychology 32 (2007) 48–82
vignettes (ANVs). In this study ANVs serve as stimulated experimental situations or sim-ulations, and are defined as concrete examples of people and their behaviors, and storiesabout individuals, situations and structures that can make reference to important points inthe study of perceptions, beliefs and attitudes (Tettegah, 2004, 2005, 2007). Researcherssometimes refer to text and media-type vignettes as stimulated experimental situations,which Zhou et al. (2003) defined as ‘‘emotion-evoking stimuli presented via audiotapes,videotapes, or realistic enactments that aim to make participants believe that the eventsand people involved in the stimuli are real, not hypothetical’’ (p. 273).
In connection, other social scientists define such emotion-evoking stimuli as simula-tions. Simulations are often defined as a computer simulation involving experimentationon a computer-based model of some system or as a computer model that mimics the oper-ation of a real or proposed system, such as the day-to-day operation of a bank, or the run-ning of an assembly line in a factory, or the staff assignment of a hospital or call center(Wikipedia, 2006). In our case we are using social simulations to characterize school inter-actions. In previous research Zhou et al. (2003) cautioned that almost all types of self-re-port measures, including self-report in experimentally induced situations, may be affectedby student participants’ verbal ability and comprehension. Thus, we should be cautiouswhen interpreting the responses because they are simulation experiments and may not per-fectly represent behaviors in real life. Clearly, observations of individuals in real situationscan provide better indices of empathy (Zahn-Waxler et al., 1992), and we try to addressthis problem by taking into account participant word count. We felt that participantswho wrote more may in turn express more concern and perspective-taking.
Specifically, participants in this study watched a Web-based ANV simulation depictinga student–student victimization situation in which the perpetrator was a Caucasian orAfrican American male and the victim was an African American or Caucasian female.The participants were asked questions to elicit responses for us to measure perspective-taking, role-taking, and empathic dispositions. Participants also completed the DavisInterpersonal Reactivity Index (IRI; Davis, 1983) to measure multidimensional empathy.
We sought to answer the following questions: (1) Do participants’ responses differ overvignettes? (2) What is the dimensionality of the empathy construct? (3) Is word count anindicator of empathy? (4) Is there a dispositional effect? (5) To what extent do pre-serviceteachers express empathy?
4. Method
4.1. Participants
One-hundred-seventy-eight students (142 women, 36 men) enrolled in a teacher educa-tion program at a Midwestern university participated in this study. Participants were solic-ited from several teacher education programs and received extra credit for their voluntaryparticipation. Seventy percent of the participants were White/Caucasian American(n = 125), 30% represented African American, Hispanic, Asian American and NativeAmericans combined (n = 50), and three were unidentified. Thirty percent stated their per-manent homes were in an urban community, 45% suburban, and 25% rural. Ninety-twopercent stated they had 0–5 years experience working with children in some capacity(e.g., tutoring, camp supervisors), while 7% had more than 6 years of experience workingwith children in some capacity. Eighty-two percent were between the ages of 18 and 25,
S. Tettegah, C.J. Anderson / Contemporary Educational Psychology 32 (2007) 48–82 51
while 18% were over 25 years of age. Additionally, 43% (n = 77) observed vignette 1 and57% (n = 101) observed vignette 2 (described below).
4.2. Materials
4.2.1. Demographic questionnaire
A 16-item survey was designed to gather information about each participant’s age, gen-der, location of residency and location of teaching position, years taught (if any), and sub-ject area interest or experience.
4.2.2. Interpersonal Reactivity Index (Davis, 1980, 1983)
The IRI was included to assess cognitive and emotional aspects of empathy for con-struct validity and to determine mean differences between elementary and secondarypre-service teachers. The IRI was developed as a multidimensional assessment, which mea-sures four facets of empathy: perspective-taking, empathic concern, personal distress, andfantasy. Respondents were asked to indicate the extent to which each statement describeshim/herself on Davis’s scale. In this study, we specifically used the perspective-takingsubscale.
The cognitive component, the Perspective-Taking subscale, consists of seven items thatassess a cognitive dimension of empathy that demonstrates the ‘‘tendency to spontaneouslyadopt the psychological point of view of others’’ (Davis, 1996, p. 57). A sample item is, ‘‘I tryto look at everybody’s side of a disagreement before I make a decision.’’ Respondents wereasked to indicate the extent to which each statement describes him/herself on all of the itemson the Perspective-taking subscale of the IRI. Response options for this questionnaireinclude a 5-point rating scale ranging from 1 (Does not Describe Me Well) to 5 (Describes
Me Very Well).
4.2.3. Vignettes
An ANV was used to gather data from participants through the World Wide Web. Theduration of the ANV was 2 min. This stimulus contained one of two vignettes that depict-ed an interaction in the classroom between two children (Scott, a 9-year old Caucasianboy, and Jamilah a 9-year old African American girl; or Jamal, a 9-year old African Amer-ican boy, and Erin, a 9-year old Caucasian girl), one teacher (Ms. Litts), and one parent(Mr. Young). We wanted to make sure the vignettes were counterbalanced for race todetermine if the pre-service teachers provided a different response based on race of the vic-tim and perpetrator. The ANV was told by a child and therefore the characters depictedrepresented people in real life.
During the vignette, Ms. Litts (the teacher) is working with the class on a cooperativelearning activity to make paper puppets or to build bridges, depending on which vignetteobserved. We felt that the actual activity (i.e., puppet or bridge making) was unimportantbecause the same behaviors are depicted in each vignette. In the ANVs the teacher requestsone student to work with the other, Scott with Jamilah in the puppet making activity orJamal with Erin in the bridge making activity, depending on the vignette. In each scenariothe boy (Scott or Jamal) tells the girl (Jamilah or Erin) that he does not want to work withher because: her ‘‘black skin might rub off on him’’ (in the vignette with Scott) or her‘‘white skin might rub off on him’’ (in the vignette with Jamal). In the next scene,Jamilah/Erin informs her father of the incident. Next, the girl’s father reports the incident
52 S. Tettegah, C.J. Anderson / Contemporary Educational Psychology 32 (2007) 48–82
to Ms. Litts, to which she responds, ‘‘I am surprised Scott/Jamal would say something likethat; just last week we talked about Martin Luther King.’’
After viewing the vignette, participants were asked, ‘‘If you had been in the position ofthe teacher, Ms. Litts, how would you have responded to the situation?’’ Participants wereinstructed to type their response in a textbox and were given unlimited time and space torespond to the question. See Appendix A.
4.3. Procedure
Participants were randomly assigned to different computer labs to complete the exper-iment. Data collection occurred at different time periods. Because participants arrivedthroughout different data collection time periods, the lab numbers were not equal. Asthe labs filled up, students were assigned accordingly over a two-day period. Given thatseveral data collections occurred for this study with the participant pool, more partici-pants were ultimately assigned to one lab more than the other. One lab was a PersonalComputer lab (22 computers) and the other a Macintosh computer lab (20 computers).All participants logged onto the website to access the vignettes, the Davis IRI, and thedemographic survey. First, participants filled out the demographic survey and then, forpurposes of counterbalancing, participants either viewed the vignette next or completedthe IRI survey next. After viewing the vignettes the participants typed their open-endedresponse, and for the IRI survey participants clicked on radio buttons to indicate their rat-ings. After completion of vignette and surveys, the participants clicked on a submit buttonto finalize their responses. The process of submission sent the data to a secure database.Participants were guaranteed anonymity through pseudonyms that were established dur-ing the initial registration process on the website.
5. Data analysis
5.1. Coding
The methodology for this research employed a grounded theory approach by organiz-ing, coding, generating categories, testing emerging categories, and searching for hypoth-eses and explanations from the vignette responses (Charmaz, 1995, 2003; Marshall &Rossman, 1989, 1999; Strauss & Corbin, 1990). Participants’ open-ended responses weresubjected to a ‘‘line-by-line’’ content analysis. This involved a research team consistingof the first author and four research assistants, examining each line of the 178 vignetteresponses. Each vignette response was different. Some responses contained five lines whileothers contained up to a full page. Upon examination of the responses a coding schemewas developed using a grounded theory approach to measure empathy which consistedof four distinct response categories: concern for the victim (CONCERN), problem solvingwith the victim (SOLVE), mention of the victim (MENTION), and management of the situationwith the victim (MANAGE; (Tettegah, 2004, 2005, 2007)). For example, expressions of con-cern involved feelings of emotion. One pre-service teacher wrote, ‘‘if I was the teacher Iwould tell Jamilah I am so sorry that Scott said that to you, I will speak with him aboutthe situation.’’ An act involving both management and concern would state the latter andmay include speaking to both of them. A situation could be managed without any expres-sions of concern. A response representing management with the victim may state, ‘‘I would
S. Tettegah, C.J. Anderson / Contemporary Educational Psychology 32 (2007) 48–82 53
tell Jamilah to ignore Scott because he really did not mean anything by his comment.’’Mentioning the victim was indicated whether the victim was mentioned by name or pro-noun (i.e., she). Each research team member read through the responses, and after readingthrough the responses several times, they went through and coded the responses to lookfor the presence or absence of expressions of concern for the victim, mention the victim,problem solving with the victim, and finally management of the situation with the victim.A zero (0) was used to indicate the absence of a response and one (1) to indicate the pres-ence of a response. It was not possible to express or not express concern for the victim.Because our focus is on the victim and not the perpetrator, we do not discuss the presenceor absence of problem solving with the perpetrator in this paper. Inter-rater reliabilityfocused on the use of a zero or one. Pairwise Cohen’s kappa for each coded responsefor the vignettes ranged from .82 to 1.00 with a mean of .91, which indicates high inter-rater reliability. Table 1 contains the coding categories and examples.
The variable of interest in the current study, empathy, is hypothesized to be reflected inthe four types of responses derived from the open-ended question. The responses also seemto relate to both the cognitive and affective domains. Mention of the victim includesaffective/cognitive perspective-taking, and involves understanding and acknowledging thatthere is a victim/perpetrator event implicated (i.e., did the participant mention thevictim?). Mentioning the victim involves what Hoffman (2000, p. 5) referred to as mediatedassociation, that is, ‘‘an association of expressive cues from the victim or the victim’ssituation with one’s own painful past experience, where the association is mediated bysemantic processing of information about the victim.’’ Concern for the victim (emotion-al/affective) involves an expression of emotion (i.e., did the participant express concernfor the victim?). According to Hoffman (2000), emotion is crucial for empathy. Empathicconcern involves the induction of role taking and feeling compassion for the victim (Davis,1996).
Problem solving with the victim (cognitive–perspective) involves the ability to accurate-ly infer a relational experience. In our case Jamilah or Erin experienced distress due to averbal assault, and therefore, in Jamilah’s or Erin’s situation distress involves a stimulus-drive component. According to Hoffman’s theory (2000) he believed that in order forempathy to be present, an empathic affect must involve a stimulus-driven component(victim’s distress) and a principle-driven component such as the distress experienced byJamilah or Erin. We used problem solving as an indicator variable to measure empathiz-er’s actions as an indicator of empathy (Hoffman, 2000). The measurement of the
Table 1
Coding categories and examples
Categories Indicators Examples
Mention the
victim
Did they recognize the
victim?
I would apologize and discuss with Jamilah/Erin
Empathic
concern
Do they express concern
for the victim?
I would ask Jamilah/Erin how she feels and talk to her about
her feelings
Management
focus
Do they manage the
problem with the victim?
I would get Jamilah/Erin together with Scott/Jamal
Problem solving
strategies
Do they problem solve with
the victim?
I would discuss the situation with Jamilah/Erin to have a
discussion about racism. I would ask Scott/Jamal to apologize
to Jamilah/Erin
54 S. Tettegah, C.J. Anderson / Contemporary Educational Psychology 32 (2007) 48–82
empathizer’s intended actions are based on the assumption that empathy is an interperson-al phenomenon, and therefore acknowledges that there is a person experiencing an eventas though one were the other person (Hakansson & Montgomery, 2003).
Managing the situation with the victim involves a cognitive perspective (i.e., did partic-ipants respond to how she would manage the situation with the victim versus another inthe situation?). As mentioned earlier, managing the situation with the victim would includementioning the victim’s name, but it would not have necessarily included expressions ofconcern for the victim. We looked to see if the respondent would actually spend time talk-ing to the victim and asking about her feelings.
5.2. The coded data
Each respondent’s coded data consisted of values (i.e., present or absent) on fourdichotomous variables, which are the four codes for empathy (i.e., MANAGE, CONCERN,SOLVE and MENTION). We aggregated the data over the respondents and analyzed it inthe form of a 2 · 2 · 2 · 2 contingency table where each cell contains the number ofrespondents who had a particular pattern of empathy codes present. The marginal per-centages for each of the codes were 78% who said that they would manage the situationwith the victim, 27% who showed concern for the victim, 23% who said they would solvethe problem with the victim, and 47% who mentioned the victim.
Vignette type is a dichotomous variable that indicates which vignette a respondentviewed (77 viewed vignette 1, and 101 viewed vignette 2). We also had numerical (metric)variables: the number of words per textual response and the value on the Davis Perspec-tive-taking subscale. The mean (and standard deviation) number of words per responsewas 95.06 (60.97). For the 111 respondents who were given the Davis instrument, the mean(standard deviation) of the Davis Perspective-taking subscale was 26.79 (4.35). The initialgroup of 67 of the pre-service teachers did not complete the IRI because it was absent fromthe set of surveys given. It was decided to add the Davis IRI Perspective-taking sub-scaleto the next group of pre-service teachers sampled.
To incorporate word count and Perspective-taking, rather than collapsing the data intoa single contingency table where each margin of the table corresponds to a (dichotomous)variable, we analyzed the data as a set of 178 contingency tables, where there is table foreach individual. In effect, we treated the participant as an additional variable in the cross-classification of the variables (Anderson & Bockenholt, 2000). In an individual’s table,there is a 1 in one cell that indicates the participant’s coded response pattern and 0’s inthe remaining cells. Analyzing the data as a set of individual tables permits the inclusionof numerical variables in the models. In sum, then, when we only consider categorical vari-ables (i.e., the four codes and the vignette condition), we analyzed the data in the form of asingle contingency table; however, when we include individual level measures (i.e., wordcount or Perspective-taking), we analyzed the data at the individual level.
6. Models
In this section, we focus on describing the general approach to analyzing the data andthe reasons for choosing the class of models used. To facilitate this presentation anddiscussion, we introduce equations for a sub-set of models that are reported in the resultssection, as well as notation that is used throughout the remainder of the paper. Additional
S. Tettegah, C.J. Anderson / Contemporary Educational Psychology 32 (2007) 48–82 55
models are presented in the results section, where we further illustrate the specifics of form-ing and deriving models from substantive theory and testing specific hypotheses.
6.1. Log-linear models
The empathy codes and vignette condition comprise multivariate categorical data.Appropriate methods for modeling this type of data are log-linear models. We use log-lin-ear models to test whether the elements of empathy are related in any way to vignette type,as well as to determine the complexity of associations between the codes. Below we presenta brief introduction to log-linear models, which is needed to follow our discussion of thelatent variable models. For a more complete introduction to log-linear models, see Agresti(1996, 2002) or Powers and Xie (2000).
With respect to notation, the index i = 1 indicates that MANAGE is present in a partici-pant’s response and i = 0 indicates that it is absent from a participant’s response. We like-wise define j, k and l for the codes SOLVE, CONCERN, and MENTION, respectively. The index m
indicates which VIGNETTE was viewed. The abbreviations Ma, S, C, Me, and V correspondto MANAGE, SOLVE, CONCERN, MENTION, and VIGNETTE. Additional notation is introduced asneeded.
The model of complete independence between vignette type and each of the codes isused as a baseline model. According to the definition of independence,
pijklm ¼ pMai pS
j pCk p
Mel pVm; ð1Þ
where pijklm equals the probability of response pattern (i, j,k, l) to vignette m, and pMai , pS
j ,pCk and pMe
l are the marginal probabilities of the codes MANAGE, SOLVE, CONCERN andMENTION, respectively, and pVm is the proportion of respondents who viewed vignette m.We can re-express (1) by taking the logarithm of both sides of (1), which gives us a linearmodel,
logðpijklmÞ ¼ logðpMai Þ þ logðpS
j Þ þ logðpCk Þ þ logðpMe
l Þ þ logðpVmÞ;
where log is the natural logarithm.For relationships that can be expressed as some form of independence, estimates of
expected probabilities equal the product of various marginal proportions. Dependencybetween discrete variables cannot be expressed as products of marginal probabilities;therefore, log-linear models are typically re-parameterized to allow representations of pat-terns of associations. For example, the re-parameterization of the model of complete inde-pendence is
logðpijklmÞ ¼ kþ kMai þ kSj þ kCk þ kMe
l þ kVm; ð2Þ
where k is a normalization constant that ensures that the sum of the fitted (predicted)probabilities equals one, and the terms kMa
i , kSj , kCk , k
Mel and kVm are the marginal effect terms.
The marginal effects ensure that the predicted marginal probabilities equal the correspond-ing observed proportions.
One of the log-linear models that we need in our analysis represents a form of depen-dency that cannot be written as a product of marginal probabilities. This model includesall two-way interactions; that is,
56 S. Tettegah, C.J. Anderson / Contemporary Educational Psychology 32 (2007) 48–82
logðpijklmÞ ¼ kþ kMai þ kSj þ kCk þ kMe
l þ kVm þ kMaSij þ kMaC
ik þ kMaMeil þ kMaV
im þ kSCjk
þ kSMejl þ kSVjm þ kCMe
kl þ kCVkm þ kMeVlm ; ð3Þ
where k, kMai , kSj , k
Ck , k
Mel and kVm are defined above, and the terms kMaS
ij , kMaCik , kMaMe
il , kMaVim ,
kSCjk , kSMejl , kSVjm , k
CMekl , kCVkm , and kMeV
lm are the two-way interaction terms between all pairs of thevariables.
Interactions in log-linear models are defined in terms of odds ratios between pairs ofvariables conditional on other terms in the model (i.e., cross-product ratios in 2 · 2 sub-tables). The conditional odds ratios are functions of the interaction parameters in Eq.(3). For example, the modeled odds ratio for the MANAGE by SOLVE given levels k, l andm for CONCERN, MENTION, and VIGNETTE equals
p11klmp22klm
p12klmp21klm
¼ expðkMaS
11 þ kMaS
22 � kMaS
12 � kMaS
21 Þ:
6.2. Graphical representations in log-linear modeling
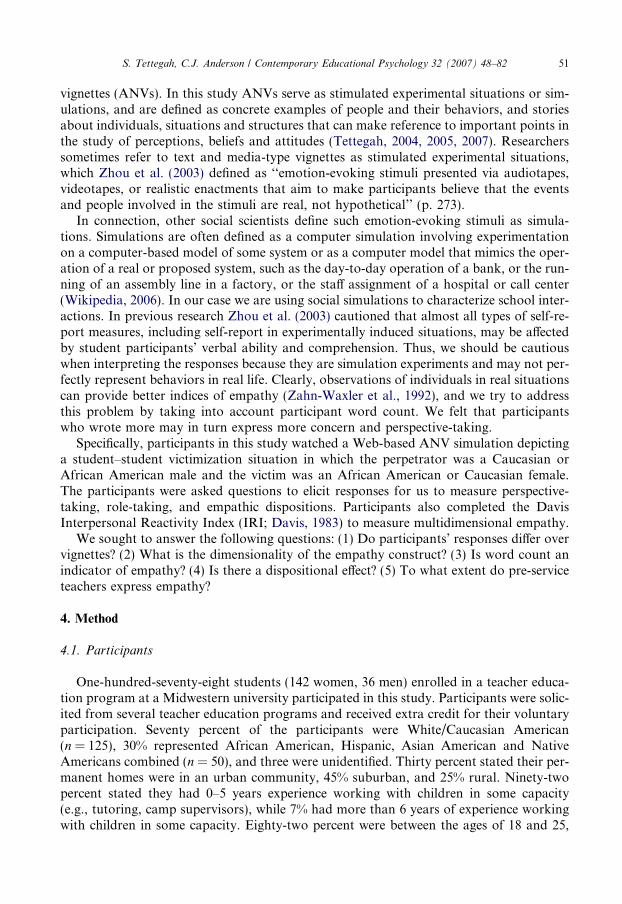
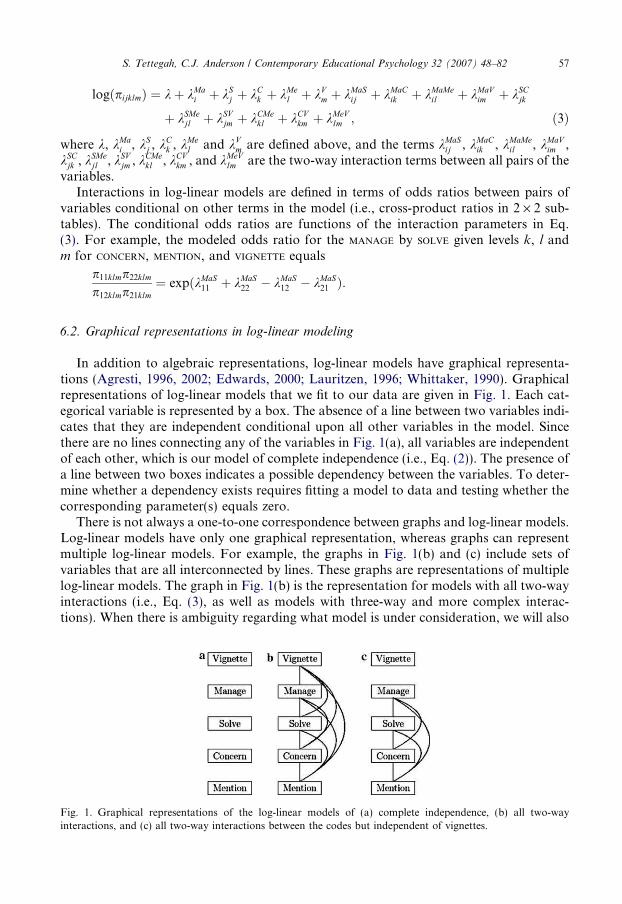
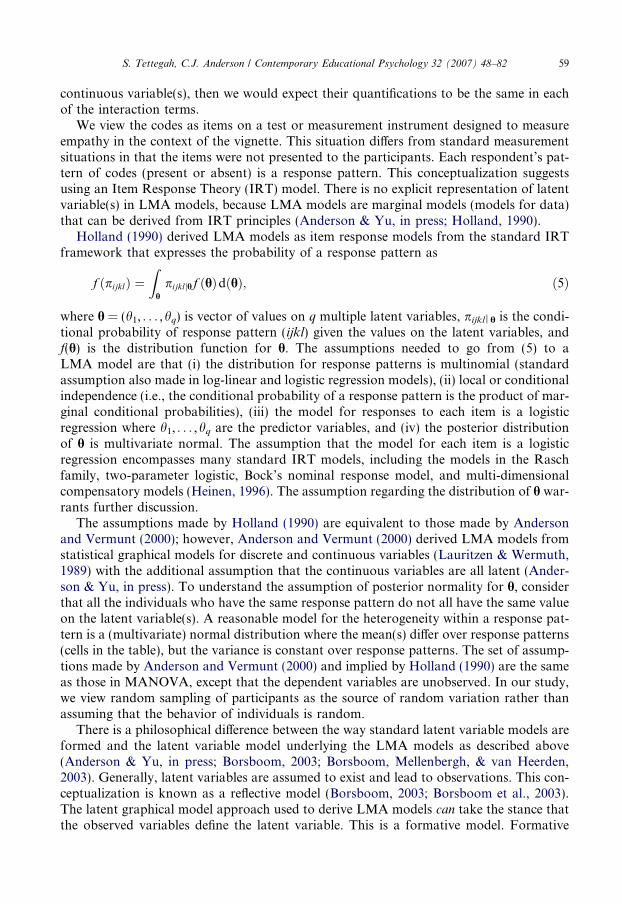
In addition to algebraic representations, log-linear models have graphical representa-tions (Agresti, 1996, 2002; Edwards, 2000; Lauritzen, 1996; Whittaker, 1990). Graphicalrepresentations of log-linear models that we fit to our data are given in Fig. 1. Each cat-egorical variable is represented by a box. The absence of a line between two variables indi-cates that they are independent conditional upon all other variables in the model. Sincethere are no lines connecting any of the variables in Fig. 1(a), all variables are independentof each other, which is our model of complete independence (i.e., Eq. (2)). The presence ofa line between two boxes indicates a possible dependency between the variables. To deter-mine whether a dependency exists requires fitting a model to data and testing whether thecorresponding parameter(s) equals zero.
There is not always a one-to-one correspondence between graphs and log-linear models.Log-linear models have only one graphical representation, whereas graphs can representmultiple log-linear models. For example, the graphs in Fig. 1(b) and (c) include sets ofvariables that are all interconnected by lines. These graphs are representations of multiplelog-linear models. The graph in Fig. 1(b) is the representation for models with all two-wayinteractions (i.e., Eq. (3), as well as models with three-way and more complex interac-tions). When there is ambiguity regarding what model is under consideration, we will also
Fig. 1. Graphical representations of the log-linear models of (a) complete independence, (b) all two-way
interactions, and (c) all two-way interactions between the codes but independent of vignettes.
S. Tettegah, C.J. Anderson / Contemporary Educational Psychology 32 (2007) 48–82 57
give verbal descriptions or algebraic representations of the models. In spite of this ambi-guity, graphs are very useful visual representations of log-linear models, as well as the log-multiplicative association models described in Section 6.3.
6.3. Log-multiplicative association models as latent variable models
Log-linear models are good at detecting dependencies in categorical data and determin-ing the complexity of associations; however, they are not sufficient to answer all of ourresearch questions regarding empathy, a latent variable. Log-multiplicative association(LMA) models are special cases of log-linear models and generalization of Goodman’s(1979, 1985; Clogg & Shihadeh, 1994) multidimensional row-column association model.The LMA models have interpretations in terms of latent continuous variables. SinceLMA models are special cases of log-linear models, results from log-linear modeling delin-eates the range of LMA models and corresponding latent variable models we shouldconsider.
Before delving into the latent variable aspects of LMA models, we start with an exam-ple of a LMA model. In LMA models, all (or a sub-set) of the unstructured interactionparameters between variables are replaced by product terms. For example, consider thefollowing bivariate interaction log-linear model (that temporarily ignores VIGNETTE):
logðpijklÞ ¼ kþ kMai þ kSj þ kCk þ kMe
l þ kMaSij þ kMaC
ik þ kMaMeil þ kSCjk þ kSMe
jl þ kCMekl :
A LMA model that is important in our analysis is obtained by replacing each of the bivar-iate interaction terms in the above log-linear model by product terms; in particular,
logðpijklÞ ¼ kþ kMa
i þ kSj þ kCk þ kMe
l þ r2mMai mSj þ r2mMa
i mCk þ r2mMai mMe
l þ r2mSj mCk
þ r2mSj mMel þ r2mCk m
Mel ; ð4Þ
where the parameters mMai , mSj , m
Ck and mMe
l are category scale values or scores for MANAGE,SOLVE, CONCERN and MENTION, respectively, and r2 is the association parameter. The cate-gory scale values and association parameter can be estimated from the data or input tofixed values. Odds ratios are direct functions of the scale values and the association param-eter. For example, the odds ratio for MANAGE and SOLVE given levels k and l of CONCERN
and MENTION equals
p11klp22kl
p12klp21kl
¼ expðr2ðmMa1 � mMa
2 ÞðmS1 � mS2ÞÞ:
For a one unit change in MANAGE and a one unit change in SOLVE, the odds ratio equalsexp(r2); that is, r 2 is a measure of the strength of the association between each pair ofvariables. As we will see when we use LMA models as latent variable models, scale valuesand association parameters provide estimates of means, variances, and (if applicable)covariances of latent variables.
Note that the scale values for each variable in the LMA given in Eq. (4) are the sameacross the terms that involve the variable. For example, the scale values for MANAGE, mMa
i ,in the interaction between MANAGE and SOLVE are the same as the ones in the interactionbetween MANAGE each of the other empathy codes. Further, the association parameterr2 is the same over all interaction terms. Foreshadowing our discussion of the latentvariable interpretation of LMA models, if the codes are related to some underlying
58 S. Tettegah, C.J. Anderson / Contemporary Educational Psychology 32 (2007) 48–82
continuous variable(s), then we would expect their quantifications to be the same in eachof the interaction terms.
We view the codes as items on a test or measurement instrument designed to measureempathy in the context of the vignette. This situation differs from standard measurementsituations in that the items were not presented to the participants. Each respondent’s pat-tern of codes (present or absent) is a response pattern. This conceptualization suggestsusing an Item Response Theory (IRT) model. There is no explicit representation of latentvariable(s) in LMA models, because LMA models are marginal models (models for data)that can be derived from IRT principles (Anderson & Yu, in press; Holland, 1990).
Holland (1990) derived LMA models as item response models from the standard IRTframework that expresses the probability of a response pattern as
f ðpijklÞ ¼Z
h
pijkljhf ðhÞdðhÞ; ð5Þ
where h = (h1, . . . ,hq) is vector of values on q multiple latent variables, pijkl Œh is the condi-tional probability of response pattern (ijkl) given the values on the latent variables, andf(h) is the distribution function for h. The assumptions needed to go from (5) to aLMA model are that (i) the distribution for response patterns is multinomial (standardassumption also made in log-linear and logistic regression models), (ii) local or conditionalindependence (i.e., the conditional probability of a response pattern is the product of mar-ginal conditional probabilities), (iii) the model for responses to each item is a logisticregression where h1, . . . ,hq are the predictor variables, and (iv) the posterior distributionof h is multivariate normal. The assumption that the model for each item is a logisticregression encompasses many standard IRT models, including the models in the Raschfamily, two-parameter logistic, Bock’s nominal response model, and multi-dimensionalcompensatory models (Heinen, 1996). The assumption regarding the distribution of h war-rants further discussion.
The assumptions made by Holland (1990) are equivalent to those made by Andersonand Vermunt (2000); however, Anderson and Vermunt (2000) derived LMA models fromstatistical graphical models for discrete and continuous variables (Lauritzen & Wermuth,1989) with the additional assumption that the continuous variables are all latent (Ander-son & Yu, in press). To understand the assumption of posterior normality for h, considerthat all the individuals who have the same response pattern do not all have the same valueon the latent variable(s). A reasonable model for the heterogeneity within a response pat-tern is a (multivariate) normal distribution where the mean(s) differ over response patterns(cells in the table), but the variance is constant over response patterns. The set of assump-tions made by Anderson and Vermunt (2000) and implied by Holland (1990) are the sameas those in MANOVA, except that the dependent variables are unobserved. In our study,we view random sampling of participants as the source of random variation rather thanassuming that the behavior of individuals is random.
There is a philosophical difference between the way standard latent variable models areformed and the latent variable model underlying the LMA models as described above(Anderson & Yu, in press; Borsboom, 2003; Borsboom, Mellenbergh, & van Heerden,2003). Generally, latent variables are assumed to exist and lead to observations. This con-ceptualization is known as a reflective model (Borsboom, 2003; Borsboom et al., 2003).The latent graphical model approach used to derive LMA models can take the stance thatthe observed variables define the latent variable. This is a formative model. Formative
S. Tettegah, C.J. Anderson / Contemporary Educational Psychology 32 (2007) 48–82 59
models are found in economics (e.g., measured variables define gross national product)and sociology (e.g., measured variables define socio-economic status). In our study, wedefine empathy in terms of the presence of the four codes MANAGE, CONCERN, SOLVE andMENTION. In psychology and education, latent variables are assumed to exist and lead toobserved behavior; however, the existence of latent variables is a metaphysical questionbeyond the scope of this paper. The latent graphical model also can take a more neutralstance regarding whether latent variables are prior to observed ones. In graphs for forma-tive models, arrows go from observed variable to latent ones, and in graphs for reflectivemodels, arrows go from the latent to the observed variables. Notice that we have not putarrows on the lines in our graphs; LMA models can be derived from directed (formativemodels) or non-directed relationships (Lauritzen & Wermuth, 1989).
Although there is a philosophical difference between the two approaches, this differenceis somewhat moot. Anderson and Yu (in press) showed that LMA and standard IRT mod-els behave and perform very similarly to nearly identical even for very short tests (i.e., 4–12items). Anderson and Yu (in press) also gave further justifications for the LMA approachbased on research in the measurement literature. In the case of Rasch models, models inthe Rasch family are log-linear models of quasi-symmetry (Tijur, 1982; see also Agresti,2002). LMA models are also quasi-symmetric models when equally spaced scores are inputfor the scale values (e.g., 0 and 1 for dichotomous variables or Likert scores for variableswith 3 or more levels); however, unlike the log-linear quasi-symmetric models, LMA mod-els typically only represent bivariate associations. Exceptions that include higher-wayinteractions can be found in Anderson (2002), as well as a model reported in the resultssection of this paper. LMA models with equally spaced scores input for the categoriesof the discrete variables are limited information Rasch models.
A second justification for using LMA models for item responses comes from both theclassical test theory and IRT literatures. When studying the response function for an itemgiven an estimate of the latent variable (i.e., pijkl Œh as a function of h), test scores are oftenused as an estimate of the latent variable; however, the item being studied should not beincluded in this test score. Rather than total test scores, rest-scores, which are test scoresminus the score for the item under study, are preferable (Junker & Sijtsma, 2000). Rest-scores lead to monotonic relationships between pijkl Œh and h, and they do not inflate thestrength of the relationship between an item and the estimate of h. In the case of multidi-mensional models, the item response functions are modeled using (weighted) rest-scoresincluding items that are related to the latent variable (Anderson, Li, & Vermunt, 2007).When standard IRT models for each item on a test are specified using rest-scores as anestimate for the latent variable, a LMA model is implied for the probability of theobserved response patterns (Anderson & Yu, in press).
6.4. Selection of LMA modeling over IRT
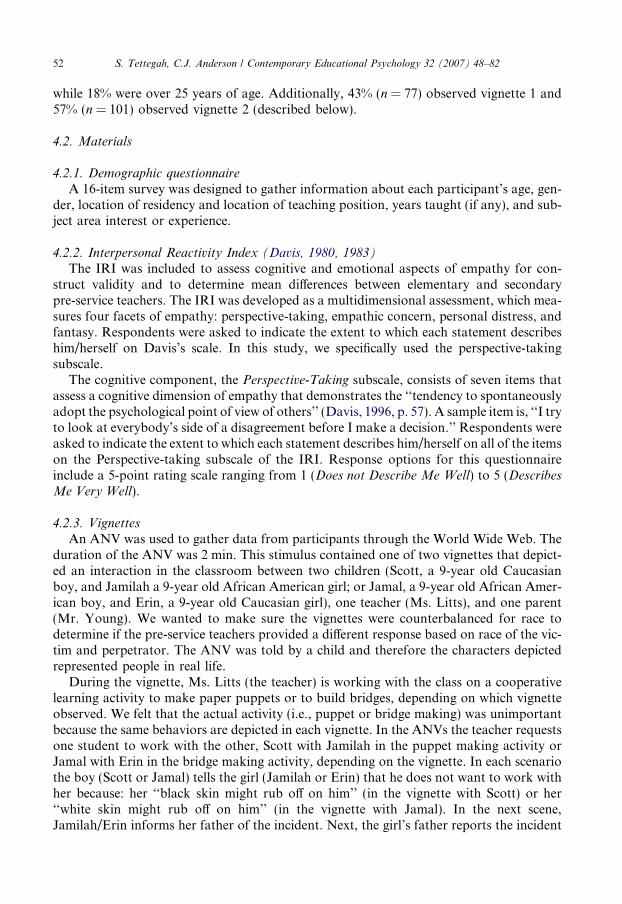
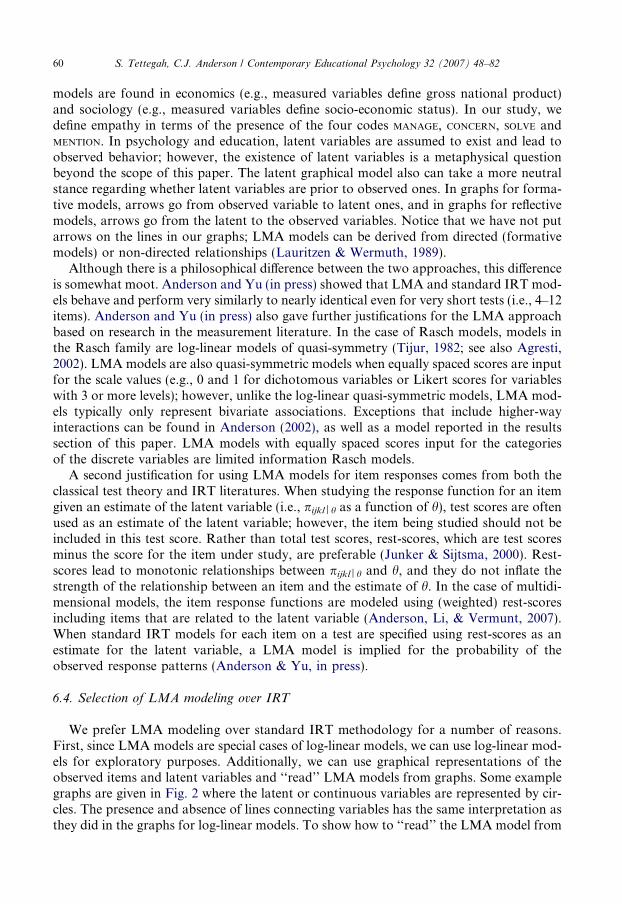
We prefer LMA modeling over standard IRT methodology for a number of reasons.First, since LMA models are special cases of log-linear models, we can use log-linear mod-els for exploratory purposes. Additionally, we can use graphical representations of theobserved items and latent variables and ‘‘read’’ LMA models from graphs. Some examplegraphs are given in Fig. 2 where the latent or continuous variables are represented by cir-cles. The presence and absence of lines connecting variables has the same interpretation asthey did in the graphs for log-linear models. To show how to ‘‘read’’ the LMA model from
60 S. Tettegah, C.J. Anderson / Contemporary Educational Psychology 32 (2007) 48–82
a graph, consider Fig. 2(b) where there is one latent variable and each of the items is relat-ed to it. This is the graphical representation of the LMA given in Eq. (4). When readingthe LMA models from the graphs, models always include a constant term k and marginaleffects terms (i.e., kMa
i , kSj , kCk and kMe
l ). The bivariate interaction terms in the model areobtained from the paths between observed variables. For example, consider the interactionbetween MANAGE and SOLVE where the path between them is
manage�H� solve;
and the interaction term for MANAGE and SOLVE equals the product of their respective scalevalues and the variance of the latent variable, mMa
i r2mSj .An additional reason for choosing LMA models is that the estimation of individuals’
values on the latent variable is a by-product of fitting the LMA model to data. The bestestimate for an individual is the mean of those with the same response pattern. For exam-ple, consider LMA model (4) with the graphical representation given in Fig. 2(b). Theadditive effects (M)ANOVA assumption of our latent variable model yields an additivefunction of the scale values (weighted by the variance) for the mean on the latent variablefor response pattern (ijkl); that is, when model (4) holds,
lijklðHÞ ¼ r2ðmMai þ mSj þ mCk þ mMe
l Þ ð6Þ
(Anderson, 2002; Anderson & Vermunt, 2000).In multidimensional models, responses from items not directly related to a latent var-
iable may contribute information through the covariance between the latent variables,which in turn improves measurement (de la Torre & Patz, 2005; Wang, Chen, & Cheng,2004). For example, consider the graph in Fig. 2(a). The means on each of the latent vari-ables equal
a b
dc
Fig. 2. Graphical representations for models with (a) two correlated latent variables, cognitive and affective, (b)
latent variable empathy, (c) latent variable empathy with residual association between Solve and Concern, and (d)
one latent variable treating SOLVE and CONCERNS as a single variable.
S. Tettegah, C.J. Anderson / Contemporary Educational Psychology 32 (2007) 48–82 61
lijklðH1Þ ¼ r21ðmMa
i þ mSj Þ þ r12ðmCk þ mMel Þ;
lijklðH2Þ ¼ r22ðmCk þ mMe
l Þ þ r21ðmMai þ mSj Þ:
In our study, we are interested in the distribution of the participants’ empathy scores; how-ever, we are also interested in how participants’ expressed empathy in their responses andhow they are related to other measured variables.
6.5. Inclusion of covariates
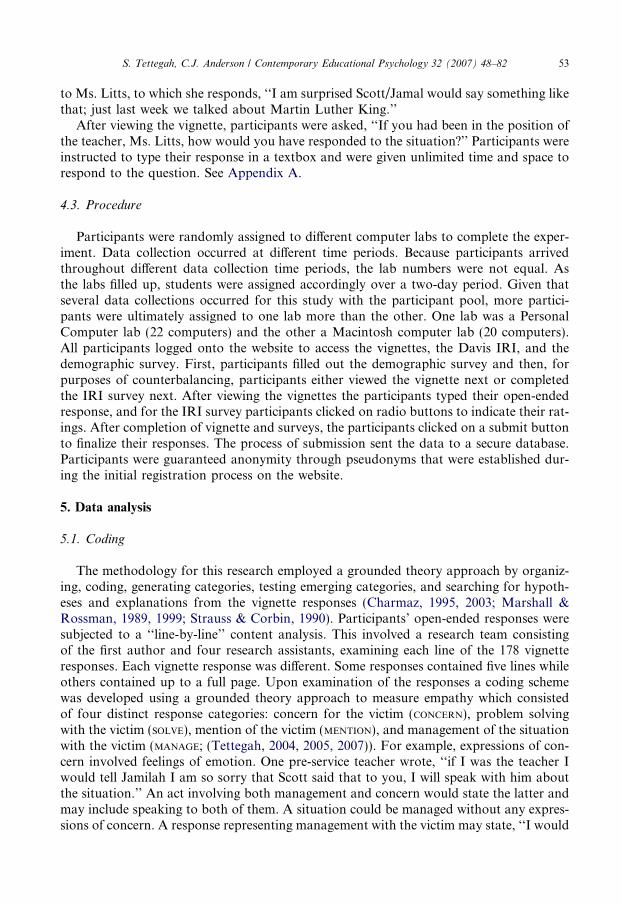
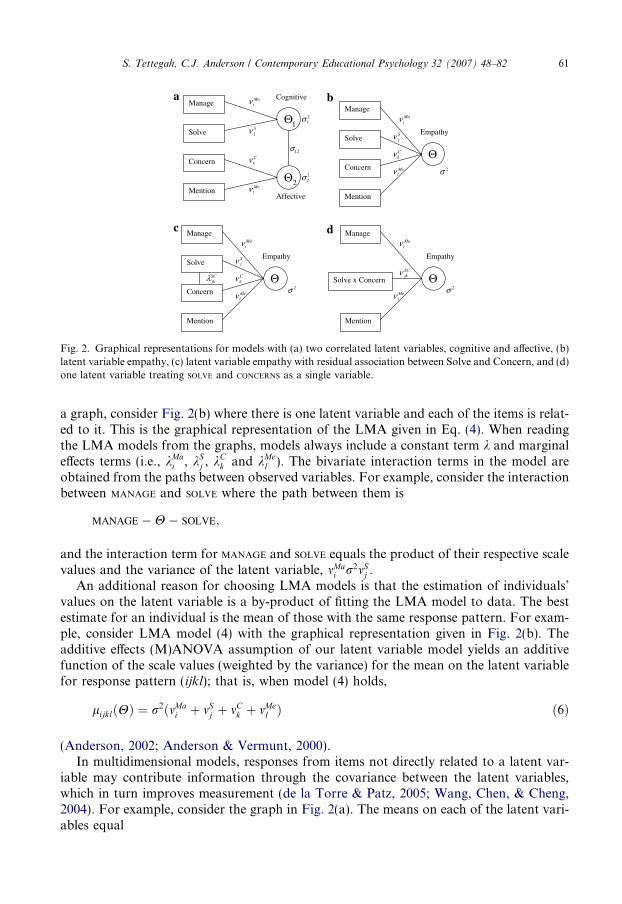
Although we can obtain estimates of individuals’ values on latent variables using IRTmethodology and use graphs to represent the system of latent and observed variables,LMA models can also include covariates in ways that are not always possible using tradi-tional IRT methodology. We will describe two methods of including concomitant infor-mation and focus on metric covariates since discrete covariates can be included byusing effect or dummy codes. One way to include covariates is as a predictor of the latentvariable; that is, the covariate is used to explain or account for some of the latent vari-able’s variance (Anderson & Bockenholt, 2000; Zwinderman, 1991, 1996). If the covariatecan account for some of the association between the observed responses, then we accountfor some of the variance of the latent variable. The graph in Fig. 3(a) represents a situationwhere we use the Perspective-taking subscale as a possible explanatory variable. The cor-responding LMA that is ‘‘read’’ from this graph is
logðpijklnÞ ¼kn þ kMai þ kSj þ kCk þ kMe
l þ kSCjk
þ r2ðmMai mSj þ mMa
i mCk þ mMai mMe
l þ mSj mCk þ mSj m
Mel þ mCk m
Mel Þ
þ bMa
i P n þ bS
j P n þ bC
k P n þ bMe
l P n;
ð7Þ
where kn equals the normalization constant for individual n, Pn equals the value of the Per-spective-taking subscale for participant n, and bMa
i , bSj , b
Ck and bMe
l are the regression coef-
a
b
Fig. 3. Graphical representations for models with the Perspective-taking sub-scale as a covariate. In graph (a),
Perspective-taking accounts for some of the empathy expressed, and in graph (b), Perspective-taking shifts the
mean of empathy.
62 S. Tettegah, C.J. Anderson / Contemporary Educational Psychology 32 (2007) 48–82
ficients for the relationship between Perspective-taking and each of the codes. The normal-ization constant kn ensures that the probabilities for individual n sum to one.
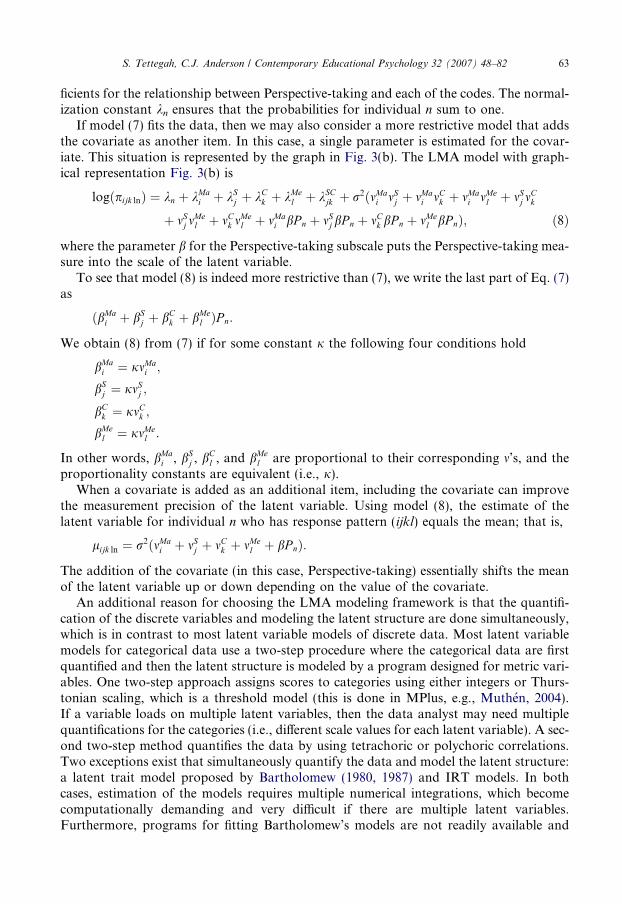
If model (7) fits the data, then we may also consider a more restrictive model that addsthe covariate as another item. In this case, a single parameter is estimated for the covar-iate. This situation is represented by the graph in Fig. 3(b). The LMA model with graph-ical representation Fig. 3(b) is
logðpijk lnÞ ¼ kn þ kMai þ kSj þ kCk þ kMe
l þ kSCjk þ r2ðmMai mSj þ mMa
i mCk þ mMai mMe
l þ mSj mCk
þ mSj mMel þ mCk m
Mel þ mMa
i bP n þ mSj bP n þ mCk bP n þ mMel bP nÞ; ð8Þ
where the parameter b for the Perspective-taking subscale puts the Perspective-taking mea-sure into the scale of the latent variable.
To see that model (8) is indeed more restrictive than (7), we write the last part of Eq. (7)as
ðbMai þ bS
j þ bCk þ bMe
l ÞP n:
We obtain (8) from (7) if for some constant j the following four conditions hold
bMai ¼ jmMa
i ;
bSj ¼ jmSj ;
bCk ¼ jmCk ;
bMel ¼ jmMe
l :
In other words, bMai , bS
j , bCl , and bMe
l are proportional to their corresponding m’s, and theproportionality constants are equivalent (i.e., j).
When a covariate is added as an additional item, including the covariate can improvethe measurement precision of the latent variable. Using model (8), the estimate of thelatent variable for individual n who has response pattern (ijkl) equals the mean; that is,
lijk ln ¼ r2ðmMai þ mSj þ mCk þ mMe
l þ bP nÞ:
The addition of the covariate (in this case, Perspective-taking) essentially shifts the meanof the latent variable up or down depending on the value of the covariate.
An additional reason for choosing the LMA modeling framework is that the quantifi-cation of the discrete variables and modeling the latent structure are done simultaneously,which is in contrast to most latent variable models of discrete data. Most latent variablemodels for categorical data use a two-step procedure where the categorical data are firstquantified and then the latent structure is modeled by a program designed for metric vari-ables. One two-step approach assigns scores to categories using either integers or Thurs-tonian scaling, which is a threshold model (this is done in MPlus, e.g., Muthen, 2004).If a variable loads on multiple latent variables, then the data analyst may need multiplequantifications for the categories (i.e., different scale values for each latent variable). A sec-ond two-step method quantifies the data by using tetrachoric or polychoric correlations.Two exceptions exist that simultaneously quantify the data and model the latent structure:a latent trait model proposed by Bartholomew (1980, 1987) and IRT models. In bothcases, estimation of the models requires multiple numerical integrations, which becomecomputationally demanding and very difficult if there are multiple latent variables.Furthermore, programs for fitting Bartholomew’s models are not readily available and
S. Tettegah, C.J. Anderson / Contemporary Educational Psychology 32 (2007) 48–82 63
different programs would be required when extensively modifying the models (e.g., chang-ing the number of latent variables, adding covariates, or placing restrictions on categoryscores). Although IRT models can be fit as non-linear mixed models (de Boeck & Wilson,2005), this approach also has estimation difficulties, especially in the case of multidimen-sional models (Glas, 2005; Wang et al., 2004).
In sum, we chose LMA models for our latent variable model in this study because theyare special cases of log-linear models. These models: (a) simultaneously quantify discretedata and model the latent structure; (b) have graphical representations; (c) are extremelyflexible in term of adding covariates; (d) yield estimates of individuals’ values on the latentvariable(s) as a by-product of fitting models to data; and, (e) use estimation proceduresthat can be done using readily available programs.
6.6. Identification constraints versus restrictions
Identification constraints are required to obtain estimates of model parameters. Theconstraints do not affect the fit of the model to data or estimates of odds ratios. For bothlog-linear and LMA models, the marginal effects and interaction parameters must havelocation constraints imposed on them, such as setting one value to a constant (e.g.,kMa
1 ¼ 0, kMaS
1j ¼ kMaS
i1 ¼ 0, bMa
1 ¼ 0) or the sum equal to a constant (e.g.,P
ikMa
i ¼ 0,P
ikMaSij ¼
P
jkMaSij ¼ 0,
P
ibMai ¼ 0). For the LMA models, all sets of the scale values need
location constraints (e.g., mMa1 ¼ 0 or
P
imMai ¼ 0). Additionally, one scaling constraint for
each latent variable must be imposed (Anderson & Vermunt, 2000).1 To set the scale,either the variance can be set equal to a constant (e.g., r2 = 1) or the sum of squared scalevalues for one variable directly related to the latent variable can be set equal to a constant
(e.g.,P
iðmMai Þ2 ¼ 1). Suppose that we set the scale using mMa
i in model (4) (i.e., graphFig. 2(b)). Since MANAGE is dichotomous and taking into account both the location andscaling constraints, the scale values for MANAGE will be set to fixed values (e.g., mMa
1 ¼ 0
and mMa2 ¼ 1, or mMa
1 ¼ �1=ffiffiffi
2p
and mMa1 ¼ 1=
ffiffiffi
2p
); however, those for mSj , mCk , and mMe
l must
be estimated and need not be equal to each other (e.g., mSj 6¼ mCj ).
We use the term restrictions to refer to conditions placed on parameters that affect thegoodness-of-fit of amodel to the data. One useful restriction is imposing equality restrictionson scale values over variables (e.g., mMa
i ¼ mSi ). Another useful restriction (for multicategoryvariables) is to impose restrictions on scale values for a particular variable. For example, intwo models reported in the results section, we treat SOLVE and CONCERN as a single variablewith four categories each of which corresponds to a combination of the presence of SOLVE
and CONCERN. In one version of this model, we impose the restriction mSC12 ¼ mSC21 .
6.7. Assessing model fit and testing hypotheses
Maximum likelihood estimation is used to estimate parameters of log-linear and LMAmodels. To assess how well a model fits the data, the goodness-of-fit likelihood ratiostatistic is used,
1 For multidimensional models, orthogonality constraints may be required when latent variables are not
correlated.
64 S. Tettegah, C.J. Anderson / Contemporary Educational Psychology 32 (2007) 48–82
G2 ¼ 2NX
i�pi� log
pi�
pi�
� �
;
where N is the size of the total sample, i* is an index for a cell in a table,2 pi* equals theproportion of observations in the i*th cell of the table, and pi* equals the maximum like-lihood estimate of the probability. If observations are independent and the model fits thedata, then for large samples the sampling distribution of G2 is approximately Chi-squarewith degrees of freedom equal to the number of cells in the table minus the number of un-ique parameters.
When including numerical covariates and analyzing the data at the individual level (i.e.,as a 178 · 2 · 2 · 2 · 2 table), the data in the table are extremely sparse. Most of theentries equal 0 and the rest equal 1. This is a violation of the asymptotic theory neededfor G2 to have an approximate Chi-square sampling distribution. If a model fits the col-lapsed data well, then when we expand the data and re-fit the same model; this providesa baseline against which to compare models with covariates. The parameter estimatesshould be exactly the same whether the data are collapsed or expanded, which providesa way to check that the data file and model has been set up correctly.
When we have nested models, conditional likelihood ratio tests are very useful, especial-ly for models fit to the individual level data. Even when the G2 of model goodness-of-fitdoes not have an approximate Chi-square distribution, the conditional likelihood ratiostatistic often is well approximated by a Chi-square distribution (Agresti, 2002). Nestedmodels most often arise when some parameters are set equal to zero. Let model M0 benested within M1. We can test whether the restrictions placed on parameters in modelM1 lead to a significant decrease in goodness-of-fit by computing the difference betweenthe logarithm of the maximum likelihood for the nested and full models; that is,
DG2 ¼ �2ðLogLikeðM0Þ � LogLikeðM1ÞÞ ¼ G2ðM0Þ � G2ðM1Þ;where LogLike(M0) and are LogLike(M1) the maximum logarithms of the likelihood forthe nested and full models, respectively, and G2 values are the model goodness-of-fit like-lihood ratio statistics. If the null hypothesis that the restrictions hold (e.g., the parame-ter(s) equals 0), then the sampling distribution of DG2 is Chi-square with degrees offreedom equal to the difference between the degrees of freedom of the two models (i.e.,Ddf = df(M1) � df(M0)).
Some of the models that we compare are not nested. In these cases, we use the dissim-ilarity index (D), the Bayesian information criterion (BIC), and Akaike’s information cri-terion (AIC). The BIC and AIC weigh the goodness-of-fit of the model to data and thecomplexity of the model. The BIC statistic also takes into account sample size. For thecollapsed data we also report the dissimilarity index, D, which equals the proportion ofobservations that would have to be moved from one cell to another for the model to fitperfectly. For all three statistics, smaller values indicate better models.
6.8. Power and sample size
Although our sample size may seem small for latent variable modeling, a sample of 178observations for a cross-classification of four dichotomous variables (i.e., 16 cells or
2 Elsewhere in the paper i is the index for the level of MANAGE.
S. Tettegah, C.J. Anderson / Contemporary Educational Psychology 32 (2007) 48–82 65
response patterns) is certainly large enough for log-linear and LMA models to obtaindecent power. When numerical variables are included in the models, the situation is anal-ogous to fitting logistic regression models with numerical predictors. Sparseness creates aproblem for assessing model goodness-of-fit, but the conditional tests for specific effectscan be quite powerful (Agresti, 2002).
When a test statistic is well approximated by a Chi-square distribution, power can becomputed for testing the global fit of log-linear and LMA models to the data and for test-ing hypotheses regarding specific effects. Assuming that a particular alternative is true,power equals the probability of rejecting the null hypothesis computed using the appropri-ate (approximate) distribution of the test statistic. In the likelihood ratio tests for log-lin-ear and LMA models, when the alternative hypothesis is true, the sampling distribution ofthe test statistic is a non-central Chi-square distribution.
To compute an estimate of power requires an estimate of the non-centrality parameterof a Chi-square distribution. An estimator of the non-centrality parameter for likelihoodratio tests equals
x ¼ 2NX
i�pi� log
pi�
~pi�
� �
;
where pi* is the true probability, and ~pi� is the maximum likelihood estimate of the prob-ability under the alternative model.3 Note that x has the same form as G2. Retrospectively,the observed data (probabilities from a saturated model) can be used to obtain estimates ofpi*. When trying prospectively to determine sample size for a given level of power,estimates of pi* from a previous study or from substantive theory can be used. Given anestimate of the non-centrality parameter and the degrees of freedom for the test, powercan be computed using any program that computes probabilities for non-central Chi-squaredistributions (e.g., SAS, the density calculator at http://calculators.stat.ucla.edu/cdf).
The size of the sub-sample of pre-service teachers to whom the Davis measure was given(only 111) decreases our power to detect effects. Even with diminished power, we foundparameter estimates for the same models fit to both the full and sub-sample that werenearly identical, and we obtained significant effects when using the sub-sample. Even still,one effect (a regression coefficient for a covariate) was statistically significant in the fullsample but not in the sub-sample.
7. Results and discussion
The computer programs SAS and lEM (Vermunt, 1997) were used to fit models to thedata. Example input files using SAS and lEM for two models are included inAppendix B. The input files for all models reported here are available from authors orat http://faculty.ed.uiuc.edu/cja/Lem_and_SAS_Cont_Ed/index.html.
Sampling zeros (response patterns with no observations) are present in the data suchthat some of the log-linear models cannot be estimated. When using log-linear models,we added .5 to all cells, which is the standard way of handling sampling zeros.4 When
3~pi� equals the value to which the maximum likelihood estimate converges to under the alternative model
(Agresti, 2002).4 An alternative way to handle sampling zeros is to use Bayesian estimation.
66 S. Tettegah, C.J. Anderson / Contemporary Educational Psychology 32 (2007) 48–82
analyzing the data by log-multiplicative association response models, there is no need toadd .5 to cells.
7.1. Do participants’ responses differ over vignettes?
Log-linear models are used to test whether the victim’s and perpetrator’s race lead todifferences in pre-service teachers’ expression of empathy. This analysis also providesthe initial justification for considering the latent variable models.
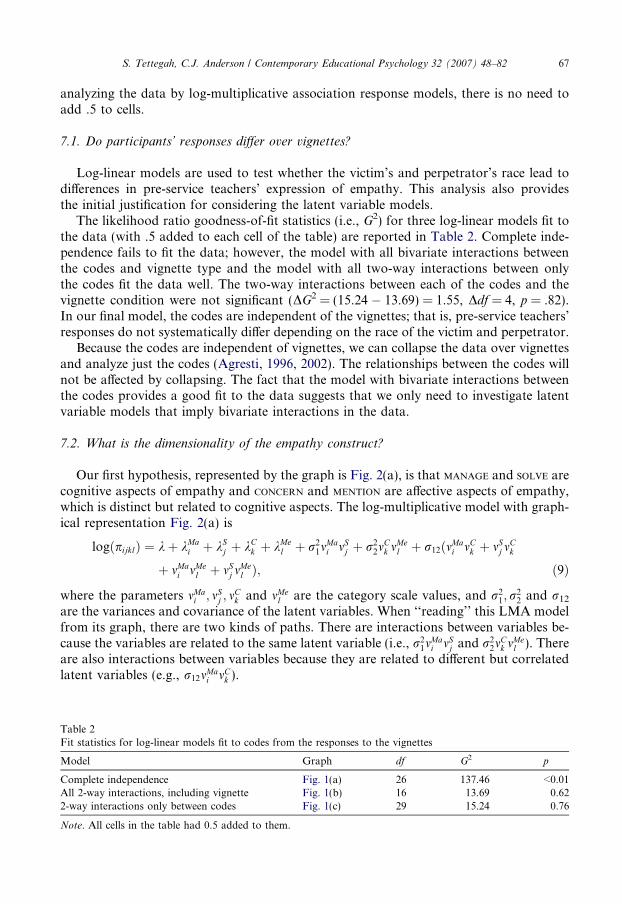
The likelihood ratio goodness-of-fit statistics (i.e., G2) for three log-linear models fit tothe data (with .5 added to each cell of the table) are reported in Table 2. Complete inde-pendence fails to fit the data; however, the model with all bivariate interactions betweenthe codes and vignette type and the model with all two-way interactions between onlythe codes fit the data well. The two-way interactions between each of the codes and thevignette condition were not significant (DG2 = (15.24 � 13.69) = 1.55, Ddf = 4, p = .82).In our final model, the codes are independent of the vignettes; that is, pre-service teachers’responses do not systematically differ depending on the race of the victim and perpetrator.
Because the codes are independent of vignettes, we can collapse the data over vignettesand analyze just the codes (Agresti, 1996, 2002). The relationships between the codes willnot be affected by collapsing. The fact that the model with bivariate interactions betweenthe codes provides a good fit to the data suggests that we only need to investigate latentvariable models that imply bivariate interactions in the data.
7.2. What is the dimensionality of the empathy construct?
Our first hypothesis, represented by the graph is Fig. 2(a), is that MANAGE and SOLVE arecognitive aspects of empathy and CONCERN and MENTION are affective aspects of empathy,which is distinct but related to cognitive aspects. The log-multiplicative model with graph-ical representation Fig. 2(a) is
logðpijklÞ ¼ kþ kMai þ kSj þ kCk þ kMe
l þ r21m
Mai mSj þ r2
2mCk m
Mel þ r12ðmMa
i mCk þ mSj mCk
þ mMai mMe
l þ mSj mMel Þ; ð9Þ
where the parameters mMai ; mSj ; m
Ck and mMe
l are the category scale values, and r21; r
22 and r12
are the variances and covariance of the latent variables. When ‘‘reading’’ this LMA modelfrom its graph, there are two kinds of paths. There are interactions between variables be-cause the variables are related to the same latent variable (i.e., r2
1mMai mSj and r2
2mCk m
Mel ). There
are also interactions between variables because they are related to different but correlatedlatent variables (e.g., r12m
Mai mCk ).
Table 2
Fit statistics for log-linear models fit to codes from the responses to the vignettes
Model Graph df G2 p
Complete independence Fig. 1(a) 26 137.46 <0.01
All 2-way interactions, including vignette Fig. 1(b) 16 13.69 0.62
2-way interactions only between codes Fig. 1(c) 29 15.24 0.76
Note. All cells in the table had 0.5 added to them.
S. Tettegah, C.J. Anderson / Contemporary Educational Psychology 32 (2007) 48–82 67
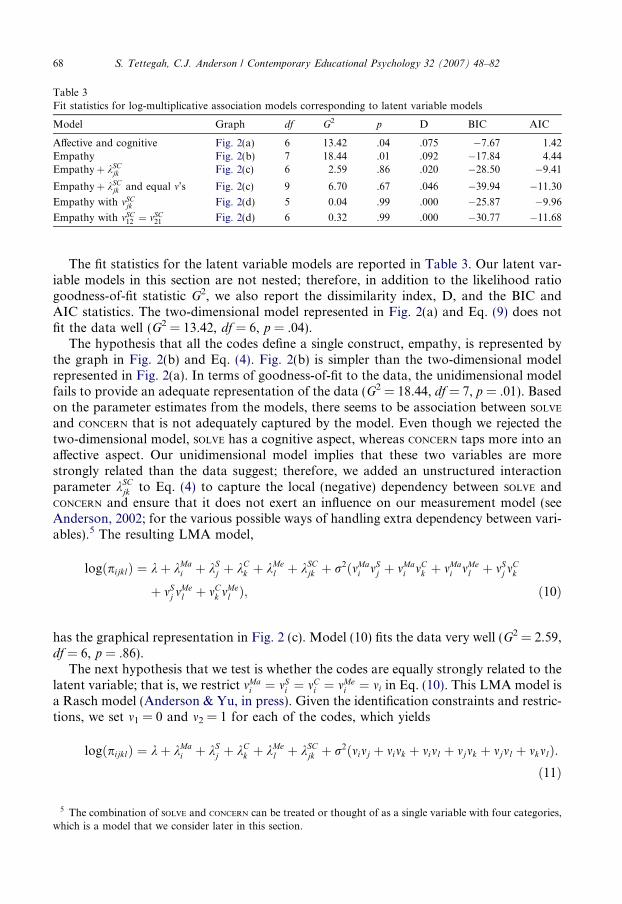
The fit statistics for the latent variable models are reported in Table 3. Our latent var-iable models in this section are not nested; therefore, in addition to the likelihood ratiogoodness-of-fit statistic G2, we also report the dissimilarity index, D, and the BIC andAIC statistics. The two-dimensional model represented in Fig. 2(a) and Eq. (9) does notfit the data well (G2 = 13.42, df = 6, p = .04).
The hypothesis that all the codes define a single construct, empathy, is represented bythe graph in Fig. 2(b) and Eq. (4). Fig. 2(b) is simpler than the two-dimensional modelrepresented in Fig. 2(a). In terms of goodness-of-fit to the data, the unidimensional modelfails to provide an adequate representation of the data (G2 = 18.44, df = 7, p = .01). Basedon the parameter estimates from the models, there seems to be association between SOLVE
and CONCERN that is not adequately captured by the model. Even though we rejected thetwo-dimensional model, SOLVE has a cognitive aspect, whereas CONCERN taps more into anaffective aspect. Our unidimensional model implies that these two variables are morestrongly related than the data suggest; therefore, we added an unstructured interactionparameter kSCjk to Eq. (4) to capture the local (negative) dependency between SOLVE andCONCERN and ensure that it does not exert an influence on our measurement model (seeAnderson, 2002; for the various possible ways of handling extra dependency between vari-ables).5 The resulting LMA model,
logðpijklÞ ¼ kþ kMai þ kSj þ kCk þ kMe
l þ kSCjk þ r2ðmMai mSj þ mMa
i mCk þ mMai mMe
l þ mSj mCk
þ mSj mMel þ mCk m
Mel Þ; ð10Þ
has the graphical representation in Fig. 2 (c). Model (10) fits the data very well (G2 = 2.59,df = 6, p = .86).
The next hypothesis that we test is whether the codes are equally strongly related to thelatent variable; that is, we restrict mMa
i ¼ mSi ¼ mCi ¼ mMei ¼ mi in Eq. (10). This LMA model is
a Rasch model (Anderson & Yu, in press). Given the identification constraints and restric-tions, we set m1 = 0 and m2 = 1 for each of the codes, which yields
logðpijklÞ ¼ kþ kMai þ kSj þ kCk þ kMe
l þ kSCjk þ r2ðmimj þ mimk þ miml þ mjmk þ mjml þ mkmlÞ:ð11Þ
Table 3
Fit statistics for log-multiplicative association models corresponding to latent variable models
Model Graph df G2 p D BIC AIC
Affective and cognitive Fig. 2(a) 6 13.42 .04 .075 �7.67 1.42
Empathy Fig. 2(b) 7 18.44 .01 .092 �17.84 4.44
Empathyþ kSCjk Fig. 2(c) 6 2.59 .86 .020 �28.50 �9.41
Empathyþ kSCjk and equal m’s Fig. 2(c) 9 6.70 .67 .046 �39.94 �11.30
Empathy with mSCjk Fig. 2(d) 5 0.04 .99 .000 �25.87 �9.96
Empathy with mSC12 ¼ mSC21 Fig. 2(d) 6 0.32 .99 .000 �30.77 �11.68
5 The combination of SOLVE and CONCERN can be treated or thought of as a single variable with four categories,
which is a model that we consider later in this section.
68 S. Tettegah, C.J. Anderson / Contemporary Educational Psychology 32 (2007) 48–82
The model with the equality restrictions fits well in terms of all the goodness-of-fit statis-tics, and based on the BIC and AIC statistics, it is the most parsimonious of all of themodels fit to the data.
One last structural model was considered that treats SOLVE and CONCERN as a single var-iable with four levels. This model is represented by the graph in Fig. 2(d) and correspondsto the following LMA model,
logðpijklÞ ¼ kþ kMai þ kSCjk þ kMe
l þ r2ðmMai mSCjk þ mMa
i mMel þ mSCjk m
Mel Þ; ð12Þ
which like models (10) and (11) includes an unstructured interaction parameter for SOLVE
and CONCERN (i.e., kSCjk ). This model fits the data extremely well (G2 = 0.04, df = 5, p = .99);however, it is not as parsimonious as model (11).
There are two noteworthy features about model (12). The first is that the estimated scalevalue mSC12 is approximately equal to mSC21 , which means that when only one of the two codes,SOLVE and CONCERN, is present, the contribution to the mean of the latent variable is thesame regardless of which code is present. In other words, whether SOLVE or CONCERN ispresent does not lead to a difference in terms of the mean on the latent variable, whichis the same as model (11). We re-fit model (12) imposing this restriction on the scale valuesand again achieved an excellent fit of the model to the data (G2 = 0.32, df = 6, p = .99).Second, model (12) includes three-way interactions between SOLVE, CONCERN and each ofthe other two codes (i.e., the terms r2mMa
i mSCjk and r2mSCjk mMel represent 3-way interactions).
Adding three-way interactions seems to us to be over-fitting the data. The AIC statisticsfor models (11) and (12) are nearly equivalent (i.e., �11.30 and �11.68), and thus donot provide a basis for making a decision. The BIC statistics clearly favor model (11)(i.e., �39.94 versus �30.77). In sum, since interpretations of models (11) and (12) are sim-ilar, three-way interactions do not seem to be warranted, and the BIC favors model (11),we selected model (11) as our final model.
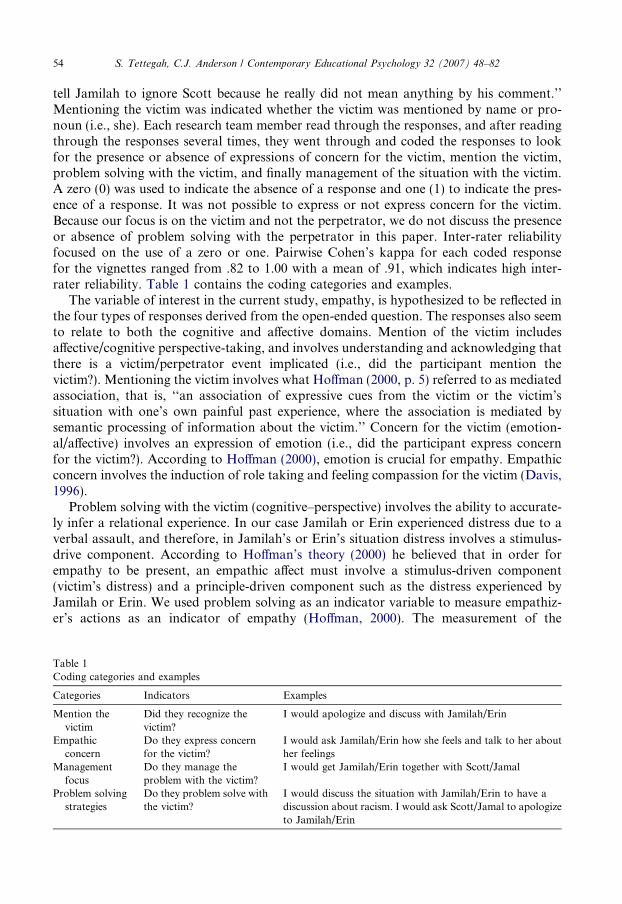
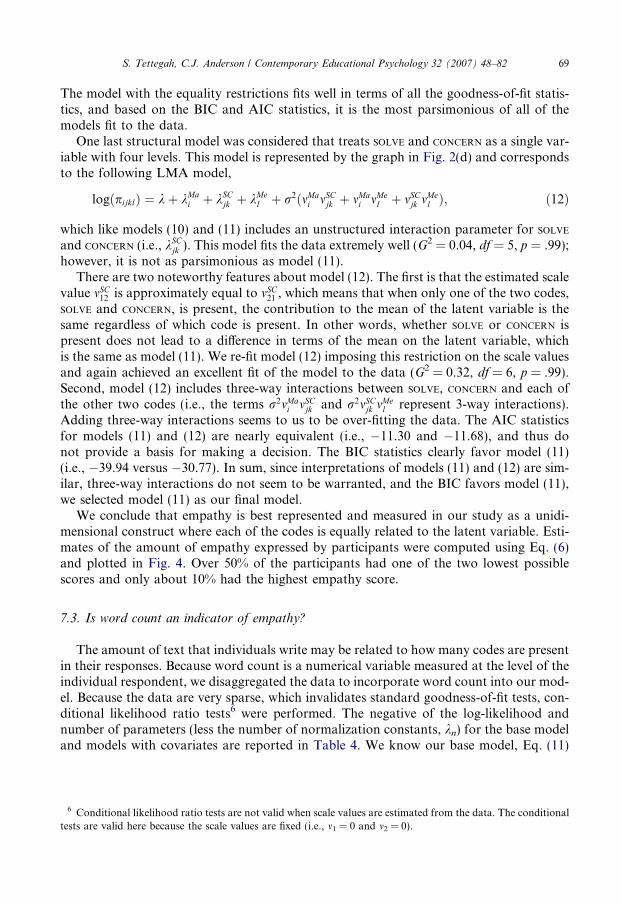
We conclude that empathy is best represented and measured in our study as a unidi-mensional construct where each of the codes is equally related to the latent variable. Esti-mates of the amount of empathy expressed by participants were computed using Eq. (6)and plotted in Fig. 4. Over 50% of the participants had one of the two lowest possiblescores and only about 10% had the highest empathy score.
7.3. Is word count an indicator of empathy?
The amount of text that individuals write may be related to how many codes are presentin their responses. Because word count is a numerical variable measured at the level of theindividual respondent, we disaggregated the data to incorporate word count into our mod-el. Because the data are very sparse, which invalidates standard goodness-of-fit tests, con-ditional likelihood ratio tests6 were performed. The negative of the log-likelihood andnumber of parameters (less the number of normalization constants, kn) for the base modeland models with covariates are reported in Table 4. We know our base model, Eq. (11)
6 Conditional likelihood ratio tests are not valid when scale values are estimated from the data. The conditional
tests are valid here because the scale values are fixed (i.e., m1 = 0 and m2 = 0).
S. Tettegah, C.J. Anderson / Contemporary Educational Psychology 32 (2007) 48–82 69
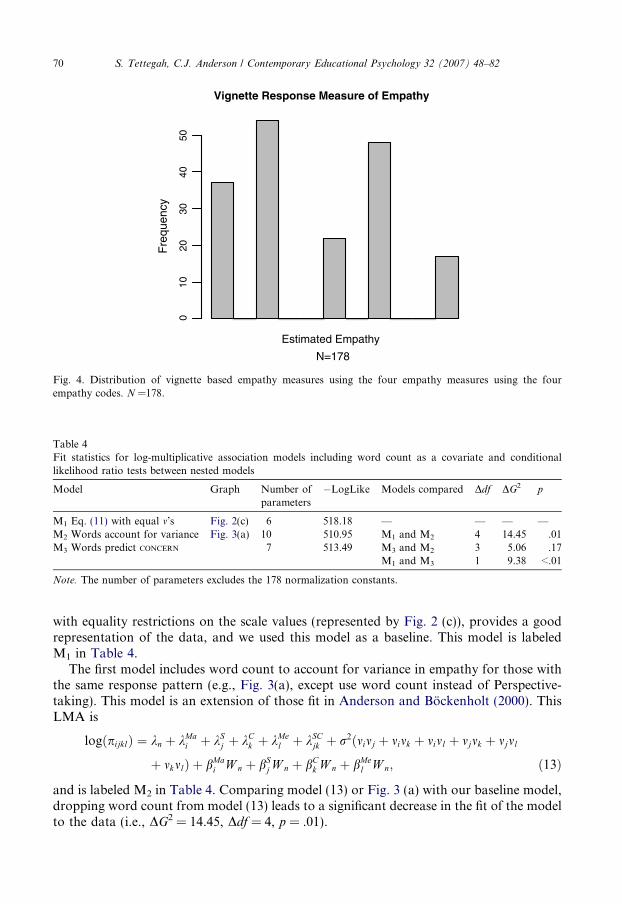
with equality restrictions on the scale values (represented by Fig. 2 (c)), provides a goodrepresentation of the data, and we used this model as a baseline. This model is labeledM1 in Table 4.
The first model includes word count to account for variance in empathy for those withthe same response pattern (e.g., Fig. 3(a), except use word count instead of Perspective-taking). This model is an extension of those fit in Anderson and Bockenholt (2000). ThisLMA is
logðpijklÞ ¼ kn þ kMai þ kSj þ kCk þ kMe
l þ kSCjk þ r2ðmimj þ mimk þ miml þ mjmk þ mjml
þ mkmlÞ þ bMai W n þ bS
jW n þ bCk W n þ bMe
l W n; ð13Þ
and is labeled M2 in Table 4. Comparing model (13) or Fig. 3 (a) with our baseline model,dropping word count from model (13) leads to a significant decrease in the fit of the modelto the data (i.e., DG2 = 14.45, Ddf = 4, p = .01).
Vignette Response Measure of Empathy
N=178
Estimated Empathy
Fre
qu
en
cy
010
20
30
40
50
Fig. 4. Distribution of vignette based empathy measures using the four empathy measures using the four
empathy codes. N =178.
Table 4
Fit statistics for log-multiplicative association models including word count as a covariate and conditional
likelihood ratio tests between nested models
Model Graph Number of
parameters
�LogLike Models compared Ddf DG2 p
M1 Eq. (11) with equal m’s Fig. 2(c) 6 518.18 — — — —
M2 Words account for variance Fig. 3(a) 10 510.95 M1 and M2 4 14.45 .01
M3 Words predict CONCERN 7 513.49 M3 and M2 3 5.06 .17
M1 and M3 1 9.38 <.01
Note. The number of parameters excludes the 178 normalization constants.
70 S. Tettegah, C.J. Anderson / Contemporary Educational Psychology 32 (2007) 48–82
After examining the parameter estimates and individual tests for the b terms (condition-al likelihood tests), only bC
k is statistically significant (p < .05). Imposing the restrictionthat bMa
i ¼ bS
j ¼ bMe
l ¼ 0 in Eq. (13), which is model M3 in Table 4, leads to a non-signif-icant decrease in the fit of the model to the data (i.e., DG2 = 5.06, Ddf = 3, p = .17). In con-clusion, the amount a pre-service teacher wrote only helps to predict whether an individualexpressed concern for the victim. The amount a pre-service teacher wrote does not explainthe variability in empathy among individuals or provide any additional informationregarding the amount of empathy expressed in an individual’s response.
7.4. Is there a dispositional effect?
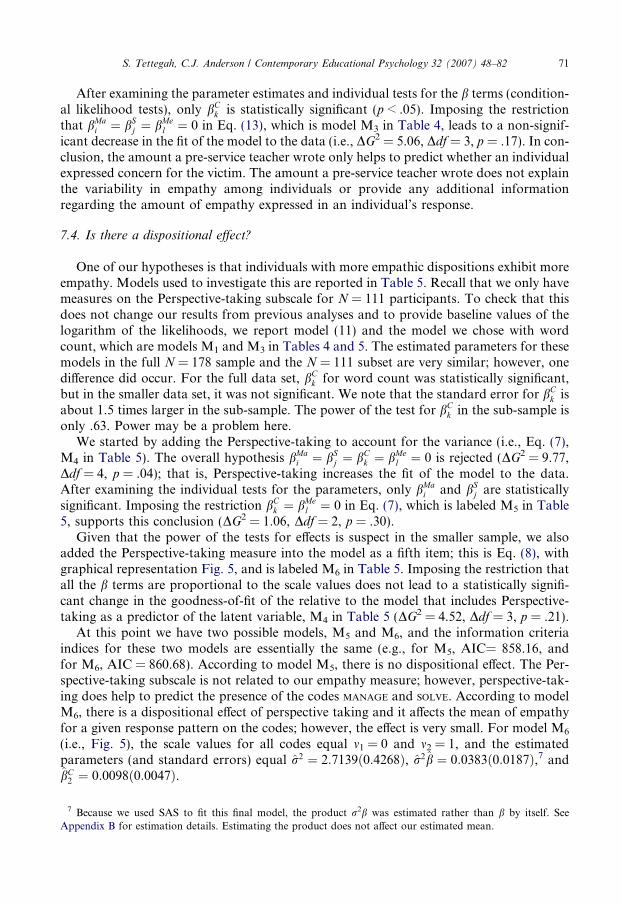
One of our hypotheses is that individuals with more empathic dispositions exhibit moreempathy. Models used to investigate this are reported in Table 5. Recall that we only havemeasures on the Perspective-taking subscale for N = 111 participants. To check that thisdoes not change our results from previous analyses and to provide baseline values of thelogarithm of the likelihoods, we report model (11) and the model we chose with wordcount, which are models M1 and M3 in Tables 4 and 5. The estimated parameters for thesemodels in the full N = 178 sample and the N = 111 subset are very similar; however, onedifference did occur. For the full data set, bC
k for word count was statistically significant,but in the smaller data set, it was not significant. We note that the standard error for bC
k isabout 1.5 times larger in the sub-sample. The power of the test for bC
k in the sub-sample isonly .63. Power may be a problem here.
We started by adding the Perspective-taking to account for the variance (i.e., Eq. (7),M4 in Table 5). The overall hypothesis bMa
i ¼ bSj ¼ bC
k ¼ bMel ¼ 0 is rejected (DG2 = 9.77,
Ddf = 4, p = .04); that is, Perspective-taking increases the fit of the model to the data.After examining the individual tests for the parameters, only bMa
i and bSj are statistically
significant. Imposing the restriction bC
k ¼ bMe
l ¼ 0 in Eq. (7), which is labeled M5 in Table5, supports this conclusion (DG2 = 1.06, Ddf = 2, p = .30).
Given that the power of the tests for effects is suspect in the smaller sample, we alsoadded the Perspective-taking measure into the model as a fifth item; this is Eq. (8), withgraphical representation Fig. 5, and is labeled M6 in Table 5. Imposing the restriction thatall the b terms are proportional to the scale values does not lead to a statistically signifi-cant change in the goodness-of-fit of the relative to the model that includes Perspective-taking as a predictor of the latent variable, M4 in Table 5 (DG2 = 4.52, Ddf = 3, p = .21).
At this point we have two possible models, M5 and M6, and the information criteriaindices for these two models are essentially the same (e.g., for M5, AIC= 858.16, andfor M6, AIC = 860.68). According to model M5, there is no dispositional effect. The Per-spective-taking subscale is not related to our empathy measure; however, perspective-tak-ing does help to predict the presence of the codes MANAGE and SOLVE. According to modelM6, there is a dispositional effect of perspective taking and it affects the mean of empathyfor a given response pattern on the codes; however, the effect is very small. For model M6
(i.e., Fig. 5), the scale values for all codes equal m1 = 0 and m2 = 1, and the estimatedparameters (and standard errors) equal r2 ¼ 2:7139ð0:4268Þ, r2b ¼ 0:0383ð0:0187Þ,7 andbC2 ¼ 0:0098ð0:0047Þ.
7 Because we used SAS to fit this final model, the product r2b was estimated rather than b by itself. See
Appendix B for estimation details. Estimating the product does not affect our estimated mean.
S. Tettegah, C.J. Anderson / Contemporary Educational Psychology 32 (2007) 48–82 71
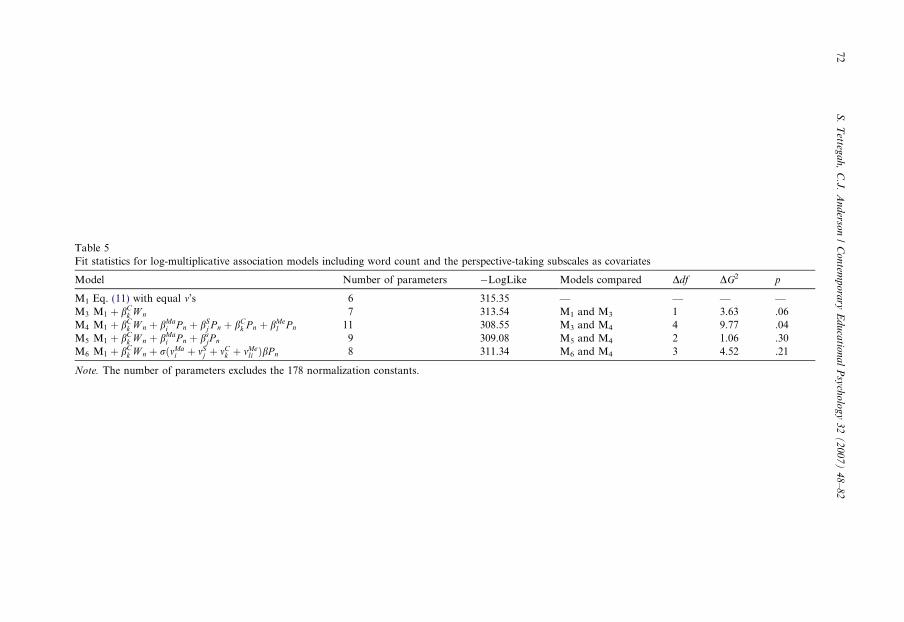
Table 5
Fit statistics for log-multiplicative association models including word count and the perspective-taking subscales as covariates
Model Number of parameters �LogLike Models compared Ddf DG2 p
M1 Eq. (11) with equal m’s 6 315.35 — — — —
M3 M1 þ bCk W n 7 313.54 M1 and M3 1 3.63 .06
M4 M1 þ bCk W n þ bMai P n þ bSj P n þ bCk P n þ bMe
l P n 11 308.55 M3 and M4 4 9.77 .04
M5 M1 þ bCk W n þ bMai P n þ bsjP n 9 309.08 M5 and M4 2 1.06 .30
M6 M1 þ bCk W n þ rðmMai þ mSj þ mCk þ mMe
li ÞbP n 8 311.34 M6 and M4 3 4.52 .21
Note. The number of parameters excludes the 178 normalization constants.
72
S.Tetteg
ah,C.J.Anderso
n/Contem
porary
Educatio
nalPsychology32(2007)48–82
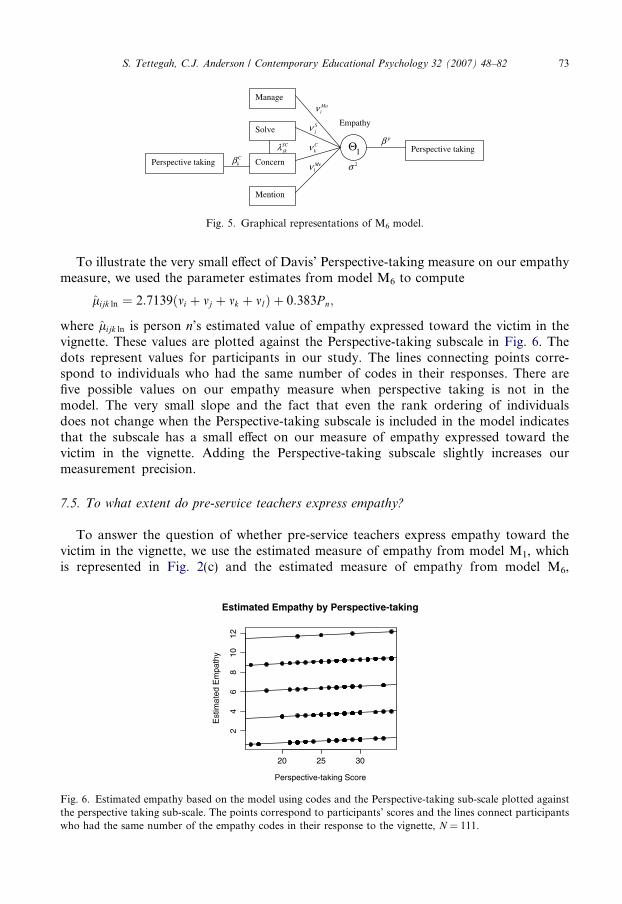
To illustrate the very small effect of Davis’ Perspective-taking measure on our empathymeasure, we used the parameter estimates from model M6 to compute
lijk ln ¼ 2:7139ðmi þ mj þ mk þ mlÞ þ 0:383P n;
where lijk ln is person n’s estimated value of empathy expressed toward the victim in thevignette. These values are plotted against the Perspective-taking subscale in Fig. 6. Thedots represent values for participants in our study. The lines connecting points corre-spond to individuals who had the same number of codes in their responses. There arefive possible values on our empathy measure when perspective taking is not in themodel. The very small slope and the fact that even the rank ordering of individualsdoes not change when the Perspective-taking subscale is included in the model indicatesthat the subscale has a small effect on our measure of empathy expressed toward thevictim in the vignette. Adding the Perspective-taking subscale slightly increases ourmeasurement precision.
7.5. To what extent do pre-service teachers express empathy?
To answer the question of whether pre-service teachers express empathy toward thevictim in the vignette, we use the estimated measure of empathy from model M1, whichis represented in Fig. 2(c) and the estimated measure of empathy from model M6,
Fig. 5. Graphical representations of M6 model.
20 25 30
24
68
10
12
Estimated Empathy by Perspective-taking
Perspective-taking Score
Estim
ate
d E
mp
ath
y
Fig. 6. Estimated empathy based on the model using codes and the Perspective-taking sub-scale plotted against
the perspective taking sub-scale. The points correspond to participants’ scores and the lines connect participants
who had the same number of the empathy codes in their response to the vignette, N = 111.
S. Tettegah, C.J. Anderson / Contemporary Educational Psychology 32 (2007) 48–82 73
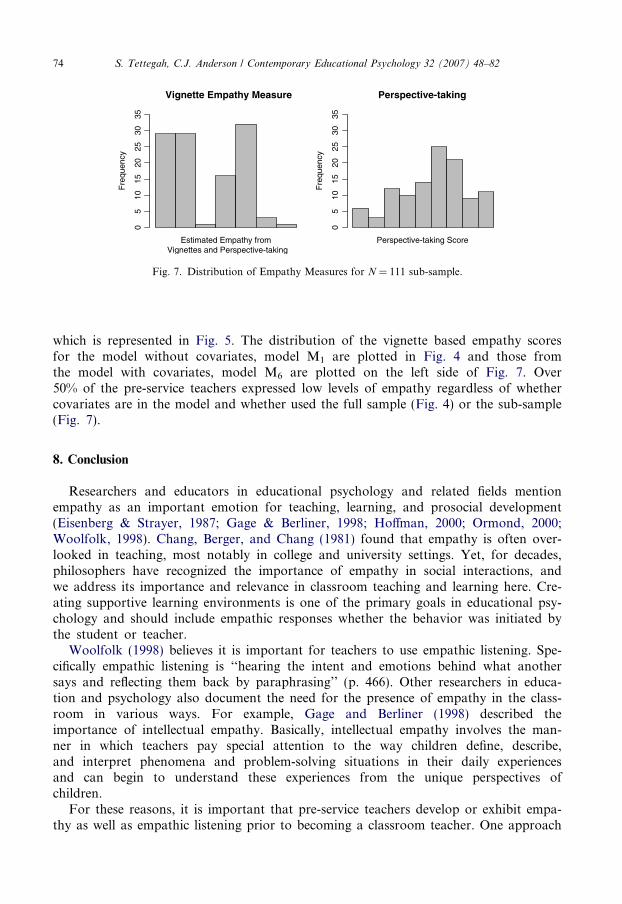
which is represented in Fig. 5. The distribution of the vignette based empathy scoresfor the model without covariates, model M1 are plotted in Fig. 4 and those fromthe model with covariates, model M6 are plotted on the left side of Fig. 7. Over50% of the pre-service teachers expressed low levels of empathy regardless of whethercovariates are in the model and whether used the full sample (Fig. 4) or the sub-sample(Fig. 7).
8. Conclusion
Researchers and educators in educational psychology and related fields mentionempathy as an important emotion for teaching, learning, and prosocial development(Eisenberg & Strayer, 1987; Gage & Berliner, 1998; Hoffman, 2000; Ormond, 2000;Woolfolk, 1998). Chang, Berger, and Chang (1981) found that empathy is often over-looked in teaching, most notably in college and university settings. Yet, for decades,philosophers have recognized the importance of empathy in social interactions, andwe address its importance and relevance in classroom teaching and learning here. Cre-ating supportive learning environments is one of the primary goals in educational psy-chology and should include empathic responses whether the behavior was initiated bythe student or teacher.
Woolfolk (1998) believes it is important for teachers to use empathic listening. Spe-cifically empathic listening is ‘‘hearing the intent and emotions behind what anothersays and reflecting them back by paraphrasing’’ (p. 466). Other researchers in educa-tion and psychology also document the need for the presence of empathy in the class-room in various ways. For example, Gage and Berliner (1998) described theimportance of intellectual empathy. Basically, intellectual empathy involves the man-ner in which teachers pay special attention to the way children define, describe,and interpret phenomena and problem-solving situations in their daily experiencesand can begin to understand these experiences from the unique perspectives ofchildren.
For these reasons, it is important that pre-service teachers develop or exhibit empa-thy as well as empathic listening prior to becoming a classroom teacher. One approach
Vignette Empathy Measure
Vignettes and Perspective-takingEstimated Empathy from
Fre
qu
en
cy
05
10
15
20
25
30
35
Perspective-taking
Perspective-taking Score
Fre
qu
en
cy
05
10
15
20
25
30
35
Fig. 7. Distribution of Empathy Measures for N = 111 sub-sample.
74 S. Tettegah, C.J. Anderson / Contemporary Educational Psychology 32 (2007) 48–82
toward meeting these goals for effective empathic responses is by determining whetherempathic responses are evident in pre-service teachers through empirical research. Thesecond step is to develop appropriate curriculum to assist in the pre-service teacher’sdevelopment and skills related to empathy prior to entering the classroom. In thisinvestigation, we examined how vignettes could reveal empathic responding of pre-ser-vice teachers. Specifying and testing a series of LMA models, we addressed severalresearch questions about the underlying dimensionality of empathy and its relationshipto other variables.
Based on an empirical model, our approach provides comparable reflections of the sin-gle underlying variable, empathy. Empathy was defined as managing the situation with thevictim, solving the problem with the victim, showing concern for the victim, and mention-ing the victim. Our modeling indicated that empathy expressed toward the victim, as wedefined it, was best represented and measured as a single latent variable. We also foundthat the amount of text written by participants was not related to the amount of empathyexpressed; however, it did help to predict whether the respondents showed concern for thevictim (the more a person wrote, the more likely s/he would express concern). Using ourvignette-based measure of empathy, race of the victim and perpetrator were not related tothe amount of empathy expressed toward the victim by participants, and overall fewerthan 50% of the participants exhibited low levels of empathy and only 10% exhibited ahigh level of empathy.
There was little, if any, effect of having an empathic disposition on the amount ofempathy expressed toward the victim. On the right side of Fig. 7, it is notable that thePerspective-taking subscale is negatively skewed. It may be the case that the partici-pants responded in a socially desirable manner when responding to items on thispaper-and-pencil survey, which could explain why the Perspective-taking measure con-tributed so little to our model. There may be an effect of empathic disposition, but theDavis Perspective-taking subscale may be yielding invalid scores. Our measure ofempathy did not run the risk of socially desirable responses because of the use ofan open ended, non-leading question. The items (codes) were unknown to the respon-dents. Our estimates of empathy measured empathy within a particular situation. If thePerspective-taking subscale is a valid measure of a dispositional trait, then we shouldbe very concerned that pre-service teachers did not show empathy toward the victimeven though they are empathic individuals.
In replications of this study with larger samples, we can further explore the relationshipbetween empathy expressed for victims of low-level aggression, as well as the relationshipbetween empathy expressed and an empathic disposition. In this study, the level of aggres-sion against the victim may not have been at a level to evoke empathy for the victim; how-ever, in future work we can manipulate the level of aggression to ascertain whether this isan important factor.
The latent variable interpretation and flexibility of log-multiplicative associationmodels were exploited in this study. One of the limitations of LMA methodology isthat standard estimation methods that use cross-classifications of items are limited toa relatively small numbers of items. This is a problem with a solution (Anderson &Vermunt, 2000). Once computer programs have fully implemented the solution tothe estimation problems, LMA models can be used to add not just subscale scores,but also responses to items on the survey type measures (e.g., items on the Davismeasure).
S. Tettegah, C.J. Anderson / Contemporary Educational Psychology 32 (2007) 48–82 75
The latent variable interpretation of LMA models using graphical models (orusing Holland’s 1990 work) assumes that the items define the latent variable. Somemay object to using LMA for measurement, because typically the latent variable isassumed to cause behavior (i.e., behavior/responses to items reflect values on thelatent variable); however, empirically, standard IRT models and LMA models behavein the same manner (Anderson & Yu, in press). Furthermore, we have explicitlydefined what an expression of empathy is in the context of the ANVs. We see usinga formative model as an advantage. By explicitly defining what empathy means andwhat empathy means in a particular context permits discussions about what empathyis.
LMA models have many advantages over other latent variable models andapproaches for discrete variables. Not all of the possible advantages of LMAmodels as latent variable models were illustrated in this article. These advantagesinclude the facts that: (a) LMA models can be very high dimensional; (b) theyeasily incorporate variables with different numbers of categories; (c) they can mod-el group effects; and, (d) the homogeneous covariance assumption can be relaxed.The computer ANVs provide a general approach to the problem of studying sit-uations where ethically we cannot manipulate the actual event (e.g., relationalaggression).
The log-linear and LMA models for statistical analysis of coded responses provide jus-tification to make generalizations to larger populations. Given the current state of devel-opment and prospects for future development in the methodologies for LMA models aslatent variable models and computer ANVs, the combined use of these tools will likelybe useful in a wide range of applications.
In sum, empathy is a very difficult construct to measure; however, the findings inthis study demonstrate how empathy can be measured and analyzed using ANVsand open-ended responses as stimulated experimental situations. We should be cautiouswhen interpreting the responses because they are situational experiments and may notrepresent actual behaviors in real life. Yet, by examining empathy using open-endedresponses, we hope to reduce the social desirability and self promoting responses thatare often associated with survey methodology (Walsh & Betz, 2001). Additional inves-tigations using more realistic settings are underway to further examine empathy. Usingthe ANVs with open-ended responses and analyzing the responses with graphical mod-els holds promise for future work studying and measuring empathy. The approach andmethodology introduced can also be adapted to study and measure latent constructs inother areas.
Acknowledgment
We would like to thank Jeroen Vermunt for computational assistance.
Appendix A
Ms. Litts (the teacher) and Mr. Frerichs (the parent) having a conversation about theErin and Jamal. This image shows the vignette and response (box) interface with a samplequestion.
76 S. Tettegah, C.J. Anderson / Contemporary Educational Psychology 32 (2007) 48–82
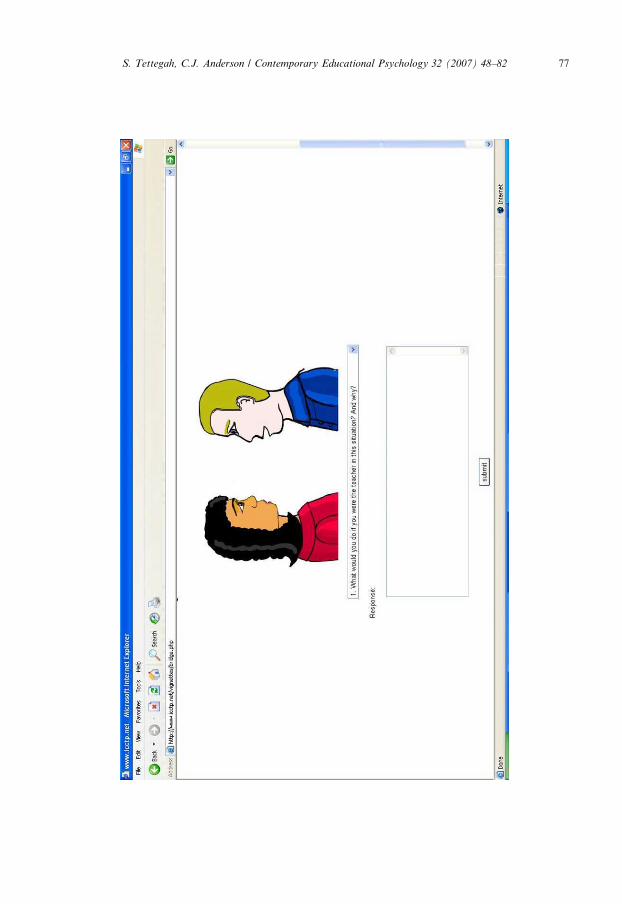
S. Tettegah, C.J. Anderson / Contemporary Educational Psychology 32 (2007) 48–82 77
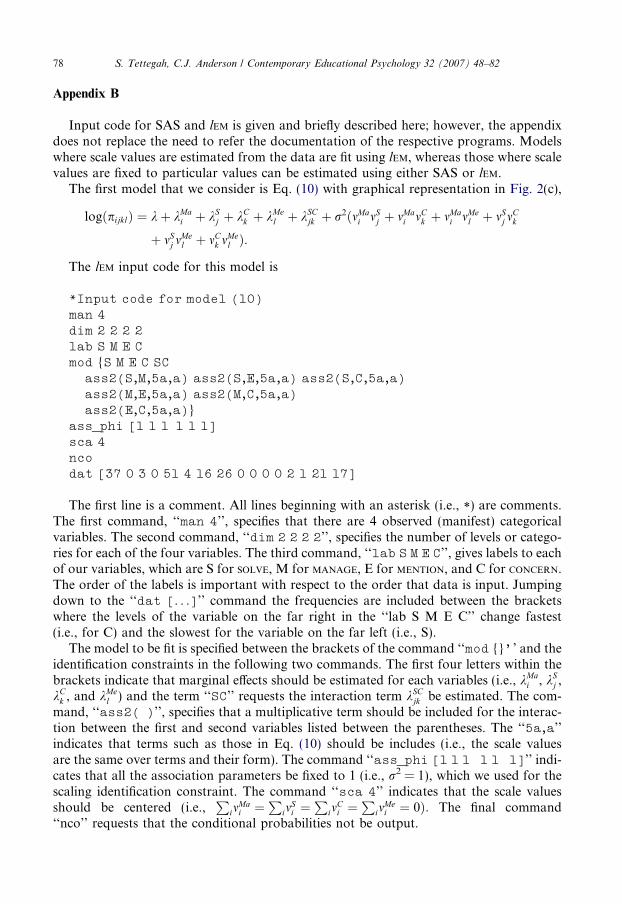
Appendix B
Input code for SAS and lEM is given and briefly described here; however, the appendixdoes not replace the need to refer the documentation of the respective programs. Modelswhere scale values are estimated from the data are fit using lEM, whereas those where scalevalues are fixed to particular values can be estimated using either SAS or lEM.
The first model that we consider is Eq. (10) with graphical representation in Fig. 2(c),
logðpijklÞ ¼ kþ kMai þ kSj þ kCk þ kMe
l þ kSCjk þ r2ðmMai mSj þ mMa
i mCk þ mMai mMe
l þ mSj mCk
þ mSj mMel þ mCk m
Mel Þ:
The lEM input code for this model is
*Input code for model (10)
man 4
dim 2 2 2 2
lab S M E C
mod {S M E C SC
ass2(S,M,5a,a) ass2(S,E,5a,a) ass2(S,C,5a,a)
ass2(M,E,5a,a) ass2(M,C,5a,a)
ass2(E,C,5a,a)}ass_phi [1 1 1 1 1 1]
sca 4
nco
dat [37 0 3 0 51 4 16 26 0 0 0 0 2 1 21 17]
The first line is a comment. All lines beginning with an asterisk (i.e., *) are comments.The first command, ‘‘man 4’’, specifies that there are 4 observed (manifest) categoricalvariables. The second command, ‘‘dim 2 2 2 2’’, specifies the number of levels or catego-ries for each of the four variables. The third command, ‘‘lab S M E C’’, gives labels to eachof our variables, which are S for SOLVE, M for MANAGE, E for MENTION, and C for CONCERN.The order of the labels is important with respect to the order that data is input. Jumpingdown to the ‘‘dat [. . .]’’ command the frequencies are included between the bracketswhere the levels of the variable on the far right in the ‘‘lab S M E C’’ change fastest(i.e., for C) and the slowest for the variable on the far left (i.e., S).
The model to be fit is specified between the brackets of the command ‘‘mod {}’’ and theidentification constraints in the following two commands. The first four letters within thebrackets indicate that marginal effects should be estimated for each variables (i.e., kMa
i , kSj ,kCk , and kMe
l ) and the term ‘‘SC’’ requests the interaction term kSCjk be estimated. The com-mand, ‘‘ass2( )’’, specifies that a multiplicative term should be included for the interac-tion between the first and second variables listed between the parentheses. The ‘‘5a,a’’indicates that terms such as those in Eq. (10) should be includes (i.e., the scale valuesare the same over terms and their form). The command ‘‘ass_phi [1 1 1 1 1 1]’’ indi-cates that all the association parameters be fixed to 1 (i.e., r2 = 1), which we used for thescaling identification constraint. The command ‘‘sca 4’’ indicates that the scale valuesshould be centered (i.e.,
P
imMai ¼
P
imSi ¼
P
imCi ¼
P
imMei ¼ 0Þ: The final command
‘‘nco’’ requests that the conditional probabilities not be output.
78 S. Tettegah, C.J. Anderson / Contemporary Educational Psychology 32 (2007) 48–82
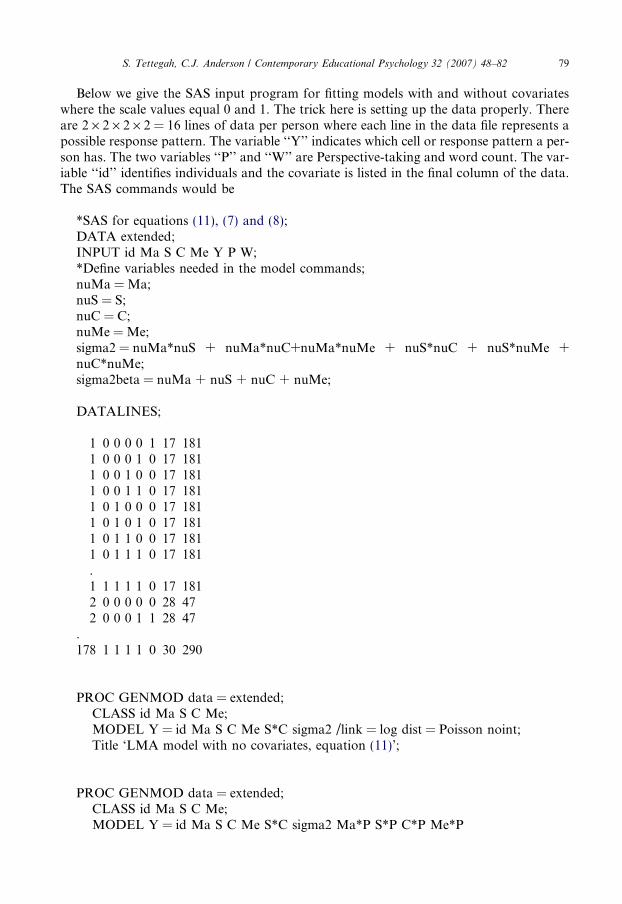
Below we give the SAS input program for fitting models with and without covariateswhere the scale values equal 0 and 1. The trick here is setting up the data properly. Thereare 2 · 2 · 2 · 2 = 16 lines of data per person where each line in the data file represents apossible response pattern. The variable ‘‘Y’’ indicates which cell or response pattern a per-son has. The two variables ‘‘P’’ and ‘‘W’’ are Perspective-taking and word count. The var-iable ‘‘id’’ identifies individuals and the covariate is listed in the final column of the data.The SAS commands would be
*SAS for equations (11), (7) and (8);DATA extended;INPUT id Ma S C Me Y P W;*Define variables needed in the model commands;nuMa = Ma;nuS = S;nuC = C;nuMe = Me;sigma2 = nuMa*nuS + nuMa*nuC+nuMa*nuMe + nuS*nuC + nuS*nuMe +nuC*nuMe;sigma2beta = nuMa + nuS + nuC + nuMe;
DATALINES;
1 0 0 0 0 1 17 1811 0 0 0 1 0 17 1811 0 0 1 0 0 17 1811 0 0 1 1 0 17 1811 0 1 0 0 0 17 1811 0 1 0 1 0 17 1811 0 1 1 0 0 17 1811 0 1 1 1 0 17 181.1 1 1 1 1 0 17 1812 0 0 0 0 0 28 472 0 0 0 1 1 28 47
.178 1 1 1 1 0 30 290
PROC GENMOD data = extended;CLASS id Ma S C Me;MODEL Y = id Ma S C Me S*C sigma2 /link = log dist = Poisson noint;Title ‘LMA model with no covariates, equation (11)’;
PROC GENMOD data = extended;CLASS id Ma S C Me;MODEL Y = id Ma S C Me S*C sigma2 Ma*P S*P C*P Me*P
S. Tettegah, C.J. Anderson / Contemporary Educational Psychology 32 (2007) 48–82 79
/link = log dist = Poisson noint;Title ‘LMA model with covariates, equation (7)’;
PROC GENMOD data = extended;CLASS id Ma S C Me;MODEL Y = id Ma S C Me S*C sigma2 sigma2beta*P W*C
/ link = log dist = Poisson noint;Title ‘The Final LMA model with Covariates’;
run;
References
Agresti, A. (1996). Introduction to categorical data analysis. NY: Wiley.
Agresti, A. (2002). Categorical data analysis (2nd Ed.). NY: Wiley.
Anderson, C. J. (2002). Analysis of multivariate frequency data by graphical models and generalizations of the
multivariate row-column association model. Psychological Methods, 7, 446–467.
Anderson, C. J., & Bockenholt, U. (2000). Graphical regression models for polytomous variables. Psychometrika,
65, 497–509.
Anderson, C. J., Li, Z., & Vermunt, J. K. (2007). Estimation of models in a Rasch family for polytomous items
and multiple latent variables. Journal of Statistical Software, 19/20.
Anderson, C. J., & Vermunt, J. K. (2000). Log-multiplicative association models as latent variable models for
nominal and/or ordinal data. Sociological Methodology, 30, 81–121.
Anderson, C. J., & Yu, H. T. (in press). Log-multiplicative association models as item response models.
Psychometrika.
Bartholomew, D. J. (1980). Factor analysis of categorical data. Journal of the Royal Statistical Society, Society B,
42, 293–321.
Bartholomew, D. J. (1987). Latent variable models and factor analysis. London: Charles Griffin & Company.
Borsboom, D. (2003). Conceptual issues in psychological measurement. Unpublished doctoral dissertation,
University of Amsterdam.
Borsboom, D., Mellenbergh, G. J., & van Heerden, J. (2003). The theoretical status of latent variables.
Psychological Review, 110, 203–219.
Boulton, M. J. (1997). Teachers’ views on bullying: Definitions, attitudes and ability to cope. British Journal of
Educational Psychology, 67, 223–233.
Chang, A. F., Berger, S. E., & Chang, B. (1981). Te relationship of student self-esteem and teacher empathy to
classroom learning. Psychology, A Quarterly of Human Behavior, 18(4), 21–25.
Charmaz, K. (1995). Grounded theory. In J. A. Smith, R. Harre, & L. V. Langenhove (Eds.), Rethinking methods
in psychology (pp. 27–49). London: Sage Publications.
Charmaz, K. (2003). Grounded theory. In J. A. Smith (Ed.), Qualitative psychology: A practical guide to research
methods (pp. 81–110). London: Sage Publications.
Clogg, C. C., & Shihadeh, E. S. (1994). Statistical models for ordinal variables. Thousand Oaks, CA: Sage.
Craig, W. M., Henderson, K., & Murphy, J. (2000). Prospective teachers’ attitudes toward bullying and
victimization. International Journal of School Psychology, 21, 5–21.
Davis, M. (1980). A multidimensional approach to individual differences in empathy. Catalog of Selected
Documents in Psychology, 10(4), 1–17.
Davis, M. (1983). Measuring individual differences in empathy: Evidence for a multidimensional approach.
Journal of Personality and Social Psychology, 44, 113–126.
Davis, M. (1996). Empathy: A social psychological approach. Madison, WI: Brown and Benchmark Publishers.
de Boeck, P., & Wilson, M. (2005). Explanatory item response models: A generalized linear and nonlinear approach.
NY: Springer.
de la Torre, J., & Patz, R. J. (2005). Making the most of what we have: A practical application of
multidimensional item response theory in test scoring. Journal of Educational and Behavioral Statistics, 30,
295–311.
80 S. Tettegah, C.J. Anderson / Contemporary Educational Psychology 32 (2007) 48–82
Deutsch, F., & Madle, R. A. (1975). Empathy: Historic and Current conceptualizations, Measurement, and a
Cognitive Theoretical Perspective. Human Development, 18, 267–287.
Edwards, D. (2000). Introduction to graphical modeling (2nd ed.). NY: Springer.
Eisenberg, N., Shea, C. L., Carlo, G., & Knight, G. (1991). Empathy-related responding and cognition: A chicken
and the egg dilemma. In W. Kurtines & J. Gewirtz (Eds.), Handbook of moral behavior and development
research (pp. 63–68). Hillsdale, NJ: Erlbaum.
Eisenberg, N., & Strayer, J. (1987). Critical issues in the study of empathy. In N. Eisenberg & J. Strayer (Eds.),
Empathy and its development (pp. 3–13). New York: Cambridge University Press.
Gage, N., & Berliner, D. (1998). Educational psychology (2nd ed.). Boston: Houghton Mifflin.
Glas, E. A. W. (2005). Review of de Boeck and Wilson explanatory item response models: A generalized linear
and nonlinear approach. Journal of Educational Measurement, 42, 303–307.
Good, T. L., & Brophy, J. E. (2000). Motivation. In T. Good & J. Brophy (Eds.), Looking in classrooms
(pp. 217–267). New York, NY: Longman.
Goodman, L. A. (1979). Simple models for the analysis of association in cross-classifications having ordered
categories. Journal of the American Statistical Association, 74, 537–552.
Goodman, L. A. (1985). The analysis of cross-classified data having ordered and/or unordered categories:
Association models, correlation models, and asymmetry models for contingency tables with or without
missing entries. The Annals of Statistics, 13, 10–69.
Hakansson, J., & Montgomery, H. (2003). Empathy as an interpersonal phenomenon. Journal of Social and
Personal Relationships, 20, 267–284.
Hazler, R. J. (1997). Bystanders: An overlooked factor in peer-on-peer abuse. Journal for the Professional
Counselor, 11, 11–21.
Hazler, R. J. (1998). Promoting personal investment in systemic approaches to school violence. Education, 119,
222–231.
Hazler, R. J., Miller, D. L., Carney, J. V., & Green, S. (2001). Adult recognition of school bullying situations.
Educational Research, 43, 133–146.
Heinen, T. (1996). Latent class and discrete latent trait models. Thousand Oaks, CA: Sage.
Hoffman, M. L. (2000). Empathy and moral development: Implications for caring and justice. New York:
Cambridge University Press.
Holland, P. W. (1990). The Dutch identity: A new tool for the study of item response models. Psychometrika, 55,
5–18.
Junker, B. W., & Sijtsma, K. (2000). Latent and manifest monotonicity in item response models. Applied
Psychological Measurement, 24, 65–81.
Kerem, E., & Fishman, N. (2001). The experience of empathy in everyday relationships: Cognitive and affective
elements. Journal of Social and Personal Relationships, 18, 709–772.
Lauritzen, S. L. (1996). Graphical models. New York: Oxford Press.
Lauritzen, S. L., & Wermuth, N. (1989). Graphical models for associations between variables, some of which are
qualitative and some quantitative. The Annals of Statistics, 17, 31–57.
Marshall, C., & Rossman, G. B. (1989). Designing qualitative research. Thousand Oaks, CA: Sage Publications.
Marshall, C., & Rossman, G. B. (1999). Designing qualitative research (3rd ed.). Thousand Oaks, CA: Sage
Publications.
Mehrabian, A., & Epstein, N. (1972). The measure of emotional empathy. Journal of Personality, 40(4),
525–543.
Muthen, B. (2004). Latent variable analysis. Growth mixture modeling and related techniques for longitudinal
data. In D. Kaplan (Ed.), The Sage handbook of quantitative methodology in the social sciences (pp. 345–368).
London: Sage.
Noddings, N. (1988). An ethic of caring and its implications for instructional arrangements. American Journal of
Education, 96, 215–230.
Ormond, J. E. (2000). Educational psychology: Developing learners. Upper Saddle River, New Jersey: Merrill
Prentice Hall.
Powers, D. A., & Xie, Y. (2000). Statistical methods for categorical data analysis. San Diego, CA: Academic Press.
Sergiovanni, T. (1994). Building community in schools. San Francisco: Jossey-Bass.
Strauss, A. L., & Corbin, J. A. (1990). Basics of qualitative research: Grounded theory procedures and techniques.
Thousands Oaks, CA: Sage Publications.
Tettegah, S. (2004, August). Pre-service teachers’ problem solving and victim empathy: What about Jamilah? Poster
session presented at the Annual Meeting of the American Psychological Association, Honolulu, HI.
S. Tettegah, C.J. Anderson / Contemporary Educational Psychology 32 (2007) 48–82 81
Tettegah, S. (2005). Technology, narratives, vignettes, and the intercultural and cross-cultural teaching portal.
Urban Education, 4, 368–393.
Tettegah, S. (2007). Preservice teachers’ victim empathy. Technology, Instruction, Cognitions and Learning, 4(2).
Tijur, T. (1982). A connection between Rasch’s item analysis model and a multiplicative Poisson model.
Scandinavian Journal of Statistics, 9, 23–30.
Vermunt, J.K. (1997). LEM : A general program for the analysis of categorical data. Retrieved January 27, 2006
from http://spitswww.uvt.nl/web/fsw/mto/lem/manual.pdf.
Walsh, W. B., & Betz, N. E. (2001). Tests and assessment (4th ed.). Englewood Cliffs, NJ: Prentice Hall.
Wang, W. C., Chen, P. H., & Cheng, Y. Y. (2004). Improving measurement precisions by test batteries using
multidimensional item response models. Psychological Methods, 9, 116–135.
Whittaker, J. (1990). Graphical models in applied mathematical multivariate statistics. New York: Wiley.
Wikipedia. The free encyclopedia (n.d.). Retrieved Jan. 30, 2006, from http://en.wikipedia.org/wiki/
Simulation#Simulation_in_education.
Woolfolk, A. (1998). Educational psychology (6th ed.). Boston: Allyn Bacon.
Yoon, J., & Kerber, K. (2003). Bullying: Elementary teachers attitudes and intervention strategies. Research in
Education, 69, 27–35.
Zahn-Waxler, C., Radke-Yarrow, M., Wagner, E., & Chapman, M. (1992). Development of concern for others.
Developmental Psychology, 28, 126–136.
Zhou, Q., Valiente, C., & Eisenberg, N. (2003). Empathy and its measurement. In N. Lopez & C. R. Snyder
(Eds.), Positive psychological assessment: A handbook of models and measures (pp. 269–281). American
Psychological Association.
Zwinderman, A. H. (1991). A generalized Rasch model for manifest predictors. Psychometrika, 56, 589–600.
Zwinderman, A. H. (1996). Response models with manifest predictors. In G. H. Fischer & I. W. Molennar (Eds.),
Rasch models: Foundations, recent developments, and applications (pp. 245–256). New York: Springer.
82 S. Tettegah, C.J. Anderson / Contemporary Educational Psychology 32 (2007) 48–82
Related Documents