ASX Release 7 May 2018 Agrimin Limited | ABN 15 122 162 396 ASX Code: AMN 2C Loch Street Nedlands, Western Australia 6009 T: +61 8 9389 5363 E: [email protected] | W: www.agrimin.com.au Page 1 of 66 PRE-FEASIBILITY STUDY COMPLETED FOR MACKAY SOP PROJECT Highlights • Pre-Feasibility Study demonstrates the potential for the Mackay Sulphate of Potash (“SOP”) Project to become a long life and low-cost supplier of SOP • Average SOP production rate of 426,000tpa is forecast over an initial 20 year life • First quartile total cash cost of US$222/t of SOP (FOB Wyndham) • Annual EBITDA forecast of US$137M, totalling US$2.7B over the initial project life • Post-tax NPV8 of US$453M and post-tax IRR of 20%, based on an average SOP price of US$555/t (FOB Wyndham) • Capital cost of US$409M (inc. US$53M contingency) has a post-tax payback period of 4.2 years • Integrated mine-to-ship logistics chain to be established through Western Australia • Agrimin Board has approved the immediate progression to a Definitive Feasibility Study, submission of an EPA referral and application for a Mining Lease • Off-take and financing discussions with various counterparties will continue while the Definitive Feasibility Study is underway Agrimin Limited (ASX: AMN) (“Agrimin” or “the Company”) announces the results of the Pre-Feasibility Study (“PFS”) for the Mackay SOP Project which is located 785km south of the Port of Wyndham, Western Australia. The PFS was managed by Advisian, the consulting business line of WorleyParsons Group. Mark Savich, CEO of Agrimin commented: “The PFS has highlighted the potential for the Mackay SOP Project to become the world’s largest and lowest cost supplier of seaborne SOP. In addition, the Project has the potential to be a catalyst for investment in regional infrastructure throughout central and top end of Australia, thereby creating sustainable economic opportunities for local communities.” “Global SOP demand is experiencing rapid growth due to evolving food production practices, and Agrimin can have an important role in providing reliable seaborne supply of this high quality fertilizer.”

Welcome message from author
This document is posted to help you gain knowledge. Please leave a comment to let me know what you think about it! Share it to your friends and learn new things together.
Transcript

ASX Release 7 May 2018
Agrimin Limited | ABN 15 122 162 396
ASX Code: AMN
2C Loch Street
Nedlands, Western Australia 6009
T: +61 8 9389 5363
E: [email protected] | W: www.agrimin.com.au
Page 1 of 66
PRE-FEASIBILITY STUDY COMPLETED FOR MACKAY SOP PROJECT
Highlights
• Pre-Feasibility Study demonstrates the potential for the Mackay Sulphate of Potash (“SOP”) Project
to become a long life and low-cost supplier of SOP
• Average SOP production rate of 426,000tpa is forecast over an initial 20 year life
• First quartile total cash cost of US$222/t of SOP (FOB Wyndham)
• Annual EBITDA forecast of US$137M, totalling US$2.7B over the initial project life
• Post-tax NPV8 of US$453M and post-tax IRR of 20%, based on an average SOP price of US$555/t
(FOB Wyndham)
• Capital cost of US$409M (inc. US$53M contingency) has a post-tax payback period of 4.2 years
• Integrated mine-to-ship logistics chain to be established through Western Australia
• Agrimin Board has approved the immediate progression to a Definitive Feasibility Study, submission
of an EPA referral and application for a Mining Lease
• Off-take and financing discussions with various counterparties will continue while the Definitive
Feasibility Study is underway
Agrimin Limited (ASX: AMN) (“Agrimin” or “the Company”) announces the results of the Pre-Feasibility Study
(“PFS”) for the Mackay SOP Project which is located 785km south of the Port of Wyndham, Western Australia.
The PFS was managed by Advisian, the consulting business line of WorleyParsons Group.
Mark Savich, CEO of Agrimin commented: “The PFS has highlighted the potential for the Mackay SOP Project to
become the world’s largest and lowest cost supplier of seaborne SOP. In addition, the Project has the potential
to be a catalyst for investment in regional infrastructure throughout central and top end of Australia, thereby
creating sustainable economic opportunities for local communities.”
“Global SOP demand is experiencing rapid growth due to evolving food production practices, and Agrimin can
have an important role in providing reliable seaborne supply of this high quality fertilizer.”

Page 2 of 66
Cautionary Statement
The Pre-Feasibility Study results, production target and forecast financial information referred to in this ASX
Release are supported by the Pre-Feasibility Study mine plan which is based on the extraction of Mineral
Resources that are classified as Indicated. There is no certainty that further exploration work and economic
assessment will result in the eventual conversion of Mineral Resources to Ore Reserves or that the production
target itself will be realised.
The consideration of all JORC modifying factors is sufficiently progressed. Hydrogeological studies and process
studies support material operating assumptions. Engineering studies support capital and operating cost
estimates and are based on standard extraction and processing techniques. Non-binding discussions are
underway with interested parties for off-take of planned production. Discussions with third party infrastructure
providers are underway. A Native Title Agreement is in place to provide the necessary consents for
development. Extensive environmental baseline studies have been completed and no social, environmental,
legal or regulatory impediments to development have been identified.
The Company has concluded it has a reasonable basis for providing the forward-looking statements included in
this ASX Release and believes it has a reasonable basis to expect it will be able to fund the development of the
Project upon successful delivery of key development milestones. The detailed reasons for these conclusions,
and material assumptions on which the forecast financial information is based, are outlined throughout this ASX
Release and in Table 16. Additionally, the assumptions for the Mineral Resources are disclosed in the JORC Code
(2012) Table 1 in this ASX Release.
The Mineral Resources underpinning the production target in this ASX Release have been prepared by a
competent person in accordance with the requirements of the JORC Code (2012).
Forward-Looking Statements
The results of the Pre-Feasibility Study are based on forward-looking information that are subject to a number
of known and unknown risks, uncertainties, and other factors that may cause actual results to differ materially
from those presented here. Forward-looking information includes such things as: exchange rates; the proposed
mine plan; projected brine concentrations and recovery rates; uncertainties and risks regarding the estimated
capital and operating costs; uncertainties and risks regarding the development timeline, including the need to
obtain the necessary approvals.
No Ore Reserve has been declared. This ASX Release has been prepared in compliance with the current JORC
Code (2012) and the ASX Listing Rules. All material assumptions on which the Pre-Feasibility Study production
target and forecast financial information is based have been included in this ASX Release, the JORC Code (2012)
Table 1 and Table 16.
The Company believes it has a reasonable basis for making the forward-looking statements in this ASX Release,
including with respect to the production target and forecast financial information. Table 16 provides the basis
for which the Pre-Feasibility Study has determined a mine plan that is technically achievable and economically
viable.
Page 3 of 66
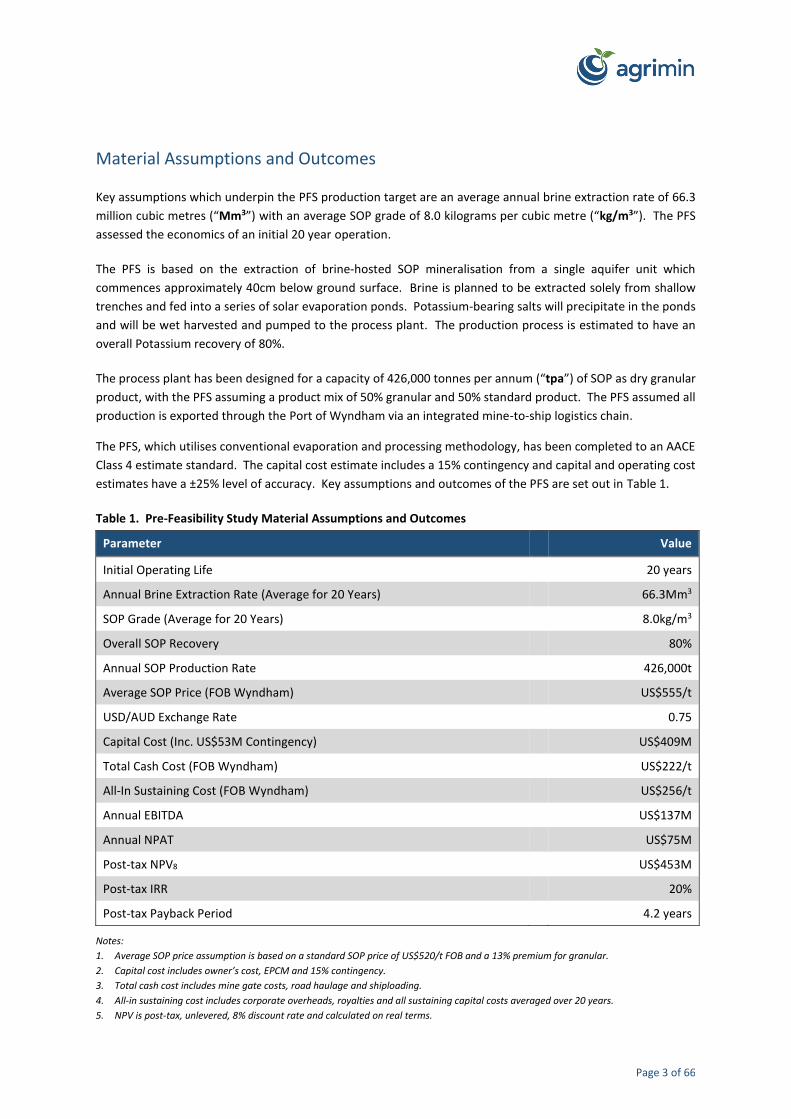
Material Assumptions and Outcomes
Key assumptions which underpin the PFS production target are an average annual brine extraction rate of 66.3
million cubic metres (“Mm3”) with an average SOP grade of 8.0 kilograms per cubic metre (“kg/m3”). The PFS
assessed the economics of an initial 20 year operation.
The PFS is based on the extraction of brine-hosted SOP mineralisation from a single aquifer unit which
commences approximately 40cm below ground surface. Brine is planned to be extracted solely from shallow
trenches and fed into a series of solar evaporation ponds. Potassium-bearing salts will precipitate in the ponds
and will be wet harvested and pumped to the process plant. The production process is estimated to have an
overall Potassium recovery of 80%.
The process plant has been designed for a capacity of 426,000 tonnes per annum (“tpa”) of SOP as dry granular
product, with the PFS assuming a product mix of 50% granular and 50% standard product. The PFS assumed all
production is exported through the Port of Wyndham via an integrated mine-to-ship logistics chain.
The PFS, which utilises conventional evaporation and processing methodology, has been completed to an AACE
Class 4 estimate standard. The capital cost estimate includes a 15% contingency and capital and operating cost
estimates have a ±25% level of accuracy. Key assumptions and outcomes of the PFS are set out in Table 1.
Table 1. Pre-Feasibility Study Material Assumptions and Outcomes
Parameter Value
Initial Operating Life 20 years
Annual Brine Extraction Rate (Average for 20 Years) 66.3Mm3
SOP Grade (Average for 20 Years) 8.0kg/m3
Overall SOP Recovery 80%
Annual SOP Production Rate 426,000t
Average SOP Price (FOB Wyndham) US$555/t
USD/AUD Exchange Rate 0.75
Capital Cost (Inc. US$53M Contingency) US$409M
Total Cash Cost (FOB Wyndham) US$222/t
All-In Sustaining Cost (FOB Wyndham) US$256/t
Annual EBITDA US$137M
Annual NPAT US$75M
Post-tax NPV8 US$453M
Post-tax IRR 20%
Post-tax Payback Period 4.2 years
Notes:
1. Average SOP price assumption is based on a standard SOP price of US$520/t FOB and a 13% premium for granular.
2. Capital cost includes owner’s cost, EPCM and 15% contingency.
3. Total cash cost includes mine gate costs, road haulage and shiploading.
4. All-in sustaining cost includes corporate overheads, royalties and all sustaining capital costs averaged over 20 years.
5. NPV is post-tax, unlevered, 8% discount rate and calculated on real terms.

Page 4 of 66
Contents
Highlights ................................................................................................................................................................ 1
Cautionary Statement............................................................................................................................................. 2
Forward-Looking Statements ................................................................................................................................. 2
Material Assumptions and Outcomes .................................................................................................................... 3
Project Overview .................................................................................................................................................... 5
Study Team ............................................................................................................................................................. 7
Mineral Resource Estimate ..................................................................................................................................... 7
Hydrogeological Modelling & Mine Planning ....................................................................................................... 10
Extraction Trenches .............................................................................................................................................. 11
Solar Evaporation Ponds ....................................................................................................................................... 12
Process Plant ........................................................................................................................................................ 14
Site Infrastructure ................................................................................................................................................. 15
Water Supply ........................................................................................................................................................ 16
Power Supply ........................................................................................................................................................ 17
Product Logistics ................................................................................................................................................... 17
Capital Costs ......................................................................................................................................................... 19
Operating Costs .................................................................................................................................................... 19
Financial Analysis .................................................................................................................................................. 21
Marketing ............................................................................................................................................................. 22
Social and Environmental ..................................................................................................................................... 22
Next Steps and Funding ........................................................................................................................................ 22
Competent Persons Statements ........................................................................................................................... 24
Key Project Risks ................................................................................................................................................... 24
Mineral Resource Report – Technical Overview ................................................................................................... 25
JORC Code, 2012 Edition – Table 1 ....................................................................................................................... 41
Basis for Forward-Looking Statements ................................................................................................................. 57

Page 5 of 66
Project Overview
The Mackay SOP Project is situated on Lake Mackay just north of the Tropic of Capricorn. The Project area covers
4,370km2 and is located 785km south of the Port of Wyndham, Western Australia, as shown in Figure 1.
The closest community is Kiwirrkurra which is approximately 60km southwest of the Project area. Agrimin has
signed a Native Title Agreement with Tjamu Tjamu (Aboriginal Corporation) RNTBC (“Tjamu Tjamu”), the native
title registered body corporate for the Kiwirrkurra people. The agreement provides the necessary consents for
the Project’s development and operations.
Figure 1. Project Location
Page 6 of 66
The local Kiwirrkurra people have provided strong support to the Company and are enthusiastic about the range
of opportunities that a long-term and large-scale Project can create. The Project has the potential to provide
substantial benefits, including support for a number of land projects that are being implemented under the
Kiwirrkurra IPA Plan for Country which manages and protects the biodiversity and cultural resources within the
vast Kiwirrkurra region.
Agrimin has progressed the Project from an exploration phase to a substantial development project with
significance to the local region and the State of Western Australia. The Project is expected to employ a workforce
of approximately 200 people during operations. It will also be a catalyst for investment in regional transport
and power infrastructure throughout the central and top end of Australia.
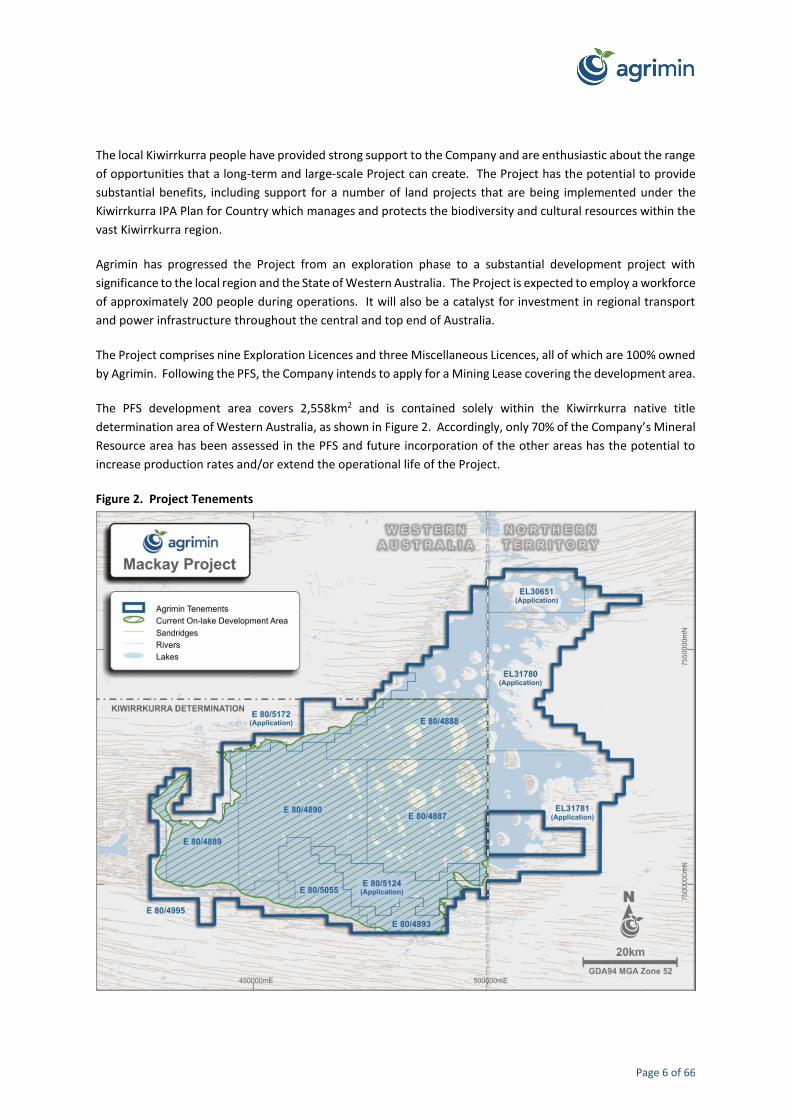
The Project comprises nine Exploration Licences and three Miscellaneous Licences, all of which are 100% owned
by Agrimin. Following the PFS, the Company intends to apply for a Mining Lease covering the development area.
The PFS development area covers 2,558km2 and is contained solely within the Kiwirrkurra native title
determination area of Western Australia, as shown in Figure 2. Accordingly, only 70% of the Company’s Mineral
Resource area has been assessed in the PFS and future incorporation of the other areas has the potential to
increase production rates and/or extend the operational life of the Project.
Figure 2. Project Tenements

Page 7 of 66
Study Team
The Company appointed Advisian in July 2017 as lead engineer and study manager for the PFS. Advisian is
experienced with large-scale greenfield and brownfield potash development projects. The PFS has examined all
aspects of the proposed Project including brine recovery, processing, logistics, implementation and operations.
Table 2 lists the key PFS consultants.
The Competent Person for the Mineral Resource is Mr Murray Brooker of Hydrominex Geoscience, and for the
process design is Mr Don Larmour of Global Potash Solutions (“GPS”).
The hydrogeological model, civil engineering and geotechnical design aspects were completed by Knight Piesold
(“KP”). Evaporation and process testwork was completed by Saskatchewan Research Council (“SRC”) at its
laboratory in Saskatoon, Canada. The evaporation and process testwork was directed and supervised by GPS,
which is also based in Saskatoon. GPS interpreted the process testwork data and completed the mass balance
and process flowsheets. Advisian completed the process plant design, capital and operating cost estimates and
financial analysis.
Table 2. Key Consultants for the Pre-Feasibility Study
Area of Responsibility Consultant Location
Lead Engineer Advisian Perth, Australia
Mineral Resource Hydrominex Geoscience & H&S Consultants Sydney, Australia
Hydrogeological Knight Piesold Perth, Australia
Civil & Geotechnical Knight Piesold Perth, Australia
Process Design Global Potash Solutions Saskatoon, Canada
Process Testwork Saskatchewan Research Council Saskatoon, Canada
Cost Estimation & Financial Model Advisian Perth, Australia
Product Logistics Qube Bulk Perth, Australia
Environmental 360 Environmental & Strategen Environmental Perth, Australia
Mineral Resource Estimate
The Mackay SOP Project is a brine-hosted potash deposit in a closed basin, salt lake setting. Brine deposits are
fundamentally different from hard rock deposits. Brine (i.e. hypersaline groundwater) is contained within the
void space of salt lake sediments and is a fluid that is subject to movement. The groundwater within the deposit
may be recharged over time which is different from hard rock deposits which are progressively mined out.
The Mineral Resource Estimate was completed in accordance with the guidelines of the Australasian Code for
Reporting Exploration Results, Mineral Resources and Ore Reserves (JORC Code), 2012 Edition. The estimation
methodology is based on procedures that have been proposed by hydrogeologists and regulators that are
applicable to Australian potash brine deposits, building on experience exploring and reporting on lithium and

Page 8 of 66
potash brine deposits in the Americas (refer to Houston et. al., 20111 and The Ontario Securities Commission2).
No Ore Reserve has been declared.
The specific yield Mineral Resource Estimate contains 26.1 million tonnes (“Mt”) of SOP to a depth of 30.0m,
shown in Table 3. This specific yield estimate represents the static free-draining portion of the deposit prior to
any extraction. It does not take into account any recharge factor which could increase the amount of extractable
brine over the life of an operation, with the resource beginning within 40cm of surface in an area with an average
annual rainfall of 280mm.
The specific yield estimate is a subset of the total porosity Mineral Resource Estimate which contains 264.4Mt
of SOP to a depth of 30.0m, shown in Table 4. A portion of this total porosity resource, in addition to the specific
yield resource, may be extractable depending on the transient conditions affecting the brine resource during
extraction and the active recharge regime within the lake system. Recharge of the sediments by rainfall and
runoff, and associated processes has been assessed as a component of the dynamic hydrogeological modelling.
Table 3. Specific Yield Mineral Resource Estimate (otherwise known as Drainable Porosity)
Resource Category State
Depth
(mbgs)
Volume (Mm³)
Average
Specific Yield
SOP Grade (kg/m³)
SOP
(Mt)
Indicated WA 0.40 – 11.25 24,182 5.0% 8.3 10.0
Inferred
WA 0.40 – 11.25 2,627 5.4% 8.2 1.2
NT 0.40 – 11.25 5,802 5.2% 7.4 2.2
WA 11.25 – 30.00 29,744 4.0% 8.0 9.6
NT 11.25 – 30.00 10,555 4.1% 7.3 3.2
Total WA & NT 0.40 – 30.00 72,909 4.5% 8.0 26.1
Table 4. Total Porosity Mineral Resource Estimate
Resource Category State
Depth
(mbgs)
Volume (Mm³)
Average
Total Porosity
SOP Grade (kg/m³)
SOP
(Mt)
Indicated WA 0.40 – 11.25 24,182 46.1% 8.3 92.2
Inferred
WA 0.40 – 11.25 2,627 46.0% 8.2 9.9
NT 0.40 – 11.25 5,802 46.0% 7.4 19.8
WA 11.25 – 30.00 29,744 45.5% 8.0 107.9
NT 11.25 – 30.00 10,555 45.2% 7.3 34.7
Total WA & NT 0.40 – 30.00 72,909 45.5% 8.0 264.4
Notes: 1. Mineral Resource below 11.25m depth and Mineral Resource outside of the Kiwirrkurra determination area are classified as Inferred.
2. Average depth of drilling was 24.7m, however the estimation extends to 30.0m where drilling reached this depth.
3. Water table is estimated to commence at approximately 40cm below ground surface.
1 Houston, J; Butcher, A; Ehren, E, Evans, K and Godfrey, L. The Evaluation of Brine Prospects and the Requirement for Modifications to Filing Standards. Economic Geology. V 106 pp 1225-1239. 2 Mineral Brine Projects and National Instrument 43-101. Standards of Disclosure for Mineral Projects. Ontario Securities Commission Staff Notice 43-704, July 22, 2011.

Page 9 of 66
Figure 3. Mineral Resource Classification for 0.40 to 11.25m Depth Profile
Figure 4. Mineral Resource Grade Distribution for 0.40 to 6.00m Depth Profile (SOP kg/m3)

Page 10 of 66
Hydrogeological Modelling & Mine Planning
The Mineral Resource is based on the dimensions of the salt lake sediments, the variations in porosity (void
space) and the SOP grade within the groundwater. An understanding of the physical properties of the salt lake
sediments and the overall aquifer hydraulics is important when assessing extractability of the Mineral Resource.
A hydrogeological model has been developed and is the key mine planning tool in determining the proportion
of the Mineral Resource which can be extracted.
Independent hydrogeological consultants developed the hydrogeological model using the MODSURFACT 3.0
software, which was calibrated in steady-state and transient mode to the data generated from the Company’s
various technical studies including long-term pumping tests. The model was developed to comprehensively
assess the overall hydrogeological system and simulate brine extraction from a trench system across Lake
Mackay. In addition, a hydrological assessment of the lake was completed, which included a flooding
assessment and the generation of an infiltration/evaporation loss model. This model was used to inform the
net recharge into the lake system and provide water balances for pre-operation and during operation of brine
extraction.
The mine plan predicts an average annual brine extraction rate of 66.3Mm3 with an average SOP grade of
8.0kg/m3 over an initial 20 year period. This equates to the extraction of 531,000tpa of SOP and is based entirely
on the extraction of the Indicated Mineral Resource (both specific yield and total porosity) within the modelled
depth of extraction of 3.0m below ground surface (“mbgs”).
The portion of the total porosity Indicated Mineral Resource contained within 3.0mbgs is 21.2Mt of SOP at a
grade of 8.1kg/m3 of brine as outlined in Table 5. The 20 year mine plan predicts that 10.6Mt (50%) of this
Indicated Mineral Resource is extracted over this period based on removal of brine from storage and an active
recharge regime within the shallow lake system and the associated processes of infiltration, mixing and diffusion.
Table 5. Total Porosity Mineral Resource Estimate Applicable to Hydrogeological Modelling
Resource Category State
Depth
(mbgs)
Volume (Mm³)
Average
Total Porosity
SOP Grade (kg/m³)
SOP
(Mt)
Indicated WA 0.40 – 3.00 5,721 45.5% 8.1 21.2
The Mineral Resource, both on a total porosity and specific yield basis, quantifies the SOP mineralisation
dissolved within the groundwater brine, not the groundwater itself. All of the SOP currently planned to be
extracted is contained within the Indicated Mineral Resource envelope as shown in Figure 3. The groundwater
which is extracted containing the SOP will comprise:
1. Current groundwater storage in the lake sediments; and
2. Future groundwater recharge into the lake sediments, predominantly from rainfall and runoff onto the
lake surface.
As the current groundwater storage in the lake is extracted, future rainfall and runoff will infiltrate the lake
surface and recharge the system. This recharge water will mix with groundwater storage within the near surface
sediments with SOP diffusing from the existing groundwater storage as it infiltrates from surface. This is
modelled as supplying a relatively consistent brine chemistry into the extraction trenches.

Page 11 of 66
Over the life of the operation, the recharge water is anticipated to gradually dilute the SOP grade of the Mineral
Resource. Consequently, the SOP grade is estimated to decrease from 8.1 to 7.7kg/m3 over the first 20 years of
the operation. The grade dilution will be offset by increasing the annual brine extraction rate from 65.5Mm3 to
68.9Mm3 through the excavation of additional trenches in order to maintain a constant production rate over
the operation’s 20 year life. The PFS mine plan is shown in Figure 5.
Figure 5. Mine Plan – Brine Extraction Rate and Grade
Extraction Trenches
The production of SOP begins with the extraction of Potassium-rich brine via an on-lake trench system, as
illustrated in Figure 6. The PFS trench network and feed channel is planned to have a length of 546km and an
average depth of 4.5m, resulting in 8.5Mm3 of excavated material. The depth of the trenches vary to allow
sufficient volume and gradient for the brine to naturally flow along the trench network southwards to the feed
channel. Brine will be transferred along the feed channel to the solar evaporation ponds with the assistance of
two pumping stations.
The PFS capital cost is based on the entire trench network being completed pre-production. The Company has
excavated 14 pilot trenches to date and these have provided geotechnical information in relation to the long-
term stability and operation of the trenches. A number of different trench designs have been trialled and the
trench side slopes assumed in the PFS have been selected based on a review of the performance of trenches in
the field.
Independent consultants at KP completed the hydrogeological modelling and geotechnical design of the
trenches. The trench network has been optimised to be laterally extensive and shallow, in order to allow the
use of the most efficient and productive excavation equipment.
0
1
2
3
4
5
6
7
8
9
0
10
20
30
40
50
60
70
80
90
1 2 3 4 5 6 7 8 9 10 11 12 13 14 15 16 17 18 19 20
SOPGrade
(kg/m3)
AnnualBrine
Extracted(Mm3)
Production Year
Brine from Storage (LHS) Brine from Recharge (LHS) SOP Grade (RHS)

Page 12 of 66
Potential exists to increase production rates and/or extend the operational life of the Project. The residual
Mineral Resource remaining within 3.0mbgs after the first 20 years of operations, plus the Mineral Resource
below this depth, represent upside not assessed in the PFS. In addition, only 70% of the on-lake area covered
by the Company’s tenements has been assessed in the PFS.
Figure 6. Proposed Trench Layout (20 Years)
Solar Evaporation Ponds
The evaporation ponds are planned to be located in the south-western area of Lake Mackay where geotechnical
testing has determined that the natural salt lake surface is suitable for un-lined evaporation ponds. The ponds
are designed to cover an area of 34km2 at start-up and be expanded to 52km2 in year 10.
Brine which is extracted via trenches from the salt lake will enter the evaporation ponds via a feed channel. This
brine will then move through a series of five ponds, as shown in Figure 7. The ponds are designed in order to
precipitate Potassium-bearing salts in the final pond. These salts will be wet harvested and pumped to the
process plant.

Page 13 of 66
The proposed size, number of cells and configuration of the evaporation ponds has been developed by GPS
based on evaporation testwork completed at SRC. The primary components of the pond design are as follows:
• Pond 0 is a pre-saturation pond that concentrates the brine to the point at which salt precipitation will
commence;
• Ponds 1 and 2 will precipitate mainly halite (NaCl) and thenardite (Na₂SO₄) waste salts. The waste salts
will be left to accumulate in Pond 1A at an approximate rate of 70cm per year and the pond walls will
be raised over time. In year 10 of operations Pond 1B will be constructed. Waste salts in Pond 2 will
be wet harvested and retained on the lake;
• Pond 3 will precipitate mainly epsomite (MgSO₄.7H₂O) waste salts. The waste salts in Pond 3 will be
wet harvested and retained on the lake; and
• Pond 4 will precipitate primarily kainite salts (KCl.MgSO₄.2.75H₂O). These Potassium-bearing salts will
be wet harvested and pumped to the process plant.
Figure 7. Proposed Evaporation Pond Layout (20 Years)

Page 14 of 66
The application of wet harvesting of the later stage waste salts and Potassium-bearing salts has delivered several
key benefits to the Project, including:
• A lower overall operating cost per tonne of salt harvested that justifies the higher upfront capital;
• An increased overall recovery due to a portion of the Potassium-bearing brine entrained in waste salts
in Ponds 2 and 3 being drained and pumped back into the pond system; and
• A decreased overall pond size due to Ponds 2, 3 and 4 not being taken off-line and dried prior to
harvesting.
The internal and external pond walls will be constructed as cut-to-fill structures using in-situ materials. The
pond area has a design vertical permeability of 8 x 10⁻¹⁰ metres per second from clay layers which indicates low
seepage losses back into the lake. The pond design includes a cut-off trench under the perimeter of the pond
embankments to key into these clay layers and the very shallow groundwater level of the lake. This trench will
further reduce overall seepage losses by reducing lateral seepage out of the ponds. A natural groundwater
mound will form underneath the large-scale ponds when the pond fill and natural water table become
connected, which can further reduce seepage rates by decreasing the overall hydraulic gradient within the pond
area. This is a key advantage of the very shallow static groundwater level that exists at Lake Mackay.
Lake Mackay’s extensive surface area also provides the flexibility for low-cost lateral pond expansions to support
potential increases to production rates and/or operational life.
Process Plant
The process plant is planned to be located to the west of the evaporation ponds and as close as practicable to
the western shore of the lake.
Kainite is the targeted Potassium-bearing salt which will be wet harvested from the final evaporation pond and
pumped to the process plant. Assay results show that kainite salt samples produced during the SRC testwork
contained 56% to 62% kainite and no deleterious elements were present. This high grade kainite is suitable for
the production of SOP (K₂SO₄) using a conventional process plant configuration (i.e. flotation, decomposition
and SOP conversion). The production process is estimated to have an overall Potassium recovery of 80%. A
simplified process flow diagram for the Project is presented in Figure 8.
The process plant design begins with the kainite salts being crushed to 850 microns and fed into a flotation
circuit to separate the kainite from halite and other minor waste salts. Following flotation, the concentrated
kainite is decomposed to schoenite (K₂SO₄.MgSO₄.6H₂O).
Following decomposition, the concentrated schoenite undergoes SOP conversion using heated water (reaction
temperature at 50°C) to dissolve magnesium sulphate (MgSO₄) and thereby precipitate SOP (K₂SO₄). The hot
brine generated from the SOP conversion step will be recycled to the evaporation ponds or cooled for use in
the kainite decomposition step.
The SOP is then dried, compacted and sized in order to meet required customer specifications. The process
plant has been designed for an annual capacity of 426,000tpa of SOP, with the ability to produce up to 100%
granular product.

Page 15 of 66
Due to the Project’s location and desert conditions, the Company’s consultants at Advisian have designed the
process plant to optimise the use of modularisation and pre-assembly modules off-site.
Figure 8. Simplified Process Flow Diagram
Site Infrastructure
The Project site is planned to be located on the western edge of Lake Mackay adjacent to the process plant
location. An indicative site layout for the process plant and associated infrastructure is shown in Figure 9.
Site infrastructure will include access roads, reverse osmosis (“RO”) plant and waste water treatment facilities,
power plant and transmission lines, 200 room accommodation camp, buildings including administration,
laboratory, medical treatment, vehicle and maintenance workshops, fire-fighting facilities and an airstrip.
The PFS has estimated an on-site workforce of approximately 160 personnel, not including 40 off-site logistics
personnel. A new bituminised airstrip is planned to be constructed to transport workers to the Project.

Page 16 of 66
Figure 9. Proposed Site Layout
Water Supply
The Project is estimated to require 3.1 gigalitres per year (“GL/year”) of process water and 0.1GL/year of potable
water. Raw water is planned to be abstracted from a borefield located approximately 38km south-east of the
proposed process plant site. The borefield location is shown in Figure 6.
Approximately 5.5GL/year of raw water with 10,000mg/L total dissolved salts (“TDS”) is planned to be abstracted
and desalinated to produce the Project’s 3.2GL/year water requirement with TDS below 5,000mg/L. The reject
brine from the RO plant will be controllably discharged via a pipeline into the solar evaporation pond facility.
Based on the Company’s water exploration drilling completed in 2017, the borefield will target an extensive
palaeovalley sand aquifer with brackish to saline water quality. The PFS borefield design consists of

Page 17 of 66
approximately 22 bores with the capacity to allow for downtime of 4 bores at any one time. The Company is
currently investigating two other areas with the potential to provide a source of fresher water. This could
potentially reduce or remove the requirement for the RO plant.
Power Supply
The Project is estimated to have a maximum operating power demand of 16.8 megawatts (“MW”) and an
average load of 14.2MW. This power load will supply the process plant, accommodation camp and supporting
facilities, RO and waste water plant, on-lake pumping infrastructure, offices and non-processing infrastructure.
The Project site will be powered by a reciprocating gas-engine based power plant. In addition, the process plant
will include a gas-fired water heating system. It is contemplated that gas is delivered via pipeline to the Project
from the Amadeus Gas Pipeline under a Build-Own-Operate (“BOO”) contract.
Diesel will be used in mobile equipment and as fuel for remote diesel-fired generators to power the brine and
fresh water pumping stations.
Product Logistics
A logistics study was completed by Qube Bulk (“Qube”) to determine the most feasible logistics chain for
transporting SOP from the Project site onto a ship at the multi-user port facility at Wyndham. As part of the
study, Qube provided an indicative FOB transportation cost with a ±15% level of accuracy.
The Qube study concluded that the following mine-to-ship logistics chain would provide the optimal solution:
• A dedicated fleet of quad road trains, as shown in Figure 10, will be loaded with a 114t payload via a
product load-out facility at the process plant site;
• Road trains will transport the product directly to a storage shed located at the Port of Wyndham and
tip the product into stockpiles;
• On arrival of a prescribed bulk carrier vessel at port, the product will be reclaimed by front end loaders
from the stockpiles and loaded into rotaboxes (i.e. rotating containers); and
• Flatbed trucks will transport the rotaboxes from the storage shed to the wharf where they will be lifted
and tipped into the vessel’s hold.
The PFS allowed for covered storage sheds at both the Project site and the port. These sheds are designed to
accommodate stockpiles with nominal 80,000t (63 days) capacity. At site, the products will be transported from
the stockpiles on a belt conveyor to either a standard or granular load-out bin.
The total road haulage distance from the Project site to the Port of Wyndham is 980km via Halls Creek. This
involves 350km along a new unsealed haul road, 250km along the unsealed Tanami Road and 380km along the
sealed Great Northern Highway. The transport route is shown in Figure 1.

Page 18 of 66
Quad road trains were selected on the basis that road infrastructure will meet the standards needed for Road
Access Vehicle (“RAV”) 10 network certification. Accordingly, the PFS contemplates the Company constructing
a 350km unsealed haul road to connect the Project site to the existing RAV 10 network.
Figure 10. Proposed Quad Road Train Configuration
Approximately 15 trucks per day will be required based on an anticipated 80 days per year of road closures
related to the Northern Australian wet season. Truck drivers will be based at the Project site, Halls Creek and
Wyndham. The haulage operation involves two legs, as shown in Figure 11, with each return trip being
completed within a 12 hour shift:
• Leg 1 – Project site to Halls Creek. Drivers based at both site and Halls Creek will meet at the half way
point and swap trucks so the truck continues onto the destination and the driver returns to the starting
point; and
• Leg 2 – Halls Creek to Wyndham. Drivers based in Wyndham and drive to Halls Creek and swap trucks
and drive back to Wyndham.
Figure 11. Proposed Haulage Operation
The Kimberley Port Authority provides oversight for the Port of Wyndham, which is a deep-water port with a
maximum tidal range of 8.2m. In 1999 the operation of the port was awarded to Cambridge Gulf Ltd (“CGL”)
and the current contract extends to 30 June 2019. Historically, 10% of Australia’s live cattle exports and up to
100,000tpa of nickel concentrate have been exported through the port.
The PFS is based on using existing wharf facilities at the Port of Wyndham for shipments of up to 15,000t in size.
The Company and CGL intend to investigate additional shiploading solutions across a range of cargo sizes to
accommodate the Company’s future customer needs.

Page 19 of 66
Capital Costs
A summary of the capital cost estimate provided by Advisian is presented in Table 6. The estimate has a ±25%
level of accuracy and a USD/AUD exchange rate of 0.75 has been assumed for foreign currency conversions.
The process plant has been designed for a capacity of 426,000tpa of SOP as dry granular product, with flexibility
to also produce a dry standard product. The off-site infrastructure primarily relates to the construction of a
350km unsealed haul road.
The capital cost estimate relating to the proposed gas supply pipeline is expected to be provided under a BOO
contract and accordingly, it has been accounted for in the operating cost estimate. Sustaining capital costs are
also accounted for in the all-in sustaining cost, as presented in Table 7.
Table 6. Capital Cost Estimates
Main Area A$M US$M
Brine Field 37.3 28.0
Evaporation Pond System 70.1 52.6
Process Plant 106.8 80.1
Utilities, Reagents & Vehicles 56.8 42.6
Site Development 2.2 1.7
Off-Site Infrastructure 122.9 92.2
Total Directs 396.1 297.1
Construction Indirects 22.8 17.1
Spares 3.2 2.4
EPCM 38.0 28.5
Owner’s Costs 14.3 10.7
Total Indirects 78.2 58.7
Contingency 71.1 53.3
Total Capital Cost 545.4 409.1
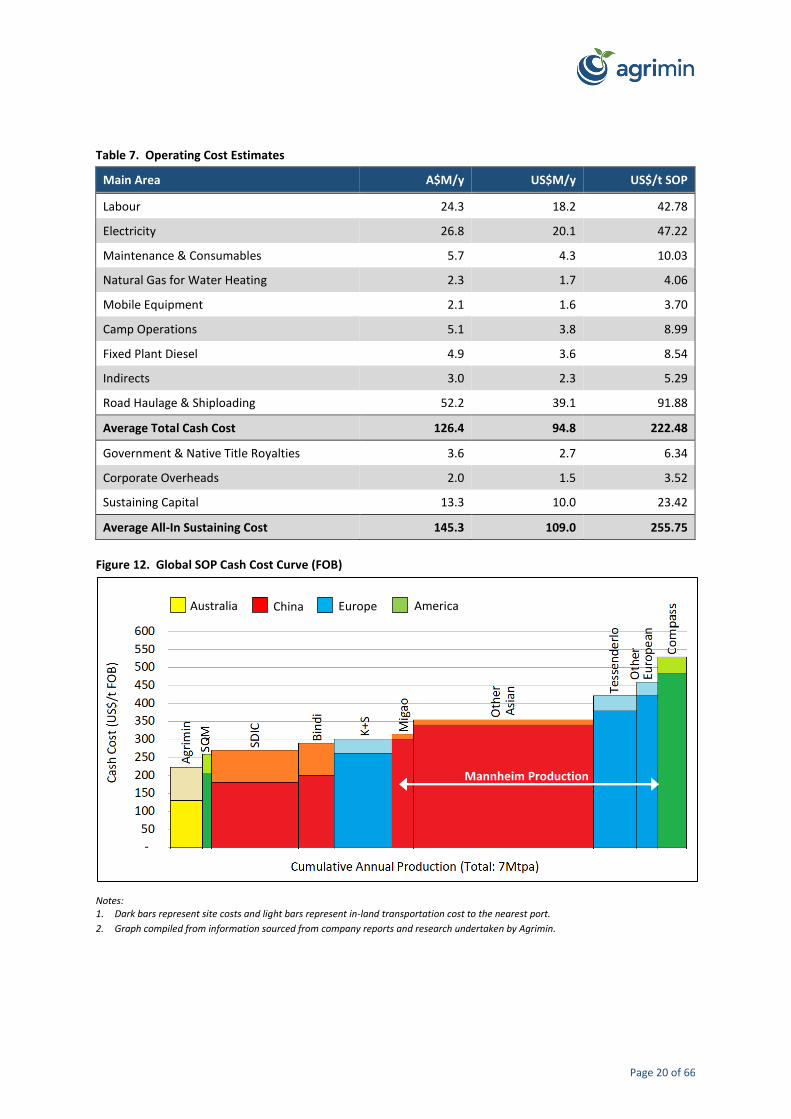
Operating Costs
A summary of the operating cost estimate provided by Advisian is presented in Table 7. The estimate has a
±25% level of accuracy and a USD/AUD exchange rate of 0.75 has been assumed for foreign currency
conversions. The estimate is based on 7,500 operating plant hours per year and it assumed that all production
is dried, compacted and sized.
The road haulage and shiploading cost is based on an indicative proposal provided by Qube with a ±15% level of
accuracy. The sustaining capital is the average annual amount for the 20 year project life.
The Company’s forecast position on the global SOP cost curve on an FOB basis is shown at Figure 12.
Page 20 of 66
Table 7. Operating Cost Estimates
Main Area A$M/y US$M/y US$/t SOP
Labour 24.3 18.2 42.78
Electricity 26.8 20.1 47.22
Maintenance & Consumables 5.7 4.3 10.03
Natural Gas for Water Heating 2.3 1.7 4.06
Mobile Equipment 2.1 1.6 3.70
Camp Operations 5.1 3.8 8.99
Fixed Plant Diesel 4.9 3.6 8.54
Indirects 3.0 2.3 5.29
Road Haulage & Shiploading 52.2 39.1 91.88
Average Total Cash Cost 126.4 94.8 222.48
Government & Native Title Royalties 3.6 2.7 6.34
Corporate Overheads 2.0 1.5 3.52
Sustaining Capital 13.3 10.0 23.42
Average All-In Sustaining Cost 145.3 109.0 255.75
Figure 12. Global SOP Cash Cost Curve (FOB)
Notes: 1. Dark bars represent site costs and light bars represent in-land transportation cost to the nearest port.
2. Graph compiled from information sourced from company reports and research undertaken by Agrimin.
Mannheim Production
Australia China Europe America

Page 21 of 66
Financial Analysis
The PFS has demonstrated strong project economics. The valuation of the Project was undertaken by Advisian
based on a discounted cash flow (“DCF”) model for the initial 20 year project life. Key financial outputs and
assumptions of the DCF model are outlined in Table 8 and Table 9, respectively.
A sensitivity analysis has determined that the financial outputs are most sensitive to assumptions made for SOP
prices and USD/AUD exchange rates. The results of a sensitivity analysis (±20%) of the key assumptions applied
in the DCF model are presented in Figure 13.
Table 8. Key Financial Outputs of the DCF Model
Output A$M US$M
Pre-tax NPV8 972.4 729.3
Post-tax NPV8 604.3 453.2
Pre-tax IRR 25%
Post-tax IRR 20%
Pre-Tax Payback Period 3.3 years
Post-Tax Payback Period 4.2 years
Annual EBITDA 183.3 137.5
Annual NPAT 99.9 75.0
Annual After-Tax Cash Flow 127.4 95.5
Cumulative After-Tax Cash Flow 2,539.9 1,904.9
Figure 13. NPV Sensitivity Analysis (Base Case US$453M)
100 150 200 250 300 350 400 450 500 550 600 650 700 750 800
Capital Cost
Discount Rate
All-In Sustaining Cost
USD/AUD Rate
SOP Price
NPV (US$M)
20% Unfavourable Change 20% Favourable Change
Page 22 of 66
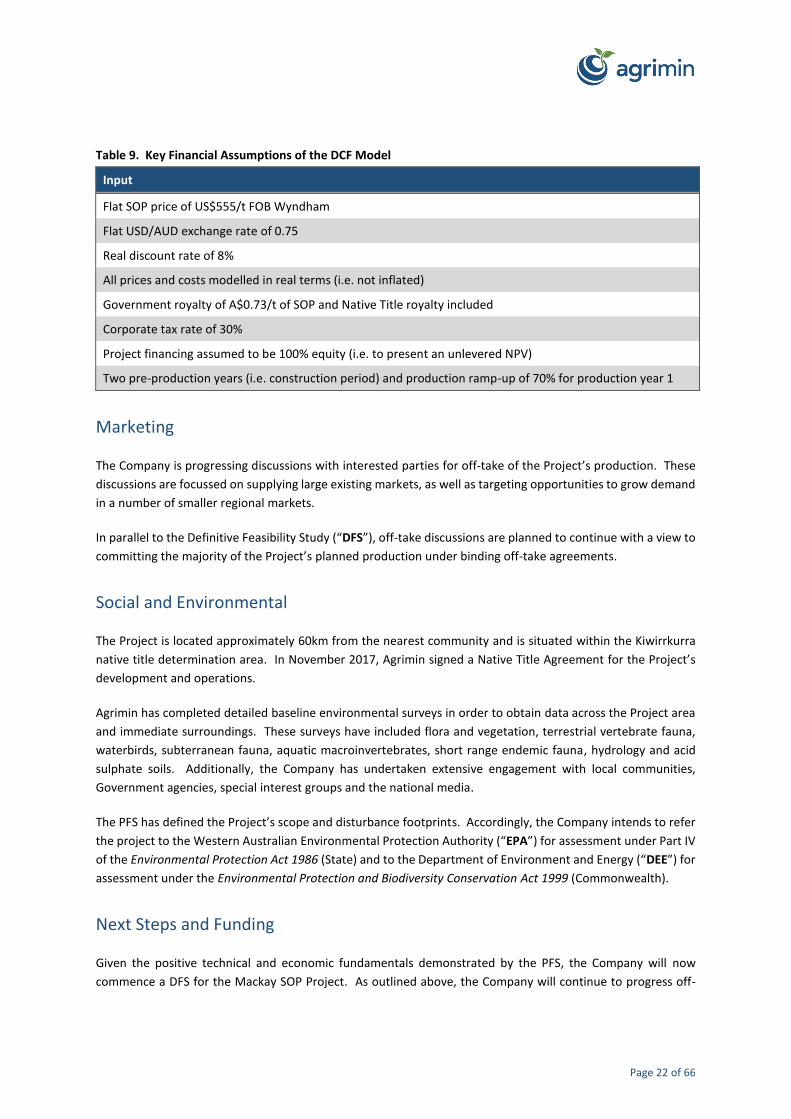
Table 9. Key Financial Assumptions of the DCF Model
Input
Flat SOP price of US$555/t FOB Wyndham
Flat USD/AUD exchange rate of 0.75
Real discount rate of 8%
All prices and costs modelled in real terms (i.e. not inflated)
Government royalty of A$0.73/t of SOP and Native Title royalty included
Corporate tax rate of 30%
Project financing assumed to be 100% equity (i.e. to present an unlevered NPV)
Two pre-production years (i.e. construction period) and production ramp-up of 70% for production year 1
Marketing
The Company is progressing discussions with interested parties for off-take of the Project’s production. These
discussions are focussed on supplying large existing markets, as well as targeting opportunities to grow demand
in a number of smaller regional markets.
In parallel to the Definitive Feasibility Study (“DFS”), off-take discussions are planned to continue with a view to
committing the majority of the Project’s planned production under binding off-take agreements.
Social and Environmental
The Project is located approximately 60km from the nearest community and is situated within the Kiwirrkurra
native title determination area. In November 2017, Agrimin signed a Native Title Agreement for the Project’s
development and operations.
Agrimin has completed detailed baseline environmental surveys in order to obtain data across the Project area
and immediate surroundings. These surveys have included flora and vegetation, terrestrial vertebrate fauna,
waterbirds, subterranean fauna, aquatic macroinvertebrates, short range endemic fauna, hydrology and acid
sulphate soils. Additionally, the Company has undertaken extensive engagement with local communities,
Government agencies, special interest groups and the national media.
The PFS has defined the Project’s scope and disturbance footprints. Accordingly, the Company intends to refer
the project to the Western Australian Environmental Protection Authority (“EPA”) for assessment under Part IV
of the Environmental Protection Act 1986 (State) and to the Department of Environment and Energy (“DEE”) for
assessment under the Environmental Protection and Biodiversity Conservation Act 1999 (Commonwealth).
Next Steps and Funding
Given the positive technical and economic fundamentals demonstrated by the PFS, the Company will now
commence a DFS for the Mackay SOP Project. As outlined above, the Company will continue to progress off-

Page 23 of 66
take and financing discussions with various counterparties while the DFS is underway. The Company plans to
also advance discussions with traditional debt and equity financiers, and strategic partners.
The DFS will incorporate the results of the Company’s pilot evaporation ponds and the processing of a bulk
sample of harvested salt to produce samples of high quality SOP for further customer testing and validation.
The pilot ponds have been constructed on Lake Mackay and are currently in the pre-commissioning phase.
Product samples are expected to be available for customers in Q4-2018.
The DFS is expected to be completed in mid-2019 and will form the basis of the Company finalising financing for
the construction of the Project and in making a Final Investment Decision (“FID”). Upon FID and funding
approval, the Project’s construction and commissioning is estimated to take 36 months. Then a production
ramp-up of 70% of production is expected in the first 12 months of operations before reaching the full
production target of 426,000tpa.
Since the completion of the Scoping Study in 2016, the Company’s market capitalisation has grown from A$67M
to A$139M, reflecting the successful completion of native title negotiations and PFS works. Successful delivery
of further development milestones, such as binding off-take agreements, environmental approvals and a DFS
with appropriate economic metrics, are expected to support ongoing convergence of the Company’s market
capitalisation with its future funding requirements. This in turn is expected to support the Company’s ongoing
ability to meet its future funding needs.
The Company is in a strong position with cash of A$7.7M and no debt, as at the quarter ended 31 March 2018.
The Company has a history of successful capital raisings and its substantial shareholders comprise high-quality
institutional investors. In addition, the Agrimin’s Board has a positive financing track record and experience in
developing resources projects.
Given the above, including the Project’s strong technical and economic attributes, and its low-risk location in
Western Australia, the Company has formed the view that it has a reasonable basis to expect that the Project’s
capital cost can be funded following the continued achievement of key development milestones.
ENDS
For more information contact:
Investor Relations: Media:
Mark Savich Michael Vaughan
Chief Executive Officer Fivemark Partners
T: +61 402 746 757 T: +61 422 602 720
E: [email protected] E: [email protected]
Or visit our website at www.agrimin.com.au

Page 24 of 66
Competent Persons Statements
The information in this ASX Release that relates to the Mineral Resource Estimate of April 2018 for the Mackay
SOP Project is based on and fairly represents information and supporting documentation compiled or reviewed
by Mr Murray Brooker who is a full-time employee of Hydrominex Geoscience Consulting Pty Ltd. Mr Brooker
is a geologist and hydrogeologist and is an independent consultant to Agrimin. Mr Brooker is a Member of the
Australian Institute of Geoscientists and has sufficient experience, which is relevant to the style of mineralisation
and type of deposit under consideration, and to the activity he is undertaking, to qualify as a Competent Person
in terms of the ‘Australasian Code for Reporting of Exploration Results, Mineral Resources and Ore Reserves’
(JORC Code, 2012 Edition). Mr Brooker consents to the inclusion of such information in this statement in the
form and context in which it appears.
The information in this ASX Release that relates to interpretation of process testwork data and selection of the
process flowsheets for the Pre-Feasibility Study was undertaken by Mr Don Larmour who is a full-time employee
of Global Potash Solutions Inc. Mr Larmour is a chemical engineer with over 30 years experience working in
potash processing and is an independent consultant to Agrimin. Mr Larmour consents to the inclusion of such
information in this statement in the form and context in which it appears.
Key Project Risks
Key risks identified to the Project’s valuation and viability are listed, but are not limited to, those outlined in Table 10.
Table 10. Key Project Risks
Variable
Decrease in global potash prices
Increase in the USD/AUD exchange rate
Material increases to capital and/or operating cost estimates
Conversion of Mineral Resources to Ore Reserves and extraction of the planned brine volumes
Outcomes of the Definitive Feasibility Study
Obtaining environmental and regulatory approvals
Access to adequate power supply and groundwater supply
Ability to secure project funding
Access to government infrastructure
Changes to government royalty and taxation rates
Ability to attract and retain key management personnel and consultants
Access to customer and ability to secure off-take agreements to sell product
General economic conditions
Page 25 of 66
Mineral Resource Report – Technical Overview
Mineral Resource Estimation
The Mineral Resource Estimate of April 2018 supersedes any previous Mineral Resource Estimates for the
Mackay SOP Project. The updated Mineral Resource Estimate is based on:
• The resource area is defined by the limit of the Company’s tenements, with the resource not extending
off the lake surface where tenements cover more than the lake area. The resource area includes the
Company’s tenement applications in Western Australia and the Northern Territory, however the
resource within these areas have been classified as Inferred.
• A digital elevation model was used to apply elevations to drill holes, which have only been located with
hand held GPS.
• The resource thickness is based on data generated from four drilling programs. This includes 57 auger
core holes (to a maximum depth of 11.25m) drilled by the Company in 2016 and 27 aircore holes (to a
maximum depth of 30m), together with 35 power auger holes, drilled by the Company in 2015. It also
includes 11 aircore holes (to a maximum depth of 27m) drilled in 2014 by Rum Jungle Resources Ltd
and 22 vibracore holes drilled in 2011 by Toro Energy Ltd on tenements not previously held by the
Company. These tenements have now been incorporated into the Company’s tenement package, along
with lithological information from holes drilled on those tenements.
o The resources that are estimated to a depth of 11.25m are based on information from all the
above drilling programs.
o The resources that are estimated below a depth of 11.25m are based only on information from
the Company’s aircore drilling. The resource is open at depth in the eastern and southern part
of the lake.
o Aircore sampling provided disturbed samples, whereas auger core and vibracore sampling
provided undisturbed (sealed core) samples.
• The grades of Potassium and other elements are based on brine samples collected from all drilling
programs. Data from the 11 vibracore holes drilled by Toro Energy Ltd in 2011 were used in preference
to data from adjacent aircore drilling by Rum Jungle Resources Ltd in 2014.
o Samples used from the Company’s sampling include bailed samples from core and power
auger holes and airlifting, pumping, and bailing of aircore holes.
o The Company also carried out analyses on brine extracted from the drill cores across the lake,
providing a detailed data set through the top 11.25m of the lake sediments with 162 primary
samples analysed.
o The bailed, pumped and airlift brine samples are by their nature composite samples and have
been compared with the brine extraction depth sampling. A factor relationship has been
developed relating the composite end of hole brine samples with the brine extraction samples.

Page 26 of 66
o A top-cut of 7.0kg/m3 of Potassium was applied to assays from brine extraction, and other
concentrations for additional elements.
• Extensive porosity data was collected from the 57 auger core holes across the lake obtained in 2016
drilling. A total of 302 samples were analysed at the Intertek soil laboratory in Perth, with an additional
64 samples analysed at Core Laboratories in Perth and at the British Geological Survey laboratory in the
UK. In addition to specific yield, total porosity, moisture content, particle size distribution, sample
density and permeability were also measured on cores to provide information for hydrogeological
modelling.
The Mineral Resource was estimated using Datamine software based on:
• Blocks with 1km square cells and 1.5m high blocks.
• A block factor was applied to blocks, so that any blocks that partially extended beyond the lake surface
or below the base of the model were assigned a block factor, to remove material outside the lake
outline, rather than using sub-blocking.
• Specific yield and total porosity data was applied as averages by depth across an eastern, central and
western zone identified in data analysis. The specific yield is higher closer to surface and varies down
hole. A constant value is applied to the Inferred Mineral Resource below a depth of 11.25m.
• Potassium and other element concentrations from the composite end of hole data from the bailed and
pumped brine samples were used to prepare a two-dimensional brine model over the lake. This was
then enhanced with the addition of brine extraction sample data that was applied vertically in the
model and used to inform blocks with brine concentrations, based on a factor relationship defined
between the two-dimensional estimate value and the brine extraction samples down the hole. This
provides additional detail to the model to a depth of 11.25m, below which estimation is solely based
on the composite end of hole brine samples.
• The ordinary kriging method was used for the estimation.
• The block model was used to estimate the resource across the lake. An upper cut-off was applied to
brine extraction samples used for the resource estimation. The upper 20m of lake islands were excised
from the resource prior to reporting as a number of holes drilled on islands in the 2016 auger core
drilling confirmed the near surface sediments of the islands host lower brine grades than the
surrounding lake sediments. The brine concentration is expected to continue to increase with depth,
but it is unknown at what depth concentrations would be equivalent to the surrounding lake sediments.
Mineral Resource classification:
• The majority of the project area has now been subject to drilling, with holes drilled on an approximate
5km grid spacing. This includes information from the Company’s drilling programs and drilling by Rum
Jungle Resources Ltd and Toro Energy Ltd on tenements previously held by these companies in the
southern part of the lake.
• Three passes with search expansion were used in the estimation. The upper 11.25m is classified as
Indicated where it falls within the first and second search pass. In the south of the lake, where the

Page 27 of 66
estimate relies on the publicly released Rum Jungle Resources Ltd assays (with no other information
available) and where drilling is more sparse, a minor portion of the upper 11.25m is classified as
Inferred. No drilling has been conducted in the far northern extent of the lake within Western Australia
or in the Northern Territory and these areas are classified as Inferred in the updated estimate, as is
material below 11.25m, as it relies solely on the aircore drilling conducted in 2015.
• Figure 3 in this ASX Release shows the resource classification areas for the top 11.25m. All resources
below 11.25m are classified as Inferred.
Project Geology
Lake Mackay overlies the Palaeoproterozoic Arunta complex and Neoproterozoic Amadeus and Ngalia basins.
The Proterozoic (Adelaidean) Bitter Springs Formation of the Amadeus Basin basal sequence outcrops to the
immediate south-west of Lake Mackay and may occur at shallow depth elsewhere beneath dunes of the Great
Sandy Desert. These sequences are underlain at variable depths by members of the Neoproterozoic Redcliff
Pound Group which comprises quartz arenite, chert, conglomerate, limestone, dolomite and siltstone.
Underlying this group is the Mount Webb Granite which overlies the Arunta Complex, an Archaean suite of
schists.
The lake surface typically comprises a thin crust of evaporite mineral deposits (predominantly halite). This is
underlain by a variable lakebed sequence which displays distinct characteristics east-west across the project
area. The sequence comprises:
• Reworked gypsiferous sand deposits comprising fine to coarse grained silty to clayey sands;
• Lacustrine deposits comprising soft to stiff, orange-brown, green clays to sandy clays, sandy silts and
loose clayey sands with small variable decomposed organic material content areas;
• Gypsum layers are present in both crystalline and granular form; and
• Hard calcrete and silcrete layers are also present in bands.
Both within and fringing the lakebed sequence, locally throughout the extent of Lake Mackay, is a series of
discontinuous aeolian deposits comprising silty to clayey sands composed of loose to partially consolidated
crystalline gypsum and quartz. These deposits intermittently extend to the surface as eroded dune islands
throughout the extent of the salt lake.
Extensive tracts of calcrete comprising massive, nodular and cavernous sandy limestone of Tertiary age occur
adjacent to Lake Mackay where they formed as palaeovalley infill deposits. Secondary silicification of these
deposits locally results in incomplete replacement by a vuggy, opaline silica caprock. Quaternary aeolian
deposits often overlie these calcrete deposits.
Hydrogeology
The lakebed sediment sequence of Lake Mackay is characterised into two broad flat lying lithological units.
Firstly, an upper unit of coarse gypsum sand, with an approximate thickness of 1m. This unit grades downward
into sandy and silty clay. Secondly, the lower unit where the lithology is dominantly clay contains discrete
interbedded layers of granular and crystalline gypsum to depths beyond 6m.

Page 28 of 66
Lake Mackay hosts hypersaline brine within the lakebed sediments. Potassium and other elements dissolved in
the brine are derived from weathering of rocks within the catchment area. Lake Mackay is the low point of a
vast catchment that extends hundreds of kilometres east from the lake.
The complete surface area of Lake Mackay is 3,500km². The total catchment area is estimated at 87,000km²,
however, the majority of the recharge is considered to be derived from direct rainfall and surface runoff within
a 7,000km² area covering the lake and its immediate surrounds. Intermittent inundation of the lake surface
typically follows seasonal rainfall during the months of December to March. Based on Australian Bureau of
Meteorology data, average rainfall for the region is 280mm per year, as shown in Figure 14. Elevation modelling
indicates a slight topographic gradient across the lake surface, generally sloping towards the south-east.
An important feature of potash brine projects is the evaporation potential as the sun’s energy is used to increase
the potash concentration of the brine within large solar evaporation ponds. Based on Australian Bureau of
Meteorology pan evaporation data, Lake Mackay is located in an area with an evaporation rate of between
3,200mm to 3,400mm per year, as shown in Figure 15. As the lake is a closed system, evaporation and
evapotranspiration are the only recognised forms of discharge.
The natural evapo-concentration of the lake brine is the most significant control on lake salinity. The water table
is encountered between 10cm to 40cm below ground surface at most points around the lake, with the brine
saturated sediments continuing from this point to the base of drilling of 30m, leaving the deposit open at depth.
Hydraulic gradients within these sediments are typically shallow.
Islands that rise several metres above the lake surface are present in the east of the lake, becoming progressively
less common to the west across the lake, where they are absent in the western third of the lake. In 2016, auger
core holes were drilled on several of the islands and this confirmed they are surficial features, with the sand
forming the islands grading downward into sandy clay and clay. The islands themselves are composed of gypsum
that is friable or cemented. Drilling in 2016 confirmed the islands have lower Potassium grades (less than
1kg/m3) to the base of drilling at 11.25m, due to the body of dilute brine that occupies the upper parts of the
islands. However, the brine becomes progressively more concentrated in Potassium with increasing depth
below the islands. Based on the 2016 drilling results the upper 20m sequence of the islands have been excluded
from the Mineral Resource Estimate as they have lower Potassium grades.
A trial geophysical survey completed in 2017 utilising a passive seismic sensoring technique has identified the
basement contact of the lake sequence over a significant area of the central part of the lake. This work has
suggested basement contact depths vary between 80m to 200m from surface over a 40-line km distance, with
depths appearing to increase towards the east. The survey identified the presence of what appears to be several
palaeovalleys beneath the present day lake surface. The complex hydrogeological relationship, if present,
between the palaeovalleys and the near surface lake brines is largely unknown at this stage and, therefore, has
not been assessed as part of the current hydrogeological model.
The observations to date form the basis for simulation of the hydrogeological regime within the lake and the
potential impact from groundwater extraction from the system. The regime assumes that as the current
groundwater storage in the lake is extracted, future rainfall and runoff will infiltrate the lake surface and
recharge the system. This recharge water will mix with groundwater storage within the near surface sediments
with SOP diffusing from the existing groundwater storage as it infiltrates from surface.

Page 29 of 66
Figure 14. Average Annual Rainfall Map
Figure 15. Average Annual Evaporation Map

Page 30 of 66
The conceptual hydrogeological model is presented in Figure 16. The general recharge regime is as follows.
Rainfall and recharge:
• Direct infiltration through the lake surface during seasonal rainfall events;
• Runoff – inundation of the lake from rainfall within the catchment, flowing into Lake Mackay as the low
point in the drainage – causing inundation in the east and south of the lake. Only likely with associated
high rainfall events such as storms or cyclones; and
• Interflow – rainfall infiltrating into the upper soil profile and flowing to the lake, evaporating on the
lake margins.
Groundwater inflows and recharge:
• Palaeovalleys interpreted to connect to Lake Mackay, bringing water from the Northern Territory and
intersecting the lake in the east and along the southern boundary;
• Evaporation of surface water from rain and inundation of the lake surface;
• Evaporation/transpiration losses;
• Evaporation within the upper 1m of the lake sediments where capillary forces allow evaporation;
• Transpiration of water from plants that are accessing fresh to brackish water derived from incident
rainfall as it percolates through the gypsiferous island sediments; and
• Possible upward hydraulic connection to deep palaeovalley sequence beneath the lake bed sediments.
Figure 16. Conceptual Hydrogeological Model
Page 31 of 66
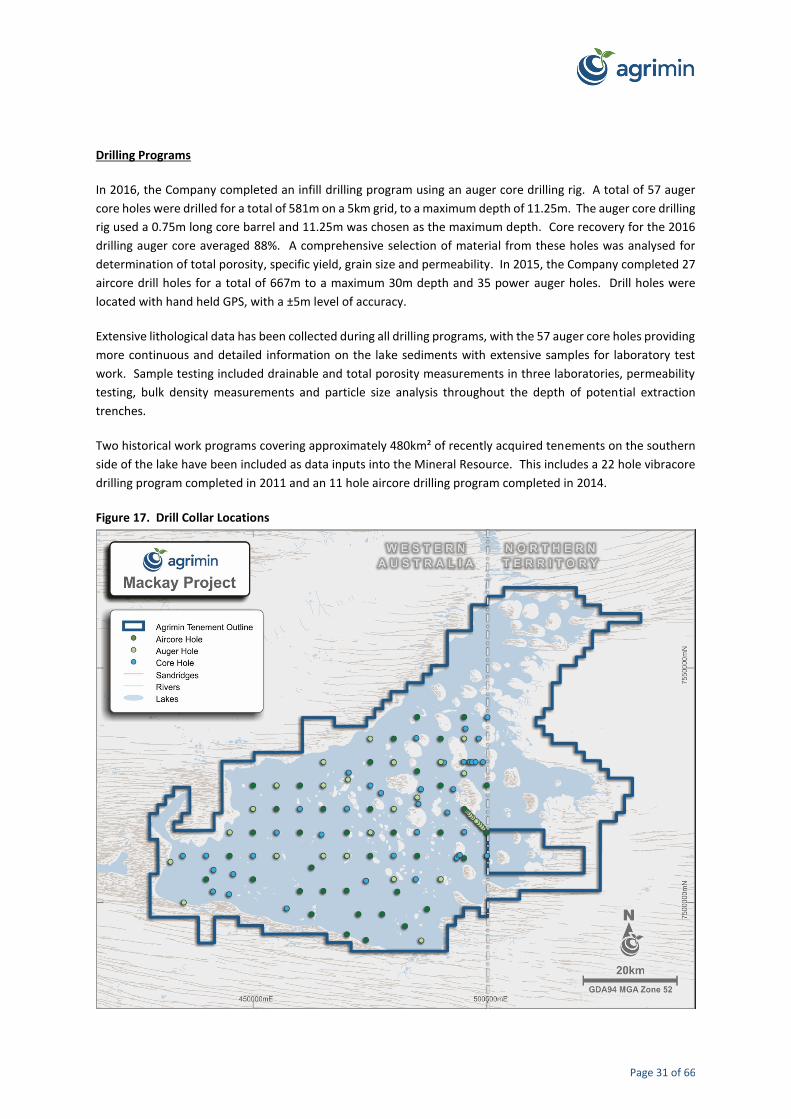
Drilling Programs
In 2016, the Company completed an infill drilling program using an auger core drilling rig. A total of 57 auger
core holes were drilled for a total of 581m on a 5km grid, to a maximum depth of 11.25m. The auger core drilling
rig used a 0.75m long core barrel and 11.25m was chosen as the maximum depth. Core recovery for the 2016
drilling auger core averaged 88%. A comprehensive selection of material from these holes was analysed for
determination of total porosity, specific yield, grain size and permeability. In 2015, the Company completed 27
aircore drill holes for a total of 667m to a maximum 30m depth and 35 power auger holes. Drill holes were
located with hand held GPS, with a ±5m level of accuracy.
Extensive lithological data has been collected during all drilling programs, with the 57 auger core holes providing
more continuous and detailed information on the lake sediments with extensive samples for laboratory test
work. Sample testing included drainable and total porosity measurements in three laboratories, permeability
testing, bulk density measurements and particle size analysis throughout the depth of potential extraction
trenches.
Two historical work programs covering approximately 480km² of recently acquired tenements on the southern
side of the lake have been included as data inputs into the Mineral Resource. This includes a 22 hole vibracore
drilling program completed in 2011 and an 11 hole aircore drilling program completed in 2014.
Figure 17. Drill Collar Locations

Page 32 of 66
Porosity Measurements
Porosity is one of the key variables in estimating brine resources for salt lakes. As discussed by Houston et., al.
(2011) there is considerable misunderstanding of the terminology related to porosity. Total porosity (Pt) relates
to the volume of brine contained within a volume of aquifer material. Except in well-sorted sands some of these
pores are not connected to others, and only the interconnected pores may be drained. Interconnected porosity
is referred to as the effective porosity (Pe). If the effective porosity is totally saturated with brine only some of
this brine will be drained during pumping. This is because of considerations such as capillary forces in the pores.
The porosity that freely drains by gravity is known as the specific yield (Sy) or drainable porosity. Brine retained
in the pores is referred to as specific retention (Sr).
Pt > Pe and Pe = Sy + Sr
In fine grained sediments, such as clays and silts much of the water is ‘bound water’ in small pores or held by
clays or capillary forces, with specific retention greatly exceeding specific yield, whereas in coarser grained
sediments specific yield greatly exceeds specific retention. Salt lakes are often dominated by clays and fine
grained sediments and the appropriate porosity metric for estimation of static resources that have a low level
of influence from recharge is the specific yield. However, the determination of the specific yield is challenging,
due to the unconsolidated nature of the sediments.
It is important to note that specific yield is a concept, not an analytical value, and therefore there is not a
standard analytical method for its determination. Different laboratories use different methods and equipment.
There are three methodologies used for determining the specific yield parameter, these include:
1. Laboratory derived (either by low-pressure centrifuge, vacuum suction (i.e. RBRC method) or other
membrane drainage methods);
2. Grain Size Analysis; or
3. Pump testing for unconfined aquifers.
A low-pressure centrifuging method (equivalent to 5 psi) was used for the determination of specific yield on
over 300 core samples across three separate laboratories, including the British Geological Survey laboratory,
which has processed samples from a number of brine projects globally. As different laboratories employ
differences in analytical methods, porosity samples were analysed in the separate laboratories for specific yield
determinations at centrifuge conditions equivalent to a low pressure (5 psi). This was the preferential method
used for the updated Mineral Resource Estimate.
302 porosity samples were submitted to the Intertek soil laboratory in Perth as the primary laboratory, with
additional samples sent to Core Laboratories in Perth and the British Geological Survey sedimentology
laboratory in the UK as check laboratories. Low-pressure centrifuging produced specific yield values ranging
from 0.5% to 16.4%. Samples with higher proportions of sand and silt had higher specific yields.
The Company also undertook Grain Size Analyses on core samples, which produced specific yield values ranging
from 3% to 25% and a regression result that is 1.8 times higher than the specific yield produced on duplicate
samples by the low-pressure centrifuging method.

Page 33 of 66
207 samples were analysed for grain size distribution. These samples were processed using wet sieving and
laser particle size distribution equipment. The resulting sand-silt-clay percentages were compared to a ternary
grain size diagram to estimate the specific yield. The results from the Grain Size Analyses were compared to
curves published by sedimentologists relating grain size to specific yield.
In addition, specific yield values were derived from hydrogeological model calibration of long-term pumping
tests conducted on 6m deep pilot trenches in 2017. This produced specific yield values ranging from 5% to 15%.
Taking the most conservative approach, the Company’s resource consultants have preferentially used the results
from the low-pressure centrifuging method in weighting and estimating the specific yield inputs for the Mineral
Resource to 11.25m (depth of core drilling). A lower constant 4.0% to 4.1% specific yield value, consistent with
the laboratory results and other published data, has been applied to the predominantly clay and gypsum unit
from 11.25m to the base of drilling, allowing for compaction at greater depths.
This methodology to estimating specific yield differs from the methods used on all other Australian potash brine
projects, which have used the Grain Size Analysis method or high-pressure (50 psi) centrifuging for the
determination of specific yield, or which have relied solely on total porosity values. The Company’s updated
Mineral Resource Estimate is not comparable on a like-for-like basis to other ASX listed companies.
As discussed above, determination of the specific yield is one of the most difficult elements of estimating brine
resources, as samples are often poorly consolidated, contain brine and can be significantly heterogeneous.
Testing also involves collecting data on small volumes of material that may involve an unknown scaling factor to
the field situation, where sedimentary layering may be important.
Estimation Methodology
Three different estimates were generated using different data sets and compiled into a single model:
• The primary brine grade concentrations were estimated using entire hole composites of the bailed
samples, into an unconstrained 2-dimensional model.
• Total porosity and specific yield were estimated using 0.75m composites of average values by depth.
• Brine extraction samples (from the drill cores) were used to estimate brine grade concentrations into
an unconstrained three-dimensional model. This limited data set has different statistical properties to
the primary bailed samples, so was only used to factor the primary grades and induce some vertical
variation into the final model.
• All three models used ordinary kriging with Gaussian variogram models, which are considered
appropriate for this type of deposit.
• Duplicate holes and holes on islands were excluded from the estimates. Some of brine extraction
samples were top-cut due to extreme values, to ensure that the resulting factors were reasonable.
• A block size of 1,000m x 1,000m x 1.5m was used for a nominal drill hole spacing of 5km x 5km.
• Search parameters for the first estimation pass were ellipsoid radii of 10,000m x 10,000m x 3m using a
minimum of 6 and maximum of 16 samples in at least 4 octants. The second pass used radii of 20,000m

Page 34 of 66
x 20,000m x 6m and 4-16 samples, while the third pass doubled the second pass radii and used similar
numbers of samples.
• The maximum extrapolation distance is 24km.
• The geological interpretation and resource estimates were generated using Datamine and GS3
geostatistical software.
Brine Assays and QA/QC Measures
Brine samples were submitted to the primary laboratory (Intertek) accompanied by blind QA/QC samples
comprising standards, field duplicates and blanks. Bureau Veritas was used as the check laboratory, with QA/QC
samples submitted for comparison analyses. Results of standards and duplicates showed a high level of
repeatability and low variance for the field brine samples analysed in both laboratories. Brine extraction samples
(brine extracted from the core as a check on open hole brine samples) showed a higher sample variance, which
is likely to reflect the small volume brine samples obtained from the core samples. Details of the QA/QC program
are provided in the following sections, along with brine assays.
A plan view of drill locations is shown in Figure 17 and a summary of the results is presented in Tables 11 to 15.
Figure 4 in this ASX Release shows the grade contour.
A total of 92 primary field brine samples were taken during the 2016 auger core drilling program. Brine
extraction samples were also analysed by Intertek which is an independent, NATA accredited, minerals
laboratory in Perth. Check analyses were completed at the Bureau Veritas laboratory in Perth. For the 2015
drilling program additional samples were analysed at the University of Antofagasta laboratory in Chile, a
laboratory with extensive experience in analysing brine samples from Chilean potash and lithium projects.
Comparison of results from these laboratories confirmed the Intertek analyses are suitable for the Mineral
Resource Estimate.
Samples from the auger core, aircore and power auger sampling show similar average and median values for
Potassium and other elements. The samples from the different drilling types also show a similar spatial
distribution across the lake. Brine extraction sampling results returned consistently higher results than the field
brine sampling results, and has been incorporated in the Mineral Resource Estimate using a top-cut for all
elements.
Table 11. Location and Assay Results of Auger Core Drill Holes in 2016
Hole ID Easting Northing
Depth
(mbgs) Sample ID
K
(kg/m3)
Mg
(kg/m3)
SO₄
(kg/m3)
MC01 464954 7510017 10.40 C01_11 3,158 3,273 23,317
MC02 470016 7510019 9.75 C02_10 5,062 2,664 21,906
MC02 470016 7510019 9.75 C02_2 5,250 2,700 22,112
MC03 493409 7509502 9.75 C03_10 2,835 3,220 19,187
MC03 493409 7509502 9.75 C03_2 2,799 3,189 18,706
MC04 493786 7510003 9.75 C04_1 2,008 1,798 14,482
MC04 493786 7510003 9.75 C04_10 2,627 2,200 17,680
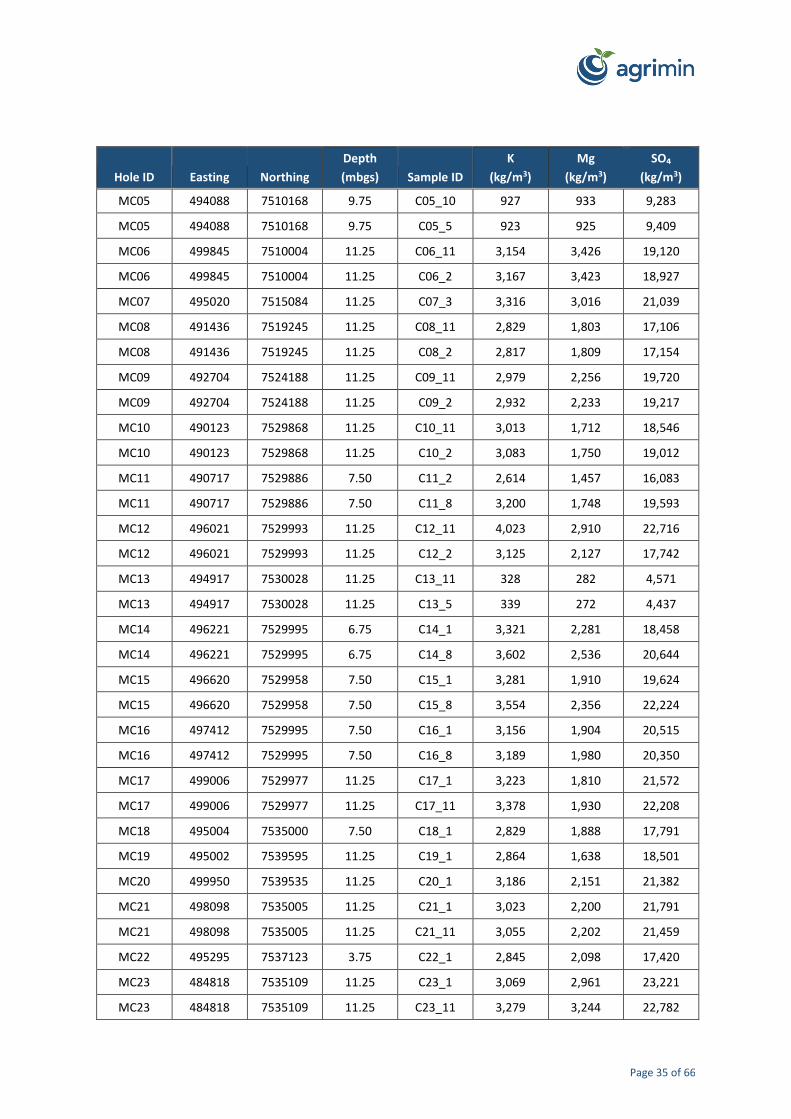
Page 35 of 66
Hole ID Easting Northing
Depth
(mbgs) Sample ID
K
(kg/m3)
Mg
(kg/m3)
SO₄
(kg/m3)
MC05 494088 7510168 9.75 C05_10 927 933 9,283
MC05 494088 7510168 9.75 C05_5 923 925 9,409
MC06 499845 7510004 11.25 C06_11 3,154 3,426 19,120
MC06 499845 7510004 11.25 C06_2 3,167 3,423 18,927
MC07 495020 7515084 11.25 C07_3 3,316 3,016 21,039
MC08 491436 7519245 11.25 C08_11 2,829 1,803 17,106
MC08 491436 7519245 11.25 C08_2 2,817 1,809 17,154
MC09 492704 7524188 11.25 C09_11 2,979 2,256 19,720
MC09 492704 7524188 11.25 C09_2 2,932 2,233 19,217
MC10 490123 7529868 11.25 C10_11 3,013 1,712 18,546
MC10 490123 7529868 11.25 C10_2 3,083 1,750 19,012
MC11 490717 7529886 7.50 C11_2 2,614 1,457 16,083
MC11 490717 7529886 7.50 C11_8 3,200 1,748 19,593
MC12 496021 7529993 11.25 C12_11 4,023 2,910 22,716
MC12 496021 7529993 11.25 C12_2 3,125 2,127 17,742
MC13 494917 7530028 11.25 C13_11 328 282 4,571
MC13 494917 7530028 11.25 C13_5 339 272 4,437
MC14 496221 7529995 6.75 C14_1 3,321 2,281 18,458
MC14 496221 7529995 6.75 C14_8 3,602 2,536 20,644
MC15 496620 7529958 7.50 C15_1 3,281 1,910 19,624
MC15 496620 7529958 7.50 C15_8 3,554 2,356 22,224
MC16 497412 7529995 7.50 C16_1 3,156 1,904 20,515
MC16 497412 7529995 7.50 C16_8 3,189 1,980 20,350
MC17 499006 7529977 11.25 C17_1 3,223 1,810 21,572
MC17 499006 7529977 11.25 C17_11 3,378 1,930 22,208
MC18 495004 7535000 7.50 C18_1 2,829 1,888 17,791
MC19 495002 7539595 11.25 C19_1 2,864 1,638 18,501
MC20 499950 7539535 11.25 C20_1 3,186 2,151 21,382
MC21 498098 7535005 11.25 C21_1 3,023 2,200 21,791
MC21 498098 7535005 11.25 C21_11 3,055 2,202 21,459
MC22 495295 7537123 3.75 C22_1 2,845 2,098 17,420
MC23 484818 7535109 11.25 C23_1 3,069 2,961 23,221
MC23 484818 7535109 11.25 C23_11 3,279 3,244 22,782

Page 36 of 66
Hole ID Easting Northing
Depth
(mbgs) Sample ID
K
(kg/m3)
Mg
(kg/m3)
SO₄
(kg/m3)
MC24 479943 7529996 11.25 C24_1 3,230 2,916 21,542
MC25 485777 7524188 11.25 C25_1 3,324 2,258 21,044
MC26 485261 7521087 7.50 C26_1 3,859 3,652 24,159
MC27 477282 7523399 7.50 C27_1 3,590 2,203 21,362
MC28 480002 7519998 11.25 C28_1 4,555 3,176 23,404
MC28 480002 7519998 11.25 C28_1 4,555 3,176 23,404
MC29 484971 7515062 11.25 C29_1 3,133 3,179 22,068
MC29 484971 7515062 11.25 C29_11 3,095 3,122 22,225
MC30 484684 7505003 11.25 C30_1 3,827 3,351 23,577
MC30 484684 7505003 11.25 C30_11 3,829 3,362 24,341
MC31 475276 7514859 11.25 C31_1 3,280 3,374 22,496
MC31 475276 7514859 11.25 C31_11 3,113 3,214 21,758
MC32 470014 7520051 11.25 C32_1 3,163 2,844 21,235
MC32 470014 7520051 11.25 C32_11 3,233 2,904 21,520
MC33 475013 7524996 11.25 C33_1 3,795 3,045 23,665
MC33 475013 7524996 11.25 C33_11 3,419 2,737 21,037
MC34 470370 7527745 11.25 C34_1 3,309 3,325 19,692
MC35 464974 7524997 11.25 C35_1 3,215 2,915 18,721
MC35 464974 7524997 11.25 C35_11 3,276 2,892 19,063
MC36 459997 7519996 11.25 C36_1 3,495 3,283 19,537
MC36 459997 7519996 11.25 C36_11 3,314 3,111 18,803
MC37 455015 7524980 11.25 C37_1 3,870 3,795 21,382
MC37 455015 7524980 11.25 C37_11 3,861 3,773 21,348
MC38 449994 7519984 11.25 C38_1 3,849 3,883 21,396
MC38 449994 7519984 11.25 C38_11 3,880 3,864 21,716
MC39 455027 7514983 11.25 C39_1 3,734 3,457 21,579
MC39 455027 7514983 11.25 C39_11 3,455 3,184 20,469
MC40 464570 7514535 11.25 C40_1 3,575 3,061 20,309
MC40 464570 7514535 11.25 C40_11 3,604 3,083 20,796
MC41 450016 7510007 11.25 C41_1 3,503 3,474 21,916
MC41 450016 7510007 11.25 C41_11 3,479 3,547 22,161
MC42 439990 7510029 11.25 C42_1 3,625 4,099 24,470
MC42 439990 7510029 11.25 C42_11 3,527 4,009 23,921

Page 37 of 66
Hole ID Easting Northing
Depth
(mbgs) Sample ID
K
(kg/m3)
Mg
(kg/m3)
SO₄
(kg/m3)
MC43 435003 7509993 11.25 C43_1 3,578 4,013 25,492
MC43 435003 7509993 11.25 C43_11 3,455 3,896 24,777
MC44 441561 7506993 11.25 C44_11 2,844 3,426 27,707
MC45 441561 7506993 2.25 C45_2 2,826 3,432 28,001
MC47 445769 7506084 2.25 C47_1 2,817 3,760 28,918
MC48 441424 7502388 11.25 C48_11 2,651 3,477 32,007
MC49 444860 7501803 11.25 C49_1 2,860 3,696 30,010
MC49 444860 7501803 11.25 C49_11 2,787 3,841 30,109
MC50 455013 7509984 11.25 C50_1 3,399 3,602 23,909
MC50 455013 7509984 11.25 C50_11 3,012 3,185 22,999
MC51 457166 7498787 11.25 C51_1 2,966 5,215 31,328
MC51 457166 7498787 11.25 C51_11 2,914 5,115 31,032
MC52 474090 7504660 6.0 C52_1 3,776 3,360 22,530
MC53 479978 7510044 11.25 C53_1 3,096 3,181 25,331
MC54 480019 7505009 11.25 C54_1 3,759 3,193 24,415
MC55 489983 7505010 11.25 C55_1 3,675 3,895 26,708
MC56 482373 7495002 11.25 C56_1 3,997 2,832 26,699
MC56 482373 7495002 11.25 C56_11 3,938 2,800 26,819
MC57 485876 7491918 11.25 C57_1 3,060 2,614 25,456
MC57 485876 7491918 11.25 C57_11 3,084 2,744 25,520
AVERAGE OF SAMPLES 3,383 2,997 22,451
Notes:
1 Locations are in GDA94 Zone 52.
2 All auger core holes were vertical.
3 Auger core holes drilled to a maximum depth of 11.25m.
4 Samples taken from islands have been excluded from the average presented as they have been sterilised from the Mineral Resource.
Table 12. Location and Assay Results of Aircore Drill Holes in 2015
Hole ID Easting Northing
Depth
(mbgs)
K
(kg/m3)
Mg
(kg/m3)
SO₄
(kg/m3)
MA01 440018 7505016 24.0 3,315 3,151 30,185
MA02 450003 7504992 16.7 3,308 3,584 25,825
MA03 449969 7514950 19.0 4,548 4,020 24,506
MA04 450003 7524996 24.0 4,111 3,653 24,467
MA05 460003 7514992 18.7 3,495 2,751 21,927

Page 38 of 66
Hole ID Easting Northing
Depth
(mbgs)
K
(kg/m3)
Mg
(kg/m3)
SO₄
(kg/m3)
MA06 470022 7515008 22.5 3,649 2,867 22,653
MA07 479996 7514981 27.0 3,872 2,573 21,265
MA08 490050 7515074 30.0 3,305 3,476 22,727
MA09 499801 7515003 30.0 3,223 3,362 23,968
MA10 495031 7519985 29.0 2,691 1,953 15,425
MA11 499807 7524974 30.0 3,140 2,915 19,869
MA12 495001 7539605 27.0 3,177 1,883 21,220
MA13 490003 7535004 26.0 3,364 2,824 22,482
MA14 485014 7539617 20.0 3,560 3,697 24,166
MA15 480001 7534993 25.0 3,373 3,039 22,373
MA16 475005 7529997 27.0 3,370 3,193 20,483
MA17 485007 7528035 30.0 4,031 2,876 23,386
MA18 489998 7525007 26.8 3,164 2,514 21,092
MA19 494995 7509521 27.0 3,381 2,094 23,060
MA20 484997 7510000 21.5 3,590 2,621 25,303
MA21 474508 7509959 22.0 4,175 3,480 22,070
MA22 474993 7519995 28.0 3,570 2,744 24,337
MA23 464982 7520024 24.0 3,807 2,972 21,006
MA24 460000 7524999 18.0 3,830 3,704 22,336
MA25 454987 7520000 26.5 3,897 3,181 22,771
MA26 444989 7510006 22.5 3,930 4,180 24,480
MA27 482395 7494998 25.0 4,395 2,658 29,008
AVERAGE OF DRILL HOLES 24.7 3,603 3,036 23,051
Notes:
1 Locations are in GDA94 Zone 52.
2 Assays are averaged for each aircore drill hole from the available samples.
3 All aircore drill holes were vertical.
Table 13. Location and Assay Results of Auger Holes in 2015
Hole ID Easting Northing
K
(kg/m3)
Mg
(kg/m3)
SO₄
(kg/m3)
HA01 432353 7508719 4,109 2,906 31,395
HA03 435206 7500041 5,239 6,319 34,481
HA04 499822 7515003 2,927 1,987 23,901
HA05 489999 7530002 2,276 1,333 18,719

Page 39 of 66
Hole ID Easting Northing
K
(kg/m3)
Mg
(kg/m3)
SO₄
(kg/m3)
HA06 485860 7491930 3,462 2,650 26,417
PA01 499228 7571653 3,468 2,496 30,694
PA02 499042 7515874 3,941 3,162 22,716
PA03 498770 7516208 3,481 2,607 22,185
PA04 498390 7516601 3,228 1,753 21,930
PA05 497996 7516981 3,142 1,942 22,377
PA06 497600 7517377 3,094 2,643 20,354
PA07 497230 7817742 4,523 3,971 27,048
PA08 496814 7518095 3,500 2,744 19,766
PA09 496509 7518372 3,336 2,127 20,805
PA10 496199 7518660 3,351 1,988 21,298
PA11 495927 7519113 3,405 2,280 21,107
PA12 495540 7519432 3,146 2,072 18,583
PA13 495307 7519609 1,953 1,440 13,142
PA14 495155 7519829 2,474 1,635 14,564
PA15 495004 7527573 2,936 1,589 17,715
PA16 494996 7535003 2,954 1,780 18,413
PA18 480008 7529895 3,637 3,056 23,708
PA19 474988 7534981 3,844 2,949 24,112
PA21 485011 7522434 4,446 3,418 23,021
PA22 480008 7520004 5,019 3,387 27,841
PA23 475000 7515002 3,464 3,413 23,890
PA24 470000 7510001 3,987 2,414 24,729
PA25 465000 7509997 3,533 3,314 23,687
PA26 455001 7509999 3,463 3,243 24,593
PA27 470000 7510001 3,903 4,030 31,629
PA28 480000 7505000 4,199 3,272 26,193
PA29 490000 7505000 4,118 3,793 27,584
PA30 470234 7526253 3,924 3,075 22,096
PA31 465000 7524999 3,559 3,011 20,645
PA32 465000 7530001 3,728 3,516 21,160
PA33 454999 7530001 6,520 7,857 44,747
PA34 454999 7525001 4,168 3,870 23,611

Page 40 of 66
Hole ID Easting Northing
K
(kg/m3)
Mg
(kg/m3)
SO₄
(kg/m3)
PA35 450001 7520001 4,212 3,988 23,814
PA36 445005 7515004 4,226 3,068 25,341
AVERAGE OF DRILL HOLES 3,690 2,977 23,846
Notes:
1 Locations are in GDA94 Zone 52.
2 Assays are based on a single sample for each auger hole.
3 All auger holes were vertical.
4 All auger holes drilled to a maximum depth of 1.5m.
Table 14. Location and Assay Results of Aircore Holes in 2014
Hole ID Easting Northing
Depth
(mbgs)
K
(kg/m3)
Mg
(kg/m3)
SO₄
(kg/m3)
LMAC001 474073 7492043 27.0 2,992 3,655 19,519
LMAC002 469990 7493275 18.0 3,694 5,026 32,695
LMAC003 469942 7502583 19.0 3,079 3,217 20,663
LMAC004 464988 7502499 18.0 3,053 3,334 21,880
LMAC005 459999 7502486 9.0 3,183 2,977 26,913
LMAC006 462481 7507525 9.0 3,639 3,631 24,442
LMAC007 480761 7502357 12.0 3,388 3,064 23,310
LMAC008 487111 7498661 12.0 3,587 2,851 24,939
LMAC009 477542 7497552 12.0 3,264 2,658 19,624
LMAC010 472472 7497554 12.0 2,874 2,818 19,456
LMAC011 462476 7497539 12.0 2,929 2,409 24,770
AVERAGE OF DRILL HOLES 14.5 3,244 3,240 23,474
Notes:
1 Locations are in GDA94 Zone 52.
2 Assays are based on a single sample for each aircore hole.
3 All aircore holes were vertical.
4 All aircore holes drilled to a maximum depth of 1.5m.
Table 15. Location and Assay Results of Vibracore Holes in 2011
Hole ID Easting Northing
Depth
(mbgs)
K
(kg/m3)
Mg
(kg/m3)
SO₄
(kg/m3)
LV01 465013 7495164 0.71 - - -
LV02 467357 7507487 1.22 3,950 3,320 24,000
LV03 475955 7499855 1.82 - - -
LV04 489989 7502393 1.45 4,210 3,240 18,300
LV05 484247 7502448 1.66 4,200 3,450 20,000

Page 41 of 66
Hole ID Easting Northing
Depth
(mbgs)
K
(kg/m3)
Mg
(kg/m3)
SO₄
(kg/m3)
LV06 484973 7493598 0.89 4,900 3,200 18,600
LV07 487453 7497655 1.47 4,800 3,510 18,000
LV08 482461 7497519 1.14 5,160 2,450 17,800
LV09 477481 7497528 1.18 4,110 2,810 25,000
LV10 472421 7497555 0.67 3,640 3,470 29,000
LV11 467410 7497489 1.18 3,560 3,610 18,600
LV12 462501 7497513 1.53 3,230 2,260 19,900
LV13 455076 7497546 1.17 3,290 3,240 16,600
LV14 449981 7497662 0.98 3,560 3,560 18,900
LV15 459948 7502471 0.38 3,860 3,950 22,800
LV16 464912 7502474 1.01 3,700 3,640 25,400
LV17 469895 7502595 1.08 3,460 3,230 18,100
LV18 474967 7502555 0.70 - - -
LV19 479954 7502404 0.79 4,600 3,240 18,800
LV20 474958 7491136 1.42 4,010 3,310 31,700
LV21 462491 7507523 1.14 4,020 3,410 28,600
LV22 470023 7493234 0.67 5,430 7,480 22,400
AVERAGE OF DRILL HOLES 1.1 4,089 3,494 21,711
Notes:
1 Locations are in GDA94 Zone 52.
2 Assays are based on a single sample for each vibracore hole.
3 All vibracore holes were vertical.
JORC Code, 2012 Edition – Table 1
Section 1 Sampling Techniques and Data
(Criteria in this section apply to all succeeding sections.)
The mineralisation at the Mackay SOP Project is contained in brine that is present in the pore spaces of lakebed
sediments. It is important for the reader to understand this is not a hard rock mining project and sediment
samples are not analysed. Exploration activities have been aimed at sampling the brine contained in sediments,
to determine variations in concentration across the Mackay SOP Project.
Criteria JORC Code explanation Commentary
Sampling techniques
• Nature and quality of sampling (eg cut channels, random chips, or specific specialised industry standard measurement tools appropriate to the
• Brine sampling was undertaken by bailing brine samples during the 2016 auger core drilling program and 2015 power auger sampling, with samples

Page 42 of 66
Criteria JORC Code explanation Commentary
minerals under investigation, such as down hole gamma sondes, or handheld XRF instruments, etc). These examples should not be taken as limiting the broad meaning of sampling.
• Include reference to measures taken to ensure sample representivity and the appropriate calibration of any measurement tools or systems used.
• Aspects of the determination of mineralisation that are Material to the Public Report.
• In cases where ‘industry standard’ work has been done this would be relatively simple (eg ‘reverse circulation drilling was used to obtain 1 m samples from which 3 kg was pulverised to produce a 30 g charge for fire assay’). In other cases more explanation may be required, such as where there is coarse gold that has inherent sampling problems. Unusual commodities or mineralisation types (eg submarine nodules) may warrant disclosure of detailed information.
taken by airlifting during the 2015 drilling program and by pumping from installed bores. The results of the sample populations from each sampling technique have been compared statistically.
• Brine samples from aircore drilling were taken from the cyclone during airlifting the hole, and from bailed (tube with a non-return valve to prevent brine escape) or pumped samples when monitoring bores were installed in the holes.
• A significant number of the aircore and core holes had 50mm piezometers installed for future monitoring and brine sampling.
• Brine samples taken by airlift, bailing and pumping are considered composite samples from the phreatic surface, as brine from all levels of the stratigraphic sequence contributes to the brine sample composition. These samples are considered representative of brine that will flow into trenches or bores during brine extraction from the resource.
• Samples of brine extracted from sediment core samples provide information on Potassium, Magnesium and Sulphate concentrations in the sediments and were used as a check on brine grades from the other sampling methods.
• The core samples were retrieved in plastic tubes (in the place of triple tubes) and sealed to ensure the unconsolidated sediments and entrained brine were recovered.
• A number of 2015 and 2016 holes were twinned and sampled. In addition, a transect of holes with a closer spacing than the 5km grid drilling, were drilled with a spacing from 200m to 800m and sampled to evaluate short range variability in brine concentration and lithology. QA/QC samples were used throughout the drilling programs
• Brine samples were taken in 1L bottles directly from the bailer, pump or cyclone, so no sub-sampling was carried out. These were filtered in the laboratory prior to analysis, with the

Page 43 of 66
Criteria JORC Code explanation Commentary
measurement of physical parameters and analysis by industry standard techniques that are applicable to brine analysis.
Drilling techniques
• Drill type (eg core, reverse circulation, open-hole hammer, rotary air blast, auger, Bangka, sonic, etc) and details (eg core diameter, triple or standard tube, depth of diamond tails, face-sampling bit or other type, whether core is oriented and if so, by what method, etc).
• The Project involved several drilling techniques over different field campaigns. Drilling campaigns required the use of small purpose built auger core and aircore rigs, transported by helicopter sling loading or ATV between the drill sites.
• Auger core drilling was undertaken with a hollow stem auger in which the core was collected in plastic (triple) tubes in the centre of the augers, with the core barrel recovered with wireline and overshot.
• Aircore drilling using an aircore blade bit to cut through the sediments, the compressed air supply transported sediment samples to the surface with minimal injection of water into the holes.
• The auger core diameter was 175mm, with the internal hollow section sufficient to install a 50mm diameter monitoring well. The aircore bit size was approximately 80mm.
• Core was not orientated and all holes were drilled vertically.
Drill sample recovery
• Method of recording and assessing core and chip sample recoveries and results assessed.
• Measures taken to maximise sample recovery and ensure representative nature of the samples.
• Whether a relationship exists between sample recovery and grade and whether sample bias may have occurred due to preferential loss/gain of fine/coarse material.
• Core from auger core sampling was measured and the recovered core compared to the length drilled (0.75m long core tubes). Core recovery was then calculated for each core tube. The plastic tubes act like triple tubes to maximise sample recovery, but allow the cores to be sealed immediately following recovery to prevent brine loss. Cores were cut to the length of recovered core if less than 0.75m.
• Overall core recovery from the auger core drilling was 88%, mostly influenced by the presence of gypsum bands which caused cores to collar off in the tubes, with core below the gypsum bands lost by washing during drilling of the remaining part of the core run.
• Core recovery was not applicable to aircore drilling. It is unknown whether core recovery was measured by Toro Energy Ltd as part of vibracore sampling

Page 44 of 66
Criteria JORC Code explanation Commentary
conducted in the south of the lake.
• The key sample material collected during and following drilling of holes is brine, in addition to the core samples. Lithological samples are important to provide an understanding of the sediment characteristics and to provide samples for porosity and permeability measurements.
• There is not a relationship between the sediment sample recovery and brine grade and sediment core recovery was sufficient that it is unlikely to be biased for reasons of variable sediment sample recovery during aircore (or core) drilling.
• Aircore brine samples were recovered via air pressure forcing water up the drill rods, through the cyclone or outside return, with samples collected in buckets and transferred into 1L bottles.
• Aircore brine samples were only obtained when water was free flowing after a rod change and composite samples were only obtained at the bottom of the hole in many cases.
• Aircore sediment samples were collected from the cyclone and logged and placed in chip trays and sealed bags on 3m intervals, with increased detail in the upper 2m.
• Due to the wet and sometimes sticky, plastic nature of the sediments it was not practical to weigh sample buckets for 3m intervals.
Logging • Whether core and chip samples have been geologically and geotechnically logged to a level of detail to support appropriate Mineral Resource estimation, mining studies and metallurgical studies.
• Whether logging is qualitative or quantitative in nature. Core (or costean, channel, etc) photography.
• The total length and percentage of the relevant intersections logged.
• All drill holes were logged for hydrogeological characteristics, including descriptions of lithology, sediment grain size, colour, moisture content, general observations and flow rates.
• A qualified hydrogeologist/geologist logged all samples.
• All auger core trays were photographed for comparison purposes. During aircore drilling snap top sample bags and chip trays were photographed as a permanent record of sample intervals.
• Because clays cause some smearing in the core tubes during drilling a number of core holes were frozen in a Perth laboratory and split to allow more

Page 45 of 66
Criteria JORC Code explanation Commentary
detailed logging and evaluation of small scale structures in the core.
• All the 581m of auger core was geological logged, as was the total 667m of aircore samples.
Sub-sampling techniques and sample preparation
• If core, whether cut or sawn and whether quarter, half or all core taken.
• If non-core, whether riffled, tube sampled, rotary split, etc and whether sampled wet or dry.
• For all sample types, the nature, quality and appropriateness of the sample preparation technique.
• Quality control procedures adopted for all sub-sampling stages to maximise representivity of samples.
• Measures taken to ensure that the sampling is representative of the in situ material collected, including for instance results for field duplicate/second-half sampling.
• Whether sample sizes are appropriate to the grain size of the material being sampled.
• Cores were collected for purposes of lithological logging and porosity sampling. The cores were systematically sampled for porosity, density, permeability and grain size data using systematic (non-selective) intervals of full core.
• Brine samples were collected by airlifting with the drilling rig or by pumping or bailer sampling. The brine was mixed during the sampling process. Due to the helicopter supported nature of the drilling campaigns it was necessary to sample bores during and immediately following drilling and bore installation. It was not always possible to purge 3 well volumes of brine from the holes prior to sampling, with the exception of airlifting of a limited number of aircore holes.
• The brine sampling methods are considered appropriate for the circumstances. As a quality control procedure, the auger core samples have been validated by the collection of brine extracted from the cores.
• Field duplicates of brine samples were taken during pumping, bailing or airlifting of samples.
• 10cm core sub-samples are considered appropriate for the laboratory test work, as are 1L brine samples for the brine analyses.
Quality of assay data and laboratory tests
• The nature, quality and appropriateness of the assaying and laboratory procedures used and whether the technique is considered partial or total.
• Nature of quality control procedures adopted (eg standards, blanks, duplicates, external laboratory checks) and whether acceptable levels of accuracy (ie lack of bias) and precision have been established.
• The samples collected were analysed for elemental assay at Intertek laboratories in Perth, an independent laboratory.
• The technique of analysis used was Inductively Coupled Plasma Optical (Atomic) Emission Spectrometry for cations and sulphur, UV visible spectrometry for chloride, gravimetric analysis for Total Dissolved Solids (TDS). Sulphate concentration was calculated from Sulphur analysis. These assays provide a measurement of the total dissolved components analysed.
• Quality control procedures were in

Page 46 of 66
Criteria JORC Code explanation Commentary
place throughout the sampling and analyses process, including the use of blanks, duplicates and laboratory prepared standards. The QA/QC samples were analysed at the Bureau Veritas laboratory as an independent check on the Intertek results, acting as triplicate analyses. For 2015 aircore analyses a number of samples were also analysed at the University of Antofagasta laboratory in Chile, a laboratory with extensive experience analysing brine samples.
• Quality control data indicates the brine results are acceptable for resource estimation.
Verification of sampling and assaying
• The verification of significant intersections by either independent or alternative company personnel.
• The use of twinned holes.
• Documentation of primary data, data entry procedures, data verification, data storage (physical and electronic) protocols.
• Discuss any adjustment to assay data.
• Results have been verified by independent consulting hydrogeologists.
• There are 22 duplicate pairs in sampling across the lake where brine samples from different drilling techniques have been compared, with both Agrimin and Rum Jungle Resources Ltd data. The Rum Jungle Resources Ltd twin holes show a higher level of variation, which is likely to be in part related to the aircore drilling following a period of heavy rain.
• In addition to twinned holes transects of auger core holes and power auger holes were used to evaluate variability in brine concentration over shorter distances.
• Brine analytical results are received from the laboratory in digital format to prevent transposition errors.
• The brine body is considered to be relatively homogenous. However, the Rum Jungle Resources Ltd aircore values were excluded from the resource estimation, due to their collection following a period of reportedly significant rain.
• Analysis of brine from pump tests on some holes provides a check on the analyses of the composite end of hole sample taken during drilling.
• Data is stored in Excel format with regular backups/copies created.
• The concentrated nature of the brines requires the laboratory to dilute sub-samples to allow analysis. The results

Page 47 of 66
Criteria JORC Code explanation Commentary
are then corrected for dilution factors by the laboratory before results are reported.
Location of data points
• Accuracy and quality of surveys used to locate drill holes (collar and down-hole surveys), trenches, mine workings and other locations used in Mineral Resource estimation.
• Specification of the grid system used.
• Quality and adequacy of topographic control.
• Collars were located using a handheld GPS system, with accuracy of ±5m.
• The grid system used was GDA94 in MGA Zone 52.
• RLs were recorded for each collar.
• The salt lake surface is generally flat lying so topographic control is not considered a critical point. Agrimin has undertaken an initial topographic survey of the lake as an evaluation of the digital elevation model.
Data spacing and distribution
• Data spacing for reporting of Exploration Results.
• Whether the data spacing and distribution is sufficient to establish the degree of geological and grade continuity appropriate for the Mineral Resource and Ore Reserve estimation procedure(s) and classifications applied.
• Whether sample compositing has been applied.
• Drilling was completed on a 5km grid, with some holes moved to avoid drilling on islands. No drilling was conducted north of 7,540,000 North or east of the Western Australian border.
• The correlation of lithological and brine concentration data suggests drilling completed in the programs is sufficient to demonstrate the continuity of both lithology/geology and brine grades to estimate a resource for the project
• All brine samples are considered a composite from the water table to the depth they are taken from i.e. a sample taken at the bottom of the hole is representative of the whole hole. Only brine extraction analyses from the auger core holes represent discrete interval samples.
• This sampling validated the continuation of brine with comparable grades to composite sample throughout the length of the auger core holes
Orientation of data in relation to geological structure
• Whether the orientation of sampling achieves unbiased sampling of possible structures and the extent to which this is known, considering the deposit type.
• If the relationship between the drilling orientation and the orientation of key mineralised structures is considered to have introduced a sampling bias, this should be assessed and reported if material.
• All drill holes are drilled vertical as the geological structure being targeted (host sediments containing brine) is flat lying.
• No orientation or structural information was obtained, as the target is brine in the pores of unconsolidated lake sediments.
Sample security
• The measures taken to ensure sample security.
• All samples were clearly labelled and kept onsite prior to being transported to Alice Springs by company contractors. From Alice Springs, the samples were
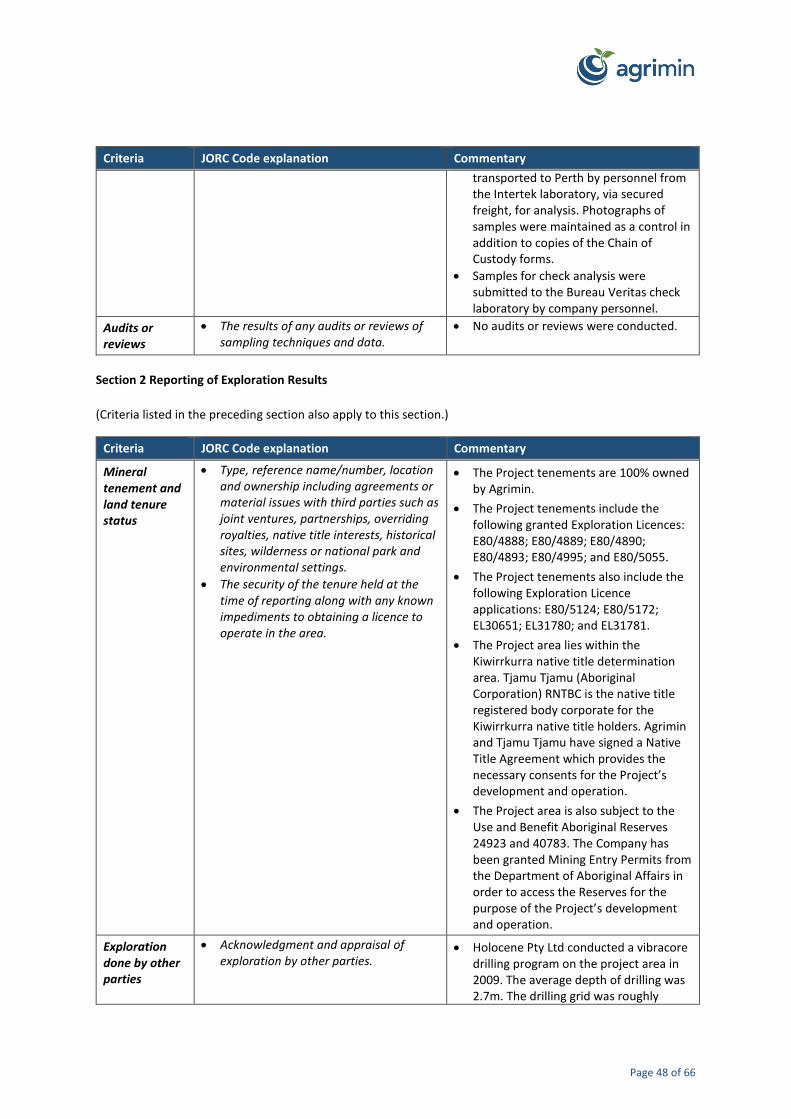
Page 48 of 66
Criteria JORC Code explanation Commentary
transported to Perth by personnel from the Intertek laboratory, via secured freight, for analysis. Photographs of samples were maintained as a control in addition to copies of the Chain of Custody forms.
• Samples for check analysis were submitted to the Bureau Veritas check laboratory by company personnel.
Audits or reviews
• The results of any audits or reviews of sampling techniques and data.
• No audits or reviews were conducted.
Section 2 Reporting of Exploration Results
(Criteria listed in the preceding section also apply to this section.)
Criteria JORC Code explanation Commentary
Mineral tenement and land tenure status
• Type, reference name/number, location and ownership including agreements or material issues with third parties such as joint ventures, partnerships, overriding royalties, native title interests, historical sites, wilderness or national park and environmental settings.
• The security of the tenure held at the time of reporting along with any known impediments to obtaining a licence to operate in the area.
• The Project tenements are 100% owned by Agrimin.
• The Project tenements include the following granted Exploration Licences: E80/4888; E80/4889; E80/4890; E80/4893; E80/4995; and E80/5055.
• The Project tenements also include the following Exploration Licence applications: E80/5124; E80/5172; EL30651; EL31780; and EL31781.
• The Project area lies within the Kiwirrkurra native title determination area. Tjamu Tjamu (Aboriginal Corporation) RNTBC is the native title registered body corporate for the Kiwirrkurra native title holders. Agrimin and Tjamu Tjamu have signed a Native Title Agreement which provides the necessary consents for the Project’s development and operation.
• The Project area is also subject to the Use and Benefit Aboriginal Reserves 24923 and 40783. The Company has been granted Mining Entry Permits from the Department of Aboriginal Affairs in order to access the Reserves for the purpose of the Project’s development and operation.
Exploration done by other parties
• Acknowledgment and appraisal of exploration by other parties.
• Holocene Pty Ltd conducted a vibracore drilling program on the project area in 2009. The average depth of drilling was 2.7m. The drilling grid was roughly
Page 49 of 66
Criteria JORC Code explanation Commentary
10km.
• Rum Jungle Resources Ltd and Toro Energy Ltd conducted drilling programs in the southern tenements now held by Agrimin. A total of 22 vibracore holes were drilled in 2011 and a further 11 aircore holes were drilled in 2014.
Geology • Deposit type, geological setting and style of mineralisation.
• The deposit type is brine-hosted potash in a salt lake setting.
Drill hole Information
• A summary of all information material to the understanding of the exploration results including a tabulation of the following information for all Material drill holes: o easting and northing of the drill hole
collar o elevation or RL (Reduced Level –
elevation above sea level in metres) of the drill hole collar
o dip and azimuth of the hole o down hole length and interception
depth o hole length.
• If the exclusion of this information is justified on the basis that the information is not Material and this exclusion does not detract from the understanding of the report, the Competent Person should clearly explain why this is the case.
• Refer to drill collars in the release.
• Auger core holes were 11.25m deep and aircore holes were up to 30m deep, with all drilled vertical.
• Approximate RL of the lake is 355m.
Data aggregation methods
• In reporting Exploration Results, weighting averaging techniques, maximum and/or minimum grade truncations (eg cutting of high grades) and cut-off grades are usually Material and should be stated.
• Where aggregate intercepts incorporate short lengths of high grade results and longer lengths of low grade results, the procedure used for such aggregation should be stated and some typical examples of such aggregations should be shown in detail.
• The assumptions used for any reporting of metal equivalent values should be clearly stated.
• Brine samples used in the Mineral Resource Estimate are all of hole composites obtained from sampling in open holes or installed bores.
• The brine extraction analyses obtained from the drill core represent discrete intervals of 10cm. These analyses had a top cut of 7.0kg/m3 Potassium applied, to minimise the effect of high assays on the estimation.
• Results are reported as SOP which is the combination of the available Potassium with the available Sulphate. The conversion factor from Potassium is 2.23.
Relationship between mineralisation widths and
• These relationships are particularly important in the reporting of Exploration Results.
• If the geometry of the mineralisation with respect to the drill hole angle is
• The brine aquifer is considered to be continuous throughout the sediment profile of the lake, which has been confirmed by analyses of depth profiles and brine extraction samples. The lake

Page 50 of 66
Criteria JORC Code explanation Commentary
intercept lengths
known, its nature should be reported.
• If it is not known and only the down hole lengths are reported, there should be a clear statement to this effect (eg ‘down hole length, true width not known’).
sediments are flat lying and all holes have been drilled vertically so it is assumed that the true width of mineralisation has been intersected in each hole.
Diagrams • Appropriate maps and sections (with scales) and tabulations of intercepts should be included for any significant discovery being reported These should include, but not be limited to a plan view of drill hole collar locations and appropriate sectional views.
• Refer to figures within the ASX Release.
Balanced reporting
• Where comprehensive reporting of all Exploration Results is not practicable, representative reporting of both low and high grades and/or widths should be practiced to avoid misleading reporting of Exploration Results.
• Results considered relevant have been reported. See results tables in this ASX Release.
Other substantive exploration data
• Other exploration data, if meaningful and material, should be reported including (but not limited to): geological observations; geophysical survey results; geochemical survey results; bulk samples – size and method of treatment; metallurgical test results; bulk density, groundwater, geotechnical and rock characteristics; potential deleterious or contaminating substances.
• The most important information apart from the Potassium and other grades from chemical analyses is the porosity of the sediments. This is discussed in sections of the text, including the methodologies used to obtain the porosity data.
Further work • The nature and scale of planned further work (eg tests for lateral extensions or depth extensions or large-scale step-out drilling).
• Diagrams clearly highlighting the areas of possible extensions, including the main geological interpretations and future drilling areas, provided this information is not commercially sensitive.
• The Board of Agrimin has approved the Project’s progression to a Definitive Feasibility Study. Field work to support the Definitive Feasibility Study is currently being undertaken. This includes pump testing, site evaporation trials, water supply investigation, geotechnical work, and infrastructure evaluation.
Section 3 Estimation and Reporting of Mineral Resources
(Criteria listed in section 1, and where relevant in section 2, also apply to this section.)
Criteria JORC Code explanation Commentary
Database integrity
• Measures taken to ensure that data has not been corrupted by, for example, transcription or keying errors, between its initial collection and its use for Mineral Resource estimation purposes.
• Data validation procedures used.
• Data was transferred directly from laboratory spreadsheets to the database.
• Data was checked for transcription errors once in the database, to ensure coordinates, assay values and
Page 51 of 66
Criteria JORC Code explanation Commentary
lithological codes were correct.
• Drop down tables were used for spreadsheet entry, to minimise potential for data entry errors.
• Data was plotted to check the spatial location and relationship to adjoining sample point.
• Brine assays and porosity testwork have been analysed and compared with other publicly available information for reasonableness.
• Comparisons of original and current datasets were made to ensure no lack of integrity.
Site visits • Comment on any site visits undertaken by the Competent Person and the outcome of those visits.
• If no site visits have been undertaken indicate why this is the case.
• The Competent Person was involved in exploration activities on site, which included oversight of two of the drilling programs prior to the current trenching program.
• Data from the current trenching program was not used in the resource, however assays from the trenches are consistent with the drilling results.
Geological interpretation
• Confidence in (or conversely, the uncertainty of) the geological interpretation of the mineral deposit.
• Nature of the data used and of any assumptions made.
• The effect, if any, of alternative interpretations on Mineral Resource estimation.
• The use of geology in guiding and controlling Mineral Resource estimation.
• The factors affecting continuity both of grade and geology.
• There is a high level of confidence in the geological model for the Project. The geology is simple, with brine-hosted in flat lying, relatively uniform, lakebed sediments.
• Any alternative interpretations are restricted to smaller scale variations in sedimentology, principally in the upper unit.
• Similar sediments are reported in previously adjoining properties (that have now been incorporated into this resource) and other Australian salt lakes.
• Geology has been used to separate the deposit into different layers for the resource estimate. The upper sandy layer is more porous, beneath which there is a less porous unit overlying the lower clays that are much less porous. Basement has been identified in a minor number of holes, which partially limits the vertical extent of the lake sediments, with the lakebed sediments extending below the maximum depth of drilling 30m across much of the lake.

Page 52 of 66
Criteria JORC Code explanation Commentary
• Sedimentary processes affect the continuity of geology, whereas the concentration of Potassium and other elements in the brine is related to water inflows, evaporation and brine evolution in the salt lake.
Dimensions • The extent and variability of the Mineral Resource expressed as length (along strike or otherwise), plan width, and depth below surface to the upper and lower limits of the Mineral Resource.
• The lateral extent of the resource has been defined by the boundary of the Company’s tenements, which have been trimmed to fit within the margins of the salt lake. The internal islands have been excised from the estimates. Refer to the figures in the ASX Release.
• The top of the resource is defined by the water table elevation, which is 10cm to 40cm below surface on the lake. The base of the resource is defined by the depth of drilling, which is currently 30m below surface. The resource remains open laterally outside of the Company’s tenements off the lake (where it is covered by sand dunes) and at depth.
• Agrimin’s current Exploration Licences (granted and applications) in Western Australia cover an area of:
o 71.9km E-W.
o 73.8km N-S.
o Surface area of 3,120km2 in total.
o Surface area of 2,701km2 on-lake (including islands).
• Agrimin’s current Exploration Licences (all applications) in Northern Territory cover an area of:
o 66.4km N-S
o 32.6km E-W
o Surface area of 1,236km2 in total.
o Surface area of 646km2 on-lake.
• There is currently an approximate 100m gap between the Western Australia and Northern Territory tenements (on the Northern Territory side of the border) which is an artificial feature with tenements extending to the borders.
Estimation and modelling techniques
• The nature and appropriateness of the estimation technique(s) applied and key assumptions, including treatment of extreme grade values, domaining, interpolation parameters and maximum distance of extrapolation from data
• Three different estimates were generated using different data sets and compiled into a single model:
o The primary brine grade concentrations were estimated using entire hole composites of

Page 53 of 66
Criteria JORC Code explanation Commentary
points. If a computer assisted estimation method was chosen include a description of computer software and parameters used.
• The availability of check estimates, previous estimates and/or mine production records and whether the Mineral Resource estimate takes appropriate account of such data.
• The assumptions made regarding recovery of by-products.
• Estimation of deleterious elements or other non-grade variables of economic significance (eg sulphur for acid mine drainage characterisation).
• In the case of block model interpolation, the block size in relation to the average sample spacing and the search employed.
• Any assumptions behind modelling of selective mining units.
• Any assumptions about correlation between variables.
• Description of how the geological interpretation was used to control the resource estimates.
• Discussion of basis for using or not using grade cutting or capping.
• The process of validation, the checking process used, the comparison of model data to drill hole data, and use of reconciliation data if available.
the bailed samples, into an unconstrained 2-dimensional model.
o Total porosity and specific yield were estimated using 0.75m composites of average values by depth.
o Brine extraction samples (from the drill cores) were used to estimate brine grade concentrations into an unconstrained three-dimensional model. This limited data set has different statistical properties to the primary bailed samples, so was only used to factor the primary grades and induce some vertical variation into the final model.
o All 3 models used ordinary kriging with Gaussian variogram models, which are considered appropriate for this type of deposit.
o Duplicate holes and holes on islands were excluded from the estimates. Some of brine extraction samples were top-cut due to extreme values, to ensure that the resulting factors were reasonable.
o A block size of 1,000m x 1,000m x 1.5m was used for a nominal drill hole spacing of 5km x 5km.
o Search parameters for the first estimation pass were ellipsoid radii of 10,000m x 10,000m x 3m using a minimum of 6 and maximum of 16 samples in at least 4 octants. The second pass used radii of 20,000m x 20,000m x 6m and 4-16 samples, while the third pass doubled the second pass radii and used similar numbers of samples.
o The maximum extrapolation distance is 24km.
o The geological interpretation and resource estimates were generated using Datamine and GS3 geostatistical software.
• No assumptions were made regarding

Page 54 of 66
Criteria JORC Code explanation Commentary
recovery of by-products.
• A number of additional elements or compounds were estimated, including Ca, Mg, Na, SO4 and Cl.
• No assumptions were made regarding selective mining units.
• No assumptions were made about correlation between variables.
• The geological interpretation was used to define the thickness of the orebody and the lake outline was used to limit the reported resources, although mineralisation probably extends beyond the lake boundary. The volume beneath internal islands on the lake were excised from the model to a depth of 20m due to low brine grades near surface (based on drilling and trends in brine grades down hole under islands).
• The new model was compared visually and statistically to the drill hole data and found to reasonably represent the underlying data. There has been no production from the project, so no reconciliation data is available.
• The new model was also compared to the previous estimate and found to be compatible, taking into account the new data and differences in the geological interpretation and estimation methodology.
Moisture • Whether the tonnages are estimated on a dry basis or with natural moisture, and the method of determination of the moisture content.
• Moisture content of the cores was measured, but as brine will be extracted this is not relevant for the resource.
Cut-off parameters
• The basis of the adopted cut-off grade(s) or quality parameters applied.
• No cut-off grades have been applied due to the homogeneity of the data and likely mining methods to be employed in a production scenario.
Mining factors or assumptions
• Assumptions made regarding possible mining methods, minimum mining dimensions and internal (or, if applicable, external) mining dilution. It is always necessary as part of the process of determining reasonable prospects for eventual economic extraction to consider potential mining methods, but the assumptions made regarding mining methods and parameters when estimating Mineral Resources may not
• The resource has been quoted in terms of brine volume and grade.
• No mining or recovery factors have been applied.
• The conceptual mining method is recovering brine from the salt lake via extraction trenches cut into the lakebed sediments.
• Mining recovery is expected to be significantly higher using trenches

Page 55 of 66
Criteria JORC Code explanation Commentary
always be rigorous. Where this is the case, this should be reported with an explanation of the basis of the mining assumptions made.
compared to bores.
• Detailed hydrogeological studies have been undertaken to define the extractable resources and extraction rates possible for the Project.
Metallurgical factors or assumptions
• The basis for assumptions or predictions regarding metallurgical amenability. It is always necessary as part of the process of determining reasonable prospects for eventual economic extraction to consider potential metallurgical methods, but the assumptions regarding metallurgical treatment processes and parameters made when reporting Mineral Resources may not always be rigorous. Where this is the case, this should be reported with an explanation of the basis of the metallurgical assumptions made.
• Evaporation trials and process testwork have been undertaken using bulk samples of the Project’s brine with representative chemistry.
• The testwork results demonstrated that the Lake Mackay brine is suitable for the production of commercial grade SOP using conventional processing techniques.
• The testwork produced SOP samples ranging from 52% to 54% K₂O, exceeding the typical grades for SOP products sold in global markets.
Environmental factors or assumptions
• Assumptions made regarding possible waste and process residue disposal options. It is always necessary as part of the process of determining reasonable prospects for eventual economic extraction to consider the potential environmental impacts of the mining and processing operation. While at this stage the determination of potential environmental impacts, particularly for a greenfields project, may not always be well advanced, the status of early consideration of these potential environmental impacts should be reported. Where these aspects have not been considered this should be reported with an explanation of the environmental assumptions made.
• Agrimin’s Preliminary Environmental Impact Assessment has identified the Preliminary Environmental Factors relevant to the Project as Flora and Vegetation, Terrestrial Fauna, Subterranean Fauna and Hydrological Processes. Studies have been completed in relation to each of these factors with sufficient detail and certainty to support the submission of a Referral to the Western Australian EPA under Part IV of the Environmental Protection Act 1986.
• Environmental assessments to date suggest that the potential impacts to the relevant environmental factors can be managed to meet the EPA Objectives.
Bulk density • Whether assumed or determined. If assumed, the basis for the assumptions. If determined, the method used, whether wet or dry, the frequency of the measurements, the nature, size and representativeness of the samples.
• The bulk density for bulk material must have been measured by methods that adequately account for void spaces (vugs, porosity, etc), moisture and differences between rock and alteration zones within the deposit.
• Discuss assumptions for bulk density
• Density measurements were taken as part of the drill core assessment process described in section 1. This included wet core density, brine density and dry solids density.
• However, no bulk density was applied to the estimates because resources are defined by volume, rather than by tonnage.

Page 56 of 66
Criteria JORC Code explanation Commentary
estimates used in the evaluation process of the different materials.
Classification • The basis for the classification of the Mineral Resources into varying confidence categories.
• Whether appropriate account has been taken of all relevant factors (ie relative confidence in tonnage/grade estimations, reliability of input data, confidence in continuity of geology and metal values, quality, quantity and distribution of the data).
• Whether the result appropriately reflects the Competent Person’s view of the deposit.
• The classification scheme was initially based on the estimation search pass by which Potassium was estimated:
o Pass 1 & 2 = Indicated.
o Pass 3 = Inferred.
• This was applied to the upper 11.25m of the deposit, with everything below this depth classified as Inferred. The resulting scheme was then reviewed by the Competent Person and modified using revised outlines for the Indicated resources, based on the Competent Person’s intimate knowledge of the deposit.
• This scheme is considered to take appropriate account of all relevant factors, including the relative confidence in the volume and grade estimates, confidence in the continuity of geology and brine concentrations values, and the quality, quantity and distribution of the data.
• The classification appropriately reflects the Competent Person’s view of the deposit.
Audits or reviews
• The results of any audits or reviews of Mineral Resource estimates.
• The Mineral Resource were estimated by independent resource consultants (H&SC) and reviewed by the Competent Person.
Discussion of relative accuracy/ confidence
• Where appropriate a statement of the relative accuracy and confidence level in the Mineral Resource estimate using an approach or procedure deemed appropriate by the Competent Person. For example, the application of statistical or geostatistical procedures to quantify the relative accuracy of the resource within stated confidence limits, or, if such an approach is not deemed appropriate, a qualitative discussion of the factors that could affect the relative accuracy and confidence of the estimate.
• The statement should specify whether it relates to global or local estimates, and, if local, state the relevant tonnages, which should be relevant to technical and economic evaluation.
• The relative accuracy of the Mineral Resource is reflected in the reporting of the Mineral Resources as per the guidelines of the JORC Code (2012).
• The statement relates to global estimates of volume, tonnages and grades.
• No production data is available for this resource.

Page 57 of 66
Criteria JORC Code explanation Commentary
Documentation should include assumptions made and the procedures used.
• These statements of relative accuracy and confidence of the estimate should be compared with production data, where available.
Basis for Forward-Looking Statements
No Ore Reserve has been declared. This ASX Release has been prepared in compliance with the current JORC
Code (2012) and the ASX Listing Rules. All material assumptions on which the PFS production target and forecast
financial information is based have been included in this ASX Release, and disclosed in Table 16 below and in the
JORC Code (2012) Table 1 above.
Table 16. Consideration of Modifying Factors (in the form of Section 4 of the JORC Code (2012) Table 1)
Criteria JORC Code explanation Commentary
Mineral Resource estimate for conversion to Ore Reserves
• Description of the Mineral Resource estimate used as a basis for the conversion to an Ore Reserve.
• Clear statement as to whether the Mineral Resources are reported additional to, or inclusive of, the Ore Reserves.
• No Ore Reserve has been declared.
• Refer to JORC Table 1 for Mineral Resource information.
Site visits • Comment on any site visits undertaken by the Competent Person and the outcome of those visits.
• If no site visits have been undertaken indicate why this is the case.
• The Competent Person for the Mineral Resource Estimate was involved in exploration activities and provided oversight of the aircore drilling and trenching program 2015 and auger drilling program in 2016.
Study status • The type and level of study undertaken to enable Mineral Resources to be converted to Ore Reserves.
• The Code requires that a study to at least Pre-Feasibility Study level has been undertaken to convert Mineral Resources to Ore Reserves. Such studies will have been carried out and will have determined a mine plan that is technically achievable and economically viable, and that material Modifying Factors have been considered.
• No Ore Reserve has been declared.
• A Pre-Feasibility Study has been completed to an AACE Class 4 estimate standard.
• Advisian (part of the WorleyParsons Group) was lead engineer and study manager. Advisian is experienced with large-scale greenfield and brownfield potash development projects.
• A team of experienced Australian and international consultants work on the study.
Cut-off parameters
• The basis of the cut-off grade(s) or quality parameters applied.
• No cut-off grades have been applied due to the homogeneity of the data and the proposed extraction method of trenches.
• A brine Mineral Resource is unable to

Page 58 of 66
Criteria JORC Code explanation Commentary
be selectively mined and the hydrogeological model (i.e. mine plan) incorporates an active recharge regime.
Mining factors or assumptions
• The method and assumptions used as reported in the Pre-Feasibility or Feasibility Study to convert the Mineral Resource to an Ore Reserve (i.e. either by application of appropriate factors by optimisation or by preliminary or detailed design).
• The choice, nature and appropriateness of the selected mining method(s) and other mining parameters including associated design issues such as pre-strip, access, etc.
• The assumptions made regarding geotechnical parameters (eg pit slopes, stope sizes, etc), grade control and pre-production drilling.
• The major assumptions made and Mineral Resource model used for pit and stope optimisation (if appropriate).
• The mining dilution factors used.
• The mining recovery factors used.
• Any minimum mining widths used.
• The manner in which Inferred Mineral Resources are utilised in mining studies and the sensitivity of the outcome to their inclusion.
• The infrastructure requirements of the selected mining methods.
• No Ore Reserve has been declared.
• Brine-hosted Mineral Resources are planned to be extracted using trenches constructed on the salt lake surface.
• Brine mineralisation is hosted by shallow lakebed sediments (surficial aquifer) within the deposit and commences at approximately 40cm below ground surface across the deposit. This style of mineralisation and shallow depth lends itself to extraction via trenches.
• The trench system will be excavated using standard excavators fitted with amphibious tracks. Slope angles of the trench walls have been based on geotechnical drilling and field observations from the excavation of pilot trenches across the deposit.
• The volume of Mineral Resources extracted is based on a numerical groundwater model which has been completed to the Australian Groundwater Modelling Guidelines (Barnett et al. 2012).
• The groundwater model was calibrated in steady-state and transient mode to the hydrographs and brine inflow rates measured during the Company’s long-term pumping tests undertaken on pilot trenches across the deposit.
• Particle tracks implemented within the groundwater model have been used to determine the contributing brine distance inflow and the appropriate spacing for trenches.
• Recharge to the surficial aquifer was modelled with the assistance of an infiltration/evaporation model based on long-term climatic data and infiltration tests taken across the deposit.
• A brine concentration model was derived to assess potential changes in brine grades over the life of mine. An active recharge regime of rainfall and runoff is predicted to result in gradual grade dilution over the life of mine

Page 59 of 66
Criteria JORC Code explanation Commentary
(refer to the mine plan).
• The trench system has been designed to utilise gravity drainage for moving much of the brine, however two pumping stations are required to assist the transfer of brine along the feed channel to the evaporation ponds.
Metallurgical factors or assumptions
• The metallurgical process proposed and the appropriateness of that process to the style of mineralisation.
• Whether the metallurgical process is well-tested technology or novel in nature.
• The nature, amount and representativeness of metallurgical test work undertaken, the nature of the metallurgical domaining applied and the corresponding metallurgical recovery factors applied.
• Any assumptions or allowances made for deleterious elements.
• The existence of any bulk sample or pilot scale test work and the degree to which such samples are considered representative of the orebody as a whole.
• For minerals that are defined by a specification, has the ore reserve estimation been based on the appropriate mineralogy to meet the specifications?
• Brine will be pumped into solar evaporation ponds to precipitate Potassium salts which are planned to be harvested and fed to a process plant.
• Process flowsheets are based on the completion of two comprehensive programs of brine evaporation and process testwork. Both programs involved a strict regime of daily monitoring and sampling to ensure a full suite of data was captured.
• The first phase used a 460L brine sample collected from Mackay SOP Project with chemistry representative of the overall Mineral Resource. The testwork was completed by Independent Metallurgical Operations Pty Ltd in Perth.
• The second phase used a 10,000L brine sample collected from Mackay SOP Project with chemistry representative of the overall Mineral Resource. The testwork was completed by the Saskatchewan Research Council under the directive of Global Potash Solutions. Both groups are based in Saskatoon, Canada, and are globally recognised experts in the field of potash processing.
• Process testwork demonstrated that commercial grade SOP was produced using conventional processing techniques.
• Detailed process engineering studies and mass balance was developed from the testwork findings supports an overall Potassium recovery rate of 80%.
• The overall recovery is defined as the amount of Potassium reporting to product SOP divided by the amount of Potassium fed into the pond system. The loss locations are as follows:
o Seepage of Potassium-bearing brine into the ground from the

Page 60 of 66
Criteria JORC Code explanation Commentary
ponds;
o Entrainment of Potassium brine within solid waste salts retained in the ponds;
o Potassium solids entrained in the Halite tails; and
o Precipitation of Potassium solids along with solid waste salts.
• The testwork produced SOP samples ranging from 52% to 54% K₂O, exceeding the typical grades for SOP products sold in global markets. SOP samples produced by the Company have undergone preliminary analysis by potential off-take parties which has confirmed the SOP produced to date meets customer specifications.
Environmental • The status of studies of potential environmental impacts of the mining and processing operation. Details of waste rock characterisation and the consideration of potential sites, status of design options considered and, where applicable, the status of approvals for process residue storage and waste dumps should be reported.
• The Company commenced detailed baseline environmental assessments in 2016 including flora and vegetation, terrestrial vertebrate fauna, waterbirds, subterranean fauna, aquatic macroinvertebrates, short range endemic fauna, hydrological and acid sulphate soils.
• The Company’s Preliminary Environmental Impact Assessment has identified the Preliminary Environmental Factors relevant to the Project as Flora and Vegetation, Terrestrial Fauna, Subterranean Fauna and Hydrological Processes. Studies have been completed in relation to each of these factors with sufficient detail and certainty to support the submission of a Referral to the Western Australian EPA under Part IV of the Environmental Protection Act 1986.
• The Project’s Disturbance Footprint is proposed to cover an area of up to 8,950ha. The off-lake Disturbance Footprint has a proposed disturbance area of up to 450ha and consists of a process plant and related infrastructure, accommodation units, access roads and a borefield. The on-lake Disturbance Footprint has a proposed disturbance area of up to 8,500ha and consists of trenches and solar evaporation ponds.
• The majority of the Project’s

Page 61 of 66
Criteria JORC Code explanation Commentary
Disturbance Footprint relates to the solar evaporation ponds and these have been designed to be located on Lake Mackay’s surface in order to minimise environmental impacts such as vegetation clearing during construction and storage of waste salt.
• The Disturbance Footprint will be finalised based on further environmental studies aimed at avoiding or minimising, in particular, potential impacts to conservation significant flora, vegetation and fauna.
• Environmental assessments to date suggest that the potential impacts to the relevant environmental factors can be managed to meet the EPA Objectives.
Infrastructure • The existence of appropriate infrastructure: availability of land for plant development, power, water, transportation (particularly for bulk commodities), labour, accommodation; or the ease with which the infrastructure can be provided, or accessed.
• The Company’s existing mining tenements and ancillary titles cover the area for the process plant, accommodation camp, office buildings, workshops, airstrip, power generation plant, fuel storage and communications facilities.
• Areas for the Project’s potable water borefield and associated pipelines and gas pipeline will be determined through ongoing studies and ancillary titles will be applied for at the appropriate times.
• The Project requires 4.5GL/year (144L/s or 18 operating bores) of raw water to feed into the reverse osmosis plant to produce 3.2GL/year of process (3.1GL/year) and potable water (0.1GL/year). The raw water will be drawn from the borefield located some 38km south-east of the process plant.
• The Project site will be powered by a reciprocating gas-engine based power plant. The process plant will also include gas-fired water heating. The Company has received an indicative and non-binding proposal to Build-Own-Operate contract (“BOO”) a 440km high pressure gas pipeline from the Amadeus Gas Pipeline to the Mackay SOP Project. Indicative tariffs have been provided for an 8-inch pipeline. A Gas Transportation Agreement of 20 years was assumed in order to align with the Project’s current

Page 62 of 66
Criteria JORC Code explanation Commentary
proposed life. The proposal was provided by one of the largest gas infrastructure businesses in Australia.
• The on-site workforce during operations will include 160 personnel with a 2 week on, 1 week off roster. The accommodation camp at the Project site will have 200 rooms. The construction of a sealed airstrip has been planned to allow a fly-in, fly-out (“FIFO”) air service operating from Perth.
• The communication system will involve a long-haul microwave network to connect in the fibre backhaul. This is expected to provide the most stable and effective communications solution. Vendor consultation has been sought and indicative budget costings obtained.
• A logistics study has been completed by Australia’s largest integrated provider of import and export logistics. The study determined the most feasible methodology for transporting SOP from the Project onto a ship located at the Port of Wyndham. The Company received an indicative FOB transportation cost with a ±15% level of accuracy.
• Road haulage operations from the Project to the port will be via quad road trains. This assumes that road infrastructure meets the standards needed to achieve Road Access Vehicle (“RAV”) 10 network certification. Accordingly, the Project is planned to involve the construction of a new 350km unsealed haul road to connect the Project to the existing RAV 10 network. The Company has received an indicative proposal from an experienced civil construction contractor in respect to this haul road.
• The Company plans to export its SOP production via the Port of Wyndham using the port’s existing wharf facilities for shipments of up to 15,000t. The SOP will be transported from a storage shed to the wharf and then loaded onto the ship using rotaboxes. The Company is engaged in discussions with port operator, Cambridge Gulf Ltd.

Page 63 of 66
Criteria JORC Code explanation Commentary
Costs • The derivation of, or assumptions made, regarding projected capital costs in the study.
• The methodology used to estimate operating costs.
• Allowances made for the content of deleterious elements.
• The source of exchange rates used in the study.
• Derivation of transportation charges.
• The basis for forecasting or source of treatment and refining charges, penalties for failure to meet specification, etc.
• The allowances made for royalties payable, both Government and private.
• The capital cost estimate is in accordance with AACE Class 4 requirements with an expected accuracy of ±25%. The estimate is as at Q1-2018. A large portion of the quantities used in the capital cost estimate have been provided by engineering in the form of high level material take-off sheets. The capital cost provides for Engineering, Procurement and Construction Management, owner’s costs and a 15% contingency.
• The operating cost estimate has been developed with an expected accuracy of ±25%. The estimate is based on the designed annual capacity of 426,000t of SOP as dry granular product with 7,500 operating plant hours per year. The workforce will operate under a FIFO scenario. Power will be generated on-site with gas delivered via pipeline under a BOO contract.
• No allowance for deleterious elements since testwork to date has not shown the presence of any.
• A USD/AUD exchange rate of 0.75 has been assumed for foreign currency conversions.
• The transportation cost is based on an indicative proposal with an expected accuracy of ±15%. The cost includes road haulage and shiploading via rotaboxes.
• A State Government royalty of A$0.73/t of SOP and a Native Title royalty has been included in the computation of all-in sustaining costs.
Revenue factors
• The derivation of, or assumptions made regarding revenue factors including head grade, metal or commodity price(s) exchange rates, transportation and treatment charges, penalties, net smelter returns, etc.
• The derivation of assumptions made of metal or commodity price(s), for the principal metals, minerals and co-products.
• An average long-term real SOP price of US$555/t FOB Wyndham has been assumed. This price is in-line with current SOP prices based on the product mix and markets that the Company is targeting.
• A USD/AUD exchange rate of 0.75 has been assumed for foreign currency conversions.
• The Project’s operating costs have been presented on an FOB Wyndham basis, which includes all transportation costs.
Page 64 of 66
Criteria JORC Code explanation Commentary
Market assessment
• The demand, supply and stock situation for the particular commodity, consumption trends and factors likely to affect supply and demand into the future.
• A customer and competitor analysis along with the identification of likely market windows for the product.
• Price and volume forecasts and the basis for these forecasts.
• For industrial minerals the customer specification, testing and acceptance requirements prior to a supply contract.
• SOP is an important fertilizer product for the cultivation of many crops. Demand has grown at approximately 5% per annum since 2000 and ongoing strong demand growth is expected to be supported by an increasing global population and decreasing arable land.
• Independent SOP market analysis prepared by CRU International Limited in 2017 support the Company’s view of the demand and supply fundamentals.
• SOP is a traded commodity and sold under contracts. The Company is engaged in non-binding discussions with potential off-takers and customers and the Company has received interest for off-take of the Mackay SOP Project’s production. These discussions are focused at supplying both supply-constrained existing and new potential demand in regional markets.
• The Company’s price and volume forecasts are predominantly based on private information gathered from meetings with fertilizer producers, distributors, end-users. These forecasts support the development of the Mackay SOP Project which will contribute 6% of global supply at full-scale.
• SOP samples produced by the Company have undergone preliminary analysis by potential off-takers which has confirmed the SOP produced to date meets customer specifications.
• Targeted product specifications include >52% K2O.
Economic • The inputs to the economic analysis to produce the net present value (NPV) in the study, the source and confidence of these economic inputs including estimated inflation, discount rate, etc.
• NPV ranges and sensitivity to variations in the significant assumptions and inputs.
• The post-tax NPV of the Project was calculated based on the discounted cash flows over the Project’s initial 20 year life. The post-tax NPV is based on an 8% real discount rate, 100% equity financed and a 30% company tax rate.
• NPV is mainly sensitive to assumptions for SOP prices and USD/AUD exchange rates.
Social • The status of agreements with key stakeholders and matters leading to
• The Project area lies within a native title determination area (Determination

Page 65 of 66
Criteria JORC Code explanation Commentary
social licence to operate. Number: WCD2001/002). The Kiwirrkurra native title holders received rights and interests on 19 October 2001. Tjamu Tjamu (Aboriginal Corporation) RNTBC is the native title registered body corporate for the Kiwirrkurra native title holders. The Company and Tjamu Tjamu have signed a Native Title Agreement which provides the necessary consents for the Project’s development and operation.
• The determination area is also subject to the Use and Benefit Aboriginal Reserves 24923 and 40783. The Company has been granted with Mining Entry Permits from the Department of Aboriginal Affairs in order to access the Reserves for the purpose of the Project’s development and operation.
• The Project is located within the Shire of East Pilbara. The Project’s nearest township is Kiwirrkurra. Both the Shire of East Pilbara and Kiwirrkurra community have been supportive of the Company’s development plans.
• The Shire of Halls Creek and the Shire of Wyndham-East Kimberley have been supportive of the Company’s plans to transport SOP in road trains to the Port of Wyndham via Halls Creek.
Other • To the extent relevant, the impact of the following on the project and/or on the estimation and classification of the Ore Reserves:
• Any identified material naturally occurring risks.
• The status of material legal agreements and marketing arrangements.
• The status of governmental agreements and approvals critical to the viability of the project, such as mineral tenement status, and government and statutory approvals. There must be reasonable grounds to expect that all necessary Government approvals will be received within the timeframes anticipated in the Pre-Feasibility or Feasibility study. Highlight and discuss the materiality of any unresolved matter that is dependent on a third party on which extraction of
• No material naturally occurring risks have been identified and the Project is not subject to any material legal agreements and/or binding marketing arrangements.
• The Company has consulted extensively with Government departments (Local, State and Federal). All Project approvals required to date have been received within expected timeframes. The Company has reasonable grounds to expect that all necessary future Government approvals will also be received within the timeframes anticipated in the Pre-Feasibility Study.

Page 66 of 66
Criteria JORC Code explanation Commentary
the reserve is contingent.
Classification • The basis for the classification of the Ore Reserves into varying confidence categories.
• Whether the result appropriately reflects the Competent Person’s view of the deposit.
• The proportion of Probable Ore Reserves that have been derived from Measured Mineral Resources (if any).
• No Ore Reserve has been declared.
• Refer to JORC Table 1 for Mineral Resource information.
Audits or reviews
• The results of any audits or reviews of Ore Reserve estimates.
• No Ore Reserve has been declared.
• Refer to JORC Table 1 for Mineral Resource information.
Discussion of relative accuracy/ confidence
• Where appropriate a statement of the relative accuracy and confidence level in the Ore Reserve estimate using an approach or procedure deemed appropriate by the Competent Person. For example, the application of statistical or geostatistical procedures to quantify the relative accuracy of the reserve within stated confidence limits, or, if such an approach is not deemed appropriate, a qualitative discussion of the factors which could affect the relative accuracy and confidence of the estimate.
• The statement should specify whether it relates to global or local estimates, and, if local, state the relevant tonnages, which should be relevant to technical and economic evaluation. Documentation should include assumptions made and the procedures used.
• Accuracy and confidence discussions should extend to specific discussions of any applied Modifying Factors that may have a material impact on Ore Reserve viability, or for which there are remaining areas of uncertainty at the current study stage.
• It is recognised that this may not be possible or appropriate in all circumstances. These statements of relative accuracy and confidence of the estimate should be compared with production data, where available.
• No Ore Reserve has been declared.
• Refer to JORC Table 1 for Mineral Resource information.
Related Documents