Green climate compatible urban industrial development in Ethiopia Strategy and projects for the Kombolcha- Mek’ele Industrial Corridor PRE-FEASIBILITY STUDIES July 2017

Welcome message from author
This document is posted to help you gain knowledge. Please leave a comment to let me know what you think about it! Share it to your friends and learn new things together.
Transcript

Green climate compatible urban industrial development in Ethiopia Strategy and projects for the Kombolcha-Mek’ele Industrial Corridor
PRE-FEASIBILITY STUDIES
July 2017

Green urban – industrial development project pre-feasibility
Page 2 of 83
Contents
Introduction 4
Purpose 4
Approach of pre-feasibility studies 4
Financing mechanisms 5
Project 1: City-wide resource re-use and waste minimisation project 10
Summary of pre-feasibility study 11
Context 12
National challenges 12
Current policy and programmes 13
Legal framework 15
Kombolcha-Mek’ele context 16
Project objectives and description 19
Implementation parties 20
Pre-feasibility assessment for investment 21
Introduction 21
Technical assessment 21
Impact assessment (economic, social and environmental) 24
Financing options 28
Risk Assessment 31
Implementation timeline 32
Next steps and recommendations 33
References 34
Project 2: Water resource management 36
Summary of pre-feasibility study 37
Context 38
National challenges 38
Current policy and programmes 39
Legal Framework 41
Kombolcha-Mek’ele context 41
Project objectives and description 44
Implementation parties 46
Pre-feasibility assessment for investment 48
Introduction 48

Green urban – industrial development project pre-feasibility
Page 3 of 83
Technical Assessment 48
Impact assessment (economic, social and environmental) 49
Financing options 52
Risk Assessment 54
Implementation timeline 56
Next steps and recommendations 57
References 58
Project 3: Green housing 60
Summary of pre-feasibility study 61
Context 62
National challenges 62
Current policy and programmes 63
Legal framework 65
Kombolcha-Mek’ele context 66
Project objectives and description 67
Implementation parties 68
Pre-feasibility assessment for investment 7 0
Introduction 7 0
Technical Assessment 7 0
Impact assessment (economic, social and environmental) 7 2
Financing Options 77
Risk Assessment 7 9
Implementation timeline 80
Next steps and recommendations 81
References 82

Green urban – industrial development project pre-feasibility
Page 4 of 83
Introduction
Purpose Presented in this report are three pre-feasibility assessments of projects that demonstrate good principles of green urban-industrial development planning. These projects relate to the cities of Mek’ele and Kombolcha, specifically, the two Government of Ethiopia industrial parks and their host urban environments. They are being shortlisted as part of a stakeholder consultation process involving the city, regional and federal authorities. Although the projects relate specifically to issues identified in one or both of these cities, the principles and application project selection and preparation would apply equally along the economic growth corridor linking the two cities, and indeed elsewhere in Ethiopia. The two key objectives of these pre-feasibility assessments are i) to provide practical examples of assessing the technical and economic viability of projects against climate-compatibility criteria; and, ii) to provide initial guidance for towns and ministries to take projects forward towards implementation. This includes a high level overview of financing and implementation strategies for the Government of Ethiopia.
Approach of pre-feasibility studies The pre-feasibility assessments are designed to guide decision makers as to whether the project is sound on technical, economic, social and environmental grounds. Further, the assessment considers the existing policy, legal and regulatory environment in which the project would be grounded, and gives a high-level overview of the institutions and other stakeholders – with a view to setting out an initial assessment of project implementation (including financing options). These are laid out in the following approach.
Figure 1: Approach adopted in the pre-feasibility studies
This assessment primarily makes use of existing information, supplemented with data collected in the field. The recommendations that are put forward in this report should give the decision maker early confidence as to whether the project is ‘go’/’no-go’ i.e. that the project has been subject to initial validation, fits broadly with key policy objectives, and potential funding streams, implementation arrangements, and risks have been identified. However key gaps remain at this stage as the data availability has been inconsistent across the project areas, for example:
1) Solid waste: The last comprehensive study conducted on solid waste management was the Feasibility study undertaken in 2006.1 As a result, data related to solid waste characteristics and collection at the
1 Feasibil ity study and Preliminary Design report for Mek’ele City Integrated Solid Waste Management, Promise Consult, 2006.

Green urban – industrial development project pre-feasibility
Page 5 of 83
city level is rare and outdated. Projects have been modelled based on official population estimates given in the National Urban Development Spatial Plan and waste generation rates taken from the last known waste characterisation study in Mek’ele. Data on waste produced at industrial park level is even scarcer, with just basic estimates available for total generation at IPDC Industrial parks produced prior to construction.
2) Water resource management: The assessment makes use of some key secondary sources, the National Urban Development Spatial Plan (for population estimates); and the environmental impact assessments for both the Mek’ele and Kombolcha Industrial Parks. Primary sources included businesses operating in existing industrial areas; the Mek’ele and Kombolcha city administrations; and water utilities. Important to note is the dearth of localised information relating to water resources and their management in the two cities. As such modelling is based on reasonably sound assumptions regarding likely water demand from domestic and industrial users and comparable international benchmarks.
3) Housing: The assessment primarily makes use of existing information, supplemented with data collected in the field. It should be noted that at the city-level data, particularly that relating to climate change (e.g. GHG emissions) is scarce in Ethiopia. As such assessment has been developed from ‘ready reckoners’ and corroborated by the expert judgement of city stakeholders.
Financing mechanisms A range of funding sources and financing mechanisms are being explored to identify the appropriate types and mix of financing for the projects. These include public and donor funding, including climate finance, as well as private sources, whether direct financing or by financial institutions. The sources of financing are reflected in project assessments below and where possible, the potential revenue models which is specific to project type.
Public funding For projects funded directly by the Federal Government of Ethiopia, there are a number of mechanisms in which the GoE can fund the investments required. This could include enhanced municipal revenues, environmental taxes, PPP arrangements.
Municipal finance
Municipal tax bases remain weak, despite urban local governments having Urban Local Governments (ULGs) having responsibility for delivering a wide range of services. In addition, Many cities lacking control over rate-setting (rates are set at the regional level). Only 3 percent of revenue collection currently takes place at municipal level, while Urban Local Governments (ULGs) own revenues constitute the primary (close to 60 percent) source of finance for urban infrastructure in Ethiopia. Federal and regional transfers (mainly in the form of block grants) only cover salaries and recurrent expenditures and are grossly insufficient to fully fund urban infrastructure and services.2 Further, user fee charges are low and do not cover operational and capital costs. ULGs are also restricted from accessing capital on commercial financial markets.
2 Ethiopian Urbanization Review (World Bank, 2015)
Box 1: Enhancing municipal revenue collection Cities and ULGs could leverage additional financing for climate resilient urban infrastructure if critical municipal finance reforms aimed at enhancing own revenue generation are introduced. Possible solutions include: giving greater autonomy for ULGs to set rates and tariffs, gradually pricing services to achieve cost recovery, automatic inflation adjustments for municipal fees and charges, allowing local government to keep state revenues generated in excess of targets as an incentive for increased revenue collection at the local level, etc.
Green urban – industrial development project pre-feasibility
Page 6 of 83
Environmental taxes
With policy and regulatory reform, the introduction of more stringent environmental taxes may be desirable both as a disincentive to polluting the environment and as a revenue stream. The imposition of tipping fees at dumpsites make a good example. Pricing of tipping fees could be set to incentivise better waste management practices e.g. transporting waste to a materials recovery facility as opposed to direct to landfill. Pricing of the tax should be set such that it reduces pollution whilst improving social welfare, and raises government revenues – good in theory, more difficult in practice.3 Other example of relevant environmental taxes include: water abstraction charges; sewerage and effluent charges.
Leveraging private investment Public-private partnerships (PPP)
In determining an equitable allocation for infrastructure costs, the Government of Ethiopia may look at attracting private sector contributions, via smart PPP frameworks. The GoE has prior experience in using PPP models, for example in the financing of the Addis Ababa Light Rail Transit (LRT). A range of models, including: business led models, PPP, MoU partnerships, municipal entities and public sector led models exist. Use of PPPs may form part of the mix of funding and delivery options though the legal feasibility, time sensitivity, degree of public control, the outlay of public cash, land value creation, pre-development costs and the business models risk-return profile would need to be considered in each case – with appropriate technical support if appropriate. Additional considerations would determine costs that various key stakeholders would likely sustain and how less conventional actors could be mobilized to take-on risk and provide financing to key utility solutions.
For large infrastructure projects that are tied to ongoing service delivery, the PPP may be structured in such a way that the capital investment is transferred to a public entity after a pre-determined period for continued operation. This will typically be after the private-entity has received a desired rate of return on its investment.
Development financing There are various development partners currently operating in the urban sector (reflecting Ethiopia’s priorities towards greening industrialisation and urbanisation). Development partners provide funding in different forms: capital investment (through concessional loans and grants - CI); budget support (BS); and more commonly, through technical assistance (TA) e.g. specialist advice on project preparation; institutional change management; policy and regulatory reform assistance. A summary table is provided below which describes projects and programmes by the most active donors and sector. Projects have been designed with existing programmes in mind so as to provide complementarity.
3 The tax should “reflect the value of the social cost of the marginal unit at the efficient level of pollution.” This requires ‘accurately valuing
the social cost. (Groom 2009)

Green urban – industrial development project pre-feasibility
Page 7 of 83
Table 1: Development financing available to Ethiopia
Donors
/Sectors
Housing Development Solid Waste Management Water Resources
Management
The World
Bank/IDA
- Affordable Housing
Market Assessment (TA)
– ongoing (TA)
- Second Urban Local
Government
Development Project (US$ 380 million,
ongoing) (CI/TA)
- Second Water Supply
and Sanitation Project
(US$ 320 million) (CI/TA)
African Development
Bank
- OWNP programme (ongoing)
- Four Towns Water and
Sanitation Improvement programme (on-going);
- Integrated water supply
and sanitation
programme for 10 towns (proposed)
- Study on the potential for
PPP in water supply
schemes;
Department for
International Development
(DFID)
- Ethiopian Investment
Advisory Facility (£33,524,999) TA
- Water, Sanitation and
Hygiene (One WASH) Programme
(£102,410,900)
GiZ - Energising Development (EnDev) Ethiopia (2010-
2019; 30 million EUR)
- University Capacity Building Programme
(2005-2015, 414 million
EUR)
- Grand Low Cost Housing Programme in Addis
Ababa (2003-2007, 50
million EUR)
Agence
Francaise de
Development
(AFD)
- Support to the Ashegoda
wind farm in Mek’ele
- Construction of landfill
site at Sendafa
- Reppie Waste-to-Energy Facility
- Water supply and waste
treatment in secondary
cities
JICA - Improvement of Access to and Maintenance/
Management of Safe
Water ; groundwater
Resource Assessment in
the Middle Awash River Basin andJerer Valley
and Shebele Sub-basin

Green urban – industrial development project pre-feasibility
Page 8 of 83
Climate Financing
In addition to more traditional sources of development finance, a summary table of key climate change related funds are given below. Key criteria and modalities are given with commentary on goodness of fit for Ethiopia’s CRGE strategy. Individual project objectives are assessed against fit with climate financing.
Table 2: Climate financing available to Ethiopia
Climate
finance
source
Brief
description Key criteria or eligibility Readiness and challenges
Green
Climate
Fund (GCF)
$10b pledged
to support
developing
countries on climate change
challenges
- Impact potential
- Paradigm shift potential
- Sustainable development
potential - Based on needs of the
recipient
- Strong country ownership
- Efficiency and effectiveness
- Integration with other projects can
provide a larger total impact;
- Evidence needed of capacity to meet
targets for MtCO2e reduced or avoided with MRV system
- Needs clear evidence of how project will
reduces exposure to climate risks, and
complementary with broader strategies
and targets
Global
Environment Facility
(GEF)
Fund to
support developing
countries on
environmental
objectives
- Has to address one or more
of the GEF focal area strategies (Biodiversity,
International Waters, Land
Degradation, Chemicals and
Waste, and Climate Change
Mitigation)
- Financing only for the
agreed incremental costs on
measures to achieve global
environmental benefits
- Funding through four
modalities: full-sized
projects, medium-sized
projects, enabling activities and programmatic
approaches
- GEF projects are not large - full-size
project is more than $2million
- Good for establishing credibility for new
ideas, piloting; less so for mainstreaming
- Ethiopia currently implementing portfolio of GEF funded projects
- Allows multiple projects in program
approach
Pilot Program for
Climate
Resilience,
Climate
Investment Funds
(PPCR)
$1.2 billion funding window
for climate
change
adaptation and
resilience building.
- Contributes directly to achieving objectives of the
national strategic plan for
climate resilience/CRGE
- Adaptation focused
- Use of hydro-met information
in planning
- Grant and loan mix
- PPCR is designing multi donor multi-sector investment facility with pipeline of
projects.
- Early inclusion of project in discussions is crucial
- PPCR currently working to design
projects for GCF eligibility
- Show compliance with all WB safeguards
- PPCR is new in Ethiopia

Green urban – industrial development project pre-feasibility
Page 9 of 83
Climate
finance
source
Brief
description Key criteria or eligibility Readiness and challenges
Clean Development
Mechanism
(CDM)
Emission-reduction
projects in
developing
countries which
can earn saleable
certified
emission
reduction
(CER) credits
- Certified emissions reduction (CER) credits must be
produced for sale;
- Sources must have a
positive economic rate of return and be a profitable
enterprise (revenue from
CERs should be surplus
profit not essential revenue
to make business profitable)
- Emission reductions must be
shown to be additional to
baseline
- CDM is complicated; new for Ethiopia;
- Readiness effort large for small amount
of anticipated revenue;
- Low likelihood of carrying out MRV regularly for CER validation4.
4 See UNDP assessment of challenges:
http://www.undp.org/content/undp/en/home/ourwork/environmentandenergy/strategic_themes/climate_change/carbon_finance/CDM/ethiopi
a_opportunities.html

Green urban – industrial development project pre-feasibility
Page 10 of 83
Project 1: City-wide resource re-use and waste minimisation project

Green urban – industrial development project pre-feasibility
Page 11 of 83
Summary of pre-feasibility study
Project description City-wide resource re-use and waste minimisation project Market failure - The growing quantity of municipal waste generated in cities and evolving
composition of waste exerts pressure on municipalities who struggle to keep pace.
- Industrial wastes are also being generated in cities such as Mek’ele and Kombolcha, but are being considered as separate challenges rather than an integrated issue with municipal wastes.
- Materials recovery is an afterthought – much of the intrinsic value in waste is being lost, to all but a handful of market players
Strategic Intent - Refocus waste strategy towards waste minimization and material recovery - Minimising municipal and industrial wastes to landfill - Promoting the closing of resource loops
Proposed interventions
- Institutions: At the federal level develop circular economy strategy to minimize waste & maximize materials use efficiency; at the local level connect and coordinate public and private sector waste players
- Incentive mechanisms: Reform of tariff structures to improve cost recovery mechanisms, public awareness campaigns on waste reduction, separation and recycling; training to IP tenants on materials recovery and waste treatment
- Investment: Alternative waste treatment technologies such as Materials Recovery Facility; energy recovery from waste
Expected benefits - CO2e/GHG emissions reduced - Additional green jobs created/livelihoods supported - Lower levels of environmental pollution/contamination
Investment costs - Estimated CAPEX: $US50 million - Estimated OPEX: US$65 - $US200/tonne of waste
Implementation timescale
- Medium (2-5 yrs.)
Spatial impact - ☒ Industrial parks ☒ Urban level ☐ Corridor level
Implementing organisation
- City Sanitation and Beautification Offices; Regional Bureaus of Urban Development; Ministry of Urban Development and Housing (MUDH); Regional Environmental Protection Authority.
Potential sources of finance
- Public investment, Climate financing/DFI; Private sector (B.O.T)
Recommended next steps
- Undertake detailed market study – materials recovery - Develop strategic partnerships – public, private (IPs), third sector - Develop an institutional advocacy strategy – clarify roles and responsibilities for
managing waste

Green urban – industrial development project pre-feasibility
Page 12 of 83
Context
National challenges Ethiopia is currently undergoing a process of rapid urbanization in a context of severe capacity and fiscal constraints. Many Ethiopian cities are struggling to provide key services such as effective solid waste management with the growing quantity of municipal waste and evolving composition of waste. This presents an environmental challenge but also an economic opportunity. Key challenges include:
1) Inadequate systems
Ethiopian cities generate on average only 0.33 kg of solid waste per capita per day, well below the global average of 1.39 kg/capita/day5. However, waste management remains a major challenge for urban local governments (ULGs) across the country. Evidence suggests that only 43 percent of the total waste generated in urban areas is collected and disposed of in landfill sites6; the remaining waste is indiscriminately dumped on roadsides, drains, waterways, or informally burnt, contributing to flooding hazards, public health risks and environmental pollution. Municipal landfills tend to be poorly managed due to lack of adequate institutional capacity and are currently operating as open dump sites with little to no environmental and health control. The current SWM financing system is inadequate. Cities have provision for charging for solid waste management ‘user-fees’ through the water-bill though this is often not-implemented. Cost recovery is a challenge for both MSEs involved in primary waste collection and for secondary collection by municipalities.
2) Coordination between municipal and industrial wastes
A lack of coordination in the sector results in a fragmented waste management system. City Authorities concentrate on the bulk evacuation and disposal of waste to municipal landfill. Private businesses, community-based organisations (CBOs) and individual waste pickers provide door-to-door collection services, and recycling is currently a private sector-led activity in which a number of players operate commercial recovery of various types of waste.
The industrial parks represent a unique source of solid waste within the wider context of cities. IPs may generate in excess of 125 tonnes of waste a day and industrial value-chains offer distinct possibilities to recover waste material as inputs to industrial processes. Factory owners and businesses operating in the parks are already at the forefront of waste treatment and mitigation technology, often going beyond standards in current environmental regulation in Ethiopia. Examples include, ‘zero liquid-waste’ discharge facilities and on-site solid waste management facilities at the DBL Industries industrial park in Mek’ele. Symbiosis between industrial parks and the cities that host them is currently underexploited when it comes to solid waste management. For example, municipal waste and industrial waste could be used to reduce conventional (carbon-based) fuel demand, reducing CO2 emissions; and materials efficiency measures in the recovery and re-use of waste from industrial processes or municipal waste could be prioritised further in line with the waste management hierarchy.7
3) Materials recovery
Recycling rates remain very low with government not currently prioritising the sorting, separation, and re-use of materials, and limited willingness for households to recycle waste. No national plan for waste management exists and current tariff structures do not recognise alternative treatment methods including recycling, composting or refuse-derived fuels.8 As a result separation and sorting of waste is practiced
5 UNFCCC, 2015
6 Ethiopia Second National Communication
77 Fischedick et al., 2014
8 Facilitating Implementation and Readiness for Mitigation (FIRM) PROJECT –ETHIOPIA (UNEP 2015)

Green urban – industrial development project pre-feasibility
Page 13 of 83
opportunistically along the waste chain and the country is not capitalizing on the economic value of waste streams. There is not data available on recycling rates although recycling is mainly carried out by informal waste pickers. Despite the UNEP(UNEP 2015) fact that many landfill sites (including the one in Mek’ele) were design to include landfill gas capture equipment, energy recovery is almost non-existent. The country’s first waste to energy (WtE) facility is currently being implement in Addis Ababa and could provide a strong opportunity for replication in other secondary cities. Recognizing the importance of addressing this large and growing problem, the Government of Ethiopia (GoE) has set ambitious goals for landfill development. It plans to build 358 landfills and 50 compost centres during the GTP II period, thereby increasing coverage to 90 percent in 75 urban centres. This is a positive sign that nationally, the country is changing how it thinks about waste.
4) Limited public awareness of the impact waste
As the country further urbanizes and per capita income increases, the volume of waste generated by urban areas is projected to reach 1.5 million tonnes annually – a doubling of the 2010 baseline values. Consequently, emissions from the waste sector are projected to grow from 1.2 Mt CO2e per year in 2010 to 3.7 Mt CO2e in 2030.9 Citizen awareness of the public and environmental health impacts of improperly managing waste remains low. Awareness of the link between climate change and improper waste management (e.g. methane/CO2
e emissions) also remains low. As such commitment and willingness to improve waste management practices at the household level is a challenge. At the firm-level, specifically within the industrial parks, there are signs that international best practices in managing waste and discharge are being taken-up.
Current policy and programmes The Climate and Resilient Green Economy Strategy (CRGE) outlines Ethiopia’s ambition of attaining lower middle-income (LMIC) status by 2025 in a climate resilient green economy. It identifies solid waste management as a key lever for GHG emissions, and recommends the use of technologies such as landfill gas capturing and flaring to provide an abatement potential of 0.9 Mt CO2e by 2030. It proposes to implement landfill gas flaring for all cities with a population of over 20,000 inhabitants in a phased manner: 13 percent of towns and cities (17 in total) will first introduce it starting from 2014 and gradually expanding to all towns and cities by 2030 (237 total cities). By 2030, the strategy envisages that 40 percent of solid waste to be disposed at landfill sites in cities with populations ranging from 20,000 to 100,000 and 70 percent in cities with over 100,000 inhabitants. It estimates a gas capture rate of 60 percent and 0.756 kg CO2
e per kg of waste.
The Ethiopian Cities Sustainable Prosperity Goals (ECSPGs) is the main guiding policy framework for the urban sector to implement GTP II. In the waste sector, the policy articulates the need to build 358 landfills and 50 compost centres during the GTP II period, thereby increasing coverage to 90 percent in 75 urban centres. Lastly, the draft Climate Resilience Strategy: Urban Development and Housing (2017) aims to identify the impact of both current weather variability and future climate change on Ethiopia (‘challenge’), to highlight options for building climate resilience (‘response’) and to understand how these options can be delivered (‘making it happen’). Solid waste management features in particular highlighting the need to “clarify and delineate institutional responsibility and accountability at the federal level with respect to SWM, and harmonize the institutional responsibility and accountability at the regional and local levels”. The strategy also sets out support for an evidence based, transparent and accountable solid waste handling and disposal system – including waste-to-energy.
Policy and regulatory provision for integrated solid waste management (ISWM) is limited, i.e. generation (including waste reduction, sorting and resource recovery), temporary storage, collection and transportation as well as the site selection, construction and management of waste disposal sites. Taking a circular economy view of waste generation, recovery and re-use is therefore given limited support at the
9 CRGE Strategy, 2011 (Federal Democratic Republic of Ethiopia 2011)
Green urban – industrial development project pre-feasibility
Page 14 of 83
policy level, save for high-level ambitions articulated at the national level. A comprehensive summary of current policy initiatives can be found on page 11-12.
There are several ongoing or planned initiatives that aim to improve the solid waste management services in urban areas across the country.
1. Second Urban Local Government Development Program (ULGDP)
ULGDP was launched in 2008 by the GoE with the funding support of the World Bank and comprises three components: i) A performance-based investments grants which help finance core infrastructure investments in roads, water supply, sanitation, solid waste, greenery and street lighting to name but a few; ii) Objective and neutral annual performance assessments, linked to the size of allocations; iii) Comprehensive capacity building support focused on all three levels of governments – federal, regional and local. ULGDP is currently being implemented in 44 ULGs (including Mek’ele and Kombolcha) and will stretch until 2018-19. Investment areas include: collection trucks landfills biogas and composting plants etc. Under ULGDP I, 18 landfills were built at a total cost of 18 million Ethiopian birr. However, due to lack of capacity of local governments to manage them, the landfills are not properly developed and managed.
2. Creating Opportunities for Municipalities to Produce and Operationalise Solid Waste Transformation (COMPOST) project
The COMPOST project, co-funded by GEF, aims to achieve GHG emission reductions through composting of organic municipal solid waste and the enhanced use of compost in urban green. The COMPOST project will be implemented over a period of five years (2017-2021) in 6 target cities: Adama, Bahir Dar, Bishoftu, Dire Dawa, Hawassa and Mek’ele. Key components and activities envisaged under the COMPOST project are to develop a national compost standards for organic compost; create a market-based system for compost with micro and small enterprises (MSEs) that are supported professionally to ensure financial sustainability of compost production and utilisation; twinning 6 project cities with other cities both from Ethiopia and outside the country; and, establishing a carbon offset scheme to support urban and peri-urban reforestation and which targets interested Corporate Social Responsibility (CSR).
3. Promoting Sustainable Cities in Ethiopia Project (pipeline)
“Promoting sustainable cities in Ethiopia” intends to implement a set of integrated activities for building climate resilience and sustainable, green cities in Ethiopia. Focusing both on adaptation and mitigation impacts, the envisaged activities span four major interventions areas: planning and enabling environment, integrated solid waste management, urban greening, and sustainable non-motorized transport. The project will be implemented in 10 cities located in 5 different regions of the country selected on the basis of two criteria: i) their high vulnerability to climate change; ii) their potential to demonstrate results which can be replicated to other cities in the country. The project will be submitted to GCF for funding. The requested budget is US$ 50 million.
4. The Urban Productive Safety Net Program
Launched in 2016 by the GoE through MUDH and the WB, the UPSNP’s long term objective is to “reduce urban poverty and vulnerability among the urban poor living below the poverty line and unleashing their productive potential”. The project has three components: Safety Net Support; Livelihood services; and, Institutional Strengthening, Program Management and Coordination. Of relevance the programmes seeks the participation of citizens in labour intensive public works (LIPWs) including: urban greenery development, solid waste management, construction of cobblestone roads, building drainages and community infrastructure, market sheds, etc. The UPSNP is the first intervention of its kind in Ethiopia and will thus require significant capacity building and institutional strengthening support and is expected

Green urban – industrial development project pre-feasibility
Page 15 of 83
to provide support to more than 600,000 beneficiaries during 2016-2020. The project will be implemented in the 9 region capitals and two chartered cities of the country. The total budget is US$ 300 million financed by IDA and GoE.
5. Reppie Waste-to-Energy (Wte) facility
Ethiopia is building its first waste-to-energy (WtE) facility on the Reppie open dumpsite which served the city of Addis Ababa for more than 45 years. The WtE facility will produce green energy within city limits from municipal solid waste. Fuel is burned in an environmentally sustainable way within a combustion chamber that heat tubes of water in a boiler, which is then turned to steam and used to drive a turbine generator to produce green energy. Launched in September 2014, the project is being implemented by Ethiopian Electric Power (EEP) in partnership with Addis Ababa City Administration (AACA). The facility is expected to be complete in 2017. Once fully operational, the WtE facility will process 1,400 tons of waste per day and will export 185 GWh/year to the national electric grid. This will be sufficient to power 25% of Addis Ababa’s residents. An estimated 46,500 MtCO2e per year avoided through methane capture and flaring. The total budget of the project is estimated to be US$ 95,880,000 and ETB 434,530,557 and is funded by Agence Française de Développement (AFD).
6. Urban waste NAMA (UNEP)
NAMA is a Ministry of Environment, Forest and Climate Change (MEFCC) initiative sponsored by UNEP to reduce GHG emissions in the solid waste sector. NAMA works with municipalities to provide market -tested technologies which have the ability to reduce GHG emissions e.g. composting plants; landfills sites and LFG recovery systems; power generation facilities etc. The programme also seeks to generate 5000 jobs in the solid waste sector; and to improve the public perception on solid waste. The current status of the project is not clear.
Legal framework Provision is made through a number of legal instruments for waste collection, transportation, collection, transportation, storage, recycling or disposal of solid waste10. ULGs have overall responsibility for solid waste management, and are required to implement appropriate systems and infrastructure facilities for waste collection, transportation and disposal. Industrial, biomedical and e-waste are not currently covered by the existing legal framework. Similarly, there are no provisions for alternative waste treatment technologies.
10
See Annex 5 for further details.
Box 2: Urban Sector Fast-Track Investment (FTI) project
Fast Track Investment Projects are the piloting and testing projects for the implementation of the CRGE strategy. In the urban sector, a total of 16 FTI projects focusing on solid waste management and urban greening were implemented in collaboration with Municipalities in nine regions of the country between 2014 and 2015. Ten solid waste management projects were implemented in Addis Ababa (2 projects), Bishoftu, Butajera, Dessie, Gambella, Harar, Hawassa, Jigjiga and Logia, while a further six urban greening projects were implemented in Adama, Asossa, Butajira, Dire Dawa, Hawassa and Shire. The projects ran for 18 months. The total budget of the project was US$ 1.5 million, including a budget of US$ 150,000 for coordination activities of the MUDH. The FTI projects did not have GHG emissions reduction targets, but were implemented to trigger learning, institutional responses, and establish working relations between the Ministry and the cities for further work on the CRGE strategy. Building on the lessons learnt from the implementation of the 16 projects, the MUDH plans to scale up the interventions to other cities.

Green urban – industrial development project pre-feasibility
Page 16 of 83
Regional Government has a legal mandate for EIA preparation and pollution though implementation is currently lacking, particularly with regards to evaluating and monitoring compliances of EIA. This is further compounded by the lack technical capacity as well as financial and human resources, particularly at the local level.
These issues would need to be addressed to promote greater involvement of the private sector in managing waste; prioritising materials recovery over eventual disposal; and freeing up government resources to play less of a ‘hands-on’ role in managing waste to concentrate on regulation, monitoring and enforcement.
Kombolcha-Mek’ele context The situation is much the same along the Kombolcha – Mek’ele Corridor. Solid waste management in Mek’ele is currently being managed at the municipal level with some success, although a comprehensive and integrated system of solid waste management that incorporates domestic, commercial, and industrial wastes is lacking11. Moreover little successful effort has been made in re-focusing waste management activities around the embodied value in many waste materials in terms of re-use, recycling or recovery (energy). The paucity of the final disposal stage for wastes results in degradation of the natural and urban environment for the City, suggesting that improvement of the current management of the city’s landfill can be significantly improved12. With a 15 percent waste collection rate, the solid waste management challenge in Kombolcha requires even more attention and significant assistance is needed to put solid waste management infrastructure and services in place. With the City Administration planning to build a new landfill site, there is a strong opportunity for Kombolcha to restructure and modernise its solid waste management system.
Mek’ele solid waste overview The current population is estimated to be approximately 369,570 ranking it as the second largest city in the country. Per capita waste generation rate in Mek’ele is estimated at 0.25 to 0.39 kg/capita/day13 and the total waste produced is approximately 118,262.4 kg per day. Some 30% of the total municipal waste generated in Mek’ele is characterised as non-biodegradable and comprises of scrap metal (7%), plastic (7%), paper (6%) and glass (10%)14. Data on waste generated from the industrial parks is scarce, though it is estimated that the IHDP would generate 125 tonnes/day of industrial waste and 29.8 tonnes day of municipal waste.15
Primary and secondary collection: Estimates of collection rates vary between 60-80% of the total waste generated a figure challenged by the local residents and other administrative bodies that suggest that a significant quantity of waste remains uncollected, specifically during the rainy season when the waste is drawn into rivers and sewerage system. Collection services are not uniform across the city. Five private contractors16, mainly SMEs, providing door-to-door services, alongside the municipality and the informal sector.
Re-use and recycling: There is currently no formally coordinated attempt at recycling or re-use of waste in Mek’ele. Around 100 itinerant waste pickers work informally at household level where paper/plastics are reclaimed for recovery; and at firm level, waste materials ‘brokers’ recover some manufacturing waste e.g. metals, batteries etc. At industrial park level there has been impressive progress in the use of modern technology in minimising waste from industrial processes – both liquid and solid. Household
11
See Annex 1 for more details. 12
See Annex 2 for detail on stakeholder Provision of technical advisory services and capacity building proposed. 13
Waste generation rates vary from one source to another. The Mek’ele Structural Plan reports a per capita waste generation rate
of 0.25 kg/capita/day while the Tigray State of the Environment Report estimate it to be around 0.39 kg/capita/day. 14
Tigray State of the Environment Report, 2015 15
Feasibil ity Study for Mek’ele Industrial Park: Environmental Impact Assessment and RAP, Voyants Solutions Pvt. Ltd (2016) 16
The five SMEs are namely Ezana, Diliet, Superdone, Zewduy Tesfay & Bayush and Birhane Hailesilasi PLC.

Green urban – industrial development project pre-feasibility
Page 17 of 83
recycling is limited to re-use of glass with the vast majority of households currently not practicing source separation of waste (83.5% do not separate waste, (Tadesse, Ruijs, and Hagos 2008).
Waste disposal: the city of Mek’ele has a 21-hectare landfill that is located at approximately 8 km from the city centre, towards the west. Operational since 2008, the landfill is estimated to receive over 100,000 tons of waste per annum17, out of which approximately up to 80% of waste is characterized as biodegradable. Sorting of waste is done manually and informally on site. The non-biodegradable wastes are stored at the site and the decomposable organic wastes are placed on the working face of the landfill site. Cost recovery for waste collection and disposal is estimated at 20% of the required budget – collected mainly through user (sanitation) fees.
Kombolcha solid waste overview The current population of Kombolcha Woreda is estimated to be 137,493, though the city’s population is projected to more than double in the next 20 years, reaching 334,274 in 2035. The city’s per capita domestic solid waste generation rate is estimated to be 0.29 Kg/person/day, or 14,500 tonnes in total in 2017.18 The Kombolcha Industrial Park is projected to generate 87 tonnes/day of industrial wastes and 20 tonnes/day of municipal wastes19.
Primary and secondary collection: Waste collection services are carried out by a limited number of micro-enterprises (also referred to as cooperatives) who collect user-fees for their services (c. 15 birr/month). Waste is collected on a daily basis from businesses and institutions while residential waste is collected once a week only due to insufficient tractors. There is currently no source-separation or sorting of waste. MSEs collect user-fees for waste collection based on a fee structure proposed and approved by the city administration. The amended fee collection manual was approved in 2005 based on which households shall pay 15 birr per month (US$0.65). Inefficient and infrequent waste collection, and a lack of community awareness, results in the open dumping of solid waste. There is currently no coordination between the cities of Kombolcha and Dessie, despite only being located a short, 20km distance apart.
Waste disposal: There is only one operational transfer station in the city and it is located near the banks of Borkena River, in an environmentally sensitive area. Solid waste collected in the city is currently being discharged in an open dumpsite, operational since 1999, located south-east of the city at a distance of about 6 km from the industrial park. An estimated 15 percent of the total waste generated is collected and discharged in the municipal open dump site (Kombolcha city Municipality, 2013). The dump site lacks adequate sanitary facilities such as geo-membrane, leachate collection drain, methane gas collection system to effectively manage the waste produced by the city. This is further compounded by inadequate human capacity at the city level, a single employee with the municipality. The city of Kombolcha intends to close and relocate the landfill site which will be located 1.7km southeast of the existing land fill site.
17
Global Methane Initiative, 2011 18
Data from Construction Design Share Co, 2005 0.289kg multiplied by 137,493 (2017 population)*365 = 14,503,449 Kgs or
14,503.5 tonnes/annum. 19
Calculated from data contained in Kombolcha Industrial Park Feasibility Report, 2008

Green urban – industrial development project pre-feasibility
Page 18 of 83
Figure 2a: Mek’ele landfill site Figure 1b: Solid waste transfer station located along
Borkena River, Kombolcha
Source: IPE Global Team, May 2017
Table 3: Summary of waste situation along the corridor
Mek’ele Kombolcha Dessie Population (2017 estimates) 358,528 133,084 245,129 Per capita waste generation rate (kg/capita/day)
0.39 0.289 0.25
Total municipal waste generated (tonnes/annum)
48,561 9,884 4,343
Municipal waste collection rate 75-82% 15% 65% Recycling rate Small-
scale/informal Small-scale/informal Small-
scale/informal Sanitary landfill (yes/no) Yes (controlled
dump site) Yes (open dump site) Yes (open dump
site) Composting Small-
scale/informal Small-scale /
informal Small-scale
Projected total waste generated by industrial parks20
154 tonnes/day
107 tonnes/day
NA
GHG emissions in CO2 eq. from total waste generated (estimated)
26,594 11,457
20
Industrial waste plus municipal waste generated at the IHDP Industrial Parks only.

Green urban – industrial development project pre-feasibility
Page 19 of 83
Project objectives and description
Component Description
Strategic Intent • Minimising municipal and industrial wastes to landfill • Promoting the closing of resource loops • Maximizing the economic value of waste streams through recovery and reuse of
material from municipal and industrial waste. • Strengthening the institutional and regulatory frameworks to foster incentives for
alternative waste treatment technologies and their effective implementation. • Building the capacity of the various actors (i.e. federal/regional government,
ULGs, MSEs, etc.) involved in the waste sector. Institution • Information collection on waste stream volumes
• Awareness-raising, training and development for ULG officials and IP developers
• Public awareness-raising campaign on waste separation, recycling and reduction
• Training to IP tenants/ workers on materials recovery and waste treatment
Incentives • Reform of tariff structures to improve cost recovery mechanisms • Revised solid waste management regulations to enable investment in alternative
waste treatment solutions • Foster increased private sector participation in waste management
Investment • Alternative waste treatment technologies for example the construction of small waste transfer stations and Materials Recovery Facility inside or adjacent to industrial parks/zones to recycle industrial waste streams (e.g. textile, metals)
• Deployment of recycling equipment and disposal facilities (e.g. waste containers for recyclable material, vehicles, storage facilities, etc.) in industrial estates managed by cities.
• Energy recovery from waste
Complementarity with existing initiatives
Projects/Key interv entions
areas
Policy and regulatory
changes
Inv estment in waste
collection, transport
and disposal
Composting Energy recov ery
Material Recov ery
Facility
Technical Assistance
Institutional strengthening
Promoting Sustainability
Cities Project (pipeline)
X X
COMPOST
project X X X X X
ULGDP II X X X
Urban
Productiv e Safety Net
Project
X
Urban Waste NAMA (status
unclear)
X X X X X X
Proposed City-
wide resource
X X X X X X X

Green urban – industrial development project pre-feasibility
Page 20 of 83
Implementation parties The implementation of the project is proposed to use existing government structures with MUDH have overall oversight of the project. No new organizational structures will need to be established.
Table 4: Implementation parties and governance structure
Stakeholder Role in project implementation
Ministry of Urban
Development and
Housing (MUDH)
• Overall management of the project, including monitoring and evaluation of project interventions
• Coordination and liaison with other ministries • Technical assistance to Regions and ULGs on project management and M&E • Policy and regulatory reforms required for effective implementation of the project
interventions; • Ensure timely preparation and submission of period progress reports (M&E, financial
report, etc.) by Regions and Cities • Facilitate experience and knowledge sharing at the national level
Ministry of Finance
and Economic
Cooperation
(MOFEC)
• Overall financial management of the project (managing funds from GCF and/or donors, disbursement to regions, oversight of budget utilization, etc.)
Ministry of
Environment,
Forest and Climate
Change
• Develop manuals and guidelines on waste GHG emissions inventory • Develop and implement capacity building programme for regions and cities to
conduct GHG emissions inventory • Responsible for monitoring and reporting GHG emissions reduction
Ethiopian Electric
Power (EEP)
• Implement and manage Waste-to-Energy plants
Regional Urban
Development
Bureaus (BUDTI in Tigray region and
BUDC in Amhara
region)
• Supervision of ULGs activities and effective implementation of the project at city level • M&E, implementation quality assurance and troubleshooting support • Disbursement of funds to cities • Knowledge and experience sharing at regional and corridor level
Regional
Environmental
Protection
Authorities
• Evaluate EIA of proposed alternative waste treatment facilities and monitor compliance during and after construction
• Capacity building for zonal and city level EPAs to monitor compliance • Develop guidelines for preparation of industrial waste reduction plans, carry out
training and capacity building for volunteering manufacturers on waste reduction/minimization strategies
Target Urban Local
Governments
• Day-to-day operational and administrative activities of the project. • Formulation and implementation of transformational SWM policies • Conducting tariff studies and implementing appropriate tariff policies (Incl. cost
recovery tariffs and tariffs for compost/recyclables) • Designing and implementing community awareness programmes
City Environmental
Protection Authority
• Evaluating EIA for proposed alternative waste technologies and landfills and monitor compliance
• Monitoring compliance of industries on waste minimization strategies • Assist ULGs in designing community raising awareness programmes on waste
reduction and minimization through waste separation and recycling.
Green urban – industrial development project pre-feasibility
Page 21 of 83
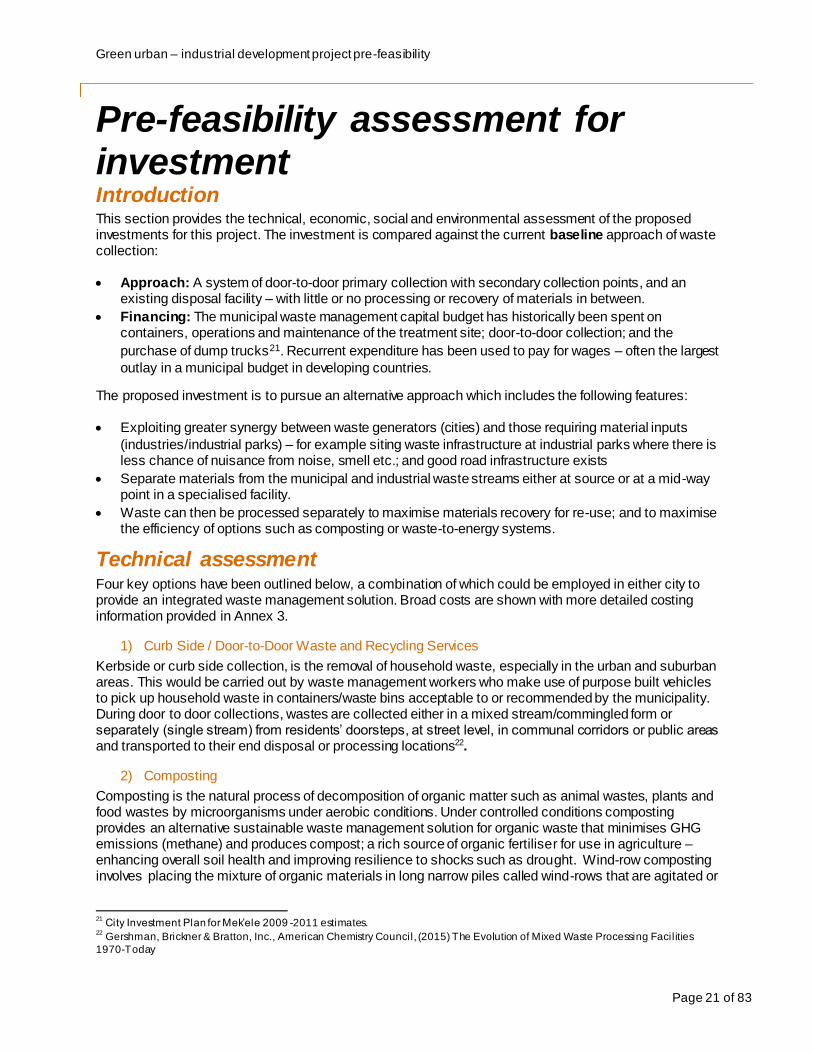
Pre-feasibility assessment for investment Introduction This section provides the technical, economic, social and environmental assessment of the proposed investments for this project. The investment is compared against the current baseline approach of waste collection:
Approach: A system of door-to-door primary collection with secondary collection points, and an existing disposal facility – with little or no processing or recovery of materials in between.
Financing: The municipal waste management capital budget has historically been spent on containers, operations and maintenance of the treatment site; door-to-door collection; and the
purchase of dump trucks21. Recurrent expenditure has been used to pay for wages – often the largest
outlay in a municipal budget in developing countries.
The proposed investment is to pursue an alternative approach which includes the following features:
Exploiting greater synergy between waste generators (cities) and those requiring material inputs
(industries/industrial parks) – for example siting waste infrastructure at industrial parks where there is less chance of nuisance from noise, smell etc.; and good road infrastructure exists
Separate materials from the municipal and industrial waste streams either at source or at a mid-way point in a specialised facility.
Waste can then be processed separately to maximise materials recovery for re-use; and to maximise the efficiency of options such as composting or waste-to-energy systems.
Technical assessment Four key options have been outlined below, a combination of which could be employed in either city to provide an integrated waste management solution. Broad costs are shown with more detailed costing information provided in Annex 3.
1) Curb Side / Door-to-Door Waste and Recycling Services
Kerbside or curb side collection, is the removal of household waste, especially in the urban and suburban areas. This would be carried out by waste management workers who make use of purpose built vehicles to pick up household waste in containers/waste bins acceptable to or recommended by the municipality. During door to door collections, wastes are collected either in a mixed stream/commingled form or separately (single stream) from residents’ doorsteps, at street level, in communal corridors or public areas and transported to their end disposal or processing locations22.
2) Composting
Composting is the natural process of decomposition of organic matter such as animal wastes, plants and food wastes by microorganisms under aerobic conditions. Under controlled conditions composting provides an alternative sustainable waste management solution for organic waste that minimises GHG emissions (methane) and produces compost; a rich source of organic fertiliser for use in agriculture – enhancing overall soil health and improving resilience to shocks such as drought. Wind-row composting involves placing the mixture of organic materials in long narrow piles called wind-rows that are agitated or
21
City Investment Plan for Mek’ele 2009 -2011 estimates. 22
Gershman, Brickner & Bratton, Inc., American Chemistry Council, (2015) The Evolution of Mixed Waste Processing Facilities
1970-Today

Green urban – industrial development project pre-feasibility
Page 22 of 83
turned on a regular basis. By turning the wind-rows, the composting materials mix thoroughly, while enhancing passive aeration23.
This technical option is consistent with the COMPOST project implemented in six cities including Mek’ele which also includes a broader set of activities to support the waste system.
At the local level, municipal composting plant would require a reasonable amount of space (1ha) to allow for transportation, sorting, and separating of waste. An ideal location for a large-scale plant (capable of processing 50-60 tonnes of waste per day) would be on the same site as a Materials Recovery Facility – and in particular on an Industrial Park. Figure 2 below shows a similar unit in operation in north-eastern Uganda.
Figure 3: Composting Plant, Mbale – northeaster Uganda. The plant occupies a clear 1 ha site next to existing
industrial units on the outskirts of town.
3) Materials Recovery Facility (MRF)
MRF is described as a mixed-waste processing system, because it accepts a mixed municipal solid waste stream and then separates out designated recyclable materials through a combination of manual and/or mechanical sorting. Sometimes, the recovered recyclable materials undergo further processing, if required, to meet technical specifications/standards needed by end-markets. The residual waste, which is the balance remaining after the recyclable materials have been sorted, is sent to a disposal facility such as a landfill. MRFs are popular waste management facilities today, due to their ability to operate, with or without city-wide public participation or accompanying recycling programmes at household or street
23
FAO. Composting: let’s give the soil something back. 2015. http://www.fao.org/soils-2015/news/news-detail/en/c/280674/

Green urban – industrial development project pre-feasibility
Page 23 of 83
level24. The facility proposed here would be expected to be a manually operated facility where the majority of processing would be done by hand to maximize employment opportunities.
As above, the most appropriate technical option would be to site an MRF on an existing industrial park. Road infrastructure and buildings (sheds) would be suitable; residential amenity (noise, smells) would be protected as the site would operate a safe distance from residential areas; proximity to industries could mean that materials suitable for use as inputs to industrial processes or as refuse derived fuels require little transportation. In addition, upwards of 125 tonnes of industrial waste could be sorted on-site, further reducing the need to transport waste to another site before sorting.
4) Waste-to-energy
Waste-to-energy plants typically operate through the anaerobic digestion of organic waste - a biological process that produces gas mainly composed of methane (CH4) and carbon dioxide (CO2). The gas is produced from a range of applicable sources including manure, food waste and other, mainly organic waste typologies. Anaerobic processes will either occurs naturally or in a controlled manner, such as biomass plant or within a bio digester. Alternatively, refuse derived fuels may be extracted from municipal or industrial waste streams to be used as an alternative to solid fuels. A good example of linking municipal waste streams to industrial processes is through the use of municipal solid waste as a fuel in industrial cement kilns; which under the right conditions can provide environmental benefits, not least off-setting carbon-based fuel usage.
Consideration should be given to siting the waste to energy plant at the industrial parks. As above, road infrastructure is already developed and of high quality to carry waste from the city; significant amounts of waste are produced on site which could be used in the plants; and, the plant itself is a safe distance from where people live, limiting nuisance.
Figure 3: Materials recovery facility operating in northern Iraq – materials recovered or used in part as fuel for the
LafargeHolcim Bazian cement plant.25
24
WRAP. Recycling collections for flats - door to door collection. http://www.wrap.org.uk/content/recycling-collections-flats-door-
door-collection 25
Source: http://www.lafarge.com/en/iraq-developing-use-alternative-fuels-processed-waste-materials

Green urban – industrial development project pre-feasibility
Page 24 of 83
Impact assessment (economic, social and environmental) 1) Description of impacts
The following impacts have been identified as possible outcomes as a result of the investment above. The impacts are identified based on the outcomes achieved by similar investments in other setting, or research undertaken in the Ethiopian context. Where no quantitative data was available an indication of the expected contribution/level if impact expected is given in the column to the right. 26
Table 5: Impact assessment
Benefits / Positive impacts Costs / Negative impacts
Economic
• Job creation: The waste sector in developing countries remains a labour intensive trade. UN-HABITAT estimates that urban solid waste management services provides employment for up to 6 workers per 1,000 population – or up to 2% of a national workforce27. Further secondary markets in recovered materials also provide new jobs and income.
++
• Capital and operational costs: The different cost ranges are provided in the next section. The range of set-up costs and implementation timeframe can affect the decisions undertaken by the city authorities.
-
• New markets: New secondary markets for recovered materials can reduce material costs/imports. A study in Addis Ababa, Ethiopia, calculated that plans for a new plastic recycling factory, could meet 9.6% of the city’s annual plastic resin requirements.
+
Social
• Livelihoods for youth and women: High labour intensity, low-skilled jobs in the waste management sector, potential to create employment opportunities, particularly for youth or women28. For example, existing waste collection services in Mek’ele are carried out by a number of MSEs (cooperatives) operating in different parts of the city. The MSEs are staffed with 37 employees out of which 26 are female.
+
• Displacement of informal jobs: There may be a displacement of existing informal waste pickers conducting door-to-door collection of wastes, sorting and separating waste for recycling, if no measures are undertaken to absorb these jobs into the formal waste collection economy.
-
26
Impact scoring: ++ significant positive impact; + positive impact; 0 neutral; - negative impact; - - significant negative impact 27
UN-HABITAT. Collection of Municipal Waste in Developing Countries. 2010.27
.
28 A note on jobs. Industrialised countries expectedly project different job and employment figures in the waste management and
recycling sectors — however the mechanised technologies that they employ, that are transferable, hint at what a future employment
scenario might look like in the future. In the USA, for example, waste disposal is only estimated to create 0.1 jobs per 1,000 metric
tons processed, while job figures for the recycling of organic waste, paper, plastic stand slightly higher, at 0.5, 4 and 10 jobs per
1,000 tonnes processed respectively.

Green urban – industrial development project pre-feasibility
Page 25 of 83
Benefits / Positive impacts Costs / Negative impacts
• Improved public health/reduced risk: Proper SWM management can help reduce the level of dust and particulates in the air, which poses significant health risks to residents of the city. ‘Open burning’ is frequently practiced during the informal management of solid waste, whereby waste is burnt in the street or in landfills. Removing waste can reduce risks of block drains and cause stagnation of water, or the contamination of water bodies used for consumption, cooking and cleaning.
+
• Health and safety risks to waste workers: Those employed in the waste management sector are exposed to risk of injury or ill-health e.g. the relative risk of infection and parasites is three to six times higher for workers in SWM than for the control populations, while acute diarrhoea is ten times more frequent, and pulmonary issues have an incidence of 1.4 to 2.6 times higher.29 Personal protective equipment (PPE) can help avoid these risks.
-
Environmental
• Waste-to-energy: Improvements in recent technologies allow the capture of energy produced in incineration to generate electricity, although the process also releases CO2 and other pollutants. +
• Emissions: Municipal solid waste management generate direct emissions which caused by energy-related GHG emissions from waste collection and transportation, emissions from landfills (mainly methane), as well as emissions from incineration and recycling.
-
• Emissions avoidance from composting: Composting offers a way to avoid emissions from the decomposition of organic waste where carried out in controlled circumstances to ensure methane emissions are managed. In addition, organic fertiliser is produced which can enhance soil health and productivity
+
• Risks on hazardous waste: Hazardous, medical, industrial and other noxious wastes need to be handled separately and carefully. Treatment options need to be developed to ensure hazardous waste is not mixed with municipal waste.
-
• Reduced pollution: By reducing waste at source and improving landfill management, air pollution can be significant reduced. Improving the efficiency of solid waste collection could reduce air emissions from waste collection and transfer vehicles. Increased recycling also reduced the pollution associated with the production of new materials.
+
• Reduced leachate: Minimizing landfilled waste will contribute to a reduction of leachate production that will prevent soil and surface and groundwater pollution. The increasing use of compost can also help reduce the amount of chemical fertilizers used, thereby minimizing soil pollution.
+
• Reduced incidence of flooding: Flooding and poor sanitation, as a result of poor SWM practices, as their primary development concerns, during a University study on the Physical and
+
29
UN-HABITAT, 2010

Green urban – industrial development project pre-feasibility
Page 26 of 83
Benefits / Positive impacts Costs / Negative impacts
Environmental Analysis of the city and its surrounding water resources. The high proportion of organic waste in the city’s waste composition, poses clear risks to blocked water channels and an increased level of flooding in the city.
2) Quantification of impacts
Due to the absence of detailed locally specific data, this pre-feasibility assessment does not provide a full cost-benefit model that a mix of waste management options in Ethiopian cities might provide, and only the following impacts are considered. Benchmark costs for waste management options in Ethiopia/elsewhere in East Africa are provided where they were available.
Costs: Capital and operational costs
In deciding which technology to invest in - a rough timeline as well as the necessary supporting services and skills to build and operate the proposed facility must be considered. For example, the establishment of a materials recovery facility, is relatively quick and easy investment for a municipality to make - taking a matter of months to set up and costing under US$1 million for a manual plant and US$2 for a mechanised plant. A waste to energy incineration plant however may cost between US$15-US$20 million. Operating such a facility requires close and consistent monitoring and auditing from highly-skilled industry experts and number of mechanical and chemical supporting services from third parties—inputs and resources that may not be readily available in a secondary city such as a Mek’ele30. This underscores the need for capacity building and training as a core component of this project.
Existing total operational costs in the two cities are hard to define due to the fragmentation of waste management services across formal and informal activities. However, in Mek’ele it is estimated that only around 20% of operational costs of the municipal waste management service are recovered through user-fees. Increasing cost-recovery and diversifying revenue streams – through for example, recovering material, generating energy etc., will ensure that any increased operational costs associated with a change in waste management practices are mitigated.
Average, typical operating expenditures (per tonne of waste processed) given below provide a useful set of benchmarks, highlighting that alternative means of processing waste can be more cost effective than collection and removal to a final disposal site (landfill). Composting for example at an average of just under $30 a tonne provides a cost effective means of processing waste, particularly when considering under the right market conditions compost can sell for an average of US$25/tonne (see financial analysis below). The largest costs after labour in processing waste is transportation i.e. fuel for trucks to transport waste from source to a place of final disposal. By localising where waste is processed i.e. on-site at an industrial park where is generated, one reduces the need to transport bulky waste large distances. In Ethiopia where organic waste is the dominant component in municipal waste, organising the separation of organic waste for composting closer to source also helps to minimise GHG emissions from as organic waste degrades through managed composting.
30
Starting out in waste-to-energy - What factors must be considered when building a new waste-to-energy facility. Waste
Management World. 2008.
https://waste-management-world.com/a/starting-out-in-waste-to-energy-what-factors-must-be-considered-when-building-a-new-
waste-to-energy-facil ity

Green urban – industrial development project pre-feasibility
Page 27 of 83
Table 6: Benchmark costs for technical waste management solutions
Technical solution CAPEX (USD$) OPEX
av erage (USD$/tonne)
Composting (Windrow) $150,000 $5 -54
Door to Door Collection (Weekly) Various $47 - 158
Material Recov ery Facility (Manual/Mechanized) $1-2 mill ion $50 - 142
Composting (In-v essel) NA $57 - 147
Waste to energy (incineration) $US15-20 mill ion NA
Benefits: Job creation and GHG emissions reduction
A more comprehensive, integrated system of managing waste has the potential to employ many more people and in terms of climate mitigation, significantly reduce GHG emissions, particularly methane (CH4). The extent to which these benefits are realised will be determined by how effectively the package of proposed technical measures are implemented. Based on waste generation data from Mek’ele and Kombolcha, the two primary benefits of job creation and reduction in GHG emissions (specifically CH4 and the CO2e cost) are estimated. These estimates are based on an integrated system of waste management i.e. collection, separation, materials recovery for composting. The assessment excludes a consideration of diverting waste to a waste-to-energy plant.
Table 7: Summary table of modelled benefits (see Annex 4 for full break dow n)
Description Mek’ele Kombolcha
2015 2020 2025 2030 2035 2015 2020 2025 2030 2035
Population
(000s)
337,7
73
455,057 602,581 775,199 962,972 93,382 130,972 182,189 249,342 334,274
Total waste
(tonnes)
98,13
0
113,541 132,925 155,607 180,281 41,822 45,801 51,222 58,330 67,320
Jobs (FTE) 2,027 2,730 3,615 4,651 5,778 560 786 1,093 1,496 2,006
Income from
jobs (US$
millions)
1.8 2.5 3.3 4.2 5.2 0.5 0.7 1.0 1.3 1.8
GHG/CO2e
(tonnes)
74,18
6
85,837 100,492 117,639 136,292 31,617 34,625 38,724 44,098 50,894
CO2e (US$
millions)
5.8 6.7 7.8 9.2 10.6 2.5 2.7 3.0 3.4 4.0
Notes: Based on the following assumptions
Population (000s) Estimates taken from National Urban Development Spatial Plan, 2015
Total waste (kg) Municipal waste generation @ 0.36kg/per capita/day (Mek’ele) and 0.29kg per capita/day
(Kombolcha) + Industrial waste generation = 125kg/ha31
Jobs (FTE) 6 FTE jobs per 1000 population (municipal solid waste only)
Jobs (value) Average wage of US$75/month X 1232
GHG/CH4 (tonnes) Average of 0.756 kg CO2e per kg of waste.
33 The carbon savings differ based on the waste type
recycled. EU estimates for example, rank paper recycling at 200 kg CO2 eq/tonne MSW, glass at
31
Mek’ele Industrial Park Feasibility Study, 2016 32
Based on salary band B-C in Mek’ele Solid Waste Management feasibility report 2006

Green urban – industrial development project pre-feasibility
Page 28 of 83
30 kg CO2 eq/tonne MSW, metals at 95 kg CO2 eq/tonne MSW, incineration at 180 kg CO2
eq/tonne MSW and incineration with energy recovery at 230 kg CO2 eq/tonne.
CO2e (US$)
1 tonne of CO2e = US$78 The 'middle' non-traded price of carbon for 2017 as determined by
DECC for use in UK policy appraisal. 'Low' estimate of 30 and 'high' estimate of 91 - converted to
dollars34
Financing options A number of these options are already being considered in existing programmes such as the ULGDP (on collection trucks, landfills and composting plants), COMPOST (on the market for compost including standards and support for MSEs). The first WtE facility in Ethiopia is also being built in Addis Ababa through funding by the AFD. However for a broader roll-out of these facilities across the Kombolcha-Mek’ele corridor, and eventually to the rest of Ethiopian cities, a broader scope of financing options need to be considered.35
Funding for capital investment and operational expenditure could be made up as follows:
CAPEX – one or more of the following to meet capital costs:
a. Development Finance Institutions, Climate Financing grant or loans disbursed through the MOFECC for capital intensive infrastructure plus technical assistance in project preparation.
b. Private-sector investment in: Materials Recovery Facility, Composting units, Waste-to-Energy plant and sanitary landfill could be delivered through a Build Operate Transfer arrangement with the private-sector receiving a concession to finance, design, construct, and operate a facility with eventual transfer to the municipality once a desired internal rate of return is achieved (typically 15-25 years).
OPEX
c. Materials recovery – value of waste that is recovered for re-sale or re-use
d. User-fees – Government or private-sector operators collect, transfer, process waste, charging user-fees to households and firms. A PPP/franchise model could be implemented with the private sector operating on a concessionary basis; collecting user-fees and remitting ‘tipping fees’ to the municipality for the disposal of any waste that has no intrinsic value
e. Municipal government budget – Recurrent expenditure for staff who define waste management strategy; oversee and coordinate private and community sector players; regulate and enforce against non-compliance; undertake city-wide beautification, street sweeping etc.
f. Clean Development Mechanism – This form of finance (credits against carbon equivalent emissions savings) would be a good fit with the project - least favoured option due to the complexity of application process and ongoing monitoring.
Some initial modelling is presented below with regards revenue to finance operating expenditure:
Material recovery facility (MRF)
Potential revenue from materials recovery efforts have been modelled at 10, 25, and 50% efficiency. Through a materials recovery facility one would expect higher rates of recovery which would likely scale up over time as the efficiency of workers and scale of the operation is rolled out over larger parts of the
33
The CRGE strategy estimates a gas capture rate of 60 percent and 0.756 kg CO2e per kg of waste which has been used here as
a conservative proxy for the emissions of CO2e that could be avoided if waste was sorted, separated and processed efficiently –
e.g. organic components separated from non-organic. 34
A brief guide to the carbon valuation methodology for UK policy appraisal (DECC 2011) 35
A list of climate financing options can be found in Annex 6.

Green urban – industrial development project pre-feasibility
Page 29 of 83
city. Waste composition data was unavailable for Kombolcha. Table 8 below provides some estimates of likely revenues available through sorting, separating and re-sale of waste through a MRF.
Table 8: Mek’ele potential project revenue from recycling rates at mechanical recovery plant (10, 25, 50% efficiency).
2017
Waste stream estimated recycling
rates
Price(US$/tonne) Projected rev enue/day
% by
weight
Weight
(tonnes)
10% 25% 50% Low Revenue
(10%)
Revenue
(25%)
Revenue
(50%)
Paper 5.1% 5.9 0.6 1.5 8.8 165.1
2
$97.92 $244.80 $1,451.76
Garden and
Park Waste36
51.6% 60.5 6.1 15.1 915.4 25.6 $154.91 $387.27 $23,433.5
0
Food Waste28 11.8% 13.8 1.4 3.4 47.4 25.6 $35.25 $88.13 $1,213.69
Textiles 4.0% 4.7 0.5 1.2 5.5 0 $0.00 $0.00 $0.00
Wood Waste 0.0 0.0 0.0 0.0 38.4 $0.00 $0.00 $0.00
Plastics 5.9% 6.9 0.7 1.7 12.0 164.8
0
$114.15 $285.37 $1,976.63
Glass 2.3% 2.6 0.3 0.7 1.8 17.07 $4.52 $11.30 $29.93
Metals 1.5% 1.8 0.2 0.4 0.8 1000 $175.80 $439.50 $772.64
Other 29.7% 34.8 0.0 8.7 302.5 0 $0.00 $0.00 $0.00
Total 100% 120.9 $582.55 $1,456.37 $28,878.1
4
Assumptions
Municipal Waste
Population 337,773 Projected rates for 2017 (NUDSP, 2015)
MSW/person (Kg) 0.39 MSW Feasibil ity Study Mek’ele 2006
Collection rate 82% Proportion of households participating in collection scheme
Informal collection 0% Assumes no recyclable waste is collected informally from households directly
Price (US$/tonne) various Cost recovery from recycling activities are based on UK and EU market pricing data for
June/July 201737
Door-to-door collection user-fees
Due to the end-use, large-scale recovery nature of the technology and infrastructure proposed (e.g. a materials recovery facility), user-fees and payments for solid waste management services should be collected by a central, municipal, public authority and ring-fenced for waste management expenses (e.g. infrastructure development). Under such a model, the municipality will be responsible for payments to sub-contracted waste collectors (e.g. the service provider that provides the door-to-door service), but will also be able to take an administrative share of the revenue, for use towards infrastructure development costs. Increasing coverage of a coordinated door-to-door waste collection service across both Mek’ele and Kombolcha has significant potential to raise revenues. This revenue would need to be collected and managed centrally, through for example billing that is attached to water or power bills – provision is made for this at city authority level. Although waste collection rates in Mek’ele are estimated at 82%, it is less clear how effective rates collection systems are. It is useful however to model the potential revenue from door-to-door collection to demonstrate the potential for an increased municipal budget to more effectively manage solid waste.
36
The price here of US$25.6/tonne refers to compost made from organic municipal waste 37
Market Pricing. Recyclables. Let’sRecycling.com. UK. 2017.

Green urban – industrial development project pre-feasibility
Page 30 of 83
Table 9: Mek’ele and Kombolcha potential project revenue from user fees for collecting solid waste at (50, 75, 90%
efficiency) (2015 – 2035).
Description Mek’ele Kombolcha
2015 2020 2025 2030 2035 2015 2020 2025 2030 2035
Population
(000s)
337,773 455,057 602,581 775,199 962,972 93,382 130,972 182,189 249,342 334,274
50% 108,087 145,618 192,826 248,064 308,151 29,882 41,911 58,300 79,789 106,968
75% 162,131 218,427 289,239 372,096 462,227 44,823 62,867 87,451 119,684 160,452
90% 194,557 262,113 347,087 446,515 554,672 53,788 75,440 104,941 143,621 192,542
Assumptions
Municipal Waste
Cost of collection service US$0.64 per person per
month
Clean Development Mechanism (CDM)
Under the UNFCC’s CDM, waste handling and disposal is a recognized CDM category – if it involves methane flaring and/or electricity generation. CDM is a complicated and onerous revenue stream where certified emissions reductions produce credits (CERs) which can be sold. Sources must have a positive economic rate of return and be a profitable enterprise (revenue from CERs should be surplus profit not essential revenue to make business profitable). Although a viable source of revenue, implementation readiness effort large for small amount of anticipated revenue.

Green urban – industrial development project pre-feasibility
Page 31 of 83
Risk Assessment A high-level assessment of any technical, operational, financial, social and environmental risks that the project interventions may face, and proposed mitigation measures to address them is presented below. This follows the GCF Risk Analysis Framework.
Table 8: Risk Analysis
Risk factors Level of impact
Probability Mitigation measure
Lack of political support for ISWM particularly at the lower level
Medium Medium The project is aligned with national policies and broad buy-in from regional and local stakeholders has been secured during the development of the project. Further, the project will include an institutional awareness raising program that targets high levels officials at city and regional levels and promotes the health, social and economic benefits of proper ISWM.
Lack of institutional technical capacity at municipal level for project management and implementation.
Medium Medium The project includes technical advisory services and the MUDH will develop manuals and guidelines on alternative waste treatment technologies. The project will provide training and capacity development to regional governments and ULGs in planning, designing, implementing and operating new facilities.
Lack of familiarity with alternative waste treatment technologies
Medium High Knowledge sharing activities will also be conducted at national and corridor level; capacity building programme for public, private and community sector will accompany policy and regulatory change. Small demonstration sites used to build knowledge and confidence.
Lack of awareness about benefits of source separation and recycling and behavioural change
Medium High A sustained community awareness raising programmes and involvement strategy to promote source separation will be implemented throughout the project duration
Displacement of informal sector
Low High Those carrying out existing activities around materials recovery informally, to be absorbed into a more coordinated formal system. Guarantees improved rights and quality of employment.

Green urban – industrial development project pre-feasibility
Page 32 of 83
Implementation timeline With a move towards greater private-sector involvement in delivery waste management services a phased approach is recommended:
- Fill critical knowledge gaps (Component 1) – undertake a number of technical studies to adequately define parameters for the system
- Begin with small focussed projects allow the public-private partnership to build in strength gradually. For example in terms of the waste management cycle, getting collection services established through a number of private franchises would begin on a pilot basis, expanding out gradually to cover the city.
- Larger capital investments later - Waste-to-energy/materials recovery facilities operators will have more confidence investing in infrastructure of an efficient collection system has already been established and regulatory and policy reform is underway
- Raise public awareness throughout – gradually introduce new waste management practices to households and firms through demonstration projects
Figure 4: Proposed implementation timeline
-
Year 1 Year 2 Year 3 Year 4 Year 5 Funding
partners
1 Project preparation
GoE/
Development
agencies
2 Regulatory and policy
reform
GoE
3 Inv estment
DFI/private-
sector
4 Awareness raising
GoE/
Development
agencies
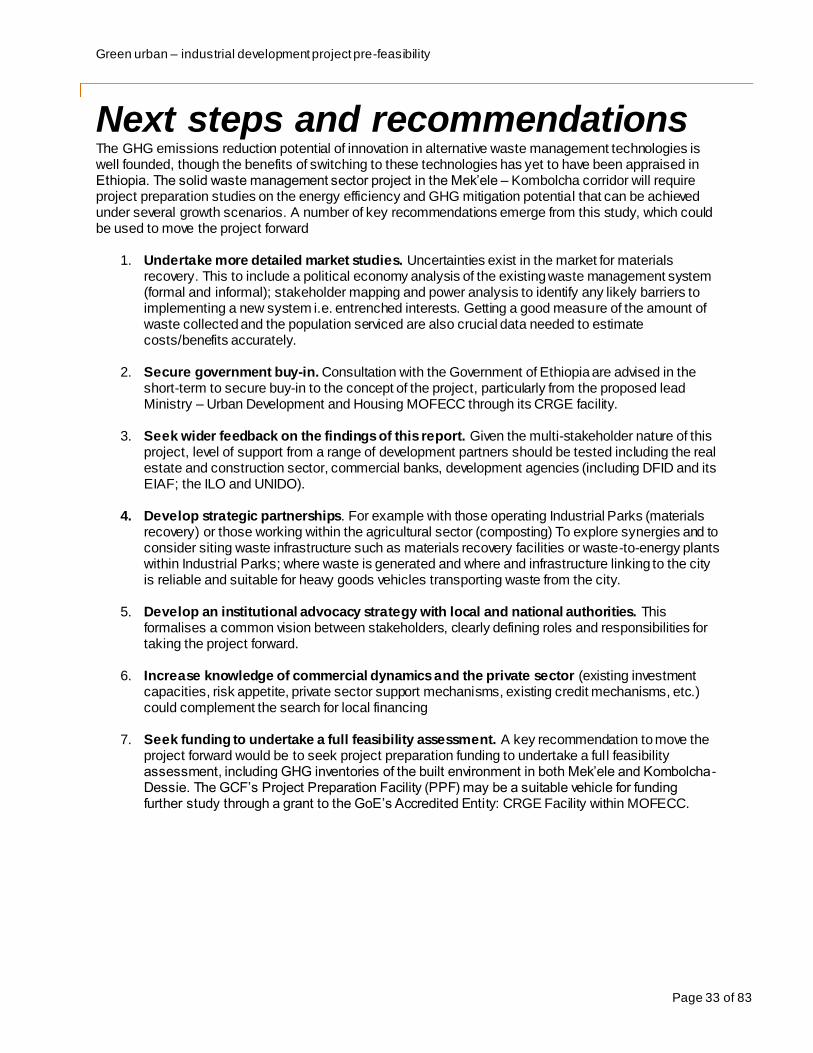
Green urban – industrial development project pre-feasibility
Page 33 of 83
Next steps and recommendations The GHG emissions reduction potential of innovation in alternative waste management technologies is well founded, though the benefits of switching to these technologies has yet to have been appraised in Ethiopia. The solid waste management sector project in the Mek’ele – Kombolcha corridor will require project preparation studies on the energy efficiency and GHG mitigation potential that can be achieved under several growth scenarios. A number of key recommendations emerge from this study, which could be used to move the project forward
1. Undertake more detailed market studies. Uncertainties exist in the market for materials recovery. This to include a political economy analysis of the existing waste management system (formal and informal); stakeholder mapping and power analysis to identify any likely barriers to implementing a new system i.e. entrenched interests. Getting a good measure of the amount of waste collected and the population serviced are also crucial data needed to estimate costs/benefits accurately.
2. Secure government buy-in. Consultation with the Government of Ethiopia are advised in the short-term to secure buy-in to the concept of the project, particularly from the proposed lead Ministry – Urban Development and Housing MOFECC through its CRGE facility.
3. Seek wider feedback on the findings of this report. Given the multi-stakeholder nature of this project, level of support from a range of development partners should be tested including the real estate and construction sector, commercial banks, development agencies (including DFID and its EIAF; the ILO and UNIDO).
4. Develop strategic partnerships. For example with those operating Industrial Parks (materials recovery) or those working within the agricultural sector (composting) To explore synergies and to consider siting waste infrastructure such as materials recovery facilities or waste-to-energy plants within Industrial Parks; where waste is generated and where and infrastructure linking to the city is reliable and suitable for heavy goods vehicles transporting waste from the city.
5. Develop an institutional advocacy strategy with local and national authorities. This formalises a common vision between stakeholders, clearly defining roles and responsibilities for taking the project forward.
6. Increase knowledge of commercial dynamics and the private sector (existing investment capacities, risk appetite, private sector support mechanisms, existing credit mechanisms, etc.) could complement the search for local financing
7. Seek funding to undertake a full feasibility assessment. A key recommendation to move the project forward would be to seek project preparation funding to undertake a full feasibility assessment, including GHG inventories of the built environment in both Mek’ele and Kombolcha-Dessie. The GCF’s Project Preparation Facility (PPF) may be a suitable vehicle for funding further study through a grant to the GoE’s Accredited Entity: CRGE Facility within MOFECC.

Green urban – industrial development project pre-feasibility
Page 34 of 83
References 1. AFD, 2013. Sustainable Waste Management Challenges in the South.
2. Annepu, R. 2012. Sustainable Solid Waste Management in India. [online] Available at: http://www.seas.columbia.edu/earth/wtert/sofos/Sustainable%20Solid%20Waste%20Management%20in%20India_Final.pdf [Accessed 27 Jun. 2017].
3. City Investment Plan for Mek’ele, 2009
4. Dussaux and Glachant (2014). Importing foreign metallic raw materials or recycling scrap metal at home? [online] Available at: https://www.parisschoolofeconomics.eu/IMG/pdf/import_recovery_revised.pdf
5. FDRE, Climate Resilient Green Economy (CRGE) strategy, 2011
6. FDRE, Climate Resilience Strategy: Urban Development and Housing (draft, 2017)
7. FDRE, 2011. ‘Ethiopia’s Climate Resilient Green Economy: Green Economy Strategy’.
8. FDRE, Ethiopian Cities Sustainable Prosperity Goals (ECSPGs)
9. FDRE. Creating Opportunities for Municipalities to Produce and Operationalise Waste Transformation (COMPOST), GEF Project Proposal, 2015FDRE, Climate Resilient Green Economy, Fast Track Investment Project Proposals, MoFED, 2014
10. FDRE, Fast Track Investments, MUDHo, Quarterly Reporting Template, April 2016
11. FDRE, Urban Waste NAMA, UNEP, October 2015
12. FAO, 2015. Composting: let’s give the soil something back. http://www.fao.org/soils-2015/news/news-detail/en/c/280674/
13. Fischedick, Manfred, Joyashree Roy, Amr Abdel-Aziz, Adolf Acquaye, Julian Allwood, J.-P. Ceron, Yong Geng, et al. 2014. ‘Chapter 10: Industry’. In Climate Change 2014: Synthesis Report. Contribution of Working Groups I, II and III to the Fifth Assessment Report of the Intergovernmental Panel on Climate Change [Core Writing Team, R.K. Pachauri and L.A. Meyer (Eds.)]. IPCC. http://pure.iiasa.ac.at/11116/.
14. Gershman, Brickner & Bratton, Inc., American Chemistry Council, 2015 The Evolution of Mixed Waste Processing Facilities 1970-Today
15. Global Methane Initiative, 2011. Ethiopia Solid Waste & Landfill, Country Profile and Action Plan, Community Development Research.
16. Goswami, U., and Sharma, H.P 2008, Study of the Impact of Municipal Solid Waste Dumping on Soil Quality in Guwahati City‖, Pollution Research, Vol.27(2), 2008.
17. Hove, M., Ngwerume, E., and Muchemwa, C., 2013. The urban crisis in sub-Saharan Africa: a threat to human security and sustainable development. International Journal of Security and Development, 2 (1), 7– 18.
18. Ideas for development. (2017). Sustainable Waste Management Challenges in the South. [online] Available at: http://ideas4development.org/en/sustainable-waste-management-challenges-in-developing-countries-charlotte-durand/ [Accessed 27 Jun. 2017].
19. Kombolcha Industrial Park Feasibility Report, 2008
20. Kubanza, N & Simatele, D, 2016 Social and environmental injustices in solid waste management in sub-Saharan Africa: a study of Kinshasa, the Democratic Republic of Congo, Local Environment, 21:7, 866-882, DOI: 10.1080/13549839.2015.1038985.
21. Lamond, J., Bhattacharya, N. and Bloch, R. 2012. The role of solid waste management as a response to urban flood risk in developing countries, a case study analysis. [online] Flood Recovery Innovation and Response. Available at: https://www.witpress.com/Secure/elibrary/papers/FRIAR12/FRIAR12016FU1.pdf [Accessed 27 Jun. 2017].
22. Mek’ele University, Physical and Environmental Analysis: Makable City Structure Plan Revision.
23. Ministry of Urban Development and Housing, and Ethiopian Civil Service University. 2015. ‘State of Ethiopian Cities Report’.
24. National Environmental Engineering Research Institute, NEERI, 2010. Air Quality Assessment, Emissions Inventory and Source Apportionment Studies: Mumbai. New Delhi: Central Pollution Control Board (CPCB).
25. Palfreman, J., Clark, M. (2016) “Where there’s muck there’s money: a market systems approach to conceptualizing solid waste management in Mombasa, Kenya”. Journal of Waste Management.
26. Promise Consult, 2006. Feasibility study and Preliminary Design report for Mek’ele City Integrated Solid Waste Management.

Green urban – industrial development project pre-feasibility
Page 35 of 83
27. Precise Ethiopia, (n.d.). Profile on The Production of Recycled Plastic Waste. [online] Available at: http://preciseethiopia.com/download/publication/business_opportunities/Profile%20on%20the%20Production%20of%20Recycled%20Plastic%20Waste.pdf [Accessed 27 Jun. 2017].
28. Tadesse, Tewodros, Arjan Ruijs, and Fitsum Hagos. 2008. ‘Household Waste Disposal in Mek’ele City, Northern Ethiopia’. Waste Management 28: 2003–12.
29. Tellus Institute with Sound Resource Management. (n.d.). More Jobs, Less Pollution: Growing the Recycling Economy in the U.S. [online] Available at: http://www.no-burn.org/wp-content/uploads/Executive-Summary-Full-Report.pdf [Accessed 27 Jun. 2017].
30. Tigray State of the Environment Report, 2015
31. World Bank, 1997. SOCIAL ASSESSMENT IN MUNICIPAL SOLID WASTE MANAGEMENT. [online] World Bank. Available at: http://siteresources.worldbank.org/INTURBANDEVELOPMENT/Resources/336387-1249073752263/6354451-1249073991564/bernsteinsa.pdf [Accessed 27 Jun. 2017].
32. UNFCCC, Ethiopia’s Second National Communication to the United Nations Framework Convention on Climate Change, 2015
33. UN-HABITAT, 2010. Water And Sanitation in the World’s Cities. [online] Available at: http://www.waste.nl/sites/waste.nl/files/product/files/swm_in_world_cities_2010.pdf [Accessed 27 Jun. 2017].
34. UN-HABITAT, 2010. Collection of Municipal Waste in Developing Countries.
35. Voyants Solutions Pvt. Ltd. 2016. ‘Feasibility Study for Mek’ele Industrial Park: Environmental Impact Assessment and RAP’.
36. WRAP, 2017. Recycling collections for flats - door to door collection. [online] Available at: http://www.wrap.org.uk/content/recycling-collections-flats-door-door-collection

Green urban – industrial development project pre-feasibility
Page 36 of 83
Project 2: Water resource management
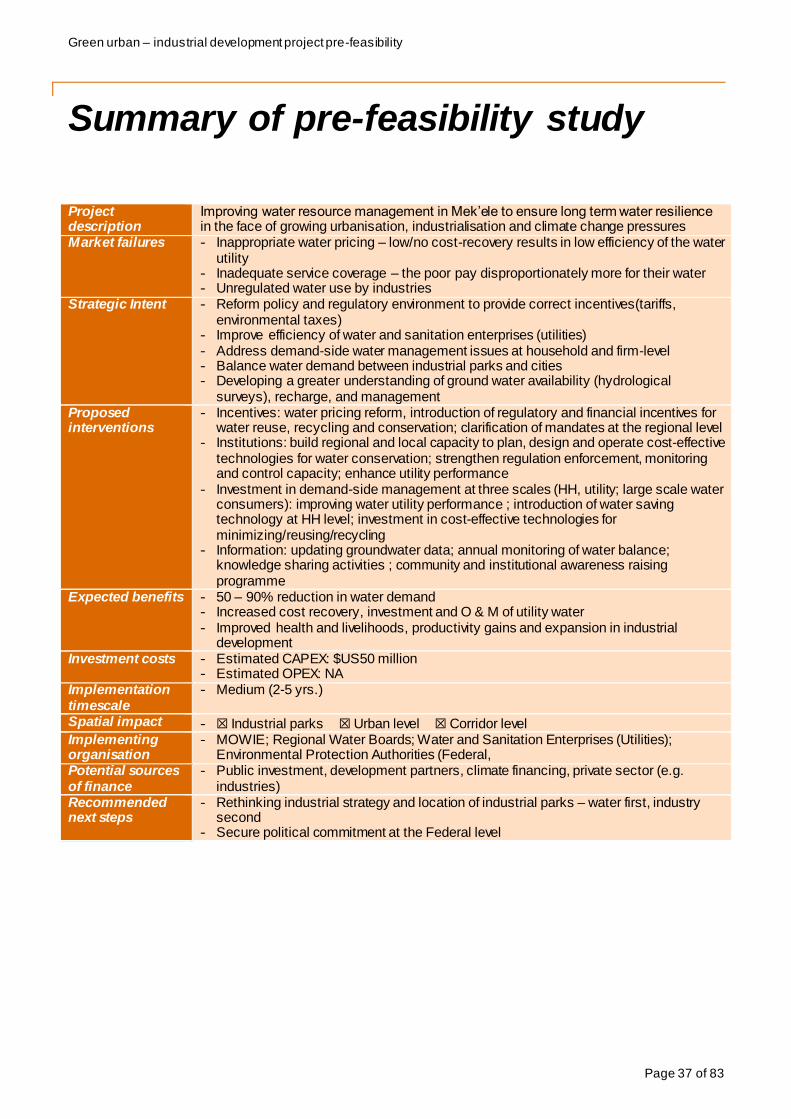
Green urban – industrial development project pre-feasibility
Page 37 of 83
Summary of pre-feasibility study
Project description
Improving water resource management in Mek’ele to ensure long term water resilience in the face of growing urbanisation, industrialisation and climate change pressures
Market failures - Inappropriate water pricing – low/no cost-recovery results in low efficiency of the water utility
- Inadequate service coverage – the poor pay disproportionately more for their water - Unregulated water use by industries
Strategic Intent - Reform policy and regulatory environment to provide correct incentives(tariffs, environmental taxes)
- Improve efficiency of water and sanitation enterprises (utilities) - Address demand-side water management issues at household and firm-level - Balance water demand between industrial parks and cities - Developing a greater understanding of ground water availability (hydrological
surveys), recharge, and management Proposed interventions
- Incentives: water pricing reform, introduction of regulatory and financial incentives for water reuse, recycling and conservation; clarification of mandates at the regional level
- Institutions: build regional and local capacity to plan, design and operate cost-effective technologies for water conservation; strengthen regulation enforcement, monitoring and control capacity; enhance utility performance
- Investment in demand-side management at three scales (HH, utility; large scale water consumers): improving water utility performance ; introduction of water saving technology at HH level; investment in cost-effective technologies for minimizing/reusing/recycling
- Information: updating groundwater data; annual monitoring of water balance; knowledge sharing activities ; community and institutional awareness raising programme
Expected benefits - 50 – 90% reduction in water demand - Increased cost recovery, investment and O & M of utility water - Improved health and livelihoods, productivity gains and expansion in industrial
development Investment costs - Estimated CAPEX: $US50 million
- Estimated OPEX: NA Implementation timescale
- Medium (2-5 yrs.)
Spatial impact - ☒ Industrial parks ☒ Urban level ☒ Corridor level Implementing organisation
- MOWIE; Regional Water Boards; Water and Sanitation Enterprises (Utilities); Environmental Protection Authorities (Federal,
Potential sources of finance
- Public investment, development partners, climate financing, private sector (e.g. industries)
Recommended next steps
- Rethinking industrial strategy and location of industrial parks – water first, industry second
- Secure political commitment at the Federal level

Green urban – industrial development project pre-feasibility
Page 38 of 83
Context
National challenges Ethiopia has made significant progress in improving water supply coverage over the past two decades. Between 1990 and 2015, national access to safe drinking water rose from only 13 percent to 57 percent, according to WHO/UNICEF JMP data (2015). In urban areas, 93 percent of the population now has access to improved drinking water.
1) Inadequate urban water supply services
Despite these achievements, great challenges remain in the water sector. While urban water coverage has expanded, quality of service remains poor, with many cities experiencing frequent water supply disruptions as well as rationing. Between 35 to 40 percent of water supplies is reportedly lost through leakages and other system inefficiencies, further exacerbating water scarcity. Leakages result in sucking of dirty water into pipes, posing a threat to public health. In most cities, water loss monitoring systems are not in place, resulting in slow detection of leakages. Total urban water demand for 2020 is projected to reach 3.31 million m3/day (with 2.435 million m3/day and 0.875 million m3/day for domestic and industrial uses, respectively) and water consumption per capita is projected to increase to 100 litres/person/day38.
2) Water use by industry / unregulated use of water
Ethiopia aims to become a leading manufacturing hub in Africa and globally, as stated in the second Growth and Transformation Plan (GTP II). To achieve this vision, GoE has prioritized various industries such as textile, leather, sugar, cement and steel which are all highly water-intensive industries. Despite the current legal framework recognizing the need for cost recovery, water usage by industries (particularly self-supply) is currently poorly regulated and pricing rarely reflects the true costs of sustainable water supply. In many cities, little is known about declines and recharge rates of groundwater as a result of extraction by industries.
Further, most first generation industries do not use modern technologies for waste water treatment and industrial effluent is commonly discharged in nearby rivers and water channels, resulting in increasing water pollution. By 2020, the volume of wastewater generated by Addis Ababa alone, much of which is discharged in the Awash and Akaki Rivers, is expected to exceed 200,000 m3 / day or 73 million m3 of wastewater, out of which 10% will from industrial source. The GoE is leading the way by introducing zero liquid discharge (ZLD) system in the industrial parks being developed by IPDC. Reuse of wastewater from industries is already practiced in some parts of the country (e.g. for irrigation) although in many locations this is largely on an unplanned basis.
3) Water resilience to climate change Climate change is likely to affect water availability and exacerbate water scarc ity issues in the future. Rainfall variability caused by climate change can reduce surface water flow and lead to further long-term reductions in groundwater levels. Temperature rises are expected to increase water needs and thermal stress. They also increase evapo-transpiration, which further reduce the amount of water available for productive use. According to the CRGE Water and Energy strategy, up to 7.3 million people in Tigray, Afar and Somali face the highest risk to water access because they are exposed to multiple risks, i.e. difficult hydrogeology combined with exposure to climate risk and low-resilience technologies. Balancing growing demand for water between agriculture, urbanization and industrialization in the face of climate change induced impacts is likely to become a significant challenge for the country. This will require new approaches and technologies for more efficient management of water resources and ensuring long-term recharges of aquifers. Without additional financial support, long-term solutions to water resilience are out of reach for many cities across the country.
4) Critical knowledge gaps
The present situation in the country is characterized by a pervasive lack of reliable and updated data relating to all aspects of water resource management (i.e. groundwater data, water balance at river basins, water extraction by major users, information on industrial discharge, water quality data. etc.). For instance, the
38
Draft Climate Resilient Strategy: Urban Development and Housing (2017)

Green urban – industrial development project pre-feasibility
Page 39 of 83
information coverage of groundwater was estimated to be around 10 percent in 2014/15. A key target of GTP II is to increase coverage to 25 percent by the end of the planning period, but even this is inadequate especially when considering that groundwater constitutes the main source of potable water in the country. A National Groundwater Information System (NGIS) is already in place but there is no systematic monitoring of groundwater quality and levels at present. The CRGE Water and Energy strategy estimates that US$ 10 million are needed to systematically monitor and maintain groundwater data. Information on how climate change is affecting the reliability and quality of water supply is also lacking. This is mainly attributed to the lack of capacity to develop and manage information databases (World Bank, 2017). These critical knowledge gaps constitute a major hindrance for the implementation of climate resilient water resource management policies.
Figure 5: Ground Water Availability during drought periods (showing the Mek’ele – Kombolcha corridor)
Current policy and programmes39 The GoE through the Ministry of Water, Irrigation and Electricity (MoWIE) has adopted several policies and strategies pertaining to water resource management. The Water Resource Management Policy (1999) is the main guiding policy in the water sector. The current policy framework recognizes water and sanitation as economic and social goods. It also recognizes the principles of integrated water resource management (IRWM) and clearly adopts a river basin approach. Ownership and management autonomy is devolved to the lowest possible units of government with MoWIE playing a regulatory role. Additionally, the GoE has adopted a policy of gradual full cost recovery for urban water supply systems. However, the fact that utilities can set water tariffs but need to be endorsed by the respective management board and approved by regional authorities is reducing the incentives to move towards full cost recovery. This is further compounded by the lack of inadequate human and institutional capacity at all levels. Another key policy challenge is the lack of integration of water resource management issues in local planning documents such as Structural Plans and Master Plans.
39
More detailed initiatives and programmes can be found in Annex 9.
Mek’ele – Kombolcha
corridor

Green urban – industrial development project pre-feasibility
Page 40 of 83
Under GTP II, the GoE plans to achieve universal access to water supply throughout the country, as part of its poverty reduction objectives. In urban areas, the Plan aims to provide 75% water supply access coverage with upgraded minimum urban utilities service levels of 100 l/c/day, 80 l/c/day, 60 l/c/day, 40 l/c/day and 30 l/c/day for category 1, 2, 3, 4, and 540 cities and towns respectively. GTP II recognizes that there are currently critical knowledge gaps with regards to groundwater availability in the country and aims to expand groundwater exploration coverage from 13 to 25 percent and to improve basins and hydrological information systems from 25 to 63 percent.
A cornerstone of the FDRE’s Climate-Resilient Strategy: Water and Energy (2015) is to accelerate
the shift from access to exposed surface water to more resilient sources; whilst enhancing self-supply.41 The strategy aims to achieve this through better regulation of water use, accelerating universal access to WASH, and enhancing the resilience of self-supply. The strategy also emphasise the need for better coordination and collaboration between various stakeholders (i.e. River Basin Authorities and Councils, regional agricultural bureaus, utilities, MoWIE and other relevant Federal Ministries).
More recently, the draft Climate Resilience Strategy: Urban Development and Housing (2017) prepared by the Ministry of Urban Development and Housing (MUDH) aims to identify the impact of both current weather variability and future climate change on Ethiopia (‘challenge’), to highlight options for building climate resilience (‘response’) and to understand how these options can be delivered (‘making it happen’). With regards to water resource management, there are several ongoing or planned initiatives that aim to improve the water resource management in urban areas across the country.
1. One WASH National Program (OWNP)
The OWNP is the GoE’s main instrument for achieving the GTP II and MDGs goals with respect to water supply, sanitation and hygiene in an integrated manner. The programme’s Urban WaSH component (20% of total budget) funds capacity building, planning and service improvement activities through grants and water expansion activities are provided on a soft loan basis. The program’s water supply interventions is expected to benefit 4.4 million people. The total budget of the project is US$ 438.7 million. The OWNP is being implemented by four Ministries: MoWIE, MoH, MoE and MOFEC.
2. Ethiopia Second Urban Water Supply and Sanitation Project (UWSSP II)
The Second Urban Water Supply and Sanitation project is an IDA financed project which aims to enhance water supply and sanitation services in an operationally efficient manner in Addis Ababa and selected Secondary Cities. . The project will have three component including: 1) Sanitation and water supply services improvements in Addis Ababa; 2) Sanitation and water supply services improvement in secondary cities under which 22 cities selected from all regional states and the Dire Dawa city administration will be supported. It has three subcomponents as follows: (i) Sanitation services improvement in secondary cities; (ii) Water supply and operational efficiency improvement in secondary cities; and (iii) Project management and institutional development in secondary cities. 3) The third component, Project management and institutional strengthening, will help Ministry of Water, Irrigation, and Electricity (MoWIE) and Regional Water Bureau (RWBs) manage the project and strengthen their institutional capacity. The project will benefit 3.38 million people of which 623,000 will benefit from improved water supply access. The project was approved in March 2017 and will run until 2023. The total estimated cost is US$ 505 million which will be financed by a combination of IDA (US$ 320 million), Scale Up Facility (SUF) Credit (US$ 125 million)and counterpart funding by Addis Ababa City Administration (US$ 60 million).
3. Second Urban Local Government Development Program (ULGDP II)
The second urban local government development program (ULGDP) aims to improve the institutional performance of participating urban local governments (ULGs) in developing and sustaining urban infrastructure and services. The program’s performance-based investments grants component helps finance core
40
The different categories are based on the population size of cities as follows: category I: population greater than 1 mill ion; category II:
100,000 - 1 mill ion; category III: 50,000 – 100,000; category IV: 20,000 – 50,000; category V: less than 20,000 inhabitants.
41 Ethiopia’s Climate-Resilient Green Economy Climate Resilience Strategy: Water and Energy (2015) Ministry of Water, Irrigation, and
Energy.

Green urban – industrial development project pre-feasibility
Page 41 of 83
infrastructure investments in roads, water supply, sanitation, solid waste, greenery and street lighting to name but a few. Eligible investment areas related to water resource management include: servicing of land with utilities (including water supply), drainage systems, liquid waste infrastructure such as wastewater treatment ponds, sludge ponds, vacuums trucks, etc.
4. An Integrated Approach to water sector development to support Ethiopia’s paradigm -changing CRGE Strategy
The FDRE has developed a project proposal for GCF funding which is intended to begin the implementation of the country’s climate resilient water strategy by acting as an innovation hub for the strategy and testing a range of new approaches. Major project components include: Resilient and integrated river basin management; replacement of diesel powered water pumping systems by solar water pumping system for rural WaSH; ultra-lowhead micro-hydro (ULH-MHP); and hydrological information systems. The requested GCF budget is US$ 10 million. The project is being implemented by MoWIE. The current status of the project proposal is unknown.
Legal Framework
Over the last two decades, the GoE has enacted a wide range of legislations, regulations and standards aimed at improving water resource management throughout the country. The Water Resource Management Proclamation (No. 197/2000) is currently the basic legal instrument governing the management, planning, utilization and protection of water resources in Ethiopia. The Proclamation states that domestic use should have priority over other uses. Further, it stipulates that water resource management shall be based on a permit system. The proclamation gives the MoWIE a prominent role in the management of water resources including the mandate to issue permits for water use, waste water discharge and water works. It also includes provisions for the MoWIE to delegate some of its responsibilities to regional governments or river basin organizations (RBO). The latter were legally established in 2007 to promote the principles of integrated water resource management and decentralization of management at the river basin level.
Despite the availability of proper policies, enforcement remains a major challenge. Permitting, monitoring and enforcement of water use is yet to be adequately implemented by MoWIE, as required by the laws in place. This is partly due to weak political commitment to adequately monitor and price water use, particularly by industries as precedence is given to industrial development and job creation. Limited human and institutional capacity at all levels also undermine the effective implementation of key water legislations and regulations. For more information on specific policies and strategies, see Annex 7.
Although due consideration has been given in the current legal system to both environmental protection and the requirements of industrial processes, there is currently no framework for wastewater that permits sufficient cost recovery. Further, industries have little incentives to act since monitoring and enforcement systems at the local level are generally weak. For instance, charges and fines are not regularly revised, thus limiting their deterrent effect.
In addition, the current policy and legal framework tends to focus on more “command-and-control” measures and incentives for climate-resilient water management are lacking. While the Ministry of Urban Development and Housing (MUDH) has developed various standards and codes for urban infrastructure, it has yet to develop codes on water recycling for instance. For more information on specific legislation, regulations and standards, see Annex 8.
Kombolcha-Mek’ele context Mek’ele water resources management overview
Mek’ele is arguably one of the least water-secure cities in Ethiopia. The city draws heavily upon groundwater which is currently being supplied from Aynalem and Chenferes well-fields. Combined they produce a total of 25,637 cubic meters per day. Water supply coverage currently stands at 59 percent. Evidence suggests that some parts of the city receive water every 3 days and for only 8 hours per day. The estimated residential per capita consumption with house and yard connection was about 44 litre/capita/day, well below the GTP II target of 80 litre/capita/day.

Green urban – industrial development project pre-feasibility
Page 42 of 83
Although the city’s utility reports non-revenue water to be 21.5 percent, other sources suggest that this figure might be as high as 44 percent (WB water sanitation report). According to a study by ARUP, frequent droughts and over extraction place the Aynalew well-fields under serious threat. 42 Further, poor sanitation and wastewater treatment practices further impact the ability of households to secure access to improved water sources where supply is contaminated locally. Water usage by industry (particularly self-supply) is currently poorly regulated and pricing rarely reflects the true costs of sustainable water supply. There are valid concerns that water for industry is being prioritized over access by households; with businesses operating in the IPDC industrial park paying a fraction of the cost per m3 of water used. The IPDC Industrial Park is estimated to need around 70 million litres per day at full-capacity.43
Table 10: Water pricing differential by use (Residential, Commercial, and Industrial).
Range of consumption
Cost and tariff rate in Birr per m3 (by consumption level)
Actual cost Subsidize tariff For Residential For Commercial Industrial Park(s)
0-5 m3 10.20 2.30 6.10
0.3 – 0.6 6-11 m3 10.20 3.50 6.10 11-20 m3 10.20 4.70 6.10 >20 m3 10.20 6.10 6.10
There are however, some innovative practices being adopted at industrial sites across the city – zero liquid discharge wastewater treatment systems; rain water harvesting system; recycled water technology wastewater from industrial processes being re-used by farmers for irrigation etc. Consideration needs to be given to replicating and scaling up these efforts city-wide in order to ensure the availability of water for urban uses but also the city’s industrial growth.
To increase the city’s water production capacity, the GoE has proposed to build a 6 to 10 million birr dam on Geba river but the project is yet to be financed. The financial constraints faced by the Government limits investment options.
Kombolcha water resources management overview
Unlike Mek’ele, Kombolcha has relatively abundant surface and ground water resources at its disposal. According to data obtained from the Kombolcha Town Water Supply and Sewerage Enterprise, water is currently supplied from three bore holes (with depth ranging between 150 and 200 meter) with a combined capacity of 150 litre per second. The total production is 6,348 cubic meters per day on average. The Enterprise has scheduled 10 new boreholes along Borkena River to secure water demand for the city for the next 20 years.
While Kombolcha may probably not have severe water scarcity problems such as Mek’ele, the city will likely face water risks of its own. Water abstraction by industries is currently managed at the site-level; with no one stakeholder providing ‘catchment’ level oversight of use/overuse of water resources. Further, the shallow water table that contributes to the city’s water abundance underlines the necessity of sound environmental management practices to protect the aquifer from the infiltration of pollutants. The industrial character of the city compounds this concern, especially since most of the existing industries in the city do not have modern technology for water saving and pollution control.
Figure 6: Polluted wastewater released from Kombolcha Tannery
42
Meke’le Regional City Report, ARUP 2016 <source> 43
More detail can be found in Annex 16.

Green urban – industrial development project pre-feasibility
Page 43 of 83
Table 11: Summary of water resource situation along the corridor
Mek’ele Kombolcha
Population (2017 CSA estimates) 358,528 133,084
Available water resource m3/capita NA
Access to safe drinking water
(% of households)
59 NA
Total annual water production (m3) 9.36 million 6.34 million
Total annual water consumption
(m3)
5.23 million NA
Current residential water consumption (litres/capita/day)
44 NA
Estimated water usage at IPs million l /day44
70.4 25.6
Number of customers 41,185 NA
% of non-revenue water supplied (%) 26 26.09
Lowest cost domestic water tariff
(ETB/m3)
2.3ETB 3 ETB
Source: Five towns wastewater management report, 2017 (World Bank – unpublished)
44
IHDP Industrial park only – includes process water, potable water, and water for irrigation/horticulture. See Annex 10 for breakdown by
sector.

Green urban – industrial development project pre-feasibility
Page 44 of 83
Project objectives and description Component Description
Strategic Intent • Ensure reliable and safe water demand is balacned between urban and industrial development in the face of climate change related pressures
• Improve water-use efficiency and allocation within likely resource constraints e.g. se of appropriate technology to better manage wastewater treatment, water re-use, recycling
• Developing a greater understanding of ground water availability (hydrological surveys), recharge, and management
• Increased awareness and community participation in water conservation strategies
Incentives Reform and enhance the regulatory and policy environment to promote integrated, climate-resilient water resources management: • Water pricing reform (water use tariffs and wastewater discharge tariffs) • Regulatory and financial incentives for water reuse and conservation (e.g. reduced
water processing fees) • Establish quality standards for water recycling and reuse • Review and clarify mandates at the regional/local levels.
Institution / Capacity building
• Develop joint water governance structures – e.g. planning and implementation across administrative boundaries and between public and private sector players – e.g. promote greater roles and responsibilities for business in improving the water resources within the communities that they operate45
• Build environmental regulation and enforcement capacity of Regional and City Government
• Strengthen the capacity and effectiveness of the water utility • Training on technological options for water reuse and recycling at household and
industrial parks/facility levels
Investment Invest in demand-management at three scales: • Utility performance: Support water utilities to manage leakages and non-revenue
water through: leak detection; water meter inspection / replacement; installing block water meter; checking for illegal connections; O&M programme; and introduction of information management systems.
• Large scale water consumers (industries, hotels, institutions): Investment in cost-effective technologies for re-using and recycling grey water for irrigation, construction and other non-potable uses.
• Household level: explore and introduce water saving technology options (e.g. rainwater harvesting, recycling grey water, etc.) at household level
Information Annual monitoring of water balance - Groundwater abstraction surveys and water
permit compliance surveys
• Integration of water resources issues into local planning processes and documents including updating river basin master plans and mapping groundwater resources
• Knowledge sharing activities (e.g. exchange programmes) to promote learning and transfer of experience, replication and scaling up of the project approach to other parts of the country.
• Awareness building activities for water conservation at household level and sensitising major water users on water resources regulations and their obligations
45
(Morrison et al. 2009)
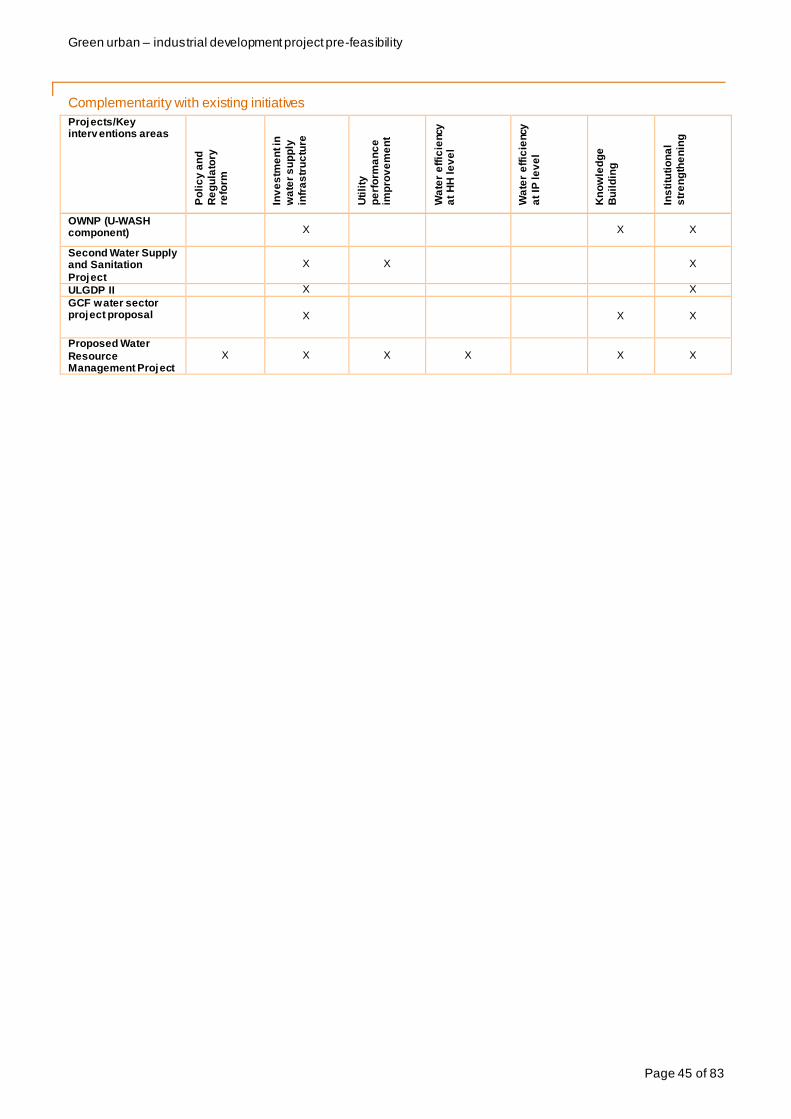
Green urban – industrial development project pre-feasibility
Page 45 of 83
Complementarity with existing initiatives
Projects/Key interv entions areas
Po
lic
y a
nd
Re
gu
lato
ry
refo
rm
Inv
es
tme
nt in
wa
ter
su
pp
ly
infr
as
tru
ctu
re
Uti
lity
pe
rfo
rma
nc
e
imp
rov
em
en
t
Wa
ter
eff
icie
ncy
a
t H
H l
ev
el
Wa
ter
eff
icie
ncy
at
IP le
ve
l
Kn
ow
led
ge
Bu
ild
ing
Ins
titu
tio
na
l
str
en
gth
en
ing
OWNP (U-WASH component) X X X
Second Water Supply and Sanitation
Project
X X X
ULGDP II X X
GCF water sector project proposal X X X
Proposed Water
Resource Management Project
X X X X X X

Green urban – industrial development project pre-feasibility
Page 46 of 83
Implementation parties Stakeholder Role in project implementation
Ministry of Water,
Irrigation and Electricity (MoWIE)
- Overall management of the project, including monitoring and evaluation of project interventions.
- Coordination and liaison with other partner ministries - Lead on implementation of Policy and Regulatory reform package and
technical assistance package - Provide capacity building support for targeted regional water bureaus
and water and sanitation enterprises (WSE) - Ensure safeguard policies are implemented - Facilitate experience and knowledge sharing at the national level
Ministry of Urban Development and
Housing
- Develop appropriate manuals and guidelines on alternative
wastewater treatment technologies - Assist MoWIE in monitoring and oversight of project interventions
Ministry of Finance and Economic
Cooperation and CRGE Facility
- Responsible for overall financial management of the project - funds from GCF or other donor agencies and overseeing overall budget utilization and expenditures.
- Report to project donors on progress achieved - Work in close partnership with MoWIE to ensure the sustainability of
the project once it phases out. Ministry of Environment, Forest and Climate Change
- Develop manuals and guidelines on GHG emissions inventory related to water sector
- Develop and implement capacity building programme for regions and cities to conduct GHG emissions inventory
- Responsible for monitoring and reporting GHG emissions reduction Finance and
Economic Development Bureau
(BOFED)
- Disbursement of financial resources from regions to city stakeholders
River Basin Councils and River Basin Authorities (RBAs)
- Prepare River Basin Master Plans - Lead on groundwater development
Regional Water Bureaus (RWBs)
- Overall project management and overall coordination at the regional level
- Supervising target activities and effective implementation of project - Capacity building at regional and local scale - Monitoring and evaluation
Regional EPA - Review ESS and ESIA of proposed alternative treatment facilities
and monitor compliance during and after construction - Capacity building support for zonal and city level EPAs to monitor
compliance
- Provide support for designing awareness raising activities on water efficiency, conservation and refuse-recycling
Town Water Boards - Implementing day-to-day operational and administrative activities of
the project.
- Establishing a focal person within the Town Board to provide project
oversight
- Preparation of integrated Structural Plans which incorporate water resource management issues

Green urban – industrial development project pre-feasibility
Page 47 of 83
Stakeholder Role in project implementation
Water and Sewerage Enterprises (WSE) in
target cities
- Lead on utility performance investments
- Assistance in the identification and assessment of major water
consumers; - Designing and implementing community awareness raising
programmes
IPDC Industrial Parks and other industrial facilities
- Investment in alternative wastewater treatment options and water reuse and recycling options
Zonal and Woreda Environmental
Protection Authority
- Monitor compliance and enforcement of ESS and ESIA documents - Carry out spots checks to monitor and control environmental and
social impacts of projects - Monitor compliance and industrial discharge

Green urban – industrial development project pre-feasibility
Page 48 of 83
Pre-feasibility assessment for investment
Introduction This section provides the technical, economic, social and environmental assessment of the proposed investments for this project. Technical assessments below relate solely to capital investment options that either increase i) performance/efficiency; ii) demand-management; or iii) water re-use and conservation. As such investments are being considered at three distinct scales: utility level; major water user; and household level to help achieve the objectives.
In the main, only demand-side technological measures are being promoted as those that are likely to have lower capital costs and will have less risk of environmental externalities. Supply -side measures are also necessary and important (e.g. managing extraction) and resolving water management issues would involve a mix of intervention at different scales, both supply and demand-side.
Technical Assessment 1) Utility performance
Poor performance of water utilities hampers the supply of water. Although there are many technological solutions for enhancing performance that reduce non-revenue water, the most cost effective and appropriate lever for enhancing performance is to ensure tariffs are set to allow for maximum cost-recovery (as proposed under the ‘Incentives Project Component described above). Utility performance is intrinsically linked to the water tariff which as is the case in Ethiopia – if set too low will lead to a lack of investment, poor maintenance/coverage and subsidies to those already connected to the network and not those who need it most i.e. the urban poor. (Mwanza 2001) Correct pricing of water will ensure a flow of finance to utilities which would allow them to make technological investments including leak detection; water meter inspection / replacement; information management systems (including checking for illegal connections); and the installation of block water meters (residential and commercial customers). In addition, additional finance would could fund more (competent) staff and ensure compliance. Therefore, although water pricing in itself is not a technological fix – on balance it is likely to achieve more cost-effective reduction in demand when compared to technological interventions. To support effective revenue collection, this may involve installation of more accurate water metering systems, or upgrades to existing water metering systems.
2) Large scale water consumers (industries):
Industrial water usage for Industrial Parks estimated at 70.4 and 25 million litres a day (Mek’ele and Kombolcha respectively), primarily drawn from groundwater reserves. Industrial water pricing currently does not reflect the true cost of water, and may encourage wastage and over-exploitation of water reserves. Efficiency measures to manage demand at the firm-level could be selected according to desired level of demand reduction and cost – particularly in relation to size of operation. Industrial park wide initiatives may also be appropriate. Technological examples are presented below which may be appropriate in the case of industrial parks and facilities in Mek’ele and Kombolcha.46 The IPDC has introduced a Zero Liquid Discharge (ZLD) waste water treatment plant in its flagship Hawassa Industrial Park and intends to deploy the technology in all of its parks including the ones in Mek’ele and Kombolcha. There are also some efforts to use grey water from textile production for irrigation in farms adjacent to private industrial parks and facilities.
Closed-loop or ‘zero-waste’ systems represent greatest demand reduction potential, though come with a high price tag that may not be appropriate for smaller operations. The extent to which what systems become economical depends on the rate of water usage and scope for re-use and recycling.
46
At the DBL Industrial Park in Mek’ele zero-waste treatment plants are already in operation within some units.

Green urban – industrial development project pre-feasibility
Page 49 of 83
Other lower cost measures can also be introduced to industrial park tenants that encourage greater awareness on water usage and potentially behavioural changes. These include introducing water monitoring programme, providing data on water balances, rates of reuse and recycling47.
Table 12: Examples of investments to reduce w ater-demand of large-scale w ater users in Mek’ele - Kombolcha48
Technological initiative Example Typical demand reduction per project
Potential cost
Production efficiency Closed-loop recycling Up to 90% H Automatic shut-off 15% S-M
Wastewater treatment Closed-loop recycling with waste water treatment
60%49 H
Greywater re-use Re-use of wash water 50% M
3) Household level:
On balance household water usage represents approximately 3 times the proportion of water usage than that of industry.50 Managing water demand at the household-level becomes an important lever for balancing overall demand for water – or more specifically demand for ground water extraction where no the sustainability of supply is in question. Rainwater harvesting provides a relatively low-cost method of ensuring self-supply. Common in rural Ethiopia for agriculture, rainwater capture can provide up to 90% of household supply even where rainfall is erratic, where suitable on-site storage solutions are provided.51 Other examples include installing water efficient taps and appliances and or recycling grey water for flushing toilets etc. However, as around 35 %of households in Mek’ele are not connected to the mains water network, water re-use and efficiency measures are likely to be inappropriate.11
Table 13: Examples of investments to reduce w ater-demand at the household-level
Technological initiative Example Typical demand reduction per project
Potential cost
Self-supply Rainwater harvesting Up to 90% M52 Water-usage efficiency Taps and appliances 50 – 80%53 S Greywater re-use Greywater tower54 NA S
Impact assessment (economic, social and environmental) 1) Description of impacts
The following impacts have been identified as possible outcomes as a result of the investment above. The impacts are identified based on the outcomes achieved by similar investments in other setting, or research undertaken in the Ethiopian context. Where no quantitative data was available an indication of the expected contribution/level if impact expected is given in the column to the right.55
Benefits / Positive impacts Costs / Negative impacts
Economic
47
Organisations such as WBCSD have produced guides and tools on water management. For example ‘Business guide to circular water
management: spotlight on reduce, reuse and recycle’, 2017. 48
Adapted from Cost-effective water saving devices and practi ces - for industrial sites. Note: Cost estimates: S = £100’s ; M = £100’s – a
few £1,000s H = many £1,000s (WRAP 2005) 49
Mek’ele IP has a proposed wastewater treatment capable of treating approximately 60% or process water from the IP 50
Draft Climate Resilient Strategy: Urban Development and Housing (2017) 51
(Taffere et al. 2016) 52
Equivalent to £100 - £1000 depending on the type of system installed. Based on costs: (‘Rainwater Harvesting (Urban) | SSWM’ 2017) 53
Climate Change 2014: Synthesis Report. Contribution of Working Groups I, II and III to the Fifth Assessment Report of the
Intergovernmental Panel on Climate Change (IPCC 2014) 54
In Peri-urban areas of Arba Minch, greywater towers were erected at low cost c. (ETB400 or GBP£20) to provide re-use of greywater
from households to irrigate urban vegetable plots. (Sustainable Sanitation Alliance 2010) 55
Impact scoring: ++ significant positive impact; + positive impact; 0 neutral; - negative impact; - - significant negative impact

Green urban – industrial development project pre-feasibility
Page 50 of 83
Benefits / Positive impacts Costs / Negative impacts
• Investment expansion/job creation: By balancing demand for water and improving water-use efficiency, relative volumes of water available for productive use should increase. As an input to production, improving access to water should encourage investment expansion and support job creation in the industrial sector. Coupled with policy, regulatory and institutional reform governing water usage should provider much broader impacts in green growth terms.
+
• Cost of inputs: investing in water efficiency technology may see some firms e.g. (heavy users) pay more in the short-term as capital expenditure rises. Over time however operational costs should reduce as firms adapt their equipment and processes to use less water e.g. efficiency gains of between 15 – 90% may be possible with appropriate investment. This also needs to be taken in the context of reforms to water pricing which may see the cost of inputs rise with water tariffs.
-
• Productivity gains: Improved water supply reduces stunting and diarrhoea, which in turn releases labour availability for other activities (agriculture, employment in industries, etc.).
+
Social
• Improved public health: Improved access to clean water supply through better maintenance and repairs of water supply facilities will result in reduction in water-borne diseases (dysentery, cholera and others). WHO estimates that 9% of global disease burden could be prevented through improved access to water. The CRGE: Water and Energy strategy estimates that universal access to WASH could prevent 946,032 maternal and child deaths in the country.
+
• Potential for conflict over water access: wealth inequality may be more pronounced where wealthier individuals and households can afford to invest in demand-side measures to reduce reliance on mains water e.g. rainwater harvesting has been shown to be more effective in water scarce regions where households can invest in larger volume water tanks. In addition, revised water pricing may create winners and losers. Increased tariffs might have an impact on the poorest of urban residents, particularly if billing cycles do not fit with their spending and consumption patterns; or if connection charges to mains supply are prohibitive.
-
- Gender benefits: Evidence suggests that households spend 670 hours/year on average on water collection, mainly undertaken by women and girls. Improving access to more resilient water supply (for example localised self-supply) reduces time spent collecting water, changes women’s workload, reduces harassment and abuse, and increases time available for other activities, such as education, family and social/community interactions.
+
• Potential for reduced health where water supply becomes contaminated e.g. rainwater harvesting supplies clean, safe water which can become contaminating in the storage tank if a suitable cleaning and maintenance regime is not followed.
-
- Improved livelihoods of communities: By increasing the availability of water, the project will improve output in urban agriculture and livestock production, which in turn leads to enhanced food security and improved livelihoods of communities.
+
Environmental
• GHG reductions: as the demand for water grows and more water is extracted, the level of ground water becomes lower, requiring more energy to pump water to the surface. Reusing and recycling water on site or nearby reduces
+
• Increased energy usage – may result from technological choices made designed to reduce water usage. For example, switching to air-cooled industrial systems from evaporative wet cooling systems.
-

Green urban – industrial development project pre-feasibility
Page 51 of 83
Benefits / Positive impacts Costs / Negative impacts
the need to energy to pump water from deep aquifers using for example diesel-based water pumping systems – reductions in CO2e that might be typically produced in the distribution of water.
• Reduced soil and water pollution: improved industrial wastewater management (zero-waste discharge, grey water recycling systems, discharge fees) and sanitation systems to prevent pollution of land and water bodies
+
• Wastewater contaminant concentrations may rise where water usage is reduced in industrial processes or household usage (e.g. toilets). This may lead to higher concentrations of pollutants in wastewater.
-
• Resource-use efficiency: investing in water saving technology or processes leads to efficient use of water, thereby reducing the volume of water used. Further, wastewater can be re-used for irrigating non-agricultural land (i.e. urban greenery, roadsides, etc.) or to replace drinking water used for toilet flushing or construction sites. Pricing water appropriately should contribute further to resource-use efficiency.
+
2) Quantification of impacts
Project cost summary: project costs in investment, operation and maintenance (O&M) (including cost of social and environmental mitigation measures)
Costs: technology selection
In deciding which infrastructural development to select—a rough timeline as well as the necessary supporting services and skills to build and operate the proposed facility must be considered.
An example of the likely scale of cost for retro-fitting demand-side management measures.
Table 14: Example costs for demand-side management investments
Technical solution CAPEX (USD$) OPEX (USD$/tonne)
Wastewater treatment plant (IP) $15 mill ion56
unknown
Rainwater harvesting (household)57
NA
- Mek’ele (25% of households, 100,342 ) $10 mill ion
- Kombolcha (25% of households, 36,461 ) $3.6 mill ion
Benefits: Water demand reduction
Reducing water demand provides the obvious benefit of maximizing a scare resource, which in a water stressed region like Tigray can unlock the health and wellbeing of citizens and productivi ty and competitiveness of firms. Water availability of water is consistently recorded as a constraint to doing business in Ethiopia.58 Domestic and commercial customers demand around half of total aggregate water supply per annum, though water supply is intermittent (e.g. 8 hours per day); and water losses (non-revenue water) are estimated at around 21%. Industrial parks will use an estimated 5 times domestic water usage which without an augmented supply would leave Mek’ele with a sizeable water deficit. Demand-side management of water usage, through for example a combination of the investments above (at household and firm level), have been modelled below
56
Mek’ele Industrial Park Environmental Impact Assessment (2015) 57
Installation costs of US$100 have been used against 2017 population estimates from the NUDSP. It may be possible to implement
rainwater harvesting solutions for less c. $25 though with limited efficiency. 58
Ibid

Green urban – industrial development project pre-feasibility
Page 52 of 83
and would provide some relief at the city-level though there is unlikely to be enough water to satisfy aggregate demand.59 Even under aggressive water-use efficiency targets, Mek’ele would still have a water demand deficit.
This is predicated on full-occupation of the Mek’ele IPDC Park by those operating in sectors that typically have high water usage demands i.e. agro-processing; apparel and garments etc. Going forward a combination of measures would need to be put in place to ensure critical levels of water stress are not experience: i) composition of the proposed industrial sectors needs to be reconsidered; ii) water demand measures need to be put in places at both domestic, commercial, and industrial level; iii) water supply needs to be augmented.
Figure 7: Closing the water supply gap through demand-side measures (Mek'ele urban water supply – municipal and
industrial)
Financing options Sources of finance for the various project components are expected to be as follows:
Component Source of finance
Incentives Public (Federal Government); Development Partners
Institution / Capacity building Public (Federal Government); Development Partners
Investment City water util ities; Regional Water Boards; Private-sector (i.e. industrial parks operators); user-fees
Information Public (Federal Government); Development Partners
User-fees
In terms of the longer term financial sustainability of reforms, it is worth considering the role of user fees briefly. Typically water is priced volumetrically for domestic and industrial users. Although volumetric pricing is typically adopted to reflect economic or environmental conditions (e.g. to reflect resource scarcity); pricing approaches may also reflect economic efficiency, cost recovery, or the underlying political economy of a country or region.
59
Note: This basic model makes some large assumptions about a) the continued pattern of water usage (40l per person per day) over time.
In reality, water usage is more dynamic rising with income/consumption for example. Supply is also held constant to suggest t hat no other
supply-side measures have been implemented either in the production of more water; improvement in efficiency of the utility e.g. leaks,
theft etc. This serves a purpose however that relatively modest (and cheap) demand-side investments can be made to provide some
excess in supply.
Gap betw een
supply and
demand can be
narrow ed using
w ater use
eff iciency
technology

Green urban – industrial development project pre-feasibility
Page 53 of 83
The water pricing strategy of industrial parks in Ethiopia has been designed to attract investors through a promise of low tariffs. Table 15 compares the volumetric costs of water in industrial parks across the east Africa and Middle East region – the water pricing in Bole Lemi IP in Addis (which provides a reasonable benchmark with parks in Mek’ele and Kombolcha) is in most cases half that of comparable sites elsewhere. Although on one hand, an attractive policy in the short-term, in revenue terms this warns that water may be under-priced – particularly in the water stressed Amhara region.
Table 15: Comparison of volumetric water pricing across Industrial Parks in the Middle East and Africa60
Country IP water (US$/m3) Differential increase from
Ethiopia61
Ethiopia Bole Lemi 0.3 - 0.6 1
Kenya Athi River 0.9 3.0
Tanzania Bagamayo EDZ 0.5 1.7
Egypt SEZone (Sokhna) 0.87 2.9
Dijbouti DFZ 1.41 4.7
Mozambique Beluluane IP 0.48 1.6
Zambia Lusaka East MFEZ 1 3.3
Oman Salalah FZ 1.71 5.7
UAE JAFZA 2.75 9.2
Although it is beyond the scope of this report to model tariff reform, broad benchmarks are given below as to the current expected revenues at business-as-usual (domestic water, commercial plus industrial parks). Note: this is not a comprehensive analysis of total revenue, but demonstrates the magnitude of additional revenue one might expect from modest increases in tariff (particularly for users at industrial parks) which would contribute to the financing of reform within the water sector – O&M, metering, monitoring etc.
Table 16: Impact increases in water tariff would have on water utility revenues inside the industrial parks 62
Rev enue/month
IP Maximum w ater
usage (m3)
Current tariff
(US$0.3 – 0.6 /m3)
BAU x1.5
(US$0.9/m3)
BAU x3
(US$1.8/m3)
Mek’ele 70,900 56,745 85,117 170,234
Kombolcha 25,600 20,489 30,733 61,467
Assumptions
ETB – USD as at
05/07/2017
0.043
60
Source: Mek’ele Industrial Park, Environmental Impact Assessment, 2015 61
Highest possible tariff used: USD$0.6/m3 62
Source: Mek’ele Industrial Park, Environmental Impact Assessment, 2015

Green urban – industrial development project pre-feasibility
Page 54 of 83
Risk Assessment A high-level assessment of any technical, operational, financial, social and environmental risks that the project interventions may face, and proposed mitigation measures to address them is presented below. This follows the GCF Risk Analysis Framework.
Table 17: Risk analysis
Risk factors Level of
impact
Probability Mitigation measure
Lack of political will and commitment
High High • The project is aligned will local needs and broad buy-in from local, regional and federal stakeholders has been secured through consultation workshops.
• The project will include institutional awareness raising activities targeting high levels officials at city and regional levels to promote cost recovery tariffs
• Strong community participation will ensure that politicians are fully committed
Lack of institutional capacity to implement project interventions
High Medium • Stakeholders involved will benefit from technical assistance, capacity building, knowledge/best practice sharing at regional/corridor level
Lack of trained manpower, particularly at the lower level, to implement projects
High Medium • Provide training and technical support on project implementation as well as planning, design, operation and maintenance of technologies for reusing and recycling grey water for utilities, ULGs, water boards, etc.
Financial barriers: alternative waste water treatment and recycling/reuse solutions are too expensive
High High • Develop initiatives to identify feasible water efficiency options
• Develop (financial, policy, regulatory) incentives schemes to foster investment of alternative technologies and include co-benefits within selection criteria
Increased revenue through tariff reform is not ring-fenced for investment/utility improvement
High Medium • Regulatory reform to ensure utilities commit to a reasonable O&M budget related to revenue. Utilities are encouraged to publish revenue figures to ensure transparency with customers.
Unclear roles and poor coordination between project stakeholders (water bureaus, utilities, MoWIE, etc.)
High Medium
• Revise federal and regional proclamations to ensure that roles are clearly defined and avoid overlapping responsibility
• Ensure clear distribution of roles for the start of the project and ensure adequate
Lack of incentives for major water users to use water more efficiently
High Medium
• Strengthen enforcement of local/regional EPA through capacity building activities and training
• Consider financial and regulatory incentives to encourage behavioural change
• Conduct awareness raising activities targeting large scale water users to sensitize them on water resource regulations
• Provide training on cost-effective technologies for water reuse and recycling that can be implemented
• Policy and regulatory changes ensure that an enabling environment is in place

Green urban – industrial development project pre-feasibility
Page 55 of 83
Data gaps to implement project interventions
Medium Medium • Extensive technical assistance will be provided
to updated and enhance knowledge of groundwater resources,
Poor acceptability by the community for reusing wastewater
Medium Medium
• Awareness, advocacy and education campaign will address any (health) concerns and ensure that communities are well-informed about recycling as a water supply option and its potential impacts.
• Keep the community informed and ensure adequate public participation in the planning process of water reuse and recycling projects
Unavailability of land within the town for decentralized wastewater treatment plant
Medium Medium
• Explore regional or community facilities where possible

Green urban – industrial development project pre-feasibility
Page 56 of 83
Implementation timeline Year 1 Year 2 Year 3 Year 4 Year 5
Implementing
partner
Interventions
Information
Updating River Basin Master Plans MoWIE/ RBA
Identification and assessment of major
water consumers
RBA/ Regional Water
Bureaus/ WSE
Willingess to pay surveys WSE
Assessment of cost efficient water
efficiency technologies MoWIE/Regional
Water Bureaus/WSE
Annual monitoring of water balance RBAs/WSE
IncentivesReview and clarify mandates at
regional/local levels
MoWIE/Regional
Governments
Water pricing reformMoWIE/Regional
Governments/RBA
Regulatory and financial incentivesMoWIE/Regional
Governments/WSE
Establish quality standards for water
recycling and reuse MoWIE
Investments
Utility performance WSE/ Regional
Water Boards
Large scale water consumers RBA/ WSE/Regional
EPA
Water saving technology at HH levelWSE/City
Admnistration
Institution and Capacity Building
Training on project implementation MoWIE
Environmental regulation and
enforcement capacity buildingMEFCC/
Regional EPA
Capacity and effectiveness of water
util ityMoWIE/Regional
Water Boards
Training on data collection, management
and systematic monitoring of
groundwater information MoWIE/ RBA
Training on water efficiency
technological options targetting
households and industrial facil ities
MoWIE/
Regional Water
Boards

Green urban – industrial development project pre-feasibility
Page 57 of 83
Next steps and recommendations Balancing city-wide demand in the context of increaing changing climate pressures will be crucial for both
ensuring sustainable livelihoods, particularly for the urban poor, and fostering industrial development.
A number of key recommendations emerge from this study, which could be used to move the project
forward
1. Seek wider feedback on the findings of this report: Given the multi-stakeholder nature of this
project, level of support from key stakeholders (MoWIE, Water Resources Development Fund, regional governments) and a range of development partners should be tested including major donors
in the water sector (World Bank, AfDB, DFID, UNICEF, JICA). 2. Secure political commitment at the Federal level: Ethiopia has enacted various legislations and
policies that fully recognize the need to move gradually towards full cost recovery and other sustainable financing practices in the water sector. However, due to lack of political commitment and
support, tariffs do not reflect the true cost of sustainable water and water use by industries remains
largely unregulated, posing significant threat to future water resilience in the country. In the short-term, a participatory dialogue should be established between the MoWIE, MoI, EIC and IPDC to
discuss water tariff policies and the country’s incentives package for investors. 3. Ensure that adequate information systems are in place to guide decision making: critical
knowledge gaps are currently hindering the implementation of water resilience strategies. Integrated Basin Development Master Plans in Ethiopia are more than 15 years old and do not reflect current
developments and trends in terms of both urbanisation and industrialisation. A first step towards implementing this project is to update all relevant master plans and establish reliable water resource
(particularly groundwater data). Ensuring that established River Basin Authorities are actively carrying out their water resource management mandate will a necessary step to carry out this task.
4. Rethinking industrial strategy and location of industrial parks: the project highlights the huge and growing water scarcity challenge faced by the city Mek’ele in the face of rapid urbanisation,
industrialisation and climate change pressures. Current financial constraints faced by the GoE limit investment options to significantly increase water supply in the town. Although demand-side
management interventions can ensure water is used efficiently and can delay large scale investments, there is a need to rethink the current industrial development strategy in the face of these
substantial financial and resource constraints. Due to the city’s limited water resource, GoE through the Ethiopian Investment Commission (EIC) should look at attracting industries that are not water
intensive. 5. Seek funding to undertake a full feasibility assessment: A key recommendation to move the
project forward would be to seek project preparation funding to undertake a full feasibility assessment.

Green urban – industrial development project pre-feasibility
Page 58 of 83
References 1. Draft Final Report, Feasibility Study, Master Planning, Environmental and Social Impact Assessment
of Kombolcha Industrial Park, IPDC, November 2015
2. Draft Study Report on the Preparation of Kombolcha Structural Plan, September 2010
3. FDRE, Proclamation No. 1/1995 – Constitution of the Federal Democratic Republic of Ethiopia Proclamation, 21st August 1995
4. FDRE. (2000). Ethiopian Water Resource Management Proclamation No. 197/2000. Retrieved from http://goalgoole.com/proclamation-no-1972000-ethiopian-water-resources-managementproclamation/
5. FDRE, Regulation No. 115/2005 –Ethiopian Water Resources Management Regulations, 29th March 2005
6. FDRE, Proclamation No. 534/2007 – River Basin Councils and Authorities Proclamation, 23rd July 2007
7. FDRE (Federal Democratic Republic of Ethiopia). (2011). Ethiopia’s Climate-Resilient Green Economy: Green Economy Strategy, Addis Ababa, Ethiopia.
8. FDRE (Federal Democratic Republic of Ethiopia). (2015). Ethiopia’s Climate-Resilient Green Economy Climate Resilience Strategy: Water and Energy, Federal Democratic Republic of Ethiopia.
9. FDRE (Federal Democratic Republic of Ethiopia). (2016b). Growth and Transformation Plan II (GTP II). 2015/16-2019/20. National Planning Commission. Addis Ababa.
10. FDRE (Federal Democratic Republic of Ethiopia). (2017) Draft Climate Resilience Strategy: Urban Development and Housing, Addis Ababa, Ethiopia.
11. Five Towns’ Wastewater Management. Technical Paper. Volume I: Main Report, December 2016
12. Imeru Tamrat: Policy and Legal Framework fior Water Resources Management in Ethiop.
13. IPCC. 2014. ‘Chapter 9: Buildings’. In Climate Change 2014: Synthesis Report. Contribution of Working Groups I, II and III to the Fifth Assessment Report of the Intergovernmental Panel on Climate Change [Core Writing Team, R.K. Pachauri and L.A. Meyer (Eds.)]. Geneva, Switzerland.
14. Mek’ele City Infrastructure; Road and Transport System, Water Supply and Drainage System and Utilities, Mek’ele Structural Plan Revision, July 2014.
15. Mek’ele Industrial Park, Environmental Impact Assessment, 2015
16. One WaSH National Program Consolidated WaSH Account EFY 2008, 3rd Quarter Progress Report, National WASH Program Coordination Office, May 2016, Addis Ababa
17. Mwanza, Dennis. 2001. ‘Reforming Africa’s Water and Sanitation Sector: Issues and Challenges’. Water Utility Partnership: WEDC.
18. Realizing Ethiopia’s Green Transformation: Country Environment Analysis, Transformation CEA Series, Environment and Natural Resources Global Practice. Washington, DC: World Bank, EDRI, 2017
19. ‘Rainwater Harvesting (Urban) | SSWM’. 2017. Accessed July 4. http://www.sswm.info/category/implementation-tools/water-sources/hardware/precipitation-harvesting/rainwater-harvesting-u.
20. SIWI (Swedish Textile Water Initiative). (Water Governance Mapping Report: Textike Industry Water Use in Ethiopia. Retrieved from http://www.siwi.org/wp-content/uploads/2017/06/Water-Governance-Mapping-Report-Ethiopia.pdf.
21. Sustainable Sanitation Alliance. 2010. ‘Case Study of Sustainable Sanitation Projects: Greywater Tower for Peri-Urban Areas Arba Minch, Ethiopia’.

Green urban – industrial development project pre-feasibility
Page 59 of 83
22. Taffere, Getachew Redae, Abebe Beyene, Said A. H. Vuai, Janvier Gasana, and Yilma Seleshi. 2016. ‘Reliability Analysis of Roof Rainwater Harvesting Systems in a Semi-Arid Region of Sub-Saharan Africa: Case Study of Mek’ele, Ethiopia’. Hydrological Sciences Journal 61 (6): 1135–40. doi:10.1080/02626667.2015.1061195.
23. WRAP. 2005. ‘Cost-Effective Water Saving Devices and Practices - for Industrial Sites’.
24. World Bank. (2006). Ethiopia: Managing Water Resources to Maximize Sustainable Growth.
25. World Bank (2017). Second Ethiopia Urban Water Supply and Sanitation Project. Project Appraisal Document. Retrieved from http://projects.worldbank.org/P156433?lang=en

Green urban – industrial development project pre-feasibility
Page 60 of 83
Project 3: Green housing

Green urban – industrial development project pre-feasibility
Page 61 of 83
Summary of pre-feasibility study
Project description Greening the Ethiopian housing sector through a package of regulatory and institutional reforms that incentivise the delivery of affordable, green housing
Market failure The housing market currently responds to the demand for more affordable housing through rapid built of low cost and poor quality housing, not taking into account trends of broader urban and industrial development and the impacts on climate resilience and energy intensity of residential buildings and streets. Without intervention this can lead to: - Urban infrastructure that locks Ethiopia into an pathway of unsustainable
development in the long-term (50 years+); - Deterioration of urban environmental and public health (lack of basic services in
slums; pollution of land, air, and water); and - Poor quality, unsustainable housing choices which impact growth potential due
to failure to attract labour.
Strategic Intent - Increase resilience of the built environment, reducing environmental risk and GHG emissions from housing
- Strengthen institutions and improve coordination with private sector to meet housing targets
- Reform policy and regulatory environment to provide incentives for developing alternative green building materials and techniques that are both culturally acceptable and support employment in a green construction sector
Proposed interventions
- Institutions: Align CRGE, urban, housing, and construction strategies; build knowledge base and capacity of city and regional governments on housing issues
- Incentive mechanisms: Review and update housing policy objectives; urban planning and building codes/regulations.
- Investment: Investment in a green building design competition to deliver up to 2,000 green houses in two sites to demonstrate alternative building techniques and materials and incentivise innovation and entrepreneurship.
Expected benefits - Additional, decent, affordable housing that is climate resilient and supports industrial development
- Reduced CO2e in housing build and operation - Green Job creation in construction and related sectors
Investment costs - Estimated CAPEX: $US10 million - Estimated OPEX: n/a
Implementation timescale
- Medium (2-5 yrs.)
Spatial impact - ☒ Industrial parks ☒ Urban level ☐ Corridor level Implementing organisation
- Ministry of Urban Development and Housing, Ministry of Construction
Potential sources of finance
- Green Climate Fund, Private sector, DFIs
Recommended next steps
- Development Terms of Reference for the design competition. - Development a road map for policy and regulatory reform. - Review guidelines on industrial park expansion in consultation with city
authorities.
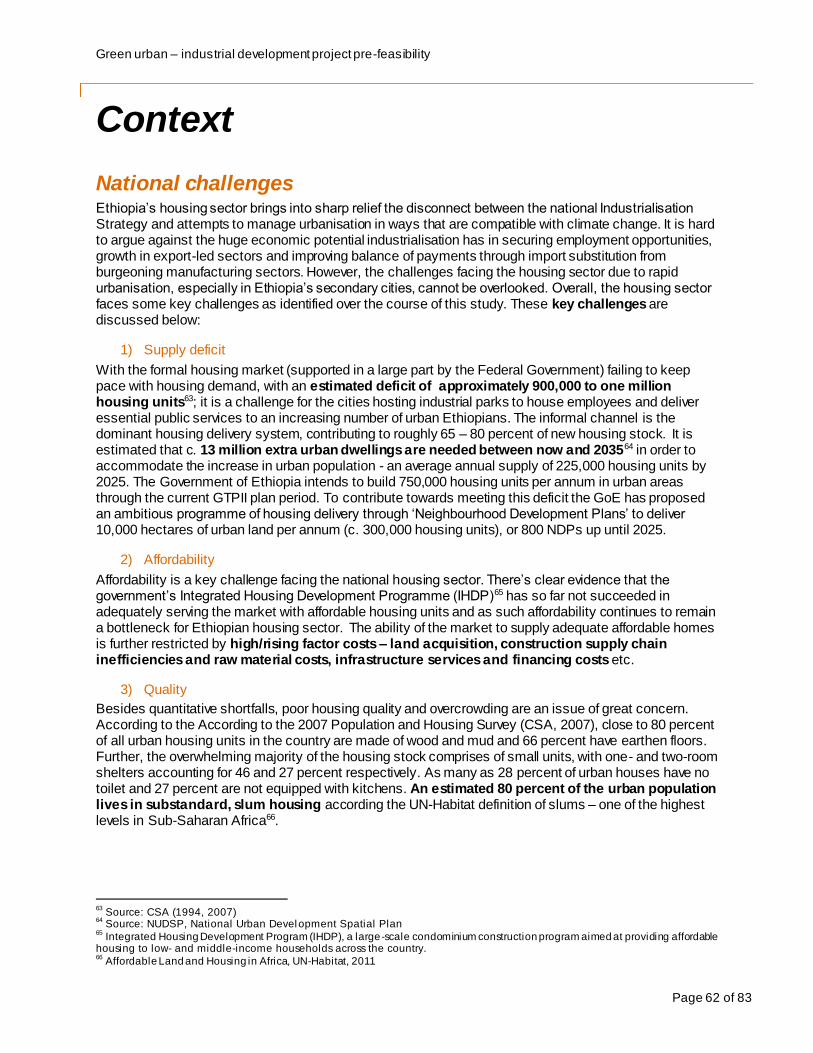
Green urban – industrial development project pre-feasibility
Page 62 of 83
Context
National challenges Ethiopia’s housing sector brings into sharp relief the disconnect between the national Industrialisation Strategy and attempts to manage urbanisation in ways that are compatible with climate change. It is hard to argue against the huge economic potential industrialisation has in securing employment opportunities, growth in export-led sectors and improving balance of payments through import substitution from burgeoning manufacturing sectors. However, the challenges facing the housing sector due to rapid urbanisation, especially in Ethiopia’s secondary cities, cannot be overlooked. Overall, the housing sector faces some key challenges as identified over the course of this study. These key challenges are discussed below:
1) Supply deficit
With the formal housing market (supported in a large part by the Federal Government) failing to keep pace with housing demand, with an estimated deficit of approximately 900,000 to one million housing units63; it is a challenge for the cities hosting industrial parks to house employees and deliver essential public services to an increasing number of urban Ethiopians. The informal channel is the dominant housing delivery system, contributing to roughly 65 – 80 percent of new housing stock. It is estimated that c. 13 million extra urban dwellings are needed between now and 203564 in order to accommodate the increase in urban population - an average annual supply of 225,000 housing units by 2025. The Government of Ethiopia intends to build 750,000 housing units per annum in urban areas through the current GTPII plan period. To contribute towards meeting this deficit the GoE has proposed an ambitious programme of housing delivery through ‘Neighbourhood Development Plans’ to deliver 10,000 hectares of urban land per annum (c. 300,000 housing units), or 800 NDPs up until 2025.
2) Affordability
Affordability is a key challenge facing the national housing sector. There’s clear evidence that the government’s Integrated Housing Development Programme (IHDP)65 has so far not succeeded in adequately serving the market with affordable housing units and as such affordability continues to remain a bottleneck for Ethiopian housing sector. The ability of the market to supply adequate affordable homes is further restricted by high/rising factor costs – land acquisition, construction supply chain inefficiencies and raw material costs, infrastructure services and financing costs etc.
3) Quality
Besides quantitative shortfalls, poor housing quality and overcrowding are an issue of great concern. According to the According to the 2007 Population and Housing Survey (CSA, 2007), close to 80 percent of all urban housing units in the country are made of wood and mud and 66 percent have earthen floors. Further, the overwhelming majority of the housing stock comprises of small units, with one- and two-room shelters accounting for 46 and 27 percent respectively. As many as 28 percent of urban houses have no toilet and 27 percent are not equipped with kitchens. An estimated 80 percent of the urban population lives in substandard, slum housing according the UN-Habitat definition of slums – one of the highest levels in Sub-Saharan Africa66.
63
Source: CSA (1994, 2007) 64
Source: NUDSP, National Urban Development Spatial Plan 65
Integrated Housing Development Program (IHDP), a large-scale condominium construction program aimed at providing affordable housing to low- and middle-income households across the country. 66
Affordable Land and Housing in Africa, UN-Habitat, 2011

Green urban – industrial development project pre-feasibility
Page 63 of 83
4) Climate compatibility
Globally the building sector accounts for around 32 % global energy use and 19% of energy-related GHG emissions.67 In its 2014 National Report on Housing and Sustainable Urban Development, MUDH acknowledged the need for housing and urban sector to play its part in reducing GHG emissions. It notes that buildings contribute around 5 Mt CO2e or 3% to Ethiopia’s emissions, and that the main drivers are emissions related to solid and liquid waste (3 Mt of CO2e) and the use of private power generators in cities (2 Mt of CO2e). The resulting demand for cement also drives cement emissions – with cement emissions accounting for more than half of all industrial emissions. To date, formal public housing programmes like IHDP have yet to consider the two primary aspects of emissions from housing: embodied energy of materials and operational energy use. (UN-HABITAT 2011). The environmental performance of the four main modes of delivery for housing in Ethiopia are considered (see Annex 12).
The current form of the built-environment in Ethiopia ranges from for example, gated, exclusive housing estates, which due to their mono-functional character incentivises private vehicle use; to self-build ‘slum’ housing which lacks basic infrastructure, is often constructed in precarious locations, prone to flooding and other natural hazards.
It is anticipated that the housing sector in Ethiopia represents a significant opportunity to reduce GHG emissions both during construction and crucially during operation where energy efficiency measures are implement. Barriers to greening housing provision include a lack of knowledge and experience across players in the housing sector; affordability concerns; and, cultural acceptance of new models of housing.
Current policy and programmes
Although Green Cities and Buildings feature in the FDRE’s Climate Resilient Green Economy strategy, there is little focus on the contribution housing specifically makes to emissions or climate resilience.68 The need to integrate climate resilience into urban planning and housing development is progressively being emphasised in various policies and strategies. Recognizing the importance of combating urban sprawl, the GoE has incorporated a vision of “compact city development” in the national urban policy – the Ethiopian Cities Sustainable Prosperity Initiative (ECPI). Under the Urban Planning and implementation programme, the ECSPI requires that all urban plans to follow a compact city development approach, whereby 30 percent of land is allocated for infrastructure, 30 percent for green and urban parks and 40 percent for other development activities. More recently, the draft Climate Resilient Strategy for the Urban Development and Housing Sector currently under finalization identifies the need to promote climate resilient housing. The strategy further identifies two policy objectives:
1. Promoting the development of resource-efficient housing using green and passive design, green and
energy efficient construction techniques and building materials and geographically sensitive design
2. Developing retrofitting and refurbishment guidelines for buildings and update building codes: under
this objective, the CRS seeks to green the existing housing stock through the development of appropriate mechanisms, such as micro-financing or small loan scheme to support climate based
retrofitting of existing structures by their owners.
A comprehensive summary of current policy initiatives is summarised in Annex 15.
1. Ethiopia Sustainable Cities Prosperity Goals (ECSPGs)
The ECSPGs is the GoE’s guiding policy framework to implement GTP II targets in the urban sector. Pillar 5 of the ECSPGs focuses on “Housing Development, Shelter Provision and Administration” and 4 projects are already identified: Urban and Rural Housing Program, Urban Housing Capacity Building 67
Source: IPCC 68
The baseline emissions scenario for Green Cities and Buildings focuses on three sources of emissions: solid waste, l iquid waste,
and off-grid fossil fuels – or the operational emissions of cities/buildings. CRGE Strategy 2011.

Green urban – industrial development project pre-feasibility
Page 64 of 83
Project, Rural Development Canters Project and Housing Administration project. Through the implementation of these various initiatives, the GoE seeks to build 750,000 new urban residential housing units, improve the provision of standard houses by 30 percent and reduce the coverage of slum settlements to around 20 %. Funding has yet to be secured for the various projects and programmes envisaged under.
2. Integrated Housing Development Program (IHDP)
The GoE has made the provision of affordable housing a strategic priority of its intervention in the urban sector. Since 2005, it has been implementing the Integrated Housing Development Program (IHDP), a large-scale condominium construction program aimed at providing affordable housing to low- and middle-income households across the country. The programme has made significant achievements in increasing the formal housing supply of the country, strengthening the construction industry and creating urban jobs. Studies have shown that housing units constructed under IHDP are not affordable to low income households, particularly in secondary cities where the IHDP was discontinued after 2011.(UN-HABITAT 2011) Units are typically constructed from cement an emphasis on rapid, modular construction; and little effort has been made to explore the use of alternative, low carbon materials. There have been concerns over construction quality and durability of the condominium buildings – a result of poor project management. (See Annex 13 for more information).
3. Neighbourhood Development Plans (NDPs)
Some attempts are underway at delivering quality housing through planned neighbourhood expansion with support from the Ministry of Urban Development and Housing (MUDH). Neighbourhood Development Plans (NDPs) were prepared by MUDH with support of the World Bank for 12 selected urban centres – including Mek’ele and Kombolcha. The Mek’ele NDP included 2500 house mixed-use development proposed around 10km from the city centre. However, it is unclear at this stage whether a private sector developer has been identified and neighbourhood design fails to capture opportunities for lowering the carbon footprint of housing. (See Box 1 below). The Kombolcha NDP was developed for a 159 ha site located in the city centre (Kebele 03). About 9.7 ha or 35.1 % of all land within the Kombolcha NDP are proposed for residential use (72.2% multi story buildings and 27.8% for townhouses). The design and implementation of the Kombolcha NDP will require ETB 138 million of investment. In addition, GoE is proposing to develop 30 structure plans and 800 NDP for cities with population greater than 100,000 inhabitants; strategic plans for all cities (pop. greater than 20,000 but less than 100,000 inhabitants); basic plans for 750 towns with population between 2,000 and 20,000 inhabitants. In addition, GoE is establishing fast design and implementation mechanisms for NDPs including decision making, mobilization of finance and personnel capacity.
4. Housing for workers at Industrial parks
In Mek’ele alone it is estimated that between 54,000 and 115,000 industrial workers will require formal housing over the next 5 years, across the three industrial parks. A major concern is the shortage of affordable housing for workers earning in some cases as low as 650-750 birr per month.69 GoE and investors have made efforts to reduce the housing deficit for those working in industrial parks. The Industrial Park Development Corporation (IPDC), have through its flagship eco-industrial park (EIP) in Hawassa in introduced a microfinance aimed at providing capital for existing home owners to build additional rooms on their plots of land. IPDC has budgeted ETB 56 million out of which ETB 28 million have been transferred to Sidama Micro financing Institution. A total of 536 rooms have been constructed up to date at a total cost of ETB 19 million. While the scheme has created additional housing units at low cost in a short period of time, the project has currently been put on hold due to low occupancy. Currently only 66 of the 536 rooms built are occupied. This is partially explained by the lack of affordability of the monthly rent (350 ETB) for workers earning a minimum wage of 650 ETB. Further the rooms are
69
Housing Diagnostic for Industrial Parks (unpublished, 2017) Ethiopia Investment Advisory Facility

Green urban – industrial development project pre-feasibility
Page 65 of 83
generally being built without adequate facilities (toilets, washing and cooking facilities). As a result, the rooms do not comply with ILO standards.
Investors at the industrial parks are also considering dormitory style housing, which with employer subsidies, look to deliver rental housing with projected to be around one third of wages. Living accommodation would be modest c. 4m2 per room (and not in compliance with ILO standards. 70) and little consideration has been given to exploring sustainable design or materials – likely that dormitories would be constructed from pre-cast concrete blocks.
5. Private developer housing schemes
There are currently more than 50 real estate companies operating in Ethiopia mainly targeting the higher end segment of the housing market. Housing units delivered through private developer-led estates only represent around 0.5% of total housing stock. Estates like the ‘Mizer’ Estate proposed in Mek’ele are typical housing development programme that would deliver 20,000 housing units for around 80,000 over the next 5 years. In the first phase (2017-2020), 700 ha land will be developed and provide close to 11,400 housing units. The scheme offers G+1 building and 5 types of units of between 65-70 m2. Each unit will contain 3 rooms, a kitchen, a toilet and a living area. The scheme is appropriate for higher income workers but will not be affordable for workers of the industrial parks.
6. Housing Cooperatives
The Urban Housing Provision Strategic Framework introduced in 2013 revives Housing cooperatives and envisages that they will play a leading role in housing provision in the country. The Framework identifies four types of housing cooperatives: cooperatives organized at workplace and enterprises, residency areas, offices/institutions and Ethiopians living abroad. Members of cooperatives are expected to save 100 % of the cost (50% at the time of organization, and the remaining 50 % when they are granted the construction license) beforehand and the houses are expected to be built by the Housing Development Enterprise or by entering into a contract with the city administration to have the houses built by a contractor of their choice.
Legal framework A well-established legal framework is in place that guarantees the right to housing for citizens and the means and methods of public housing delivery. Housing issues, notably access to land are described first and foremost in the Constitution of the Federal Republic of Ethiopia (1995), vesting all land under the control of the state. A number of ‘urban’ proclamations set the tone for the allocation of rights to use land (Urban Land Lease Holding Proclamation (N° 721/2011); and plan for urban expansion (Urban Planning Proclamation (N° 574/2008). Further two separate proclamations make provision for the development and management of condominium housing (Condominium Proclamation N°370/2003) and building regulations to guide the construction, modification, or alteration of buildings, and for their use to ensure public safety (Ethiopian Building Proclamation (No. 624/2009). See Annex 15 for more information.
Lastly, two separate proclamations set out guidance on the registration and expropriation of land - i.e. acquisition of land for use for public purposes (Expropriation of landholdings for Public Purposes ad Payment Compensation Proclamation (N°455/2005). A more detailed description of these legal provisions can be found in Annex 15.
However, some gaps exist. For example, current planning and building regulations do not encourage the use of alternative construction material such as earth and bamboo. This calls for the revision of existing planning and building codes. Further, existing regulations on minimum lot sizes and limits on land plot coverage and building heights, discourage compact city development (EUR, 2015). 70
Recommendation concerning Workers' Housing ILO (1961)

Green urban – industrial development project pre-feasibility
Page 66 of 83
Kombolcha-Mek’ele context Along the Mek’ele – Kombolcha the gap between housing supply and demand is widening due rapid population growth fuelled by both natural growth and in-ward migration, inefficiencies in land delivery mechanisms, high construction costs, coupled with a high prevalence of urban unemployment and poverty. Importantly, the growth of informal housing results with its low environmental performance and poor access to basic services. Without an associated and planned increase in sustainable, affordable and decent housing supply industrialisation is likely to exacerbate the shortage of housing.
Table 18: Summary statistics on current housing situation in Kombolcha – Mek’ele Characteristics
Statistics on current housing situation in Kombolcha – Mek’ele Characteristics
Mek’ele
Current population (2017) 337,773
Current housing stock 21,129 (2007 Census)
11,867 urban, (2009 City survey)
Housing types71 Private individual housing (82%);
Kebele houses (11%),
Government rental houses (7%),
IHDP condominium residential (6%)
Commercial (2%)
Delivery mechanism Housing cooperatives: over 80 on waiting list
Expected housing demand to 2020 25,000
Minimum plot size for residential development72 150m2
Population in over-crowded conditions 60%
71
See Annex 13 for more details 72
State of Ethiopian Cities Report (Ministry of Urban Development and Housing and Ethiopian Civil Service University 2015)

Green urban – industrial development project pre-feasibility
Page 67 of 83
Project objectives and description Component Description
Strategic Intent • Increase resilience of the built environment, reducing environmental risk and GHG emissions from housing
• Strengthen institutions and improve coordination with private sector to meet housing targets
• Reform policy and regulatory environment to provide incentives for developing alternative green building materials and techniques that are both culturally acceptable and support employment in a green construction sector
Institution • Information collection and projections on housing supply and demand • Land assembly, servicing and allocation to enable green housing projects • Align housing strategy with construction strategy • Capacity building for Regional and City governments on green building
technology and techniques
Incentives • Development of housing and building codes and regulations e.g. revising minimum standards; developing green building codes (environmental performance)
Investment • Investment in a green building design competition73 to deliver up to 2000 green houses. To demonstrate the use of alternative building techniques and materials, including hybrid models of contemporary, vernacular forms of housing. Elsewhere innovation competitions have been used to incentivise innovation and green entrepreneurship, making the case for demonstrating the case for the use of alternative, innovative building techniques and materials in the housing sector. Two demonstration sites (one in Mek’ele and Kombolcha) of c. 1000 houses would be developed with initial seed funding of US$1 million. The competition would consider two types of neighbourhood development: inner city redevelopment (brownfield) and greenfield development.
Complimentarity with existing initiatives
Most ongoing housing initiatives seek only to enhance supply with some indirect benefits in job creation. There is lots of space in the housing sector for broader-based policy reforms and greening infrastructure.
Projects/Key
interv entions areas
Po
lic
y a
nd
Re
gu
lato
ry
refo
rm
Aff
ord
ab
le
ho
us
ing
su
pp
ly
Cli
ma
te
co
mp
ati
bil
ity
Jo
b c
rea
tio
n
Ca
pa
cit
y
bu
ild
ing
IHDP X X X
Hawassa Microfinancing
scheme
X X
Proposed Green
housing project
X X X X X
73
Green Design Competition: Entries would be appraised against a number of objectively verifiable, green economy, climate
resil ience criteria that reflect delivery of nominal improvements over business as usual housing models in Ethiopia. Housing design
schemes would be accompanied by a design and access statement to demonstrate how building and street design would
incorporate green and inclusive design principles; for example securing net savings in CO2 emissions in construction and operation;
and have embedded principles of climate resil ience and resource use efficiency. Design schemes would also need to be
accompanied by a business plan that demonstrates the affordability of housing units (through a range of tenures/housing types),
particularly to those in the bottom 40% of the income curve.

Green urban – industrial development project pre-feasibility
Page 68 of 83
Implementation parties Implementing a city-wide green, housing solution is not a job for government alone. GoE’s role should be primarily in guiding reform in the enabling environment for green housing; supported by bodies like the EIABC who can provide capacity building in technical understanding of green building design and energy efficiency.74 Although historically, GoE have played an active and central role in the delivery of housing, particularly in affordable housing, there must be some recognition that the private sector, and in particularly the real estate and construction sector, will play a role in advising on the design and financing of mass housing schemes which meet higher standards of environmental performance. GoE will of course be instrumental in coordinating change and providing the correct incentives.
Stakeholder Role in project implementation Ministry of Urban
Development and
Housing (MUDH) and CRGE Unit
• Overall leadership and management of the project, including monitoring and evaluation of project interventions.
• Lead on coordination and liaison with other ministries and implementation of the Policy and Regulatory reform programme
• Lead other project components: institutional change; Capacity Building for Cities and Regions; and increasing data availability, raising awareness and conducting strategic research.
Ministry of Finance
and Economic
Cooperation
(MOFEC)
• Responsible for overall financial management of the project - funds from GCF or other donor agencies and overseeing overall budget utilization.
• Work in close partnership with MUDH to ensure the sustainability of the project once it phases out.
The Ministry of
Construction
• Supporting the development of green construction local supply chains (component 3).
• Revising existing building codes, conducting research on alternative material and construction technologies, preparing manuals and guidelines for mainstreaming innovative practices and technologies
• Conducting capacity development programmes targeting ULGs, construction firm, MSEs and housing cooperatives.
Regional Urban
Development
Bureaus
• Supervising ULGs activities and effective implementation of the project. • Disbursement of financial resources to cities. • Knowledge management at the regional and corridor level.
Target Urban Local
Governments
• Day-to-day operational and administrative activities of the project. • Sitting on the evaluation board for the green housing competition75 -
selecting and surveying potential demonstration housing sites Ministry of Environment, Forest and Climate Change
• Provide support to regional and city level administrations with the assessment of GHG emissions linked to the housing sector.
• Lead the interventions around improved cook stoves and their integration in urban housing projects.
Ministry of Water, Irrigation and Electricity (MoWIE)
• Provision of guidance on energy aspects related to green housing and neighbourhoods i.e. use of off-grid solar for street lighting and solar home system.
• Introduce the necessary policy and regulatory reforms and (financial) incentives for the integration of such technological solutions in urban housing projects.
Federal Micro and Medium Scale Industries Enterprise Agency
• Responsible for providing capacity development through trainings and workshops targeting MSEs engaged in the construction industry.
EiABC • Provide research support for the project, building on its extensive
74
For more information on resource efficiency and resil ience in building design, see Annex 16. 75
See Annex 14 for more details.

Green urban – industrial development project pre-feasibility
Page 69 of 83
experience and knowledge of alternative housing construction in Ethiopia. Commercial banks/National bank
• Provide input and guidance on business model development – affordability in housing delivery.

Green urban – industrial development project pre-feasibility
Page 70 of 83
Pre-feasibility assessment for investment Introduction This section provides the technical, economic, social and environmental assessment of the proposed investments for this project. The investment is compared against the current baseline approach of the four typical housing delivery methods in Ethiopia (costs and benefits) which relate to various housing market segments. Ethiopia’s ambition to transition to Lower Middle Income status by 2025 will see aggregate and relative demand rise and diversify across market segments - as incomes rise along with the consumption of housing services. The purpose of this technical assessment then is to set out the broad technical parameters against which the housing market should respond to deliver green, affordable housing. The parameters through which a) design competition might be framed; b) a more detailed feasibility assessment is carried out c) regulatory and policy reform might be guided. The following three: technical parameters are being considered below:
Technical Assessment 1) Quantity
Given the backlog of housing in Mek’ele and Kombolcha and proliferation of informal sub-standard housing in the absence of an effective formal housing market, and intervention in the housing sector needs to deliver volume housing, across various market segments at a price that the majority of urban Ethiopians can afford (whether as tenants or owner/occupiers). Measuring demand is not without its challenges, particularly in the context of dynamic urbanisation, and the absence of income data, expenditure levels and savings capacity. This is complicate further by the dynamics of the urban population in Ethiopia. ULGs, including the cities of Mek’ele and Kombolcha, have failed to provide enough housing through formal housing channels to satisfy demand, mainly due to the lack of capacity of ULGs to supply adequate and affordable serviced land for housing development. Demand projections for Mek’ele have been provided below to outline the scale of the housing challenge that would inform a technical option:
Table 19: Demand for housing in Mek’ele (2017)
Population Household size No. of HHs Housing
stock
Demand components
Acc.
Backlog76
Backlog Deteriorated
units77
Industrial
Parks
Total
demand
366,249 3.65 100,342 82,666 4,820 17,676 9,301 50,000 125,887
Source: See Annex 17 for full methodology and notes
2) Affordability
Given the surge in the urban population expected to be driven by ongoing industrialisation of both Mek’ele and Kombolcha, demand for worker housing will be significant. Minimum wage range at Industrial parks for low-skilled workers is 750-1500 birr per month and the largest demand will come from single workers unable to afford housing at market prices.78 As noted above, aggregated demand in housing relates in part to income and expenditure levels. The majority of residents in Mek’ele and Kombolcha renting their accommodation (55% and 42.7% respectively).79 Existing market prices for families, couples or single workers prepared to co-habit e.g. 500-1500 birr per month rental cost per unit; or c. 250 birr per month for
76
Accumulated backlog prior to Census 2007 77
As classified in the Census 2007. 78
Housing Diagnostic for Industrial Parks: Mek’ele situation and proposed solutions, EIAF 2017 (unpublished) 79
National Population and Housing Census of Ethiopia, 2007

Green urban – industrial development project pre-feasibility
Page 71 of 83
single room accommodation. Therefore the affordability of alternative options for housing must be a consideration at the technical design stage.
3) Sustainable design criteria
Earlier research points to a ‘compact, connected and resilient urban network’ as a necessary model for urban development in Ethiopia. (Ethiopian Development Research Institute, Global Green Growth Institute, and New Climate Economy 2015). Greening urbanisation and industrialisation in Ethiopia work at three-scales: city/urban; neighbourhood and building. As there is a well-developed spatial framework in place; at a technical level this project would focus on the following scales:
- Neighbourhood scale: mixed-use neighbourhoods, with optimised housing densities, economies of scale in service delivery and environmental; and greater climate resilience through sustainable urban landscape design.
- Building scale: housing design that seeks enhanced performance through the use of alternative materials with lower embedded energy costs; and greater resource use efficiency in operation (water, energy); and building level design that achieves greater resilience to climate changes.
Summary of technical options criteria
Although, a complex set of challenges exist there are numerous cross-cutting opportunities for greening the housing sector to leverage GHG abatement potential whilst increasing resilience. Design parameters are summarised in the table below; these would form the basis for criteria for the design competition.
Table 2018: Technical design parameters for a green housing project
Parameters for a green housing project
Promotes economic growth through structural transformation
• Must deliver a model of low-cost, decent housing capable of accommodating workers for industrial parks and other urban economic sectors
• Building local supply chain in green construction sector and maintenance jobs
Promotes increased resilience to climate change
• Street design incorporates urban greenery to improve local micro-climate, reduces incidences of flooding; and promotes sustainable transport (walking/cycling) routes
• Building design can better withstand extreme weather – e.g. heat, drought
GHG emissions reductions /avoidance
• Alternative materials with lower embedded energy costs e.g. reduced reliance on cement a carbon intensive material – e.g. use of sustainable timber, bamboo etc.
• Potential for decentralised/off-grid power generation – renewables, promotion of solar home systems and solar lanterns; improved cook stoves
• Can lower household energy demand e.g. natural cooling and ventilation; through effective site planning and building design, mitigating the demand for electric fans and air conditioning.
• Construction and retrofit techniques may offer significant potential (often at little marginal investment cost) to deliver very low or no energy buildings. (IPCC, 2014)
Reduced environmental pollution/risk
• Reducing indoor air pollution from cooking and heating • Water, sanitation and drainage services designed in at the outset to better
manage waste and protect natural environment
Increased resource use efficiency
• Optimitsed housing density makes better use of land • Where appropriate seeking to retrofit green design into existing urban fabric • Buildings designed to capture and store heat and water (rainfall) for re-use
Social inclusion • Delivering decent housing that is affordable to those within the bottom-2 quintiles of urban dwellers (40% poorest).

Green urban – industrial development project pre-feasibility
Page 72 of 83
and development • Inclusive design to reflect the needs of vulnerable citizens; children, elderly, the disabled etc.
Impact assessment (economic, social and environmental) 1) Description of impacts
The following impacts have been identified as possible outcomes as a result of the investment above. The impacts are identified based on the outcomes achieved by similar investments in other setting, or research undertaken in the Ethiopian context. Where no quantitative data was available an indication of the expected contribution/level if impact expected is given in the column to the right. 80
Benefits / Positive impacts Costs / Negative impacts
Economic
• Job creation:
- High labour intensity in the housing sector, potential
to create broad based w ealth creation and
employment opportunities.
- Forw ard and backw ard linkages creates
employment elsew here along construction industry
supply chains, often in higher value-added sectors
like renew able energy technology.
-
+
Employee health and safety
Those employed in the construction sector are
often prone to greater risk of injury or ill-health
and require enhanced social protection by
employers and w orkers representative bodies. -
Social
• Improved public health: - Decent, w ell-designed housing improves pubic
health – environmental factors (that include
housing) are estimated to account for 25% of all
preventable ill-health e.g. acute respiratory
infections and diarrheal diseases.
- Housing w ith improved access to WASH reduces
poverty and increases gender equity amongst the
urban poor e.g. many urban girls are forced to stop
attending schools in their local area, especially after
puberty, w here separate toilet facilities are not
available81.
- Access to clean cooking facilities reduces exposure
to toxic smoke from traditional cooking causes a
range of deadly chronic and acute health effects
particularly in w omen82.
- Proximity to green and open spaces w hich is
incorporated into the design of modern housing – promotes recreation
- Secure tenure is strongly related to health; w here
those w ho ow n their ow n homes and have security
of tenure, are usually in better health83.
-
+
• Displacement and resettlement: - Often developing new housing on the edge
of the city w ill require existing ‘rural’
residents to be resettled in accommodated
elsew here. Provision should be made for
multi-stakeholder dialogue and participatory
decision making; adequate compensation;
Relocation settlements to preferably be in
close proximity.
-
Meets housing needs: • Urban dw ellers often have different housing needs
and aspirations, w hich is certainly the case for
w omen and other marginalised groups (such as
youth, indigenous groups, differently-abled, etc.). In
the design of housing, w omen and men often have
+
80
Impact scoring: ++ significant positive impact; + positive impact; 0 neutral; - negative impact; - - significant negative impact 81
UN-HABITAT, 2017c 82
Global All iance of Clean Cookstoves, 2015 83
Macintyre, 2001
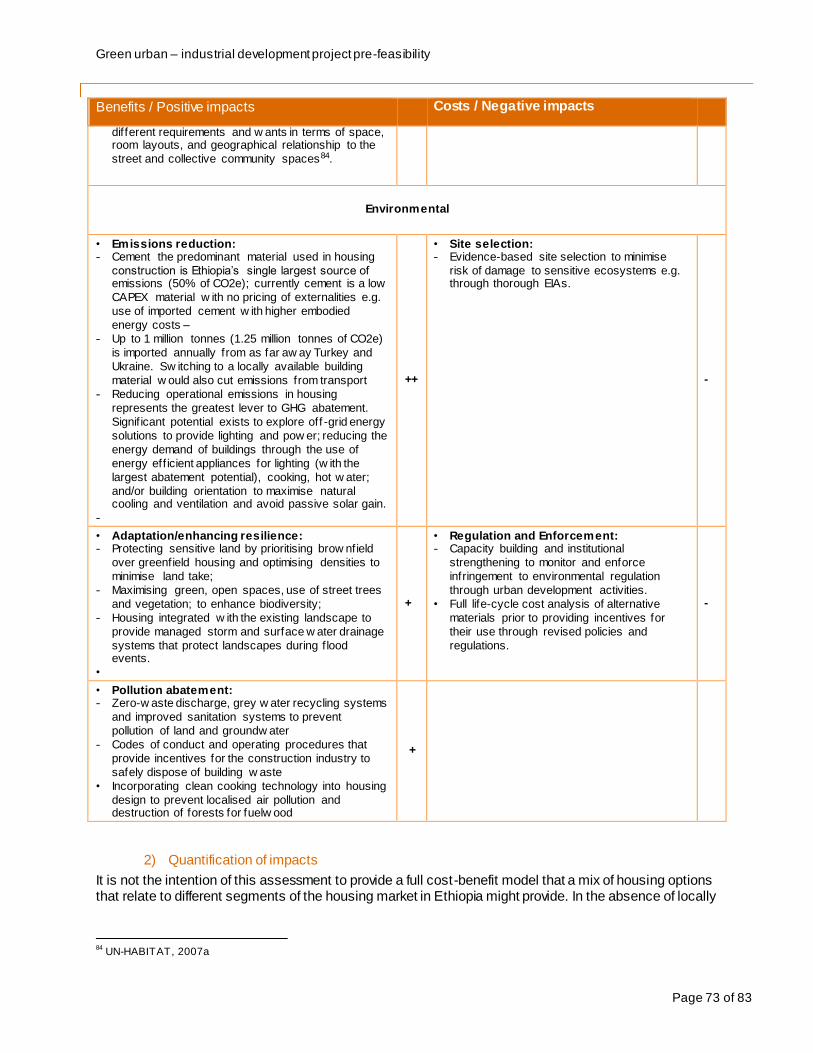
Green urban – industrial development project pre-feasibility
Page 73 of 83
Benefits / Positive impacts Costs / Negative impacts
different requirements and w ants in terms of space, room layouts, and geographical relationship to the
street and collective community spaces84.
Environmental
• Emissions reduction: - Cement the predominant material used in housing
construction is Ethiopia’s single largest source of emissions (50% of CO2e); currently cement is a low
CAPEX material w ith no pricing of externalities e.g.
use of imported cement w ith higher embodied
energy costs –
- Up to 1 million tonnes (1.25 million tonnes of CO2e)
is imported annually from as far aw ay Turkey and
Ukraine. Sw itching to a locally available building
material w ould also cut emissions from transport
- Reducing operational emissions in housing
represents the greatest lever to GHG abatement.
Signif icant potential exists to explore off -grid energy
solutions to provide lighting and pow er; reducing the
energy demand of buildings through the use of
energy eff icient appliances for lighting (w ith the
largest abatement potential), cooking, hot w ater;
and/or building orientation to maximise natural cooling and ventilation and avoid passive solar gain.
-
++
• Site selection: - Evidence-based site selection to minimise
risk of damage to sensitive ecosystems e.g. through thorough EIAs.
-
• Adaptation/enhancing resilience: - Protecting sensitive land by prioritising brow nfield
over greenfield housing and optimising densities to
minimise land take;
- Maximising green, open spaces, use of street trees
and vegetation; to enhance biodiversity;
- Housing integrated w ith the existing landscape to
provide managed storm and surface w ater drainage
systems that protect landscapes during f lood events.
•
+
• Regulation and Enforcement: - Capacity building and institutional
strengthening to monitor and enforce
infringement to environmental regulation
through urban development activities.
• Full life-cycle cost analysis of alternative
materials prior to providing incentives for
their use through revised policies and
regulations.
-
• Pollution abatement: - Zero-w aste discharge, grey w ater recycling systems
and improved sanitation systems to prevent
pollution of land and groundw ater
- Codes of conduct and operating procedures that
provide incentives for the construction industry to
safely dispose of building w aste
• Incorporating clean cooking technology into housing
design to prevent localised air pollution and destruction of forests for fuelw ood
+
2) Quantification of impacts
It is not the intention of this assessment to provide a full cost-benefit model that a mix of housing options that relate to different segments of the housing market in Ethiopia might provide. In the absence of locally
84
UN-HABITAT, 2007a

Green urban – industrial development project pre-feasibility
Page 74 of 83
specific data, qualitative statements are provided to qualify the likely costs and benefits this housing project would incur/deliver with an understanding that these benefits would be economic in nature.
Costs: Capital and operational costs
Globally, there is a perception that green housing is expensive. Where alternative materials and technologies are used to deliver housing in low-volumes, economies of scale are unlikely to be realised. As little green building technology has been adopted in Ethiopia it is difficult to provide costs. In contrast, a summary table of outline costs for delivering housing units through the current four main, formal housing delivery channels are given below e.g. aggregate cost of inputs construction materials, labour, transportation etc. This gives a benchmark against which the demonstration project for alternative, green housing delivery could be assessed. It is acknowledged that affordability is a key issue determining the availability and indeed demand for housing. It is therefore appropriate to keep in mind broad ranges of income (far-left column) and associated costs for each housing market segment.
Table 191: Inventory of costs for four main formal housing models (all costs in ETB)
CAPEX OPEX85
Market segment Housing type Construction
cost per unit (ETB)
Cost to
service land
Total Energy
usage cost ETB/per
month)
Rental cost
(ETB/month)
High-income >
5000
ETB/month
formal housing market
e.g. middle class
suburban housing (65-
70m2)
83,700 086 83,700 300 3000
Medium-income
1,500 – 5000
ETB/month
IHDP (i.e.
condominium) (20 -
45m2)
16,000 –
50,00087
NA 16,000 –
50,000
90 – 255 5000
Housing cooperatives NA NA NA 3000
Low-income
750 – 1500
ETB/month
Dormitory housing
(4m2)
20,000 –
37,000
7500 –
15,000
35,000 –
42,500
45 – 90 250-350
As a benchmarking exercise, total outline costs in capital expenditure are given below for delivering 1000 units of housing through the design competition; and, to satisfy total average annual demand for housing in Mek’ele. These estimates are subject to a mix of housing being delivered to satisfy various market segments. A more detailed assessment of costs and financing models e.g. revenue projections/sources, cost recovery mechanisms would need to be provided through next stage, full feasibility assessment.
Table 202: Current outline benchmark costs for delivering housing88
CAPEX
City/phase Housing mix Total
housing
Units
Average CAPEX
(unit cost of
construction, land,
infra) ETB
Total cost range for
delivering formal
housing ETB
(Millions)
Total cost range for
delivering formal
housing
USD$ (millions)
Mek’ele 4
(design
Mix of high;
medium; low -
1000 16,000 –
50,000
22.3 – 42.1 0.96 – 1.81
85
According to CSA (2012), Household Consumption and Expenditure (HCE) Survey, household monthly expenditure for fuel and
power accounts for 6% for urban areas of the country which also applies for Mek’ele. In view of that, a household earning 5,000 birr
will spend 6% of monthly income for power and fuel, thus Birr 3,600 per annum. 86
Land is provided serviced e.g. servicing is subsidised by the government. 87
Based on a range of sizes from studio apartment (>20m2) to 3 bedroom apartment (45m2). Note in order to keep costs down,
condominium apartments are sold/let with only basic levels of finishing. (UN-HABITAT 2011) 88
See Annex 17 for complete model and assumptions. Ranges represent low and high cost variants on housing models. Costs for
delivering self-build ‘slum’ households as a) GoE intends to ‘phase -out’ slum households over the life of GTPII; b) in ‘slum’ housing
is unlikely to meet basic climate compatibility criteria and is not being promoted under this study.

Green urban – industrial development project pre-feasibility
Page 75 of 83
competition,
1000 units)
income house
types
(5%, 21%,
74%)
Mek’ele
(total
demand89)
12,589 16,000 –
50,000
281.3 – 529.6 12.1 – 22.9
Benefits: Job creation and GHG emissions reduction
In the absence of detailed local data it is difficult to attach economic value to the benefits of greening the housing sector. However,. a broad estimate of the magnitude of impacts for various interventions that would be brought about through changes to the enabling environment for the housing sector is provided below in Table 14. Many of these benefits would be achieved through a package of interventions as opposed to one specific measure – though it would be hoped that the broad range of benefits could be quantified further through the housing demonstration component of this project. The greatest benefit of investing in green housing lies in GHG emissions abatement through increasing the energy efficiency of buildings. The urban sector currently contributes around 15% (20 MtCO2e) of Ethiopia’s emissions rising to around 125 MtCO2e by 2035; in Addis, residential buildings contribute just over 28% of the city’s GHG emissions. The emissions abatement potential is significant, representing an opportunity of around US$1.6 million/annum in Mek’ele alone.
89
Demand estimates for Mek’ele – see Annex 17. 90
In Addis per capita emissions from residential buildings were estimated at 0.45 tons per capita of CO2 equivalent. Although no
quantified data is available on breakdowns of GHG emissions from different components of residential buildings, the 0.45 rate
multiplied by average household size of 3.65 has been used to estimate GHG emi ssions from annual demand for residential
buildings in Mek’ele; and the equivalent of US$78/tonne the ‘middle’ non -traded price for carbon.
1.25tCO2e
GHG emissions
abatment per tonne of
cement avoided
13 job years per $US1
million
spent on retrofitting
clean energy technology
in buildings
20,677 tCO2e
/US$1.6 million
abatement potential
through energy
efficiency measures in
new housing (Mek’ele) 90
2.97
FTE jobs created per
housing unit

Green urban – industrial development project pre-feasibility
Page 76 of 83
Table 213: Likely magnitude of benefits accruing from green housing project.
Approach and justification Likely benefit Likely magnitude of
benefit
Alternative construction materials and techniques Replacement of imported cement.
For IHDP condominium projects alone cement usage is estimated at
1 million tonnes of cement and iron bars per annum, a proportion of
w hich is imported. Cement is very high embodied energy costs,
w here 1 ton of cement contributes the equivalent to 1.25 tonnes of
CO2. Reducing the use of traditional cement in constructing homes
is an imperative for greening industrialisation in Ethiopia.
Increase in import
substitution
0.86 Ratio of domestic
cement production to
cement consumption91
Reduced GHG
emissions
(during construction)
1.25t co2e 1 ton of cement
Greening the construction sector.
The contribution the construction sector makes to aggregate city
product is currently around 10% in Ethiopia, slightly higher than jobs
in the public sector.92 Grow th in the construction sector drives grow th
elsew here in the economy, so housing projects generate broad
based w ealth creation and employment opportunities both during
construction and in the ongoing operations/maintenance of
additional housing units, and elsew here through forw ard and
backw ard linkages along construction supply chains.
Job creation
2.97 FTE jobs created per house
constructed93
Energy efficiency measures
Use of energy efficient light bulbs.
This has the largest abatement potential for reducing emissions from
housing/buildings. Total residential demand for lighting stands at 8.3
TWH by 2030; w hich could be reduced 60 - 77% if houses sw itch to
f lorescent/LED bulbs for lighting. This is a cost-eff icient (purchase
cost is outw eighed by savings in operating costs) and a technology
already available in Ethiopia.
Reduced GHG
emissions
(during operation)
5.1 MtCO2e in the Green Cities
and Buildings
sector94
Use of improved efficiency or ‘fuel-shift’ stoves.
Efficient stoves have tw o distinct effects on GHG emissions -
reducing forest degradation, w ith an impact of around 0.9 t
biomass/year per household; and w oody biomass acts as carbon
sink, amounting to 2.1 t/year per household (if it is not burned).
Carbon intensity of cooking/preparing food e.g. predominant use of
charcoal in kitchens across Ethiopia. Abatement potential of 1.6 t
CO2e/stove/year under the assumption that reduced consumption
f irst decreases direct degradation before it affects the carbon sink)95
1.6t co2e per stove/year
Passive design of buildings to maximises ventilation and reduce solar gain. This reduces the need to employ mechanical
cooling for example, air conditioning units.
NA
Resource-use efficiency
Use of off-grid solar. Households use different backup lighting
services during the grid-blackouts. The more common types that are
identif ied below bare signif icant ongoing costs for households, in
addition to electricity bills. Off -grid solar provides greater resilience
for households w ho have intermittent pow er access through the
mains grid, and provides abatement of emissions
Energy use eff iciency NA
Recycling grey water and harvesting rain water. Reduction in the
amount of mains w ater consumed at the household level. Rainw ater
Water resource
k
cubic metres of water
91
In 2012, 3.8 million tonnes per annum domestic production against 4.37 million tonnes consumed per annum. (FDRE Ministry of
Industry 2013) 92
State of Ethiopian Cities Report, (Ministry of Urban Development and Housing and Ethiopian Civil Service University 2015) 93
A conservative estimated taken from the economic impact of housebuilding in the US. Ethiopia has a higher labour intensity
construction industry and as such this figure could be many times higher. Source: ‘NAHB: Impact of Home Building and Remodeling
on the U.S. Economy’ 2017 94
Climate Resilient Green Economy Strategy (Federal Democratic Republic of Ethiopia 2011) 95
Ibid

Green urban – industrial development project pre-feasibility
Page 77 of 83
capture and storage has a long history in Ethiopia though
performance at the household level has been show n to be
constrained in Mek’ele on account of ‘ineff icient design’.(Taffere et
al. 2016)
efficiency
use avoided
Compact city development. In addition, optimising density may
represent a signif icant carbon saving (CO2 emissions arising from
passenger transport in Ethiopia is projected to increase from 40 to
220 billion passenger KMs by 2030: equivalent to 4 times increase in
MT C02).
efficient use of land 1.08 – 5%96
Reduction in CO2
emissions through an increase in density of
10%
Sustainable water and sanitation provision. Decent, sustainable
housing should include as a design consideration of ground-up
access. Existing housing stock in Mek’ele and Kombolcha is
currently under-provisioned in terms of access to w ater and
sanitation. For example, only 60.2% of households in Mek’ele have
private f lush toilet and around 57% shared a w ater source. Improved
access to w ater and sanitation. Globally the economic return on
sanitation is US$5.5 per $1.
Social development 2.8 Cost benefit ratio for
improved WASH97
Financing Options With the exception of housing delivered informally, formal market housing in Ethiopia is likely to be subsidised either in kind where government provides housing itself or serviced land; through employer contributions in the case of dormitory housing for workers; or through access to loans or grants. IHDP condominium housing for example is offered with a loan backed by the National Bank – though down payments required range from 10 – 40% 0f the property’s value. Less than 1% of housing is delivered by private real-estate developers and there are only a handful of lenders operating in the mortgage market. Property finance is unpopular with Ethiopian commercial banks as the real estate sector is considered ‘high-risk’.98 Otherwise self- financing housing is common, where owners build incrementally on plots of land acquired formally or informally. The majority of households in Mek’ele and Kombolcha rent their accommodation, with rents ranging from 250 – 1500 ETB/month (see Figure 4 - rents in Mek’ele). At the lowest end of the housing market, worker housing has been subsidised by employers, see for example the Hawassa eco-Industrial Park (see Box 2 below).
Financing options for new green housing therefore is likely to come through a combination of:
- Government subsidies (serviced land, public housing); - Self-financing e.g. microfinancing schemes, mortgages; - Employer subsidies; - Development partners e.g. INGOs; impact investors99.
96
Taken from a study of Chinese cities where increased density is correlated with increase public transport use and therefore a
reduction in emissions.(Yi et al. 2017). Elsewhere, Roaf (2012) notes that the relationship between housing density and CO2
emissions may not be linear where medium density development outperforms high -rise development with its associated increased
energy usage through lifts, service cores ,l ighting etc. 97
Global costs and benefits of drinking-water supply and sanitation interventions, WHO. Hulton, Organization, and others (2012) 98
Urban infrastructure in Sub-Saharan Africa – harnessing land values, housing and transport: Report on Ethiopia Case Study
(African Centre for Cities 2015) 99
Reall.net

Green urban – industrial development project pre-feasibility
Page 78 of 83
Figure 8: Affordability modelling of housing provision in Mek’ele (rental)
Source: Housing Diagnostic for Industrial Parks. Ethiopia Investment Advisory Facility, 2017 (unpublished)

Green urban – industrial development project pre-feasibility
Page 79 of 83
Risk Assessment A high-level assessment of any technical, operational, financial, social and environmental risks that the project interventions may face, and proposed mitigation measures to address them is presented below.
Table 24: Risk Analysis
No. Description Level of
Impact
Probability Mitigation measure
1 No/low capacity to manage project locally e.g. limited knowledge of sustainable design principles
Medium High International experts drafted in to support scoping and briefing of project, evaluation, and monitoring of project
2 Low-uptake from local building industry in entering the design competition and/or limited green design credentials
Medium High Encourage local construction/design firms to partner with international partners with green/eco design credentials – knowledge transfer
3 Affordability of housing units
High Medium Viable finance models/costings to be considered as criteria in judging entries; Ethiopian financial service providers to sit on design panel
4 Low public/cultural acceptability of alternative designs/materials
High Medium The project will involve volunteer housing cooperatives. Awareness raising campaign on the benefits of the housing models developed.
5 Political interference in developing an alternative construction supply chain
Medium High GoE currently provides strong incentives for the use of cement in construction as a ‘low-cost’ material suitable for mass house building; investing heavily in the sector primarily to reduce imports. Making the case for substituting cement for alternative materials based on full life-cycle costings of the environmental costs of producing cement may face considerable political resistance.100 Mitigation measures include: phased replacement of lower carbon cements, partial substitution of cement in favour or other locally available low-impact materials e.g. rammed earth.
100
For example, Cement production in Tigray is owned by the Tigray Liberation Front who have a vested interest in continued use of
cement. Substituting cement in housing construction.

Green urban – industrial development project pre-feasibility
Page 80 of 83
Implementation timeline The technical options for this project have been worked up with climate financing criteria in mind. The project’s fit with Ethiopia’s CRGE strategy is the relevant climate policy framework and statement of commitments along with 5-year national development plan, the Growth and Transformation Plan-GPT II would secure eligibility for climate financing e.g. the GCF. As a scalable / replicable project, and an innovative project, and as an initiative that can leverage finance from multiple sources, this project is innovative with medium to high transformative potential. Broad fit with GCF funding criteria is highlighted below in Table 7.
Financing would be anticipated at 3/4 major stages as follows:
Year 1 Year 2 Year 3 Year 4 Year 5 Funding
partners
1 Design
competition/research
GoE/
Development
agencies
2
Regulatory and policy
reform and capacity
building
GCF/DFI +
Private sector
3 Market launch
Private-sector +
homebuyers

Green urban – industrial development project pre-feasibility
Page 81 of 83
Next steps and recommendations Green housing has the potential to transform cities towards a more climate compatible pathway – indicative evidence suggests a significant level of verified combined values of expected CO2 equivalent to be reduced or avoided. A Green housing project would contribute towards corridor-wide reduction in energy demand, and make contributions to Ethiopia’s Climate Resilient Green Economy strategy. The technical options put forward have the potential to demonstrate reform of the enabling environment for housing. However this is a multi -stakeholder process, with some significant institutional change and enhanced coordination required. A number of key recommendations emerge from this study, which could be used to move the project forward
1. Secure government buy-in. Consultation with the Government of Ethiopia are advised in the short-term to secure buy-in to the concept of the project, particularly from the proposed lead Ministry – Urban Development and Housing MOFECC through its CRGE facility.
2. Seek wider feedback on the findings of this report. Given the multi-stakeholder nature of this project, level of support from a range of development partners should be tested including the real estate and construction sector, commercial banks, development agencies (including DFID and its EIAF; the ILO and UNIDO).
3. Development Terms of Reference for the design competition. A small, interim-task would be to take the technical design parameters presented in this report and work up some terms of reference for a green housing design competition. These cold be used to secure further buy-in from a range of stakeholders and attract initial seed funding for this idea.
4. Development a road map for policy and regulatory reform. As highlighted above, CRGE guidance is starting to be reflected in urban development and housing policy. To demonstrate a commitment to progressing this through the regulatory environment and down to local, city-level policy, and a roadmap should be designed setting out broad timelines, key partners, and milestones for thorough reform of the housing sector.
5. Review guidelines on industrial park expansion in consultation with city authorities. In the short-term, a participatory dialogue should be established between the IPDC, private industrial park owners and the relevant city authorities. Housing demand projections provided in this report could form the starting point for addressing likely shortfall, looking at a range of short-term options to ‘plug-the-gap’ in a sustainable manner as more units at the IPs come on-line.
6. Seek funding to undertake a full feasibility assessment. A key recommendation to move the project forward would be to seek project preparation funding to undertake a full feasibility assessment, including GHG inventories of the built environment in both Mek’ele and Kombolcha-Dessie. The GCF’s Project Preparation Facility (PPF) may be a suitable vehicle for funding further study through a grant to the GoE’s Accredited Entity: CRGE Facility within MOFECC.

Green urban – industrial development project pre-feasibility
Page 82 of 83
References 1. African Centre for Cities. 2015. ‘Urban Infrastructure in Sub-Saharan Africa – Harnessing Land Values,
Housing and Transport: Report on Ethiopia Case Study’. DFID.
2. EIAF, DFID, Housing diagnostic for industrial parks, Mekele situation and proposed solutions, Preliminary Draft, June,
3. Ethiopian Development Research Institute, Global Green Growth Institute, and New Climate Economy. 2015. ‘Unlocking the Power Ethiopia’s Cities: A Report by Ethiopia’s New Climate Economy Partnership’.
4. Ethiopian Urbanization Review, World Bank, 2015 of Urban Development and Housing, 2015, National Urban Development Spatial Plan
5. FDRE, Proclamation No. 272/2002 – Re-enactment of Urban Lands Lease Holding Proclamation, 14th
6. May 2002
7. FDRE, Proclamation No. 370/2003 – Condominium Proclamation, 11th September 2003
8. FDRE, Proclamation No. 455/2005 – Expropriation of Landholdings for Public Purposes and Payment of
9. Compensation Proclamation, 15th July 2005
10. FDRE, Proclamation No. 624/2009 – Ethiopian Building Proclamation, 6th May 2009
11. FDRE, Proclamation No. 574/2008 – Urban Planning Proclamation, 16th May 2008
12. FDRE, Proclamation No. 721/2011 – Urban Lands Lease Holding Proclamation, 28th November 2011
13. FDRE Ministry of Industry. 2013. ‘Ethiopian Industrial Development Strategic Plan (2013-2025)’.
14. Ministry of Urban Development and Housing, Urban Housing Strategy of Ethiopia, August 2013
15. Ministry of Urban Development and Housing, Urban Housing Provision Strategic Framework, February 2013
16. Ministry of Urban Development and Housing, Kombolcha Central Neighbourhood Development Plan, Urban Design Plan, 2015
17. Federal Democratic Republic of Ethiopia. 2011. ‘Ethiopia’s Climate Resilient Green Economy: Green Economy Strategy’.
18. Hulton, Guy, World Health Organization, and others. 2012. ‘Global Costs and Benefits of Drinking-Water Supply and Sanitation Interventions to Reach the MDG Target and Universal Coverage’. http://apps.who.int/iris/bitstream/10665/75140/1/WHO_HSE_WSH_12.01_eng.pdf.
19. ILO. 1961. ‘Recommendation R115 - Workers’ Housing Recommendation, 1961 (No. 115)’. http://www.ilo.org/dyn/normlex/en/f?p=1000:12100:::NO:12100:P12100_INSTRUMENT_ID:312453.
20. Ministry of Urban Development and Housing. 2015. ‘Mek’ele - Gergembes Neighbourhood Development Plan’.
21. Ministry of Urban Development and Housing, and Ethiopian Civil Service University. 2015. ‘State of Ethiopian Cities Report’.
22. ‘NAHB: Impact of Home Building and Remodeling on the U.S. Economy’. 2017. Accessed June 25. http://www.nahbclassic.org/generic.aspx?sectionID=734&genericContentID=227858&channelID=311&_ga=2.112405184.510936206.1498426460-789310633.1498426460.
23. Roaf, Susan. 2012. Transforming Markets in the Built Environment: Adapting to Climate Change. Routledge.
24. Taffere, Getachew Redae, Abebe Beyene, Said A. H. Vuai, Janvier Gasana, and Yilma Seleshi. 2016. ‘Reliability Analysis of Roof Rainwater Harvesting Systems in a Semi-Arid Region of Sub-Saharan Africa: Case Study of Mek’ele, Ethiopia’. Hydrological Sciences Journal 61 (6): 1135–40. doi:10.1080/02626667.2015.1061195.
25. UN-HABITAT. 2011. ‘Condominium Housing in Ethiopia: The Integrated Housing Development Programme’.
26. Yi, Yanchun, Sisi Ma, Weijun Guan, and Ke Li. 2017. ‘An Empirical Study on the Relationship between Urban Spatial Form and CO2 in Chinese Cities’. Sustainability 9 (4): 672. doi:10.3390/su9040672.

Green urban – industrial development project pre-feasibility
Page 83 of 83
This document is an output from a project commissioned through the Climate and Development Knowledge Network
(CDKN). CDKN is a programme funded by the UK Department for International Development (DFID) and the
Netherlands Directorate-General for International Cooperation (DGIS) for the benefit of developing countries. The views
expressed and information contained in it are not necessarily those of or endorsed by DFID, DGIS or the entities
managing the delivery of CDKN, which can accept no responsibility or liability for such views, completeness or accuracy
of the information or for any reliance placed on them. This publication has been prepared for general guidance on
matters of interest only, and does not constitute professional advice. You should not act upon the information contained
in this publication without obtaining specific professional advice. No representation or warranty (express or implied) is
given as to the accuracy or completeness of the information contained in this publication, and, to the extent permitted by
law, the entities managing the delivery of CDKN do not accept or assume any liability, responsibility or duty of care for
any consequences of you or anyone else acting, or refraining from acting, in reliance on the information contained in this
publication or for any decision based on it. CDKN is led and administered by PricewaterhouseCoopers LLP.
Management of the delivery of CDKN is undertaken by PricewaterhouseCoopers LLP, and an alliance of organisations
including Fundación Futuro Latinoamericano, LEAD Pakistan, the Overseas Development Institute, and
SouthSouthNorth. Copyright © 2017, Climate and Development Knowledge Network. All rights reserved.
Related Documents