1 Pre-breeding blood urea nitrogen concentration and reproductive performance of Bonsmara heifers within different management systems T. Tshuma a ; D. E. Holm a ; G. T. Fosgate a ; D. C. Lourens a a Department of Production Animal Studies, Faculty of Veterinary Science, University of Pretoria, Private Bag X 04, Onderstepoort, 0110, South Africa Corresponding author: Takula Tshuma, BVSc, MMedVet (Bov HH) Email: [email protected] Tel: +27-12-529-8039 Fax: +27- 12-529 8315 Abstract This study investigated the association between pre-breeding blood urea nitrogen (BUN) concentration and reproductive performance of beef heifers within different management systems in South Africa. Bonsmara heifers (n = 369) from five herds with different estimated levels of nitrogen intake during the month prior to the commencement of the breeding season were sampled in November and December 2010 to determine BUN concentrations. Body mass, age, body condition score (BCS) and reproductive tract score (RTS) were recorded at study enrolment. Trans-rectal ultrasound and/or-palpation was performed four to eight weeks after a three-month breeding season to estimate the stage of pregnancy. Days to pregnancy (DTP) was defined as the number of days from the start of the breeding season until the estimated conception date. Logistic regression and Cox proportional hazards survival analysis were performed to estimate the association of pre-breeding BUN concentration with subsequent pregnancy and DTP respectively. After stratifying for herd and adjusting for age,

Welcome message from author
This document is posted to help you gain knowledge. Please leave a comment to let me know what you think about it! Share it to your friends and learn new things together.
Transcript

1
Pre-breeding blood urea nitrogen concentration and reproductive
performance of Bonsmara heifers within different management systems
T. Tshumaa; D. E. Holm
a; G. T. Fosgate
a; D. C. Lourens
a
aDepartment of Production Animal Studies, Faculty of Veterinary Science, University of Pretoria, Private Bag X
04, Onderstepoort, 0110, South Africa
Corresponding author: Takula Tshuma, BVSc, MMedVet (Bov HH)
Email: [email protected]
Tel: +27-12-529-8039
Fax: +27- 12-529 8315
Abstract
This study investigated the association between pre-breeding blood urea nitrogen (BUN)
concentration and reproductive performance of beef heifers within different management
systems in South Africa. Bonsmara heifers (n = 369) from five herds with different estimated
levels of nitrogen intake during the month prior to the commencement of the breeding season
were sampled in November and December 2010 to determine BUN concentrations. Body
mass, age, body condition score (BCS) and reproductive tract score (RTS) were recorded at
study enrolment. Trans-rectal ultrasound and/or-palpation was performed four to eight weeks
after a three-month breeding season to estimate the stage of pregnancy. Days to pregnancy
(DTP) was defined as the number of days from the start of the breeding season until the
estimated conception date. Logistic regression and Cox proportional hazards survival analysis
were performed to estimate the association of pre-breeding BUN concentration with
subsequent pregnancy and DTP respectively. After stratifying for herd and adjusting for age,

2
heifers with relatively higher pre-breeding BUN concentration took longer to become
pregnant when compared to those with relatively lower BUN concentration (P = 0.011). In
the herd with the highest estimated nitrogen intake (n = 143), heifers with relatively higher
BUN were less likely to become pregnant (P = 0.013) and if they did, it was only later during
the breeding season (P = 0.017), after adjusting for body mass. These associations were not
present in the herd (n = 106) with the lowest estimated nitrogen intake (P > 0.500). It is
concluded that Bonsmara heifers with relatively higher pre-breeding BUN concentration,
might be at a disadvantage because of this negative impact on reproductive performance,
particularly when the production system includes high levels of nitrogen intake.
Keywords
beef cattle, blood urea nitrogen, reproductive performance, nitrogen supplementation
Introduction
Ruminants are capable of maintaining adequate nitrogen levels for microbial protein
synthesis in the rumen even during times of nitrogen scarcity, mainly by recycling nitrogen
back into the rumen and by reducing the amount excreted into urine, faeces and milk
(Erickson and Klopfenstein, 2010, Dijkstra et al., 2011). However the limits of this
physiological adaptation are still unknown (Muscher et al., 2010). The efficiency of nitrogen
retention in feedlot cattle is low, with only 10 to 15% of dietary nitrogen retained in tissues
(Bierman et al., 1999) and the remainder being excreted. However, lower proportions may be
excreted by cattle in extensive production systems where the level of nitrogen intake is
relatively lower.
Blood urea nitrogen (BUN) is the major end product of nitrogen metabolism in ruminants. It
has been suggested in dairy cattle that BUN concentration can be used to monitor the

3
efficiency of nitrogen utilisation, where high concentrations are indicative of inefficient
utilisation of dietary nitrogen (Nousiainen et al., 2004). This is however contrary to
Schoeman’s (1989) review, who suggested that Nguni cattle with higher BUN concentrations
were more capable of maintaining body condition during winter periods, suggesting that they
were more efficient retainers of nitrogen. Although the study of Kohn et al. (2005)
demonstrated a linear relationship between BUN concentration and urinary nitrogen excretion
rate in many species, the exact association between relative BUN concentration and the
efficiency of nitrogen retention in grazing beef cattle remains unclear.
Blood urea nitrogen is synthesized in the liver, and can have variable concentrations without
causing any adverse effects to the fertility of cattle. However, concentrations above 20 mg/dL
at the time of breeding may lead to reduced fertility in dairy cattle (Ferguson et al., 1993).
Elevated BUN concentration decreases uterine pH, which is thought to have a negative effect
on embryo development and implantation (Elrod and Butler, 1993). It has been suggested,
however, that the negative association between high BUN concentration and reproductive
outcome might be confounded by a concurrent energy deficit (Staples et al., 1990). Blood
urea nitrogen concentrations below 7 mg/dL at breeding have been reported to also be
associated with reduced reproductive performance due to protein deficiency (Carlsson and
Pehrson, 1993). In their review Jorritsma et al. (2003) concluded that the effects of urea on
fertility are likely to occur during cleavage and blastocyst formation of the fertilised embryo,
whereas the effects of high levels of ammonia in the blood are probably exerted prior to
ovulation. It is estimated that follicles start to develop about 100 days prior to ovulation
(Britt, 2008).
Blood urea nitrogen concentration, and hence the efficiency of nitrogen retention is believed
to vary between and within cattle breeds (Schoeman, 1989; Chase Jr. et al., 1993). Several
studies have also reported genetic variation in milk urea nitrogen (MUN) concentration

4
(indirect indication of BUN concentration) between cows of the same breed, suggesting
genetic differences in nitrogen utilisation efficiency (Stoop et al., 2007; Bouwman et al.,
2010; Hossein-Zadeh and Ardalan, 2011). Possible reasons for this variation include differing
grazing habits or differences in the rate of urea excretion by the kidneys (Schoeman, 1989).
Other known sources of variation in BUN concentration are dietary protein and energy levels,
hydration status at time of sampling, time of sample collection, age of the animal, dry matter
intake and the particular method of analysis (Godden et al., 2001; Kauffman and St-Pierre,
2001; Rajala-Schultz and Saville, 2003; Hossein-Zadeh and Ardalan, 2011). Mitchell et al.
(2005) demonstrated that variation in MUN is genetically determined and has a heritability of
0.15. The objective of this study was to determine if the relative BUN concentration within a
herd was associated with reduced reproductive performance in Bonsmara heifers within
different management systems.
Materials and Methods
Study locality and study herds
Nulliparous Bonsmara heifers (n = 369) were enrolled from 5 herds in South Africa (Herds
A-E according to sampling order). Herds that met study criteria (practised a 3-month
restricted breeding program starting on the first of December, performed a veterinary
breeding soundness evaluation of bulls before the onset of the breeding season and kept
records on birth dates and body mass of their animals) were identified by convenience
sampling. All herds were located between the latitudes 23˚21′53″ and 27˚29′9″ South. Herds
A, C and D were managed on sourish mixed bushveld in the Limpopo Province. Herd B was
managed on sweet mixed bushveld in the Limpopo Province whereas Herd E was managed
on sour veld in the Free State Province. In all herds, lick supplements were delivered in feed

5
troughs onto the pasture and intake was estimated according to the manufacturer’s
recommendations.
Herds A and C were commercial cow-calf herds whereas B, D and E were registered
breeding herds. All herds practised a three-month restricted breeding program starting on the
first of December each year. Breeding bulls were determined to be breeding sound prior to
the breeding season as described by Irons et al. (2007). Facilities on the farms did not allow
heifers to have access to feed while in the holding pens and access to drinking water was only
available for Herds A, B and D.
Heifers in Herd A were bred by four bulls in one multisire group. These heifers were
managed extensively on pasture and received a 46% crude protein (CP) commercial protein
lick supplement (Protein lick with oil cake, KK Animal Nutrition, South Africa). The
recommended daily intake of 450 g/heifer/day was maintained throughout the dormant
season. The supplement was changed to a commercial mineral lick (Phossure 6, KK Animal
Nutrition, South Africa) approximately two months before the beginning of the breeding
season. The CP content of the pasture during the month prior to the onset of breeding was
estimated at 7.8% (Bransby, 1988) and the level of nitrogen in dietary intake was estimated to
be low (Table 1). Only the month of birth of heifers in this herd was recorded, and a date of
birth on the 15th
day of the month of birth was assigned to each heifer for analytical purposes.
Heifers in Herd B were bred by natural service in a single sire group. These heifers were
managed extensively on natural pasture (CP content estimated at 6.9%, Bransby, 1988) and a
commercial production lick supplement containing 27% CP (Summer Production lick for
growth, KK Animal Nutrition, South Africa) was provided throughout the dormant season at
the recommended intake of 1000g/heifer/day. The supplement was changed to a higher
energy lick supplement containing 18% CP (Beef Booster 18, Meadow Animal Feeds, South

6
Africa), at the recommended intake of 500 g/heifer/day at the beginning of the breeding
season. The level of dietary nitrogen intake of heifers in this herd during the month prior to
breeding was estimated to be moderate (Table 1).
Table 1: Estimated levels of nitrogen intake during the month prior to breeding
Herd Crude protein (%) Dietary nitrogen intake level
From Pasture
(estimated)
From the
supplement
A 7.8 0 Lowl
B 6.9 23 Moderatem
C 9.0 18 Moderate
D 7.8 45 Highh
E 19.5 18 Very highvh
l = CP < 8%
m = 8 < CP < 12
h = 12 < CP < 14
vh = CP > 14
Heifers in Herd C were artificially inseminated after synchronisation with progesterone
impregnated intravaginal devices (CIDR Easy Breed, Pfizer Animal Health), followed by
natural mating with one bull. This herd was managed semi-intensively on irrigated oat
pastures (estimated to contain 9% CP, Bransby, 1988) with an 18% CP commercial
production lick supplement (Production lick, Driehoek Feeds, South Africa)) during the 2
months prior to the breeding season (recommended lick intake 1000 g/heifer/day). The level
of dietary nitrogen intake in this herd during the month prior to the onset of breeding was
estimated to be moderate (Table 1). At the beginning of the breeding season, heifers were
moved to natural pasture where they received a commercial mineral lick supplement
(Phossure 6, KK Animal Nutrition, South Africa) ad lib, intake estimated at 60 – 100
g/heifer/day.
Heifers in Herd D were bred by natural service in a single sire group. The herd was managed
extensively on natural pasture (CP content estimated to be 7.8%, Bransby, 1988) with a 45%
CP commercial protein lick supplement (Voermol Dundee lick, Voermol, South Africa) that

7
was provided during the dormant season (estimated intake 450 g/heifer/day). The total dietary
nitrogen intake during the month prior to the onset of breeding was estimated to be high
(Table 1). The protein supplementation was replaced with a commercial mineral lick
(Phossure 6, KK Animal Nutrition, South Africa) at the beginning of the breeding season
with an estimated intake of 60 – 100 g/heifer/day.
Heifers in Herd E were bred by natural service in multisire groups of 3 to 4 bulls per 100
heifers. They were managed semi-intensively on irrigated rye grass pastures with an
estimated CP content of 19.5% (Bransby, 1988) and supplemented with an 18% CP energy
lick (Produksielek 180, Saamstaan Feeds Vrede, South Africa) that was specifically made for
this farm starting five months prior to the onset of the breeding season. The recommended
intake for this lick was 1000 g/heifer/day. The total dietary nitrogen intake during the month
prior to the onset of breeding was estimated to be very high (Table 1). Heifers were moved to
natural pasture (over sown with Themeda triandra) on the first day of the breeding season
and provided with a commercial mineral lick (Phossure, KK Animal Nutrition, South Africa)
at the recommended intake of 100g/heifer/day. Sampling in Herd E was performed over two
consecutive days.
Study design and data collection
The sample size was estimated based on the normal approximation to the binomial for the
comparison of two proportions assuming equal group sizes at a power of 80% and an
allowable alpha error of 5%. It was assumed that animals with higher levels of BUN would
have a pregnancy proportion of 85% compared to other heifers in which the proportion was
expected to be 95% based on the industry standard of a 90% pregnancy proportion. The
sample size was calculated as 160 heifers per group and increased by 10% (352 total) to
account for losses during follow-up (Fosgate, 2009).

8
Data were collected during two farm visits, the first being within one week prior to the
commencement of the breeding season during which blood samples, age, body mass, body
condition score (BCS) and reproductive tract score (RTS) data were collected. A second visit
was conducted four to eight weeks after the termination of the breeding season for pregnancy
testing.
Heifers were restrained in a crush and blood samples were collected by venepuncture from
the coccygeal vein or artery into evacuated 4 ml serum tubes (Becton Dickinson, BD
vacutainer CAT, silicone clot activator). Blood samples were centrifuged at 4000 rpm for 8
minutes immediately after clot formation, separated into micro centrifuge tubes (2 ml) and
frozen in a portable freezer at -18 °C. After blood sampling, BCS and RTS were performed
and recorded on scales from 1 to 9 and 1 to 5 respectively according to standardised protocols
(Andersen et al., 1991, Marston et al., 2005). Frozen serum samples were delivered to the
clinical pathology laboratory at the Faculty of Veterinary Science of the University of
Pretoria within two days of sampling. Serum was stored at -80 °C for a maximum of 30 days
prior to testing using an auto analyser machine (Cobas Integra 400 plus, Roche, Switzerland).
Pregnancy status and foetal age (in days) was determined by a single investigator (TT), either
by transrectal palpation, or transrectal ultrasonography if the stage of pregnancy was judged
to be less than 56 days by palpation (Sheldon and Noakes, 2002; Romano et al., 2006;
Youngquist, 2007). Ultrasonography was performed using a portable ultrasound machine
with a 3.5 - 5 MHz linear transducer (CTS900V, Shantou Institute for Ultrasonic Instruments,
China). Records of the days that heifers were observed to be mated, when available, were
used to verify accuracy of the estimated foetal age. Days to pregnancy (DTP) was calculated
as the total number of days from the start of the breeding season to pregnancy examination
minus the estimated foetal age.

9
Informed consent was obtained from all herd owners prior to sampling and typical farming
practices continued throughout the study. Farmers were not informed of the BUN, BCS, and
RTS data prior to pregnancy testing.
Statistical analysis
Data normality was assessed by plotting histograms, calculating descriptive statistics, and
performing the Anderson-Darling test. Data satisfying the normality assumption were
presented as mean +/- standard deviation (SD) and non-normal data were presented as the
median and range (minimum, maximum).
Conditional logistic regression analysis was performed to measure the association between
BUN concentration and subsequent pregnancy while adjusting for herd as the grouping factor
and other potential confounders by including main effect terms in the models. Variables that
caused 15% or greater change in the odds ratio (OR) for BUN concentration when included
in models were considered important confounders.
Stratified Cox proportional hazards analysis was performed to investigate the effect of BUN
concentration on DTP. Heifers that did not become pregnant were right censored, and those
that were lost to follow up were excluded from the analysis. Herd was included as the
stratifying factor and other potential confounders were evaluated as main effects. Sampling
day was forced into all models in herds where sampling required two days.
Reproductive tract score and BCS were screened as ordinal variables and dichotomized when
significant associations (P < 0.2) with BUN were identified. Categorisation was performed
based on the relative frequencies within each category. Specifically, RTS was grouped as 1 to
3 versus 4 and 5. Results for the ordinal coding were reported when categorisation did not
suggest violation of the assumption of being linear in the natural logarithm on the odds or

10
hazard scale. In addition to confounding variables, all variables with P < 0.2 were entered
into all multivariable models and removed one by one in a backward elimination process
based on the largest Wald P values until only variables that were significantly associated with
the outcome remained (P < 0.05).
Data were analysed using commercially available software (IBM SPSS Statistics Version 20,
International Business Machines Corp., Armonk, NY, USA; MINITAB Statistical Software,
Release 13.32, Minitab Inc., State College, Pennsylvania, USA).
P-values less than 0.05 were defined as being significant, values between 0.05 and 0.1 as
borderline significant and values greater than 0.1 as being not significant.
Results
Three hundred and sixty-nine heifers were sampled at the start of the study and 338 were
present at the time of pregnancy examination. The overall age at breeding varied from 12 to
31 months (Table 2). The mean body mass and BUN concentration (± SD) was 283 kg ± 48
and 5.27 mmolL-1
± 1.8 respectively. Heifers were generally in good condition (BCS ≥ 3) and
there were no marked differences in BCS within and between herds. Pregnancy proportion
varied from 41% to 100% and the median DTP (min, max) was 40 (4, 89).
The association between BUN concentration and pregnancy status overall was borderline
significant (P = 0.068) and was significant in Herds D and E (Table 3). Heifers with a higher
BUN concentration at the beginning of the breeding season in Herd D (OR = 0.478; 95% CI:
0.232 – 0.987) and E (OR = 0.617; 95% CI: 0.422 – 0.903) had lower odds of becoming
pregnant. It was not possible to perform logistic regression for Herds B and C because they
had pregnancy proportions of 100%. Heifers with higher BUN concentration had a lower rate
of becoming pregnant (HR = 0.832; 95% CI: 0.722 – 0.958, P = 0.011) (Table 4).

11
Table 2: Descriptive statistics for all herds
Herd n Age
(range)
Mass
± SD
BUN
± SD
BCS
(range)
RTS
(range)
DTP
(range)
PP
(%)
Overall 338 19
(12, 31)
283 ± 48 5.27 ± 1.80 5
(3, 7)
4
(1, 5)
40
(4, 89)
63
A 106 19
(14, 24)*
- 5.37 ± 0.81 5
(4, 5)
4
(2, 5)
43
(15, 89)
71
B 33 25
(20, 26)
318 ± 32 2.20 ± 0.67 5
(3, 5)
3
(1, 5)
24
(10, 59)
100
C 34 26
(24, 27)
297 ± 29 4.14 ± 0.92 6
(5, 7)
5
(3, 5)
4
(4, 81)
100
D 22 24
(22, 31)
380 ± 38 4.50 ± 1.80 5
(4, 6)
4
(1, 5)
47
(12, 75)
68
E1 80 14
(12, 23)
256 ± 26 7.40 ± 1.14 5
(4, 6)
4
(3, 5)
40
(12, 89)
54
E2 63 14
(12, 22)
257 ± 28 4.77 ± 1.16 5
(4, 6)
4
(1, 5)
47
(12, 89)
41
*The exact ages of individual animals in this herd were not known. Only the month of birth was available
Age = median age in months
BCS = Median body condition score
BUN = Mean blood urea nitrogen concentration in mmolL-1
DTP = Median days to pregnancy
E1 = first day of sampling in Herd E
E2 = second day of sampling in Herd E
Mass = mass of the heifers in kilograms
n = sample size
PP = Pregnancy proportion
RTS = Median reproductive tract score
SD = Standard deviation

12
Table 3: Association between pre-breeding BUN concentration and pregnancy status
Herd n BUN ± SD
Association between BUN
concentration and Pregnancy status
OR
95% CI of OR
P -
value
Lower Upper
Overall 338 5.27 ± 1.80 0.881a 0.768 1.009 0.068
A 106 5.37 ± 0.81 0.833u 0.460 1.511 0.548
B 33 2.20 ± 0.67 N.A N.A N.A N.A
C 34 4.14 ± 0.92 N.A N.A N.A N.A
D 22 4.50 ± 1.80 0.478u 0.232 0.987 0.046
E 143 6.09 ± 1.15 0.617ms
0.422 0.903 0.013
a = adjusted for age
BUN ± SD = mean BUN concentration in mmolL-1
± standard deviation
CI = confidence interval
n = sample size
N.A = not applicable ms
= adjusted for mass and sample day u = unadjusted
13
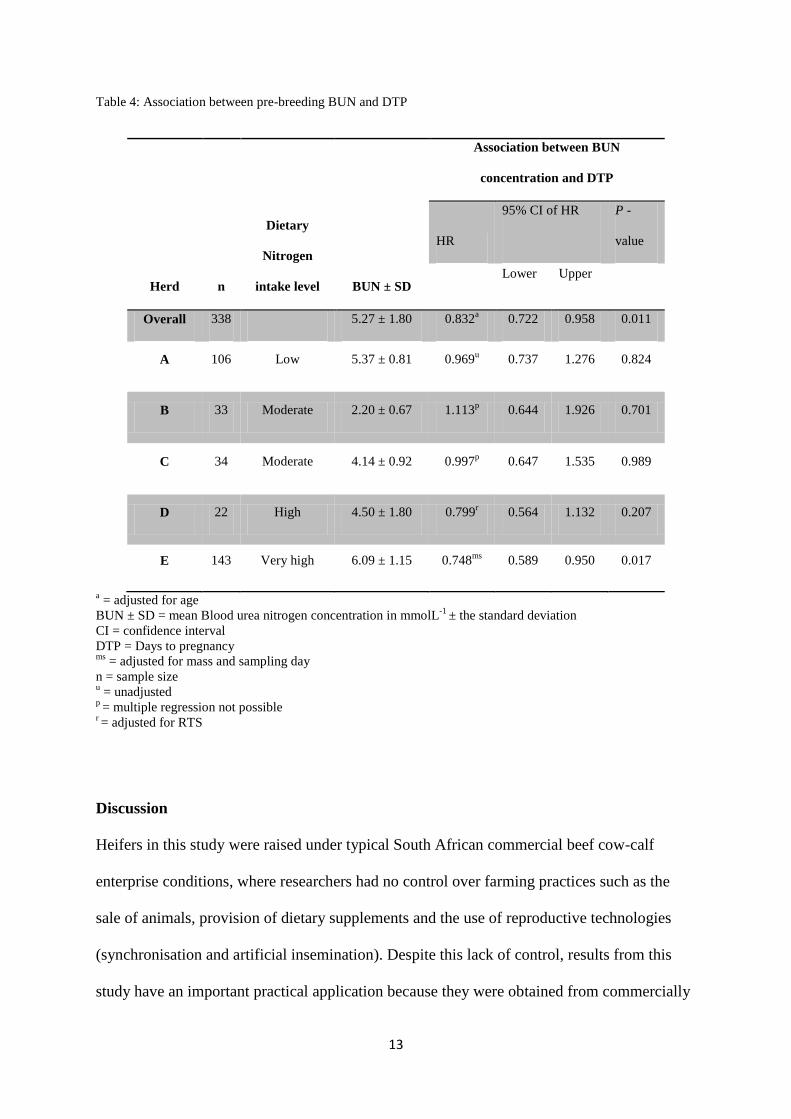
Table 4: Association between pre-breeding BUN and DTP
Herd n
Dietary
Nitrogen
intake level BUN ± SD
Association between BUN
concentration and DTP
HR
95% CI of HR
P -
value
Lower Upper
Overall 338 5.27 ± 1.80 0.832a 0.722 0.958 0.011
A 106 Low 5.37 ± 0.81 0.969u 0.737 1.276 0.824
B 33 Moderate 2.20 ± 0.67 1.113p 0.644 1.926 0.701
C 34 Moderate 4.14 ± 0.92 0.997p 0.647 1.535 0.989
D 22 High 4.50 ± 1.80 0.799r 0.564 1.132 0.207
E 143 Very high 6.09 ± 1.15 0.748ms
0.589 0.950 0.017
a = adjusted for age
BUN ± SD = mean Blood urea nitrogen concentration in mmolL-1
± the standard deviation
CI = confidence interval
DTP = Days to pregnancy ms
= adjusted for mass and sampling day
n = sample size u = unadjusted
p = multiple regression not possible
r = adjusted for RTS
Discussion
Heifers in this study were raised under typical South African commercial beef cow-calf
enterprise conditions, where researchers had no control over farming practices such as the
sale of animals, provision of dietary supplements and the use of reproductive technologies
(synchronisation and artificial insemination). Despite this lack of control, results from this
study have an important practical application because they were obtained from commercially

14
viable operations. Although many other variables are associated with pregnancy outcome
(Chenoweth, 2005), these variables were not evaluated during the study. An assumption was
made that such differences would be herd-level effects that could be adjusted by including
herd in the statistical models to account for unmeasured variables. Herd, was forced into all
models as a stratifying factor and other potential confounders were evaluated as main effects.
To the knowledge of the authors, none of these, except energy, have a direct interaction with
BUN in determining the pregnancy outcome.
BUN concentration was only determined once prior to the onset of the breeding season.
However, it is likely that BUN concentration in the heifers continued to vary during the
breeding season due to dietary and environmental changes. Nevertheless, since the
environmental changes are likely to have affected all heifers in the herd in a similar way, and
that urea concentration is genetically determined, it was assumed that those heifers that
initially had a higher BUN concentration remained high relative to the rest of the herd
throughout the breeding season. To the knowledge of the authors this hypothesis has not been
previously tested. Since all the heifers in each herd were sampled on the same day under
similar conditions (except for Herd E), it was therefore assumed that the measured BUN
concentration reflects the distribution of relative BUN concentration in that herd. Since Herd
E was sampled over 2 days, it was therefore necessary to force sampling day into all
regression models to account for potential confounding.
The pregnancy proportion for Herds A, D and E was lower than the benchmark for beef cow-
calf operations (> 90% pregnancy rate) with a 62-day breeding season (Chenoweth and
Sanderson, 2001). The reason for the lower pregnancy proportion in Herds A and E is not
clear, but is thought to be due to heifers in these herds being immature at the onset of the
breeding season and probably not cycling. The long DTP in these herds strengthens the
suspicion of immaturity at the onset of the breeding season. This is in agreement with the
15
work done by other researchers that have reported that heifers that mature fast and undergo a
few complete oestrous cycles before the breeding season tend to have better reproductive
performance (Yelich et al., 1996; Berry et al., 2003).
The 100% pregnancy proportion and relatively low DTP in Herds B and C was likely due to
the heifers being mature and cycling prior to the onset of the breeding season. However it is
important to note that Herd C utilized oestrus synchronisation and artificial insemination and
these procedures are known to improve pregnancy proportion and reduce DTP (Xu and
Burton, 1999).
Most authors advocate the use of pregnancy proportion and days to calving (DTC) as the
most appropriate measures of reproductive performance (Meyer et al., 1990; MacGregor and
Casey, 1999; Eler et al., 2002). In this study, DTP was used instead of DTC in order to
exclude abortions and variations in gestational length, which are not expected to be related to
BUN concentration.
It is the authors’ opinion that in a restricted breeding season, DTP will be a better measure of
reproductive performance than pregnancy proportion because if the breeding season had been
long enough, most heifers would eventually become pregnant and pregnancy proportion
alone would not differentiate heifers with good reproductive performance from those with
poor performance.
Assuming that cycling occurs randomly in heifers, except in herds where oestrous
synchronisation is practised, stage of the oestrous cycle when the breeding season
commenced would have affected DTP in individual animals. Stage of the oestrous cycle at
the onset of breeding was not known, however, because of the relatively large sample size, it
was assumed that this imprecision (random error) did not negate the usefulness of DTP.

16
Pre-breeding BUN concentration was significantly associated with DTP but not pregnancy
status in all herds combined. This suggests that high BUN concentration before the onset of
the breeding season negatively affected the chances of becoming pregnant only early during
the breeding season and that this effect was lost as the breeding season progressed. The first
possible explanation is that some animals adapted to the increased BUN concentration as
suggested by Calsamiglia et al. (2010). Alternatively, BUN levels may have decreased during
the course of the breeding season due to dietary changes. The latter option is highly possible
because rumen degradable protein supplementation was stopped in all herds at the beginning
of the breeding season. The results of this study are similar to those of Guo et al. (2004), who
showed that in among-herd analyses; MUN concentration had minimal effect on conception
rate but was associated with greater days open. Ferguson et al. (1993) also showed that within
dairy herds with mean MUN concentrations above 20 mg/dL, cows with higher MUN levels
were associated with poorer conception at first service, but not at subsequent services. The
short duration of the negative effects of high BUN concentration in these studies was
probably due to the fact that dairy cows are usually bred for the first time while they are still
adapting to lactational rations and experiencing high BUN concentrations (Jorritsma et al.,
2003).
It is thought that in dairy cattle, the negative effect of high BUN concentration might be
exerted through the exacerbation of an underlying negative energy balance (NEB) and the
energy costs of detoxifying large quantities of ammonia in post-partal cattle (Staples et al.,
1990; Garcia-Bojalil et al., 1998; Overton et al., 1999). However, it can be assumed that beef
heifers will not suffer from NEB as is the case in lactating dairy cattle. In this study, BCS was
used as an indicator of the animal’s energy reserves. This is widely supported in literature for
both beef and dairy cattle (Wildman et al., 1982; Edmonson et al., 1989; Houghton et al.,
1990). However, BCS has been shown to have lower accuracy in young growing cows

17
because growing animals tend to have less fat deposits (Nicholson and Butterworth, 1986).
The heifers in this study were at an optimum BCS (median = 5) with little variation within
and between herds. The lack of variation made it impossible to estimate the effect of BCS on
reproductive performance.
Variation in the genetic ability to utilise nitrogen has been well documented (Mitchell et al.,
2005; Bouwman et al., 2010; Hossein-Zadeh and Ardalan, 2011). It has been shown in dairy
cattle that animals with better nitrogen retaining abilities have lower BUN levels (Nousiainen
et al., 2004). However in an earlier review, Schoeman (1989) concluded that beef cattle with
better nitrogen utilising abilities had higher BUN levels. Although the exact reason for the
apparent lack of agreement in their conclusions is not known, it is hypothesised that the
relationship between BUN concentration and nitrogen retention in beef cattle that are on
natural grazing may be the opposite of what happens in dairy cattle due to the relatively lower
dietary nitrogen intake. This would be due to more efficient recirculation of nitrogen during
times of reduced dietary nitrogen intakes. The relationship of BUN and nitrogen utilisation
efficiency in beef cattle under different levels of nitrogen intake needs further investigation.
Feeding high levels of rumen degradable protein (RDP) is known to down-regulate the
efficiency of nitrogen recirculation (Marini and van Amburgh, 2003; Marini et al., 2004),
leading to higher BUN concentration and renal loss. If the above hypothesis is correct, then
beef heifers with better abilities to retain nitrogen within herds that were supplied with
potentially excessive levels of RDP might have lost their advantage and suffered more
negative consequences from the effects of high BUN concentrations. This suggests that
heifers with an improved ability to retain nitrogen within herds heavily supplemented with
RDP (in order to achieve faster growth) are at risk of being culled for poor fertility in a
restricted breeding system.
18
Conclusion
Blood urea nitrogen concentration prior to the start of breeding was independently associated
with reproductive performance of Bonsmara heifers, especially in herds where management
included supplementation of dietary nitrogen to achieve early breeding.
It is recommended that production systems designed to achieve early breeding in beef heifers
investigate whether oversupplying rumen degradable protein selects against animals with
relatively high levels of blood urea nitrogen.
Acknowledgements
The authors thank the participating farmers for providing the animals, facilities and farm
records, and the Faculty of Veterinary Science, University of Pretoria for financial support.
This research was performed under protocol number V072-810 as approved by the Animal
Ethics Committee of the University of Pretoria.
Conflict of Interest
Any opinion, finding and conclusion or recommendation is that of the authors. There were no
conflict of interests
References
Andersen, K.J., LeFever, D.G., Brinks, J.S. and Odde, K.G., 1991. The use of reproductive
tract scoring system in beef heifers, Agri-Practice, 12, 19-26
Berry, D.P., Buckley, F., Dillon, P., Evans, R.D., Rath, M. and Veerkamp, R.F., 2003.
Genetic Relationships among Body Condition Score, Body Weight, Milk Yield, and
Fertility in Dairy Cows, Journal of dairy science, 86, 2193-2204

19
Bierman, S., Erickson, G.E., Klopfenstein, T.J., Stock, R.A. and Shain, D.H., 1999.
Evaluation of nitrogen and organic matter balance in the feedlot as affected by level
and source of dietary fiber., Journal of animal science, 77, 1645-1653
Bouwman, A.C., Schopen, G.C.B., Bovenhuis, H., Visker, M.H.P.W. and van Arendonk,
J.A.M., 2010. Genome-wide scan to detect quantitative trait loci for milk urea nitrogen
in Dutch Holstein-Friesian cows, Journal of dairy science, 93, 3310-3319
Bransby, D.I., 1988. The Value of Veld and Pasture as an Animal Feed. In: N.M.
Tainton(ed), Veld and Pasture Management in South Africa, (Shuter & Shooter in
association with University of Natal Press, Pietermaritzburg), 175-214
Britt, J.H., 2008. Oocyte development in cattle: physiological and genetic aspects, Revista
Brasileira de Zootecnia, 37, 110-115
Calsamiglia, S., Ferret, A., Reynolds, C.K., Kristensen, N.B. and Vuuren, A.M.v., 2010.
Strategies for optimizing nitrogen use by ruminants., Animal, 4, 1184-1196
Carlsson, J. and Pehrson, B., 1993. The Relationships Between Seasonal Variations in the
Concentration of Urea in Bulk Milk and the Production and Fertility of Dairy Herds,
Journal of Veterinary Medicine Series A, 40, 205-212
Chase Jr., C.C., Larsen, R.E., Hammond, A.C. and Randel, R.D., 1993. Effect of dietary
energy on growth and reproductive characteristics of Angus and Senepol bulls during
summer in Florida, Theriogenology, 40, 43-61
Chenoweth, P.J. and Sanderson, M.W., 2001. Health and Production Management in Beef
Cattle Breeding Herds. In: L.L. Duncan(ed), Herd Health Food Animal Production
Medicine, (W.B. Saunders Company, New York, London), 530-531

20
Chenoweth, P.J., 2005. Cow-Calf Production Principles. In: P.J. Chenoweth and M.W.
Sanderson (eds), Beef Practice: Cow-calf production medicine, (Blackwell Publishing,
Amos, Iowa), 9-27
Dijkstra, J., Oenema, O. and Bannink, A., 2011. Dietary strategies to reducing N excretion
from cattle: implications for methane emissions, Current Opinion in Environmental
Sustainability, 3, 414-422
Edmonson, A.J., Lean, I.J., Weaver, L.D., Farver, T. and Webster, G., 1989. A Body
Condition Scoring Chart for Holstein Dairy Cows, Journal of dairy science, 72, 68-78
Eler, J.P., Silva, J.A.I.I.V., Ferraz, J.B.S., Dias, F., Oliveira, H.N., Evans, J.L. and Golden,
B.L., 2002. Genetic evaluation of the probability of pregnancy at 14 months for Nellore
heifers., Journal of animal science, 80, 951-954
Elrod, C.C. and Butler, W.R., 1993. Reduction of fertility and alteration of uterine pH in
heifers fed excess ruminally degradable protein, Journal of animal science, 71, 694-701
Erickson, G. and Klopfenstein, T., 2010. Nutritional and management methods to decrease
nitrogen losses from beef feedlots, Journal of animal science, 88, E172-E180
Ferguson, J.D., Galligan, D.T., Blanchard, T. and Reeves, M., 1993. Serum Urea Nitrogen
and Conception Rate: The Usefulness of Test Information, Journal of dairy science, 76,
3742-3746
Fosgate, G.T., 2009. Practical Sample Size Calculations for Surveillance and Diagnostic
Investigations, Journal of Veterinary Diagnostic Investigation, 21, 3-14
21
Garcia-Bojalil, C.M., Staples, C.R., Risco, C.A., Savio, J.D. and Thatcher, W.W., 1998.
Protein Degradability and Calcium Salts of Long-Chain Fatty Acids in the Diets of
Lactating Dairy Cows: Productive Responses, Journal of dairy science, 81, 1374-1384
Godden, S.M., Lissemore, K.D., Kelton, D.F., Leslie, K.E., Walton, J.S. and Lumsden, J.H.,
2001. Factors Associated with Milk Urea Concentrations in Ontario Dairy Cows,
Journal of dairy science, 84, 107-114
Guo, K., Russek-Cohen, E., A.Varner, M. and Kohn, R.A., 2004. Effects of Milk Urea
Nitrogen and Other Factors on Probability of Conception of Dairy Cows, Journal of
dairy science, 87, 1878-1885
Hossein-Zadeh, N.G. and Ardalan, M., 2011. Estimation of genetic parameters for milk urea
nitrogen and its relationship with milk constituents in Iranian Holsteins, Livestock
Science, 135, 274-281
Houghton, P.L., Lemenager, R.P., Moss, G.E. and Hendrix, K.S., 1990. Prediction of
Postpartum Beef Cow Body Composition Using Weight to Height Ratio and Visual
Body Condition Score., Journal of animal science, 68, 1428-1437
Irons, P.C., Nöthling, J.O. and Bertschinger, H.J., 2007. Bull breeding soundness evaluation
in Southern Africa, Theriogenology, 68, 842-847
Jorritsma, R., Wensing, T., Theo, A.M.K., Peter, L.A.M.V. and Jos, P.T.M.N., 2003.
Metabolic changes in early lactation and impaired reproductive performance in dairy
cows, Vet.Res., 34, 11-26
22
Kauffman, A.J. and St-Pierre, N.R., 2001. The Relationship of Milk Urea Nitrogen to Urine
Nitrogen Excretion in Holstein and Jersey Cows, Journal of dairy science, 84, 2284-
2294
Kohn, R.A., Dinneen, M.M. and Russek-Cohen, E., 2005. Using blood urea nitrogen to
predict nitrogen excretion and efficiency of nitrogen utilization in cattle, sheep, goats,
horses, pigs, and rats, Journal of animal science, 83, 879-889
MacGregor, R.G. and Casey, N.H., 1999. Evaluation of calving interval and calving date as
measures of reproductive performance in a beef herd, Livestock Production Science,
57, 181-191
Marini, J.C., Klein, J.D., Sands, J.M. and van Amburgh, M.E., 2004. Effect of nitrogen intake
on nitrogen recycling and urea transporter abundance in lambs., Journal of animal
science, 82, 1157-1164
Marini, J.C. and van Amburgh, M.E., 2003. Nitrogen metabolism and recycling in Holstein
heifers, Journal of animal science, 81, 545-552
Marston, T. T. 2005. Beef cowherd nutrition and management. In: Chenoweth, P. J., M. W.
Sanderson (Eds). Beef practice; Cow-calf production medicine: 89 – 108 Blackwell
Publishing, Ames, Iowa.
Meyer, K., Hammond, K., Parnell, P.F., MacKinnon, M.J. and Sivarajasingam, S., 1990.
Estimates of heritability and repeatability for reproductive traits in Australian beef
cattle., Livestock Production Science, 25, 15-30
Mitchell, R.G., Rogers, G.W., Dechow, C.D., Vallimont, J.E., Cooper, J.B., Sander-Nielsen,
U. and Clay, J.S., 2005. Milk Urea Nitrogen Concentration: Heritability and Genetic

23
Correlations with Reproductive Performance and Disease, Journal of dairy science, 88,
4434-4440
Muscher, A.S., Schröder, B., Breves, G. and Huber, K., 2010. Dietary nitrogen reduction
enhances urea transport across goat rumen epithelium, Journal of animal science, 88,
3390-3398
Ndlovu, T., Chimonyo, M., Okoh, A.I., Muchenje, V., Dzama, K. and Raats, J.G., 2007.
Assessing the nutritional status of beef cattle: current practices and future prospects,
African Journal of Biotechnology, 6, 2727-2734
Nicholson, M.J. and Butterworth, M.H., 1986. A Guide to Condition Scoring of Zebu Cattle,
(International Livestock Centre for Africa, Addis Ababa, Ethiopia)
Nousiainen, J., Shingfield, K.J. and Huhtanen, P., 2004. Evaluation of Milk Urea Nitrogen as
a Diagnostic of Protein Feeding, Journal of dairy science, 87, 386-398
Overton, T.R., Drackley, J.K., Ottemann-Abbamonte, C.J., Beaulieu, A.D., Emmert, L.S. and
Clark, J.H., 1999. Substrate utilization for hepatic gluconeogenesis is altered by
increased glucose demand in ruminants., Journal of animal science, 77, 1940-1951
Rajala-Schultz, P.J. and Saville, W.J.A., 2003. Sources of Variation in Milk Urea Nitrogen in
Ohio Dairy Herds, Journal of dairy science, 86, 1653-1661
Romano, J.E., Thompson, J.A., Forrest, D.W., Westhusin, M.E., Tomaszweski, M.A. and
Kraemer, D.C., 2006. Early pregnancy diagnosis by transrectal ultrasonography in dairy
cattle, Theriogenology, 66, 1034-1041

24
Schoeman, S.J., 1989. Recent research into the production potential of indigenous cattle with
special reference to the Sanga, South African Journal of Animal Science, 19, 55-61
Sheldon, M. and Noakes, D., 2002. Pregnancy diagnosis in cattle, In practice, 24, 310-317
Staples, C.R., Thatcher, W.W. and Clark, J.H., 1990. Relationship Between Ovarian Activity
and Energy Status During the Early Postpartum Period of High Producing Dairy
Cows1,2, Journal of dairy science, 73, 938-947
Stoop, W.M., Bovenhuis, H. and van Arendonk, J.A.M., 2007. Genetic Parameters for Milk
Urea Nitrogen in Relation to Milk Production Traits, Journal of dairy science, 90, 1981-
1986
Wildman, E.E., Jones, G.M., Wagner, P.E., Boman, R.L., Troutt Jr., H.F. and Lesch, T.N.,
1982. A Dairy Cow Body Condition Scoring System and Its Relationship to Selected
Production Characteristics, Journal of dairy science, 65, 495-501
Xu, Z.Z. and Burton, L.J., 1999. Effects of oestrus synchronisation and fixed-time artificial
insemination on the reproductive performance of dairy heifers, New Zealand veterinary
journal, 47, 101-104
Yelich, J.V., Wettemann, R.P., Marston, T.T. and Spicer, L.J., 1996. Luteinizing hormone,
growth hormone, insulin-like growth factor-I, insulin and metabolites before puberty in
heifers fed to gain at two rates, Domestic animal endocrinology JID - 8505191, 13,
325-328
Youngquist, R.S., 2007. Pregnancy Diagnosis. In: Anonymous Current Therapy in Large
Animal Theriogenology (Second Edition), (W.B. Saunders, Saint Louis), 294-303
Related Documents