PORTLAND PUBLIC SCHOOLS ENROLLMENT FORECASTS 2018-19 to 2032-33 Based on October 2017 Enrollments AUGUST 2018 Population Research Center PRC PRC PRC Population Research Center PRC PRC PRC Population Research Center PRC PRC PRC PRC PRC PRC

Welcome message from author
This document is posted to help you gain knowledge. Please leave a comment to let me know what you think about it! Share it to your friends and learn new things together.
Transcript

PORTLAND PUBLIC SCHOOLS
ENROLLMENT FORECASTS
2018-19 to 2032-33
Based on October 2017 Enrollments
AUGUST 2018
Population ResearchCenter
PRCPRCPRCPopulation ResearchCenter
PRCPRCPRCPopulation ResearchCenter
PRCPRCPRCPRCPRCPRC


PORTLAND PUBLIC SCHOOLS
ENROLLMENT FORECASTS
2018-19 TO 2032-33
Based on October 2017 Enrollments
AUGUST 2018
Project Staff:
Charles Rynerson, Research Associate
Joshua Ollinger, Graduate Research Assistant
Population ResearchCenter
PRCPRCPRCPopulation ResearchCenter
PRCPRCPRCPopulation ResearchCenter
PRCPRCPRCPRCPRCPRC

CONTENTS
EXECUTIVE SUMMARY ..................................................................................................................... 1
Population and Housing Trends .................................................................................................. 1
Enrollment Trends ....................................................................................................................... 2
Enrollment Forecasts .................................................................................................................. 2
INTRODUCTION ............................................................................................................................... 7
POPULATION AND HOUSING TRENDS ............................................................................................. 9
Population by Age Group ............................................................................................................ 9
Births ......................................................................................................................................... 10
Housing Growth ........................................................................................................................ 14
ENROLLMENT TRENDS ................................................................................................................... 19
District Capture Rate ................................................................................................................. 21
Enrollment Trends by Place of Residence ................................................................................. 23
ENROLLMENT FORECASTS ............................................................................................................. 27
Forecast Process ....................................................................................................................... 27
District‐wide Population and Enrollment Forecasts: Methodology......................................... 27
District‐wide Population and Enrollment Forecasts: Results .................................................... 30
Resident Enrollment Forecasts by High School Cluster: Methodology .................................... 36
Resident Enrollment Forecasts by High School Cluster: Results ............................................... 36
Resident Enrollment Forecasts by Attendance Area: Methodology ........................................ 37
Resident Enrollment Forecasts by Attendance Area: Results .................................................. 38
Enrollment Forecasts for Individual Schools: Methodology .................................................... 38
Enrollment Forecasts for Individual Schools: Results .............................................................. 39
FORECAST ACCURACY .................................................................................................................... 41
APPENDIX A: DISTRICT‐WIDE ENROLLMENT FORECASTS, 2018‐19 to 2032‐33………………………………..
APPENDIX B: ENROLLMENT FORECASTS BY AREA OF RESIDENCE, 2018‐19 to 2032‐33……………………
APPENDIX C: ENROLLMENT FORECASTS BY SCHOOL, 2018‐19 to 2032‐33…………………………….………..
APPENDIX D: ELEMENTARY SCHOOL ATTENDANCE AREAS BY HIGH SCHOOL CLUSTER……………………
APPENDIX E: POPULATION, HOUSING, SOCIAL AND ECONOMIC PROFILE……………………………………….
TABLES, CHARTS, AND FIGURES
Table 1. PPS District‐wide K‐12 Enrollment Forecasts…………………………………………………………....….4
Table 2. Births by High School Cluster………………………………………………………………………………………12
Table 3. Housing Units Permitted by High School Cluster, 2000 to 2017………………………….……….15
Table 4. Affordable Multi‐Family Homes Under Development, June 2018…………..………….……….18
Table 5. PPS, Historic K‐12 Enrollment, 2007‐08 to 2017‐18…………………………………………………….20
Table 6. Estimated PPS Capture Rates, 1999‐2000 and 2009‐2010…………………………………………..21
Table 7. School Enrollment by Type of School, 2006‐10 and 2012‐16………….……………………………22
Table 8. PPS Historic Enrollment by Grade Level and High School Cluster of Residence………24‐25
Table 9. PPS District‐wide Forecasts by Grade Level……………………………….…………………...………..….35
Table 10. PPS Forecast K‐12 Enrollment by High School Cluster of Residence……………………...….37
Table 11. District‐wide Forecast Accuracy………………………………….…….………………………………....….42
Table 12. Forecast Accuracy by Grade Level…..………………….………………………....…………………....….43
Chart 1. PPS District‐wide K‐12 Enrollment Forecasts..……………………………………………….…...….…....4
Chart 2. PPS District‐wide K‐5 Enrollment Forecasts..…………………………………..…………….…...….…....5
Chart 3. PPS District‐wide 6‐8 Enrollment Forecasts..………………..……………………………….…...….…....5
Chart 4. PPS District‐wide 9‐12 Enrollment Forecasts..……………………………………………….…...….…....6
Chart 5. Population by Age Group, PPS, 1990, 2000, and 2010………………………………....………..…..10
Chart 6. Age‐Specific Fertility Rates, 1990, 2000, and 2010, Residents of PPS………………………..11
Chart 7. Annual Births to PPS Residents, 2000 to 2016………………………………..………....………..…....12
Chart 8. Median Age of Mother at Birth of Child, by Place of Residence………...................………..14
Chart 9. Housing Units Authorized in PPS by City of Portland………………..……….................………..16
Chart 10. Birth Cohorts and Kindergarten Enrollment, Historic and Middle Series Forecast….…...30
Chart 11. Kindergarten Enrollment Scenarios, Historic and Forecast…..…………….……………………….31
Chart 12. Population Change due to Net Migration, by Age Group, 2000 to 2020…………….....….32
Chart 13. Total Population, PPS District, 1970 to 2030…………………………………….……………………….33
EXECUTIVE SUMMARY
This report presents the results of a demographic study conducted by the Portland State
University Population Research Center (PRC) for Portland Public Schools (PPS). The study includes
analysis of population, housing and enrollment trends affecting the District in recent years,
estimates of the number of PPS students by housing type, and annual forecasts of enrollment for
a 15 year horizon, from 2018‐19 to 2032‐33. Enrollment forecasts were prepared under high,
middle, and low scenarios for the District. Forecasts for attendance areas by place of residence
and for individual schools are consistent with the middle district‐wide forecast.
Population and Housing Trends
Between 2000 and 2010, population within PPS grew by about 34,100, from 426,110
persons to 460,248. Population growth under the three forecast scenarios ranges from
46,700 to 55,200 between 2010 and 2020, followed by growth ranging from 36,900 to
59,100 between 2020 and 2030.
The young adult population age 20 to 34 grew by about 14,000 (12 percent) between
2000 and 2010, but annual births to District residents changed very little during the
decade, as fertility rates fell among women under age 30. The number of births has fallen
more than 10 percent since a 2008 peak; the 2016 birth total was the lowest since the
1980s.
In the most recent three years, 2015, 2016, and 2017, permits were issued for over 2,700
new single family homes and about 15,000 units in multiple family developments within
PPS.
Unit types most likely to be home to PPS students include single family homes and
affordable multi‐bedroom apartments. However, most new housing within PPS is in
market‐rate rental units, including many studio and one bedroom units.
New affordable housing projects scheduled for occupancy between 2018 and 2020 within
PPS include over 600 family‐size units of two or more bedrooms.
2
Enrollment Trends
In fall 2017, Portland Public Schools (PPS) enrolled 48,684 students in grades K‐12, an
increase of 375 students from fall 2016.
For the nine year period since 2008‐09, PPS K‐12 enrollment has grown by 3,660 students
(eight percent).
After 10 consecutive years of annual elementary (K‐5th) enrollment growth between fall
2006 and fall 2016, the district‐wide K‐5th grade total declined by 148 students (0.6
percent) in fall 2017.
The drop in K‐5 enrollment is due to successively smaller incoming kindergarten classes
in each of the five years since their 2012‐13 peak. Fall 2017 kindergarten enrollment was
the smallest since 2007‐08, and was 329 students lower than in 2012‐13.
Enrollment in middle grades (6th‐8th) reached a new peak in fall 2017. The enrollment of
10,780 in grades 6‐8 was 84 students (0.8 percent) greater than enrollment in fall 2016,
and was the largest in 14 years.
Enrollment in high school grades (9th‐12th) has grown in each of the four years between
fall 2013 and fall 2017, adding 577 students. Most of that growth occurred between fall
2016 and fall 2017, when grades 9‐12 added 439 students (3.4 percent), reaching a total
of 13,423, the largest in 10 years.
The Cleveland, Grant, Lincoln, and Wilson high school clusters (HSCLs) gained PPS
residents at every school level (elementary, middle, and high) during the five year period
between 2012‐13 and 2017‐18, while the Madison and Roosevelt HSCLs lost students at
every level.
Enrollment Forecasts
For the district‐wide forecast, three scenarios of population and enrollment changes were
developed: a most‐likely, or middle, scenario; a scenario for lower growth; and a higher growth
scenario. All three of the scenarios for the PPS district‐wide enrollment forecasts use similar
mortality, fertility, and kindergarten and first grade “capture” rates during the 15 year horizon.
3
The differences between the three scenarios are primarily due to different assumptions about the
levels of net migration (the net movement into and out of the District) of the District’s population.
In the middle scenario, K‐12 enrollment increases by an average of 434 students annually
during the first three years until 2020‐21, and an average of 186 students annually over
the remainder of the 15 year forecast horizon, reaching 52,222 in 2032‐33.
Elementary enrollment declines by 574 students during the first five years of the middle
scenario forecast, as incoming kindergarten classes remain close to or slightly below
recent levels due to the local, state, and national birth downturn.
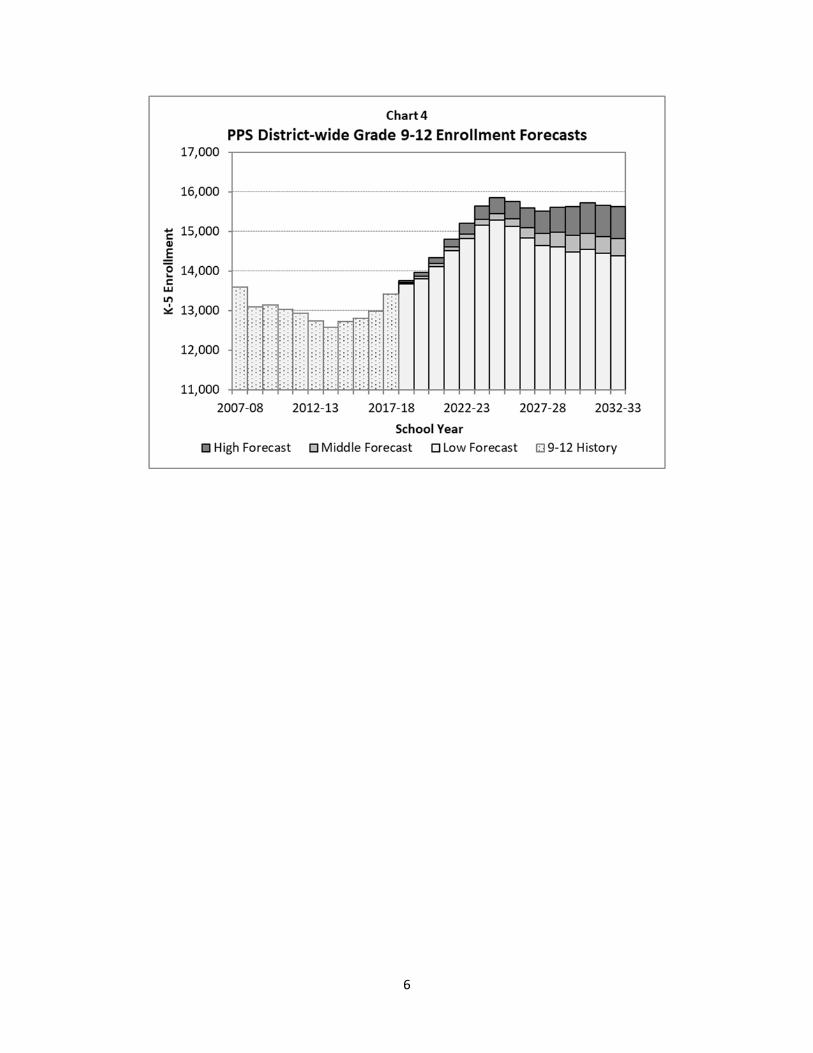
Middle school and high school enrollments grow initially under the middle scenario,
reflecting larger cohorts attributable to the elementary growth that began in 2007. High
school enrollments peak in 2024‐25 with about 2,000 more students than in 2017‐18
In the low scenario, K‐12 enrollment growth averages 118 students annually, reaching
50,450 in 2032‐33.
Elementary enrollment declines during the first five years of the low scenario forecast,
amounting to a loss of about 1,000 K‐5th grade students; secondary enrollments increase
initially followed by decline beginning in 2021‐22 for middle grades and 2025‐26 for high
school.
In the high scenario, K‐12 enrollment growth averages 389 students annually, reaching
54,514 in 2032‐33.
K‐12 growth in the first five years between 2017‐18 and 2022‐23 exceeds the most recent
five years since 2012‐13, in spite of a small loss of about 100 students in elementary
grades.
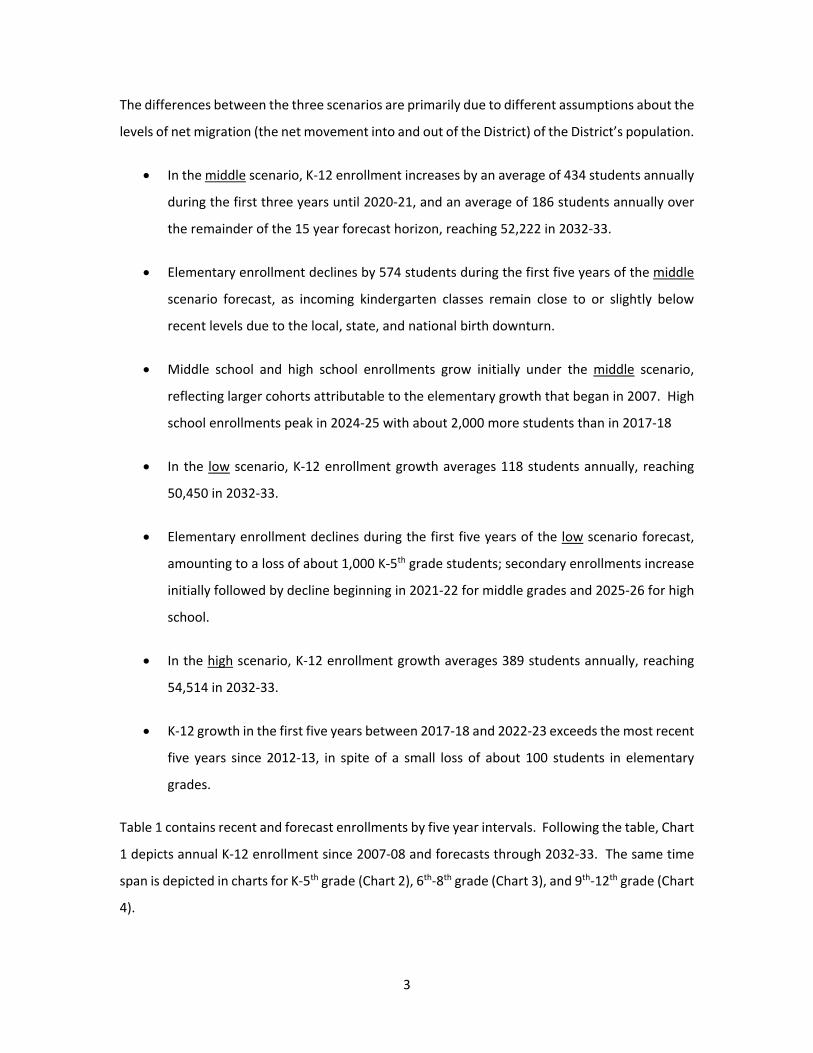
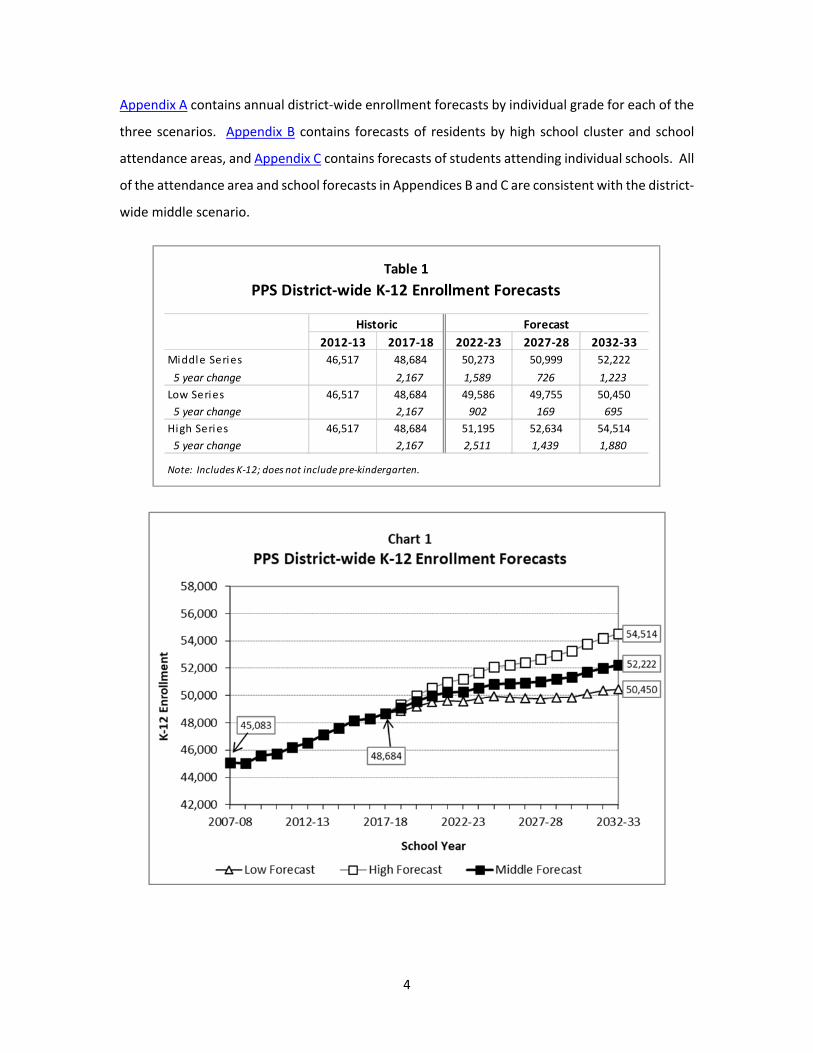
Table 1 contains recent and forecast enrollments by five year intervals. Following the table, Chart
1 depicts annual K‐12 enrollment since 2007‐08 and forecasts through 2032‐33. The same time
span is depicted in charts for K‐5th grade (Chart 2), 6th‐8th grade (Chart 3), and 9th‐12th grade (Chart
4).
4
Appendix A contains annual district‐wide enrollment forecasts by individual grade for each of the
three scenarios. Appendix B contains forecasts of residents by high school cluster and school
attendance areas, and Appendix C contains forecasts of students attending individual schools. All
of the attendance area and school forecasts in Appendices B and C are consistent with the district‐
wide middle scenario.
Table 1
PPS District‐wide K‐12 Enrollment Forecasts
Historic Forecast
2012‐13 2017‐18 2022‐23 2027‐28 2032‐33
Middle Series 46,517 48,684 50,273 50,999 52,222
5 year change 2,167 1,589 726 1,223
Low Series 46,517 48,684 49,586 49,755 50,450
5 year change 2,167 902 169 695
High Series 46,517 48,684 51,195 52,634 54,514
5 year change 2,167 2,511 1,439 1,880
Note: Includes K‐12; does not include pre‐kindergarten.

5
6
7
INTRODUCTION
The Population Research Center (PRC) at Portland State University has prepared enrollment
forecasts for Portland Public Schools (PPS) in each of the past 19 years. This new study updates
the previous long‐range forecasts for the District, its attendance areas, and individual schools.
The appendices of this report contain annual forecasts of district‐wide enrollment by grade level,
PPS students by attendance area of residence, and enrollment at individual schools for the 2018‐
19 to 2032‐33 school years.
Primary data sources used to prepare these forecasts include historic PPS enrollments through
2017‐18, U.S. Census Bureau 2000 and 2010 Decennial Censuses and 2012 to 2016 American
Community Survey, birth data from the Oregon Center for Health Statistics, and housing
development information from the City of Portland and Metro.
The forecast process is geographically top‐down, divided into four stages:
District‐wide forecasts by grade level are prepared using a cohort‐component model,
described in the “Enrollment Forecasts” section of this report. A middle scenario,
considered the most likely scenario consistent with long term demographic trends and
expected population growth, is prepared first. Migration levels are adjusted to produce
alternative high and low scenarios for the District. All three scenarios use the same
fertility rates and long run kindergarten and 1st grade capture rates (ratios of PPS
enrollment to total residents).
Second, forecasts of PPS students by grade level residing in each high school cluster (HSCL)
are prepared and controlled to the district‐wide middle growth forecast.
Third, forecasts of PPS students by grade level residing within elementary, middle, and
high school attendance areas are prepared within each cluster, with attendance area
resident forecasts controlled to the HSCL forecasts. This step includes forecasts of
residents and non‐residents attending each neighborhood school.
8
The fourth step is to prepare enrollment forecasts for schools that have no attendance
area. The largest of the district‐run non‐neighborhood schools are forecast individually,
while alternative programs, community based programs, special services, and charter
schools are grouped into an “other schools and programs” category.
The District serves most of the City of Portland and small portions of the cities of Lake Oswego
and Beaverton and unincorporated Multnomah and Washington Counties. According to the 2010
Census, the population for PPS was 460,248. Among the 460,248 PPS residents, there were
451,258 City of Portland residents (representing 77 percent of the City total), 2,413 Lake Oswego
residents, 1,453 Beaverton residents, and 5,124 unincorporated area residents.
Following this introduction are sections presenting recent population, housing, and enrollment
trends within the District. Next are summaries of the district‐wide enrollment forecasts and
individual school forecasts, and descriptions of the methodologies used to produce them. The
final section contains a brief discussion of the nature and accuracy of forecasts, and appendices
contain tables showing A) annual district‐wide enrollment forecasts by grade, B) annual
enrollment forecasts by area of residence and grade level (K‐2, 3‐5, 6‐8, 9‐12), C) annual
enrollment forecasts by individual school, D) neighborhood elementary school attendance areas
listed by high school cluster, and E) selected population, housing, social, and economic estimates
from the Census Bureau’s American Community Survey.
9
POPULATION AND HOUSING TRENDS
During the decade between 2000 and 2010, population within PPS grew by about 34,000, from
426,110 persons to 460,248. Growth has accelerated in the current decade; it is estimated that
the District added more than 40,000 residents between 2010 and 20161. While the District’s
average annual growth rate (AAGR) of 0.8 percent between 2000 and 2010 fell below the metro
area’s 1.4 percent AAGR, the District’s 1.3 percent AAGR between 2010 and 2016 was similar to
the metro area rate.
Population by Age Group
Although the District’s population grew in both the 1990s and 2000s, population change by age
group has varied widely. Losses for ages under five and five to nine between 1990 and 2000 are
consistent with the elementary enrollment losses of the late 1990s and early 2000s, while the
growth of the under age five population between 2000 and 2010 corresponds to current
elementary enrollment growth. The young adult population grew in both decades, with the
largest growth between 1990 and 2000 among residents age 25 to 29 and the largest growth
between 2000 and 2010 among residents age 30 to 34.
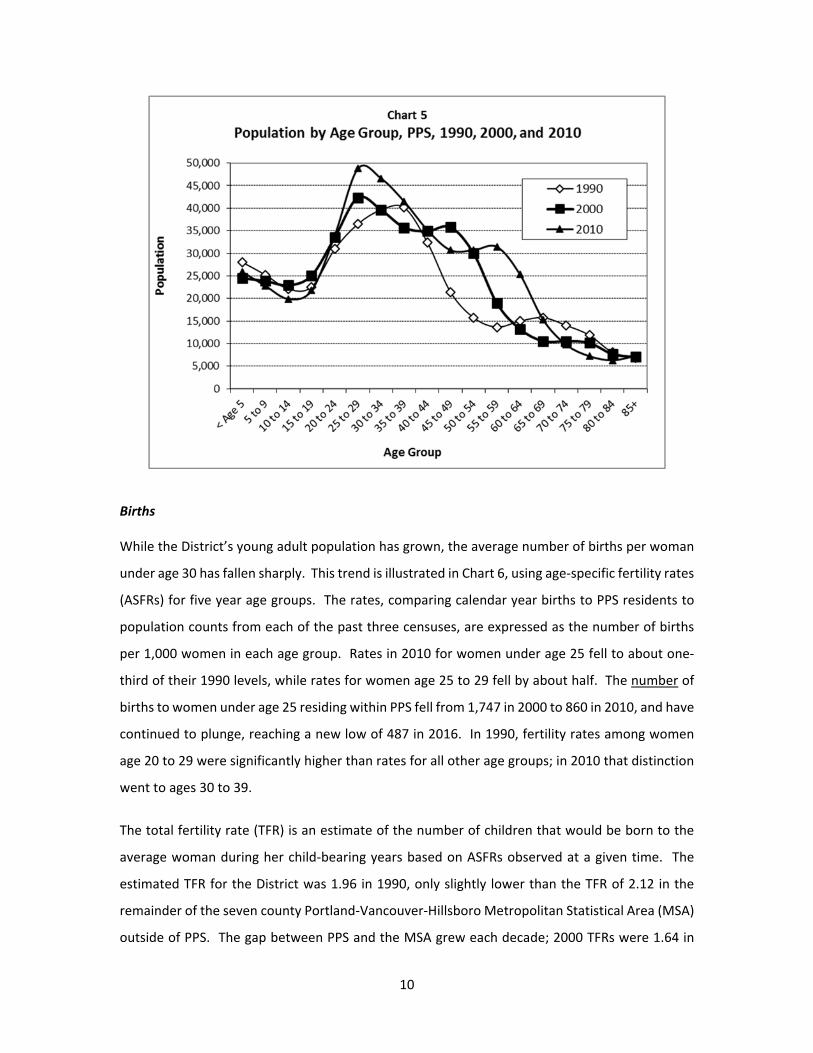
Chart 5 illustrates the growth of the young adult population. In 2000, 25 to 34 year‐olds
constituted the two largest age groups, with a population of about 82,000 accounting for nearly
18 percent of the District’s total population. By 2010 the 95,000 PPS residents age 25 to 34
accounted for nearly 21 percent of the District’s total population. The chart also shows the aging
of the baby boom generation; the District’s largest population in 1990 was age 35 to 39. That
same cohort born in the early 1950s shows up in subsequent peaks of age 45 to 49 in 2000 and
age 55 to 59 in 2010.
1 The Census Bureau’s Small Area Income and Poverty Estimates include a 2016 population estimate of
500,445 for Portland Public Schools. Retrieved at https://www.census.gov/programs‐surveys/saipe.html.
10
Births
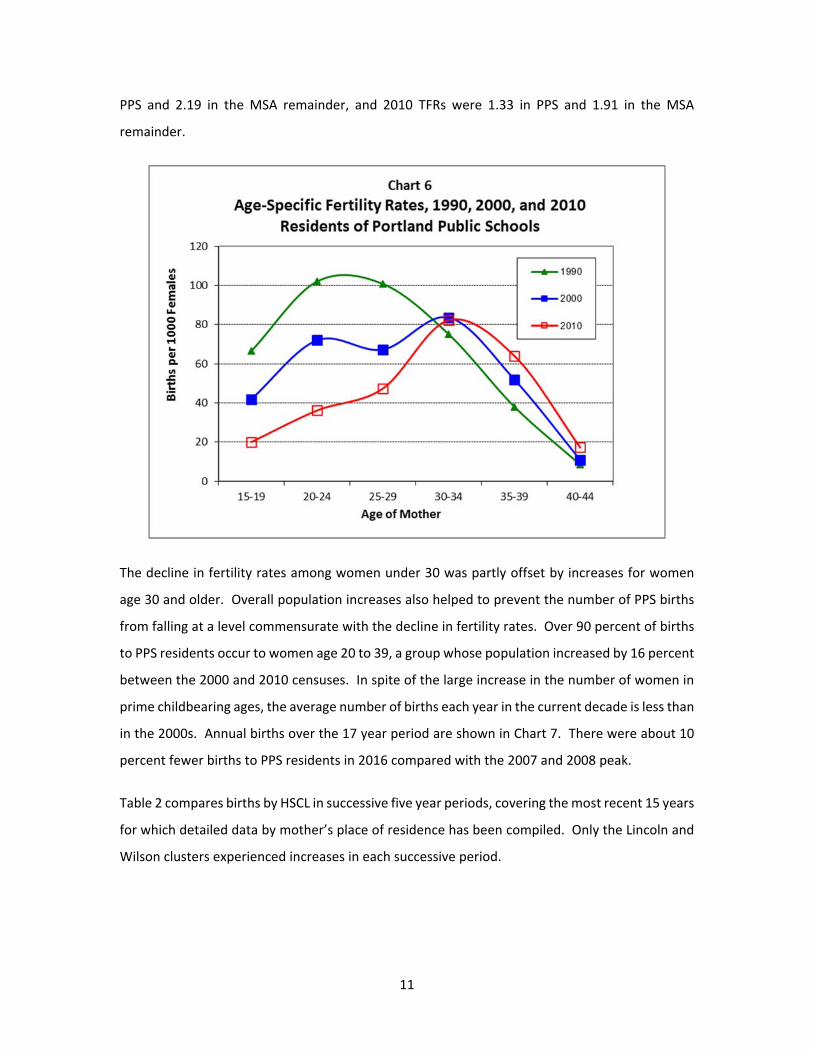
While the District’s young adult population has grown, the average number of births per woman
under age 30 has fallen sharply. This trend is illustrated in Chart 6, using age‐specific fertility rates
(ASFRs) for five year age groups. The rates, comparing calendar year births to PPS residents to
population counts from each of the past three censuses, are expressed as the number of births
per 1,000 women in each age group. Rates in 2010 for women under age 25 fell to about one‐
third of their 1990 levels, while rates for women age 25 to 29 fell by about half. The number of
births to women under age 25 residing within PPS fell from 1,747 in 2000 to 860 in 2010, and have
continued to plunge, reaching a new low of 487 in 2016. In 1990, fertility rates among women
age 20 to 29 were significantly higher than rates for all other age groups; in 2010 that distinction
went to ages 30 to 39.
The total fertility rate (TFR) is an estimate of the number of children that would be born to the
average woman during her child‐bearing years based on ASFRs observed at a given time. The
estimated TFR for the District was 1.96 in 1990, only slightly lower than the TFR of 2.12 in the
remainder of the seven county Portland‐Vancouver‐Hillsboro Metropolitan Statistical Area (MSA)
outside of PPS. The gap between PPS and the MSA grew each decade; 2000 TFRs were 1.64 in
11
PPS and 2.19 in the MSA remainder, and 2010 TFRs were 1.33 in PPS and 1.91 in the MSA
remainder.
The decline in fertility rates among women under 30 was partly offset by increases for women
age 30 and older. Overall population increases also helped to prevent the number of PPS births
from falling at a level commensurate with the decline in fertility rates. Over 90 percent of births
to PPS residents occur to women age 20 to 39, a group whose population increased by 16 percent
between the 2000 and 2010 censuses. In spite of the large increase in the number of women in
prime childbearing ages, the average number of births each year in the current decade is less than
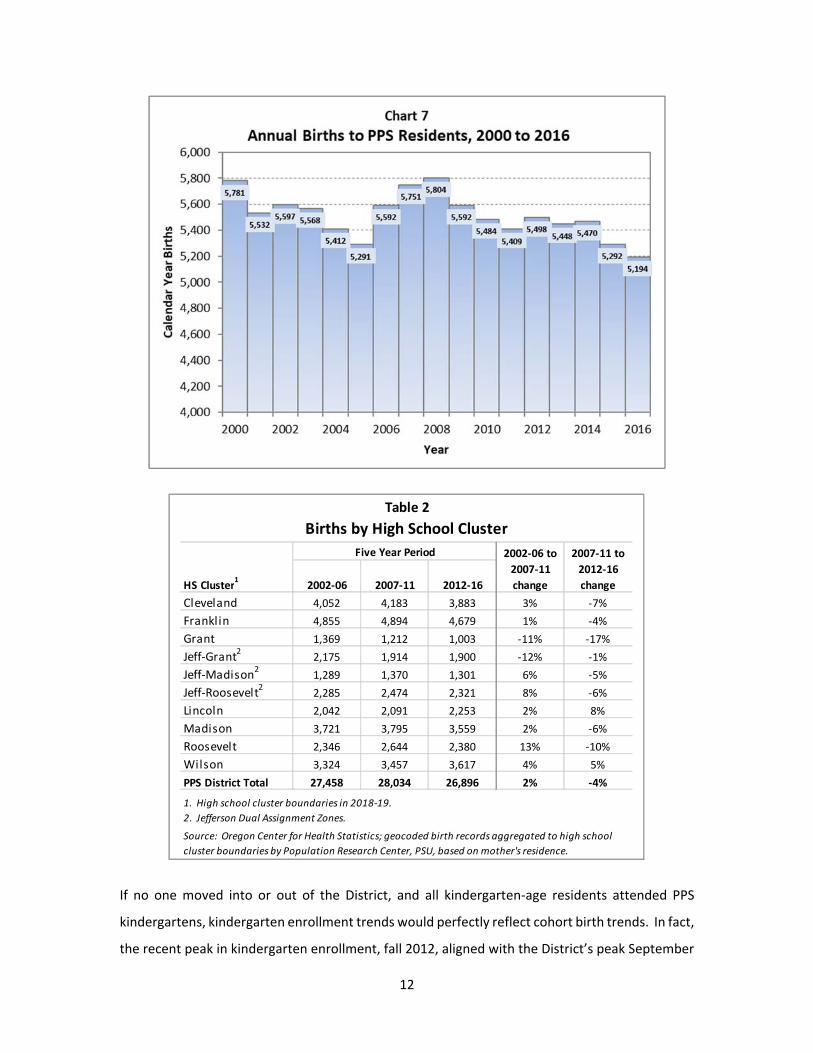
in the 2000s. Annual births over the 17 year period are shown in Chart 7. There were about 10
percent fewer births to PPS residents in 2016 compared with the 2007 and 2008 peak.
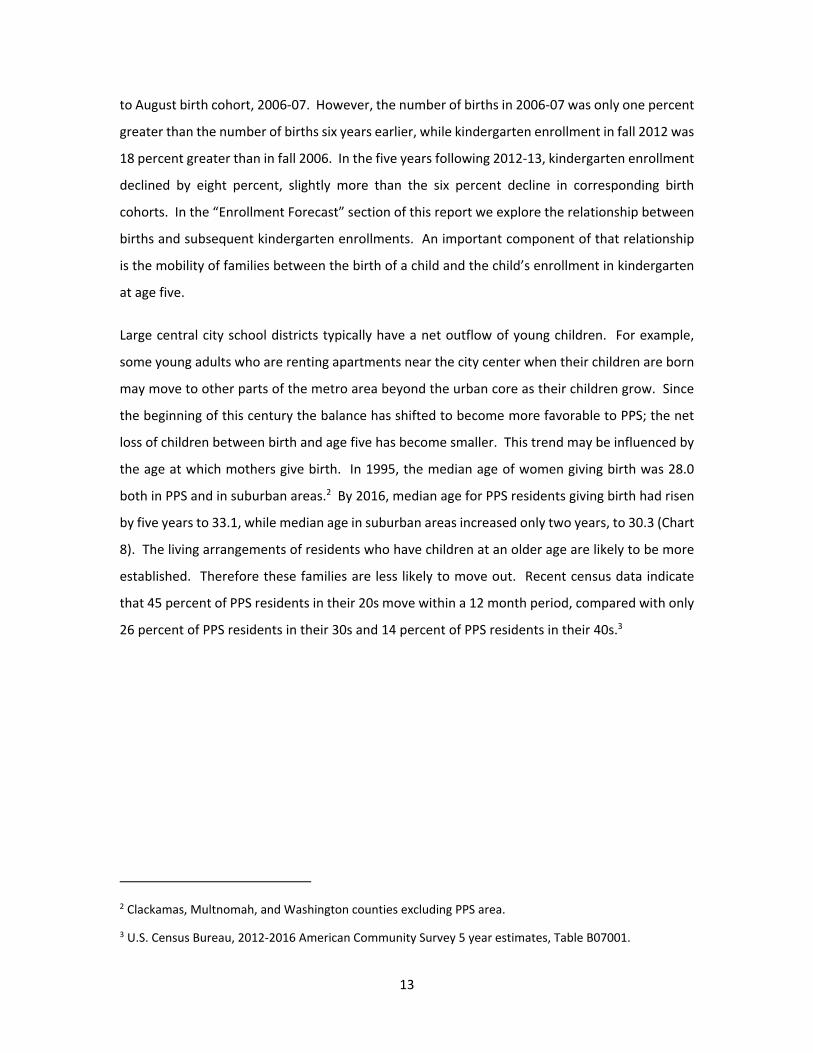
Table 2 compares births by HSCL in successive five year periods, covering the most recent 15 years
for which detailed data by mother’s place of residence has been compiled. Only the Lincoln and
Wilson clusters experienced increases in each successive period.
12
If no one moved into or out of the District, and all kindergarten‐age residents attended PPS
kindergartens, kindergarten enrollment trends would perfectly reflect cohort birth trends. In fact,
the recent peak in kindergarten enrollment, fall 2012, aligned with the District’s peak September
Five Year Period
HS Cluster1
2002‐06 2007‐11 2012‐16
Cleveland 4,052 4,183 3,883 3% ‐7%
Franklin 4,855 4,894 4,679 1% ‐4%
Grant 1,369 1,212 1,003 ‐11% ‐17%
Jeff‐Grant2
2,175 1,914 1,900 ‐12% ‐1%
Jeff‐Madison2
1,289 1,370 1,301 6% ‐5%
Jeff‐Roosevelt2
2,285 2,474 2,321 8% ‐6%
Lincoln 2,042 2,091 2,253 2% 8%
Madison 3,721 3,795 3,559 2% ‐6%
Roosevelt 2,346 2,644 2,380 13% ‐10%
Wilson 3,324 3,457 3,617 4% 5%
PPS District Total 27,458 28,034 26,896 2% ‐4%
1. High school cluster boundaries in 2018‐19.
Source: Oregon Center for Health Statistics; geocoded birth records aggregated to high school
cluster boundaries by Population Research Center, PSU, based on mother's residence.
Table 2
Births by High School Cluster
2002‐06 to
2007‐11
change
2007‐11 to
2012‐16
change
2. Jefferson Dual Assignment Zones.
13
to August birth cohort, 2006‐07. However, the number of births in 2006‐07 was only one percent
greater than the number of births six years earlier, while kindergarten enrollment in fall 2012 was
18 percent greater than in fall 2006. In the five years following 2012‐13, kindergarten enrollment
declined by eight percent, slightly more than the six percent decline in corresponding birth
cohorts. In the “Enrollment Forecast” section of this report we explore the relationship between
births and subsequent kindergarten enrollments. An important component of that relationship
is the mobility of families between the birth of a child and the child’s enrollment in kindergarten
at age five.
Large central city school districts typically have a net outflow of young children. For example,
some young adults who are renting apartments near the city center when their children are born
may move to other parts of the metro area beyond the urban core as their children grow. Since
the beginning of this century the balance has shifted to become more favorable to PPS; the net
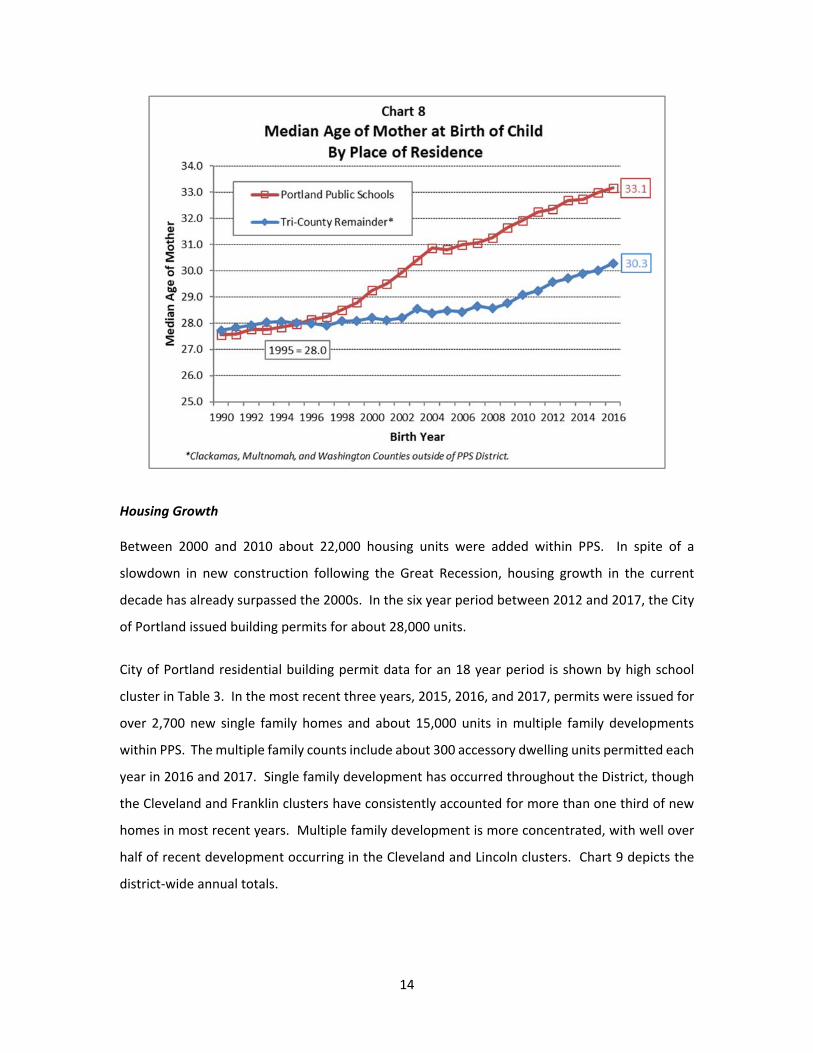
loss of children between birth and age five has become smaller. This trend may be influenced by
the age at which mothers give birth. In 1995, the median age of women giving birth was 28.0
both in PPS and in suburban areas.2 By 2016, median age for PPS residents giving birth had risen
by five years to 33.1, while median age in suburban areas increased only two years, to 30.3 (Chart
8). The living arrangements of residents who have children at an older age are likely to be more
established. Therefore these families are less likely to move out. Recent census data indicate
that 45 percent of PPS residents in their 20s move within a 12 month period, compared with only
26 percent of PPS residents in their 30s and 14 percent of PPS residents in their 40s.3
2 Clackamas, Multnomah, and Washington counties excluding PPS area.
3 U.S. Census Bureau, 2012‐2016 American Community Survey 5 year estimates, Table B07001.
14
Housing Growth
Between 2000 and 2010 about 22,000 housing units were added within PPS. In spite of a
slowdown in new construction following the Great Recession, housing growth in the current
decade has already surpassed the 2000s. In the six year period between 2012 and 2017, the City
of Portland issued building permits for about 28,000 units.
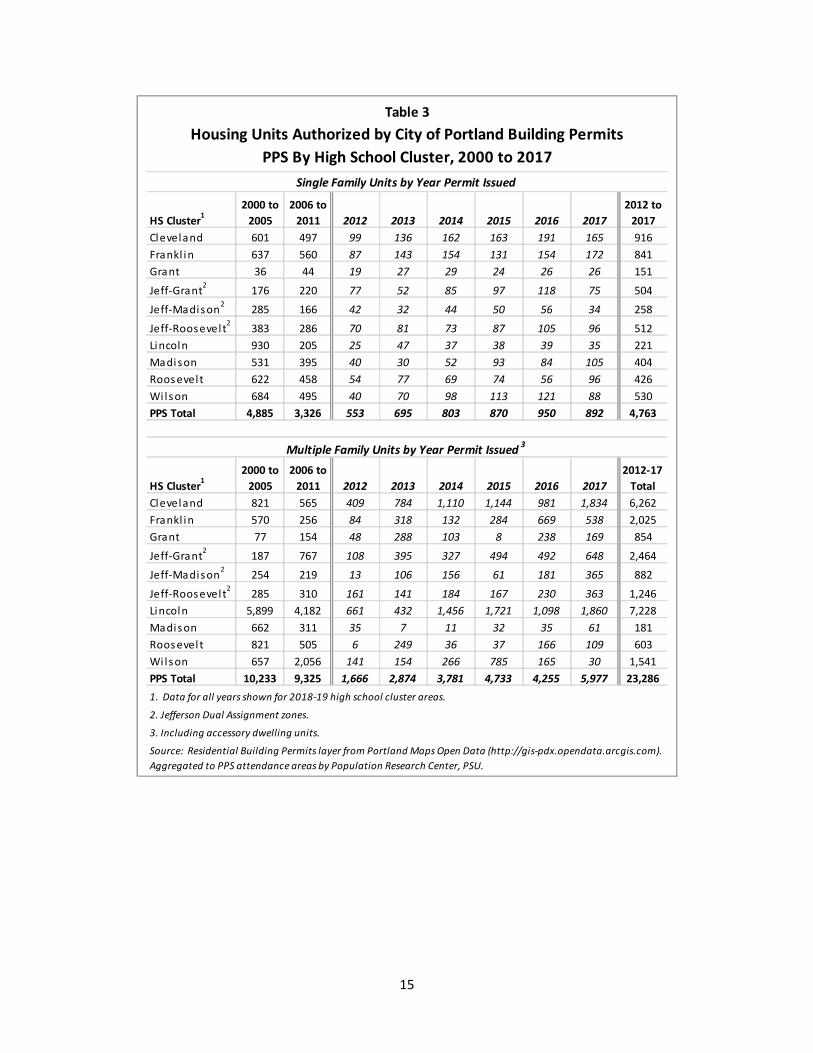
City of Portland residential building permit data for an 18 year period is shown by high school
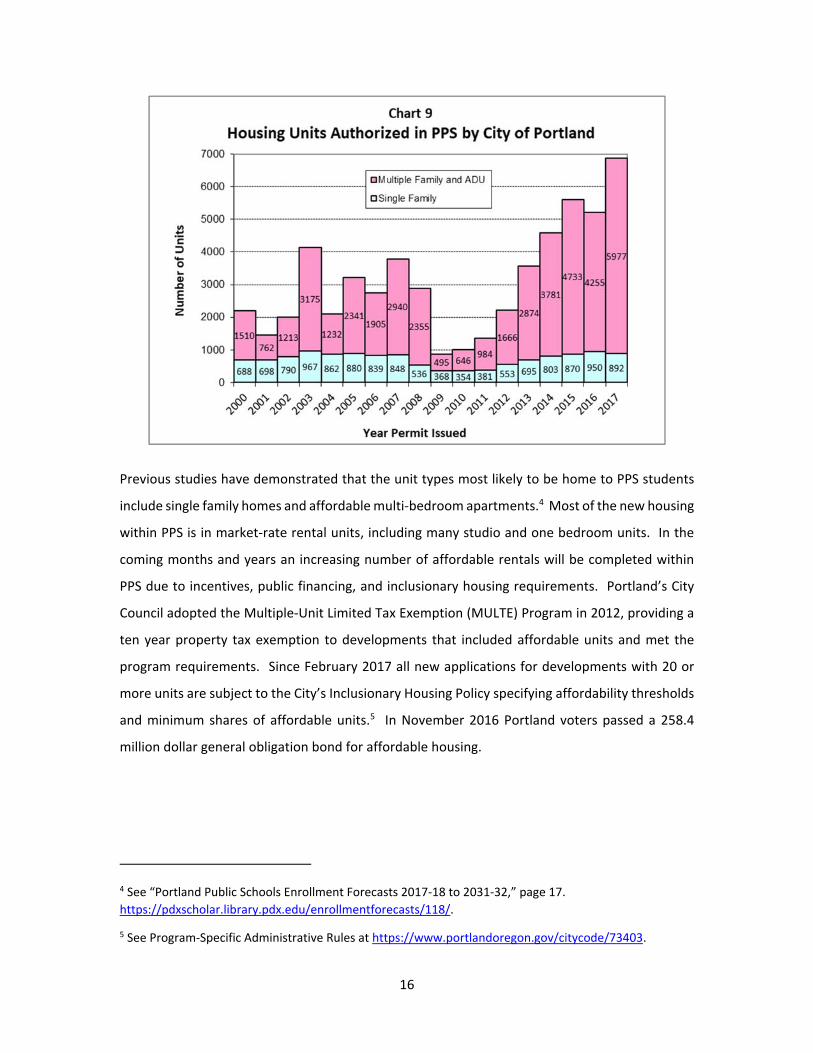
cluster in Table 3. In the most recent three years, 2015, 2016, and 2017, permits were issued for
over 2,700 new single family homes and about 15,000 units in multiple family developments
within PPS. The multiple family counts include about 300 accessory dwelling units permitted each
year in 2016 and 2017. Single family development has occurred throughout the District, though
the Cleveland and Franklin clusters have consistently accounted for more than one third of new
homes in most recent years. Multiple family development is more concentrated, with well over
half of recent development occurring in the Cleveland and Lincoln clusters. Chart 9 depicts the
district‐wide annual totals.
15
Table 3
Housing Units Authorized by City of Portland Building Permits
PPS By High School Cluster, 2000 to 2017
Single Family Units by Year Permit Issued
HS Cluster1
2000 to
2005
2006 to
2011 2012 2013 2014 2015 2016 2017
2012 to
2017
Cleveland 601 497 99 136 162 163 191 165 916
Frankl in 637 560 87 143 154 131 154 172 841
Grant 36 44 19 27 29 24 26 26 151
Jeff‐Grant2
176 220 77 52 85 97 118 75 504
Jeff‐Madison2
285 166 42 32 44 50 56 34 258
Jeff‐Roosevel t2
383 286 70 81 73 87 105 96 512
Lincoln 930 205 25 47 37 38 39 35 221
Madison 531 395 40 30 52 93 84 105 404
Roosevel t 622 458 54 77 69 74 56 96 426
Wilson 684 495 40 70 98 113 121 88 530
PPS Total 4,885 3,326 553 695 803 870 950 892 4,763
Multiple Family Units by Year Permit Issued3
HS Cluster1
2000 to
2005
2006 to
2011 2012 2013 2014 2015 2016 2017
2012‐17
Total
Cleveland 821 565 409 784 1,110 1,144 981 1,834 6,262
Frankl in 570 256 84 318 132 284 669 538 2,025
Grant 77 154 48 288 103 8 238 169 854
Jeff‐Grant2
187 767 108 395 327 494 492 648 2,464
Jeff‐Madison2
254 219 13 106 156 61 181 365 882
Jeff‐Roosevel t2
285 310 161 141 184 167 230 363 1,246
Lincoln 5,899 4,182 661 432 1,456 1,721 1,098 1,860 7,228
Madison 662 311 35 7 11 32 35 61 181
Roosevel t 821 505 6 249 36 37 166 109 603
Wilson 657 2,056 141 154 266 785 165 30 1,541
PPS Total 10,233 9,325 1,666 2,874 3,781 4,733 4,255 5,977 23,286
1. Data for all years shown for 2018‐19 high school cluster areas.
2. Jefferson Dual Assignment zones.
3. Including accessory dwelling units.
Source: Residential Building Permits layer from Portland Maps Open Data (http://gis‐pdx.opendata.arcgis.com).
Aggregated to PPS attendance areas by Population Research Center, PSU.
16
Previous studies have demonstrated that the unit types most likely to be home to PPS students
include single family homes and affordable multi‐bedroom apartments.4 Most of the new housing
within PPS is in market‐rate rental units, including many studio and one bedroom units. In the
coming months and years an increasing number of affordable rentals will be completed within
PPS due to incentives, public financing, and inclusionary housing requirements. Portland’s City
Council adopted the Multiple‐Unit Limited Tax Exemption (MULTE) Program in 2012, providing a
ten year property tax exemption to developments that included affordable units and met the
program requirements. Since February 2017 all new applications for developments with 20 or
more units are subject to the City’s Inclusionary Housing Policy specifying affordability thresholds
and minimum shares of affordable units.5 In November 2016 Portland voters passed a 258.4
million dollar general obligation bond for affordable housing.
4 See “Portland Public Schools Enrollment Forecasts 2017‐18 to 2031‐32,” page 17.
https://pdxscholar.library.pdx.edu/enrollmentforecasts/118/.
5 See Program‐Specific Administrative Rules at https://www.portlandoregon.gov/citycode/73403.

17
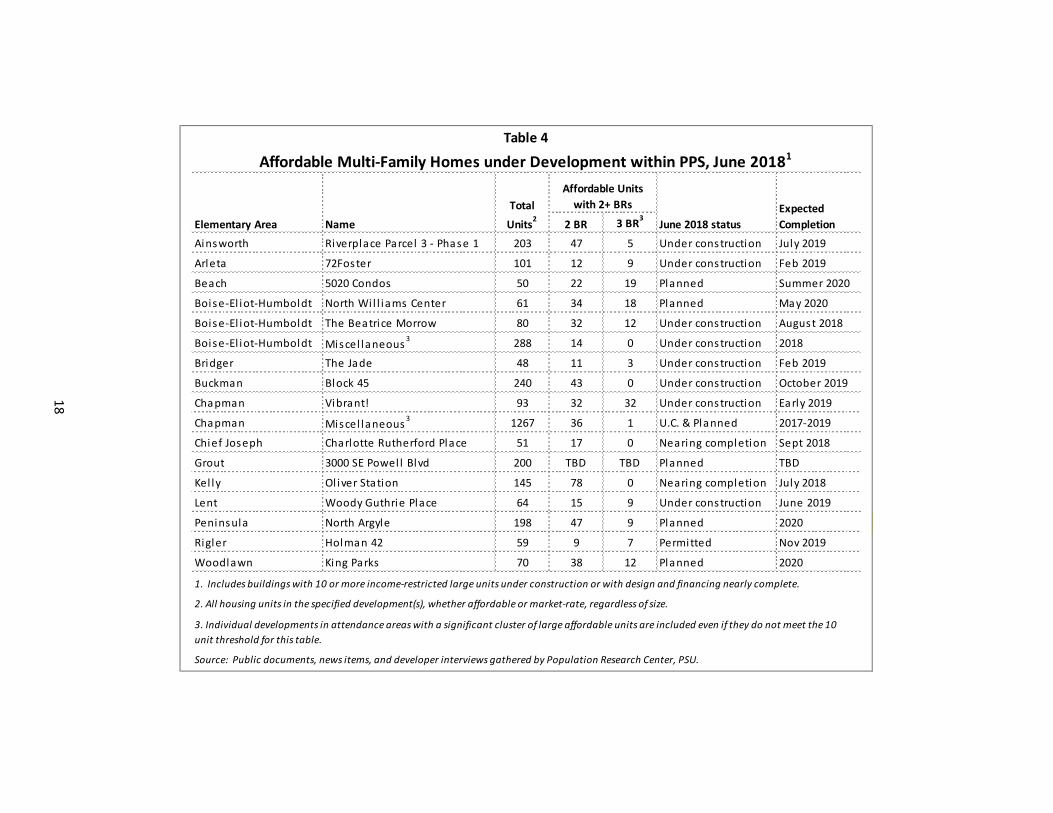
The Portland Housing Bureau (PHB) web site includes documents and interactive maps detailing
PHB‐financed rental housing projects and inclusionary housing developments in the pipeline.6
Enrollment impacts from affordable developments in the pipeline with 10 or more units larger
than one bedroom are specifically factored into the school forecasts. These developments known
to PRC as of June 2018 including over 600 family‐size units of two or more bedrooms are listed in
Table 4 by elementary attendance area.
6 PHB‐financed rental houing projects in pre‐development or construction phases at
https://www.portlandoregon.gov/phb/74263; Inclusionary Housing Pipeline at
https://www.portlandoregon.gov/PHB/76089
2 BR 3 BR3
Ainsworth Riverplace Parcel 3 ‐ Phase 1 203 47 5 Under construction July 2019
Arleta 72Foster 101 12 9 Under construction Feb 2019
Beach 5020 Condos 50 22 19 Planned Summer 2020
Boise‐El iot‐Humboldt North Wi l l iams Center 61 34 18 Planned May 2020
Boise‐El iot‐Humboldt The Beatrice Morrow 80 32 12 Under construction August 2018
Boise‐El iot‐Humboldt Miscel laneous3 288 14 0 Under construction 2018
Bridger The Jade 48 11 3 Under construction Feb 2019
Buckman Block 45 240 43 0 Under construction October 2019
Chapman Vibrant! 93 32 32 Under construction Early 2019
Chapman Miscel laneous3 1267 36 1 U.C. & Planned 2017‐2019
Chief Joseph Charlotte Rutherford Place 51 17 0 Nearing completion Sept 2018
Grout 3000 SE Powel l Blvd 200 TBD TBD Planned TBD
Kel ly Ol iver Station 145 78 0 Nearing completion July 2018
Lent Woody Guthrie Place 64 15 9 Under construction June 2019
Peninsula North Argyle 198 47 9 Planned 2020
Rigler Holman 42 59 9 7 Permitted Nov 2019
Woodlawn King Parks 70 38 12 Planned 2020
1. Includes buildings with 10 or more income‐restricted large units under construction or with design and financing nearly complete.
2. All housing units in the specified development(s), whether affordable or market‐rate, regardless of size.
Source: Public documents, news items, and developer interviews gathered by Population Research Center, PSU.
Table 4
Affordable Multi‐Family Homes under Development within PPS, June 20181
3. Individual developments in attendance areas with a significant cluster of large affordable units are included even if they do not meet the 10
unit threshold for this table.
Affordable Units
with 2+ BRsTotal
Units2
Expected
CompletionJune 2018 statusNameElementary Area
18

19
ENROLLMENT TRENDS
In fall 2017, Portland Public Schools (PPS) enrolled 48,684 students in grades K‐12, an increase of
375 students from fall 2016. This is the ninth consecutive year of enrollment growth, following
12 consecutive years of enrollment losses that occurred between 1996‐97 and 2008‐09. For the
nine year period since 2008‐09, PPS K‐12 enrollment has grown by 3,660 students (eight percent).
After 10 consecutive years of annual elementary (K‐5th) enrollment growth between fall 2006 and
fall 2016, the district‐wide K‐5th grade total declined by 148 students (0.6 percent) in fall 2017.
The drop in K‐5 enrollment is due to successively smaller incoming kindergarten classes in each of
the five years since their 2012‐13 peak. Fall 2017 kindergarten enrollment was the smallest since
2007‐08, and was 329 students lower than in 2012‐13. Overall, elementary grades have added
2,908 students (13 percent) since 2007‐08.
Enrollment in middle grades (6th‐8th) reached a new peak in fall 2017. The enrollment of 10,780
in grades 6‐8 was 84 students (0.8 percent) greater than enrollment in fall 2016, and was the
largest in 14 years. Overall, middle grades have added 914 students (nine percent) since 2007‐
08, with nearly all of that growth occurring since 2011‐12.
Momentum from the years of growth in earlier grades has now reached high school grades (9th‐
12th). Enrollment in grades 9‐12 fell to a low of 12,584 in fall 2013, but grew in each of the four
following years, adding 577 students between fall 2013 and fall 2017. Most of that growth
occurred between fall 2016 and fall 2017, when grades 9‐12 added 439 students (3.4 percent),
reaching a total of 13,423, the largest in 10 years.
On the next page, Table 5 summarizes the K‐12 enrollment history for the District by grade level
annually from 2007‐08 to 2017‐18.7
7 The “total” row in Table 5 differs from the district‐wide totals published by PPS because Table 6 shows K‐
12 figures only; it does not include pre‐kindergarten enrollment.
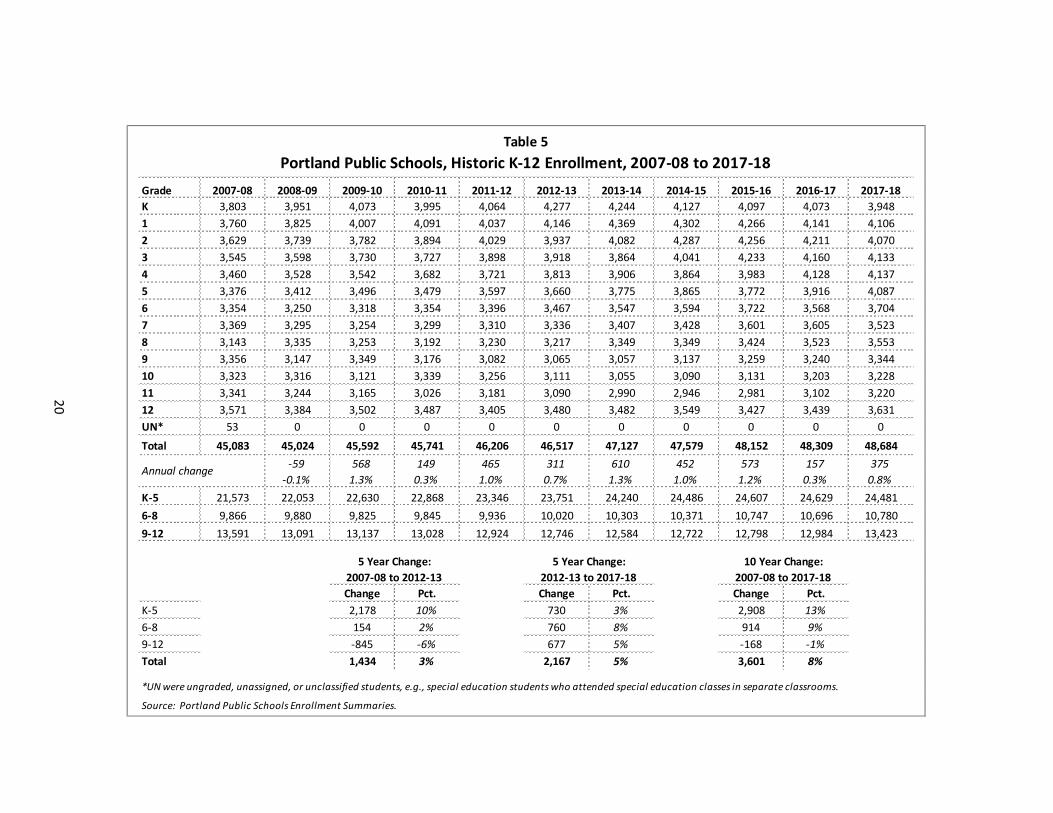
Table 5
Portland Public Schools, Historic K‐12 Enrollment, 2007‐08 to 2017‐18
Grade 2007‐08 2008‐09 2009‐10 2010‐11 2011‐12 2012‐13 2013‐14 2014‐15 2015‐16 2016‐17 2017‐18
K 3,803 3,951 4,073 3,995 4,064 4,277 4,244 4,127 4,097 4,073 3,948
1 3,760 3,825 4,007 4,091 4,037 4,146 4,369 4,302 4,266 4,141 4,106
2 3,629 3,739 3,782 3,894 4,029 3,937 4,082 4,287 4,256 4,211 4,070
3 3,545 3,598 3,730 3,727 3,898 3,918 3,864 4,041 4,233 4,160 4,133
4 3,460 3,528 3,542 3,682 3,721 3,813 3,906 3,864 3,983 4,128 4,137
5 3,376 3,412 3,496 3,479 3,597 3,660 3,775 3,865 3,772 3,916 4,087
6 3,354 3,250 3,318 3,354 3,396 3,467 3,547 3,594 3,722 3,568 3,704
7 3,369 3,295 3,254 3,299 3,310 3,336 3,407 3,428 3,601 3,605 3,523
8 3,143 3,335 3,253 3,192 3,230 3,217 3,349 3,349 3,424 3,523 3,553
9 3,356 3,147 3,349 3,176 3,082 3,065 3,057 3,137 3,259 3,240 3,344
10 3,323 3,316 3,121 3,339 3,256 3,111 3,055 3,090 3,131 3,203 3,228
11 3,341 3,244 3,165 3,026 3,181 3,090 2,990 2,946 2,981 3,102 3,220
12 3,571 3,384 3,502 3,487 3,405 3,480 3,482 3,549 3,427 3,439 3,631
UN* 53 0 0 0 0 0 0 0 0 0 0
Total 45,083 45,024 45,592 45,741 46,206 46,517 47,127 47,579 48,152 48,309 48,684
‐59 568 149 465 311 610 452 573 157 375
‐0.1% 1.3% 0.3% 1.0% 0.7% 1.3% 1.0% 1.2% 0.3% 0.8%
K‐5 21,573 22,053 22,630 22,868 23,346 23,751 24,240 24,486 24,607 24,629 24,481
6‐8 9,866 9,880 9,825 9,845 9,936 10,020 10,303 10,371 10,747 10,696 10,780
9‐12 13,591 13,091 13,137 13,028 12,924 12,746 12,584 12,722 12,798 12,984 13,423
5 Year Change:
2007‐08 to 2012‐13
5 Year Change:
2012‐13 to 2017‐18
10 Year Change:
2007‐08 to 2017‐18
Change Pct. Change Pct. Change Pct.
K‐5 2,178 10% 730 3% 2,908 13%
6‐8 154 2% 760 8% 914 9%
9‐12 ‐845 ‐6% 677 5% ‐168 ‐1%
Total 1,434 3% 2,167 5% 3,601 8%
*UN were ungraded, unassigned, or unclassified students, e.g., special education students who attended special education classes in separate classrooms.
Annual change
Source: Portland Public Schools Enrollment Summaries.
20

21
District Capture Rate
The capture rate is the ratio of enrollment in District schools to the school age population living
within the District boundary. School age residents who do not attend PPS schools include those
who attend private schools, transfer to other districts, are home schooled, five or six year olds
who have not yet entered school, and teenagers who have graduated or dropped out. Conversely,
PPS enrollment includes some students who are not included in the district’s school age
population, specifically transfer students from other districts and students over age 18.
The most accurate count of school age population comes from the decennial census; baseline
capture rates for the enrollment forecast are calculated by comparing the census conducted on
April 1 with PPS enrollment of students residing within the District.8 School years 1999‐2000
and 2009‐2010 are used because they include the April 1 census date. Rates based on the 2000
8 A similar table was included in the 2011 report, but it compared TOTAL enrollment (PPS residents AND
students residing outside of the district) with census population. Therefore capture rates were reported
as higher than those shown in Table 7 of this report.
Table 6
Estimated PPS Capture Rates, Resident Enrollment1
1999‐2000 and 2009‐2010
K‐2 3‐5 6‐8 9‐12 K‐12
2000 Population2
14,186 14,589 13,452 18,806 61,033
2010 Population3
13,820 12,641 11,793 16,161 54,414
1999‐2000 Enrol lment4
11,987 12,391 11,502 15,397 51,277
Capture Rate, 1999‐20005 84.5% 84.9% 85.5% 81.9% 84.0%
2009‐2010 Enrol lment 11,576 10,472 9,601 12,738 44,387
Capture Rate, 2009‐20106 83.8% 82.8% 81.4% 78.8% 81.6%
6. The ratio of 2009‐2010 resident enrollment to 2010 (census) population.
1. The ratio of enrolled District residents to total District population by grade level. Enrollments exclude
about 1,000 students in 1999‐2000 and 1,200 students in 2009‐10 residing outside of the district.
2. April 1, 2000 census counts grouped by grade level cohorts. For example, K‐2 is an estimate of the
number of children who would have been age 5 to 7 on 9/1/99.
3. April 1, 2010 census counts grouped by grade level cohorts. For example, K‐2 is an estimate of the
number of children who would have been age 5 to 7 on 9/1/09.
4. Excludes students enrolled in programs that were transferred to MESD in 2003; ungraded students
assigned to grade levels.
5. The ratio of 1999‐2000 resident enrollment to 2000 (census) population.
22
and 2010 censuses presented in Table 6 show that PPS capture rates declined for each grade level
group, particularly at the secondary level. Declining capture rates exacerbated the decade’s
enrollment loss that was primarily caused by an 11 percent decline in school‐age population. We
infer from this analysis that 81 percent of the District’s loss of 6,890 resident students between
1999‐2000 and 2009‐2010 was attributable to population change, while the remaining 19 percent
was attributable to capture rate change.
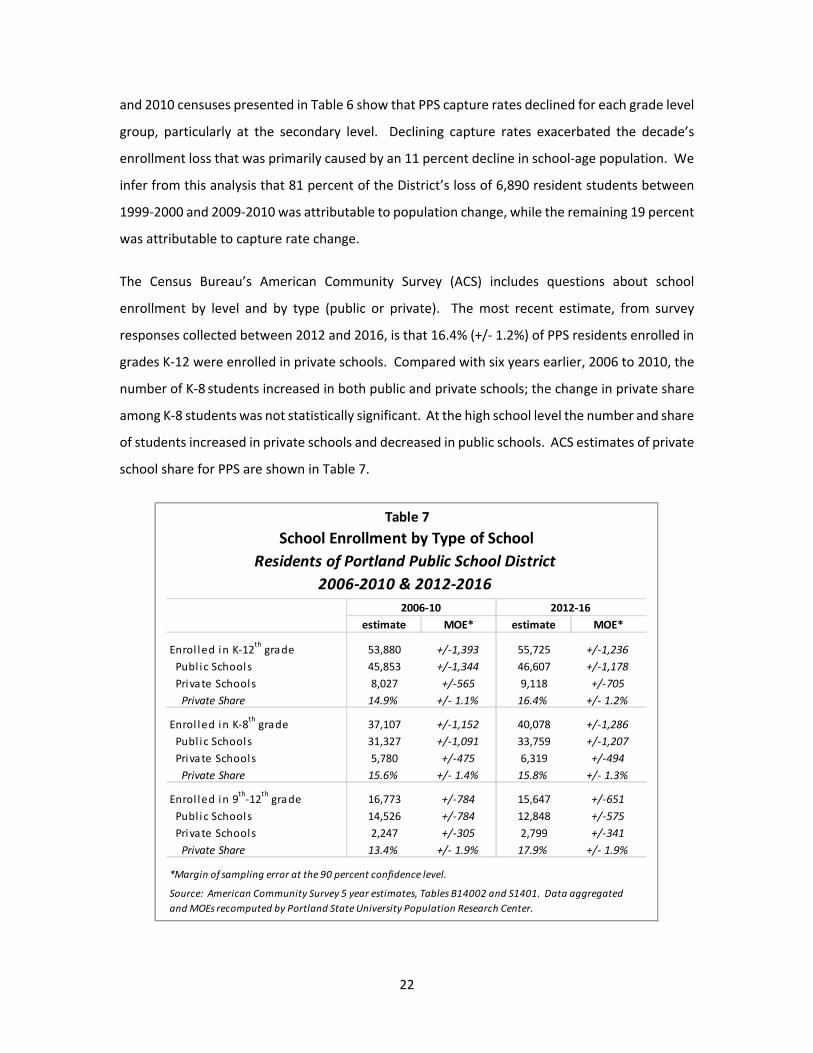
The Census Bureau’s American Community Survey (ACS) includes questions about school
enrollment by level and by type (public or private). The most recent estimate, from survey
responses collected between 2012 and 2016, is that 16.4% (+/‐ 1.2%) of PPS residents enrolled in
grades K‐12 were enrolled in private schools. Compared with six years earlier, 2006 to 2010, the
number of K‐8 students increased in both public and private schools; the change in private share
among K‐8 students was not statistically significant. At the high school level the number and share
of students increased in private schools and decreased in public schools. ACS estimates of private
school share for PPS are shown in Table 7.
2006‐10 2012‐16
estimate MOE* estimate MOE*
Enrol led in K‐12th grade 53,880 +/‐1,393 55,725 +/‐1,236
Publ ic Schools 45,853 +/‐1,344 46,607 +/‐1,178
Private Schools 8,027 +/‐565 9,118 +/‐705
Private Share 14.9% +/‐ 1.1% 16.4% +/‐ 1.2%
Enrol led in K‐8th grade 37,107 +/‐1,152 40,078 +/‐1,286
Publ ic Schools 31,327 +/‐1,091 33,759 +/‐1,207
Private Schools 5,780 +/‐475 6,319 +/‐494
Private Share 15.6% +/‐ 1.4% 15.8% +/‐ 1.3%
Enrol led in 9th‐12
th grade 16,773 +/‐784 15,647 +/‐651
Publ ic Schools 14,526 +/‐784 12,848 +/‐575
Private Schools 2,247 +/‐305 2,799 +/‐341
Private Share 13.4% +/‐ 1.9% 17.9% +/‐ 1.9%
*Margin of sampling error at the 90 percent confidence level.
Table 7
School Enrollment by Type of School
Residents of Portland Public School District
2006‐2010 & 2012‐2016
Source: American Community Survey 5 year estimates, Tables B14002 and S1401. Data aggregated
and MOEs recomputed by Portland State University Population Research Center.

23
Enrollment Trends by Place of Residence
The overall population of students residing in an attendance area and enrolled in any PPS school
is typically more stable than the enrollment at the neighborhood school serving the attendance
area. Enrollment at individual schools may change due to program or boundary changes, school
openings or closures, school choice, the number of transfer slots, or other changes not related to
underlying demographic trends. When student points are matched by address in a geographic
information system, the number of PPS students (including charter schools) by grade level can be
tabulated for any geographic area. Creating time series of resident PPS students by grade level
by current attendance areas facilitates historic enrollment analysis even if school boundaries have
changed, allowing us to identify shifts in the share of area students who enroll in their
neighborhood school, or attend other schools or programs.
High school clusters (HSCLs) are composed of the elementary school attendance areas (ESAAs) in
the high schools’ feeder patterns. Each of the three Jefferson dual assignment zones are treated
as individual clusters in this report. Several HSCLs are equivalent to high school attendance areas
(HSAAs). However, two elementary areas are split between HSAAs. Faubon is split between the
Jefferson‐Madison and Jefferson‐Roosevelt HSAAs but is included in the Jefferson‐Madison HSCL.
Beginning in 2018‐19, the Bridlemile ESAA will be split between the Lincoln and Wilson HSAAs.
However, HSCL tables in this report include the entire Bridlemile ESAA in the Wilson cluster. A list
of ESAAs by HSCL is provided in Appendix D of this report.
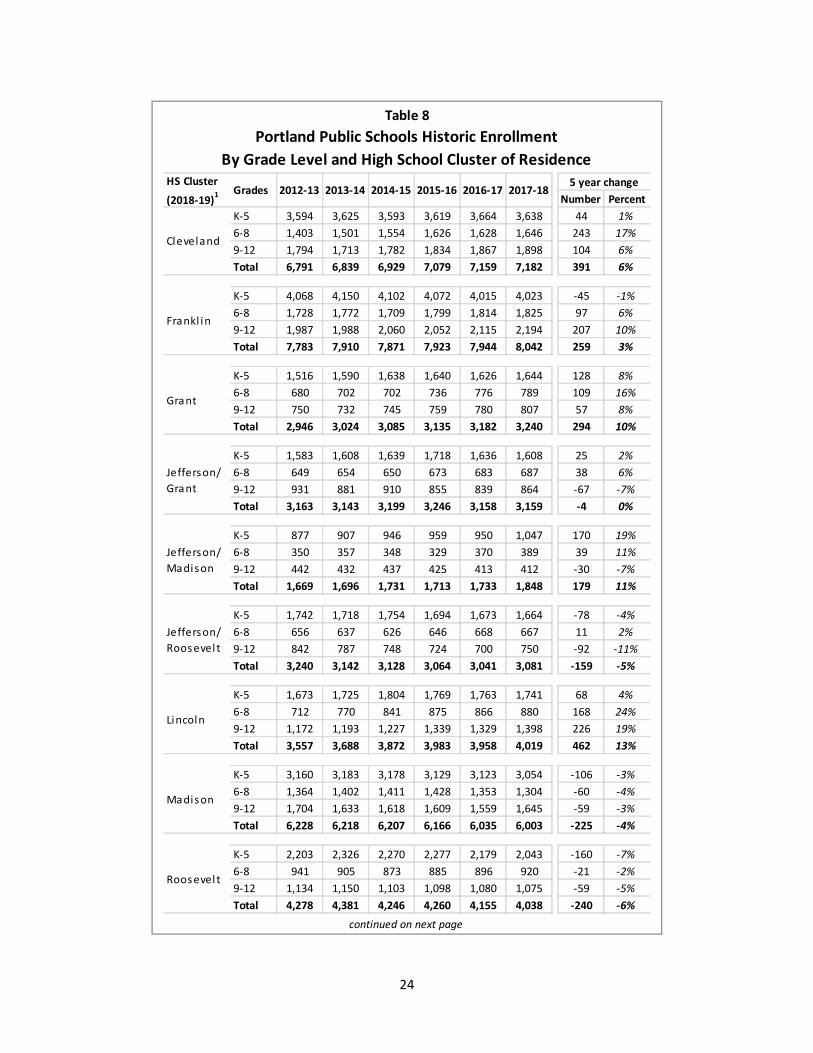
District‐wide K‐12 enrollment increased by five percent between 2012‐13 and 2017‐18, with wide
variation in growth rates among HSCLs and among school levels (K‐5, 6‐8, 9‐12). Table 8 reports
the total number of residents of each high school cluster enrolled in PPS schools, regardless of
which PPS school they attend. The downturn in elementary enrollment did not occur district‐
wide until 2017‐18. However, the Franklin, Jefferson‐Roosevelt, Madison, and Roosevelt HSCLs
were all home to fewer PPS K‐5th grade students in 2017‐18 than in 2012‐13. The Cleveland,
Grant, Lincoln, and Wilson HSCLs gained PPS residents at every school level during the period,
while only the Madison and Roosevelt HSCLs lost students at every level.
24
Table 8
Portland Public Schools Historic Enrollment
By Grade Level and High School Cluster of Residence
5 year change
Number Percent
K‐5 3,594 3,625 3,593 3,619 3,664 3,638 44 1%
6‐8 1,403 1,501 1,554 1,626 1,628 1,646 243 17%
9‐12 1,794 1,713 1,782 1,834 1,867 1,898 104 6%
Total 6,791 6,839 6,929 7,079 7,159 7,182 391 6%
K‐5 4,068 4,150 4,102 4,072 4,015 4,023 ‐45 ‐1%
6‐8 1,728 1,772 1,709 1,799 1,814 1,825 97 6%
9‐12 1,987 1,988 2,060 2,052 2,115 2,194 207 10%
Total 7,783 7,910 7,871 7,923 7,944 8,042 259 3%
K‐5 1,516 1,590 1,638 1,640 1,626 1,644 128 8%
6‐8 680 702 702 736 776 789 109 16%
9‐12 750 732 745 759 780 807 57 8%
Total 2,946 3,024 3,085 3,135 3,182 3,240 294 10%
K‐5 1,583 1,608 1,639 1,718 1,636 1,608 25 2%
6‐8 649 654 650 673 683 687 38 6%
9‐12 931 881 910 855 839 864 ‐67 ‐7%
Total 3,163 3,143 3,199 3,246 3,158 3,159 ‐4 0%
K‐5 877 907 946 959 950 1,047 170 19%
6‐8 350 357 348 329 370 389 39 11%
9‐12 442 432 437 425 413 412 ‐30 ‐7%
Total 1,669 1,696 1,731 1,713 1,733 1,848 179 11%
K‐5 1,742 1,718 1,754 1,694 1,673 1,664 ‐78 ‐4%
6‐8 656 637 626 646 668 667 11 2%
9‐12 842 787 748 724 700 750 ‐92 ‐11%
Total 3,240 3,142 3,128 3,064 3,041 3,081 ‐159 ‐5%
K‐5 1,673 1,725 1,804 1,769 1,763 1,741 68 4%
6‐8 712 770 841 875 866 880 168 24%
9‐12 1,172 1,193 1,227 1,339 1,329 1,398 226 19%
Total 3,557 3,688 3,872 3,983 3,958 4,019 462 13%
K‐5 3,160 3,183 3,178 3,129 3,123 3,054 ‐106 ‐3%
6‐8 1,364 1,402 1,411 1,428 1,353 1,304 ‐60 ‐4%
9‐12 1,704 1,633 1,618 1,609 1,559 1,645 ‐59 ‐3%
Total 6,228 6,218 6,207 6,166 6,035 6,003 ‐225 ‐4%
K‐5 2,203 2,326 2,270 2,277 2,179 2,043 ‐160 ‐7%
6‐8 941 905 873 885 896 920 ‐21 ‐2%
9‐12 1,134 1,150 1,103 1,098 1,080 1,075 ‐59 ‐5%
Total 4,278 4,381 4,246 4,260 4,155 4,038 ‐240 ‐6%
continued on next page
Madison
Roosevel t
Jefferson/
Madison
Jefferson/
Roosevel t
2017‐182016‐17HS Cluster
(2018‐19)1 2012‐13Grades 2013‐14 2014‐15 2015‐16
Cleveland
Frankl in
Grant
Jefferson/
Grant
Lincoln

25
Table 8 (continued)
Portland Public Schools Historic Enrollment
By Grade Level and High School Cluster of Residence
5 year change
Number Percent
K‐5 2,846 2,874 3,002 3,106 3,322 3,350 504 18%
6‐8 1,334 1,402 1,437 1,528 1,434 1,453 119 9%
9‐12 1,690 1,688 1,715 1,761 1,880 1,938 248 15%
Total 5,870 5,964 6,154 6,395 6,636 6,741 871 15%
K‐5 489 534 560 624 678 669 180 37%
6‐8 203 201 220 222 208 220 17 8%
9‐12 300 387 377 342 422 442 142 47%
Total 992 1,122 1,157 1,188 1,308 1,331 339 34%
K‐5 23,751 24,240 24,486 24,607 24,629 24,481 730 3%
6‐8 10,020 10,303 10,371 10,747 10,696 10,780 760 8%
9‐12 12,746 12,584 12,722 12,798 12,984 13,423 677 5%
Total 46,517 47,127 47,579 48,152 48,309 48,684 2,167 5%
2. Jefferson Dual Assignment zones.
HS Cluster
(2018‐19)1 Grades 2012‐13 2013‐14 2014‐15 2015‐16 2016‐17 2017‐18
Wilson
PPS Dis trict
Tota ls
1. Historical data reflects 2018‐19 clusters. Clusters are composed of whole elementary areas and may
differ from high school attendance areas reported in Table B6. Appendix D contains a list of elementary
school areas by cluster.
Out of
Dis trict


27
ENROLLMENT FORECASTS
Forecast Process
The forecast process is geographically top‐down, divided into four stages:
District‐wide forecasts by grade level are prepared using a cohort‐component model,
described in more detail below. A middle scenario, considered the most likely scenario
consistent with long term demographic trends and expected population growth, is
prepared first. Migration levels are adjusted to produce alternative high and low
scenarios for the District. All three scenarios use the same fertility rates and long run
capture rates.
Second, forecasts of PPS students by grade level residing in each high school cluster (HSCL)
are prepared and controlled to the district‐wide middle growth forecast.
Third, forecasts of PPS students by grade level residing within elementary, middle, and
high school attendance areas are prepared within each cluster, with attendance area
resident forecasts controlled to the HSCL forecasts. This step includes forecasts of
residents and non‐residents attending each neighborhood school.
The fourth step is to prepare enrollment forecasts for schools that have no attendance
area. The largest of the district‐run non‐neighborhood schools are forecast individually,
and alternative programs, community based programs, special services, and charter
schools are grouped into an “other schools and programs” category.
District‐wide Population and Enrollment Forecasts: Methodology
The district‐wide forecasts are the sum of two parts: resident forecasts consistent with population
forecasts by age group, and non‐resident forecasts based on recent trends in the number of PPS
students living outside of the District’s boundaries.
28
Cohort‐Component Model for District Residents
To ensure that enrollment forecasts are consistent with the dynamics of likely population growth
within the District, a grade progression enrollment model is combined with a demographic cohort‐
component model used to forecast population for the District by age and sex. The components
of population change are births, deaths, and migration. An area’s population grows when births
outnumber deaths and when more people move into an area than out of it. These events occur
at different rates for persons of different age groups, or cohorts. For example, people tend to
relocate the most when they are in their 20s and the elderly have a lower chance than people in
their 40s to survive over a ten year period. Using age‐specific fertility rates, age‐sex specific
mortality rates, age‐sex specific migration rates, estimates of recent net migration levels, and
forecasts of future migration levels, each component is applied to the base year population in a
manner that simulates the actual dynamics of population change.
The 2000 and 2010 Census results were used as a baseline for the population forecasts. By
“surviving” the 2000 population and 2000s births (estimating the population in each age group
that would survive to the year 2010) and comparing the “survived” population to the actual 2010
population by age group, we were able to estimate the overall level of net migration between
2000 and 2010 as well as net migration by gender and age cohort. The net migration data was
used to develop initial net migration rates, which were used as a baseline for rates used to
forecast net migration for the 2010 to 2040 period.
We estimated the number of births to women residing within the District each year from 1999 to
2016, using data from the Oregon Department of Human Services, Center for Health Statistics.
Detailed information including the age of mothers is incorporated in the establishment of fertility
rates by age group for both 2000 and 2010. Steep declines in rates among women under 30 have
continued since 2010, influencing the assumption that TFRs will decrease from 1.34 in 2010 to
1.17 in 2020. Fertility rates are held constant after 2020.
Historic school enrollment is linked to the population forecast in two ways. First, the kindergarten
and first grade enrollments at the time of the most recent census (the 2009‐2010 school year) are
compared to the population at the appropriate ages counted in the census. The “capture rate,”
or ratio of enrollment to population, is an estimate of the share of area children who are enrolled
in District schools. Assumptions for capture rates based on census data are used to bring new
29
kindergarten and first grade students into the District’s enrollment. If there is evidence that
capture rates have changed since the time of the census, they may be adjusted in the forecast.
After some initial fluctuation, capture rates for District residents of 0.842 for kindergarten and
0.856 for first grade are established in the long range forecast.
The other way that historic population and enrollment are linked is through migration. Annual
changes in school enrollment by cohort closely follow trends in the net migration of children in
the District’s population. Once the students are in first grade, a set of baseline grade progression
rates (GPRs) are used to move students from one grade to the next. The GPR is the ratio of
enrollment in a specific grade in one year to the enrollment of the same age cohort in the previous
year; for example, the number of students enrolled in second grade this year divided by the
number of students enrolled in first grade last year. These rates, usually 1.00 for elementary
grades, represent a scenario under which there is no change due to migration. Enrollment change
beyond the baseline is added (or subtracted, if appropriate) at each grade level depending on the
migration levels of the overall population by single years of age.
Grade Progression Model for PPS Students Residing Outside of the District.
To derive the total district‐wide enrollment, it is necessary to include non‐residents, who
comprise just over two percent of the District total. They are not linked to District population in
the way that residents are, so an additional component of the district‐wide forecast is a grade
progression model for out‐of‐district residents.
The number of out‐of‐district PPS kindergarten students is held constant at the 2017‐18 level. For
each grade from 1 to 12, the model incorporates recent GPRs for PPS students residing out of the
district by grade level. In order to determine the GPRs for the future, weighted averages of the
ratios for each grade level from the past four years were calculated. A heavier weight is applied
to the years that are assumed to have more bearing on future enrollments, allowing the trends
of those to dominate over the other years.

30
District‐wide Population and Enrollment Forecasts: Results
Chart 10 compares the historic and forecast number of births to District residents with the historic
and middle series forecast number of PPS kindergarten students. Births are compiled by
kindergarten cohorts (September to August). Although many children move into and out of the
District between birth and age five, and not all District residents attend PPS kindergartens, the
trend in kindergarten enrollment has often followed the trend in the birth cohort. For example,
the peak kindergarten class of 2012‐13 aligned with the birth peak in 2006‐07. In the nine years
since 2009‐10 the ratio of kindergarten to corresponding births has remained within the range of
0.73 to 0.75. This is consistent with the district’s capture rate, assumed to be about 84 percent
for kindergarten, and a net loss of children due to net migration between birth and age five. The
enrollment models do not explicitly use the kindergarten to birth ratio; capture rates and net
migration drive the kindergarten forecasts. However, ratios derived from the kindergarten
forecasts and observed and predicted births increase to 0.78 in the middle series forecast due to
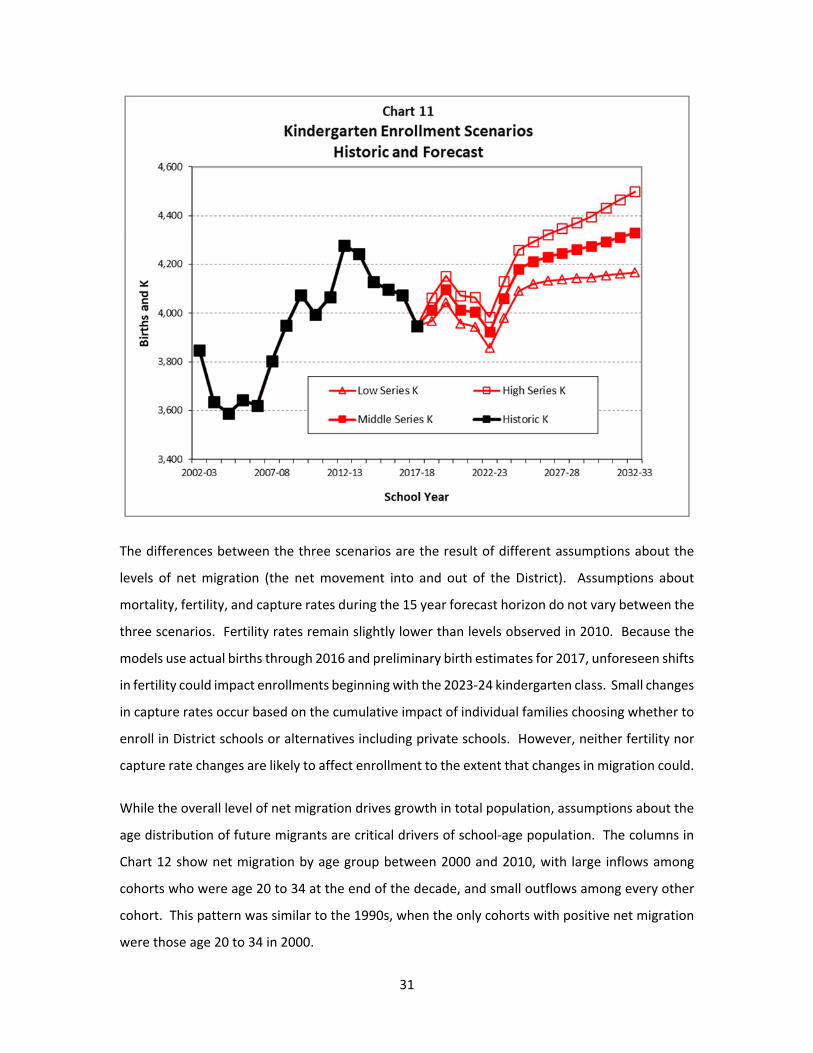
expected population growth and a smaller net outflow of young children. Chart 11 depicts
kindergarten enrollment under all three forecast scenarios.
31
The differences between the three scenarios are the result of different assumptions about the
levels of net migration (the net movement into and out of the District). Assumptions about
mortality, fertility, and capture rates during the 15 year forecast horizon do not vary between the
three scenarios. Fertility rates remain slightly lower than levels observed in 2010. Because the
models use actual births through 2016 and preliminary birth estimates for 2017, unforeseen shifts
in fertility could impact enrollments beginning with the 2023‐24 kindergarten class. Small changes
in capture rates occur based on the cumulative impact of individual families choosing whether to
enroll in District schools or alternatives including private schools. However, neither fertility nor
capture rate changes are likely to affect enrollment to the extent that changes in migration could.
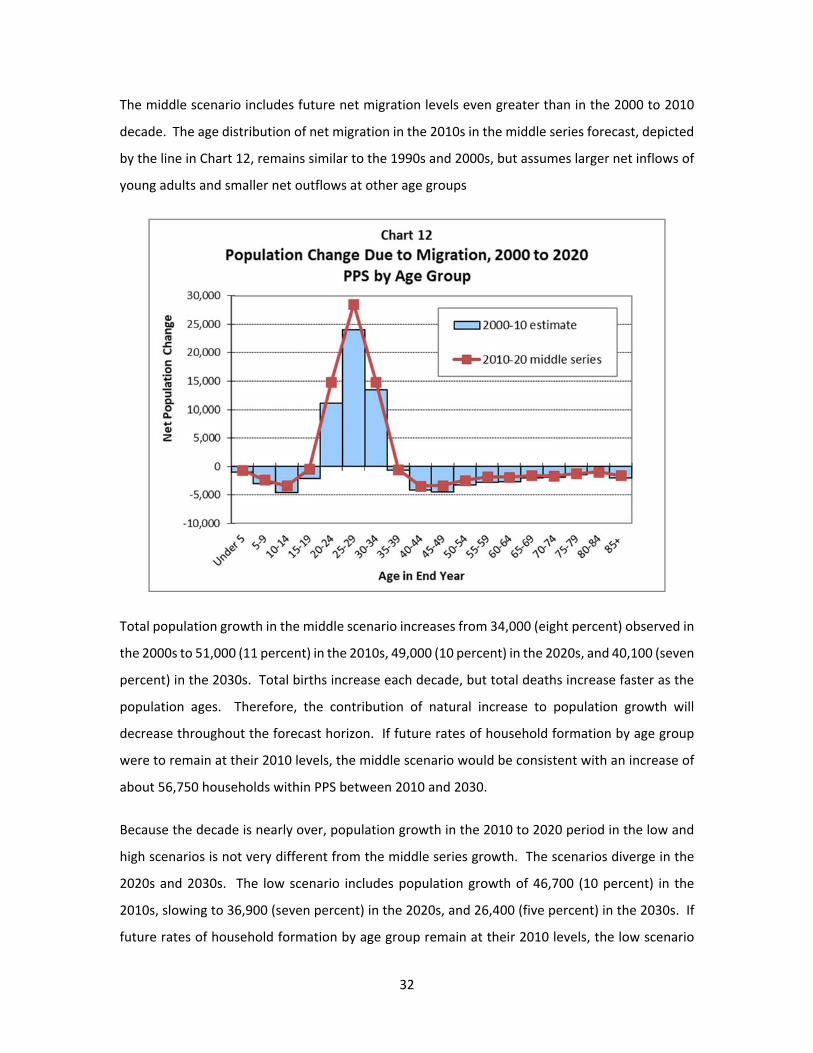
While the overall level of net migration drives growth in total population, assumptions about the
age distribution of future migrants are critical drivers of school‐age population. The columns in
Chart 12 show net migration by age group between 2000 and 2010, with large inflows among
cohorts who were age 20 to 34 at the end of the decade, and small outflows among every other
cohort. This pattern was similar to the 1990s, when the only cohorts with positive net migration
were those age 20 to 34 in 2000.
32
The middle scenario includes future net migration levels even greater than in the 2000 to 2010
decade. The age distribution of net migration in the 2010s in the middle series forecast, depicted
by the line in Chart 12, remains similar to the 1990s and 2000s, but assumes larger net inflows of
young adults and smaller net outflows at other age groups
Total population growth in the middle scenario increases from 34,000 (eight percent) observed in
the 2000s to 51,000 (11 percent) in the 2010s, 49,000 (10 percent) in the 2020s, and 40,100 (seven
percent) in the 2030s. Total births increase each decade, but total deaths increase faster as the
population ages. Therefore, the contribution of natural increase to population growth will
decrease throughout the forecast horizon. If future rates of household formation by age group
were to remain at their 2010 levels, the middle scenario would be consistent with an increase of
about 56,750 households within PPS between 2010 and 2030.
Because the decade is nearly over, population growth in the 2010 to 2020 period in the low and
high scenarios is not very different from the middle series growth. The scenarios diverge in the
2020s and 2030s. The low scenario includes population growth of 46,700 (10 percent) in the
2010s, slowing to 36,900 (seven percent) in the 2020s, and 26,400 (five percent) in the 2030s. If
future rates of household formation by age group remain at their 2010 levels, the low scenario
33
would be consistent with an increase of about 49,300 households within PPS between 2010 and
2030.
In the high scenario, population growth of 55,200 (12 percent) occurs in the 2010s, followed by
59,100 (11 percent) in the 2020s and 54,500 (nine percent) in the 2030s. If future rates of
household formation by age group remain at their 2010 levels, the high scenario would be
consistent with an increase of about 62,700 households within PPS between 2010 and 2030.
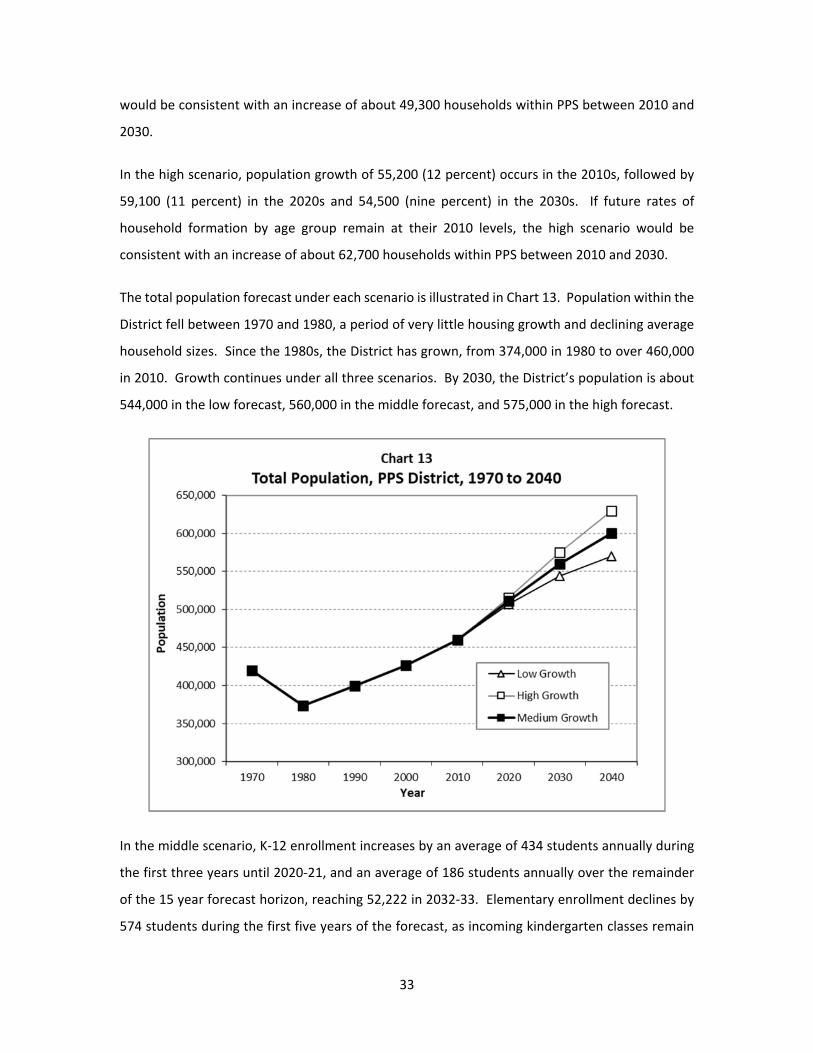
The total population forecast under each scenario is illustrated in Chart 13. Population within the
District fell between 1970 and 1980, a period of very little housing growth and declining average
household sizes. Since the 1980s, the District has grown, from 374,000 in 1980 to over 460,000
in 2010. Growth continues under all three scenarios. By 2030, the District’s population is about
544,000 in the low forecast, 560,000 in the middle forecast, and 575,000 in the high forecast.
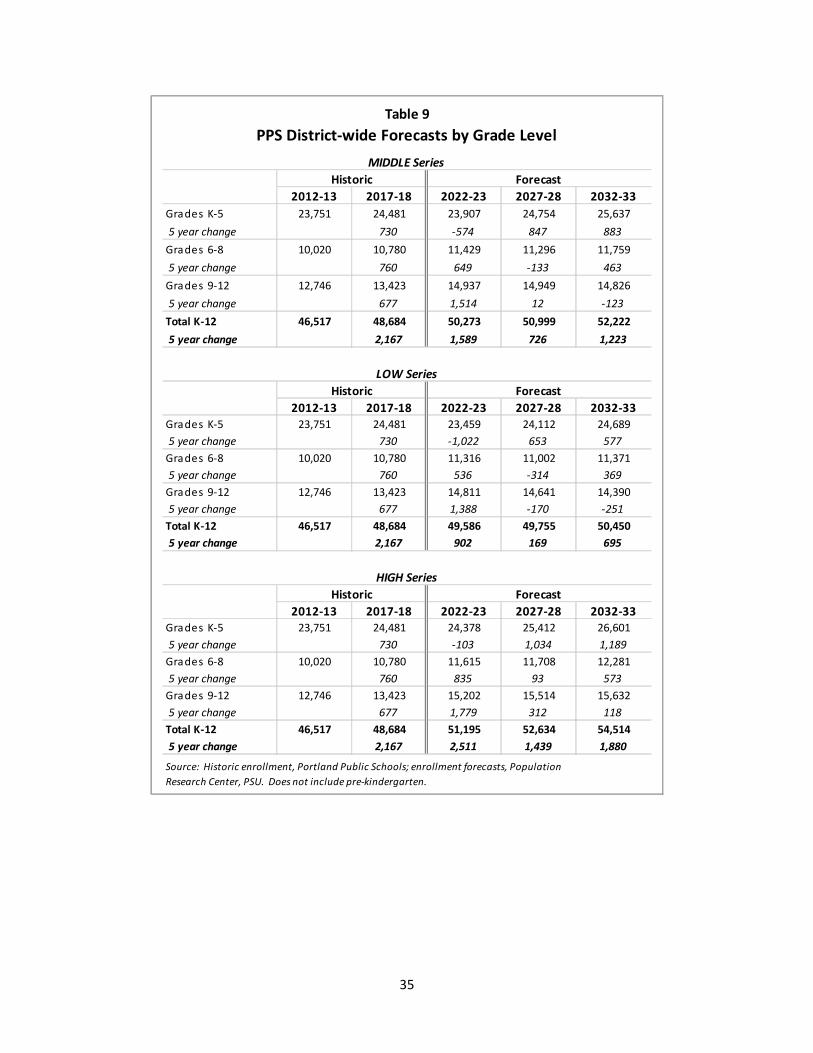
In the middle scenario, K‐12 enrollment increases by an average of 434 students annually during
the first three years until 2020‐21, and an average of 186 students annually over the remainder
of the 15 year forecast horizon, reaching 52,222 in 2032‐33. Elementary enrollment declines by
574 students during the first five years of the forecast, as incoming kindergarten classes remain
34
close to or slightly below recent levels due to the local, state, and national birth downturn.
However, by 2032‐33 the number of K‐5th grade students is 1,156 larger than in 2017‐18. Middle
school and high school enrollments grow initially, reflecting the larger cohorts attributable to the
elementary growth that began in 2007. High school enrollments peak in 2024‐25 with about 2,000
more students than in 2017‐18, followed by decline due to the smaller birth cohorts currently
entering kindergarten.
In the low scenario, K‐12 enrollment growth averages 118 annually, reaching 50,450 in 2032‐33.
That average includes growth of 200 to 300 students in several years at the beginning and end of
the forecast horizon and small losses during several years between 2022‐23 and 2027‐28.
Elementary enrollment declines during the first five years of the forecast, amounting to a loss of
about 1,000 K‐5th grade students. Secondary enrollments increase initially; beginning in 2021‐22
middle grades experience several years of decline followed by decline in high school enrollment
beginning in 2025‐26.
In the high scenario, K‐12 enrollment growth averages 389 students annually, reaching 54,514 in
2032‐33. K‐12 growth in the first five years between 2017‐18 and 2022‐23 exceeds the most
recent five years since 2012‐13, in spite of a small loss of about 100 students in elementary grades.
Enrollment forecasts in five year increments based on these three district‐wide forecast scenarios
are summarized in Table 9. Five years of history are included in the table for comparison. Detailed
forecasts by year and by individual grade are in Appendix A.
35
Table 9
PPS District‐wide Forecasts by Grade Level
MIDDLE Series
Historic Forecast
2012‐13 2017‐18 2022‐23 2027‐28 2032‐33
Grades K‐5 23,751 24,481 23,907 24,754 25,637
5 year change 730 ‐574 847 883
Grades 6‐8 10,020 10,780 11,429 11,296 11,759
5 year change 760 649 ‐133 463
Grades 9‐12 12,746 13,423 14,937 14,949 14,826
5 year change 677 1,514 12 ‐123
Total K‐12 46,517 48,684 50,273 50,999 52,222
5 year change 2,167 1,589 726 1,223
LOW Series
Historic Forecast
2012‐13 2017‐18 2022‐23 2027‐28 2032‐33Grades K‐5 23,751 24,481 23,459 24,112 24,689
5 year change 730 ‐1,022 653 577
Grades 6‐8 10,020 10,780 11,316 11,002 11,371
5 year change 760 536 ‐314 369
Grades 9‐12 12,746 13,423 14,811 14,641 14,390
5 year change 677 1,388 ‐170 ‐251
Total K‐12 46,517 48,684 49,586 49,755 50,450
5 year change 2,167 902 169 695
HIGH Series
Historic Forecast
2012‐13 2017‐18 2022‐23 2027‐28 2032‐33Grades K‐5 23,751 24,481 24,378 25,412 26,601
5 year change 730 ‐103 1,034 1,189
Grades 6‐8 10,020 10,780 11,615 11,708 12,281
5 year change 760 835 93 573
Grades 9‐12 12,746 13,423 15,202 15,514 15,632
5 year change 677 1,779 312 118
Total K‐12 46,517 48,684 51,195 52,634 54,514
5 year change 2,167 2,511 1,439 1,880
Source: Historic enrollment, Portland Public Schools; enrollment forecasts, Population
Research Center, PSU. Does not include pre‐kindergarten.

36
Resident Enrollment Forecasts by High School Cluster: Methodology
Grade progression models are used to forecast the number of PPS students residing in each of the
District’s eight high school clusters (HSCLs). The HSCL kindergarten forecasts utilize a combination
of two methods: ratios of resident kindergarten students to corresponding births and HSCL shares
of district‐wide kindergarten, adjusted to reflect the expected geographic distribution of future
housing development. For grades 1 to 12, GPRs account for the effects of mobility, capture rates,
and dropout or retention rates. They are initially based on averages of the ratios from the past
five years, and are adjusted as needed to mute the influence of extreme outliers or to incorporate
assumptions about growth. Information from the City of Portland’s Comprehensive Plan update
provided guidance about the potential distribution of future growth.
Under the City of Portland 2035 Comprehensive Plan, the number of housing units within PPS
could grow to about 314,000. That would be a significant increase over the 2010 housing stock
of about 219,000 units. However, enrollment will grow at a much slower rate than the rate of
housing growth due to decreases in household size and an increasing share of smaller housing
units associated with changing demand and limited land supply. Given the expected mix of new
housing under an average of the alternative scenarios, a housing‐based model using SGRs specific
to the 11 housing types depicted in the Comprehensive Plan’s Scenarios Background Report
produced district‐wide enrollment growth similar to the middle series cohort‐component
forecast.9 Results of the housing model for each HSCL were not used explicitly in the model, but
they influenced the final adjustments of GPRs as well as HSCL shares of district‐wide births and
kindergarten to birth ratios.
Resident Enrollment Forecasts by High School Cluster: Results
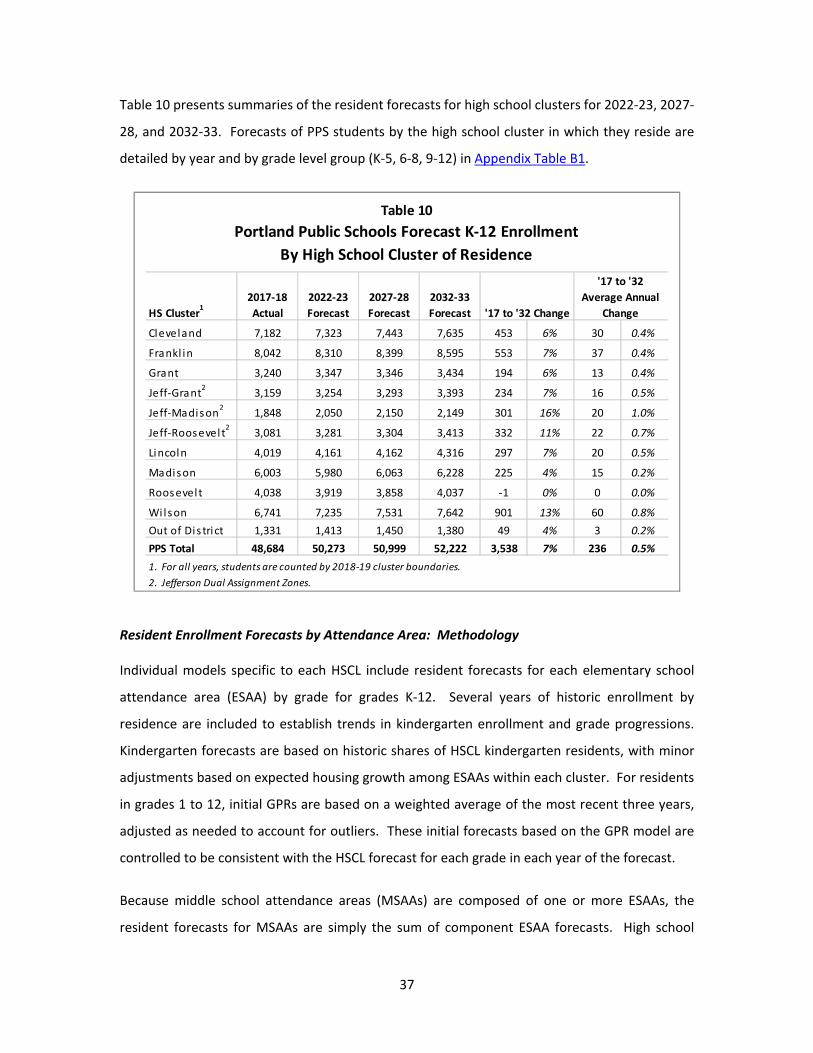
The largest numeric growth between 2017‐18 and 2032‐33 in the number of PPS K‐12 residents
occurs in the Wilson HSCL (901 students). The Jefferson‐Madison, Jefferson‐Roosevelt, and
Wilson HSCLs each experience double digit percentage growth. The 15 year growth rate in each
of the other clusters is at or below the District average of seven percent for the period.
9 See Table 12 in Scenarios Background Report, City of Portland, Bureau of Planning and Sustainability, July
2015. http://www.portlandoregon.gov/bps/article/531170.
37
Table 10 presents summaries of the resident forecasts for high school clusters for 2022‐23, 2027‐
28, and 2032‐33. Forecasts of PPS students by the high school cluster in which they reside are
detailed by year and by grade level group (K‐5, 6‐8, 9‐12) in Appendix Table B1.
Resident Enrollment Forecasts by Attendance Area: Methodology
Individual models specific to each HSCL include resident forecasts for each elementary school
attendance area (ESAA) by grade for grades K‐12. Several years of historic enrollment by
residence are included to establish trends in kindergarten enrollment and grade progressions.
Kindergarten forecasts are based on historic shares of HSCL kindergarten residents, with minor
adjustments based on expected housing growth among ESAAs within each cluster. For residents
in grades 1 to 12, initial GPRs are based on a weighted average of the most recent three years,
adjusted as needed to account for outliers. These initial forecasts based on the GPR model are
controlled to be consistent with the HSCL forecast for each grade in each year of the forecast.
Because middle school attendance areas (MSAAs) are composed of one or more ESAAs, the
resident forecasts for MSAAs are simply the sum of component ESAA forecasts. High school
Table 10
Portland Public Schools Forecast K‐12 Enrollment
By High School Cluster of Residence
HS Cluster1
2017‐18
Actual
2022‐23
Forecast
2027‐28
Forecast
2032‐33
Forecast
Cleveland 7,182 7,323 7,443 7,635 453 6% 30 0.4%
Frankl in 8,042 8,310 8,399 8,595 553 7% 37 0.4%
Grant 3,240 3,347 3,346 3,434 194 6% 13 0.4%
Jeff‐Grant2
3,159 3,254 3,293 3,393 234 7% 16 0.5%
Jeff‐Madison2
1,848 2,050 2,150 2,149 301 16% 20 1.0%
Jeff‐Roosevel t2
3,081 3,281 3,304 3,413 332 11% 22 0.7%
Lincoln 4,019 4,161 4,162 4,316 297 7% 20 0.5%
Madison 6,003 5,980 6,063 6,228 225 4% 15 0.2%
Roosevel t 4,038 3,919 3,858 4,037 ‐1 0% 0 0.0%
Wilson 6,741 7,235 7,531 7,642 901 13% 60 0.8%
Out of Dis trict 1,331 1,413 1,450 1,380 49 4% 3 0.2%
PPS Total 48,684 50,273 50,999 52,222 3,538 7% 236 0.5%
2. Jefferson Dual Assignment Zones.
'17 to '32 Change
'17 to '32
Average Annual
Change
1. For all years, students are counted by 2018‐19 cluster boundaries.

38
attendance area (HSAA) forecasts are also the sum of ESAA forecasts, although the Jefferson‐
Madison and Jefferson‐Roosevelt Dual Assignment Zones split the Faubion ESAA, requiring the
Faubion ESAA forecast to be allocated to each zone. The Bridlemile ESAA forecast is also split,
reflecting portions assigned to either the West Sylvan or Gray MSAAs and the Lincoln or Wilson
HSAAs beginning in the 2018‐19 school year.
Resident Enrollment Forecasts by Attendance Area: Results
Resident forecasts by attendance area are detailed in Appendix Tables B2 to B6 for the relevant
grade levels. That is, K‐5th grade for ESAAs, 6th‐8th grade for MSAAs, and 9th‐12th grade for HSAAs.
Forecasts are tabulated for each year from 2018‐19 to 2032‐33, the same horizon as the district‐
wide forecasts. The history and forecasts in Tables B2 to B6 are tabulated by 2018‐19 boundaries.
Enrollment Forecasts for Individual Schools: Methodology
Historic figures for resident and non‐resident enrollment for individual neighborhood schools are
compiled within the same models for each HSCL as the attendance area resident forecasts.
The resident forecast for each neighborhood school relies on its attendance area resident forecast
and assumptions about its capture rate of attendance area residents at the entry grade. These
entry grade rates are based on recent trends. For example, an elementary school with a forecast
of 100 PPS kindergarten residents and a kindergarten capture rate of 0.85 would be expected to
enroll 85 neighborhood students. Forecasts of other grades are based on GPRs, in the manner of
the resident forecasts in the same models. The share of residents attending their neighborhood
school can change in the forecast, but the relationship between resident enrollment and total
residents in an attendance area is monitored closely. Certainly, the number of residents at a
school can’t exceed the number of attendance area residents attending all PPS schools, by grade
level.
Nonresident enrollment at individual neighborhood schools is based on historic trends and
information about the number of school choice lottery transfer slots or special programs such as

39
language immersion. Some neighborhood schools that have limited classroom space are closed
to new lottery transfers and will gradually reduce their non‐resident enrollment.10
Forecasts for middle schools and high schools are similar to those for elementary and K‐8 schools
except that the entry grade for resident shares and non‐resident totals is 6th or 9th grade instead
of kindergarten. Some high schools have more than one resident enrollment component, due to
past boundary changes or dual assignment zones.
The forecasts for eight schools and programs that do not have a neighborhood boundary also are
grade progression models similar to the non‐resident portion for the neighborhood schools. The
“other schools and programs” category is computed as the residual of district‐wide enrollment
minus grade level enrollments at each of the neighborhood and non‐neighborhood schools for
which individual forecasts are prepared. As a check to prevent the residual from deviating
substantially from historic norms and trends, it is compared with a grade progression forecast
that utilizes enrollment history for the “other schools and programs” category. Final adjustments
are made to forecasts for individual schools to minimize the differences between the residual and
grade progression methods.
Enrollment Forecasts for Individual Schools: Results
The school forecasts maintain the 2018‐19 boundaries and grade configurations for all
neighborhood schools throughout the 15 year forecast horizon. While reduction in non‐resident
enrollment may occur due to fewer lottery transfers at many schools, school capacities do not
constrain the forecasts.
Enrollments are stable at most of the non‐neighborhood schools, with similar numbers of
students at each grade year after year. An exception in these forecasts is Benson High School,
where the number of freshman slots was raised from 275 in the 2015‐16 school year to 300 in
2016‐17.
10 Information about school choice and the number of lottery transfer slots at each school is available at
http://www.pps.net/Page/2343.
40
Appendix C includes annual enrollment forecasts for each of the District’s neighborhood schools
and eight schools and programs that do not have a neighborhood boundary (ACCESS, Benson
High, Creative Science, da Vinci, Metropolitan Learning Center, Odyssey, Richmond, and
Winterhaven). PPS students not attending any of the schools listed in the tables are combined in
the “Other Schools and Programs” category. These include other focus/alternative programs,
community based programs, special services, and public charter schools.
41
FORECAST ACCURACY
Enrollment forecasts are utilized as a school planning tool and as a basis for community
discussions about future school facility needs. Due to the nature of forecasting, there is no way
to estimate a confidence interval as one might for data collected from a survey. The best way to
measure potential forecast error is to compare actual enrollments with previous forecasts that
were conducted using similar data and methodologies.
This is the 19th consecutive year that PRC has conducted enrollment forecasts for PPS. Table 11
compares the total K‐12 forecasts from each of the past 10 series with the actual K‐12 enrollments
through 2017‐18. The “base year” indicates the most recent actual enrollment that PRC
researchers used when they prepared the forecasts.
Forecasts based on 2007‐08 enrollment predicted that enrollment would fall each year until 2011‐
12 and then increase slightly. The actual enrollment decline only persisted until 2008‐09, and the
subsequent increases were much greater than forecast, resulting in steadily increasing errors —
as great as 6.6 percent for 2017‐18 forecasts done ten years previously. District‐wide forecasts
prepared since 2009‐10 have been much more accurate; actual K‐12 enrollments have fallen
within one percent of forecast enrollments in the first year of each middle series, and have not
differed by more than 1.5 percent in any year.
Forecasts of total K‐12 enrollment tend to be more accurate than forecasts for individual grades
because of compensating errors. For example, if 9th grade forecasts are too high and 8th grade
forecasts are too low, the errors may cancel each other out in the K‐12 total. Table 12 reports
grade level errors in the middle scenario forecasts for school year 2017‐18 prepared in each of
the four previous years. The 1.2 percent mean absolute percentage error (MAPE) in the one year
forecast was lower than the longer range forecasts, illustrating the value of an annual “reset” to
more closely predict individual grades enrollments. The largest one year errors were for
kindergarten and 6th grade, in which actual enrollments fell short of the forecasts, and 11th and
12th grades, in which actual enrollments exceeded the forecast.
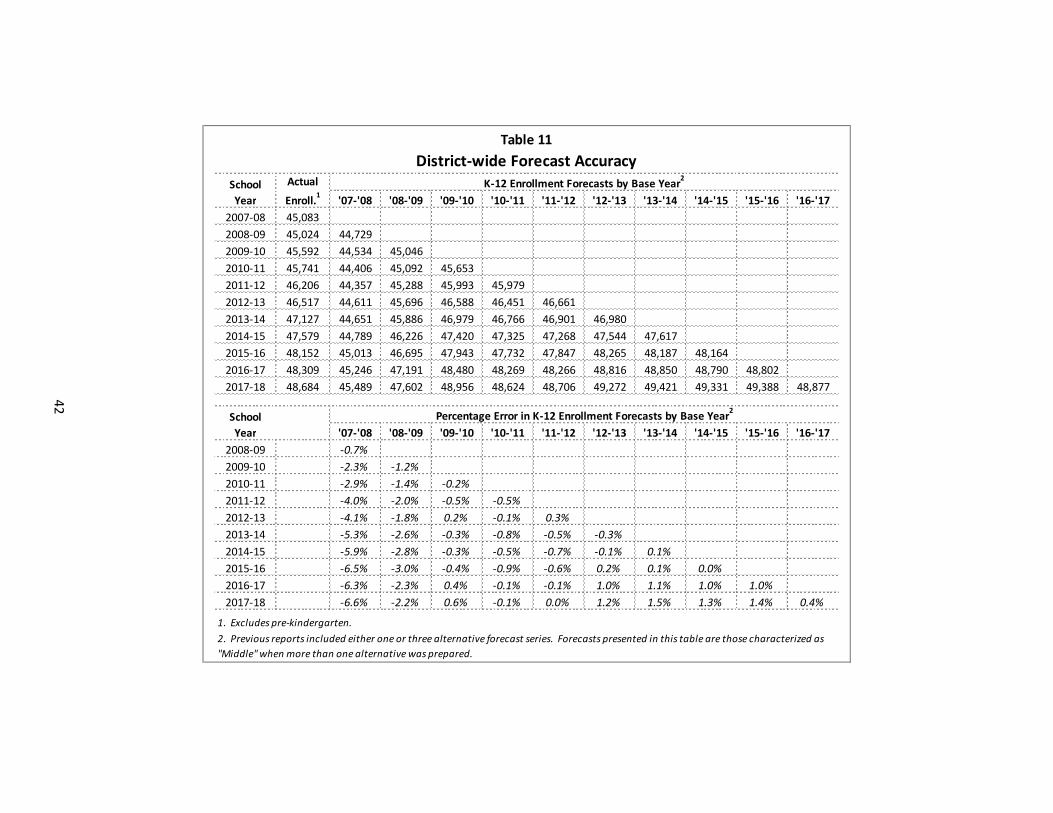
Table 11
District‐wide Forecast AccuracyK‐12 Enrollment Forecasts by Base Year
2
'07‐'08 '08‐'09 '09‐'10 '10‐'11 '11‐'12 '12‐'13 '13‐'14 '14‐'15 '15‐'16 '16‐'17
2007‐08 45,083
2008‐09 45,024 44,729
2009‐10 45,592 44,534 45,046
2010‐11 45,741 44,406 45,092 45,653
2011‐12 46,206 44,357 45,288 45,993 45,979
2012‐13 46,517 44,611 45,696 46,588 46,451 46,661
2013‐14 47,127 44,651 45,886 46,979 46,766 46,901 46,980
2014‐15 47,579 44,789 46,226 47,420 47,325 47,268 47,544 47,617
2015‐16 48,152 45,013 46,695 47,943 47,732 47,847 48,265 48,187 48,164
2016‐17 48,309 45,246 47,191 48,480 48,269 48,266 48,816 48,850 48,790 48,802
2017‐18 48,684 45,489 47,602 48,956 48,624 48,706 49,272 49,421 49,331 49,388 48,877
Percentage Error in K‐12 Enrollment Forecasts by Base Year2
'07‐'08 '08‐'09 '09‐'10 '10‐'11 '11‐'12 '12‐'13 '13‐'14 '14‐'15 '15‐'16 '16‐'17
2008‐09 ‐0.7%
2009‐10 ‐2.3% ‐1.2%
2010‐11 ‐2.9% ‐1.4% ‐0.2%
2011‐12 ‐4.0% ‐2.0% ‐0.5% ‐0.5%
2012‐13 ‐4.1% ‐1.8% 0.2% ‐0.1% 0.3%
2013‐14 ‐5.3% ‐2.6% ‐0.3% ‐0.8% ‐0.5% ‐0.3%
2014‐15 ‐5.9% ‐2.8% ‐0.3% ‐0.5% ‐0.7% ‐0.1% 0.1%
2015‐16 ‐6.5% ‐3.0% ‐0.4% ‐0.9% ‐0.6% 0.2% 0.1% 0.0%
2016‐17 ‐6.3% ‐2.3% 0.4% ‐0.1% ‐0.1% 1.0% 1.1% 1.0% 1.0%
2017‐18 ‐6.6% ‐2.2% 0.6% ‐0.1% 0.0% 1.2% 1.5% 1.3% 1.4% 0.4%
2. Previous reports included either one or three alternative forecast series. Forecasts presented in this table are those characterized as
"Middle" when more than one alternative was prepared.
School
Year
Actual
Enroll.1
School
Year
1. Excludes pre‐kindergarten.
42

43
Table 12
Forecast Accuracy by Grade Level, 2017‐18 Enrollments
2017‐18 Enrollment Forecasts by Base Year*
2016‐17 (1 yr.) 2015‐16 (2 yr.) 2014‐15 (3 yr.) 2013‐14 (4 yr.)
Fcst. Error Fcst. Error Fcst. Error Fcst. Error
K 3,948 4,057 2.8% 4,089 3.6% 4,124 4.5% 4,128 4.6%
1 4,106 4,128 0.5% 4,191 2.1% 4,207 2.5% 4,192 2.1%
2 4,070 4,095 0.6% 4,133 1.5% 4,131 1.5% 4,126 1.4%
3 4,133 4,165 0.8% 4,171 0.9% 4,121 ‐0.3% 4,143 0.2%
4 4,137 4,110 ‐0.7% 4,165 0.7% 4,161 0.6% 4,130 ‐0.2%
5 4,087 4,080 ‐0.2% 4,132 1.1% 4,150 1.5% 4,160 1.8%
6 3,704 3,781 2.1% 3,796 2.5% 3,797 2.5% 3,828 3.3%
7 3,523 3,541 0.5% 3,616 2.6% 3,624 2.9% 3,627 3.0%
8 3,553 3,578 0.7% 3,659 3.0% 3,626 2.1% 3,673 3.4%
9 3,344 3,386 1.3% 3,435 2.7% 3,383 1.2% 3,481 4.1%
10 3,228 3,255 0.8% 3,313 2.6% 3,285 1.8% 3,385 4.9%
11 3,220 3,133 ‐2.7% 3,164 ‐1.7% 3,125 ‐3.0% 3,142 ‐2.4%
12 3,631 3,568 ‐1.7% 3,524 ‐2.9% 3,597 ‐0.9% 3,406 ‐6.2%
Total 48,684 48,877 0.4% 49,388 1.4% 49,331 1.3% 49,421 1.5%
Mean Absolute Pct. Error 1.2% 2.2% 1.9% 2.9%
*Note: Middle Scenarios
2017‐18
Enroll‐
mentGrade

APPENDIX A
DISTRICT‐WIDE ENROLLMENT FORECASTS
2018‐19 to 2032‐33

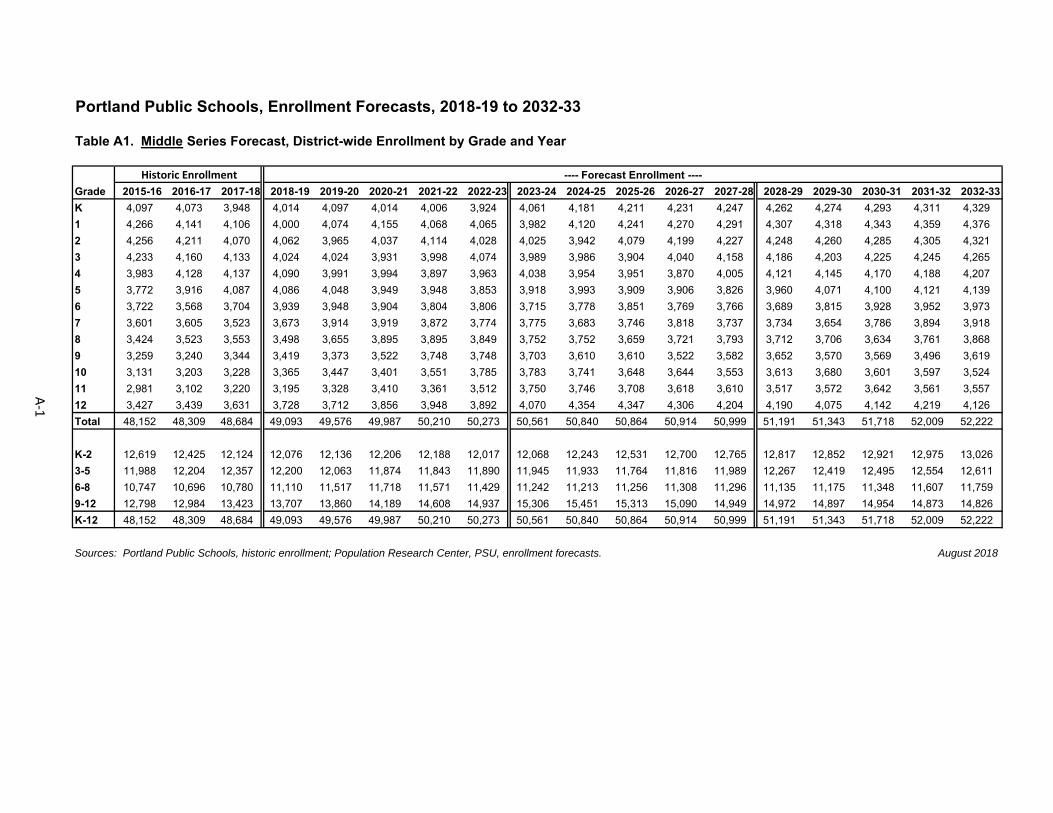
Portland Public Schools, Enrollment Forecasts, 2018-19 to 2032-33
Table A1. Middle Series Forecast, District-wide Enrollment by Grade and Year
Historic Enrollment ---- Forecast Enrollment ----
Grade 2015-16 2016-17 2017-18 2018-19 2019-20 2020-21 2021-22 2022-23 2023-24 2024-25 2025-26 2026-27 2027-28 2028-29 2029-30 2030-31 2031-32 2032-33
K 4,097 4,073 3,948 4,014 4,097 4,014 4,006 3,924 4,061 4,181 4,211 4,231 4,247 4,262 4,274 4,293 4,311 4,329
1 4,266 4,141 4,106 4,000 4,074 4,155 4,068 4,065 3,982 4,120 4,241 4,270 4,291 4,307 4,318 4,343 4,359 4,376
2 4,256 4,211 4,070 4,062 3,965 4,037 4,114 4,028 4,025 3,942 4,079 4,199 4,227 4,248 4,260 4,285 4,305 4,321
3 4,233 4,160 4,133 4,024 4,024 3,931 3,998 4,074 3,989 3,986 3,904 4,040 4,158 4,186 4,203 4,225 4,245 4,265
4 3,983 4,128 4,137 4,090 3,991 3,994 3,897 3,963 4,038 3,954 3,951 3,870 4,005 4,121 4,145 4,170 4,188 4,207
5 3,772 3,916 4,087 4,086 4,048 3,949 3,948 3,853 3,918 3,993 3,909 3,906 3,826 3,960 4,071 4,100 4,121 4,139
6 3,722 3,568 3,704 3,939 3,948 3,904 3,804 3,806 3,715 3,778 3,851 3,769 3,766 3,689 3,815 3,928 3,952 3,973
7 3,601 3,605 3,523 3,673 3,914 3,919 3,872 3,774 3,775 3,683 3,746 3,818 3,737 3,734 3,654 3,786 3,894 3,918
8 3,424 3,523 3,553 3,498 3,655 3,895 3,895 3,849 3,752 3,752 3,659 3,721 3,793 3,712 3,706 3,634 3,761 3,868
9 3,259 3,240 3,344 3,419 3,373 3,522 3,748 3,748 3,703 3,610 3,610 3,522 3,582 3,652 3,570 3,569 3,496 3,619
10 3,131 3,203 3,228 3,365 3,447 3,401 3,551 3,785 3,783 3,741 3,648 3,644 3,553 3,613 3,680 3,601 3,597 3,524
11 2,981 3,102 3,220 3,195 3,328 3,410 3,361 3,512 3,750 3,746 3,708 3,618 3,610 3,517 3,572 3,642 3,561 3,557
12 3,427 3,439 3,631 3,728 3,712 3,856 3,948 3,892 4,070 4,354 4,347 4,306 4,204 4,190 4,075 4,142 4,219 4,126
Total 48,152 48,309 48,684 49,093 49,576 49,987 50,210 50,273 50,561 50,840 50,864 50,914 50,999 51,191 51,343 51,718 52,009 52,222
K-2 12,619 12,425 12,124 12,076 12,136 12,206 12,188 12,017 12,068 12,243 12,531 12,700 12,765 12,817 12,852 12,921 12,975 13,026
3-5 11,988 12,204 12,357 12,200 12,063 11,874 11,843 11,890 11,945 11,933 11,764 11,816 11,989 12,267 12,419 12,495 12,554 12,611
6-8 10,747 10,696 10,780 11,110 11,517 11,718 11,571 11,429 11,242 11,213 11,256 11,308 11,296 11,135 11,175 11,348 11,607 11,759
9-12 12,798 12,984 13,423 13,707 13,860 14,189 14,608 14,937 15,306 15,451 15,313 15,090 14,949 14,972 14,897 14,954 14,873 14,826
K-12 48,152 48,309 48,684 49,093 49,576 49,987 50,210 50,273 50,561 50,840 50,864 50,914 50,999 51,191 51,343 51,718 52,009 52,222
Sources: Portland Public Schools, historic enrollment; Population Research Center, PSU, enrollment forecasts. August 2018
A-1

Portland Public Schools, Enrollment Forecasts, 2018-19 to 2032-33
Table A2. Low Series Forecast, District-wide Enrollment by Grade and Year
Historic Enrollment ---- Forecast Enrollment ----
Grade 2015-16 2016-17 2017-18 2018-19 2019-20 2020-21 2021-22 2022-23 2023-24 2024-25 2025-26 2026-27 2027-28 2028-29 2029-30 2030-31 2031-32 2032-33
K 4,097 4,073 3,948 3,968 4,043 3,958 3,945 3,857 3,981 4,091 4,119 4,133 4,138 4,144 4,146 4,155 4,161 4,167
1 4,266 4,141 4,106 3,948 4,016 4,096 4,007 3,997 3,909 4,033 4,145 4,172 4,186 4,192 4,193 4,203 4,209 4,214
2 4,256 4,211 4,070 4,051 3,903 3,974 4,049 3,961 3,951 3,864 3,987 4,097 4,124 4,138 4,140 4,149 4,155 4,160
3 4,233 4,160 4,133 4,013 4,002 3,859 3,926 4,000 3,913 3,903 3,817 3,939 4,047 4,074 4,084 4,094 4,099 4,104
4 3,983 4,128 4,137 4,078 3,968 3,960 3,814 3,880 3,953 3,867 3,857 3,773 3,893 4,000 4,022 4,040 4,046 4,051
5 3,772 3,916 4,087 4,074 4,024 3,919 3,907 3,764 3,829 3,901 3,816 3,807 3,724 3,842 3,944 3,973 3,987 3,993
6 3,722 3,568 3,704 3,928 3,924 3,877 3,771 3,763 3,625 3,688 3,758 3,676 3,667 3,587 3,697 3,803 3,827 3,841
7 3,601 3,605 3,523 3,662 3,892 3,892 3,841 3,738 3,728 3,591 3,653 3,722 3,641 3,632 3,550 3,666 3,767 3,791
8 3,424 3,523 3,553 3,488 3,634 3,869 3,864 3,815 3,713 3,702 3,564 3,626 3,694 3,614 3,601 3,527 3,639 3,739
9 3,259 3,240 3,344 3,411 3,355 3,499 3,719 3,715 3,667 3,569 3,559 3,427 3,487 3,553 3,472 3,466 3,392 3,499
10 3,131 3,203 3,228 3,358 3,433 3,380 3,525 3,752 3,746 3,701 3,604 3,590 3,455 3,515 3,577 3,503 3,494 3,420
11 2,981 3,102 3,220 3,188 3,315 3,393 3,337 3,483 3,714 3,706 3,665 3,571 3,553 3,417 3,473 3,541 3,465 3,456
12 3,427 3,439 3,631 3,720 3,697 3,837 3,925 3,861 4,033 4,308 4,297 4,252 4,146 4,120 3,956 4,028 4,103 4,015
Total 48,152 48,309 48,684 48,887 49,206 49,513 49,630 49,586 49,762 49,924 49,841 49,785 49,755 49,828 49,855 50,148 50,344 50,450
K-2 12,619 12,425 12,124 11,967 11,962 12,028 12,001 11,815 11,841 11,988 12,251 12,402 12,448 12,474 12,479 12,507 12,525 12,541
3-5 11,988 12,204 12,357 12,165 11,994 11,738 11,647 11,644 11,695 11,671 11,490 11,519 11,664 11,916 12,050 12,107 12,132 12,148
6-8 10,747 10,696 10,780 11,078 11,450 11,638 11,476 11,316 11,066 10,981 10,975 11,024 11,002 10,833 10,848 10,996 11,233 11,371
9-12 12,798 12,984 13,423 13,677 13,800 14,109 14,506 14,811 15,160 15,284 15,125 14,840 14,641 14,605 14,478 14,538 14,454 14,390
K-12 48,152 48,309 48,684 48,887 49,206 49,513 49,630 49,586 49,762 49,924 49,841 49,785 49,755 49,828 49,855 50,148 50,344 50,450
Sources: Portland Public Schools, historic enrollment; Population Research Center, PSU, enrollment forecasts. August 2018
A-2

Portland Public Schools, Enrollment Forecasts, 2018-19 to 2032-33
Table A3. High Series Forecast, District-wide Enrollment by Grade and Year
Historic Enrollment ---- Forecast Enrollment ----
Grade 2015-16 2016-17 2017-18 2018-19 2019-20 2020-21 2021-22 2022-23 2023-24 2024-25 2025-26 2026-27 2027-28 2028-29 2029-30 2030-31 2031-32 2032-33
K 4,097 4,073 3,948 4,063 4,152 4,071 4,065 3,984 4,131 4,260 4,293 4,322 4,347 4,371 4,396 4,433 4,467 4,500
1 4,266 4,141 4,106 4,046 4,134 4,225 4,138 4,136 4,055 4,203 4,334 4,367 4,397 4,421 4,446 4,479 4,513 4,546
2 4,256 4,211 4,070 4,077 4,021 4,107 4,197 4,111 4,109 4,028 4,175 4,305 4,338 4,368 4,391 4,421 4,449 4,483
3 4,233 4,160 4,133 4,039 4,050 3,992 4,077 4,166 4,081 4,079 3,999 4,145 4,274 4,306 4,336 4,363 4,389 4,416
4 3,983 4,128 4,137 4,106 4,017 4,023 3,965 4,049 4,137 4,053 4,051 3,972 4,117 4,244 4,276 4,310 4,333 4,358
5 3,772 3,916 4,087 4,102 4,076 3,983 3,989 3,932 4,016 4,103 4,020 4,018 3,939 4,083 4,209 4,245 4,275 4,298
6 3,722 3,568 3,704 3,955 3,975 3,943 3,852 3,861 3,806 3,888 3,973 3,892 3,890 3,813 3,953 4,080 4,111 4,140
7 3,601 3,605 3,523 3,687 3,942 3,958 3,926 3,836 3,844 3,788 3,870 3,955 3,874 3,872 3,795 3,939 4,061 4,092
8 3,424 3,523 3,553 3,512 3,680 3,934 3,949 3,918 3,829 3,836 3,778 3,859 3,944 3,863 3,861 3,788 3,928 4,049
9 3,259 3,240 3,344 3,433 3,396 3,557 3,800 3,815 3,785 3,699 3,706 3,651 3,730 3,812 3,734 3,735 3,661 3,797
10 3,131 3,203 3,228 3,378 3,472 3,434 3,600 3,852 3,865 3,838 3,752 3,755 3,697 3,776 3,859 3,784 3,781 3,707
11 2,981 3,102 3,220 3,207 3,351 3,444 3,407 3,574 3,831 3,842 3,818 3,734 3,733 3,673 3,751 3,836 3,758 3,755
12 3,427 3,439 3,631 3,742 3,737 3,894 4,003 3,961 4,158 4,464 4,474 4,450 4,354 4,348 4,275 4,369 4,463 4,373
Total 48,152 48,309 48,684 49,347 50,003 50,565 50,968 51,195 51,647 52,081 52,243 52,425 52,634 52,950 53,282 53,782 54,189 54,514
K-2 12,619 12,425 12,124 12,186 12,307 12,403 12,400 12,231 12,295 12,491 12,802 12,994 13,082 13,160 13,233 13,333 13,429 13,529
3-5 11,988 12,204 12,357 12,247 12,143 11,998 12,031 12,147 12,234 12,235 12,070 12,135 12,330 12,633 12,821 12,918 12,997 13,072
6-8 10,747 10,696 10,780 11,154 11,597 11,835 11,727 11,615 11,479 11,512 11,621 11,706 11,708 11,548 11,609 11,807 12,100 12,281
9-12 12,798 12,984 13,423 13,760 13,956 14,329 14,810 15,202 15,639 15,843 15,750 15,590 15,514 15,609 15,619 15,724 15,663 15,632
K-12 48,152 48,309 48,684 49,347 50,003 50,565 50,968 51,195 51,647 52,081 52,243 52,425 52,634 52,950 53,282 53,782 54,189 54,514
Sources: Portland Public Schools, historic enrollment; Population Research Center, PSU, enrollment forecasts. August 2018
A-3

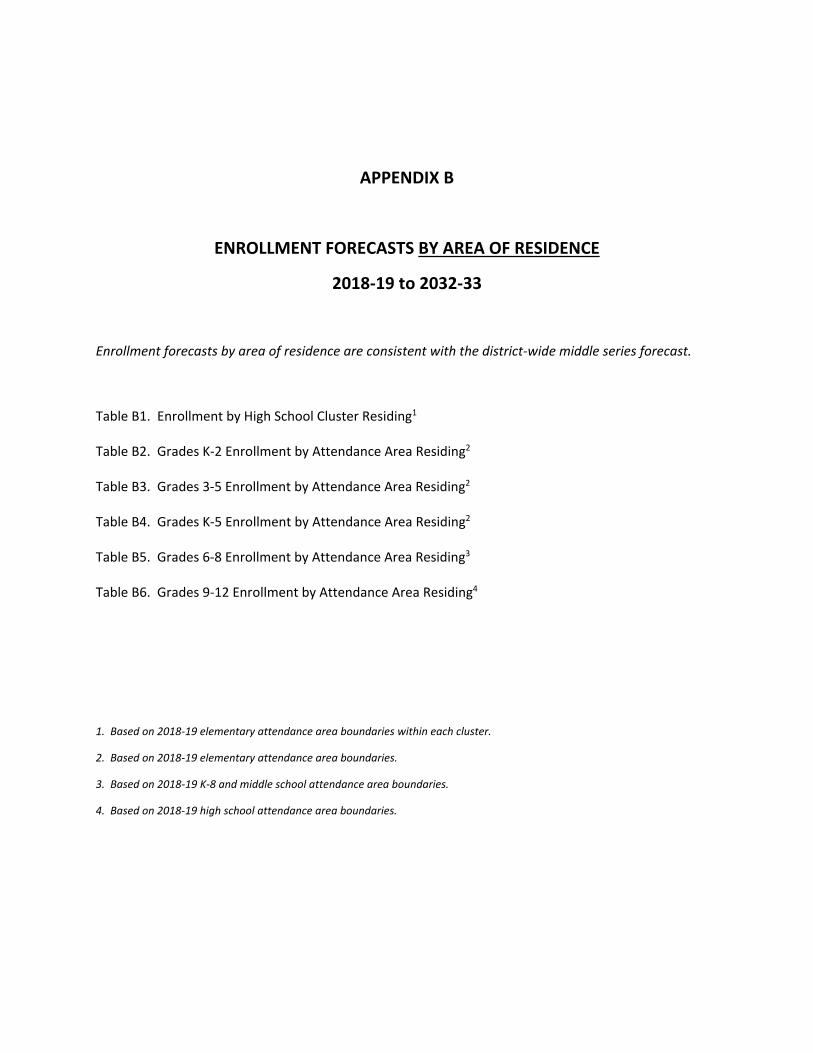
APPENDIX B
ENROLLMENT FORECASTS BY AREA OF RESIDENCE
2018‐19 to 2032‐33
Enrollment forecasts by area of residence are consistent with the district‐wide middle series forecast.
Table B1. Enrollment by High School Cluster Residing1
Table B2. Grades K‐2 Enrollment by Attendance Area Residing2
Table B3. Grades 3‐5 Enrollment by Attendance Area Residing2
Table B4. Grades K‐5 Enrollment by Attendance Area Residing2
Table B5. Grades 6‐8 Enrollment by Attendance Area Residing3
Table B6. Grades 9‐12 Enrollment by Attendance Area Residing4
1. Based on 2018‐19 elementary attendance area boundaries within each cluster.
2. Based on 2018‐19 elementary attendance area boundaries.
3. Based on 2018‐19 K‐8 and middle school attendance area boundaries.
4. Based on 2018‐19 high school attendance area boundaries.


Table B1
PPS Residents Forecast by Cluster and Grade Level, 2018‐19 to 2032‐33
Historic Forecast
Change 2017‐18
to 2032‐33
Cluster* 2017‐18 2018‐19 2019‐20 2020‐21 2021‐22 2022‐23 2023‐24 2024‐25 2025‐26 2026‐27 2027‐28 2028‐29 2029‐30 2030‐31 2031‐32 2032‐33 Number Percent
Cleveland Cluster
K‐5 3,638 3,614 3,608 3,609 3,604 3,581 3,585 3,609 3,629 3,665 3,703 3,757 3,795 3,818 3,837 3,852 214 6%
6‐8 1,646 1,652 1,690 1,672 1,667 1,662 1,670 1,659 1,658 1,655 1,660 1,638 1,643 1,662 1,703 1,733 87 5%
9‐12 1,898 1,966 1,954 2,029 2,074 2,080 2,099 2,101 2,092 2,079 2,080 2,076 2,066 2,065 2,055 2,050 152 8%
Total 7,182 7,232 7,252 7,310 7,345 7,323 7,354 7,369 7,379 7,399 7,443 7,471 7,504 7,545 7,595 7,635 453 6%
Franklin Cluster
K‐5 4,023 4,003 4,007 4,035 4,038 4,025 4,017 4,020 4,036 4,060 4,105 4,160 4,192 4,213 4,232 4,254 231 6%
6‐8 1,825 1,879 1,915 1,918 1,862 1,827 1,853 1,886 1,908 1,906 1,874 1,841 1,842 1,880 1,928 1,949 124 7%
9‐12 2,194 2,250 2,310 2,353 2,420 2,458 2,445 2,457 2,405 2,383 2,420 2,446 2,461 2,441 2,400 2,392 198 9%
Total 8,042 8,132 8,232 8,306 8,320 8,310 8,315 8,363 8,349 8,349 8,399 8,447 8,495 8,534 8,560 8,595 553 7%
Grant Cluster
K‐5 1,644 1,606 1,581 1,555 1,534 1,524 1,539 1,551 1,564 1,581 1,606 1,627 1,630 1,641 1,653 1,665 21 1%
6‐8 789 821 852 881 856 834 805 792 787 792 784 779 791 813 827 832 43 5%
9‐12 807 866 877 901 975 989 1,009 1,037 1,008 976 956 949 940 939 935 937 130 16%
Total 3,240 3,293 3,310 3,337 3,365 3,347 3,353 3,380 3,359 3,349 3,346 3,355 3,361 3,393 3,415 3,434 194 6%
Jefferson/Grant Cluster
K‐5 1,608 1,598 1,608 1,608 1,615 1,634 1,630 1,637 1,643 1,653 1,666 1,690 1,703 1,719 1,726 1,734 126 8%
6‐8 687 717 701 716 706 681 686 694 724 719 717 704 703 708 727 738 51 7%
9‐12 864 833 866 888 903 939 925 927 902 909 910 915 942 931 924 921 57 7%
Total 3,159 3,148 3,175 3,212 3,224 3,254 3,241 3,258 3,269 3,281 3,293 3,309 3,348 3,358 3,377 3,393 234 7%
Jefferson/Madison Cluster
K‐5 1,047 1,064 1,056 1,067 1,067 1,055 1,038 1,036 1,041 1,058 1,075 1,081 1,082 1,084 1,087 1,086 39 4%
6‐8 389 416 464 468 456 455 491 515 511 487 466 462 468 485 491 495 106 27%
9‐12 412 425 435 469 510 540 563 569 579 580 609 629 611 589 572 568 156 38%
Total 1,848 1,905 1,955 2,004 2,033 2,050 2,092 2,120 2,131 2,125 2,150 2,172 2,161 2,158 2,150 2,149 301 16%
Jefferson/Roosevelt Cluster
K‐5 1,664 1,636 1,608 1,618 1,650 1,651 1,656 1,680 1,686 1,701 1,714 1,739 1,755 1,762 1,767 1,773 109 7%
6‐8 667 676 704 746 719 691 665 673 688 693 702 685 686 694 712 722 55 8%
9‐12 750 781 840 899 916 939 972 965 949 928 888 912 921 920 923 918 168 22%
Total 3,081 3,093 3,152 3,263 3,285 3,281 3,293 3,318 3,323 3,322 3,304 3,336 3,362 3,376 3,402 3,413 332 11%
Forecast: Population Research Center, Portland State University, August 2018.
B-1
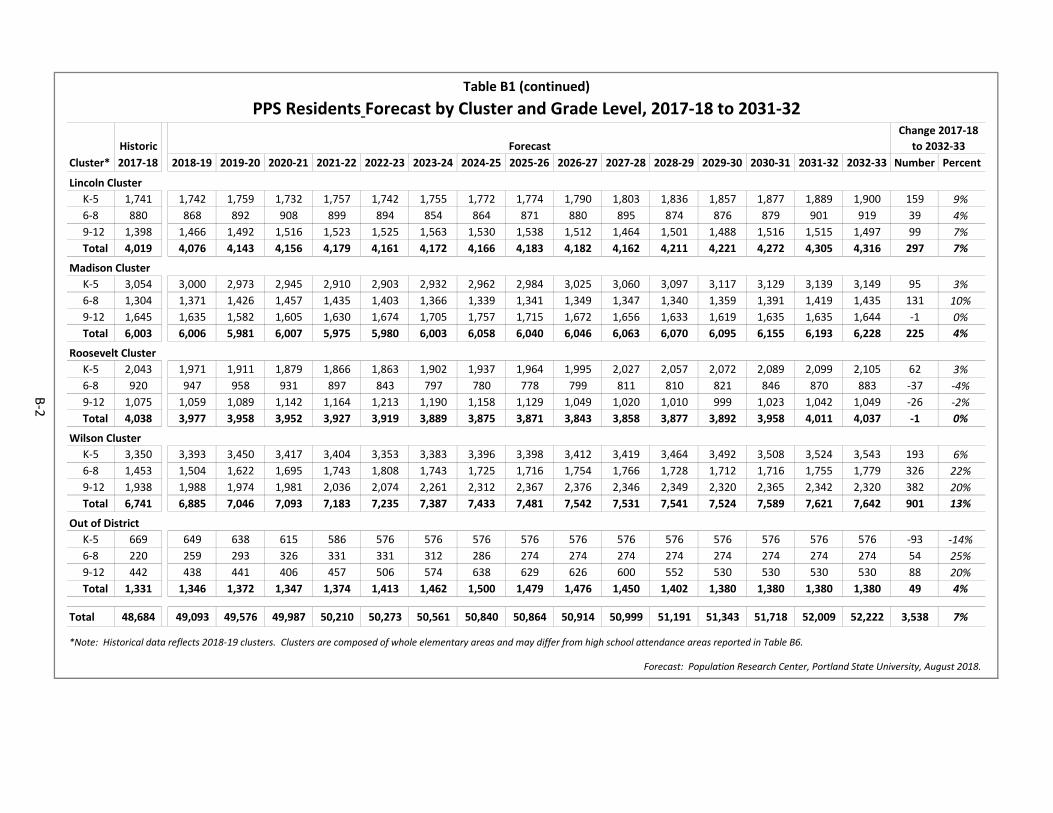
Table B1 (continued)
PPS Residents Forecast by Cluster and Grade Level, 2017‐18 to 2031‐32
Historic Forecast
Change 2017‐18
to 2032‐33
Cluster* 2017‐18 2018‐19 2019‐20 2020‐21 2021‐22 2022‐23 2023‐24 2024‐25 2025‐26 2026‐27 2027‐28 2028‐29 2029‐30 2030‐31 2031‐32 2032‐33 Number Percent
Lincoln Cluster
K‐5 1,741 1,742 1,759 1,732 1,757 1,742 1,755 1,772 1,774 1,790 1,803 1,836 1,857 1,877 1,889 1,900 159 9%
6‐8 880 868 892 908 899 894 854 864 871 880 895 874 876 879 901 919 39 4%
9‐12 1,398 1,466 1,492 1,516 1,523 1,525 1,563 1,530 1,538 1,512 1,464 1,501 1,488 1,516 1,515 1,497 99 7%
Total 4,019 4,076 4,143 4,156 4,179 4,161 4,172 4,166 4,183 4,182 4,162 4,211 4,221 4,272 4,305 4,316 297 7%
Madison Cluster
K‐5 3,054 3,000 2,973 2,945 2,910 2,903 2,932 2,962 2,984 3,025 3,060 3,097 3,117 3,129 3,139 3,149 95 3%
6‐8 1,304 1,371 1,426 1,457 1,435 1,403 1,366 1,339 1,341 1,349 1,347 1,340 1,359 1,391 1,419 1,435 131 10%
9‐12 1,645 1,635 1,582 1,605 1,630 1,674 1,705 1,757 1,715 1,672 1,656 1,633 1,619 1,635 1,635 1,644 ‐1 0%
Total 6,003 6,006 5,981 6,007 5,975 5,980 6,003 6,058 6,040 6,046 6,063 6,070 6,095 6,155 6,193 6,228 225 4%
Roosevelt Cluster
K‐5 2,043 1,971 1,911 1,879 1,866 1,863 1,902 1,937 1,964 1,995 2,027 2,057 2,072 2,089 2,099 2,105 62 3%
6‐8 920 947 958 931 897 843 797 780 778 799 811 810 821 846 870 883 ‐37 ‐4%
9‐12 1,075 1,059 1,089 1,142 1,164 1,213 1,190 1,158 1,129 1,049 1,020 1,010 999 1,023 1,042 1,049 ‐26 ‐2%
Total 4,038 3,977 3,958 3,952 3,927 3,919 3,889 3,875 3,871 3,843 3,858 3,877 3,892 3,958 4,011 4,037 ‐1 0%
Wilson Cluster
K‐5 3,350 3,393 3,450 3,417 3,404 3,353 3,383 3,396 3,398 3,412 3,419 3,464 3,492 3,508 3,524 3,543 193 6%
6‐8 1,453 1,504 1,622 1,695 1,743 1,808 1,743 1,725 1,716 1,754 1,766 1,728 1,712 1,716 1,755 1,779 326 22%
9‐12 1,938 1,988 1,974 1,981 2,036 2,074 2,261 2,312 2,367 2,376 2,346 2,349 2,320 2,365 2,342 2,320 382 20%
Total 6,741 6,885 7,046 7,093 7,183 7,235 7,387 7,433 7,481 7,542 7,531 7,541 7,524 7,589 7,621 7,642 901 13%
Out of District
K‐5 669 649 638 615 586 576 576 576 576 576 576 576 576 576 576 576 ‐93 ‐14%
6‐8 220 259 293 326 331 331 312 286 274 274 274 274 274 274 274 274 54 25%
9‐12 442 438 441 406 457 506 574 638 629 626 600 552 530 530 530 530 88 20%
Total 1,331 1,346 1,372 1,347 1,374 1,413 1,462 1,500 1,479 1,476 1,450 1,402 1,380 1,380 1,380 1,380 49 4%
Total 48,684 49,093 49,576 49,987 50,210 50,273 50,561 50,840 50,864 50,914 50,999 51,191 51,343 51,718 52,009 52,222 3,538 7%
Forecast: Population Research Center, Portland State University, August 2018.
*Note: Historical data reflects 2018‐19 clusters. Clusters are composed of whole elementary areas and may differ from high school attendance areas reported in Table B6.
B-2
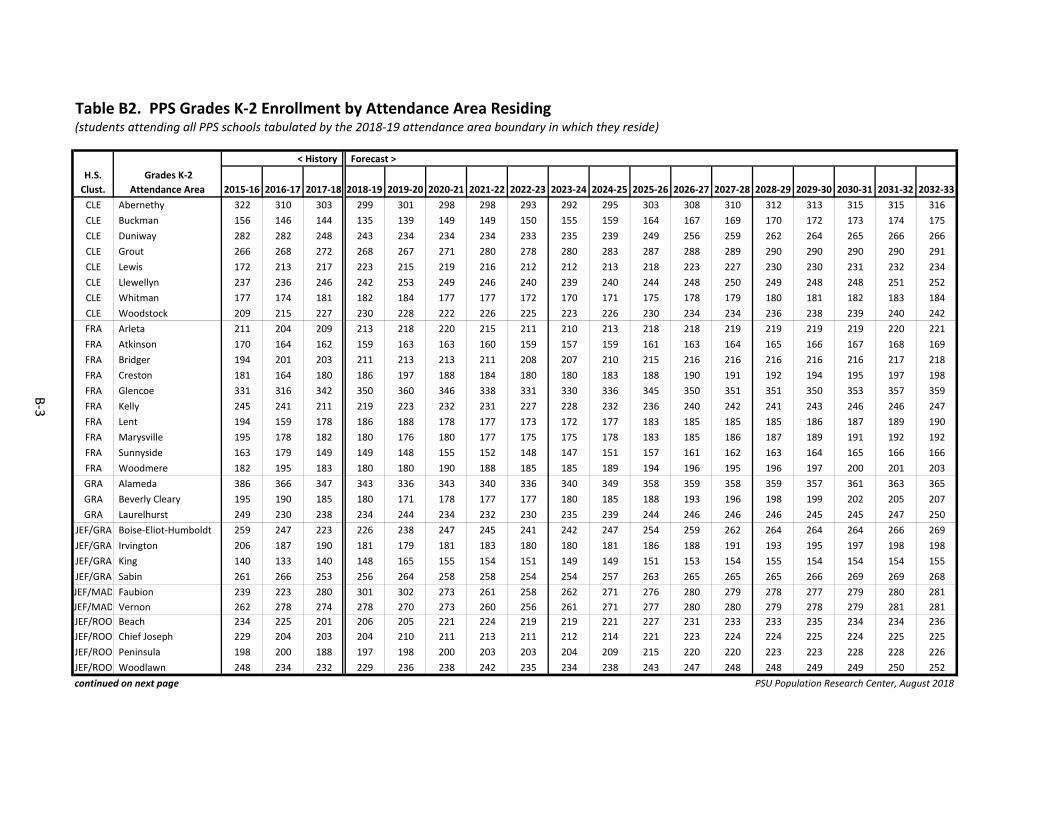
Table B2. PPS Grades K‐2 Enrollment by Attendance Area Residing(students attending all PPS schools tabulated by the 2018‐19 attendance area boundary in which they reside)
< History Forecast >
H.S.
Clust.
Grades K‐2
Attendance Area 2015‐16 2016‐17 2017‐18 2018‐19 2019‐20 2020‐21 2021‐22 2022‐23 2023‐24 2024‐25 2025‐26 2026‐27 2027‐28 2028‐29 2029‐30 2030‐31 2031‐32 2032‐33
CLE Abernethy 322 310 303 299 301 298 298 293 292 295 303 308 310 312 313 315 315 316
CLE Buckman 156 146 144 135 139 149 149 150 155 159 164 167 169 170 172 173 174 175
CLE Duniway 282 282 248 243 234 234 234 233 235 239 249 256 259 262 264 265 266 266
CLE Grout 266 268 272 268 267 271 280 278 280 283 287 288 289 290 290 290 290 291
CLE Lewis 172 213 217 223 215 219 216 212 212 213 218 223 227 230 230 231 232 234
CLE Llewellyn 237 236 246 242 253 249 246 240 239 240 244 248 250 249 248 248 251 252
CLE Whitman 177 174 181 182 184 177 177 172 170 171 175 178 179 180 181 182 183 184
CLE Woodstock 209 215 227 230 228 222 226 225 223 226 230 234 234 236 238 239 240 242
FRA Arleta 211 204 209 213 218 220 215 211 210 213 218 218 219 219 219 219 220 221
FRA Atkinson 170 164 162 159 163 163 160 159 157 159 161 163 164 165 166 167 168 169
FRA Bridger 194 201 203 211 213 213 211 208 207 210 215 216 216 216 216 216 217 218
FRA Creston 181 164 180 186 197 188 184 180 180 183 188 190 191 192 194 195 197 198
FRA Glencoe 331 316 342 350 360 346 338 331 330 336 345 350 351 351 350 353 357 359
FRA Kelly 245 241 211 219 223 232 231 227 228 232 236 240 242 241 243 246 246 247
FRA Lent 194 159 178 186 188 178 177 173 172 177 183 185 185 185 186 187 189 190
FRA Marysville 195 178 182 180 176 180 177 175 175 178 183 185 186 187 189 191 192 192
FRA Sunnyside 163 179 149 149 148 155 152 148 147 151 157 161 162 163 164 165 166 166
FRA Woodmere 182 195 183 180 180 190 188 185 185 189 194 196 195 196 197 200 201 203
GRA Alameda 386 366 347 343 336 343 340 336 340 349 358 359 358 359 357 361 363 365
GRA Beverly Cleary 195 190 185 180 171 178 177 177 180 185 188 193 196 198 199 202 205 207
GRA Laurelhurst 249 230 238 234 244 234 232 230 235 239 244 246 246 246 245 245 247 250
JEF/GRA Boise‐Eliot‐Humboldt 259 247 223 226 238 247 245 241 242 247 254 259 262 264 264 264 266 269
JEF/GRA Irvington 206 187 190 181 179 181 183 180 180 181 186 188 191 193 195 197 198 198
JEF/GRA King 140 133 140 148 165 155 154 151 149 149 151 153 154 155 154 154 154 155
JEF/GRA Sabin 261 266 253 256 264 258 258 254 254 257 263 265 265 265 266 269 269 268
JEF/MAD Faubion 239 223 280 301 302 273 261 258 262 271 276 280 279 278 277 279 280 281
JEF/MAD Vernon 262 278 274 278 270 273 260 256 261 271 277 280 280 279 278 279 281 281
JEF/ROO Beach 234 225 201 206 205 221 224 219 219 221 227 231 233 233 235 234 234 236
JEF/ROO Chief Joseph 229 204 203 204 210 211 213 211 212 214 221 223 224 224 225 224 225 225
JEF/ROO Peninsula 198 200 188 197 198 200 203 203 204 209 215 220 220 223 223 228 228 226
JEF/ROO Woodlawn 248 234 232 229 236 238 242 235 234 238 243 247 248 248 249 249 250 252
continued on next page PSU Population Research Center, August 2018
B-3

Table B2 (continued). PPS Grades K‐2 Enrollment by Attendance Area Residing(students attending all PPS schools tabulated by the 2018‐19 attendance area boundary in which they reside)
< History Forecast >
H.S.
Clust.
Grades K‐2
Attendance Area 2015‐16 2016‐17 2017‐18 2018‐19 2019‐20 2020‐21 2021‐22 2022‐23 2023‐24 2024‐25 2025‐26 2026‐27 2027‐28 2028‐29 2029‐30 2030‐31 2031‐32 2032‐33
LIN Ainsworth 257 239 235 236 249 260 263 256 256 257 266 272 275 277 280 282 284 286
LIN Chapman 322 330 285 282 293 301 311 305 307 309 317 323 330 334 337 340 341 343
LIN Forest Park 206 230 233 245 228 221 223 218 218 217 222 226 228 230 231 232 232 233
LIN Skyline 94 83 78 78 86 84 85 82 81 80 81 81 82 82 82 81 80 80
MAD Harrison Park 353 331 330 324 319 316 312 313 318 326 332 336 337 339 340 340 342 342
MAD Lee 253 232 217 205 221 216 212 211 215 219 224 228 229 231 231 234 231 230
MAD Rigler 291 308 279 274 265 272 270 266 270 276 283 288 289 292 293 294 294 295
MAD Rose City Park 228 227 222 228 232 239 238 232 232 237 241 243 242 241 242 243 245 245
MAD Scott 269 259 268 253 259 258 262 264 270 275 279 281 282 283 284 284 284 285
MAD Vestal 233 223 197 197 191 197 198 196 199 203 207 209 210 210 210 211 212 214
ROO Astor 231 188 183 179 174 177 177 177 180 185 190 194 196 197 198 201 202 203
ROO Cesar Chavez 156 144 127 127 122 127 129 131 134 137 140 141 143 146 147 149 149 149
ROO James John 288 268 244 237 241 249 252 251 255 261 269 273 277 279 279 279 280 281
ROO Rosa Parks 234 226 215 205 199 202 205 204 207 212 216 218 218 217 217 217 219 220
ROO Sitton 269 258 236 224 230 234 235 235 239 246 253 256 255 256 255 258 257 257
WIL Bridlemile 270 286 273 274 274 269 272 266 263 262 269 274 275 276 278 280 281 281
WIL Capitol Hill 229 249 244 245 236 245 247 241 241 242 249 253 255 257 259 262 264 267
WIL Hayhurst 253 267 265 254 244 260 261 254 253 254 262 264 265 267 268 269 271 272
WIL Maplewood 219 255 234 234 237 254 256 250 249 250 256 258 258 259 259 259 261 262
WIL Markham 271 256 269 269 271 263 265 259 258 258 264 267 268 267 266 266 267 268
WIL Rieke 214 222 209 212 207 218 219 213 211 210 215 219 219 219 220 222 223 224
WIL Stephenson 173 185 187 180 187 182 179 176 177 176 177 180 182 183 183 185 186 187
Grade K‐2 residing in PPS 12,306 12,094 11,821 11,800 11,870 11,940 11,922 11,751 11,802 11,977 12,265 12,434 12,499 12,551 12,586 12,655 12,709 12,760
Grade K‐2 residing outside PPS 313 331 303 276 266 266 266 266 266 266 266 266 266 266 266 266 266 266
Grade K‐2 Totals 12,619 12,425 12,124 12,076 12,136 12,206 12,188 12,017 12,068 12,243 12,531 12,700 12,765 12,817 12,852 12,921 12,975 13,026
PSU Population Research Center, August 2018
B-4
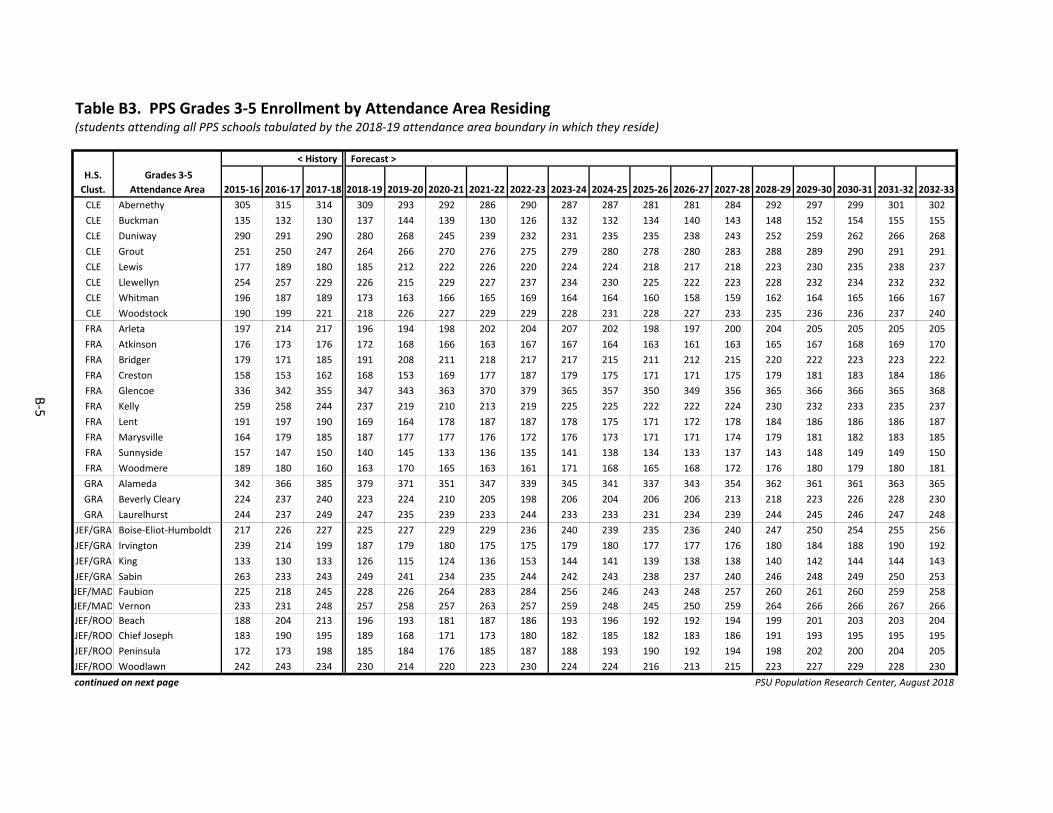
Table B3. PPS Grades 3‐5 Enrollment by Attendance Area Residing(students attending all PPS schools tabulated by the 2018‐19 attendance area boundary in which they reside)
< History Forecast >
H.S.
Clust.
Grades 3‐5
Attendance Area 2015‐16 2016‐17 2017‐18 2018‐19 2019‐20 2020‐21 2021‐22 2022‐23 2023‐24 2024‐25 2025‐26 2026‐27 2027‐28 2028‐29 2029‐30 2030‐31 2031‐32 2032‐33
CLE Abernethy 305 315 314 309 293 292 286 290 287 287 281 281 284 292 297 299 301 302
CLE Buckman 135 132 130 137 144 139 130 126 132 132 134 140 143 148 152 154 155 155
CLE Duniway 290 291 290 280 268 245 239 232 231 235 235 238 243 252 259 262 266 268
CLE Grout 251 250 247 264 266 270 276 275 279 280 278 280 283 288 289 290 291 291
CLE Lewis 177 189 180 185 212 222 226 220 224 224 218 217 218 223 230 235 238 237
CLE Llewellyn 254 257 229 226 215 229 227 237 234 230 225 222 223 228 232 234 232 232
CLE Whitman 196 187 189 173 163 166 165 169 164 164 160 158 159 162 164 165 166 167
CLE Woodstock 190 199 221 218 226 227 229 229 228 231 228 227 233 235 236 236 237 240
FRA Arleta 197 214 217 196 194 198 202 204 207 202 198 197 200 204 205 205 205 205
FRA Atkinson 176 173 176 172 168 166 163 167 167 164 163 161 163 165 167 168 169 170
FRA Bridger 179 171 185 191 208 211 218 217 217 215 211 212 215 220 222 223 223 222
FRA Creston 158 153 162 168 153 169 177 187 179 175 171 171 175 179 181 183 184 186
FRA Glencoe 336 342 355 347 343 363 370 379 365 357 350 349 356 365 366 366 365 368
FRA Kelly 259 258 244 237 219 210 213 219 225 225 222 222 224 230 232 233 235 237
FRA Lent 191 197 190 169 164 178 187 187 178 175 171 172 178 184 186 186 186 187
FRA Marysville 164 179 185 187 177 177 176 172 176 173 171 171 174 179 181 182 183 185
FRA Sunnyside 157 147 150 140 145 133 136 135 141 138 134 133 137 143 148 149 149 150
FRA Woodmere 189 180 160 163 170 165 163 161 171 168 165 168 172 176 180 179 180 181
GRA Alameda 342 366 385 379 371 351 347 339 345 341 337 343 354 362 361 361 363 365
GRA Beverly Cleary 224 237 240 223 224 210 205 198 206 204 206 206 213 218 223 226 228 230
GRA Laurelhurst 244 237 249 247 235 239 233 244 233 233 231 234 239 244 245 246 247 248
JEF/GRA Boise‐Eliot‐Humboldt 217 226 227 225 227 229 229 236 240 239 235 236 240 247 250 254 255 256
JEF/GRA Irvington 239 214 199 187 179 180 175 175 179 180 177 177 176 180 184 188 190 192
JEF/GRA King 133 130 133 126 115 124 136 153 144 141 139 138 138 140 142 144 144 143
JEF/GRA Sabin 263 233 243 249 241 234 235 244 242 243 238 237 240 246 248 249 250 253
JEF/MAD Faubion 225 218 245 228 226 264 283 284 256 246 243 248 257 260 261 260 259 258
JEF/MAD Vernon 233 231 248 257 258 257 263 257 259 248 245 250 259 264 266 266 267 266
JEF/ROO Beach 188 204 213 196 193 181 187 186 193 196 192 192 194 199 201 203 203 204
JEF/ROO Chief Joseph 183 190 195 189 168 171 173 180 182 185 182 183 186 191 193 195 195 195
JEF/ROO Peninsula 172 173 198 185 184 176 185 187 188 193 190 192 194 198 202 200 204 205
JEF/ROO Woodlawn 242 243 234 230 214 220 223 230 224 224 216 213 215 223 227 229 228 230
continued on next page PSU Population Research Center, August 2018
B-5

Table B3 (continued). PPS Grades 3‐5 Enrollment by Attendance Area Residing(students attending all PPS schools tabulated by the 2018‐19 attendance area boundary in which they reside)
< History Forecast >
H.S.
Clust.
Grades 3‐5
Attendance Area 2015‐16 2016‐17 2017‐18 2018‐19 2019‐20 2020‐21 2021‐22 2022‐23 2023‐24 2024‐25 2025‐26 2026‐27 2027‐28 2028‐29 2029‐30 2030‐31 2031‐32 2032‐33
LIN Ainsworth 231 212 234 234 235 233 237 244 253 257 250 250 251 258 262 267 269 271
LIN Chapman 286 303 322 317 314 283 278 284 294 303 298 301 302 311 317 323 328 331
LIN Forest Park 289 264 247 241 260 262 272 255 250 251 246 245 245 253 257 261 262 264
LIN Skyline 84 102 107 109 94 88 88 98 96 98 94 92 90 91 91 91 93 92
MAD Harrison Park 343 346 339 318 304 302 295 289 288 286 288 294 301 307 312 315 317 319
MAD Lee 235 233 240 244 209 203 193 206 199 198 198 202 206 211 214 214 217 218
MAD Rigler 274 285 283 282 283 267 260 252 256 256 252 257 264 271 275 276 278 279
MAD Rose City Park 191 203 206 224 238 243 250 248 249 244 239 239 244 247 248 247 248 251
MAD Scott 258 274 277 273 267 270 257 265 267 271 273 279 284 288 290 291 292 293
MAD Vestal 201 202 196 178 185 162 163 161 169 171 168 169 172 177 178 180 179 178
ROO Astor 156 164 151 161 153 153 150 147 150 149 149 150 154 159 162 166 169 170
ROO Cesar Chavez 172 179 164 135 124 119 117 112 117 120 123 127 130 132 134 136 139 141
ROO James John 256 247 259 243 224 204 203 207 217 219 218 221 226 235 239 243 244 244
ROO Rosa Parks 254 237 223 222 213 204 193 189 193 196 195 198 202 207 208 208 207 207
ROO Sitton 261 268 241 238 231 210 205 210 210 212 211 217 226 229 233 232 233 233
WIL Bridlemile 257 271 298 309 319 303 297 300 299 302 294 290 290 300 306 308 309 311
WIL Capitol Hill 166 191 221 239 261 243 243 235 245 247 241 241 242 248 251 252 255 257
WIL Hayhurst 218 229 235 244 275 262 254 244 260 260 254 254 255 260 262 263 264 265
WIL Maplewood 193 196 201 217 241 229 228 232 249 251 245 244 245 250 252 253 253 254
WIL Markham 242 281 300 306 292 288 285 288 279 282 275 274 274 281 285 286 285 284
WIL Rieke 209 232 208 208 208 202 203 199 209 209 205 203 203 207 209 208 209 211
WIL Stephenson 192 202 206 202 198 199 195 196 190 193 192 191 188 190 194 195 196 200
Grade 3‐5 residing in PPS 11,677 11,857 11,991 11,827 11,691 11,525 11,523 11,580 11,635 11,623 11,454 11,506 11,679 11,957 12,109 12,185 12,244 12,301
Grade 3‐5 residing outside PPS 311 347 366 373 372 349 320 310 310 310 310 310 310 310 310 310 310 310
Grade 3‐5 Totals 11,988 12,204 12,357 12,200 12,063 11,874 11,843 11,890 11,945 11,933 11,764 11,816 11,989 12,267 12,419 12,495 12,554 12,611
PSU Population Research Center, August 2018
B-6

Table B4. PPS Grades K‐5 Enrollment by Attendance Area Residing(students attending all PPS schools tabulated by the 2018‐19 attendance area boundary in which they reside)
< History Forecast >
H.S.
Clust.
Grades K‐5
Attendance Area 2015‐16 2016‐17 2017‐18 2018‐19 2019‐20 2020‐21 2021‐22 2022‐23 2023‐24 2024‐25 2025‐26 2026‐27 2027‐28 2028‐29 2029‐30 2030‐31 2031‐32 2032‐33
CLE Abernethy 627 625 617 608 594 590 584 583 579 582 584 589 594 604 610 614 616 618
CLE Buckman 291 278 274 272 283 288 279 276 287 291 298 307 312 318 324 327 329 330
CLE Duniway 572 573 538 523 502 479 473 465 466 474 484 494 502 514 523 527 532 534
CLE Grout 517 518 519 532 533 541 556 553 559 563 565 568 572 578 579 580 581 582
CLE Lewis 349 402 397 408 427 441 442 432 436 437 436 440 445 453 460 466 470 471
CLE Llewellyn 491 493 475 468 468 478 473 477 473 470 469 470 473 477 480 482 483 484
CLE Whitman 373 361 370 355 347 343 342 341 334 335 335 336 338 342 345 347 349 351
CLE Woodstock 399 414 448 448 454 449 455 454 451 457 458 461 467 471 474 475 477 482
FRA Arleta 408 418 426 409 412 418 417 415 417 415 416 415 419 423 424 424 425 426
FRA Atkinson 346 337 338 331 331 329 323 326 324 323 324 324 327 330 333 335 337 339
FRA Bridger 373 372 388 402 421 424 429 425 424 425 426 428 431 436 438 439 440 440
FRA Creston 339 317 342 354 350 357 361 367 359 358 359 361 366 371 375 378 381 384
FRA Glencoe 667 658 697 697 703 709 708 710 695 693 695 699 707 716 716 719 722 727
FRA Kelly 504 499 455 456 442 442 444 446 453 457 458 462 466 471 475 479 481 484
FRA Lent 385 356 368 355 352 356 364 360 350 352 354 357 363 369 372 373 375 377
FRA Marysville 359 357 367 367 353 357 353 347 351 351 354 356 360 366 370 373 375 377
FRA Sunnyside 320 326 299 289 293 288 288 283 288 289 291 294 299 306 312 314 315 316
FRA Woodmere 371 375 343 343 350 355 351 346 356 357 359 364 367 372 377 379 381 384
GRA Alameda 728 732 732 722 707 694 687 675 685 690 695 702 712 721 718 722 726 730
GRA Beverly Cleary 419 427 425 403 395 388 382 375 386 389 394 399 409 416 422 428 433 437
GRA Laurelhurst 493 467 487 481 479 473 465 474 468 472 475 480 485 490 490 491 494 498
JEF/GRA Boise‐Eliot‐Humboldt 476 473 450 451 465 476 474 477 482 486 489 495 502 511 514 518 521 525
JEF/GRA Irvington 445 401 389 368 358 361 358 355 359 361 363 365 367 373 379 385 388 390
JEF/GRA King 273 263 273 274 280 279 290 304 293 290 290 291 292 295 296 298 298 298
JEF/GRA Sabin 524 499 496 505 505 492 493 498 496 500 501 502 505 511 514 518 519 521
JEF/MAD Faubion 464 441 525 529 528 537 544 542 518 517 519 528 536 538 538 539 539 539
JEF/MAD Vernon 495 509 522 535 528 530 523 513 520 519 522 530 539 543 544 545 548 547
JEF/ROO Beach 422 429 414 402 398 402 411 405 412 417 419 423 427 432 436 437 437 440
JEF/ROO Chief Joseph 412 394 398 393 378 382 386 391 394 399 403 406 410 415 418 419 420 420
JEF/ROO Peninsula 370 373 386 382 382 376 388 390 392 402 405 412 414 421 425 428 432 431
JEF/ROO Woodlawn 490 477 466 459 450 458 465 465 458 462 459 460 463 471 476 478 478 482
continued on next page PSU Population Research Center, August 2018
B-7

Table B4 (continued). PPS Grades K‐5 Enrollment by Attendance Area Residing(students attending all PPS schools tabulated by the 2018‐19 attendance area boundary in which they reside)
< History Forecast >
H.S.
Clust.
Grades K‐5
Attendance Area 2015‐16 2016‐17 2017‐18 2018‐19 2019‐20 2020‐21 2021‐22 2022‐23 2023‐24 2024‐25 2025‐26 2026‐27 2027‐28 2028‐29 2029‐30 2030‐31 2031‐32 2032‐33
LIN Ainsworth 488 451 469 470 484 493 500 500 509 514 516 522 526 535 542 549 553 557
LIN Chapman 608 633 607 599 607 584 589 589 601 612 615 624 632 645 654 663 669 674
LIN Forest Park 495 494 480 486 488 483 495 473 468 468 468 471 473 483 488 493 494 497
LIN Skyline 178 185 185 187 180 172 173 180 177 178 175 173 172 173 173 172 173 172
MAD Harrison Park 696 677 669 642 623 618 607 602 606 612 620 630 638 646 652 655 659 661
MAD Lee 488 465 457 449 430 419 405 417 414 417 422 430 435 442 445 448 448 448
MAD Rigler 565 593 562 556 548 539 530 518 526 532 535 545 553 563 568 570 572 574
MAD Rose City Park 419 430 428 452 470 482 488 480 481 481 480 482 486 488 490 490 493 496
MAD Scott 527 533 545 526 526 528 519 529 537 546 552 560 566 571 574 575 576 578
MAD Vestal 434 425 393 375 376 359 361 357 368 374 375 378 382 387 388 391 391 392
ROO Astor 387 352 334 340 327 330 327 324 330 334 339 344 350 356 360 367 371 373
ROO Cesar Chavez 328 323 291 262 246 246 246 243 251 257 263 268 273 278 281 285 288 290
ROO James John 544 515 503 480 465 453 455 458 472 480 487 494 503 514 518 522 524 525
ROO Rosa Parks 488 463 438 427 412 406 398 393 400 408 411 416 420 424 425 425 426 427
ROO Sitton 530 526 477 462 461 444 440 445 449 458 464 473 481 485 488 490 490 490
WIL Bridlemile 527 557 571 583 593 572 569 566 562 564 563 564 565 576 584 588 590 592
WIL Capitol Hill 395 440 465 484 497 488 490 476 486 489 490 494 497 505 510 514 519 524
WIL Hayhurst 471 496 500 498 519 522 515 498 513 514 516 518 520 527 530 532 535 537
WIL Maplewood 412 451 435 451 478 483 484 482 498 501 501 502 503 509 511 512 514 516
WIL Markham 513 537 569 575 563 551 550 547 537 540 539 541 542 548 551 552 552 552
WIL Rieke 423 454 417 420 415 420 422 412 420 419 420 422 422 426 429 430 432 435
WIL Stephenson 365 387 393 382 385 381 374 372 367 369 369 371 370 373 377 380 382 387
Grade K‐5 residing in PPS 23,983 23,951 23,812 23,627 23,561 23,465 23,445 23,331 23,437 23,600 23,719 23,940 24,178 24,508 24,695 24,840 24,953 25,061
Grade K‐5 residing outside PPS 624 678 669 649 638 615 586 576 576 576 576 576 576 576 576 576 576 576
Grade K‐5 Totals 24,607 24,629 24,481 24,276 24,199 24,080 24,031 23,907 24,013 24,176 24,295 24,516 24,754 25,084 25,271 25,416 25,529 25,637
PSU Population Research Center, August 2018
B-8
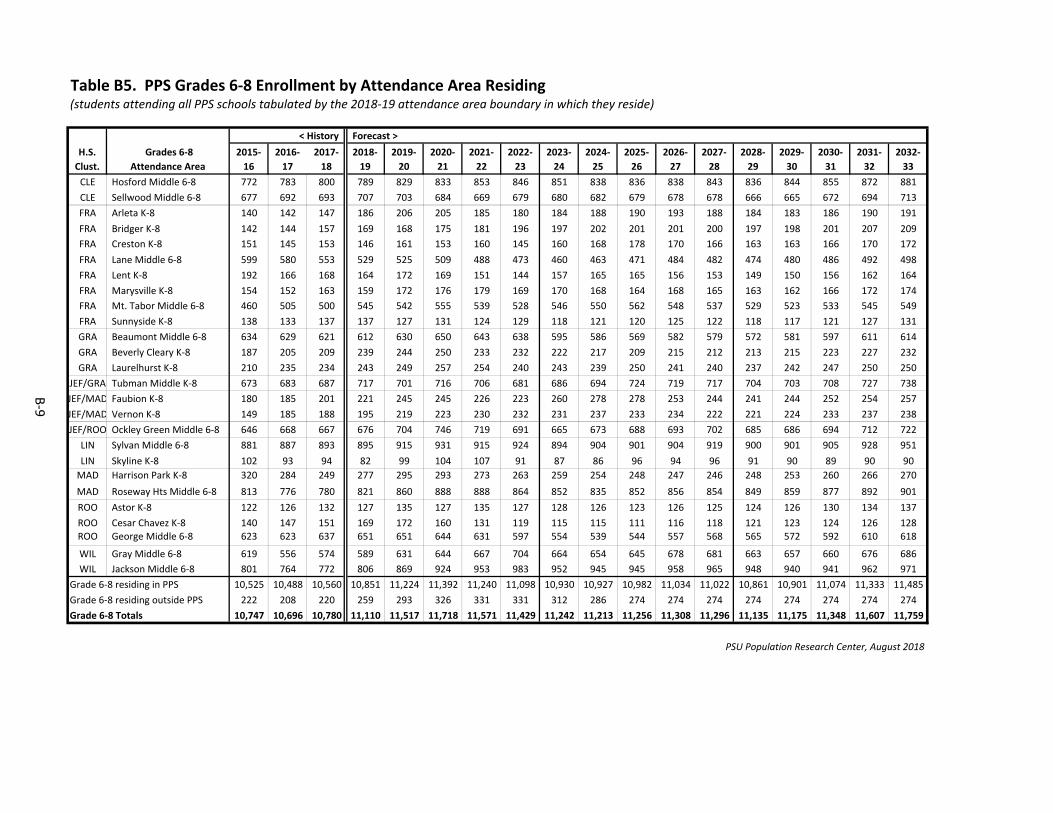
Table B5. PPS Grades 6‐8 Enrollment by Attendance Area Residing(students attending all PPS schools tabulated by the 2018‐19 attendance area boundary in which they reside)
< History Forecast >
H.S.
Clust.
Grades 6‐8
Attendance Area
2015‐
16
2016‐
17
2017‐
18
2018‐
19
2019‐
20
2020‐
21
2021‐
22
2022‐
23
2023‐
24
2024‐
25
2025‐
26
2026‐
27
2027‐
28
2028‐
29
2029‐
30
2030‐
31
2031‐
32
2032‐
33
CLE Hosford Middle 6‐8 772 783 800 789 829 833 853 846 851 838 836 838 843 836 844 855 872 881
CLE Sellwood Middle 6‐8 677 692 693 707 703 684 669 679 680 682 679 678 678 666 665 672 694 713
FRA Arleta K‐8 140 142 147 186 206 205 185 180 184 188 190 193 188 184 183 186 190 191
FRA Bridger K‐8 142 144 157 169 168 175 181 196 197 202 201 201 200 197 198 201 207 209
FRA Creston K‐8 151 145 153 146 161 153 160 145 160 168 178 170 166 163 163 166 170 172
FRA Lane Middle 6‐8 599 580 553 529 525 509 488 473 460 463 471 484 482 474 480 486 492 498
FRA Lent K‐8 192 166 168 164 172 169 151 144 157 165 165 156 153 149 150 156 162 164
FRA Marysville K‐8 154 152 163 159 172 176 179 169 170 168 164 168 165 163 162 166 172 174
FRA Mt. Tabor Middle 6‐8 460 505 500 545 542 555 539 528 546 550 562 548 537 529 523 533 545 549
FRA Sunnyside K‐8 138 133 137 137 127 131 124 129 118 121 120 125 122 118 117 121 127 131
GRA Beaumont Middle 6‐8 634 629 621 612 630 650 643 638 595 586 569 582 579 572 581 597 611 614
GRA Beverly Cleary K‐8 187 205 209 239 244 250 233 232 222 217 209 215 212 213 215 223 227 232
GRA Laurelhurst K‐8 210 235 234 243 249 257 254 240 243 239 250 241 240 237 242 247 250 250
JEF/GRA Tubman Middle K‐8 673 683 687 717 701 716 706 681 686 694 724 719 717 704 703 708 727 738
JEF/MAD Faubion K‐8 180 185 201 221 245 245 226 223 260 278 278 253 244 241 244 252 254 257
JEF/MAD Vernon K‐8 149 185 188 195 219 223 230 232 231 237 233 234 222 221 224 233 237 238
JEF/ROO Ockley Green Middle 6‐8 646 668 667 676 704 746 719 691 665 673 688 693 702 685 686 694 712 722
LIN Sylvan Middle 6‐8 881 887 893 895 915 931 915 924 894 904 901 904 919 900 901 905 928 951
LIN Skyline K‐8 102 93 94 82 99 104 107 91 87 86 96 94 96 91 90 89 90 90
MAD Harrison Park K‐8 320 284 249 277 295 293 273 263 259 254 248 247 246 248 253 260 266 270
MAD Roseway Hts Middle 6‐8 813 776 780 821 860 888 888 864 852 835 852 856 854 849 859 877 892 901
ROO Astor K‐8 122 126 132 127 135 127 135 127 128 126 123 126 125 124 126 130 134 137
ROO Cesar Chavez K‐8 140 147 151 169 172 160 131 119 115 115 111 116 118 121 123 124 126 128
ROO George Middle 6‐8 623 623 637 651 651 644 631 597 554 539 544 557 568 565 572 592 610 618
WIL Gray Middle 6‐8 619 556 574 589 631 644 667 704 664 654 645 678 681 663 657 660 676 686
WIL Jackson Middle 6‐8 801 764 772 806 869 924 953 983 952 945 945 958 965 948 940 941 962 971
Grade 6‐8 residing in PPS 10,525 10,488 10,560 10,851 11,224 11,392 11,240 11,098 10,930 10,927 10,982 11,034 11,022 10,861 10,901 11,074 11,333 11,485
Grade 6‐8 residing outside PPS 222 208 220 259 293 326 331 331 312 286 274 274 274 274 274 274 274 274
Grade 6‐8 Totals 10,747 10,696 10,780 11,110 11,517 11,718 11,571 11,429 11,242 11,213 11,256 11,308 11,296 11,135 11,175 11,348 11,607 11,759
PSU Population Research Center, August 2018
B-9
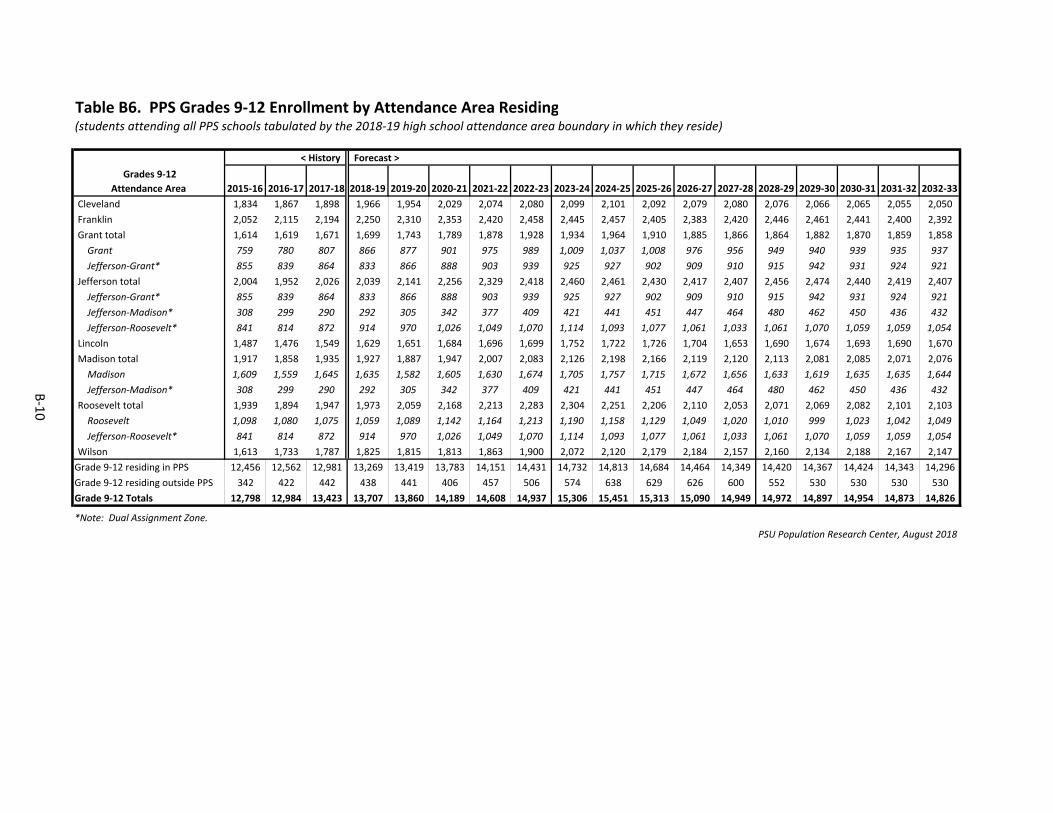
Table B6. PPS Grades 9‐12 Enrollment by Attendance Area Residing(students attending all PPS schools tabulated by the 2018‐19 high school attendance area boundary in which they reside)
< History Forecast >
Grades 9‐12
Attendance Area 2015‐16 2016‐17 2017‐18 2018‐19 2019‐20 2020‐21 2021‐22 2022‐23 2023‐24 2024‐25 2025‐26 2026‐27 2027‐28 2028‐29 2029‐30 2030‐31 2031‐32 2032‐33
Cleveland 1,834 1,867 1,898 1,966 1,954 2,029 2,074 2,080 2,099 2,101 2,092 2,079 2,080 2,076 2,066 2,065 2,055 2,050
Franklin 2,052 2,115 2,194 2,250 2,310 2,353 2,420 2,458 2,445 2,457 2,405 2,383 2,420 2,446 2,461 2,441 2,400 2,392
Grant total 1,614 1,619 1,671 1,699 1,743 1,789 1,878 1,928 1,934 1,964 1,910 1,885 1,866 1,864 1,882 1,870 1,859 1,858
Grant 759 780 807 866 877 901 975 989 1,009 1,037 1,008 976 956 949 940 939 935 937
Jefferson‐Grant* 855 839 864 833 866 888 903 939 925 927 902 909 910 915 942 931 924 921
Jefferson total 2,004 1,952 2,026 2,039 2,141 2,256 2,329 2,418 2,460 2,461 2,430 2,417 2,407 2,456 2,474 2,440 2,419 2,407
Jefferson‐Grant* 855 839 864 833 866 888 903 939 925 927 902 909 910 915 942 931 924 921
Jefferson‐Madison* 308 299 290 292 305 342 377 409 421 441 451 447 464 480 462 450 436 432
Jefferson‐Roosevelt* 841 814 872 914 970 1,026 1,049 1,070 1,114 1,093 1,077 1,061 1,033 1,061 1,070 1,059 1,059 1,054
Lincoln 1,487 1,476 1,549 1,629 1,651 1,684 1,696 1,699 1,752 1,722 1,726 1,704 1,653 1,690 1,674 1,693 1,690 1,670
Madison total 1,917 1,858 1,935 1,927 1,887 1,947 2,007 2,083 2,126 2,198 2,166 2,119 2,120 2,113 2,081 2,085 2,071 2,076
Madison 1,609 1,559 1,645 1,635 1,582 1,605 1,630 1,674 1,705 1,757 1,715 1,672 1,656 1,633 1,619 1,635 1,635 1,644
Jefferson‐Madison* 308 299 290 292 305 342 377 409 421 441 451 447 464 480 462 450 436 432
Roosevelt total 1,939 1,894 1,947 1,973 2,059 2,168 2,213 2,283 2,304 2,251 2,206 2,110 2,053 2,071 2,069 2,082 2,101 2,103
Roosevelt 1,098 1,080 1,075 1,059 1,089 1,142 1,164 1,213 1,190 1,158 1,129 1,049 1,020 1,010 999 1,023 1,042 1,049
Jefferson‐Roosevelt* 841 814 872 914 970 1,026 1,049 1,070 1,114 1,093 1,077 1,061 1,033 1,061 1,070 1,059 1,059 1,054
Wilson 1,613 1,733 1,787 1,825 1,815 1,813 1,863 1,900 2,072 2,120 2,179 2,184 2,157 2,160 2,134 2,188 2,167 2,147
Grade 9‐12 residing in PPS 12,456 12,562 12,981 13,269 13,419 13,783 14,151 14,431 14,732 14,813 14,684 14,464 14,349 14,420 14,367 14,424 14,343 14,296
Grade 9‐12 residing outside PPS 342 422 442 438 441 406 457 506 574 638 629 626 600 552 530 530 530 530
Grade 9‐12 Totals 12,798 12,984 13,423 13,707 13,860 14,189 14,608 14,937 15,306 15,451 15,313 15,090 14,949 14,972 14,897 14,954 14,873 14,826
*Note: Dual Assignment Zone.
PSU Population Research Center, August 2018
B-10
APPENDIX C
ENROLLMENT FORECASTS BY SCHOOL
2018‐19 to 2032‐33
School forecasts are consistent with the district‐wide middle series forecast.

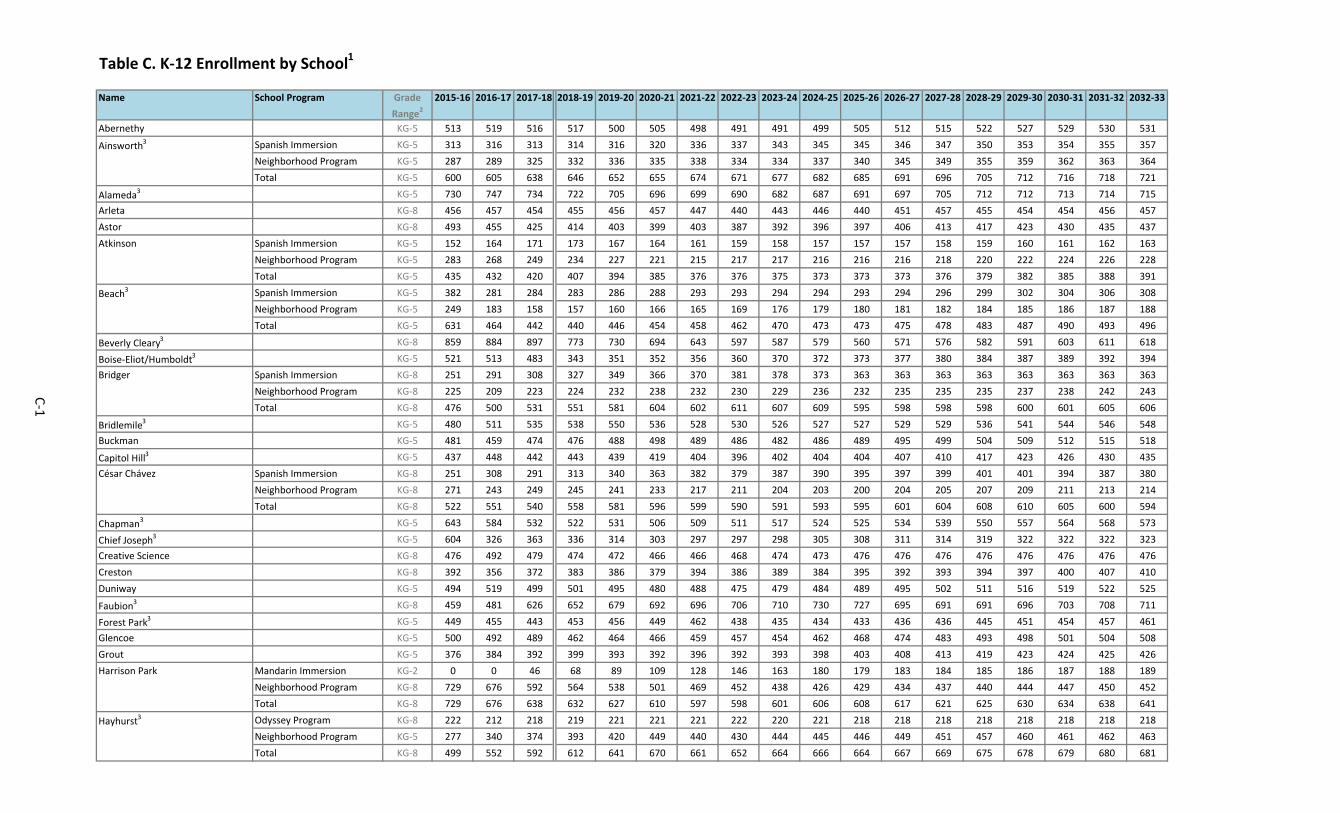
Table C. K‐12 Enrollment by School1
Name School Program Grade
Range22015‐16 2016‐17 2017‐18 2018‐19 2019‐20 2020‐21 2021‐22 2022‐23 2023‐24 2024‐25 2025‐26 2026‐27 2027‐28 2028‐29 2029‐30 2030‐31 2031‐32 2032‐33
Abernethy KG‐5 513 519 516 517 500 505 498 491 491 499 505 512 515 522 527 529 530 531
Ainsworth3 Spanish Immersion KG‐5 313 316 313 314 316 320 336 337 343 345 345 346 347 350 353 354 355 357
Neighborhood Program KG‐5 287 289 325 332 336 335 338 334 334 337 340 345 349 355 359 362 363 364
Total KG‐5 600 605 638 646 652 655 674 671 677 682 685 691 696 705 712 716 718 721
Alameda3 KG‐5 730 747 734 722 705 696 699 690 682 687 691 697 705 712 712 713 714 715
Arleta KG‐8 456 457 454 455 456 457 447 440 443 446 440 451 457 455 454 454 456 457
Astor KG‐8 493 455 425 414 403 399 403 387 392 396 397 406 413 417 423 430 435 437
Atkinson Spanish Immersion KG‐5 152 164 171 173 167 164 161 159 158 157 157 157 158 159 160 161 162 163
Neighborhood Program KG‐5 283 268 249 234 227 221 215 217 217 216 216 216 218 220 222 224 226 228
Total KG‐5 435 432 420 407 394 385 376 376 375 373 373 373 376 379 382 385 388 391
Beach3 Spanish Immersion KG‐5 382 281 284 283 286 288 293 293 294 294 293 294 296 299 302 304 306 308
Neighborhood Program KG‐5 249 183 158 157 160 166 165 169 176 179 180 181 182 184 185 186 187 188
Total KG‐5 631 464 442 440 446 454 458 462 470 473 473 475 478 483 487 490 493 496
Beverly Cleary3 KG‐8 859 884 897 773 730 694 643 597 587 579 560 571 576 582 591 603 611 618
Boise‐Eliot/Humboldt3 KG‐5 521 513 483 343 351 352 356 360 370 372 373 377 380 384 387 389 392 394
Bridger Spanish Immersion KG‐8 251 291 308 327 349 366 370 381 378 373 363 363 363 363 363 363 363 363
Neighborhood Program KG‐8 225 209 223 224 232 238 232 230 229 236 232 235 235 235 237 238 242 243
Total KG‐8 476 500 531 551 581 604 602 611 607 609 595 598 598 598 600 601 605 606
Bridlemile3 KG‐5 480 511 535 538 550 536 528 530 526 527 527 529 529 536 541 544 546 548
Buckman KG‐5 481 459 474 476 488 498 489 486 482 486 489 495 499 504 509 512 515 518
Capitol Hill3 KG‐5 437 448 442 443 439 419 404 396 402 404 404 407 410 417 423 426 430 435
César Chávez Spanish Immersion KG‐8 251 308 291 313 340 363 382 379 387 390 395 397 399 401 401 394 387 380
Neighborhood Program KG‐8 271 243 249 245 241 233 217 211 204 203 200 204 205 207 209 211 213 214
Total KG‐8 522 551 540 558 581 596 599 590 591 593 595 601 604 608 610 605 600 594
Chapman3 KG‐5 643 584 532 522 531 506 509 511 517 524 525 534 539 550 557 564 568 573
Chief Joseph3 KG‐5 604 326 363 336 314 303 297 297 298 305 308 311 314 319 322 322 322 323
Creative Science KG‐8 476 492 479 474 472 466 466 468 474 473 476 476 476 476 476 476 476 476
Creston KG‐8 392 356 372 383 386 379 394 386 389 384 395 392 393 394 397 400 407 410
Duniway KG‐5 494 519 499 501 495 480 488 475 479 484 489 495 502 511 516 519 522 525
Faubion3 KG‐8 459 481 626 652 679 692 696 706 710 730 727 695 691 691 696 703 708 711
Forest Park3 KG‐5 449 455 443 453 456 449 462 438 435 434 433 436 436 445 451 454 457 461
Glencoe KG‐5 500 492 489 462 464 466 459 457 454 462 468 474 483 493 498 501 504 508
Grout KG‐5 376 384 392 399 393 392 396 392 393 398 403 408 413 419 423 424 425 426
Harrison Park Mandarin Immersion KG‐2 0 0 46 68 89 109 128 146 163 180 179 183 184 185 186 187 188 189
Neighborhood Program KG‐8 729 676 592 564 538 501 469 452 438 426 429 434 437 440 444 447 450 452
Total KG‐8 729 676 638 632 627 610 597 598 601 606 608 617 621 625 630 634 638 641
Hayhurst3 Odyssey Program KG‐8 222 212 218 219 221 221 221 222 220 221 218 218 218 218 218 218 218 218
Neighborhood Program KG‐5 277 340 374 393 420 449 440 430 444 445 446 449 451 457 460 461 462 463
Total KG‐8 499 552 592 612 641 670 661 652 664 666 664 667 669 675 678 679 680 681
C-1
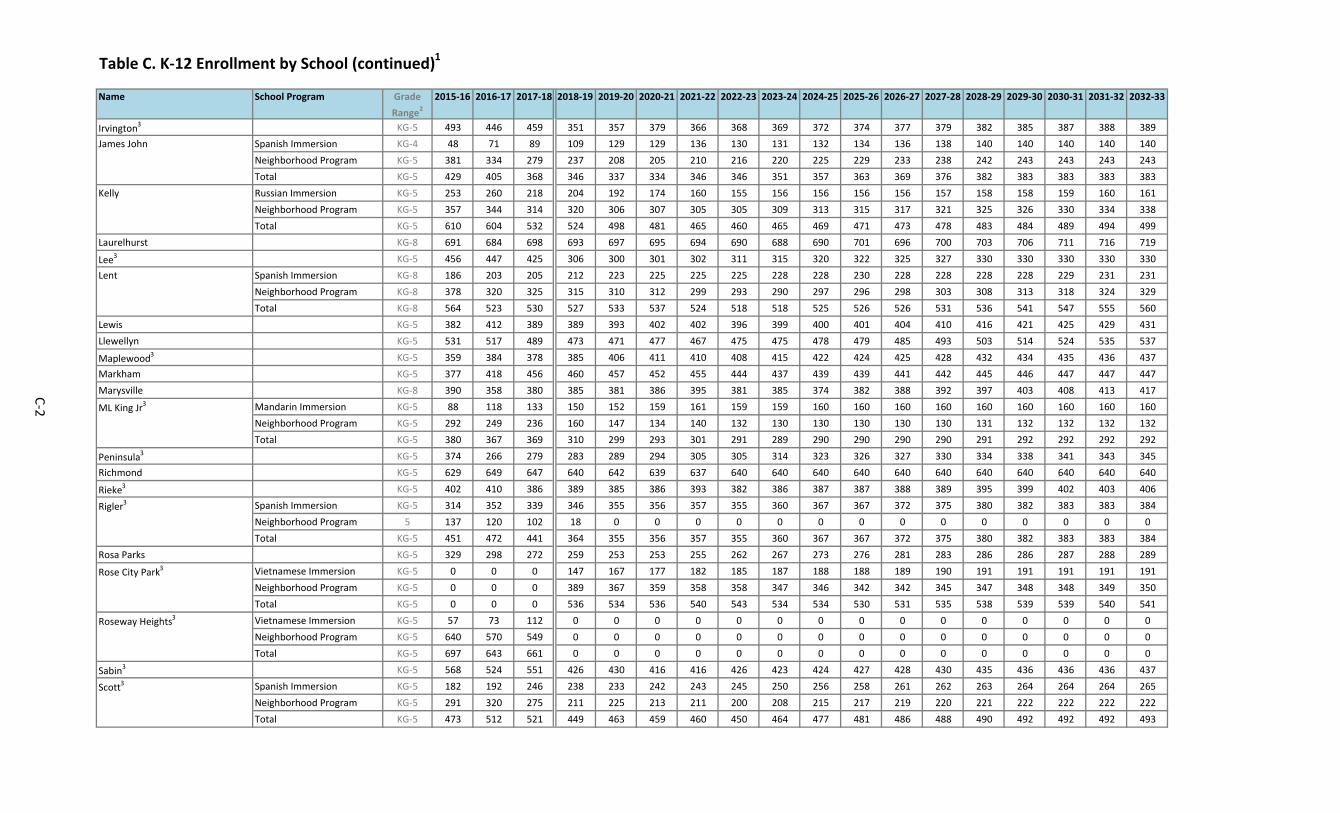
Table C. K‐12 Enrollment by School (continued)1
Name School Program Grade
Range22015‐16 2016‐17 2017‐18 2018‐19 2019‐20 2020‐21 2021‐22 2022‐23 2023‐24 2024‐25 2025‐26 2026‐27 2027‐28 2028‐29 2029‐30 2030‐31 2031‐32 2032‐33
Irvington3 KG‐5 493 446 459 351 357 379 366 368 369 372 374 377 379 382 385 387 388 389
James John Spanish Immersion KG‐4 48 71 89 109 129 129 136 130 131 132 134 136 138 140 140 140 140 140
Neighborhood Program KG‐5 381 334 279 237 208 205 210 216 220 225 229 233 238 242 243 243 243 243
Total KG‐5 429 405 368 346 337 334 346 346 351 357 363 369 376 382 383 383 383 383
Kelly Russian Immersion KG‐5 253 260 218 204 192 174 160 155 156 156 156 156 157 158 158 159 160 161
Neighborhood Program KG‐5 357 344 314 320 306 307 305 305 309 313 315 317 321 325 326 330 334 338
Total KG‐5 610 604 532 524 498 481 465 460 465 469 471 473 478 483 484 489 494 499
Laurelhurst KG‐8 691 684 698 693 697 695 694 690 688 690 701 696 700 703 706 711 716 719
Lee3 KG‐5 456 447 425 306 300 301 302 311 315 320 322 325 327 330 330 330 330 330
Lent Spanish Immersion KG‐8 186 203 205 212 223 225 225 225 228 228 230 228 228 228 228 229 231 231
Neighborhood Program KG‐8 378 320 325 315 310 312 299 293 290 297 296 298 303 308 313 318 324 329
Total KG‐8 564 523 530 527 533 537 524 518 518 525 526 526 531 536 541 547 555 560
Lewis KG‐5 382 412 389 389 393 402 402 396 399 400 401 404 410 416 421 425 429 431
Llewellyn KG‐5 531 517 489 473 471 477 467 475 475 478 479 485 493 503 514 524 535 537
Maplewood3 KG‐5 359 384 378 385 406 411 410 408 415 422 424 425 428 432 434 435 436 437
Markham KG‐5 377 418 456 460 457 452 455 444 437 439 439 441 442 445 446 447 447 447
Marysville KG‐8 390 358 380 385 381 386 395 381 385 374 382 388 392 397 403 408 413 417
ML King Jr3 Mandarin Immersion KG‐5 88 118 133 150 152 159 161 159 159 160 160 160 160 160 160 160 160 160
Neighborhood Program KG‐5 292 249 236 160 147 134 140 132 130 130 130 130 130 131 132 132 132 132
Total KG‐5 380 367 369 310 299 293 301 291 289 290 290 290 290 291 292 292 292 292
Peninsula3 KG‐5 374 266 279 283 289 294 305 305 314 323 326 327 330 334 338 341 343 345
Richmond KG‐5 629 649 647 640 642 639 637 640 640 640 640 640 640 640 640 640 640 640
Rieke3 KG‐5 402 410 386 389 385 386 393 382 386 387 387 388 389 395 399 402 403 406
Rigler3 Spanish Immersion KG‐5 314 352 339 346 355 356 357 355 360 367 367 372 375 380 382 383 383 384
Neighborhood Program 5 137 120 102 18 0 0 0 0 0 0 0 0 0 0 0 0 0 0
Total KG‐5 451 472 441 364 355 356 357 355 360 367 367 372 375 380 382 383 383 384
Rosa Parks KG‐5 329 298 272 259 253 253 255 262 267 273 276 281 283 286 286 287 288 289
Rose City Park3 Vietnamese Immersion KG‐5 0 0 0 147 167 177 182 185 187 188 188 189 190 191 191 191 191 191
Neighborhood Program KG‐5 0 0 0 389 367 359 358 358 347 346 342 342 345 347 348 348 349 350
Total KG‐5 0 0 0 536 534 536 540 543 534 534 530 531 535 538 539 539 540 541
Roseway Heights3 Vietnamese Immersion KG‐5 57 73 112 0 0 0 0 0 0 0 0 0 0 0 0 0 0 0
Neighborhood Program KG‐5 640 570 549 0 0 0 0 0 0 0 0 0 0 0 0 0 0 0
Total KG‐5 697 643 661 0 0 0 0 0 0 0 0 0 0 0 0 0 0 0
Sabin3 KG‐5 568 524 551 426 430 416 416 426 423 424 427 428 430 435 436 436 436 437
Scott3 Spanish Immersion KG‐5 182 192 246 238 233 242 243 245 250 256 258 261 262 263 264 264 264 265
Neighborhood Program KG‐5 291 320 275 211 225 213 211 200 208 215 217 219 220 221 222 222 222 222
Total KG‐5 473 512 521 449 463 459 460 450 464 477 481 486 488 490 492 492 492 493
C-2
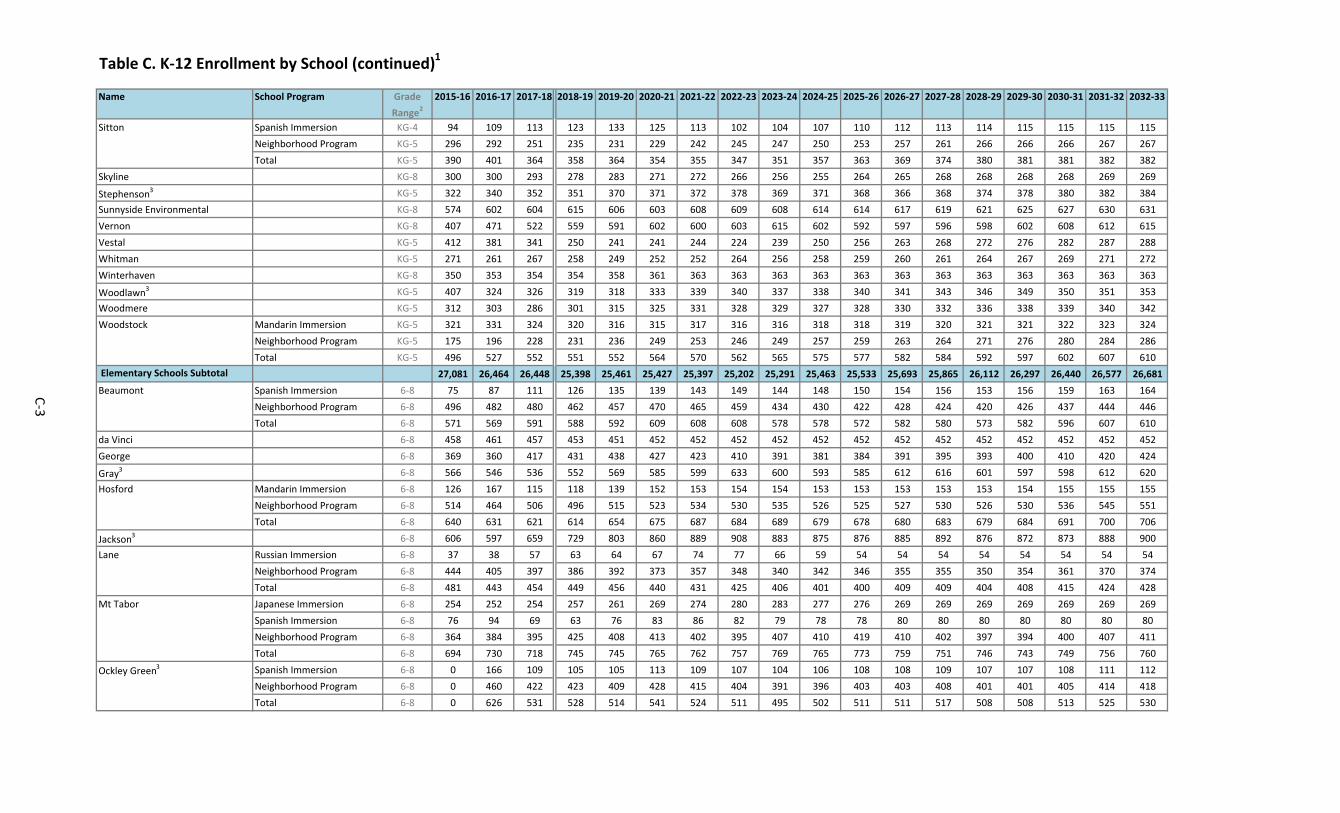
Table C. K‐12 Enrollment by School (continued)1
Name School Program Grade
Range22015‐16 2016‐17 2017‐18 2018‐19 2019‐20 2020‐21 2021‐22 2022‐23 2023‐24 2024‐25 2025‐26 2026‐27 2027‐28 2028‐29 2029‐30 2030‐31 2031‐32 2032‐33
Sitton Spanish Immersion KG‐4 94 109 113 123 133 125 113 102 104 107 110 112 113 114 115 115 115 115
Neighborhood Program KG‐5 296 292 251 235 231 229 242 245 247 250 253 257 261 266 266 266 267 267
Total KG‐5 390 401 364 358 364 354 355 347 351 357 363 369 374 380 381 381 382 382
Skyline KG‐8 300 300 293 278 283 271 272 266 256 255 264 265 268 268 268 268 269 269
Stephenson3 KG‐5 322 340 352 351 370 371 372 378 369 371 368 366 368 374 378 380 382 384
Sunnyside Environmental KG‐8 574 602 604 615 606 603 608 609 608 614 614 617 619 621 625 627 630 631
Vernon KG‐8 407 471 522 559 591 602 600 603 615 602 592 597 596 598 602 608 612 615
Vestal KG‐5 412 381 341 250 241 241 244 224 239 250 256 263 268 272 276 282 287 288
Whitman KG‐5 271 261 267 258 249 252 252 264 256 258 259 260 261 264 267 269 271 272
Winterhaven KG‐8 350 353 354 354 358 361 363 363 363 363 363 363 363 363 363 363 363 363
Woodlawn3 KG‐5 407 324 326 319 318 333 339 340 337 338 340 341 343 346 349 350 351 353
Woodmere KG‐5 312 303 286 301 315 325 331 328 329 327 328 330 332 336 338 339 340 342
Woodstock Mandarin Immersion KG‐5 321 331 324 320 316 315 317 316 316 318 318 319 320 321 321 322 323 324
Neighborhood Program KG‐5 175 196 228 231 236 249 253 246 249 257 259 263 264 271 276 280 284 286
Total KG‐5 496 527 552 551 552 564 570 562 565 575 577 582 584 592 597 602 607 610
Elementary Schools Subtotal 27,081 26,464 26,448 25,398 25,461 25,427 25,397 25,202 25,291 25,463 25,533 25,693 25,865 26,112 26,297 26,440 26,577 26,681
Beaumont Spanish Immersion 6‐8 75 87 111 126 135 139 143 149 144 148 150 154 156 153 156 159 163 164
Neighborhood Program 6‐8 496 482 480 462 457 470 465 459 434 430 422 428 424 420 426 437 444 446
Total 6‐8 571 569 591 588 592 609 608 608 578 578 572 582 580 573 582 596 607 610
da Vinci 6‐8 458 461 457 453 451 452 452 452 452 452 452 452 452 452 452 452 452 452
George 6‐8 369 360 417 431 438 427 423 410 391 381 384 391 395 393 400 410 420 424
Gray3 6‐8 566 546 536 552 569 585 599 633 600 593 585 612 616 601 597 598 612 620
Hosford Mandarin Immersion 6‐8 126 167 115 118 139 152 153 154 154 153 153 153 153 153 154 155 155 155
Neighborhood Program 6‐8 514 464 506 496 515 523 534 530 535 526 525 527 530 526 530 536 545 551
Total 6‐8 640 631 621 614 654 675 687 684 689 679 678 680 683 679 684 691 700 706
Jackson3 6‐8 606 597 659 729 803 860 889 908 883 875 876 885 892 876 872 873 888 900
Lane Russian Immersion 6‐8 37 38 57 63 64 67 74 77 66 59 54 54 54 54 54 54 54 54
Neighborhood Program 6‐8 444 405 397 386 392 373 357 348 340 342 346 355 355 350 354 361 370 374
Total 6‐8 481 443 454 449 456 440 431 425 406 401 400 409 409 404 408 415 424 428
Mt Tabor Japanese Immersion 6‐8 254 252 254 257 261 269 274 280 283 277 276 269 269 269 269 269 269 269
Spanish Immersion 6‐8 76 94 69 63 76 83 86 82 79 78 78 80 80 80 80 80 80 80
Neighborhood Program 6‐8 364 384 395 425 408 413 402 395 407 410 419 410 402 397 394 400 407 411
Total 6‐8 694 730 718 745 745 765 762 757 769 765 773 759 751 746 743 749 756 760
Ockley Green3 Spanish Immersion 6‐8 0 166 109 105 105 113 109 107 104 106 108 108 109 107 107 108 111 112
Neighborhood Program 6‐8 0 460 422 423 409 428 415 404 391 396 403 403 408 401 401 405 414 418
Total 6‐8 0 626 531 528 514 541 524 511 495 502 511 511 517 508 508 513 525 530
C-3

Table C. K‐12 Enrollment by School (continued)1
Name School Program Grade
Range22015‐16 2016‐17 2017‐18 2018‐19 2019‐20 2020‐21 2021‐22 2022‐23 2023‐24 2024‐25 2025‐26 2026‐27 2027‐28 2028‐29 2029‐30 2030‐31 2031‐32 2032‐33
Roseway Heights3 Spanish Immersion 6 0 0 0 40 77 98 101 104 111 110 108 109 109 109 109 109 109 109
Vietnamese Immersion N/A 0 0 0 0 0 26 52 74 79 81 85 85 85 85 85 85 85 85
Neighborhood Program 6‐8 0 0 0 531 553 548 539 512 501 491 499 501 501 499 505 513 522 527
Total 6‐8 0 0 0 571 630 672 692 690 691 682 692 695 695 693 699 707 716 721
Sellwood 6‐8 560 583 589 598 585 573 570 575 574 575 573 572 572 562 562 569 586 600
Tubman3 6‐8 0 0 0 446 433 434 439 434 444 448 460 458 457 450 452 455 464 470
West Sylvan3 Spanish Immersion 6‐8 126 145 141 151 161 158 150 152 149 157 150 152 154 154 154 154 154 154
Neighborhood Program 6‐8 840 766 735 691 707 731 725 733 710 713 711 715 725 709 709 711 731 749
Total 6‐8 966 911 876 842 868 889 875 885 859 870 861 867 879 863 863 865 885 903
Middle Schools Subtotal 5,911 6,457 6,449 7,546 7,738 7,922 7,951 7,972 7,831 7,801 7,817 7,873 7,898 7,800 7,822 7,893 8,035 8,124
Benson 9‐12 914 994 1026 1058 1072 1080 1080 1080 1080 1080 1080 1080 1080 1080 1080 1080 1080 1080
Cleveland Mandarin Immersion 9‐12 77 97 120 138 139 134 138 136 142 148 149 149 149 149 149 149 149 149
Neighborhood Program 9‐12 1523 1512 1466 1465 1445 1470 1518 1549 1555 1554 1550 1540 1540 1537 1530 1530 1521 1519
Total 9‐12 1600 1609 1586 1603 1584 1604 1656 1685 1697 1702 1699 1689 1689 1686 1679 1679 1670 1668
Franklin Spanish Immersion 9‐12 97 105 118 144 137 145 155 155 164 165 165 165 165 165 165 165 165 165
Russian Immersion 9‐11 0 0 18 26 39 40 49 54 54 52 52 52 52 52 52 52 52 52
Neighborhood Program 9‐12 1473 1507 1609 1653 1705 1734 1762 1777 1764 1760 1730 1725 1749 1764 1771 1754 1728 1728
Total 9‐12 1570 1612 1745 1823 1881 1919 1966 1986 1982 1977 1947 1942 1966 1981 1988 1971 1945 1945
Grant3 Japanese Immersion 9‐12 124 148 170 196 204 223 224 222 225 223 222 222 222 222 222 222 222 222
Neighborhood Program 9‐12 1357 1328 1342 1317 1337 1363 1430 1465 1476 1486 1451 1433 1418 1416 1418 1410 1406 1410
Total 9‐12 1481 1476 1512 1513 1541 1586 1654 1687 1701 1709 1673 1655 1640 1638 1640 1632 1628 1632
Jefferson 9‐12 524 590 677 775 857 924 952 982 1000 995 984 979 975 994 997 987 980 978
Lincoln3 Spanish Immersion 9‐12 191 179 164 160 154 154 150 155 154 154 154 154 154 154 154 154 154 154
Neighborhood Program 9‐12 1505 1524 1541 1557 1530 1514 1515 1514 1558 1534 1536 1513 1476 1505 1496 1512 1507 1490
Total 9‐12 1696 1703 1705 1717 1684 1668 1665 1669 1712 1688 1690 1667 1630 1659 1650 1666 1661 1644
Madison3 Spanish Immersion 9‐12 33 48 68 69 85 116 137 160 175 175 176 175 175 176 175 175 176 175
Vietnamese Immersion N/A 0 0 0 0 0 0 0 0 21 42 60 81 84 86 90 90 90 90
Neighborhood Program 9‐12 1101 1022 1078 1032 1017 1006 1029 1054 1045 1052 1020 983 973 966 956 960 961 969
Total 9‐12 1134 1070 1146 1101 1102 1122 1166 1214 1241 1269 1256 1239 1232 1228 1221 1225 1227 1234
Roosevelt Spanish Immersion 9‐12 112 86 132 120 117 139 147 151 150 147 142 139 137 139 140 139 139 140
Neighborhood Program 9‐12 828 795 727 733 774 805 827 861 849 823 797 752 734 735 735 742 749 756
Total 9‐12 940 881 859 853 891 944 974 1012 999 970 939 891 871 874 875 881 888 896
Wilson3 9‐12 1324 1413 1512 1597 1611 1645 1693 1736 1864 1912 1986 1988 1987 1990 1959 1999 1982 1973
High Schools Subtotal 11,183 11,348 11,768 12,040 12,223 12,492 12,806 13,051 13,276 13,302 13,254 13,130 13,070 13,130 13,089 13,120 13,061 13,050
ACCESS 1‐8 346 352 336 328 314 302 287 273 273 273 273 273 273 273 273 273 273 273
Metro. Learning Center K‐12 426 427 390 386 387 385 385 383 384 385 385 385 385 385 385 385 385 385
Other Schools and Programs K‐12 3205 3261 3293 3395 3453 3459 3384 3392 3506 3616 3602 3560 3508 3491 3477 3607 3678 3709
District Total 48,152 48,309 48,684 49,093 49,576 49,987 50,210 50,273 50,561 50,840 50,864 50,914 50,999 51,191 51,343 51,718 52,009 52,222
C-4
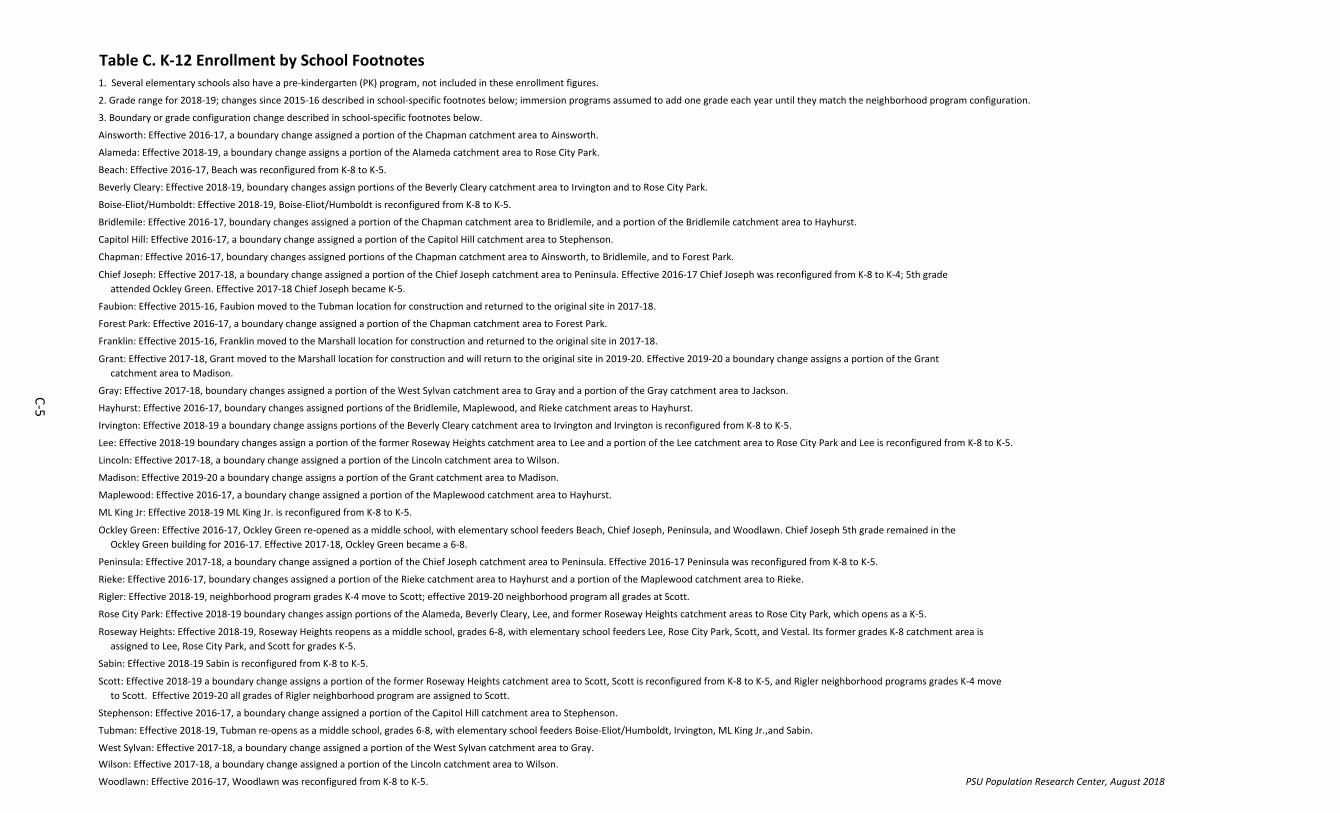
Table C. K‐12 Enrollment by School Footnotes
Woodlawn: Effective 2016‐17, Woodlawn was reconfigured from K‐8 to K‐5. PSU Population Research Center, August 2018
Franklin: Effective 2015‐16, Franklin moved to the Marshall location for construction and returned to the original site in 2017‐18.
Ainsworth: Effective 2016‐17, a boundary change assigned a portion of the Chapman catchment area to Ainsworth.
Alameda: Effective 2018‐19, a boundary change assigns a portion of the Alameda catchment area to Rose City Park.
Beach: Effective 2016‐17, Beach was reconfigured from K‐8 to K‐5.
Beverly Cleary: Effective 2018‐19, boundary changes assign portions of the Beverly Cleary catchment area to Irvington and to Rose City Park.
Boise‐Eliot/Humboldt: Effective 2018‐19, Boise‐Eliot/Humboldt is reconfigured from K‐8 to K‐5.
Bridlemile: Effective 2016‐17, boundary changes assigned a portion of the Chapman catchment area to Bridlemile, and a portion of the Bridlemile catchment area to Hayhurst.
Capitol Hill: Effective 2016‐17, a boundary change assigned a portion of the Capitol Hill catchment area to Stephenson.
Chapman: Effective 2016‐17, boundary changes assigned portions of the Chapman catchment area to Ainsworth, to Bridlemile, and to Forest Park.
Chief Joseph: Effective 2017‐18, a boundary change assigned a portion of the Chief Joseph catchment area to Peninsula. Effective 2016‐17 Chief Joseph was reconfigured from K‐8 to K‐4; 5th grade
attended Ockley Green. Effective 2017‐18 Chief Joseph became K‐5.
Faubion: Effective 2015‐16, Faubion moved to the Tubman location for construction and returned to the original site in 2017‐18.
Forest Park: Effective 2016‐17, a boundary change assigned a portion of the Chapman catchment area to Forest Park.
Peninsula: Effective 2017‐18, a boundary change assigned a portion of the Chief Joseph catchment area to Peninsula. Effective 2016‐17 Peninsula was reconfigured from K‐8 to K‐5.
Rieke: Effective 2016‐17, boundary changes assigned a portion of the Rieke catchment area to Hayhurst and a portion of the Maplewood catchment area to Rieke.
Grant: Effective 2017‐18, Grant moved to the Marshall location for construction and will return to the original site in 2019‐20. Effective 2019‐20 a boundary change assigns a portion of the Grant
catchment area to Madison.
Gray: Effective 2017‐18, boundary changes assigned a portion of the West Sylvan catchment area to Gray and a portion of the Gray catchment area to Jackson.
Hayhurst: Effective 2016‐17, boundary changes assigned portions of the Bridlemile, Maplewood, and Rieke catchment areas to Hayhurst.
Irvington: Effective 2018‐19 a boundary change assigns portions of the Beverly Cleary catchment area to Irvington and Irvington is reconfigured from K‐8 to K‐5.
Lee: Effective 2018‐19 boundary changes assign a portion of the former Roseway Heights catchment area to Lee and a portion of the Lee catchment area to Rose City Park and Lee is reconfigured from K‐8 to K‐5.
Lincoln: Effective 2017‐18, a boundary change assigned a portion of the Lincoln catchment area to Wilson.
1. Several elementary schools also have a pre‐kindergarten (PK) program, not included in these enrollment figures.
Rigler: Effective 2018‐19, neighborhood program grades K‐4 move to Scott; effective 2019‐20 neighborhood program all grades at Scott.
West Sylvan: Effective 2017‐18, a boundary change assigned a portion of the West Sylvan catchment area to Gray.
Wilson: Effective 2017‐18, a boundary change assigned a portion of the Lincoln catchment area to Wilson.
2. Grade range for 2018‐19; changes since 2015‐16 described in school‐specific footnotes below; immersion programs assumed to add one grade each year until they match the neighborhood program configuration.
3. Boundary or grade configuration change described in school‐specific footnotes below.
Rose City Park: Effective 2018‐19 boundary changes assign portions of the Alameda, Beverly Cleary, Lee, and former Roseway Heights catchment areas to Rose City Park, which opens as a K‐5.
Roseway Heights: Effective 2018‐19, Roseway Heights reopens as a middle school, grades 6‐8, with elementary school feeders Lee, Rose City Park, Scott, and Vestal. Its former grades K‐8 catchment area is
assigned to Lee, Rose City Park, and Scott for grades K‐5.
Sabin: Effective 2018‐19 Sabin is reconfigured from K‐8 to K‐5.
Scott: Effective 2018‐19 a boundary change assigns a portion of the former Roseway Heights catchment area to Scott, Scott is reconfigured from K‐8 to K‐5, and Rigler neighborhood programs grades K‐4 move
to Scott. Effective 2019‐20 all grades of Rigler neighborhood program are assigned to Scott.
Stephenson: Effective 2016‐17, a boundary change assigned a portion of the Capitol Hill catchment area to Stephenson.
Tubman: Effective 2018‐19, Tubman re‐opens as a middle school, grades 6‐8, with elementary school feeders Boise‐Eliot/Humboldt, Irvington, ML King Jr.,and Sabin.
Madison: Effective 2019‐20 a boundary change assigns a portion of the Grant catchment area to Madison.
Maplewood: Effective 2016‐17, a boundary change assigned a portion of the Maplewood catchment area to Hayhurst.
ML King Jr: Effective 2018‐19 ML King Jr. is reconfigured from K‐8 to K‐5.
Ockley Green: Effective 2016‐17, Ockley Green re‐opened as a middle school, with elementary school feeders Beach, Chief Joseph, Peninsula, and Woodlawn. Chief Joseph 5th grade remained in the
Ockley Green building for 2016‐17. Effective 2017‐18, Ockley Green became a 6‐8.
C-5


APPENDIX D
ELEMENTARY SCHOOL ATTENDANCE AREAS
BY HIGH SCHOOL CLUSTER

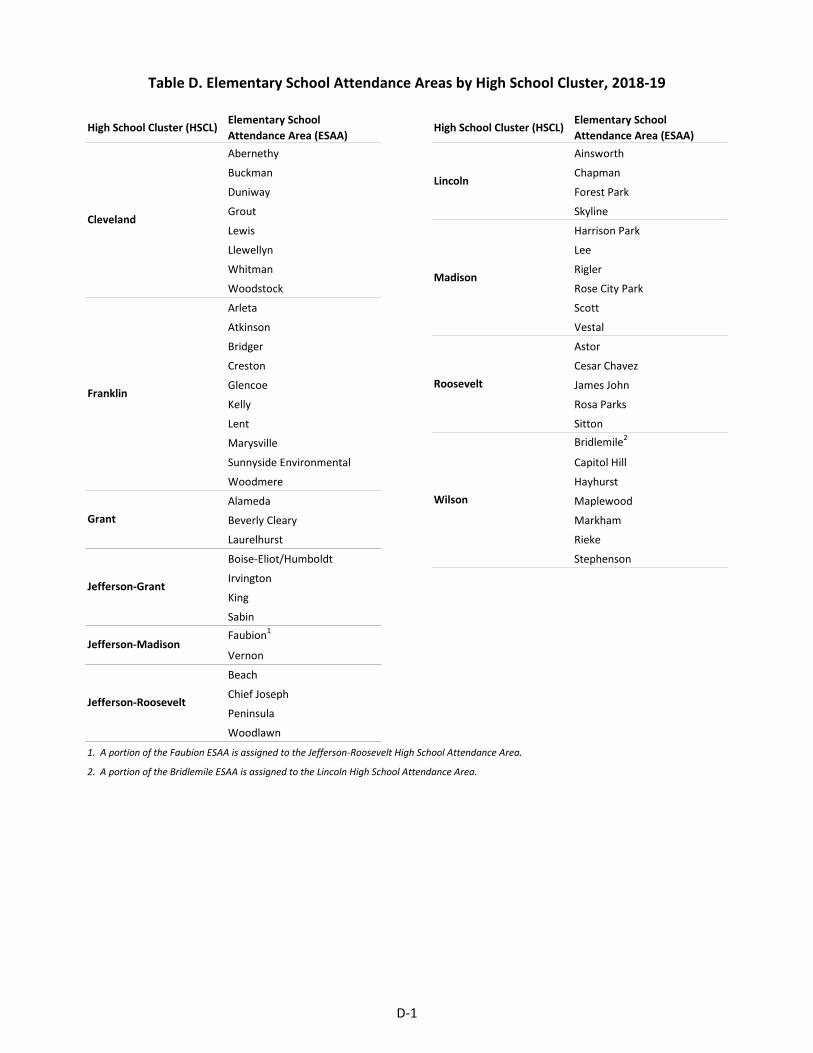
Table D. Elementary School Attendance Areas by High School Cluster, 2018‐19
High School Cluster (HSCL)Elementary School
Attendance Area (ESAA)High School Cluster (HSCL)
Elementary School
Attendance Area (ESAA)
Abernethy Ainsworth
Buckman Chapman
Duniway Forest Park
Grout Skyline
Lewis Harrison Park
Llewellyn Lee
Whitman Rigler
Woodstock Rose City Park
Arleta Scott
Atkinson Vestal
Bridger Astor
Creston Cesar Chavez
Glencoe James John
Kelly Rosa Parks
Lent Sitton
Marysville Bridlemile2
Sunnyside Environmental Capitol Hill
Woodmere Hayhurst
Alameda Maplewood
Beverly Cleary Markham
Laurelhurst Rieke
Boise‐Eliot/Humboldt Stephenson
Irvington
King
Sabin
Faubion1
Vernon
Beach
Chief Joseph
Peninsula
Woodlawn
1. A portion of the Faubion ESAA is assigned to the Jefferson‐Roosevelt High School Attendance Area.
2. A portion of the Bridlemile ESAA is assigned to the Lincoln High School Attendance Area.
Lincoln
Madison
Roosevelt
Wilson
Cleveland
Franklin
Grant
Jefferson‐Grant
Jefferson‐Madison
Jefferson‐Roosevelt
D-1

APPENDIX E
POPULATION, HOUSING, SOCIAL AND ECONOMIC PROFILE
PORTLAND PUBLIC SCHOOLS DISTRICT

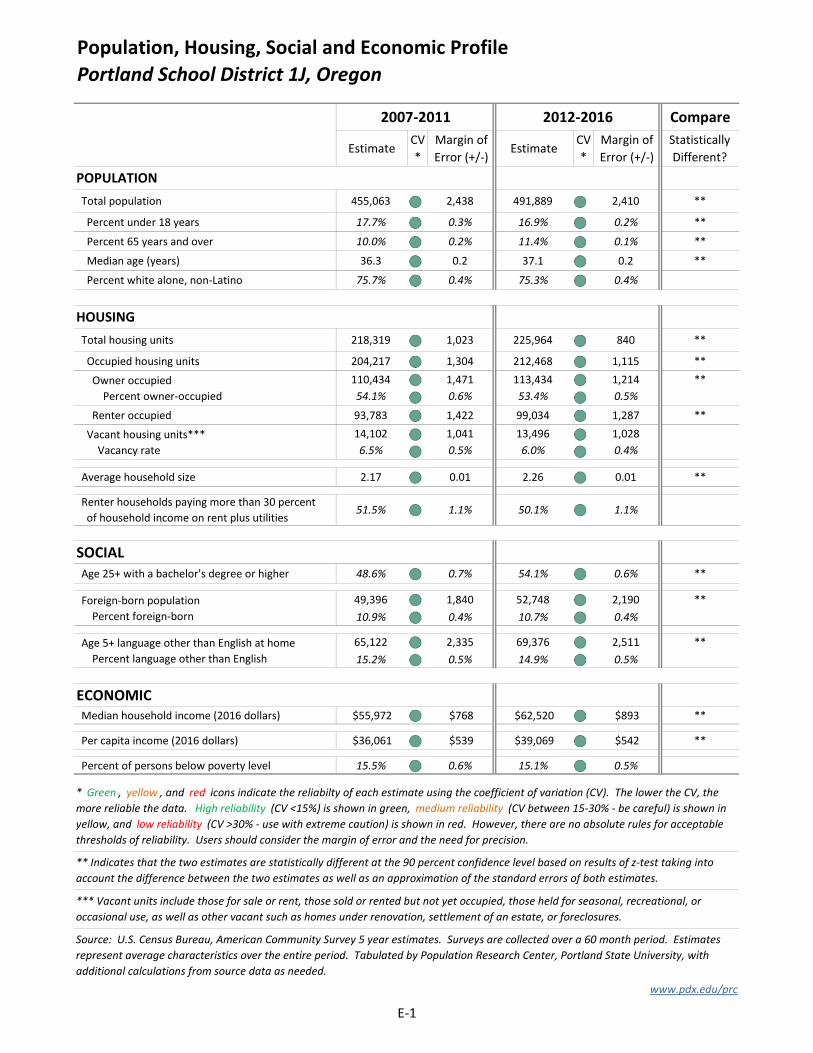
Population, Housing, Social and Economic Profile
Portland School District 1J, Oregon
2007‐2011 2012‐2016 Compare
EstimateCV
*
Margin of
Error (+/‐)Estimate
CV
*
Margin of
Error (+/‐)
Statistically
Different?
POPULATION
Total population 455,063 2,438 491,889 2,410 **
Percent under 18 years 17.7% 0.3% 16.9% 0.2% **
Percent 65 years and over 10.0% 0.2% 11.4% 0.1% **
Median age (years) 36.3 0.2 37.1 0.2 **
Percent white alone, non‐Latino 75.7% 0.4% 75.3% 0.4%
HOUSING
Total housing units 218,319 1,023 225,964 840 **
Occupied housing units 204,217 1,304 212,468 1,115 **
Owner occupied 110,434 1,471 113,434 1,214 **
Percent owner‐occupied 54.1% 0.6% 53.4% 0.5%
Renter occupied 93,783 1,422 99,034 1,287 **
Vacant housing units*** 14,102 1,041 13,496 1,028
Vacancy rate 6.5% 0.5% 6.0% 0.4%
Average household size 2.17 0.01 2.26 0.01 **
Renter households paying more than 30 percent
of household income on rent plus utilities51.5% 1.1% 50.1% 1.1%
SOCIAL Age 25+ with a bachelor's degree or higher 48.6% 0.7% 54.1% 0.6% **
Foreign‐born population 49,396 1,840 52,748 2,190 **
Percent foreign‐born 10.9% 0.4% 10.7% 0.4%
Age 5+ language other than English at home 65,122 2,335 69,376 2,511 **
Percent language other than English 15.2% 0.5% 14.9% 0.5%
ECONOMIC Median household income (2016 dollars) $55,972 $768 $62,520 $893 **
Per capita income (2016 dollars) $36,061 $539 $39,069 $542 **
Percent of persons below poverty level 15.5% 0.6% 15.1% 0.5%
** Indicates that the two estimates are statistically different at the 90 percent confidence level based on results of z‐test taking into
account the difference between the two estimates as well as an approximation of the standard errors of both estimates.
*** Vacant units include those for sale or rent, those sold or rented but not yet occupied, those held for seasonal, recreational, or
occasional use, as well as other vacant such as homes under renovation, settlement of an estate, or foreclosures.
* Green , yellow , and red icons indicate the reliabilty of each estimate using the coefficient of variation (CV). The lower the CV, the
more reliable the data. High reliability (CV <15%) is shown in green, medium reliability (CV between 15‐30% ‐ be careful) is shown in
yellow, and low reliability (CV >30% ‐ use with extreme caution) is shown in red. However, there are no absolute rules for acceptable
thresholds of reliability. Users should consider the margin of error and the need for precision.
Source: U.S. Census Bureau, American Community Survey 5 year estimates. Surveys are collected over a 60 month period. Estimates
represent average characteristics over the entire period. Tabulated by Population Research Center, Portland State University, with
additional calculations from source data as needed.
www.pdx.edu/prc
E-1
Related Documents