A Summer Internship Project Report Submitted by: Prathamesh Jayram Advilkar Dept. of Physics, Wadia College, Pune-01 26-05-2008 to 09-07-2008 Under the guidance of Dr. S. Prasanna Kumar Scientist- F National Institute of Oceanography Dona-Paula, Goa-403004, India

Welcome message from author
This document is posted to help you gain knowledge. Please leave a comment to let me know what you think about it! Share it to your friends and learn new things together.
Transcript
A Summer Internship Project Report Submitted by:
Prathamesh Jayram Advilkar
Dept. of Physics, Wadia College, Pune-01
26-05-2008 to 09-07-2008
Under the guidance of
Dr. S. Prasanna Kumar
Scientist- F
National Institute of Oceanography
Dona-Paula, Goa-403004, India
DECLARATION
I hereby declare that the work incorporated in this dissertation (as a part of the M.Sc
course) is original and carried out at National Institute of Oceanography, Dona Paula,
Goa under the guidance of Dr. S. Prasanna Kumar (Scientist F, Physical
Oceanography Department) and it has not been submitted in part or in full any degree,
diploma of any other University.
DATE: 9th July 2008 Prathamesh J. Advilkar
Place: Panaji-Goa
ACKNOWLEDGEMENT Although Words cannot express my gratitude for people who provided constant support
to me, lifting my spirits and for the general bonhomie, yet, I pen down my feelings to
acknowledge people, without whom, my internship would not have been a success.
First and foremost, I express my most heartfelt and sincere thanks to my project guide,
Dr. S. Prasanna Kumar for his valuable guidance, support, encouragement, and scientific
freedom given to me throughout my internship. I am also grateful to him for motivating
me towards new ideas and I take this opportunity to express my indebtedness and
respect to him.
I would like to thank The Director of NIO, Dr. Satish Shetye for giving me a golden
opportunity to carry out my internship in such a prestigious institute. I am privileged to
express my sincere thanks to JRF’s Roshin Sir, Bajish Sir, for training me both
practically and theoretically about various techniques, without which my work would
not have reached its completion. I am equally thankful to project assistants in POD
laboratory for the same.
I am thankful to Dr.S.C.Lahoti, HoD, Physics dept. Wadia College, Pune for providing
me constant support. I am also grateful to my departmental guide, Dr. K.V. Desa for
lifting my spirits always. I am also thankful to all the professors of my department.
My immense love and gratitude to all my friends whom I met in NIO during my stay for
helping me out in different aspects. Last but definitely not the least, my sincere thanks
to God almighty and my parents for bestowing their blessings on me to complete my
work successfully in a healthy way.
CONTENTS
I. Declaration
II. Certificate
III. Acknowledgement
1. Introduction
1.1. Introduction
1.2. Acoustics
1.3. Expression for the speed of sound
1.4. Underwater Acoustics
1.5. Applications of Underwater Acoustics
1.6. Present Work
2. Data and methods
2.1 General
2.2. Study Area
2.3. Concept
2.4. Programming
2.5. Software Used
3. Results and discussion
3.1. Vertical profile of sound speed
3.2. Vertical profile of temperature and salinity
4. Summary
5. Bibliography
“I seem to have been only like a boy playing on the seashore and diverting myself in now and then finding a smoother pebble or prettier shell than ordinary, whilst the great ocean of truth lay all undiscovered before me.” -Sir Isaac Newton 1642-1727, British Scientist
CHAPTER 1- INTRODUCTION
1.1 INTRODUCTION Oceans have always influenced the life and history of man. From the time immemorial,
man has been using oceans in several ways. According to our mythology, the suras
(Gods) and asuras (Demons) churned the ocean (Samudra manthan) and extracted
amrita, the elixir of life. Even in Kalyuga, we get many mineral, food and energy
resources from the oceans.
The oceanic part of world has an area of about 361 million sq. km (i.e. 71% of the
globe), an average depth of about 3730 m and total volume of about 1347000 million
cubic km. Oceans are huge storehouse of resources like minerals (metals, oils, natural
gas, chemicals etc.), food (fish, prawns, lobsters etc.) and energy (waves, water currents,
tides etc.). We have been using ocean for transporting goods and for recreation purposes.
In addition, ocean controls weather and climate and thus considerably influences the
environment. Even the quality of the air that we breathe depends greatly on the
interaction between the oceans and the atmosphere. Oceans have served as channels of
adventure and discovery. Thus, there are many reasons to study the oceans and benefit
from it.
Oceanographers map the sea floor features by using an echo- sounder. It emits sound
pulses from the ship towards the bottom from where they are reflected to the surface,
and time taken is recorded. Knowing the velocity of sound in ocean water, they find out
the water depth below the ship. Present day multi-beam echo sounders provide wide
coverage of the sea-floor depth simultaneously. Side scan sonar deployed at shallow
water depths gives a picture of the features of the sea-floor and sunken ships and similar
objects. Sound of different frequencies can penetrate through the sea-floor, get reflected
and come back to the ship. Through, such seismic investigations, scientists are able to
find out structure and materials lying beneath the sea-floor. This is how sound is useful
in scientific study. This is the motivation of the present project.
1.2 ACOUSTICS We hear different sounds around us, which includes bird chirping, people talking,
vehicle moving etc. We also hear the sound of rain, leaves moving in breeze and musical
notes from various instruments, these sounds are produced by vibrations. Sound is a
vibration composed of frequency that travels through solids, liquids, & gases and
capable of being detected by ears. We cannot hear all the sounds. The audible range of
human ear is between 20 Hz to 20,000 Hz. The sound below 20 Hz is called infrasonic
whereas beyond 20,000 Hz it is called ultrasonic. The branch of science that deals with
the study of sounds is called, acoustics.
Loudness, pitch and quality are the three characteristics of sound. The loudness of sound
depends upon the amplitude of vibration. The pitch is determined by frequency of
vibration. The quality of sound depends on vibrating body. The loudness of sound is
measured in decibels. Sound needs medium to travel. It propagates best through solids
and liquids and less well in gases but not at all in vacuum. The speed of sound is not the
same in solids, liquids and gases. The speeds of sound in some media are given in
Table1.
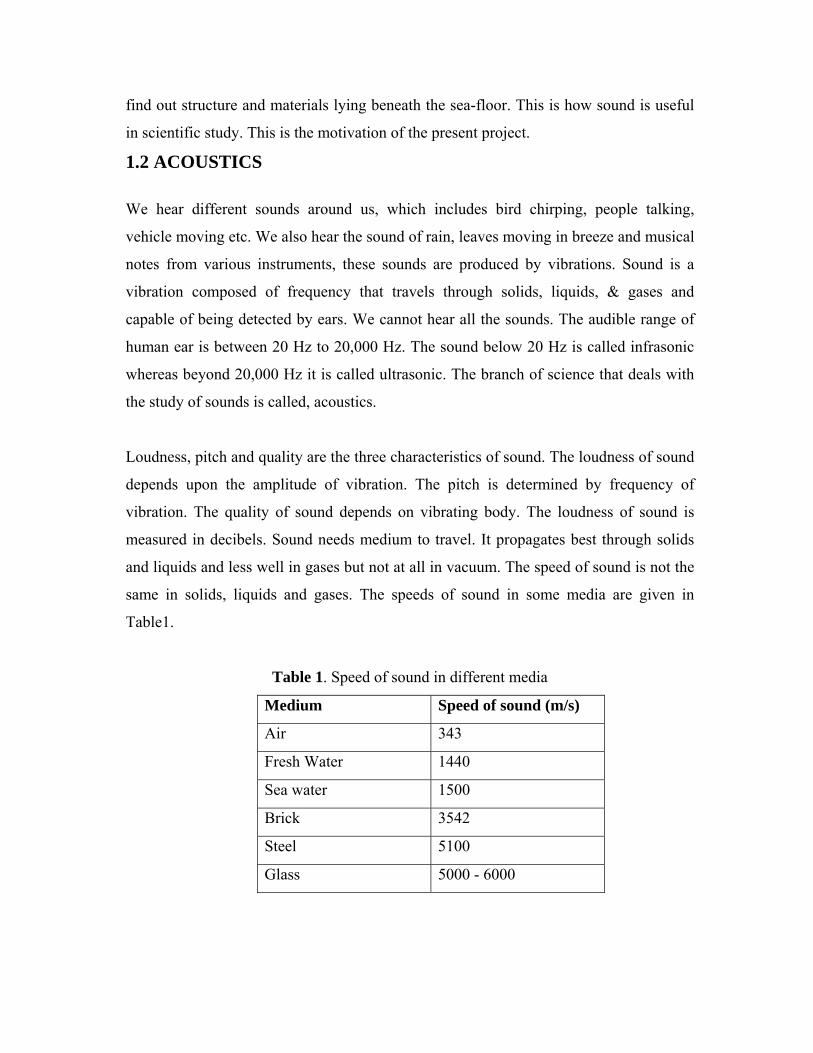
Table 1. Speed of sound in different media
Medium Speed of sound (m/s)
Air 343
Fresh Water 1440
Sea water 1500
Brick 3542
Steel 5100
Glass 5000 - 6000
1.3 EXPRESSION FOR THE SPEED OF SOUND
In general, the speed of sound c is given by
Where
C is a coefficient of stiffness
ρ is the density
Thus, the speed of sound increases with the stiffness of the material, and decreases with
the density.
In a solid material, the stiffness of the springs is called the elastic modulus, and the mass
corresponds to the density. All other things being equal, sound will travel more slowly in
denser materials, and faster in stiffer ones. For instance, sound will travel faster in iron
than uranium, and faster in hydrogen than nitrogen, due to the lower density of the first
material of each set. At the same time, sound will travel faster in iron than hydrogen,
because the internal bonds in a solid like iron are much stronger than the gaseous bonds
between hydrogen molecules. In general, solids will have a higher speed of sound than
liquids, and liquids will have a higher speed of sound than gases.
Speed in solids
In solids the speed of sound is given by
Where
E is Young's modulus
ρ (rho) is density.
Speed in liquids
The speed of sound in a fluid is given by
Where K is the bulk modulus of the fluid.
Speed in ideal gases
The speed of sound in an ideal gas is given by the relationship
C ideal gas
Where,
R = the universal gas constant = 8.314 J/mol K,
T = the absolute temperature
M = the molecular weight of the gas in kg/mol
γ = the adiabatic constant, characteristic of the specific gas
For air, the adiabatic constant γ = 1.4 and the average molecular mass for dry air is 28.95
gm/mol. This leads to
C sound
1.4 UNDERWATER ACOUSTICS Underwater acoustics is the study of the propagation of sound in water and the
interaction of the mechanical waves that constitute sound with the water and its
boundaries. Underwater acoustics is sometimes known as hydro acoustics.
History Underwater sound has probably been used by marine animals for millions of years.
Aristotle is thought to have been the first who noted that sound could be heard in water.
Almost 2000 years later, Leonardo da Vinci wrote,” If you cause your ship to stop and
place the head of a long tube in the water and place the other extremity to your ear, you
will hear ships at great distances.” In 1687 Isaac Newton wrote his Mathematical
Principles of Natural Philosophy which included the first mathematical treatment of
sound.
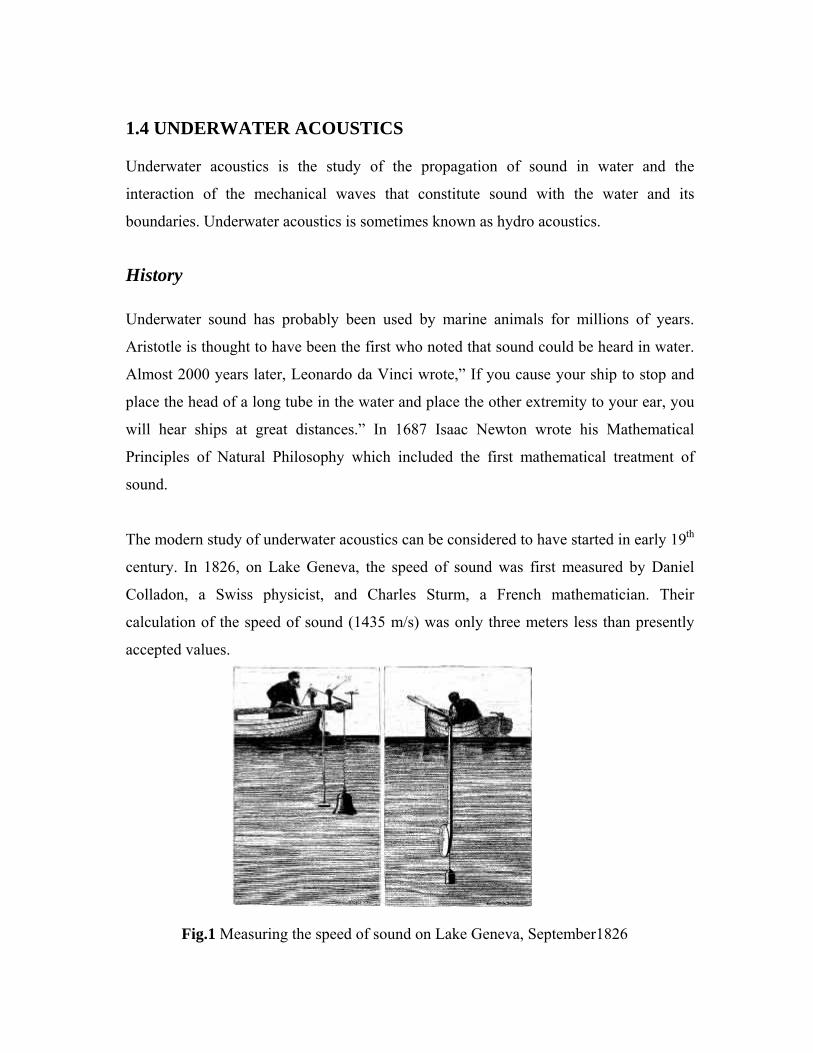
The modern study of underwater acoustics can be considered to have started in early 19th
century. In 1826, on Lake Geneva, the speed of sound was first measured by Daniel
Colladon, a Swiss physicist, and Charles Sturm, a French mathematician. Their
calculation of the speed of sound (1435 m/s) was only three meters less than presently
accepted values.
Fig.1 Measuring the speed of sound on Lake Geneva, September1826
Later, in the 1890s, Elisha Gray, designed a waterproof telephone transmitter that could
be used as a “hydrophone” to listen the underwater bell signals. Shortly after, in 1912,
the effort was expanded to include underwater communication through transmission of
Morse code in the sea. The sinking of the Titanic in 1912 and the start of World War I
provided the impetus for the next wave of progress in underwater acoustics.
The advent of World War I and advances in submarine warfare drove the development
of underwater acoustic technologies. Echoes were received from a submarine at
distances as great as 1500 meters for the first time, in 1918. This resulted in several new
inventions, including the fathometer, and seismic prospecting. In years between the two
World Wars, the development of underwater acoustic instrumentation benefited from
advances in electronics, which allowed for amplification, processing, and the display of
acoustical data. It was during time that scientists began to understand how sound
propagates in the sea.
By the time World War II began, many American ships were equipped for both
underwater listening and echo-ranging. During World War II, an increased effort in
undersea acoustics was directed toward developing systems to locate and track German
U-boats. Scanning sonar sets, acoustic mines, the acoustic homing torpedo, and non-
reflecting coatings for submarines were all developed during wartime.
At the end of World War II, the Soviets gathered the German resources they needed to
build up a submarine fleet, creating a new threat for the allied forces. Therefore, the US
and British efforts in underwater acoustics continued and as a result, great advances in
sound propagation were made. Sonar systems grew larger, more powerful, and operated
at lower frequencies, resulting in much greater range.
Since the end of the Cold War, advances in underwater acoustics have continued. The
focus of military acoustics has shifted from deep water to the shallow water. Moreover,
a considerable increase in the use of underwater sound for non-military, commercial
applications has occurred. These commercial devices include side-scan sonars to image
ship wrecks, sub-bottom profilers to penetrate the seafloor while searching for oil and
other minerals, acoustic speedometers for measuring ship speed, acoustic transponders
and beacons for position marking, and myriad devices to aid in ocean exploration.
Speed of Sound in oceans
The atmosphere is well illuminated each day by sun and light can travel almost
indefinitely through it when there are no water droplets, ice crystals or dust particles
present. We can therefore make use of our sight, and of electromagnetic radiation
generally in making scientific observations. Light is form of EM energy and propagates
effectively through vacuum and in general, less well as the density of material increases.
In the oceans, however, situation is different. The greater part of ocean is almost
completely dark and any artificial light that is introduced is subject to scattering and
absorption making visibility poor. Sound propagates well through liquids and solids, less
well in gases and not at all in vacuum. Acoustic waves, however, travel well in the
ocean and this makes possible the remote sensing of objects and the transmission of
information.
The speed of sound in sea water is about 1500 m/s. It is affected by the oceanographic
variables of temperature, salinity, and pressure. Sound speed increases with increasing
pressure (depth), temperature and salinity. A typical speed of sound in water near the
ocean surface is about 1520 meters per second which is more than 4 times faster than the
speed of sound in air. The approximate change in the speed of sound with a change in
each property is given below:
Change in Temperature by1°C = 4.0 m/s
Change in Salinity by 1PSU = 1.4 m/s
Change in Depth (pressure) by 1000 m = 17 m/s.
In the top few hundred meters of ocean, where temperature changes are large, sound
speed will be controlled mainly by temperature and to a much smaller degree by salinity
and depth. Below the permanent thermocline, neither T nor S varies greatly and so
pressure becomes dominant control on sound speed. Horizontal variations in sound
speed are very much smaller than vertical ones because horizontal gradients of
temperature and salinity are much smaller than vertical gradients. Thus, an acoustic
wave travelling vertically in the ocean will not be significantly affected by refraction
because it is travelling essentially at right angles to the interfaces between layers of
different density. However, the wave travelling horizontally may undergo considerable
refraction because it will meet such interfaces at low angles.
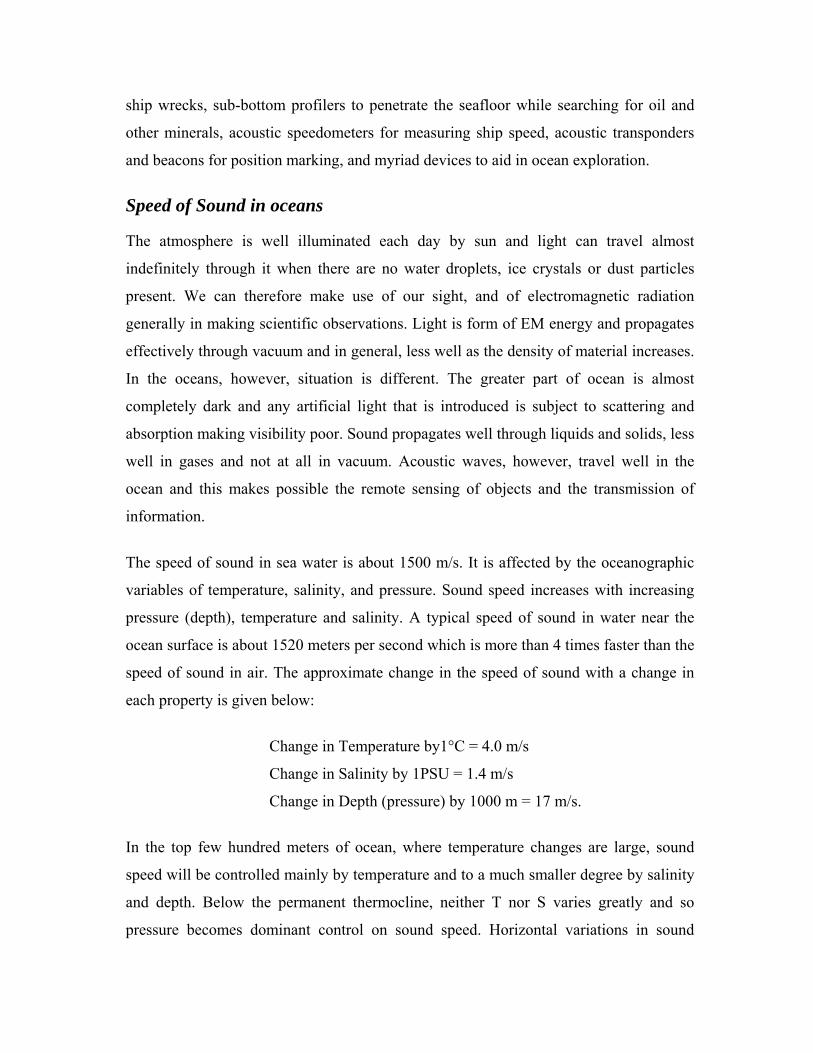
The vertical profile of sound speed in the ocean is given in Fig.2. The decrease in sound
speed near the surface is due to decreasing temperature. The sound speed at the surface
is fast because the temperature is high from the sun warming the upper layers of the
ocean. As the depth increases, the temperature gets colder and colder until it reaches a
nearly constant value. Since the temperature is now constant, the pressure of the water
has the largest effect on sound speed. Because pressure increases with depth, sound
speed increases with depth. Salinity has a much smaller effect on sound speed than
temperature or pressure.
Fig. 2 Typical sound speed (m/s) profile in the ocean
In all water sound speed is determined by its bulk modulus and mass density. The bulk
modulus is affected by temperature, dissolved impurities (usually salinity), and pressure.
Sound Channel In the deep ocean, the slowest sound speed occurs at a depth of about 800 to 1000
meters, i.e. the region in the water column where the sound speed first decreases to a
minimum value with depth and then increases in value, due to pressure. If an acoustic
energy is emitted ear the depth of the sound speed minimum, as the sound energy
propagates upward the sound rays will bent downward due to refraction, similarly as the
sound energy moves downward from the region of minimum sound speed the sound rays
will bent upward again due to refraction. This upward and downward bending of rays
below and above the sound speed minimum results in the rays being trapped within the
ocean and allows the propagation of sound energy horizontally over long distances
within the ocean with out any energy loss. This makes ocean a good sound channel or
acoustic wave guide. This channel is called the SOund Fixing And Ranging, or SOFAR,
channel.
1.5 APPLICATIONS OF UNDERWATER ACOUSTICS SONAR Sonar is the name given to the acoustic equivalent of radar. Sonar (Sound Navigation
And Ranging) is the generic name of the technology that is used to locate objects
underwater. Sonar systems are of two basic types - active and passive. In active sonar,
the system emits a pulse of sound and then the operator listens for echoes. In passive
sonar, the operator listens to sounds emitted by the object one is trying to locate. In
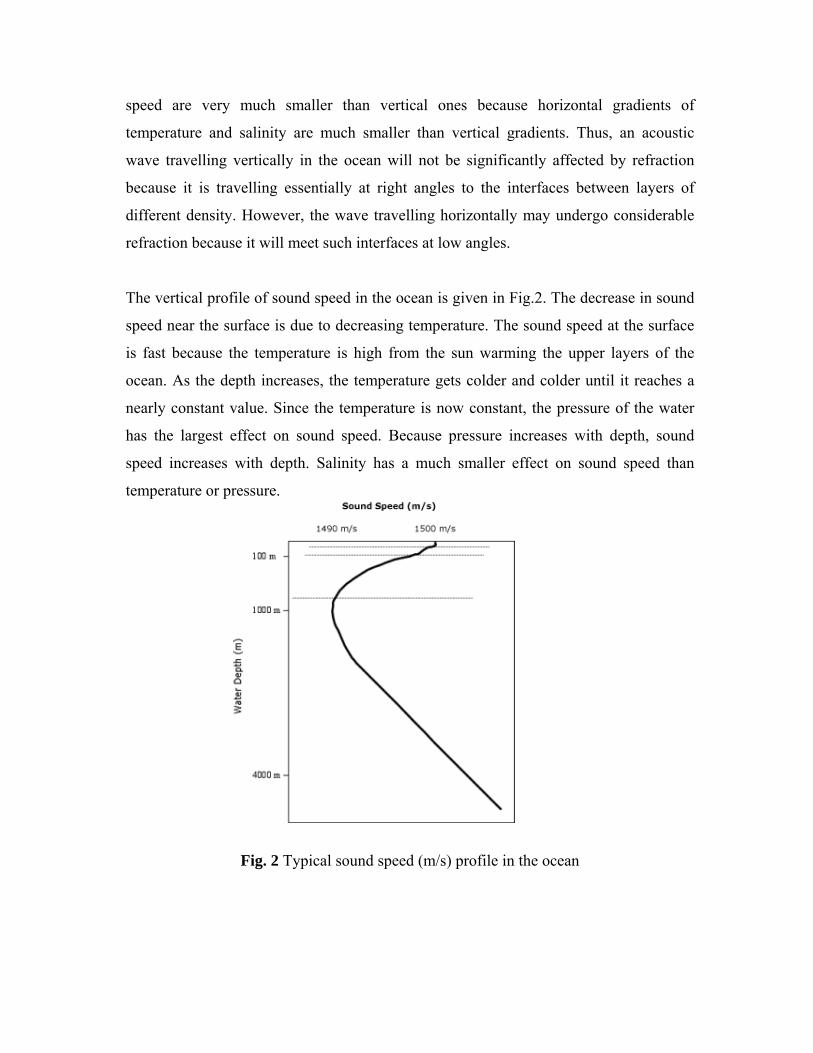
Sonar, sound signal is emitted and reflections are received from objects within the water
(perhaps fish or submarines) or from the sea-bed. When the sound wave travels
vertically down to the sea-bed and back, the time taken will provide a measure of depth
of water if sound speed is also known.
Fig.3 The picture depicting the working principle of SONAR.
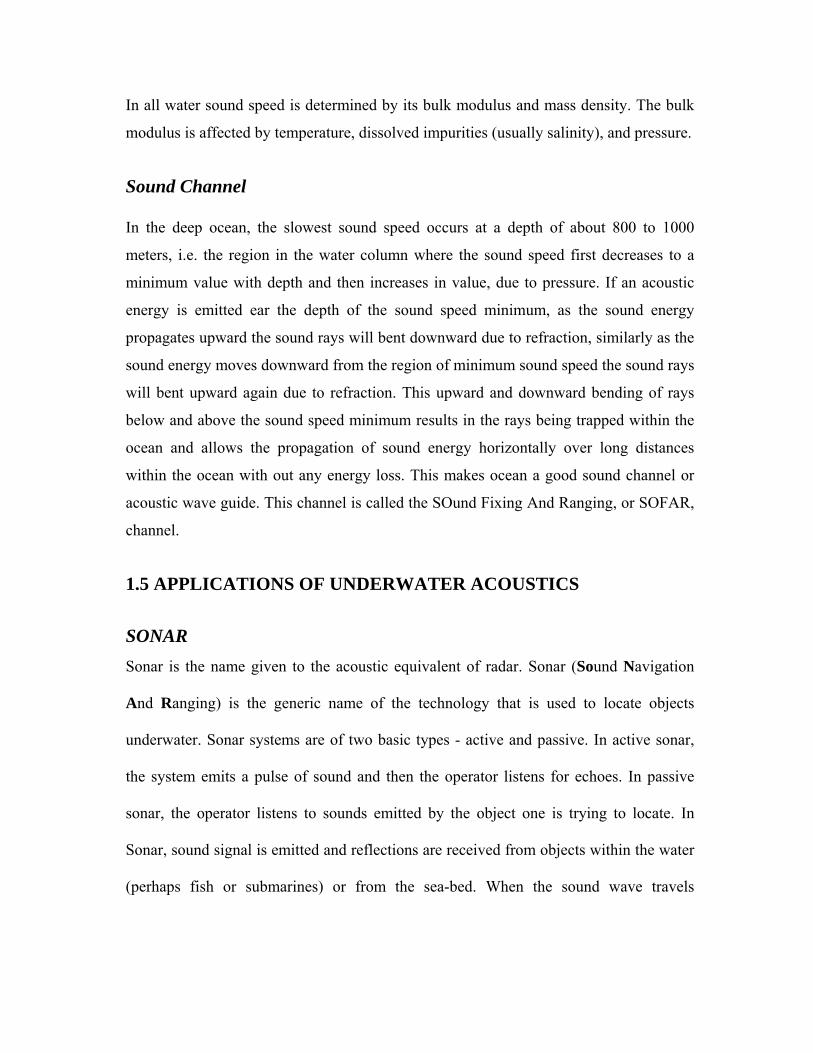
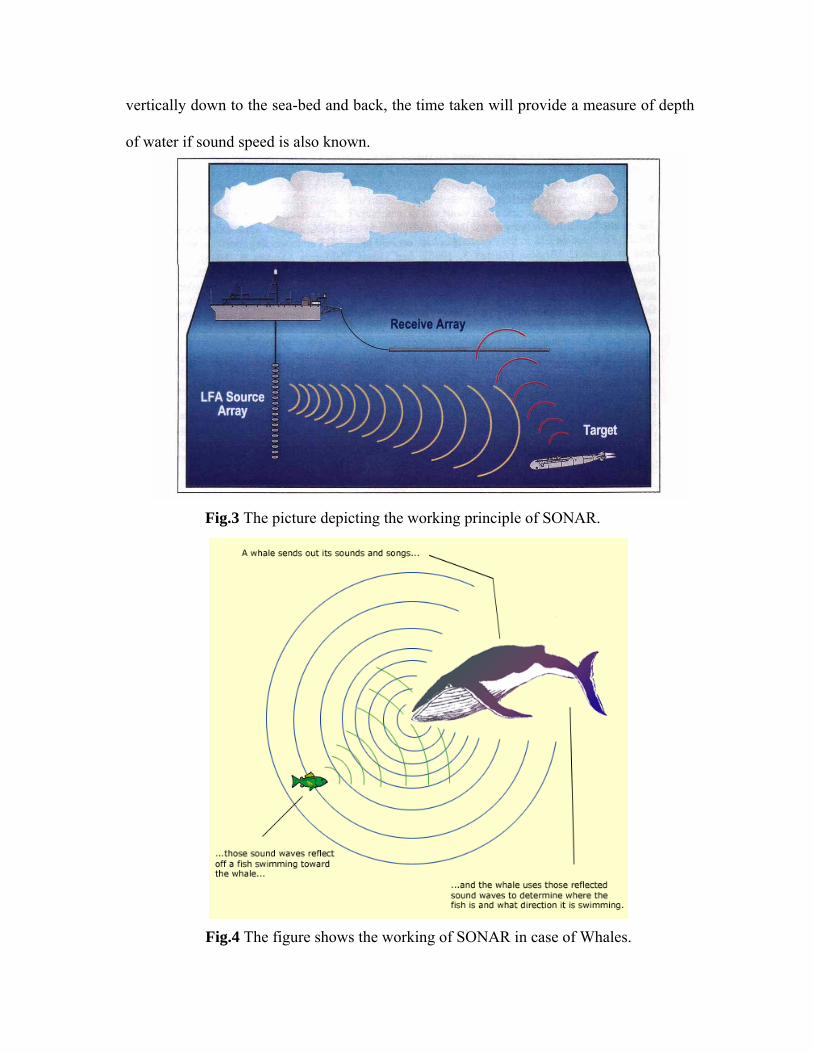
Fig.4 The figure shows the working of SONAR in case of Whales.
Weather & climate observation
Acoustic sensors can be used to monitor the sound made by wind and precipitation.
Marine biology Due to its excellent propagation properties, underwater sound is used as a tool to aid the
study of marine life, from micro plankton to the blue whale.
Particle physics
A neutrino is a fundamental particle that interacts very weakly with other matter. For
this reason, it requires detection apparatus on a very large scale, and the ocean is
sometimes used for this purpose. In particular, it is thought that ultra-high energy
neutrinos in seawater can be detected acoustically.
1.6 PRESENT WORK The aim of the present project work is to understand the characteristics of the sound
speed profiles in the Arabian Sea and the Bay of Bengal. Since the sound speed in the
ocean depends on the temperature and salinity, the vertical profiles of temperature and
salinity were also examined in both the Arabian Sea and the Bay of Bengal.
CHAPTER 2 – DATA AND METHODS
2.1: GENERAL
Underwater propagation depends on many factors. The direction of sound propagation is
determined by the sound speed gradients in the water. In the top few hundred meters of
ocean, where temperature changes are large, sound speed will be controlled mainly by
temperature (T) and to a much smaller degree by salinity (S) and depth (D). Below the
permanent thermocline, neither T nor S varies greatly and so pressure becomes
dominant control on sound speed. In general, T, S, and D will have dominancy over
sound speed. To study the characteristics of the sound speed in the Arabian Sea and the
Bay of Bengal, the annual mean sound speed profiles used for present study were
collected from two locations (4.5oN & 14.5oN) from the central Arabian Sea (63.5oE)
and the central Bay of Bengal (87.5oE).
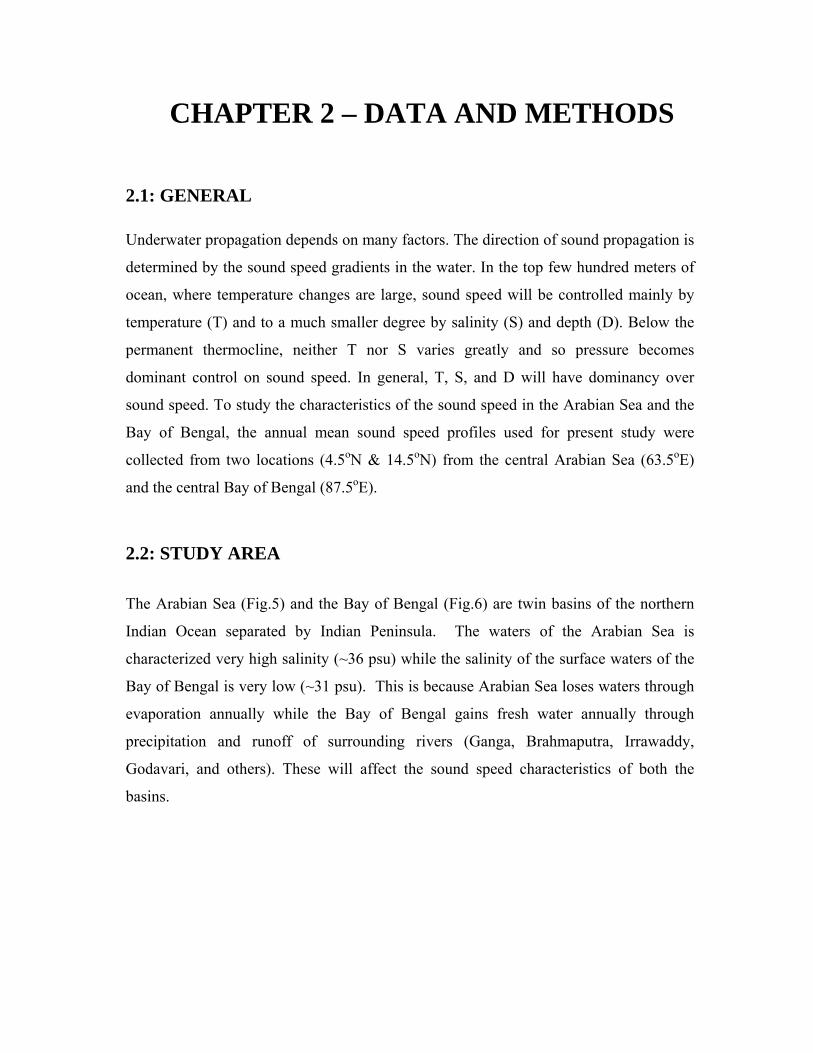
2.2: STUDY AREA The Arabian Sea (Fig.5) and the Bay of Bengal (Fig.6) are twin basins of the northern
Indian Ocean separated by Indian Peninsula. The waters of the Arabian Sea is
characterized very high salinity (~36 psu) while the salinity of the surface waters of the
Bay of Bengal is very low (~31 psu). This is because Arabian Sea loses waters through
evaporation annually while the Bay of Bengal gains fresh water annually through
precipitation and runoff of surrounding rivers (Ganga, Brahmaputra, Irrawaddy,
Godavari, and others). These will affect the sound speed characteristics of both the
basins.
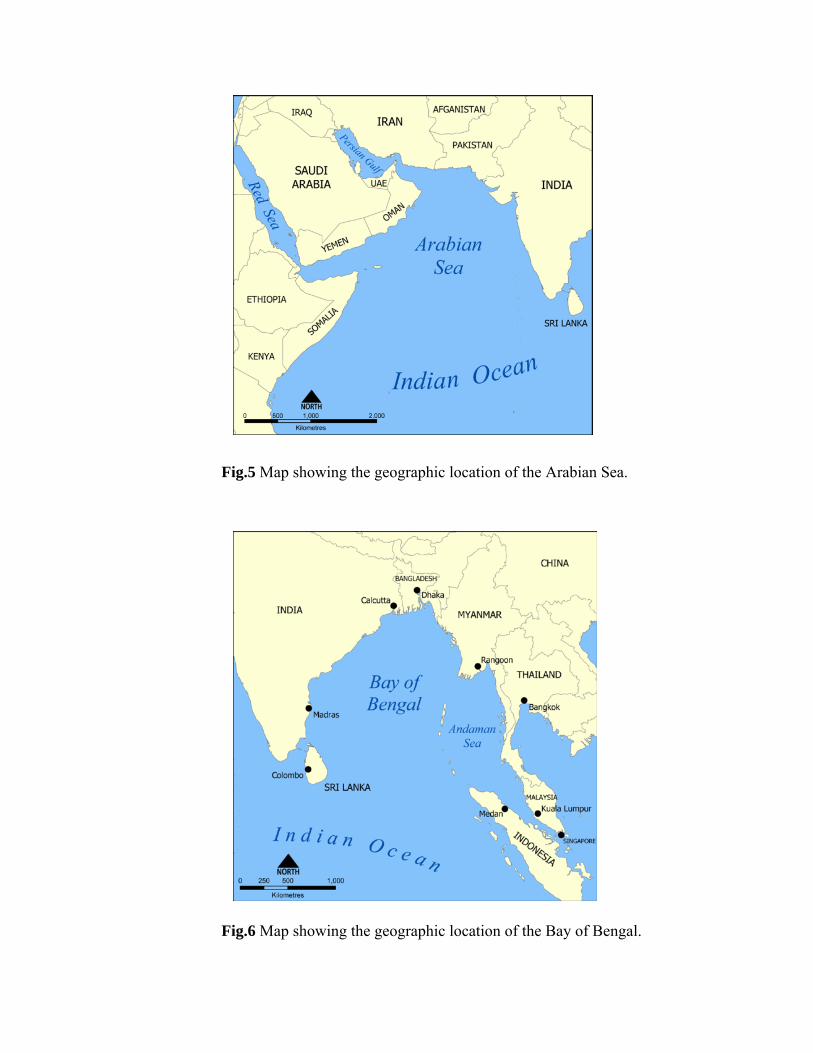
Fig.5 Map showing the geographic location of the Arabian Sea. Fig.6 Map showing the geographic location of the Bay of Bengal.
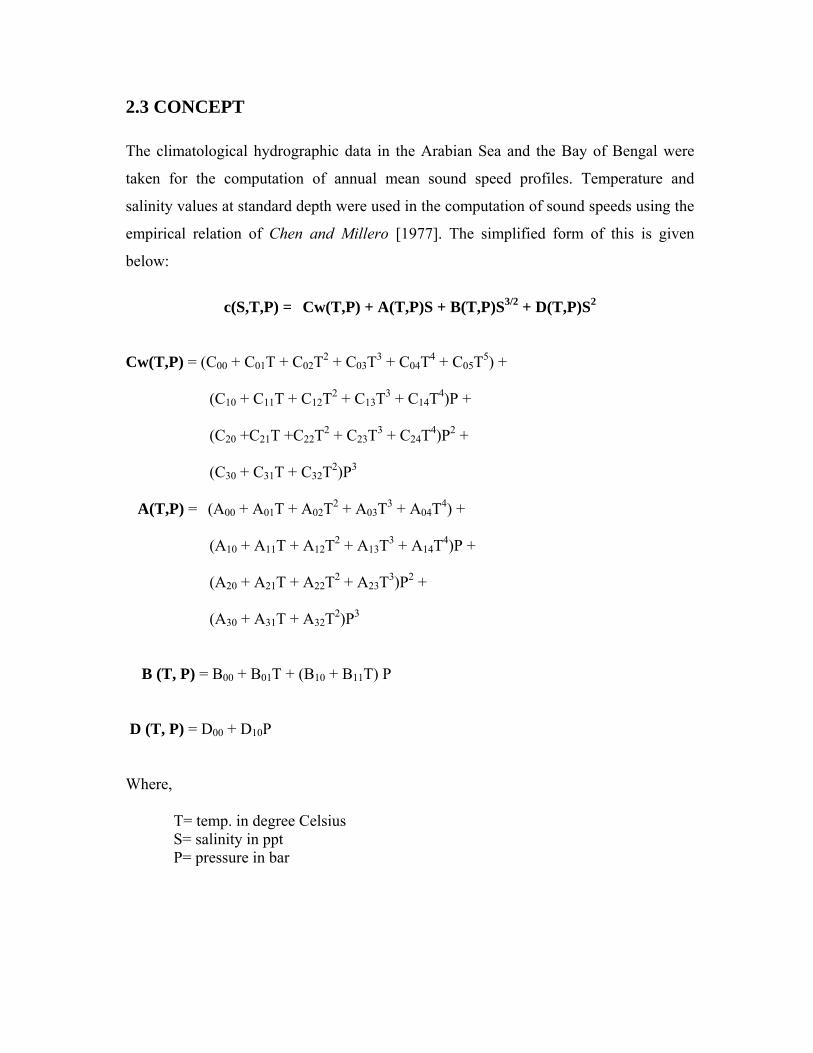
2.3 CONCEPT The climatological hydrographic data in the Arabian Sea and the Bay of Bengal were
taken for the computation of annual mean sound speed profiles. Temperature and
salinity values at standard depth were used in the computation of sound speeds using the
empirical relation of Chen and Millero [1977]. The simplified form of this is given
below:
c(S,T,P) = Cw(T,P) + A(T,P)S + B(T,P)S3/2 + D(T,P)S2
Cw(T,P) = (C00 + C01T + C02T2 + C03T3 + C04T4 + C05T5) + (C10 + C11T + C12T2 + C13T3 + C14T4)P + (C20 +C21T +C22T2 + C23T3 + C24T4)P2 + (C30 + C31T + C32T2)P3 A(T,P) = (A00 + A01T + A02T2 + A03T3 + A04T4) + (A10 + A11T + A12T2 + A13T3 + A14T4)P + (A20 + A21T + A22T2 + A23T3)P2 + (A30 + A31T + A32T2)P3 B (T, P) = B00 + B01T + (B10 + B11T) P D (T, P) = D00 + D10P
Where, T= temp. in degree Celsius S= salinity in ppt P= pressure in bar
2.4 PROGRAMMING Using FORTRAN program sound speed was computed. FORTRAN is a general-
purpose, procedural, imperative programming language that is especially suited to
numeric computation and scientific computing for scientific and engineering
applications. The program for computation of sound speed is given below:
real s,t,svel,d open(1,file='stn702_04.txt') open(2,file='pra3.txt') i=1 10 read (1,*,end=99)d,t,s write(2,5)svel(s,t,d),d 5 format(f7.2,3x,f5.0) goto10 99 close(1) stop end include'/home/bajish/oce2403/functions/svel.f' c ********FUNCTION SVEL*********** real function svel(s,t,p0) c* To compute sound velocity in water. c* Input: c* s - salinity c* t - temperature c* p0 - depth c**************************************************** equivalence (a0,b0,c0),(a1,b1,c1),(a2,c2),(a3,c3) c scale pressure to bars p=p0/10 sr =sqrt (abs(s)) c s**2 term d =1.727e-3-7.9836e-6*p
c s**3/2 term b1=7.3637e-5 +1.7945e-7*t b0=-1.922e-2 -4.42e-5*t b=b0+b1*p c s**1 term a3 =(-3.389e-13*t+6.649e-12)*t+1.100e-10 a2 =((7.988e-12*t-1.6002e-10)*t+9.1041e-9)*t-3.9064e-7 a1=(((-2.0122e-10*t+1.0507e-8)*t-6.4885e-8)*t-1.2580e-5)*t+ # 9.4742e-5 a0=(((-3.21e-8*t+2.006e-6)*t+7.164e-5)*t-1.262e-2)*t+1.389 a=((a3*p+a2)*p+a1)*p+a0 c s**0 term c3=(-2.3643e-12*t+3.8504e-10)*t-9.7729e-9 c2=(((1.0405e-12*t-2.5335e-10)*t+2.5974e-8)*t-1.7107e-6)*t # + 3.1260e-5 c1=(((-6.1185e-10*t+1.3621e-7)*t-8.1788e-6)*t+6.8982e-4)*t # +0.153563 c0=((((3.1464e-9*t-1.47800e-6)*t+3.3420e-4)*t-5.80852e-2)*t # + 5.03711)*t+1402.388 c=((c3*p+c2)*p+c1)*p+c0 c sound speed return svel=c+(a+b*sr+d*s)*s return end 2.5 SOFTWARE USED For the plotting of temperature, salinity and sound speed profiles Golden Software
Package GRAPHER was used.
CHAPTER 3 – RESULTS AND DISCUSSION
3.1 VERTICAL PROFILES OF SOUND SPEED
The sound speeds were computed from the temperature, salinity and depth data at
standard oceanographic depths at one location each in the Arabian Sea (14.5oN, 63.5oE)
and the Bay of Bengal (14.5oN, 87.5oE).
1540 1544 1548 1552
Speed of sound (m/s)
1600
1200
800
400
0
Dep
th o
f wat
er(m
)
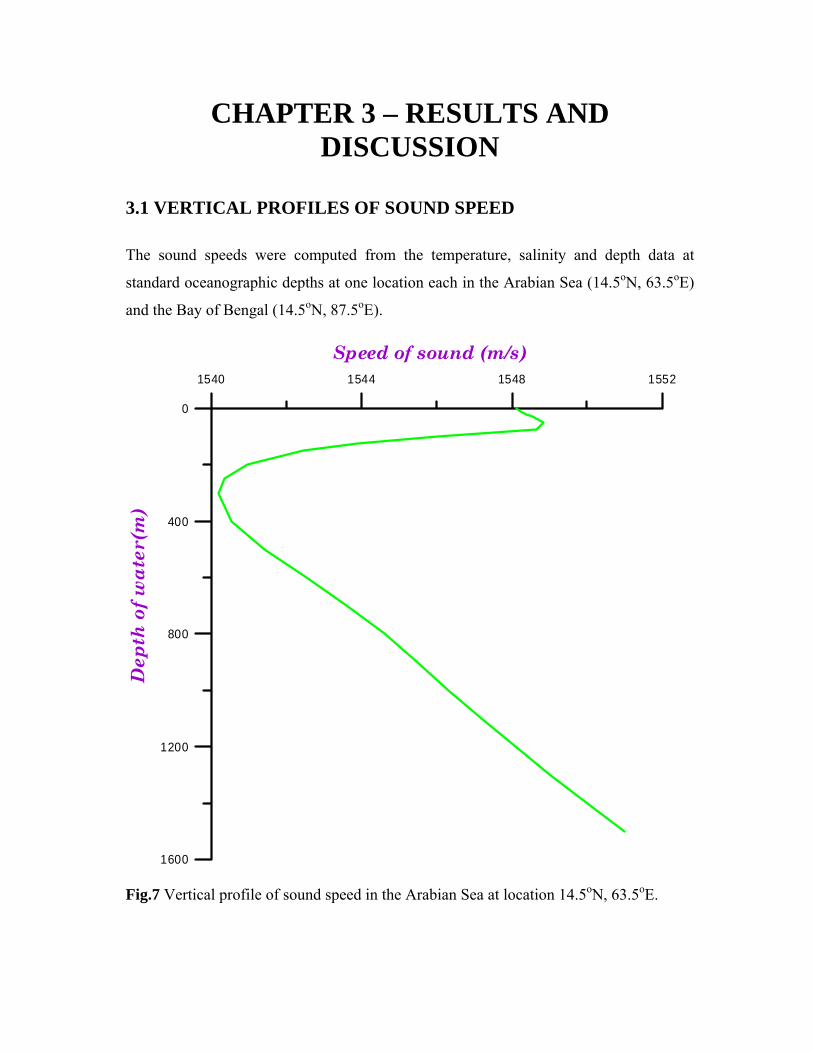
Fig.7 Vertical profile of sound speed in the Arabian Sea at location 14.5oN, 63.5oE.
The vertical profile of sound speed in the Arabian Sea showed that in the upper 50 m the
sound speed increased with depth reaching a maximum value of about 1548.8 m/s at 50
m and below this the sound speed showed a steady decrease reaching the minimum
value of 1540.2 m/s at 300m depth (Fig.7). Below this depth the sound speed showed an
increase right up to the bottom. Thus the characteristics of the sound speed profile in the
Arabian Sea was the presence of surface duct in the upper 50 m which is very important
for the submarine SONAR operations. The SOFAR channel axis was at 300 m and the
effective wave guide lies between 100 m and 1250 m.
1536 1540 1544 1548 1552
Speed of sound (m/s)
1600
1200
800
400
0
Dep
th o
f wat
er(m
)
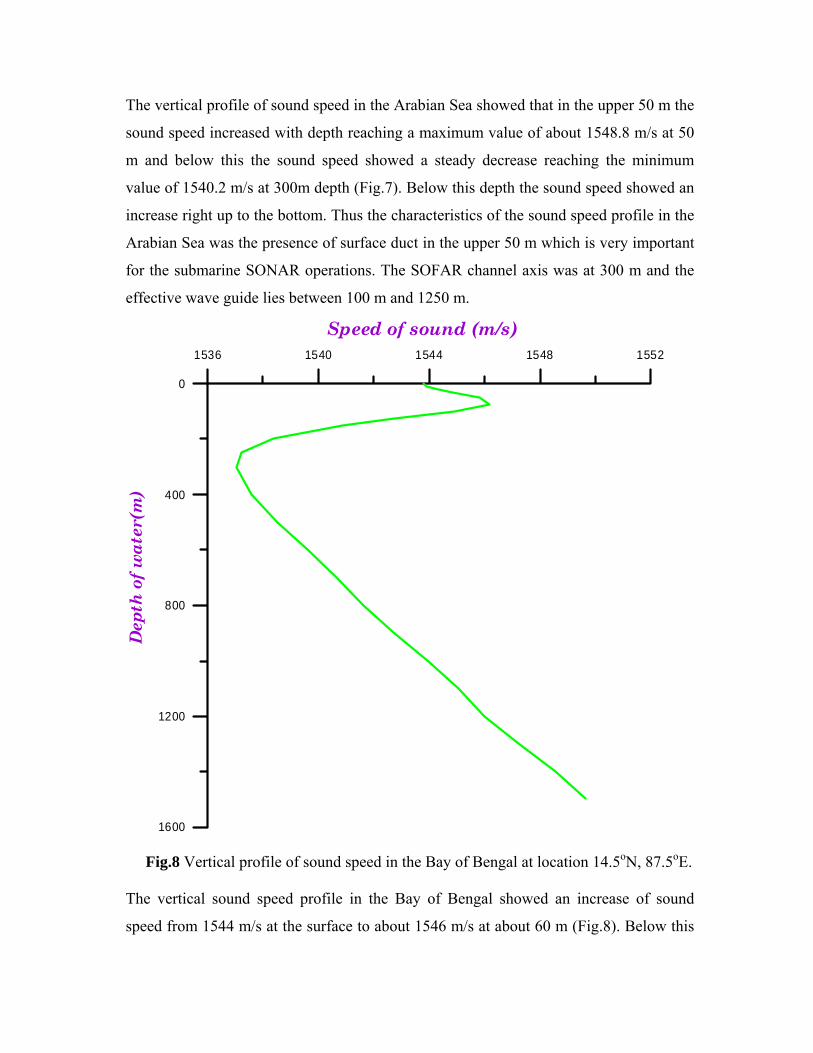
Fig.8 Vertical profile of sound speed in the Bay of Bengal at location 14.5oN, 87.5oE. The vertical sound speed profile in the Bay of Bengal showed an increase of sound
speed from 1544 m/s at the surface to about 1546 m/s at about 60 m (Fig.8). Below this
the sound speed showed rapid decrease and reached the minimum value of 1537 m/s at
300 m. Below 300 m the sound speed increased steadily right up to the bottom. Thus,
the characteristic feature of the sound speed profile in the Bay of Bengal was the
presence of surface duct in the upper 60 m and the SOFAR channel axis at 300m. The
effective deep wave guide was between the depths 100 and 1200 m.
3.2 VERTICAL PROFILES OF TEMPERATURE AND SALINITY
In order to understand the characteristics of the sound speed profiles in the Arabian Sea
and the Bay of Bengal, the vertical profiles of temperature and salinity were analyzed as
the sound speed is controlled by temperature and salinity.
34.8 35.2 35.6 36 36.4
Salinity(psu)
1600
1200
800
400
0
Dep
th (
m)
5 10 15 20 25 30
Temp.(oc)
- -Temperature - - Salinity
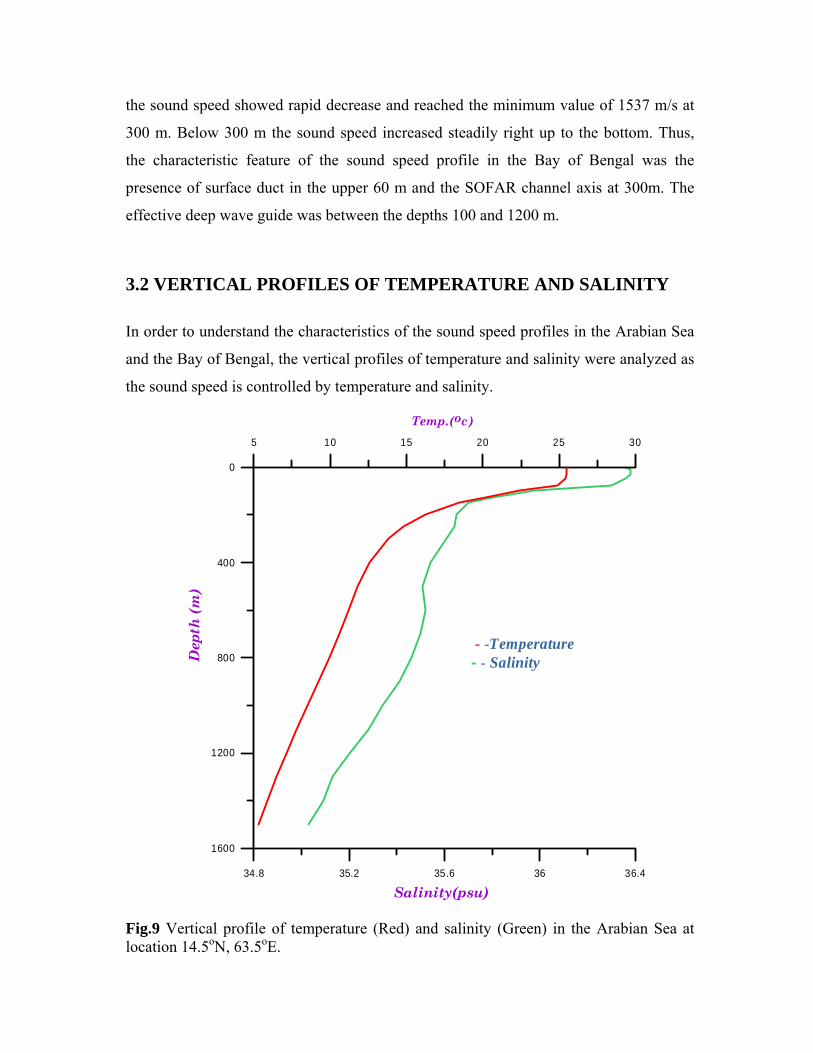
Fig.9 Vertical profile of temperature (Red) and salinity (Green) in the Arabian Sea at location 14.5oN, 63.5oE.
The vertical profile of temperature showed an isothermal layer in the upper 50 m and
below this the temperature decreased rapidly with depth up to 300 m (Fig.9 Red curve).
Below 300 m the temperature decreased slowly with depth. The isothermal layer in the
upper 50m is the mixed layer, while the layer within which the temperature decreased
rapidly (50-300 m) is known as the thermo cline.
The vertical profile of salinity showed a slight increase of salinity in the upper 20 m
followed by an isohaline layer up to 40 m (Fig.9 Green curve). Below 40 m and up to
300 m the salinity decreased rapidly, known as the halocline, while below 300 m the
decrease of salinity with depth was slower.
The characteristics of the sound speed profile arise from the characteristics of the
temperature and salinity profile. The surface duct seen in the sound speed profile in the
upper 50 m was due to the presence of isothermal and isohaline layer within which the
increase in depth leads to an increase in the sound speed, giving rise to the observed
surface duct. The decrease in sound speed below the surface duct and up to 300 m was
due to the rapid decrease of temperature and salinity (thermo cline and halocline) in this
layer. Below 300 m the effect of increased pressure due to increase in depth is more
dominant than the slow decrease of temperature and salinity with depth which ultimately
increases the sound speed.
In the Bay of Bengal the thermal structure showed an isothermal layer in the upper 60 m
within which the salinity showed a rapid increase (Fig.10). This layer is known as the
barrier layer. Below 60 m the temperature decreased but the salinity decreased rapidly
with depth up to 300 m. Below 300 m both temperature and salinity showed very slow
decrease.
The strong surface duct seen in the vertical profile of sound speed in the Bay of Bengal
arises due to the sharp increase of salinity in the isothermal layer. Thus, in the Bay of
Bengal both increasing salinity and depth gives rise to the formation of strong surface
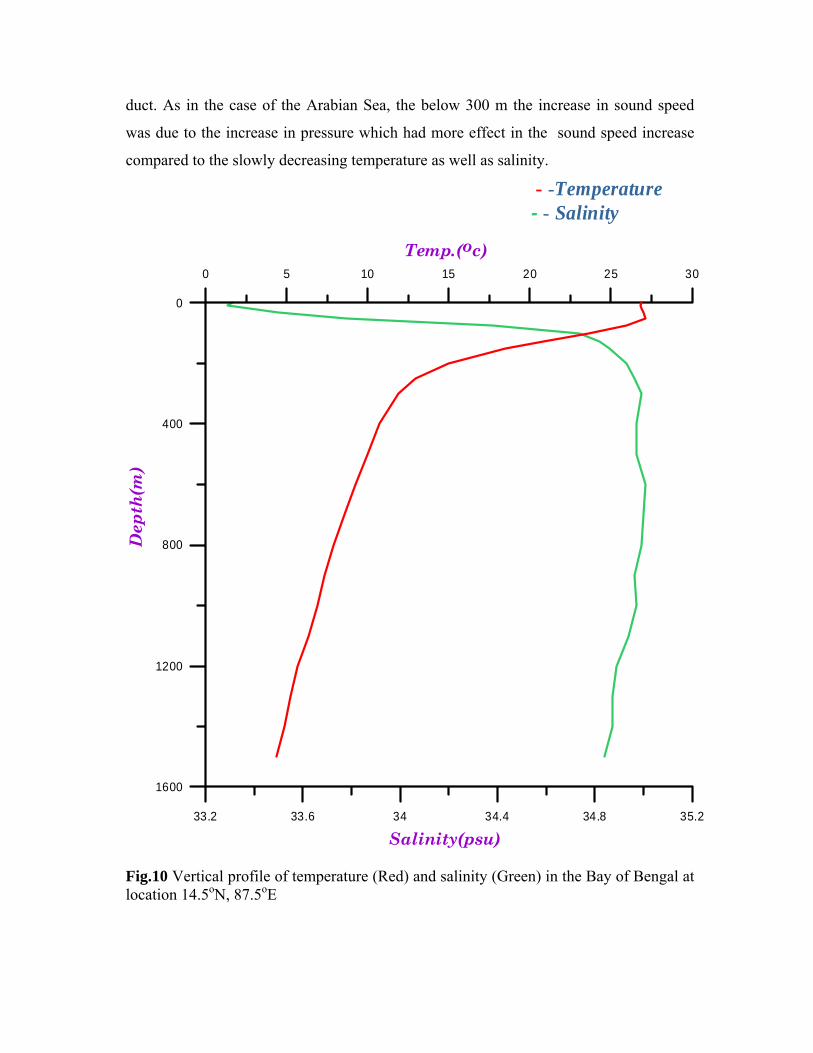
duct. As in the case of the Arabian Sea, the below 300 m the increase in sound speed
was due to the increase in pressure which had more effect in the sound speed increase
compared to the slowly decreasing temperature as well as salinity.
33.2 33.6 34 34.4 34.8 35.2
Salinity(psu)
1600
1200
800
400
0
Dep
th(m
)
0 5 10 15 20 25 30
Temp.(oc)
- -Temperature- - Salinity
Fig.10 Vertical profile of temperature (Red) and salinity (Green) in the Bay of Bengal at location 14.5oN, 87.5oE
CHAPTER 4 – SUMMARY The present project work studies the characteristics of the sound speed profiles in the
Arabian Sea and the Bay of Bengal. Since the sound speed in the ocean depends on the
temperature and salinity, the vertical profiles of temperature and salinity were also
examined in both the Arabian Sea and the Bay of Bengal. To compute sound speed
FORTRAN program was used. The sound speeds were computed from the temperature,
salinity and depth data at standard oceanographic depths at one location each in the
Arabian Sea (14.5oN, 63.5oE) and the Bay of Bengal (14.5oN, 87.5oE). The vertical
profile of sound speed in the Arabian Sea showed the presence of surface duct in the
upper 50 m which is very important for the submarine SONAR operations. The SOFAR
channel axis was at 300 m and the effective wave guide lies between 100 m and 1250 m
whereas the vertical sound speed profile in the Bay of Bengal showed the presence of
surface duct in the upper 60 m and the SOFAR channel axis at 300m. The effective deep
wave guide was between the depths 100 and 1200 m. Again analyzing vertical profiles
of temperature and salinity it is found that the surface duct seen in the Arabian Sea
sound speed profile in the upper 50 m was due to the presence of isothermal and
isohaline layer. Sound speed increases here with increase in depth. Below 300 m the
depth is more dominant than temperature and salinity which ultimately increases the
sound speed while in the Bay of Bengal, strong surface duct was seen due to the sharp
increase of salinity in the isothermal layer. Sound speed increases below 300 m, as it
was in the same case of Arabian Sea.
Due to lower salinity of Bay of Bengal, it will have always lower sound speed values at
any given depth.
Bibliography
Descriptive physical oceanography, an introduction -George Pickard Emery
Oceanography, Physical Processes- Open University Series
Story of the oceans -Dept. of ocean development and Geological Society of India
Oceanography-An invitation to marine sciences -Tom garrison
Learning Sciences-The world of Physics and Energy-Indumati Rao, C.N.R. Rao
Acoustic propagational characteristics and tomography studies of the northern Indian Ocean
-S. Prasanna Kumar, Y.K. Somayajulu, and T.V.Ramana Murthy (1997)
Numerical simulation and measurements of acoustic transmissions from Heard Island to the equatorial Indian ocean.
-S. Prasanna Kumar, Y.K. Somayajulu,G.S Navelkar,A.K. Saran,T.V.Ramana Murthy and C.S.Murthy(1996)
Acoustic propagation within a surface duct in the western Bay of Bengal
-S. Prasanna Kumar,G.S Navelkar, T.V.Ramana Murthy and C.S.Murthy (1994)
Resources used from the Website used in the study
en.wikipedia.org/wiki/underwater _sound
oceanexplorer.noaa.gov/explorations/sound01/background/acoustics
www.dosits.org
hyperphysics.phy.astr.gsu.edu/
en.wikipedia.org/wiki/speed_of_sound
Related Documents