Pramerica Sicav Socie ´te ´ d’Investissement a ` Capital Variable With Multiple Sub-funds (SICAV organized under the laws of the Grand-Duchy of Luxembourg) Unaudited Semi-Annual Report as at June 30, 2019 11-13, Boulevard de la Foire L-1528 Luxembourg R.C.S. Luxembourg B-36503 No subscription can be solely received on the basis of annual reports. Subscriptions are only valid if made on the basis of the current prospectus accompanied by the latest annual report, including audited financial statements and the most recent unaudited semi-annual report, if published thereafter.

Welcome message from author
This document is posted to help you gain knowledge. Please leave a comment to let me know what you think about it! Share it to your friends and learn new things together.
Transcript
Pramerica Sicav
Societe d’Investissement a Capital VariableWith Multiple Sub-funds
(SICAV organized under the laws of the Grand-Duchy of Luxembourg)
Unaudited Semi-Annual Reportas at June 30, 2019
11-13, Boulevard de la FoireL-1528 Luxembourg
R.C.S. Luxembourg B-36503
No subscription can be solely received on the basis of annual reports. Subscriptions are only valid if made on the basis of the current prospectus
accompanied by the latest annual report, including audited financial statements and the most recent unaudited semi-annual report, if published thereafter.

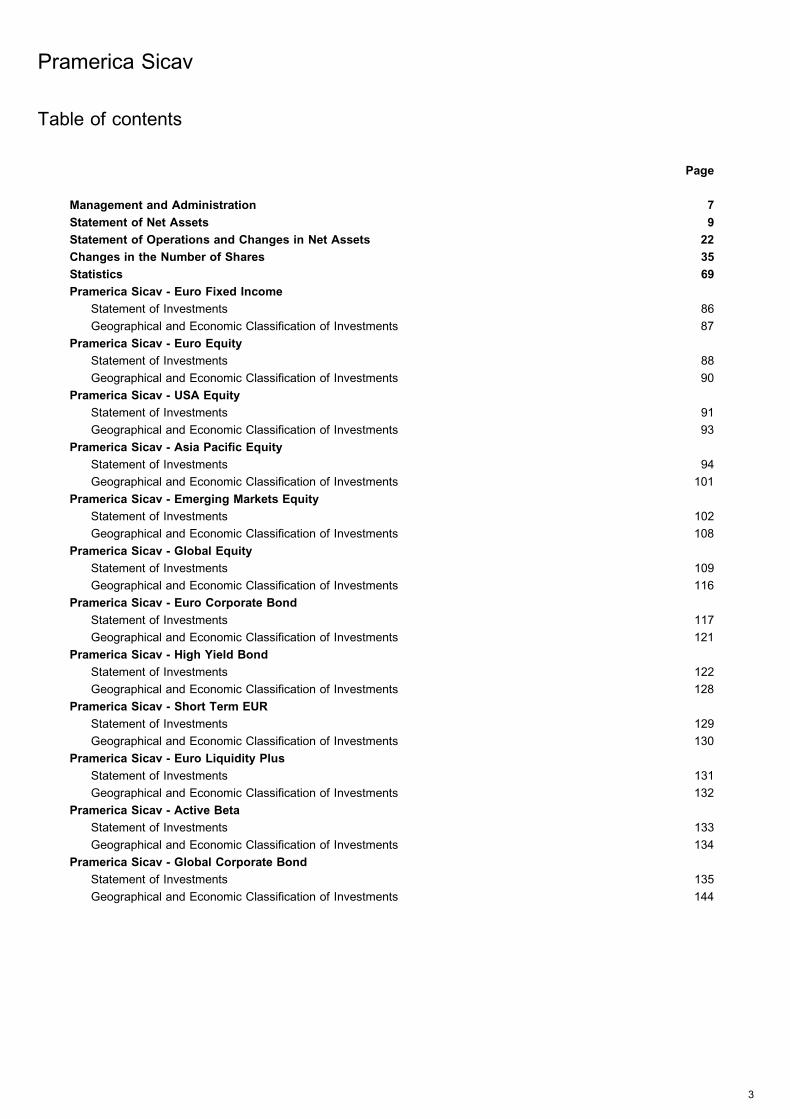
Table of contents
Page
Management and Administration 7
Statement of Net Assets 9
Statement of Operations and Changes in Net Assets 22
Changes in the Number of Shares 35
Statistics 69
Pramerica Sicav - Euro Fixed Income
Statement of Investments 86
Geographical and Economic Classification of Investments 87
Pramerica Sicav - Euro Equity
Statement of Investments 88
Geographical and Economic Classification of Investments 90
Pramerica Sicav - USA Equity
Statement of Investments 91
Geographical and Economic Classification of Investments 93
Pramerica Sicav - Asia Pacific Equity
Statement of Investments 94
Geographical and Economic Classification of Investments 101
Pramerica Sicav - Emerging Markets Equity
Statement of Investments 102
Geographical and Economic Classification of Investments 108
Pramerica Sicav - Global Equity
Statement of Investments 109
Geographical and Economic Classification of Investments 116
Pramerica Sicav - Euro Corporate Bond
Statement of Investments 117
Geographical and Economic Classification of Investments 121
Pramerica Sicav - High Yield Bond
Statement of Investments 122
Geographical and Economic Classification of Investments 128
Pramerica Sicav - Short Term EUR
Statement of Investments 129
Geographical and Economic Classification of Investments 130
Pramerica Sicav - Euro Liquidity Plus
Statement of Investments 131
Geographical and Economic Classification of Investments 132
Pramerica Sicav - Active Beta
Statement of Investments 133
Geographical and Economic Classification of Investments 134
Pramerica Sicav - Global Corporate Bond
Statement of Investments 135
Geographical and Economic Classification of Investments 144
Pramerica Sicav
3
Pramerica Sicav - Euro Corporate Short Term
Statement of Investments 145
Geographical and Economic Classification of Investments 149
Pramerica Sicav - Euro Equity High Dividend
Statement of Investments 150
Geographical and Economic Classification of Investments 151
Pramerica Sicav - Emerging Markets Bond
Statement of Investments 152
Geographical and Economic Classification of Investments 155
Pramerica Sicav - Global Dynamic Allocation
Statement of Investments 156
Geographical and Economic Classification of Investments 158
Pramerica Sicav - Cedola Certa 2012-2015
Statement of Investments 159
Geographical and Economic Classification of Investments 160
Pramerica Sicav - Beta Neutral
Statement of Investments 161
Geographical and Economic Classification of Investments 163
Pramerica Sicav - Long/Short Euro
Statement of Investments 164
Geographical and Economic Classification of Investments 166
Pramerica Sicav - Cedola Certa 2013-2016
Statement of Investments 167
Geographical and Economic Classification of Investments 168
Pramerica Sicav - Protezione e Crescita 2017
Statement of Investments 169
Geographical and Economic Classification of Investments 170
Pramerica Sicav - Cedola Certa 2013-2017
Statement of Investments 171
Geographical and Economic Classification of Investments 172
Pramerica Sicav - Focus Italia
Statement of Investments 173
Geographical and Economic Classification of Investments 174
Pramerica Sicav - Cedola Mercati Emergenti
Statement of Investments 175
Geographical and Economic Classification of Investments 178
Pramerica Sicav - Protezione Mercati Emergenti
Statement of Investments 179
Geographical and Economic Classification of Investments 180
Pramerica Sicav - Multiasset Europe 50
Statement of Investments 181
Geographical and Economic Classification of Investments 183
Pramerica Sicav - Global High Yield Euro Hedged
Statement of Investments 184
Geographical and Economic Classification of Investments 190
Pramerica Sicav
4
Table of contents (continued)
Pramerica Sicav - Global Multiasset 30
Statement of Investments 191
Geographical and Economic Classification of Investments 193
Pramerica Sicav - Italian Equity
Statement of Investments 194
Geographical and Economic Classification of Investments 196
Pramerica Sicav - Income Opportunities
Statement of Investments 197
Geographical and Economic Classification of Investments 200
Pramerica Sicav - European Equity
Statement of Investments 201
Geographical and Economic Classification of Investments 203
Pramerica Sicav - Global Stars
Statement of Investments 204
Geographical and Economic Classification of Investments 207
Pramerica Sicav - Social 4 Future
Statement of Investments 208
Geographical and Economic Classification of Investments 212
Pramerica Sicav - Global Multiasset 15
Statement of Investments 213
Geographical and Economic Classification of Investments 215
Pramerica Sicav - Euro Corporate Bond High Potential
Statement of Investments 216
Geographical and Economic Classification of Investments 223
Pramerica Sicav - Obiettivo Stabilita
Statement of Investments 224
Geographical and Economic Classification of Investments 229
Pramerica Sicav - Obiettivo Controllo
Statement of Investments 230
Geographical and Economic Classification of Investments 235
Pramerica Sicav - Obiettivo Equilibrio
Statement of Investments 236
Geographical and Economic Classification of Investments 241
Pramerica Sicav - Obiettivo Sviluppo
Statement of Investments 242
Geographical and Economic Classification of Investments 246
Pramerica Sicav - Globo (Global Bond)
Statement of Investments 247
Geographical and Economic Classification of Investments 252
Pramerica Sicav - US Core Equity
Statement of Investments 253
Geographical and Economic Classification of Investments 257
Pramerica Sicav - Global Inflation Linked
Statement of Investments 258
Geographical and Economic Classification of Investments 259
Pramerica Sicav - Strategic Bond
Statement of Investments 260
Geographical and Economic Classification of Investments 262
Pramerica Sicav
5
Table of contents (continued)
Pramerica Sicav - Euro High Yield
Statement of Investments 263
Geographical and Economic Classification of Investments 268
Pramerica Sicav - Italian Mid Cap Equity
Statement of Investments 269
Geographical and Economic Classification of Investments 271
Pramerica Sicav - Social 4 Planet
Statement of Investments 272
Geographical and Economic Classification of Investments 277
Pramerica Sicav - Absolute Return Solution
Statement of Investments 278
Geographical and Economic Classification of Investments 282
Pramerica Sicav - Global Infrastructure
Statement of Investments 283
Geographical and Economic Classification of Investments 284
Pramerica Sicav - Inflation Linked Euro Hedged
Statement of Investments 285
Geographical and Economic Classification of Investments 286
Pramerica Sicav - Smart Factor Euro
Statement of Investments 287
Geographical and Economic Classification of Investments 289
Notes to the Financial Statements 290
Unaudited Appendix 361
Pramerica Sicav
6
Table of contents (continued)
Management and Administration
Board of Directors of the SICAV:
Chairman:
Mr. Sergio PaciChairman of the BoardPramerica SGR S.p.A.5, Via Monte di PietaI-20121 Milano
Members:
Mr. Andrea GhidoniChief Executive Officer and General ManagerPramerica SGR S.p.A.5, Via Monte di PietaI-20121 Milano
Ms. Marcella SivilottiHead of StrategyPGIM655, Broad Street, 19th FloorNewark, NJ 07102 USA
Management Company:
Pramerica Management Company S.A.37/A, Avenue J.F. KennedyL-1855 Luxembourg
Cabinet de Revision Agree:
Deloitte AuditSociete a responsabilite limitee560, rue de NeudorfL-2220 Luxembourg
Legal Advisors:
- as to Iceland Law:Lex Law OfficesBorgartuni 26,105 Reykjavik
- as to Luxembourg Law:Bonn & Schmitt148, Avenue de la FaıencerieL-1511 Luxembourg
- as to Italian Law:Galante e Associati Studio Legalevia del Banco di S. Spirito, 42I-00186 Roma
Registered Office:
11-13 Boulevard de la FoireL-1528 LuxembourgR.C.S. Luxembourg B-36503
Distributors:
EFG Bank (Luxembourg) S.A.56, Grand-RueL-1660 Luxembourg
Pramerica SGR S.p.A.Head Office: piazza Vittorio Veneto, 8, I-24122 Bergamo;Administrative Office: 5, Via Monte di Pieta, I-20121 Milano
Investment Managers:
Pramerica SGR S.p.A.Head Office: piazza Vittorio Veneto, 8, I-24122 Bergamo;Administrative Office: 5, Via Monte di Pieta, I-20121 Milano
for all sub-funds except the sub-funds mentioned below.
Prudential International Investments Advisers, LLC655, Broad StreetNewark, NJ 07102 USA
for the following sub-funds:Pramerica Sicav – High Yield BondPramerica Sicav – Cedola Mercati Emergenti
Sub-Investment Managers/Sub-sub Investment Managers:
Prudential International Investments Advisers, LLC655, Broad StreetNewark, NJ 07102 USA
for the following sub-funds:Pramerica Sicav – USA EquityPramerica Sicav – Asia Pacific EquityPramerica Sicav – Emerging Markets EquityPramerica Sicav – Global EquityPramerica Sicav – Global Corporate BondPramerica Sicav – Emerging Markets BondPramerica Sicav – Global High Yield Euro HedgedPramerica Sicav – Globo (Global Bond)Pramerica Sicav – US Core EquityPramerica Sicav – Global Infrastructure
Quantitative Management Associates LLC (QMA)Gateway Center 2McCarter Highway & Market StreetNewark, NJ 07102 USA
PGIM, Inc.Prudential PlazaNewark, NJ 07101 USA
Pramerica Sicav
7
Sub-Investment Managers/Sub-sub Investment Managers: (continued)
Jennison Associates LLC466 Lexington AvenueNew York, NY 10017 USA
Pramerica Investment Management LimitedGrand Buildings, 1-3 Strand, Trafalgar SquareLondon WC2N 5HR UK
Depositary Bank, Domiciliary and Paying Agent:
RBC Investor Services Bank S.A.14, Porte de FranceL-4360 Esch-sur-Alzette
Administrative, Registrar and Transfer Agent:
RBC Investor Services Bank S.A.14, Porte de FranceL-4360 Esch-sur-Alzette
Pramerica Sicav
8
Management and Administration (continued)
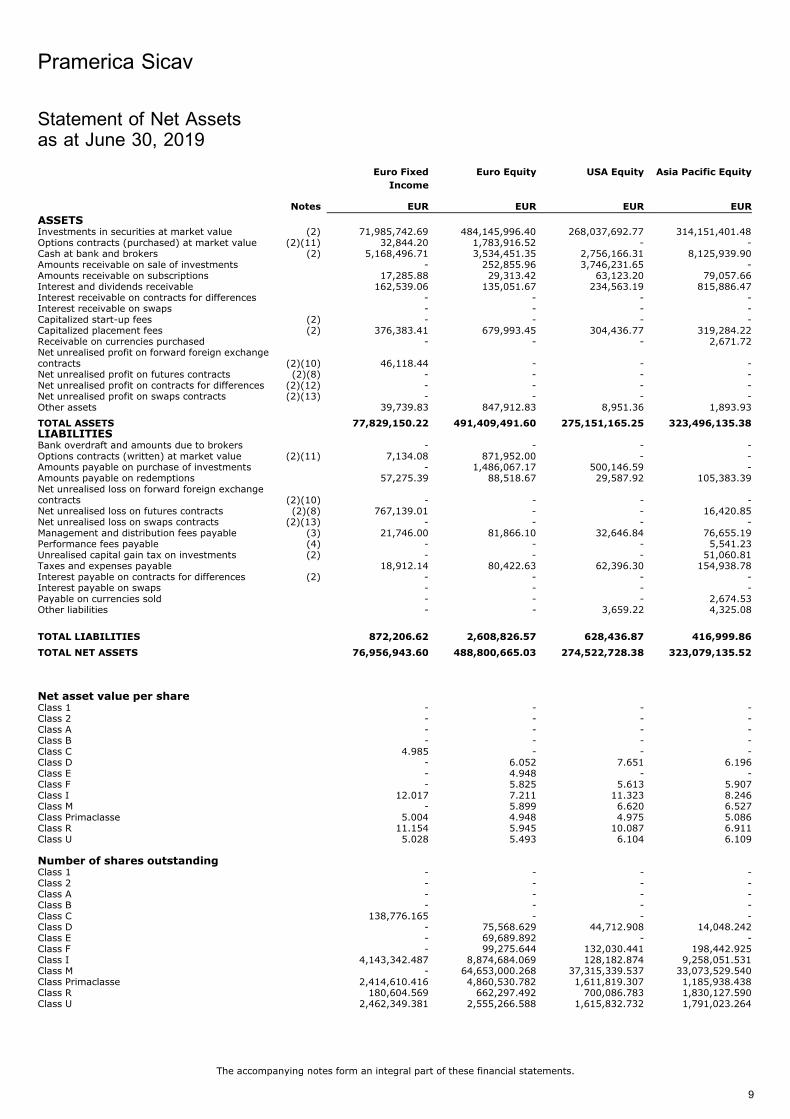
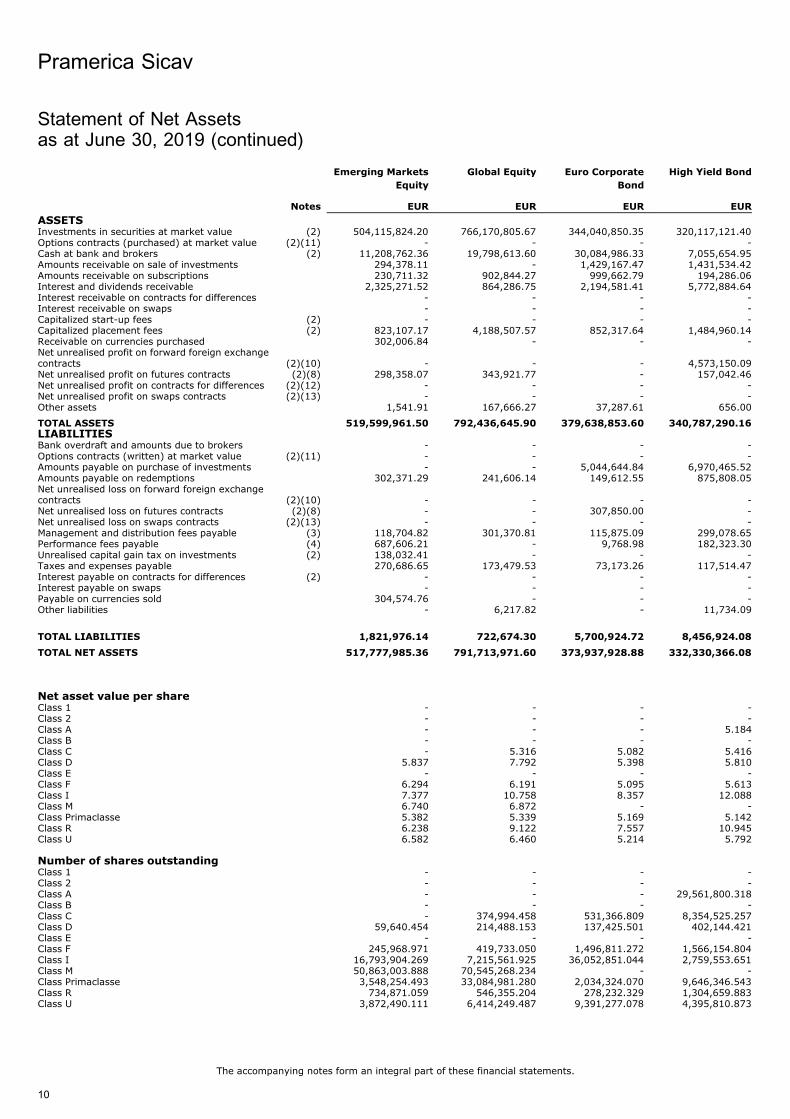
Statement of Net Assetsas at June 30, 2019
Euro Fixed
Income
Euro Equity USA Equity Asia Pacific Equity
Notes EUR EUR EUR EUR
ASSETSInvestments in securities at market value (2) 71,985,742.69 484,145,996.40 268,037,692.77 314,151,401.48Options contracts (purchased) at market value (2)(11) 32,844.20 1,783,916.52 - -Cash at bank and brokers (2) 5,168,496.71 3,534,451.35 2,756,166.31 8,125,939.90Amounts receivable on sale of investments - 252,855.96 3,746,231.65 -Amounts receivable on subscriptions 17,285.88 29,313.42 63,123.20 79,057.66Interest and dividends receivable 162,539.06 135,051.67 234,563.19 815,886.47Interest receivable on contracts for differences - - - -Interest receivable on swaps - - - -Capitalized start-up fees (2) - - - -Capitalized placement fees (2) 376,383.41 679,993.45 304,436.77 319,284.22Receivable on currencies purchased - - - 2,671.72Net unrealised profit on forward foreign exchangecontracts (2)(10) 46,118.44 - - -Net unrealised profit on futures contracts (2)(8) - - - -Net unrealised profit on contracts for differences (2)(12) - - - -Net unrealised profit on swaps contracts (2)(13) - - - -Other assets 39,739.83 847,912.83 8,951.36 1,893.93
TOTAL ASSETS 77,829,150.22 491,409,491.60 275,151,165.25 323,496,135.38LIABILITIESBank overdraft and amounts due to brokers - - - -Options contracts (written) at market value (2)(11) 7,134.08 871,952.00 - -Amounts payable on purchase of investments - 1,486,067.17 500,146.59 -Amounts payable on redemptions 57,275.39 88,518.67 29,587.92 105,383.39Net unrealised loss on forward foreign exchangecontracts (2)(10) - - - -Net unrealised loss on futures contracts (2)(8) 767,139.01 - - 16,420.85Net unrealised loss on swaps contracts (2)(13) - - - -Management and distribution fees payable (3) 21,746.00 81,866.10 32,646.84 76,655.19Performance fees payable (4) - - - 5,541.23Unrealised capital gain tax on investments (2) - - - 51,060.81Taxes and expenses payable 18,912.14 80,422.63 62,396.30 154,938.78Interest payable on contracts for differences (2) - - - -Interest payable on swaps - - - -Payable on currencies sold - - - 2,674.53Other liabilities - - 3,659.22 4,325.08
TOTAL LIABILITIES 872,206.62 2,608,826.57 628,436.87 416,999.86
TOTAL NET ASSETS 76,956,943.60 488,800,665.03 274,522,728.38 323,079,135.52
Net asset value per shareClass 1 - - - -Class 2 - - - -Class A - - - -Class B - - - -Class C 4.985 - - -Class D - 6.052 7.651 6.196Class E - 4.948 - -Class F - 5.825 5.613 5.907Class I 12.017 7.211 11.323 8.246Class M - 5.899 6.620 6.527Class Primaclasse 5.004 4.948 4.975 5.086Class R 11.154 5.945 10.087 6.911Class U 5.028 5.493 6.104 6.109
Number of shares outstandingClass 1 - - - -Class 2 - - - -Class A - - - -Class B - - - -Class C 138,776.165 - - -Class D - 75,568.629 44,712.908 14,048.242Class E - 69,689.892 - -Class F - 99,275.644 132,030.441 198,442.925Class I 4,143,342.487 8,874,684.069 128,182.874 9,258,051.531Class M - 64,653,000.268 37,315,339.537 33,073,529.540Class Primaclasse 2,414,610.416 4,860,530.782 1,611,819.307 1,185,938.438Class R 180,604.569 662,297.492 700,086.783 1,830,127.590Class U 2,462,349.381 2,555,266.588 1,615,832.732 1,791,023.264
Pramerica Sicav
The accompanying notes form an integral part of these financial statements.
9
Emerging Markets
Equity
Global Equity Euro Corporate
Bond
High Yield Bond
Notes EUR EUR EUR EUR
ASSETSInvestments in securities at market value (2) 504,115,824.20 766,170,805.67 344,040,850.35 320,117,121.40Options contracts (purchased) at market value (2)(11) - - - -Cash at bank and brokers (2) 11,208,762.36 19,798,613.60 30,084,986.33 7,055,654.95Amounts receivable on sale of investments 294,378.11 - 1,429,167.47 1,431,534.42Amounts receivable on subscriptions 230,711.32 902,844.27 999,662.79 194,286.06Interest and dividends receivable 2,325,271.52 864,286.75 2,194,581.41 5,772,884.64Interest receivable on contracts for differences - - - -Interest receivable on swaps - - - -Capitalized start-up fees (2) - - - -Capitalized placement fees (2) 823,107.17 4,188,507.57 852,317.64 1,484,960.14Receivable on currencies purchased 302,006.84 - - -Net unrealised profit on forward foreign exchangecontracts (2)(10) - - - 4,573,150.09Net unrealised profit on futures contracts (2)(8) 298,358.07 343,921.77 - 157,042.46Net unrealised profit on contracts for differences (2)(12) - - - -Net unrealised profit on swaps contracts (2)(13) - - - -Other assets 1,541.91 167,666.27 37,287.61 656.00
TOTAL ASSETS 519,599,961.50 792,436,645.90 379,638,853.60 340,787,290.16LIABILITIESBank overdraft and amounts due to brokers - - - -Options contracts (written) at market value (2)(11) - - - -Amounts payable on purchase of investments - - 5,044,644.84 6,970,465.52Amounts payable on redemptions 302,371.29 241,606.14 149,612.55 875,808.05Net unrealised loss on forward foreign exchangecontracts (2)(10) - - - -Net unrealised loss on futures contracts (2)(8) - - 307,850.00 -Net unrealised loss on swaps contracts (2)(13) - - - -Management and distribution fees payable (3) 118,704.82 301,370.81 115,875.09 299,078.65Performance fees payable (4) 687,606.21 - 9,768.98 182,323.30Unrealised capital gain tax on investments (2) 138,032.41 - - -Taxes and expenses payable 270,686.65 173,479.53 73,173.26 117,514.47Interest payable on contracts for differences (2) - - - -Interest payable on swaps - - - -Payable on currencies sold 304,574.76 - - -Other liabilities - 6,217.82 - 11,734.09
TOTAL LIABILITIES 1,821,976.14 722,674.30 5,700,924.72 8,456,924.08
TOTAL NET ASSETS 517,777,985.36 791,713,971.60 373,937,928.88 332,330,366.08
Net asset value per shareClass 1 - - - -Class 2 - - - -Class A - - - 5.184Class B - - - -Class C - 5.316 5.082 5.416Class D 5.837 7.792 5.398 5.810Class E - - - -Class F 6.294 6.191 5.095 5.613Class I 7.377 10.758 8.357 12.088Class M 6.740 6.872 - -Class Primaclasse 5.382 5.339 5.169 5.142Class R 6.238 9.122 7.557 10.945Class U 6.582 6.460 5.214 5.792
Number of shares outstandingClass 1 - - - -Class 2 - - - -Class A - - - 29,561,800.318Class B - - - -Class C - 374,994.458 531,366.809 8,354,525.257Class D 59,640.454 214,488.153 137,425.501 402,144.421Class E - - - -Class F 245,968.971 419,733.050 1,496,811.272 1,566,154.804Class I 16,793,904.269 7,215,561.925 36,052,851.044 2,759,553.651Class M 50,863,003.888 70,545,268.234 - -Class Primaclasse 3,548,254.493 33,084,981.280 2,034,324.070 9,646,346.543Class R 734,871.059 546,355.204 278,232.329 1,304,659.883Class U 3,872,490.111 6,414,249.487 9,391,277.078 4,395,810.873
Pramerica Sicav
The accompanying notes form an integral part of these financial statements.
10
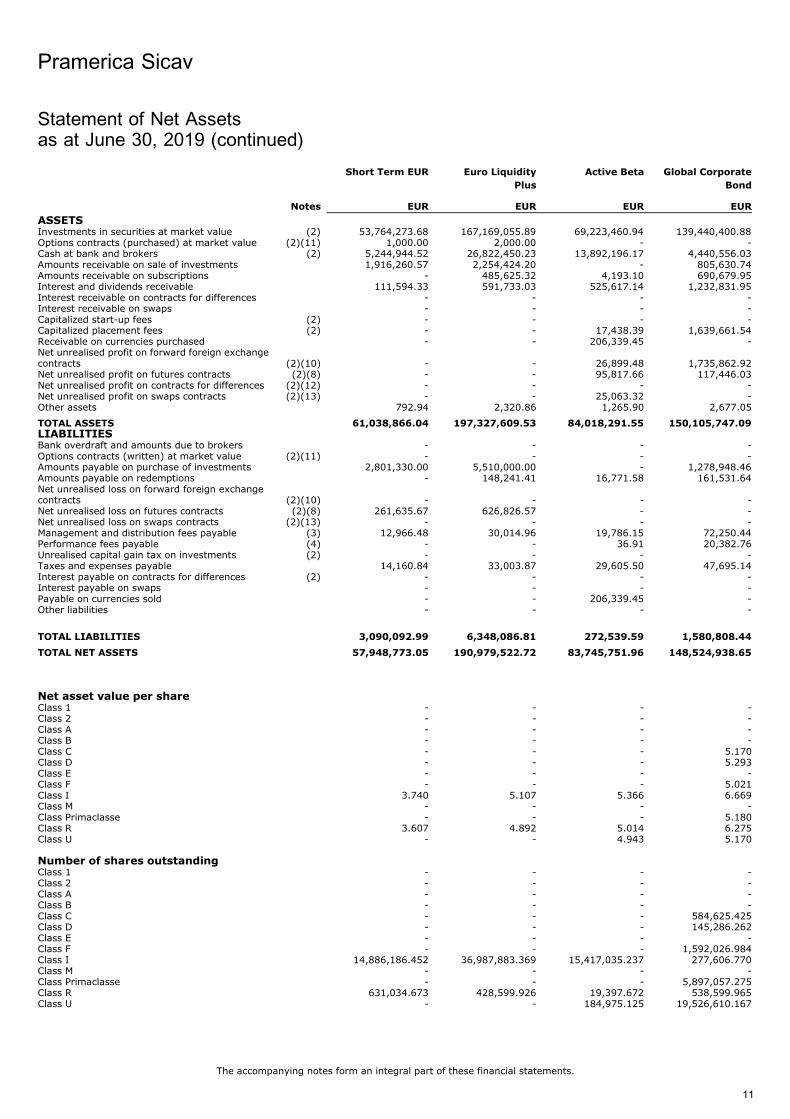
Statement of Net Assetsas at June 30, 2019 (continued)
Short Term EUR Euro Liquidity
Plus
Active Beta Global Corporate
Bond
Notes EUR EUR EUR EUR
ASSETSInvestments in securities at market value (2) 53,764,273.68 167,169,055.89 69,223,460.94 139,440,400.88Options contracts (purchased) at market value (2)(11) 1,000.00 2,000.00 - -Cash at bank and brokers (2) 5,244,944.52 26,822,450.23 13,892,196.17 4,440,556.03Amounts receivable on sale of investments 1,916,260.57 2,254,424.20 - 805,630.74Amounts receivable on subscriptions - 485,625.32 4,193.10 690,679.95Interest and dividends receivable 111,594.33 591,733.03 525,617.14 1,232,831.95Interest receivable on contracts for differences - - - -Interest receivable on swaps - - - -Capitalized start-up fees (2) - - - -Capitalized placement fees (2) - - 17,438.39 1,639,661.54Receivable on currencies purchased - - 206,339.45 -Net unrealised profit on forward foreign exchangecontracts (2)(10) - - 26,899.48 1,735,862.92Net unrealised profit on futures contracts (2)(8) - - 95,817.66 117,446.03Net unrealised profit on contracts for differences (2)(12) - - - -Net unrealised profit on swaps contracts (2)(13) - - 25,063.32 -Other assets 792.94 2,320.86 1,265.90 2,677.05
TOTAL ASSETS 61,038,866.04 197,327,609.53 84,018,291.55 150,105,747.09LIABILITIESBank overdraft and amounts due to brokers - - - -Options contracts (written) at market value (2)(11) - - - -Amounts payable on purchase of investments 2,801,330.00 5,510,000.00 - 1,278,948.46Amounts payable on redemptions - 148,241.41 16,771.58 161,531.64Net unrealised loss on forward foreign exchangecontracts (2)(10) - - - -Net unrealised loss on futures contracts (2)(8) 261,635.67 626,826.57 - -Net unrealised loss on swaps contracts (2)(13) - - - -Management and distribution fees payable (3) 12,966.48 30,014.96 19,786.15 72,250.44Performance fees payable (4) - - 36.91 20,382.76Unrealised capital gain tax on investments (2) - - - -Taxes and expenses payable 14,160.84 33,003.87 29,605.50 47,695.14Interest payable on contracts for differences (2) - - - -Interest payable on swaps - - - -Payable on currencies sold - - 206,339.45 -Other liabilities - - - -
TOTAL LIABILITIES 3,090,092.99 6,348,086.81 272,539.59 1,580,808.44
TOTAL NET ASSETS 57,948,773.05 190,979,522.72 83,745,751.96 148,524,938.65
Net asset value per shareClass 1 - - - -Class 2 - - - -Class A - - - -Class B - - - -Class C - - - 5.170Class D - - - 5.293Class E - - - -Class F - - - 5.021Class I 3.740 5.107 5.366 6.669Class M - - - -Class Primaclasse - - - 5.180Class R 3.607 4.892 5.014 6.275Class U - - 4.943 5.170
Number of shares outstandingClass 1 - - - -Class 2 - - - -Class A - - - -Class B - - - -Class C - - - 584,625.425Class D - - - 145,286.262Class E - - - -Class F - - - 1,592,026.984Class I 14,886,186.452 36,987,883.369 15,417,035.237 277,606.770Class M - - - -Class Primaclasse - - - 5,897,057.275Class R 631,034.673 428,599.926 19,397.672 538,599.965Class U - - 184,975.125 19,526,610.167
Pramerica Sicav
The accompanying notes form an integral part of these financial statements.
11
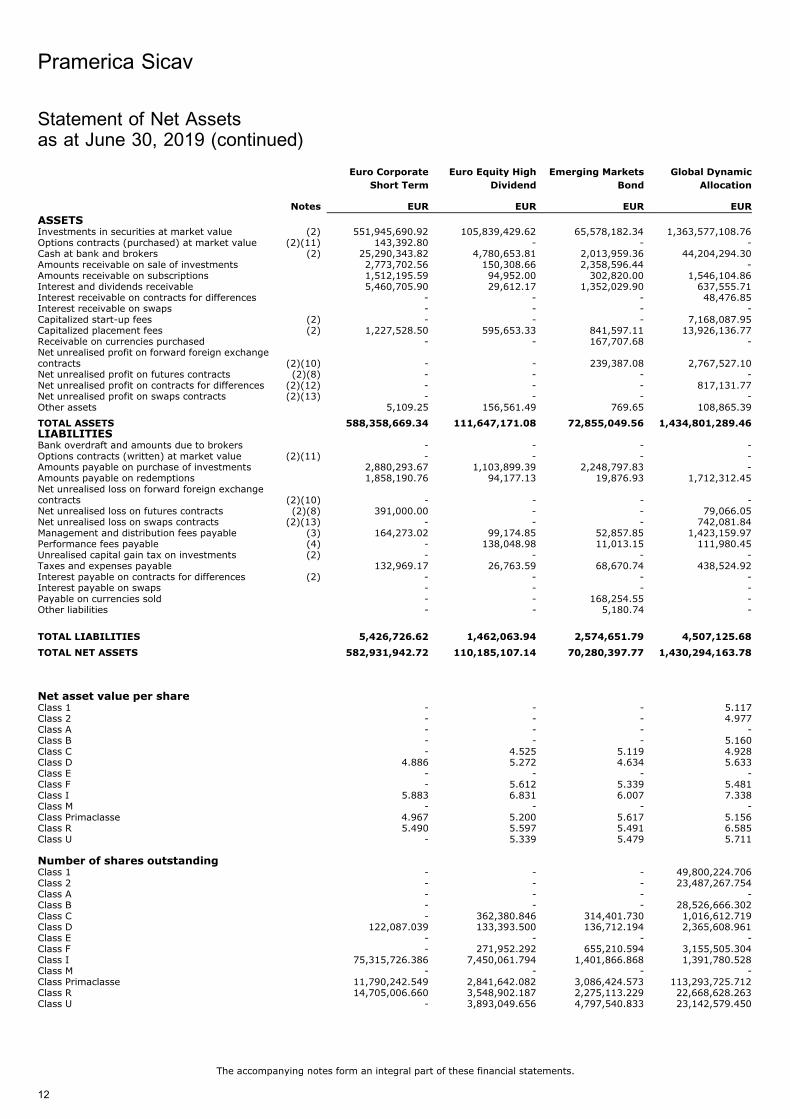
Statement of Net Assetsas at June 30, 2019 (continued)
Euro Corporate
Short Term
Euro Equity High
Dividend
Emerging Markets
Bond
Global Dynamic
Allocation
Notes EUR EUR EUR EUR
ASSETSInvestments in securities at market value (2) 551,945,690.92 105,839,429.62 65,578,182.34 1,363,577,108.76Options contracts (purchased) at market value (2)(11) 143,392.80 - - -Cash at bank and brokers (2) 25,290,343.82 4,780,653.81 2,013,959.36 44,204,294.30Amounts receivable on sale of investments 2,773,702.56 150,308.66 2,358,596.44 -Amounts receivable on subscriptions 1,512,195.59 94,952.00 302,820.00 1,546,104.86Interest and dividends receivable 5,460,705.90 29,612.17 1,352,029.90 637,555.71Interest receivable on contracts for differences - - - 48,476.85Interest receivable on swaps - - - -Capitalized start-up fees (2) - - - 7,168,087.95Capitalized placement fees (2) 1,227,528.50 595,653.33 841,597.11 13,926,136.77Receivable on currencies purchased - - 167,707.68 -Net unrealised profit on forward foreign exchangecontracts (2)(10) - - 239,387.08 2,767,527.10Net unrealised profit on futures contracts (2)(8) - - - -Net unrealised profit on contracts for differences (2)(12) - - - 817,131.77Net unrealised profit on swaps contracts (2)(13) - - - -Other assets 5,109.25 156,561.49 769.65 108,865.39
TOTAL ASSETS 588,358,669.34 111,647,171.08 72,855,049.56 1,434,801,289.46LIABILITIESBank overdraft and amounts due to brokers - - - -Options contracts (written) at market value (2)(11) - - - -Amounts payable on purchase of investments 2,880,293.67 1,103,899.39 2,248,797.83 -Amounts payable on redemptions 1,858,190.76 94,177.13 19,876.93 1,712,312.45Net unrealised loss on forward foreign exchangecontracts (2)(10) - - - -Net unrealised loss on futures contracts (2)(8) 391,000.00 - - 79,066.05Net unrealised loss on swaps contracts (2)(13) - - - 742,081.84Management and distribution fees payable (3) 164,273.02 99,174.85 52,857.85 1,423,159.97Performance fees payable (4) - 138,048.98 11,013.15 111,980.45Unrealised capital gain tax on investments (2) - - - -Taxes and expenses payable 132,969.17 26,763.59 68,670.74 438,524.92Interest payable on contracts for differences (2) - - - -Interest payable on swaps - - - -Payable on currencies sold - - 168,254.55 -Other liabilities - - 5,180.74 -
TOTAL LIABILITIES 5,426,726.62 1,462,063.94 2,574,651.79 4,507,125.68
TOTAL NET ASSETS 582,931,942.72 110,185,107.14 70,280,397.77 1,430,294,163.78
Net asset value per shareClass 1 - - - 5.117Class 2 - - - 4.977Class A - - - -Class B - - - 5.160Class C - 4.525 5.119 4.928Class D 4.886 5.272 4.634 5.633Class E - - - -Class F - 5.612 5.339 5.481Class I 5.883 6.831 6.007 7.338Class M - - - -Class Primaclasse 4.967 5.200 5.617 5.156Class R 5.490 5.597 5.491 6.585Class U - 5.339 5.479 5.711
Number of shares outstandingClass 1 - - - 49,800,224.706Class 2 - - - 23,487,267.754Class A - - - -Class B - - - 28,526,666.302Class C - 362,380.846 314,401.730 1,016,612.719Class D 122,087.039 133,393.500 136,712.194 2,365,608.961Class E - - - -Class F - 271,952.292 655,210.594 3,155,505.304Class I 75,315,726.386 7,450,061.794 1,401,866.868 1,391,780.528Class M - - - -Class Primaclasse 11,790,242.549 2,841,642.082 3,086,424.573 113,293,725.712Class R 14,705,006.660 3,548,902.187 2,275,113.229 22,668,628.263Class U - 3,893,049.656 4,797,540.833 23,142,579.450
Pramerica Sicav
The accompanying notes form an integral part of these financial statements.
12
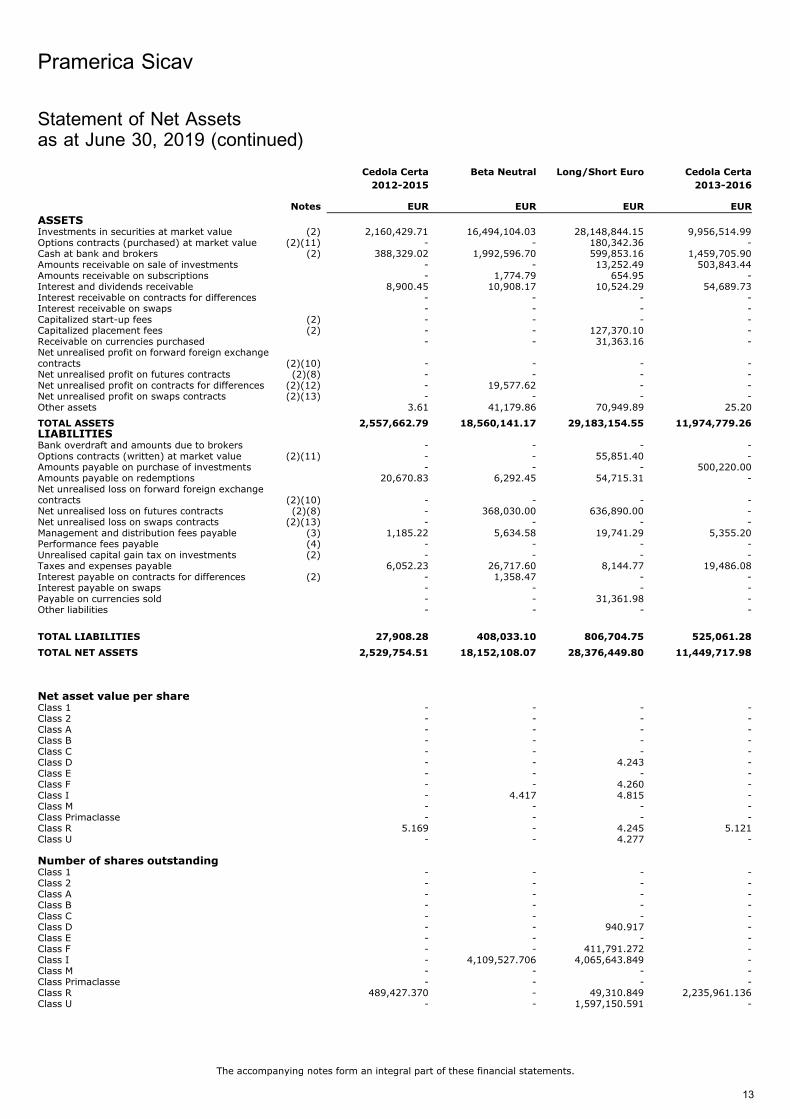
Statement of Net Assetsas at June 30, 2019 (continued)
Cedola Certa
2012-2015
Beta Neutral Long/Short Euro Cedola Certa
2013-2016
Notes EUR EUR EUR EUR
ASSETSInvestments in securities at market value (2) 2,160,429.71 16,494,104.03 28,148,844.15 9,956,514.99Options contracts (purchased) at market value (2)(11) - - 180,342.36 -Cash at bank and brokers (2) 388,329.02 1,992,596.70 599,853.16 1,459,705.90Amounts receivable on sale of investments - - 13,252.49 503,843.44Amounts receivable on subscriptions - 1,774.79 654.95 -Interest and dividends receivable 8,900.45 10,908.17 10,524.29 54,689.73Interest receivable on contracts for differences - - - -Interest receivable on swaps - - - -Capitalized start-up fees (2) - - - -Capitalized placement fees (2) - - 127,370.10 -Receivable on currencies purchased - - 31,363.16 -Net unrealised profit on forward foreign exchangecontracts (2)(10) - - - -Net unrealised profit on futures contracts (2)(8) - - - -Net unrealised profit on contracts for differences (2)(12) - 19,577.62 - -Net unrealised profit on swaps contracts (2)(13) - - - -Other assets 3.61 41,179.86 70,949.89 25.20
TOTAL ASSETS 2,557,662.79 18,560,141.17 29,183,154.55 11,974,779.26LIABILITIESBank overdraft and amounts due to brokers - - - -Options contracts (written) at market value (2)(11) - - 55,851.40 -Amounts payable on purchase of investments - - - 500,220.00Amounts payable on redemptions 20,670.83 6,292.45 54,715.31 -Net unrealised loss on forward foreign exchangecontracts (2)(10) - - - -Net unrealised loss on futures contracts (2)(8) - 368,030.00 636,890.00 -Net unrealised loss on swaps contracts (2)(13) - - - -Management and distribution fees payable (3) 1,185.22 5,634.58 19,741.29 5,355.20Performance fees payable (4) - - - -Unrealised capital gain tax on investments (2) - - - -Taxes and expenses payable 6,052.23 26,717.60 8,144.77 19,486.08Interest payable on contracts for differences (2) - 1,358.47 - -Interest payable on swaps - - - -Payable on currencies sold - - 31,361.98 -Other liabilities - - - -
TOTAL LIABILITIES 27,908.28 408,033.10 806,704.75 525,061.28
TOTAL NET ASSETS 2,529,754.51 18,152,108.07 28,376,449.80 11,449,717.98
Net asset value per shareClass 1 - - - -Class 2 - - - -Class A - - - -Class B - - - -Class C - - - -Class D - - 4.243 -Class E - - - -Class F - - 4.260 -Class I - 4.417 4.815 -Class M - - - -Class Primaclasse - - - -Class R 5.169 - 4.245 5.121Class U - - 4.277 -
Number of shares outstandingClass 1 - - - -Class 2 - - - -Class A - - - -Class B - - - -Class C - - - -Class D - - 940.917 -Class E - - - -Class F - - 411,791.272 -Class I - 4,109,527.706 4,065,643.849 -Class M - - - -Class Primaclasse - - - -Class R 489,427.370 - 49,310.849 2,235,961.136Class U - - 1,597,150.591 -
Pramerica Sicav
The accompanying notes form an integral part of these financial statements.
13
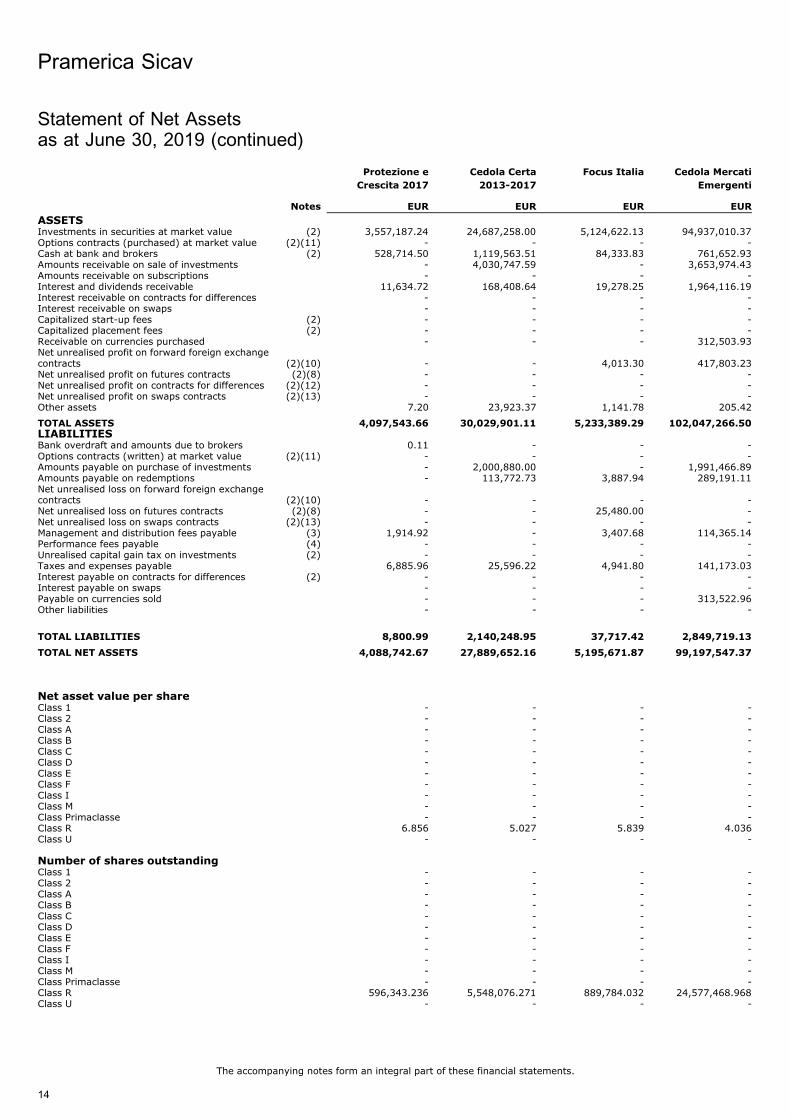
Statement of Net Assetsas at June 30, 2019 (continued)
Protezione e
Crescita 2017
Cedola Certa
2013-2017
Focus Italia Cedola Mercati
Emergenti
Notes EUR EUR EUR EUR
ASSETSInvestments in securities at market value (2) 3,557,187.24 24,687,258.00 5,124,622.13 94,937,010.37Options contracts (purchased) at market value (2)(11) - - - -Cash at bank and brokers (2) 528,714.50 1,119,563.51 84,333.83 761,652.93Amounts receivable on sale of investments - 4,030,747.59 - 3,653,974.43Amounts receivable on subscriptions - - - -Interest and dividends receivable 11,634.72 168,408.64 19,278.25 1,964,116.19Interest receivable on contracts for differences - - - -Interest receivable on swaps - - - -Capitalized start-up fees (2) - - - -Capitalized placement fees (2) - - - -Receivable on currencies purchased - - - 312,503.93Net unrealised profit on forward foreign exchangecontracts (2)(10) - - 4,013.30 417,803.23Net unrealised profit on futures contracts (2)(8) - - - -Net unrealised profit on contracts for differences (2)(12) - - - -Net unrealised profit on swaps contracts (2)(13) - - - -Other assets 7.20 23,923.37 1,141.78 205.42
TOTAL ASSETS 4,097,543.66 30,029,901.11 5,233,389.29 102,047,266.50LIABILITIESBank overdraft and amounts due to brokers 0.11 - - -Options contracts (written) at market value (2)(11) - - - -Amounts payable on purchase of investments - 2,000,880.00 - 1,991,466.89Amounts payable on redemptions - 113,772.73 3,887.94 289,191.11Net unrealised loss on forward foreign exchangecontracts (2)(10) - - - -Net unrealised loss on futures contracts (2)(8) - - 25,480.00 -Net unrealised loss on swaps contracts (2)(13) - - - -Management and distribution fees payable (3) 1,914.92 - 3,407.68 114,365.14Performance fees payable (4) - - - -Unrealised capital gain tax on investments (2) - - - -Taxes and expenses payable 6,885.96 25,596.22 4,941.80 141,173.03Interest payable on contracts for differences (2) - - - -Interest payable on swaps - - - -Payable on currencies sold - - - 313,522.96Other liabilities - - - -
TOTAL LIABILITIES 8,800.99 2,140,248.95 37,717.42 2,849,719.13
TOTAL NET ASSETS 4,088,742.67 27,889,652.16 5,195,671.87 99,197,547.37
Net asset value per shareClass 1 - - - -Class 2 - - - -Class A - - - -Class B - - - -Class C - - - -Class D - - - -Class E - - - -Class F - - - -Class I - - - -Class M - - - -Class Primaclasse - - - -Class R 6.856 5.027 5.839 4.036Class U - - - -
Number of shares outstandingClass 1 - - - -Class 2 - - - -Class A - - - -Class B - - - -Class C - - - -Class D - - - -Class E - - - -Class F - - - -Class I - - - -Class M - - - -Class Primaclasse - - - -Class R 596,343.236 5,548,076.271 889,784.032 24,577,468.968Class U - - - -
Pramerica Sicav
The accompanying notes form an integral part of these financial statements.
14
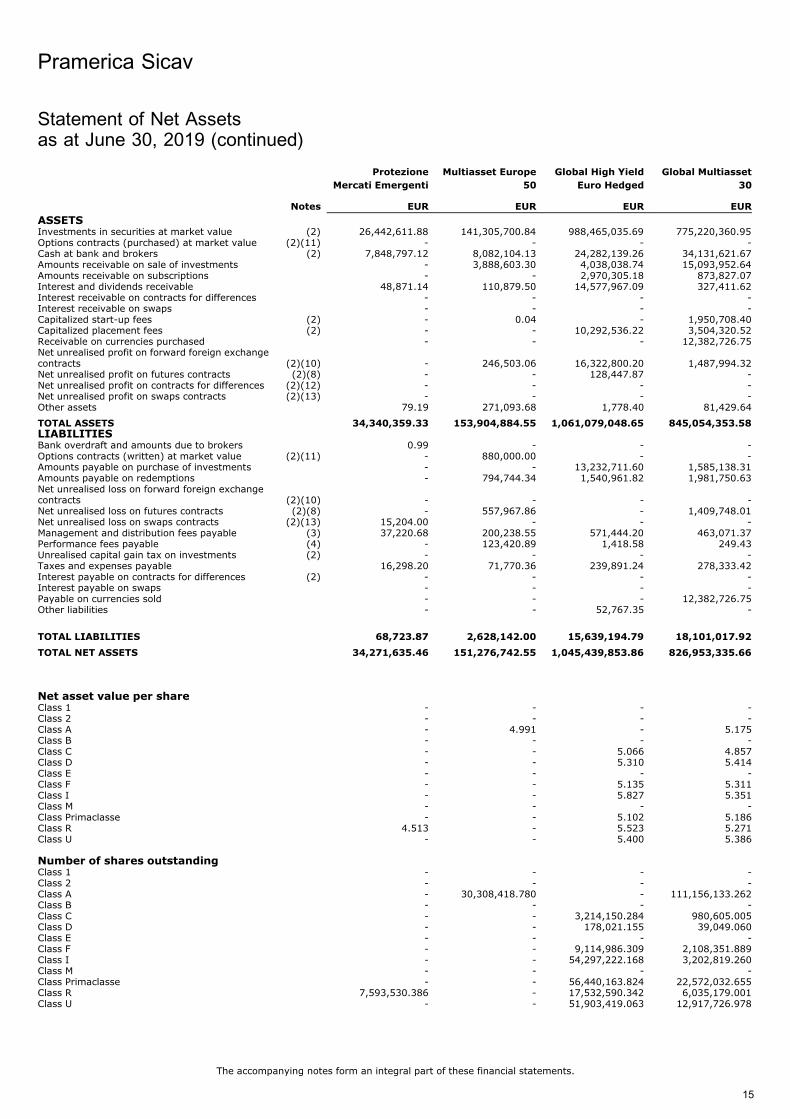
Statement of Net Assetsas at June 30, 2019 (continued)
Protezione
Mercati Emergenti
Multiasset Europe
50
Global High Yield
Euro Hedged
Global Multiasset
30
Notes EUR EUR EUR EUR
ASSETSInvestments in securities at market value (2) 26,442,611.88 141,305,700.84 988,465,035.69 775,220,360.95Options contracts (purchased) at market value (2)(11) - - - -Cash at bank and brokers (2) 7,848,797.12 8,082,104.13 24,282,139.26 34,131,621.67Amounts receivable on sale of investments - 3,888,603.30 4,038,038.74 15,093,952.64Amounts receivable on subscriptions - - 2,970,305.18 873,827.07Interest and dividends receivable 48,871.14 110,879.50 14,577,967.09 327,411.62Interest receivable on contracts for differences - - - -Interest receivable on swaps - - - -Capitalized start-up fees (2) - 0.04 - 1,950,708.40Capitalized placement fees (2) - - 10,292,536.22 3,504,320.52Receivable on currencies purchased - - - 12,382,726.75Net unrealised profit on forward foreign exchangecontracts (2)(10) - 246,503.06 16,322,800.20 1,487,994.32Net unrealised profit on futures contracts (2)(8) - - 128,447.87 -Net unrealised profit on contracts for differences (2)(12) - - - -Net unrealised profit on swaps contracts (2)(13) - - - -Other assets 79.19 271,093.68 1,778.40 81,429.64
TOTAL ASSETS 34,340,359.33 153,904,884.55 1,061,079,048.65 845,054,353.58LIABILITIESBank overdraft and amounts due to brokers 0.99 - - -Options contracts (written) at market value (2)(11) - 880,000.00 - -Amounts payable on purchase of investments - - 13,232,711.60 1,585,138.31Amounts payable on redemptions - 794,744.34 1,540,961.82 1,981,750.63Net unrealised loss on forward foreign exchangecontracts (2)(10) - - - -Net unrealised loss on futures contracts (2)(8) - 557,967.86 - 1,409,748.01Net unrealised loss on swaps contracts (2)(13) 15,204.00 - - -Management and distribution fees payable (3) 37,220.68 200,238.55 571,444.20 463,071.37Performance fees payable (4) - 123,420.89 1,418.58 249.43Unrealised capital gain tax on investments (2) - - - -Taxes and expenses payable 16,298.20 71,770.36 239,891.24 278,333.42Interest payable on contracts for differences (2) - - - -Interest payable on swaps - - - -Payable on currencies sold - - - 12,382,726.75Other liabilities - - 52,767.35 -
TOTAL LIABILITIES 68,723.87 2,628,142.00 15,639,194.79 18,101,017.92
TOTAL NET ASSETS 34,271,635.46 151,276,742.55 1,045,439,853.86 826,953,335.66
Net asset value per shareClass 1 - - - -Class 2 - - - -Class A - 4.991 - 5.175Class B - - - -Class C - - 5.066 4.857Class D - - 5.310 5.414Class E - - - -Class F - - 5.135 5.311Class I - - 5.827 5.351Class M - - - -Class Primaclasse - - 5.102 5.186Class R 4.513 - 5.523 5.271Class U - - 5.400 5.386
Number of shares outstandingClass 1 - - - -Class 2 - - - -Class A - 30,308,418.780 - 111,156,133.262Class B - - - -Class C - - 3,214,150.284 980,605.005Class D - - 178,021.155 39,049.060Class E - - - -Class F - - 9,114,986.309 2,108,351.889Class I - - 54,297,222.168 3,202,819.260Class M - - - -Class Primaclasse - - 56,440,163.824 22,572,032.655Class R 7,593,530.386 - 17,532,590.342 6,035,179.001Class U - - 51,903,419.063 12,917,726.978
Pramerica Sicav
The accompanying notes form an integral part of these financial statements.
15
Statement of Net Assetsas at June 30, 2019 (continued)
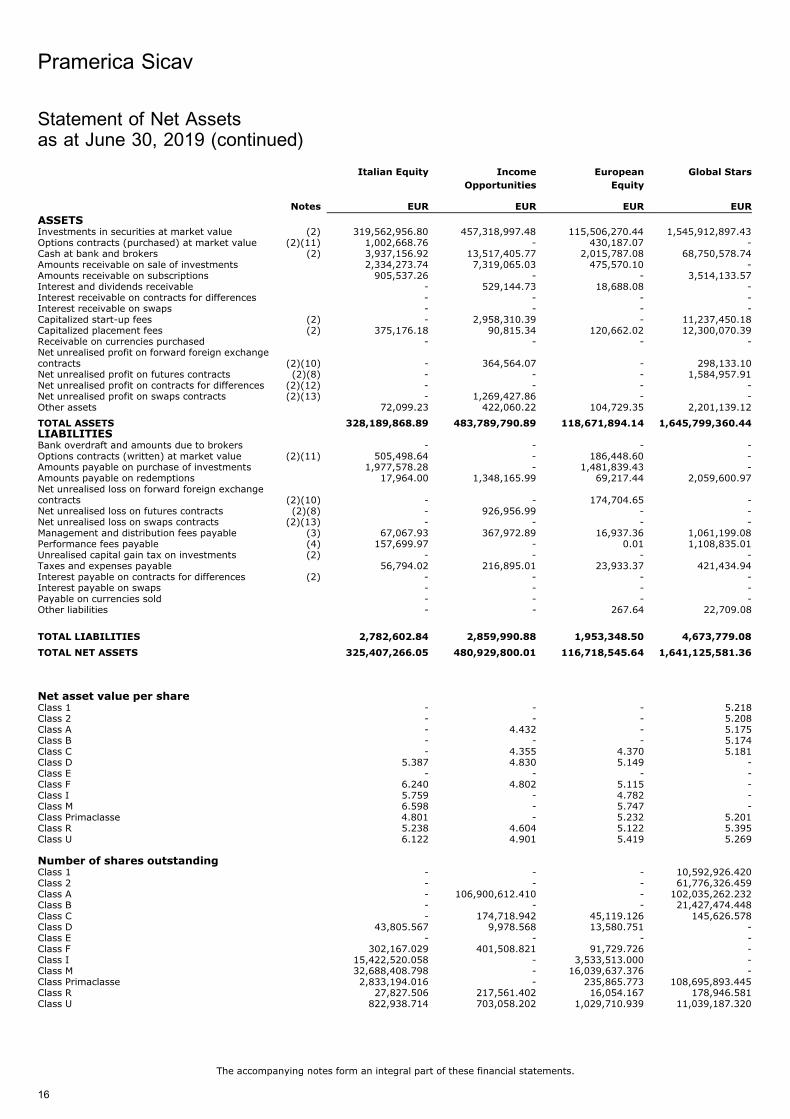
Italian Equity Income
Opportunities
European
Equity
Global Stars
Notes EUR EUR EUR EUR
ASSETSInvestments in securities at market value (2) 319,562,956.80 457,318,997.48 115,506,270.44 1,545,912,897.43Options contracts (purchased) at market value (2)(11) 1,002,668.76 - 430,187.07 -Cash at bank and brokers (2) 3,937,156.92 13,517,405.77 2,015,787.08 68,750,578.74Amounts receivable on sale of investments 2,334,273.74 7,319,065.03 475,570.10 -Amounts receivable on subscriptions 905,537.26 - - 3,514,133.57Interest and dividends receivable - 529,144.73 18,688.08 -Interest receivable on contracts for differences - - - -Interest receivable on swaps - - - -Capitalized start-up fees (2) - 2,958,310.39 - 11,237,450.18Capitalized placement fees (2) 375,176.18 90,815.34 120,662.02 12,300,070.39Receivable on currencies purchased - - - -Net unrealised profit on forward foreign exchangecontracts (2)(10) - 364,564.07 - 298,133.10Net unrealised profit on futures contracts (2)(8) - - - 1,584,957.91Net unrealised profit on contracts for differences (2)(12) - - - -Net unrealised profit on swaps contracts (2)(13) - 1,269,427.86 - -Other assets 72,099.23 422,060.22 104,729.35 2,201,139.12
TOTAL ASSETS 328,189,868.89 483,789,790.89 118,671,894.14 1,645,799,360.44LIABILITIESBank overdraft and amounts due to brokers - - - -Options contracts (written) at market value (2)(11) 505,498.64 - 186,448.60 -Amounts payable on purchase of investments 1,977,578.28 - 1,481,839.43 -Amounts payable on redemptions 17,964.00 1,348,165.99 69,217.44 2,059,600.97Net unrealised loss on forward foreign exchangecontracts (2)(10) - - 174,704.65 -Net unrealised loss on futures contracts (2)(8) - 926,956.99 - -Net unrealised loss on swaps contracts (2)(13) - - - -Management and distribution fees payable (3) 67,067.93 367,972.89 16,937.36 1,061,199.08Performance fees payable (4) 157,699.97 - 0.01 1,108,835.01Unrealised capital gain tax on investments (2) - - - -Taxes and expenses payable 56,794.02 216,895.01 23,933.37 421,434.94Interest payable on contracts for differences (2) - - - -Interest payable on swaps - - - -Payable on currencies sold - - - -Other liabilities - - 267.64 22,709.08
TOTAL LIABILITIES 2,782,602.84 2,859,990.88 1,953,348.50 4,673,779.08
TOTAL NET ASSETS 325,407,266.05 480,929,800.01 116,718,545.64 1,641,125,581.36
Net asset value per shareClass 1 - - - 5.218Class 2 - - - 5.208Class A - 4.432 - 5.175Class B - - - 5.174Class C - 4.355 4.370 5.181Class D 5.387 4.830 5.149 -Class E - - - -Class F 6.240 4.802 5.115 -Class I 5.759 - 4.782 -Class M 6.598 - 5.747 -Class Primaclasse 4.801 - 5.232 5.201Class R 5.238 4.604 5.122 5.395Class U 6.122 4.901 5.419 5.269
Number of shares outstandingClass 1 - - - 10,592,926.420Class 2 - - - 61,776,326.459Class A - 106,900,612.410 - 102,035,262.232Class B - - - 21,427,474.448Class C - 174,718.942 45,119.126 145,626.578Class D 43,805.567 9,978.568 13,580.751 -Class E - - - -Class F 302,167.029 401,508.821 91,729.726 -Class I 15,422,520.058 - 3,533,513.000 -Class M 32,688,408.798 - 16,039,637.376 -Class Primaclasse 2,833,194.016 - 235,865.773 108,695,893.445Class R 27,827.506 217,561.402 16,054.167 178,946.581Class U 822,938.714 703,058.202 1,029,710.939 11,039,187.320
Pramerica Sicav
The accompanying notes form an integral part of these financial statements.
16
Statement of Net Assetsas at June 30, 2019 (continued)
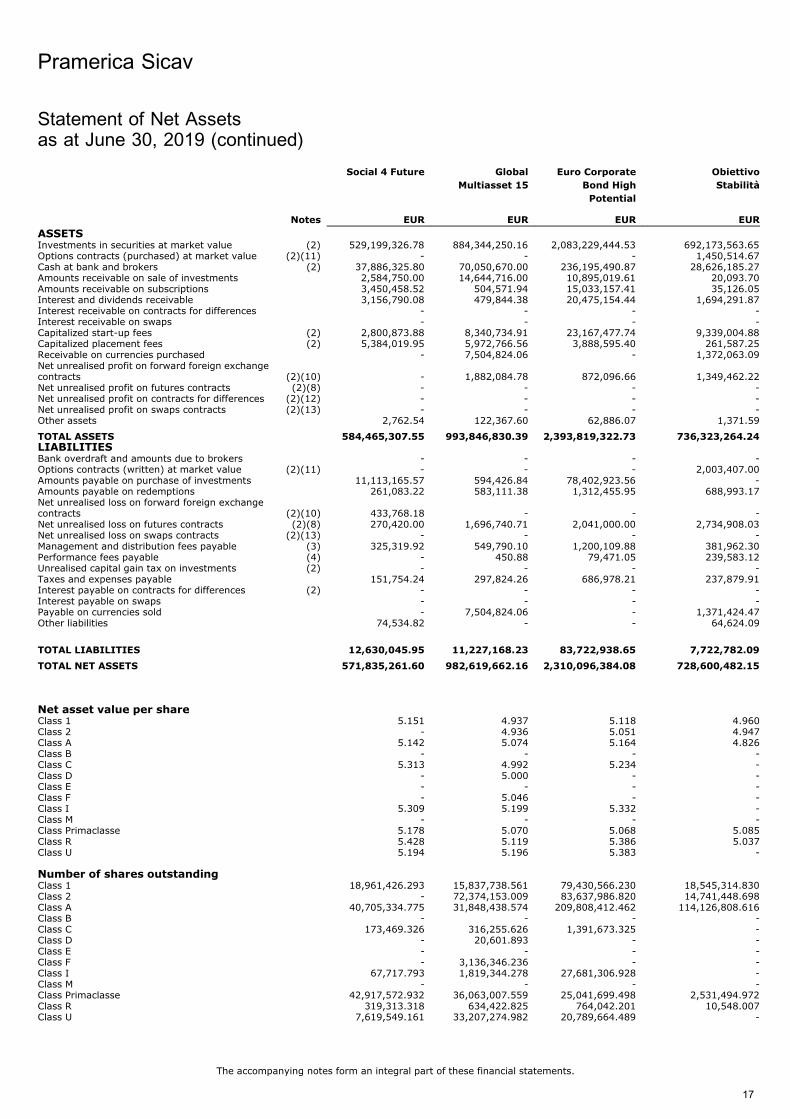
Social 4 Future Global
Multiasset 15
Euro Corporate
Bond High
Potential
Obiettivo
Stabilita
Notes EUR EUR EUR EUR
ASSETSInvestments in securities at market value (2) 529,199,326.78 884,344,250.16 2,083,229,444.53 692,173,563.65Options contracts (purchased) at market value (2)(11) - - - 1,450,514.67Cash at bank and brokers (2) 37,886,325.80 70,050,670.00 236,195,490.87 28,626,185.27Amounts receivable on sale of investments 2,584,750.00 14,644,716.00 10,895,019.61 20,093.70Amounts receivable on subscriptions 3,450,458.52 504,571.94 15,033,157.41 35,126.05Interest and dividends receivable 3,156,790.08 479,844.38 20,475,154.44 1,694,291.87Interest receivable on contracts for differences - - - -Interest receivable on swaps - - - -Capitalized start-up fees (2) 2,800,873.88 8,340,734.91 23,167,477.74 9,339,004.88Capitalized placement fees (2) 5,384,019.95 5,972,766.56 3,888,595.40 261,587.25Receivable on currencies purchased - 7,504,824.06 - 1,372,063.09Net unrealised profit on forward foreign exchangecontracts (2)(10) - 1,882,084.78 872,096.66 1,349,462.22Net unrealised profit on futures contracts (2)(8) - - - -Net unrealised profit on contracts for differences (2)(12) - - - -Net unrealised profit on swaps contracts (2)(13) - - - -Other assets 2,762.54 122,367.60 62,886.07 1,371.59
TOTAL ASSETS 584,465,307.55 993,846,830.39 2,393,819,322.73 736,323,264.24LIABILITIESBank overdraft and amounts due to brokers - - - -Options contracts (written) at market value (2)(11) - - - 2,003,407.00Amounts payable on purchase of investments 11,113,165.57 594,426.84 78,402,923.56 -Amounts payable on redemptions 261,083.22 583,111.38 1,312,455.95 688,993.17Net unrealised loss on forward foreign exchangecontracts (2)(10) 433,768.18 - - -Net unrealised loss on futures contracts (2)(8) 270,420.00 1,696,740.71 2,041,000.00 2,734,908.03Net unrealised loss on swaps contracts (2)(13) - - - -Management and distribution fees payable (3) 325,319.92 549,790.10 1,200,109.88 381,962.30Performance fees payable (4) - 450.88 79,471.05 239,583.12Unrealised capital gain tax on investments (2) - - - -Taxes and expenses payable 151,754.24 297,824.26 686,978.21 237,879.91Interest payable on contracts for differences (2) - - - -Interest payable on swaps - - - -Payable on currencies sold - 7,504,824.06 - 1,371,424.47Other liabilities 74,534.82 - - 64,624.09
TOTAL LIABILITIES 12,630,045.95 11,227,168.23 83,722,938.65 7,722,782.09
TOTAL NET ASSETS 571,835,261.60 982,619,662.16 2,310,096,384.08 728,600,482.15
Net asset value per shareClass 1 5.151 4.937 5.118 4.960Class 2 - 4.936 5.051 4.947Class A 5.142 5.074 5.164 4.826Class B - - - -Class C 5.313 4.992 5.234 -Class D - 5.000 - -Class E - - - -Class F - 5.046 - -Class I 5.309 5.199 5.332 -Class M - - - -Class Primaclasse 5.178 5.070 5.068 5.085Class R 5.428 5.119 5.386 5.037Class U 5.194 5.196 5.383 -
Number of shares outstandingClass 1 18,961,426.293 15,837,738.561 79,430,566.230 18,545,314.830Class 2 - 72,374,153.009 83,637,986.820 14,741,448.698Class A 40,705,334.775 31,848,438.574 209,808,412.462 114,126,808.616Class B - - - -Class C 173,469.326 316,255.626 1,391,673.325 -Class D - 20,601.893 - -Class E - - - -Class F - 3,136,346.236 - -Class I 67,717.793 1,819,344.278 27,681,306.928 -Class M - - - -Class Primaclasse 42,917,572.932 36,063,007.559 25,041,699.498 2,531,494.972Class R 319,313.318 634,422.825 764,042.201 10,548.007Class U 7,619,549.161 33,207,274.982 20,789,664.489 -
Pramerica Sicav
The accompanying notes form an integral part of these financial statements.
17
Statement of Net Assetsas at June 30, 2019 (continued)
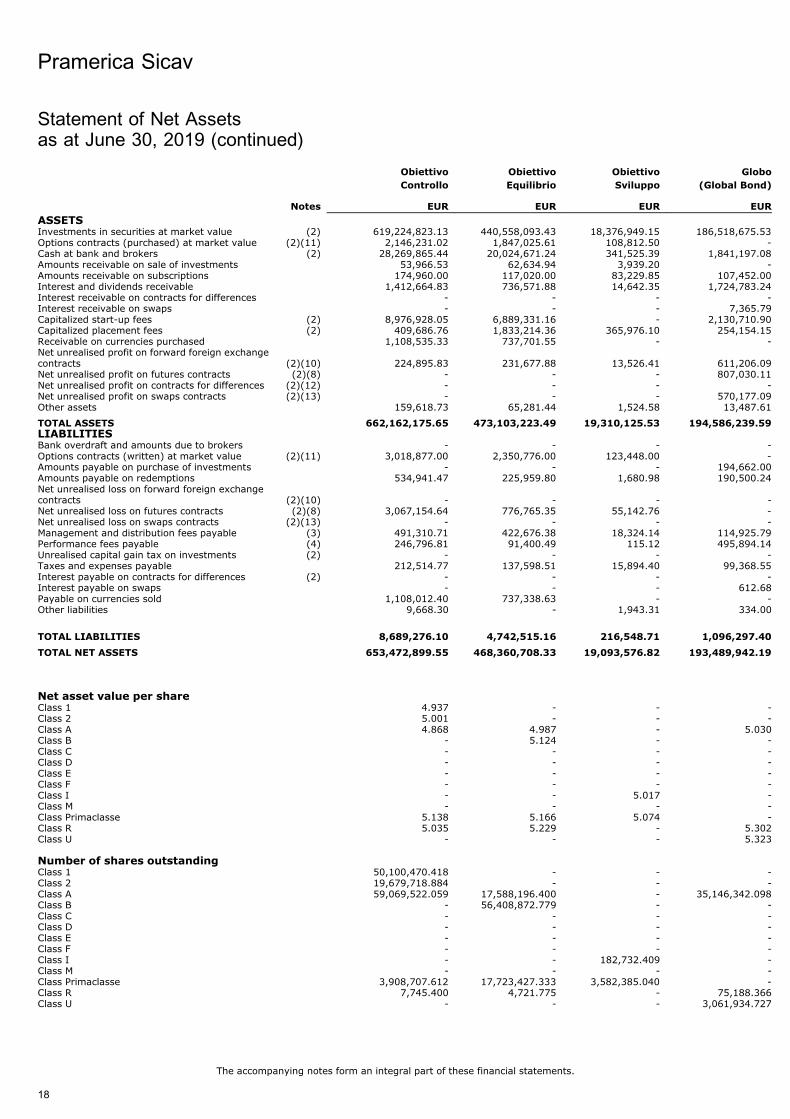
Obiettivo
Controllo
Obiettivo
Equilibrio
Obiettivo
Sviluppo
Globo
(Global Bond)
Notes EUR EUR EUR EUR
ASSETSInvestments in securities at market value (2) 619,224,823.13 440,558,093.43 18,376,949.15 186,518,675.53Options contracts (purchased) at market value (2)(11) 2,146,231.02 1,847,025.61 108,812.50 -Cash at bank and brokers (2) 28,269,865.44 20,024,671.24 341,525.39 1,841,197.08Amounts receivable on sale of investments 53,966.53 62,634.94 3,939.20 -Amounts receivable on subscriptions 174,960.00 117,020.00 83,229.85 107,452.00Interest and dividends receivable 1,412,664.83 736,571.88 14,642.35 1,724,783.24Interest receivable on contracts for differences - - - -Interest receivable on swaps - - - 7,365.79Capitalized start-up fees (2) 8,976,928.05 6,889,331.16 - 2,130,710.90Capitalized placement fees (2) 409,686.76 1,833,214.36 365,976.10 254,154.15Receivable on currencies purchased 1,108,535.33 737,701.55 - -Net unrealised profit on forward foreign exchangecontracts (2)(10) 224,895.83 231,677.88 13,526.41 611,206.09Net unrealised profit on futures contracts (2)(8) - - - 807,030.11Net unrealised profit on contracts for differences (2)(12) - - - -Net unrealised profit on swaps contracts (2)(13) - - - 570,177.09Other assets 159,618.73 65,281.44 1,524.58 13,487.61
TOTAL ASSETS 662,162,175.65 473,103,223.49 19,310,125.53 194,586,239.59LIABILITIESBank overdraft and amounts due to brokers - - - -Options contracts (written) at market value (2)(11) 3,018,877.00 2,350,776.00 123,448.00 -Amounts payable on purchase of investments - - - 194,662.00Amounts payable on redemptions 534,941.47 225,959.80 1,680.98 190,500.24Net unrealised loss on forward foreign exchangecontracts (2)(10) - - - -Net unrealised loss on futures contracts (2)(8) 3,067,154.64 776,765.35 55,142.76 -Net unrealised loss on swaps contracts (2)(13) - - - -Management and distribution fees payable (3) 491,310.71 422,676.38 18,324.14 114,925.79Performance fees payable (4) 246,796.81 91,400.49 115.12 495,894.14Unrealised capital gain tax on investments (2) - - - -Taxes and expenses payable 212,514.77 137,598.51 15,894.40 99,368.55Interest payable on contracts for differences (2) - - - -Interest payable on swaps - - - 612.68Payable on currencies sold 1,108,012.40 737,338.63 - -Other liabilities 9,668.30 - 1,943.31 334.00
TOTAL LIABILITIES 8,689,276.10 4,742,515.16 216,548.71 1,096,297.40
TOTAL NET ASSETS 653,472,899.55 468,360,708.33 19,093,576.82 193,489,942.19
Net asset value per shareClass 1 4.937 - - -Class 2 5.001 - - -Class A 4.868 4.987 - 5.030Class B - 5.124 - -Class C - - - -Class D - - - -Class E - - - -Class F - - - -Class I - - 5.017 -Class M - - - -Class Primaclasse 5.138 5.166 5.074 -Class R 5.035 5.229 - 5.302Class U - - - 5.323
Number of shares outstandingClass 1 50,100,470.418 - - -Class 2 19,679,718.884 - - -Class A 59,069,522.059 17,588,196.400 - 35,146,342.098Class B - 56,408,872.779 - -Class C - - - -Class D - - - -Class E - - - -Class F - - - -Class I - - 182,732.409 -Class M - - - -Class Primaclasse 3,908,707.612 17,723,427.333 3,582,385.040 -Class R 7,745.400 4,721.775 - 75,188.366Class U - - - 3,061,934.727
Pramerica Sicav
The accompanying notes form an integral part of these financial statements.
18
Statement of Net Assetsas at June 30, 2019 (continued)
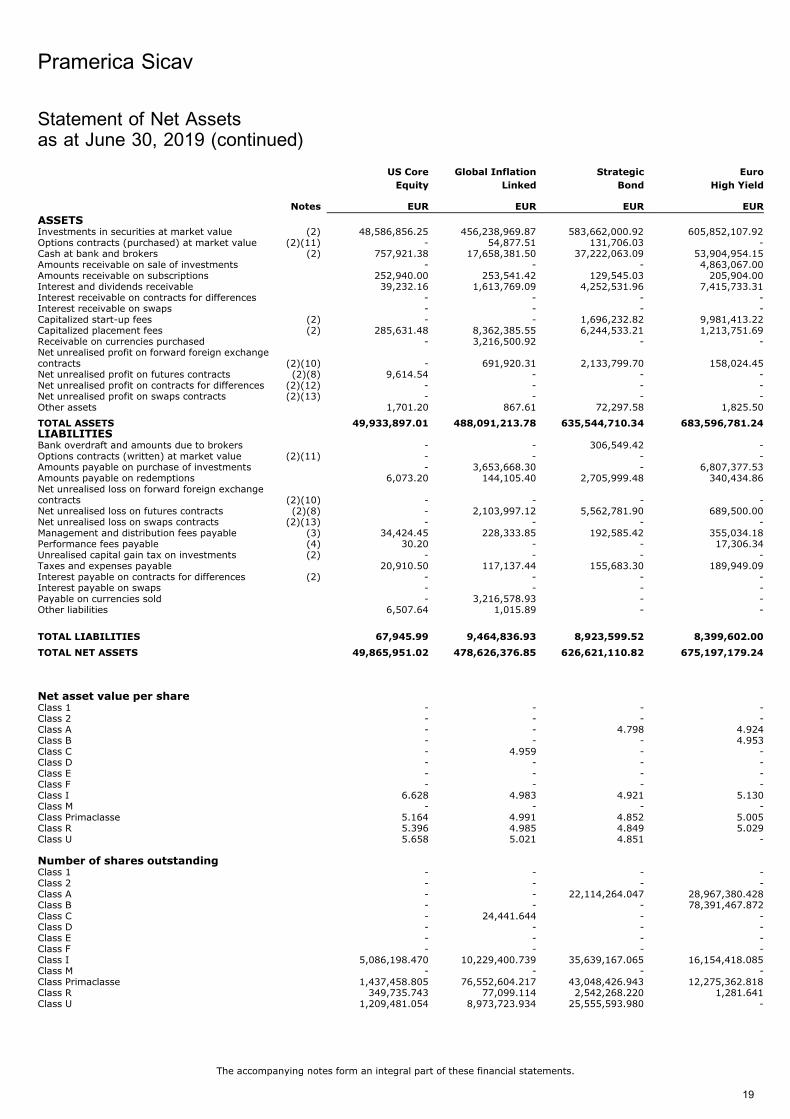
US Core
Equity
Global Inflation
Linked
Strategic
Bond
Euro
High Yield
Notes EUR EUR EUR EUR
ASSETSInvestments in securities at market value (2) 48,586,856.25 456,238,969.87 583,662,000.92 605,852,107.92Options contracts (purchased) at market value (2)(11) - 54,877.51 131,706.03 -Cash at bank and brokers (2) 757,921.38 17,658,381.50 37,222,063.09 53,904,954.15Amounts receivable on sale of investments - - - 4,863,067.00Amounts receivable on subscriptions 252,940.00 253,541.42 129,545.03 205,904.00Interest and dividends receivable 39,232.16 1,613,769.09 4,252,531.96 7,415,733.31Interest receivable on contracts for differences - - - -Interest receivable on swaps - - - -Capitalized start-up fees (2) - - 1,696,232.82 9,981,413.22Capitalized placement fees (2) 285,631.48 8,362,385.55 6,244,533.21 1,213,751.69Receivable on currencies purchased - 3,216,500.92 - -Net unrealised profit on forward foreign exchangecontracts (2)(10) - 691,920.31 2,133,799.70 158,024.45Net unrealised profit on futures contracts (2)(8) 9,614.54 - - -Net unrealised profit on contracts for differences (2)(12) - - - -Net unrealised profit on swaps contracts (2)(13) - - - -Other assets 1,701.20 867.61 72,297.58 1,825.50
TOTAL ASSETS 49,933,897.01 488,091,213.78 635,544,710.34 683,596,781.24LIABILITIESBank overdraft and amounts due to brokers - - 306,549.42 -Options contracts (written) at market value (2)(11) - - - -Amounts payable on purchase of investments - 3,653,668.30 - 6,807,377.53Amounts payable on redemptions 6,073.20 144,105.40 2,705,999.48 340,434.86Net unrealised loss on forward foreign exchangecontracts (2)(10) - - - -Net unrealised loss on futures contracts (2)(8) - 2,103,997.12 5,562,781.90 689,500.00Net unrealised loss on swaps contracts (2)(13) - - - -Management and distribution fees payable (3) 34,424.45 228,333.85 192,585.42 355,034.18Performance fees payable (4) 30.20 - - 17,306.34Unrealised capital gain tax on investments (2) - - - -Taxes and expenses payable 20,910.50 117,137.44 155,683.30 189,949.09Interest payable on contracts for differences (2) - - - -Interest payable on swaps - - - -Payable on currencies sold - 3,216,578.93 - -Other liabilities 6,507.64 1,015.89 - -
TOTAL LIABILITIES 67,945.99 9,464,836.93 8,923,599.52 8,399,602.00
TOTAL NET ASSETS 49,865,951.02 478,626,376.85 626,621,110.82 675,197,179.24
Net asset value per shareClass 1 - - - -Class 2 - - - -Class A - - 4.798 4.924Class B - - - 4.953Class C - 4.959 - -Class D - - - -Class E - - - -Class F - - - -Class I 6.628 4.983 4.921 5.130Class M - - - -Class Primaclasse 5.164 4.991 4.852 5.005Class R 5.396 4.985 4.849 5.029Class U 5.658 5.021 4.851 -
Number of shares outstandingClass 1 - - - -Class 2 - - - -Class A - - 22,114,264.047 28,967,380.428Class B - - - 78,391,467.872Class C - 24,441.644 - -Class D - - - -Class E - - - -Class F - - - -Class I 5,086,198.470 10,229,400.739 35,639,167.065 16,154,418.085Class M - - - -Class Primaclasse 1,437,458.805 76,552,604.217 43,048,426.943 12,275,362.818Class R 349,735.743 77,099.114 2,542,268.220 1,281.641Class U 1,209,481.054 8,973,723.934 25,555,593.980 -
Pramerica Sicav
The accompanying notes form an integral part of these financial statements.
19
Statement of Net Assetsas at June 30, 2019 (continued)
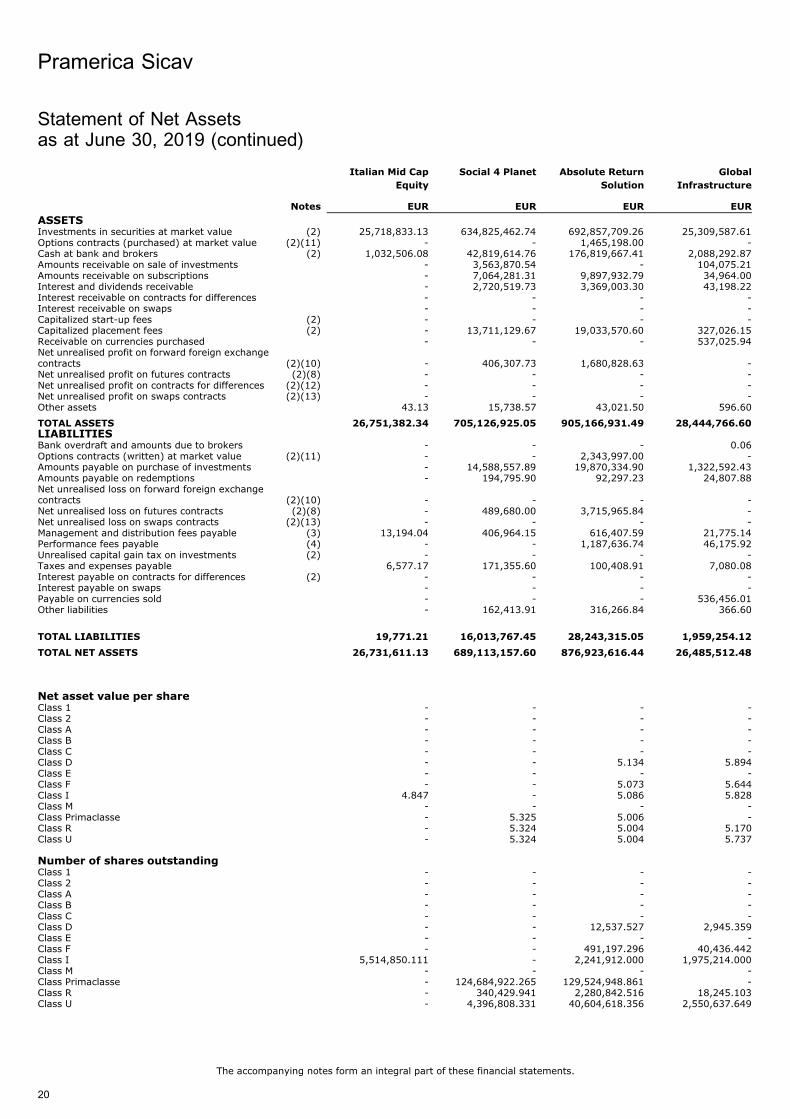
Italian Mid Cap
Equity
Social 4 Planet Absolute Return
Solution
Global
Infrastructure
Notes EUR EUR EUR EUR
ASSETSInvestments in securities at market value (2) 25,718,833.13 634,825,462.74 692,857,709.26 25,309,587.61Options contracts (purchased) at market value (2)(11) - - 1,465,198.00 -Cash at bank and brokers (2) 1,032,506.08 42,819,614.76 176,819,667.41 2,088,292.87Amounts receivable on sale of investments - 3,563,870.54 - 104,075.21Amounts receivable on subscriptions - 7,064,281.31 9,897,932.79 34,964.00Interest and dividends receivable - 2,720,519.73 3,369,003.30 43,198.22Interest receivable on contracts for differences - - - -Interest receivable on swaps - - - -Capitalized start-up fees (2) - - - -Capitalized placement fees (2) - 13,711,129.67 19,033,570.60 327,026.15Receivable on currencies purchased - - - 537,025.94Net unrealised profit on forward foreign exchangecontracts (2)(10) - 406,307.73 1,680,828.63 -Net unrealised profit on futures contracts (2)(8) - - - -Net unrealised profit on contracts for differences (2)(12) - - - -Net unrealised profit on swaps contracts (2)(13) - - - -Other assets 43.13 15,738.57 43,021.50 596.60
TOTAL ASSETS 26,751,382.34 705,126,925.05 905,166,931.49 28,444,766.60LIABILITIESBank overdraft and amounts due to brokers - - - 0.06Options contracts (written) at market value (2)(11) - - 2,343,997.00 -Amounts payable on purchase of investments - 14,588,557.89 19,870,334.90 1,322,592.43Amounts payable on redemptions - 194,795.90 92,297.23 24,807.88Net unrealised loss on forward foreign exchangecontracts (2)(10) - - - -Net unrealised loss on futures contracts (2)(8) - 489,680.00 3,715,965.84 -Net unrealised loss on swaps contracts (2)(13) - - - -Management and distribution fees payable (3) 13,194.04 406,964.15 616,407.59 21,775.14Performance fees payable (4) - - 1,187,636.74 46,175.92Unrealised capital gain tax on investments (2) - - - -Taxes and expenses payable 6,577.17 171,355.60 100,408.91 7,080.08Interest payable on contracts for differences (2) - - - -Interest payable on swaps - - - -Payable on currencies sold - - - 536,456.01Other liabilities - 162,413.91 316,266.84 366.60
TOTAL LIABILITIES 19,771.21 16,013,767.45 28,243,315.05 1,959,254.12
TOTAL NET ASSETS 26,731,611.13 689,113,157.60 876,923,616.44 26,485,512.48
Net asset value per shareClass 1 - - - -Class 2 - - - -Class A - - - -Class B - - - -Class C - - - -Class D - - 5.134 5.894Class E - - - -Class F - - 5.073 5.644Class I 4.847 - 5.086 5.828Class M - - - -Class Primaclasse - 5.325 5.006 -Class R - 5.324 5.004 5.170Class U - 5.324 5.004 5.737
Number of shares outstandingClass 1 - - - -Class 2 - - - -Class A - - - -Class B - - - -Class C - - - -Class D - - 12,537.527 2,945.359Class E - - - -Class F - - 491,197.296 40,436.442Class I 5,514,850.111 - 2,241,912.000 1,975,214.000Class M - - - -Class Primaclasse - 124,684,922.265 129,524,948.861 -Class R - 340,429.941 2,280,842.516 18,245.103Class U - 4,396,808.331 40,604,618.356 2,550,637.649
Pramerica Sicav
The accompanying notes form an integral part of these financial statements.
20
Statement of Net Assetsas at June 30, 2019 (continued)
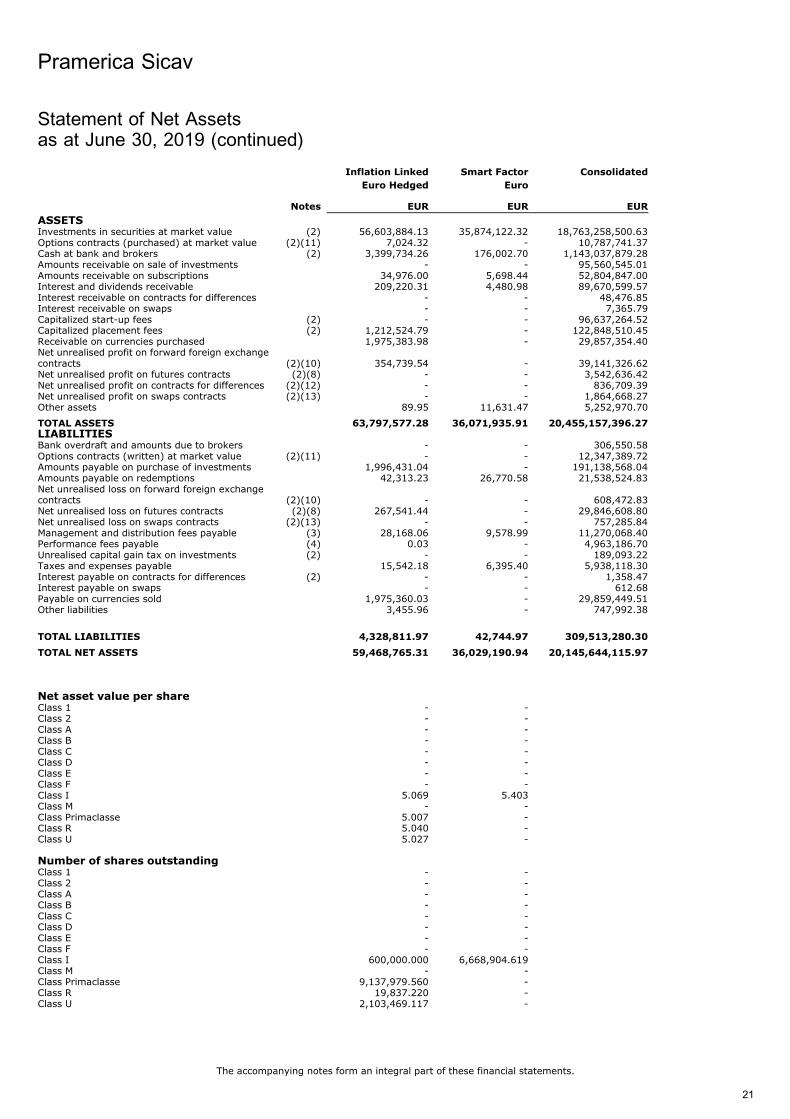
Inflation Linked
Euro Hedged
Smart Factor
Euro
Consolidated
Notes EUR EUR EUR
ASSETSInvestments in securities at market value (2) 56,603,884.13 35,874,122.32 18,763,258,500.63Options contracts (purchased) at market value (2)(11) 7,024.32 - 10,787,741.37Cash at bank and brokers (2) 3,399,734.26 176,002.70 1,143,037,879.28Amounts receivable on sale of investments - - 95,560,545.01Amounts receivable on subscriptions 34,976.00 5,698.44 52,804,847.00Interest and dividends receivable 209,220.31 4,480.98 89,670,599.57Interest receivable on contracts for differences - - 48,476.85Interest receivable on swaps - - 7,365.79Capitalized start-up fees (2) - - 96,637,264.52Capitalized placement fees (2) 1,212,524.79 - 122,848,510.45Receivable on currencies purchased 1,975,383.98 - 29,857,354.40Net unrealised profit on forward foreign exchangecontracts (2)(10) 354,739.54 - 39,141,326.62Net unrealised profit on futures contracts (2)(8) - - 3,542,636.42Net unrealised profit on contracts for differences (2)(12) - - 836,709.39Net unrealised profit on swaps contracts (2)(13) - - 1,864,668.27Other assets 89.95 11,631.47 5,252,970.70
TOTAL ASSETS 63,797,577.28 36,071,935.91 20,455,157,396.27LIABILITIESBank overdraft and amounts due to brokers - - 306,550.58Options contracts (written) at market value (2)(11) - - 12,347,389.72Amounts payable on purchase of investments 1,996,431.04 - 191,138,568.04Amounts payable on redemptions 42,313.23 26,770.58 21,538,524.83Net unrealised loss on forward foreign exchangecontracts (2)(10) - - 608,472.83Net unrealised loss on futures contracts (2)(8) 267,541.44 - 29,846,608.80Net unrealised loss on swaps contracts (2)(13) - - 757,285.84Management and distribution fees payable (3) 28,168.06 9,578.99 11,270,068.40Performance fees payable (4) 0.03 - 4,963,186.70Unrealised capital gain tax on investments (2) - - 189,093.22Taxes and expenses payable 15,542.18 6,395.40 5,938,118.30Interest payable on contracts for differences (2) - - 1,358.47Interest payable on swaps - - 612.68Payable on currencies sold 1,975,360.03 - 29,859,449.51Other liabilities 3,455.96 - 747,992.38
TOTAL LIABILITIES 4,328,811.97 42,744.97 309,513,280.30
TOTAL NET ASSETS 59,468,765.31 36,029,190.94 20,145,644,115.97
Net asset value per shareClass 1 - -Class 2 - -Class A - -Class B - -Class C - -Class D - -Class E - -Class F - -Class I 5.069 5.403Class M - -Class Primaclasse 5.007 -Class R 5.040 -Class U 5.027 -
Number of shares outstandingClass 1 - -Class 2 - -Class A - -Class B - -Class C - -Class D - -Class E - -Class F - -Class I 600,000.000 6,668,904.619Class M - -Class Primaclasse 9,137,979.560 -Class R 19,837.220 -Class U 2,103,469.117 -
Pramerica Sicav
The accompanying notes form an integral part of these financial statements.
21
Statement of Net Assetsas at June 30, 2019 (continued)
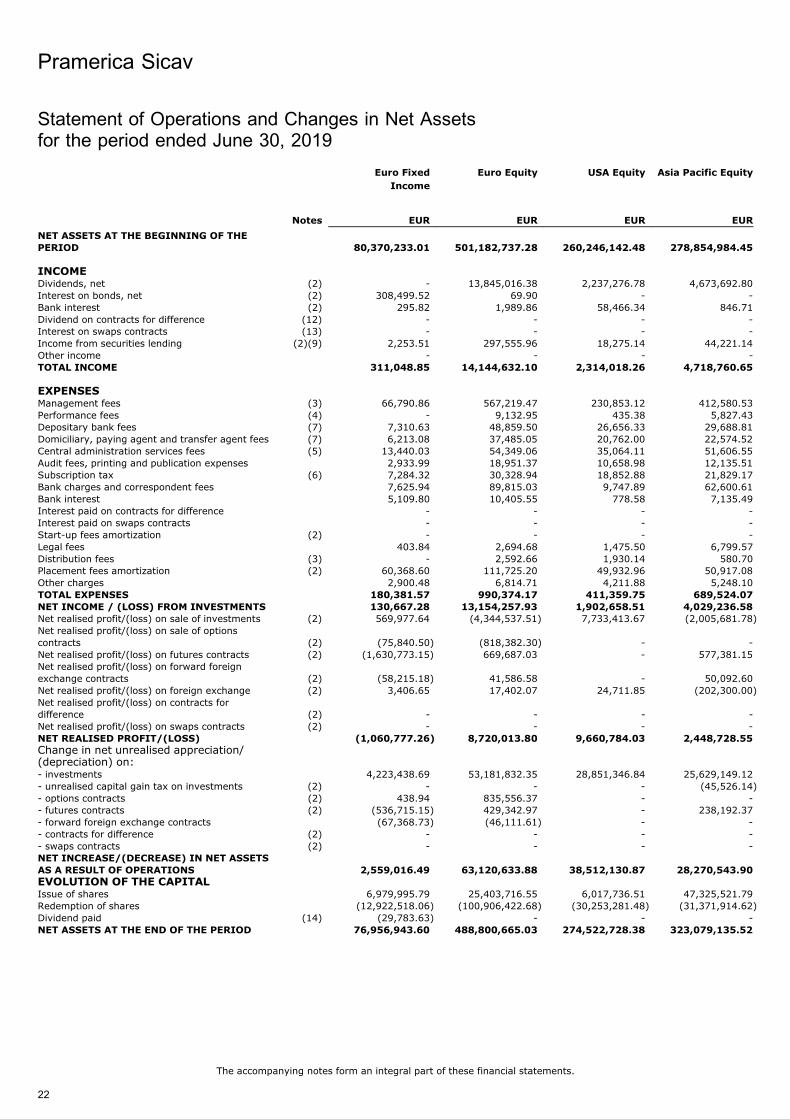
Statement of Operations and Changes in Net Assetsfor the period ended June 30, 2019
Euro Fixed
Income
Euro Equity USA Equity Asia Pacific Equity
Notes EUR EUR EUR EUR
NET ASSETS AT THE BEGINNING OF THE
PERIOD 80,370,233.01 501,182,737.28 260,246,142.48 278,854,984.45
INCOMEDividends, net (2) - 13,845,016.38 2,237,276.78 4,673,692.80Interest on bonds, net (2) 308,499.52 69.90 - -Bank interest (2) 295.82 1,989.86 58,466.34 846.71Dividend on contracts for difference (12) - - - -Interest on swaps contracts (13) - - - -Income from securities lending (2)(9) 2,253.51 297,555.96 18,275.14 44,221.14Other income - - - -TOTAL INCOME 311,048.85 14,144,632.10 2,314,018.26 4,718,760.65
EXPENSESManagement fees (3) 66,790.86 567,219.47 230,853.12 412,580.53Performance fees (4) - 9,132.95 435.38 5,827.43Depositary bank fees (7) 7,310.63 48,859.50 26,656.33 29,688.81Domiciliary, paying agent and transfer agent fees (7) 6,213.08 37,485.05 20,762.00 22,574.52Central administration services fees (5) 13,440.03 54,349.06 35,064.11 51,606.55Audit fees, printing and publication expenses 2,933.99 18,951.37 10,658.98 12,135.51Subscription tax (6) 7,284.32 30,328.94 18,852.88 21,829.17Bank charges and correspondent fees 7,625.94 89,815.03 9,747.89 62,600.61Bank interest 5,109.80 10,405.55 778.58 7,135.49Interest paid on contracts for difference - - - -Interest paid on swaps contracts - - - -Start-up fees amortization (2) - - - -Legal fees 403.84 2,694.68 1,475.50 6,799.57Distribution fees (3) - 2,592.66 1,930.14 580.70Placement fees amortization (2) 60,368.60 111,725.20 49,932.96 50,917.08Other charges 2,900.48 6,814.71 4,211.88 5,248.10TOTAL EXPENSES 180,381.57 990,374.17 411,359.75 689,524.07
NET INCOME / (LOSS) FROM INVESTMENTS 130,667.28 13,154,257.93 1,902,658.51 4,029,236.58Net realised profit/(loss) on sale of investments (2) 569,977.64 (4,344,537.51) 7,733,413.67 (2,005,681.78)Net realised profit/(loss) on sale of optionscontracts (2) (75,840.50) (818,382.30) - -Net realised profit/(loss) on futures contracts (2) (1,630,773.15) 669,687.03 - 577,381.15Net realised profit/(loss) on forward foreignexchange contracts (2) (58,215.18) 41,586.58 - 50,092.60Net realised profit/(loss) on foreign exchange (2) 3,406.65 17,402.07 24,711.85 (202,300.00)Net realised profit/(loss) on contracts fordifference (2) - - - -Net realised profit/(loss) on swaps contracts (2) - - - -NET REALISED PROFIT/(LOSS) (1,060,777.26) 8,720,013.80 9,660,784.03 2,448,728.55
Change in net unrealised appreciation/(depreciation) on:- investments 4,223,438.69 53,181,832.35 28,851,346.84 25,629,149.12- unrealised capital gain tax on investments (2) - - - (45,526.14)- options contracts (2) 438.94 835,556.37 - -- futures contracts (2) (536,715.15) 429,342.97 - 238,192.37- forward foreign exchange contracts (67,368.73) (46,111.61) - -- contracts for difference (2) - - - -- swaps contracts (2) - - - -NET INCREASE/(DECREASE) IN NET ASSETS
AS A RESULT OF OPERATIONS 2,559,016.49 63,120,633.88 38,512,130.87 28,270,543.90
EVOLUTION OF THE CAPITALIssue of shares 6,979,995.79 25,403,716.55 6,017,736.51 47,325,521.79Redemption of shares (12,922,518.06) (100,906,422.68) (30,253,281.48) (31,371,914.62)Dividend paid (14) (29,783.63) - - -NET ASSETS AT THE END OF THE PERIOD 76,956,943.60 488,800,665.03 274,522,728.38 323,079,135.52
Pramerica Sicav
The accompanying notes form an integral part of these financial statements.
22
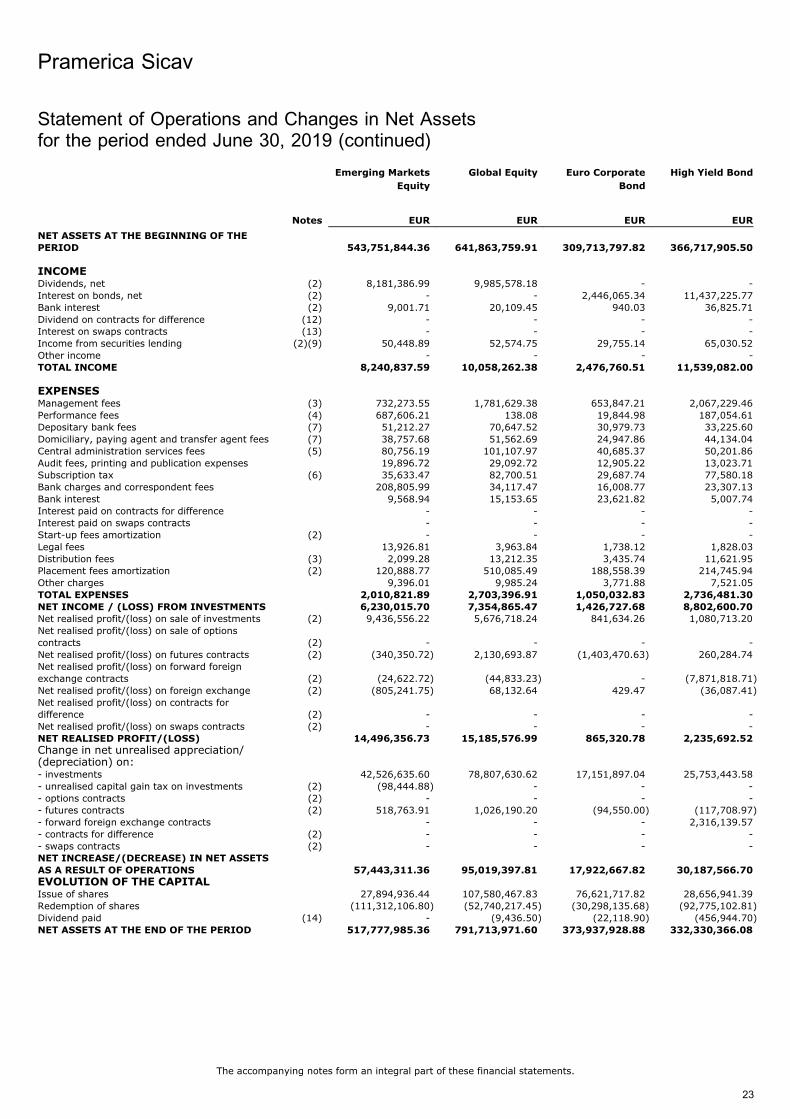
Emerging Markets
Equity
Global Equity Euro Corporate
Bond
High Yield Bond
Notes EUR EUR EUR EUR
NET ASSETS AT THE BEGINNING OF THE
PERIOD 543,751,844.36 641,863,759.91 309,713,797.82 366,717,905.50
INCOMEDividends, net (2) 8,181,386.99 9,985,578.18 - -Interest on bonds, net (2) - - 2,446,065.34 11,437,225.77Bank interest (2) 9,001.71 20,109.45 940.03 36,825.71Dividend on contracts for difference (12) - - - -Interest on swaps contracts (13) - - - -Income from securities lending (2)(9) 50,448.89 52,574.75 29,755.14 65,030.52Other income - - - -TOTAL INCOME 8,240,837.59 10,058,262.38 2,476,760.51 11,539,082.00
EXPENSESManagement fees (3) 732,273.55 1,781,629.38 653,847.21 2,067,229.46Performance fees (4) 687,606.21 138.08 19,844.98 187,054.61Depositary bank fees (7) 51,212.27 70,647.52 30,979.73 33,225.60Domiciliary, paying agent and transfer agent fees (7) 38,757.68 51,562.69 24,947.86 44,134.04Central administration services fees (5) 80,756.19 101,107.97 40,685.37 50,201.86Audit fees, printing and publication expenses 19,896.72 29,092.72 12,905.22 13,023.71Subscription tax (6) 35,633.47 82,700.51 29,687.74 77,580.18Bank charges and correspondent fees 208,805.99 34,117.47 16,008.77 23,307.13Bank interest 9,568.94 15,153.65 23,621.82 5,007.74Interest paid on contracts for difference - - - -Interest paid on swaps contracts - - - -Start-up fees amortization (2) - - - -Legal fees 13,926.81 3,963.84 1,738.12 1,828.03Distribution fees (3) 2,099.28 13,212.35 3,435.74 11,621.95Placement fees amortization (2) 120,888.77 510,085.49 188,558.39 214,745.94Other charges 9,396.01 9,985.24 3,771.88 7,521.05TOTAL EXPENSES 2,010,821.89 2,703,396.91 1,050,032.83 2,736,481.30
NET INCOME / (LOSS) FROM INVESTMENTS 6,230,015.70 7,354,865.47 1,426,727.68 8,802,600.70Net realised profit/(loss) on sale of investments (2) 9,436,556.22 5,676,718.24 841,634.26 1,080,713.20Net realised profit/(loss) on sale of optionscontracts (2) - - - -Net realised profit/(loss) on futures contracts (2) (340,350.72) 2,130,693.87 (1,403,470.63) 260,284.74Net realised profit/(loss) on forward foreignexchange contracts (2) (24,622.72) (44,833.23) - (7,871,818.71)Net realised profit/(loss) on foreign exchange (2) (805,241.75) 68,132.64 429.47 (36,087.41)Net realised profit/(loss) on contracts fordifference (2) - - - -Net realised profit/(loss) on swaps contracts (2) - - - -NET REALISED PROFIT/(LOSS) 14,496,356.73 15,185,576.99 865,320.78 2,235,692.52
Change in net unrealised appreciation/(depreciation) on:- investments 42,526,635.60 78,807,630.62 17,151,897.04 25,753,443.58- unrealised capital gain tax on investments (2) (98,444.88) - - -- options contracts (2) - - - -- futures contracts (2) 518,763.91 1,026,190.20 (94,550.00) (117,708.97)- forward foreign exchange contracts - - - 2,316,139.57- contracts for difference (2) - - - -- swaps contracts (2) - - - -NET INCREASE/(DECREASE) IN NET ASSETS
AS A RESULT OF OPERATIONS 57,443,311.36 95,019,397.81 17,922,667.82 30,187,566.70
EVOLUTION OF THE CAPITALIssue of shares 27,894,936.44 107,580,467.83 76,621,717.82 28,656,941.39Redemption of shares (111,312,106.80) (52,740,217.45) (30,298,135.68) (92,775,102.81)Dividend paid (14) - (9,436.50) (22,118.90) (456,944.70)NET ASSETS AT THE END OF THE PERIOD 517,777,985.36 791,713,971.60 373,937,928.88 332,330,366.08
Pramerica Sicav
The accompanying notes form an integral part of these financial statements.
23
Statement of Operations and Changes in Net Assetsfor the period ended June 30, 2019 (continued)
Short Term EUR Euro Liquidity
Plus
Active Beta Global Corporate
Bond
Notes EUR EUR EUR EUR
NET ASSETS AT THE BEGINNING OF THE
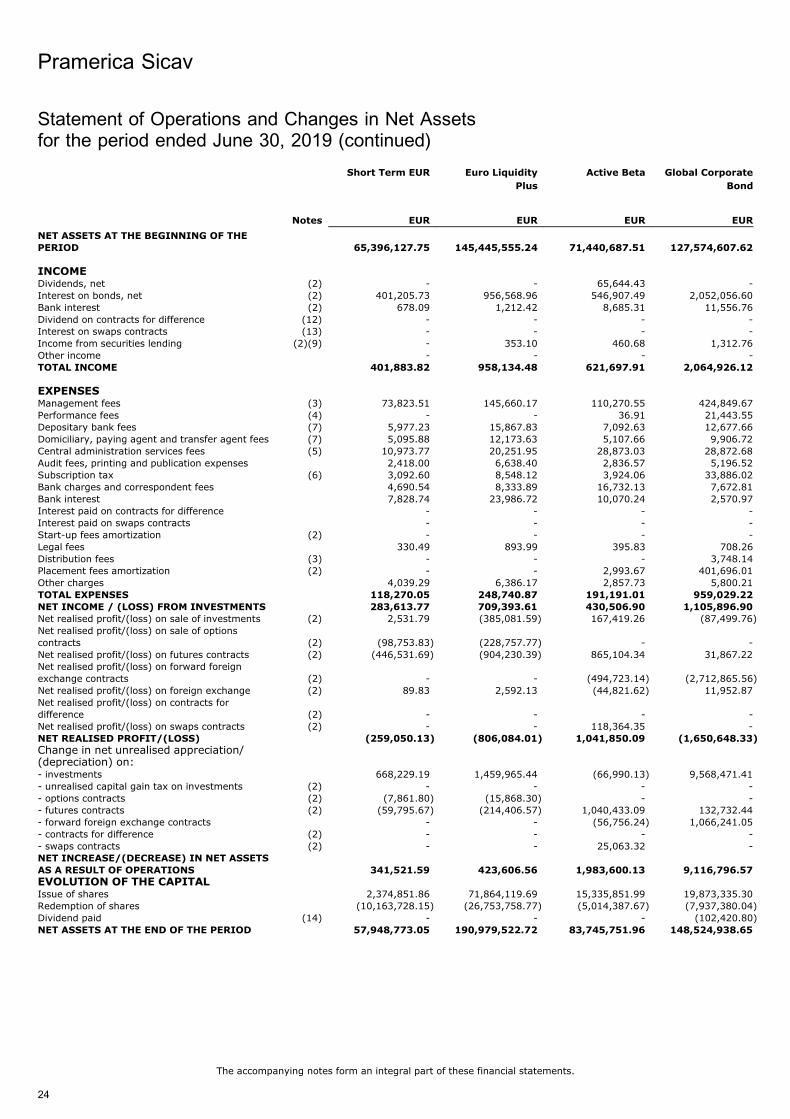
PERIOD 65,396,127.75 145,445,555.24 71,440,687.51 127,574,607.62
INCOMEDividends, net (2) - - 65,644.43 -Interest on bonds, net (2) 401,205.73 956,568.96 546,907.49 2,052,056.60Bank interest (2) 678.09 1,212.42 8,685.31 11,556.76Dividend on contracts for difference (12) - - - -Interest on swaps contracts (13) - - - -Income from securities lending (2)(9) - 353.10 460.68 1,312.76Other income - - - -TOTAL INCOME 401,883.82 958,134.48 621,697.91 2,064,926.12
EXPENSESManagement fees (3) 73,823.51 145,660.17 110,270.55 424,849.67Performance fees (4) - - 36.91 21,443.55Depositary bank fees (7) 5,977.23 15,867.83 7,092.63 12,677.66Domiciliary, paying agent and transfer agent fees (7) 5,095.88 12,173.63 5,107.66 9,906.72Central administration services fees (5) 10,973.77 20,251.95 28,873.03 28,872.68Audit fees, printing and publication expenses 2,418.00 6,638.40 2,836.57 5,196.52Subscription tax (6) 3,092.60 8,548.12 3,924.06 33,886.02Bank charges and correspondent fees 4,690.54 8,333.89 16,732.13 7,672.81Bank interest 7,828.74 23,986.72 10,070.24 2,570.97Interest paid on contracts for difference - - - -Interest paid on swaps contracts - - - -Start-up fees amortization (2) - - - -Legal fees 330.49 893.99 395.83 708.26Distribution fees (3) - - - 3,748.14Placement fees amortization (2) - - 2,993.67 401,696.01Other charges 4,039.29 6,386.17 2,857.73 5,800.21TOTAL EXPENSES 118,270.05 248,740.87 191,191.01 959,029.22
NET INCOME / (LOSS) FROM INVESTMENTS 283,613.77 709,393.61 430,506.90 1,105,896.90Net realised profit/(loss) on sale of investments (2) 2,531.79 (385,081.59) 167,419.26 (87,499.76)Net realised profit/(loss) on sale of optionscontracts (2) (98,753.83) (228,757.77) - -Net realised profit/(loss) on futures contracts (2) (446,531.69) (904,230.39) 865,104.34 31,867.22Net realised profit/(loss) on forward foreignexchange contracts (2) - - (494,723.14) (2,712,865.56)Net realised profit/(loss) on foreign exchange (2) 89.83 2,592.13 (44,821.62) 11,952.87Net realised profit/(loss) on contracts fordifference (2) - - - -Net realised profit/(loss) on swaps contracts (2) - - 118,364.35 -NET REALISED PROFIT/(LOSS) (259,050.13) (806,084.01) 1,041,850.09 (1,650,648.33)
Change in net unrealised appreciation/(depreciation) on:- investments 668,229.19 1,459,965.44 (66,990.13) 9,568,471.41- unrealised capital gain tax on investments (2) - - - -- options contracts (2) (7,861.80) (15,868.30) - -- futures contracts (2) (59,795.67) (214,406.57) 1,040,433.09 132,732.44- forward foreign exchange contracts - - (56,756.24) 1,066,241.05- contracts for difference (2) - - - -- swaps contracts (2) - - 25,063.32 -NET INCREASE/(DECREASE) IN NET ASSETS
AS A RESULT OF OPERATIONS 341,521.59 423,606.56 1,983,600.13 9,116,796.57
EVOLUTION OF THE CAPITALIssue of shares 2,374,851.86 71,864,119.69 15,335,851.99 19,873,335.30Redemption of shares (10,163,728.15) (26,753,758.77) (5,014,387.67) (7,937,380.04)Dividend paid (14) - - - (102,420.80)NET ASSETS AT THE END OF THE PERIOD 57,948,773.05 190,979,522.72 83,745,751.96 148,524,938.65
Pramerica Sicav
The accompanying notes form an integral part of these financial statements.
24
Statement of Operations and Changes in Net Assetsfor the period ended June 30, 2019 (continued)
Euro Corporate
Short Term
Euro Equity High
Dividend
Emerging Markets
Bond
Global Dynamic
Allocation
Notes EUR EUR EUR EUR
NET ASSETS AT THE BEGINNING OF THE
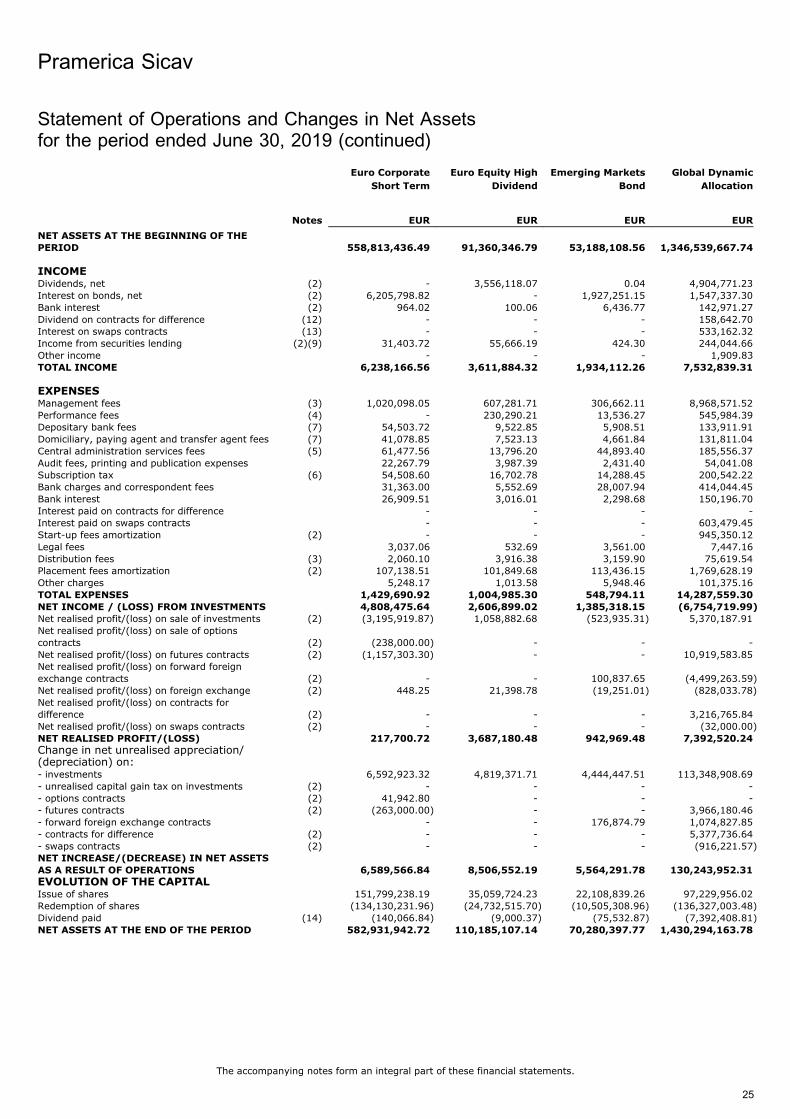
PERIOD 558,813,436.49 91,360,346.79 53,188,108.56 1,346,539,667.74
INCOMEDividends, net (2) - 3,556,118.07 0.04 4,904,771.23Interest on bonds, net (2) 6,205,798.82 - 1,927,251.15 1,547,337.30Bank interest (2) 964.02 100.06 6,436.77 142,971.27Dividend on contracts for difference (12) - - - 158,642.70Interest on swaps contracts (13) - - - 533,162.32Income from securities lending (2)(9) 31,403.72 55,666.19 424.30 244,044.66Other income - - - 1,909.83TOTAL INCOME 6,238,166.56 3,611,884.32 1,934,112.26 7,532,839.31
EXPENSESManagement fees (3) 1,020,098.05 607,281.71 306,662.11 8,968,571.52Performance fees (4) - 230,290.21 13,536.27 545,984.39Depositary bank fees (7) 54,503.72 9,522.85 5,908.51 133,911.91Domiciliary, paying agent and transfer agent fees (7) 41,078.85 7,523.13 4,661.84 131,811.04Central administration services fees (5) 61,477.56 13,796.20 44,893.40 185,556.37Audit fees, printing and publication expenses 22,267.79 3,987.39 2,431.40 54,041.08Subscription tax (6) 54,508.60 16,702.78 14,288.45 200,542.22Bank charges and correspondent fees 31,363.00 5,552.69 28,007.94 414,044.45Bank interest 26,909.51 3,016.01 2,298.68 150,196.70Interest paid on contracts for difference - - - -Interest paid on swaps contracts - - - 603,479.45Start-up fees amortization (2) - - - 945,350.12Legal fees 3,037.06 532.69 3,561.00 7,447.16Distribution fees (3) 2,060.10 3,916.38 3,159.90 75,619.54Placement fees amortization (2) 107,138.51 101,849.68 113,436.15 1,769,628.19Other charges 5,248.17 1,013.58 5,948.46 101,375.16TOTAL EXPENSES 1,429,690.92 1,004,985.30 548,794.11 14,287,559.30
NET INCOME / (LOSS) FROM INVESTMENTS 4,808,475.64 2,606,899.02 1,385,318.15 (6,754,719.99)Net realised profit/(loss) on sale of investments (2) (3,195,919.87) 1,058,882.68 (523,935.31) 5,370,187.91Net realised profit/(loss) on sale of optionscontracts (2) (238,000.00) - - -Net realised profit/(loss) on futures contracts (2) (1,157,303.30) - - 10,919,583.85Net realised profit/(loss) on forward foreignexchange contracts (2) - - 100,837.65 (4,499,263.59)Net realised profit/(loss) on foreign exchange (2) 448.25 21,398.78 (19,251.01) (828,033.78)Net realised profit/(loss) on contracts fordifference (2) - - - 3,216,765.84Net realised profit/(loss) on swaps contracts (2) - - - (32,000.00)NET REALISED PROFIT/(LOSS) 217,700.72 3,687,180.48 942,969.48 7,392,520.24
Change in net unrealised appreciation/(depreciation) on:- investments 6,592,923.32 4,819,371.71 4,444,447.51 113,348,908.69- unrealised capital gain tax on investments (2) - - - -- options contracts (2) 41,942.80 - - -- futures contracts (2) (263,000.00) - - 3,966,180.46- forward foreign exchange contracts - - 176,874.79 1,074,827.85- contracts for difference (2) - - - 5,377,736.64- swaps contracts (2) - - - (916,221.57)NET INCREASE/(DECREASE) IN NET ASSETS
AS A RESULT OF OPERATIONS 6,589,566.84 8,506,552.19 5,564,291.78 130,243,952.31
EVOLUTION OF THE CAPITALIssue of shares 151,799,238.19 35,059,724.23 22,108,839.26 97,229,956.02Redemption of shares (134,130,231.96) (24,732,515.70) (10,505,308.96) (136,327,003.48)Dividend paid (14) (140,066.84) (9,000.37) (75,532.87) (7,392,408.81)NET ASSETS AT THE END OF THE PERIOD 582,931,942.72 110,185,107.14 70,280,397.77 1,430,294,163.78
Pramerica Sicav
The accompanying notes form an integral part of these financial statements.
25
Statement of Operations and Changes in Net Assetsfor the period ended June 30, 2019 (continued)
Cedola Certa
2012-2015
Beta Neutral Long/Short Euro Cedola Certa
2013-2016
Notes EUR EUR EUR EUR
NET ASSETS AT THE BEGINNING OF THE
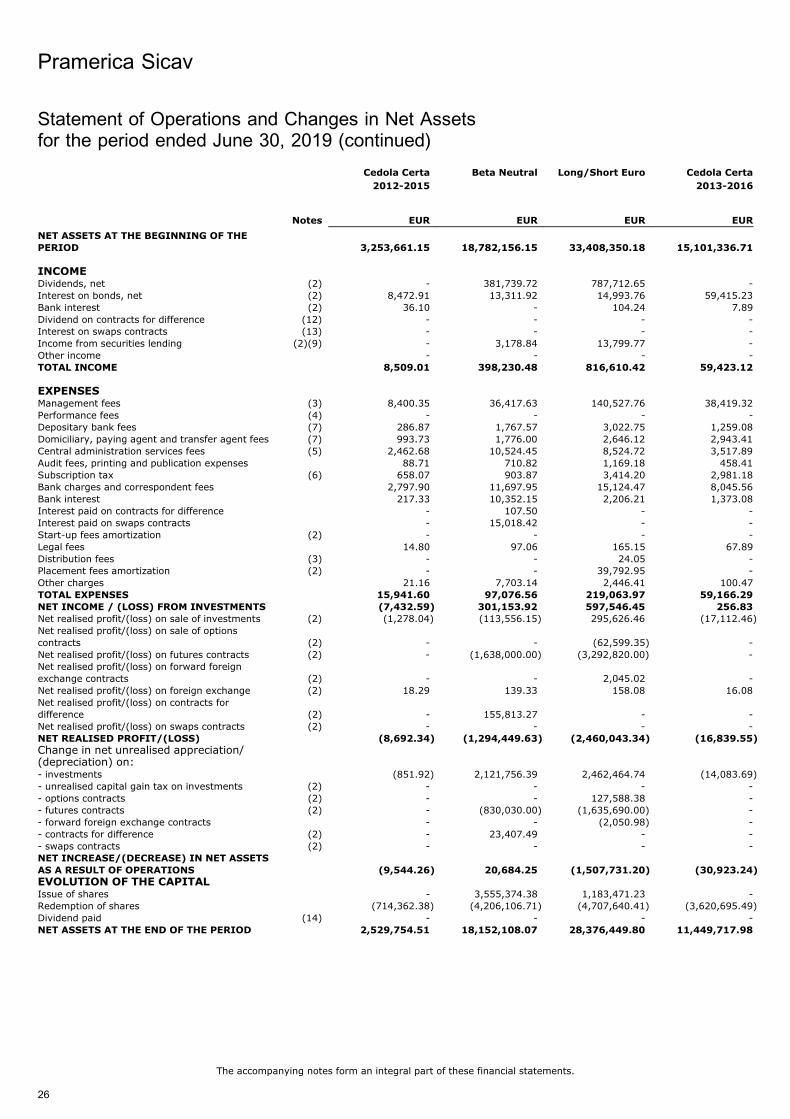
PERIOD 3,253,661.15 18,782,156.15 33,408,350.18 15,101,336.71
INCOMEDividends, net (2) - 381,739.72 787,712.65 -Interest on bonds, net (2) 8,472.91 13,311.92 14,993.76 59,415.23Bank interest (2) 36.10 - 104.24 7.89Dividend on contracts for difference (12) - - - -Interest on swaps contracts (13) - - - -Income from securities lending (2)(9) - 3,178.84 13,799.77 -Other income - - - -TOTAL INCOME 8,509.01 398,230.48 816,610.42 59,423.12
EXPENSESManagement fees (3) 8,400.35 36,417.63 140,527.76 38,419.32Performance fees (4) - - - -Depositary bank fees (7) 286.87 1,767.57 3,022.75 1,259.08Domiciliary, paying agent and transfer agent fees (7) 993.73 1,776.00 2,646.12 2,943.41Central administration services fees (5) 2,462.68 10,524.45 8,524.72 3,517.89Audit fees, printing and publication expenses 88.71 710.82 1,169.18 458.41Subscription tax (6) 658.07 903.87 3,414.20 2,981.18Bank charges and correspondent fees 2,797.90 11,697.95 15,124.47 8,045.56Bank interest 217.33 10,352.15 2,206.21 1,373.08Interest paid on contracts for difference - 107.50 - -Interest paid on swaps contracts - 15,018.42 - -Start-up fees amortization (2) - - - -Legal fees 14.80 97.06 165.15 67.89Distribution fees (3) - - 24.05 -Placement fees amortization (2) - - 39,792.95 -Other charges 21.16 7,703.14 2,446.41 100.47TOTAL EXPENSES 15,941.60 97,076.56 219,063.97 59,166.29
NET INCOME / (LOSS) FROM INVESTMENTS (7,432.59) 301,153.92 597,546.45 256.83Net realised profit/(loss) on sale of investments (2) (1,278.04) (113,556.15) 295,626.46 (17,112.46)Net realised profit/(loss) on sale of optionscontracts (2) - - (62,599.35) -Net realised profit/(loss) on futures contracts (2) - (1,638,000.00) (3,292,820.00) -Net realised profit/(loss) on forward foreignexchange contracts (2) - - 2,045.02 -Net realised profit/(loss) on foreign exchange (2) 18.29 139.33 158.08 16.08Net realised profit/(loss) on contracts fordifference (2) - 155,813.27 - -Net realised profit/(loss) on swaps contracts (2) - - - -NET REALISED PROFIT/(LOSS) (8,692.34) (1,294,449.63) (2,460,043.34) (16,839.55)
Change in net unrealised appreciation/(depreciation) on:- investments (851.92) 2,121,756.39 2,462,464.74 (14,083.69)- unrealised capital gain tax on investments (2) - - - -- options contracts (2) - - 127,588.38 -- futures contracts (2) - (830,030.00) (1,635,690.00) -- forward foreign exchange contracts - - (2,050.98) -- contracts for difference (2) - 23,407.49 - -- swaps contracts (2) - - - -NET INCREASE/(DECREASE) IN NET ASSETS
AS A RESULT OF OPERATIONS (9,544.26) 20,684.25 (1,507,731.20) (30,923.24)
EVOLUTION OF THE CAPITALIssue of shares - 3,555,374.38 1,183,471.23 -Redemption of shares (714,362.38) (4,206,106.71) (4,707,640.41) (3,620,695.49)Dividend paid (14) - - - -NET ASSETS AT THE END OF THE PERIOD 2,529,754.51 18,152,108.07 28,376,449.80 11,449,717.98
Pramerica Sicav
The accompanying notes form an integral part of these financial statements.
26
Statement of Operations and Changes in Net Assetsfor the period ended June 30, 2019 (continued)
Protezione e
Crescita 2017
Cedola Certa
2013-2017
Focus Italia Cedola Mercati
Emergenti
Notes EUR EUR EUR EUR
NET ASSETS AT THE BEGINNING OF THE
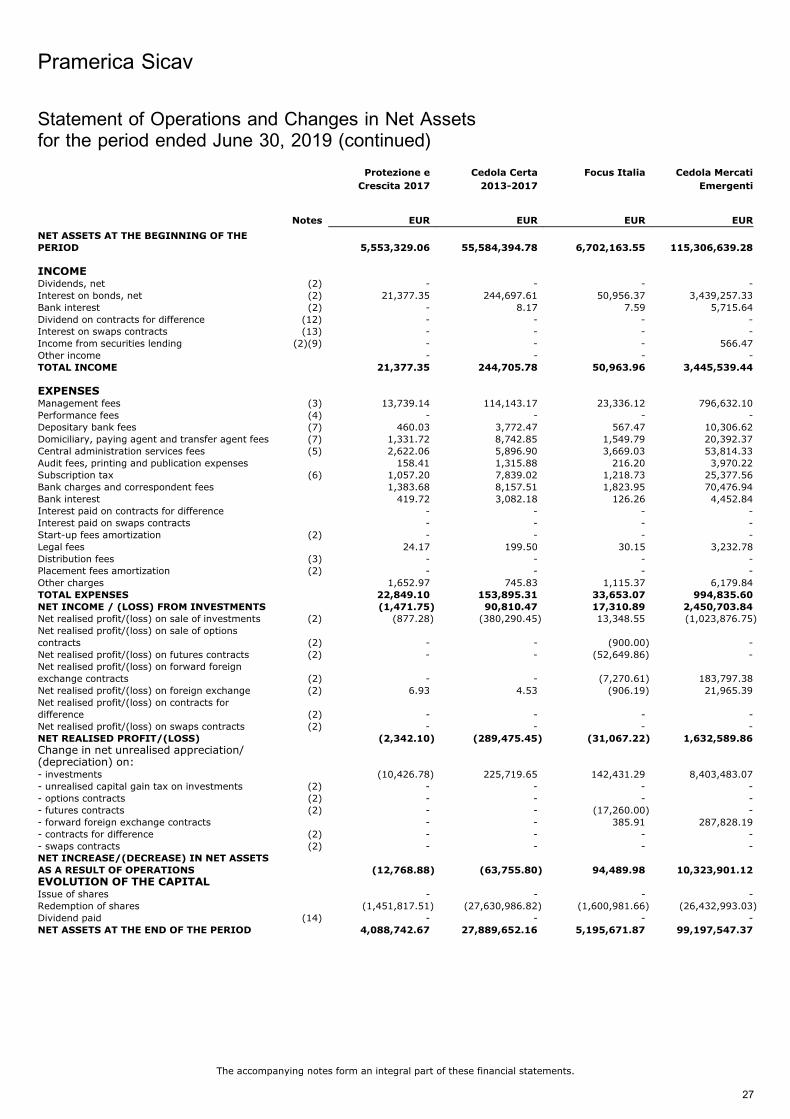
PERIOD 5,553,329.06 55,584,394.78 6,702,163.55 115,306,639.28
INCOMEDividends, net (2) - - - -Interest on bonds, net (2) 21,377.35 244,697.61 50,956.37 3,439,257.33Bank interest (2) - 8.17 7.59 5,715.64Dividend on contracts for difference (12) - - - -Interest on swaps contracts (13) - - - -Income from securities lending (2)(9) - - - 566.47Other income - - - -TOTAL INCOME 21,377.35 244,705.78 50,963.96 3,445,539.44
EXPENSESManagement fees (3) 13,739.14 114,143.17 23,336.12 796,632.10Performance fees (4) - - - -Depositary bank fees (7) 460.03 3,772.47 567.47 10,306.62Domiciliary, paying agent and transfer agent fees (7) 1,331.72 8,742.85 1,549.79 20,392.37Central administration services fees (5) 2,622.06 5,896.90 3,669.03 53,814.33Audit fees, printing and publication expenses 158.41 1,315.88 216.20 3,970.22Subscription tax (6) 1,057.20 7,839.02 1,218.73 25,377.56Bank charges and correspondent fees 1,383.68 8,157.51 1,823.95 70,476.94Bank interest 419.72 3,082.18 126.26 4,452.84Interest paid on contracts for difference - - - -Interest paid on swaps contracts - - - -Start-up fees amortization (2) - - - -Legal fees 24.17 199.50 30.15 3,232.78Distribution fees (3) - - - -Placement fees amortization (2) - - - -Other charges 1,652.97 745.83 1,115.37 6,179.84TOTAL EXPENSES 22,849.10 153,895.31 33,653.07 994,835.60
NET INCOME / (LOSS) FROM INVESTMENTS (1,471.75) 90,810.47 17,310.89 2,450,703.84Net realised profit/(loss) on sale of investments (2) (877.28) (380,290.45) 13,348.55 (1,023,876.75)Net realised profit/(loss) on sale of optionscontracts (2) - - (900.00) -Net realised profit/(loss) on futures contracts (2) - - (52,649.86) -Net realised profit/(loss) on forward foreignexchange contracts (2) - - (7,270.61) 183,797.38Net realised profit/(loss) on foreign exchange (2) 6.93 4.53 (906.19) 21,965.39Net realised profit/(loss) on contracts fordifference (2) - - - -Net realised profit/(loss) on swaps contracts (2) - - - -NET REALISED PROFIT/(LOSS) (2,342.10) (289,475.45) (31,067.22) 1,632,589.86
Change in net unrealised appreciation/(depreciation) on:- investments (10,426.78) 225,719.65 142,431.29 8,403,483.07- unrealised capital gain tax on investments (2) - - - -- options contracts (2) - - - -- futures contracts (2) - - (17,260.00) -- forward foreign exchange contracts - - 385.91 287,828.19- contracts for difference (2) - - - -- swaps contracts (2) - - - -NET INCREASE/(DECREASE) IN NET ASSETS
AS A RESULT OF OPERATIONS (12,768.88) (63,755.80) 94,489.98 10,323,901.12
EVOLUTION OF THE CAPITALIssue of shares - - - -Redemption of shares (1,451,817.51) (27,630,986.82) (1,600,981.66) (26,432,993.03)Dividend paid (14) - - - -NET ASSETS AT THE END OF THE PERIOD 4,088,742.67 27,889,652.16 5,195,671.87 99,197,547.37
Pramerica Sicav
The accompanying notes form an integral part of these financial statements.
27
Statement of Operations and Changes in Net Assetsfor the period ended June 30, 2019 (continued)
Protezione
Mercati Emergenti
Multiasset Europe
50
Global High Yield
Euro Hedged
Global Multiasset
30
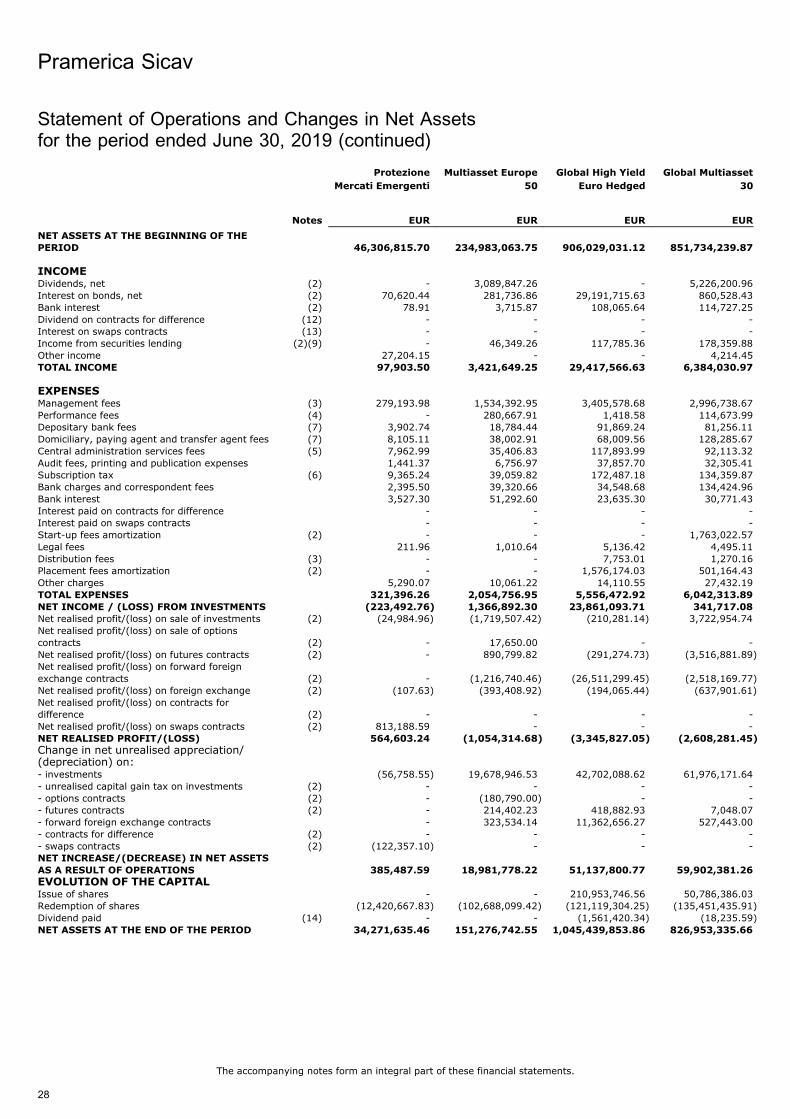
Notes EUR EUR EUR EUR
NET ASSETS AT THE BEGINNING OF THE
PERIOD 46,306,815.70 234,983,063.75 906,029,031.12 851,734,239.87
INCOMEDividends, net (2) - 3,089,847.26 - 5,226,200.96Interest on bonds, net (2) 70,620.44 281,736.86 29,191,715.63 860,528.43Bank interest (2) 78.91 3,715.87 108,065.64 114,727.25Dividend on contracts for difference (12) - - - -Interest on swaps contracts (13) - - - -Income from securities lending (2)(9) - 46,349.26 117,785.36 178,359.88Other income 27,204.15 - - 4,214.45TOTAL INCOME 97,903.50 3,421,649.25 29,417,566.63 6,384,030.97
EXPENSESManagement fees (3) 279,193.98 1,534,392.95 3,405,578.68 2,996,738.67Performance fees (4) - 280,667.91 1,418.58 114,673.99Depositary bank fees (7) 3,902.74 18,784.44 91,869.24 81,256.11Domiciliary, paying agent and transfer agent fees (7) 8,105.11 38,002.91 68,009.56 128,285.67Central administration services fees (5) 7,962.99 35,406.83 117,893.99 92,113.32Audit fees, printing and publication expenses 1,441.37 6,756.97 37,857.70 32,305.41Subscription tax (6) 9,365.24 39,059.82 172,487.18 134,359.87Bank charges and correspondent fees 2,395.50 39,320.66 34,548.68 134,424.96Bank interest 3,527.30 51,292.60 23,635.30 30,771.43Interest paid on contracts for difference - - - -Interest paid on swaps contracts - - - -Start-up fees amortization (2) - - - 1,763,022.57Legal fees 211.96 1,010.64 5,136.42 4,495.11Distribution fees (3) - - 7,753.01 1,270.16Placement fees amortization (2) - - 1,576,174.03 501,164.43Other charges 5,290.07 10,061.22 14,110.55 27,432.19TOTAL EXPENSES 321,396.26 2,054,756.95 5,556,472.92 6,042,313.89
NET INCOME / (LOSS) FROM INVESTMENTS (223,492.76) 1,366,892.30 23,861,093.71 341,717.08Net realised profit/(loss) on sale of investments (2) (24,984.96) (1,719,507.42) (210,281.14) 3,722,954.74Net realised profit/(loss) on sale of optionscontracts (2) - 17,650.00 - -Net realised profit/(loss) on futures contracts (2) - 890,799.82 (291,274.73) (3,516,881.89)Net realised profit/(loss) on forward foreignexchange contracts (2) - (1,216,740.46) (26,511,299.45) (2,518,169.77)Net realised profit/(loss) on foreign exchange (2) (107.63) (393,408.92) (194,065.44) (637,901.61)Net realised profit/(loss) on contracts fordifference (2) - - - -Net realised profit/(loss) on swaps contracts (2) 813,188.59 - - -NET REALISED PROFIT/(LOSS) 564,603.24 (1,054,314.68) (3,345,827.05) (2,608,281.45)
Change in net unrealised appreciation/(depreciation) on:- investments (56,758.55) 19,678,946.53 42,702,088.62 61,976,171.64- unrealised capital gain tax on investments (2) - - - -- options contracts (2) - (180,790.00) - -- futures contracts (2) - 214,402.23 418,882.93 7,048.07- forward foreign exchange contracts - 323,534.14 11,362,656.27 527,443.00- contracts for difference (2) - - - -- swaps contracts (2) (122,357.10) - - -NET INCREASE/(DECREASE) IN NET ASSETS
AS A RESULT OF OPERATIONS 385,487.59 18,981,778.22 51,137,800.77 59,902,381.26
EVOLUTION OF THE CAPITALIssue of shares - - 210,953,746.56 50,786,386.03Redemption of shares (12,420,667.83) (102,688,099.42) (121,119,304.25) (135,451,435.91)Dividend paid (14) - - (1,561,420.34) (18,235.59)NET ASSETS AT THE END OF THE PERIOD 34,271,635.46 151,276,742.55 1,045,439,853.86 826,953,335.66
Pramerica Sicav
The accompanying notes form an integral part of these financial statements.
28
Statement of Operations and Changes in Net Assetsfor the period ended June 30, 2019 (continued)

Italian Equity Income
Opportunities
European
Equity
Global Stars
Notes EUR EUR EUR EUR
NET ASSETS AT THE BEGINNING OF THE
PERIOD 254,691,820.62 567,486,987.10 114,640,781.48 1,439,601,188.07
INCOMEDividends, net (2) 7,579,761.98 743,041.37 3,231,501.98 1,804,121.55Interest on bonds, net (2) 25,482.87 932,364.18 - -Bank interest (2) 168.72 25,783.61 602.06 25,680.86Dividend on contracts for difference (12) - - - -Interest on swaps contracts (13) - - - -Income from securities lending (2)(9) 410,354.58 11,981.96 54,382.25 76.76Other income - 2,848.92 - -TOTAL INCOME 8,015,768.15 1,716,020.04 3,286,486.29 1,829,879.17
EXPENSESManagement fees (3) 336,172.79 2,332,525.62 103,651.46 5,849,647.62Performance fees (4) 157,926.77 - 0.01 1,555,337.33Depositary bank fees (7) 27,646.08 50,497.10 11,384.65 147,155.46Domiciliary, paying agent and transfer agent fees (7) 21,520.97 100,327.58 9,400.52 174,643.94Central administration services fees (5) 34,864.73 71,865.23 20,181.37 186,037.65Audit fees, printing and publication expenses 11,358.31 19,726.14 4,505.21 79,934.89Subscription tax (6) 19,146.85 51,182.42 7,452.95 114,187.92Bank charges and correspondent fees 33,933.11 104,941.36 18,366.33 178,926.90Bank interest 9,960.35 26,371.12 4,706.96 25,439.18Interest paid on contracts for difference - - - -Interest paid on swaps contracts - - - -Start-up fees amortization (2) - 1,524,078.17 - 2,889,734.37Legal fees 1,551.32 2,773.47 629.91 8,212.95Distribution fees (3) 1,199.90 327.16 570.84 -Placement fees amortization (2) 57,969.14 22,316.81 24,972.05 1,266,668.98Other charges 5,219.85 35,464.71 8,012.89 67,711.97TOTAL EXPENSES 718,470.17 4,342,396.89 213,835.15 12,543,639.16
NET INCOME / (LOSS) FROM INVESTMENTS 7,297,297.98 (2,626,376.85) 3,072,651.14 (10,713,759.99)Net realised profit/(loss) on sale of investments (2) 7,900,597.60 2,455,015.55 (2,211,625.23) 30,073,260.36Net realised profit/(loss) on sale of optionscontracts (2) (503,731.44) - (185,682.62) -Net realised profit/(loss) on futures contracts (2) 690,723.35 (697,029.91) 115,144.99 8,484,445.02Net realised profit/(loss) on forward foreignexchange contracts (2) 31,875.94 (2,533,728.91) 142,133.81 (665,495.60)Net realised profit/(loss) on foreign exchange (2) 7,384.97 (823,112.31) (205,721.48) (381,625.95)Net realised profit/(loss) on contracts fordifference (2) - - - -Net realised profit/(loss) on swaps contracts (2) - 4,885,677.13 - -NET REALISED PROFIT/(LOSS) 15,424,148.40 660,444.70 726,900.61 26,796,823.84
Change in net unrealised appreciation/(depreciation) on:- investments 31,474,228.56 19,429,045.28 13,858,141.36 96,350,252.71- unrealised capital gain tax on investments (2) - - - -- options contracts (2) 461,529.63 - 215,397.06 -- futures contracts (2) (17,640.00) 5,023,278.01 - 7,310,062.01- forward foreign exchange contracts (31,965.37) (833,246.72) (89,102.95) (206,088.53)- contracts for difference (2) - - - -- swaps contracts (2) - 1,372,233.02 - -NET INCREASE/(DECREASE) IN NET ASSETS
AS A RESULT OF OPERATIONS 47,310,301.22 25,651,754.29 14,711,336.08 130,251,050.03
EVOLUTION OF THE CAPITALIssue of shares 61,717,875.92 247,834.53 1,298,768.87 183,513,744.38Redemption of shares (38,312,731.71) (112,455,086.94) (13,931,438.41) (85,699,531.36)Dividend paid (14) - (1,688.97) (902.38) (26,540,869.76)NET ASSETS AT THE END OF THE PERIOD 325,407,266.05 480,929,800.01 116,718,545.64 1,641,125,581.36
Pramerica Sicav
The accompanying notes form an integral part of these financial statements.
29
Statement of Operations and Changes in Net Assetsfor the period ended June 30, 2019 (continued)
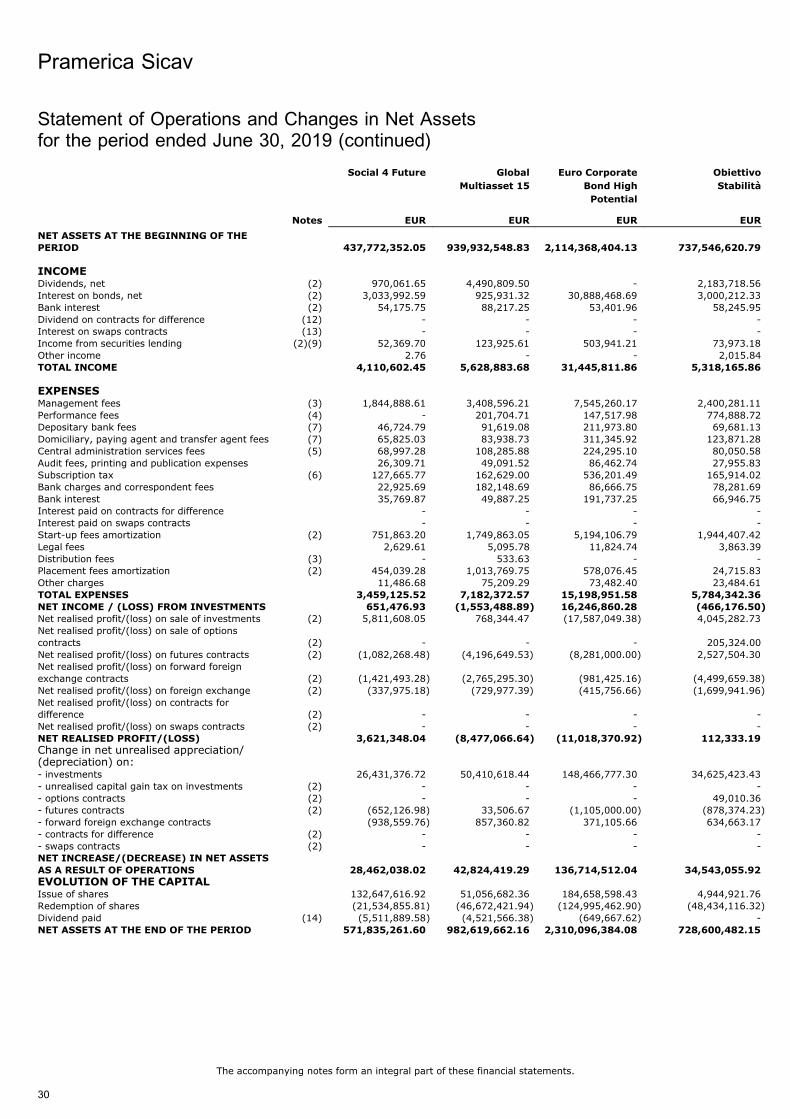
Social 4 Future Global
Multiasset 15
Euro Corporate
Bond High
Potential
Obiettivo
Stabilita
Notes EUR EUR EUR EUR
NET ASSETS AT THE BEGINNING OF THE
PERIOD 437,772,352.05 939,932,548.83 2,114,368,404.13 737,546,620.79
INCOMEDividends, net (2) 970,061.65 4,490,809.50 - 2,183,718.56Interest on bonds, net (2) 3,033,992.59 925,931.32 30,888,468.69 3,000,212.33Bank interest (2) 54,175.75 88,217.25 53,401.96 58,245.95Dividend on contracts for difference (12) - - - -Interest on swaps contracts (13) - - - -Income from securities lending (2)(9) 52,369.70 123,925.61 503,941.21 73,973.18Other income 2.76 - - 2,015.84TOTAL INCOME 4,110,602.45 5,628,883.68 31,445,811.86 5,318,165.86
EXPENSESManagement fees (3) 1,844,888.61 3,408,596.21 7,545,260.17 2,400,281.11Performance fees (4) - 201,704.71 147,517.98 774,888.72Depositary bank fees (7) 46,724.79 91,619.08 211,973.80 69,681.13Domiciliary, paying agent and transfer agent fees (7) 65,825.03 83,938.73 311,345.92 123,871.28Central administration services fees (5) 68,997.28 108,285.88 224,295.10 80,050.58Audit fees, printing and publication expenses 26,309.71 49,091.52 86,462.74 27,955.83Subscription tax (6) 127,665.77 162,629.00 536,201.49 165,914.02Bank charges and correspondent fees 22,925.69 182,148.69 86,666.75 78,281.69Bank interest 35,769.87 49,887.25 191,737.25 66,946.75Interest paid on contracts for difference - - - -Interest paid on swaps contracts - - - -Start-up fees amortization (2) 751,863.20 1,749,863.05 5,194,106.79 1,944,407.42Legal fees 2,629.61 5,095.78 11,824.74 3,863.39Distribution fees (3) - 533.63 - -Placement fees amortization (2) 454,039.28 1,013,769.75 578,076.45 24,715.83Other charges 11,486.68 75,209.29 73,482.40 23,484.61TOTAL EXPENSES 3,459,125.52 7,182,372.57 15,198,951.58 5,784,342.36
NET INCOME / (LOSS) FROM INVESTMENTS 651,476.93 (1,553,488.89) 16,246,860.28 (466,176.50)Net realised profit/(loss) on sale of investments (2) 5,811,608.05 768,344.47 (17,587,049.38) 4,045,282.73Net realised profit/(loss) on sale of optionscontracts (2) - - - 205,324.00Net realised profit/(loss) on futures contracts (2) (1,082,268.48) (4,196,649.53) (8,281,000.00) 2,527,504.30Net realised profit/(loss) on forward foreignexchange contracts (2) (1,421,493.28) (2,765,295.30) (981,425.16) (4,499,659.38)Net realised profit/(loss) on foreign exchange (2) (337,975.18) (729,977.39) (415,756.66) (1,699,941.96)Net realised profit/(loss) on contracts fordifference (2) - - - -Net realised profit/(loss) on swaps contracts (2) - - - -NET REALISED PROFIT/(LOSS) 3,621,348.04 (8,477,066.64) (11,018,370.92) 112,333.19
Change in net unrealised appreciation/(depreciation) on:- investments 26,431,376.72 50,410,618.44 148,466,777.30 34,625,423.43- unrealised capital gain tax on investments (2) - - - -- options contracts (2) - - - 49,010.36- futures contracts (2) (652,126.98) 33,506.67 (1,105,000.00) (878,374.23)- forward foreign exchange contracts (938,559.76) 857,360.82 371,105.66 634,663.17- contracts for difference (2) - - - -- swaps contracts (2) - - - -NET INCREASE/(DECREASE) IN NET ASSETS
AS A RESULT OF OPERATIONS 28,462,038.02 42,824,419.29 136,714,512.04 34,543,055.92
EVOLUTION OF THE CAPITALIssue of shares 132,647,616.92 51,056,682.36 184,658,598.43 4,944,921.76Redemption of shares (21,534,855.81) (46,672,421.94) (124,995,462.90) (48,434,116.32)Dividend paid (14) (5,511,889.58) (4,521,566.38) (649,667.62) -NET ASSETS AT THE END OF THE PERIOD 571,835,261.60 982,619,662.16 2,310,096,384.08 728,600,482.15
Pramerica Sicav
The accompanying notes form an integral part of these financial statements.
30
Statement of Operations and Changes in Net Assetsfor the period ended June 30, 2019 (continued)
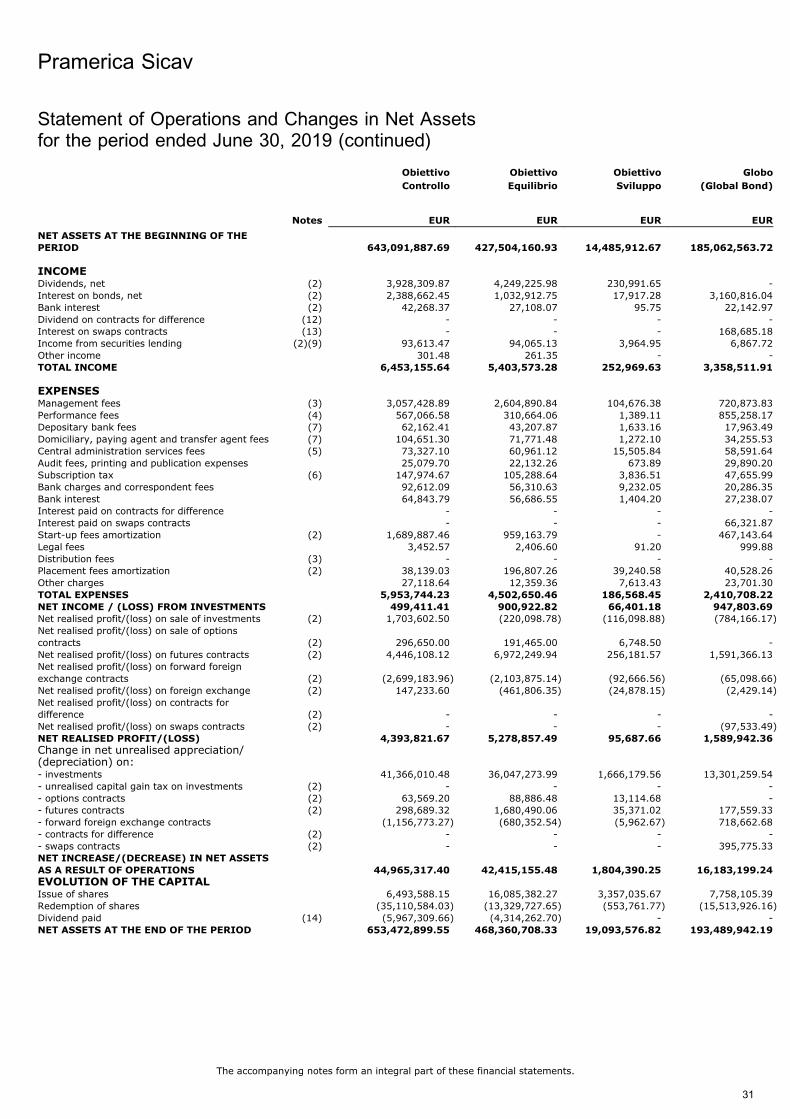
Obiettivo
Controllo
Obiettivo
Equilibrio
Obiettivo
Sviluppo
Globo
(Global Bond)
Notes EUR EUR EUR EUR
NET ASSETS AT THE BEGINNING OF THE
PERIOD 643,091,887.69 427,504,160.93 14,485,912.67 185,062,563.72
INCOMEDividends, net (2) 3,928,309.87 4,249,225.98 230,991.65 -Interest on bonds, net (2) 2,388,662.45 1,032,912.75 17,917.28 3,160,816.04Bank interest (2) 42,268.37 27,108.07 95.75 22,142.97Dividend on contracts for difference (12) - - - -Interest on swaps contracts (13) - - - 168,685.18Income from securities lending (2)(9) 93,613.47 94,065.13 3,964.95 6,867.72Other income 301.48 261.35 - -TOTAL INCOME 6,453,155.64 5,403,573.28 252,969.63 3,358,511.91
EXPENSESManagement fees (3) 3,057,428.89 2,604,890.84 104,676.38 720,873.83Performance fees (4) 567,066.58 310,664.06 1,389.11 855,258.17Depositary bank fees (7) 62,162.41 43,207.87 1,633.16 17,963.49Domiciliary, paying agent and transfer agent fees (7) 104,651.30 71,771.48 1,272.10 34,255.53Central administration services fees (5) 73,327.10 60,961.12 15,505.84 58,591.64Audit fees, printing and publication expenses 25,079.70 22,132.26 673.89 29,890.20Subscription tax (6) 147,974.67 105,288.64 3,836.51 47,655.99Bank charges and correspondent fees 92,612.09 56,310.63 9,232.05 20,286.35Bank interest 64,843.79 56,686.55 1,404.20 27,238.07Interest paid on contracts for difference - - - -Interest paid on swaps contracts - - - 66,321.87Start-up fees amortization (2) 1,689,887.46 959,163.79 - 467,143.64Legal fees 3,452.57 2,406.60 91.20 999.88Distribution fees (3) - - - -Placement fees amortization (2) 38,139.03 196,807.26 39,240.58 40,528.26Other charges 27,118.64 12,359.36 7,613.43 23,701.30TOTAL EXPENSES 5,953,744.23 4,502,650.46 186,568.45 2,410,708.22
NET INCOME / (LOSS) FROM INVESTMENTS 499,411.41 900,922.82 66,401.18 947,803.69Net realised profit/(loss) on sale of investments (2) 1,703,602.50 (220,098.78) (116,098.88) (784,166.17)Net realised profit/(loss) on sale of optionscontracts (2) 296,650.00 191,465.00 6,748.50 -Net realised profit/(loss) on futures contracts (2) 4,446,108.12 6,972,249.94 256,181.57 1,591,366.13Net realised profit/(loss) on forward foreignexchange contracts (2) (2,699,183.96) (2,103,875.14) (92,666.56) (65,098.66)Net realised profit/(loss) on foreign exchange (2) 147,233.60 (461,806.35) (24,878.15) (2,429.14)Net realised profit/(loss) on contracts fordifference (2) - - - -Net realised profit/(loss) on swaps contracts (2) - - - (97,533.49)NET REALISED PROFIT/(LOSS) 4,393,821.67 5,278,857.49 95,687.66 1,589,942.36
Change in net unrealised appreciation/(depreciation) on:- investments 41,366,010.48 36,047,273.99 1,666,179.56 13,301,259.54- unrealised capital gain tax on investments (2) - - - -- options contracts (2) 63,569.20 88,886.48 13,114.68 -- futures contracts (2) 298,689.32 1,680,490.06 35,371.02 177,559.33- forward foreign exchange contracts (1,156,773.27) (680,352.54) (5,962.67) 718,662.68- contracts for difference (2) - - - -- swaps contracts (2) - - - 395,775.33NET INCREASE/(DECREASE) IN NET ASSETS
AS A RESULT OF OPERATIONS 44,965,317.40 42,415,155.48 1,804,390.25 16,183,199.24
EVOLUTION OF THE CAPITALIssue of shares 6,493,588.15 16,085,382.27 3,357,035.67 7,758,105.39Redemption of shares (35,110,584.03) (13,329,727.65) (553,761.77) (15,513,926.16)Dividend paid (14) (5,967,309.66) (4,314,262.70) - -NET ASSETS AT THE END OF THE PERIOD 653,472,899.55 468,360,708.33 19,093,576.82 193,489,942.19
Pramerica Sicav
The accompanying notes form an integral part of these financial statements.
31
Statement of Operations and Changes in Net Assetsfor the period ended June 30, 2019 (continued)
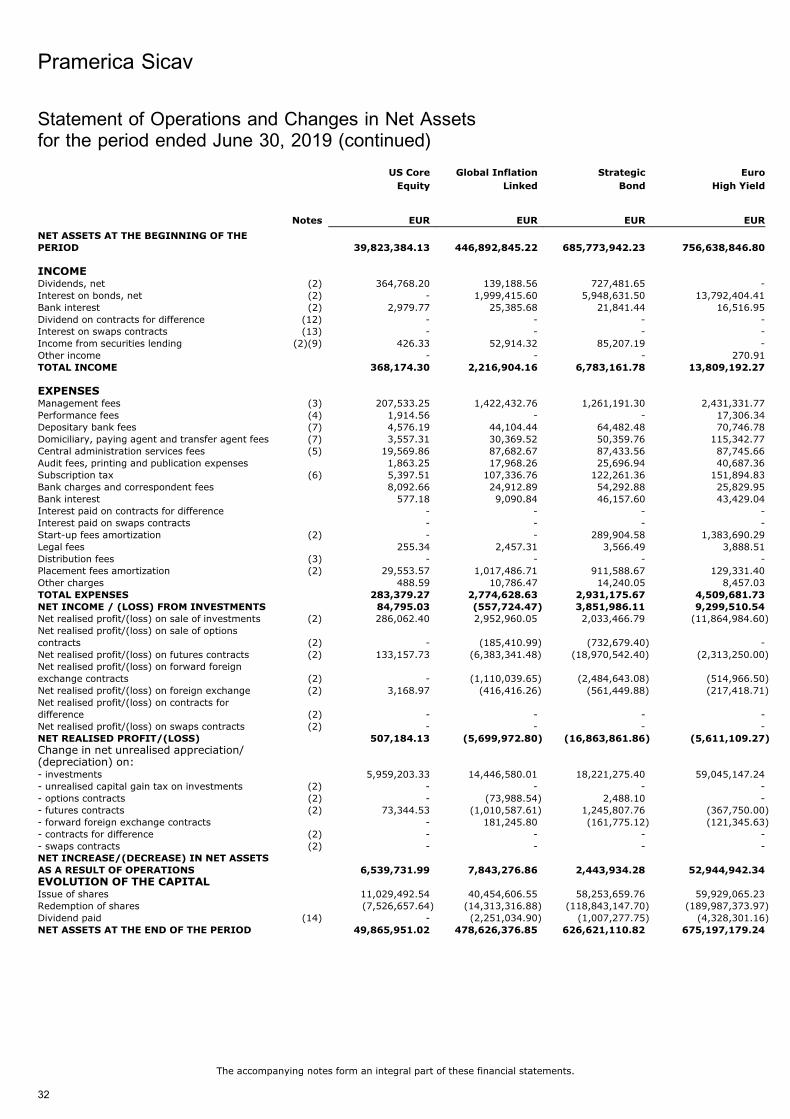
US Core
Equity
Global Inflation
Linked
Strategic
Bond
Euro
High Yield
Notes EUR EUR EUR EUR
NET ASSETS AT THE BEGINNING OF THE
PERIOD 39,823,384.13 446,892,845.22 685,773,942.23 756,638,846.80
INCOMEDividends, net (2) 364,768.20 139,188.56 727,481.65 -Interest on bonds, net (2) - 1,999,415.60 5,948,631.50 13,792,404.41Bank interest (2) 2,979.77 25,385.68 21,841.44 16,516.95Dividend on contracts for difference (12) - - - -Interest on swaps contracts (13) - - - -Income from securities lending (2)(9) 426.33 52,914.32 85,207.19 -Other income - - - 270.91TOTAL INCOME 368,174.30 2,216,904.16 6,783,161.78 13,809,192.27
EXPENSESManagement fees (3) 207,533.25 1,422,432.76 1,261,191.30 2,431,331.77Performance fees (4) 1,914.56 - - 17,306.34Depositary bank fees (7) 4,576.19 44,104.44 64,482.48 70,746.78Domiciliary, paying agent and transfer agent fees (7) 3,557.31 30,369.52 50,359.76 115,342.77Central administration services fees (5) 19,569.86 87,682.67 87,433.56 87,745.66Audit fees, printing and publication expenses 1,863.25 17,968.26 25,696.94 40,687.36Subscription tax (6) 5,397.51 107,336.76 122,261.36 151,894.83Bank charges and correspondent fees 8,092.66 24,912.89 54,292.88 25,829.95Bank interest 577.18 9,090.84 46,157.60 43,429.04Interest paid on contracts for difference - - - -Interest paid on swaps contracts - - - -Start-up fees amortization (2) - - 289,904.58 1,383,690.29Legal fees 255.34 2,457.31 3,566.49 3,888.51Distribution fees (3) - - - -Placement fees amortization (2) 29,553.57 1,017,486.71 911,588.67 129,331.40Other charges 488.59 10,786.47 14,240.05 8,457.03TOTAL EXPENSES 283,379.27 2,774,628.63 2,931,175.67 4,509,681.73
NET INCOME / (LOSS) FROM INVESTMENTS 84,795.03 (557,724.47) 3,851,986.11 9,299,510.54Net realised profit/(loss) on sale of investments (2) 286,062.40 2,952,960.05 2,033,466.79 (11,864,984.60)Net realised profit/(loss) on sale of optionscontracts (2) - (185,410.99) (732,679.40) -Net realised profit/(loss) on futures contracts (2) 133,157.73 (6,383,341.48) (18,970,542.40) (2,313,250.00)Net realised profit/(loss) on forward foreignexchange contracts (2) - (1,110,039.65) (2,484,643.08) (514,966.50)Net realised profit/(loss) on foreign exchange (2) 3,168.97 (416,416.26) (561,449.88) (217,418.71)Net realised profit/(loss) on contracts fordifference (2) - - - -Net realised profit/(loss) on swaps contracts (2) - - - -NET REALISED PROFIT/(LOSS) 507,184.13 (5,699,972.80) (16,863,861.86) (5,611,109.27)
Change in net unrealised appreciation/(depreciation) on:- investments 5,959,203.33 14,446,580.01 18,221,275.40 59,045,147.24- unrealised capital gain tax on investments (2) - - - -- options contracts (2) - (73,988.54) 2,488.10 -- futures contracts (2) 73,344.53 (1,010,587.61) 1,245,807.76 (367,750.00)- forward foreign exchange contracts - 181,245.80 (161,775.12) (121,345.63)- contracts for difference (2) - - - -- swaps contracts (2) - - - -NET INCREASE/(DECREASE) IN NET ASSETS
AS A RESULT OF OPERATIONS 6,539,731.99 7,843,276.86 2,443,934.28 52,944,942.34
EVOLUTION OF THE CAPITALIssue of shares 11,029,492.54 40,454,606.55 58,253,659.76 59,929,065.23Redemption of shares (7,526,657.64) (14,313,316.88) (118,843,147.70) (189,987,373.97)Dividend paid (14) - (2,251,034.90) (1,007,277.75) (4,328,301.16)NET ASSETS AT THE END OF THE PERIOD 49,865,951.02 478,626,376.85 626,621,110.82 675,197,179.24
Pramerica Sicav
The accompanying notes form an integral part of these financial statements.
32
Statement of Operations and Changes in Net Assetsfor the period ended June 30, 2019 (continued)

Italian Mid Cap
Equity
Social 4 Planet Absolute Return
Solution
Global
Infrastructure
Notes EUR EUR EUR EUR
NET ASSETS AT THE BEGINNING OF THE
PERIOD 20,820,927.58 384,841,304.78 194,840,728.37 13,244,716.27
INCOMEDividends, net (2) 512,578.26 2,043,599.66 3,851,753.66 314,042.54Interest on bonds, net (2) 2,327.25 2,192,798.33 2,614,993.23 -Bank interest (2) - 23,821.55 18,063.41 6,081.74Dividend on contracts for difference (12) - - - -Interest on swaps contracts (13) - - - -Income from securities lending (2)(9) 18,850.20 15,974.71 35,265.81 2,333.88Other income - - - -TOTAL INCOME 533,755.71 4,276,194.25 6,520,076.11 322,458.16
EXPENSESManagement fees (3) 76,710.96 2,080,672.54 2,470,724.89 103,811.30Performance fees (4) - - 1,187,636.74 46,175.92Depositary bank fees (7) 2,267.61 47,690.00 47,001.45 1,914.28Domiciliary, paying agent and transfer agent fees (7) 2,064.38 32,677.30 29,842.71 1,619.66Central administration services fees (5) 6,433.78 108,323.62 83,951.06 15,149.19Audit fees, printing and publication expenses 966.18 20,970.73 10,782.47 1,034.37Subscription tax (6) 1,226.87 136,706.06 159,009.67 3,645.67Bank charges and correspondent fees 2,405.76 18,943.36 144,308.20 11,954.61Bank interest 635.05 21,094.72 88,462.72 232.19Interest paid on contracts for difference - - - -Interest paid on swaps contracts - - - -Start-up fees amortization (2) - - - -Legal fees 126.83 2,737.00 2,812.93 109.87Distribution fees (3) - - 125.50 61.51Placement fees amortization (2) - 1,186,659.18 1,289,603.20 28,946.34Other charges 205.83 12,228.24 8,876.66 543.10TOTAL EXPENSES 93,043.25 3,668,702.75 5,523,138.20 215,198.01
NET INCOME / (LOSS) FROM INVESTMENTS 440,712.46 607,491.50 996,937.91 107,260.15Net realised profit/(loss) on sale of investments (2) (224,608.59) 6,568,991.70 837,752.60 238,945.05Net realised profit/(loss) on sale of optionscontracts (2) - - 624,730.00 -Net realised profit/(loss) on futures contracts (2) - (1,111,776.47) (1,044,703.33) -Net realised profit/(loss) on forward foreignexchange contracts (2) - (2,813,451.56) (3,000,573.51) (235.80)Net realised profit/(loss) on foreign exchange (2) (2.31) (894,496.84) (1,284,227.12) 6,707.57Net realised profit/(loss) on contracts fordifference (2) - - - -Net realised profit/(loss) on swaps contracts (2) - - - -NET REALISED PROFIT/(LOSS) 216,101.56 2,356,758.33 (2,870,083.45) 352,676.97
Change in net unrealised appreciation/(depreciation) on:- investments 2,448,033.67 43,536,065.78 18,980,025.22 2,707,691.88- unrealised capital gain tax on investments (2) - - - -- options contracts (2) - - 1,402,072.78 -- futures contracts (2) - (705,138.76) (2,435,444.93) -- forward foreign exchange contracts - 127,718.88 1,255,680.06 -- contracts for difference (2) - - - -- swaps contracts (2) - - - -NET INCREASE/(DECREASE) IN NET ASSETS
AS A RESULT OF OPERATIONS 2,664,135.23 45,315,404.23 16,332,249.68 3,060,368.85
EVOLUTION OF THE CAPITALIssue of shares 3,522,745.35 271,673,983.53 669,872,723.48 10,642,723.05Redemption of shares (276,197.03) (12,717,534.94) (4,122,085.09) (462,295.69)Dividend paid (14) - - - -NET ASSETS AT THE END OF THE PERIOD 26,731,611.13 689,113,157.60 876,923,616.44 26,485,512.48
Pramerica Sicav
The accompanying notes form an integral part of these financial statements.
33
Statement of Operations and Changes in Net Assetsfor the period ended June 30, 2019 (continued)
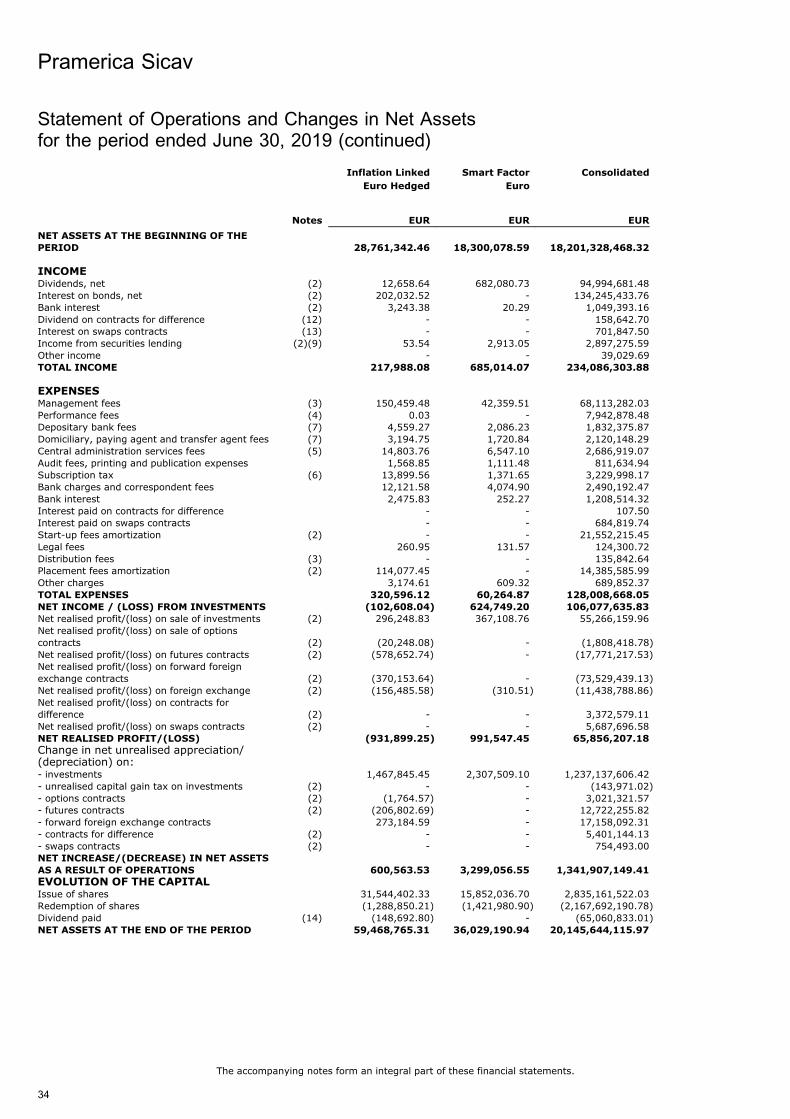
Inflation Linked
Euro Hedged
Smart Factor
Euro
Consolidated
Notes EUR EUR EUR
NET ASSETS AT THE BEGINNING OF THE
PERIOD 28,761,342.46 18,300,078.59 18,201,328,468.32
INCOMEDividends, net (2) 12,658.64 682,080.73 94,994,681.48Interest on bonds, net (2) 202,032.52 - 134,245,433.76Bank interest (2) 3,243.38 20.29 1,049,393.16Dividend on contracts for difference (12) - - 158,642.70Interest on swaps contracts (13) - - 701,847.50Income from securities lending (2)(9) 53.54 2,913.05 2,897,275.59Other income - - 39,029.69TOTAL INCOME 217,988.08 685,014.07 234,086,303.88
EXPENSESManagement fees (3) 150,459.48 42,359.51 68,113,282.03Performance fees (4) 0.03 - 7,942,878.48Depositary bank fees (7) 4,559.27 2,086.23 1,832,375.87Domiciliary, paying agent and transfer agent fees (7) 3,194.75 1,720.84 2,120,148.29Central administration services fees (5) 14,803.76 6,547.10 2,686,919.07Audit fees, printing and publication expenses 1,568.85 1,111.48 811,634.94Subscription tax (6) 13,899.56 1,371.65 3,229,998.17Bank charges and correspondent fees 12,121.58 4,074.90 2,490,192.47Bank interest 2,475.83 252.27 1,208,514.32Interest paid on contracts for difference - - 107.50Interest paid on swaps contracts - - 684,819.74Start-up fees amortization (2) - - 21,552,215.45Legal fees 260.95 131.57 124,300.72Distribution fees (3) - - 135,842.64Placement fees amortization (2) 114,077.45 - 14,385,585.99Other charges 3,174.61 609.32 689,852.37TOTAL EXPENSES 320,596.12 60,264.87 128,008,668.05
NET INCOME / (LOSS) FROM INVESTMENTS (102,608.04) 624,749.20 106,077,635.83Net realised profit/(loss) on sale of investments (2) 296,248.83 367,108.76 55,266,159.96Net realised profit/(loss) on sale of optionscontracts (2) (20,248.08) - (1,808,418.78)Net realised profit/(loss) on futures contracts (2) (578,652.74) - (17,771,217.53)Net realised profit/(loss) on forward foreignexchange contracts (2) (370,153.64) - (73,529,439.13)Net realised profit/(loss) on foreign exchange (2) (156,485.58) (310.51) (11,438,788.86)Net realised profit/(loss) on contracts fordifference (2) - - 3,372,579.11Net realised profit/(loss) on swaps contracts (2) - - 5,687,696.58NET REALISED PROFIT/(LOSS) (931,899.25) 991,547.45 65,856,207.18
Change in net unrealised appreciation/(depreciation) on:- investments 1,467,845.45 2,307,509.10 1,237,137,606.42- unrealised capital gain tax on investments (2) - - (143,971.02)- options contracts (2) (1,764.57) - 3,021,321.57- futures contracts (2) (206,802.69) - 12,722,255.82- forward foreign exchange contracts 273,184.59 - 17,158,092.31- contracts for difference (2) - - 5,401,144.13- swaps contracts (2) - - 754,493.00NET INCREASE/(DECREASE) IN NET ASSETS
AS A RESULT OF OPERATIONS 600,563.53 3,299,056.55 1,341,907,149.41
EVOLUTION OF THE CAPITALIssue of shares 31,544,402.33 15,852,036.70 2,835,161,522.03Redemption of shares (1,288,850.21) (1,421,980.90) (2,167,692,190.78)Dividend paid (14) (148,692.80) - (65,060,833.01)NET ASSETS AT THE END OF THE PERIOD 59,468,765.31 36,029,190.94 20,145,644,115.97
Pramerica Sicav
The accompanying notes form an integral part of these financial statements.
34
Statement of Operations and Changes in Net Assetsfor the period ended June 30, 2019 (continued)
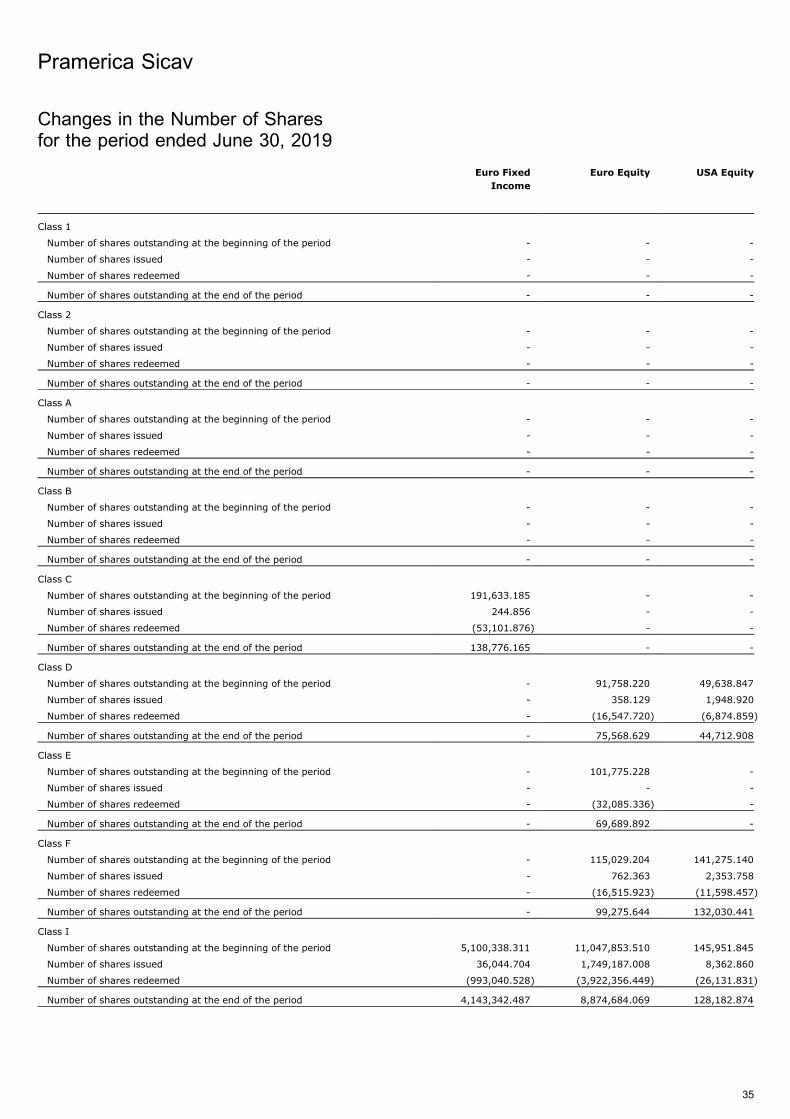
Changes in the Number of Sharesfor the period ended June 30, 2019
Euro Fixed
Income
Euro Equity USA Equity
Class 1
Number of shares outstanding at the beginning of the period - - -
Number of shares issued - - -
Number of shares redeemed - - -
Number of shares outstanding at the end of the period - - -
Class 2
Number of shares outstanding at the beginning of the period - - -
Number of shares issued - - -
Number of shares redeemed - - -
Number of shares outstanding at the end of the period - - -
Class A
Number of shares outstanding at the beginning of the period - - -
Number of shares issued - - -
Number of shares redeemed - - -
Number of shares outstanding at the end of the period - - -
Class B
Number of shares outstanding at the beginning of the period - - -
Number of shares issued - - -
Number of shares redeemed - - -
Number of shares outstanding at the end of the period - - -
Class C
Number of shares outstanding at the beginning of the period 191,633.185 - -
Number of shares issued 244.856 - -
Number of shares redeemed (53,101.876) - -
Number of shares outstanding at the end of the period 138,776.165 - -
Class D
Number of shares outstanding at the beginning of the period - 91,758.220 49,638.847
Number of shares issued - 358.129 1,948.920
Number of shares redeemed - (16,547.720) (6,874.859)
Number of shares outstanding at the end of the period - 75,568.629 44,712.908
Class E
Number of shares outstanding at the beginning of the period - 101,775.228 -
Number of shares issued - - -
Number of shares redeemed - (32,085.336) -
Number of shares outstanding at the end of the period - 69,689.892 -
Class F
Number of shares outstanding at the beginning of the period - 115,029.204 141,275.140
Number of shares issued - 762.363 2,353.758
Number of shares redeemed - (16,515.923) (11,598.457)
Number of shares outstanding at the end of the period - 99,275.644 132,030.441
Class I
Number of shares outstanding at the beginning of the period 5,100,338.311 11,047,853.510 145,951.845
Number of shares issued 36,044.704 1,749,187.008 8,362.860
Number of shares redeemed (993,040.528) (3,922,356.449) (26,131.831)
Number of shares outstanding at the end of the period 4,143,342.487 8,874,684.069 128,182.874
Pramerica Sicav
35
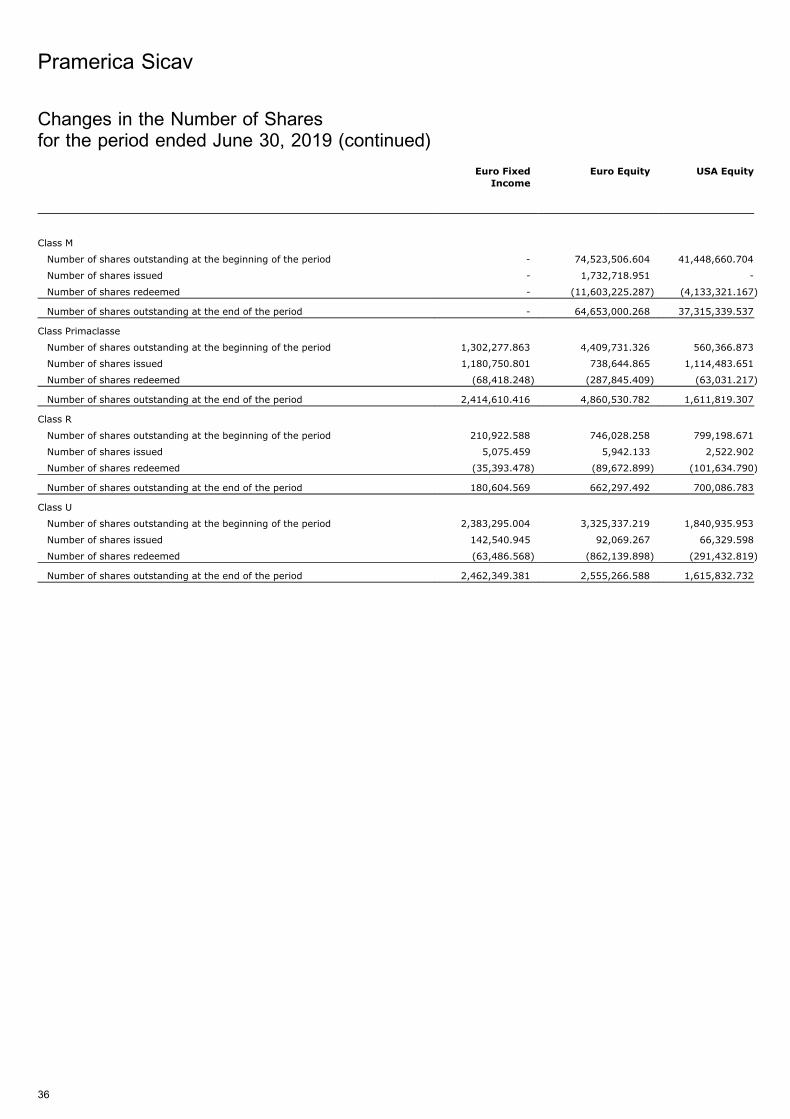
Euro Fixed
Income
Euro Equity USA Equity
Class M
Number of shares outstanding at the beginning of the period - 74,523,506.604 41,448,660.704
Number of shares issued - 1,732,718.951 -
Number of shares redeemed - (11,603,225.287) (4,133,321.167)
Number of shares outstanding at the end of the period - 64,653,000.268 37,315,339.537
Class Primaclasse
Number of shares outstanding at the beginning of the period 1,302,277.863 4,409,731.326 560,366.873
Number of shares issued 1,180,750.801 738,644.865 1,114,483.651
Number of shares redeemed (68,418.248) (287,845.409) (63,031.217)
Number of shares outstanding at the end of the period 2,414,610.416 4,860,530.782 1,611,819.307
Class R
Number of shares outstanding at the beginning of the period 210,922.588 746,028.258 799,198.671
Number of shares issued 5,075.459 5,942.133 2,522.902
Number of shares redeemed (35,393.478) (89,672.899) (101,634.790)
Number of shares outstanding at the end of the period 180,604.569 662,297.492 700,086.783
Class U
Number of shares outstanding at the beginning of the period 2,383,295.004 3,325,337.219 1,840,935.953
Number of shares issued 142,540.945 92,069.267 66,329.598
Number of shares redeemed (63,486.568) (862,139.898) (291,432.819)
Number of shares outstanding at the end of the period 2,462,349.381 2,555,266.588 1,615,832.732
Pramerica Sicav
36
Changes in the Number of Sharesfor the period ended June 30, 2019 (continued)
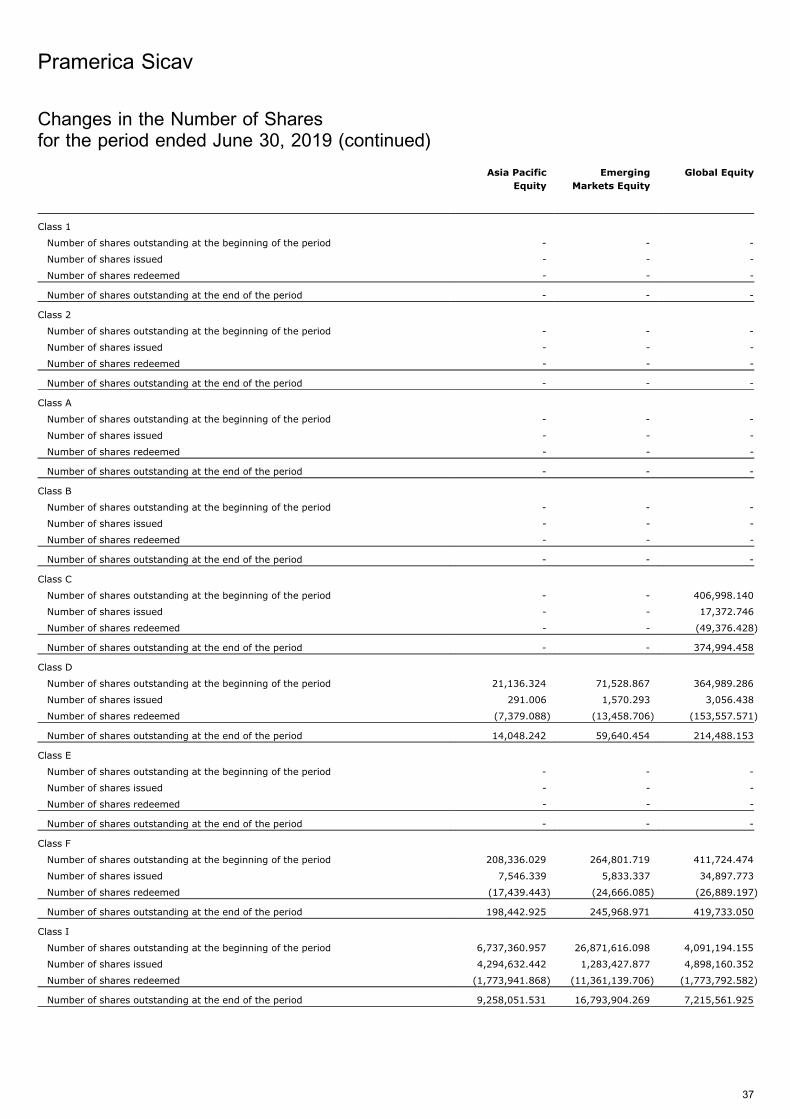
Asia Pacific
Equity
Emerging
Markets Equity
Global Equity
Class 1
Number of shares outstanding at the beginning of the period - - -
Number of shares issued - - -
Number of shares redeemed - - -
Number of shares outstanding at the end of the period - - -
Class 2
Number of shares outstanding at the beginning of the period - - -
Number of shares issued - - -
Number of shares redeemed - - -
Number of shares outstanding at the end of the period - - -
Class A
Number of shares outstanding at the beginning of the period - - -
Number of shares issued - - -
Number of shares redeemed - - -
Number of shares outstanding at the end of the period - - -
Class B
Number of shares outstanding at the beginning of the period - - -
Number of shares issued - - -
Number of shares redeemed - - -
Number of shares outstanding at the end of the period - - -
Class C
Number of shares outstanding at the beginning of the period - - 406,998.140
Number of shares issued - - 17,372.746
Number of shares redeemed - - (49,376.428)
Number of shares outstanding at the end of the period - - 374,994.458
Class D
Number of shares outstanding at the beginning of the period 21,136.324 71,528.867 364,989.286
Number of shares issued 291.006 1,570.293 3,056.438
Number of shares redeemed (7,379.088) (13,458.706) (153,557.571)
Number of shares outstanding at the end of the period 14,048.242 59,640.454 214,488.153
Class E
Number of shares outstanding at the beginning of the period - - -
Number of shares issued - - -
Number of shares redeemed - - -
Number of shares outstanding at the end of the period - - -
Class F
Number of shares outstanding at the beginning of the period 208,336.029 264,801.719 411,724.474
Number of shares issued 7,546.339 5,833.337 34,897.773
Number of shares redeemed (17,439.443) (24,666.085) (26,889.197)
Number of shares outstanding at the end of the period 198,442.925 245,968.971 419,733.050
Class I
Number of shares outstanding at the beginning of the period 6,737,360.957 26,871,616.098 4,091,194.155
Number of shares issued 4,294,632.442 1,283,427.877 4,898,160.352
Number of shares redeemed (1,773,941.868) (11,361,139.706) (1,773,792.582)
Number of shares outstanding at the end of the period 9,258,051.531 16,793,904.269 7,215,561.925
Pramerica Sicav
37
Changes in the Number of Sharesfor the period ended June 30, 2019 (continued)
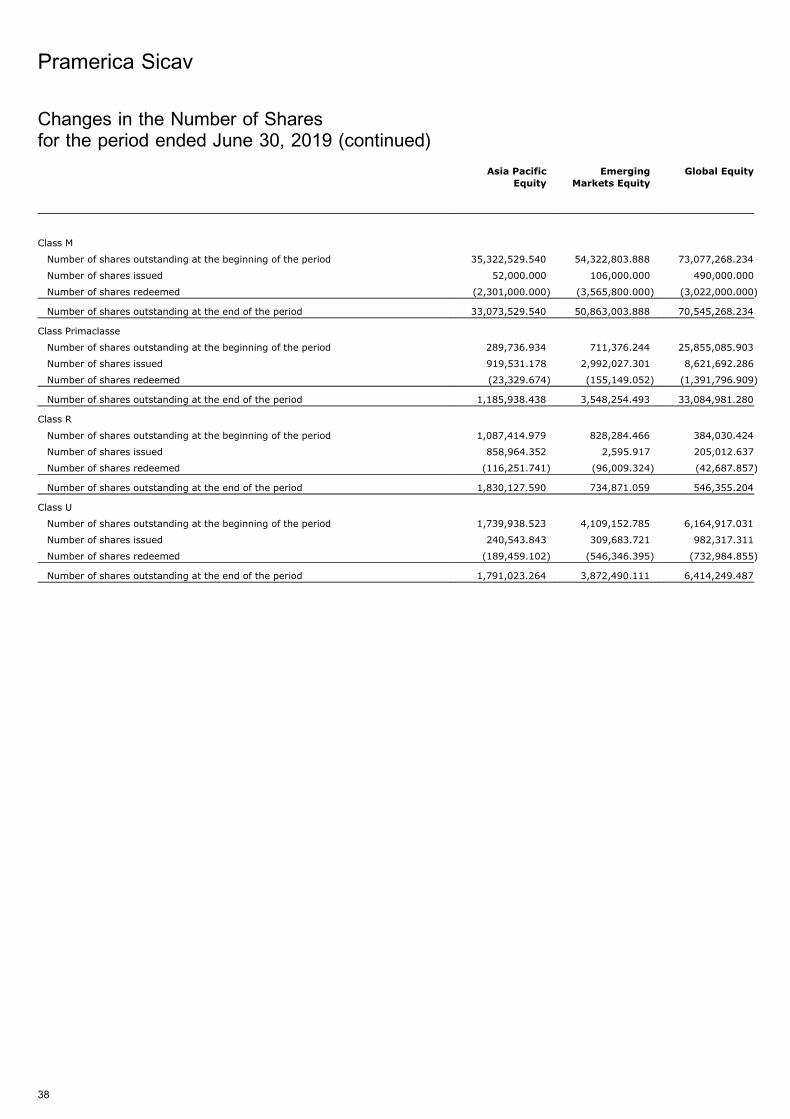
Asia Pacific
Equity
Emerging
Markets Equity
Global Equity
Class M
Number of shares outstanding at the beginning of the period 35,322,529.540 54,322,803.888 73,077,268.234
Number of shares issued 52,000.000 106,000.000 490,000.000
Number of shares redeemed (2,301,000.000) (3,565,800.000) (3,022,000.000)
Number of shares outstanding at the end of the period 33,073,529.540 50,863,003.888 70,545,268.234
Class Primaclasse
Number of shares outstanding at the beginning of the period 289,736.934 711,376.244 25,855,085.903
Number of shares issued 919,531.178 2,992,027.301 8,621,692.286
Number of shares redeemed (23,329.674) (155,149.052) (1,391,796.909)
Number of shares outstanding at the end of the period 1,185,938.438 3,548,254.493 33,084,981.280
Class R
Number of shares outstanding at the beginning of the period 1,087,414.979 828,284.466 384,030.424
Number of shares issued 858,964.352 2,595.917 205,012.637
Number of shares redeemed (116,251.741) (96,009.324) (42,687.857)
Number of shares outstanding at the end of the period 1,830,127.590 734,871.059 546,355.204
Class U
Number of shares outstanding at the beginning of the period 1,739,938.523 4,109,152.785 6,164,917.031
Number of shares issued 240,543.843 309,683.721 982,317.311
Number of shares redeemed (189,459.102) (546,346.395) (732,984.855)
Number of shares outstanding at the end of the period 1,791,023.264 3,872,490.111 6,414,249.487
Pramerica Sicav
38
Changes in the Number of Sharesfor the period ended June 30, 2019 (continued)
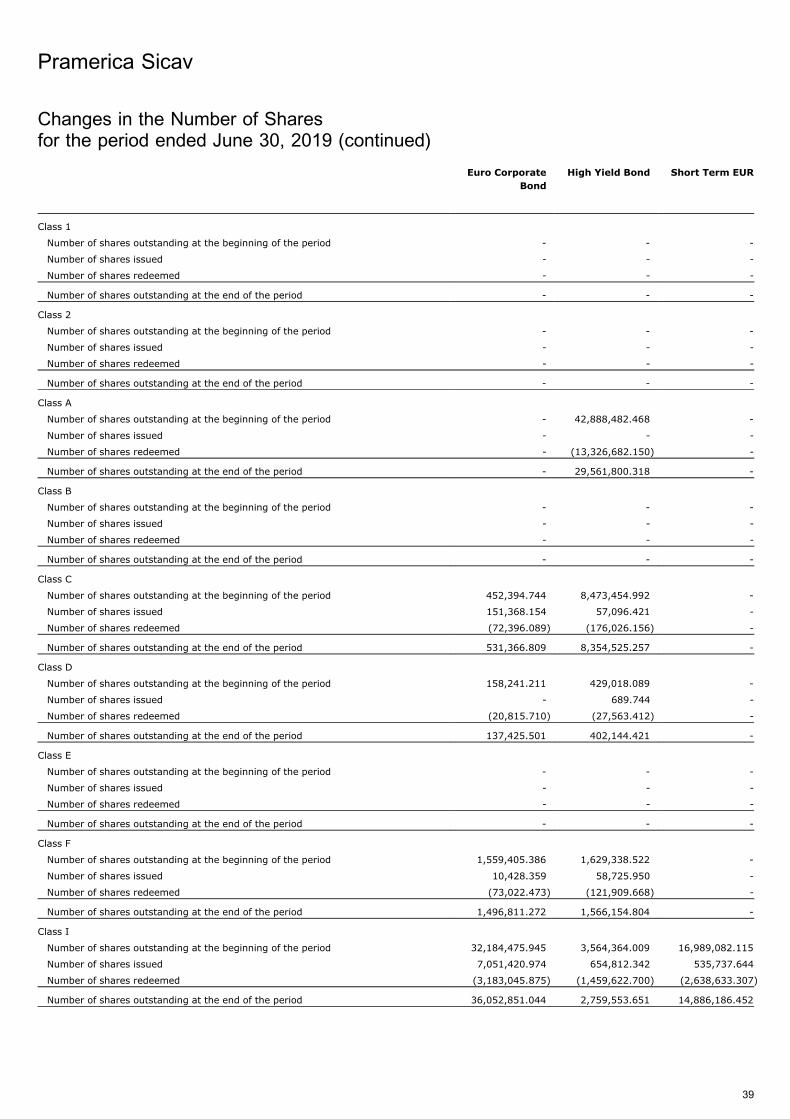
Euro Corporate
Bond
High Yield Bond Short Term EUR
Class 1
Number of shares outstanding at the beginning of the period - - -
Number of shares issued - - -
Number of shares redeemed - - -
Number of shares outstanding at the end of the period - - -
Class 2
Number of shares outstanding at the beginning of the period - - -
Number of shares issued - - -
Number of shares redeemed - - -
Number of shares outstanding at the end of the period - - -
Class A
Number of shares outstanding at the beginning of the period - 42,888,482.468 -
Number of shares issued - - -
Number of shares redeemed - (13,326,682.150) -
Number of shares outstanding at the end of the period - 29,561,800.318 -
Class B
Number of shares outstanding at the beginning of the period - - -
Number of shares issued - - -
Number of shares redeemed - - -
Number of shares outstanding at the end of the period - - -
Class C
Number of shares outstanding at the beginning of the period 452,394.744 8,473,454.992 -
Number of shares issued 151,368.154 57,096.421 -
Number of shares redeemed (72,396.089) (176,026.156) -
Number of shares outstanding at the end of the period 531,366.809 8,354,525.257 -
Class D
Number of shares outstanding at the beginning of the period 158,241.211 429,018.089 -
Number of shares issued - 689.744 -
Number of shares redeemed (20,815.710) (27,563.412) -
Number of shares outstanding at the end of the period 137,425.501 402,144.421 -
Class E
Number of shares outstanding at the beginning of the period - - -
Number of shares issued - - -
Number of shares redeemed - - -
Number of shares outstanding at the end of the period - - -
Class F
Number of shares outstanding at the beginning of the period 1,559,405.386 1,629,338.522 -
Number of shares issued 10,428.359 58,725.950 -
Number of shares redeemed (73,022.473) (121,909.668) -
Number of shares outstanding at the end of the period 1,496,811.272 1,566,154.804 -
Class I
Number of shares outstanding at the beginning of the period 32,184,475.945 3,564,364.009 16,989,082.115
Number of shares issued 7,051,420.974 654,812.342 535,737.644
Number of shares redeemed (3,183,045.875) (1,459,622.700) (2,638,633.307)
Number of shares outstanding at the end of the period 36,052,851.044 2,759,553.651 14,886,186.452
Pramerica Sicav
39
Changes in the Number of Sharesfor the period ended June 30, 2019 (continued)
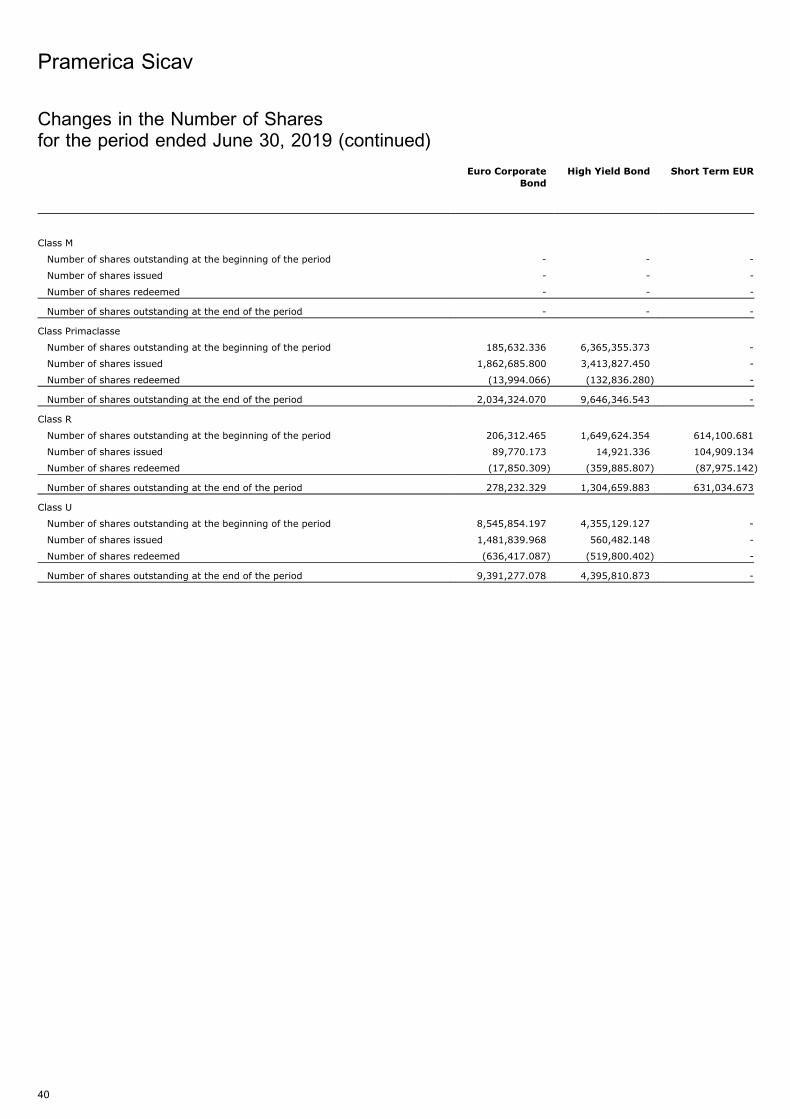
Euro Corporate
Bond
High Yield Bond Short Term EUR
Class M
Number of shares outstanding at the beginning of the period - - -
Number of shares issued - - -
Number of shares redeemed - - -
Number of shares outstanding at the end of the period - - -
Class Primaclasse
Number of shares outstanding at the beginning of the period 185,632.336 6,365,355.373 -
Number of shares issued 1,862,685.800 3,413,827.450 -
Number of shares redeemed (13,994.066) (132,836.280) -
Number of shares outstanding at the end of the period 2,034,324.070 9,646,346.543 -
Class R
Number of shares outstanding at the beginning of the period 206,312.465 1,649,624.354 614,100.681
Number of shares issued 89,770.173 14,921.336 104,909.134
Number of shares redeemed (17,850.309) (359,885.807) (87,975.142)
Number of shares outstanding at the end of the period 278,232.329 1,304,659.883 631,034.673
Class U
Number of shares outstanding at the beginning of the period 8,545,854.197 4,355,129.127 -
Number of shares issued 1,481,839.968 560,482.148 -
Number of shares redeemed (636,417.087) (519,800.402) -
Number of shares outstanding at the end of the period 9,391,277.078 4,395,810.873 -
Pramerica Sicav
40
Changes in the Number of Sharesfor the period ended June 30, 2019 (continued)
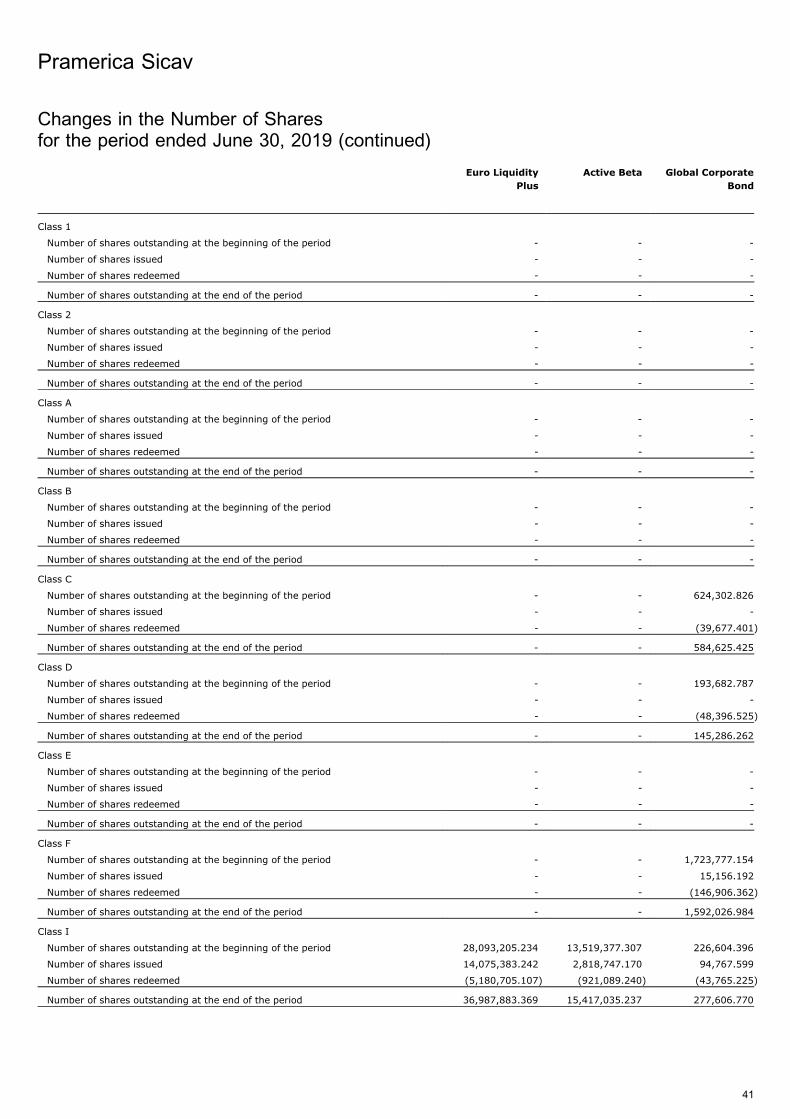
Euro Liquidity
Plus
Active Beta Global Corporate
Bond
Class 1
Number of shares outstanding at the beginning of the period - - -
Number of shares issued - - -
Number of shares redeemed - - -
Number of shares outstanding at the end of the period - - -
Class 2
Number of shares outstanding at the beginning of the period - - -
Number of shares issued - - -
Number of shares redeemed - - -
Number of shares outstanding at the end of the period - - -
Class A
Number of shares outstanding at the beginning of the period - - -
Number of shares issued - - -
Number of shares redeemed - - -
Number of shares outstanding at the end of the period - - -
Class B
Number of shares outstanding at the beginning of the period - - -
Number of shares issued - - -
Number of shares redeemed - - -
Number of shares outstanding at the end of the period - - -
Class C
Number of shares outstanding at the beginning of the period - - 624,302.826
Number of shares issued - - -
Number of shares redeemed - - (39,677.401)
Number of shares outstanding at the end of the period - - 584,625.425
Class D
Number of shares outstanding at the beginning of the period - - 193,682.787
Number of shares issued - - -
Number of shares redeemed - - (48,396.525)
Number of shares outstanding at the end of the period - - 145,286.262
Class E
Number of shares outstanding at the beginning of the period - - -
Number of shares issued - - -
Number of shares redeemed - - -
Number of shares outstanding at the end of the period - - -
Class F
Number of shares outstanding at the beginning of the period - - 1,723,777.154
Number of shares issued - - 15,156.192
Number of shares redeemed - - (146,906.362)
Number of shares outstanding at the end of the period - - 1,592,026.984
Class I
Number of shares outstanding at the beginning of the period 28,093,205.234 13,519,377.307 226,604.396
Number of shares issued 14,075,383.242 2,818,747.170 94,767.599
Number of shares redeemed (5,180,705.107) (921,089.240) (43,765.225)
Number of shares outstanding at the end of the period 36,987,883.369 15,417,035.237 277,606.770
Pramerica Sicav
41
Changes in the Number of Sharesfor the period ended June 30, 2019 (continued)
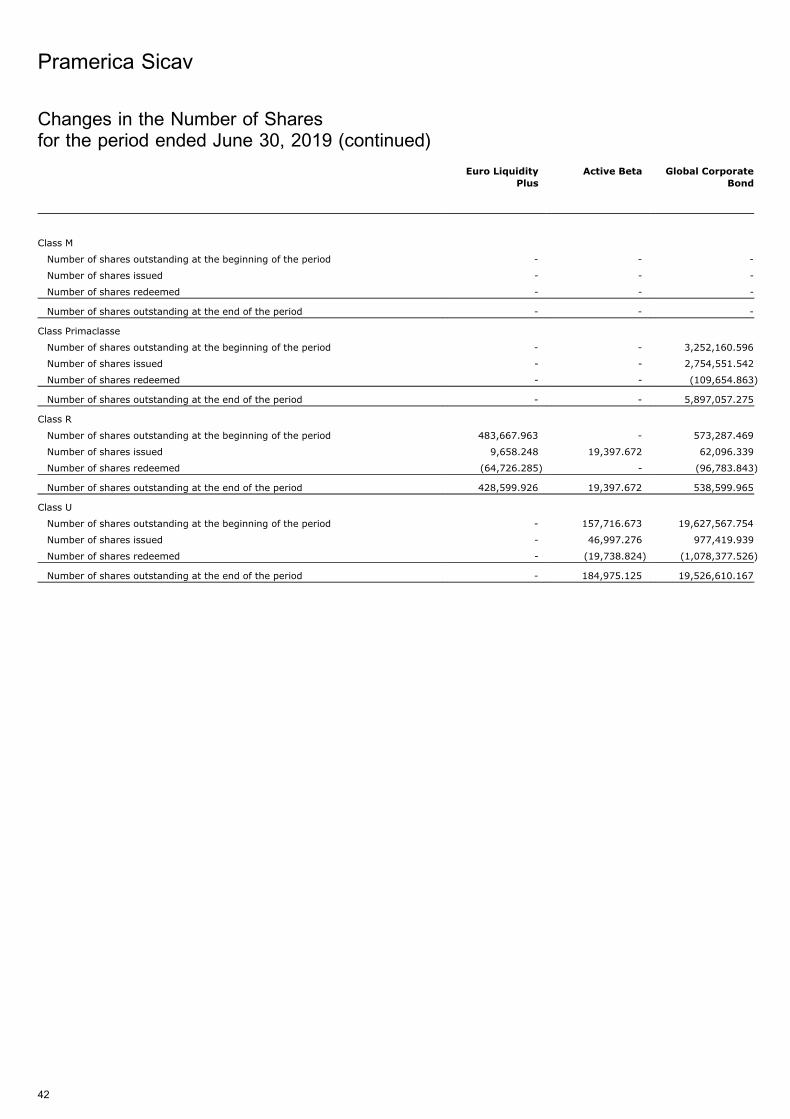
Euro Liquidity
Plus
Active Beta Global Corporate
Bond
Class M
Number of shares outstanding at the beginning of the period - - -
Number of shares issued - - -
Number of shares redeemed - - -
Number of shares outstanding at the end of the period - - -
Class Primaclasse
Number of shares outstanding at the beginning of the period - - 3,252,160.596
Number of shares issued - - 2,754,551.542
Number of shares redeemed - - (109,654.863)
Number of shares outstanding at the end of the period - - 5,897,057.275
Class R
Number of shares outstanding at the beginning of the period 483,667.963 - 573,287.469
Number of shares issued 9,658.248 19,397.672 62,096.339
Number of shares redeemed (64,726.285) - (96,783.843)
Number of shares outstanding at the end of the period 428,599.926 19,397.672 538,599.965
Class U
Number of shares outstanding at the beginning of the period - 157,716.673 19,627,567.754
Number of shares issued - 46,997.276 977,419.939
Number of shares redeemed - (19,738.824) (1,078,377.526)
Number of shares outstanding at the end of the period - 184,975.125 19,526,610.167
Pramerica Sicav
42
Changes in the Number of Sharesfor the period ended June 30, 2019 (continued)
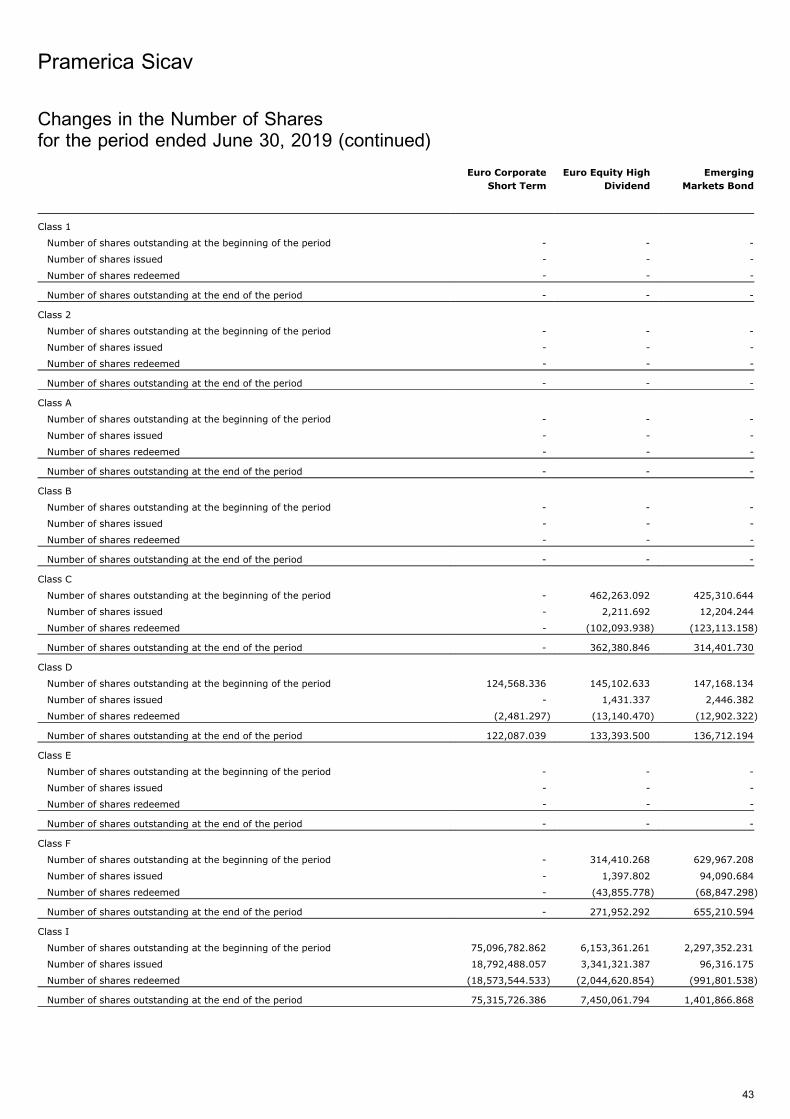
Euro Corporate
Short Term
Euro Equity High
Dividend
Emerging
Markets Bond
Class 1
Number of shares outstanding at the beginning of the period - - -
Number of shares issued - - -
Number of shares redeemed - - -
Number of shares outstanding at the end of the period - - -
Class 2
Number of shares outstanding at the beginning of the period - - -
Number of shares issued - - -
Number of shares redeemed - - -
Number of shares outstanding at the end of the period - - -
Class A
Number of shares outstanding at the beginning of the period - - -
Number of shares issued - - -
Number of shares redeemed - - -
Number of shares outstanding at the end of the period - - -
Class B
Number of shares outstanding at the beginning of the period - - -
Number of shares issued - - -
Number of shares redeemed - - -
Number of shares outstanding at the end of the period - - -
Class C
Number of shares outstanding at the beginning of the period - 462,263.092 425,310.644
Number of shares issued - 2,211.692 12,204.244
Number of shares redeemed - (102,093.938) (123,113.158)
Number of shares outstanding at the end of the period - 362,380.846 314,401.730
Class D
Number of shares outstanding at the beginning of the period 124,568.336 145,102.633 147,168.134
Number of shares issued - 1,431.337 2,446.382
Number of shares redeemed (2,481.297) (13,140.470) (12,902.322)
Number of shares outstanding at the end of the period 122,087.039 133,393.500 136,712.194
Class E
Number of shares outstanding at the beginning of the period - - -
Number of shares issued - - -
Number of shares redeemed - - -
Number of shares outstanding at the end of the period - - -
Class F
Number of shares outstanding at the beginning of the period - 314,410.268 629,967.208
Number of shares issued - 1,397.802 94,090.684
Number of shares redeemed - (43,855.778) (68,847.298)
Number of shares outstanding at the end of the period - 271,952.292 655,210.594
Class I
Number of shares outstanding at the beginning of the period 75,096,782.862 6,153,361.261 2,297,352.231
Number of shares issued 18,792,488.057 3,341,321.387 96,316.175
Number of shares redeemed (18,573,544.533) (2,044,620.854) (991,801.538)
Number of shares outstanding at the end of the period 75,315,726.386 7,450,061.794 1,401,866.868
Pramerica Sicav
43
Changes in the Number of Sharesfor the period ended June 30, 2019 (continued)
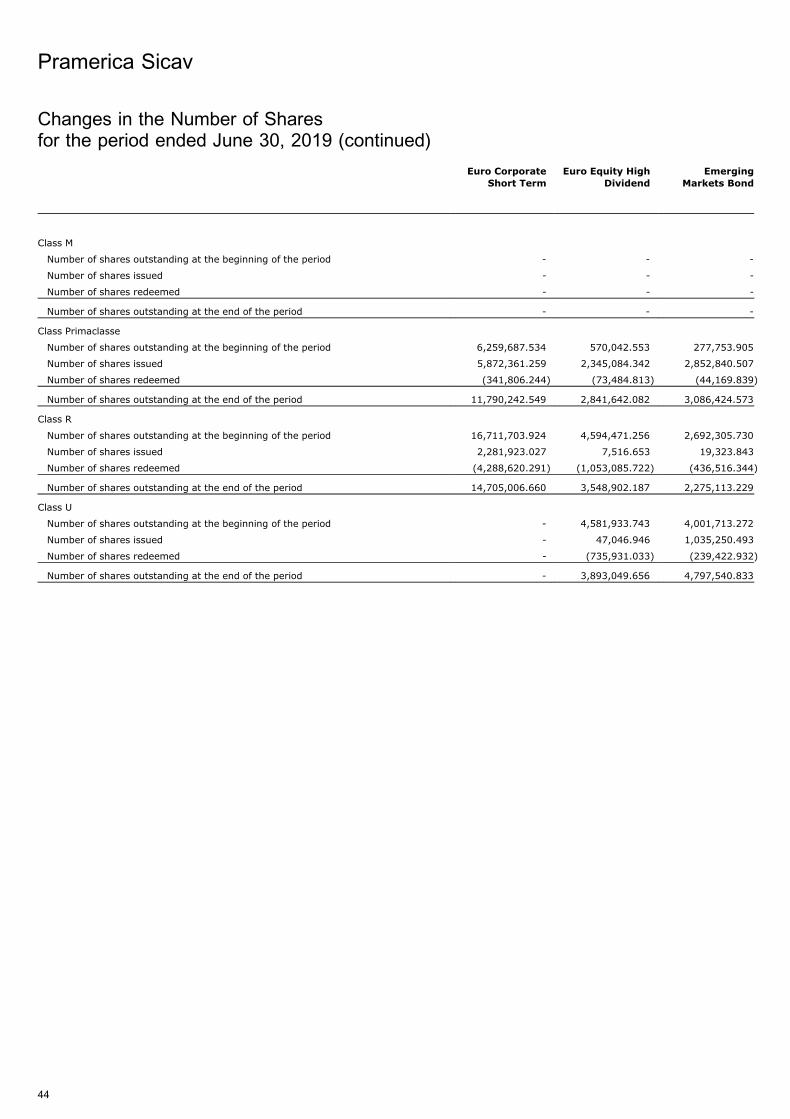
Euro Corporate
Short Term
Euro Equity High
Dividend
Emerging
Markets Bond
Class M
Number of shares outstanding at the beginning of the period - - -
Number of shares issued - - -
Number of shares redeemed - - -
Number of shares outstanding at the end of the period - - -
Class Primaclasse
Number of shares outstanding at the beginning of the period 6,259,687.534 570,042.553 277,753.905
Number of shares issued 5,872,361.259 2,345,084.342 2,852,840.507
Number of shares redeemed (341,806.244) (73,484.813) (44,169.839)
Number of shares outstanding at the end of the period 11,790,242.549 2,841,642.082 3,086,424.573
Class R
Number of shares outstanding at the beginning of the period 16,711,703.924 4,594,471.256 2,692,305.730
Number of shares issued 2,281,923.027 7,516.653 19,323.843
Number of shares redeemed (4,288,620.291) (1,053,085.722) (436,516.344)
Number of shares outstanding at the end of the period 14,705,006.660 3,548,902.187 2,275,113.229
Class U
Number of shares outstanding at the beginning of the period - 4,581,933.743 4,001,713.272
Number of shares issued - 47,046.946 1,035,250.493
Number of shares redeemed - (735,931.033) (239,422.932)
Number of shares outstanding at the end of the period - 3,893,049.656 4,797,540.833
Pramerica Sicav
44
Changes in the Number of Sharesfor the period ended June 30, 2019 (continued)
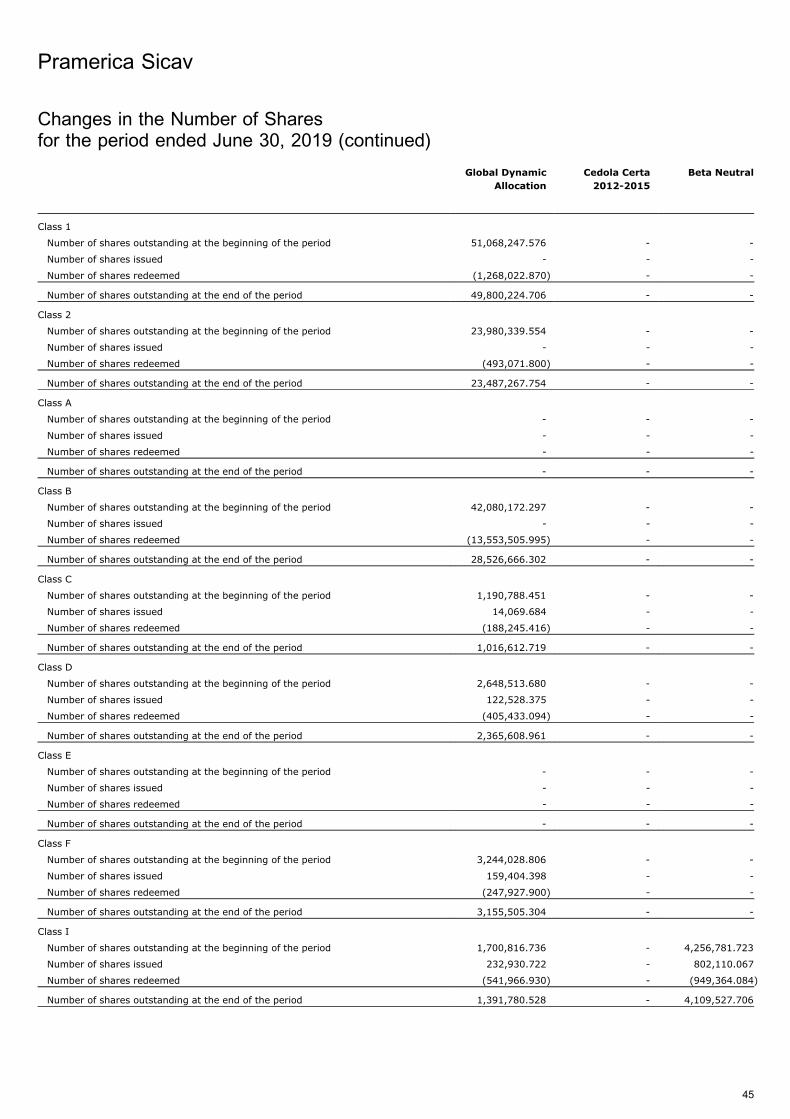
Global Dynamic
Allocation
Cedola Certa
2012-2015
Beta Neutral
Class 1
Number of shares outstanding at the beginning of the period 51,068,247.576 - -
Number of shares issued - - -
Number of shares redeemed (1,268,022.870) - -
Number of shares outstanding at the end of the period 49,800,224.706 - -
Class 2
Number of shares outstanding at the beginning of the period 23,980,339.554 - -
Number of shares issued - - -
Number of shares redeemed (493,071.800) - -
Number of shares outstanding at the end of the period 23,487,267.754 - -
Class A
Number of shares outstanding at the beginning of the period - - -
Number of shares issued - - -
Number of shares redeemed - - -
Number of shares outstanding at the end of the period - - -
Class B
Number of shares outstanding at the beginning of the period 42,080,172.297 - -
Number of shares issued - - -
Number of shares redeemed (13,553,505.995) - -
Number of shares outstanding at the end of the period 28,526,666.302 - -
Class C
Number of shares outstanding at the beginning of the period 1,190,788.451 - -
Number of shares issued 14,069.684 - -
Number of shares redeemed (188,245.416) - -
Number of shares outstanding at the end of the period 1,016,612.719 - -
Class D
Number of shares outstanding at the beginning of the period 2,648,513.680 - -
Number of shares issued 122,528.375 - -
Number of shares redeemed (405,433.094) - -
Number of shares outstanding at the end of the period 2,365,608.961 - -
Class E
Number of shares outstanding at the beginning of the period - - -
Number of shares issued - - -
Number of shares redeemed - - -
Number of shares outstanding at the end of the period - - -
Class F
Number of shares outstanding at the beginning of the period 3,244,028.806 - -
Number of shares issued 159,404.398 - -
Number of shares redeemed (247,927.900) - -
Number of shares outstanding at the end of the period 3,155,505.304 - -
Class I
Number of shares outstanding at the beginning of the period 1,700,816.736 - 4,256,781.723
Number of shares issued 232,930.722 - 802,110.067
Number of shares redeemed (541,966.930) - (949,364.084)
Number of shares outstanding at the end of the period 1,391,780.528 - 4,109,527.706
Pramerica Sicav
45
Changes in the Number of Sharesfor the period ended June 30, 2019 (continued)
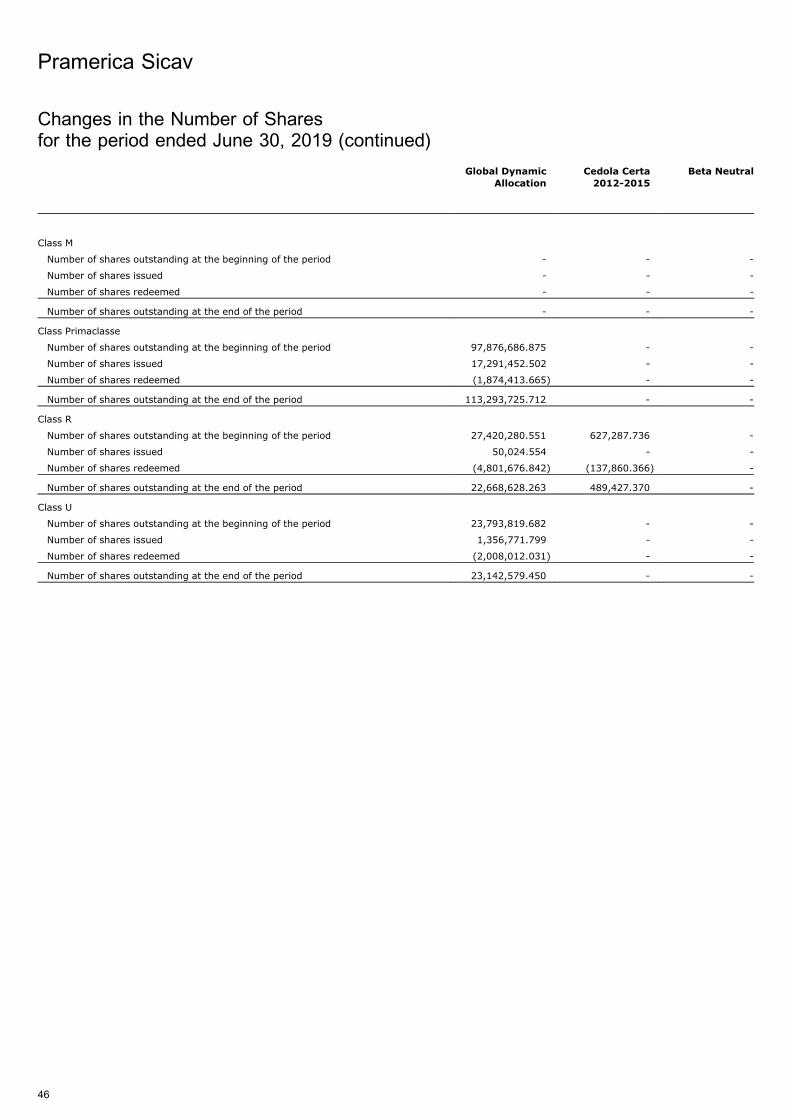
Global Dynamic
Allocation
Cedola Certa
2012-2015
Beta Neutral
Class M
Number of shares outstanding at the beginning of the period - - -
Number of shares issued - - -
Number of shares redeemed - - -
Number of shares outstanding at the end of the period - - -
Class Primaclasse
Number of shares outstanding at the beginning of the period 97,876,686.875 - -
Number of shares issued 17,291,452.502 - -
Number of shares redeemed (1,874,413.665) - -
Number of shares outstanding at the end of the period 113,293,725.712 - -
Class R
Number of shares outstanding at the beginning of the period 27,420,280.551 627,287.736 -
Number of shares issued 50,024.554 - -
Number of shares redeemed (4,801,676.842) (137,860.366) -
Number of shares outstanding at the end of the period 22,668,628.263 489,427.370 -
Class U
Number of shares outstanding at the beginning of the period 23,793,819.682 - -
Number of shares issued 1,356,771.799 - -
Number of shares redeemed (2,008,012.031) - -
Number of shares outstanding at the end of the period 23,142,579.450 - -
Pramerica Sicav
46
Changes in the Number of Sharesfor the period ended June 30, 2019 (continued)
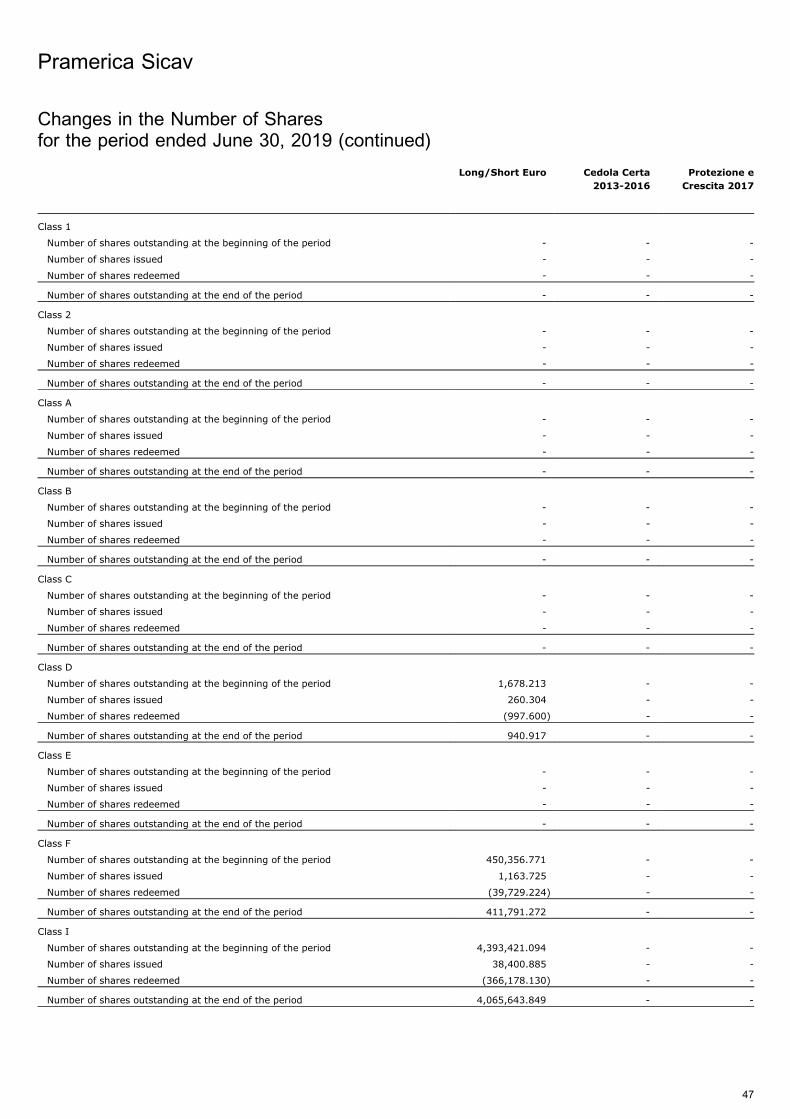
Long/Short Euro Cedola Certa
2013-2016
Protezione e
Crescita 2017
Class 1
Number of shares outstanding at the beginning of the period - - -
Number of shares issued - - -
Number of shares redeemed - - -
Number of shares outstanding at the end of the period - - -
Class 2
Number of shares outstanding at the beginning of the period - - -
Number of shares issued - - -
Number of shares redeemed - - -
Number of shares outstanding at the end of the period - - -
Class A
Number of shares outstanding at the beginning of the period - - -
Number of shares issued - - -
Number of shares redeemed - - -
Number of shares outstanding at the end of the period - - -
Class B
Number of shares outstanding at the beginning of the period - - -
Number of shares issued - - -
Number of shares redeemed - - -
Number of shares outstanding at the end of the period - - -
Class C
Number of shares outstanding at the beginning of the period - - -
Number of shares issued - - -
Number of shares redeemed - - -
Number of shares outstanding at the end of the period - - -
Class D
Number of shares outstanding at the beginning of the period 1,678.213 - -
Number of shares issued 260.304 - -
Number of shares redeemed (997.600) - -
Number of shares outstanding at the end of the period 940.917 - -
Class E
Number of shares outstanding at the beginning of the period - - -
Number of shares issued - - -
Number of shares redeemed - - -
Number of shares outstanding at the end of the period - - -
Class F
Number of shares outstanding at the beginning of the period 450,356.771 - -
Number of shares issued 1,163.725 - -
Number of shares redeemed (39,729.224) - -
Number of shares outstanding at the end of the period 411,791.272 - -
Class I
Number of shares outstanding at the beginning of the period 4,393,421.094 - -
Number of shares issued 38,400.885 - -
Number of shares redeemed (366,178.130) - -
Number of shares outstanding at the end of the period 4,065,643.849 - -
Pramerica Sicav
47
Changes in the Number of Sharesfor the period ended June 30, 2019 (continued)
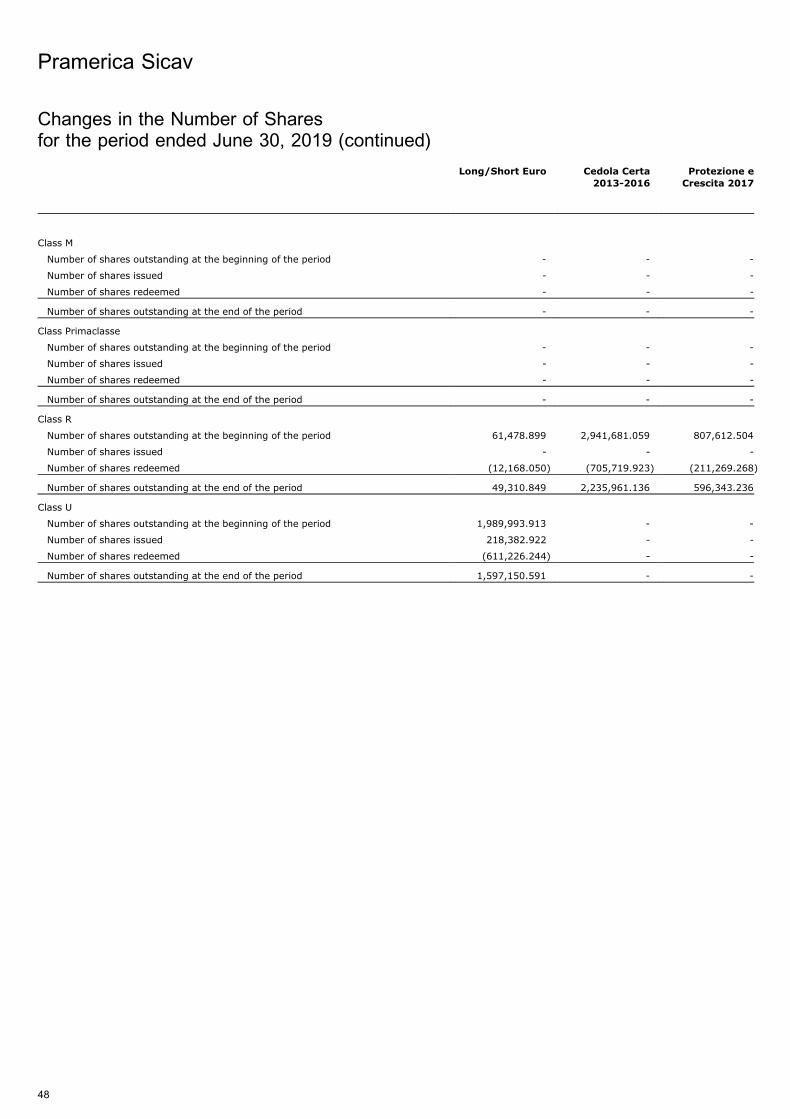
Long/Short Euro Cedola Certa
2013-2016
Protezione e
Crescita 2017
Class M
Number of shares outstanding at the beginning of the period - - -
Number of shares issued - - -
Number of shares redeemed - - -
Number of shares outstanding at the end of the period - - -
Class Primaclasse
Number of shares outstanding at the beginning of the period - - -
Number of shares issued - - -
Number of shares redeemed - - -
Number of shares outstanding at the end of the period - - -
Class R
Number of shares outstanding at the beginning of the period 61,478.899 2,941,681.059 807,612.504
Number of shares issued - - -
Number of shares redeemed (12,168.050) (705,719.923) (211,269.268)
Number of shares outstanding at the end of the period 49,310.849 2,235,961.136 596,343.236
Class U
Number of shares outstanding at the beginning of the period 1,989,993.913 - -
Number of shares issued 218,382.922 - -
Number of shares redeemed (611,226.244) - -
Number of shares outstanding at the end of the period 1,597,150.591 - -
Pramerica Sicav
48
Changes in the Number of Sharesfor the period ended June 30, 2019 (continued)
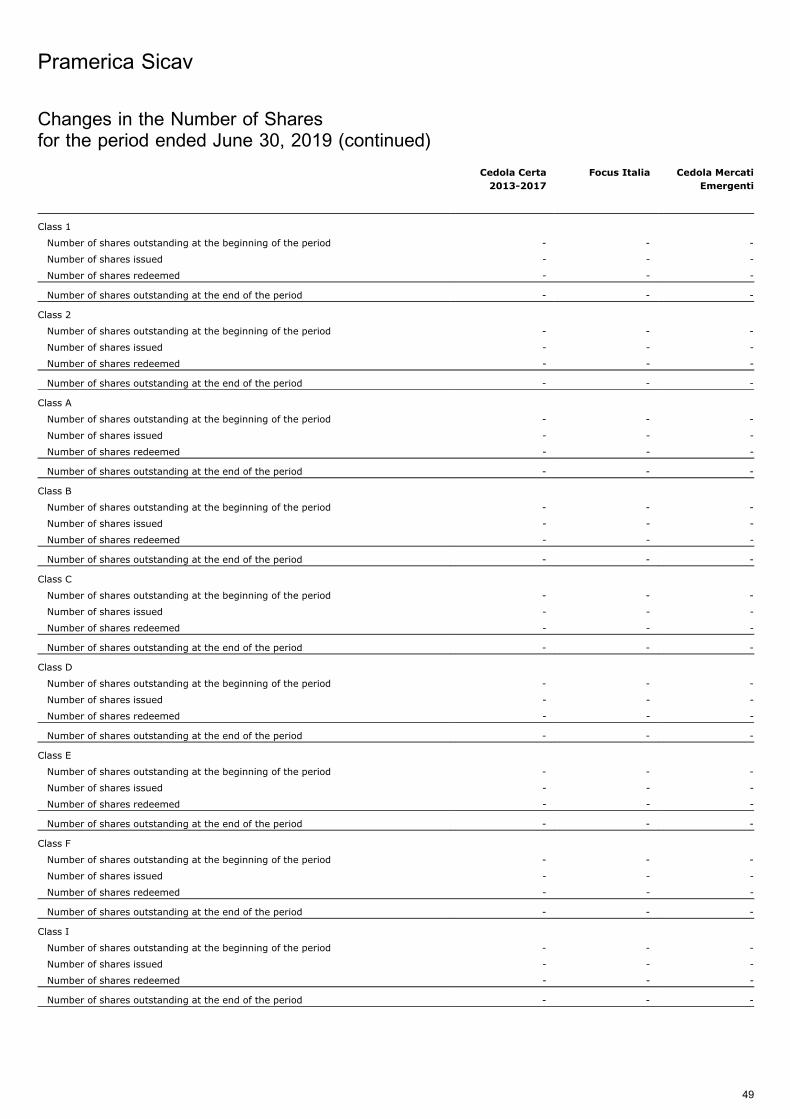
Cedola Certa
2013-2017
Focus Italia Cedola Mercati
Emergenti
Class 1
Number of shares outstanding at the beginning of the period - - -
Number of shares issued - - -
Number of shares redeemed - - -
Number of shares outstanding at the end of the period - - -
Class 2
Number of shares outstanding at the beginning of the period - - -
Number of shares issued - - -
Number of shares redeemed - - -
Number of shares outstanding at the end of the period - - -
Class A
Number of shares outstanding at the beginning of the period - - -
Number of shares issued - - -
Number of shares redeemed - - -
Number of shares outstanding at the end of the period - - -
Class B
Number of shares outstanding at the beginning of the period - - -
Number of shares issued - - -
Number of shares redeemed - - -
Number of shares outstanding at the end of the period - - -
Class C
Number of shares outstanding at the beginning of the period - - -
Number of shares issued - - -
Number of shares redeemed - - -
Number of shares outstanding at the end of the period - - -
Class D
Number of shares outstanding at the beginning of the period - - -
Number of shares issued - - -
Number of shares redeemed - - -
Number of shares outstanding at the end of the period - - -
Class E
Number of shares outstanding at the beginning of the period - - -
Number of shares issued - - -
Number of shares redeemed - - -
Number of shares outstanding at the end of the period - - -
Class F
Number of shares outstanding at the beginning of the period - - -
Number of shares issued - - -
Number of shares redeemed - - -
Number of shares outstanding at the end of the period - - -
Class I
Number of shares outstanding at the beginning of the period - - -
Number of shares issued - - -
Number of shares redeemed - - -
Number of shares outstanding at the end of the period - - -
Pramerica Sicav
49
Changes in the Number of Sharesfor the period ended June 30, 2019 (continued)
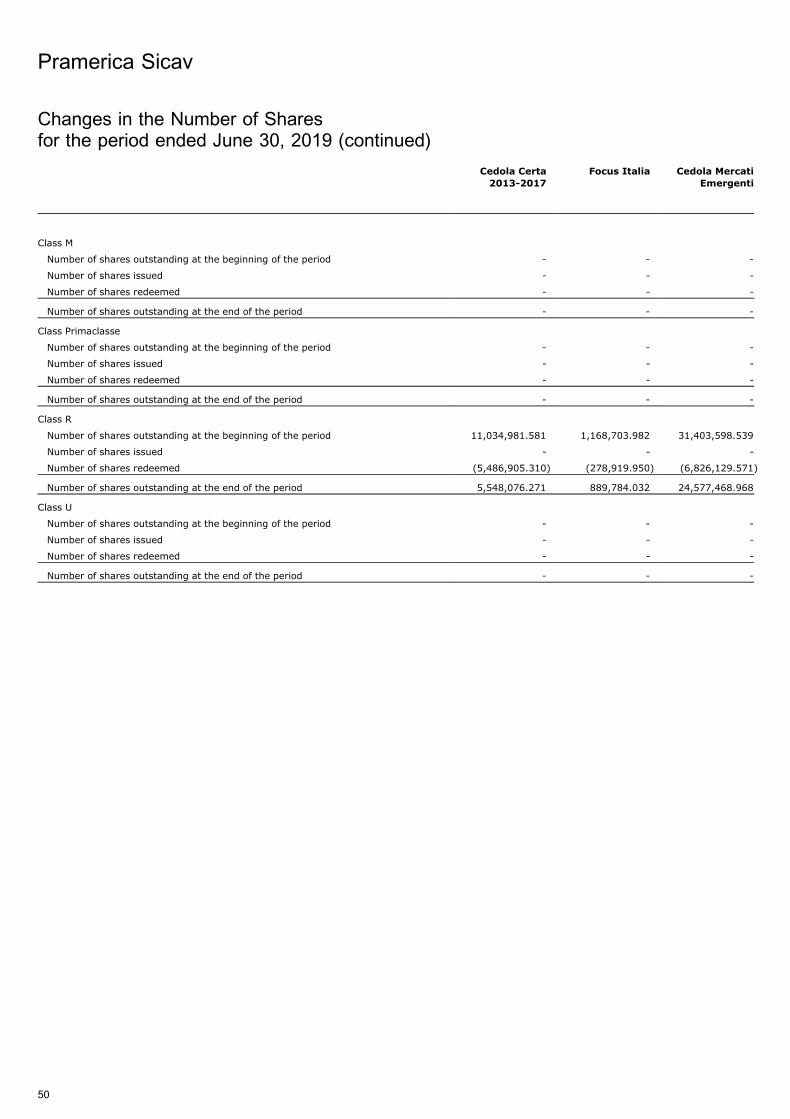
Cedola Certa
2013-2017
Focus Italia Cedola Mercati
Emergenti
Class M
Number of shares outstanding at the beginning of the period - - -
Number of shares issued - - -
Number of shares redeemed - - -
Number of shares outstanding at the end of the period - - -
Class Primaclasse
Number of shares outstanding at the beginning of the period - - -
Number of shares issued - - -
Number of shares redeemed - - -
Number of shares outstanding at the end of the period - - -
Class R
Number of shares outstanding at the beginning of the period 11,034,981.581 1,168,703.982 31,403,598.539
Number of shares issued - - -
Number of shares redeemed (5,486,905.310) (278,919.950) (6,826,129.571)
Number of shares outstanding at the end of the period 5,548,076.271 889,784.032 24,577,468.968
Class U
Number of shares outstanding at the beginning of the period - - -
Number of shares issued - - -
Number of shares redeemed - - -
Number of shares outstanding at the end of the period - - -
Pramerica Sicav
50
Changes in the Number of Sharesfor the period ended June 30, 2019 (continued)
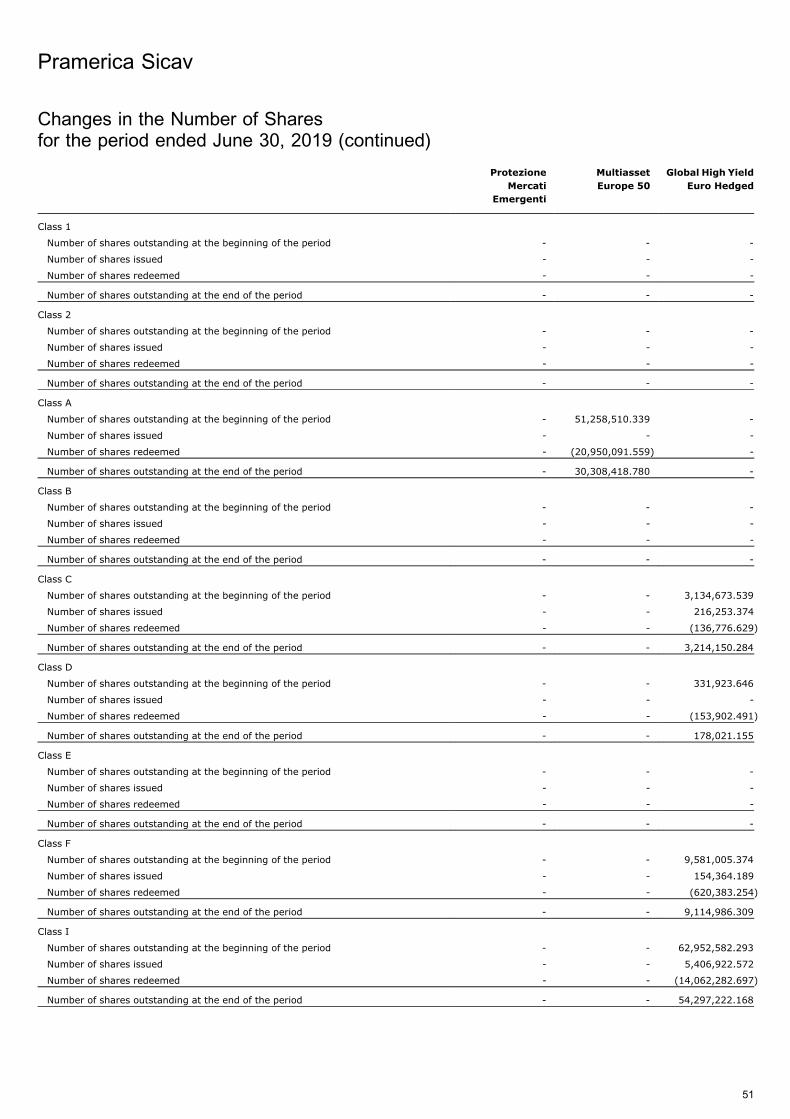
Protezione
Mercati
Emergenti
Multiasset
Europe 50
Global High Yield
Euro Hedged
Class 1
Number of shares outstanding at the beginning of the period - - -
Number of shares issued - - -
Number of shares redeemed - - -
Number of shares outstanding at the end of the period - - -
Class 2
Number of shares outstanding at the beginning of the period - - -
Number of shares issued - - -
Number of shares redeemed - - -
Number of shares outstanding at the end of the period - - -
Class A
Number of shares outstanding at the beginning of the period - 51,258,510.339 -
Number of shares issued - - -
Number of shares redeemed - (20,950,091.559) -
Number of shares outstanding at the end of the period - 30,308,418.780 -
Class B
Number of shares outstanding at the beginning of the period - - -
Number of shares issued - - -
Number of shares redeemed - - -
Number of shares outstanding at the end of the period - - -
Class C
Number of shares outstanding at the beginning of the period - - 3,134,673.539
Number of shares issued - - 216,253.374
Number of shares redeemed - - (136,776.629)
Number of shares outstanding at the end of the period - - 3,214,150.284
Class D
Number of shares outstanding at the beginning of the period - - 331,923.646
Number of shares issued - - -
Number of shares redeemed - - (153,902.491)
Number of shares outstanding at the end of the period - - 178,021.155
Class E
Number of shares outstanding at the beginning of the period - - -
Number of shares issued - - -
Number of shares redeemed - - -
Number of shares outstanding at the end of the period - - -
Class F
Number of shares outstanding at the beginning of the period - - 9,581,005.374
Number of shares issued - - 154,364.189
Number of shares redeemed - - (620,383.254)
Number of shares outstanding at the end of the period - - 9,114,986.309
Class I
Number of shares outstanding at the beginning of the period - - 62,952,582.293
Number of shares issued - - 5,406,922.572
Number of shares redeemed - - (14,062,282.697)
Number of shares outstanding at the end of the period - - 54,297,222.168
Pramerica Sicav
51
Changes in the Number of Sharesfor the period ended June 30, 2019 (continued)
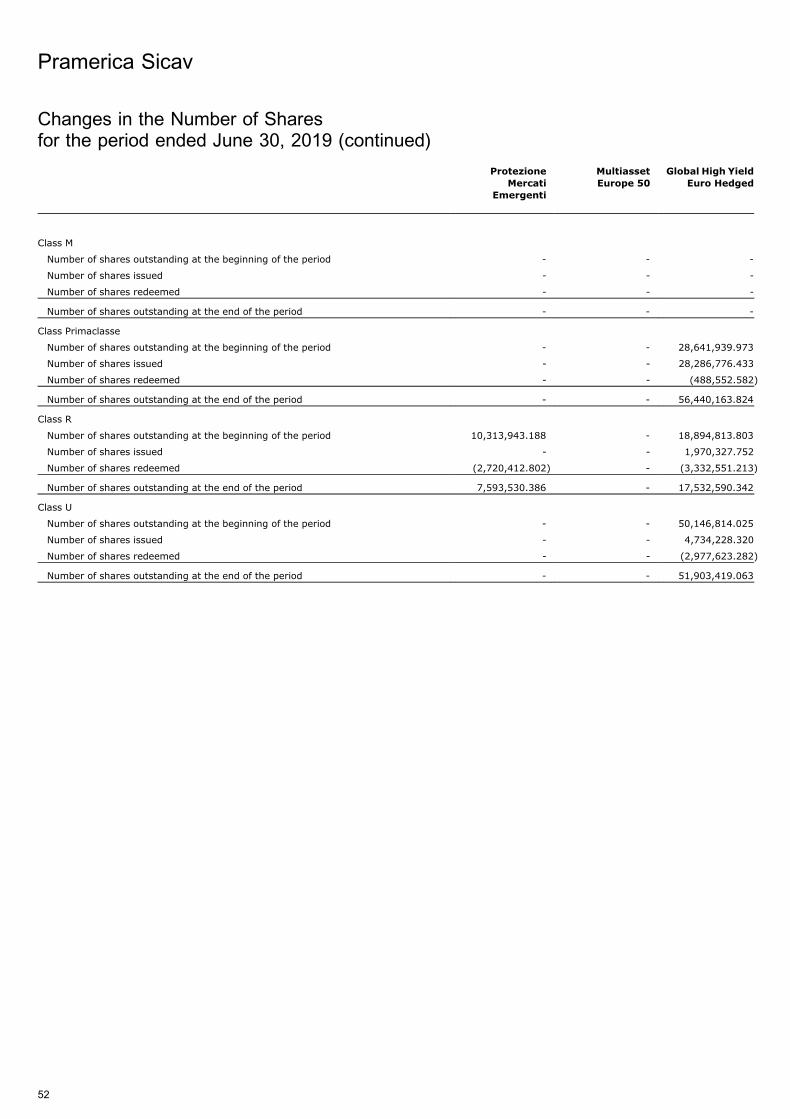
Protezione
MercatiEmergenti
Multiasset
Europe 50
Global High Yield
Euro Hedged
Class M
Number of shares outstanding at the beginning of the period - - -
Number of shares issued - - -
Number of shares redeemed - - -
Number of shares outstanding at the end of the period - - -
Class Primaclasse
Number of shares outstanding at the beginning of the period - - 28,641,939.973
Number of shares issued - - 28,286,776.433
Number of shares redeemed - - (488,552.582)
Number of shares outstanding at the end of the period - - 56,440,163.824
Class R
Number of shares outstanding at the beginning of the period 10,313,943.188 - 18,894,813.803
Number of shares issued - - 1,970,327.752
Number of shares redeemed (2,720,412.802) - (3,332,551.213)
Number of shares outstanding at the end of the period 7,593,530.386 - 17,532,590.342
Class U
Number of shares outstanding at the beginning of the period - - 50,146,814.025
Number of shares issued - - 4,734,228.320
Number of shares redeemed - - (2,977,623.282)
Number of shares outstanding at the end of the period - - 51,903,419.063
Pramerica Sicav
52
Changes in the Number of Sharesfor the period ended June 30, 2019 (continued)
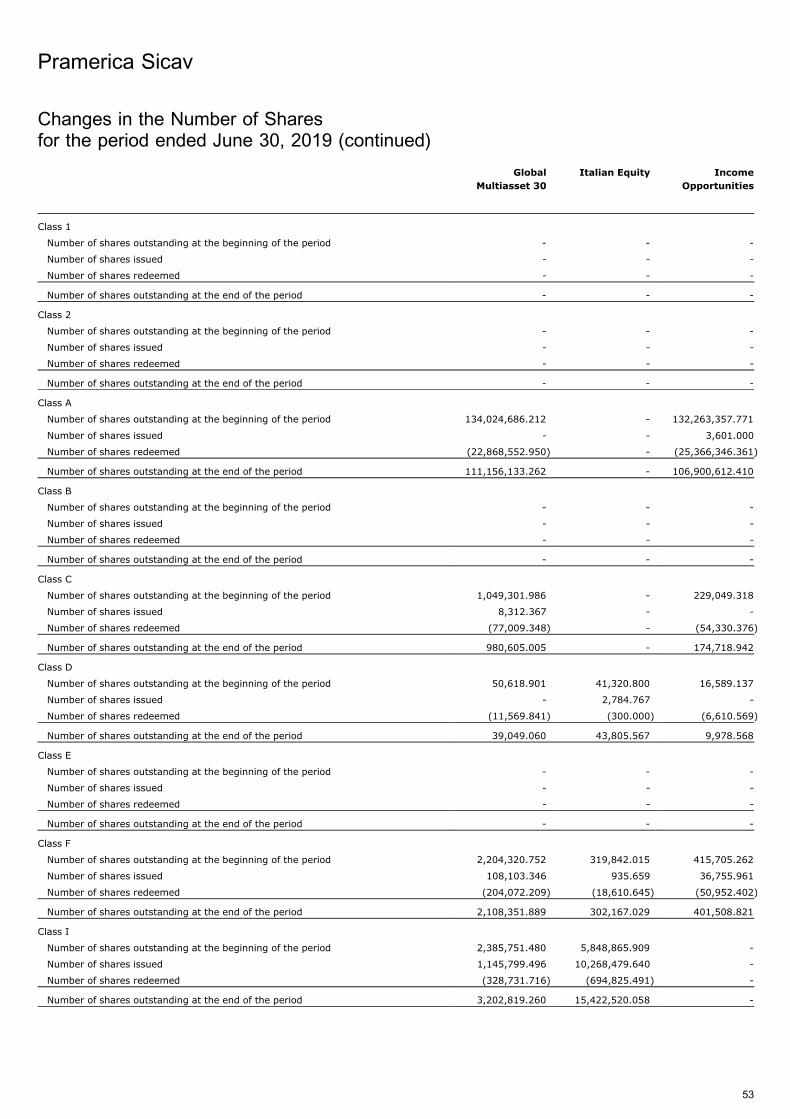
Global
Multiasset 30
Italian Equity Income
Opportunities
Class 1
Number of shares outstanding at the beginning of the period - - -
Number of shares issued - - -
Number of shares redeemed - - -
Number of shares outstanding at the end of the period - - -
Class 2
Number of shares outstanding at the beginning of the period - - -
Number of shares issued - - -
Number of shares redeemed - - -
Number of shares outstanding at the end of the period - - -
Class A
Number of shares outstanding at the beginning of the period 134,024,686.212 - 132,263,357.771
Number of shares issued - - 3,601.000
Number of shares redeemed (22,868,552.950) - (25,366,346.361)
Number of shares outstanding at the end of the period 111,156,133.262 - 106,900,612.410
Class B
Number of shares outstanding at the beginning of the period - - -
Number of shares issued - - -
Number of shares redeemed - - -
Number of shares outstanding at the end of the period - - -
Class C
Number of shares outstanding at the beginning of the period 1,049,301.986 - 229,049.318
Number of shares issued 8,312.367 - -
Number of shares redeemed (77,009.348) - (54,330.376)
Number of shares outstanding at the end of the period 980,605.005 - 174,718.942
Class D
Number of shares outstanding at the beginning of the period 50,618.901 41,320.800 16,589.137
Number of shares issued - 2,784.767 -
Number of shares redeemed (11,569.841) (300.000) (6,610.569)
Number of shares outstanding at the end of the period 39,049.060 43,805.567 9,978.568
Class E
Number of shares outstanding at the beginning of the period - - -
Number of shares issued - - -
Number of shares redeemed - - -
Number of shares outstanding at the end of the period - - -
Class F
Number of shares outstanding at the beginning of the period 2,204,320.752 319,842.015 415,705.262
Number of shares issued 108,103.346 935.659 36,755.961
Number of shares redeemed (204,072.209) (18,610.645) (50,952.402)
Number of shares outstanding at the end of the period 2,108,351.889 302,167.029 401,508.821
Class I
Number of shares outstanding at the beginning of the period 2,385,751.480 5,848,865.909 -
Number of shares issued 1,145,799.496 10,268,479.640 -
Number of shares redeemed (328,731.716) (694,825.491) -
Number of shares outstanding at the end of the period 3,202,819.260 15,422,520.058 -
Pramerica Sicav
53
Changes in the Number of Sharesfor the period ended June 30, 2019 (continued)
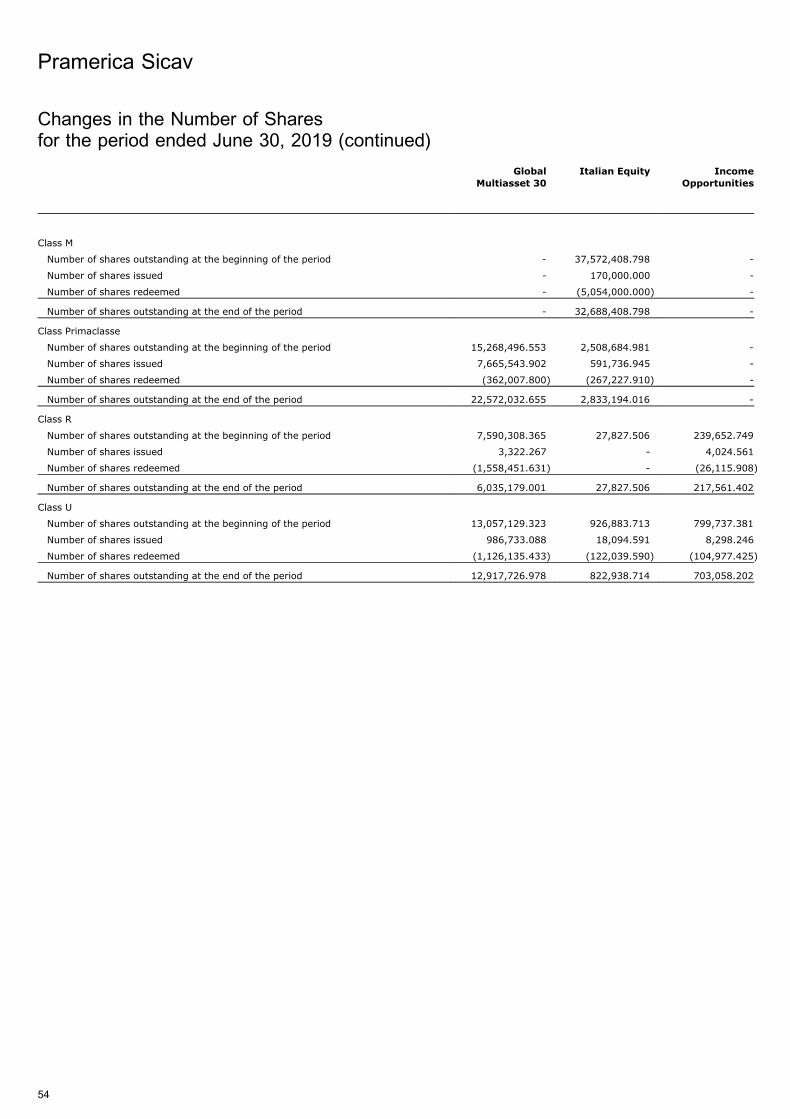
Global
Multiasset 30
Italian Equity Income
Opportunities
Class M
Number of shares outstanding at the beginning of the period - 37,572,408.798 -
Number of shares issued - 170,000.000 -
Number of shares redeemed - (5,054,000.000) -
Number of shares outstanding at the end of the period - 32,688,408.798 -
Class Primaclasse
Number of shares outstanding at the beginning of the period 15,268,496.553 2,508,684.981 -
Number of shares issued 7,665,543.902 591,736.945 -
Number of shares redeemed (362,007.800) (267,227.910) -
Number of shares outstanding at the end of the period 22,572,032.655 2,833,194.016 -
Class R
Number of shares outstanding at the beginning of the period 7,590,308.365 27,827.506 239,652.749
Number of shares issued 3,322.267 - 4,024.561
Number of shares redeemed (1,558,451.631) - (26,115.908)
Number of shares outstanding at the end of the period 6,035,179.001 27,827.506 217,561.402
Class U
Number of shares outstanding at the beginning of the period 13,057,129.323 926,883.713 799,737.381
Number of shares issued 986,733.088 18,094.591 8,298.246
Number of shares redeemed (1,126,135.433) (122,039.590) (104,977.425)
Number of shares outstanding at the end of the period 12,917,726.978 822,938.714 703,058.202
Pramerica Sicav
54
Changes in the Number of Sharesfor the period ended June 30, 2019 (continued)
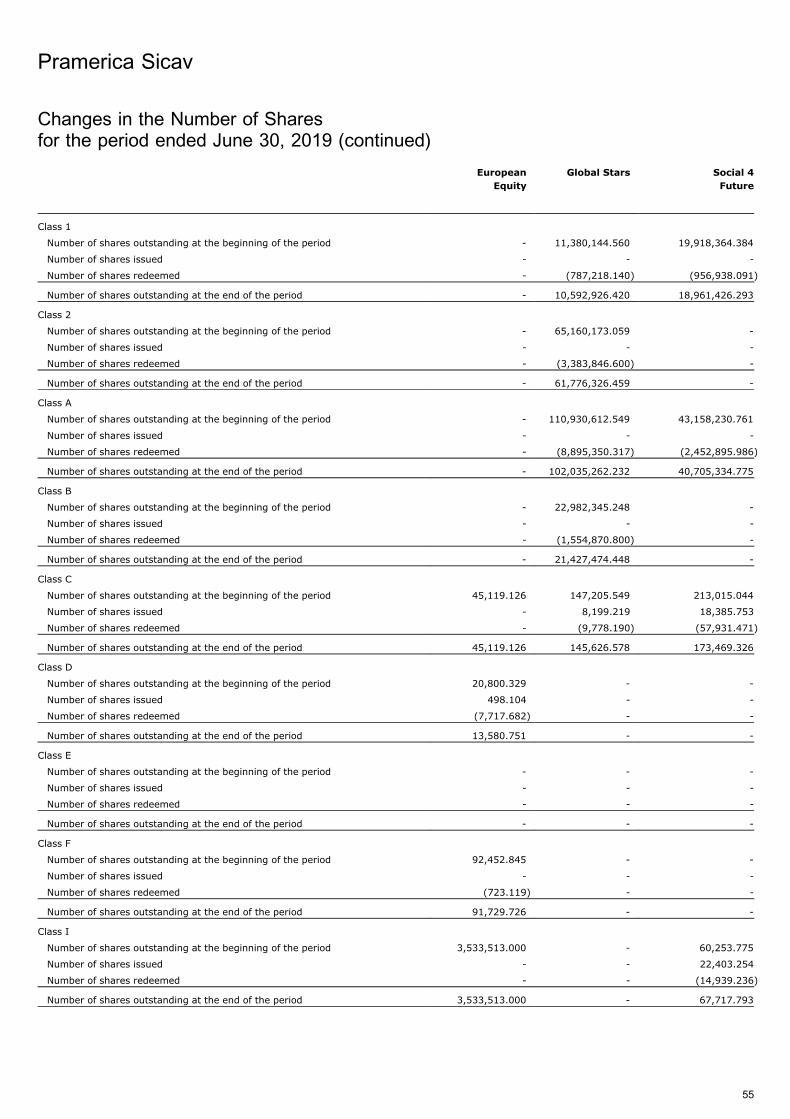
European
Equity
Global Stars Social 4
Future
Class 1
Number of shares outstanding at the beginning of the period - 11,380,144.560 19,918,364.384
Number of shares issued - - -
Number of shares redeemed - (787,218.140) (956,938.091)
Number of shares outstanding at the end of the period - 10,592,926.420 18,961,426.293
Class 2
Number of shares outstanding at the beginning of the period - 65,160,173.059 -
Number of shares issued - - -
Number of shares redeemed - (3,383,846.600) -
Number of shares outstanding at the end of the period - 61,776,326.459 -
Class A
Number of shares outstanding at the beginning of the period - 110,930,612.549 43,158,230.761
Number of shares issued - - -
Number of shares redeemed - (8,895,350.317) (2,452,895.986)
Number of shares outstanding at the end of the period - 102,035,262.232 40,705,334.775
Class B
Number of shares outstanding at the beginning of the period - 22,982,345.248 -
Number of shares issued - - -
Number of shares redeemed - (1,554,870.800) -
Number of shares outstanding at the end of the period - 21,427,474.448 -
Class C
Number of shares outstanding at the beginning of the period 45,119.126 147,205.549 213,015.044
Number of shares issued - 8,199.219 18,385.753
Number of shares redeemed - (9,778.190) (57,931.471)
Number of shares outstanding at the end of the period 45,119.126 145,626.578 173,469.326
Class D
Number of shares outstanding at the beginning of the period 20,800.329 - -
Number of shares issued 498.104 - -
Number of shares redeemed (7,717.682) - -
Number of shares outstanding at the end of the period 13,580.751 - -
Class E
Number of shares outstanding at the beginning of the period - - -
Number of shares issued - - -
Number of shares redeemed - - -
Number of shares outstanding at the end of the period - - -
Class F
Number of shares outstanding at the beginning of the period 92,452.845 - -
Number of shares issued - - -
Number of shares redeemed (723.119) - -
Number of shares outstanding at the end of the period 91,729.726 - -
Class I
Number of shares outstanding at the beginning of the period 3,533,513.000 - 60,253.775
Number of shares issued - - 22,403.254
Number of shares redeemed - - (14,939.236)
Number of shares outstanding at the end of the period 3,533,513.000 - 67,717.793
Pramerica Sicav
55
Changes in the Number of Sharesfor the period ended June 30, 2019 (continued)
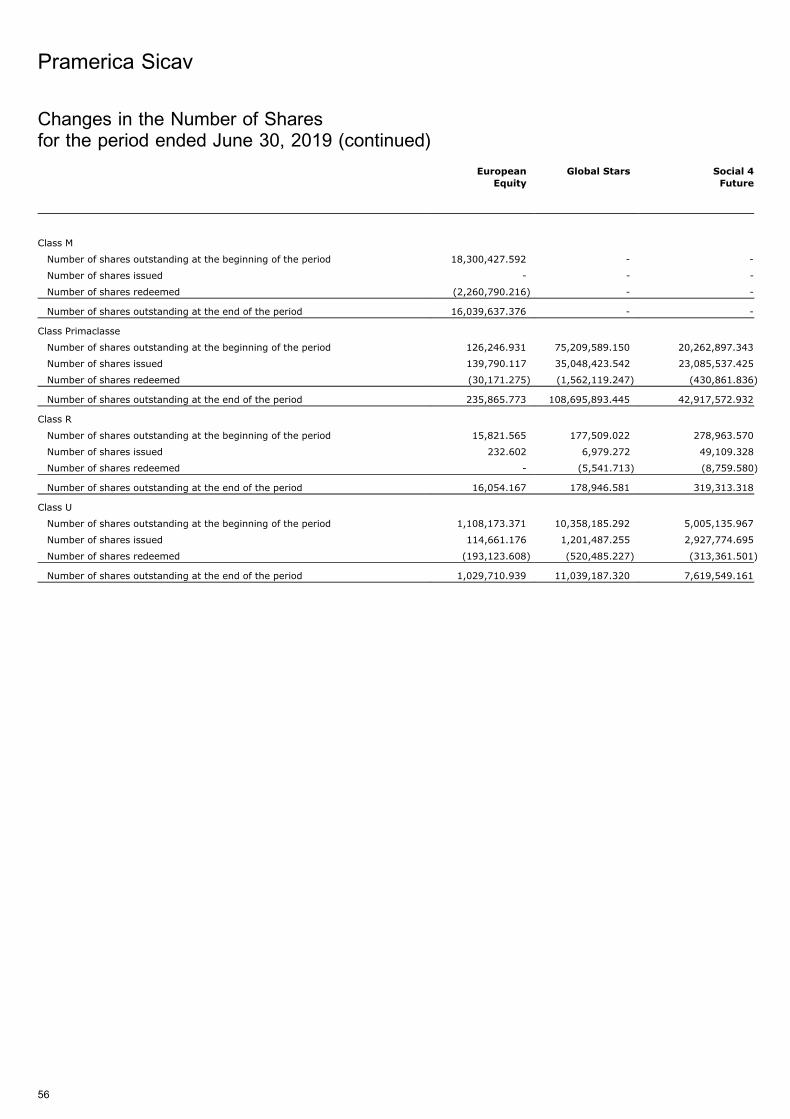
European
Equity
Global Stars Social 4
Future
Class M
Number of shares outstanding at the beginning of the period 18,300,427.592 - -
Number of shares issued - - -
Number of shares redeemed (2,260,790.216) - -
Number of shares outstanding at the end of the period 16,039,637.376 - -
Class Primaclasse
Number of shares outstanding at the beginning of the period 126,246.931 75,209,589.150 20,262,897.343
Number of shares issued 139,790.117 35,048,423.542 23,085,537.425
Number of shares redeemed (30,171.275) (1,562,119.247) (430,861.836)
Number of shares outstanding at the end of the period 235,865.773 108,695,893.445 42,917,572.932
Class R
Number of shares outstanding at the beginning of the period 15,821.565 177,509.022 278,963.570
Number of shares issued 232.602 6,979.272 49,109.328
Number of shares redeemed - (5,541.713) (8,759.580)
Number of shares outstanding at the end of the period 16,054.167 178,946.581 319,313.318
Class U
Number of shares outstanding at the beginning of the period 1,108,173.371 10,358,185.292 5,005,135.967
Number of shares issued 114,661.176 1,201,487.255 2,927,774.695
Number of shares redeemed (193,123.608) (520,485.227) (313,361.501)
Number of shares outstanding at the end of the period 1,029,710.939 11,039,187.320 7,619,549.161
Pramerica Sicav
56
Changes in the Number of Sharesfor the period ended June 30, 2019 (continued)
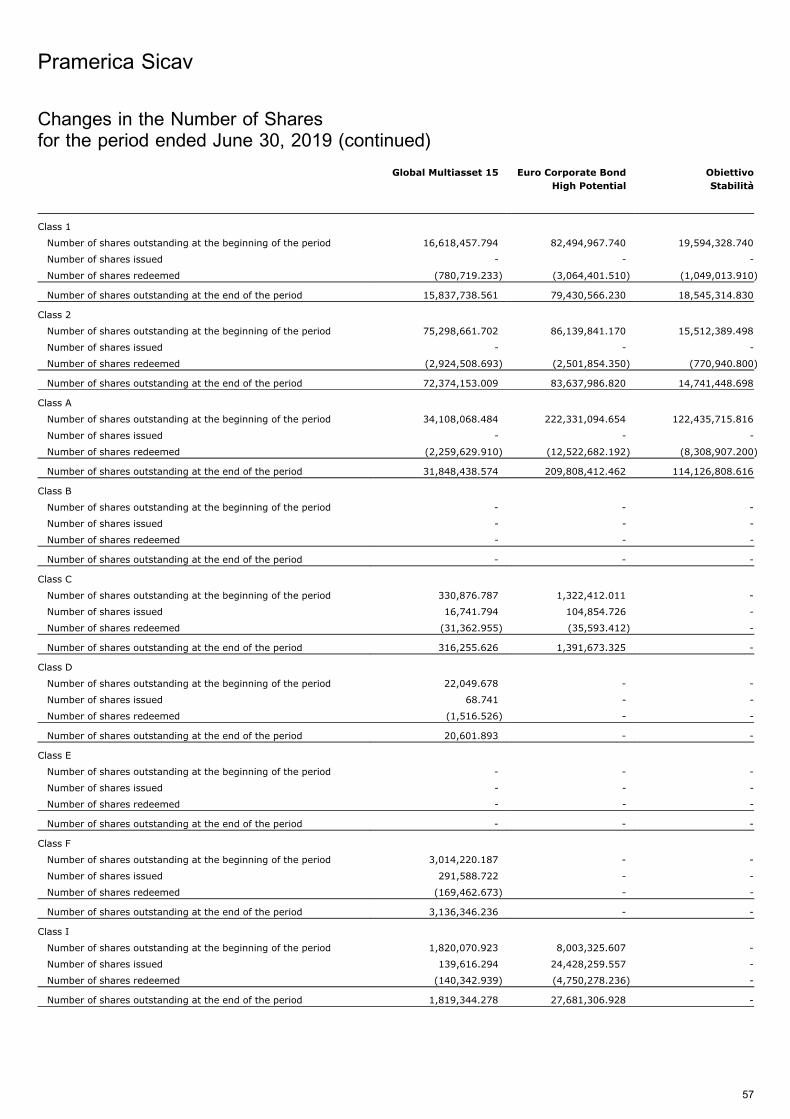
Global Multiasset 15 Euro Corporate Bond
High Potential
Obiettivo
Stabilita
Class 1
Number of shares outstanding at the beginning of the period 16,618,457.794 82,494,967.740 19,594,328.740
Number of shares issued - - -
Number of shares redeemed (780,719.233) (3,064,401.510) (1,049,013.910)
Number of shares outstanding at the end of the period 15,837,738.561 79,430,566.230 18,545,314.830
Class 2
Number of shares outstanding at the beginning of the period 75,298,661.702 86,139,841.170 15,512,389.498
Number of shares issued - - -
Number of shares redeemed (2,924,508.693) (2,501,854.350) (770,940.800)
Number of shares outstanding at the end of the period 72,374,153.009 83,637,986.820 14,741,448.698
Class A
Number of shares outstanding at the beginning of the period 34,108,068.484 222,331,094.654 122,435,715.816
Number of shares issued - - -
Number of shares redeemed (2,259,629.910) (12,522,682.192) (8,308,907.200)
Number of shares outstanding at the end of the period 31,848,438.574 209,808,412.462 114,126,808.616
Class B
Number of shares outstanding at the beginning of the period - - -
Number of shares issued - - -
Number of shares redeemed - - -
Number of shares outstanding at the end of the period - - -
Class C
Number of shares outstanding at the beginning of the period 330,876.787 1,322,412.011 -
Number of shares issued 16,741.794 104,854.726 -
Number of shares redeemed (31,362.955) (35,593.412) -
Number of shares outstanding at the end of the period 316,255.626 1,391,673.325 -
Class D
Number of shares outstanding at the beginning of the period 22,049.678 - -
Number of shares issued 68.741 - -
Number of shares redeemed (1,516.526) - -
Number of shares outstanding at the end of the period 20,601.893 - -
Class E
Number of shares outstanding at the beginning of the period - - -
Number of shares issued - - -
Number of shares redeemed - - -
Number of shares outstanding at the end of the period - - -
Class F
Number of shares outstanding at the beginning of the period 3,014,220.187 - -
Number of shares issued 291,588.722 - -
Number of shares redeemed (169,462.673) - -
Number of shares outstanding at the end of the period 3,136,346.236 - -
Class I
Number of shares outstanding at the beginning of the period 1,820,070.923 8,003,325.607 -
Number of shares issued 139,616.294 24,428,259.557 -
Number of shares redeemed (140,342.939) (4,750,278.236) -
Number of shares outstanding at the end of the period 1,819,344.278 27,681,306.928 -
Pramerica Sicav
57
Changes in the Number of Sharesfor the period ended June 30, 2019 (continued)
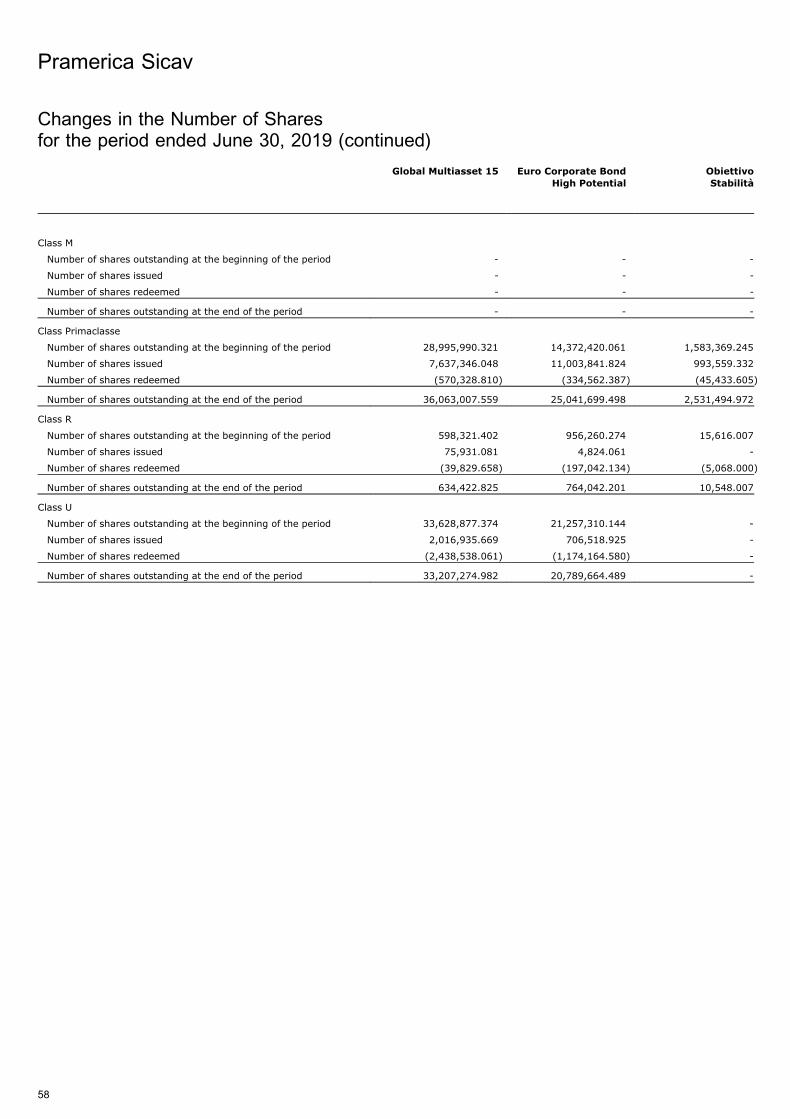
Global Multiasset 15 Euro Corporate Bond
High Potential
Obiettivo
Stabilita
Class M
Number of shares outstanding at the beginning of the period - - -
Number of shares issued - - -
Number of shares redeemed - - -
Number of shares outstanding at the end of the period - - -
Class Primaclasse
Number of shares outstanding at the beginning of the period 28,995,990.321 14,372,420.061 1,583,369.245
Number of shares issued 7,637,346.048 11,003,841.824 993,559.332
Number of shares redeemed (570,328.810) (334,562.387) (45,433.605)
Number of shares outstanding at the end of the period 36,063,007.559 25,041,699.498 2,531,494.972
Class R
Number of shares outstanding at the beginning of the period 598,321.402 956,260.274 15,616.007
Number of shares issued 75,931.081 4,824.061 -
Number of shares redeemed (39,829.658) (197,042.134) (5,068.000)
Number of shares outstanding at the end of the period 634,422.825 764,042.201 10,548.007
Class U
Number of shares outstanding at the beginning of the period 33,628,877.374 21,257,310.144 -
Number of shares issued 2,016,935.669 706,518.925 -
Number of shares redeemed (2,438,538.061) (1,174,164.580) -
Number of shares outstanding at the end of the period 33,207,274.982 20,789,664.489 -
Pramerica Sicav
58
Changes in the Number of Sharesfor the period ended June 30, 2019 (continued)
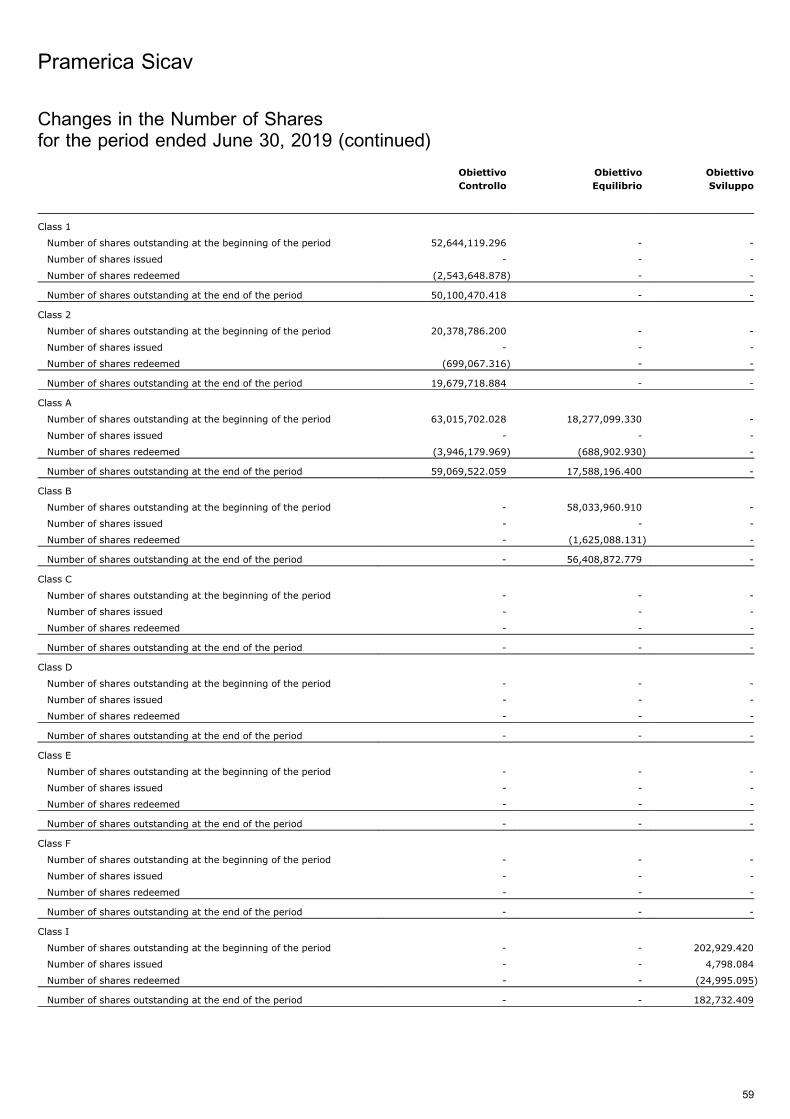
Obiettivo
Controllo
Obiettivo
Equilibrio
Obiettivo
Sviluppo
Class 1
Number of shares outstanding at the beginning of the period 52,644,119.296 - -
Number of shares issued - - -
Number of shares redeemed (2,543,648.878) - -
Number of shares outstanding at the end of the period 50,100,470.418 - -
Class 2
Number of shares outstanding at the beginning of the period 20,378,786.200 - -
Number of shares issued - - -
Number of shares redeemed (699,067.316) - -
Number of shares outstanding at the end of the period 19,679,718.884 - -
Class A
Number of shares outstanding at the beginning of the period 63,015,702.028 18,277,099.330 -
Number of shares issued - - -
Number of shares redeemed (3,946,179.969) (688,902.930) -
Number of shares outstanding at the end of the period 59,069,522.059 17,588,196.400 -
Class B
Number of shares outstanding at the beginning of the period - 58,033,960.910 -
Number of shares issued - - -
Number of shares redeemed - (1,625,088.131) -
Number of shares outstanding at the end of the period - 56,408,872.779 -
Class C
Number of shares outstanding at the beginning of the period - - -
Number of shares issued - - -
Number of shares redeemed - - -
Number of shares outstanding at the end of the period - - -
Class D
Number of shares outstanding at the beginning of the period - - -
Number of shares issued - - -
Number of shares redeemed - - -
Number of shares outstanding at the end of the period - - -
Class E
Number of shares outstanding at the beginning of the period - - -
Number of shares issued - - -
Number of shares redeemed - - -
Number of shares outstanding at the end of the period - - -
Class F
Number of shares outstanding at the beginning of the period - - -
Number of shares issued - - -
Number of shares redeemed - - -
Number of shares outstanding at the end of the period - - -
Class I
Number of shares outstanding at the beginning of the period - - 202,929.420
Number of shares issued - - 4,798.084
Number of shares redeemed - - (24,995.095)
Number of shares outstanding at the end of the period - - 182,732.409
Pramerica Sicav
59
Changes in the Number of Sharesfor the period ended June 30, 2019 (continued)
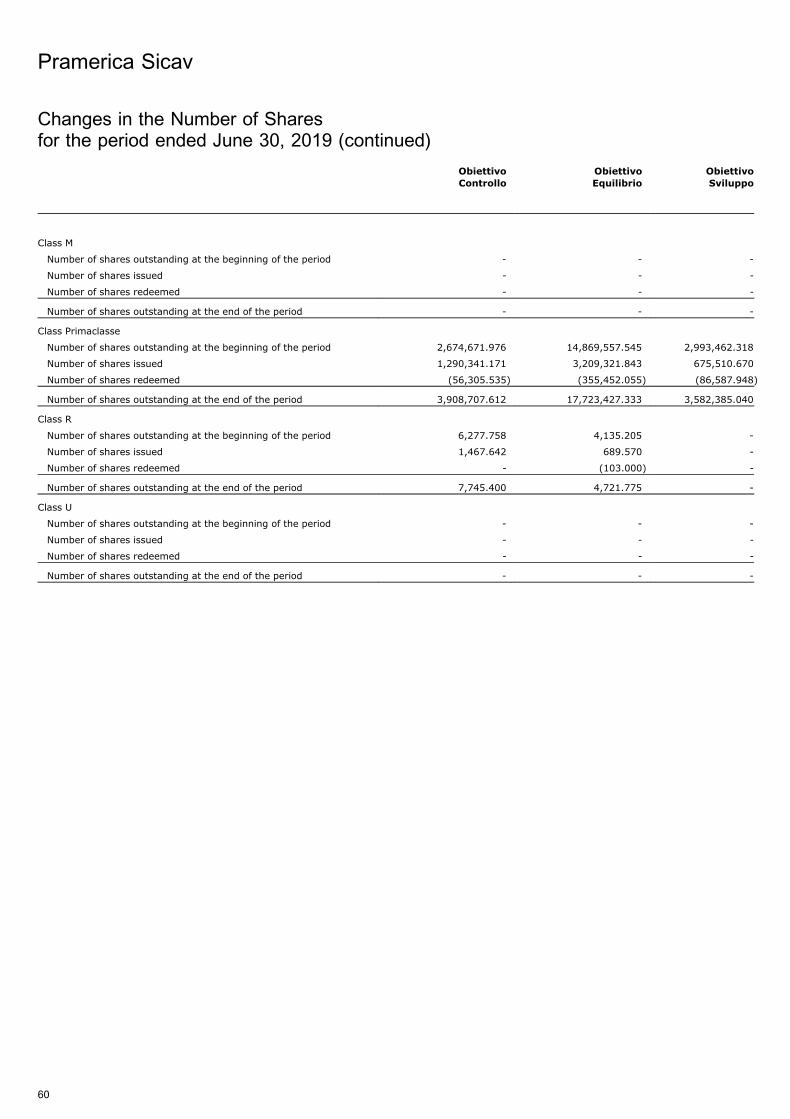
Obiettivo
Controllo
Obiettivo
Equilibrio
Obiettivo
Sviluppo
Class M
Number of shares outstanding at the beginning of the period - - -
Number of shares issued - - -
Number of shares redeemed - - -
Number of shares outstanding at the end of the period - - -
Class Primaclasse
Number of shares outstanding at the beginning of the period 2,674,671.976 14,869,557.545 2,993,462.318
Number of shares issued 1,290,341.171 3,209,321.843 675,510.670
Number of shares redeemed (56,305.535) (355,452.055) (86,587.948)
Number of shares outstanding at the end of the period 3,908,707.612 17,723,427.333 3,582,385.040
Class R
Number of shares outstanding at the beginning of the period 6,277.758 4,135.205 -
Number of shares issued 1,467.642 689.570 -
Number of shares redeemed - (103.000) -
Number of shares outstanding at the end of the period 7,745.400 4,721.775 -
Class U
Number of shares outstanding at the beginning of the period - - -
Number of shares issued - - -
Number of shares redeemed - - -
Number of shares outstanding at the end of the period - - -
Pramerica Sicav
60
Changes in the Number of Sharesfor the period ended June 30, 2019 (continued)
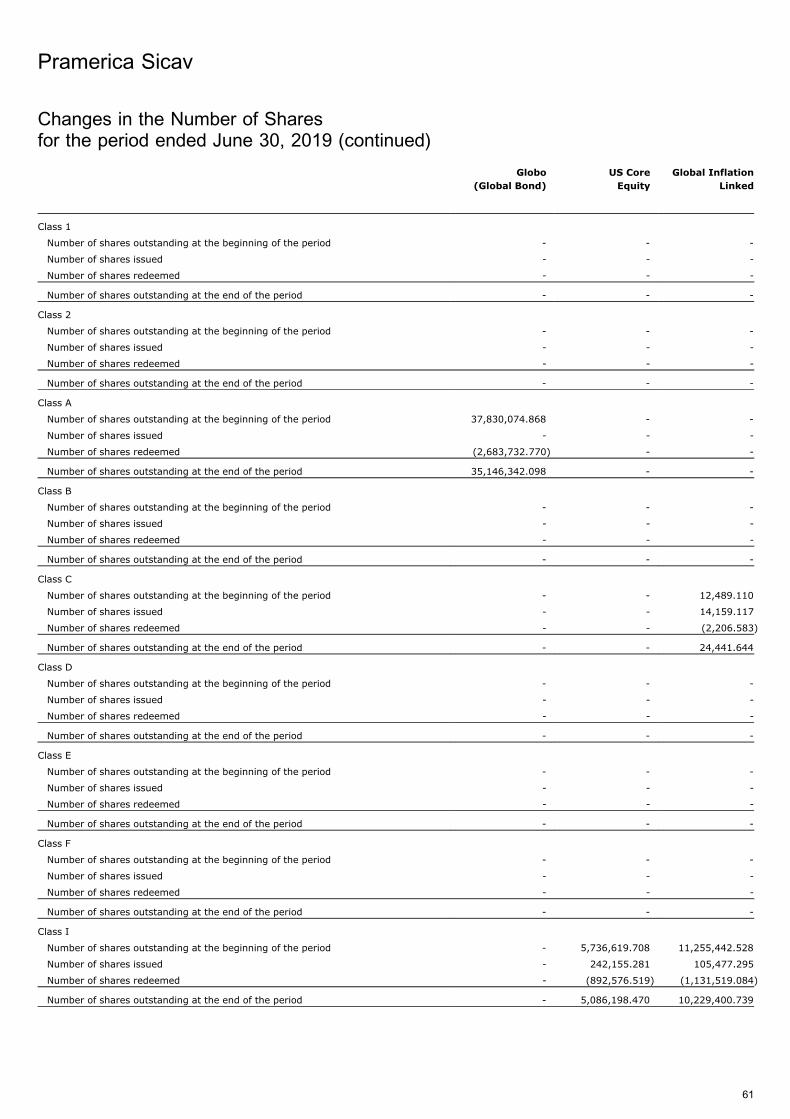
Globo
(Global Bond)
US Core
Equity
Global Inflation
Linked
Class 1
Number of shares outstanding at the beginning of the period - - -
Number of shares issued - - -
Number of shares redeemed - - -
Number of shares outstanding at the end of the period - - -
Class 2
Number of shares outstanding at the beginning of the period - - -
Number of shares issued - - -
Number of shares redeemed - - -
Number of shares outstanding at the end of the period - - -
Class A
Number of shares outstanding at the beginning of the period 37,830,074.868 - -
Number of shares issued - - -
Number of shares redeemed (2,683,732.770) - -
Number of shares outstanding at the end of the period 35,146,342.098 - -
Class B
Number of shares outstanding at the beginning of the period - - -
Number of shares issued - - -
Number of shares redeemed - - -
Number of shares outstanding at the end of the period - - -
Class C
Number of shares outstanding at the beginning of the period - - 12,489.110
Number of shares issued - - 14,159.117
Number of shares redeemed - - (2,206.583)
Number of shares outstanding at the end of the period - - 24,441.644
Class D
Number of shares outstanding at the beginning of the period - - -
Number of shares issued - - -
Number of shares redeemed - - -
Number of shares outstanding at the end of the period - - -
Class E
Number of shares outstanding at the beginning of the period - - -
Number of shares issued - - -
Number of shares redeemed - - -
Number of shares outstanding at the end of the period - - -
Class F
Number of shares outstanding at the beginning of the period - - -
Number of shares issued - - -
Number of shares redeemed - - -
Number of shares outstanding at the end of the period - - -
Class I
Number of shares outstanding at the beginning of the period - 5,736,619.708 11,255,442.528
Number of shares issued - 242,155.281 105,477.295
Number of shares redeemed - (892,576.519) (1,131,519.084)
Number of shares outstanding at the end of the period - 5,086,198.470 10,229,400.739
Pramerica Sicav
61
Changes in the Number of Sharesfor the period ended June 30, 2019 (continued)
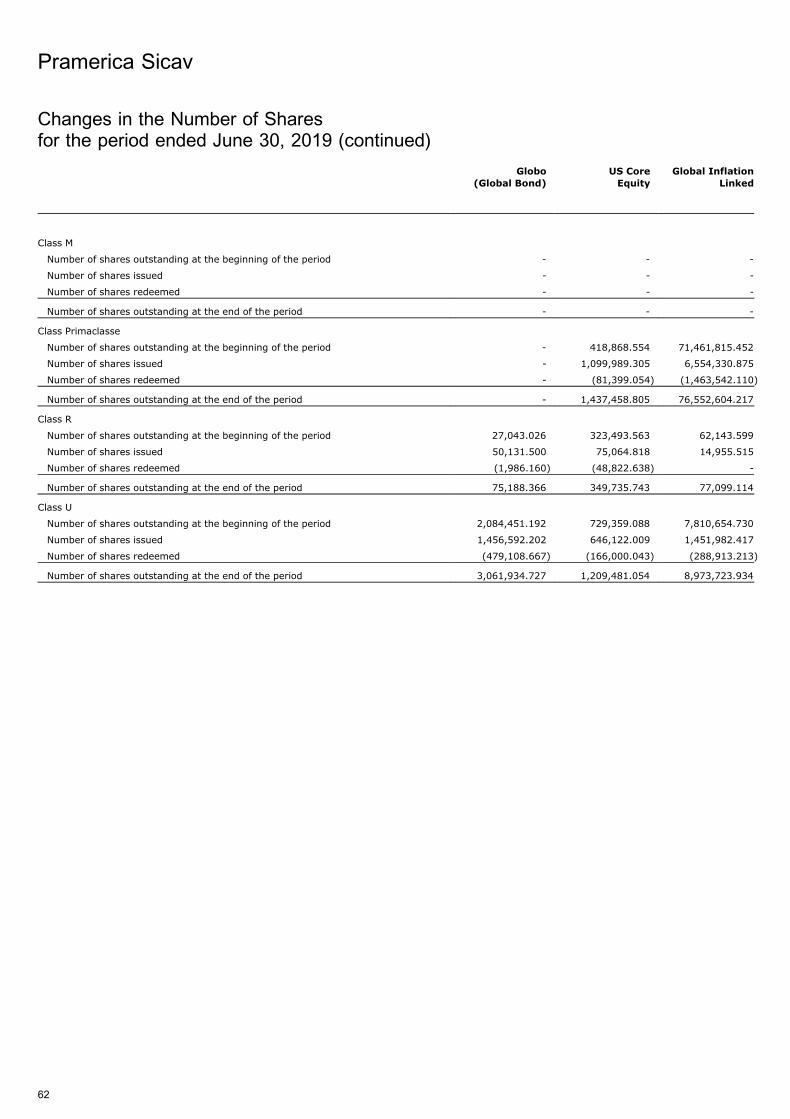
Globo
(Global Bond)
US Core
Equity
Global Inflation
Linked
Class M
Number of shares outstanding at the beginning of the period - - -
Number of shares issued - - -
Number of shares redeemed - - -
Number of shares outstanding at the end of the period - - -
Class Primaclasse
Number of shares outstanding at the beginning of the period - 418,868.554 71,461,815.452
Number of shares issued - 1,099,989.305 6,554,330.875
Number of shares redeemed - (81,399.054) (1,463,542.110)
Number of shares outstanding at the end of the period - 1,437,458.805 76,552,604.217
Class R
Number of shares outstanding at the beginning of the period 27,043.026 323,493.563 62,143.599
Number of shares issued 50,131.500 75,064.818 14,955.515
Number of shares redeemed (1,986.160) (48,822.638) -
Number of shares outstanding at the end of the period 75,188.366 349,735.743 77,099.114
Class U
Number of shares outstanding at the beginning of the period 2,084,451.192 729,359.088 7,810,654.730
Number of shares issued 1,456,592.202 646,122.009 1,451,982.417
Number of shares redeemed (479,108.667) (166,000.043) (288,913.213)
Number of shares outstanding at the end of the period 3,061,934.727 1,209,481.054 8,973,723.934
Pramerica Sicav
62
Changes in the Number of Sharesfor the period ended June 30, 2019 (continued)
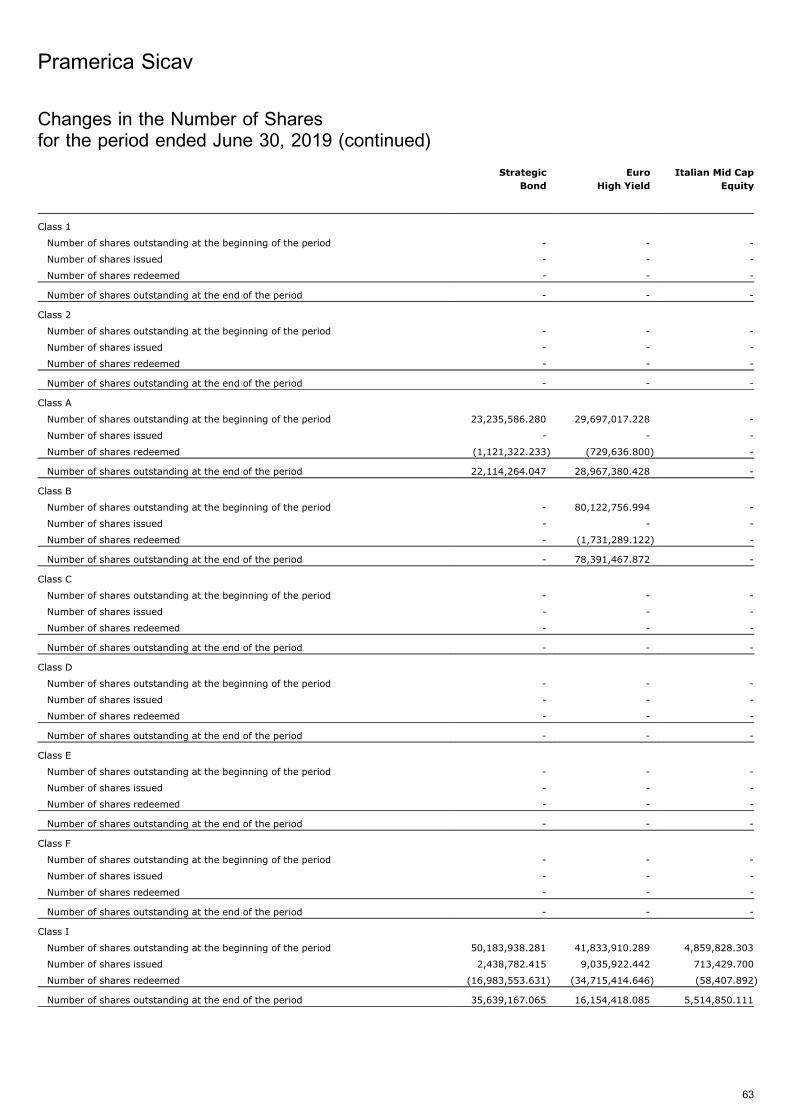
Strategic
Bond
Euro
High Yield
Italian Mid Cap
Equity
Class 1
Number of shares outstanding at the beginning of the period - - -
Number of shares issued - - -
Number of shares redeemed - - -
Number of shares outstanding at the end of the period - - -
Class 2
Number of shares outstanding at the beginning of the period - - -
Number of shares issued - - -
Number of shares redeemed - - -
Number of shares outstanding at the end of the period - - -
Class A
Number of shares outstanding at the beginning of the period 23,235,586.280 29,697,017.228 -
Number of shares issued - - -
Number of shares redeemed (1,121,322.233) (729,636.800) -
Number of shares outstanding at the end of the period 22,114,264.047 28,967,380.428 -
Class B
Number of shares outstanding at the beginning of the period - 80,122,756.994 -
Number of shares issued - - -
Number of shares redeemed - (1,731,289.122) -
Number of shares outstanding at the end of the period - 78,391,467.872 -
Class C
Number of shares outstanding at the beginning of the period - - -
Number of shares issued - - -
Number of shares redeemed - - -
Number of shares outstanding at the end of the period - - -
Class D
Number of shares outstanding at the beginning of the period - - -
Number of shares issued - - -
Number of shares redeemed - - -
Number of shares outstanding at the end of the period - - -
Class E
Number of shares outstanding at the beginning of the period - - -
Number of shares issued - - -
Number of shares redeemed - - -
Number of shares outstanding at the end of the period - - -
Class F
Number of shares outstanding at the beginning of the period - - -
Number of shares issued - - -
Number of shares redeemed - - -
Number of shares outstanding at the end of the period - - -
Class I
Number of shares outstanding at the beginning of the period 50,183,938.281 41,833,910.289 4,859,828.303
Number of shares issued 2,438,782.415 9,035,922.442 713,429.700
Number of shares redeemed (16,983,553.631) (34,715,414.646) (58,407.892)
Number of shares outstanding at the end of the period 35,639,167.065 16,154,418.085 5,514,850.111
Pramerica Sicav
63
Changes in the Number of Sharesfor the period ended June 30, 2019 (continued)
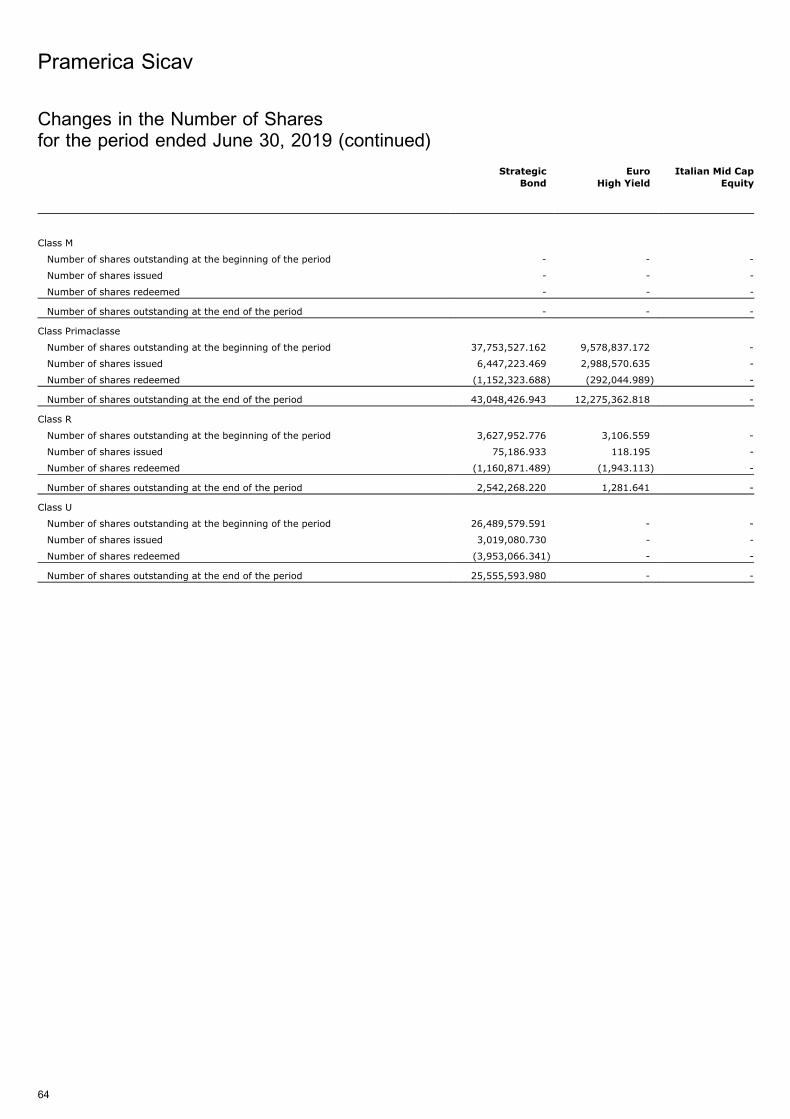
Strategic
Bond
Euro
High Yield
Italian Mid Cap
Equity
Class M
Number of shares outstanding at the beginning of the period - - -
Number of shares issued - - -
Number of shares redeemed - - -
Number of shares outstanding at the end of the period - - -
Class Primaclasse
Number of shares outstanding at the beginning of the period 37,753,527.162 9,578,837.172 -
Number of shares issued 6,447,223.469 2,988,570.635 -
Number of shares redeemed (1,152,323.688) (292,044.989) -
Number of shares outstanding at the end of the period 43,048,426.943 12,275,362.818 -
Class R
Number of shares outstanding at the beginning of the period 3,627,952.776 3,106.559 -
Number of shares issued 75,186.933 118.195 -
Number of shares redeemed (1,160,871.489) (1,943.113) -
Number of shares outstanding at the end of the period 2,542,268.220 1,281.641 -
Class U
Number of shares outstanding at the beginning of the period 26,489,579.591 - -
Number of shares issued 3,019,080.730 - -
Number of shares redeemed (3,953,066.341) - -
Number of shares outstanding at the end of the period 25,555,593.980 - -
Pramerica Sicav
64
Changes in the Number of Sharesfor the period ended June 30, 2019 (continued)
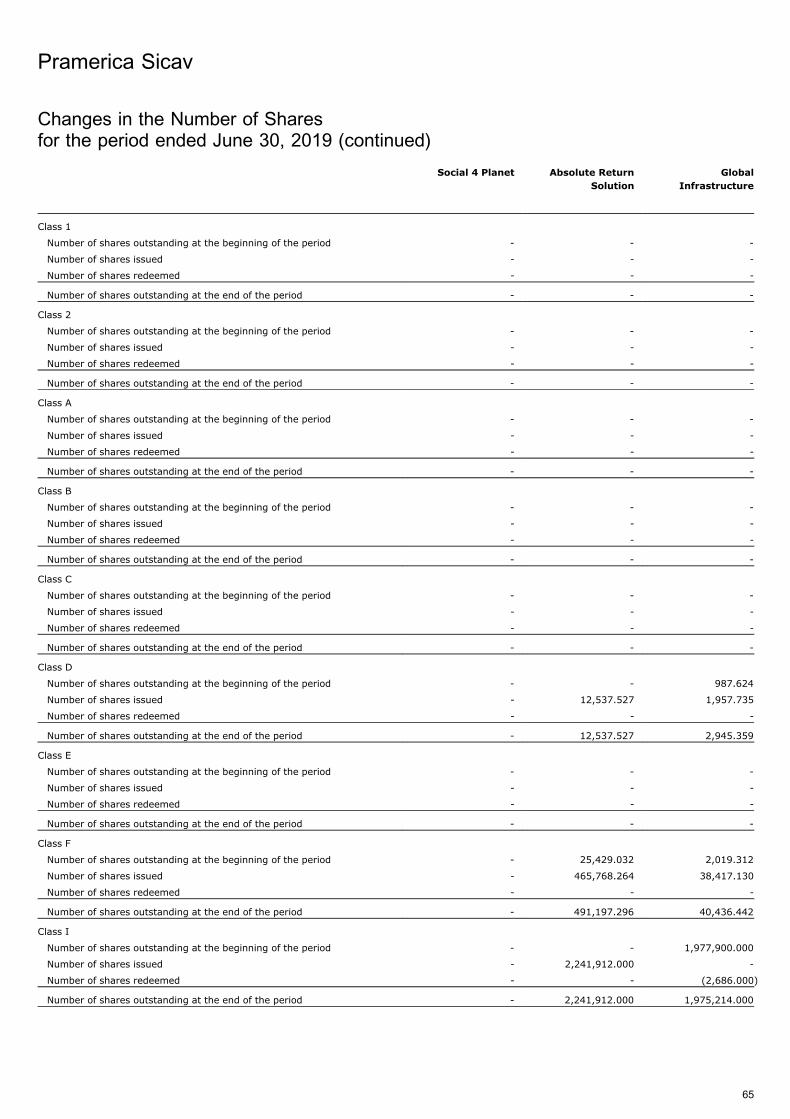
Social 4 Planet Absolute Return
Solution
Global
Infrastructure
Class 1
Number of shares outstanding at the beginning of the period - - -
Number of shares issued - - -
Number of shares redeemed - - -
Number of shares outstanding at the end of the period - - -
Class 2
Number of shares outstanding at the beginning of the period - - -
Number of shares issued - - -
Number of shares redeemed - - -
Number of shares outstanding at the end of the period - - -
Class A
Number of shares outstanding at the beginning of the period - - -
Number of shares issued - - -
Number of shares redeemed - - -
Number of shares outstanding at the end of the period - - -
Class B
Number of shares outstanding at the beginning of the period - - -
Number of shares issued - - -
Number of shares redeemed - - -
Number of shares outstanding at the end of the period - - -
Class C
Number of shares outstanding at the beginning of the period - - -
Number of shares issued - - -
Number of shares redeemed - - -
Number of shares outstanding at the end of the period - - -
Class D
Number of shares outstanding at the beginning of the period - - 987.624
Number of shares issued - 12,537.527 1,957.735
Number of shares redeemed - - -
Number of shares outstanding at the end of the period - 12,537.527 2,945.359
Class E
Number of shares outstanding at the beginning of the period - - -
Number of shares issued - - -
Number of shares redeemed - - -
Number of shares outstanding at the end of the period - - -
Class F
Number of shares outstanding at the beginning of the period - 25,429.032 2,019.312
Number of shares issued - 465,768.264 38,417.130
Number of shares redeemed - - -
Number of shares outstanding at the end of the period - 491,197.296 40,436.442
Class I
Number of shares outstanding at the beginning of the period - - 1,977,900.000
Number of shares issued - 2,241,912.000 -
Number of shares redeemed - - (2,686.000)
Number of shares outstanding at the end of the period - 2,241,912.000 1,975,214.000
Pramerica Sicav
65
Changes in the Number of Sharesfor the period ended June 30, 2019 (continued)
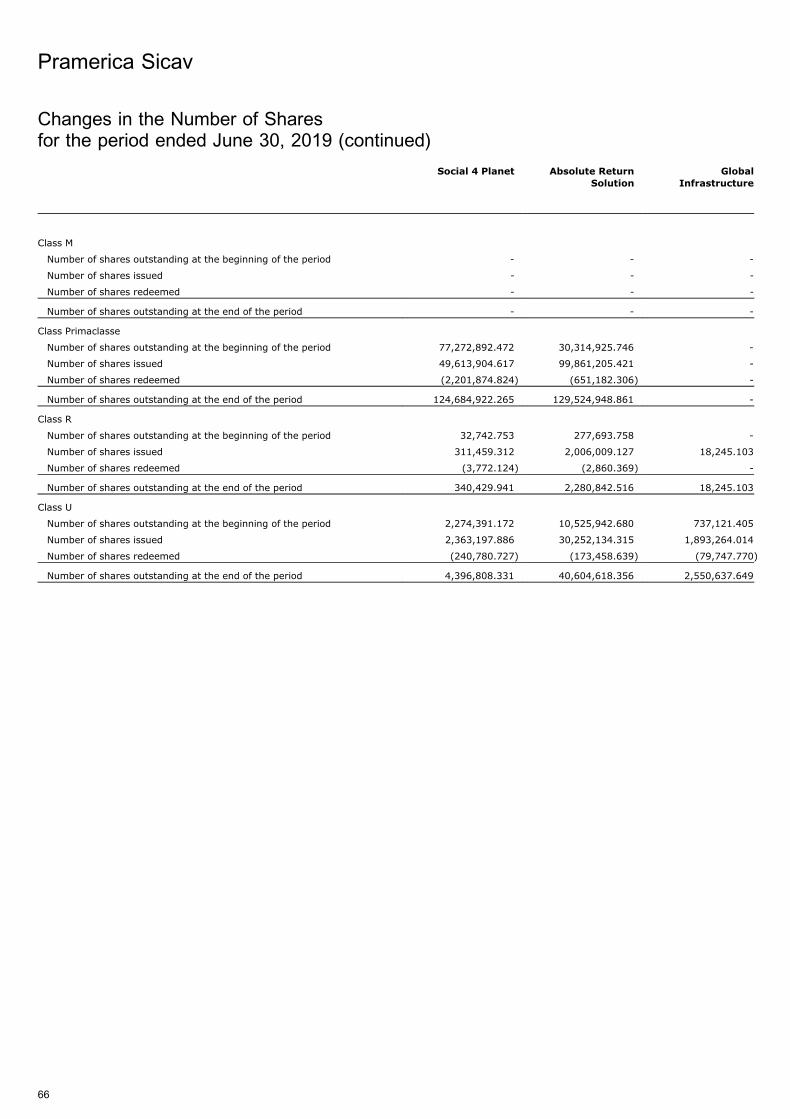
Social 4 Planet Absolute Return
Solution
Global
Infrastructure
Class M
Number of shares outstanding at the beginning of the period - - -
Number of shares issued - - -
Number of shares redeemed - - -
Number of shares outstanding at the end of the period - - -
Class Primaclasse
Number of shares outstanding at the beginning of the period 77,272,892.472 30,314,925.746 -
Number of shares issued 49,613,904.617 99,861,205.421 -
Number of shares redeemed (2,201,874.824) (651,182.306) -
Number of shares outstanding at the end of the period 124,684,922.265 129,524,948.861 -
Class R
Number of shares outstanding at the beginning of the period 32,742.753 277,693.758 -
Number of shares issued 311,459.312 2,006,009.127 18,245.103
Number of shares redeemed (3,772.124) (2,860.369) -
Number of shares outstanding at the end of the period 340,429.941 2,280,842.516 18,245.103
Class U
Number of shares outstanding at the beginning of the period 2,274,391.172 10,525,942.680 737,121.405
Number of shares issued 2,363,197.886 30,252,134.315 1,893,264.014
Number of shares redeemed (240,780.727) (173,458.639) (79,747.770)
Number of shares outstanding at the end of the period 4,396,808.331 40,604,618.356 2,550,637.649
Pramerica Sicav
66
Changes in the Number of Sharesfor the period ended June 30, 2019 (continued)
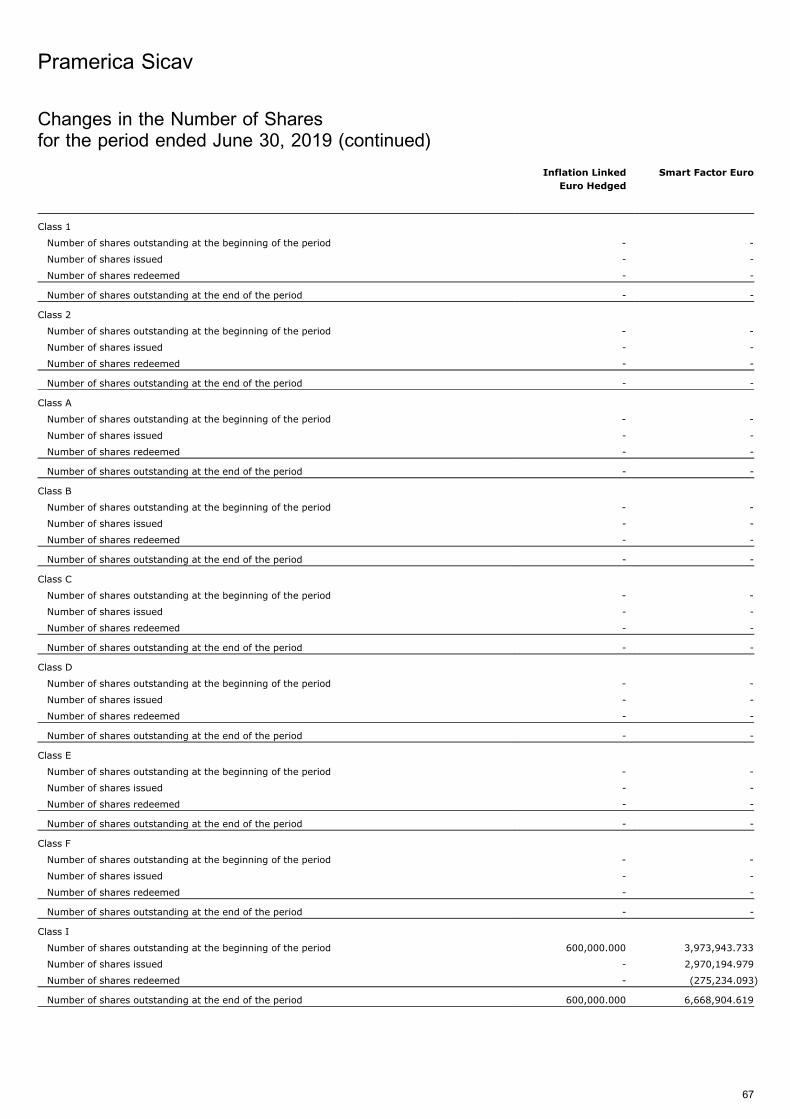
Inflation Linked
Euro Hedged
Smart Factor Euro
Class 1
Number of shares outstanding at the beginning of the period - -
Number of shares issued - -
Number of shares redeemed - -
Number of shares outstanding at the end of the period - -
Class 2
Number of shares outstanding at the beginning of the period - -
Number of shares issued - -
Number of shares redeemed - -
Number of shares outstanding at the end of the period - -
Class A
Number of shares outstanding at the beginning of the period - -
Number of shares issued - -
Number of shares redeemed - -
Number of shares outstanding at the end of the period - -
Class B
Number of shares outstanding at the beginning of the period - -
Number of shares issued - -
Number of shares redeemed - -
Number of shares outstanding at the end of the period - -
Class C
Number of shares outstanding at the beginning of the period - -
Number of shares issued - -
Number of shares redeemed - -
Number of shares outstanding at the end of the period - -
Class D
Number of shares outstanding at the beginning of the period - -
Number of shares issued - -
Number of shares redeemed - -
Number of shares outstanding at the end of the period - -
Class E
Number of shares outstanding at the beginning of the period - -
Number of shares issued - -
Number of shares redeemed - -
Number of shares outstanding at the end of the period - -
Class F
Number of shares outstanding at the beginning of the period - -
Number of shares issued - -
Number of shares redeemed - -
Number of shares outstanding at the end of the period - -
Class I
Number of shares outstanding at the beginning of the period 600,000.000 3,973,943.733
Number of shares issued - 2,970,194.979
Number of shares redeemed - (275,234.093)
Number of shares outstanding at the end of the period 600,000.000 6,668,904.619
Pramerica Sicav
67
Changes in the Number of Sharesfor the period ended June 30, 2019 (continued)
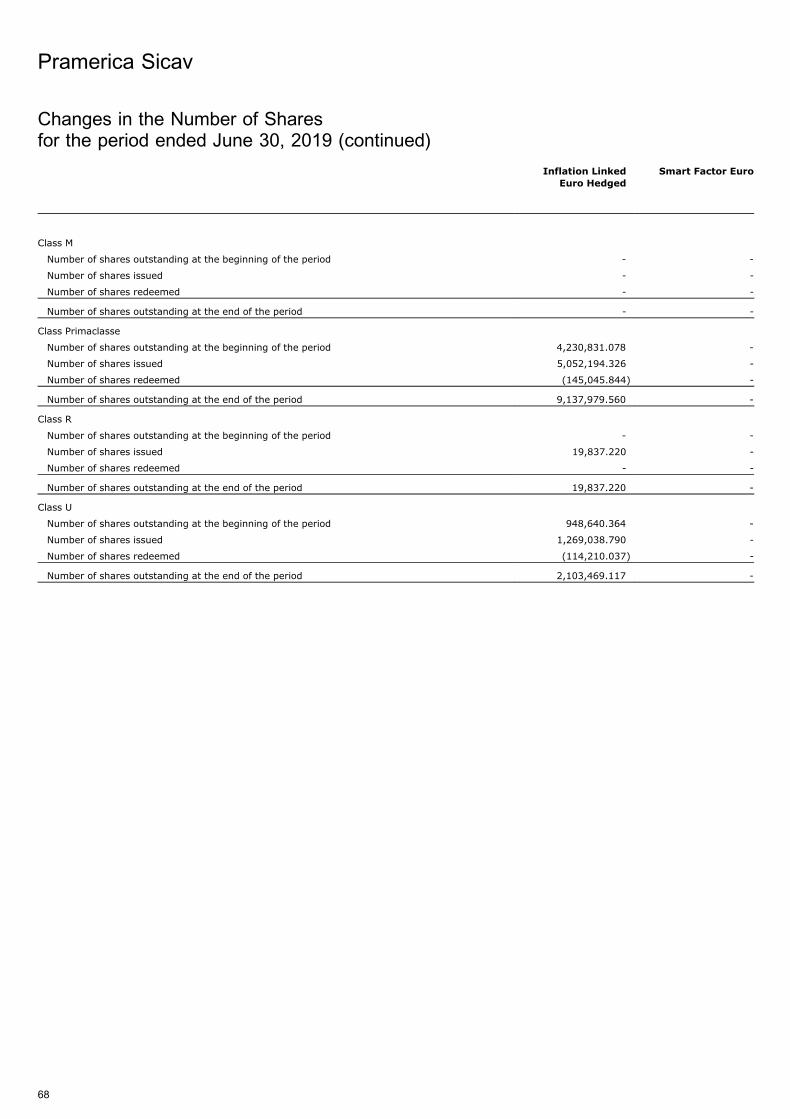
Inflation Linked
Euro Hedged
Smart Factor Euro
Class M
Number of shares outstanding at the beginning of the period - -
Number of shares issued - -
Number of shares redeemed - -
Number of shares outstanding at the end of the period - -
Class Primaclasse
Number of shares outstanding at the beginning of the period 4,230,831.078 -
Number of shares issued 5,052,194.326 -
Number of shares redeemed (145,045.844) -
Number of shares outstanding at the end of the period 9,137,979.560 -
Class R
Number of shares outstanding at the beginning of the period - -
Number of shares issued 19,837.220 -
Number of shares redeemed - -
Number of shares outstanding at the end of the period 19,837.220 -
Class U
Number of shares outstanding at the beginning of the period 948,640.364 -
Number of shares issued 1,269,038.790 -
Number of shares redeemed (114,210.037) -
Number of shares outstanding at the end of the period 2,103,469.117 -
Pramerica Sicav
68
Changes in the Number of Sharesfor the period ended June 30, 2019 (continued)
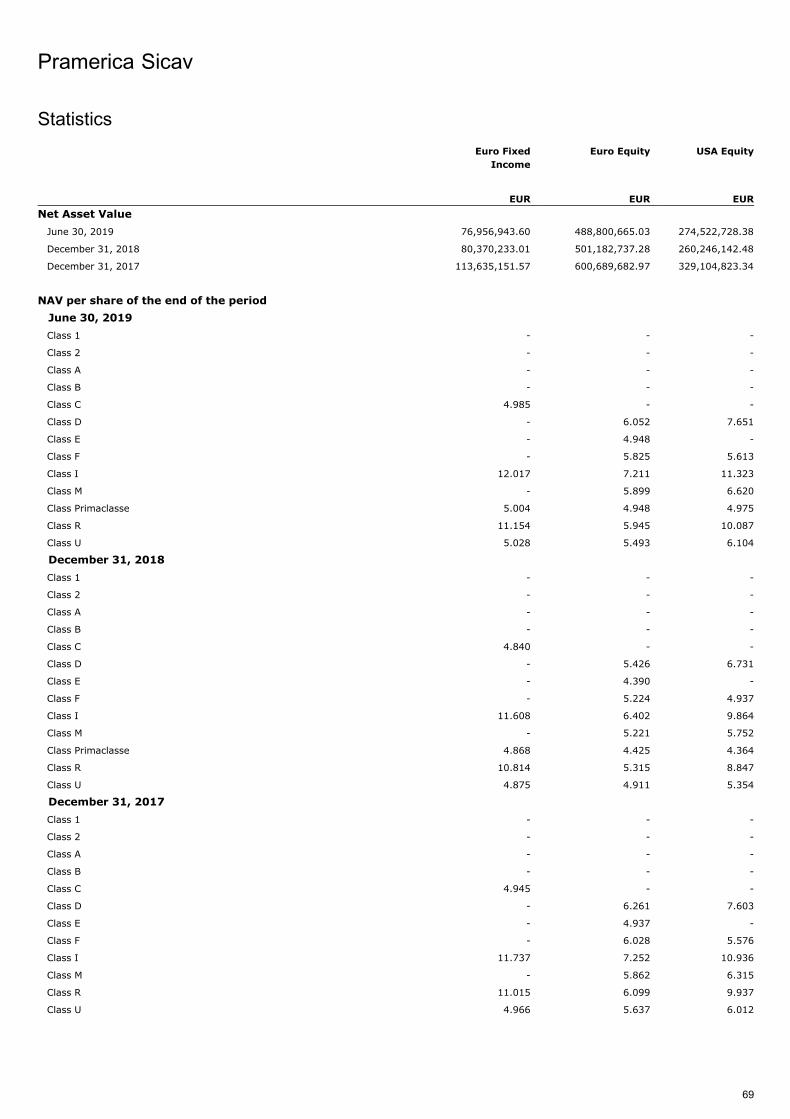
Statistics
Euro Fixed
Income
Euro Equity USA Equity
EUR EUR EUR
Net Asset Value
June 30, 2019 76,956,943.60 488,800,665.03 274,522,728.38
December 31, 2018 80,370,233.01 501,182,737.28 260,246,142.48
December 31, 2017 113,635,151.57 600,689,682.97 329,104,823.34
NAV per share of the end of the period
June 30, 2019
Class 1 - - -
Class 2 - - -
Class A - - -
Class B - - -
Class C 4.985 - -
Class D - 6.052 7.651
Class E - 4.948 -
Class F - 5.825 5.613
Class I 12.017 7.211 11.323
Class M - 5.899 6.620
Class Primaclasse 5.004 4.948 4.975
Class R 11.154 5.945 10.087
Class U 5.028 5.493 6.104
December 31, 2018
Class 1 - - -
Class 2 - - -
Class A - - -
Class B - - -
Class C 4.840 - -
Class D - 5.426 6.731
Class E - 4.390 -
Class F - 5.224 4.937
Class I 11.608 6.402 9.864
Class M - 5.221 5.752
Class Primaclasse 4.868 4.425 4.364
Class R 10.814 5.315 8.847
Class U 4.875 4.911 5.354
December 31, 2017
Class 1 - - -
Class 2 - - -
Class A - - -
Class B - - -
Class C 4.945 - -
Class D - 6.261 7.603
Class E - 4.937 -
Class F - 6.028 5.576
Class I 11.737 7.252 10.936
Class M - 5.862 6.315
Class R 11.015 6.099 9.937
Class U 4.966 5.637 6.012
Pramerica Sicav
69
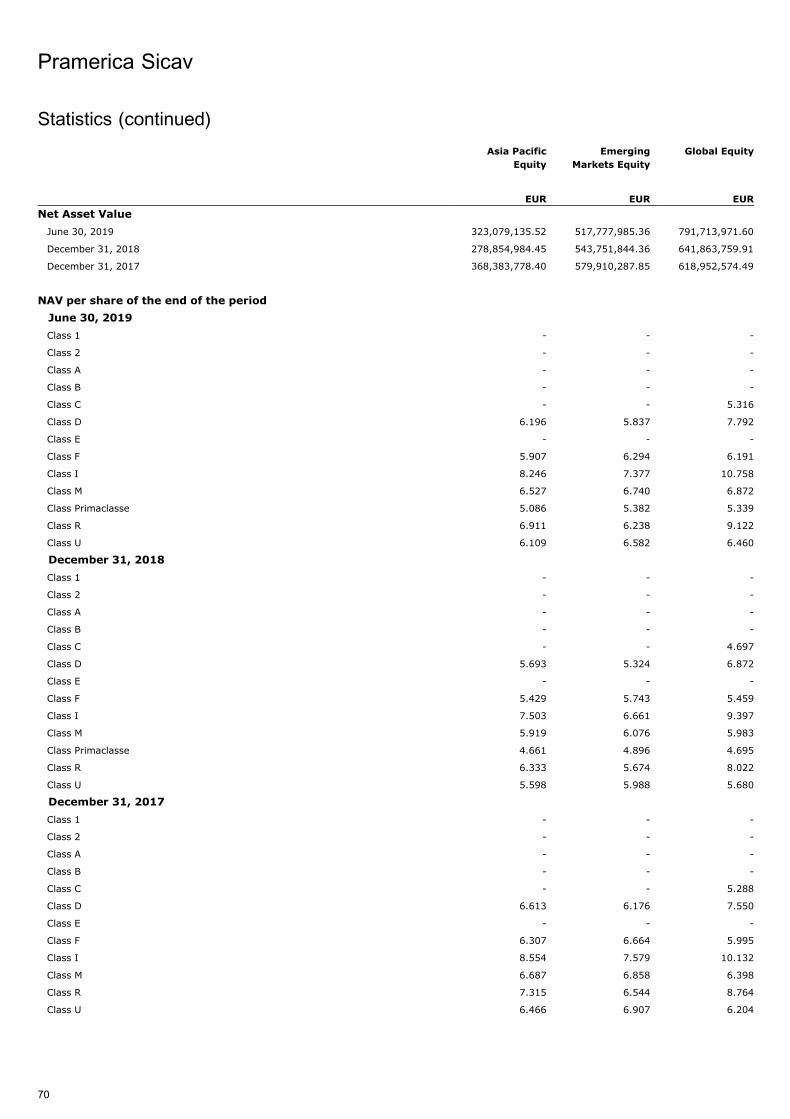
Asia Pacific
Equity
Emerging
Markets Equity
Global Equity
EUR EUR EUR
Net Asset Value
June 30, 2019 323,079,135.52 517,777,985.36 791,713,971.60
December 31, 2018 278,854,984.45 543,751,844.36 641,863,759.91
December 31, 2017 368,383,778.40 579,910,287.85 618,952,574.49
NAV per share of the end of the period
June 30, 2019
Class 1 - - -
Class 2 - - -
Class A - - -
Class B - - -
Class C - - 5.316
Class D 6.196 5.837 7.792
Class E - - -
Class F 5.907 6.294 6.191
Class I 8.246 7.377 10.758
Class M 6.527 6.740 6.872
Class Primaclasse 5.086 5.382 5.339
Class R 6.911 6.238 9.122
Class U 6.109 6.582 6.460
December 31, 2018
Class 1 - - -
Class 2 - - -
Class A - - -
Class B - - -
Class C - - 4.697
Class D 5.693 5.324 6.872
Class E - - -
Class F 5.429 5.743 5.459
Class I 7.503 6.661 9.397
Class M 5.919 6.076 5.983
Class Primaclasse 4.661 4.896 4.695
Class R 6.333 5.674 8.022
Class U 5.598 5.988 5.680
December 31, 2017
Class 1 - - -
Class 2 - - -
Class A - - -
Class B - - -
Class C - - 5.288
Class D 6.613 6.176 7.550
Class E - - -
Class F 6.307 6.664 5.995
Class I 8.554 7.579 10.132
Class M 6.687 6.858 6.398
Class R 7.315 6.544 8.764
Class U 6.466 6.907 6.204
Pramerica Sicav
70
Statistics (continued)
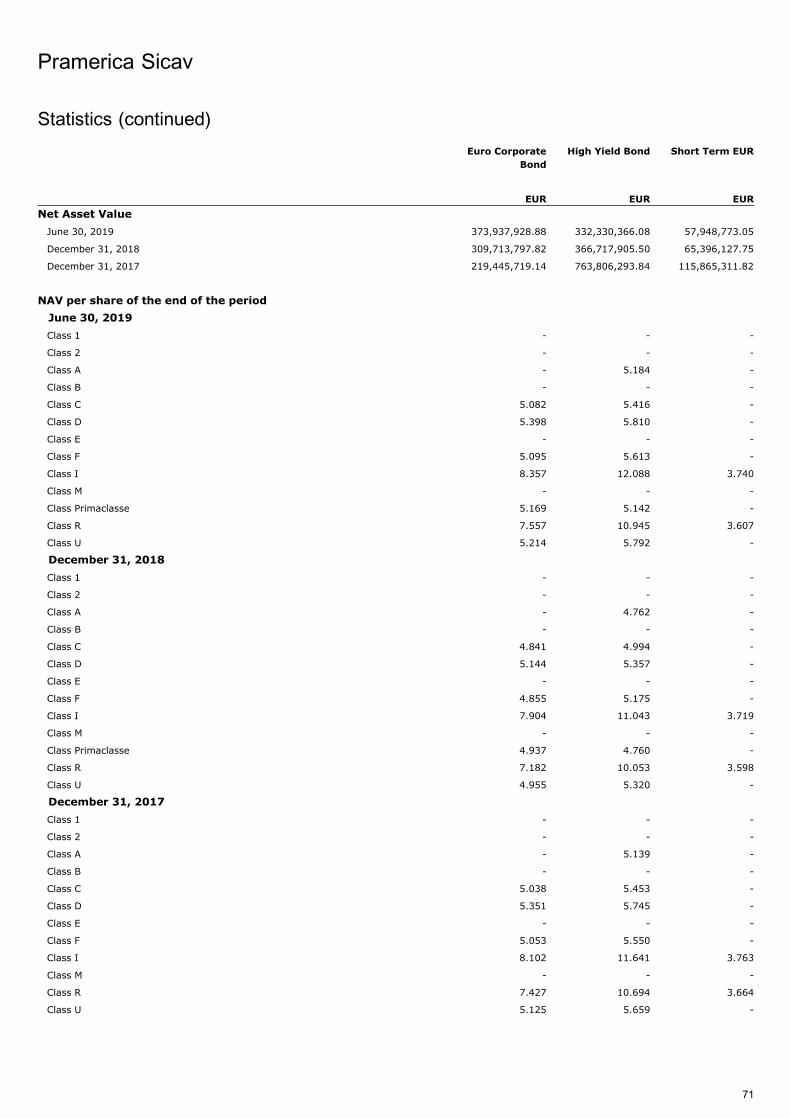
Euro Corporate
Bond
High Yield Bond Short Term EUR
EUR EUR EUR
Net Asset Value
June 30, 2019 373,937,928.88 332,330,366.08 57,948,773.05
December 31, 2018 309,713,797.82 366,717,905.50 65,396,127.75
December 31, 2017 219,445,719.14 763,806,293.84 115,865,311.82
NAV per share of the end of the period
June 30, 2019
Class 1 - - -
Class 2 - - -
Class A - 5.184 -
Class B - - -
Class C 5.082 5.416 -
Class D 5.398 5.810 -
Class E - - -
Class F 5.095 5.613 -
Class I 8.357 12.088 3.740
Class M - - -
Class Primaclasse 5.169 5.142 -
Class R 7.557 10.945 3.607
Class U 5.214 5.792 -
December 31, 2018
Class 1 - - -
Class 2 - - -
Class A - 4.762 -
Class B - - -
Class C 4.841 4.994 -
Class D 5.144 5.357 -
Class E - - -
Class F 4.855 5.175 -
Class I 7.904 11.043 3.719
Class M - - -
Class Primaclasse 4.937 4.760 -
Class R 7.182 10.053 3.598
Class U 4.955 5.320 -
December 31, 2017
Class 1 - - -
Class 2 - - -
Class A - 5.139 -
Class B - - -
Class C 5.038 5.453 -
Class D 5.351 5.745 -
Class E - - -
Class F 5.053 5.550 -
Class I 8.102 11.641 3.763
Class M - - -
Class R 7.427 10.694 3.664
Class U 5.125 5.659 -
Pramerica Sicav
71
Statistics (continued)
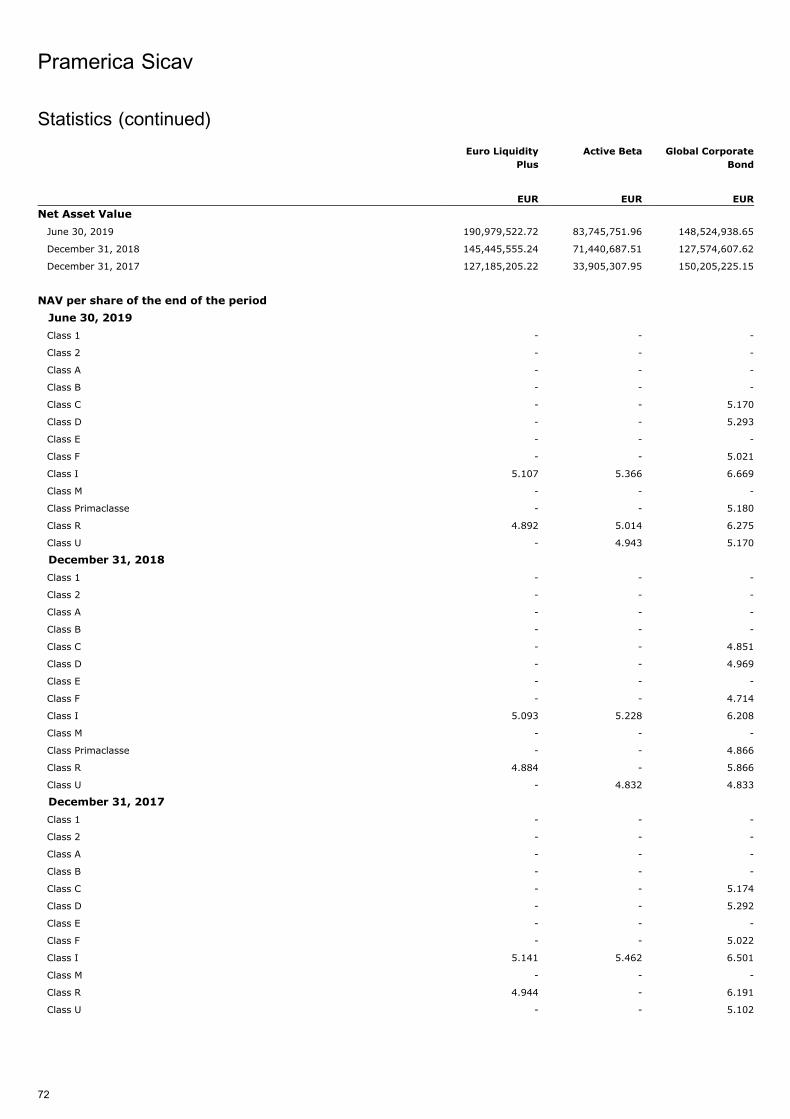
Euro Liquidity
Plus
Active Beta Global Corporate
Bond
EUR EUR EUR
Net Asset Value
June 30, 2019 190,979,522.72 83,745,751.96 148,524,938.65
December 31, 2018 145,445,555.24 71,440,687.51 127,574,607.62
December 31, 2017 127,185,205.22 33,905,307.95 150,205,225.15
NAV per share of the end of the period
June 30, 2019
Class 1 - - -
Class 2 - - -
Class A - - -
Class B - - -
Class C - - 5.170
Class D - - 5.293
Class E - - -
Class F - - 5.021
Class I 5.107 5.366 6.669
Class M - - -
Class Primaclasse - - 5.180
Class R 4.892 5.014 6.275
Class U - 4.943 5.170
December 31, 2018
Class 1 - - -
Class 2 - - -
Class A - - -
Class B - - -
Class C - - 4.851
Class D - - 4.969
Class E - - -
Class F - - 4.714
Class I 5.093 5.228 6.208
Class M - - -
Class Primaclasse - - 4.866
Class R 4.884 - 5.866
Class U - 4.832 4.833
December 31, 2017
Class 1 - - -
Class 2 - - -
Class A - - -
Class B - - -
Class C - - 5.174
Class D - - 5.292
Class E - - -
Class F - - 5.022
Class I 5.141 5.462 6.501
Class M - - -
Class R 4.944 - 6.191
Class U - - 5.102
Pramerica Sicav
72
Statistics (continued)
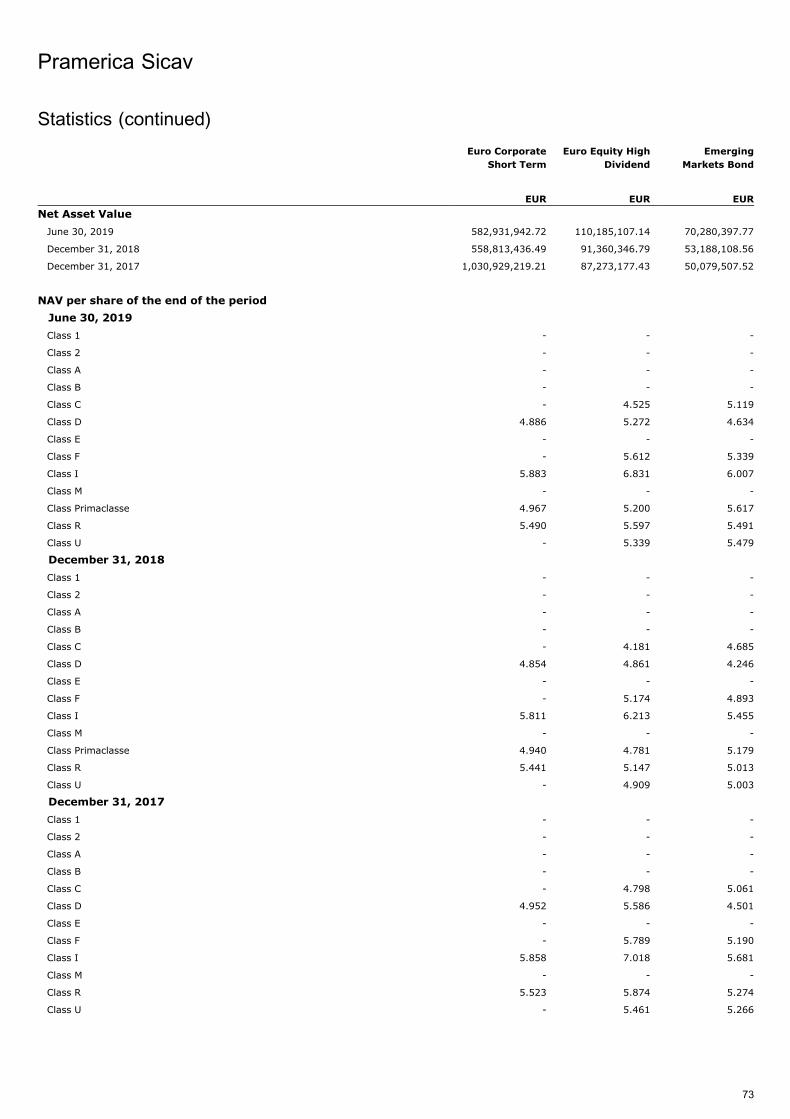
Euro Corporate
Short Term
Euro Equity High
Dividend
Emerging
Markets Bond
EUR EUR EUR
Net Asset Value
June 30, 2019 582,931,942.72 110,185,107.14 70,280,397.77
December 31, 2018 558,813,436.49 91,360,346.79 53,188,108.56
December 31, 2017 1,030,929,219.21 87,273,177.43 50,079,507.52
NAV per share of the end of the period
June 30, 2019
Class 1 - - -
Class 2 - - -
Class A - - -
Class B - - -
Class C - 4.525 5.119
Class D 4.886 5.272 4.634
Class E - - -
Class F - 5.612 5.339
Class I 5.883 6.831 6.007
Class M - - -
Class Primaclasse 4.967 5.200 5.617
Class R 5.490 5.597 5.491
Class U - 5.339 5.479
December 31, 2018
Class 1 - - -
Class 2 - - -
Class A - - -
Class B - - -
Class C - 4.181 4.685
Class D 4.854 4.861 4.246
Class E - - -
Class F - 5.174 4.893
Class I 5.811 6.213 5.455
Class M - - -
Class Primaclasse 4.940 4.781 5.179
Class R 5.441 5.147 5.013
Class U - 4.909 5.003
December 31, 2017
Class 1 - - -
Class 2 - - -
Class A - - -
Class B - - -
Class C - 4.798 5.061
Class D 4.952 5.586 4.501
Class E - - -
Class F - 5.789 5.190
Class I 5.858 7.018 5.681
Class M - - -
Class R 5.523 5.874 5.274
Class U - 5.461 5.266
Pramerica Sicav
73
Statistics (continued)
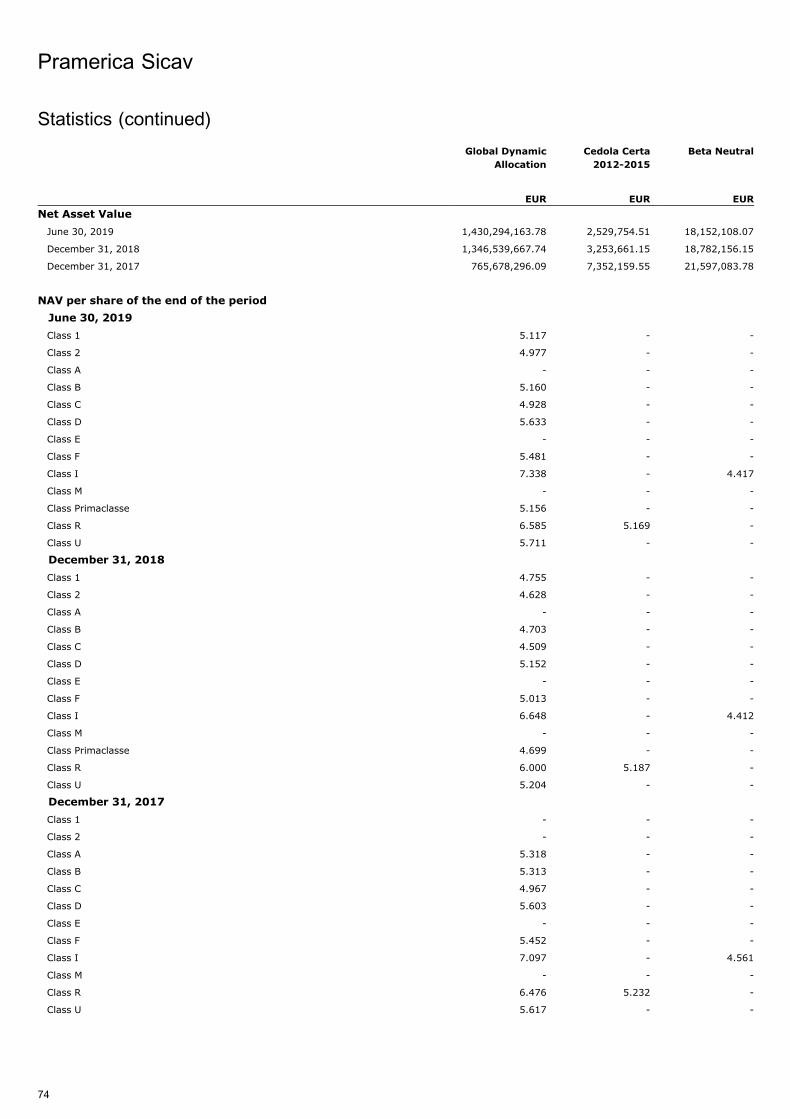
Global Dynamic
Allocation
Cedola Certa
2012-2015
Beta Neutral
EUR EUR EUR
Net Asset Value
June 30, 2019 1,430,294,163.78 2,529,754.51 18,152,108.07
December 31, 2018 1,346,539,667.74 3,253,661.15 18,782,156.15
December 31, 2017 765,678,296.09 7,352,159.55 21,597,083.78
NAV per share of the end of the period
June 30, 2019
Class 1 5.117 - -
Class 2 4.977 - -
Class A - - -
Class B 5.160 - -
Class C 4.928 - -
Class D 5.633 - -
Class E - - -
Class F 5.481 - -
Class I 7.338 - 4.417
Class M - - -
Class Primaclasse 5.156 - -
Class R 6.585 5.169 -
Class U 5.711 - -
December 31, 2018
Class 1 4.755 - -
Class 2 4.628 - -
Class A - - -
Class B 4.703 - -
Class C 4.509 - -
Class D 5.152 - -
Class E - - -
Class F 5.013 - -
Class I 6.648 - 4.412
Class M - - -
Class Primaclasse 4.699 - -
Class R 6.000 5.187 -
Class U 5.204 - -
December 31, 2017
Class 1 - - -
Class 2 - - -
Class A 5.318 - -
Class B 5.313 - -
Class C 4.967 - -
Class D 5.603 - -
Class E - - -
Class F 5.452 - -
Class I 7.097 - 4.561
Class M - - -
Class R 6.476 5.232 -
Class U 5.617 - -
Pramerica Sicav
74
Statistics (continued)
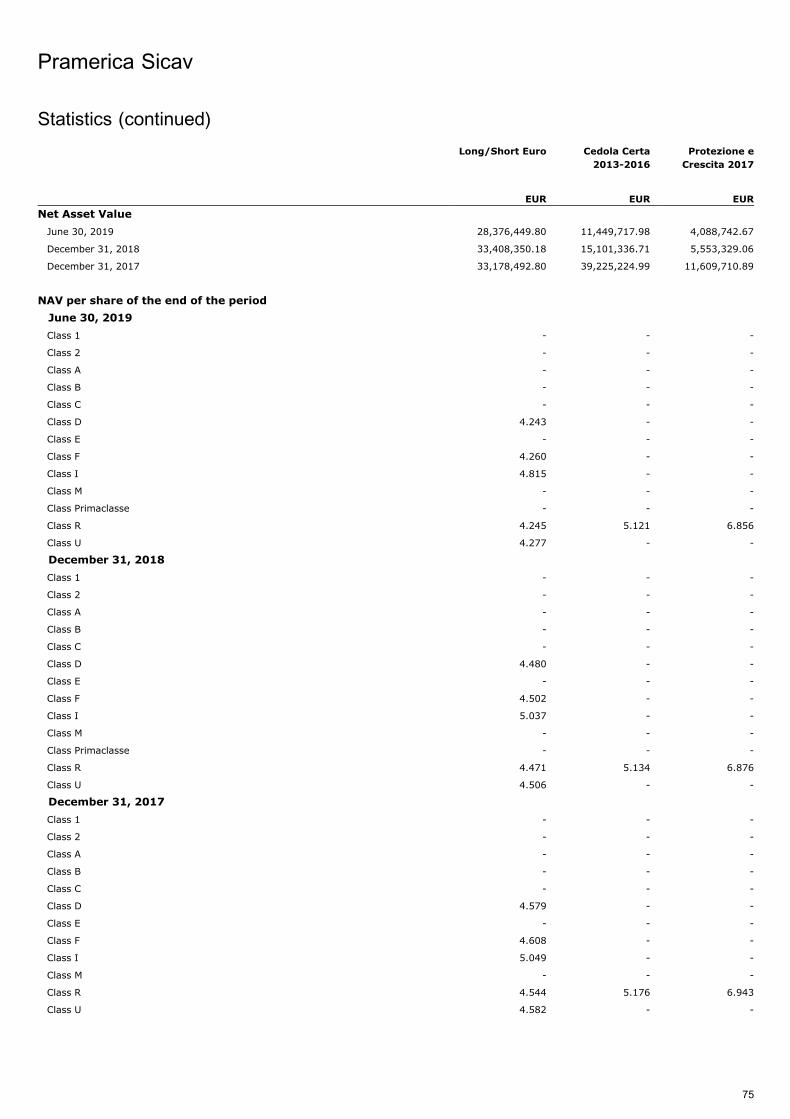
Long/Short Euro Cedola Certa
2013-2016
Protezione e
Crescita 2017
EUR EUR EUR
Net Asset Value
June 30, 2019 28,376,449.80 11,449,717.98 4,088,742.67
December 31, 2018 33,408,350.18 15,101,336.71 5,553,329.06
December 31, 2017 33,178,492.80 39,225,224.99 11,609,710.89
NAV per share of the end of the period
June 30, 2019
Class 1 - - -
Class 2 - - -
Class A - - -
Class B - - -
Class C - - -
Class D 4.243 - -
Class E - - -
Class F 4.260 - -
Class I 4.815 - -
Class M - - -
Class Primaclasse - - -
Class R 4.245 5.121 6.856
Class U 4.277 - -
December 31, 2018
Class 1 - - -
Class 2 - - -
Class A - - -
Class B - - -
Class C - - -
Class D 4.480 - -
Class E - - -
Class F 4.502 - -
Class I 5.037 - -
Class M - - -
Class Primaclasse - - -
Class R 4.471 5.134 6.876
Class U 4.506 - -
December 31, 2017
Class 1 - - -
Class 2 - - -
Class A - - -
Class B - - -
Class C - - -
Class D 4.579 - -
Class E - - -
Class F 4.608 - -
Class I 5.049 - -
Class M - - -
Class R 4.544 5.176 6.943
Class U 4.582 - -
Pramerica Sicav
75
Statistics (continued)
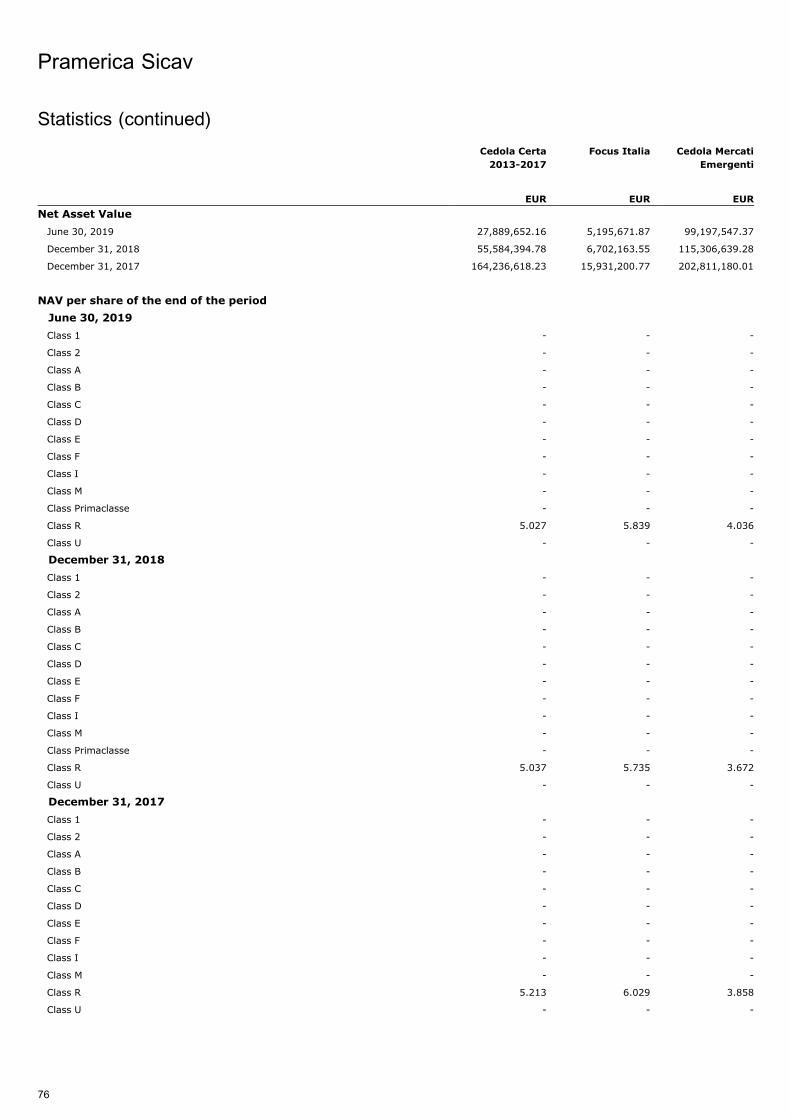
Cedola Certa
2013-2017
Focus Italia Cedola Mercati
Emergenti
EUR EUR EUR
Net Asset Value
June 30, 2019 27,889,652.16 5,195,671.87 99,197,547.37
December 31, 2018 55,584,394.78 6,702,163.55 115,306,639.28
December 31, 2017 164,236,618.23 15,931,200.77 202,811,180.01
NAV per share of the end of the period
June 30, 2019
Class 1 - - -
Class 2 - - -
Class A - - -
Class B - - -
Class C - - -
Class D - - -
Class E - - -
Class F - - -
Class I - - -
Class M - - -
Class Primaclasse - - -
Class R 5.027 5.839 4.036
Class U - - -
December 31, 2018
Class 1 - - -
Class 2 - - -
Class A - - -
Class B - - -
Class C - - -
Class D - - -
Class E - - -
Class F - - -
Class I - - -
Class M - - -
Class Primaclasse - - -
Class R 5.037 5.735 3.672
Class U - - -
December 31, 2017
Class 1 - - -
Class 2 - - -
Class A - - -
Class B - - -
Class C - - -
Class D - - -
Class E - - -
Class F - - -
Class I - - -
Class M - - -
Class R 5.213 6.029 3.858
Class U - - -
Pramerica Sicav
76
Statistics (continued)
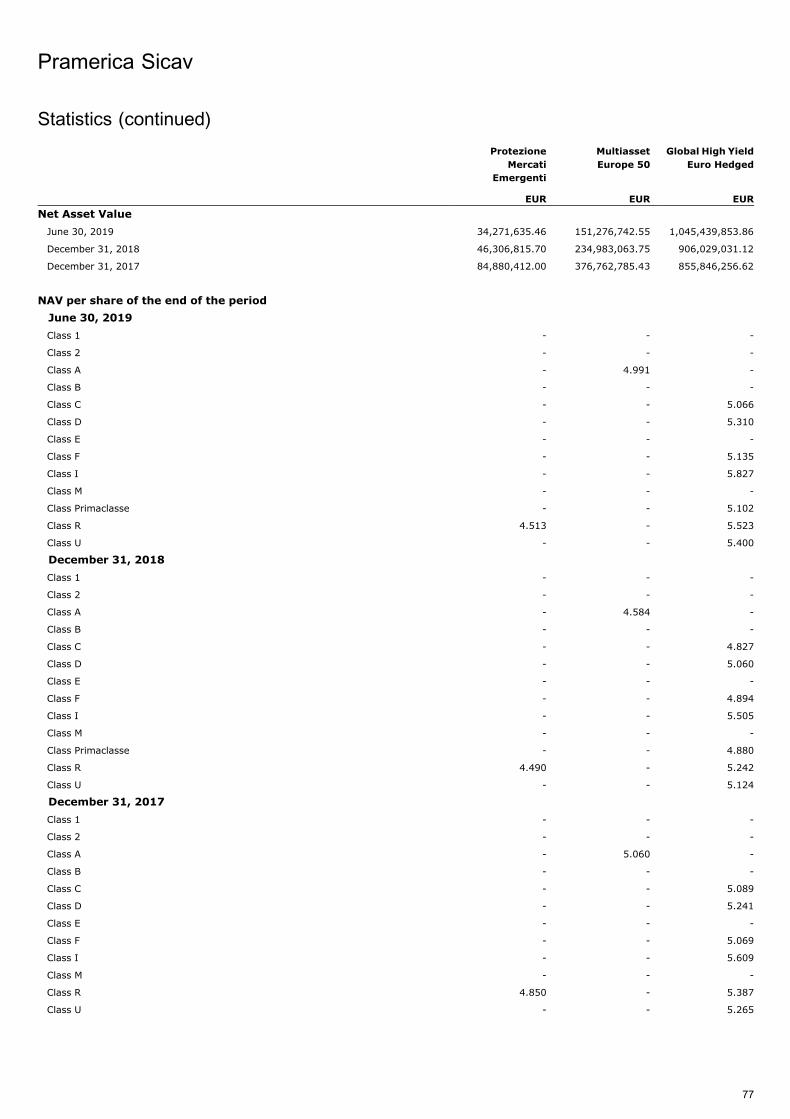
Protezione
Mercati
Emergenti
Multiasset
Europe 50
Global High Yield
Euro Hedged
EUR EUR EUR
Net Asset Value
June 30, 2019 34,271,635.46 151,276,742.55 1,045,439,853.86
December 31, 2018 46,306,815.70 234,983,063.75 906,029,031.12
December 31, 2017 84,880,412.00 376,762,785.43 855,846,256.62
NAV per share of the end of the period
June 30, 2019
Class 1 - - -
Class 2 - - -
Class A - 4.991 -
Class B - - -
Class C - - 5.066
Class D - - 5.310
Class E - - -
Class F - - 5.135
Class I - - 5.827
Class M - - -
Class Primaclasse - - 5.102
Class R 4.513 - 5.523
Class U - - 5.400
December 31, 2018
Class 1 - - -
Class 2 - - -
Class A - 4.584 -
Class B - - -
Class C - - 4.827
Class D - - 5.060
Class E - - -
Class F - - 4.894
Class I - - 5.505
Class M - - -
Class Primaclasse - - 4.880
Class R 4.490 - 5.242
Class U - - 5.124
December 31, 2017
Class 1 - - -
Class 2 - - -
Class A - 5.060 -
Class B - - -
Class C - - 5.089
Class D - - 5.241
Class E - - -
Class F - - 5.069
Class I - - 5.609
Class M - - -
Class R 4.850 - 5.387
Class U - - 5.265
Pramerica Sicav
77
Statistics (continued)
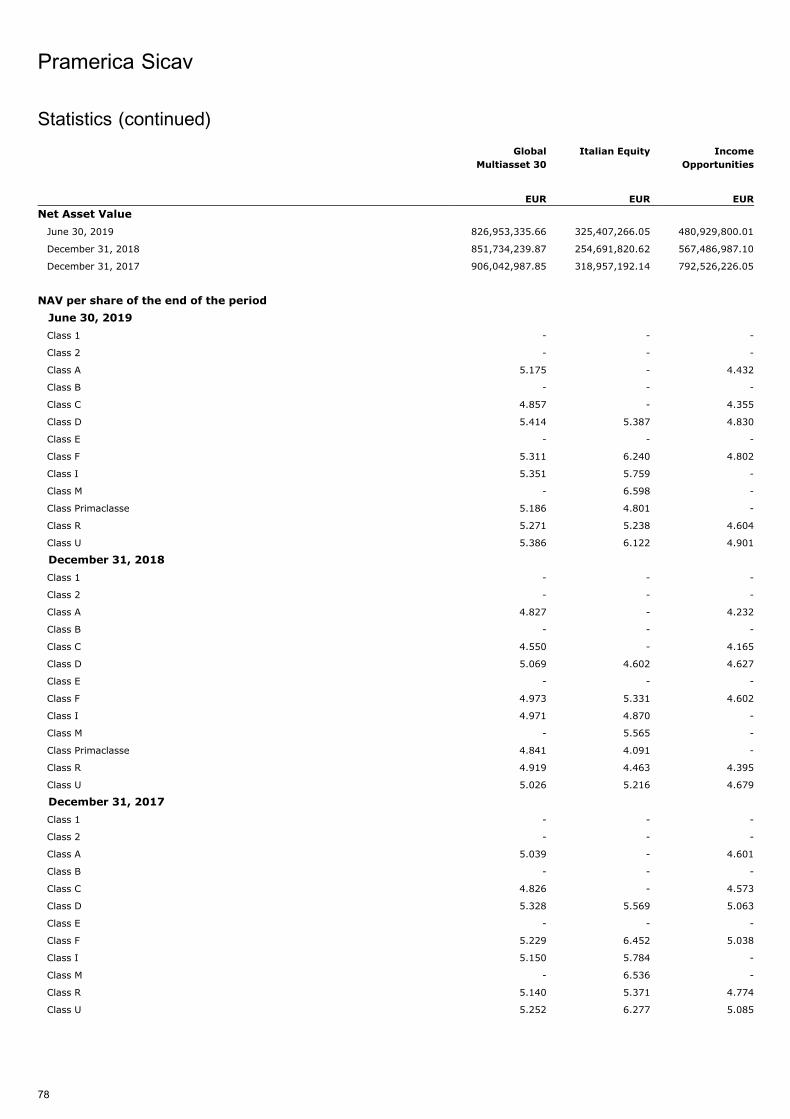
Global
Multiasset 30
Italian Equity Income
Opportunities
EUR EUR EUR
Net Asset Value
June 30, 2019 826,953,335.66 325,407,266.05 480,929,800.01
December 31, 2018 851,734,239.87 254,691,820.62 567,486,987.10
December 31, 2017 906,042,987.85 318,957,192.14 792,526,226.05
NAV per share of the end of the period
June 30, 2019
Class 1 - - -
Class 2 - - -
Class A 5.175 - 4.432
Class B - - -
Class C 4.857 - 4.355
Class D 5.414 5.387 4.830
Class E - - -
Class F 5.311 6.240 4.802
Class I 5.351 5.759 -
Class M - 6.598 -
Class Primaclasse 5.186 4.801 -
Class R 5.271 5.238 4.604
Class U 5.386 6.122 4.901
December 31, 2018
Class 1 - - -
Class 2 - - -
Class A 4.827 - 4.232
Class B - - -
Class C 4.550 - 4.165
Class D 5.069 4.602 4.627
Class E - - -
Class F 4.973 5.331 4.602
Class I 4.971 4.870 -
Class M - 5.565 -
Class Primaclasse 4.841 4.091 -
Class R 4.919 4.463 4.395
Class U 5.026 5.216 4.679
December 31, 2017
Class 1 - - -
Class 2 - - -
Class A 5.039 - 4.601
Class B - - -
Class C 4.826 - 4.573
Class D 5.328 5.569 5.063
Class E - - -
Class F 5.229 6.452 5.038
Class I 5.150 5.784 -
Class M - 6.536 -
Class R 5.140 5.371 4.774
Class U 5.252 6.277 5.085
Pramerica Sicav
78
Statistics (continued)
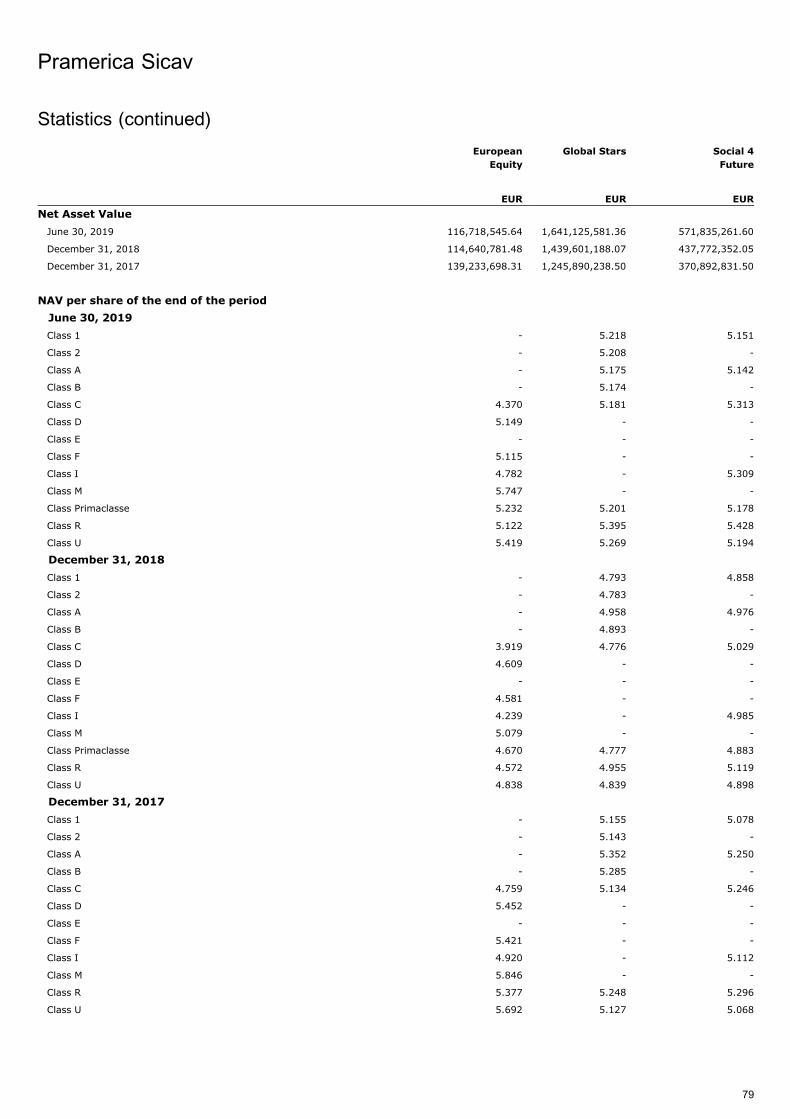
European
Equity
Global Stars Social 4
Future
EUR EUR EUR
Net Asset Value
June 30, 2019 116,718,545.64 1,641,125,581.36 571,835,261.60
December 31, 2018 114,640,781.48 1,439,601,188.07 437,772,352.05
December 31, 2017 139,233,698.31 1,245,890,238.50 370,892,831.50
NAV per share of the end of the period
June 30, 2019
Class 1 - 5.218 5.151
Class 2 - 5.208 -
Class A - 5.175 5.142
Class B - 5.174 -
Class C 4.370 5.181 5.313
Class D 5.149 - -
Class E - - -
Class F 5.115 - -
Class I 4.782 - 5.309
Class M 5.747 - -
Class Primaclasse 5.232 5.201 5.178
Class R 5.122 5.395 5.428
Class U 5.419 5.269 5.194
December 31, 2018
Class 1 - 4.793 4.858
Class 2 - 4.783 -
Class A - 4.958 4.976
Class B - 4.893 -
Class C 3.919 4.776 5.029
Class D 4.609 - -
Class E - - -
Class F 4.581 - -
Class I 4.239 - 4.985
Class M 5.079 - -
Class Primaclasse 4.670 4.777 4.883
Class R 4.572 4.955 5.119
Class U 4.838 4.839 4.898
December 31, 2017
Class 1 - 5.155 5.078
Class 2 - 5.143 -
Class A - 5.352 5.250
Class B - 5.285 -
Class C 4.759 5.134 5.246
Class D 5.452 - -
Class E - - -
Class F 5.421 - -
Class I 4.920 - 5.112
Class M 5.846 - -
Class R 5.377 5.248 5.296
Class U 5.692 5.127 5.068
Pramerica Sicav
79
Statistics (continued)
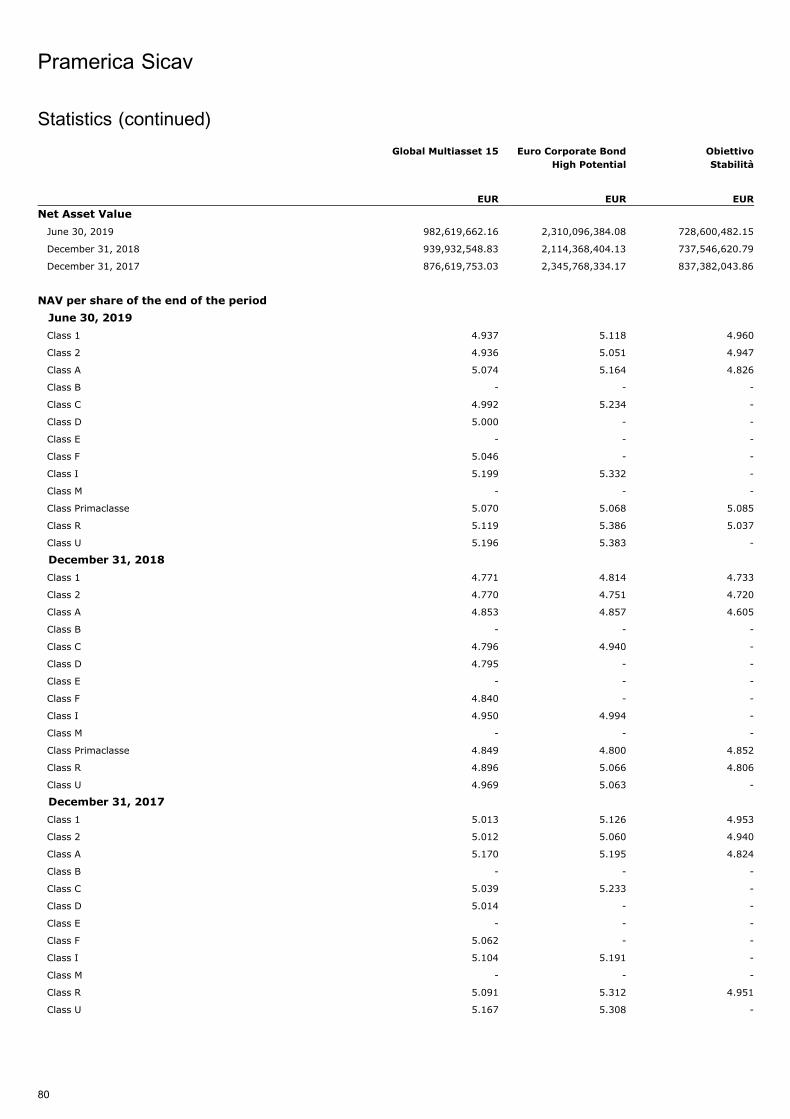
Global Multiasset 15 Euro Corporate Bond
High Potential
Obiettivo
Stabilita
EUR EUR EUR
Net Asset Value
June 30, 2019 982,619,662.16 2,310,096,384.08 728,600,482.15
December 31, 2018 939,932,548.83 2,114,368,404.13 737,546,620.79
December 31, 2017 876,619,753.03 2,345,768,334.17 837,382,043.86
NAV per share of the end of the period
June 30, 2019
Class 1 4.937 5.118 4.960
Class 2 4.936 5.051 4.947
Class A 5.074 5.164 4.826
Class B - - -
Class C 4.992 5.234 -
Class D 5.000 - -
Class E - - -
Class F 5.046 - -
Class I 5.199 5.332 -
Class M - - -
Class Primaclasse 5.070 5.068 5.085
Class R 5.119 5.386 5.037
Class U 5.196 5.383 -
December 31, 2018
Class 1 4.771 4.814 4.733
Class 2 4.770 4.751 4.720
Class A 4.853 4.857 4.605
Class B - - -
Class C 4.796 4.940 -
Class D 4.795 - -
Class E - - -
Class F 4.840 - -
Class I 4.950 4.994 -
Class M - - -
Class Primaclasse 4.849 4.800 4.852
Class R 4.896 5.066 4.806
Class U 4.969 5.063 -
December 31, 2017
Class 1 5.013 5.126 4.953
Class 2 5.012 5.060 4.940
Class A 5.170 5.195 4.824
Class B - - -
Class C 5.039 5.233 -
Class D 5.014 - -
Class E - - -
Class F 5.062 - -
Class I 5.104 5.191 -
Class M - - -
Class R 5.091 5.312 4.951
Class U 5.167 5.308 -
Pramerica Sicav
80
Statistics (continued)
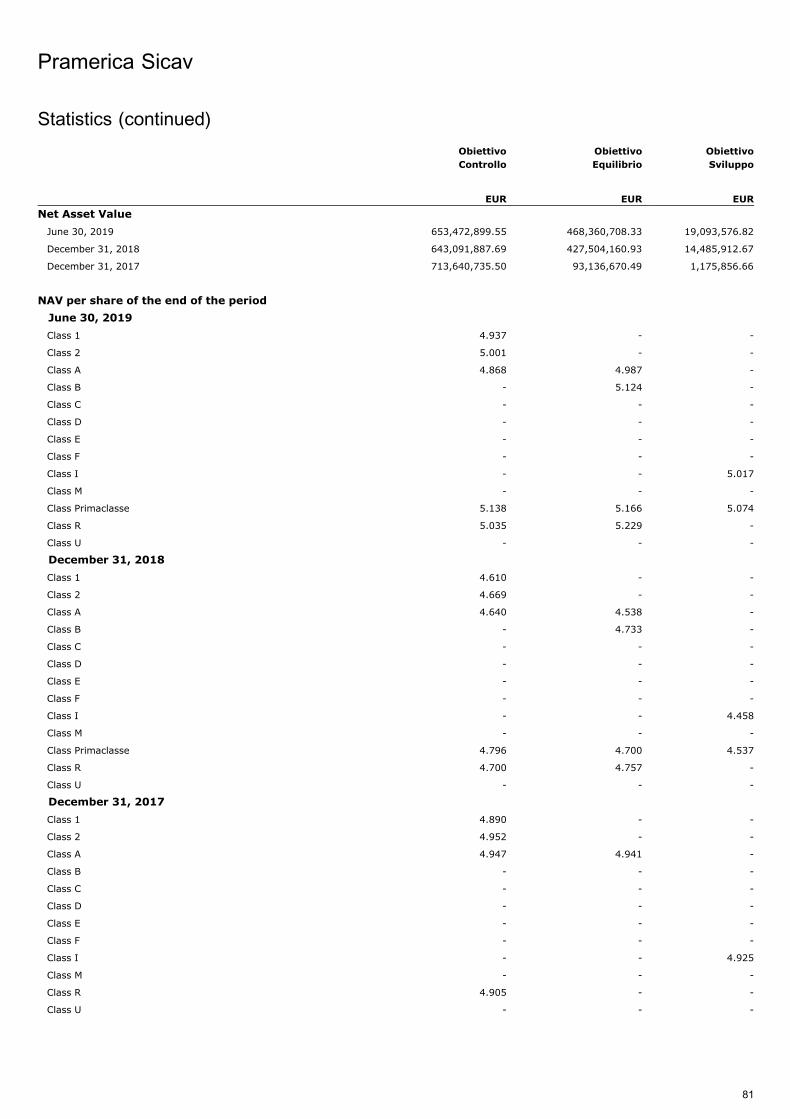
Obiettivo
Controllo
Obiettivo
Equilibrio
Obiettivo
Sviluppo
EUR EUR EUR
Net Asset Value
June 30, 2019 653,472,899.55 468,360,708.33 19,093,576.82
December 31, 2018 643,091,887.69 427,504,160.93 14,485,912.67
December 31, 2017 713,640,735.50 93,136,670.49 1,175,856.66
NAV per share of the end of the period
June 30, 2019
Class 1 4.937 - -
Class 2 5.001 - -
Class A 4.868 4.987 -
Class B - 5.124 -
Class C - - -
Class D - - -
Class E - - -
Class F - - -
Class I - - 5.017
Class M - - -
Class Primaclasse 5.138 5.166 5.074
Class R 5.035 5.229 -
Class U - - -
December 31, 2018
Class 1 4.610 - -
Class 2 4.669 - -
Class A 4.640 4.538 -
Class B - 4.733 -
Class C - - -
Class D - - -
Class E - - -
Class F - - -
Class I - - 4.458
Class M - - -
Class Primaclasse 4.796 4.700 4.537
Class R 4.700 4.757 -
Class U - - -
December 31, 2017
Class 1 4.890 - -
Class 2 4.952 - -
Class A 4.947 4.941 -
Class B - - -
Class C - - -
Class D - - -
Class E - - -
Class F - - -
Class I - - 4.925
Class M - - -
Class R 4.905 - -
Class U - - -
Pramerica Sicav
81
Statistics (continued)
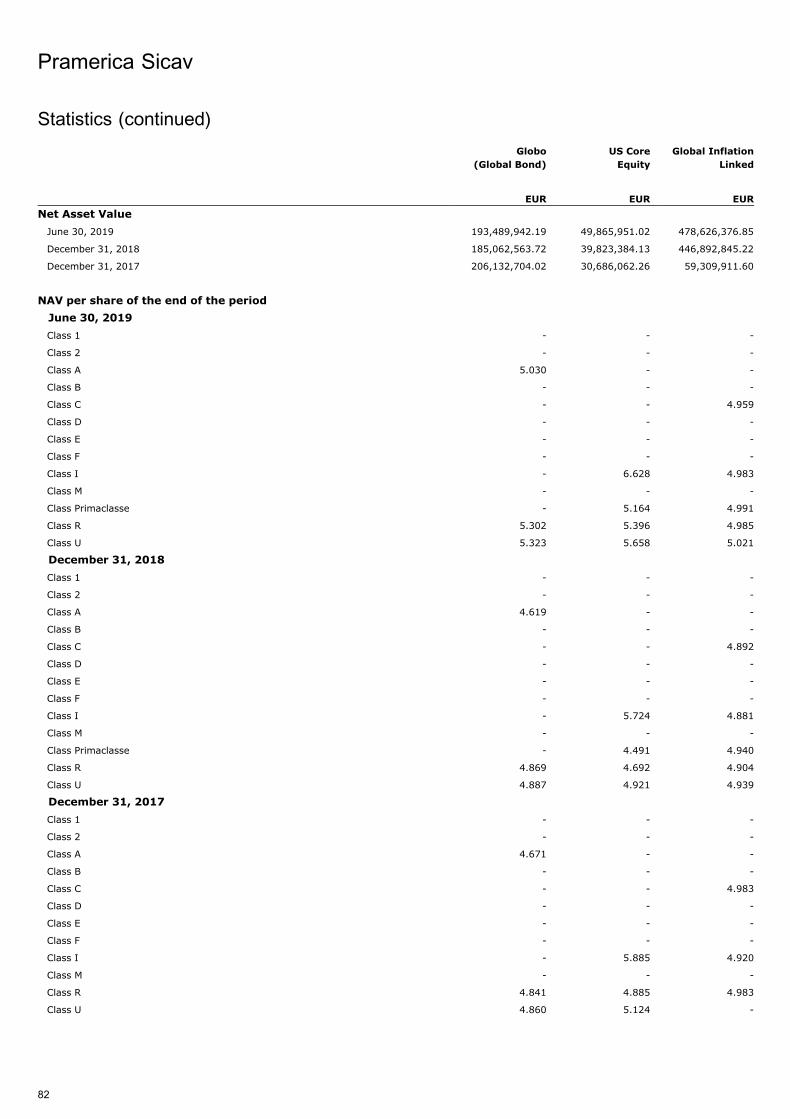
Globo
(Global Bond)
US Core
Equity
Global Inflation
Linked
EUR EUR EUR
Net Asset Value
June 30, 2019 193,489,942.19 49,865,951.02 478,626,376.85
December 31, 2018 185,062,563.72 39,823,384.13 446,892,845.22
December 31, 2017 206,132,704.02 30,686,062.26 59,309,911.60
NAV per share of the end of the period
June 30, 2019
Class 1 - - -
Class 2 - - -
Class A 5.030 - -
Class B - - -
Class C - - 4.959
Class D - - -
Class E - - -
Class F - - -
Class I - 6.628 4.983
Class M - - -
Class Primaclasse - 5.164 4.991
Class R 5.302 5.396 4.985
Class U 5.323 5.658 5.021
December 31, 2018
Class 1 - - -
Class 2 - - -
Class A 4.619 - -
Class B - - -
Class C - - 4.892
Class D - - -
Class E - - -
Class F - - -
Class I - 5.724 4.881
Class M - - -
Class Primaclasse - 4.491 4.940
Class R 4.869 4.692 4.904
Class U 4.887 4.921 4.939
December 31, 2017
Class 1 - - -
Class 2 - - -
Class A 4.671 - -
Class B - - -
Class C - - 4.983
Class D - - -
Class E - - -
Class F - - -
Class I - 5.885 4.920
Class M - - -
Class R 4.841 4.885 4.983
Class U 4.860 5.124 -
Pramerica Sicav
82
Statistics (continued)
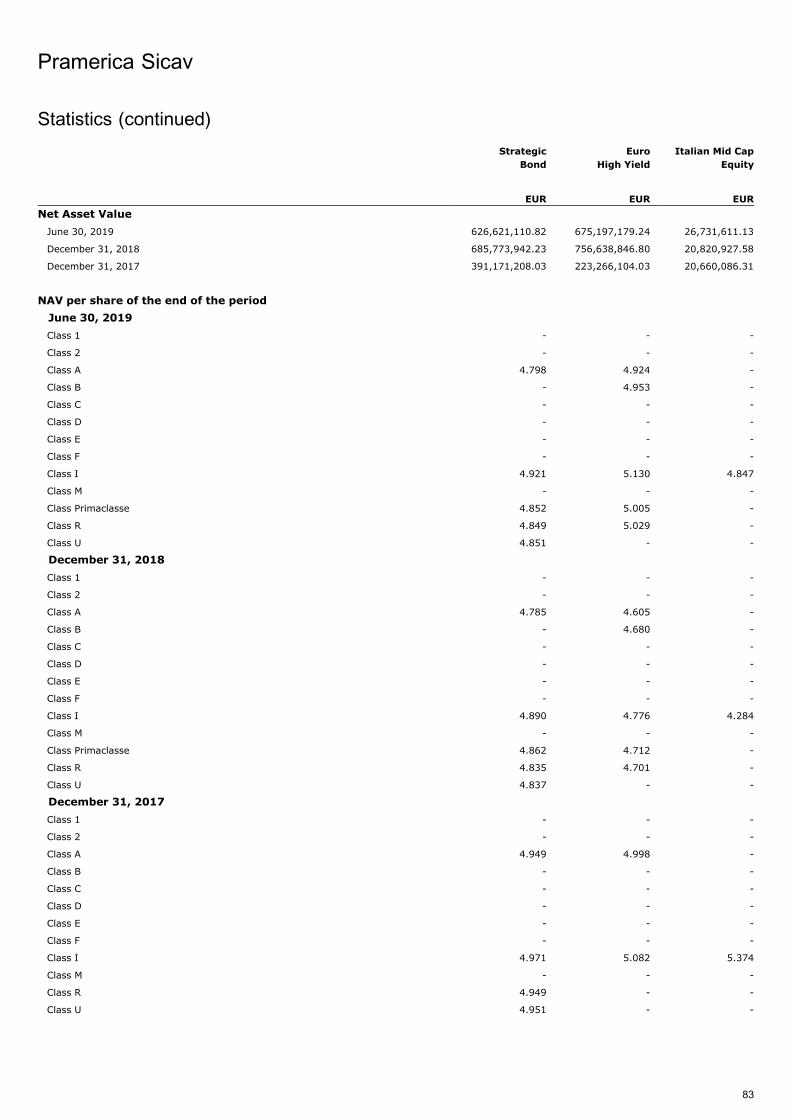
Strategic
Bond
Euro
High Yield
Italian Mid Cap
Equity
EUR EUR EUR
Net Asset Value
June 30, 2019 626,621,110.82 675,197,179.24 26,731,611.13
December 31, 2018 685,773,942.23 756,638,846.80 20,820,927.58
December 31, 2017 391,171,208.03 223,266,104.03 20,660,086.31
NAV per share of the end of the period
June 30, 2019
Class 1 - - -
Class 2 - - -
Class A 4.798 4.924 -
Class B - 4.953 -
Class C - - -
Class D - - -
Class E - - -
Class F - - -
Class I 4.921 5.130 4.847
Class M - - -
Class Primaclasse 4.852 5.005 -
Class R 4.849 5.029 -
Class U 4.851 - -
December 31, 2018
Class 1 - - -
Class 2 - - -
Class A 4.785 4.605 -
Class B - 4.680 -
Class C - - -
Class D - - -
Class E - - -
Class F - - -
Class I 4.890 4.776 4.284
Class M - - -
Class Primaclasse 4.862 4.712 -
Class R 4.835 4.701 -
Class U 4.837 - -
December 31, 2017
Class 1 - - -
Class 2 - - -
Class A 4.949 4.998 -
Class B - - -
Class C - - -
Class D - - -
Class E - - -
Class F - - -
Class I 4.971 5.082 5.374
Class M - - -
Class R 4.949 - -
Class U 4.951 - -
Pramerica Sicav
83
Statistics (continued)
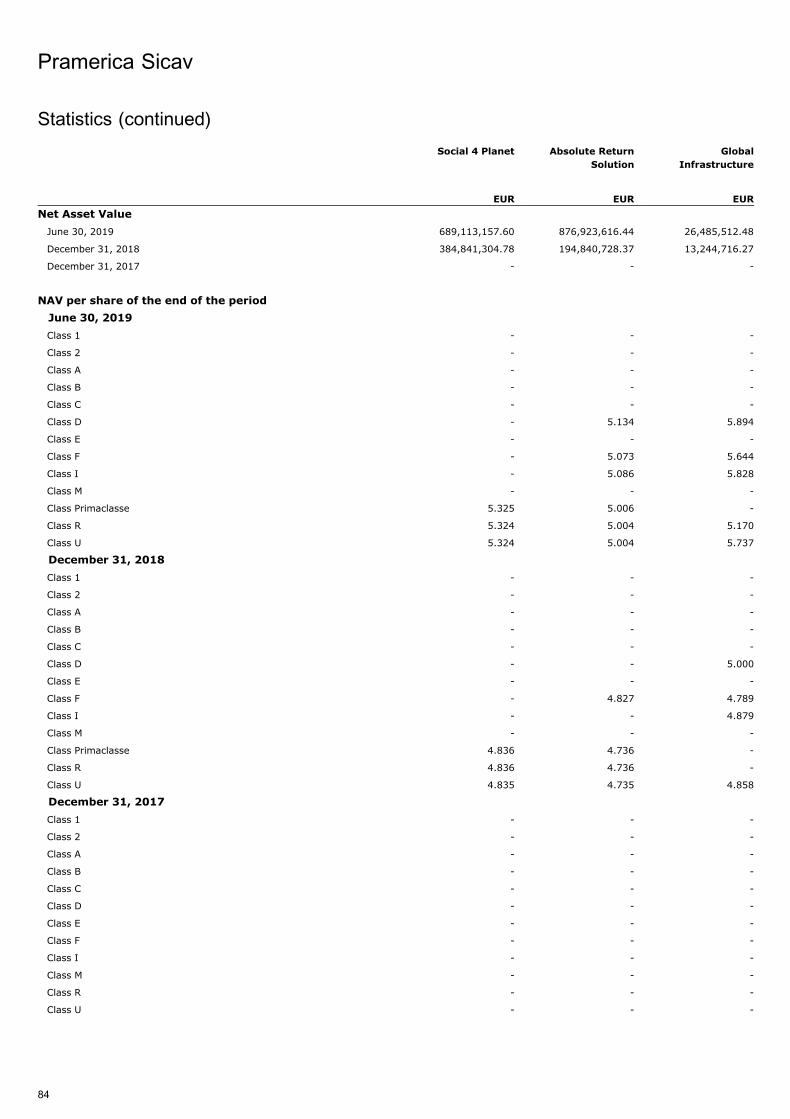
Social 4 Planet Absolute Return
Solution
Global
Infrastructure
EUR EUR EUR
Net Asset Value
June 30, 2019 689,113,157.60 876,923,616.44 26,485,512.48
December 31, 2018 384,841,304.78 194,840,728.37 13,244,716.27
December 31, 2017 - - -
NAV per share of the end of the period
June 30, 2019
Class 1 - - -
Class 2 - - -
Class A - - -
Class B - - -
Class C - - -
Class D - 5.134 5.894
Class E - - -
Class F - 5.073 5.644
Class I - 5.086 5.828
Class M - - -
Class Primaclasse 5.325 5.006 -
Class R 5.324 5.004 5.170
Class U 5.324 5.004 5.737
December 31, 2018
Class 1 - - -
Class 2 - - -
Class A - - -
Class B - - -
Class C - - -
Class D - - 5.000
Class E - - -
Class F - 4.827 4.789
Class I - - 4.879
Class M - - -
Class Primaclasse 4.836 4.736 -
Class R 4.836 4.736 -
Class U 4.835 4.735 4.858
December 31, 2017
Class 1 - - -
Class 2 - - -
Class A - - -
Class B - - -
Class C - - -
Class D - - -
Class E - - -
Class F - - -
Class I - - -
Class M - - -
Class R - - -
Class U - - -
Pramerica Sicav
84
Statistics (continued)
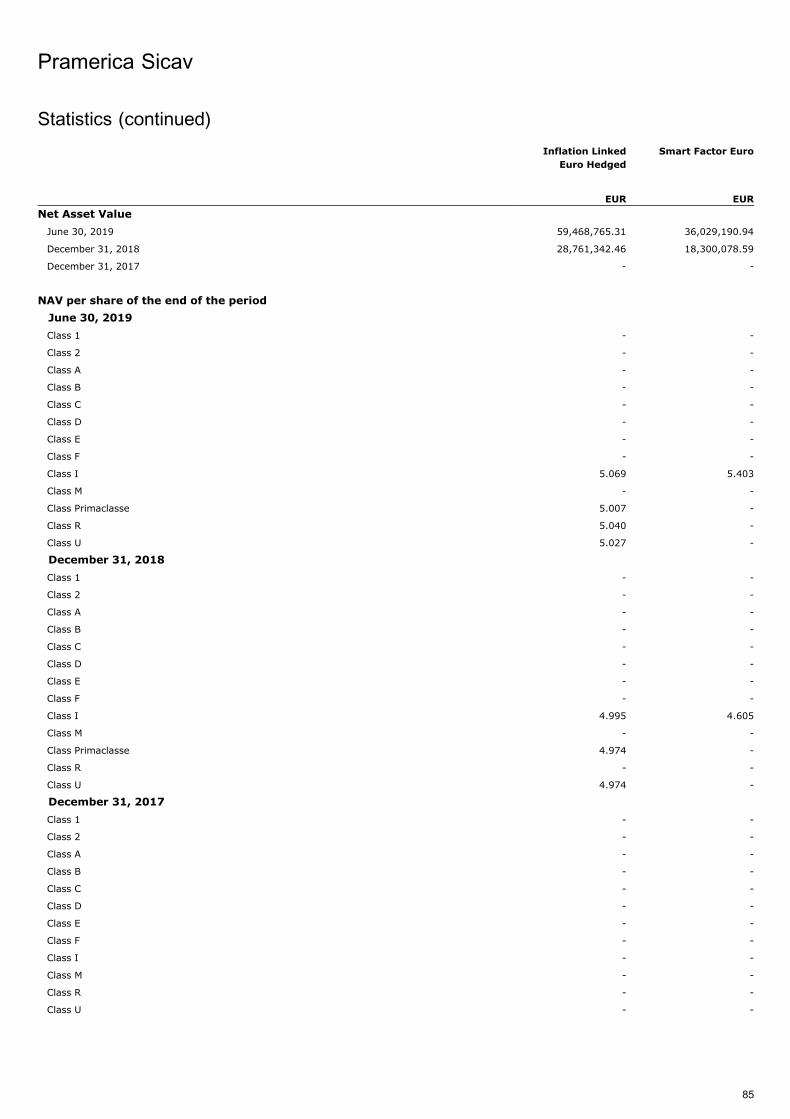
Inflation Linked
Euro Hedged
Smart Factor Euro
EUR EUR
Net Asset Value
June 30, 2019 59,468,765.31 36,029,190.94
December 31, 2018 28,761,342.46 18,300,078.59
December 31, 2017 - -
NAV per share of the end of the period
June 30, 2019
Class 1 - -
Class 2 - -
Class A - -
Class B - -
Class C - -
Class D - -
Class E - -
Class F - -
Class I 5.069 5.403
Class M - -
Class Primaclasse 5.007 -
Class R 5.040 -
Class U 5.027 -
December 31, 2018
Class 1 - -
Class 2 - -
Class A - -
Class B - -
Class C - -
Class D - -
Class E - -
Class F - -
Class I 4.995 4.605
Class M - -
Class Primaclasse 4.974 -
Class R - -
Class U 4.974 -
December 31, 2017
Class 1 - -
Class 2 - -
Class A - -
Class B - -
Class C - -
Class D - -
Class E - -
Class F - -
Class I - -
Class M - -
Class R - -
Class U - -
Pramerica Sicav
85
Statistics (continued)
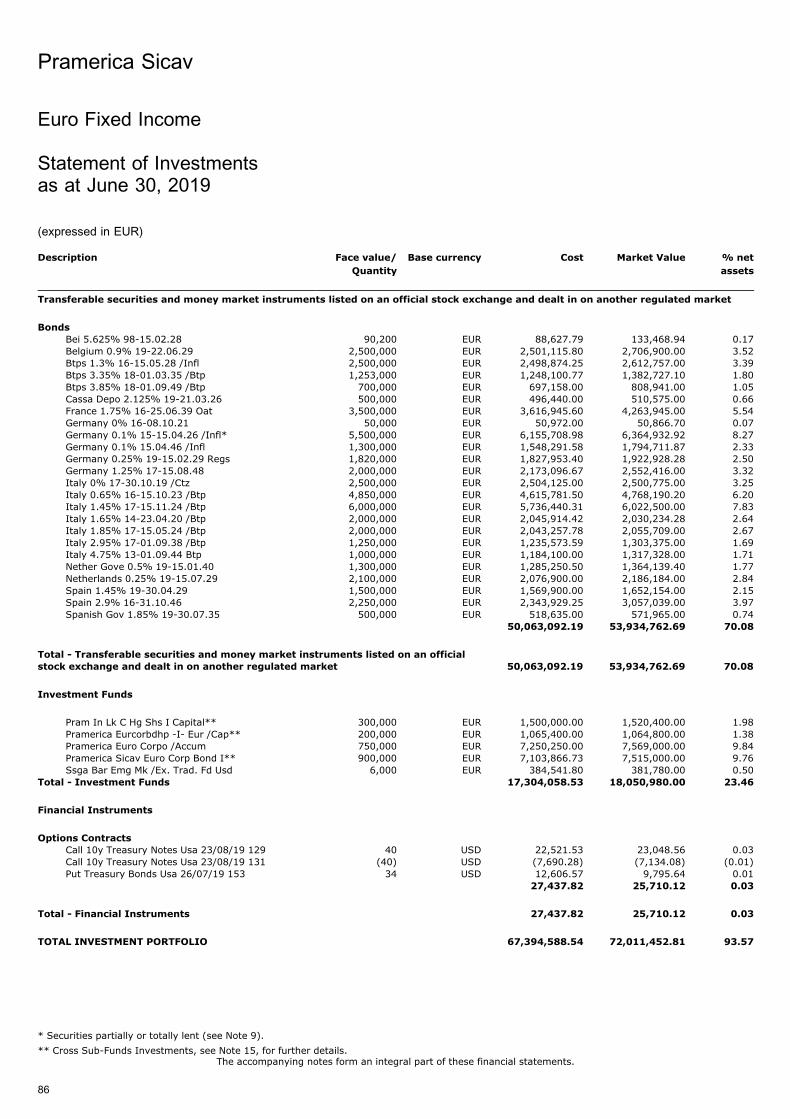
Euro Fixed Income
Statement of Investmentsas at June 30, 2019
(expressed in EUR)
Description Face value/
Quantity
Base currency Cost Market Value % net
assets
Transferable securities and money market instruments listed on an official stock exchange and dealt in on another regulated market
Bonds
Bei 5.625% 98-15.02.28 90,200 EUR 88,627.79 133,468.94 0.17Belgium 0.9% 19-22.06.29 2,500,000 EUR 2,501,115.80 2,706,900.00 3.52Btps 1.3% 16-15.05.28 /Infl 2,500,000 EUR 2,498,874.25 2,612,757.00 3.39Btps 3.35% 18-01.03.35 /Btp 1,253,000 EUR 1,248,100.77 1,382,727.10 1.80Btps 3.85% 18-01.09.49 /Btp 700,000 EUR 697,158.00 808,941.00 1.05Cassa Depo 2.125% 19-21.03.26 500,000 EUR 496,440.00 510,575.00 0.66France 1.75% 16-25.06.39 Oat 3,500,000 EUR 3,616,945.60 4,263,945.00 5.54Germany 0% 16-08.10.21 50,000 EUR 50,972.00 50,866.70 0.07Germany 0.1% 15-15.04.26 /Infl* 5,500,000 EUR 6,155,708.98 6,364,932.92 8.27Germany 0.1% 15.04.46 /Infl 1,300,000 EUR 1,548,291.58 1,794,711.87 2.33Germany 0.25% 19-15.02.29 Regs 1,820,000 EUR 1,827,953.40 1,922,928.28 2.50Germany 1.25% 17-15.08.48 2,000,000 EUR 2,173,096.67 2,552,416.00 3.32Italy 0% 17-30.10.19 /Ctz 2,500,000 EUR 2,504,125.00 2,500,775.00 3.25Italy 0.65% 16-15.10.23 /Btp 4,850,000 EUR 4,615,781.50 4,768,190.20 6.20Italy 1.45% 17-15.11.24 /Btp 6,000,000 EUR 5,736,440.31 6,022,500.00 7.83Italy 1.65% 14-23.04.20 /Btp 2,000,000 EUR 2,045,914.42 2,030,234.28 2.64Italy 1.85% 17-15.05.24 /Btp 2,000,000 EUR 2,043,257.78 2,055,709.00 2.67Italy 2.95% 17-01.09.38 /Btp 1,250,000 EUR 1,235,573.59 1,303,375.00 1.69Italy 4.75% 13-01.09.44 Btp 1,000,000 EUR 1,184,100.00 1,317,328.00 1.71Nether Gove 0.5% 19-15.01.40 1,300,000 EUR 1,285,250.50 1,364,139.40 1.77Netherlands 0.25% 19-15.07.29 2,100,000 EUR 2,076,900.00 2,186,184.00 2.84Spain 1.45% 19-30.04.29 1,500,000 EUR 1,569,900.00 1,652,154.00 2.15Spain 2.9% 16-31.10.46 2,250,000 EUR 2,343,929.25 3,057,039.00 3.97Spanish Gov 1.85% 19-30.07.35 500,000 EUR 518,635.00 571,965.00 0.74
50,063,092.19 53,934,762.69 70.08
Total - Transferable securities and money market instruments listed on an official
stock exchange and dealt in on another regulated market 50,063,092.19 53,934,762.69 70.08
Investment Funds
Pram In Lk C Hg Shs I Capital** 300,000 EUR 1,500,000.00 1,520,400.00 1.98Pramerica Eurcorbdhp -I- Eur /Cap** 200,000 EUR 1,065,400.00 1,064,800.00 1.38Pramerica Euro Corpo /Accum 750,000 EUR 7,250,250.00 7,569,000.00 9.84Pramerica Sicav Euro Corp Bond I** 900,000 EUR 7,103,866.73 7,515,000.00 9.76Ssga Bar Emg Mk /Ex. Trad. Fd Usd 6,000 EUR 384,541.80 381,780.00 0.50
Total - Investment Funds 17,304,058.53 18,050,980.00 23.46
Financial Instruments
Options ContractsCall 10y Treasury Notes Usa 23/08/19 129 40 USD 22,521.53 23,048.56 0.03Call 10y Treasury Notes Usa 23/08/19 131 (40) USD (7,690.28) (7,134.08) (0.01)Put Treasury Bonds Usa 26/07/19 153 34 USD 12,606.57 9,795.64 0.01
27,437.82 25,710.12 0.03
Total - Financial Instruments 27,437.82 25,710.12 0.03
TOTAL INVESTMENT PORTFOLIO 67,394,588.54 72,011,452.81 93.57
Pramerica Sicav
The accompanying notes form an integral part of these financial statements.
86
* Securities partially or totally lent (see Note 9).
** Cross Sub-Funds Investments, see Note 15, for further details.
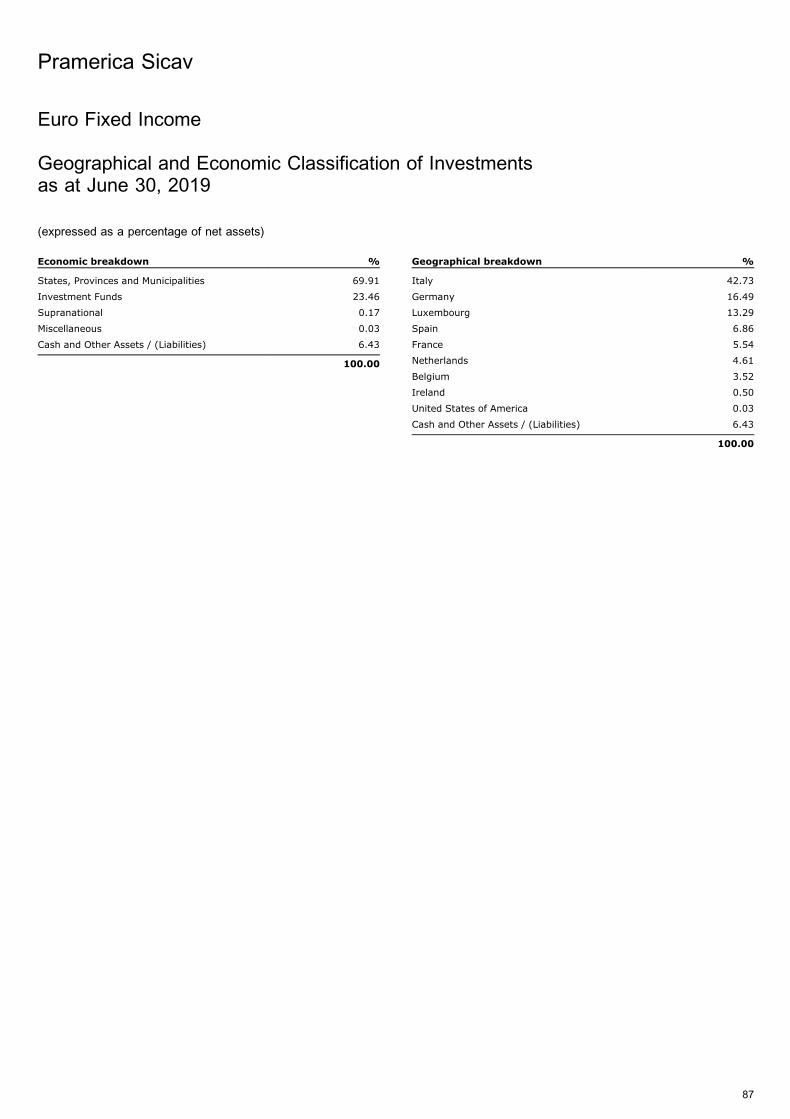
Euro Fixed Income
Geographical and Economic Classification of Investmentsas at June 30, 2019
(expressed as a percentage of net assets)
Economic breakdown %
States, Provinces and Municipalities 69.91
Investment Funds 23.46
Supranational 0.17
Miscellaneous 0.03
Cash and Other Assets / (Liabilities) 6.43
100.00
Geographical breakdown %
Italy 42.73
Germany 16.49
Luxembourg 13.29
Spain 6.86
France 5.54
Netherlands 4.61
Belgium 3.52
Ireland 0.50
United States of America 0.03
Cash and Other Assets / (Liabilities) 6.43
100.00
Pramerica Sicav
87
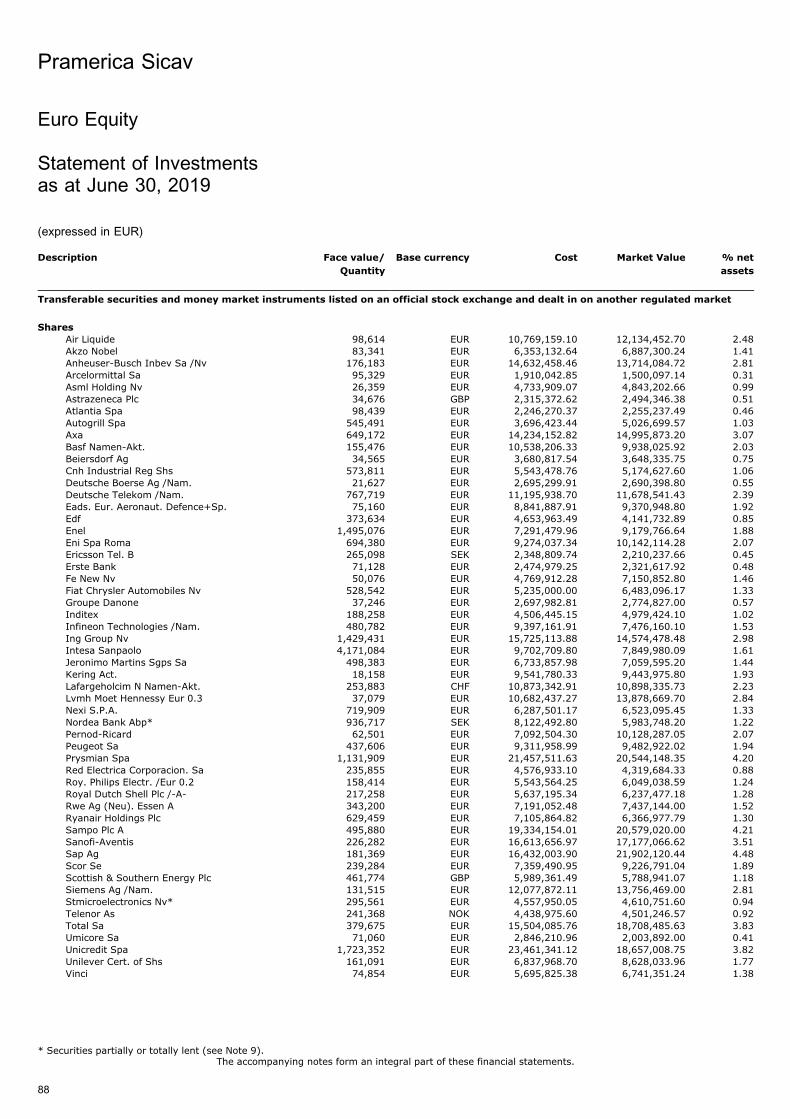
Euro Equity
Statement of Investmentsas at June 30, 2019
(expressed in EUR)
Description Face value/
Quantity
Base currency Cost Market Value % net
assets
Transferable securities and money market instruments listed on an official stock exchange and dealt in on another regulated market
Shares
Air Liquide 98,614 EUR 10,769,159.10 12,134,452.70 2.48Akzo Nobel 83,341 EUR 6,353,132.64 6,887,300.24 1.41Anheuser-Busch Inbev Sa /Nv 176,183 EUR 14,632,458.46 13,714,084.72 2.81Arcelormittal Sa 95,329 EUR 1,910,042.85 1,500,097.14 0.31Asml Holding Nv 26,359 EUR 4,733,909.07 4,843,202.66 0.99Astrazeneca Plc 34,676 GBP 2,315,372.62 2,494,346.38 0.51Atlantia Spa 98,439 EUR 2,246,270.37 2,255,237.49 0.46Autogrill Spa 545,491 EUR 3,696,423.44 5,026,699.57 1.03Axa 649,172 EUR 14,234,152.82 14,995,873.20 3.07Basf Namen-Akt. 155,476 EUR 10,538,206.33 9,938,025.92 2.03Beiersdorf Ag 34,565 EUR 3,680,817.54 3,648,335.75 0.75Cnh Industrial Reg Shs 573,811 EUR 5,543,478.76 5,174,627.60 1.06Deutsche Boerse Ag /Nam. 21,627 EUR 2,695,299.91 2,690,398.80 0.55Deutsche Telekom /Nam. 767,719 EUR 11,195,938.70 11,678,541.43 2.39Eads. Eur. Aeronaut. Defence+Sp. 75,160 EUR 8,841,887.91 9,370,948.80 1.92Edf 373,634 EUR 4,653,963.49 4,141,732.89 0.85Enel 1,495,076 EUR 7,291,479.96 9,179,766.64 1.88Eni Spa Roma 694,380 EUR 9,274,037.34 10,142,114.28 2.07Ericsson Tel. B 265,098 SEK 2,348,809.74 2,210,237.66 0.45Erste Bank 71,128 EUR 2,474,979.25 2,321,617.92 0.48Fe New Nv 50,076 EUR 4,769,912.28 7,150,852.80 1.46Fiat Chrysler Automobiles Nv 528,542 EUR 5,235,000.00 6,483,096.17 1.33Groupe Danone 37,246 EUR 2,697,982.81 2,774,827.00 0.57Inditex 188,258 EUR 4,506,445.15 4,979,424.10 1.02Infineon Technologies /Nam. 480,782 EUR 9,397,161.91 7,476,160.10 1.53Ing Group Nv 1,429,431 EUR 15,725,113.88 14,574,478.48 2.98Intesa Sanpaolo 4,171,084 EUR 9,702,709.80 7,849,980.09 1.61Jeronimo Martins Sgps Sa 498,383 EUR 6,733,857.98 7,059,595.20 1.44Kering Act. 18,158 EUR 9,541,780.33 9,443,975.80 1.93Lafargeholcim N Namen-Akt. 253,883 CHF 10,873,342.91 10,898,335.73 2.23Lvmh Moet Hennessy Eur 0.3 37,079 EUR 10,682,437.27 13,878,669.70 2.84Nexi S.P.A. 719,909 EUR 6,287,501.17 6,523,095.45 1.33Nordea Bank Abp* 936,717 SEK 8,122,492.80 5,983,748.20 1.22Pernod-Ricard 62,501 EUR 7,092,504.30 10,128,287.05 2.07Peugeot Sa 437,606 EUR 9,311,958.99 9,482,922.02 1.94Prysmian Spa 1,131,909 EUR 21,457,511.63 20,544,148.35 4.20Red Electrica Corporacion. Sa 235,855 EUR 4,576,933.10 4,319,684.33 0.88Roy. Philips Electr. /Eur 0.2 158,414 EUR 5,543,564.25 6,049,038.59 1.24Royal Dutch Shell Plc /-A- 217,258 EUR 5,637,195.34 6,237,477.18 1.28Rwe Ag (Neu). Essen A 343,200 EUR 7,191,052.48 7,437,144.00 1.52Ryanair Holdings Plc 629,459 EUR 7,105,864.82 6,366,977.79 1.30Sampo Plc A 495,880 EUR 19,334,154.01 20,579,020.00 4.21Sanofi-Aventis 226,282 EUR 16,613,656.97 17,177,066.62 3.51Sap Ag 181,369 EUR 16,432,003.90 21,902,120.44 4.48Scor Se 239,284 EUR 7,359,490.95 9,226,791.04 1.89Scottish & Southern Energy Plc 461,774 GBP 5,989,361.49 5,788,941.07 1.18Siemens Ag /Nam. 131,515 EUR 12,077,872.11 13,756,469.00 2.81Stmicroelectronics Nv* 295,561 EUR 4,557,950.05 4,610,751.60 0.94Telenor As 241,368 NOK 4,438,975.60 4,501,246.57 0.92Total Sa 379,675 EUR 15,504,085.76 18,708,485.63 3.83Umicore Sa 71,060 EUR 2,846,210.96 2,003,892.00 0.41Unicredit Spa 1,723,352 EUR 23,461,341.12 18,657,008.75 3.82Unilever Cert. of Shs 161,091 EUR 6,837,968.70 8,628,033.96 1.77Vinci 74,854 EUR 5,695,825.38 6,741,351.24 1.38
Pramerica Sicav
The accompanying notes form an integral part of these financial statements.
88
* Securities partially or totally lent (see Note 9).
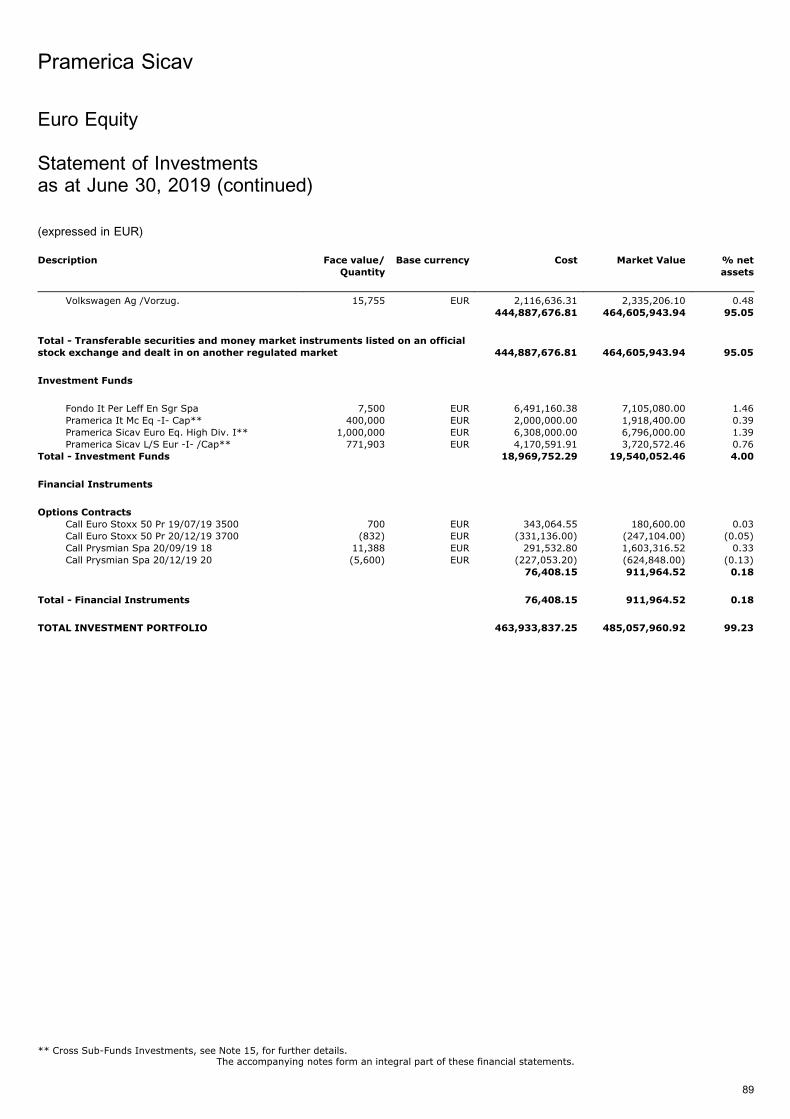
Description Face value/
Quantity
Base currency Cost Market Value % net
assets
Volkswagen Ag /Vorzug. 15,755 EUR 2,116,636.31 2,335,206.10 0.48444,887,676.81 464,605,943.94 95.05
Total - Transferable securities and money market instruments listed on an officialstock exchange and dealt in on another regulated market 444,887,676.81 464,605,943.94 95.05
Investment Funds
Fondo It Per Leff En Sgr Spa 7,500 EUR 6,491,160.38 7,105,080.00 1.46Pramerica It Mc Eq -I- Cap** 400,000 EUR 2,000,000.00 1,918,400.00 0.39Pramerica Sicav Euro Eq. High Div. I** 1,000,000 EUR 6,308,000.00 6,796,000.00 1.39Pramerica Sicav L/S Eur -I- /Cap** 771,903 EUR 4,170,591.91 3,720,572.46 0.76
Total - Investment Funds 18,969,752.29 19,540,052.46 4.00
Financial Instruments
Options Contracts
Call Euro Stoxx 50 Pr 19/07/19 3500 700 EUR 343,064.55 180,600.00 0.03Call Euro Stoxx 50 Pr 20/12/19 3700 (832) EUR (331,136.00) (247,104.00) (0.05)Call Prysmian Spa 20/09/19 18 11,388 EUR 291,532.80 1,603,316.52 0.33Call Prysmian Spa 20/12/19 20 (5,600) EUR (227,053.20) (624,848.00) (0.13)
76,408.15 911,964.52 0.18
Total - Financial Instruments 76,408.15 911,964.52 0.18
TOTAL INVESTMENT PORTFOLIO 463,933,837.25 485,057,960.92 99.23
Pramerica Sicav
The accompanying notes form an integral part of these financial statements.
89
Euro Equity
Statement of Investmentsas at June 30, 2019 (continued)
(expressed in EUR)
** Cross Sub-Funds Investments, see Note 15, for further details.
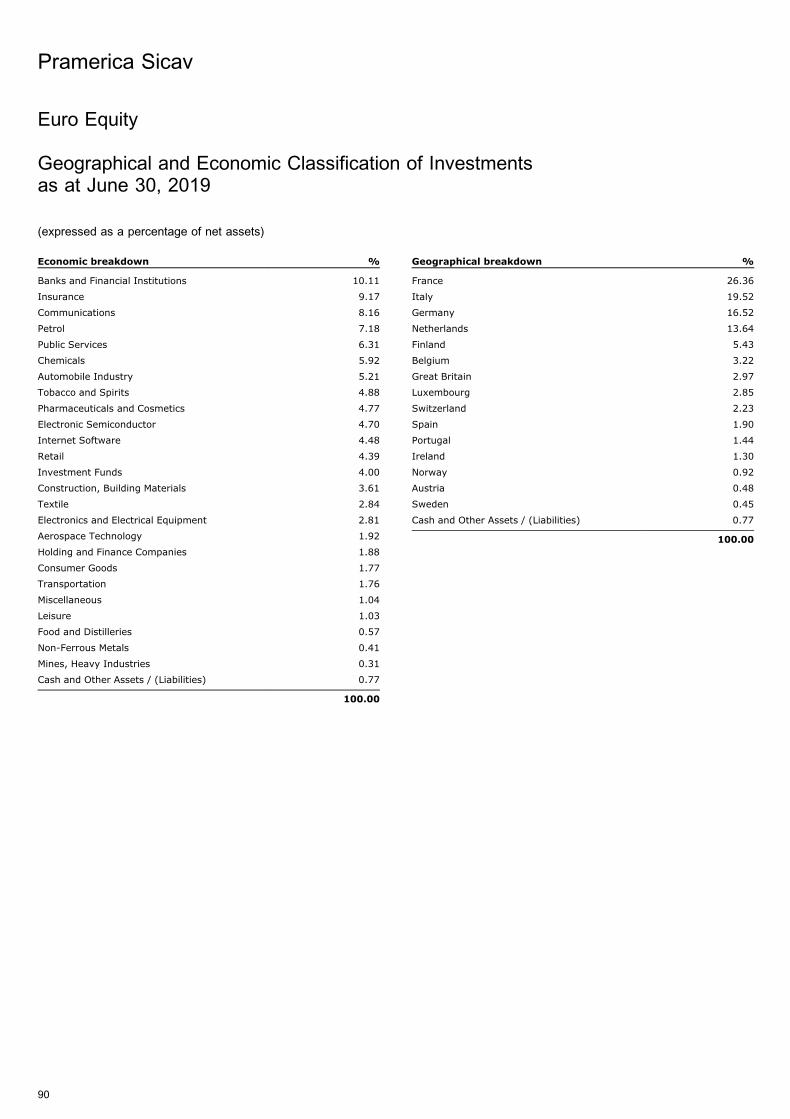
Euro Equity
Geographical and Economic Classification of Investmentsas at June 30, 2019
(expressed as a percentage of net assets)
Economic breakdown %
Banks and Financial Institutions 10.11
Insurance 9.17
Communications 8.16
Petrol 7.18
Public Services 6.31
Chemicals 5.92
Automobile Industry 5.21
Tobacco and Spirits 4.88
Pharmaceuticals and Cosmetics 4.77
Electronic Semiconductor 4.70
Internet Software 4.48
Retail 4.39
Investment Funds 4.00
Construction, Building Materials 3.61
Textile 2.84
Electronics and Electrical Equipment 2.81
Aerospace Technology 1.92
Holding and Finance Companies 1.88
Consumer Goods 1.77
Transportation 1.76
Miscellaneous 1.04
Leisure 1.03
Food and Distilleries 0.57
Non-Ferrous Metals 0.41
Mines, Heavy Industries 0.31
Cash and Other Assets / (Liabilities) 0.77
100.00
Geographical breakdown %
France 26.36
Italy 19.52
Germany 16.52
Netherlands 13.64
Finland 5.43
Belgium 3.22
Great Britain 2.97
Luxembourg 2.85
Switzerland 2.23
Spain 1.90
Portugal 1.44
Ireland 1.30
Norway 0.92
Austria 0.48
Sweden 0.45
Cash and Other Assets / (Liabilities) 0.77
100.00
Pramerica Sicav
90
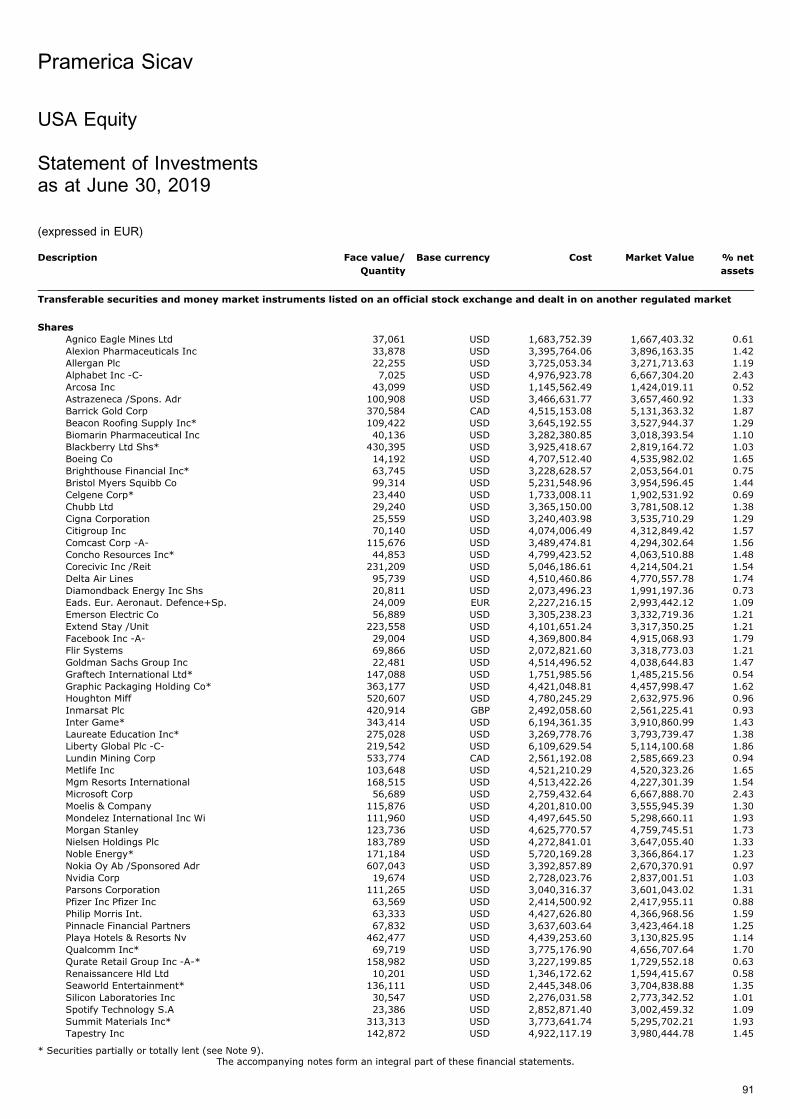
USA Equity
Statement of Investmentsas at June 30, 2019
(expressed in EUR)
Description Face value/
Quantity
Base currency Cost Market Value % net
assets
Transferable securities and money market instruments listed on an official stock exchange and dealt in on another regulated market
Shares
Agnico Eagle Mines Ltd 37,061 USD 1,683,752.39 1,667,403.32 0.61Alexion Pharmaceuticals Inc 33,878 USD 3,395,764.06 3,896,163.35 1.42Allergan Plc 22,255 USD 3,725,053.34 3,271,713.63 1.19Alphabet Inc -C- 7,025 USD 4,976,923.78 6,667,304.20 2.43Arcosa Inc 43,099 USD 1,145,562.49 1,424,019.11 0.52Astrazeneca /Spons. Adr 100,908 USD 3,466,631.77 3,657,460.92 1.33Barrick Gold Corp 370,584 CAD 4,515,153.08 5,131,363.32 1.87Beacon Roofing Supply Inc* 109,422 USD 3,645,192.55 3,527,944.37 1.29Biomarin Pharmaceutical Inc 40,136 USD 3,282,380.85 3,018,393.54 1.10Blackberry Ltd Shs* 430,395 USD 3,925,418.67 2,819,164.72 1.03Boeing Co 14,192 USD 4,707,512.40 4,535,982.02 1.65Brighthouse Financial Inc* 63,745 USD 3,228,628.57 2,053,564.01 0.75Bristol Myers Squibb Co 99,314 USD 5,231,548.96 3,954,596.45 1.44Celgene Corp* 23,440 USD 1,733,008.11 1,902,531.92 0.69Chubb Ltd 29,240 USD 3,365,150.00 3,781,508.12 1.38Cigna Corporation 25,559 USD 3,240,403.98 3,535,710.29 1.29Citigroup Inc 70,140 USD 4,074,006.49 4,312,849.42 1.57Comcast Corp -A- 115,676 USD 3,489,474.81 4,294,302.64 1.56Concho Resources Inc* 44,853 USD 4,799,423.52 4,063,510.88 1.48Corecivic Inc /Reit 231,209 USD 5,046,186.61 4,214,504.21 1.54Delta Air Lines 95,739 USD 4,510,460.86 4,770,557.78 1.74Diamondback Energy Inc Shs 20,811 USD 2,073,496.23 1,991,197.36 0.73Eads. Eur. Aeronaut. Defence+Sp. 24,009 EUR 2,227,216.15 2,993,442.12 1.09Emerson Electric Co 56,889 USD 3,305,238.23 3,332,719.36 1.21Extend Stay /Unit 223,558 USD 4,101,651.24 3,317,350.25 1.21Facebook Inc -A- 29,004 USD 4,369,800.84 4,915,068.93 1.79Flir Systems 69,866 USD 2,072,821.60 3,318,773.03 1.21Goldman Sachs Group Inc 22,481 USD 4,514,496.52 4,038,644.83 1.47Graftech International Ltd* 147,088 USD 1,751,985.56 1,485,215.56 0.54Graphic Packaging Holding Co* 363,177 USD 4,421,048.81 4,457,998.47 1.62Houghton Miff 520,607 USD 4,780,245.29 2,632,975.96 0.96Inmarsat Plc 420,914 GBP 2,492,058.60 2,561,225.41 0.93Inter Game* 343,414 USD 6,194,361.35 3,910,860.99 1.43Laureate Education Inc* 275,028 USD 3,269,778.76 3,793,739.47 1.38Liberty Global Plc -C- 219,542 USD 6,109,629.54 5,114,100.68 1.86Lundin Mining Corp 533,774 CAD 2,561,192.08 2,585,669.23 0.94Metlife Inc 103,648 USD 4,521,210.29 4,520,323.26 1.65Mgm Resorts International 168,515 USD 4,513,422.26 4,227,301.39 1.54Microsoft Corp 56,689 USD 2,759,432.64 6,667,888.70 2.43Moelis & Company 115,876 USD 4,201,810.00 3,555,945.39 1.30Mondelez International Inc Wi 111,960 USD 4,497,645.50 5,298,660.11 1.93Morgan Stanley 123,736 USD 4,625,770.57 4,759,745.51 1.73Nielsen Holdings Plc 183,789 USD 4,272,841.01 3,647,055.40 1.33Noble Energy* 171,184 USD 5,720,169.28 3,366,864.17 1.23Nokia Oy Ab /Sponsored Adr 607,043 USD 3,392,857.89 2,670,370.91 0.97Nvidia Corp 19,674 USD 2,728,023.76 2,837,001.51 1.03Parsons Corporation 111,265 USD 3,040,316.37 3,601,043.02 1.31Pfizer Inc Pfizer Inc 63,569 USD 2,414,500.92 2,417,955.11 0.88Philip Morris Int. 63,333 USD 4,427,626.80 4,366,968.56 1.59Pinnacle Financial Partners 67,832 USD 3,637,603.64 3,423,464.18 1.25Playa Hotels & Resorts Nv 462,477 USD 4,439,253.60 3,130,825.95 1.14Qualcomm Inc* 69,719 USD 3,775,176.90 4,656,707.64 1.70Qurate Retail Group Inc -A-* 158,982 USD 3,227,199.85 1,729,552.18 0.63Renaissancere Hld Ltd 10,201 USD 1,346,172.62 1,594,415.67 0.58Seaworld Entertainment* 136,111 USD 2,445,348.06 3,704,838.88 1.35Silicon Laboratories Inc 30,547 USD 2,276,031.58 2,773,342.52 1.01Spotify Technology S.A 23,386 USD 2,852,871.40 3,002,459.32 1.09Summit Materials Inc* 313,313 USD 3,773,641.74 5,295,702.21 1.93Tapestry Inc 142,872 USD 4,922,117.19 3,980,444.78 1.45
Pramerica Sicav
The accompanying notes form an integral part of these financial statements.
91
* Securities partially or totally lent (see Note 9).
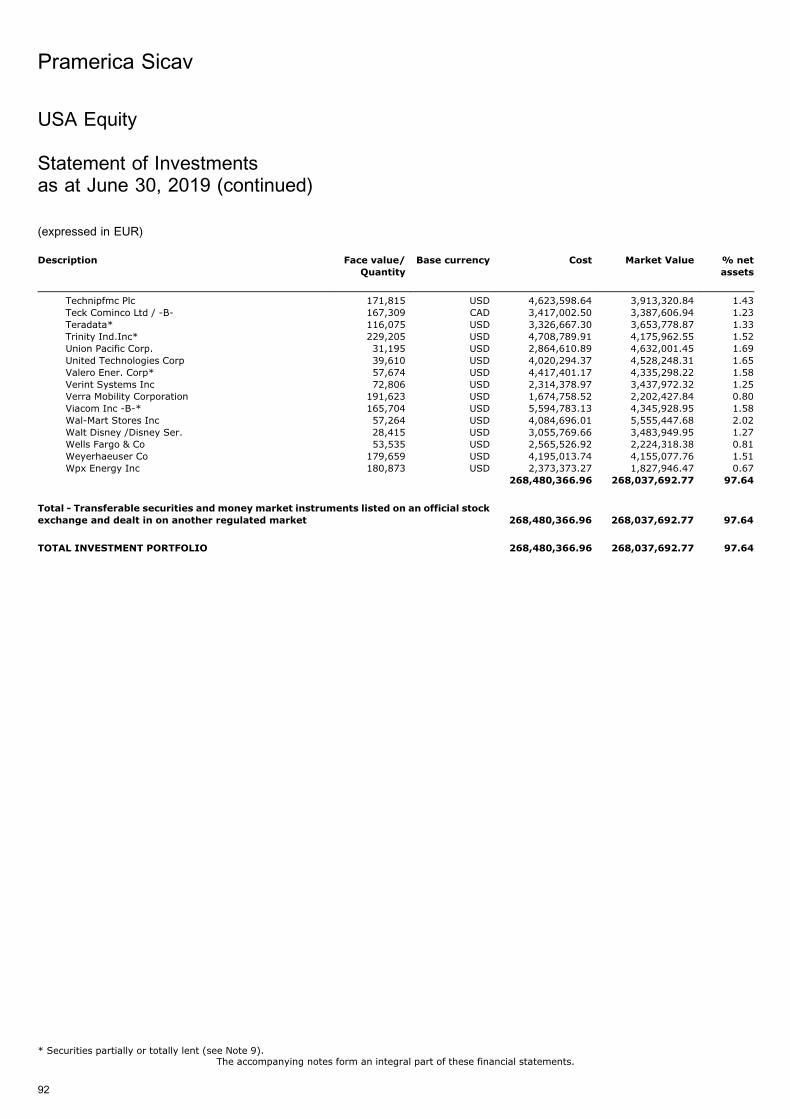
Description Face value/
Quantity
Base currency Cost Market Value % net
assets
Technipfmc Plc 171,815 USD 4,623,598.64 3,913,320.84 1.43Teck Cominco Ltd / -B- 167,309 CAD 3,417,002.50 3,387,606.94 1.23Teradata* 116,075 USD 3,326,667.30 3,653,778.87 1.33Trinity Ind.Inc* 229,205 USD 4,708,789.91 4,175,962.55 1.52Union Pacific Corp. 31,195 USD 2,864,610.89 4,632,001.45 1.69United Technologies Corp 39,610 USD 4,020,294.37 4,528,248.31 1.65Valero Ener. Corp* 57,674 USD 4,417,401.17 4,335,298.22 1.58Verint Systems Inc 72,806 USD 2,314,378.97 3,437,972.32 1.25Verra Mobility Corporation 191,623 USD 1,674,758.52 2,202,427.84 0.80Viacom Inc -B-* 165,704 USD 5,594,783.13 4,345,928.95 1.58Wal-Mart Stores Inc 57,264 USD 4,084,696.01 5,555,447.68 2.02Walt Disney /Disney Ser. 28,415 USD 3,055,769.66 3,483,949.95 1.27Wells Fargo & Co 53,535 USD 2,565,526.92 2,224,318.38 0.81Weyerhaeuser Co 179,659 USD 4,195,013.74 4,155,077.76 1.51Wpx Energy Inc 180,873 USD 2,373,373.27 1,827,946.47 0.67
268,480,366.96 268,037,692.77 97.64
Total - Transferable securities and money market instruments listed on an official stock
exchange and dealt in on another regulated market 268,480,366.96 268,037,692.77 97.64
TOTAL INVESTMENT PORTFOLIO 268,480,366.96 268,037,692.77 97.64
Pramerica Sicav
The accompanying notes form an integral part of these financial statements.
92
USA Equity
Statement of Investmentsas at June 30, 2019 (continued)
(expressed in EUR)
* Securities partially or totally lent (see Note 9).
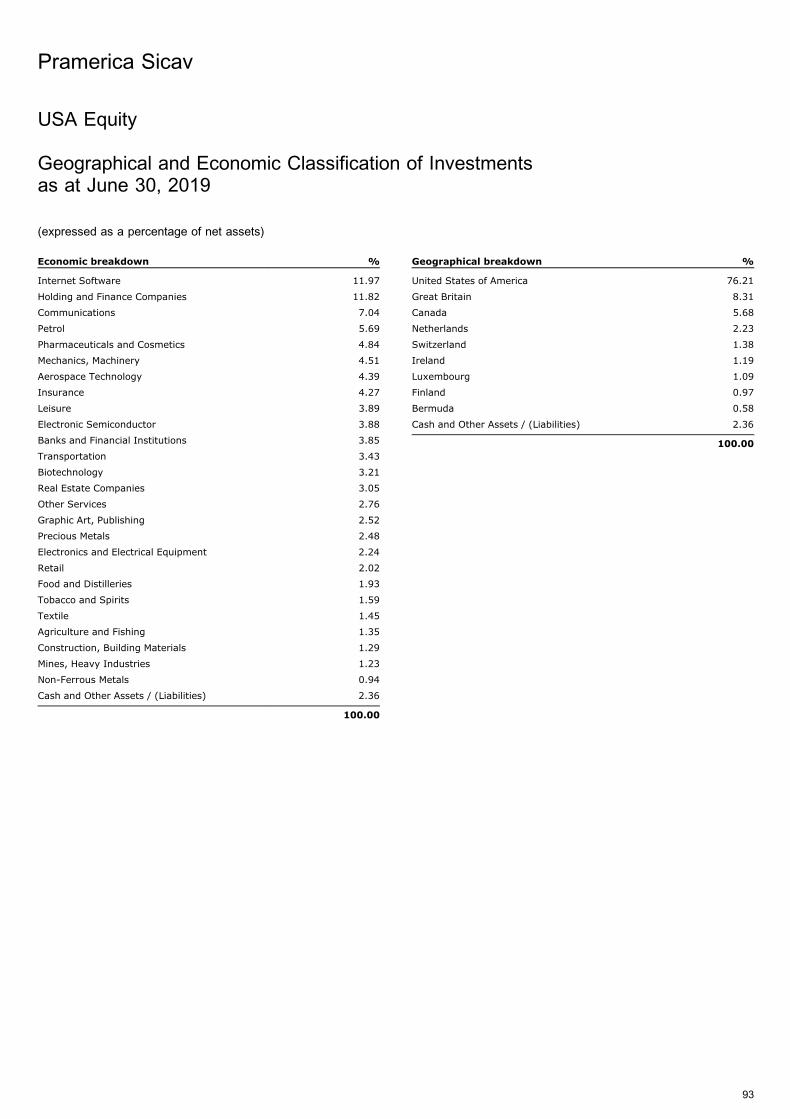
USA Equity
Geographical and Economic Classification of Investmentsas at June 30, 2019
(expressed as a percentage of net assets)
Economic breakdown %
Internet Software 11.97
Holding and Finance Companies 11.82
Communications 7.04
Petrol 5.69
Pharmaceuticals and Cosmetics 4.84
Mechanics, Machinery 4.51
Aerospace Technology 4.39
Insurance 4.27
Leisure 3.89
Electronic Semiconductor 3.88
Banks and Financial Institutions 3.85
Transportation 3.43
Biotechnology 3.21
Real Estate Companies 3.05
Other Services 2.76
Graphic Art, Publishing 2.52
Precious Metals 2.48
Electronics and Electrical Equipment 2.24
Retail 2.02
Food and Distilleries 1.93
Tobacco and Spirits 1.59
Textile 1.45
Agriculture and Fishing 1.35
Construction, Building Materials 1.29
Mines, Heavy Industries 1.23
Non-Ferrous Metals 0.94
Cash and Other Assets / (Liabilities) 2.36
100.00
Geographical breakdown %
United States of America 76.21
Great Britain 8.31
Canada 5.68
Netherlands 2.23
Switzerland 1.38
Ireland 1.19
Luxembourg 1.09
Finland 0.97
Bermuda 0.58
Cash and Other Assets / (Liabilities) 2.36
100.00
Pramerica Sicav
93
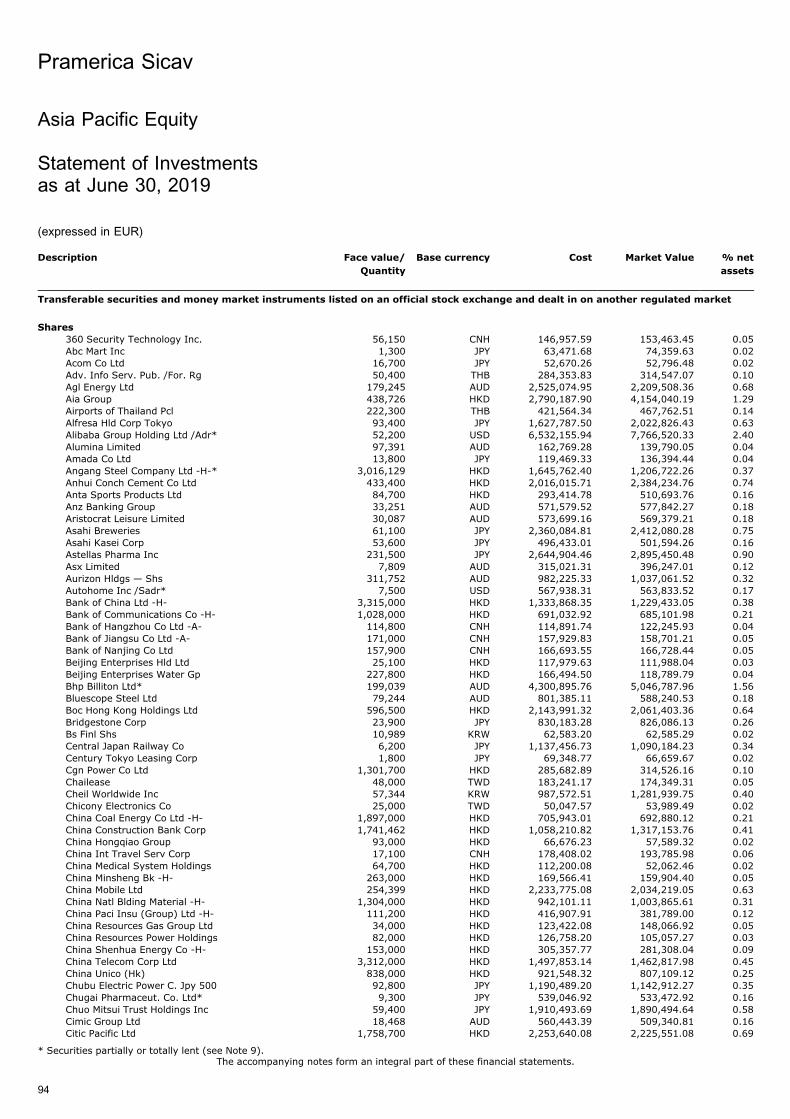
Asia Pacific Equity
Statement of Investmentsas at June 30, 2019
(expressed in EUR)
Description Face value/
Quantity
Base currency Cost Market Value % net
assets
Transferable securities and money market instruments listed on an official stock exchange and dealt in on another regulated market
Shares
360 Security Technology Inc. 56,150 CNH 146,957.59 153,463.45 0.05Abc Mart Inc 1,300 JPY 63,471.68 74,359.63 0.02Acom Co Ltd 16,700 JPY 52,670.26 52,796.48 0.02Adv. Info Serv. Pub. /For. Rg 50,400 THB 284,353.83 314,547.07 0.10Agl Energy Ltd 179,245 AUD 2,525,074.95 2,209,508.36 0.68Aia Group 438,726 HKD 2,790,187.90 4,154,040.19 1.29Airports of Thailand Pcl 222,300 THB 421,564.34 467,762.51 0.14Alfresa Hld Corp Tokyo 93,400 JPY 1,627,787.50 2,022,826.43 0.63Alibaba Group Holding Ltd /Adr* 52,200 USD 6,532,155.94 7,766,520.33 2.40Alumina Limited 97,391 AUD 162,769.28 139,790.05 0.04Amada Co Ltd 13,800 JPY 119,469.33 136,394.44 0.04Angang Steel Company Ltd -H-* 3,016,129 HKD 1,645,762.40 1,206,722.26 0.37Anhui Conch Cement Co Ltd 433,400 HKD 2,016,015.71 2,384,234.76 0.74Anta Sports Products Ltd 84,700 HKD 293,414.78 510,693.76 0.16Anz Banking Group 33,251 AUD 571,579.52 577,842.27 0.18Aristocrat Leisure Limited 30,087 AUD 573,699.16 569,379.21 0.18Asahi Breweries 61,100 JPY 2,360,084.81 2,412,080.28 0.75Asahi Kasei Corp 53,600 JPY 496,433.01 501,594.26 0.16Astellas Pharma Inc 231,500 JPY 2,644,904.46 2,895,450.48 0.90Asx Limited 7,809 AUD 315,021.31 396,247.01 0.12Aurizon Hldgs — Shs 311,752 AUD 982,225.33 1,037,061.52 0.32Autohome Inc /Sadr* 7,500 USD 567,938.31 563,833.52 0.17Bank of China Ltd -H- 3,315,000 HKD 1,333,868.35 1,229,433.05 0.38Bank of Communications Co -H- 1,028,000 HKD 691,032.92 685,101.98 0.21Bank of Hangzhou Co Ltd -A- 114,800 CNH 114,891.74 122,245.93 0.04Bank of Jiangsu Co Ltd -A- 171,000 CNH 157,929.83 158,701.21 0.05Bank of Nanjing Co Ltd 157,900 CNH 166,693.55 166,728.44 0.05Beijing Enterprises Hld Ltd 25,100 HKD 117,979.63 111,988.04 0.03Beijing Enterprises Water Gp 227,800 HKD 166,494.50 118,789.79 0.04Bhp Billiton Ltd* 199,039 AUD 4,300,895.76 5,046,787.96 1.56Bluescope Steel Ltd 79,244 AUD 801,385.11 588,240.53 0.18Boc Hong Kong Holdings Ltd 596,500 HKD 2,143,991.32 2,061,403.36 0.64Bridgestone Corp 23,900 JPY 830,183.28 826,086.13 0.26Bs Finl Shs 10,989 KRW 62,583.20 62,585.29 0.02Central Japan Railway Co 6,200 JPY 1,137,456.73 1,090,184.23 0.34Century Tokyo Leasing Corp 1,800 JPY 69,348.77 66,659.67 0.02Cgn Power Co Ltd 1,301,700 HKD 285,682.89 314,526.16 0.10Chailease 48,000 TWD 183,241.17 174,349.31 0.05Cheil Worldwide Inc 57,344 KRW 987,572.51 1,281,939.75 0.40Chicony Electronics Co 25,000 TWD 50,047.57 53,989.49 0.02China Coal Energy Co Ltd -H- 1,897,000 HKD 705,943.01 692,880.12 0.21China Construction Bank Corp 1,741,462 HKD 1,058,210.82 1,317,153.76 0.41China Hongqiao Group 93,000 HKD 66,676.23 57,589.32 0.02China Int Travel Serv Corp 17,100 CNH 178,408.02 193,785.98 0.06China Medical System Holdings 64,700 HKD 112,200.08 52,062.46 0.02China Minsheng Bk -H- 263,000 HKD 169,566.41 159,904.40 0.05China Mobile Ltd 254,399 HKD 2,233,775.08 2,034,219.05 0.63China Natl Blding Material -H- 1,304,000 HKD 942,101.11 1,003,865.61 0.31China Paci Insu (Group) Ltd -H- 111,200 HKD 416,907.91 381,789.00 0.12China Resources Gas Group Ltd 34,000 HKD 123,422.08 148,066.92 0.05China Resources Power Holdings 82,000 HKD 126,758.20 105,057.27 0.03China Shenhua Energy Co -H- 153,000 HKD 305,357.77 281,308.04 0.09China Telecom Corp Ltd 3,312,000 HKD 1,497,853.14 1,462,817.98 0.45China Unico (Hk) 838,000 HKD 921,548.32 807,109.12 0.25Chubu Electric Power C. Jpy 500 92,800 JPY 1,190,489.20 1,142,912.27 0.35Chugai Pharmaceut. Co. Ltd* 9,300 JPY 539,046.92 533,472.92 0.16Chuo Mitsui Trust Holdings Inc 59,400 JPY 1,910,493.69 1,890,494.64 0.58Cimic Group Ltd 18,468 AUD 560,443.39 509,340.81 0.16Citic Pacific Ltd 1,758,700 HKD 2,253,640.08 2,225,551.08 0.69
Pramerica Sicav
The accompanying notes form an integral part of these financial statements.
94
* Securities partially or totally lent (see Note 9).
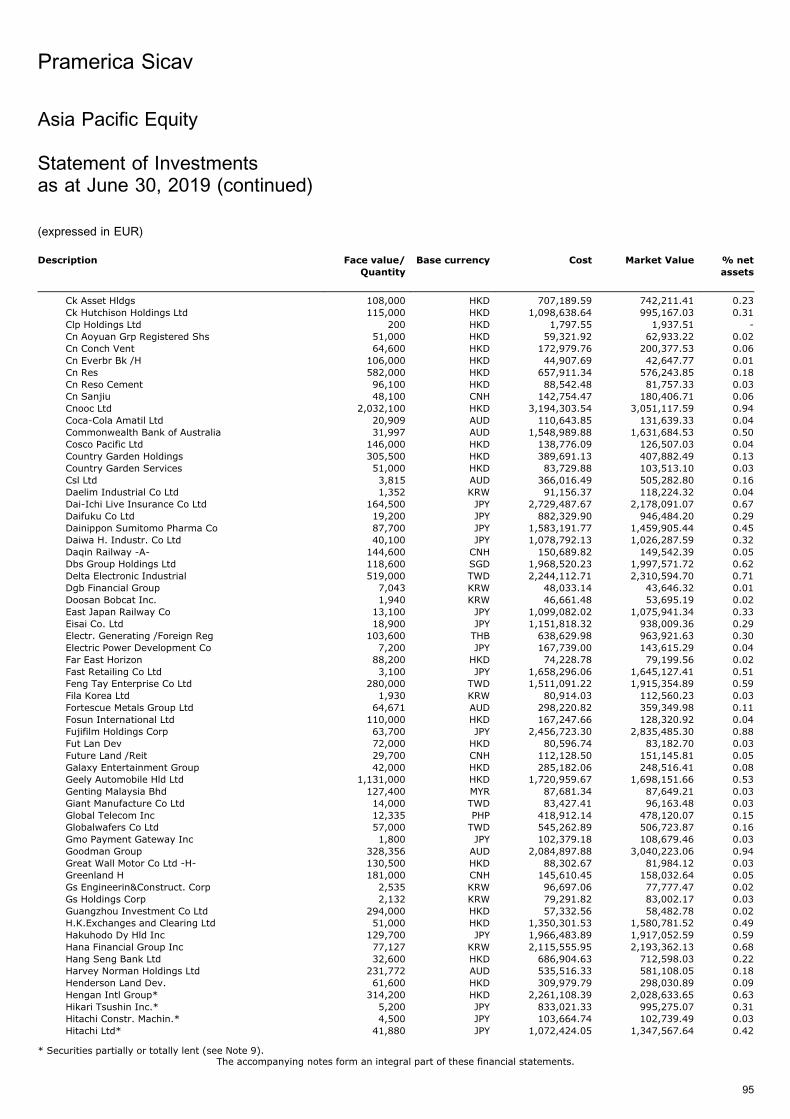
Description Face value/
Quantity
Base currency Cost Market Value % net
assets
Ck Asset Hldgs 108,000 HKD 707,189.59 742,211.41 0.23Ck Hutchison Holdings Ltd 115,000 HKD 1,098,638.64 995,167.03 0.31Clp Holdings Ltd 200 HKD 1,797.55 1,937.51 -Cn Aoyuan Grp Registered Shs 51,000 HKD 59,321.92 62,933.22 0.02Cn Conch Vent 64,600 HKD 172,979.76 200,377.53 0.06Cn Everbr Bk /H 106,000 HKD 44,907.69 42,647.77 0.01Cn Res 582,000 HKD 657,911.34 576,243.85 0.18Cn Reso Cement 96,100 HKD 88,542.48 81,757.33 0.03Cn Sanjiu 48,100 CNH 142,754.47 180,406.71 0.06Cnooc Ltd 2,032,100 HKD 3,194,303.54 3,051,117.59 0.94Coca-Cola Amatil Ltd 20,909 AUD 110,643.85 131,639.33 0.04Commonwealth Bank of Australia 31,997 AUD 1,548,989.88 1,631,684.53 0.50Cosco Pacific Ltd 146,000 HKD 138,776.09 126,507.03 0.04Country Garden Holdings 305,500 HKD 389,691.13 407,882.49 0.13Country Garden Services 51,000 HKD 83,729.88 103,513.10 0.03Csl Ltd 3,815 AUD 366,016.49 505,282.80 0.16Daelim Industrial Co Ltd 1,352 KRW 91,156.37 118,224.32 0.04Dai-Ichi Live Insurance Co Ltd 164,500 JPY 2,729,487.67 2,178,091.07 0.67Daifuku Co Ltd 19,200 JPY 882,329.90 946,484.20 0.29Dainippon Sumitomo Pharma Co 87,700 JPY 1,583,191.77 1,459,905.44 0.45Daiwa H. Industr. Co Ltd 40,100 JPY 1,078,792.13 1,026,287.59 0.32Daqin Railway -A- 144,600 CNH 150,689.82 149,542.39 0.05Dbs Group Holdings Ltd 118,600 SGD 1,968,520.23 1,997,571.72 0.62Delta Electronic Industrial 519,000 TWD 2,244,112.71 2,310,594.70 0.71Dgb Financial Group 7,043 KRW 48,033.14 43,646.32 0.01Doosan Bobcat Inc. 1,940 KRW 46,661.48 53,695.19 0.02East Japan Railway Co 13,100 JPY 1,099,082.02 1,075,941.34 0.33Eisai Co. Ltd 18,900 JPY 1,151,818.32 938,009.36 0.29Electr. Generating /Foreign Reg 103,600 THB 638,629.98 963,921.63 0.30Electric Power Development Co 7,200 JPY 167,739.00 143,615.29 0.04Far East Horizon 88,200 HKD 74,228.78 79,199.56 0.02Fast Retailing Co Ltd 3,100 JPY 1,658,296.06 1,645,127.41 0.51Feng Tay Enterprise Co Ltd 280,000 TWD 1,511,091.22 1,915,354.89 0.59Fila Korea Ltd 1,930 KRW 80,914.03 112,560.23 0.03Fortescue Metals Group Ltd 64,671 AUD 298,220.82 359,349.98 0.11Fosun International Ltd 110,000 HKD 167,247.66 128,320.92 0.04Fujifilm Holdings Corp 63,700 JPY 2,456,723.30 2,835,485.30 0.88Fut Lan Dev 72,000 HKD 80,596.74 83,182.70 0.03Future Land /Reit 29,700 CNH 112,128.50 151,145.81 0.05Galaxy Entertainment Group 42,000 HKD 285,182.06 248,516.41 0.08Geely Automobile Hld Ltd 1,131,000 HKD 1,720,959.67 1,698,151.66 0.53Genting Malaysia Bhd 127,400 MYR 87,681.34 87,649.21 0.03Giant Manufacture Co Ltd 14,000 TWD 83,427.41 96,163.48 0.03Global Telecom Inc 12,335 PHP 418,912.14 478,120.07 0.15Globalwafers Co Ltd 57,000 TWD 545,262.89 506,723.87 0.16Gmo Payment Gateway Inc 1,800 JPY 102,379.18 108,679.46 0.03Goodman Group 328,356 AUD 2,084,897.88 3,040,223.06 0.94Great Wall Motor Co Ltd -H- 130,500 HKD 88,302.67 81,984.12 0.03Greenland H 181,000 CNH 145,610.45 158,032.64 0.05Gs Engineerin&Construct. Corp 2,535 KRW 96,697.06 77,777.47 0.02Gs Holdings Corp 2,132 KRW 79,291.82 83,002.17 0.03Guangzhou Investment Co Ltd 294,000 HKD 57,332.56 58,482.78 0.02H.K.Exchanges and Clearing Ltd 51,000 HKD 1,350,301.53 1,580,781.52 0.49Hakuhodo Dy Hld Inc 129,700 JPY 1,966,483.89 1,917,052.59 0.59Hana Financial Group Inc 77,127 KRW 2,115,555.95 2,193,362.13 0.68Hang Seng Bank Ltd 32,600 HKD 686,904.63 712,598.03 0.22Harvey Norman Holdings Ltd 231,772 AUD 535,516.33 581,108.05 0.18Henderson Land Dev. 61,600 HKD 309,979.79 298,030.89 0.09Hengan Intl Group* 314,200 HKD 2,261,108.39 2,028,633.65 0.63Hikari Tsushin Inc.* 5,200 JPY 833,021.33 995,275.07 0.31Hitachi Constr. Machin.* 4,500 JPY 103,664.74 102,739.49 0.03Hitachi Ltd* 41,880 JPY 1,072,424.05 1,347,567.64 0.42
Pramerica Sicav
The accompanying notes form an integral part of these financial statements.
95
Asia Pacific Equity
Statement of Investmentsas at June 30, 2019 (continued)
(expressed in EUR)
* Securities partially or totally lent (see Note 9).
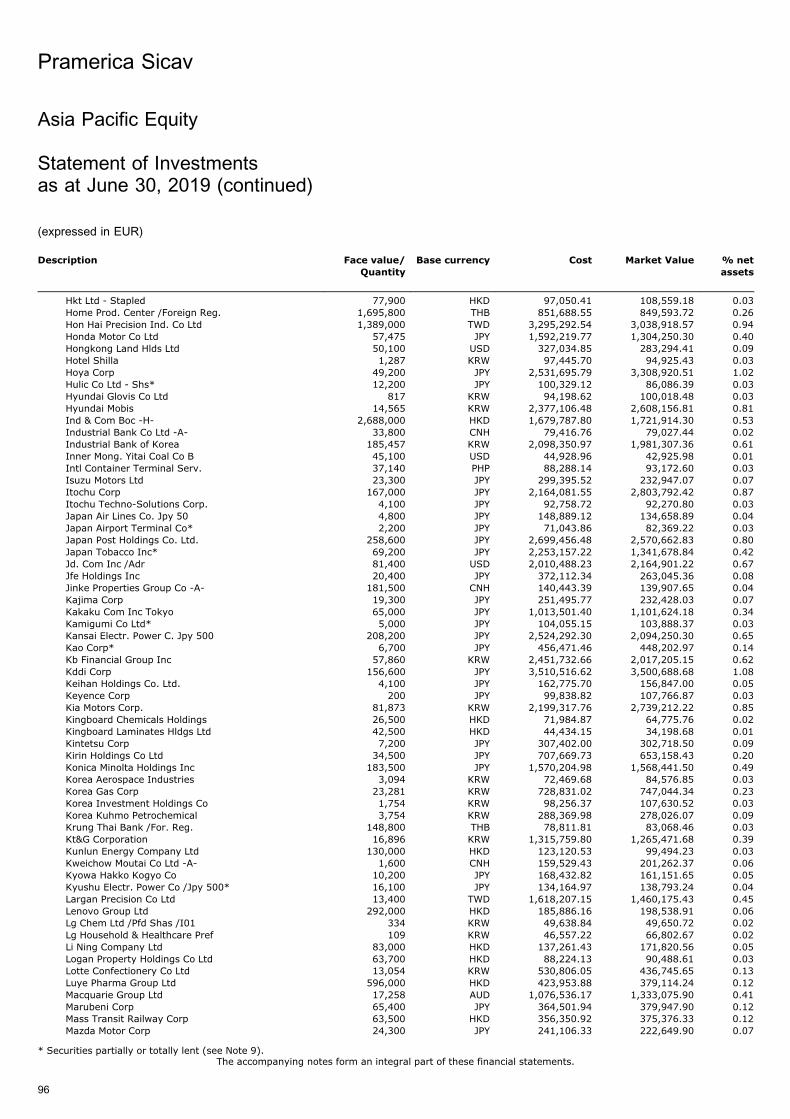
Description Face value/
Quantity
Base currency Cost Market Value % net
assets
Hkt Ltd - Stapled 77,900 HKD 97,050.41 108,559.18 0.03Home Prod. Center /Foreign Reg. 1,695,800 THB 851,688.55 849,593.72 0.26Hon Hai Precision Ind. Co Ltd 1,389,000 TWD 3,295,292.54 3,038,918.57 0.94Honda Motor Co Ltd 57,475 JPY 1,592,219.77 1,304,250.30 0.40Hongkong Land Hlds Ltd 50,100 USD 327,034.85 283,294.41 0.09Hotel Shilla 1,287 KRW 97,445.70 94,925.43 0.03Hoya Corp 49,200 JPY 2,531,695.79 3,308,920.51 1.02Hulic Co Ltd - Shs* 12,200 JPY 100,329.12 86,086.39 0.03Hyundai Glovis Co Ltd 817 KRW 94,198.62 100,018.48 0.03Hyundai Mobis 14,565 KRW 2,377,106.48 2,608,156.81 0.81Ind & Com Boc -H- 2,688,000 HKD 1,679,787.80 1,721,914.30 0.53Industrial Bank Co Ltd -A- 33,800 CNH 79,416.76 79,027.44 0.02Industrial Bank of Korea 185,457 KRW 2,098,350.97 1,981,307.36 0.61Inner Mong. Yitai Coal Co B 45,100 USD 44,928.96 42,925.98 0.01Intl Container Terminal Serv. 37,140 PHP 88,288.14 93,172.60 0.03Isuzu Motors Ltd 23,300 JPY 299,395.52 232,947.07 0.07Itochu Corp 167,000 JPY 2,164,081.55 2,803,792.42 0.87Itochu Techno-Solutions Corp. 4,100 JPY 92,758.72 92,270.80 0.03Japan Air Lines Co. Jpy 50 4,800 JPY 148,889.12 134,658.89 0.04Japan Airport Terminal Co* 2,200 JPY 71,043.86 82,369.22 0.03Japan Post Holdings Co. Ltd. 258,600 JPY 2,699,456.48 2,570,662.83 0.80Japan Tobacco Inc* 69,200 JPY 2,253,157.22 1,341,678.84 0.42Jd. Com Inc /Adr 81,400 USD 2,010,488.23 2,164,901.22 0.67Jfe Holdings Inc 20,400 JPY 372,112.34 263,045.36 0.08Jinke Properties Group Co -A- 181,500 CNH 140,443.39 139,907.65 0.04Kajima Corp 19,300 JPY 251,495.77 232,428.03 0.07Kakaku Com Inc Tokyo 65,000 JPY 1,013,501.40 1,101,624.18 0.34Kamigumi Co Ltd* 5,000 JPY 104,055.15 103,888.37 0.03Kansai Electr. Power C. Jpy 500 208,200 JPY 2,524,292.30 2,094,250.30 0.65Kao Corp* 6,700 JPY 456,471.46 448,202.97 0.14Kb Financial Group Inc 57,860 KRW 2,451,732.66 2,017,205.15 0.62Kddi Corp 156,600 JPY 3,510,516.62 3,500,688.68 1.08Keihan Holdings Co. Ltd. 4,100 JPY 162,775.70 156,847.00 0.05Keyence Corp 200 JPY 99,838.82 107,766.87 0.03Kia Motors Corp. 81,873 KRW 2,199,317.76 2,739,212.22 0.85Kingboard Chemicals Holdings 26,500 HKD 71,984.87 64,775.76 0.02Kingboard Laminates Hldgs Ltd 42,500 HKD 44,434.15 34,198.68 0.01Kintetsu Corp 7,200 JPY 307,402.00 302,718.50 0.09Kirin Holdings Co Ltd 34,500 JPY 707,669.73 653,158.43 0.20Konica Minolta Holdings Inc 183,500 JPY 1,570,204.98 1,568,441.50 0.49Korea Aerospace Industries 3,094 KRW 72,469.68 84,576.85 0.03Korea Gas Corp 23,281 KRW 728,831.02 747,044.34 0.23Korea Investment Holdings Co 1,754 KRW 98,256.37 107,630.52 0.03Korea Kuhmo Petrochemical 3,754 KRW 288,369.98 278,026.07 0.09Krung Thai Bank /For. Reg. 148,800 THB 78,811.81 83,068.46 0.03Kt&G Corporation 16,896 KRW 1,315,759.80 1,265,471.68 0.39Kunlun Energy Company Ltd 130,000 HKD 123,120.53 99,494.23 0.03Kweichow Moutai Co Ltd -A- 1,600 CNH 159,529.43 201,262.37 0.06Kyowa Hakko Kogyo Co 10,200 JPY 168,432.82 161,151.65 0.05Kyushu Electr. Power Co /Jpy 500* 16,100 JPY 134,164.97 138,793.24 0.04Largan Precision Co Ltd 13,400 TWD 1,618,207.15 1,460,175.43 0.45Lenovo Group Ltd 292,000 HKD 185,886.16 198,538.91 0.06Lg Chem Ltd /Pfd Shas /I01 334 KRW 49,638.84 49,650.72 0.02Lg Household & Healthcare Pref 109 KRW 46,557.22 66,802.67 0.02Li Ning Company Ltd 83,000 HKD 137,261.43 171,820.56 0.05Logan Property Holdings Co Ltd 63,700 HKD 88,224.13 90,488.61 0.03Lotte Confectionery Co Ltd 13,054 KRW 530,806.05 436,745.65 0.13Luye Pharma Group Ltd 596,000 HKD 423,953.88 379,114.24 0.12Macquarie Group Ltd 17,258 AUD 1,076,536.17 1,333,075.90 0.41Marubeni Corp 65,400 JPY 364,501.94 379,947.90 0.12Mass Transit Railway Corp 63,500 HKD 356,350.92 375,376.33 0.12Mazda Motor Corp 24,300 JPY 241,106.33 222,649.90 0.07
Pramerica Sicav
The accompanying notes form an integral part of these financial statements.
96
Asia Pacific Equity
Statement of Investmentsas at June 30, 2019 (continued)
(expressed in EUR)
* Securities partially or totally lent (see Note 9).
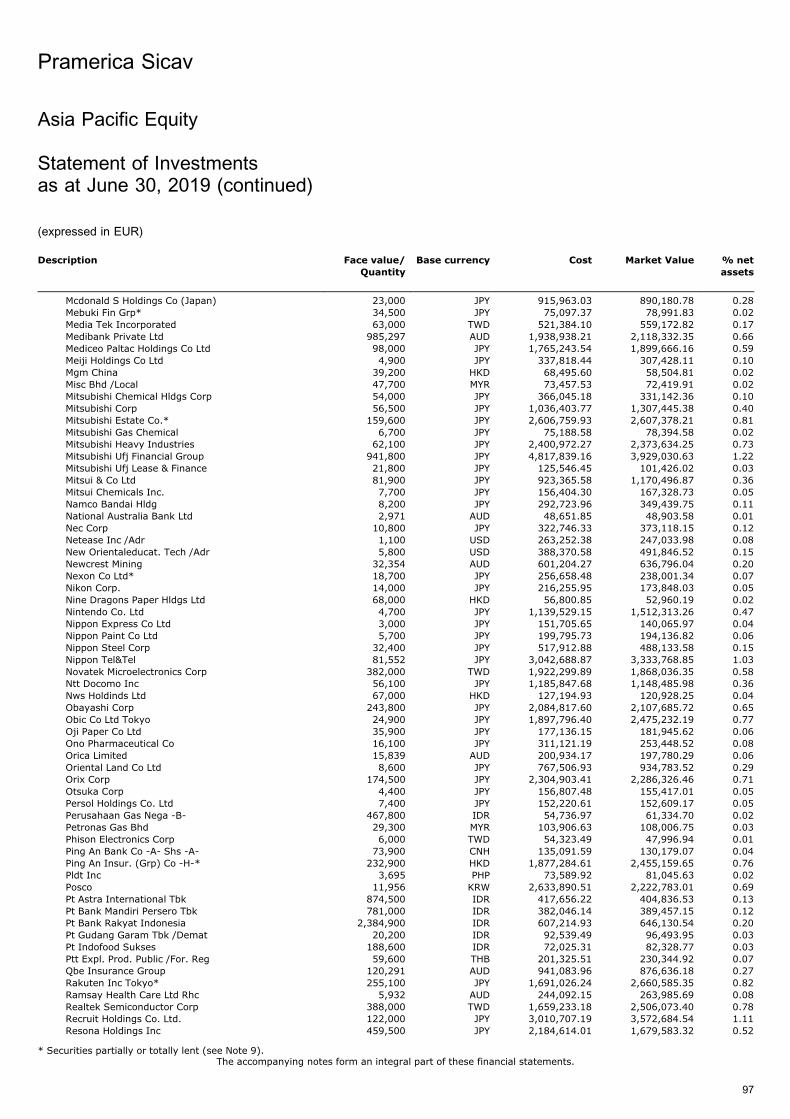
Description Face value/
Quantity
Base currency Cost Market Value % net
assets
Mcdonald S Holdings Co (Japan) 23,000 JPY 915,963.03 890,180.78 0.28Mebuki Fin Grp* 34,500 JPY 75,097.37 78,991.83 0.02Media Tek Incorporated 63,000 TWD 521,384.10 559,172.82 0.17Medibank Private Ltd 985,297 AUD 1,938,938.21 2,118,332.35 0.66Mediceo Paltac Holdings Co Ltd 98,000 JPY 1,765,243.54 1,899,666.16 0.59Meiji Holdings Co Ltd 4,900 JPY 337,818.44 307,428.11 0.10Mgm China 39,200 HKD 68,495.60 58,504.81 0.02Misc Bhd /Local 47,700 MYR 73,457.53 72,419.91 0.02Mitsubishi Chemical Hldgs Corp 54,000 JPY 366,045.18 331,142.36 0.10Mitsubishi Corp 56,500 JPY 1,036,403.77 1,307,445.38 0.40Mitsubishi Estate Co.* 159,600 JPY 2,606,759.93 2,607,378.21 0.81Mitsubishi Gas Chemical 6,700 JPY 75,188.58 78,394.58 0.02Mitsubishi Heavy Industries 62,100 JPY 2,400,972.27 2,373,634.25 0.73Mitsubishi Ufj Financial Group 941,800 JPY 4,817,839.16 3,929,030.63 1.22Mitsubishi Ufj Lease & Finance 21,800 JPY 125,546.45 101,426.02 0.03Mitsui & Co Ltd 81,900 JPY 923,365.58 1,170,496.87 0.36Mitsui Chemicals Inc. 7,700 JPY 156,404.30 167,328.73 0.05Namco Bandai Hldg 8,200 JPY 292,723.96 349,439.75 0.11National Australia Bank Ltd 2,971 AUD 48,651.85 48,903.58 0.01Nec Corp 10,800 JPY 322,746.33 373,118.15 0.12Netease Inc /Adr 1,100 USD 263,252.38 247,033.98 0.08New Orientaleducat. Tech /Adr 5,800 USD 388,370.58 491,846.52 0.15Newcrest Mining 32,354 AUD 601,204.27 636,796.04 0.20Nexon Co Ltd* 18,700 JPY 256,658.48 238,001.34 0.07Nikon Corp. 14,000 JPY 216,255.95 173,848.03 0.05Nine Dragons Paper Hldgs Ltd 68,000 HKD 56,800.85 52,960.19 0.02Nintendo Co. Ltd 4,700 JPY 1,139,529.15 1,512,313.26 0.47Nippon Express Co Ltd 3,000 JPY 151,705.65 140,065.97 0.04Nippon Paint Co Ltd 5,700 JPY 199,795.73 194,136.82 0.06Nippon Steel Corp 32,400 JPY 517,912.88 488,133.58 0.15Nippon Tel&Tel 81,552 JPY 3,042,688.87 3,333,768.85 1.03Novatek Microelectronics Corp 382,000 TWD 1,922,299.89 1,868,036.35 0.58Ntt Docomo Inc 56,100 JPY 1,185,847.68 1,148,485.98 0.36Nws Holdinds Ltd 67,000 HKD 127,194.93 120,928.25 0.04Obayashi Corp 243,800 JPY 2,084,817.60 2,107,685.72 0.65Obic Co Ltd Tokyo 24,900 JPY 1,897,796.40 2,475,232.19 0.77Oji Paper Co Ltd 35,900 JPY 177,136.15 181,945.62 0.06Ono Pharmaceutical Co 16,100 JPY 311,121.19 253,448.52 0.08Orica Limited 15,839 AUD 200,934.17 197,780.29 0.06Oriental Land Co Ltd 8,600 JPY 767,506.93 934,783.52 0.29Orix Corp 174,500 JPY 2,304,903.41 2,286,326.46 0.71Otsuka Corp 4,400 JPY 156,807.48 155,417.01 0.05Persol Holdings Co. Ltd 7,400 JPY 152,220.61 152,609.17 0.05Perusahaan Gas Nega -B- 467,800 IDR 54,736.97 61,334.70 0.02Petronas Gas Bhd 29,300 MYR 103,906.63 108,006.75 0.03Phison Electronics Corp 6,000 TWD 54,323.49 47,996.94 0.01Ping An Bank Co -A- Shs -A- 73,900 CNH 135,091.59 130,179.07 0.04Ping An Insur. (Grp) Co -H-* 232,900 HKD 1,877,284.61 2,455,159.65 0.76Pldt Inc 3,695 PHP 73,589.92 81,045.63 0.02Posco 11,956 KRW 2,633,890.51 2,222,783.01 0.69Pt Astra International Tbk 874,500 IDR 417,656.22 404,836.53 0.13Pt Bank Mandiri Persero Tbk 781,000 IDR 382,046.14 389,457.15 0.12Pt Bank Rakyat Indonesia 2,384,900 IDR 607,214.93 646,130.54 0.20Pt Gudang Garam Tbk /Demat 20,200 IDR 92,539.49 96,493.95 0.03Pt Indofood Sukses 188,600 IDR 72,025.31 82,328.77 0.03Ptt Expl. Prod. Public /For. Reg 59,600 THB 201,325.51 230,344.92 0.07Qbe Insurance Group 120,291 AUD 941,083.96 876,636.18 0.27Rakuten Inc Tokyo* 255,100 JPY 1,691,026.24 2,660,585.35 0.82Ramsay Health Care Ltd Rhc 5,932 AUD 244,092.15 263,985.69 0.08Realtek Semiconductor Corp 388,000 TWD 1,659,233.18 2,506,073.40 0.78Recruit Holdings Co. Ltd. 122,000 JPY 3,010,707.19 3,572,684.54 1.11Resona Holdings Inc 459,500 JPY 2,184,614.01 1,679,583.32 0.52
Pramerica Sicav
The accompanying notes form an integral part of these financial statements.
97
Asia Pacific Equity
Statement of Investmentsas at June 30, 2019 (continued)
(expressed in EUR)
* Securities partially or totally lent (see Note 9).
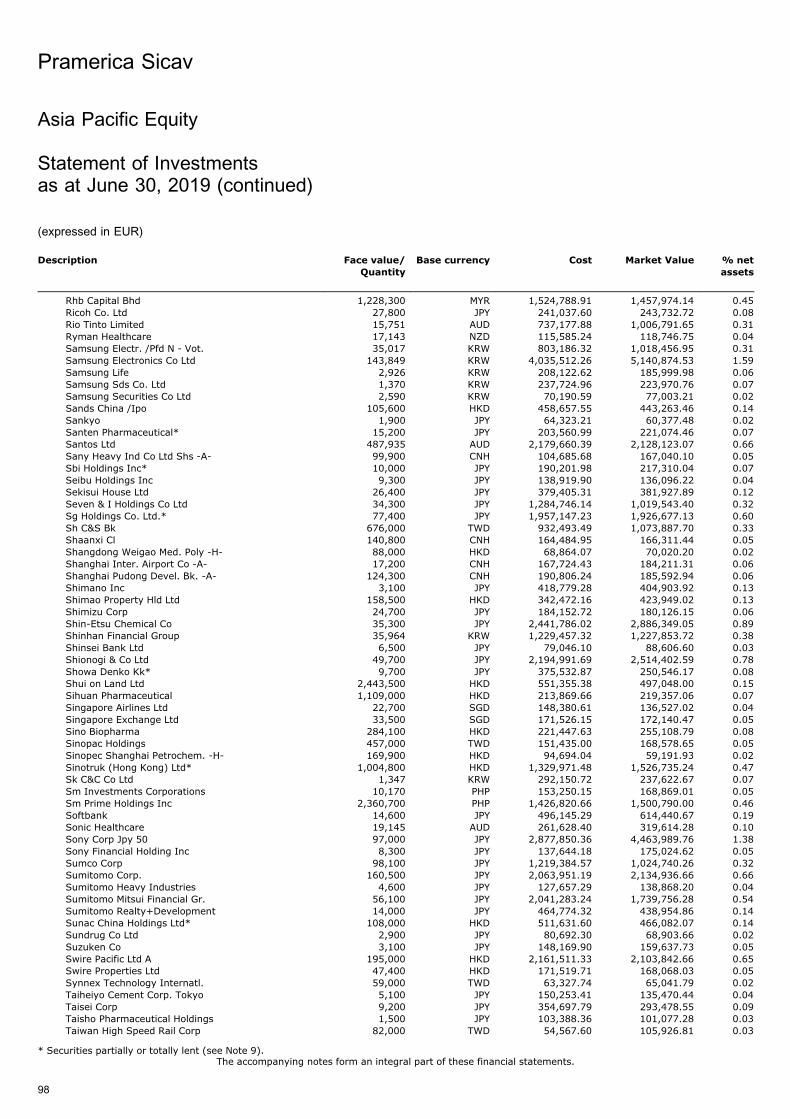
Description Face value/
Quantity
Base currency Cost Market Value % net
assets
Rhb Capital Bhd 1,228,300 MYR 1,524,788.91 1,457,974.14 0.45Ricoh Co. Ltd 27,800 JPY 241,037.60 243,732.72 0.08Rio Tinto Limited 15,751 AUD 737,177.88 1,006,791.65 0.31Ryman Healthcare 17,143 NZD 115,585.24 118,746.75 0.04Samsung Electr. /Pfd N - Vot. 35,017 KRW 803,186.32 1,018,456.95 0.31Samsung Electronics Co Ltd 143,849 KRW 4,035,512.26 5,140,874.53 1.59Samsung Life 2,926 KRW 208,122.62 185,999.98 0.06Samsung Sds Co. Ltd 1,370 KRW 237,724.96 223,970.76 0.07Samsung Securities Co Ltd 2,590 KRW 70,190.59 77,003.21 0.02Sands China /Ipo 105,600 HKD 458,657.55 443,263.46 0.14Sankyo 1,900 JPY 64,323.21 60,377.48 0.02Santen Pharmaceutical* 15,200 JPY 203,560.99 221,074.46 0.07Santos Ltd 487,935 AUD 2,179,660.39 2,128,123.07 0.66Sany Heavy Ind Co Ltd Shs -A- 99,900 CNH 104,685.68 167,040.10 0.05Sbi Holdings Inc* 10,000 JPY 190,201.98 217,310.04 0.07Seibu Holdings Inc 9,300 JPY 138,919.90 136,096.22 0.04Sekisui House Ltd 26,400 JPY 379,405.31 381,927.89 0.12Seven & I Holdings Co Ltd 34,300 JPY 1,284,746.14 1,019,543.40 0.32Sg Holdings Co. Ltd.* 77,400 JPY 1,957,147.23 1,926,677.13 0.60Sh C&S Bk 676,000 TWD 932,493.49 1,073,887.70 0.33Shaanxi Cl 140,800 CNH 164,484.95 166,311.44 0.05Shangdong Weigao Med. Poly -H- 88,000 HKD 68,864.07 70,020.20 0.02Shanghai Inter. Airport Co -A- 17,200 CNH 167,724.43 184,211.31 0.06Shanghai Pudong Devel. Bk. -A- 124,300 CNH 190,806.24 185,592.94 0.06Shimano Inc 3,100 JPY 418,779.28 404,903.92 0.13Shimao Property Hld Ltd 158,500 HKD 342,472.16 423,949.02 0.13Shimizu Corp 24,700 JPY 184,152.72 180,126.15 0.06Shin-Etsu Chemical Co 35,300 JPY 2,441,786.02 2,886,349.05 0.89Shinhan Financial Group 35,964 KRW 1,229,457.32 1,227,853.72 0.38Shinsei Bank Ltd 6,500 JPY 79,046.10 88,606.60 0.03Shionogi & Co Ltd 49,700 JPY 2,194,991.69 2,514,402.59 0.78Showa Denko Kk* 9,700 JPY 375,532.87 250,546.17 0.08Shui on Land Ltd 2,443,500 HKD 551,355.38 497,048.00 0.15Sihuan Pharmaceutical 1,109,000 HKD 213,869.66 219,357.06 0.07Singapore Airlines Ltd 22,700 SGD 148,380.61 136,527.02 0.04Singapore Exchange Ltd 33,500 SGD 171,526.15 172,140.47 0.05Sino Biopharma 284,100 HKD 221,447.63 255,108.79 0.08Sinopac Holdings 457,000 TWD 151,435.00 168,578.65 0.05Sinopec Shanghai Petrochem. -H- 169,900 HKD 94,694.04 59,191.93 0.02Sinotruk (Hong Kong) Ltd* 1,004,800 HKD 1,329,971.48 1,526,735.24 0.47Sk C&C Co Ltd 1,347 KRW 292,150.72 237,622.67 0.07Sm Investments Corporations 10,170 PHP 153,250.15 168,869.01 0.05Sm Prime Holdings Inc 2,360,700 PHP 1,426,820.66 1,500,790.00 0.46Softbank 14,600 JPY 496,145.29 614,440.67 0.19Sonic Healthcare 19,145 AUD 261,628.40 319,614.28 0.10Sony Corp Jpy 50 97,000 JPY 2,877,850.36 4,463,989.76 1.38Sony Financial Holding Inc 8,300 JPY 137,644.18 175,024.62 0.05Sumco Corp 98,100 JPY 1,219,384.57 1,024,740.26 0.32Sumitomo Corp. 160,500 JPY 2,063,951.19 2,134,936.66 0.66Sumitomo Heavy Industries 4,600 JPY 127,657.29 138,868.20 0.04Sumitomo Mitsui Financial Gr. 56,100 JPY 2,041,283.24 1,739,756.28 0.54Sumitomo Realty+Development 14,000 JPY 464,774.32 438,954.86 0.14Sunac China Holdings Ltd* 108,000 HKD 511,631.60 466,082.07 0.14Sundrug Co Ltd 2,900 JPY 80,692.30 68,903.66 0.02Suzuken Co 3,100 JPY 148,169.90 159,637.73 0.05Swire Pacific Ltd A 195,000 HKD 2,161,511.33 2,103,842.66 0.65Swire Properties Ltd 47,400 HKD 171,519.71 168,068.03 0.05Synnex Technology Internatl. 59,000 TWD 63,327.74 65,041.79 0.02Taiheiyo Cement Corp. Tokyo 5,100 JPY 150,253.41 135,470.44 0.04Taisei Corp 9,200 JPY 354,697.79 293,478.55 0.09Taisho Pharmaceutical Holdings 1,500 JPY 103,388.36 101,077.28 0.03Taiwan High Speed Rail Corp 82,000 TWD 54,567.60 105,926.81 0.03
Pramerica Sicav
The accompanying notes form an integral part of these financial statements.
98
Asia Pacific Equity
Statement of Investmentsas at June 30, 2019 (continued)
(expressed in EUR)
* Securities partially or totally lent (see Note 9).
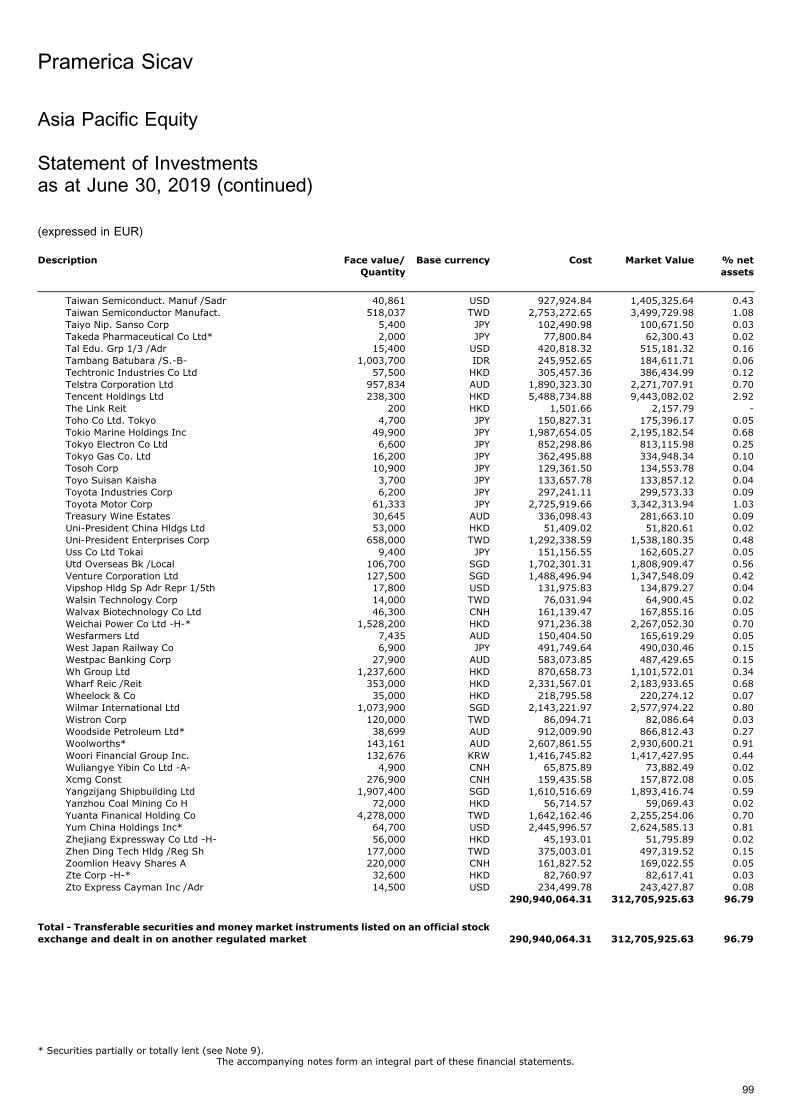
Description Face value/
Quantity
Base currency Cost Market Value % net
assets
Taiwan Semiconduct. Manuf /Sadr 40,861 USD 927,924.84 1,405,325.64 0.43Taiwan Semiconductor Manufact. 518,037 TWD 2,753,272.65 3,499,729.98 1.08Taiyo Nip. Sanso Corp 5,400 JPY 102,490.98 100,671.50 0.03Takeda Pharmaceutical Co Ltd* 2,000 JPY 77,800.84 62,300.43 0.02Tal Edu. Grp 1/3 /Adr 15,400 USD 420,818.32 515,181.32 0.16Tambang Batubara /S.-B- 1,003,700 IDR 245,952.65 184,611.71 0.06Techtronic Industries Co Ltd 57,500 HKD 305,457.36 386,434.99 0.12Telstra Corporation Ltd 957,834 AUD 1,890,323.30 2,271,707.91 0.70Tencent Holdings Ltd 238,300 HKD 5,488,734.88 9,443,082.02 2.92The Link Reit 200 HKD 1,501.66 2,157.79 -Toho Co Ltd. Tokyo 4,700 JPY 150,827.31 175,396.17 0.05Tokio Marine Holdings Inc 49,900 JPY 1,987,654.05 2,195,182.54 0.68Tokyo Electron Co Ltd 6,600 JPY 852,298.86 813,115.98 0.25Tokyo Gas Co. Ltd 16,200 JPY 362,495.88 334,948.34 0.10Tosoh Corp 10,900 JPY 129,361.50 134,553.78 0.04Toyo Suisan Kaisha 3,700 JPY 133,657.78 133,857.12 0.04Toyota Industries Corp 6,200 JPY 297,241.11 299,573.33 0.09Toyota Motor Corp 61,333 JPY 2,725,919.66 3,342,313.94 1.03Treasury Wine Estates 30,645 AUD 336,098.43 281,663.10 0.09Uni-President China Hldgs Ltd 53,000 HKD 51,409.02 51,820.61 0.02Uni-President Enterprises Corp 658,000 TWD 1,292,338.59 1,538,180.35 0.48Uss Co Ltd Tokai 9,400 JPY 151,156.55 162,605.27 0.05Utd Overseas Bk /Local 106,700 SGD 1,702,301.31 1,808,909.47 0.56Venture Corporation Ltd 127,500 SGD 1,488,496.94 1,347,548.09 0.42Vipshop Hldg Sp Adr Repr 1/5th 17,800 USD 131,975.83 134,879.27 0.04Walsin Technology Corp 14,000 TWD 76,031.94 64,900.45 0.02Walvax Biotechnology Co Ltd 46,300 CNH 161,139.47 167,855.16 0.05Weichai Power Co Ltd -H-* 1,528,200 HKD 971,236.38 2,267,052.30 0.70Wesfarmers Ltd 7,435 AUD 150,404.50 165,619.29 0.05West Japan Railway Co 6,900 JPY 491,749.64 490,030.46 0.15Westpac Banking Corp 27,900 AUD 583,073.85 487,429.65 0.15Wh Group Ltd 1,237,600 HKD 870,658.73 1,101,572.01 0.34Wharf Reic /Reit 353,000 HKD 2,331,567.01 2,183,933.65 0.68Wheelock & Co 35,000 HKD 218,795.58 220,274.12 0.07Wilmar International Ltd 1,073,900 SGD 2,143,221.97 2,577,974.22 0.80Wistron Corp 120,000 TWD 86,094.71 82,086.64 0.03Woodside Petroleum Ltd* 38,699 AUD 912,009.90 866,812.43 0.27Woolworths* 143,161 AUD 2,607,861.55 2,930,600.21 0.91Woori Financial Group Inc. 132,676 KRW 1,416,745.82 1,417,427.95 0.44Wuliangye Yibin Co Ltd -A- 4,900 CNH 65,875.89 73,882.49 0.02Xcmg Const 276,900 CNH 159,435.58 157,872.08 0.05Yangzijang Shipbuilding Ltd 1,907,400 SGD 1,610,516.69 1,893,416.74 0.59Yanzhou Coal Mining Co H 72,000 HKD 56,714.57 59,069.43 0.02Yuanta Finanical Holding Co 4,278,000 TWD 1,642,162.46 2,255,254.06 0.70Yum China Holdings Inc* 64,700 USD 2,445,996.57 2,624,585.13 0.81Zhejiang Expressway Co Ltd -H- 56,000 HKD 45,193.01 51,795.89 0.02Zhen Ding Tech Hldg /Reg Sh 177,000 TWD 375,003.01 497,319.52 0.15Zoomlion Heavy Shares A 220,000 CNH 161,827.52 169,022.55 0.05Zte Corp -H-* 32,600 HKD 82,760.97 82,617.41 0.03Zto Express Cayman Inc /Adr 14,500 USD 234,499.78 243,427.87 0.08
290,940,064.31 312,705,925.63 96.79
Total - Transferable securities and money market instruments listed on an official stock
exchange and dealt in on another regulated market 290,940,064.31 312,705,925.63 96.79
Pramerica Sicav
The accompanying notes form an integral part of these financial statements.
99
Asia Pacific Equity
Statement of Investmentsas at June 30, 2019 (continued)
(expressed in EUR)
* Securities partially or totally lent (see Note 9).
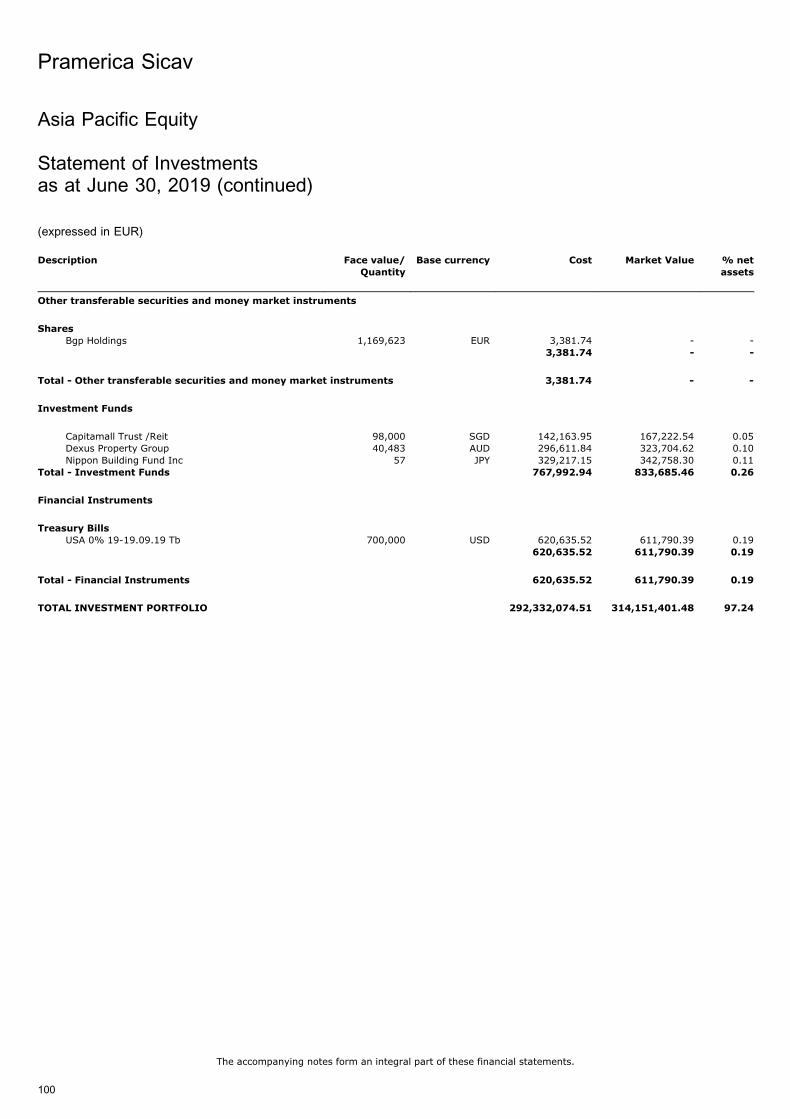
Description Face value/
Quantity
Base currency Cost Market Value % net
assets
Other transferable securities and money market instruments
Shares
Bgp Holdings 1,169,623 EUR 3,381.74 - -3,381.74 - -
Total - Other transferable securities and money market instruments 3,381.74 - -
Investment Funds
Capitamall Trust /Reit 98,000 SGD 142,163.95 167,222.54 0.05Dexus Property Group 40,483 AUD 296,611.84 323,704.62 0.10Nippon Building Fund Inc 57 JPY 329,217.15 342,758.30 0.11
Total - Investment Funds 767,992.94 833,685.46 0.26
Financial Instruments
Treasury BillsUSA 0% 19-19.09.19 Tb 700,000 USD 620,635.52 611,790.39 0.19
620,635.52 611,790.39 0.19
Total - Financial Instruments 620,635.52 611,790.39 0.19
TOTAL INVESTMENT PORTFOLIO 292,332,074.51 314,151,401.48 97.24
Pramerica Sicav
The accompanying notes form an integral part of these financial statements.
100
Asia Pacific Equity
Statement of Investmentsas at June 30, 2019 (continued)
(expressed in EUR)
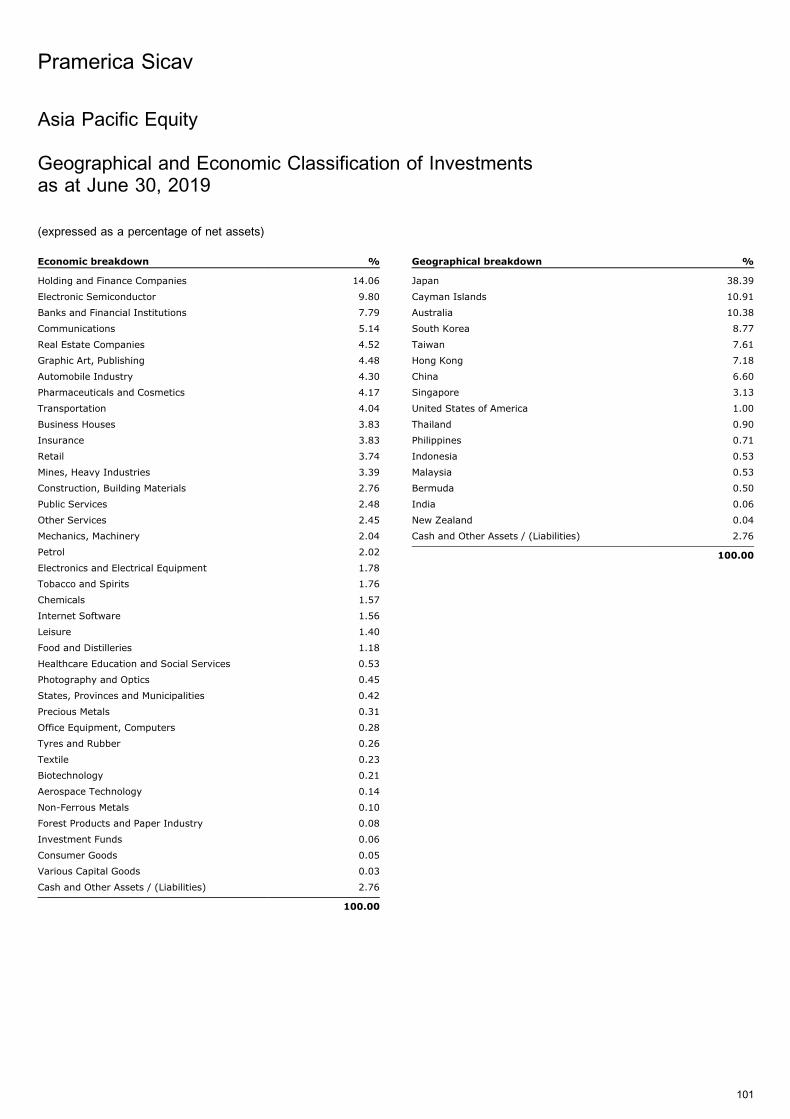
Asia Pacific Equity
Geographical and Economic Classification of Investmentsas at June 30, 2019
(expressed as a percentage of net assets)
Economic breakdown %
Holding and Finance Companies 14.06
Electronic Semiconductor 9.80
Banks and Financial Institutions 7.79
Communications 5.14
Real Estate Companies 4.52
Graphic Art, Publishing 4.48
Automobile Industry 4.30
Pharmaceuticals and Cosmetics 4.17
Transportation 4.04
Business Houses 3.83
Insurance 3.83
Retail 3.74
Mines, Heavy Industries 3.39
Construction, Building Materials 2.76
Public Services 2.48
Other Services 2.45
Mechanics, Machinery 2.04
Petrol 2.02
Electronics and Electrical Equipment 1.78
Tobacco and Spirits 1.76
Chemicals 1.57
Internet Software 1.56
Leisure 1.40
Food and Distilleries 1.18
Healthcare Education and Social Services 0.53
Photography and Optics 0.45
States, Provinces and Municipalities 0.42
Precious Metals 0.31
Office Equipment, Computers 0.28
Tyres and Rubber 0.26
Textile 0.23
Biotechnology 0.21
Aerospace Technology 0.14
Non-Ferrous Metals 0.10
Forest Products and Paper Industry 0.08
Investment Funds 0.06
Consumer Goods 0.05
Various Capital Goods 0.03
Cash and Other Assets / (Liabilities) 2.76
100.00
Geographical breakdown %
Japan 38.39
Cayman Islands 10.91
Australia 10.38
South Korea 8.77
Taiwan 7.61
Hong Kong 7.18
China 6.60
Singapore 3.13
United States of America 1.00
Thailand 0.90
Philippines 0.71
Indonesia 0.53
Malaysia 0.53
Bermuda 0.50
India 0.06
New Zealand 0.04
Cash and Other Assets / (Liabilities) 2.76
100.00
Pramerica Sicav
101
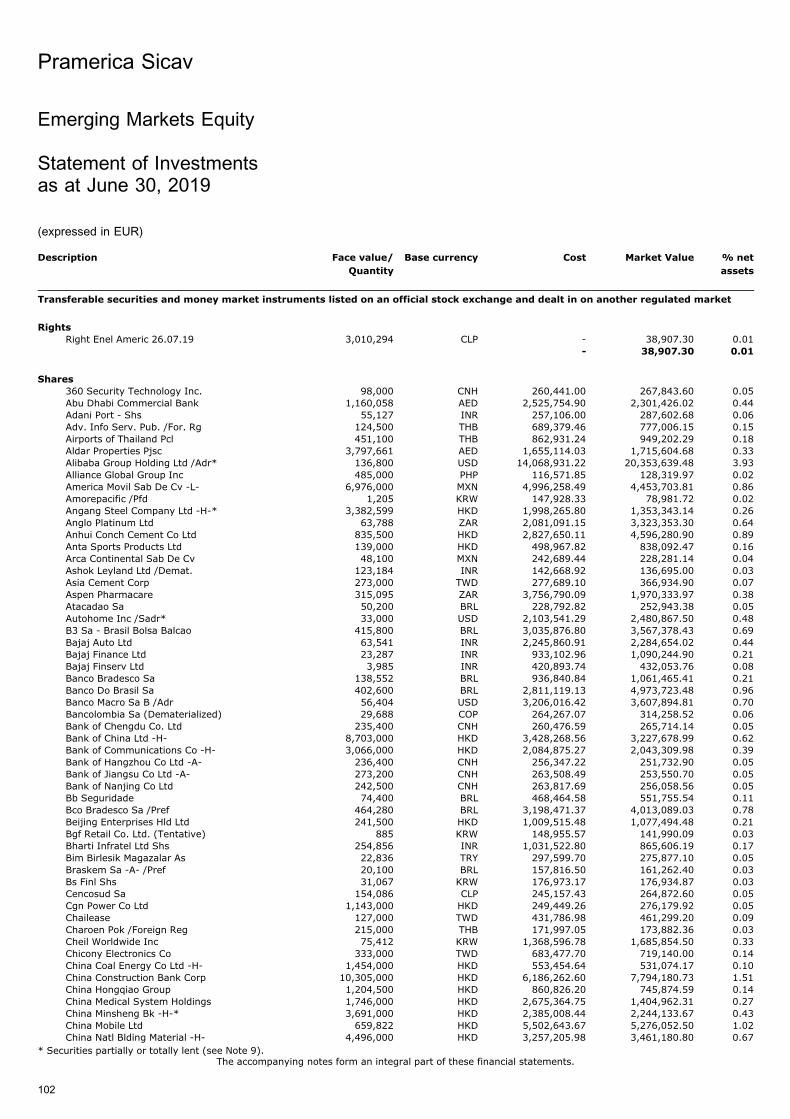
Emerging Markets Equity
Statement of Investmentsas at June 30, 2019
(expressed in EUR)
Description Face value/
Quantity
Base currency Cost Market Value % net
assets
Transferable securities and money market instruments listed on an official stock exchange and dealt in on another regulated market
Rights
Right Enel Americ 26.07.19 3,010,294 CLP - 38,907.30 0.01- 38,907.30 0.01
Shares
360 Security Technology Inc. 98,000 CNH 260,441.00 267,843.60 0.05Abu Dhabi Commercial Bank 1,160,058 AED 2,525,754.90 2,301,426.02 0.44Adani Port - Shs 55,127 INR 257,106.00 287,602.68 0.06Adv. Info Serv. Pub. /For. Rg 124,500 THB 689,379.46 777,006.15 0.15Airports of Thailand Pcl 451,100 THB 862,931.24 949,202.29 0.18Aldar Properties Pjsc 3,797,661 AED 1,655,114.03 1,715,604.68 0.33Alibaba Group Holding Ltd /Adr* 136,800 USD 14,068,931.22 20,353,639.48 3.93Alliance Global Group Inc 485,000 PHP 116,571.85 128,319.97 0.02America Movil Sab De Cv -L- 6,976,000 MXN 4,996,258.49 4,453,703.81 0.86Amorepacific /Pfd 1,205 KRW 147,928.33 78,981.72 0.02Angang Steel Company Ltd -H-* 3,382,599 HKD 1,998,265.80 1,353,343.14 0.26Anglo Platinum Ltd 63,788 ZAR 2,081,091.15 3,323,353.30 0.64Anhui Conch Cement Co Ltd 835,500 HKD 2,827,650.11 4,596,280.90 0.89Anta Sports Products Ltd 139,000 HKD 498,967.82 838,092.47 0.16Arca Continental Sab De Cv 48,100 MXN 242,689.44 228,281.14 0.04Ashok Leyland Ltd /Demat. 123,184 INR 142,668.92 136,695.00 0.03Asia Cement Corp 273,000 TWD 277,689.10 366,934.90 0.07Aspen Pharmacare 315,095 ZAR 3,756,790.09 1,970,333.97 0.38Atacadao Sa 50,200 BRL 228,792.82 252,943.38 0.05Autohome Inc /Sadr* 33,000 USD 2,103,541.29 2,480,867.50 0.48B3 Sa - Brasil Bolsa Balcao 415,800 BRL 3,035,876.80 3,567,378.43 0.69Bajaj Auto Ltd 63,541 INR 2,245,860.91 2,284,654.02 0.44Bajaj Finance Ltd 23,287 INR 933,102.96 1,090,244.90 0.21Bajaj Finserv Ltd 3,985 INR 420,893.74 432,053.76 0.08Banco Bradesco Sa 138,552 BRL 936,840.84 1,061,465.41 0.21Banco Do Brasil Sa 402,600 BRL 2,811,119.13 4,973,723.48 0.96Banco Macro Sa B /Adr 56,404 USD 3,206,016.42 3,607,894.81 0.70Bancolombia Sa (Dematerialized) 29,688 COP 264,267.07 314,258.52 0.06Bank of Chengdu Co. Ltd 235,400 CNH 260,476.59 265,714.14 0.05Bank of China Ltd -H- 8,703,000 HKD 3,428,268.56 3,227,678.99 0.62Bank of Communications Co -H- 3,066,000 HKD 2,084,875.27 2,043,309.98 0.39Bank of Hangzhou Co Ltd -A- 236,400 CNH 256,347.22 251,732.90 0.05Bank of Jiangsu Co Ltd -A- 273,200 CNH 263,508.49 253,550.70 0.05Bank of Nanjing Co Ltd 242,500 CNH 263,817.69 256,058.56 0.05Bb Seguridade 74,400 BRL 468,464.58 551,755.54 0.11Bco Bradesco Sa /Pref 464,280 BRL 3,198,471.37 4,013,089.03 0.78Beijing Enterprises Hld Ltd 241,500 HKD 1,009,515.48 1,077,494.48 0.21Bgf Retail Co. Ltd. (Tentative) 885 KRW 148,955.57 141,990.09 0.03Bharti Infratel Ltd Shs 254,856 INR 1,031,522.80 865,606.19 0.17Bim Birlesik Magazalar As 22,836 TRY 297,599.70 275,877.10 0.05Braskem Sa -A- /Pref 20,100 BRL 157,816.50 161,262.40 0.03Bs Finl Shs 31,067 KRW 176,973.17 176,934.87 0.03Cencosud Sa 154,086 CLP 245,157.43 264,872.60 0.05Cgn Power Co Ltd 1,143,000 HKD 249,449.26 276,179.92 0.05Chailease 127,000 TWD 431,786.98 461,299.20 0.09Charoen Pok /Foreign Reg 215,000 THB 171,997.05 173,882.36 0.03Cheil Worldwide Inc 75,412 KRW 1,368,596.78 1,685,854.50 0.33Chicony Electronics Co 333,000 TWD 683,477.70 719,140.00 0.14China Coal Energy Co Ltd -H- 1,454,000 HKD 553,454.64 531,074.17 0.10China Construction Bank Corp 10,305,000 HKD 6,186,262.60 7,794,180.73 1.51China Hongqiao Group 1,204,500 HKD 860,826.20 745,874.59 0.14China Medical System Holdings 1,746,000 HKD 2,675,364.75 1,404,962.31 0.27China Minsheng Bk -H-* 3,691,000 HKD 2,385,008.44 2,244,133.67 0.43China Mobile Ltd 659,822 HKD 5,502,643.67 5,276,052.50 1.02China Natl Blding Material -H- 4,496,000 HKD 3,257,205.98 3,461,180.80 0.67
Pramerica Sicav
The accompanying notes form an integral part of these financial statements.
102
* Securities partially or totally lent (see Note 9).
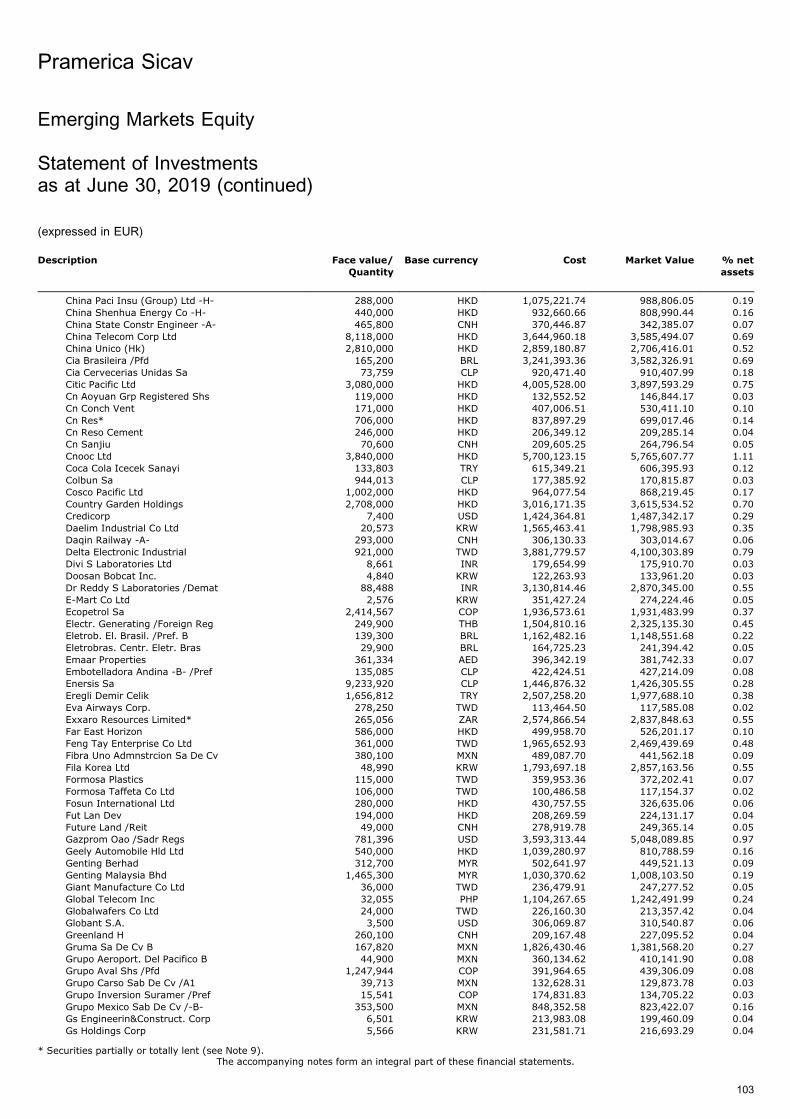
Description Face value/
Quantity
Base currency Cost Market Value % net
assets
China Paci Insu (Group) Ltd -H- 288,000 HKD 1,075,221.74 988,806.05 0.19China Shenhua Energy Co -H- 440,000 HKD 932,660.66 808,990.44 0.16China State Constr Engineer -A- 465,800 CNH 370,446.87 342,385.07 0.07China Telecom Corp Ltd 8,118,000 HKD 3,644,960.18 3,585,494.07 0.69China Unico (Hk) 2,810,000 HKD 2,859,180.87 2,706,416.01 0.52Cia Brasileira /Pfd 165,200 BRL 3,241,393.36 3,582,326.91 0.69Cia Cervecerias Unidas Sa 73,759 CLP 920,471.40 910,407.99 0.18Citic Pacific Ltd 3,080,000 HKD 4,005,528.00 3,897,593.29 0.75Cn Aoyuan Grp Registered Shs 119,000 HKD 132,552.52 146,844.17 0.03Cn Conch Vent 171,000 HKD 407,006.51 530,411.10 0.10Cn Res* 706,000 HKD 837,897.29 699,017.46 0.14Cn Reso Cement 246,000 HKD 206,349.12 209,285.14 0.04Cn Sanjiu 70,600 CNH 209,605.25 264,796.54 0.05Cnooc Ltd 3,840,000 HKD 5,700,123.15 5,765,607.77 1.11Coca Cola Icecek Sanayi 133,803 TRY 615,349.21 606,395.93 0.12Colbun Sa 944,013 CLP 177,385.92 170,815.87 0.03Cosco Pacific Ltd 1,002,000 HKD 964,077.54 868,219.45 0.17Country Garden Holdings 2,708,000 HKD 3,016,171.35 3,615,534.52 0.70Credicorp 7,400 USD 1,424,364.81 1,487,342.17 0.29Daelim Industrial Co Ltd 20,573 KRW 1,565,463.41 1,798,985.93 0.35Daqin Railway -A- 293,000 CNH 306,130.33 303,014.67 0.06Delta Electronic Industrial 921,000 TWD 3,881,779.57 4,100,303.89 0.79Divi S Laboratories Ltd 8,661 INR 179,654.99 175,910.70 0.03Doosan Bobcat Inc. 4,840 KRW 122,263.93 133,961.20 0.03Dr Reddy S Laboratories /Demat 88,488 INR 3,130,814.46 2,870,345.00 0.55E-Mart Co Ltd 2,576 KRW 351,427.24 274,224.46 0.05Ecopetrol Sa 2,414,567 COP 1,936,573.61 1,931,483.99 0.37Electr. Generating /Foreign Reg 249,900 THB 1,504,810.16 2,325,135.30 0.45Eletrob. El. Brasil. /Pref. B 139,300 BRL 1,162,482.16 1,148,551.68 0.22Eletrobras. Centr. Eletr. Bras 29,900 BRL 164,725.23 241,394.42 0.05Emaar Properties 361,334 AED 396,342.19 381,742.33 0.07Embotelladora Andina -B- /Pref 135,085 CLP 422,424.51 427,214.09 0.08Enersis Sa 9,233,920 CLP 1,446,876.32 1,426,305.55 0.28Eregli Demir Celik 1,656,812 TRY 2,507,258.20 1,977,688.10 0.38Eva Airways Corp. 278,250 TWD 113,464.50 117,585.08 0.02Exxaro Resources Limited* 265,056 ZAR 2,574,866.54 2,837,848.63 0.55Far East Horizon 586,000 HKD 499,958.70 526,201.17 0.10Feng Tay Enterprise Co Ltd 361,000 TWD 1,965,652.93 2,469,439.69 0.48Fibra Uno Admnstrcion Sa De Cv 380,100 MXN 489,087.70 441,562.18 0.09Fila Korea Ltd 48,990 KRW 1,793,697.18 2,857,163.56 0.55Formosa Plastics 115,000 TWD 359,953.36 372,202.41 0.07Formosa Taffeta Co Ltd 106,000 TWD 100,486.58 117,154.37 0.02Fosun International Ltd 280,000 HKD 430,757.55 326,635.06 0.06Fut Lan Dev 194,000 HKD 208,269.59 224,131.17 0.04Future Land /Reit 49,000 CNH 278,919.78 249,365.14 0.05Gazprom Oao /Sadr Regs 781,396 USD 3,593,313.44 5,048,089.85 0.97Geely Automobile Hld Ltd 540,000 HKD 1,039,280.97 810,788.59 0.16Genting Berhad 312,700 MYR 502,641.97 449,521.13 0.09Genting Malaysia Bhd 1,465,300 MYR 1,030,370.62 1,008,103.50 0.19Giant Manufacture Co Ltd 36,000 TWD 236,479.91 247,277.52 0.05Global Telecom Inc 32,055 PHP 1,104,267.65 1,242,491.99 0.24Globalwafers Co Ltd 24,000 TWD 226,160.30 213,357.42 0.04Globant S.A. 3,500 USD 306,069.87 310,540.87 0.06Greenland H 260,100 CNH 209,167.48 227,095.52 0.04Gruma Sa De Cv B 167,820 MXN 1,826,430.46 1,381,568.20 0.27Grupo Aeroport. Del Pacifico B 44,900 MXN 360,134.62 410,141.90 0.08Grupo Aval Shs /Pfd 1,247,944 COP 391,964.65 439,306.09 0.08Grupo Carso Sab De Cv /A1 39,713 MXN 132,628.31 129,873.78 0.03Grupo Inversion Suramer /Pref 15,541 COP 174,831.83 134,705.22 0.03Grupo Mexico Sab De Cv /-B- 353,500 MXN 848,352.58 823,422.07 0.16Gs Engineerin&Construct. Corp 6,501 KRW 213,983.08 199,460.09 0.04Gs Holdings Corp 5,566 KRW 231,581.71 216,693.29 0.04
Pramerica Sicav
The accompanying notes form an integral part of these financial statements.
103
Emerging Markets Equity
Statement of Investmentsas at June 30, 2019 (continued)
(expressed in EUR)
* Securities partially or totally lent (see Note 9).

Description Face value/
Quantity
Base currency Cost Market Value % net
assets
Guangzhou Investment Co Ltd 1,718,000 HKD 354,733.83 341,746.31 0.07Gz Bys Phar 63,540 CNH 285,146.51 332,782.64 0.06Hana Financial Group Inc 156,431 KRW 4,464,399.62 4,448,634.47 0.86Hanwha Chemical Corp 12,401 KRW 223,830.01 214,049.82 0.04Hcl Technologies /Demat. 121,880 INR 1,471,480.05 1,650,335.38 0.32Hellenic Telecom 24,680 EUR 262,852.97 320,840.00 0.06Henan Shuanghui Inv. & Dev. Co -A- 90,900 CNH 289,188.58 289,225.30 0.06Hengan Intl Group* 299,000 HKD 2,526,113.59 1,930,494.79 0.37Hindalco Industries /Demat. 828,613 INR 2,324,523.37 2,182,025.81 0.42Home Prod. Center /Foreign Reg. 4,718,800 THB 2,294,677.22 2,364,113.00 0.46Hon Hai Precision Ind. Co Ltd 2,773,000 TWD 6,600,531.44 6,066,897.91 1.17Hotel Shilla 3,275 KRW 247,501.61 241,554.61 0.05Housing Devt Fin Corp 68,279 INR 1,594,979.57 1,903,620.71 0.37Hyundai Glovis Co Ltd 1,679 KRW 209,059.38 205,545.93 0.04Hyundai Mobis 14,378 KRW 2,395,650.86 2,574,670.69 0.50Ind & Com Boc -H- 6,724,000 HKD 3,930,554.01 4,307,348.11 0.83Industrial Bank Co Ltd -A- 138,000 CNH 328,939.58 322,656.39 0.06Industrial Bank of Korea 211,788 KRW 2,410,939.51 2,262,611.41 0.44Infosys — Shs 49,543 INR 347,343.56 461,239.28 0.09Ing Life Insurance Korea. Ltd. 3,990 KRW 106,061.21 96,023.80 0.02Inner Mong. Yitai Coal Co B 115,900 USD 124,843.97 110,313.11 0.02Inter Rao Ues Jsc 3,855,000 RUB 205,730.72 242,964.58 0.05Interglobe Aviation Ltd 9,925 INR 202,320.67 196,660.41 0.04Intl Container Terminal Serv. 414,310 PHP 1,010,149.11 1,039,373.67 0.20Investec Ltd 29,991 ZAR 165,011.57 171,500.65 0.03Irb Brasil Resseguros 15,800 BRL 335,343.50 356,443.12 0.07Itau Holding /Pref 147,790 BRL 1,141,619.73 1,227,353.80 0.24Itc Ltd /Demat 356,852 INR 1,274,051.65 1,242,893.13 0.24Jastrzebska Spolka Weglowa Shs 6,293 PLN 143,305.41 69,933.79 0.01Jd. Com Inc /Adr 112,100 USD 2,799,387.76 2,981,393.45 0.58Jiangsu Hendrui Medicine Co -A- 13,800 CNH 105,260.36 116,431.51 0.02Jiangxi Copper Co Ltd H 114,000 HKD 130,266.32 133,243.37 0.03Jinke Properties Group Co -A- 267,100 CNH 207,195.43 205,891.65 0.04Jsc Surgutneftegaz /Sadr* 43,266 USD 148,425.20 157,084.19 0.03Jumbo Sa 47,812 EUR 679,601.38 812,804.00 0.16Kb Financial Group Inc 117,671 KRW 4,796,237.45 4,102,429.09 0.79Kia Motors Corp.* 141,381 KRW 3,687,745.36 4,730,162.11 0.91Kingboard Chemicals Holdings 77,000 HKD 248,676.21 188,216.37 0.04Koc Hld As 126,667 TRY 297,837.12 336,979.06 0.07Komercni Banka As 36,955 CZK 1,308,946.59 1,293,831.64 0.25Korea Aerospace Industries 7,666 KRW 200,356.68 209,555.96 0.04Korea Gas Corp 2,881 KRW 89,810.68 92,445.98 0.02Korea Investment Holdings Co 4,409 KRW 246,303.76 270,549.00 0.05Korea Kuhmo Petrochemical 19,593 KRW 1,513,184.24 1,451,082.80 0.28Korea Zinc Co Ltd 913 KRW 298,101.18 330,453.25 0.06Krung Thai Bank /For. Reg. 4,958,300 THB 2,678,299.09 2,767,999.60 0.53Kt Corporation 71,872 KRW 1,628,503.46 1,549,334.15 0.30Kt&G Corporation 59,947 KRW 4,595,559.91 4,489,892.92 0.87Kumba Iron Ore Ltd* 100,896 ZAR 2,072,277.28 3,136,559.17 0.61Kweichow Moutai Co Ltd -A- 6,100 CNH 708,336.85 767,312.77 0.15Land and House Public /for. Reg. 338,700 THB 98,167.56 107,630.85 0.02Largan Precision Co Ltd 9,000 TWD 1,106,128.30 980,714.84 0.19Larsen & Toubro Ltd /Demat. 150,498 INR 2,525,665.84 2,972,973.36 0.57Legend Holdings Ltd /H 41,600 HKD 102,656.22 85,930.28 0.02Lenovo Group Ltd 1,506,000 HKD 937,821.26 1,023,971.24 0.20Lg Chem Ltd /Pfd Shas /I01 962 KRW 147,718.52 143,005.96 0.03Lg Electronics Inc 33,372 KRW 1,815,171.16 2,012,276.81 0.39Lg Household & Healthcare Pref 286 KRW 130,086.91 175,280.41 0.03Lic Hsg Finance 223,635 INR 1,376,656.04 1,579,287.68 0.30Localiza Renta A Car 57,000 BRL 453,582.01 534,987.62 0.10Logan Property Holdings Co Ltd* 690,000 HKD 806,453.49 980,174.90 0.19Lojas Renner Sa 100,430 BRL 904,312.90 1,084,761.30 0.21
Pramerica Sicav
The accompanying notes form an integral part of these financial statements.
104
Emerging Markets Equity
Statement of Investmentsas at June 30, 2019 (continued)
(expressed in EUR)
* Securities partially or totally lent (see Note 9).
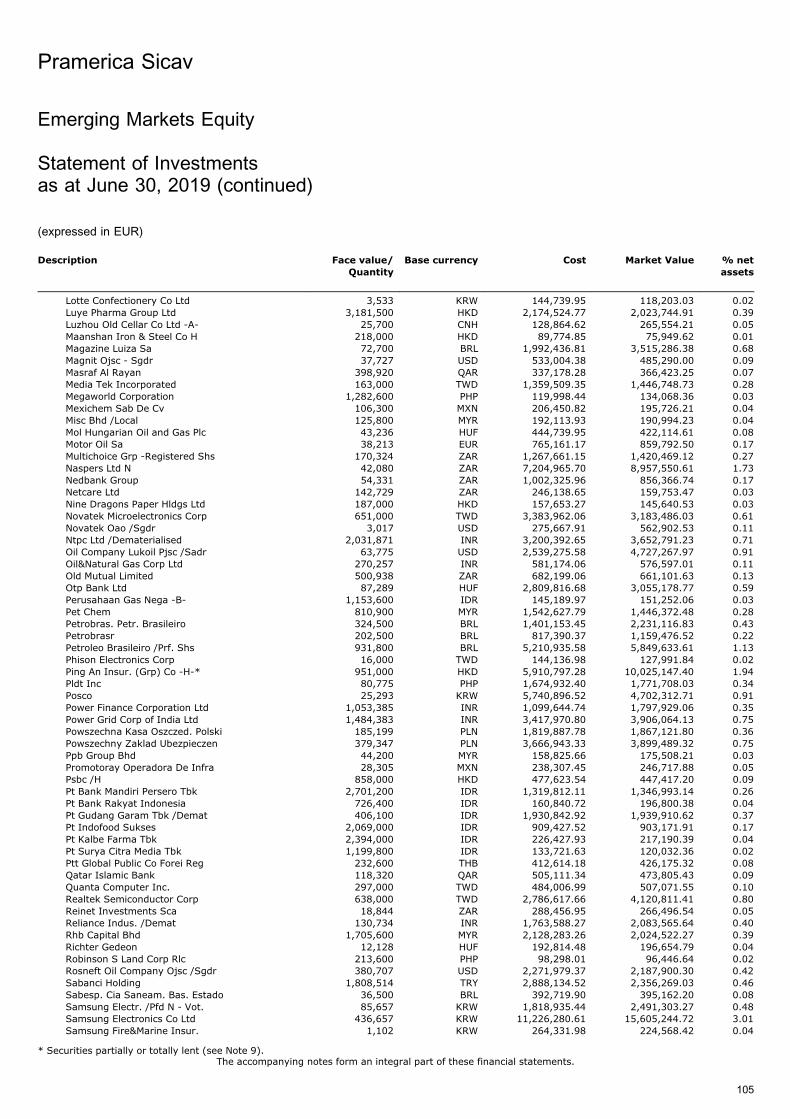
Description Face value/
Quantity
Base currency Cost Market Value % net
assets
Lotte Confectionery Co Ltd 3,533 KRW 144,739.95 118,203.03 0.02Luye Pharma Group Ltd 3,181,500 HKD 2,174,524.77 2,023,744.91 0.39Luzhou Old Cellar Co Ltd -A- 25,700 CNH 128,864.62 265,554.21 0.05Maanshan Iron & Steel Co H 218,000 HKD 89,774.85 75,949.62 0.01Magazine Luiza Sa 72,700 BRL 1,992,436.81 3,515,286.38 0.68Magnit Ojsc - Sgdr 37,727 USD 533,004.38 485,290.00 0.09Masraf Al Rayan 398,920 QAR 337,178.28 366,423.25 0.07Media Tek Incorporated 163,000 TWD 1,359,509.35 1,446,748.73 0.28Megaworld Corporation 1,282,600 PHP 119,998.44 134,068.36 0.03Mexichem Sab De Cv 106,300 MXN 206,450.82 195,726.21 0.04Misc Bhd /Local 125,800 MYR 192,113.93 190,994.23 0.04Mol Hungarian Oil and Gas Plc 43,236 HUF 444,739.95 422,114.61 0.08Motor Oil Sa 38,213 EUR 765,161.17 859,792.50 0.17Multichoice Grp -Registered Shs 170,324 ZAR 1,267,661.15 1,420,469.12 0.27Naspers Ltd N 42,080 ZAR 7,204,965.70 8,957,550.61 1.73Nedbank Group 54,331 ZAR 1,002,325.96 856,366.74 0.17Netcare Ltd 142,729 ZAR 246,138.65 159,753.47 0.03Nine Dragons Paper Hldgs Ltd 187,000 HKD 157,653.27 145,640.53 0.03Novatek Microelectronics Corp 651,000 TWD 3,383,962.06 3,183,486.03 0.61Novatek Oao /Sgdr 3,017 USD 275,667.91 562,902.53 0.11Ntpc Ltd /Dematerialised 2,031,871 INR 3,200,392.65 3,652,791.23 0.71Oil Company Lukoil Pjsc /Sadr 63,775 USD 2,539,275.58 4,727,267.97 0.91Oil&Natural Gas Corp Ltd 270,257 INR 581,174.06 576,597.01 0.11Old Mutual Limited 500,938 ZAR 682,199.06 661,101.63 0.13Otp Bank Ltd 87,289 HUF 2,809,816.68 3,055,178.77 0.59Perusahaan Gas Nega -B- 1,153,600 IDR 145,189.97 151,252.06 0.03Pet Chem 810,900 MYR 1,542,627.79 1,446,372.48 0.28Petrobras. Petr. Brasileiro 324,500 BRL 1,401,153.45 2,231,116.83 0.43Petrobrasr 202,500 BRL 817,390.37 1,159,476.52 0.22Petroleo Brasileiro /Prf. Shs 931,800 BRL 5,210,935.58 5,849,633.61 1.13Phison Electronics Corp 16,000 TWD 144,136.98 127,991.84 0.02Ping An Insur. (Grp) Co -H-* 951,000 HKD 5,910,797.28 10,025,147.40 1.94Pldt Inc 80,775 PHP 1,674,932.40 1,771,708.03 0.34Posco 25,293 KRW 5,740,896.52 4,702,312.71 0.91Power Finance Corporation Ltd 1,053,385 INR 1,099,644.74 1,797,929.06 0.35Power Grid Corp of India Ltd 1,484,383 INR 3,417,970.80 3,906,064.13 0.75Powszechna Kasa Oszczed. Polski 185,199 PLN 1,819,887.78 1,867,121.80 0.36Powszechny Zaklad Ubezpieczen 379,347 PLN 3,666,943.33 3,899,489.32 0.75Ppb Group Bhd 44,200 MYR 158,825.66 175,508.21 0.03Promotoray Operadora De Infra 28,305 MXN 238,307.45 246,717.88 0.05Psbc /H 858,000 HKD 477,623.54 447,417.20 0.09Pt Bank Mandiri Persero Tbk 2,701,200 IDR 1,319,812.11 1,346,993.14 0.26Pt Bank Rakyat Indonesia 726,400 IDR 160,840.72 196,800.38 0.04Pt Gudang Garam Tbk /Demat 406,100 IDR 1,930,842.92 1,939,910.62 0.37Pt Indofood Sukses 2,069,000 IDR 909,427.52 903,171.91 0.17Pt Kalbe Farma Tbk 2,394,000 IDR 226,427.93 217,190.39 0.04Pt Surya Citra Media Tbk 1,199,800 IDR 133,721.63 120,032.36 0.02Ptt Global Public Co Forei Reg 232,600 THB 412,614.18 426,175.32 0.08Qatar Islamic Bank 118,320 QAR 505,111.34 473,805.43 0.09Quanta Computer Inc. 297,000 TWD 484,006.99 507,071.55 0.10Realtek Semiconductor Corp 638,000 TWD 2,786,617.66 4,120,811.41 0.80Reinet Investments Sca 18,844 ZAR 288,456.95 266,496.54 0.05Reliance Indus. /Demat 130,734 INR 1,763,588.27 2,083,565.64 0.40Rhb Capital Bhd 1,705,600 MYR 2,128,283.26 2,024,522.27 0.39Richter Gedeon 12,128 HUF 192,814.48 196,654.79 0.04Robinson S Land Corp Rlc 213,600 PHP 98,298.01 96,446.64 0.02Rosneft Oil Company Ojsc /Sgdr 380,707 USD 2,271,979.37 2,187,900.30 0.42Sabanci Holding 1,808,514 TRY 2,888,134.52 2,356,269.03 0.46Sabesp. Cia Saneam. Bas. Estado 36,500 BRL 392,719.90 395,162.20 0.08Samsung Electr. /Pfd N - Vot. 85,657 KRW 1,818,935.44 2,491,303.27 0.48Samsung Electronics Co Ltd 436,657 KRW 11,226,280.61 15,605,244.72 3.01Samsung Fire&Marine Insur. 1,102 KRW 264,331.98 224,568.42 0.04
Pramerica Sicav
The accompanying notes form an integral part of these financial statements.
105
Emerging Markets Equity
Statement of Investmentsas at June 30, 2019 (continued)
(expressed in EUR)
* Securities partially or totally lent (see Note 9).
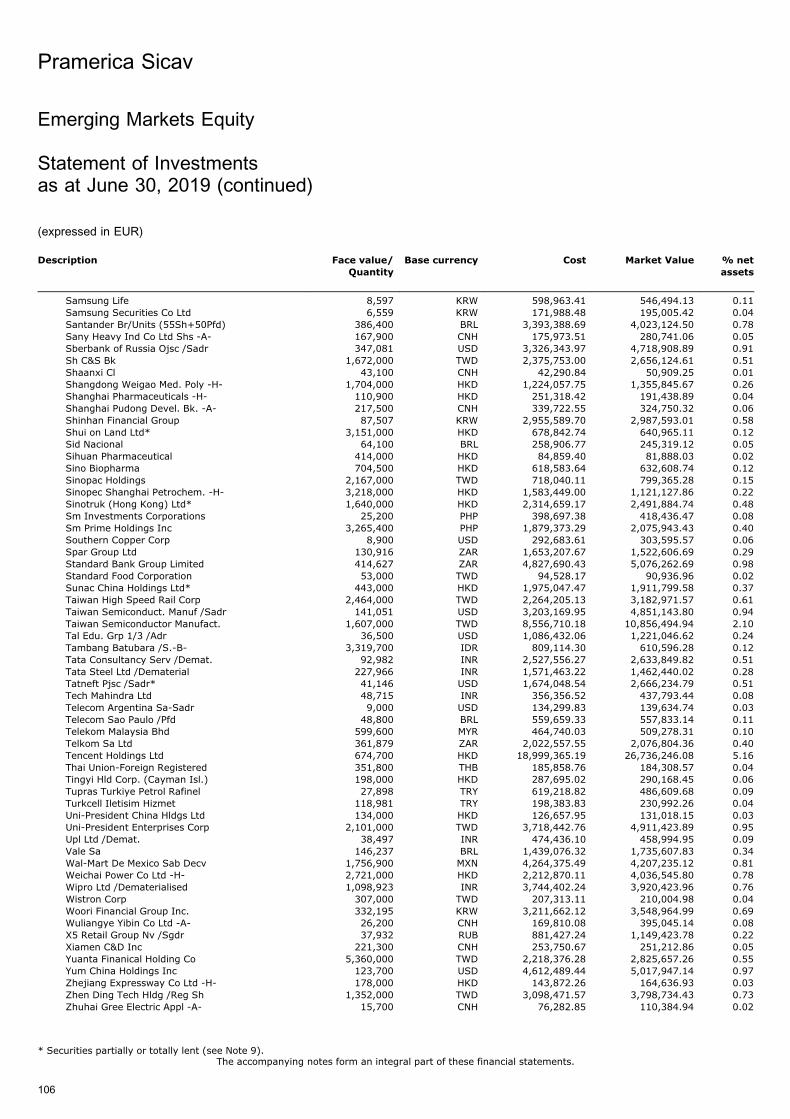
Description Face value/
Quantity
Base currency Cost Market Value % net
assets
Samsung Life 8,597 KRW 598,963.41 546,494.13 0.11Samsung Securities Co Ltd 6,559 KRW 171,988.48 195,005.42 0.04Santander Br/Units (55Sh+50Pfd) 386,400 BRL 3,393,388.69 4,023,124.50 0.78Sany Heavy Ind Co Ltd Shs -A- 167,900 CNH 175,973.51 280,741.06 0.05Sberbank of Russia Ojsc /Sadr 347,081 USD 3,326,343.97 4,718,908.89 0.91Sh C&S Bk 1,672,000 TWD 2,375,753.00 2,656,124.61 0.51Shaanxi Cl 43,100 CNH 42,290.84 50,909.25 0.01Shangdong Weigao Med. Poly -H- 1,704,000 HKD 1,224,057.75 1,355,845.67 0.26Shanghai Pharmaceuticals -H- 110,900 HKD 251,318.42 191,438.89 0.04Shanghai Pudong Devel. Bk. -A- 217,500 CNH 339,722.55 324,750.32 0.06Shinhan Financial Group 87,507 KRW 2,955,589.70 2,987,593.01 0.58Shui on Land Ltd* 3,151,000 HKD 678,842.74 640,965.11 0.12Sid Nacional 64,100 BRL 258,906.77 245,319.12 0.05Sihuan Pharmaceutical 414,000 HKD 84,859.40 81,888.03 0.02Sino Biopharma 704,500 HKD 618,583.64 632,608.74 0.12Sinopac Holdings 2,167,000 TWD 718,040.11 799,365.28 0.15Sinopec Shanghai Petrochem. -H- 3,218,000 HKD 1,583,449.00 1,121,127.86 0.22Sinotruk (Hong Kong) Ltd* 1,640,000 HKD 2,314,659.17 2,491,884.74 0.48Sm Investments Corporations 25,200 PHP 398,697.38 418,436.47 0.08Sm Prime Holdings Inc 3,265,400 PHP 1,879,373.29 2,075,943.43 0.40Southern Copper Corp 8,900 USD 292,683.61 303,595.57 0.06Spar Group Ltd 130,916 ZAR 1,653,207.67 1,522,606.69 0.29Standard Bank Group Limited 414,627 ZAR 4,827,690.43 5,076,262.69 0.98Standard Food Corporation 53,000 TWD 94,528.17 90,936.96 0.02Sunac China Holdings Ltd* 443,000 HKD 1,975,047.47 1,911,799.58 0.37Taiwan High Speed Rail Corp 2,464,000 TWD 2,264,205.13 3,182,971.57 0.61Taiwan Semiconduct. Manuf /Sadr 141,051 USD 3,203,169.95 4,851,143.80 0.94Taiwan Semiconductor Manufact. 1,607,000 TWD 8,556,710.18 10,856,494.94 2.10Tal Edu. Grp 1/3 /Adr 36,500 USD 1,086,432.06 1,221,046.62 0.24Tambang Batubara /S.-B- 3,319,700 IDR 809,114.30 610,596.28 0.12Tata Consultancy Serv /Demat. 92,982 INR 2,527,556.27 2,633,849.82 0.51Tata Steel Ltd /Dematerial 227,966 INR 1,571,463.22 1,462,440.02 0.28Tatneft Pjsc /Sadr* 41,146 USD 1,674,048.54 2,666,234.79 0.51Tech Mahindra Ltd 48,715 INR 356,356.52 437,793.44 0.08Telecom Argentina Sa-Sadr 9,000 USD 134,299.83 139,634.74 0.03Telecom Sao Paulo /Pfd 48,800 BRL 559,659.33 557,833.14 0.11Telekom Malaysia Bhd 599,600 MYR 464,740.03 509,278.31 0.10Telkom Sa Ltd 361,879 ZAR 2,022,557.55 2,076,804.36 0.40Tencent Holdings Ltd 674,700 HKD 18,999,365.19 26,736,246.08 5.16Thai Union-Foreign Registered 351,800 THB 185,858.76 184,308.57 0.04Tingyi Hld Corp. (Cayman Isl.) 198,000 HKD 287,695.02 290,168.45 0.06Tupras Turkiye Petrol Rafinel 27,898 TRY 619,218.82 486,609.68 0.09Turkcell Iletisim Hizmet 118,981 TRY 198,383.83 230,992.26 0.04Uni-President China Hldgs Ltd 134,000 HKD 126,657.95 131,018.15 0.03Uni-President Enterprises Corp 2,101,000 TWD 3,718,442.76 4,911,423.89 0.95Upl Ltd /Demat. 38,497 INR 474,436.10 458,994.95 0.09Vale Sa 146,237 BRL 1,439,076.32 1,735,607.83 0.34Wal-Mart De Mexico Sab Decv 1,756,900 MXN 4,264,375.49 4,207,235.12 0.81Weichai Power Co Ltd -H- 2,721,000 HKD 2,212,870.11 4,036,545.80 0.78Wipro Ltd /Dematerialised 1,098,923 INR 3,744,402.24 3,920,423.96 0.76Wistron Corp 307,000 TWD 207,313.11 210,004.98 0.04Woori Financial Group Inc. 332,195 KRW 3,211,662.12 3,548,964.99 0.69Wuliangye Yibin Co Ltd -A- 26,200 CNH 169,810.08 395,045.14 0.08X5 Retail Group Nv /Sgdr 37,932 RUB 881,427.24 1,149,423.78 0.22Xiamen C&D Inc 221,300 CNH 253,750.67 251,212.86 0.05Yuanta Finanical Holding Co 5,360,000 TWD 2,218,376.28 2,825,657.26 0.55Yum China Holdings Inc 123,700 USD 4,612,489.44 5,017,947.14 0.97Zhejiang Expressway Co Ltd -H- 178,000 HKD 143,872.26 164,636.93 0.03Zhen Ding Tech Hldg /Reg Sh 1,352,000 TWD 3,098,471.57 3,798,734.43 0.73Zhuhai Gree Electric Appl -A- 15,700 CNH 76,282.85 110,384.94 0.02
Pramerica Sicav
The accompanying notes form an integral part of these financial statements.
106
Emerging Markets Equity
Statement of Investmentsas at June 30, 2019 (continued)
(expressed in EUR)
* Securities partially or totally lent (see Note 9).
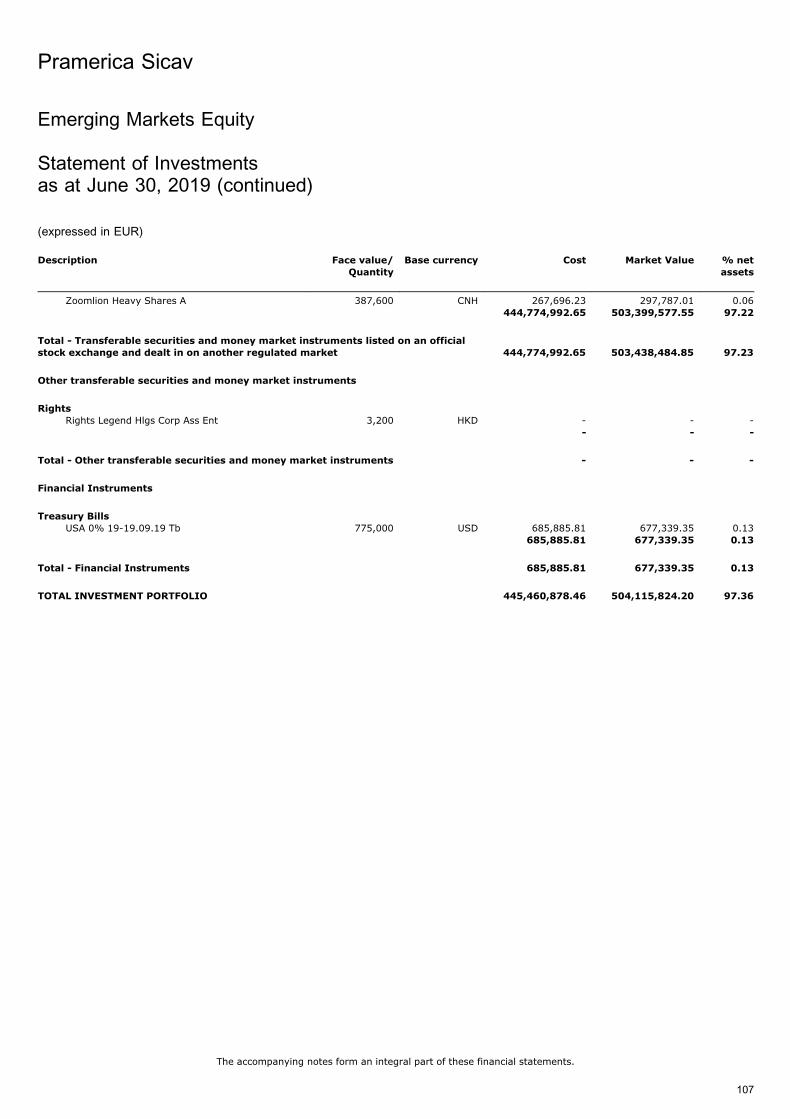
Description Face value/
Quantity
Base currency Cost Market Value % net
assets
Zoomlion Heavy Shares A 387,600 CNH 267,696.23 297,787.01 0.06444,774,992.65 503,399,577.55 97.22
Total - Transferable securities and money market instruments listed on an officialstock exchange and dealt in on another regulated market 444,774,992.65 503,438,484.85 97.23
Other transferable securities and money market instruments
Rights
Rights Legend Hlgs Corp Ass Ent 3,200 HKD - - -- - -
Total - Other transferable securities and money market instruments - - -
Financial Instruments
Treasury Bills
USA 0% 19-19.09.19 Tb 775,000 USD 685,885.81 677,339.35 0.13685,885.81 677,339.35 0.13
Total - Financial Instruments 685,885.81 677,339.35 0.13
TOTAL INVESTMENT PORTFOLIO 445,460,878.46 504,115,824.20 97.36
Pramerica Sicav
The accompanying notes form an integral part of these financial statements.
107
Emerging Markets Equity
Statement of Investmentsas at June 30, 2019 (continued)
(expressed in EUR)
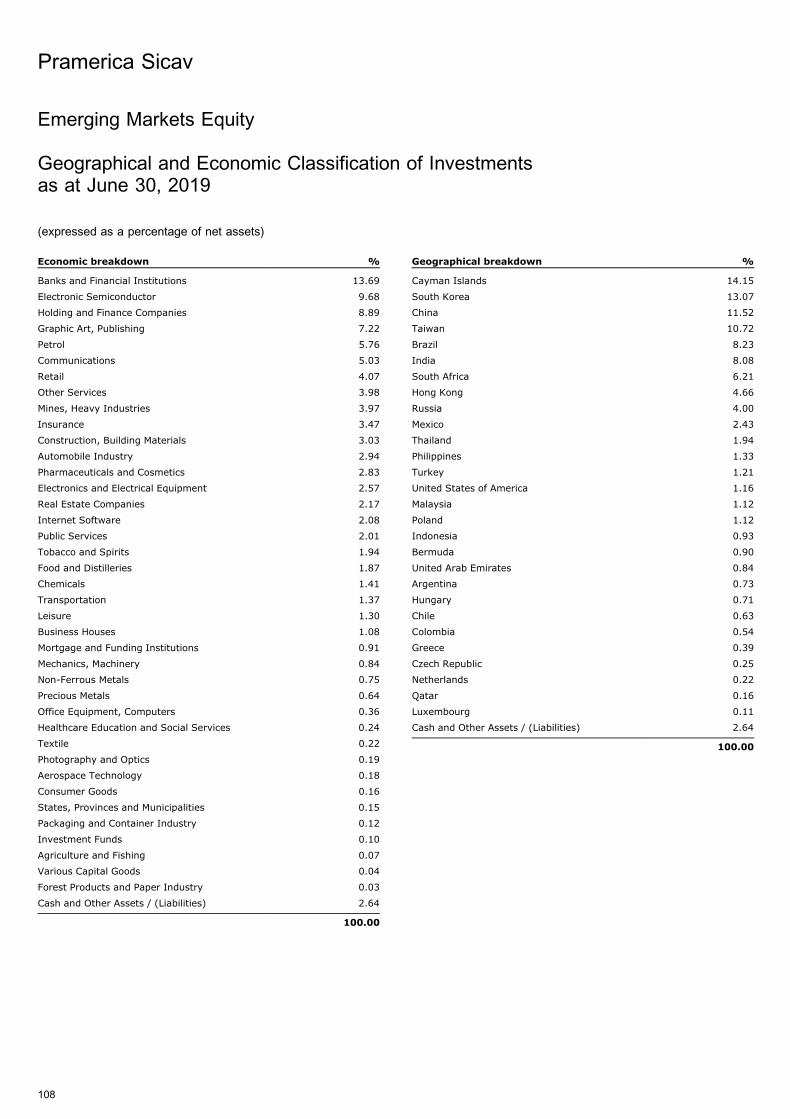
Emerging Markets Equity
Geographical and Economic Classification of Investmentsas at June 30, 2019
(expressed as a percentage of net assets)
Economic breakdown %
Banks and Financial Institutions 13.69
Electronic Semiconductor 9.68
Holding and Finance Companies 8.89
Graphic Art, Publishing 7.22
Petrol 5.76
Communications 5.03
Retail 4.07
Other Services 3.98
Mines, Heavy Industries 3.97
Insurance 3.47
Construction, Building Materials 3.03
Automobile Industry 2.94
Pharmaceuticals and Cosmetics 2.83
Electronics and Electrical Equipment 2.57
Real Estate Companies 2.17
Internet Software 2.08
Public Services 2.01
Tobacco and Spirits 1.94
Food and Distilleries 1.87
Chemicals 1.41
Transportation 1.37
Leisure 1.30
Business Houses 1.08
Mortgage and Funding Institutions 0.91
Mechanics, Machinery 0.84
Non-Ferrous Metals 0.75
Precious Metals 0.64
Office Equipment, Computers 0.36
Healthcare Education and Social Services 0.24
Textile 0.22
Photography and Optics 0.19
Aerospace Technology 0.18
Consumer Goods 0.16
States, Provinces and Municipalities 0.15
Packaging and Container Industry 0.12
Investment Funds 0.10
Agriculture and Fishing 0.07
Various Capital Goods 0.04
Forest Products and Paper Industry 0.03
Cash and Other Assets / (Liabilities) 2.64
100.00
Geographical breakdown %
Cayman Islands 14.15
South Korea 13.07
China 11.52
Taiwan 10.72
Brazil 8.23
India 8.08
South Africa 6.21
Hong Kong 4.66
Russia 4.00
Mexico 2.43
Thailand 1.94
Philippines 1.33
Turkey 1.21
United States of America 1.16
Malaysia 1.12
Poland 1.12
Indonesia 0.93
Bermuda 0.90
United Arab Emirates 0.84
Argentina 0.73
Hungary 0.71
Chile 0.63
Colombia 0.54
Greece 0.39
Czech Republic 0.25
Netherlands 0.22
Qatar 0.16
Luxembourg 0.11
Cash and Other Assets / (Liabilities) 2.64
100.00
Pramerica Sicav
108
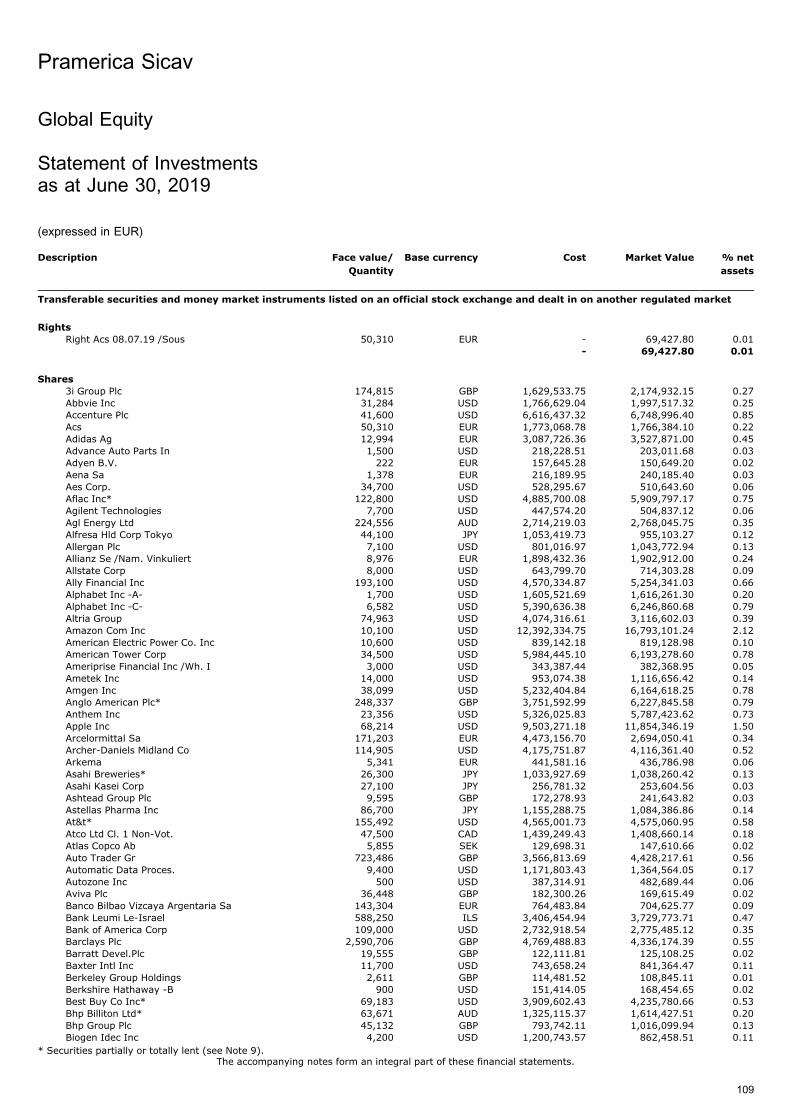
Global Equity
Statement of Investmentsas at June 30, 2019
(expressed in EUR)
Description Face value/
Quantity
Base currency Cost Market Value % net
assets
Transferable securities and money market instruments listed on an official stock exchange and dealt in on another regulated market
Rights
Right Acs 08.07.19 /Sous 50,310 EUR - 69,427.80 0.01- 69,427.80 0.01
Shares
3i Group Plc 174,815 GBP 1,629,533.75 2,174,932.15 0.27Abbvie Inc 31,284 USD 1,766,629.04 1,997,517.32 0.25Accenture Plc 41,600 USD 6,616,437.32 6,748,996.40 0.85Acs 50,310 EUR 1,773,068.78 1,766,384.10 0.22Adidas Ag 12,994 EUR 3,087,726.36 3,527,871.00 0.45Advance Auto Parts In 1,500 USD 218,228.51 203,011.68 0.03Adyen B.V. 222 EUR 157,645.28 150,649.20 0.02Aena Sa 1,378 EUR 216,189.95 240,185.40 0.03Aes Corp. 34,700 USD 528,295.67 510,643.60 0.06Aflac Inc* 122,800 USD 4,885,700.08 5,909,797.17 0.75Agilent Technologies 7,700 USD 447,574.20 504,837.12 0.06Agl Energy Ltd 224,556 AUD 2,714,219.03 2,768,045.75 0.35Alfresa Hld Corp Tokyo 44,100 JPY 1,053,419.73 955,103.27 0.12Allergan Plc 7,100 USD 801,016.97 1,043,772.94 0.13Allianz Se /Nam. Vinkuliert 8,976 EUR 1,898,432.36 1,902,912.00 0.24Allstate Corp 8,000 USD 643,799.70 714,303.28 0.09Ally Financial Inc 193,100 USD 4,570,334.87 5,254,341.03 0.66Alphabet Inc -A- 1,700 USD 1,605,521.69 1,616,261.30 0.20Alphabet Inc -C- 6,582 USD 5,390,636.38 6,246,860.68 0.79Altria Group 74,963 USD 4,074,316.61 3,116,602.03 0.39Amazon Com Inc 10,100 USD 12,392,334.75 16,793,101.24 2.12American Electric Power Co. Inc 10,600 USD 839,142.18 819,128.98 0.10American Tower Corp 34,500 USD 5,984,445.10 6,193,278.60 0.78Ameriprise Financial Inc /Wh. I 3,000 USD 343,387.44 382,368.95 0.05Ametek Inc 14,000 USD 953,074.38 1,116,656.42 0.14Amgen Inc 38,099 USD 5,232,404.84 6,164,618.25 0.78Anglo American Plc* 248,337 GBP 3,751,592.99 6,227,845.58 0.79Anthem Inc 23,356 USD 5,326,025.83 5,787,423.62 0.73Apple Inc 68,214 USD 9,503,271.18 11,854,346.19 1.50Arcelormittal Sa 171,203 EUR 4,473,156.70 2,694,050.41 0.34Archer-Daniels Midland Co 114,905 USD 4,175,751.87 4,116,361.40 0.52Arkema 5,341 EUR 441,581.16 436,786.98 0.06Asahi Breweries* 26,300 JPY 1,033,927.69 1,038,260.42 0.13Asahi Kasei Corp 27,100 JPY 256,781.32 253,604.56 0.03Ashtead Group Plc 9,595 GBP 172,278.93 241,643.82 0.03Astellas Pharma Inc 86,700 JPY 1,155,288.75 1,084,386.86 0.14At&t* 155,492 USD 4,565,001.73 4,575,060.95 0.58Atco Ltd Cl. 1 Non-Vot. 47,500 CAD 1,439,249.43 1,408,660.14 0.18Atlas Copco Ab 5,855 SEK 129,698.31 147,610.66 0.02Auto Trader Gr 723,486 GBP 3,566,813.69 4,428,217.61 0.56Automatic Data Proces. 9,400 USD 1,171,803.43 1,364,564.05 0.17Autozone Inc 500 USD 387,314.91 482,689.44 0.06Aviva Plc 36,448 GBP 182,300.26 169,615.49 0.02Banco Bilbao Vizcaya Argentaria Sa 143,304 EUR 764,483.84 704,625.77 0.09Bank Leumi Le-Israel 588,250 ILS 3,406,454.94 3,729,773.71 0.47Bank of America Corp 109,000 USD 2,732,918.54 2,775,485.12 0.35Barclays Plc 2,590,706 GBP 4,769,488.83 4,336,174.39 0.55Barratt Devel.Plc 19,555 GBP 122,111.81 125,108.25 0.02Baxter Intl Inc 11,700 USD 743,658.24 841,364.47 0.11Berkeley Group Holdings 2,611 GBP 114,481.52 108,845.11 0.01Berkshire Hathaway -B 900 USD 151,414.05 168,454.65 0.02Best Buy Co Inc* 69,183 USD 3,909,602.43 4,235,780.66 0.53Bhp Billiton Ltd* 63,671 AUD 1,325,115.37 1,614,427.51 0.20Bhp Group Plc 45,132 GBP 793,742.11 1,016,099.94 0.13Biogen Idec Inc 4,200 USD 1,200,743.57 862,458.51 0.11
Pramerica Sicav
The accompanying notes form an integral part of these financial statements.
109
* Securities partially or totally lent (see Note 9).
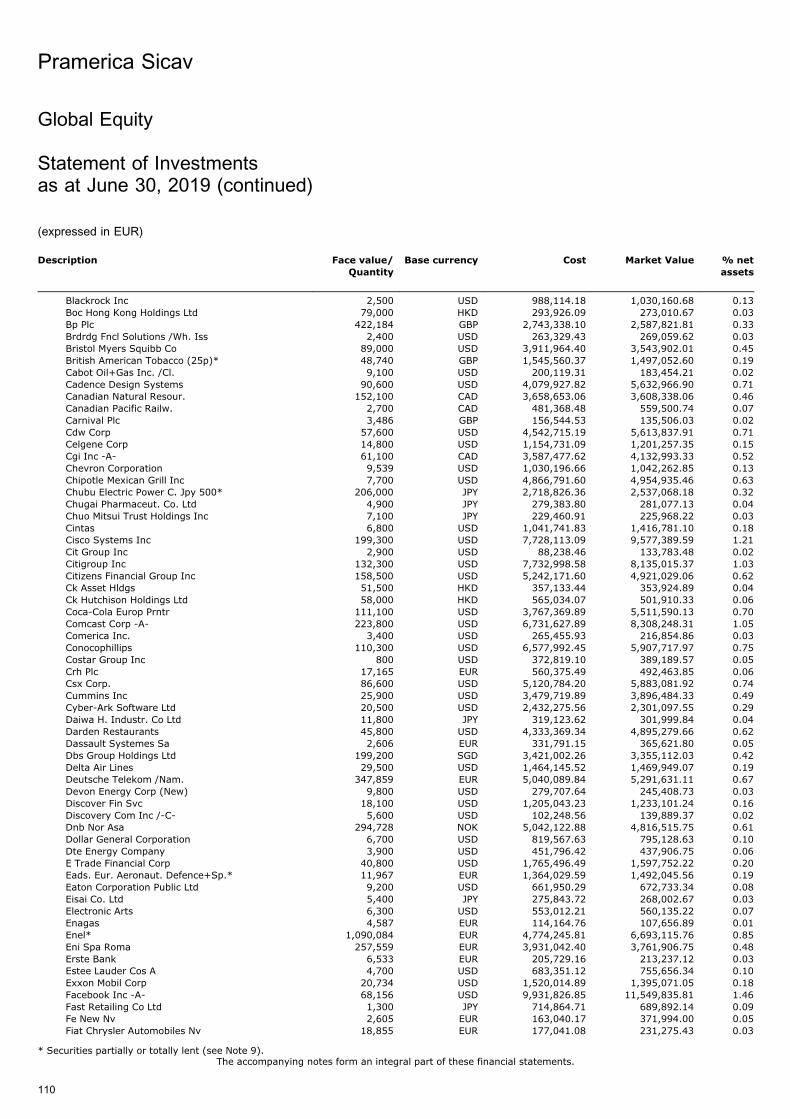
Description Face value/
Quantity
Base currency Cost Market Value % net
assets
Blackrock Inc 2,500 USD 988,114.18 1,030,160.68 0.13Boc Hong Kong Holdings Ltd 79,000 HKD 293,926.09 273,010.67 0.03Bp Plc 422,184 GBP 2,743,338.10 2,587,821.81 0.33Brdrdg Fncl Solutions /Wh. Iss 2,400 USD 263,329.43 269,059.62 0.03Bristol Myers Squibb Co 89,000 USD 3,911,964.40 3,543,902.01 0.45British American Tobacco (25p)* 48,740 GBP 1,545,560.37 1,497,052.60 0.19Cabot Oil+Gas Inc. /Cl. 9,100 USD 200,119.31 183,454.21 0.02Cadence Design Systems 90,600 USD 4,079,927.82 5,632,966.90 0.71Canadian Natural Resour. 152,100 CAD 3,658,653.06 3,608,338.06 0.46Canadian Pacific Railw. 2,700 CAD 481,368.48 559,500.74 0.07Carnival Plc 3,486 GBP 156,544.53 135,506.03 0.02Cdw Corp 57,600 USD 4,542,715.19 5,613,837.91 0.71Celgene Corp 14,800 USD 1,154,731.09 1,201,257.35 0.15Cgi Inc -A- 61,100 CAD 3,587,477.62 4,132,993.33 0.52Chevron Corporation 9,539 USD 1,030,196.66 1,042,262.85 0.13Chipotle Mexican Grill Inc 7,700 USD 4,866,791.60 4,954,935.46 0.63Chubu Electric Power C. Jpy 500* 206,000 JPY 2,718,826.36 2,537,068.18 0.32Chugai Pharmaceut. Co. Ltd 4,900 JPY 279,383.80 281,077.13 0.04Chuo Mitsui Trust Holdings Inc 7,100 JPY 229,460.91 225,968.22 0.03Cintas 6,800 USD 1,041,741.83 1,416,781.10 0.18Cisco Systems Inc 199,300 USD 7,728,113.09 9,577,389.59 1.21Cit Group Inc 2,900 USD 88,238.46 133,783.48 0.02Citigroup Inc 132,300 USD 7,732,998.58 8,135,015.37 1.03Citizens Financial Group Inc 158,500 USD 5,242,171.60 4,921,029.06 0.62Ck Asset Hldgs 51,500 HKD 357,133.44 353,924.89 0.04Ck Hutchison Holdings Ltd 58,000 HKD 565,034.07 501,910.33 0.06Coca-Cola Europ Prntr 111,100 USD 3,767,369.89 5,511,590.13 0.70Comcast Corp -A- 223,800 USD 6,731,627.89 8,308,248.31 1.05Comerica Inc. 3,400 USD 265,455.93 216,854.86 0.03Conocophillips 110,300 USD 6,577,992.45 5,907,717.97 0.75Costar Group Inc 800 USD 372,819.10 389,189.57 0.05Crh Plc 17,165 EUR 560,375.49 492,463.85 0.06Csx Corp. 86,600 USD 5,120,784.20 5,883,081.92 0.74Cummins Inc 25,900 USD 3,479,719.89 3,896,484.33 0.49Cyber-Ark Software Ltd 20,500 USD 2,432,275.56 2,301,097.55 0.29Daiwa H. Industr. Co Ltd 11,800 JPY 319,123.62 301,999.84 0.04Darden Restaurants 45,800 USD 4,333,369.34 4,895,279.66 0.62Dassault Systemes Sa 2,606 EUR 331,791.15 365,621.80 0.05Dbs Group Holdings Ltd 199,200 SGD 3,421,002.26 3,355,112.03 0.42Delta Air Lines 29,500 USD 1,464,145.52 1,469,949.07 0.19Deutsche Telekom /Nam. 347,859 EUR 5,040,089.84 5,291,631.11 0.67Devon Energy Corp (New) 9,800 USD 279,707.64 245,408.73 0.03Discover Fin Svc 18,100 USD 1,205,043.23 1,233,101.24 0.16Discovery Com Inc /-C- 5,600 USD 102,248.56 139,889.37 0.02Dnb Nor Asa 294,728 NOK 5,042,122.88 4,816,515.75 0.61Dollar General Corporation 6,700 USD 819,567.63 795,128.63 0.10Dte Energy Company 3,900 USD 451,796.42 437,906.75 0.06E Trade Financial Corp 40,800 USD 1,765,496.49 1,597,752.22 0.20Eads. Eur. Aeronaut. Defence+Sp.* 11,967 EUR 1,364,029.59 1,492,045.56 0.19Eaton Corporation Public Ltd 9,200 USD 661,950.29 672,733.34 0.08Eisai Co. Ltd 5,400 JPY 275,843.72 268,002.67 0.03Electronic Arts 6,300 USD 553,012.21 560,135.22 0.07Enagas 4,587 EUR 114,164.76 107,656.89 0.01Enel* 1,090,084 EUR 4,774,245.81 6,693,115.76 0.85Eni Spa Roma 257,559 EUR 3,931,042.40 3,761,906.75 0.48Erste Bank 6,533 EUR 205,729.16 213,237.12 0.03Estee Lauder Cos A 4,700 USD 683,351.12 755,656.34 0.10Exxon Mobil Corp 20,734 USD 1,520,014.89 1,395,071.05 0.18Facebook Inc -A- 68,156 USD 9,931,826.85 11,549,835.81 1.46Fast Retailing Co Ltd 1,300 JPY 714,864.71 689,892.14 0.09Fe New Nv 2,605 EUR 163,040.17 371,994.00 0.05Fiat Chrysler Automobiles Nv 18,855 EUR 177,041.08 231,275.43 0.03
Pramerica Sicav
The accompanying notes form an integral part of these financial statements.
110
Global Equity
Statement of Investmentsas at June 30, 2019 (continued)
(expressed in EUR)
* Securities partially or totally lent (see Note 9).
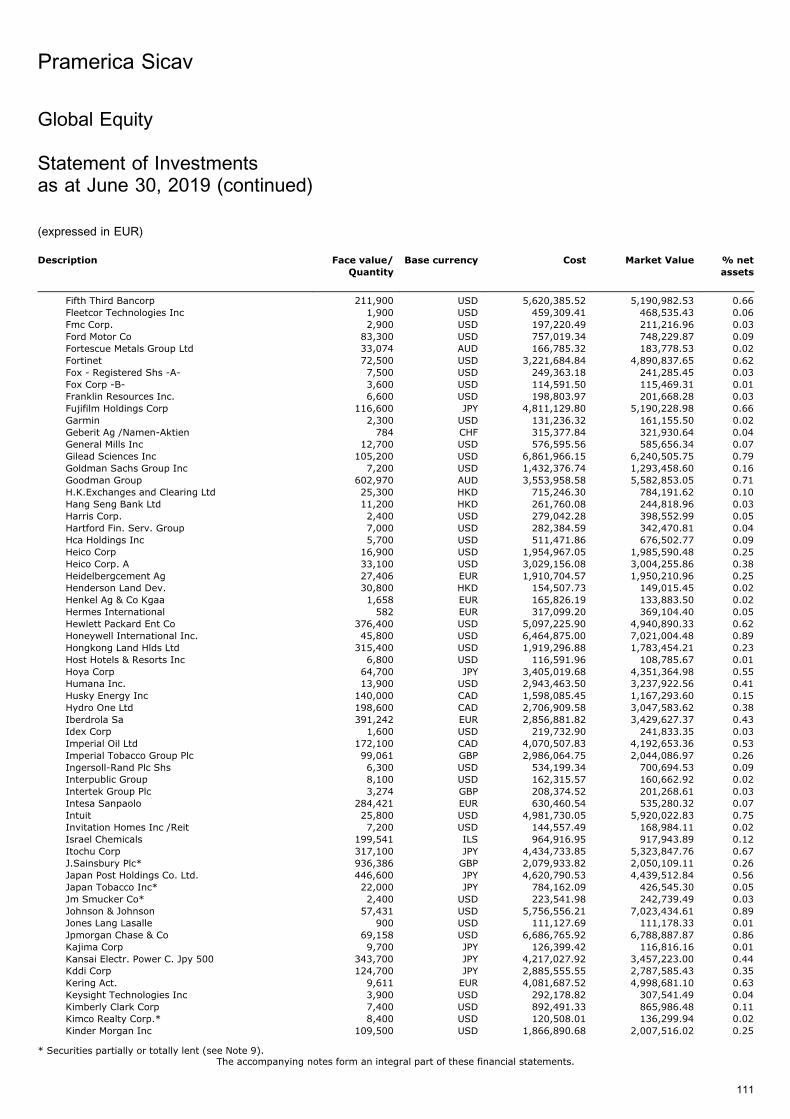
Description Face value/
Quantity
Base currency Cost Market Value % net
assets
Fifth Third Bancorp 211,900 USD 5,620,385.52 5,190,982.53 0.66Fleetcor Technologies Inc 1,900 USD 459,309.41 468,535.43 0.06Fmc Corp. 2,900 USD 197,220.49 211,216.96 0.03Ford Motor Co 83,300 USD 757,019.34 748,229.87 0.09Fortescue Metals Group Ltd 33,074 AUD 166,785.32 183,778.53 0.02Fortinet 72,500 USD 3,221,684.84 4,890,837.65 0.62Fox - Registered Shs -A- 7,500 USD 249,363.18 241,285.45 0.03Fox Corp -B- 3,600 USD 114,591.50 115,469.31 0.01Franklin Resources Inc. 6,600 USD 198,803.97 201,668.28 0.03Fujifilm Holdings Corp 116,600 JPY 4,811,129.80 5,190,228.98 0.66Garmin 2,300 USD 131,236.32 161,155.50 0.02Geberit Ag /Namen-Aktien 784 CHF 315,377.84 321,930.64 0.04General Mills Inc 12,700 USD 576,595.56 585,656.34 0.07Gilead Sciences Inc 105,200 USD 6,861,966.15 6,240,505.75 0.79Goldman Sachs Group Inc 7,200 USD 1,432,376.74 1,293,458.60 0.16Goodman Group 602,970 AUD 3,553,958.58 5,582,853.05 0.71H.K.Exchanges and Clearing Ltd 25,300 HKD 715,246.30 784,191.62 0.10Hang Seng Bank Ltd 11,200 HKD 261,760.08 244,818.96 0.03Harris Corp. 2,400 USD 279,042.28 398,552.99 0.05Hartford Fin. Serv. Group 7,000 USD 282,384.59 342,470.81 0.04Hca Holdings Inc 5,700 USD 511,471.86 676,502.77 0.09Heico Corp 16,900 USD 1,954,967.05 1,985,590.48 0.25Heico Corp. A 33,100 USD 3,029,156.08 3,004,255.86 0.38Heidelbergcement Ag 27,406 EUR 1,910,704.57 1,950,210.96 0.25Henderson Land Dev. 30,800 HKD 154,507.73 149,015.45 0.02Henkel Ag & Co Kgaa 1,658 EUR 165,826.19 133,883.50 0.02Hermes International 582 EUR 317,099.20 369,104.40 0.05Hewlett Packard Ent Co 376,400 USD 5,097,225.90 4,940,890.33 0.62Honeywell International Inc. 45,800 USD 6,464,875.00 7,021,004.48 0.89Hongkong Land Hlds Ltd 315,400 USD 1,919,296.88 1,783,454.21 0.23Host Hotels & Resorts Inc 6,800 USD 116,591.96 108,785.67 0.01Hoya Corp 64,700 JPY 3,405,019.68 4,351,364.98 0.55Humana Inc. 13,900 USD 2,943,463.50 3,237,922.56 0.41Husky Energy Inc 140,000 CAD 1,598,085.45 1,167,293.60 0.15Hydro One Ltd 198,600 CAD 2,706,909.58 3,047,583.62 0.38Iberdrola Sa 391,242 EUR 2,856,881.82 3,429,627.37 0.43Idex Corp 1,600 USD 219,732.90 241,833.35 0.03Imperial Oil Ltd 172,100 CAD 4,070,507.83 4,192,653.36 0.53Imperial Tobacco Group Plc 99,061 GBP 2,986,064.75 2,044,086.97 0.26Ingersoll-Rand Plc Shs 6,300 USD 534,199.34 700,694.53 0.09Interpublic Group 8,100 USD 162,315.57 160,662.92 0.02Intertek Group Plc 3,274 GBP 208,374.52 201,268.61 0.03Intesa Sanpaolo 284,421 EUR 630,460.54 535,280.32 0.07Intuit 25,800 USD 4,981,730.05 5,920,022.83 0.75Invitation Homes Inc /Reit 7,200 USD 144,557.49 168,984.11 0.02Israel Chemicals 199,541 ILS 964,916.95 917,943.89 0.12Itochu Corp 317,100 JPY 4,434,733.85 5,323,847.76 0.67J.Sainsbury Plc* 936,386 GBP 2,079,933.82 2,050,109.11 0.26Japan Post Holdings Co. Ltd. 446,600 JPY 4,620,790.53 4,439,512.84 0.56Japan Tobacco Inc* 22,000 JPY 784,162.09 426,545.30 0.05Jm Smucker Co* 2,400 USD 223,541.98 242,739.49 0.03Johnson & Johnson 57,431 USD 5,756,556.21 7,023,434.61 0.89Jones Lang Lasalle 900 USD 111,127.69 111,178.33 0.01Jpmorgan Chase & Co 69,158 USD 6,686,765.92 6,788,887.87 0.86Kajima Corp 9,700 JPY 126,399.42 116,816.16 0.01Kansai Electr. Power C. Jpy 500 343,700 JPY 4,217,027.92 3,457,223.00 0.44Kddi Corp 124,700 JPY 2,885,555.55 2,787,585.43 0.35Kering Act. 9,611 EUR 4,081,687.52 4,998,681.10 0.63Keysight Technologies Inc 3,900 USD 292,178.82 307,541.49 0.04Kimberly Clark Corp 7,400 USD 892,491.33 865,986.48 0.11Kimco Realty Corp.* 8,400 USD 120,508.01 136,299.94 0.02Kinder Morgan Inc 109,500 USD 1,866,890.68 2,007,516.02 0.25
Pramerica Sicav
The accompanying notes form an integral part of these financial statements.
111
Global Equity
Statement of Investmentsas at June 30, 2019 (continued)
(expressed in EUR)
* Securities partially or totally lent (see Note 9).
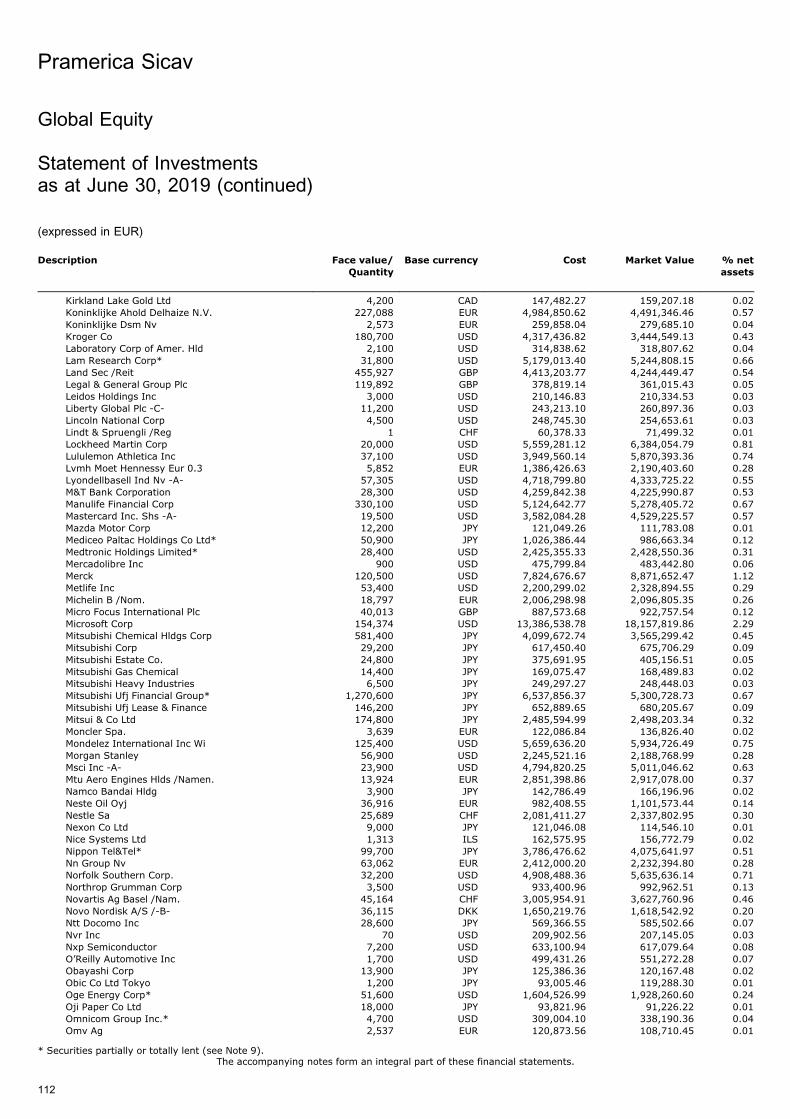
Description Face value/
Quantity
Base currency Cost Market Value % net
assets
Kirkland Lake Gold Ltd 4,200 CAD 147,482.27 159,207.18 0.02Koninklijke Ahold Delhaize N.V. 227,088 EUR 4,984,850.62 4,491,346.46 0.57Koninklijke Dsm Nv 2,573 EUR 259,858.04 279,685.10 0.04Kroger Co 180,700 USD 4,317,436.82 3,444,549.13 0.43Laboratory Corp of Amer. Hld 2,100 USD 314,838.62 318,807.62 0.04Lam Research Corp* 31,800 USD 5,179,013.40 5,244,808.15 0.66Land Sec /Reit 455,927 GBP 4,413,203.77 4,244,449.47 0.54Legal & General Group Plc 119,892 GBP 378,819.14 361,015.43 0.05Leidos Holdings Inc 3,000 USD 210,146.83 210,334.53 0.03Liberty Global Plc -C- 11,200 USD 243,213.10 260,897.36 0.03Lincoln National Corp 4,500 USD 248,745.30 254,653.61 0.03Lindt & Spruengli /Reg 1 CHF 60,378.33 71,499.32 0.01Lockheed Martin Corp 20,000 USD 5,559,281.12 6,384,054.79 0.81Lululemon Athletica Inc 37,100 USD 3,949,560.14 5,870,393.36 0.74Lvmh Moet Hennessy Eur 0.3 5,852 EUR 1,386,426.63 2,190,403.60 0.28Lyondellbasell Ind Nv -A- 57,305 USD 4,718,799.80 4,333,725.22 0.55M&T Bank Corporation 28,300 USD 4,259,842.38 4,225,990.87 0.53Manulife Financial Corp 330,100 USD 5,124,642.77 5,278,405.72 0.67Mastercard Inc. Shs -A- 19,500 USD 3,582,084.28 4,529,225.57 0.57Mazda Motor Corp 12,200 JPY 121,049.26 111,783.08 0.01Mediceo Paltac Holdings Co Ltd* 50,900 JPY 1,026,386.44 986,663.34 0.12Medtronic Holdings Limited* 28,400 USD 2,425,355.33 2,428,550.36 0.31Mercadolibre Inc 900 USD 475,799.84 483,442.80 0.06Merck 120,500 USD 7,824,676.67 8,871,652.47 1.12Metlife Inc 53,400 USD 2,200,299.02 2,328,894.55 0.29Michelin B /Nom. 18,797 EUR 2,006,298.98 2,096,805.35 0.26Micro Focus International Plc 40,013 GBP 887,573.68 922,757.54 0.12Microsoft Corp 154,374 USD 13,386,538.78 18,157,819.86 2.29Mitsubishi Chemical Hldgs Corp 581,400 JPY 4,099,672.74 3,565,299.42 0.45Mitsubishi Corp 29,200 JPY 617,450.40 675,706.29 0.09Mitsubishi Estate Co. 24,800 JPY 375,691.95 405,156.51 0.05Mitsubishi Gas Chemical 14,400 JPY 169,075.47 168,489.83 0.02Mitsubishi Heavy Industries 6,500 JPY 249,297.27 248,448.03 0.03Mitsubishi Ufj Financial Group* 1,270,600 JPY 6,537,856.37 5,300,728.73 0.67Mitsubishi Ufj Lease & Finance 146,200 JPY 652,889.65 680,205.67 0.09Mitsui & Co Ltd 174,800 JPY 2,485,594.99 2,498,203.34 0.32Moncler Spa. 3,639 EUR 122,086.84 136,826.40 0.02Mondelez International Inc Wi 125,400 USD 5,659,636.20 5,934,726.49 0.75Morgan Stanley 56,900 USD 2,245,521.16 2,188,768.99 0.28Msci Inc -A- 23,900 USD 4,794,820.25 5,011,046.62 0.63Mtu Aero Engines Hlds /Namen. 13,924 EUR 2,851,398.86 2,917,078.00 0.37Namco Bandai Hldg 3,900 JPY 142,786.49 166,196.96 0.02Neste Oil Oyj 36,916 EUR 982,408.55 1,101,573.44 0.14Nestle Sa 25,689 CHF 2,081,411.27 2,337,802.95 0.30Nexon Co Ltd 9,000 JPY 121,046.08 114,546.10 0.01Nice Systems Ltd 1,313 ILS 162,575.95 156,772.79 0.02Nippon Tel&Tel* 99,700 JPY 3,786,476.62 4,075,641.97 0.51Nn Group Nv 63,062 EUR 2,412,000.20 2,232,394.80 0.28Norfolk Southern Corp. 32,200 USD 4,908,488.36 5,635,636.14 0.71Northrop Grumman Corp 3,500 USD 933,400.96 992,962.51 0.13Novartis Ag Basel /Nam. 45,164 CHF 3,005,954.91 3,627,760.96 0.46Novo Nordisk A/S /-B- 36,115 DKK 1,650,219.76 1,618,542.92 0.20Ntt Docomo Inc 28,600 JPY 569,366.55 585,502.66 0.07Nvr Inc 70 USD 209,902.56 207,145.05 0.03Nxp Semiconductor 7,200 USD 633,100.94 617,079.64 0.08O’Reilly Automotive Inc 1,700 USD 499,431.26 551,272.28 0.07Obayashi Corp 13,900 JPY 125,386.36 120,167.48 0.02Obic Co Ltd Tokyo 1,200 JPY 93,005.46 119,288.30 0.01Oge Energy Corp* 51,600 USD 1,604,526.99 1,928,260.60 0.24Oji Paper Co Ltd 18,000 JPY 93,821.96 91,226.22 0.01Omnicom Group Inc.* 4,700 USD 309,004.10 338,190.36 0.04Omv Ag 2,537 EUR 120,873.56 108,710.45 0.01
Pramerica Sicav
The accompanying notes form an integral part of these financial statements.
112
Global Equity
Statement of Investmentsas at June 30, 2019 (continued)
(expressed in EUR)
* Securities partially or totally lent (see Note 9).
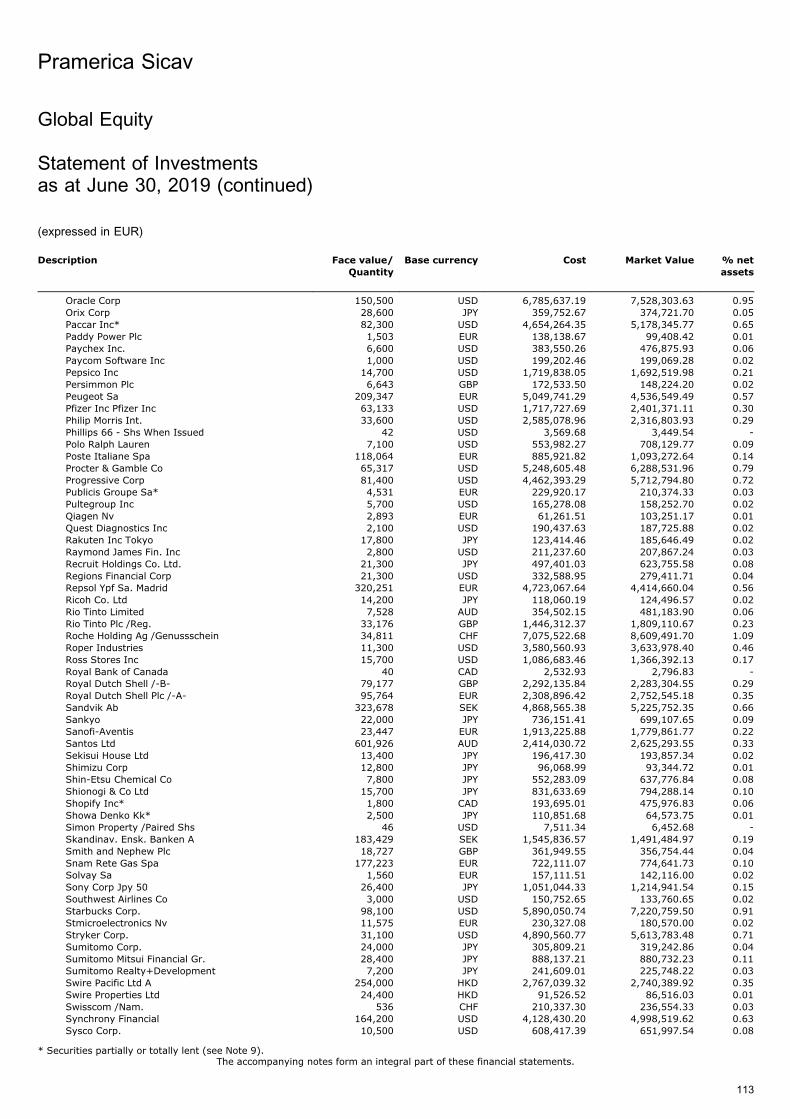
Description Face value/
Quantity
Base currency Cost Market Value % net
assets
Oracle Corp 150,500 USD 6,785,637.19 7,528,303.63 0.95Orix Corp 28,600 JPY 359,752.67 374,721.70 0.05Paccar Inc* 82,300 USD 4,654,264.35 5,178,345.77 0.65Paddy Power Plc 1,503 EUR 138,138.67 99,408.42 0.01Paychex Inc. 6,600 USD 383,550.26 476,875.93 0.06Paycom Software Inc 1,000 USD 199,202.46 199,069.28 0.02Pepsico Inc 14,700 USD 1,719,838.05 1,692,519.98 0.21Persimmon Plc 6,643 GBP 172,533.50 148,224.20 0.02Peugeot Sa 209,347 EUR 5,049,741.29 4,536,549.49 0.57Pfizer Inc Pfizer Inc 63,133 USD 1,717,727.69 2,401,371.11 0.30Philip Morris Int. 33,600 USD 2,585,078.96 2,316,803.93 0.29Phillips 66 - Shs When Issued 42 USD 3,569.68 3,449.54 -Polo Ralph Lauren 7,100 USD 553,982.27 708,129.77 0.09Poste Italiane Spa 118,064 EUR 885,921.82 1,093,272.64 0.14Procter & Gamble Co 65,317 USD 5,248,605.48 6,288,531.96 0.79Progressive Corp 81,400 USD 4,462,393.29 5,712,794.80 0.72Publicis Groupe Sa* 4,531 EUR 229,920.17 210,374.33 0.03Pultegroup Inc 5,700 USD 165,278.08 158,252.70 0.02Qiagen Nv 2,893 EUR 61,261.51 103,251.17 0.01Quest Diagnostics Inc 2,100 USD 190,437.63 187,725.88 0.02Rakuten Inc Tokyo 17,800 JPY 123,414.46 185,646.49 0.02Raymond James Fin. Inc 2,800 USD 211,237.60 207,867.24 0.03Recruit Holdings Co. Ltd. 21,300 JPY 497,401.03 623,755.58 0.08Regions Financial Corp 21,300 USD 332,588.95 279,411.71 0.04Repsol Ypf Sa. Madrid 320,251 EUR 4,723,067.64 4,414,660.04 0.56Ricoh Co. Ltd 14,200 JPY 118,060.19 124,496.57 0.02Rio Tinto Limited 7,528 AUD 354,502.15 481,183.90 0.06Rio Tinto Plc /Reg. 33,176 GBP 1,446,312.37 1,809,110.67 0.23Roche Holding Ag /Genussschein 34,811 CHF 7,075,522.68 8,609,491.70 1.09Roper Industries 11,300 USD 3,580,560.93 3,633,978.40 0.46Ross Stores Inc 15,700 USD 1,086,683.46 1,366,392.13 0.17Royal Bank of Canada 40 CAD 2,532.93 2,796.83 -Royal Dutch Shell /-B- 79,177 GBP 2,292,135.84 2,283,304.55 0.29Royal Dutch Shell Plc /-A- 95,764 EUR 2,308,896.42 2,752,545.18 0.35Sandvik Ab 323,678 SEK 4,868,565.38 5,225,752.35 0.66Sankyo 22,000 JPY 736,151.41 699,107.65 0.09Sanofi-Aventis 23,447 EUR 1,913,225.88 1,779,861.77 0.22Santos Ltd 601,926 AUD 2,414,030.72 2,625,293.55 0.33Sekisui House Ltd 13,400 JPY 196,417.30 193,857.34 0.02Shimizu Corp 12,800 JPY 96,068.99 93,344.72 0.01Shin-Etsu Chemical Co 7,800 JPY 552,283.09 637,776.84 0.08Shionogi & Co Ltd 15,700 JPY 831,633.69 794,288.14 0.10Shopify Inc* 1,800 CAD 193,695.01 475,976.83 0.06Showa Denko Kk* 2,500 JPY 110,851.68 64,573.75 0.01Simon Property /Paired Shs 46 USD 7,511.34 6,452.68 -Skandinav. Ensk. Banken A 183,429 SEK 1,545,836.57 1,491,484.97 0.19Smith and Nephew Plc 18,727 GBP 361,949.55 356,754.44 0.04Snam Rete Gas Spa 177,223 EUR 722,111.07 774,641.73 0.10Solvay Sa 1,560 EUR 157,111.51 142,116.00 0.02Sony Corp Jpy 50 26,400 JPY 1,051,044.33 1,214,941.54 0.15Southwest Airlines Co 3,000 USD 150,752.65 133,760.65 0.02Starbucks Corp. 98,100 USD 5,890,050.74 7,220,759.50 0.91Stmicroelectronics Nv 11,575 EUR 230,327.08 180,570.00 0.02Stryker Corp. 31,100 USD 4,890,560.77 5,613,783.48 0.71Sumitomo Corp. 24,000 JPY 305,809.21 319,242.86 0.04Sumitomo Mitsui Financial Gr. 28,400 JPY 888,137.21 880,732.23 0.11Sumitomo Realty+Development 7,200 JPY 241,609.01 225,748.22 0.03Swire Pacific Ltd A 254,000 HKD 2,767,039.32 2,740,389.92 0.35Swire Properties Ltd 24,400 HKD 91,526.52 86,516.03 0.01Swisscom /Nam. 536 CHF 210,337.30 236,554.33 0.03Synchrony Financial 164,200 USD 4,128,430.20 4,998,519.62 0.63Sysco Corp. 10,500 USD 608,417.39 651,997.54 0.08
Pramerica Sicav
The accompanying notes form an integral part of these financial statements.
113
Global Equity
Statement of Investmentsas at June 30, 2019 (continued)
(expressed in EUR)
* Securities partially or totally lent (see Note 9).
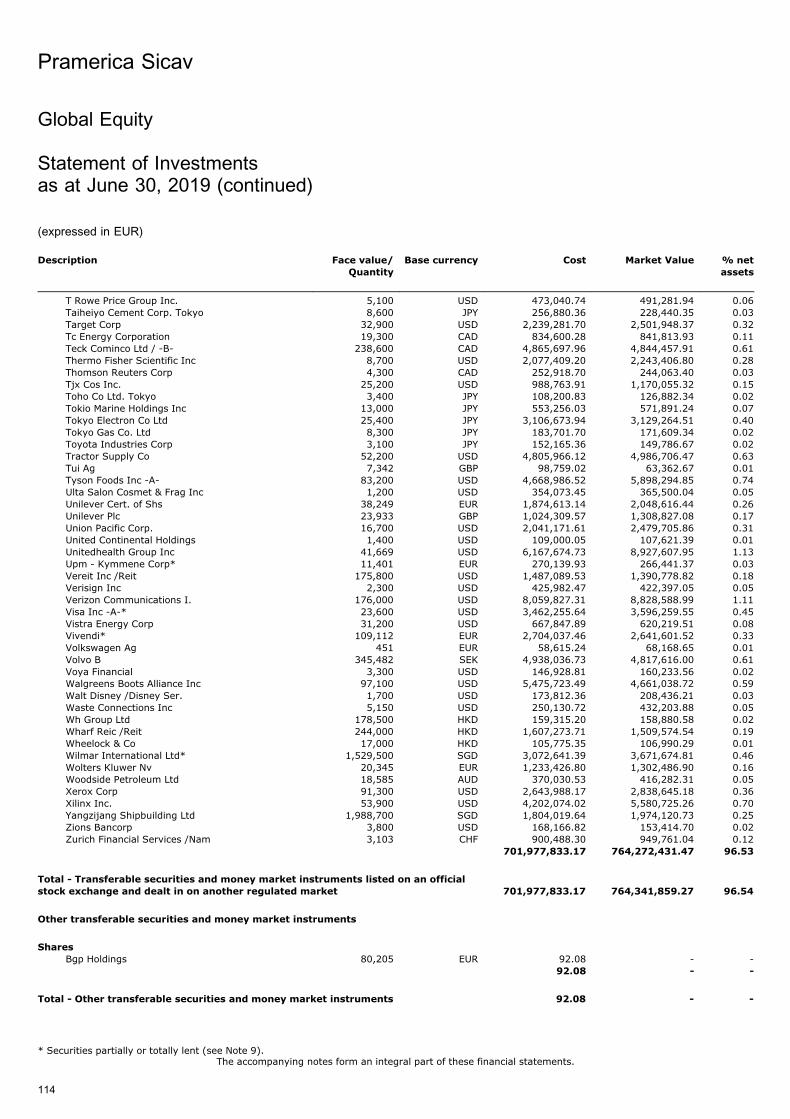
Description Face value/
Quantity
Base currency Cost Market Value % net
assets
T Rowe Price Group Inc. 5,100 USD 473,040.74 491,281.94 0.06Taiheiyo Cement Corp. Tokyo 8,600 JPY 256,880.36 228,440.35 0.03Target Corp 32,900 USD 2,239,281.70 2,501,948.37 0.32Tc Energy Corporation 19,300 CAD 834,600.28 841,813.93 0.11Teck Cominco Ltd / -B- 238,600 CAD 4,865,697.96 4,844,457.91 0.61Thermo Fisher Scientific Inc 8,700 USD 2,077,409.20 2,243,406.80 0.28Thomson Reuters Corp 4,300 CAD 252,918.70 244,063.40 0.03Tjx Cos Inc. 25,200 USD 988,763.91 1,170,055.32 0.15Toho Co Ltd. Tokyo 3,400 JPY 108,200.83 126,882.34 0.02Tokio Marine Holdings Inc 13,000 JPY 553,256.03 571,891.24 0.07Tokyo Electron Co Ltd 25,400 JPY 3,106,673.94 3,129,264.51 0.40Tokyo Gas Co. Ltd 8,300 JPY 183,701.70 171,609.34 0.02Toyota Industries Corp 3,100 JPY 152,165.36 149,786.67 0.02Tractor Supply Co 52,200 USD 4,805,966.12 4,986,706.47 0.63Tui Ag 7,342 GBP 98,759.02 63,362.67 0.01Tyson Foods Inc -A- 83,200 USD 4,668,986.52 5,898,294.85 0.74Ulta Salon Cosmet & Frag Inc 1,200 USD 354,073.45 365,500.04 0.05Unilever Cert. of Shs 38,249 EUR 1,874,613.14 2,048,616.44 0.26Unilever Plc 23,933 GBP 1,024,309.57 1,308,827.08 0.17Union Pacific Corp. 16,700 USD 2,041,171.61 2,479,705.86 0.31United Continental Holdings 1,400 USD 109,000.05 107,621.39 0.01Unitedhealth Group Inc 41,669 USD 6,167,674.73 8,927,607.95 1.13Upm - Kymmene Corp* 11,401 EUR 270,139.93 266,441.37 0.03Vereit Inc /Reit 175,800 USD 1,487,089.53 1,390,778.82 0.18Verisign Inc 2,300 USD 425,982.47 422,397.05 0.05Verizon Communications I. 176,000 USD 8,059,827.31 8,828,588.99 1.11Visa Inc -A-* 23,600 USD 3,462,255.64 3,596,259.55 0.45Vistra Energy Corp 31,200 USD 667,847.89 620,219.51 0.08Vivendi* 109,112 EUR 2,704,037.46 2,641,601.52 0.33Volkswagen Ag 451 EUR 58,615.24 68,168.65 0.01Volvo B 345,482 SEK 4,938,036.73 4,817,616.00 0.61Voya Financial 3,300 USD 146,928.81 160,233.56 0.02Walgreens Boots Alliance Inc 97,100 USD 5,475,723.49 4,661,038.72 0.59Walt Disney /Disney Ser. 1,700 USD 173,812.36 208,436.21 0.03Waste Connections Inc 5,150 USD 250,130.72 432,203.88 0.05Wh Group Ltd 178,500 HKD 159,315.20 158,880.58 0.02Wharf Reic /Reit 244,000 HKD 1,607,273.71 1,509,574.54 0.19Wheelock & Co 17,000 HKD 105,775.35 106,990.29 0.01Wilmar International Ltd* 1,529,500 SGD 3,072,641.39 3,671,674.81 0.46Wolters Kluwer Nv 20,345 EUR 1,233,426.80 1,302,486.90 0.16Woodside Petroleum Ltd 18,585 AUD 370,030.53 416,282.31 0.05Xerox Corp 91,300 USD 2,643,988.17 2,838,645.18 0.36Xilinx Inc. 53,900 USD 4,202,074.02 5,580,725.26 0.70Yangzijang Shipbuilding Ltd 1,988,700 SGD 1,804,019.64 1,974,120.73 0.25Zions Bancorp 3,800 USD 168,166.82 153,414.70 0.02Zurich Financial Services /Nam 3,103 CHF 900,488.30 949,761.04 0.12
701,977,833.17 764,272,431.47 96.53
Total - Transferable securities and money market instruments listed on an official
stock exchange and dealt in on another regulated market 701,977,833.17 764,341,859.27 96.54
Other transferable securities and money market instruments
Shares
Bgp Holdings 80,205 EUR 92.08 - -92.08 - -
Total - Other transferable securities and money market instruments 92.08 - -
Pramerica Sicav
The accompanying notes form an integral part of these financial statements.
114
Global Equity
Statement of Investmentsas at June 30, 2019 (continued)
(expressed in EUR)
* Securities partially or totally lent (see Note 9).
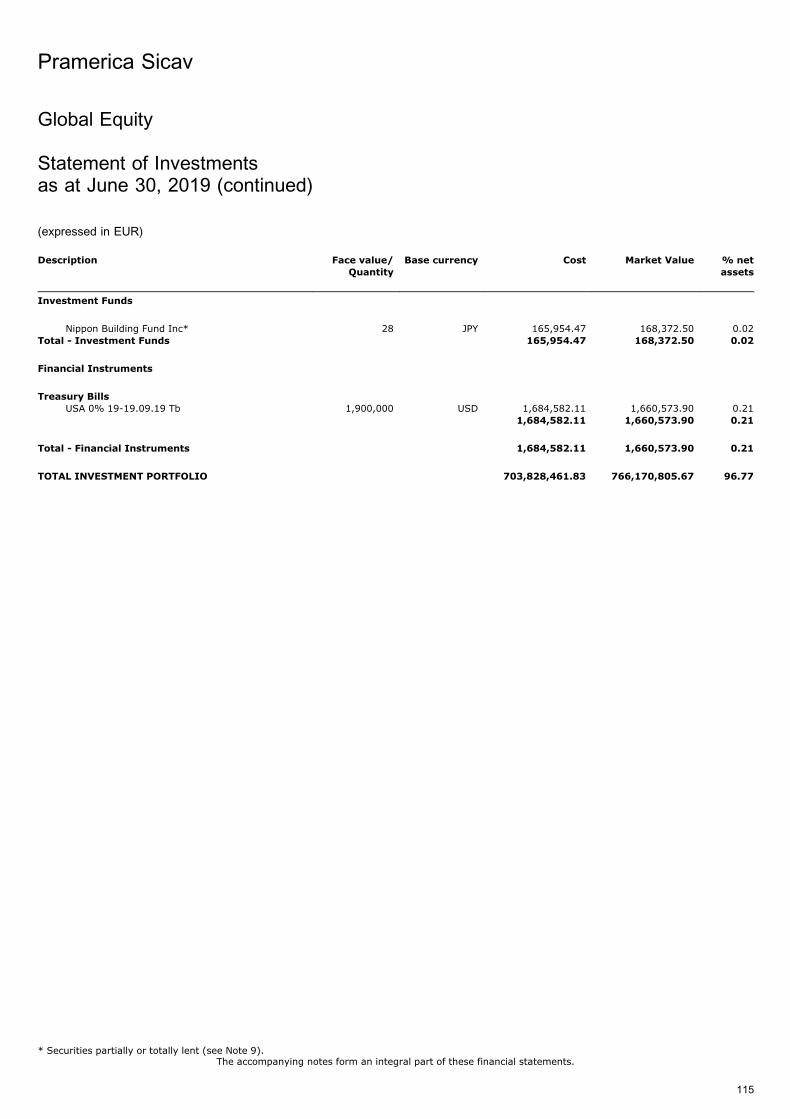
Description Face value/
Quantity
Base currency Cost Market Value % net
assets
Investment Funds
Nippon Building Fund Inc* 28 JPY 165,954.47 168,372.50 0.02Total - Investment Funds 165,954.47 168,372.50 0.02
Financial Instruments
Treasury Bills
USA 0% 19-19.09.19 Tb 1,900,000 USD 1,684,582.11 1,660,573.90 0.211,684,582.11 1,660,573.90 0.21
Total - Financial Instruments 1,684,582.11 1,660,573.90 0.21
TOTAL INVESTMENT PORTFOLIO 703,828,461.83 766,170,805.67 96.77
Pramerica Sicav
The accompanying notes form an integral part of these financial statements.
115
Global Equity
Statement of Investmentsas at June 30, 2019 (continued)
(expressed in EUR)
* Securities partially or totally lent (see Note 9).
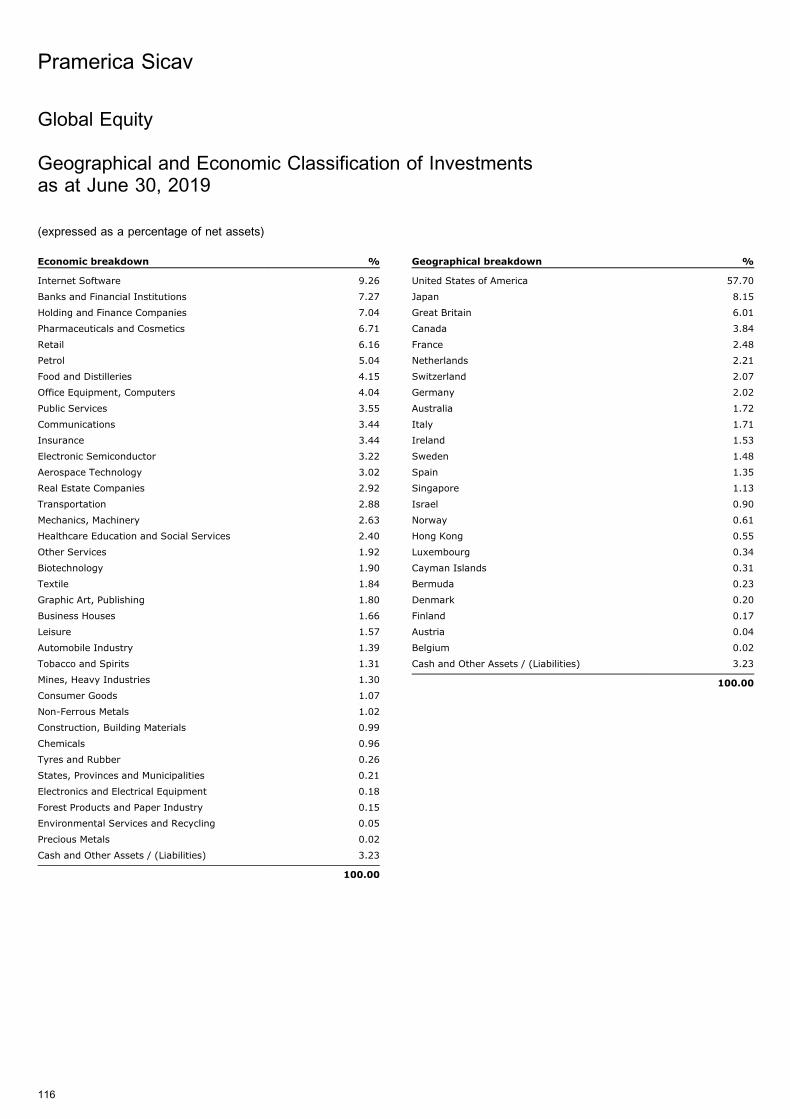
Global Equity
Geographical and Economic Classification of Investmentsas at June 30, 2019
(expressed as a percentage of net assets)
Economic breakdown %
Internet Software 9.26
Banks and Financial Institutions 7.27
Holding and Finance Companies 7.04
Pharmaceuticals and Cosmetics 6.71
Retail 6.16
Petrol 5.04
Food and Distilleries 4.15
Office Equipment, Computers 4.04
Public Services 3.55
Communications 3.44
Insurance 3.44
Electronic Semiconductor 3.22
Aerospace Technology 3.02
Real Estate Companies 2.92
Transportation 2.88
Mechanics, Machinery 2.63
Healthcare Education and Social Services 2.40
Other Services 1.92
Biotechnology 1.90
Textile 1.84
Graphic Art, Publishing 1.80
Business Houses 1.66
Leisure 1.57
Automobile Industry 1.39
Tobacco and Spirits 1.31
Mines, Heavy Industries 1.30
Consumer Goods 1.07
Non-Ferrous Metals 1.02
Construction, Building Materials 0.99
Chemicals 0.96
Tyres and Rubber 0.26
States, Provinces and Municipalities 0.21
Electronics and Electrical Equipment 0.18
Forest Products and Paper Industry 0.15
Environmental Services and Recycling 0.05
Precious Metals 0.02
Cash and Other Assets / (Liabilities) 3.23
100.00
Geographical breakdown %
United States of America 57.70
Japan 8.15
Great Britain 6.01
Canada 3.84
France 2.48
Netherlands 2.21
Switzerland 2.07
Germany 2.02
Australia 1.72
Italy 1.71
Ireland 1.53
Sweden 1.48
Spain 1.35
Singapore 1.13
Israel 0.90
Norway 0.61
Hong Kong 0.55
Luxembourg 0.34
Cayman Islands 0.31
Bermuda 0.23
Denmark 0.20
Finland 0.17
Austria 0.04
Belgium 0.02
Cash and Other Assets / (Liabilities) 3.23
100.00
Pramerica Sicav
116
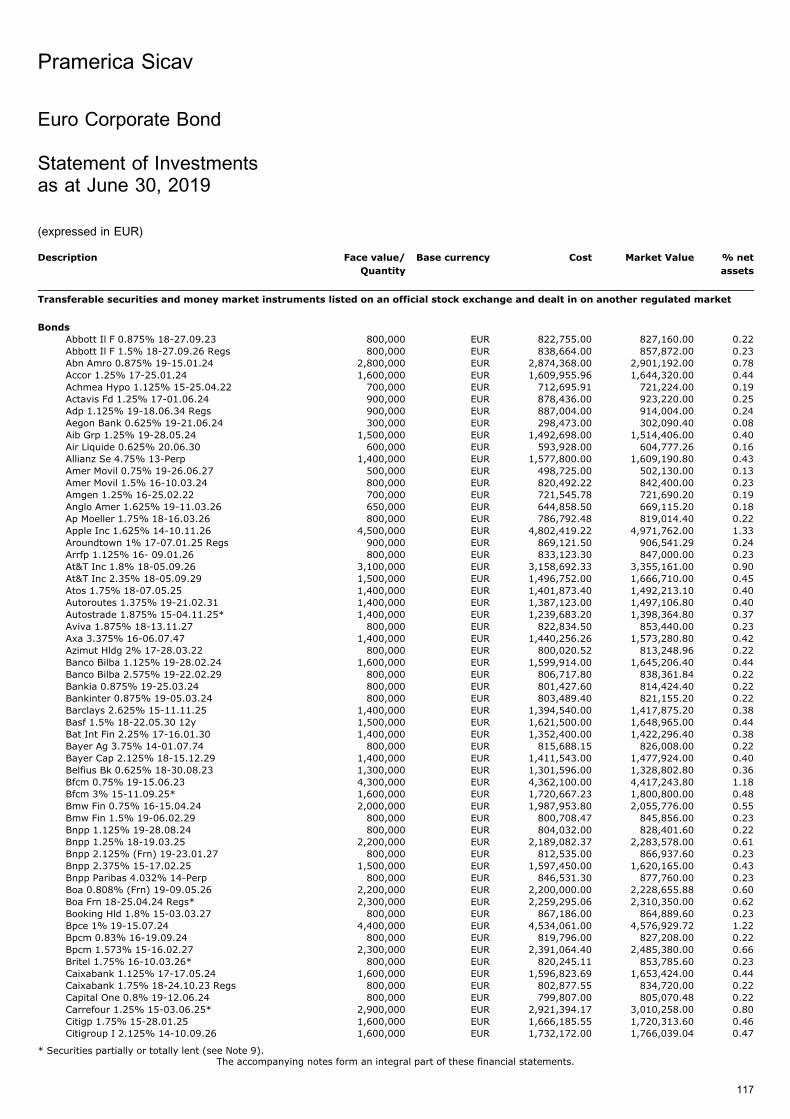
Euro Corporate Bond
Statement of Investmentsas at June 30, 2019
(expressed in EUR)
Description Face value/
Quantity
Base currency Cost Market Value % net
assets
Transferable securities and money market instruments listed on an official stock exchange and dealt in on another regulated market
Bonds
Abbott Il F 0.875% 18-27.09.23 800,000 EUR 822,755.00 827,160.00 0.22Abbott Il F 1.5% 18-27.09.26 Regs 800,000 EUR 838,664.00 857,872.00 0.23Abn Amro 0.875% 19-15.01.24 2,800,000 EUR 2,874,368.00 2,901,192.00 0.78Accor 1.25% 17-25.01.24 1,600,000 EUR 1,609,955.96 1,644,320.00 0.44Achmea Hypo 1.125% 15-25.04.22 700,000 EUR 712,695.91 721,224.00 0.19Actavis Fd 1.25% 17-01.06.24 900,000 EUR 878,436.00 923,220.00 0.25Adp 1.125% 19-18.06.34 Regs 900,000 EUR 887,004.00 914,004.00 0.24Aegon Bank 0.625% 19-21.06.24 300,000 EUR 298,473.00 302,090.40 0.08Aib Grp 1.25% 19-28.05.24 1,500,000 EUR 1,492,698.00 1,514,406.00 0.40Air Liquide 0.625% 20.06.30 600,000 EUR 593,928.00 604,777.26 0.16Allianz Se 4.75% 13-Perp 1,400,000 EUR 1,577,800.00 1,609,190.80 0.43Amer Movil 0.75% 19-26.06.27 500,000 EUR 498,725.00 502,130.00 0.13Amer Movil 1.5% 16-10.03.24 800,000 EUR 820,492.22 842,400.00 0.23Amgen 1.25% 16-25.02.22 700,000 EUR 721,545.78 721,690.20 0.19Anglo Amer 1.625% 19-11.03.26 650,000 EUR 644,858.50 669,115.20 0.18Ap Moeller 1.75% 18-16.03.26 800,000 EUR 786,792.48 819,014.40 0.22Apple Inc 1.625% 14-10.11.26 4,500,000 EUR 4,802,419.22 4,971,762.00 1.33Aroundtown 1% 17-07.01.25 Regs 900,000 EUR 869,121.50 906,541.29 0.24Arrfp 1.125% 16- 09.01.26 800,000 EUR 833,123.30 847,000.00 0.23At&T Inc 1.8% 18-05.09.26 3,100,000 EUR 3,158,692.33 3,355,161.00 0.90At&T Inc 2.35% 18-05.09.29 1,500,000 EUR 1,496,752.00 1,666,710.00 0.45Atos 1.75% 18-07.05.25 1,400,000 EUR 1,401,873.40 1,492,213.10 0.40Autoroutes 1.375% 19-21.02.31 1,400,000 EUR 1,387,123.00 1,497,106.80 0.40Autostrade 1.875% 15-04.11.25* 1,400,000 EUR 1,239,683.20 1,398,364.80 0.37Aviva 1.875% 18-13.11.27 800,000 EUR 822,834.50 853,440.00 0.23Axa 3.375% 16-06.07.47 1,400,000 EUR 1,440,256.26 1,573,280.80 0.42Azimut Hldg 2% 17-28.03.22 800,000 EUR 800,020.52 813,248.96 0.22Banco Bilba 1.125% 19-28.02.24 1,600,000 EUR 1,599,914.00 1,645,206.40 0.44Banco Bilba 2.575% 19-22.02.29 800,000 EUR 806,717.80 838,361.84 0.22Bankia 0.875% 19-25.03.24 800,000 EUR 801,427.60 814,424.40 0.22Bankinter 0.875% 19-05.03.24 800,000 EUR 803,489.40 821,155.20 0.22Barclays 2.625% 15-11.11.25 1,400,000 EUR 1,394,540.00 1,417,875.20 0.38Basf 1.5% 18-22.05.30 12y 1,500,000 EUR 1,621,500.00 1,648,965.00 0.44Bat Int Fin 2.25% 17-16.01.30 1,400,000 EUR 1,352,400.00 1,422,296.40 0.38Bayer Ag 3.75% 14-01.07.74 800,000 EUR 815,688.15 826,008.00 0.22Bayer Cap 2.125% 18-15.12.29 1,400,000 EUR 1,411,543.00 1,477,924.00 0.40Belfius Bk 0.625% 18-30.08.23 1,300,000 EUR 1,301,596.00 1,328,802.80 0.36Bfcm 0.75% 19-15.06.23 4,300,000 EUR 4,362,100.00 4,417,243.80 1.18Bfcm 3% 15-11.09.25* 1,600,000 EUR 1,720,667.23 1,800,800.00 0.48Bmw Fin 0.75% 16-15.04.24 2,000,000 EUR 1,987,953.80 2,055,776.00 0.55Bmw Fin 1.5% 19-06.02.29 800,000 EUR 800,708.47 845,856.00 0.23Bnpp 1.125% 19-28.08.24 800,000 EUR 804,032.00 828,401.60 0.22Bnpp 1.25% 18-19.03.25 2,200,000 EUR 2,189,082.37 2,283,578.00 0.61Bnpp 2.125% (Frn) 19-23.01.27 800,000 EUR 812,535.00 866,937.60 0.23Bnpp 2.375% 15-17.02.25 1,500,000 EUR 1,597,450.00 1,620,165.00 0.43Bnpp Paribas 4.032% 14-Perp 800,000 EUR 846,531.30 877,760.00 0.23Boa 0.808% (Frn) 19-09.05.26 2,200,000 EUR 2,200,000.00 2,228,655.88 0.60Boa Frn 18-25.04.24 Regs* 2,300,000 EUR 2,259,295.06 2,310,350.00 0.62Booking Hld 1.8% 15-03.03.27 800,000 EUR 867,186.00 864,889.60 0.23Bpce 1% 19-15.07.24 4,400,000 EUR 4,534,061.00 4,576,929.72 1.22Bpcm 0.83% 16-19.09.24 800,000 EUR 819,796.00 827,208.00 0.22Bpcm 1.573% 15-16.02.27 2,300,000 EUR 2,391,064.40 2,485,380.00 0.66Britel 1.75% 16-10.03.26* 800,000 EUR 820,245.11 853,785.60 0.23Caixabank 1.125% 17-17.05.24 1,600,000 EUR 1,596,823.69 1,653,424.00 0.44Caixabank 1.75% 18-24.10.23 Regs 800,000 EUR 802,877.55 834,720.00 0.22Capital One 0.8% 19-12.06.24 800,000 EUR 799,807.00 805,070.48 0.22Carrefour 1.25% 15-03.06.25* 2,900,000 EUR 2,921,394.17 3,010,258.00 0.80Citigp 1.75% 15-28.01.25 1,600,000 EUR 1,666,185.55 1,720,313.60 0.46Citigroup I 2.125% 14-10.09.26 1,600,000 EUR 1,732,172.00 1,766,039.04 0.47
Pramerica Sicav
The accompanying notes form an integral part of these financial statements.
117
* Securities partially or totally lent (see Note 9).

Description Face value/
Quantity
Base currency Cost Market Value % net
assets
Ck Hutchiso 1.25% 18-13.04.25 1,900,000 EUR 1,877,998.42 1,975,145.00 0.53Cnh Ind Fin 1.75% 17-12.09.25 2,200,000 EUR 2,187,361.83 2,301,758.80 0.62Coca Cola 1.875% 14-22.09.26 3,100,000 EUR 3,319,556.00 3,463,622.87 0.93Comzbk 1% 19-04.03.26 Regs 1,500,000 EUR 1,494,482.62 1,540,590.00 0.41Credit Agri 1.25% 16-14.04.26 2,300,000 EUR 2,390,503.00 2,436,045.00 0.65Credit Agri 1.375% 18-13.03.25 2,900,000 EUR 2,911,896.09 3,039,159.40 0.81Crh Fin 1.375% 16-18.10.28* 2,200,000 EUR 2,157,773.90 2,347,109.60 0.63Cs Group 1.25% 17-17.07.25 800,000 EUR 819,787.00 829,252.80 0.22Daimler Int 0.875% 18-09.04.24 3,900,000 EUR 3,899,553.33 4,006,867.80 1.07Danone 1.25% 15-30.05.24 1,400,000 EUR 1,452,521.69 1,487,239.60 0.40Delphi Auto 1.5% 15-10.03.25 700,000 EUR 704,173.75 728,401.80 0.19Deut Bk 1.25% 14-08.09.21 2,100,000 EUR 2,121,878.00 2,101,890.00 0.56Deut Tel If 1.5% 16-03.04.28 2,900,000 EUR 2,938,314.93 3,101,010.60 0.83Diageo Fin 1% 18-22.04.25 Regs* 1,400,000 EUR 1,396,267.00 1,460,760.00 0.39Dsk Bk 1.375% 19-24.05.22 800,000 EUR 800,163.00 818,302.40 0.22Easyjet Plc 1.125% 16-18.10.23 1,800,000 EUR 1,805,082.66 1,843,355.70 0.49Edf 1% 16-13.10.26 3,100,000 EUR 3,110,079.00 3,258,044.20 0.87Edf 2% 18-02.10.30 700,000 EUR 722,246.00 776,568.80 0.21Edf 4% 18-Perp 800,000 EUR 815,042.95 863,080.00 0.23Elia Sys Op 2.75% 18-Perp Regs 400,000 EUR 400,348.00 421,430.40 0.11Emerson El 0.375% 19-22.05.24 800,000 EUR 800,532.90 807,550.48 0.22Enel 2.5% 18-24.11.78 Regs 1,300,000 EUR 1,263,592.01 1,308,925.80 0.35Enel Fin 1.966% 15-27.01.25 1,600,000 EUR 1,694,104.00 1,738,937.60 0.46Enexis 0.75% 19-02.07.31 Regs 150,000 EUR 149,350.50 149,925.00 0.04Enexis 0.875% 16-28.04.26 1,300,000 EUR 1,291,254.71 1,353,690.00 0.36Erste Bk 0.875% 19-22.05.26 800,000 EUR 799,600.00 817,936.00 0.22Esb Fin 2.125% 15-08.06.27 1,500,000 EUR 1,612,205.26 1,691,982.00 0.45Eurogrid 1.5% 16-18.04.28 1,400,000 EUR 1,414,753.57 1,489,121.20 0.40Eutelsat 2% 18-02.10.25 1,400,000 EUR 1,392,993.20 1,440,194.00 0.39Fca Bank Ie 1% 17-15.11.21* 3,700,000 EUR 3,700,817.52 3,771,661.60 1.01Fer Emsn 1.375% 17-31.03.25 Regs 2,300,000 EUR 2,285,280.35 2,412,428.60 0.64Fil Intl 2.5% 16-04.11.26 1,300,000 EUR 1,314,527.66 1,383,330.00 0.37Fiserv 0.375% 19-01.07.23 500,000 EUR 499,260.00 503,043.00 0.13Ford Mc Frn 0.384% 17-01.12.24 700,000 EUR 633,050.52 652,323.00 0.17Fortum 0.875% 19-27.02.23 1,400,000 EUR 1,396,780.00 1,429,176.00 0.38Fresenius 1.5% 17-30.01.24* 900,000 EUR 908,546.01 943,790.40 0.25G4s Int Fin 1.5% 17-02.06.24 1,300,000 EUR 1,298,809.10 1,322,027.20 0.35Galp Gas Na 1.375% 16-19.09.23 1,800,000 EUR 1,807,244.93 1,871,773.20 0.50Gaz Cap 3.125% 16-17.11.23 1,500,000 EUR 1,580,761.76 1,620,000.00 0.43Gdf Suez 1% 15-13.03.26 3,100,000 EUR 3,143,549.06 3,275,577.49 0.88Gdf Suez 3.875% 14-Perp 600,000 EUR 634,495.93 670,156.80 0.18Ge Cap Eur 0.8% 15-21.01.22 3,900,000 EUR 3,927,308.85 3,970,800.60 1.06Ge Cap Eur 2.625% 13-15.03.23 Emtn* 1,400,000 EUR 1,481,377.00 1,512,666.40 0.40Gen Elec 0.875% 17-17.05.25 800,000 EUR 739,276.00 796,032.00 0.21General Motors 0.955% 07.09.23 800,000 EUR 793,904.83 805,712.00 0.22Generali Fi 4.596% 14-Perp 1,400,000 EUR 1,409,348.24 1,458,240.00 0.39Germany 0% 15-17.04.20 800,000 EUR 805,424.00 804,204.80 0.22Glaxosmithk 1.25% 18-21.05.26 800,000 EUR 831,368.00 851,155.20 0.23Glencore FI 1.875% 16-13.09.23* 2,100,000 EUR 2,138,508.57 2,204,811.00 0.59Gs 1.375% 17-15.05.24 4,600,000 EUR 4,657,969.26 4,764,680.00 1.27Heidlrg 1.5% 16-07.02.25 Reg-S 700,000 EUR 705,736.43 736,470.00 0.20Heineken Nv 1% 16-04.05.26* 1,500,000 EUR 1,497,707.97 1,566,528.00 0.42Hsbc Hldg 0.875% 16-06.09.24 800,000 EUR 803,704.00 820,193.52 0.22Iberdrola I 1.75% 15-17.09.23 1,300,000 EUR 1,371,799.07 1,400,139.00 0.37Iberdrola I 3.25% 19-Perp 800,000 EUR 813,640.00 863,808.00 0.23Ibm Corp 1.25% 19-29.01.27 2,300,000 EUR 2,308,394.75 2,428,763.20 0.65Imp Tob 1.375% 17-27.01.25 Regs 2,100,000 EUR 2,089,716.16 2,146,393.83 0.57Ing Groep 1% 18-20.09.23 1,500,000 EUR 1,497,387.00 1,547,322.00 0.41Ing Groep 2.5% (Frn) 17-15.02.29 3,800,000 EUR 3,947,955.26 4,043,580.00 1.08Inmob Col 2% 18-17.04.26 1,600,000 EUR 1,593,805.75 1,709,512.64 0.46Innogy Fin 1.625% 18-30.05.26 800,000 EUR 853,842.80 864,697.60 0.23Internation 1.8% 18-25.09.26 1,600,000 EUR 1,618,332.30 1,705,062.56 0.46
Pramerica Sicav
The accompanying notes form an integral part of these financial statements.
118
Euro Corporate Bond
Statement of Investmentsas at June 30, 2019 (continued)
(expressed in EUR)
* Securities partially or totally lent (see Note 9).

Description Face value/
Quantity
Base currency Cost Market Value % net
assets
Intesa San 2.125% 18-30.08.23 2,300,000 EUR 2,398,498.80 2,415,308.20 0.65Itv 2% 16-01.12.23* 700,000 EUR 716,032.61 730,850.40 0.20Jab Holding 1.75% 18-25.06.26 1,400,000 EUR 1,420,399.00 1,471,974.00 0.39Jpmorgan Ch 0.625% 16-25.01.24 5,300,000 EUR 5,254,852.64 5,401,760.00 1.44Kbc 0.625% 19-10.04.25 Regs 800,000 EUR 796,690.90 805,096.00 0.22Kellogg Co 1% 16-17.05.24 2,500,000 EUR 2,517,123.06 2,592,525.00 0.69Klepierre 0.625% 19-01.07.30 1,000,000 EUR 988,210.00 982,072.00 0.26Kon Ah Del 0.25% 19-26.06.25 350,000 EUR 347,452.00 348,470.50 0.09Lbp 2.75% 14-23.04.26 Ftf 1,300,000 EUR 1,332,596.00 1,351,500.80 0.36Lease plan 0.75% 17-03.10.22 1,500,000 EUR 1,494,583.84 1,517,715.00 0.41Lloyds Bk 0.625% 18-15.01.24 1,500,000 EUR 1,470,965.09 1,492,545.00 0.40Mapfre 1.625% 16-19.05.26 800,000 EUR 818,911.00 847,576.00 0.23Mapfre 4.375% (Frn) 17-31.03.47 1,400,000 EUR 1,487,998.83 1,572,760.00 0.42Mcdonalds 0.9% 19-15.06.26 2,200,000 EUR 2,202,106.00 2,266,330.00 0.61Mediobanca 0.625% 17-27.09.22* 1,500,000 EUR 1,460,490.25 1,491,120.00 0.40Medtrnc 1.125% 19-07.03.27 1,200,000 EUR 1,219,436.20 1,250,594.52 0.33Merck Kgaa 1.625% 19-25.06.79 800,000 EUR 800,065.00 804,054.40 0.21Met Life 0.375% 19-09.04.24 Regs 1,000,000 EUR 999,122.23 1,011,738.00 0.27Metrovacesa 2.375% 16-23.05.22 1,300,000 EUR 1,372,897.76 1,376,187.80 0.37Mor St 1.875% 14-30.03.23* 4,700,000 EUR 4,951,668.36 4,995,084.80 1.34Munich Re 3.25% 18-26.05.49 600,000 EUR 596,675.49 694,525.20 0.19Nat Aus Bk 0.625% 17-18.09.24 2,200,000 EUR 2,209,834.00 2,245,320.00 0.60Natl Grid 1% 17-12.07.24 Regs 900,000 EUR 920,362.50 929,881.80 0.25Ndaq 1.75% 19-28.03.29 900,000 EUR 906,851.20 955,692.00 0.26Newbelco 1.15% 18-22.01.27 3,900,000 EUR 3,903,166.00 4,058,535.00 1.09Nn Group 4.5% 14-Perp 600,000 EUR 632,071.94 661,878.72 0.18Omv 0% 19-03.07.25 Regs 800,000 EUR 793,216.00 795,152.00 0.21Omv 1% 17-14.12.26 Regs 700,000 EUR 683,446.00 740,661.60 0.20Omv 6.25% 15-Perp* 700,000 EUR 845,377.87 879,718.00 0.24Orange 1% 16-12.05.25 800,000 EUR 808,235.00 836,728.00 0.22Orange 1.125% 19-15.07.24 Regs 1,500,000 EUR 1,556,250.00 1,573,029.00 0.42Partnerre 1.25% 16-15.09.26 1,300,000 EUR 1,248,563.33 1,331,184.40 0.36Pemex 3.75% 17-21.02.24* 2,800,000 EUR 2,849,263.93 2,782,136.00 0.74Peugeot 2% 17-23.03.24 Regs 1,400,000 EUR 1,416,337.93 1,474,849.60 0.39Pricelineco 2.375% 14-23.09.24 700,000 EUR 769,230.00 774,396.35 0.21Prosegur 1% 18-08.02.23 Regs 1,300,000 EUR 1,292,731.34 1,321,148.40 0.35Psa Banque 0.625% 17-10.10.22 2,100,000 EUR 2,086,976.63 2,126,518.59 0.57Rabobk 1.25% 16-23.03.26 2,800,000 EUR 2,962,400.00 3,007,631.20 0.80Raiffeisen 1% 18-04.12.23 800,000 EUR 805,302.50 822,294.64 0.22Rbs Grp 2.5% 16-22.03.23* 2,100,000 EUR 2,208,375.64 2,228,587.20 0.60Rci Bq 0.5% 16-15.09.23 3,900,000 EUR 3,830,994.20 3,887,644.80 1.04Relx Capita 1.3% 15-12.05.25* 800,000 EUR 805,180.80 841,912.00 0.23Royal Phil 0.5% 19-22.05.26 900,000 EUR 895,446.00 909,587.97 0.24Rte 1% 16-19.10.26 1,500,000 EUR 1,537,231.00 1,577,958.00 0.42Sanofi 0.5% 16-13.01.27 700,000 EUR 700,345.80 712,539.94 0.19Santan Cons 1% 19-27.02.24 900,000 EUR 903,861.00 925,947.00 0.25Santander 0.25% 19-19.06.24 1,100,000 EUR 1,094,775.00 1,100,627.00 0.29Santander I 2.5% 15-18.03.25 2,900,000 EUR 2,951,497.10 3,134,482.11 0.84Sap Ag 0.75% 18-10.12.24 Regs 1,400,000 EUR 1,396,744.00 1,453,306.40 0.39Schneid El 1.375% 18-21.06.27 800,000 EUR 846,930.80 857,512.00 0.23Scor Se 3.625% 16-27.05.48 600,000 EUR 629,798.80 683,710.56 0.18Shb 0.125% 19-18.06.24 Regs 1,900,000 EUR 1,897,264.00 1,905,263.00 0.51Shell Int F 0.375% 16-15.02.25 2,300,000 EUR 2,274,437.57 2,357,195.71 0.63Sky Regd Guar 2.5% 14-15.09.26 900,000 EUR 1,014,565.00 1,021,617.00 0.27Sns 0.75% 18-25.06.23 1,500,000 EUR 1,517,060.00 1,537,422.00 0.41Socgen 1.125% 18-23.01.25 1,500,000 EUR 1,509,917.00 1,531,740.00 0.41Socgen 1.25% 19-15.02.24 1,400,000 EUR 1,396,554.00 1,443,240.40 0.39Socgen 2.625% 15-27.02.25 700,000 EUR 730,590.40 761,178.60 0.20Swiss Re Ad 1.375% 16-27.05.23 2,600,000 EUR 2,666,835.06 2,716,932.40 0.73Takeda Phar 3% 18-21.11.30 Regs 1,500,000 EUR 1,526,087.00 1,732,530.00 0.46Telefonica 1.069% 19-05.02.24 1,500,000 EUR 1,506,812.00 1,560,237.00 0.42Telefonica 1.788% 19-12.03.29 900,000 EUR 905,664.00 971,571.60 0.26
Pramerica Sicav
The accompanying notes form an integral part of these financial statements.
119
Euro Corporate Bond
Statement of Investmentsas at June 30, 2019 (continued)
(expressed in EUR)
* Securities partially or totally lent (see Note 9).
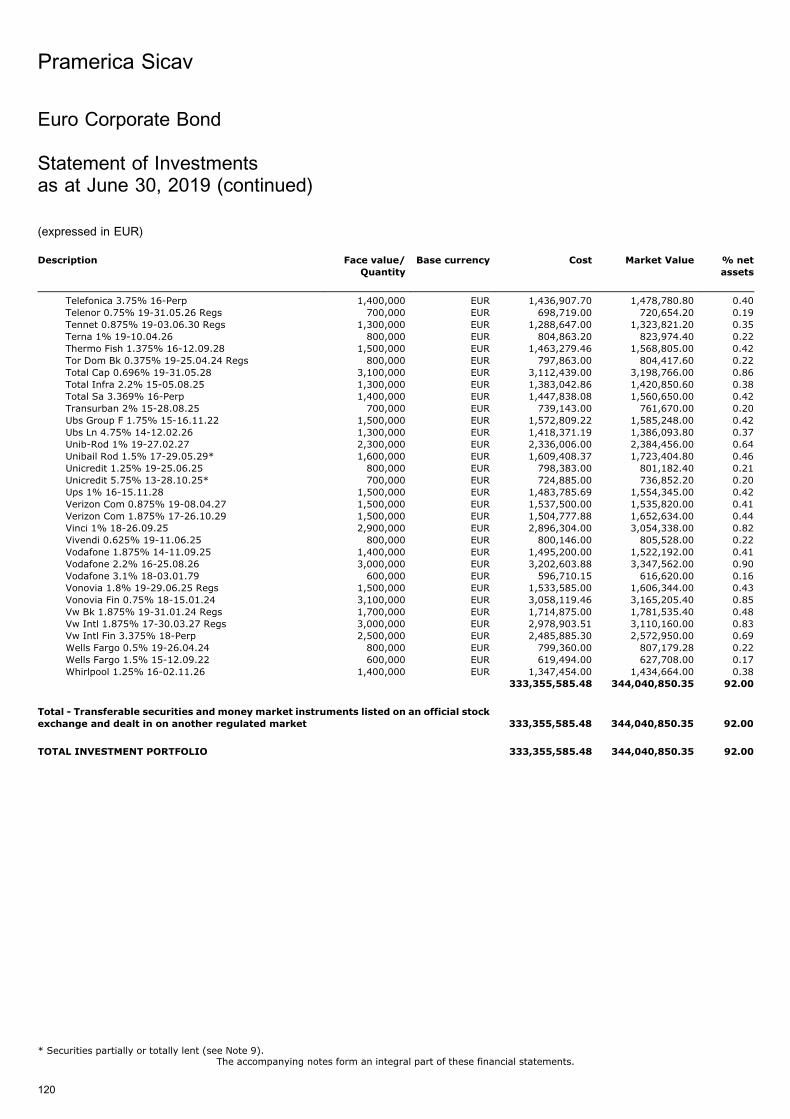
Description Face value/
Quantity
Base currency Cost Market Value % net
assets
Telefonica 3.75% 16-Perp 1,400,000 EUR 1,436,907.70 1,478,780.80 0.40Telenor 0.75% 19-31.05.26 Regs 700,000 EUR 698,719.00 720,654.20 0.19Tennet 0.875% 19-03.06.30 Regs 1,300,000 EUR 1,288,647.00 1,323,821.20 0.35Terna 1% 19-10.04.26 800,000 EUR 804,863.20 823,974.40 0.22Thermo Fish 1.375% 16-12.09.28 1,500,000 EUR 1,463,279.46 1,568,805.00 0.42Tor Dom Bk 0.375% 19-25.04.24 Regs 800,000 EUR 797,863.00 804,417.60 0.22Total Cap 0.696% 19-31.05.28 3,100,000 EUR 3,112,439.00 3,198,766.00 0.86Total Infra 2.2% 15-05.08.25 1,300,000 EUR 1,383,042.86 1,420,850.60 0.38Total Sa 3.369% 16-Perp 1,400,000 EUR 1,447,838.08 1,560,650.00 0.42Transurban 2% 15-28.08.25 700,000 EUR 739,143.00 761,670.00 0.20Ubs Group F 1.75% 15-16.11.22 1,500,000 EUR 1,572,809.22 1,585,248.00 0.42Ubs Ln 4.75% 14-12.02.26 1,300,000 EUR 1,418,371.19 1,386,093.80 0.37Unib-Rod 1% 19-27.02.27 2,300,000 EUR 2,336,006.00 2,384,456.00 0.64Unibail Rod 1.5% 17-29.05.29* 1,600,000 EUR 1,609,408.37 1,723,404.80 0.46Unicredit 1.25% 19-25.06.25 800,000 EUR 798,383.00 801,182.40 0.21Unicredit 5.75% 13-28.10.25* 700,000 EUR 724,885.00 736,852.20 0.20Ups 1% 16-15.11.28 1,500,000 EUR 1,483,785.69 1,554,345.00 0.42Verizon Com 0.875% 19-08.04.27 1,500,000 EUR 1,537,500.00 1,535,820.00 0.41Verizon Com 1.875% 17-26.10.29 1,500,000 EUR 1,504,777.88 1,652,634.00 0.44Vinci 1% 18-26.09.25 2,900,000 EUR 2,896,304.00 3,054,338.00 0.82Vivendi 0.625% 19-11.06.25 800,000 EUR 800,146.00 805,528.00 0.22Vodafone 1.875% 14-11.09.25 1,400,000 EUR 1,495,200.00 1,522,192.00 0.41Vodafone 2.2% 16-25.08.26 3,000,000 EUR 3,202,603.88 3,347,562.00 0.90Vodafone 3.1% 18-03.01.79 600,000 EUR 596,710.15 616,620.00 0.16Vonovia 1.8% 19-29.06.25 Regs 1,500,000 EUR 1,533,585.00 1,606,344.00 0.43Vonovia Fin 0.75% 18-15.01.24 3,100,000 EUR 3,058,119.46 3,165,205.40 0.85Vw Bk 1.875% 19-31.01.24 Regs 1,700,000 EUR 1,714,875.00 1,781,535.40 0.48Vw Intl 1.875% 17-30.03.27 Regs 3,000,000 EUR 2,978,903.51 3,110,160.00 0.83Vw Intl Fin 3.375% 18-Perp 2,500,000 EUR 2,485,885.30 2,572,950.00 0.69Wells Fargo 0.5% 19-26.04.24 800,000 EUR 799,360.00 807,179.28 0.22Wells Fargo 1.5% 15-12.09.22 600,000 EUR 619,494.00 627,708.00 0.17Whirlpool 1.25% 16-02.11.26 1,400,000 EUR 1,347,454.00 1,434,664.00 0.38
333,355,585.48 344,040,850.35 92.00
Total - Transferable securities and money market instruments listed on an official stock
exchange and dealt in on another regulated market 333,355,585.48 344,040,850.35 92.00
TOTAL INVESTMENT PORTFOLIO 333,355,585.48 344,040,850.35 92.00
Pramerica Sicav
The accompanying notes form an integral part of these financial statements.
120
Euro Corporate Bond
Statement of Investmentsas at June 30, 2019 (continued)
(expressed in EUR)
* Securities partially or totally lent (see Note 9).
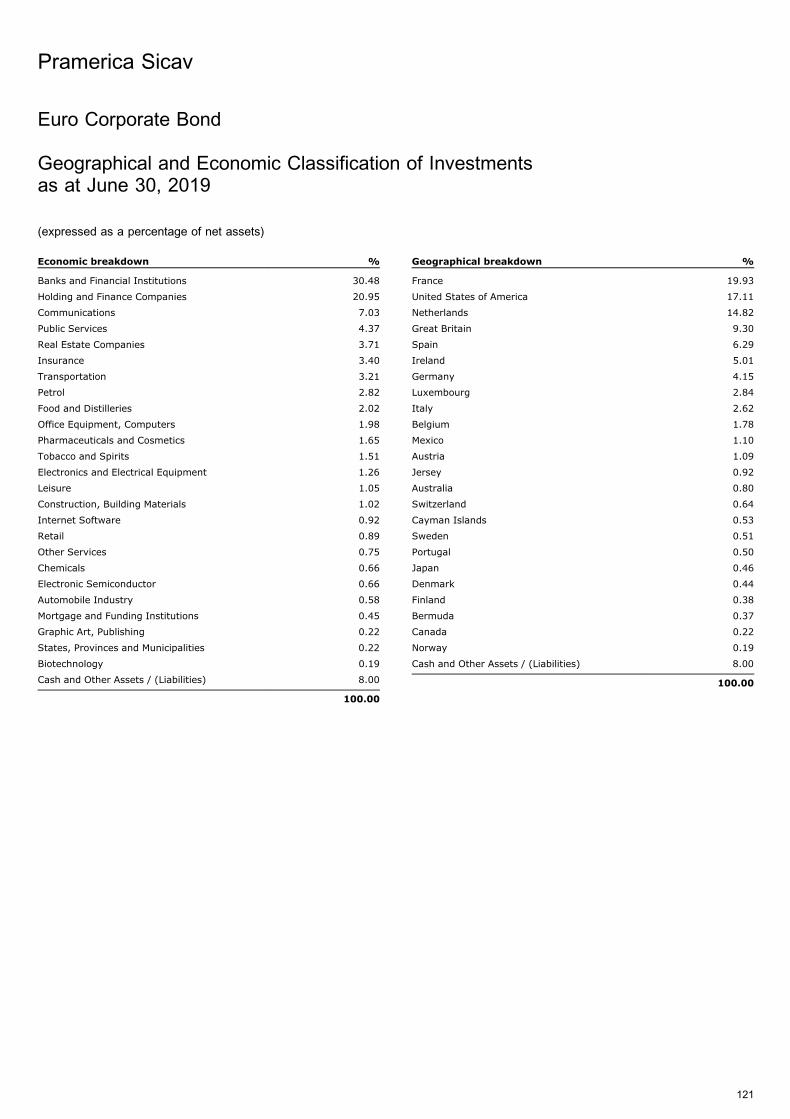
Euro Corporate Bond
Geographical and Economic Classification of Investmentsas at June 30, 2019
(expressed as a percentage of net assets)
Economic breakdown %
Banks and Financial Institutions 30.48
Holding and Finance Companies 20.95
Communications 7.03
Public Services 4.37
Real Estate Companies 3.71
Insurance 3.40
Transportation 3.21
Petrol 2.82
Food and Distilleries 2.02
Office Equipment, Computers 1.98
Pharmaceuticals and Cosmetics 1.65
Tobacco and Spirits 1.51
Electronics and Electrical Equipment 1.26
Leisure 1.05
Construction, Building Materials 1.02
Internet Software 0.92
Retail 0.89
Other Services 0.75
Chemicals 0.66
Electronic Semiconductor 0.66
Automobile Industry 0.58
Mortgage and Funding Institutions 0.45
Graphic Art, Publishing 0.22
States, Provinces and Municipalities 0.22
Biotechnology 0.19
Cash and Other Assets / (Liabilities) 8.00
100.00
Geographical breakdown %
France 19.93
United States of America 17.11
Netherlands 14.82
Great Britain 9.30
Spain 6.29
Ireland 5.01
Germany 4.15
Luxembourg 2.84
Italy 2.62
Belgium 1.78
Mexico 1.10
Austria 1.09
Jersey 0.92
Australia 0.80
Switzerland 0.64
Cayman Islands 0.53
Sweden 0.51
Portugal 0.50
Japan 0.46
Denmark 0.44
Finland 0.38
Bermuda 0.37
Canada 0.22
Norway 0.19
Cash and Other Assets / (Liabilities) 8.00
100.00
Pramerica Sicav
121

High Yield Bond
Statement of Investmentsas at June 30, 2019
(expressed in EUR)
Description Face value/
Quantity
Base currency Cost Market Value % net
assets
Transferable securities and money market instruments listed on an official stock exchange and dealt in on another regulated market
Bonds
Adient Glob 3.5% 16-15.08.24 1,050,000 EUR 1,052,359.55 871,500.00 0.26Afren 10.25% 12-08.04.19 975,836 USD 813,315.32 702.60 -Aguila 3 6.75% 17-15.12.21 850,000 EUR 878,050.00 875,908.00 0.26Aguila 3 9.75% 17-15.12.22 750,000 EUR 810,937.50 798,982.50 0.24Akbank 5.125% 15-31.03.25* 1,500,000 USD 1,332,465.69 1,214,988.15 0.37Allis Trans 5.875% 19-01.06.29 144a 250,000 USD 221,591.92 231,034.33 0.07Alta Mesa 7.875% 17-15.12.24 1,305,000 USD 1,120,103.96 444,013.96 0.13Altice Fi 4.75% 17-15.01.28 Regs 130,000 EUR 130,000.00 113,037.60 0.03Am Axle & M 6.25% 18-15.03.26 975,000 USD 791,396.10 845,388.09 0.25Am Axle 6.25% 17-01.04.25 975,000 USD 909,903.03 851,808.76 0.26Amc Ent 6.375% 16-15.11.24 Regs 1,150,000 GBP 1,283,722.61 1,250,120.18 0.38Amerigas 5.75% 17-20.05.27 550,000 USD 437,208.44 507,068.22 0.15Amerigas Fi 5.875% 16-20.08.26 1,150,000 USD 1,014,288.24 1,070,331.02 0.32Angola 9.5% 15-12.11.25 1,027,000 USD 993,442.97 1,033,140.90 0.31Anixter 6% 18-01.12.25 250,000 USD 219,471.51 238,168.41 0.07Antero 5.75% 19-15.01.28 1,225,000 USD 1,076,071.68 1,064,843.27 0.32Arab Rep 4.75% 18-16.04.26 Regs 925,000 EUR 887,815.00 929,403.00 0.28Arab Rep 5.625% 18-16.04.30 Regs 420,000 EUR 364,140.00 410,133.36 0.12Arab Rep Eg 6.375% 19-11.04.31 935,000 EUR 935,000.00 949,761.78 0.29Ard 6.625% 17-15.09.23 /Pik Regs 2,550,000 EUR 2,586,310.42 2,641,162.50 0.79Argentina 4.625% 18-11.01.23 3,950,000 USD 3,270,679.80 2,774,641.76 0.83Argentina 7.5% 16-22.04.26 2,680,000 USD 2,404,703.72 1,987,233.30 0.60Argentina 7.82% 09-31.12.33 /Pik 5,779,636 EUR 3,322,483.16 4,728,319.84 1.42Argentina 7.82% 31.12.33 Pik 1,750,000 EUR 1,453,075.94 1,998,785.25 0.60Argentina 8.28% 09-31.12.33 1,110 USD - 795.60 -Argentina Frn 03-15.12.35 Gdp 2,352 USD - 74.37 -Ascent Reso 10% 17-01.04.22 144a* 959,000 USD 892,010.05 891,426.24 0.27Ascent Reso 7% 18-01.11.26 400,000 USD 337,853.43 320,484.68 0.10Ashton Wd 6.75% 17-01.08.25 144a 1,125,000 USD 966,590.51 953,222.41 0.29Avant 4.75% 17-01.10.24 Regs 1,030,000 EUR 1,037,629.63 1,102,100.00 0.33Avolon 5.25% 19-15.05.24 144a 800,000 USD 709,345.63 750,471.51 0.23Avolon 5.5% 18-15.01.23 800,000 USD 656,814.45 748,862.94 0.23Bahrain 6.75% 17-20.09.29 Regs 1,070,000 USD 839,849.40 992,141.51 0.30Bahrain 7% 15-26.01.26 510,000 USD 427,258.31 483,135.55 0.15Bahrain 7% 16-12.10.28 995,000 USD 757,405.85 940,208.17 0.28Bahrain 7.5% 17-20.09.47 720,000 USD 659,125.46 668,419.70 0.20Banff Merge 8.375% 18-01.09.26 2,700,000 EUR 2,700,000.00 2,239,736.40 0.67Blitz 6% 18-30.07.26 1,200,000 EUR 1,200,000.00 1,273,152.00 0.38Bombardier 7.5% 15-15.03.25 275,000 USD 241,380.34 242,137.15 0.07Bombardier 7.5% 17-01.12.24 144a 2,600,000 USD 2,212,765.96 2,328,562.65 0.70Bombardier 7.875% 15.04.27 144a 500,000 USD 435,748.16 439,568.88 0.13Bombardier 8.75% 16-01.12.21 144a 1,650,000 USD 1,667,412.61 1,579,155.33 0.48Bq Cent Tun 6.75% 18-31.10.23 Regs 310,000 EUR 319,145.00 317,524.32 0.10Bracken 8.875% 18-15.10.23 /Pik Regs 1,200,000 GBP 1,348,062.88 1,293,408.50 0.39Brazil 8.25% 04-20.01.34 1,000,000 USD 987,917.87 1,171,094.92 0.35Brkfld Res 6.375% 15-15.05.25 1,175,000 USD 1,083,404.99 1,042,014.22 0.31Buenos 9.125% 16-16.03.24 /Pool 3,750,000 USD 3,706,515.43 2,749,396.35 0.83C&W Sr 6.875% 17-15.09.27 144a 1,850,000 USD 1,574,334.10 1,677,329.00 0.50Calpine 5.375% 14-15.01.23 875,000 USD 655,747.15 777,204.98 0.23Calpine 5.5% 15-01.02.24 2,100,000 USD 1,852,015.16 1,825,445.61 0.55Cco Hldgs 5% 17-01.02.28 2,525,000 USD 2,125,420.88 2,264,053.03 0.68Cec Ent 8% 14-15.02.22 189,000 USD 138,932.59 166,986.79 0.05Chemours Co 4% 18-15.05.26 800,000 EUR 800,526.32 800,000.00 0.24Chesa Ener 8% 17-15.06.27* 1,025,000 USD 911,111.11 793,117.26 0.24Chs 8.125% 18-30.06.24 144a* 2,158,000 USD 1,806,394.99 1,416,371.06 0.43Cir Fin Int 4.75% 19-22.05.25 1,050,000 EUR 1,059,500.00 1,102,500.00 0.33Citgo 10.75% 15-15.02.20 3,750,000 USD 3,218,762.06 3,407,893.58 1.03Clear Ch 9.25% 19-15.02.24 144a 2,840,000 USD 2,521,940.52 2,705,593.12 0.81Cleveland 5.875% 19-01.06.27 144a 1,825,000 USD 1,570,951.24 1,558,356.75 0.47
Pramerica Sicav
The accompanying notes form an integral part of these financial statements.
122
* Securities partially or totally lent (see Note 9).
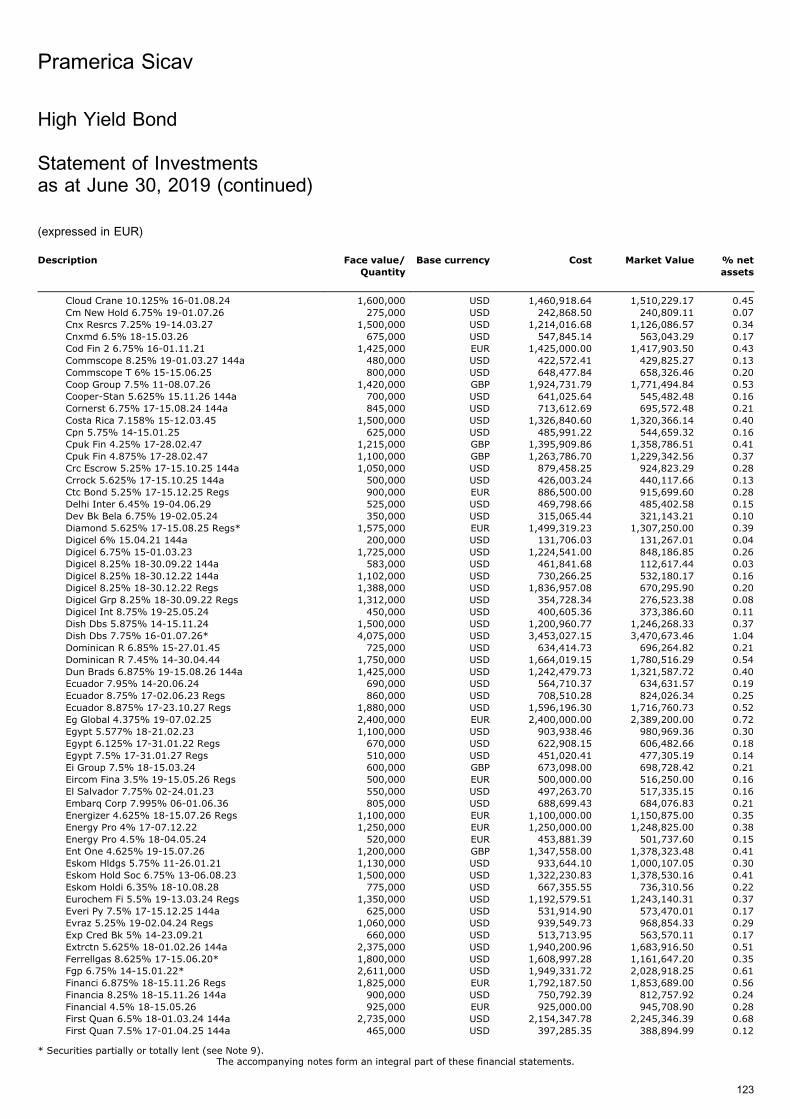
Description Face value/
Quantity
Base currency Cost Market Value % net
assets
Cloud Crane 10.125% 16-01.08.24 1,600,000 USD 1,460,918.64 1,510,229.17 0.45Cm New Hold 6.75% 19-01.07.26 275,000 USD 242,868.50 240,809.11 0.07Cnx Resrcs 7.25% 19-14.03.27 1,500,000 USD 1,214,016.68 1,126,086.57 0.34Cnxmd 6.5% 18-15.03.26 675,000 USD 547,845.14 563,043.29 0.17Cod Fin 2 6.75% 16-01.11.21 1,425,000 EUR 1,425,000.00 1,417,903.50 0.43Commscope 8.25% 19-01.03.27 144a 480,000 USD 422,572.41 429,825.27 0.13Commscope T 6% 15-15.06.25 800,000 USD 648,477.84 658,326.46 0.20Coop Group 7.5% 11-08.07.26 1,420,000 GBP 1,924,731.79 1,771,494.84 0.53Cooper-Stan 5.625% 15.11.26 144a 700,000 USD 641,025.64 545,482.48 0.16Cornerst 6.75% 17-15.08.24 144a 845,000 USD 713,612.69 695,572.48 0.21Costa Rica 7.158% 15-12.03.45 1,500,000 USD 1,326,840.60 1,320,366.14 0.40Cpn 5.75% 14-15.01.25 625,000 USD 485,991.22 544,659.32 0.16Cpuk Fin 4.25% 17-28.02.47 1,215,000 GBP 1,395,909.86 1,358,786.51 0.41Cpuk Fin 4.875% 17-28.02.47 1,100,000 GBP 1,263,786.70 1,229,342.56 0.37Crc Escrow 5.25% 17-15.10.25 144a 1,050,000 USD 879,458.25 924,823.29 0.28Crrock 5.625% 17-15.10.25 144a 500,000 USD 426,003.24 440,117.66 0.13Ctc Bond 5.25% 17-15.12.25 Regs 900,000 EUR 886,500.00 915,699.60 0.28Delhi Inter 6.45% 19-04.06.29 525,000 USD 469,798.66 485,402.58 0.15Dev Bk Bela 6.75% 19-02.05.24 350,000 USD 315,065.44 321,143.21 0.10Diamond 5.625% 17-15.08.25 Regs* 1,575,000 EUR 1,499,319.23 1,307,250.00 0.39Digicel 6% 15.04.21 144a 200,000 USD 131,706.03 131,267.01 0.04Digicel 6.75% 15-01.03.23 1,725,000 USD 1,224,541.00 848,186.85 0.26Digicel 8.25% 18-30.09.22 144a 583,000 USD 461,841.68 112,617.44 0.03Digicel 8.25% 18-30.12.22 144a 1,102,000 USD 730,266.25 532,180.17 0.16Digicel 8.25% 18-30.12.22 Regs 1,388,000 USD 1,836,957.08 670,295.90 0.20Digicel Grp 8.25% 18-30.09.22 Regs 1,312,000 USD 354,728.34 276,523.38 0.08Digicel Int 8.75% 19-25.05.24 450,000 USD 400,605.36 373,386.60 0.11Dish Dbs 5.875% 14-15.11.24 1,500,000 USD 1,200,960.77 1,246,268.33 0.37Dish Dbs 7.75% 16-01.07.26* 4,075,000 USD 3,453,027.15 3,470,673.46 1.04Dominican R 6.85% 15-27.01.45 725,000 USD 634,414.73 696,264.82 0.21Dominican R 7.45% 14-30.04.44 1,750,000 USD 1,664,019.15 1,780,516.29 0.54Dun Brads 6.875% 19-15.08.26 144a 1,425,000 USD 1,242,479.73 1,321,587.72 0.40Ecuador 7.95% 14-20.06.24 690,000 USD 564,710.37 634,631.57 0.19Ecuador 8.75% 17-02.06.23 Regs 860,000 USD 708,510.28 824,026.34 0.25Ecuador 8.875% 17-23.10.27 Regs 1,880,000 USD 1,596,196.30 1,716,760.73 0.52Eg Global 4.375% 19-07.02.25 2,400,000 EUR 2,400,000.00 2,389,200.00 0.72Egypt 5.577% 18-21.02.23 1,100,000 USD 903,938.46 980,969.36 0.30Egypt 6.125% 17-31.01.22 Regs 670,000 USD 622,908.15 606,482.66 0.18Egypt 7.5% 17-31.01.27 Regs 510,000 USD 451,020.41 477,305.19 0.14Ei Group 7.5% 18-15.03.24 600,000 GBP 673,098.00 698,728.42 0.21Eircom Fina 3.5% 19-15.05.26 Regs 500,000 EUR 500,000.00 516,250.00 0.16El Salvador 7.75% 02-24.01.23 550,000 USD 497,263.70 517,335.15 0.16Embarq Corp 7.995% 06-01.06.36 805,000 USD 688,699.43 684,076.83 0.21Energizer 4.625% 18-15.07.26 Regs 1,100,000 EUR 1,100,000.00 1,150,875.00 0.35Energy Pro 4% 17-07.12.22 1,250,000 EUR 1,250,000.00 1,248,825.00 0.38Energy Pro 4.5% 18-04.05.24 520,000 EUR 453,881.39 501,737.60 0.15Ent One 4.625% 19-15.07.26 1,200,000 GBP 1,347,558.00 1,378,323.48 0.41Eskom Hldgs 5.75% 11-26.01.21 1,130,000 USD 933,644.10 1,000,107.05 0.30Eskom Hold Soc 6.75% 13-06.08.23 1,500,000 USD 1,322,230.83 1,378,530.16 0.41Eskom Holdi 6.35% 18-10.08.28 775,000 USD 667,355.55 736,310.56 0.22Eurochem Fi 5.5% 19-13.03.24 Regs 1,350,000 USD 1,192,579.51 1,243,140.31 0.37Everi Py 7.5% 17-15.12.25 144a 625,000 USD 531,914.90 573,470.01 0.17Evraz 5.25% 19-02.04.24 Regs 1,060,000 USD 939,549.73 968,854.33 0.29Exp Cred Bk 5% 14-23.09.21 660,000 USD 513,713.95 563,570.11 0.17Extrctn 5.625% 18-01.02.26 144a 2,375,000 USD 1,940,200.96 1,683,916.50 0.51Ferrellgas 8.625% 17-15.06.20* 1,800,000 USD 1,608,997.28 1,161,647.20 0.35Fgp 6.75% 14-15.01.22* 2,611,000 USD 1,949,331.72 2,028,918.25 0.61Financi 6.875% 18-15.11.26 Regs 1,825,000 EUR 1,792,187.50 1,853,689.00 0.56Financia 8.25% 18-15.11.26 144a 900,000 USD 750,792.39 812,757.92 0.24Financial 4.5% 18-15.05.26 925,000 EUR 925,000.00 945,708.90 0.28First Quan 6.5% 18-01.03.24 144a 2,735,000 USD 2,154,347.78 2,245,346.39 0.68First Quan 7.5% 17-01.04.25 144a 465,000 USD 397,285.35 388,894.99 0.12
Pramerica Sicav
The accompanying notes form an integral part of these financial statements.
123
High Yield Bond
Statement of Investmentsas at June 30, 2019 (continued)
(expressed in EUR)
* Securities partially or totally lent (see Note 9).
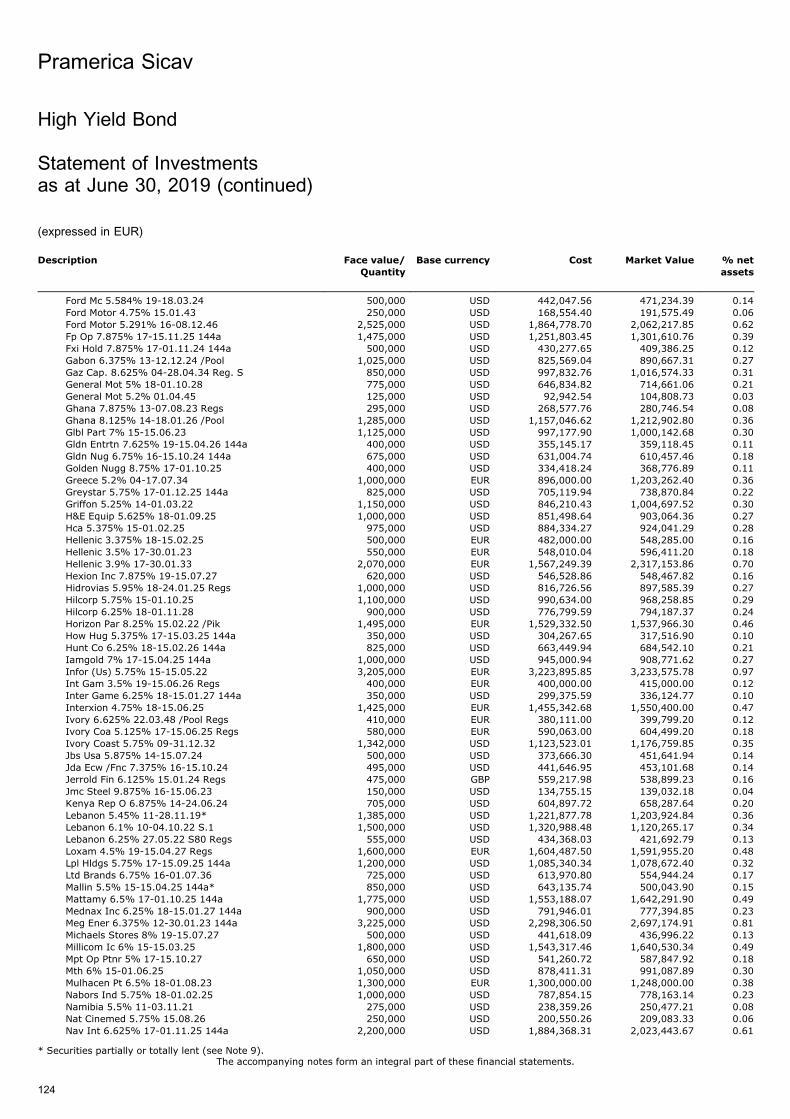
Description Face value/
Quantity
Base currency Cost Market Value % net
assets
Ford Mc 5.584% 19-18.03.24 500,000 USD 442,047.56 471,234.39 0.14Ford Motor 4.75% 15.01.43 250,000 USD 168,554.40 191,575.49 0.06Ford Motor 5.291% 16-08.12.46 2,525,000 USD 1,864,778.70 2,062,217.85 0.62Fp Op 7.875% 17-15.11.25 144a 1,475,000 USD 1,251,803.45 1,301,610.76 0.39Fxi Hold 7.875% 17-01.11.24 144a 500,000 USD 430,277.65 409,386.25 0.12Gabon 6.375% 13-12.12.24 /Pool 1,025,000 USD 825,569.04 890,667.31 0.27Gaz Cap. 8.625% 04-28.04.34 Reg. S 850,000 USD 997,832.76 1,016,574.33 0.31General Mot 5% 18-01.10.28 775,000 USD 646,834.82 714,661.06 0.21General Mot 5.2% 01.04.45 125,000 USD 92,942.54 104,808.73 0.03Ghana 7.875% 13-07.08.23 Regs 295,000 USD 268,577.76 280,746.54 0.08Ghana 8.125% 14-18.01.26 /Pool 1,285,000 USD 1,157,046.62 1,212,902.80 0.36Glbl Part 7% 15-15.06.23 1,125,000 USD 997,177.90 1,000,142.68 0.30Gldn Entrtn 7.625% 19-15.04.26 144a 400,000 USD 355,145.17 359,118.45 0.11Gldn Nug 6.75% 16-15.10.24 144a 675,000 USD 631,004.74 610,457.46 0.18Golden Nugg 8.75% 17-01.10.25 400,000 USD 334,418.24 368,776.89 0.11Greece 5.2% 04-17.07.34 1,000,000 EUR 896,000.00 1,203,262.40 0.36Greystar 5.75% 17-01.12.25 144a 825,000 USD 705,119.94 738,870.84 0.22Griffon 5.25% 14-01.03.22 1,150,000 USD 846,210.43 1,004,697.52 0.30H&E Equip 5.625% 18-01.09.25 1,000,000 USD 851,498.64 903,064.36 0.27Hca 5.375% 15-01.02.25 975,000 USD 884,334.27 924,041.29 0.28Hellenic 3.375% 18-15.02.25 500,000 EUR 482,000.00 548,285.00 0.16Hellenic 3.5% 17-30.01.23 550,000 EUR 548,010.04 596,411.20 0.18Hellenic 3.9% 17-30.01.33 2,070,000 EUR 1,567,249.39 2,317,153.86 0.70Hexion Inc 7.875% 19-15.07.27 620,000 USD 546,528.86 548,467.82 0.16Hidrovias 5.95% 18-24.01.25 Regs 1,000,000 USD 816,726.56 897,585.39 0.27Hilcorp 5.75% 15-01.10.25 1,100,000 USD 990,634.00 968,258.85 0.29Hilcorp 6.25% 18-01.11.28 900,000 USD 776,799.59 794,187.37 0.24Horizon Par 8.25% 15.02.22 /Pik 1,495,000 EUR 1,529,332.50 1,537,966.30 0.46How Hug 5.375% 17-15.03.25 144a 350,000 USD 304,267.65 317,516.90 0.10Hunt Co 6.25% 18-15.02.26 144a 825,000 USD 663,449.94 684,542.10 0.21Iamgold 7% 17-15.04.25 144a 1,000,000 USD 945,000.94 908,771.62 0.27Infor (Us) 5.75% 15-15.05.22 3,205,000 EUR 3,223,895.85 3,233,575.78 0.97Int Gam 3.5% 19-15.06.26 Regs 400,000 EUR 400,000.00 415,000.00 0.12Inter Game 6.25% 18-15.01.27 144a 350,000 USD 299,375.59 336,124.77 0.10Interxion 4.75% 18-15.06.25 1,425,000 EUR 1,455,342.68 1,550,400.00 0.47Ivory 6.625% 22.03.48 /Pool Regs 410,000 EUR 380,111.00 399,799.20 0.12Ivory Coa 5.125% 17-15.06.25 Regs 580,000 EUR 590,063.00 604,499.20 0.18Ivory Coast 5.75% 09-31.12.32 1,342,000 USD 1,123,523.01 1,176,759.85 0.35Jbs Usa 5.875% 14-15.07.24 500,000 USD 373,666.30 451,641.94 0.14Jda Ecw /Fnc 7.375% 16-15.10.24 495,000 USD 441,646.95 453,101.68 0.14Jerrold Fin 6.125% 15.01.24 Regs 475,000 GBP 559,217.98 538,899.23 0.16Jmc Steel 9.875% 16-15.06.23 150,000 USD 134,755.15 139,032.18 0.04Kenya Rep O 6.875% 14-24.06.24 705,000 USD 604,897.72 658,287.64 0.20Lebanon 5.45% 11-28.11.19* 1,385,000 USD 1,221,877.78 1,203,924.84 0.36Lebanon 6.1% 10-04.10.22 S.1 1,500,000 USD 1,320,988.48 1,120,265.17 0.34Lebanon 6.25% 27.05.22 S80 Regs 555,000 USD 434,368.03 421,692.79 0.13Loxam 4.5% 19-15.04.27 Regs 1,600,000 EUR 1,604,487.50 1,591,955.20 0.48Lpl Hldgs 5.75% 17-15.09.25 144a 1,200,000 USD 1,085,340.34 1,078,672.40 0.32Ltd Brands 6.75% 16-01.07.36 725,000 USD 613,970.80 554,944.24 0.17Mallin 5.5% 15-15.04.25 144a* 850,000 USD 643,135.74 500,043.90 0.15Mattamy 6.5% 17-01.10.25 144a 1,775,000 USD 1,553,188.07 1,642,291.90 0.49Mednax Inc 6.25% 18-15.01.27 144a 900,000 USD 791,946.01 777,394.85 0.23Meg Ener 6.375% 12-30.01.23 144a 3,225,000 USD 2,298,306.50 2,697,174.91 0.81Michaels Stores 8% 19-15.07.27 500,000 USD 441,618.09 436,996.22 0.13Millicom Ic 6% 15-15.03.25 1,800,000 USD 1,543,317.46 1,640,530.34 0.49Mpt Op Ptnr 5% 17-15.10.27 650,000 USD 541,260.72 587,847.92 0.18Mth 6% 15-01.06.25 1,050,000 USD 878,411.31 991,087.89 0.30Mulhacen Pt 6.5% 18-01.08.23 1,300,000 EUR 1,300,000.00 1,248,000.00 0.38Nabors Ind 5.75% 18-01.02.25 1,000,000 USD 787,854.15 778,163.14 0.23Namibia 5.5% 11-03.11.21 275,000 USD 238,359.26 250,477.21 0.08Nat Cinemed 5.75% 15.08.26 250,000 USD 200,550.26 209,083.33 0.06Nav Int 6.625% 17-01.11.25 144a 2,200,000 USD 1,884,368.31 2,023,443.67 0.61
Pramerica Sicav
The accompanying notes form an integral part of these financial statements.
124
High Yield Bond
Statement of Investmentsas at June 30, 2019 (continued)
(expressed in EUR)
* Securities partially or totally lent (see Note 9).
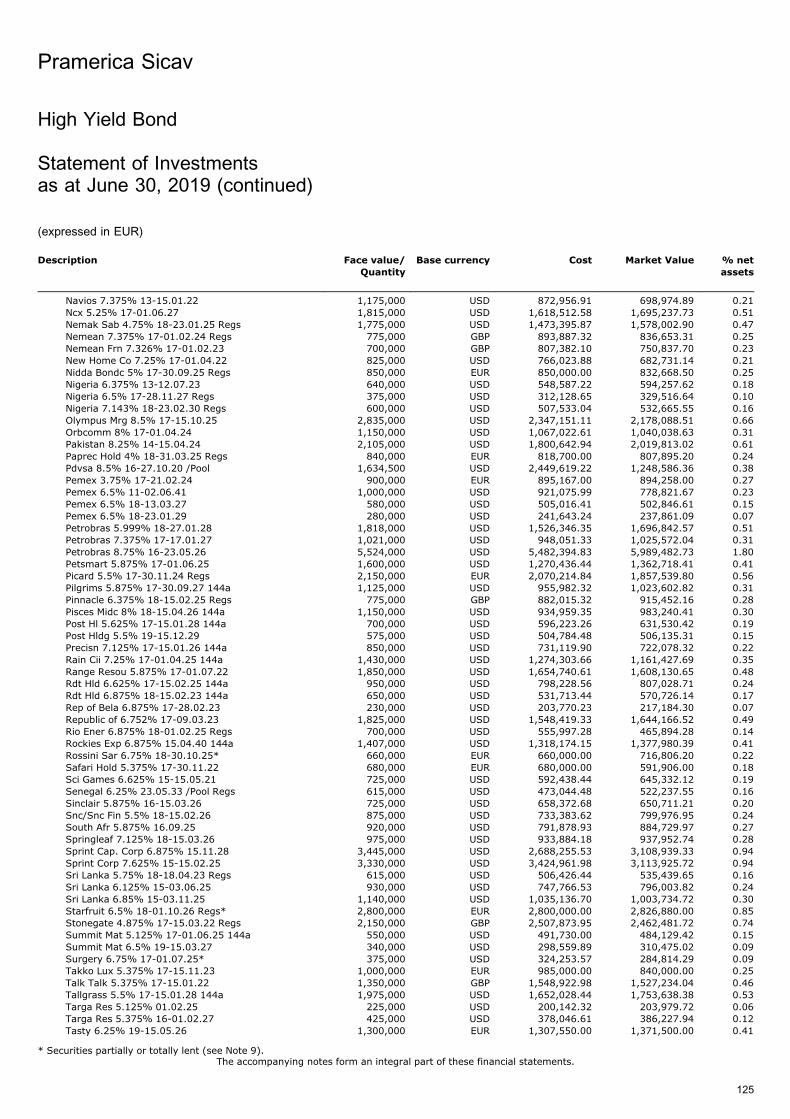
Description Face value/
Quantity
Base currency Cost Market Value % net
assets
Navios 7.375% 13-15.01.22 1,175,000 USD 872,956.91 698,974.89 0.21Ncx 5.25% 17-01.06.27 1,815,000 USD 1,618,512.58 1,695,237.73 0.51Nemak Sab 4.75% 18-23.01.25 Regs 1,775,000 USD 1,473,395.87 1,578,002.90 0.47Nemean 7.375% 17-01.02.24 Regs 775,000 GBP 893,887.32 836,653.31 0.25Nemean Frn 7.326% 17-01.02.23 700,000 GBP 807,382.10 750,837.70 0.23New Home Co 7.25% 17-01.04.22 825,000 USD 766,023.88 682,731.14 0.21Nidda Bondc 5% 17-30.09.25 Regs 850,000 EUR 850,000.00 832,668.50 0.25Nigeria 6.375% 13-12.07.23 640,000 USD 548,587.22 594,257.62 0.18Nigeria 6.5% 17-28.11.27 Regs 375,000 USD 312,128.65 329,516.64 0.10Nigeria 7.143% 18-23.02.30 Regs 600,000 USD 507,533.04 532,665.55 0.16Olympus Mrg 8.5% 17-15.10.25 2,835,000 USD 2,347,151.11 2,178,088.51 0.66Orbcomm 8% 17-01.04.24 1,150,000 USD 1,067,022.61 1,040,038.63 0.31Pakistan 8.25% 14-15.04.24 2,105,000 USD 1,800,642.94 2,019,813.02 0.61Paprec Hold 4% 18-31.03.25 Regs 840,000 EUR 818,700.00 807,895.20 0.24Pdvsa 8.5% 16-27.10.20 /Pool 1,634,500 USD 2,449,619.22 1,248,586.36 0.38Pemex 3.75% 17-21.02.24 900,000 EUR 895,167.00 894,258.00 0.27Pemex 6.5% 11-02.06.41 1,000,000 USD 921,075.99 778,821.67 0.23Pemex 6.5% 18-13.03.27 580,000 USD 505,016.41 502,846.61 0.15Pemex 6.5% 18-23.01.29 280,000 USD 241,643.24 237,861.09 0.07Petrobras 5.999% 18-27.01.28 1,818,000 USD 1,526,346.35 1,696,842.57 0.51Petrobras 7.375% 17-17.01.27 1,021,000 USD 948,051.33 1,025,572.04 0.31Petrobras 8.75% 16-23.05.26 5,524,000 USD 5,482,394.83 5,989,482.73 1.80Petsmart 5.875% 17-01.06.25 1,600,000 USD 1,270,436.44 1,362,718.41 0.41Picard 5.5% 17-30.11.24 Regs 2,150,000 EUR 2,070,214.84 1,857,539.80 0.56Pilgrims 5.875% 17-30.09.27 144a 1,125,000 USD 955,982.32 1,023,602.82 0.31Pinnacle 6.375% 18-15.02.25 Regs 775,000 GBP 882,015.32 915,452.16 0.28Pisces Midc 8% 18-15.04.26 144a 1,150,000 USD 934,959.35 983,240.41 0.30Post Hl 5.625% 17-15.01.28 144a 700,000 USD 596,223.26 631,530.42 0.19Post Hldg 5.5% 19-15.12.29 575,000 USD 504,784.48 506,135.31 0.15Precisn 7.125% 17-15.01.26 144a 850,000 USD 731,119.90 722,078.32 0.22Rain Cii 7.25% 17-01.04.25 144a 1,430,000 USD 1,274,303.66 1,161,427.69 0.35Range Resou 5.875% 17-01.07.22 1,850,000 USD 1,654,740.61 1,608,130.65 0.48Rdt Hld 6.625% 17-15.02.25 144a 950,000 USD 798,228.56 807,028.71 0.24Rdt Hld 6.875% 18-15.02.23 144a 650,000 USD 531,713.44 570,726.14 0.17Rep of Bela 6.875% 17-28.02.23 230,000 USD 203,770.23 217,184.30 0.07Republic of 6.752% 17-09.03.23 1,825,000 USD 1,548,419.33 1,644,166.52 0.49Rio Ener 6.875% 18-01.02.25 Regs 700,000 USD 555,997.28 465,894.28 0.14Rockies Exp 6.875% 15.04.40 144a 1,407,000 USD 1,318,174.15 1,377,980.39 0.41Rossini Sar 6.75% 18-30.10.25* 660,000 EUR 660,000.00 716,806.20 0.22Safari Hold 5.375% 17-30.11.22 680,000 EUR 680,000.00 591,906.00 0.18Sci Games 6.625% 15-15.05.21 725,000 USD 592,438.44 645,332.12 0.19Senegal 6.25% 23.05.33 /Pool Regs 615,000 USD 473,044.48 522,237.55 0.16Sinclair 5.875% 16-15.03.26 725,000 USD 658,372.68 650,711.21 0.20Snc/Snc Fin 5.5% 18-15.02.26 875,000 USD 733,383.62 799,976.95 0.24South Afr 5.875% 16.09.25 920,000 USD 791,878.93 884,729.97 0.27Springleaf 7.125% 18-15.03.26 975,000 USD 933,884.18 937,952.74 0.28Sprint Cap. Corp 6.875% 15.11.28 3,445,000 USD 2,688,255.53 3,108,939.33 0.94Sprint Corp 7.625% 15-15.02.25 3,330,000 USD 3,424,961.98 3,113,925.72 0.94Sri Lanka 5.75% 18-18.04.23 Regs 615,000 USD 506,426.44 535,439.65 0.16Sri Lanka 6.125% 15-03.06.25 930,000 USD 747,766.53 796,003.82 0.24Sri Lanka 6.85% 15-03.11.25 1,140,000 USD 1,035,136.70 1,003,734.72 0.30Starfruit 6.5% 18-01.10.26 Regs* 2,800,000 EUR 2,800,000.00 2,826,880.00 0.85Stonegate 4.875% 17-15.03.22 Regs 2,150,000 GBP 2,507,873.95 2,462,481.72 0.74Summit Mat 5.125% 17-01.06.25 144a 550,000 USD 491,730.00 484,129.42 0.15Summit Mat 6.5% 19-15.03.27 340,000 USD 298,559.89 310,475.02 0.09Surgery 6.75% 17-01.07.25* 375,000 USD 324,253.57 284,814.29 0.09Takko Lux 5.375% 17-15.11.23 1,000,000 EUR 985,000.00 840,000.00 0.25Talk Talk 5.375% 17-15.01.22 1,350,000 GBP 1,548,922.98 1,527,234.04 0.46Tallgrass 5.5% 17-15.01.28 144a 1,975,000 USD 1,652,028.44 1,753,638.38 0.53Targa Res 5.125% 01.02.25 225,000 USD 200,142.32 203,979.72 0.06Targa Res 5.375% 16-01.02.27 425,000 USD 378,046.61 386,227.94 0.12Tasty 6.25% 19-15.05.26 1,300,000 EUR 1,307,550.00 1,371,500.00 0.41
Pramerica Sicav
The accompanying notes form an integral part of these financial statements.
125
High Yield Bond
Statement of Investmentsas at June 30, 2019 (continued)
(expressed in EUR)
* Securities partially or totally lent (see Note 9).
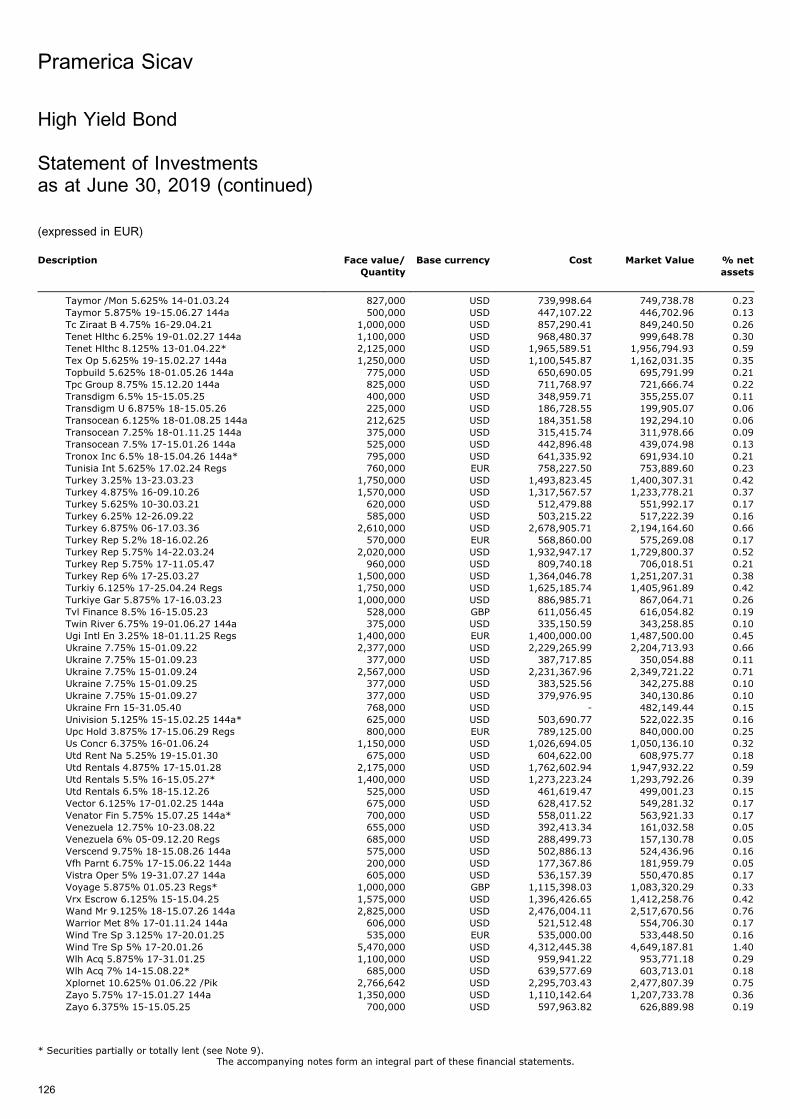
Description Face value/
Quantity
Base currency Cost Market Value % net
assets
Taymor /Mon 5.625% 14-01.03.24 827,000 USD 739,998.64 749,738.78 0.23Taymor 5.875% 19-15.06.27 144a 500,000 USD 447,107.22 446,702.96 0.13Tc Ziraat B 4.75% 16-29.04.21 1,000,000 USD 857,290.41 849,240.50 0.26Tenet Hlthc 6.25% 19-01.02.27 144a 1,100,000 USD 968,480.37 999,648.78 0.30Tenet Hlthc 8.125% 13-01.04.22* 2,125,000 USD 1,965,589.51 1,956,794.93 0.59Tex Op 5.625% 19-15.02.27 144a 1,250,000 USD 1,100,545.87 1,162,031.35 0.35Topbuild 5.625% 18-01.05.26 144a 775,000 USD 650,690.05 695,791.99 0.21Tpc Group 8.75% 15.12.20 144a 825,000 USD 711,768.97 721,666.74 0.22Transdigm 6.5% 15-15.05.25 400,000 USD 348,959.71 355,255.07 0.11Transdigm U 6.875% 18-15.05.26 225,000 USD 186,728.55 199,905.07 0.06Transocean 6.125% 18-01.08.25 144a 212,625 USD 184,351.58 192,294.10 0.06Transocean 7.25% 18-01.11.25 144a 375,000 USD 315,415.74 311,978.66 0.09Transocean 7.5% 17-15.01.26 144a 525,000 USD 442,896.48 439,074.98 0.13Tronox Inc 6.5% 18-15.04.26 144a* 795,000 USD 641,335.92 691,934.10 0.21Tunisia Int 5.625% 17.02.24 Regs 760,000 EUR 758,227.50 753,889.60 0.23Turkey 3.25% 13-23.03.23 1,750,000 USD 1,493,823.45 1,400,307.31 0.42Turkey 4.875% 16-09.10.26 1,570,000 USD 1,317,567.57 1,233,778.21 0.37Turkey 5.625% 10-30.03.21 620,000 USD 512,479.88 551,992.17 0.17Turkey 6.25% 12-26.09.22 585,000 USD 503,215.22 517,222.39 0.16Turkey 6.875% 06-17.03.36 2,610,000 USD 2,678,905.71 2,194,164.60 0.66Turkey Rep 5.2% 18-16.02.26 570,000 EUR 568,860.00 575,269.08 0.17Turkey Rep 5.75% 14-22.03.24 2,020,000 USD 1,932,947.17 1,729,800.37 0.52Turkey Rep 5.75% 17-11.05.47 960,000 USD 809,740.18 706,018.51 0.21Turkey Rep 6% 17-25.03.27 1,500,000 USD 1,364,046.78 1,251,207.31 0.38Turkiy 6.125% 17-25.04.24 Regs 1,750,000 USD 1,625,185.74 1,405,961.89 0.42Turkiye Gar 5.875% 17-16.03.23 1,000,000 USD 886,985.71 867,064.71 0.26Tvl Finance 8.5% 16-15.05.23 528,000 GBP 611,056.45 616,054.82 0.19Twin River 6.75% 19-01.06.27 144a 375,000 USD 335,150.59 343,258.85 0.10Ugi Intl En 3.25% 18-01.11.25 Regs 1,400,000 EUR 1,400,000.00 1,487,500.00 0.45Ukraine 7.75% 15-01.09.22 2,377,000 USD 2,229,265.99 2,204,713.93 0.66Ukraine 7.75% 15-01.09.23 377,000 USD 387,717.85 350,054.88 0.11Ukraine 7.75% 15-01.09.24 2,567,000 USD 2,231,367.96 2,349,721.22 0.71Ukraine 7.75% 15-01.09.25 377,000 USD 383,525.56 342,275.88 0.10Ukraine 7.75% 15-01.09.27 377,000 USD 379,976.95 340,130.86 0.10Ukraine Frn 15-31.05.40 768,000 USD - 482,149.44 0.15Univision 5.125% 15-15.02.25 144a* 625,000 USD 503,690.77 522,022.35 0.16Upc Hold 3.875% 17-15.06.29 Regs 800,000 EUR 789,125.00 840,000.00 0.25Us Concr 6.375% 16-01.06.24 1,150,000 USD 1,026,694.05 1,050,136.10 0.32Utd Rent Na 5.25% 19-15.01.30 675,000 USD 604,622.00 608,975.77 0.18Utd Rentals 4.875% 17-15.01.28 2,175,000 USD 1,762,602.94 1,947,932.22 0.59Utd Rentals 5.5% 16-15.05.27* 1,400,000 USD 1,273,223.24 1,293,792.26 0.39Utd Rentals 6.5% 18-15.12.26 525,000 USD 461,619.47 499,001.23 0.15Vector 6.125% 17-01.02.25 144a 675,000 USD 628,417.52 549,281.32 0.17Venator Fin 5.75% 15.07.25 144a* 700,000 USD 558,011.22 563,921.33 0.17Venezuela 12.75% 10-23.08.22 655,000 USD 392,413.34 161,032.58 0.05Venezuela 6% 05-09.12.20 Regs 685,000 USD 288,499.73 157,130.78 0.05Verscend 9.75% 18-15.08.26 144a 575,000 USD 502,886.13 524,436.96 0.16Vfh Parnt 6.75% 17-15.06.22 144a 200,000 USD 177,367.86 181,959.79 0.05Vistra Oper 5% 19-31.07.27 144a 605,000 USD 536,157.39 550,470.85 0.17Voyage 5.875% 01.05.23 Regs* 1,000,000 GBP 1,115,398.03 1,083,320.29 0.33Vrx Escrow 6.125% 15-15.04.25 1,575,000 USD 1,396,426.65 1,412,258.76 0.42Wand Mr 9.125% 18-15.07.26 144a 2,825,000 USD 2,476,004.11 2,517,670.56 0.76Warrior Met 8% 17-01.11.24 144a 606,000 USD 521,512.48 554,706.30 0.17Wind Tre Sp 3.125% 17-20.01.25 535,000 EUR 535,000.00 533,448.50 0.16Wind Tre Sp 5% 17-20.01.26 5,470,000 USD 4,312,445.38 4,649,187.81 1.40Wlh Acq 5.875% 17-31.01.25 1,100,000 USD 959,941.22 953,771.18 0.29Wlh Acq 7% 14-15.08.22* 685,000 USD 639,577.69 603,713.01 0.18Xplornet 10.625% 01.06.22 /Pik 2,766,642 USD 2,295,703.43 2,477,807.39 0.75Zayo 5.75% 17-15.01.27 144a 1,350,000 USD 1,110,142.64 1,207,733.78 0.36Zayo 6.375% 15-15.05.25 700,000 USD 597,963.82 626,889.98 0.19
Pramerica Sicav
The accompanying notes form an integral part of these financial statements.
126
High Yield Bond
Statement of Investmentsas at June 30, 2019 (continued)
(expressed in EUR)
* Securities partially or totally lent (see Note 9).
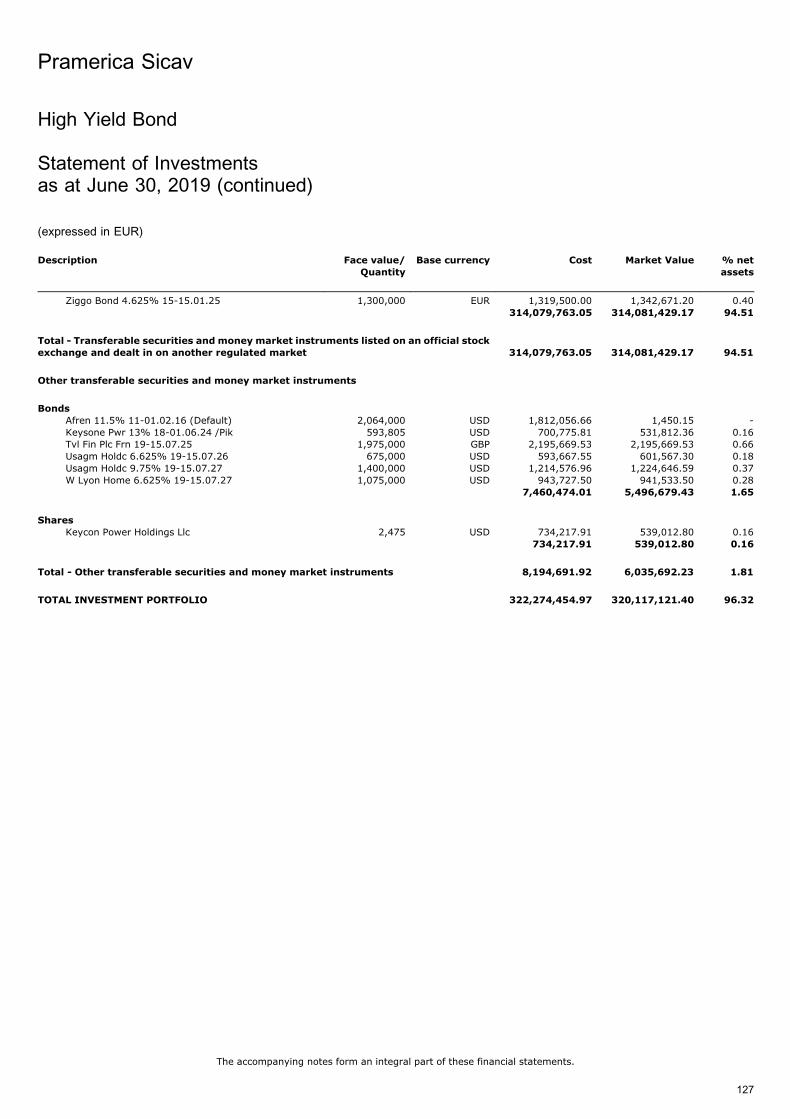
Description Face value/
Quantity
Base currency Cost Market Value % net
assets
Ziggo Bond 4.625% 15-15.01.25 1,300,000 EUR 1,319,500.00 1,342,671.20 0.40314,079,763.05 314,081,429.17 94.51
Total - Transferable securities and money market instruments listed on an official stockexchange and dealt in on another regulated market 314,079,763.05 314,081,429.17 94.51
Other transferable securities and money market instruments
Bonds
Afren 11.5% 11-01.02.16 (Default) 2,064,000 USD 1,812,056.66 1,450.15 -Keysone Pwr 13% 18-01.06.24 /Pik 593,805 USD 700,775.81 531,812.36 0.16Tvl Fin Plc Frn 19-15.07.25 1,975,000 GBP 2,195,669.53 2,195,669.53 0.66Usagm Holdc 6.625% 19-15.07.26 675,000 USD 593,667.55 601,567.30 0.18Usagm Holdc 9.75% 19-15.07.27 1,400,000 USD 1,214,576.96 1,224,646.59 0.37W Lyon Home 6.625% 19-15.07.27 1,075,000 USD 943,727.50 941,533.50 0.28
7,460,474.01 5,496,679.43 1.65
Shares
Keycon Power Holdings Llc 2,475 USD 734,217.91 539,012.80 0.16734,217.91 539,012.80 0.16
Total - Other transferable securities and money market instruments 8,194,691.92 6,035,692.23 1.81
TOTAL INVESTMENT PORTFOLIO 322,274,454.97 320,117,121.40 96.32
Pramerica Sicav
The accompanying notes form an integral part of these financial statements.
127
High Yield Bond
Statement of Investmentsas at June 30, 2019 (continued)
(expressed in EUR)
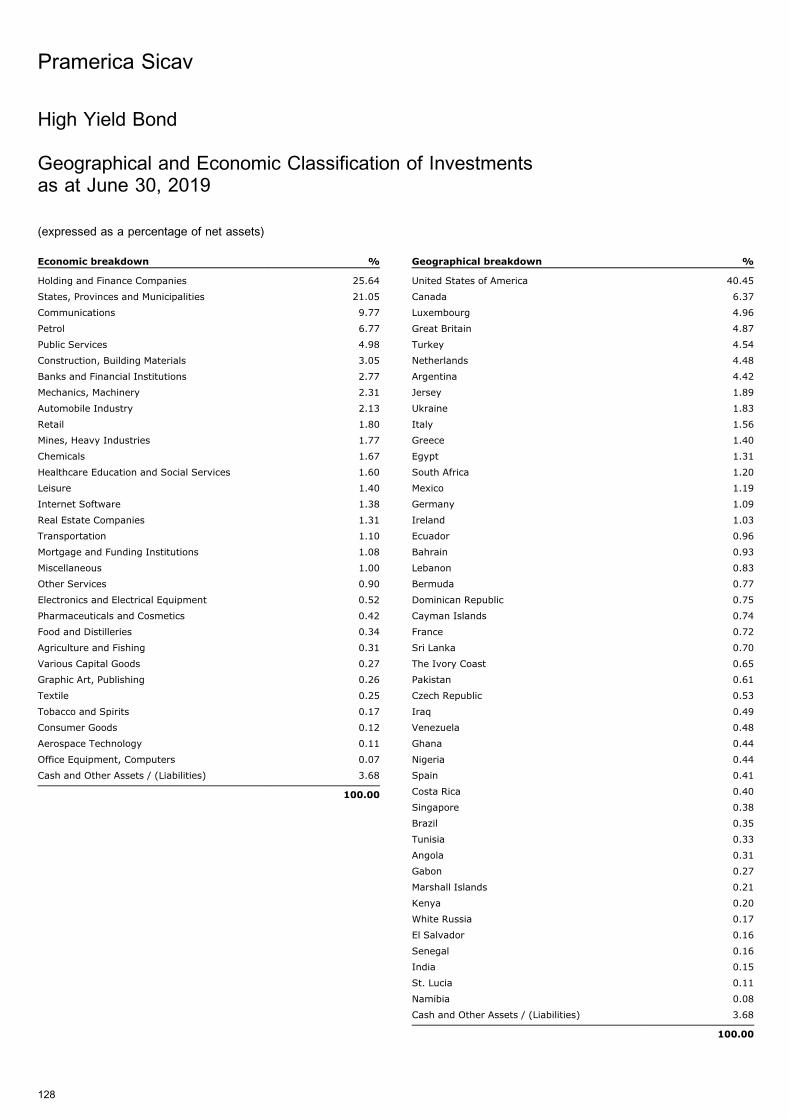
High Yield Bond
Geographical and Economic Classification of Investmentsas at June 30, 2019
(expressed as a percentage of net assets)
Economic breakdown %
Holding and Finance Companies 25.64
States, Provinces and Municipalities 21.05
Communications 9.77
Petrol 6.77
Public Services 4.98
Construction, Building Materials 3.05
Banks and Financial Institutions 2.77
Mechanics, Machinery 2.31
Automobile Industry 2.13
Retail 1.80
Mines, Heavy Industries 1.77
Chemicals 1.67
Healthcare Education and Social Services 1.60
Leisure 1.40
Internet Software 1.38
Real Estate Companies 1.31
Transportation 1.10
Mortgage and Funding Institutions 1.08
Miscellaneous 1.00
Other Services 0.90
Electronics and Electrical Equipment 0.52
Pharmaceuticals and Cosmetics 0.42
Food and Distilleries 0.34
Agriculture and Fishing 0.31
Various Capital Goods 0.27
Graphic Art, Publishing 0.26
Textile 0.25
Tobacco and Spirits 0.17
Consumer Goods 0.12
Aerospace Technology 0.11
Office Equipment, Computers 0.07
Cash and Other Assets / (Liabilities) 3.68
100.00
Geographical breakdown %
United States of America 40.45
Canada 6.37
Luxembourg 4.96
Great Britain 4.87
Turkey 4.54
Netherlands 4.48
Argentina 4.42
Jersey 1.89
Ukraine 1.83
Italy 1.56
Greece 1.40
Egypt 1.31
South Africa 1.20
Mexico 1.19
Germany 1.09
Ireland 1.03
Ecuador 0.96
Bahrain 0.93
Lebanon 0.83
Bermuda 0.77
Dominican Republic 0.75
Cayman Islands 0.74
France 0.72
Sri Lanka 0.70
The Ivory Coast 0.65
Pakistan 0.61
Czech Republic 0.53
Iraq 0.49
Venezuela 0.48
Ghana 0.44
Nigeria 0.44
Spain 0.41
Costa Rica 0.40
Singapore 0.38
Brazil 0.35
Tunisia 0.33
Angola 0.31
Gabon 0.27
Marshall Islands 0.21
Kenya 0.20
White Russia 0.17
El Salvador 0.16
Senegal 0.16
India 0.15
St. Lucia 0.11
Namibia 0.08
Cash and Other Assets / (Liabilities) 3.68
100.00
Pramerica Sicav
128
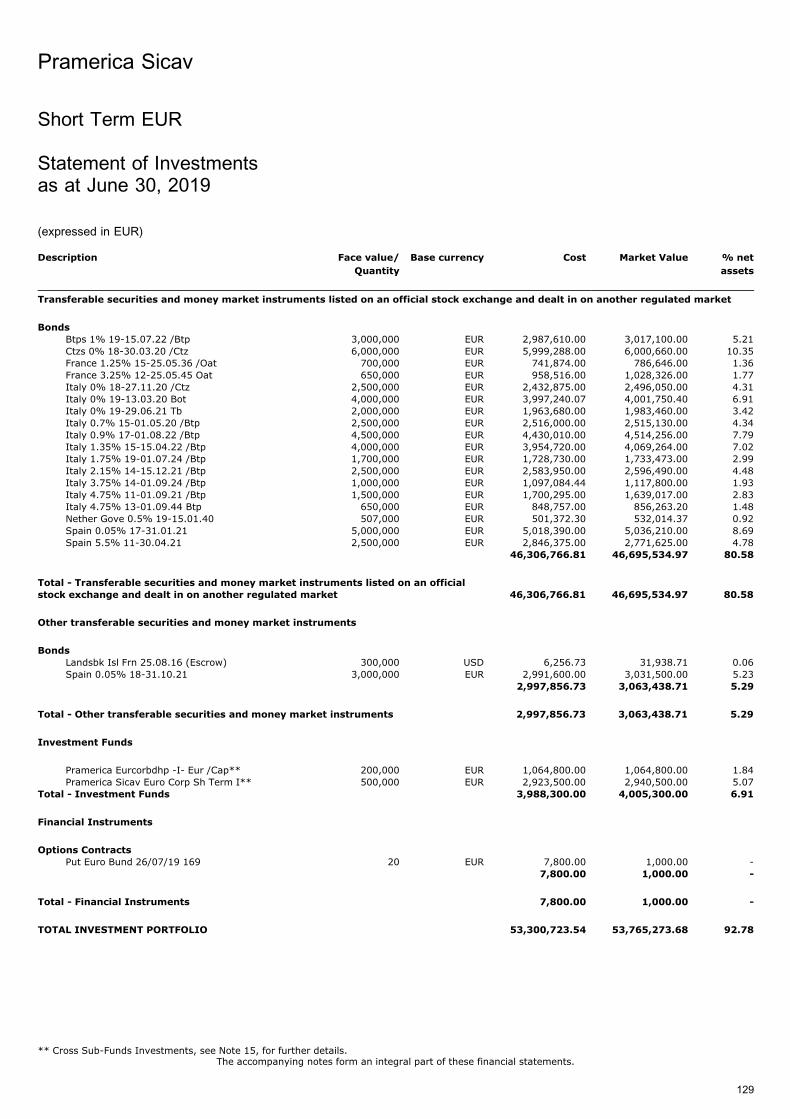
Short Term EUR
Statement of Investmentsas at June 30, 2019
(expressed in EUR)
Description Face value/
Quantity
Base currency Cost Market Value % net
assets
Transferable securities and money market instruments listed on an official stock exchange and dealt in on another regulated market
Bonds
Btps 1% 19-15.07.22 /Btp 3,000,000 EUR 2,987,610.00 3,017,100.00 5.21Ctzs 0% 18-30.03.20 /Ctz 6,000,000 EUR 5,999,288.00 6,000,660.00 10.35France 1.25% 15-25.05.36 /Oat 700,000 EUR 741,874.00 786,646.00 1.36France 3.25% 12-25.05.45 Oat 650,000 EUR 958,516.00 1,028,326.00 1.77Italy 0% 18-27.11.20 /Ctz 2,500,000 EUR 2,432,875.00 2,496,050.00 4.31Italy 0% 19-13.03.20 Bot 4,000,000 EUR 3,997,240.07 4,001,750.40 6.91Italy 0% 19-29.06.21 Tb 2,000,000 EUR 1,963,680.00 1,983,460.00 3.42Italy 0.7% 15-01.05.20 /Btp 2,500,000 EUR 2,516,000.00 2,515,130.00 4.34Italy 0.9% 17-01.08.22 /Btp 4,500,000 EUR 4,430,010.00 4,514,256.00 7.79Italy 1.35% 15-15.04.22 /Btp 4,000,000 EUR 3,954,720.00 4,069,264.00 7.02Italy 1.75% 19-01.07.24 /Btp 1,700,000 EUR 1,728,730.00 1,733,473.00 2.99Italy 2.15% 14-15.12.21 /Btp 2,500,000 EUR 2,583,950.00 2,596,490.00 4.48Italy 3.75% 14-01.09.24 /Btp 1,000,000 EUR 1,097,084.44 1,117,800.00 1.93Italy 4.75% 11-01.09.21 /Btp 1,500,000 EUR 1,700,295.00 1,639,017.00 2.83Italy 4.75% 13-01.09.44 Btp 650,000 EUR 848,757.00 856,263.20 1.48Nether Gove 0.5% 19-15.01.40 507,000 EUR 501,372.30 532,014.37 0.92Spain 0.05% 17-31.01.21 5,000,000 EUR 5,018,390.00 5,036,210.00 8.69Spain 5.5% 11-30.04.21 2,500,000 EUR 2,846,375.00 2,771,625.00 4.78
46,306,766.81 46,695,534.97 80.58
Total - Transferable securities and money market instruments listed on an official
stock exchange and dealt in on another regulated market 46,306,766.81 46,695,534.97 80.58
Other transferable securities and money market instruments
Bonds
Landsbk Isl Frn 25.08.16 (Escrow) 300,000 USD 6,256.73 31,938.71 0.06Spain 0.05% 18-31.10.21 3,000,000 EUR 2,991,600.00 3,031,500.00 5.23
2,997,856.73 3,063,438.71 5.29
Total - Other transferable securities and money market instruments 2,997,856.73 3,063,438.71 5.29
Investment Funds
Pramerica Eurcorbdhp -I- Eur /Cap** 200,000 EUR 1,064,800.00 1,064,800.00 1.84Pramerica Sicav Euro Corp Sh Term I** 500,000 EUR 2,923,500.00 2,940,500.00 5.07
Total - Investment Funds 3,988,300.00 4,005,300.00 6.91
Financial Instruments
Options Contracts
Put Euro Bund 26/07/19 169 20 EUR 7,800.00 1,000.00 -7,800.00 1,000.00 -
Total - Financial Instruments 7,800.00 1,000.00 -
TOTAL INVESTMENT PORTFOLIO 53,300,723.54 53,765,273.68 92.78
Pramerica Sicav
The accompanying notes form an integral part of these financial statements.
129
** Cross Sub-Funds Investments, see Note 15, for further details.
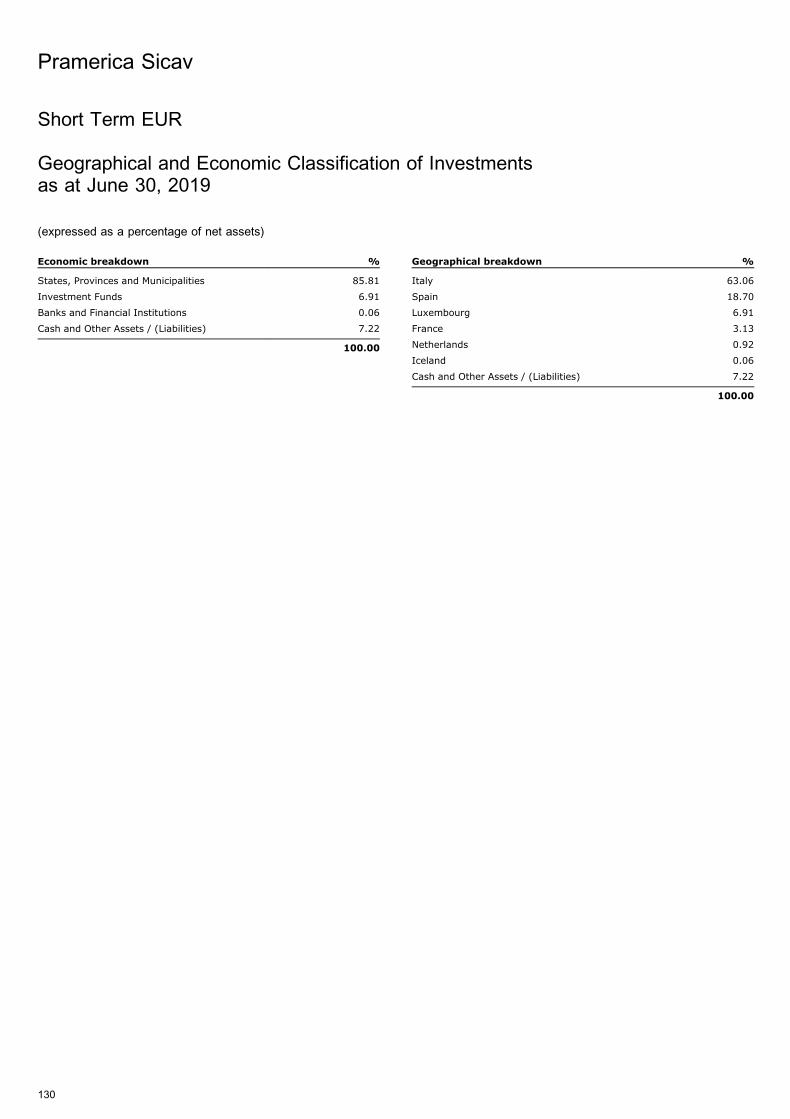
Short Term EUR
Geographical and Economic Classification of Investmentsas at June 30, 2019
(expressed as a percentage of net assets)
Economic breakdown %
States, Provinces and Municipalities 85.81
Investment Funds 6.91
Banks and Financial Institutions 0.06
Cash and Other Assets / (Liabilities) 7.22
100.00
Geographical breakdown %
Italy 63.06
Spain 18.70
Luxembourg 6.91
France 3.13
Netherlands 0.92
Iceland 0.06
Cash and Other Assets / (Liabilities) 7.22
100.00
Pramerica Sicav
130
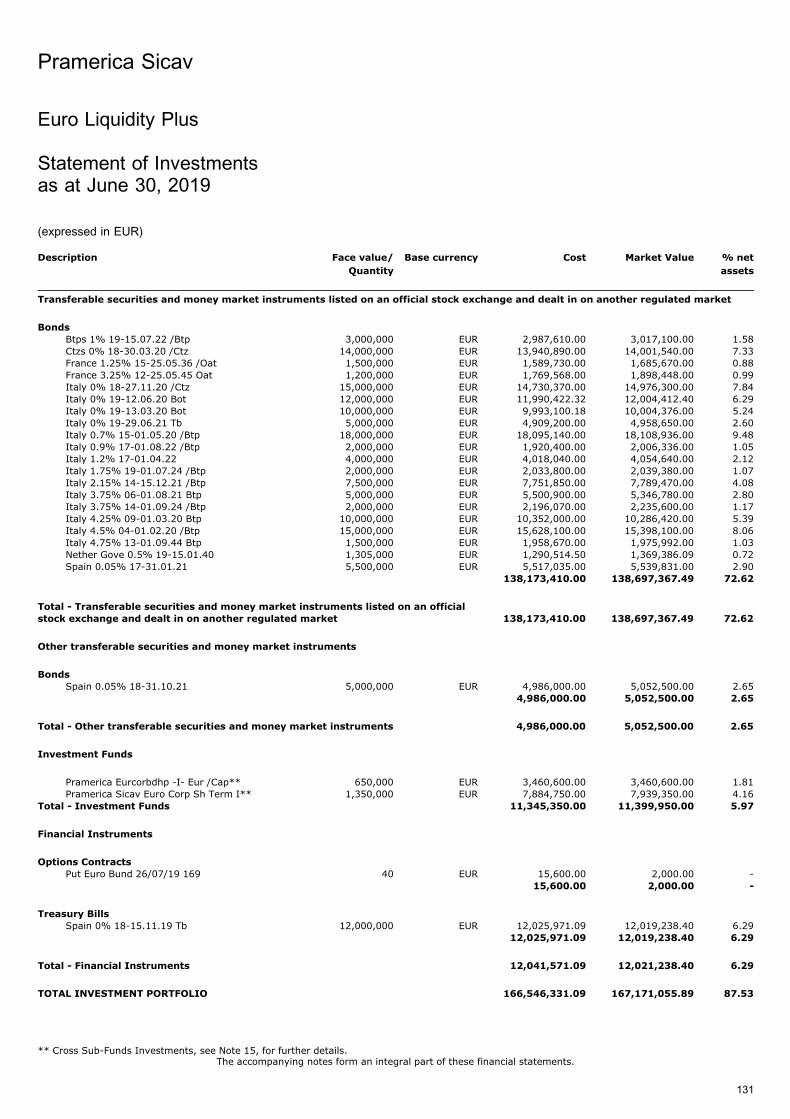
Euro Liquidity Plus
Statement of Investmentsas at June 30, 2019
(expressed in EUR)
Description Face value/
Quantity
Base currency Cost Market Value % net
assets
Transferable securities and money market instruments listed on an official stock exchange and dealt in on another regulated market
Bonds
Btps 1% 19-15.07.22 /Btp 3,000,000 EUR 2,987,610.00 3,017,100.00 1.58Ctzs 0% 18-30.03.20 /Ctz 14,000,000 EUR 13,940,890.00 14,001,540.00 7.33France 1.25% 15-25.05.36 /Oat 1,500,000 EUR 1,589,730.00 1,685,670.00 0.88France 3.25% 12-25.05.45 Oat 1,200,000 EUR 1,769,568.00 1,898,448.00 0.99Italy 0% 18-27.11.20 /Ctz 15,000,000 EUR 14,730,370.00 14,976,300.00 7.84Italy 0% 19-12.06.20 Bot 12,000,000 EUR 11,990,422.32 12,004,412.40 6.29Italy 0% 19-13.03.20 Bot 10,000,000 EUR 9,993,100.18 10,004,376.00 5.24Italy 0% 19-29.06.21 Tb 5,000,000 EUR 4,909,200.00 4,958,650.00 2.60Italy 0.7% 15-01.05.20 /Btp 18,000,000 EUR 18,095,140.00 18,108,936.00 9.48Italy 0.9% 17-01.08.22 /Btp 2,000,000 EUR 1,920,400.00 2,006,336.00 1.05Italy 1.2% 17-01.04.22 4,000,000 EUR 4,018,040.00 4,054,640.00 2.12Italy 1.75% 19-01.07.24 /Btp 2,000,000 EUR 2,033,800.00 2,039,380.00 1.07Italy 2.15% 14-15.12.21 /Btp 7,500,000 EUR 7,751,850.00 7,789,470.00 4.08Italy 3.75% 06-01.08.21 Btp 5,000,000 EUR 5,500,900.00 5,346,780.00 2.80Italy 3.75% 14-01.09.24 /Btp 2,000,000 EUR 2,196,070.00 2,235,600.00 1.17Italy 4.25% 09-01.03.20 Btp 10,000,000 EUR 10,352,000.00 10,286,420.00 5.39Italy 4.5% 04-01.02.20 /Btp 15,000,000 EUR 15,628,100.00 15,398,100.00 8.06Italy 4.75% 13-01.09.44 Btp 1,500,000 EUR 1,958,670.00 1,975,992.00 1.03Nether Gove 0.5% 19-15.01.40 1,305,000 EUR 1,290,514.50 1,369,386.09 0.72Spain 0.05% 17-31.01.21 5,500,000 EUR 5,517,035.00 5,539,831.00 2.90
138,173,410.00 138,697,367.49 72.62
Total - Transferable securities and money market instruments listed on an official
stock exchange and dealt in on another regulated market 138,173,410.00 138,697,367.49 72.62
Other transferable securities and money market instruments
Bonds
Spain 0.05% 18-31.10.21 5,000,000 EUR 4,986,000.00 5,052,500.00 2.654,986,000.00 5,052,500.00 2.65
Total - Other transferable securities and money market instruments 4,986,000.00 5,052,500.00 2.65
Investment Funds
Pramerica Eurcorbdhp -I- Eur /Cap** 650,000 EUR 3,460,600.00 3,460,600.00 1.81Pramerica Sicav Euro Corp Sh Term I** 1,350,000 EUR 7,884,750.00 7,939,350.00 4.16
Total - Investment Funds 11,345,350.00 11,399,950.00 5.97
Financial Instruments
Options Contracts
Put Euro Bund 26/07/19 169 40 EUR 15,600.00 2,000.00 -15,600.00 2,000.00 -
Treasury Bills
Spain 0% 18-15.11.19 Tb 12,000,000 EUR 12,025,971.09 12,019,238.40 6.2912,025,971.09 12,019,238.40 6.29
Total - Financial Instruments 12,041,571.09 12,021,238.40 6.29
TOTAL INVESTMENT PORTFOLIO 166,546,331.09 167,171,055.89 87.53
Pramerica Sicav
The accompanying notes form an integral part of these financial statements.
131
** Cross Sub-Funds Investments, see Note 15, for further details.
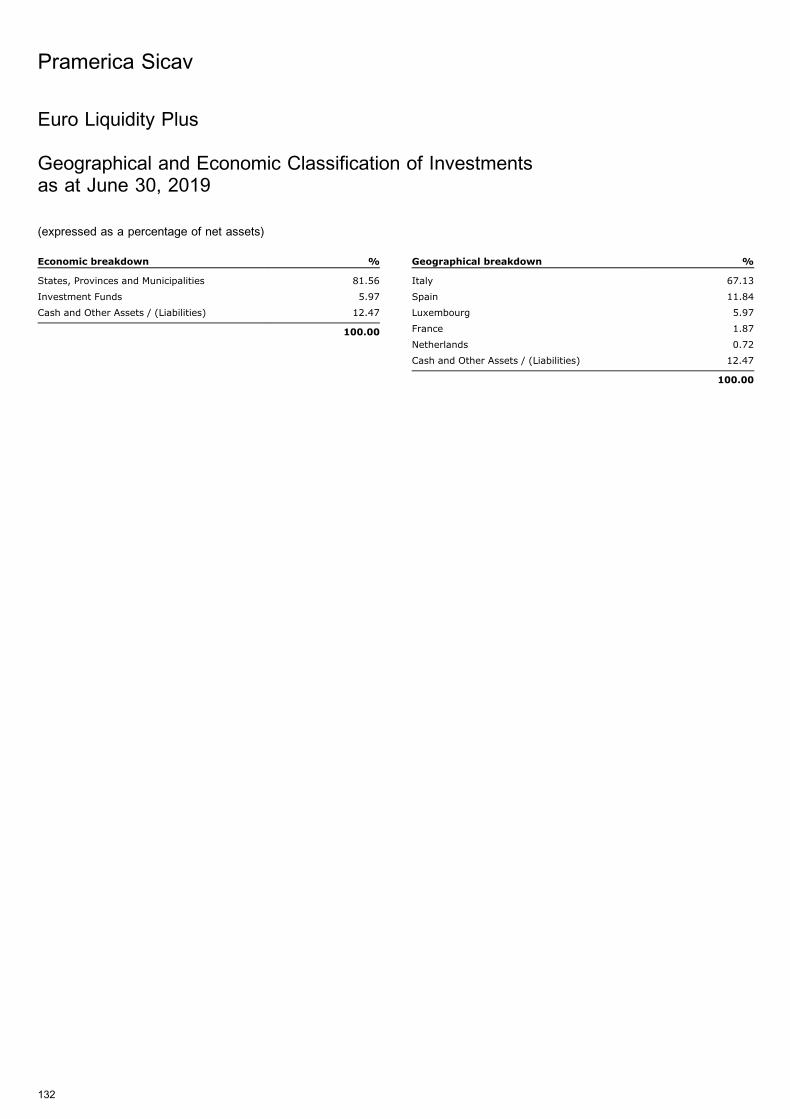
Euro Liquidity Plus
Geographical and Economic Classification of Investmentsas at June 30, 2019
(expressed as a percentage of net assets)
Economic breakdown %
States, Provinces and Municipalities 81.56
Investment Funds 5.97
Cash and Other Assets / (Liabilities) 12.47
100.00
Geographical breakdown %
Italy 67.13
Spain 11.84
Luxembourg 5.97
France 1.87
Netherlands 0.72
Cash and Other Assets / (Liabilities) 12.47
100.00
Pramerica Sicav
132
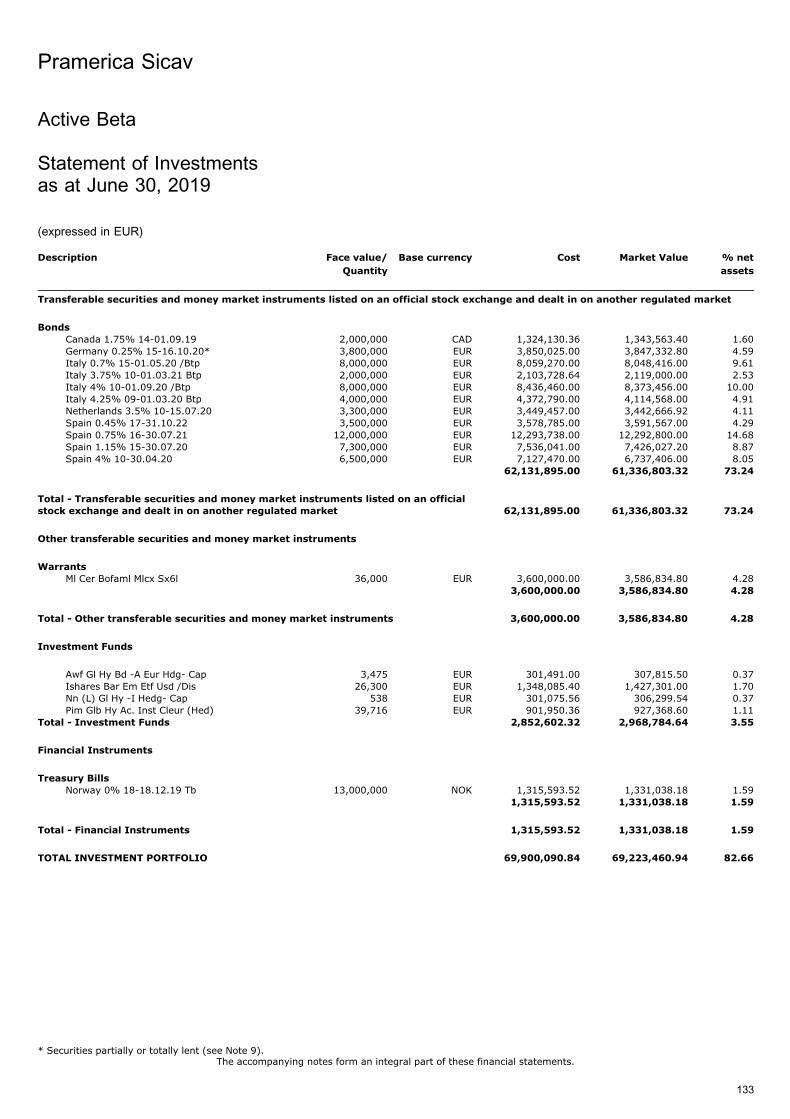
Active Beta
Statement of Investmentsas at June 30, 2019
(expressed in EUR)
Description Face value/
Quantity
Base currency Cost Market Value % net
assets
Transferable securities and money market instruments listed on an official stock exchange and dealt in on another regulated market
Bonds
Canada 1.75% 14-01.09.19 2,000,000 CAD 1,324,130.36 1,343,563.40 1.60Germany 0.25% 15-16.10.20* 3,800,000 EUR 3,850,025.00 3,847,332.80 4.59Italy 0.7% 15-01.05.20 /Btp 8,000,000 EUR 8,059,270.00 8,048,416.00 9.61Italy 3.75% 10-01.03.21 Btp 2,000,000 EUR 2,103,728.64 2,119,000.00 2.53Italy 4% 10-01.09.20 /Btp 8,000,000 EUR 8,436,460.00 8,373,456.00 10.00Italy 4.25% 09-01.03.20 Btp 4,000,000 EUR 4,372,790.00 4,114,568.00 4.91Netherlands 3.5% 10-15.07.20 3,300,000 EUR 3,449,457.00 3,442,666.92 4.11Spain 0.45% 17-31.10.22 3,500,000 EUR 3,578,785.00 3,591,567.00 4.29Spain 0.75% 16-30.07.21 12,000,000 EUR 12,293,738.00 12,292,800.00 14.68Spain 1.15% 15-30.07.20 7,300,000 EUR 7,536,041.00 7,426,027.20 8.87Spain 4% 10-30.04.20 6,500,000 EUR 7,127,470.00 6,737,406.00 8.05
62,131,895.00 61,336,803.32 73.24
Total - Transferable securities and money market instruments listed on an officialstock exchange and dealt in on another regulated market 62,131,895.00 61,336,803.32 73.24
Other transferable securities and money market instruments
Warrants
Ml Cer Bofaml Mlcx Sx6l 36,000 EUR 3,600,000.00 3,586,834.80 4.283,600,000.00 3,586,834.80 4.28
Total - Other transferable securities and money market instruments 3,600,000.00 3,586,834.80 4.28
Investment Funds
Awf Gl Hy Bd -A Eur Hdg- Cap 3,475 EUR 301,491.00 307,815.50 0.37Ishares Bar Em Etf Usd /Dis 26,300 EUR 1,348,085.40 1,427,301.00 1.70Nn (L) Gl Hy -I Hedg- Cap 538 EUR 301,075.56 306,299.54 0.37Pim Glb Hy Ac. Inst Cleur (Hed) 39,716 EUR 901,950.36 927,368.60 1.11
Total - Investment Funds 2,852,602.32 2,968,784.64 3.55
Financial Instruments
Treasury Bills
Norway 0% 18-18.12.19 Tb 13,000,000 NOK 1,315,593.52 1,331,038.18 1.591,315,593.52 1,331,038.18 1.59
Total - Financial Instruments 1,315,593.52 1,331,038.18 1.59
TOTAL INVESTMENT PORTFOLIO 69,900,090.84 69,223,460.94 82.66
Pramerica Sicav
The accompanying notes form an integral part of these financial statements.
133
* Securities partially or totally lent (see Note 9).
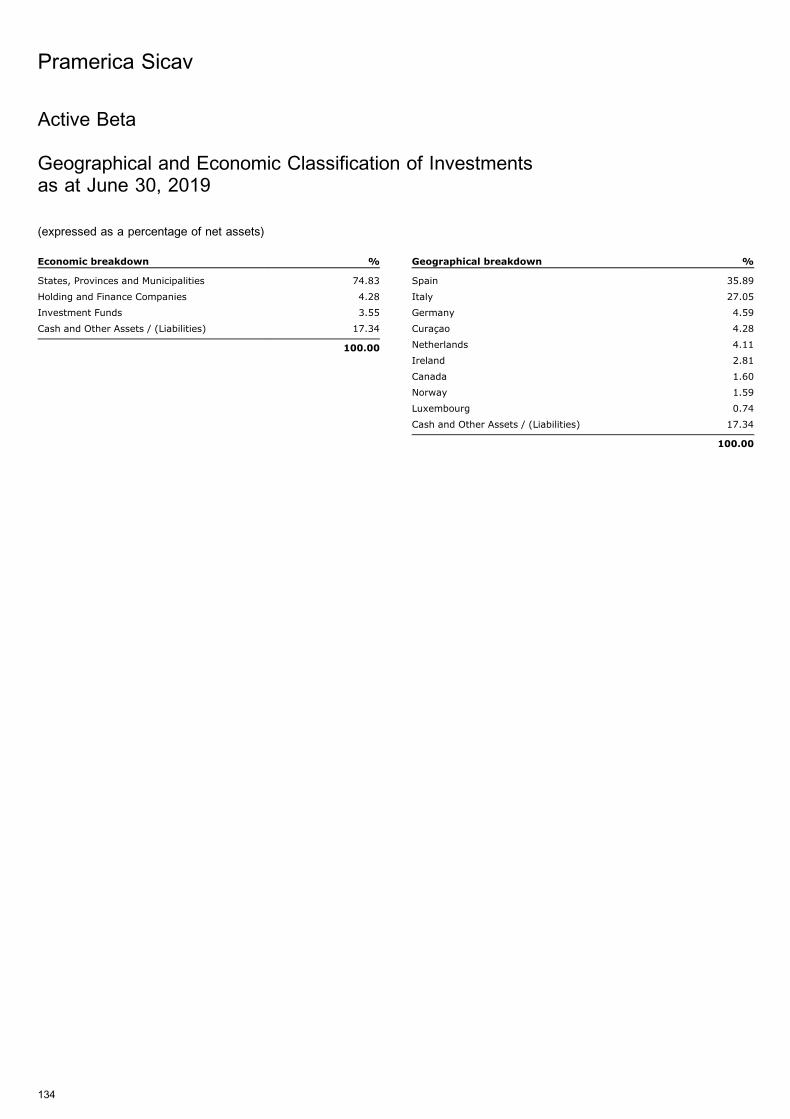
Active Beta
Geographical and Economic Classification of Investmentsas at June 30, 2019
(expressed as a percentage of net assets)
Economic breakdown %
States, Provinces and Municipalities 74.83
Holding and Finance Companies 4.28
Investment Funds 3.55
Cash and Other Assets / (Liabilities) 17.34
100.00
Geographical breakdown %
Spain 35.89
Italy 27.05
Germany 4.59
Curacao 4.28
Netherlands 4.11
Ireland 2.81
Canada 1.60
Norway 1.59
Luxembourg 0.74
Cash and Other Assets / (Liabilities) 17.34
100.00
Pramerica Sicav
134

Global Corporate Bond
Statement of Investmentsas at June 30, 2019
(expressed in EUR)
Description Face value/
Quantity
Base currency Cost Market Value % net
assets
Transferable securities and money market instruments listed on an official stock exchange and dealt in on another regulated market
Bonds
Abbott Il F 0.875% 18-27.09.23 300,000 EUR 299,736.00 310,185.00 0.21Abbott Il F 1.5% 18-27.09.26 Regs* 200,000 EUR 199,446.00 214,468.00 0.14Abbvie 4.45% 16-14.05.46 295,000 USD 249,343.78 254,383.22 0.17Abbvie 4.5% 15-14.05.35 265,000 USD 220,883.12 240,031.80 0.16Abbvie 4.7% 15-14.05.45 200,000 USD 166,842.33 178,772.39 0.12Abibb 4.6% 18-15.04.48 200,000 USD 162,036.99 187,961.52 0.13Abn Amro 2.875% 15-30.06.25 100,000 EUR 103,591.00 102,667.93 0.07Abu Dhabi 4.125% 17-11.10.47Regs 265,000 USD 223,421.87 254,757.40 0.17Actavis Fd 3% 15-12.03.20 600,000 USD 548,341.77 528,368.67 0.36Adp 1.125% 19-18.06.34 Regs 200,000 EUR 197,112.00 203,112.00 0.14Aep Tex 3.95% 18-01.06.28 190,000 USD 158,206.35 178,311.11 0.12Aep Tr 3.1% 16-01.12.26 60,000 USD 56,090.11 53,529.43 0.04Aetna Inc 3.5% 14-15.11.24 35,000 USD 32,718.00 31,684.42 0.02Aetna Inc 3.875% 17-15.08.47 250,000 USD 211,244.38 198,466.44 0.13Agl Capital 2.45% 16-01.10.23 105,000 USD 93,045.49 91,949.07 0.06Agl Capital 3.25% 16-15.06.26 150,000 USD 134,593.10 132,800.54 0.09Agl Capital 4.4% 17-30.05.47 195,000 USD 177,712.39 181,111.33 0.12Aig 4.375% 15-15.01.55 450,000 USD 385,135.26 397,896.96 0.27Ald Intl 1.25% 18-11.10.22 200,000 EUR 199,830.00 205,312.00 0.14Allergan Fd 1.5% 18-15.11.23 500,000 EUR 498,140.00 520,760.00 0.35Alliander 0.875% 19-24.06.32 300,000 EUR 295,884.00 304,771.80 0.20Altria Grp 3.125% 19-15.06.31 200,000 EUR 199,960.00 216,828.00 0.15Altria Grp 4.4% 19-14.02.26 145,000 USD 128,039.07 136,234.33 0.09Amgen 4% 12-13.09.29 100,000 GBP 139,784.25 128,688.30 0.09Anadko Pet 0% 06-10.10.36 1,000,000 USD 370,026.75 414,830.34 0.28Anadko Pet 4.85% 16-15.03.21 319,000 USD 294,282.52 289,947.27 0.19Andeavor 3.5% 17-01.12.22 55,000 USD 46,568.29 49,435.89 0.03Anheuser-Bu 4.90% 19-01.02.46 675,000 USD 719,821.54 659,905.52 0.44Apache 3.25% 12-15.04.22 21,000 USD 18,430.75 18,712.57 0.01Apple Inc 3.75% 17-12.09.47 715,000 USD 579,522.53 657,875.21 0.44Aroundtown 1% 17-07.01.25 Regs 200,000 EUR 195,246.00 201,453.62 0.14Aroundtown 1.5% 16-15.07.24 200,000 EUR 199,646.00 208,417.60 0.14Asb Finance 0.5% 16-17.06.20 200,000 EUR 200,164.00 201,272.50 0.14Astrazeneca 0.875% 14-24.11.21 700,000 EUR 726,810.00 715,287.44 0.48At&T Inc 2.45% 15-15.03.35 100,000 EUR 91,811.00 105,167.60 0.07At&T Inc 3.15% 17-04.09.36 100,000 EUR 100,550.00 113,066.80 0.08At&t Inc 4.45% 15-01.04.24 150,000 USD 144,686.07 141,722.14 0.10At&t Inc 4.5% 15-15.05.35 15,000 USD 13,844.90 13,787.08 0.01At&t Inc 4.75% 15-15.05.46 900,000 USD 835,682.81 834,500.80 0.56At&T Inc 4.8% 14-15.06.44 150,000 USD 117,510.73 139,018.24 0.09At&T Inc 4.85% 19-01.03.39 65,000 USD 54,866.21 61,252.08 0.04At&t Inc 5.15% 16-15.03.42 225,000 USD 203,473.03 215,940.03 0.15At&t Inc 5.25% 17-01.03.37 135,000 USD 124,319.16 133,032.51 0.09Atlim 1.875% 17-13.07.27 100,000 EUR 98,966.00 97,955.00 0.07Atmos En 3% 17-15.06.27 175,000 USD 155,072.64 156,305.04 0.11Aviva 1.875% 18-13.11.27 100,000 EUR 99,346.00 106,680.00 0.07Axa 3.25% 18-28.05.49 200,000 EUR 198,414.00 219,964.00 0.15Bafc 1.379% (Frn) 17-07.02.25 300,000 EUR 303,492.00 313,200.00 0.21Bafc 4.33% 19-15.03.50 385,000 USD 341,433.13 376,868.89 0.25Barc 5.14% 10-14.10.20 400,000 USD 384,120.16 361,187.53 0.24Barclays 1.375% 18-24.01.26 Regs 300,000 EUR 284,080.00 299,801.40 0.20Barclays 2% 17-07.02.28 300,000 EUR 296,190.00 294,482.10 0.20Barclays 2.375% 17-06.10.23 300,000 GBP 339,533.80 335,371.04 0.23Barclays 3.932% 19-07.05.25 400,000 USD 356,404.53 357,445.85 0.24Bat Capital 1.125% 17-16.11.23 300,000 EUR 300,835.00 306,570.00 0.21Bat Capital 4.39% 18-15.08.37 300,000 USD 255,580.17 249,611.40 0.17Bat Intl 3.25% 12-07.06.22 100,000 USD 91,008.41 89,073.81 0.06Bay Area Toll 6.263% 09-01.04.49 100,000 USD 112,071.21 131,649.84 0.09Bayer Cap 1.5% 18-26.06.26* 200,000 EUR 199,178.00 207,153.76 0.14
Pramerica Sicav
The accompanying notes form an integral part of these financial statements.
135
* Securities partially or totally lent (see Note 9).

Description Face value/
Quantity
Base currency Cost Market Value % net
assets
Bco Sab 0.875% 17-05.03.23 600,000 EUR 596,250.00 605,202.00 0.41Becton Dick 2.894% 17-06.06.22 250,000 USD 222,222.22 222,492.21 0.15Bfcm 0.5% 18-16.11.22 200,000 EUR 199,402.00 203,540.00 0.14Bfcm 1.875% 19-18.06.29 Regs 200,000 EUR 199,368.00 207,913.20 0.14Blackstone 1.4% 18-06.07.22 350,000 EUR 349,755.00 358,060.50 0.24Blackstone 2% 19-15.02.24 Regs 200,000 EUR 199,962.00 209,717.62 0.14Bmw Fin 1.5% 19-06.02.29 200,000 EUR 198,750.00 211,464.00 0.14Bnp Paribas 1% 17-29.11.24 500,000 EUR 496,015.00 502,406.00 0.34Bnpp 2.125% (Frn) 19-23.01.27 300,000 EUR 297,846.00 325,101.60 0.22Bnpp 3.375% 18-09.01.25 (144a) 700,000 USD 559,194.55 625,350.46 0.42Bnpp 3.375% 19-23.01.26 300,000 GBP 338,024.64 355,807.91 0.24Boa 3.419% 17-20.12.28 520,000 USD 424,162.24 469,819.89 0.32Boa 3.824% 17-20.01.28 280,000 USD 244,330.85 260,245.41 0.17Bpce 4.5% 14-15.03.25 200,000 USD 174,971.23 185,085.19 0.12Bpce 4.625% 14-11.07.24 300,000 USD 249,650.48 278,241.93 0.19Brdcom Crp 3.875% 18-15.01.27 395,000 USD 356,780.48 339,855.13 0.23Bristol Mye 3.4% 19-26.07.29 144a 225,000 USD 199,431.36 206,832.72 0.14Bristol Mye 4.125% 19-15.06.39 70,000 USD 62,347.48 66,282.35 0.04Bristol Mye 4.25% 19-26.10.49 300,000 USD 265,862.90 288,270.26 0.19Brit Sky Br 1.5% 14-15.09.21 600,000 EUR 625,986.00 621,034.80 0.42Britel 0.625% 16-10.03.21 850,000 EUR 858,757.50 860,166.00 0.58Britel 9.625% 00-15.12.30 30,000 USD 34,019.55 39,728.33 0.03Brixmor 4.125% 16-15.06.26 300,000 USD 276,700.93 272,288.39 0.18Brixmor 4.125% 19-15.05.29 310,000 USD 276,514.79 284,396.29 0.19Bunzl Finan 2.25% 17-11.06.25* 200,000 GBP 225,683.81 224,813.19 0.15Burlington 4.375% 12-01.09.42 300,000 USD 257,670.99 298,389.10 0.20Byr Us F 2.75% 18-15.07.21 144a 700,000 USD 639,932.86 615,060.66 0.41Byr Us F 4.7% 18-15.07.64 144a 29,000 USD 21,221.71 23,155.67 0.02Ca Inc 3.6% 17-15.08.22 170,000 USD 159,750.75 151,597.36 0.10Caixabank 1.125% 17-12.01.23 200,000 EUR 199,704.00 204,017.60 0.14Caixabank 2.25% 18-17.04.30 300,000 EUR 298,599.00 302,015.40 0.20Cal 5.983% 07-19.04.22 66,650 USD 59,762.57 62,073.26 0.04Calif Inst 4.7% 11-01.11.2111 10,000 USD 7,421.26 10,838.57 0.01Cameron Int 4.5% 11-01.06.21 40,000 USD 33,133.48 35,958.28 0.02Canadian Pac. 5.75% 03-15.03.33 50,000 USD 38,077.79 54,036.42 0.04Capital One 0.8% 19-12.06.24 400,000 EUR 399,764.00 402,535.24 0.27Cardi Hlth 2.616% 17-15.06.22 355,000 USD 316,202.01 313,576.13 0.21Carolina Pw 4.1% 13-15.03.43 375,000 USD 369,199.34 352,875.13 0.24Cbs 2.9% 16-15.01.27 170,000 USD 149,711.33 144,814.84 0.10Cdn Nat Res 3.45% 11-15-11-21 500,000 USD 462,742.07 448,601.41 0.30Celgene 2.25% 17-15.08.21 670,000 USD 542,435.91 586,352.72 0.39Celgene 3.875% 15-15.08.25 200,000 USD 176,660.26 188,159.42 0.13Celgene 4.625% 14-15.05.44 275,000 USD 254,432.41 275,276.55 0.19Cenovus Egy 5.25% 17-15.06.37 245,000 USD 198,492.03 224,996.44 0.15Cenovus Egy 5.7% 10-15.10.19 250,000 USD 219,471.51 221,206.63 0.15Cf 3.4% 16-01.12.21 560,000 USD 524,741.52 499,078.06 0.34Cf 4.5% 16-01.12.26 300,000 USD 265,737.07 273,887.01 0.18Charter Cm 5.375% 17-01.05.47 140,000 USD 115,608.34 129,709.83 0.09Charter Com 4.908% 16-23.07.25 500,000 USD 428,562.41 476,619.24 0.32Charter Com 6.484% 16-23.10.45 500,000 USD 534,480.71 517,301.12 0.35Chubb Ina 2.5% 18-15.03.38 300,000 EUR 299,997.00 342,858.00 0.23Chubb Ina H 1.4% 19-15.06.31 200,000 EUR 199,016.00 204,282.38 0.14Citigp 3.2% 16-21.10.26 480,000 USD 433,911.88 429,822.32 0.29Citigp 3.4% 16-01.05.26 300,000 USD 276,602.99 272,645.39 0.18Citigroup I 1.5% 18-24.07.26 600,000 EUR 598,370.00 630,752.40 0.42Citigroup I 3.7% 16-12.01.26 175,000 USD 162,341.46 161,754.70 0.11Citigroup I 4.044% 18-01.06.24 450,000 USD 379,330.69 417,675.27 0.28Cloverie Frn 7.5% 09-24.07.39 200,000 EUR 233,058.00 200,938.00 0.14Cms Energy 2.95% 16-15.02.27 110,000 USD 99,987.32 95,326.18 0.06Cna Fi Corp 4.5% 16-01.03.26 700,000 USD 671,690.79 658,886.79 0.44Cnac Hk Fin 1.75% 18-14.06.22 600,000 EUR 598,170.00 615,237.60 0.41Cndian Pac 6.125% 15-15.09.2115 200,000 USD 231,728.07 236,949.69 0.16
Pramerica Sicav
The accompanying notes form an integral part of these financial statements.
136
Global Corporate Bond
Statement of Investmentsas at June 30, 2019 (continued)
(expressed in EUR)
* Securities partially or totally lent (see Note 9).

Description Face value/
Quantity
Base currency Cost Market Value % net
assets
Cnp 3.55% 18-01.04.23 250,000 USD 200,478.18 226,167.18 0.15Col Pln 4.25% 18-15.04.48 500,000 USD 406,203.43 468,070.73 0.31Comcast 3.9% 18-01.03.38 155,000 USD 129,168.48 143,310.69 0.10Comcast 4% 18-01.03.48 215,000 USD 168,303.35 199,692.89 0.13Comcast 4.15% 18-15.10.28 145,000 USD 125,402.35 140,321.20 0.09Comcast 4.6% 18-15.10.38 15,000 USD 13,903.01 15,080.96 0.01Comcast 4.7% 18-15.10.48 115,000 USD 99,425.20 118,262.82 0.08Comzbk 7.75% 11-16.03.21 /Sub 300,000 EUR 363,560.00 337,290.00 0.23Concho Res 4.3% 18-15.08.28 75,000 USD 64,153.29 70,908.38 0.05Conn Light 4% 18-01.04.48 200,000 USD 161,798.72 191,986.30 0.13Cox Comm 3.5% 17-15.08.27 144a 300,000 USD 256,389.86 268,344.59 0.18Cox Comm 4.6% 17-15.08.47 144a 75,000 USD 64,009.88 66,722.74 0.04Crdt Ag As 2.625% 18-29.01.48 Regs 300,000 EUR 299,949.00 295,991.40 0.20Crdt Agr As 4.5% 14-Perp 100,000 EUR 103,825.00 110,421.60 0.07Credit Ag 3.75% 18-24.04.23 144a 250,000 USD 201,781.95 227,837.55 0.15Cs Group 4.207% 18-12.06.24 250,000 USD 212,188.08 230,334.75 0.15Cs Group 4.282% 17-09.01.28 144a 680,000 USD 571,891.45 630,315.28 0.42Cs Ny 3.625% 14-09.09.24 350,000 USD 308,153.24 323,713.25 0.22Csx Corp 4.25% 16-01.11.66 360,000 USD 320,129.97 313,780.35 0.21Cvs Health 3.7% 18-09.03.23 165,000 USD 146,833.14 149,823.64 0.10Cvs Health 4.78% 18-25.03.38 300,000 USD 241,665.34 274,784.59 0.18Cvs Health 5.125% 15-20.07.45 450,000 USD 470,927.96 421,359.83 0.28Cw Bk Austr 1.936% 17-03.10.29 300,000 EUR 303,897.00 306,384.00 0.21Cwth Edison 2.55% 16-15.06.26 145,000 USD 127,888.52 126,632.64 0.09Cwth Edison 3.7% 15-01.03.45 450,000 USD 411,711.67 401,827.44 0.27Cwth Edison 3.75% 17-15.08.47 200,000 USD 168,003.34 181,996.19 0.12Cwth Edison 4.35% 15-15.11.45 195,000 USD 200,754.03 194,141.82 0.13Deut Bk 1.625% 19-12.02.21 400,000 EUR 399,828.00 403,140.92 0.27Deut Bk 1.875% 17-28.02.20 200,000 GBP 224,377.39 223,293.77 0.15Deut Bk Ny 4.25% 18-04.02.21 595,000 USD 509,980.73 527,050.00 0.35Deut Tel 3.6% 17-19.01.27 144a 500,000 USD 473,027.38 450,076.30 0.30Devon Ener 3.25% 12-15.05.22 400,000 USD 347,626.70 357,850.56 0.24Dfs 3.1% 15-04.06.20 1,250,000 USD 1,147,336.67 1,102,851.44 0.74Dfs 7% 10-15.04.20 30,000 USD 25,221.72 27,240.66 0.02Digi Rty 2.75% 17-01.02.23 120,000 USD 101,126.67 105,259.35 0.07Digital Eur 2.5% 19-16.01.26 500,000 EUR 504,504.00 545,232.00 0.37Disca 3.3% 12-15.05.22 Sr 300,000 USD 282,584.90 268,137.81 0.18Disca 3.8% 17-13.03.24 940,000 USD 822,067.75 856,612.45 0.58Dollar Tree 3.7% 18-15.05.23 115,000 USD 93,856.17 104,256.59 0.07Dominion Re 2.962% 16-01.07.19 30,000 USD 26,809.84 26,341.21 0.02Dow 9.4% 09-15.05.39 40,000 USD 49,514.02 55,758.95 0.04Dow Chem 4.375% 12-15.11.42 200,000 USD 174,130.16 177,613.84 0.12Dow Chem 5.55% 18-30.11.48 170,000 USD 150,639.27 177,645.73 0.12Dowdupont 4.205% 18-15.11.23 300,000 USD 265,275.44 281,964.91 0.19Dr Pepper 4.057% 19-25.05.23 360,000 USD 300,751.88 331,860.32 0.22Ds Smith 1.375% 17-26.07.24 450,000 EUR 448,303.50 459,581.40 0.31Ds Smith 2.25% 15-16.09.22 250,000 EUR 263,031.50 263,585.50 0.18Dsk Bk 2.5% 19-21.06.29 500,000 EUR 497,145.00 519,888.00 0.35Dsk Bk 5.375% 19-12.01.24 200,000 USD 179,006.95 189,809.08 0.13Dte 3.5% 14-01.06.24 250,000 USD 202,201.22 227,476.60 0.15Dte 3.85% 13-01.12.23 450,000 USD 440,195.67 413,711.45 0.28Duke Energy 4.15% 14-01.12.44 200,000 USD 192,163.91 190,076.85 0.13Duke Energy 4.25% 11-15.12.41 400,000 USD 380,226.24 385,995.68 0.26Dxc Tech 2.875% 17-27.03.20 85,000 USD 79,414.85 74,627.05 0.05Eastman Che 4.5% 18-01.12.28 200,000 USD 173,337.43 190,164.60 0.13Eastman Che 4.65% 14-15.10.44 200,000 USD 159,467.52 181,707.21 0.12El Paso 4.3% 14-01.05.24 125,000 USD 101,888.22 116,664.68 0.08Elenia Fina 2.875% 13-17.12.20 200,000 EUR 208,147.00 208,560.30 0.14Elia Sys Op 1.375% 19-14.01.26 200,000 EUR 199,894.00 212,591.60 0.14Emera Us Fi 2.7% 16-15.06.21 500,000 USD 469,100.17 440,520.72 0.30Encana Corp 6.5% 04-15.08.34 250,000 USD 265,103.72 269,447.54 0.18Encana Corp 6.5% 07-01.02.38 300,000 USD 302,967.85 322,593.96 0.22Eneco Hldg 3.25% 14-Perp 390,000 EUR 402,706.20 413,400.00 0.28
Pramerica Sicav
The accompanying notes form an integral part of these financial statements.
137
Global Corporate Bond
Statement of Investmentsas at June 30, 2019 (continued)
(expressed in EUR)
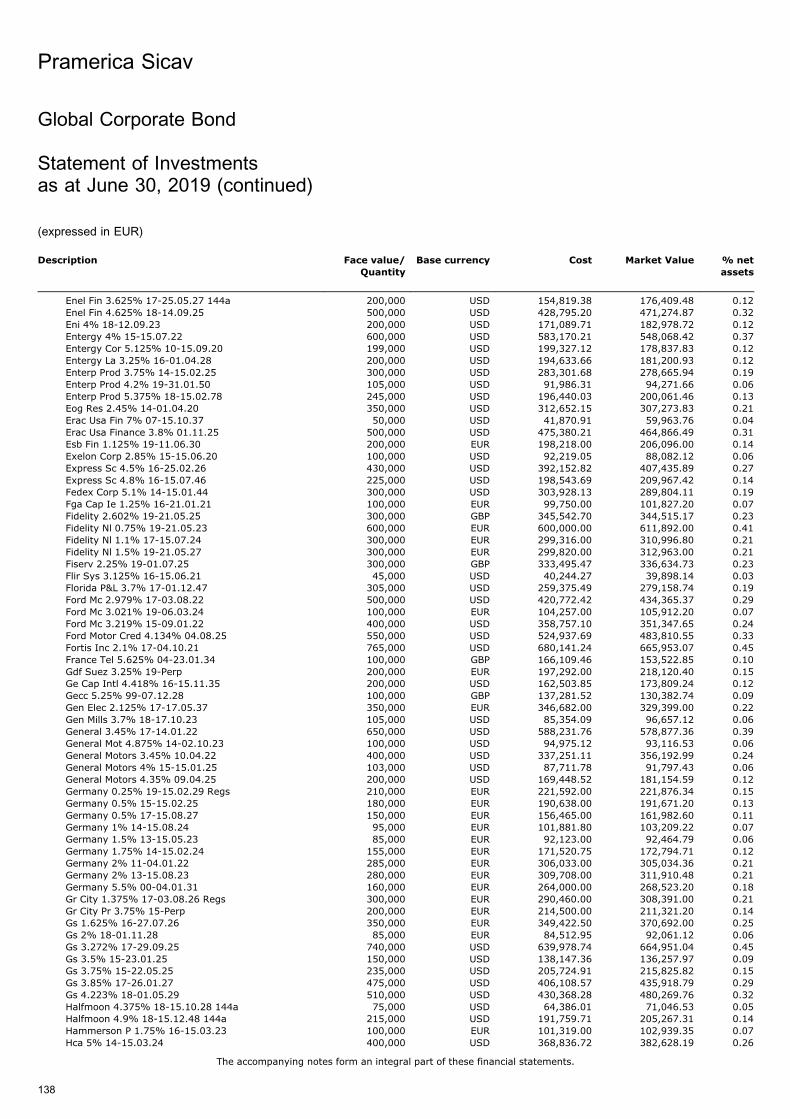
Description Face value/
Quantity
Base currency Cost Market Value % net
assets
Enel Fin 3.625% 17-25.05.27 144a 200,000 USD 154,819.38 176,409.48 0.12Enel Fin 4.625% 18-14.09.25 500,000 USD 428,795.20 471,274.87 0.32Eni 4% 18-12.09.23 200,000 USD 171,089.71 182,978.72 0.12Entergy 4% 15-15.07.22 600,000 USD 583,170.21 548,068.42 0.37Entergy Cor 5.125% 10-15.09.20 199,000 USD 199,327.12 178,837.83 0.12Entergy La 3.25% 16-01.04.28 200,000 USD 194,633.66 181,200.93 0.12Enterp Prod 3.75% 14-15.02.25 300,000 USD 283,301.68 278,665.94 0.19Enterp Prod 4.2% 19-31.01.50 105,000 USD 91,986.31 94,271.66 0.06Enterp Prod 5.375% 18-15.02.78 245,000 USD 196,440.03 200,061.46 0.13Eog Res 2.45% 14-01.04.20 350,000 USD 312,652.15 307,273.83 0.21Erac Usa Fin 7% 07-15.10.37 50,000 USD 41,870.91 59,963.76 0.04Erac Usa Finance 3.8% 01.11.25 500,000 USD 475,380.21 464,866.49 0.31Esb Fin 1.125% 19-11.06.30 200,000 EUR 198,218.00 206,096.00 0.14Exelon Corp 2.85% 15-15.06.20 100,000 USD 92,219.05 88,082.12 0.06Express Sc 4.5% 16-25.02.26 430,000 USD 392,152.82 407,435.89 0.27Express Sc 4.8% 16-15.07.46 225,000 USD 198,543.69 209,967.42 0.14Fedex Corp 5.1% 14-15.01.44 300,000 USD 303,928.13 289,804.11 0.19Fga Cap Ie 1.25% 16-21.01.21 100,000 EUR 99,750.00 101,827.20 0.07Fidelity 2.602% 19-21.05.25 300,000 GBP 345,542.70 344,515.17 0.23Fidelity Nl 0.75% 19-21.05.23 600,000 EUR 600,000.00 611,892.00 0.41Fidelity Nl 1.1% 17-15.07.24 300,000 EUR 299,316.00 310,996.80 0.21Fidelity Nl 1.5% 19-21.05.27 300,000 EUR 299,820.00 312,963.00 0.21Fiserv 2.25% 19-01.07.25 300,000 GBP 333,495.47 336,634.73 0.23Flir Sys 3.125% 16-15.06.21 45,000 USD 40,244.27 39,898.14 0.03Florida P&L 3.7% 17-01.12.47 305,000 USD 259,375.49 279,158.74 0.19Ford Mc 2.979% 17-03.08.22 500,000 USD 420,772.42 434,365.37 0.29Ford Mc 3.021% 19-06.03.24 100,000 EUR 104,257.00 105,912.20 0.07Ford Mc 3.219% 15-09.01.22 400,000 USD 358,757.10 351,347.65 0.24Ford Motor Cred 4.134% 04.08.25 550,000 USD 524,937.69 483,810.55 0.33Fortis Inc 2.1% 17-04.10.21 765,000 USD 680,141.24 665,953.07 0.45France Tel 5.625% 04-23.01.34 100,000 GBP 166,109.46 153,522.85 0.10Gdf Suez 3.25% 19-Perp 200,000 EUR 197,292.00 218,120.40 0.15Ge Cap Intl 4.418% 16-15.11.35 200,000 USD 162,503.85 173,809.24 0.12Gecc 5.25% 99-07.12.28 100,000 GBP 137,281.52 130,382.74 0.09Gen Elec 2.125% 17-17.05.37 350,000 EUR 346,682.00 329,399.00 0.22Gen Mills 3.7% 18-17.10.23 105,000 USD 85,354.09 96,657.12 0.06General 3.45% 17-14.01.22 650,000 USD 588,231.76 578,877.36 0.39General Mot 4.875% 14-02.10.23 100,000 USD 94,975.12 93,116.53 0.06General Motors 3.45% 10.04.22 400,000 USD 337,251.11 356,192.99 0.24General Motors 4% 15-15.01.25 103,000 USD 87,711.78 91,797.43 0.06General Motors 4.35% 09.04.25 200,000 USD 169,448.52 181,154.59 0.12Germany 0.25% 19-15.02.29 Regs 210,000 EUR 221,592.00 221,876.34 0.15Germany 0.5% 15-15.02.25 180,000 EUR 190,638.00 191,671.20 0.13Germany 0.5% 17-15.08.27 150,000 EUR 156,465.00 161,982.60 0.11Germany 1% 14-15.08.24 95,000 EUR 101,881.80 103,209.22 0.07Germany 1.5% 13-15.05.23 85,000 EUR 92,123.00 92,464.79 0.06Germany 1.75% 14-15.02.24 155,000 EUR 171,520.75 172,794.71 0.12Germany 2% 11-04.01.22 285,000 EUR 306,033.00 305,034.36 0.21Germany 2% 13-15.08.23 280,000 EUR 309,708.00 311,910.48 0.21Germany 5.5% 00-04.01.31 160,000 EUR 264,000.00 268,523.20 0.18Gr City 1.375% 17-03.08.26 Regs 300,000 EUR 290,460.00 308,391.00 0.21Gr City Pr 3.75% 15-Perp 200,000 EUR 214,500.00 211,321.20 0.14Gs 1.625% 16-27.07.26 350,000 EUR 349,422.50 370,692.00 0.25Gs 2% 18-01.11.28 85,000 EUR 84,512.95 92,061.12 0.06Gs 3.272% 17-29.09.25 740,000 USD 639,978.74 664,951.04 0.45Gs 3.5% 15-23.01.25 150,000 USD 138,147.36 136,257.97 0.09Gs 3.75% 15-22.05.25 235,000 USD 205,724.91 215,825.82 0.15Gs 3.85% 17-26.01.27 475,000 USD 406,108.57 435,918.79 0.29Gs 4.223% 18-01.05.29 510,000 USD 430,368.28 480,269.76 0.32Halfmoon 4.375% 18-15.10.28 144a 75,000 USD 64,386.01 71,046.53 0.05Halfmoon 4.9% 18-15.12.48 144a 215,000 USD 191,759.71 205,267.31 0.14Hammerson P 1.75% 16-15.03.23 100,000 EUR 101,319.00 102,939.35 0.07Hca 5% 14-15.03.24 400,000 USD 368,836.72 382,628.19 0.26
Pramerica Sicav
The accompanying notes form an integral part of these financial statements.
138
Global Corporate Bond
Statement of Investmentsas at June 30, 2019 (continued)
(expressed in EUR)

Description Face value/
Quantity
Base currency Cost Market Value % net
assets
Hca 5.125% 19-15.06.39 115,000 USD 101,171.00 104,985.34 0.07Hcp 3.25% 19-15.07.26 95,000 USD 84,043.83 84,066.01 0.06Hcp 3.50% 19-15.07.29 90,000 USD 79,354.29 79,372.39 0.05Health Care 4.125% 19-15.03.29 400,000 USD 361,680.55 372,505.61 0.25Healthcare 2.95% 17-01.07.22 90,000 USD 80,114.19 79,586.63 0.05Heathrow Fd 1.875% 19-14.03.34 200,000 EUR 196,940.00 209,124.66 0.14High Str 4.111% 18-15.02.28 115,000 USD 93,268.45 106,225.31 0.07Hj Heinz Co 2.25% 16-25.05.28 100,000 EUR 99,688.00 106,790.00 0.07Hj Heinz Co 5.2% 16-15.07.45 400,000 USD 415,879.16 368,297.34 0.25Host Hotel 3.875% 17-01.04.24 130,000 USD 122,328.01 117,408.15 0.08Hsbc Hldg 2.175% 18-27.06.23 500,000 GBP 571,755.50 563,896.99 0.38Hsbc Hldg 3% 19-22.07.28 200,000 GBP 230,416.37 232,877.05 0.16Hsbc Hldg 3.973% 19-22.05.30 200,000 USD 178,443.97 183,432.45 0.12Hsbc Hldg 4.25% 15-18.08.25 300,000 USD 246,262.94 277,339.77 0.19Hsbc Hldg 4.292% 18-12.09.26 350,000 USD 297,052.82 326,927.14 0.22Husky Ener 4% 14-15.04.24 350,000 USD 318,274.80 320,266.44 0.22Husky Energy 7.25% 09-15.12.19 250,000 USD 260,094.89 223,922.73 0.15Ibm Corp 0.875% 19-31.01.25 300,000 EUR 298,191.00 309,650.13 0.21Ibm Corp 1.75% 19-31.01.31 200,000 EUR 197,908.00 217,178.40 0.15Indiana Mic 3.85% 15.05.28 220,000 USD 181,500.46 207,313.41 0.14Informa 1.5% 18-05.07.23 250,000 EUR 249,092.50 259,509.00 0.17Ing Gro 4.625% 18-06.01.26 144a 170,000 USD 153,516.33 162,832.80 0.11Ing Groep 1.625% 17-26.09.29 400,000 EUR 396,784.00 406,980.00 0.27Ing Groep 3% 19-18.02.26 200,000 GBP 226,690.99 233,504.71 0.16Ing Groep 4.05% 19-09.04.29 200,000 USD 177,978.43 187,321.91 0.13Int San 3.125% 17-14.07.22 144a 200,000 USD 175,318.70 173,821.99 0.12Interco Hot 2.125% 16-24.08.26 300,000 GBP 343,444.41 330,227.80 0.22Intercont 2.125% 18-15.05.27 Regs 200,000 EUR 199,060.00 212,388.00 0.14Internation 1.8% 18-25.09.26 300,000 EUR 299,733.00 319,699.23 0.22Ints S 3.375% 18-12.01.23 /144a 400,000 USD 318,248.88 349,955.67 0.24Ip Co 6% 11-15.11.41 10,000 USD 7,271.18 10,292.15 0.01Ip Co 7.3% 09-15.11.39 28,000 USD 27,719.45 32,031.81 0.02Ipalco 3.7% 17-01.09.24 260,000 USD 221,170.47 236,316.28 0.16Johnson Ctl 1% 17-15.09.23 151,000 EUR 149,684.79 155,802.40 0.10Jpm 3.2% 13-25.01.23 Sr 70,000 USD 58,809.70 63,070.22 0.04Jpm 3.3% 16-01.04.26 625,000 USD 557,851.49 567,122.83 0.38Jpm 3.897% 18-23.01.49 150,000 USD 122,629.17 138,066.82 0.09Jpm 4.26% 17-22.02.48 300,000 USD 283,956.46 290,302.12 0.20Jpmorgan Ch 3.96% 19-29.01.27 400,000 USD 352,174.68 375,694.97 0.25Jpmorgan Ch 4.005% 18-23.04.29 365,000 USD 295,116.43 345,715.06 0.23Just Grp 3.5% 18-07.02.25 400,000 GBP 455,982.68 428,373.46 0.29Kerr-McGee 6.95% 04-01.07.24 45,000 USD 42,958.66 46,306.05 0.03Kinder Morg 4.15% 13-01.02.24 500,000 USD 448,869.21 463,039.78 0.31Kroger Co 3.85% 13-01.08.23 200,000 USD 193,937.07 183,900.34 0.12La Ca Wtr 6.574% 11-01.07.45 40,000 USD 46,855.06 53,376.42 0.04Lab Corp 3.6% 17-01.09.27 155,000 USD 132,052.86 139,679.69 0.09Leaseplan 1% 16-24.05.21 300,000 EUR 300,152.00 305,435.40 0.21Liberty 1.75% 17-27.03.24 Regs 500,000 EUR 499,215.00 524,800.00 0.35Liberty 4.50% 19-15.06.49 144a 65,000 USD 57,793.53 60,183.49 0.04Liberty Mut 2.75% 16-04.05.26 200,000 EUR 201,748.00 220,896.00 0.15Lincoln Nc 6.25% 09-15.02.20 15,000 USD 13,151.76 13,458.59 0.01Lloyds Bk 0.625% 18-15.01.24 250,000 EUR 242,757.50 248,757.50 0.17Lloyds Bk 2.907% 17-07.11.23 200,000 USD 171,659.08 175,899.78 0.12Louisv. G&E 4.65% 13-15.11.43 400,000 USD 415,649.05 397,974.54 0.27Lse 1.75% 18-06.12.27 400,000 EUR 398,612.00 426,252.00 0.29Lyb Int Fin 3.5% 17-02.03.27 375,000 USD 297,550.12 335,147.77 0.23Lyondell Ind 5.75% 12-15.04.24 300,000 USD 301,436.83 296,213.48 0.20Macys Ret 2.875% 12-15.02.23* 100,000 USD 87,894.21 85,976.72 0.06Magellan Mid 4.2% 12-01.12.42 200,000 USD 177,462.40 171,531.70 0.12Markel 4.90% 12-01.07.22 75,000 USD 62,723.26 70,264.29 0.05Markel 5% 16-05.04.46 75,000 USD 69,651.28 70,442.80 0.05Marriott 2.3% 16-15.01.22 180,000 USD 157,851.88 157,525.60 0.11
Pramerica Sicav
The accompanying notes form an integral part of these financial statements.
139
Global Corporate Bond
Statement of Investmentsas at June 30, 2019 (continued)
(expressed in EUR)
* Securities partially or totally lent (see Note 9).

Description Face value/
Quantity
Base currency Cost Market Value % net
assets
Mars Inc 3.6% 19-01.04.34 144a 35,000 USD 30,908.70 32,715.41 0.02Mars Inc 4.125% 19-01.04.54 50,000 USD 44,244.81 47,277.17 0.03Marsh Mclen 1.349% 19-21.09.26 400,000 EUR 400,008.00 416,193.16 0.28Marsh Mclen 1.979% 19-21.03.30 200,000 EUR 200,000.00 214,888.08 0.14Martin Mari 4.25% 14-02.07.24 40,000 USD 29,256.44 37,283.27 0.02Mcdonalds 0.625% 17-29.01.24 300,000 EUR 299,496.00 307,316.40 0.21Mckesson 3.95% 18-16.02.28 60,000 USD 48,788.13 54,621.11 0.04Medtrnc 1.125% 19-07.03.27 300,000 EUR 298,656.00 312,648.63 0.21Medtrnc 1.50% 19-02.07.39 100,000 EUR 98,980.00 98,783.00 0.07Medtrnc 1.75% 19-02.07.49 200,000 EUR 194,662.00 193,500.00 0.13Medtrnc 4.25% 19-07.03.39 100,000 EUR 98,985.00 113,066.00 0.08Merck 3.4% 19-07.03.29 445,000 USD 391,349.69 415,884.87 0.28Methanex 4.25% 14-01.12.24 300,000 USD 253,514.70 268,420.90 0.18Metrovacesa 2.375% 16-23.05.22 300,000 EUR 316,050.00 317,581.80 0.21Microsoft 3.75% 15-12.02.45 400,000 USD 326,503.14 382,089.38 0.26Microsoft 4% 15-12.02.55 160,000 USD 140,803.53 157,928.46 0.11Microsoft 4.5% 17-06.02.57 550,000 USD 532,095.20 591,258.74 0.40Midamer Nrg 4.5% 14-01.02.45 1,050,000 USD 1,018,857.81 1,038,739.03 0.70Mit Ufj Fin 2.998% 17-22.02.22 500,000 USD 448,124.45 445,901.62 0.30Mit Ufj Fin 3.455% 18-02.03.23 400,000 USD 325,494.34 361,084.17 0.24Mizuho Fina 2.601% 17-11.09.22 200,000 USD 157,126.74 175,502.95 0.12Mizuho Fina 2.953% 17-28.02.22 500,000 USD 418,964.60 444,062.08 0.30Mor St 1.342% 17-23.10.26* 650,000 EUR 644,435.00 677,502.80 0.46Mor St 3.625% 17-20.01.27 950,000 USD 783,652.55 875,458.24 0.59Mor St 3.875% 14-29.04.24 100,000 USD 96,225.12 93,059.52 0.06Mor St 3.971% 17-22.07.38 335,000 USD 290,798.61 308,162.35 0.21Mor St 4.35% 14-08.09.26 900,000 USD 840,155.54 847,391.13 0.57Motablty 2.375% 17-14.03.32 Regs 200,000 GBP 227,740.63 229,817.12 0.15Motorola 4.6% 19-23.05.29 200,000 USD 178,007.30 183,677.32 0.12Mplx Lp 4% 18-15.03.28 460,000 USD 369,001.88 418,296.43 0.28Mplx Lp 4.125% 17-01.03.27 125,000 USD 116,748.53 114,886.93 0.08Mplx Lp 4.7% 18-15.04.48 145,000 USD 115,808.28 128,406.93 0.09Mplx Lp 5.5% 18-15.02.49 190,000 USD 162,345.42 189,478.18 0.13Mylan 3.125% 16-22.11.28 200,000 EUR 202,138.50 206,653.60 0.14Mylan Inc 2.125% 18-23.05.25 300,000 EUR 299,286.00 299,106.15 0.20National Gr 2.625% 16-22.09.38 150,000 GBP 174,733.30 164,756.57 0.11Natl Grid 1% 17-12.07.24 Regs 200,000 EUR 198,540.00 206,640.40 0.14Newbelco 2.85% 17-25.05.37 125,000 GBP 145,304.07 137,923.47 0.09Newfield Expl 5.75% 11-30.01.22 330,000 USD 314,327.57 310,123.86 0.21Newmont Mining 5.125% 09-01.10.19 500,000 USD 495,405.26 441,620.60 0.30Nextera Nrg 3.55% 17-01.05.27 525,000 USD 479,096.73 481,238.45 0.32Nidec Corp 0.487% 18-27.09.21 200,000 EUR 200,000.00 201,500.00 0.14Nisource 3.49% 17-15.05.27 430,000 USD 395,557.27 390,538.35 0.26Nisource 3.95% 17-30.03.48 350,000 USD 281,102.87 306,426.24 0.21Noble Energy 4.15% 11-15.12.21 932,000 USD 881,105.56 844,470.97 0.57Norfolk Sth 5.59% 05-17.05.25 8,000 USD 6,546.63 7,998.64 0.01Nstar El 2.7% 16-01.06.26 163,000 USD 148,751.42 140,013.79 0.09Nutrien 3.15% 18-01.10.22 200,000 USD 168,962.91 178,539.78 0.12Nutrien 4% 17-15.12.26 900,000 USD 829,769.04 824,405.06 0.55Oneok Inc 4% 17-13.07.27 205,000 USD 179,703.47 187,076.80 0.13Oneok Inc 4.35% 19-15.03.29 300,000 USD 266,424.05 281,524.54 0.19Ontario 3.125% 17-20.03.22 400,000 USD 374,796.63 358,115.23 0.24Optus Fin 1% 19-20.06.29 Regs 200,000 EUR 198,792.00 202,518.40 0.14Oracle Corp 4% 17-15.11.47 300,000 USD 257,896.87 283,073.33 0.19Oracle Corp 4.3% 14-08.07.34 65,000 USD 47,450.52 64,942.39 0.04Orange 3.25% 19-15.01.32 Regs 100,000 GBP 110,610.77 121,635.45 0.08Orsted 4.875% 12-12.01.32 Regs 100,000 GBP 137,926.58 144,081.96 0.10Owens Corn 4.2% 12-15.12.22 40,000 USD 30,687.25 36,552.44 0.02Parker-Hann 3.25% 19-14.06.29 345,000 USD 305,353.95 314,190.49 0.21Pentair Fin 2.65% 13-01.12.19 50,000 USD 39,260.56 43,874.39 0.03Pentair Fin 4.5% 19-01.07.29 615,000 USD 539,845.40 552,640.06 0.37Perkinelmer 0.6% 18-09.04.21 500,000 EUR 499,750.00 504,095.00 0.34
Pramerica Sicav
The accompanying notes form an integral part of these financial statements.
140
Global Corporate Bond
Statement of Investmentsas at June 30, 2019 (continued)
(expressed in EUR)
* Securities partially or totally lent (see Note 9).
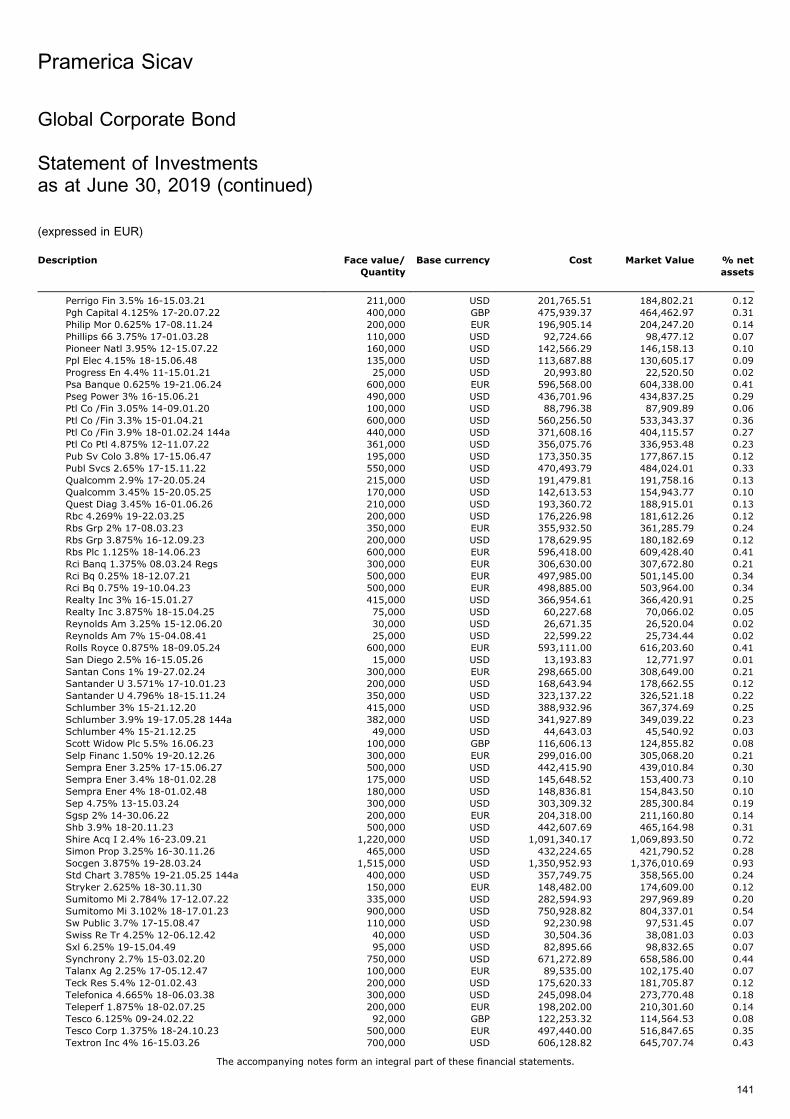
Description Face value/
Quantity
Base currency Cost Market Value % net
assets
Perrigo Fin 3.5% 16-15.03.21 211,000 USD 201,765.51 184,802.21 0.12Pgh Capital 4.125% 17-20.07.22 400,000 GBP 475,939.37 464,462.97 0.31Philip Mor 0.625% 17-08.11.24 200,000 EUR 196,905.14 204,247.20 0.14Phillips 66 3.75% 17-01.03.28 110,000 USD 92,724.66 98,477.12 0.07Pioneer Natl 3.95% 12-15.07.22 160,000 USD 142,566.29 146,158.13 0.10Ppl Elec 4.15% 18-15.06.48 135,000 USD 113,687.88 130,605.17 0.09Progress En 4.4% 11-15.01.21 25,000 USD 20,993.80 22,520.50 0.02Psa Banque 0.625% 19-21.06.24 600,000 EUR 596,568.00 604,338.00 0.41Pseg Power 3% 16-15.06.21 490,000 USD 436,701.96 434,837.25 0.29Ptl Co /Fin 3.05% 14-09.01.20 100,000 USD 88,796.38 87,909.89 0.06Ptl Co /Fin 3.3% 15-01.04.21 600,000 USD 560,256.50 533,343.37 0.36Ptl Co /Fin 3.9% 18-01.02.24 144a 440,000 USD 371,608.16 404,115.57 0.27Ptl Co Ptl 4.875% 12-11.07.22 361,000 USD 356,075.76 336,953.48 0.23Pub Sv Colo 3.8% 17-15.06.47 195,000 USD 173,350.35 177,867.15 0.12Publ Svcs 2.65% 17-15.11.22 550,000 USD 470,493.79 484,024.01 0.33Qualcomm 2.9% 17-20.05.24 215,000 USD 191,479.81 191,758.16 0.13Qualcomm 3.45% 15-20.05.25 170,000 USD 142,613.53 154,943.77 0.10Quest Diag 3.45% 16-01.06.26 210,000 USD 193,360.72 188,915.01 0.13Rbc 4.269% 19-22.03.25 200,000 USD 176,226.98 181,612.26 0.12Rbs Grp 2% 17-08.03.23 350,000 EUR 355,932.50 361,285.79 0.24Rbs Grp 3.875% 16-12.09.23 200,000 USD 178,629.95 180,182.69 0.12Rbs Plc 1.125% 18-14.06.23 600,000 EUR 596,418.00 609,428.40 0.41Rci Banq 1.375% 08.03.24 Regs 300,000 EUR 306,630.00 307,672.80 0.21Rci Bq 0.25% 18-12.07.21 500,000 EUR 497,985.00 501,145.00 0.34Rci Bq 0.75% 19-10.04.23 500,000 EUR 498,885.00 503,964.00 0.34Realty Inc 3% 16-15.01.27 415,000 USD 366,954.61 366,420.91 0.25Realty Inc 3.875% 18-15.04.25 75,000 USD 60,227.68 70,066.02 0.05Reynolds Am 3.25% 15-12.06.20 30,000 USD 26,671.35 26,520.04 0.02Reynolds Am 7% 15-04.08.41 25,000 USD 22,599.22 25,734.44 0.02Rolls Royce 0.875% 18-09.05.24 600,000 EUR 593,111.00 616,203.60 0.41San Diego 2.5% 16-15.05.26 15,000 USD 13,193.83 12,771.97 0.01Santan Cons 1% 19-27.02.24 300,000 EUR 298,665.00 308,649.00 0.21Santander U 3.571% 17-10.01.23 200,000 USD 168,643.94 178,662.55 0.12Santander U 4.796% 18-15.11.24 350,000 USD 323,137.22 326,521.18 0.22Schlumber 3% 15-21.12.20 415,000 USD 388,932.96 367,374.69 0.25Schlumber 3.9% 19-17.05.28 144a 382,000 USD 341,927.89 349,039.22 0.23Schlumber 4% 15-21.12.25 49,000 USD 44,643.03 45,540.92 0.03Scott Widow Plc 5.5% 16.06.23 100,000 GBP 116,606.13 124,855.82 0.08Selp Financ 1.50% 19-20.12.26 300,000 EUR 299,016.00 305,068.20 0.21Sempra Ener 3.25% 17-15.06.27 500,000 USD 442,415.90 439,010.84 0.30Sempra Ener 3.4% 18-01.02.28 175,000 USD 145,648.52 153,400.73 0.10Sempra Ener 4% 18-01.02.48 180,000 USD 148,836.81 154,843.50 0.10Sep 4.75% 13-15.03.24 300,000 USD 303,309.32 285,300.84 0.19Sgsp 2% 14-30.06.22 200,000 EUR 204,318.00 211,160.80 0.14Shb 3.9% 18-20.11.23 500,000 USD 442,607.69 465,164.98 0.31Shire Acq I 2.4% 16-23.09.21 1,220,000 USD 1,091,340.17 1,069,893.50 0.72Simon Prop 3.25% 16-30.11.26 465,000 USD 432,224.65 421,790.52 0.28Socgen 3.875% 19-28.03.24 1,515,000 USD 1,350,952.93 1,376,010.69 0.93Std Chart 3.785% 19-21.05.25 144a 400,000 USD 357,749.75 358,565.00 0.24Stryker 2.625% 18-30.11.30 150,000 EUR 148,482.00 174,609.00 0.12Sumitomo Mi 2.784% 17-12.07.22 335,000 USD 282,594.93 297,969.89 0.20Sumitomo Mi 3.102% 18-17.01.23 900,000 USD 750,928.82 804,337.01 0.54Sw Public 3.7% 17-15.08.47 110,000 USD 92,230.98 97,531.45 0.07Swiss Re Tr 4.25% 12-06.12.42 40,000 USD 30,504.36 38,081.03 0.03Sxl 6.25% 19-15.04.49 95,000 USD 82,895.66 98,832.65 0.07Synchrony 2.7% 15-03.02.20 750,000 USD 671,272.89 658,586.00 0.44Talanx Ag 2.25% 17-05.12.47 100,000 EUR 89,535.00 102,175.40 0.07Teck Res 5.4% 12-01.02.43 200,000 USD 175,620.33 181,705.87 0.12Telefonica 4.665% 18-06.03.38 300,000 USD 245,098.04 273,770.48 0.18Teleperf 1.875% 18-02.07.25 200,000 EUR 198,202.00 210,301.60 0.14Tesco 6.125% 09-24.02.22 92,000 GBP 122,253.32 114,564.53 0.08Tesco Corp 1.375% 18-24.10.23 500,000 EUR 497,440.00 516,847.65 0.35Textron Inc 4% 16-15.03.26 700,000 USD 606,128.82 645,707.74 0.43
Pramerica Sicav
The accompanying notes form an integral part of these financial statements.
141
Global Corporate Bond
Statement of Investmentsas at June 30, 2019 (continued)
(expressed in EUR)
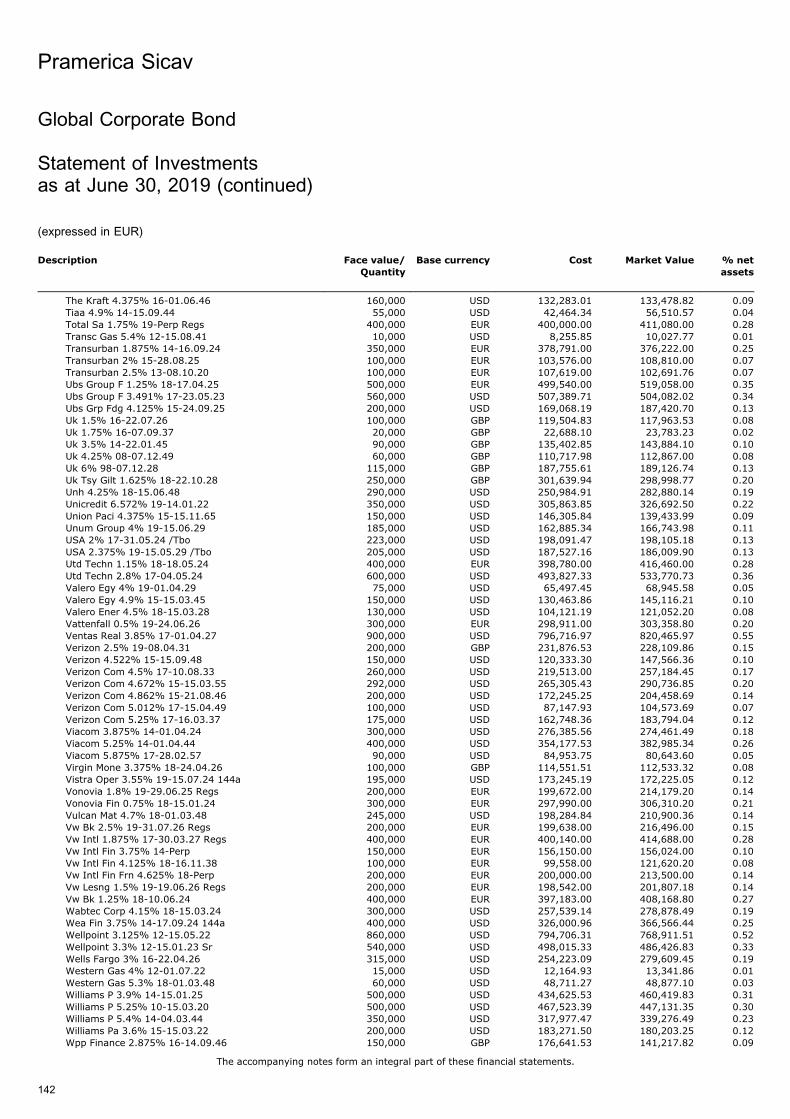
Description Face value/
Quantity
Base currency Cost Market Value % net
assets
The Kraft 4.375% 16-01.06.46 160,000 USD 132,283.01 133,478.82 0.09Tiaa 4.9% 14-15.09.44 55,000 USD 42,464.34 56,510.57 0.04Total Sa 1.75% 19-Perp Regs 400,000 EUR 400,000.00 411,080.00 0.28Transc Gas 5.4% 12-15.08.41 10,000 USD 8,255.85 10,027.77 0.01Transurban 1.875% 14-16.09.24 350,000 EUR 378,791.00 376,222.00 0.25Transurban 2% 15-28.08.25 100,000 EUR 103,576.00 108,810.00 0.07Transurban 2.5% 13-08.10.20 100,000 EUR 107,619.00 102,691.76 0.07Ubs Group F 1.25% 18-17.04.25 500,000 EUR 499,540.00 519,058.00 0.35Ubs Group F 3.491% 17-23.05.23 560,000 USD 507,389.71 504,082.02 0.34Ubs Grp Fdg 4.125% 15-24.09.25 200,000 USD 169,068.19 187,420.70 0.13Uk 1.5% 16-22.07.26 100,000 GBP 119,504.83 117,963.53 0.08Uk 1.75% 16-07.09.37 20,000 GBP 22,688.10 23,783.23 0.02Uk 3.5% 14-22.01.45 90,000 GBP 135,402.85 143,884.10 0.10Uk 4.25% 08-07.12.49 60,000 GBP 110,717.98 112,867.00 0.08Uk 6% 98-07.12.28 115,000 GBP 187,755.61 189,126.74 0.13Uk Tsy Gilt 1.625% 18-22.10.28 250,000 GBP 301,639.94 298,998.77 0.20Unh 4.25% 18-15.06.48 290,000 USD 250,984.91 282,880.14 0.19Unicredit 6.572% 19-14.01.22 350,000 USD 305,863.85 326,692.50 0.22Union Paci 4.375% 15-15.11.65 150,000 USD 146,305.84 139,433.99 0.09Unum Group 4% 19-15.06.29 185,000 USD 162,885.34 166,743.98 0.11USA 2% 17-31.05.24 /Tbo 223,000 USD 198,091.47 198,105.18 0.13USA 2.375% 19-15.05.29 /Tbo 205,000 USD 187,527.16 186,009.90 0.13Utd Techn 1.15% 18-18.05.24 400,000 EUR 398,780.00 416,460.00 0.28Utd Techn 2.8% 17-04.05.24 600,000 USD 493,827.33 533,770.73 0.36Valero Egy 4% 19-01.04.29 75,000 USD 65,497.45 68,945.58 0.05Valero Egy 4.9% 15-15.03.45 150,000 USD 130,463.86 145,116.21 0.10Valero Ener 4.5% 18-15.03.28 130,000 USD 104,121.19 121,052.20 0.08Vattenfall 0.5% 19-24.06.26 300,000 EUR 298,911.00 303,358.80 0.20Ventas Real 3.85% 17-01.04.27 900,000 USD 796,716.97 820,465.97 0.55Verizon 2.5% 19-08.04.31 200,000 GBP 231,876.53 228,109.86 0.15Verizon 4.522% 15-15.09.48 150,000 USD 120,333.30 147,566.36 0.10Verizon Com 4.5% 17-10.08.33 260,000 USD 219,513.00 257,184.45 0.17Verizon Com 4.672% 15-15.03.55 292,000 USD 265,305.43 290,736.85 0.20Verizon Com 4.862% 15-21.08.46 200,000 USD 172,245.25 204,458.69 0.14Verizon Com 5.012% 17-15.04.49 100,000 USD 87,147.93 104,573.69 0.07Verizon Com 5.25% 17-16.03.37 175,000 USD 162,748.36 183,794.04 0.12Viacom 3.875% 14-01.04.24 300,000 USD 276,385.56 274,461.49 0.18Viacom 5.25% 14-01.04.44 400,000 USD 354,177.53 382,985.34 0.26Viacom 5.875% 17-28.02.57 90,000 USD 84,953.75 80,643.60 0.05Virgin Mone 3.375% 18-24.04.26 100,000 GBP 114,551.51 112,533.32 0.08Vistra Oper 3.55% 19-15.07.24 144a 195,000 USD 173,245.19 172,225.05 0.12Vonovia 1.8% 19-29.06.25 Regs 200,000 EUR 199,672.00 214,179.20 0.14Vonovia Fin 0.75% 18-15.01.24 300,000 EUR 297,990.00 306,310.20 0.21Vulcan Mat 4.7% 18-01.03.48 245,000 USD 198,284.84 210,900.36 0.14Vw Bk 2.5% 19-31.07.26 Regs 200,000 EUR 199,638.00 216,496.00 0.15Vw Intl 1.875% 17-30.03.27 Regs 400,000 EUR 400,140.00 414,688.00 0.28Vw Intl Fin 3.75% 14-Perp 150,000 EUR 156,150.00 156,024.00 0.10Vw Intl Fin 4.125% 18-16.11.38 100,000 EUR 99,558.00 121,620.20 0.08Vw Intl Fin Frn 4.625% 18-Perp 200,000 EUR 200,000.00 213,500.00 0.14Vw Lesng 1.5% 19-19.06.26 Regs 200,000 EUR 198,542.00 201,807.18 0.14Vw Bk 1.25% 18-10.06.24 400,000 EUR 397,183.00 408,168.80 0.27Wabtec Corp 4.15% 18-15.03.24 300,000 USD 257,539.14 278,878.49 0.19Wea Fin 3.75% 14-17.09.24 144a 400,000 USD 326,000.96 366,566.44 0.25Wellpoint 3.125% 12-15.05.22 860,000 USD 794,706.31 768,911.51 0.52Wellpoint 3.3% 12-15.01.23 Sr 540,000 USD 498,015.33 486,426.83 0.33Wells Fargo 3% 16-22.04.26 315,000 USD 254,223.09 279,609.45 0.19Western Gas 4% 12-01.07.22 15,000 USD 12,164.93 13,341.86 0.01Western Gas 5.3% 18-01.03.48 60,000 USD 48,711.27 48,877.10 0.03Williams P 3.9% 14-15.01.25 500,000 USD 434,625.53 460,419.83 0.31Williams P 5.25% 10-15.03.20 500,000 USD 467,523.39 447,131.35 0.30Williams P 5.4% 14-04.03.44 350,000 USD 317,977.47 339,276.49 0.23Williams Pa 3.6% 15-15.03.22 200,000 USD 183,271.50 180,203.25 0.12Wpp Finance 2.875% 16-14.09.46 150,000 GBP 176,641.53 141,217.82 0.09
Pramerica Sicav
The accompanying notes form an integral part of these financial statements.
142
Global Corporate Bond
Statement of Investmentsas at June 30, 2019 (continued)
(expressed in EUR)
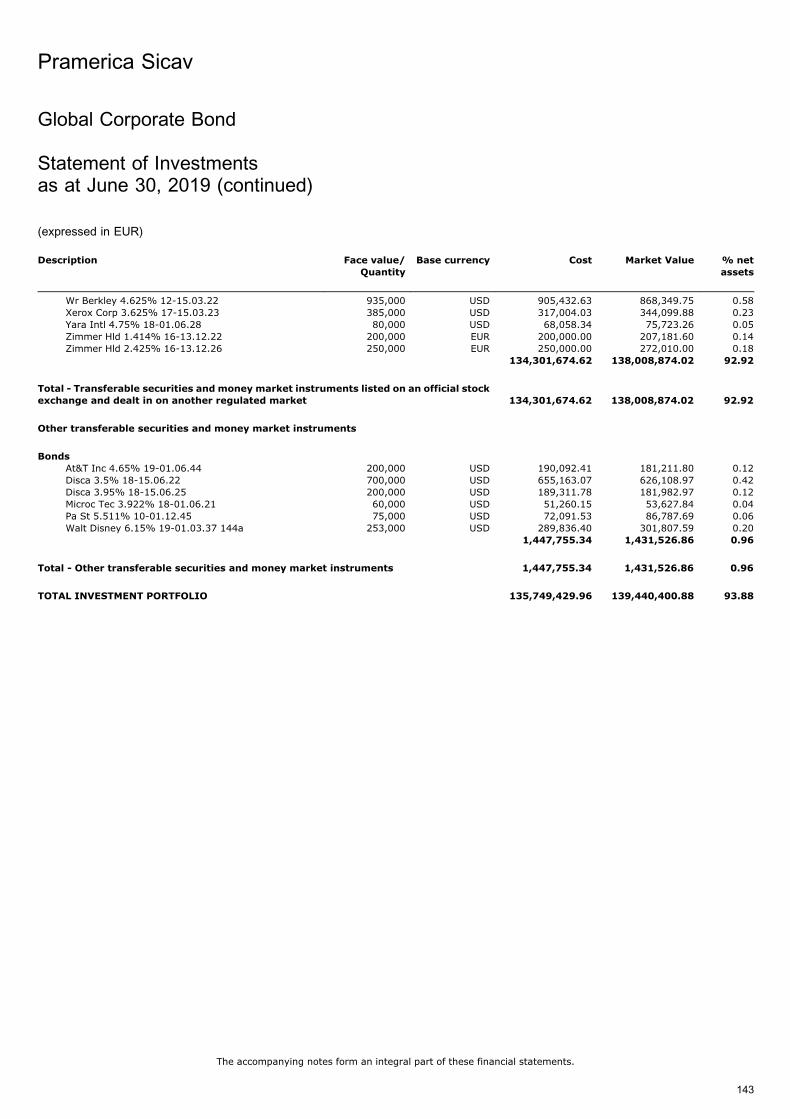
Description Face value/
Quantity
Base currency Cost Market Value % net
assets
Wr Berkley 4.625% 12-15.03.22 935,000 USD 905,432.63 868,349.75 0.58Xerox Corp 3.625% 17-15.03.23 385,000 USD 317,004.03 344,099.88 0.23Yara Intl 4.75% 18-01.06.28 80,000 USD 68,058.34 75,723.26 0.05Zimmer Hld 1.414% 16-13.12.22 200,000 EUR 200,000.00 207,181.60 0.14Zimmer Hld 2.425% 16-13.12.26 250,000 EUR 250,000.00 272,010.00 0.18
134,301,674.62 138,008,874.02 92.92
Total - Transferable securities and money market instruments listed on an official stockexchange and dealt in on another regulated market 134,301,674.62 138,008,874.02 92.92
Other transferable securities and money market instruments
Bonds
At&T Inc 4.65% 19-01.06.44 200,000 USD 190,092.41 181,211.80 0.12Disca 3.5% 18-15.06.22 700,000 USD 655,163.07 626,108.97 0.42Disca 3.95% 18-15.06.25 200,000 USD 189,311.78 181,982.97 0.12Microc Tec 3.922% 18-01.06.21 60,000 USD 51,260.15 53,627.84 0.04Pa St 5.511% 10-01.12.45 75,000 USD 72,091.53 86,787.69 0.06Walt Disney 6.15% 19-01.03.37 144a 253,000 USD 289,836.40 301,807.59 0.20
1,447,755.34 1,431,526.86 0.96
Total - Other transferable securities and money market instruments 1,447,755.34 1,431,526.86 0.96
TOTAL INVESTMENT PORTFOLIO 135,749,429.96 139,440,400.88 93.88
Pramerica Sicav
The accompanying notes form an integral part of these financial statements.
143
Global Corporate Bond
Statement of Investmentsas at June 30, 2019 (continued)
(expressed in EUR)
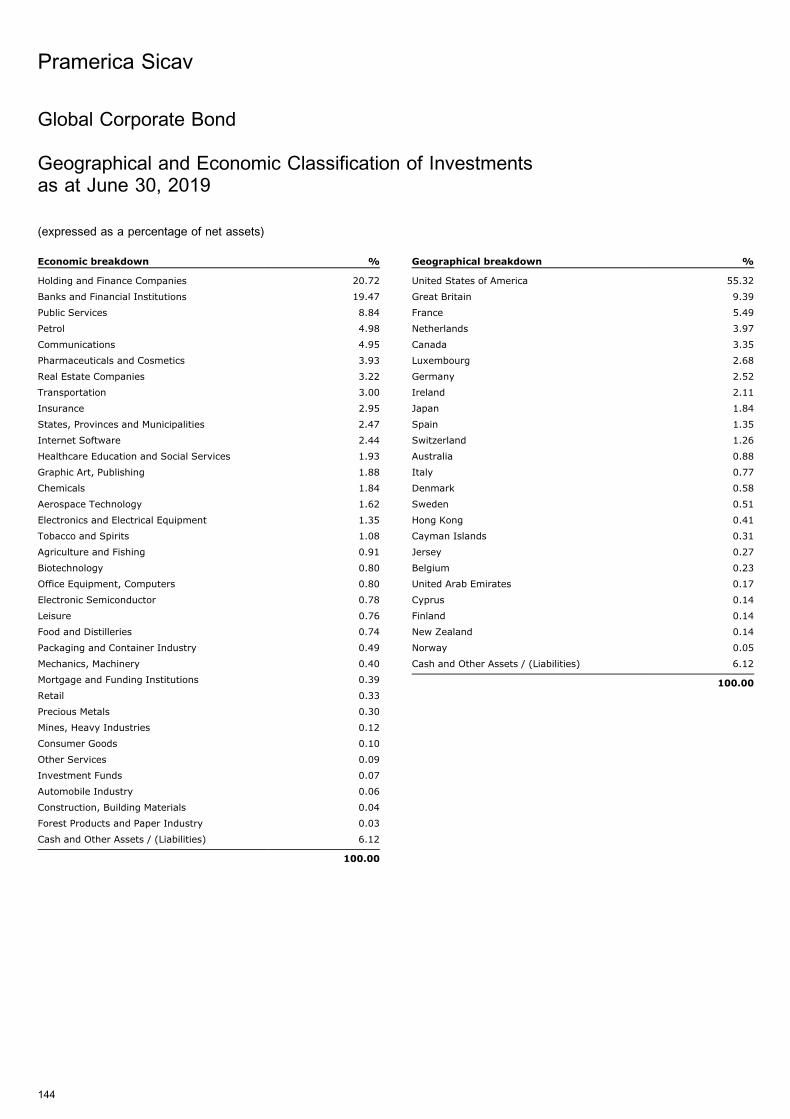
Global Corporate Bond
Geographical and Economic Classification of Investmentsas at June 30, 2019
(expressed as a percentage of net assets)
Economic breakdown %
Holding and Finance Companies 20.72
Banks and Financial Institutions 19.47
Public Services 8.84
Petrol 4.98
Communications 4.95
Pharmaceuticals and Cosmetics 3.93
Real Estate Companies 3.22
Transportation 3.00
Insurance 2.95
States, Provinces and Municipalities 2.47
Internet Software 2.44
Healthcare Education and Social Services 1.93
Graphic Art, Publishing 1.88
Chemicals 1.84
Aerospace Technology 1.62
Electronics and Electrical Equipment 1.35
Tobacco and Spirits 1.08
Agriculture and Fishing 0.91
Biotechnology 0.80
Office Equipment, Computers 0.80
Electronic Semiconductor 0.78
Leisure 0.76
Food and Distilleries 0.74
Packaging and Container Industry 0.49
Mechanics, Machinery 0.40
Mortgage and Funding Institutions 0.39
Retail 0.33
Precious Metals 0.30
Mines, Heavy Industries 0.12
Consumer Goods 0.10
Other Services 0.09
Investment Funds 0.07
Automobile Industry 0.06
Construction, Building Materials 0.04
Forest Products and Paper Industry 0.03
Cash and Other Assets / (Liabilities) 6.12
100.00
Geographical breakdown %
United States of America 55.32
Great Britain 9.39
France 5.49
Netherlands 3.97
Canada 3.35
Luxembourg 2.68
Germany 2.52
Ireland 2.11
Japan 1.84
Spain 1.35
Switzerland 1.26
Australia 0.88
Italy 0.77
Denmark 0.58
Sweden 0.51
Hong Kong 0.41
Cayman Islands 0.31
Jersey 0.27
Belgium 0.23
United Arab Emirates 0.17
Cyprus 0.14
Finland 0.14
New Zealand 0.14
Norway 0.05
Cash and Other Assets / (Liabilities) 6.12
100.00
Pramerica Sicav
144
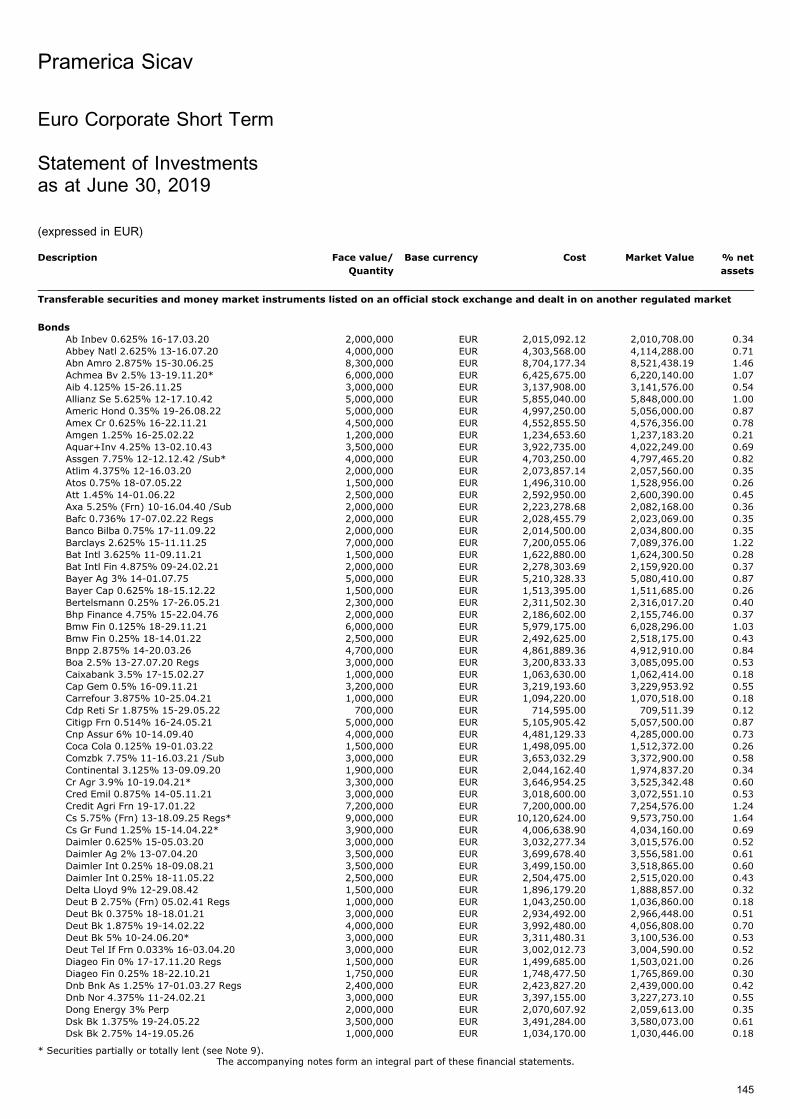
Euro Corporate Short Term
Statement of Investmentsas at June 30, 2019
(expressed in EUR)
Description Face value/
Quantity
Base currency Cost Market Value % net
assets
Transferable securities and money market instruments listed on an official stock exchange and dealt in on another regulated market
Bonds
Ab Inbev 0.625% 16-17.03.20 2,000,000 EUR 2,015,092.12 2,010,708.00 0.34Abbey Natl 2.625% 13-16.07.20 4,000,000 EUR 4,303,568.00 4,114,288.00 0.71Abn Amro 2.875% 15-30.06.25 8,300,000 EUR 8,704,177.34 8,521,438.19 1.46Achmea Bv 2.5% 13-19.11.20* 6,000,000 EUR 6,425,675.00 6,220,140.00 1.07Aib 4.125% 15-26.11.25 3,000,000 EUR 3,137,908.00 3,141,576.00 0.54Allianz Se 5.625% 12-17.10.42 5,000,000 EUR 5,855,040.00 5,848,000.00 1.00Americ Hond 0.35% 19-26.08.22 5,000,000 EUR 4,997,250.00 5,056,000.00 0.87Amex Cr 0.625% 16-22.11.21 4,500,000 EUR 4,552,855.50 4,576,356.00 0.78Amgen 1.25% 16-25.02.22 1,200,000 EUR 1,234,653.60 1,237,183.20 0.21Aquar+Inv 4.25% 13-02.10.43 3,500,000 EUR 3,922,735.00 4,022,249.00 0.69Assgen 7.75% 12-12.12.42 /Sub* 4,000,000 EUR 4,703,250.00 4,797,465.20 0.82Atlim 4.375% 12-16.03.20 2,000,000 EUR 2,073,857.14 2,057,560.00 0.35Atos 0.75% 18-07.05.22 1,500,000 EUR 1,496,310.00 1,528,956.00 0.26Att 1.45% 14-01.06.22 2,500,000 EUR 2,592,950.00 2,600,390.00 0.45Axa 5.25% (Frn) 10-16.04.40 /Sub 2,000,000 EUR 2,223,278.68 2,082,168.00 0.36Bafc 0.736% 17-07.02.22 Regs 2,000,000 EUR 2,028,455.79 2,023,069.00 0.35Banco Bilba 0.75% 17-11.09.22 2,000,000 EUR 2,014,500.00 2,034,800.00 0.35Barclays 2.625% 15-11.11.25 7,000,000 EUR 7,200,055.06 7,089,376.00 1.22Bat Intl 3.625% 11-09.11.21 1,500,000 EUR 1,622,880.00 1,624,300.50 0.28Bat Intl Fin 4.875% 09-24.02.21 2,000,000 EUR 2,278,303.69 2,159,920.00 0.37Bayer Ag 3% 14-01.07.75 5,000,000 EUR 5,210,328.33 5,080,410.00 0.87Bayer Cap 0.625% 18-15.12.22 1,500,000 EUR 1,513,395.00 1,511,685.00 0.26Bertelsmann 0.25% 17-26.05.21 2,300,000 EUR 2,311,502.30 2,316,017.20 0.40Bhp Finance 4.75% 15-22.04.76 2,000,000 EUR 2,186,602.00 2,155,746.00 0.37Bmw Fin 0.125% 18-29.11.21 6,000,000 EUR 5,979,175.00 6,028,296.00 1.03Bmw Fin 0.25% 18-14.01.22 2,500,000 EUR 2,492,625.00 2,518,175.00 0.43Bnpp 2.875% 14-20.03.26 4,700,000 EUR 4,861,889.36 4,912,910.00 0.84Boa 2.5% 13-27.07.20 Regs 3,000,000 EUR 3,200,833.33 3,085,095.00 0.53Caixabank 3.5% 17-15.02.27 1,000,000 EUR 1,063,630.00 1,062,414.00 0.18Cap Gem 0.5% 16-09.11.21 3,200,000 EUR 3,219,193.60 3,229,953.92 0.55Carrefour 3.875% 10-25.04.21 1,000,000 EUR 1,094,220.00 1,070,518.00 0.18Cdp Reti Sr 1.875% 15-29.05.22 700,000 EUR 714,595.00 709,511.39 0.12Citigp Frn 0.514% 16-24.05.21 5,000,000 EUR 5,105,905.42 5,057,500.00 0.87Cnp Assur 6% 10-14.09.40 4,000,000 EUR 4,481,129.33 4,285,000.00 0.73Coca Cola 0.125% 19-01.03.22 1,500,000 EUR 1,498,095.00 1,512,372.00 0.26Comzbk 7.75% 11-16.03.21 /Sub 3,000,000 EUR 3,653,032.29 3,372,900.00 0.58Continental 3.125% 13-09.09.20 1,900,000 EUR 2,044,162.40 1,974,837.20 0.34Cr Agr 3.9% 10-19.04.21* 3,300,000 EUR 3,646,954.25 3,525,342.48 0.60Cred Emil 0.875% 14-05.11.21 3,000,000 EUR 3,018,600.00 3,072,551.10 0.53Credit Agri Frn 19-17.01.22 7,200,000 EUR 7,200,000.00 7,254,576.00 1.24Cs 5.75% (Frn) 13-18.09.25 Regs* 9,000,000 EUR 10,120,624.00 9,573,750.00 1.64Cs Gr Fund 1.25% 15-14.04.22* 3,900,000 EUR 4,006,638.90 4,034,160.00 0.69Daimler 0.625% 15-05.03.20 3,000,000 EUR 3,032,277.34 3,015,576.00 0.52Daimler Ag 2% 13-07.04.20 3,500,000 EUR 3,699,678.40 3,556,581.00 0.61Daimler Int 0.25% 18-09.08.21 3,500,000 EUR 3,499,150.00 3,518,865.00 0.60Daimler Int 0.25% 18-11.05.22 2,500,000 EUR 2,504,475.00 2,515,020.00 0.43Delta Lloyd 9% 12-29.08.42 1,500,000 EUR 1,896,179.20 1,888,857.00 0.32Deut B 2.75% (Frn) 05.02.41 Regs 1,000,000 EUR 1,043,250.00 1,036,860.00 0.18Deut Bk 0.375% 18-18.01.21 3,000,000 EUR 2,934,492.00 2,966,448.00 0.51Deut Bk 1.875% 19-14.02.22 4,000,000 EUR 3,992,480.00 4,056,808.00 0.70Deut Bk 5% 10-24.06.20* 3,000,000 EUR 3,311,480.31 3,100,536.00 0.53Deut Tel If Frn 0.033% 16-03.04.20 3,000,000 EUR 3,002,012.73 3,004,590.00 0.52Diageo Fin 0% 17-17.11.20 Regs 1,500,000 EUR 1,499,685.00 1,503,021.00 0.26Diageo Fin 0.25% 18-22.10.21 1,750,000 EUR 1,748,477.50 1,765,869.00 0.30Dnb Bnk As 1.25% 17-01.03.27 Regs 2,400,000 EUR 2,423,827.20 2,439,000.00 0.42Dnb Nor 4.375% 11-24.02.21 3,000,000 EUR 3,397,155.00 3,227,273.10 0.55Dong Energy 3% Perp 2,000,000 EUR 2,070,607.92 2,059,613.00 0.35Dsk Bk 1.375% 19-24.05.22 3,500,000 EUR 3,491,284.00 3,580,073.00 0.61Dsk Bk 2.75% 14-19.05.26 1,000,000 EUR 1,034,170.00 1,030,446.00 0.18
Pramerica Sicav
The accompanying notes form an integral part of these financial statements.
145
* Securities partially or totally lent (see Note 9).
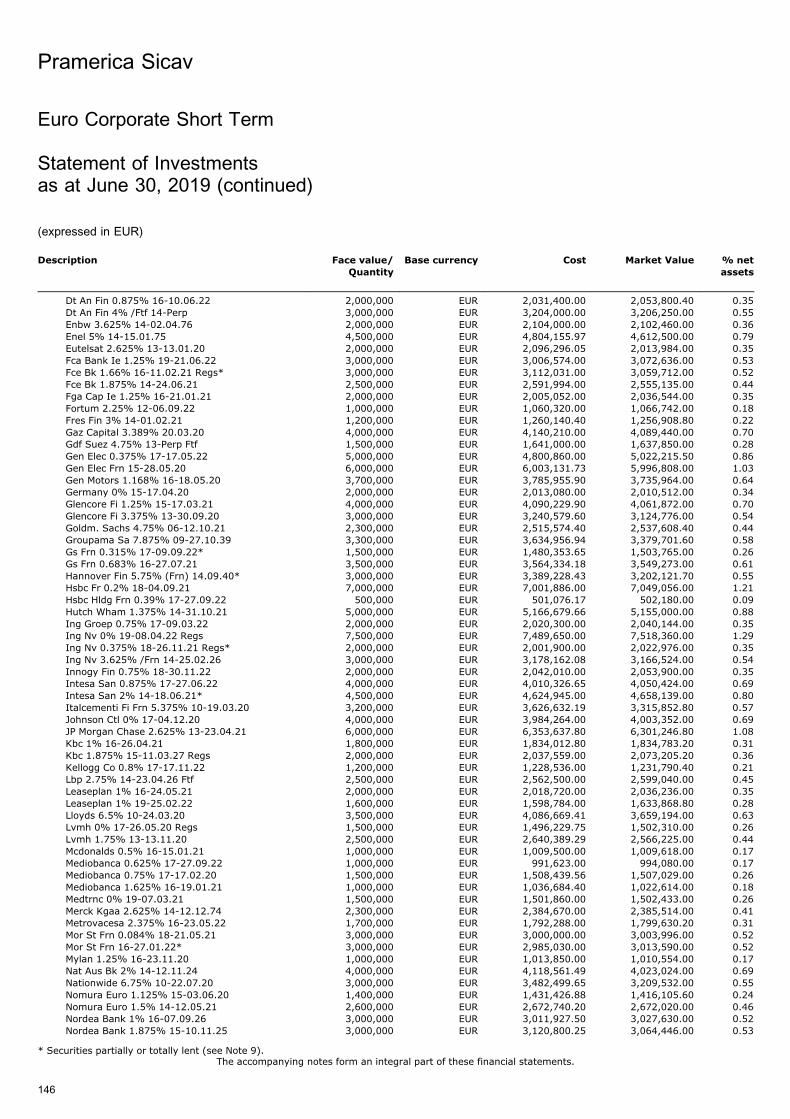
Description Face value/
Quantity
Base currency Cost Market Value % net
assets
Dt An Fin 0.875% 16-10.06.22 2,000,000 EUR 2,031,400.00 2,053,800.40 0.35Dt An Fin 4% /Ftf 14-Perp 3,000,000 EUR 3,204,000.00 3,206,250.00 0.55Enbw 3.625% 14-02.04.76 2,000,000 EUR 2,104,000.00 2,102,460.00 0.36Enel 5% 14-15.01.75 4,500,000 EUR 4,804,155.97 4,612,500.00 0.79Eutelsat 2.625% 13-13.01.20 2,000,000 EUR 2,096,296.05 2,013,984.00 0.35Fca Bank Ie 1.25% 19-21.06.22 3,000,000 EUR 3,006,574.00 3,072,636.00 0.53Fce Bk 1.66% 16-11.02.21 Regs* 3,000,000 EUR 3,112,031.00 3,059,712.00 0.52Fce Bk 1.875% 14-24.06.21 2,500,000 EUR 2,591,994.00 2,555,135.00 0.44Fga Cap Ie 1.25% 16-21.01.21 2,000,000 EUR 2,005,052.00 2,036,544.00 0.35Fortum 2.25% 12-06.09.22 1,000,000 EUR 1,060,320.00 1,066,742.00 0.18Fres Fin 3% 14-01.02.21 1,200,000 EUR 1,260,140.40 1,256,908.80 0.22Gaz Capital 3.389% 20.03.20 4,000,000 EUR 4,140,210.00 4,089,440.00 0.70Gdf Suez 4.75% 13-Perp Ftf 1,500,000 EUR 1,641,000.00 1,637,850.00 0.28Gen Elec 0.375% 17-17.05.22 5,000,000 EUR 4,800,860.00 5,022,215.50 0.86Gen Elec Frn 15-28.05.20 6,000,000 EUR 6,003,131.73 5,996,808.00 1.03Gen Motors 1.168% 16-18.05.20 3,700,000 EUR 3,785,955.90 3,735,964.00 0.64Germany 0% 15-17.04.20 2,000,000 EUR 2,013,080.00 2,010,512.00 0.34Glencore Fi 1.25% 15-17.03.21 4,000,000 EUR 4,090,229.90 4,061,872.00 0.70Glencore Fi 3.375% 13-30.09.20 3,000,000 EUR 3,240,579.60 3,124,776.00 0.54Goldm. Sachs 4.75% 06-12.10.21 2,300,000 EUR 2,515,574.40 2,537,608.40 0.44Groupama Sa 7.875% 09-27.10.39 3,300,000 EUR 3,634,956.94 3,379,701.60 0.58Gs Frn 0.315% 17-09.09.22* 1,500,000 EUR 1,480,353.65 1,503,765.00 0.26Gs Frn 0.683% 16-27.07.21 3,500,000 EUR 3,564,334.18 3,549,273.00 0.61Hannover Fin 5.75% (Frn) 14.09.40* 3,000,000 EUR 3,389,228.43 3,202,121.70 0.55Hsbc Fr 0.2% 18-04.09.21 7,000,000 EUR 7,001,886.00 7,049,056.00 1.21Hsbc Hldg Frn 0.39% 17-27.09.22 500,000 EUR 501,076.17 502,180.00 0.09Hutch Wham 1.375% 14-31.10.21 5,000,000 EUR 5,166,679.66 5,155,000.00 0.88Ing Groep 0.75% 17-09.03.22 2,000,000 EUR 2,020,300.00 2,040,144.00 0.35Ing Nv 0% 19-08.04.22 Regs 7,500,000 EUR 7,489,650.00 7,518,360.00 1.29Ing Nv 0.375% 18-26.11.21 Regs* 2,000,000 EUR 2,001,900.00 2,022,976.00 0.35Ing Nv 3.625% /Frn 14-25.02.26 3,000,000 EUR 3,178,162.08 3,166,524.00 0.54Innogy Fin 0.75% 18-30.11.22 2,000,000 EUR 2,042,010.00 2,053,900.00 0.35Intesa San 0.875% 17-27.06.22 4,000,000 EUR 4,010,326.65 4,050,424.00 0.69Intesa San 2% 14-18.06.21* 4,500,000 EUR 4,624,945.00 4,658,139.00 0.80Italcementi Fi Frn 5.375% 10-19.03.20 3,200,000 EUR 3,626,632.19 3,315,852.80 0.57Johnson Ctl 0% 17-04.12.20 4,000,000 EUR 3,984,264.00 4,003,352.00 0.69JP Morgan Chase 2.625% 13-23.04.21 6,000,000 EUR 6,353,637.80 6,301,246.80 1.08Kbc 1% 16-26.04.21 1,800,000 EUR 1,834,012.80 1,834,783.20 0.31Kbc 1.875% 15-11.03.27 Regs 2,000,000 EUR 2,037,559.00 2,073,205.20 0.36Kellogg Co 0.8% 17-17.11.22 1,200,000 EUR 1,228,536.00 1,231,790.40 0.21Lbp 2.75% 14-23.04.26 Ftf 2,500,000 EUR 2,562,500.00 2,599,040.00 0.45Leaseplan 1% 16-24.05.21 2,000,000 EUR 2,018,720.00 2,036,236.00 0.35Leaseplan 1% 19-25.02.22 1,600,000 EUR 1,598,784.00 1,633,868.80 0.28Lloyds 6.5% 10-24.03.20 3,500,000 EUR 4,086,669.41 3,659,194.00 0.63Lvmh 0% 17-26.05.20 Regs 1,500,000 EUR 1,496,229.75 1,502,310.00 0.26Lvmh 1.75% 13-13.11.20 2,500,000 EUR 2,640,389.29 2,566,225.00 0.44Mcdonalds 0.5% 16-15.01.21 1,000,000 EUR 1,009,500.00 1,009,618.00 0.17Mediobanca 0.625% 17-27.09.22 1,000,000 EUR 991,623.00 994,080.00 0.17Mediobanca 0.75% 17-17.02.20 1,500,000 EUR 1,508,439.56 1,507,029.00 0.26Mediobanca 1.625% 16-19.01.21 1,000,000 EUR 1,036,684.40 1,022,614.00 0.18Medtrnc 0% 19-07.03.21 1,500,000 EUR 1,501,860.00 1,502,433.00 0.26Merck Kgaa 2.625% 14-12.12.74 2,300,000 EUR 2,384,670.00 2,385,514.00 0.41Metrovacesa 2.375% 16-23.05.22 1,700,000 EUR 1,792,288.00 1,799,630.20 0.31Mor St Frn 0.084% 18-21.05.21 3,000,000 EUR 3,000,000.00 3,003,996.00 0.52Mor St Frn 16-27.01.22* 3,000,000 EUR 2,985,030.00 3,013,590.00 0.52Mylan 1.25% 16-23.11.20 1,000,000 EUR 1,013,850.00 1,010,554.00 0.17Nat Aus Bk 2% 14-12.11.24 4,000,000 EUR 4,118,561.49 4,023,024.00 0.69Nationwide 6.75% 10-22.07.20 3,000,000 EUR 3,482,499.65 3,209,532.00 0.55Nomura Euro 1.125% 15-03.06.20 1,400,000 EUR 1,431,426.88 1,416,105.60 0.24Nomura Euro 1.5% 14-12.05.21 2,600,000 EUR 2,672,740.20 2,672,020.00 0.46Nordea Bank 1% 16-07.09.26 3,000,000 EUR 3,011,927.50 3,027,630.00 0.52Nordea Bank 1.875% 15-10.11.25 3,000,000 EUR 3,120,800.25 3,064,446.00 0.53
Pramerica Sicav
The accompanying notes form an integral part of these financial statements.
146
Euro Corporate Short Term
Statement of Investmentsas at June 30, 2019 (continued)
(expressed in EUR)
* Securities partially or totally lent (see Note 9).
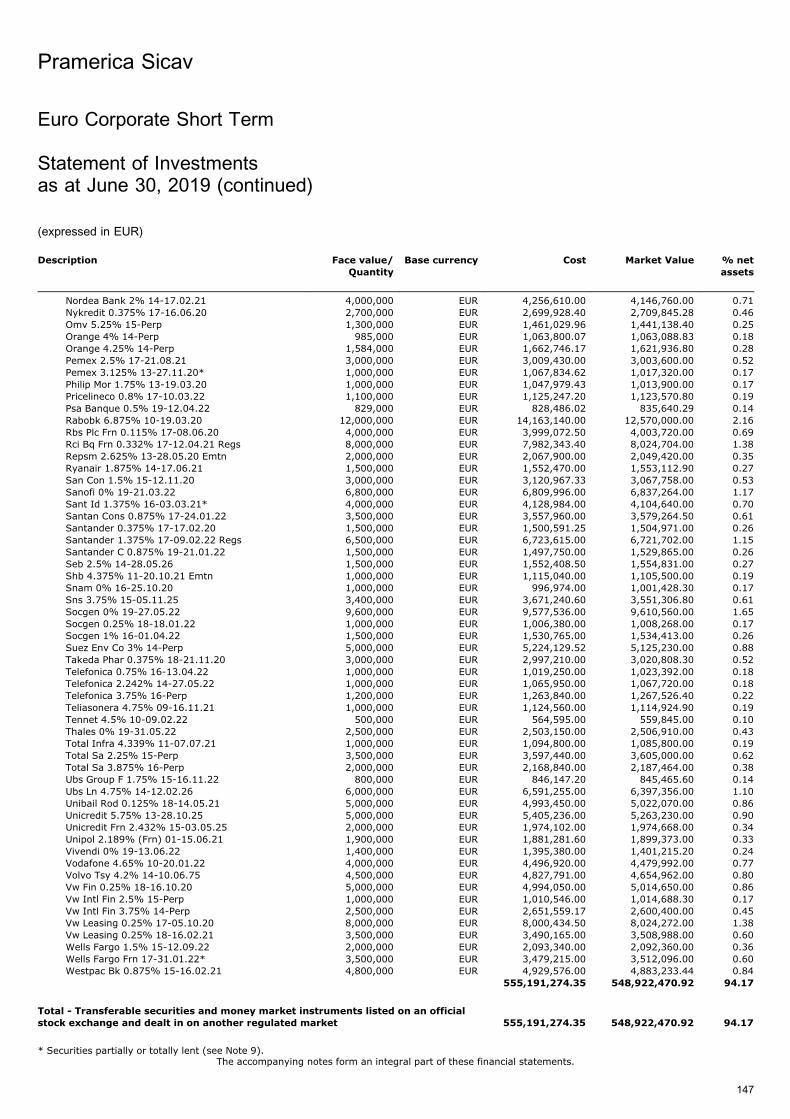
Description Face value/
Quantity
Base currency Cost Market Value % net
assets
Nordea Bank 2% 14-17.02.21 4,000,000 EUR 4,256,610.00 4,146,760.00 0.71Nykredit 0.375% 17-16.06.20 2,700,000 EUR 2,699,928.40 2,709,845.28 0.46Omv 5.25% 15-Perp 1,300,000 EUR 1,461,029.96 1,441,138.40 0.25Orange 4% 14-Perp 985,000 EUR 1,063,800.07 1,063,088.83 0.18Orange 4.25% 14-Perp 1,584,000 EUR 1,662,746.17 1,621,936.80 0.28Pemex 2.5% 17-21.08.21 3,000,000 EUR 3,009,430.00 3,003,600.00 0.52Pemex 3.125% 13-27.11.20* 1,000,000 EUR 1,067,834.62 1,017,320.00 0.17Philip Mor 1.75% 13-19.03.20 1,000,000 EUR 1,047,979.43 1,013,900.00 0.17Pricelineco 0.8% 17-10.03.22 1,100,000 EUR 1,125,247.20 1,123,570.80 0.19Psa Banque 0.5% 19-12.04.22 829,000 EUR 828,486.02 835,640.29 0.14Rabobk 6.875% 10-19.03.20 12,000,000 EUR 14,163,140.00 12,570,000.00 2.16Rbs Plc Frn 0.115% 17-08.06.20 4,000,000 EUR 3,999,072.50 4,003,720.00 0.69Rci Bq Frn 0.332% 17-12.04.21 Regs 8,000,000 EUR 7,982,343.40 8,024,704.00 1.38Repsm 2.625% 13-28.05.20 Emtn 2,000,000 EUR 2,067,900.00 2,049,420.00 0.35Ryanair 1.875% 14-17.06.21 1,500,000 EUR 1,552,470.00 1,553,112.90 0.27San Con 1.5% 15-12.11.20 3,000,000 EUR 3,120,967.33 3,067,758.00 0.53Sanofi 0% 19-21.03.22 6,800,000 EUR 6,809,996.00 6,837,264.00 1.17Sant Id 1.375% 16-03.03.21* 4,000,000 EUR 4,128,984.00 4,104,640.00 0.70Santan Cons 0.875% 17-24.01.22 3,500,000 EUR 3,557,960.00 3,579,264.50 0.61Santander 0.375% 17-17.02.20 1,500,000 EUR 1,500,591.25 1,504,971.00 0.26Santander 1.375% 17-09.02.22 Regs 6,500,000 EUR 6,723,615.00 6,721,702.00 1.15Santander C 0.875% 19-21.01.22 1,500,000 EUR 1,497,750.00 1,529,865.00 0.26Seb 2.5% 14-28.05.26 1,500,000 EUR 1,552,408.50 1,554,831.00 0.27Shb 4.375% 11-20.10.21 Emtn 1,000,000 EUR 1,115,040.00 1,105,500.00 0.19Snam 0% 16-25.10.20 1,000,000 EUR 996,974.00 1,001,428.30 0.17Sns 3.75% 15-05.11.25 3,400,000 EUR 3,671,240.60 3,551,306.80 0.61Socgen 0% 19-27.05.22 9,600,000 EUR 9,577,536.00 9,610,560.00 1.65Socgen 0.25% 18-18.01.22 1,000,000 EUR 1,006,380.00 1,008,268.00 0.17Socgen 1% 16-01.04.22 1,500,000 EUR 1,530,765.00 1,534,413.00 0.26Suez Env Co 3% 14-Perp 5,000,000 EUR 5,224,129.52 5,125,230.00 0.88Takeda Phar 0.375% 18-21.11.20 3,000,000 EUR 2,997,210.00 3,020,808.30 0.52Telefonica 0.75% 16-13.04.22 1,000,000 EUR 1,019,250.00 1,023,392.00 0.18Telefonica 2.242% 14-27.05.22 1,000,000 EUR 1,065,950.00 1,067,720.00 0.18Telefonica 3.75% 16-Perp 1,200,000 EUR 1,263,840.00 1,267,526.40 0.22Teliasonera 4.75% 09-16.11.21 1,000,000 EUR 1,124,560.00 1,114,924.90 0.19Tennet 4.5% 10-09.02.22 500,000 EUR 564,595.00 559,845.00 0.10Thales 0% 19-31.05.22 2,500,000 EUR 2,503,150.00 2,506,910.00 0.43Total Infra 4.339% 11-07.07.21 1,000,000 EUR 1,094,800.00 1,085,800.00 0.19Total Sa 2.25% 15-Perp 3,500,000 EUR 3,597,440.00 3,605,000.00 0.62Total Sa 3.875% 16-Perp 2,000,000 EUR 2,168,840.00 2,187,464.00 0.38Ubs Group F 1.75% 15-16.11.22 800,000 EUR 846,147.20 845,465.60 0.14Ubs Ln 4.75% 14-12.02.26 6,000,000 EUR 6,591,255.00 6,397,356.00 1.10Unibail Rod 0.125% 18-14.05.21 5,000,000 EUR 4,993,450.00 5,022,070.00 0.86Unicredit 5.75% 13-28.10.25 5,000,000 EUR 5,405,236.00 5,263,230.00 0.90Unicredit Frn 2.432% 15-03.05.25 2,000,000 EUR 1,974,102.00 1,974,668.00 0.34Unipol 2.189% (Frn) 01-15.06.21 1,900,000 EUR 1,881,281.60 1,899,373.00 0.33Vivendi 0% 19-13.06.22 1,400,000 EUR 1,395,380.00 1,401,215.20 0.24Vodafone 4.65% 10-20.01.22 4,000,000 EUR 4,496,920.00 4,479,992.00 0.77Volvo Tsy 4.2% 14-10.06.75 4,500,000 EUR 4,827,791.00 4,654,962.00 0.80Vw Fin 0.25% 18-16.10.20 5,000,000 EUR 4,994,050.00 5,014,650.00 0.86Vw Intl Fin 2.5% 15-Perp 1,000,000 EUR 1,010,546.00 1,014,688.30 0.17Vw Intl Fin 3.75% 14-Perp 2,500,000 EUR 2,651,559.17 2,600,400.00 0.45Vw Leasing 0.25% 17-05.10.20 8,000,000 EUR 8,000,434.50 8,024,272.00 1.38Vw Leasing 0.25% 18-16.02.21 3,500,000 EUR 3,490,165.00 3,508,988.00 0.60Wells Fargo 1.5% 15-12.09.22 2,000,000 EUR 2,093,340.00 2,092,360.00 0.36Wells Fargo Frn 17-31.01.22* 3,500,000 EUR 3,479,215.00 3,512,096.00 0.60Westpac Bk 0.875% 15-16.02.21 4,800,000 EUR 4,929,576.00 4,883,233.44 0.84
555,191,274.35 548,922,470.92 94.17
Total - Transferable securities and money market instruments listed on an officialstock exchange and dealt in on another regulated market 555,191,274.35 548,922,470.92 94.17
Pramerica Sicav
The accompanying notes form an integral part of these financial statements.
147
Euro Corporate Short Term
Statement of Investmentsas at June 30, 2019 (continued)
(expressed in EUR)
* Securities partially or totally lent (see Note 9).
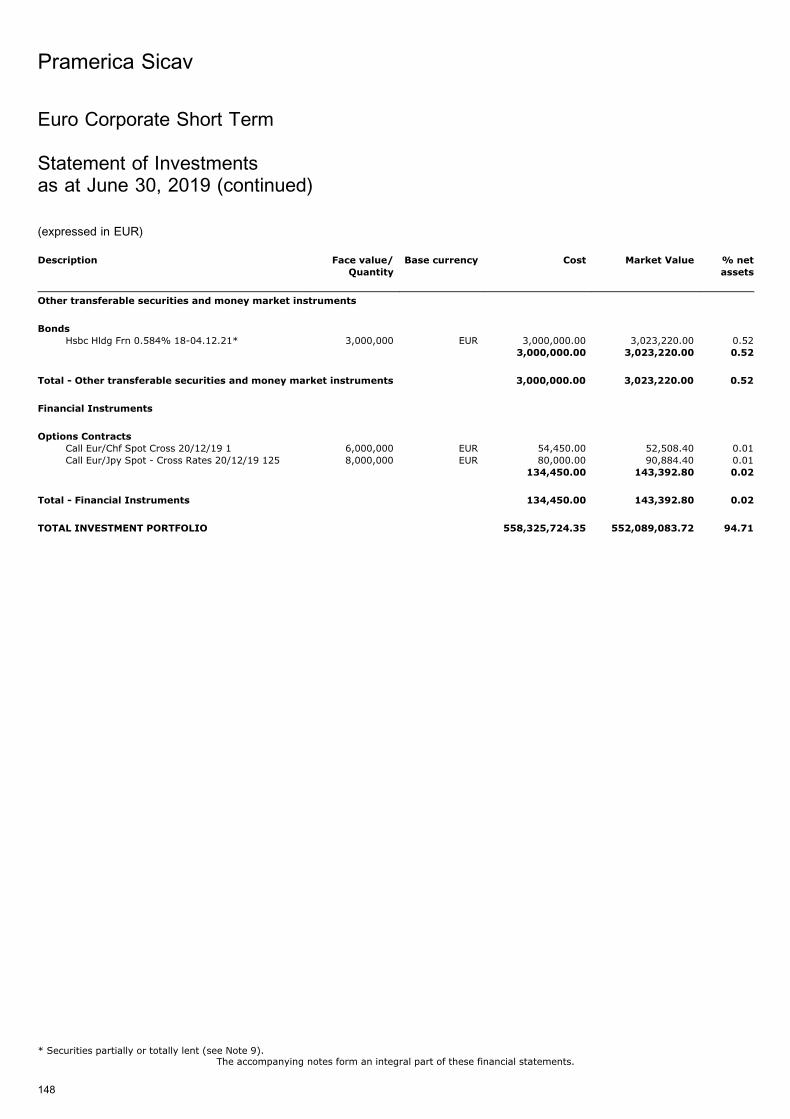
Description Face value/
Quantity
Base currency Cost Market Value % net
assets
Other transferable securities and money market instruments
Bonds
Hsbc Hldg Frn 0.584% 18-04.12.21* 3,000,000 EUR 3,000,000.00 3,023,220.00 0.523,000,000.00 3,023,220.00 0.52
Total - Other transferable securities and money market instruments 3,000,000.00 3,023,220.00 0.52
Financial Instruments
Options ContractsCall Eur/Chf Spot Cross 20/12/19 1 6,000,000 EUR 54,450.00 52,508.40 0.01Call Eur/Jpy Spot - Cross Rates 20/12/19 125 8,000,000 EUR 80,000.00 90,884.40 0.01
134,450.00 143,392.80 0.02
Total - Financial Instruments 134,450.00 143,392.80 0.02
TOTAL INVESTMENT PORTFOLIO 558,325,724.35 552,089,083.72 94.71
Pramerica Sicav
The accompanying notes form an integral part of these financial statements.
148
Euro Corporate Short Term
Statement of Investmentsas at June 30, 2019 (continued)
(expressed in EUR)
* Securities partially or totally lent (see Note 9).
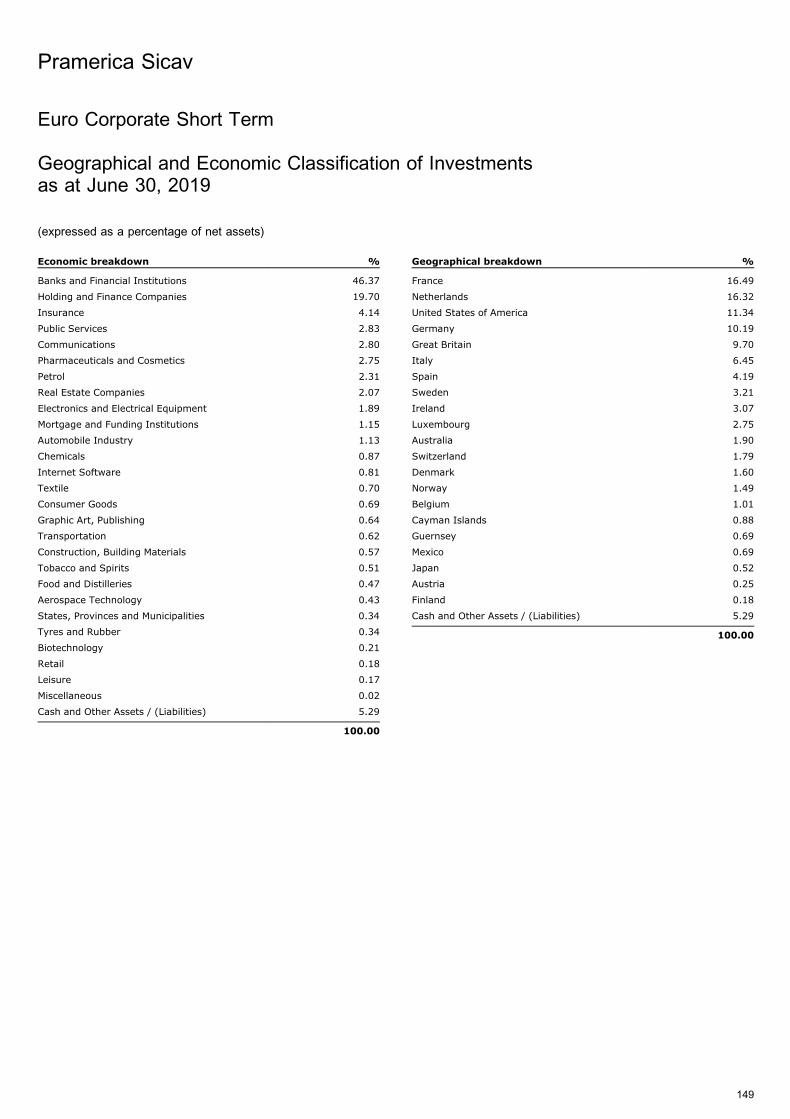
Euro Corporate Short Term
Geographical and Economic Classification of Investmentsas at June 30, 2019
(expressed as a percentage of net assets)
Economic breakdown %
Banks and Financial Institutions 46.37
Holding and Finance Companies 19.70
Insurance 4.14
Public Services 2.83
Communications 2.80
Pharmaceuticals and Cosmetics 2.75
Petrol 2.31
Real Estate Companies 2.07
Electronics and Electrical Equipment 1.89
Mortgage and Funding Institutions 1.15
Automobile Industry 1.13
Chemicals 0.87
Internet Software 0.81
Textile 0.70
Consumer Goods 0.69
Graphic Art, Publishing 0.64
Transportation 0.62
Construction, Building Materials 0.57
Tobacco and Spirits 0.51
Food and Distilleries 0.47
Aerospace Technology 0.43
States, Provinces and Municipalities 0.34
Tyres and Rubber 0.34
Biotechnology 0.21
Retail 0.18
Leisure 0.17
Miscellaneous 0.02
Cash and Other Assets / (Liabilities) 5.29
100.00
Geographical breakdown %
France 16.49
Netherlands 16.32
United States of America 11.34
Germany 10.19
Great Britain 9.70
Italy 6.45
Spain 4.19
Sweden 3.21
Ireland 3.07
Luxembourg 2.75
Australia 1.90
Switzerland 1.79
Denmark 1.60
Norway 1.49
Belgium 1.01
Cayman Islands 0.88
Guernsey 0.69
Mexico 0.69
Japan 0.52
Austria 0.25
Finland 0.18
Cash and Other Assets / (Liabilities) 5.29
100.00
Pramerica Sicav
149
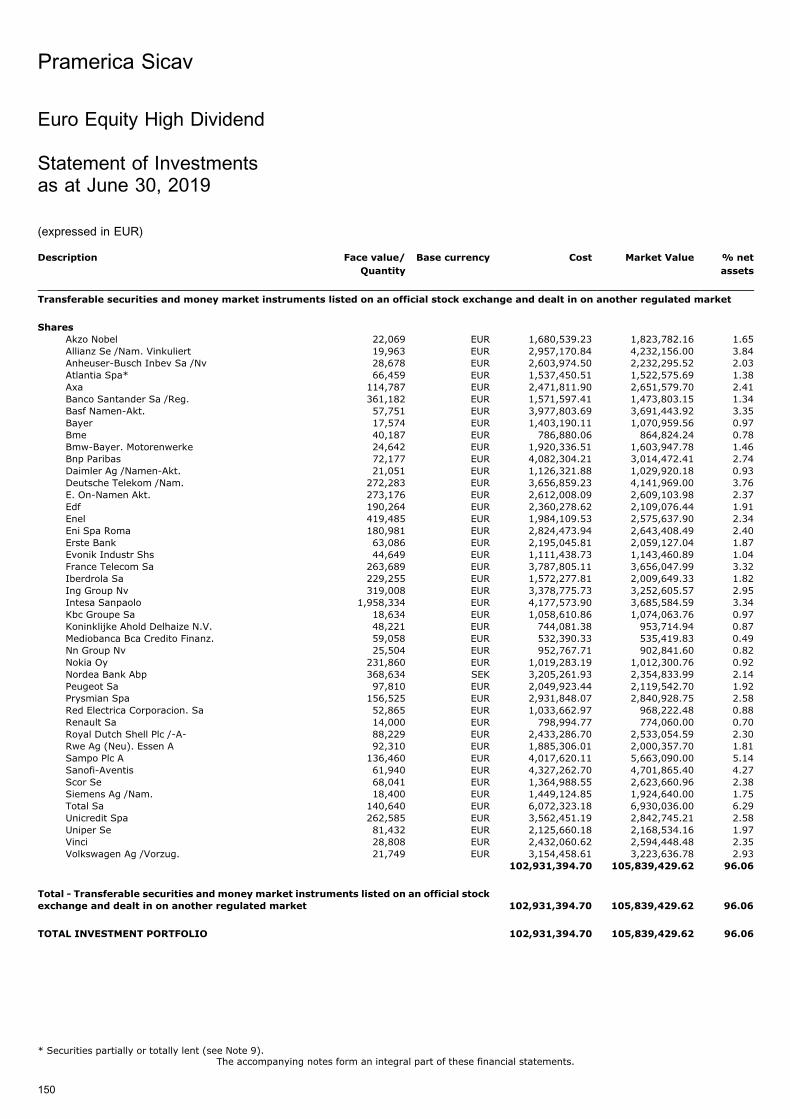
Euro Equity High Dividend
Statement of Investmentsas at June 30, 2019
(expressed in EUR)
Description Face value/
Quantity
Base currency Cost Market Value % net
assets
Transferable securities and money market instruments listed on an official stock exchange and dealt in on another regulated market
Shares
Akzo Nobel 22,069 EUR 1,680,539.23 1,823,782.16 1.65Allianz Se /Nam. Vinkuliert 19,963 EUR 2,957,170.84 4,232,156.00 3.84Anheuser-Busch Inbev Sa /Nv 28,678 EUR 2,603,974.50 2,232,295.52 2.03Atlantia Spa* 66,459 EUR 1,537,450.51 1,522,575.69 1.38Axa 114,787 EUR 2,471,811.90 2,651,579.70 2.41Banco Santander Sa /Reg. 361,182 EUR 1,571,597.41 1,473,803.15 1.34Basf Namen-Akt. 57,751 EUR 3,977,803.69 3,691,443.92 3.35Bayer 17,574 EUR 1,403,190.11 1,070,959.56 0.97Bme 40,187 EUR 786,880.06 864,824.24 0.78Bmw-Bayer. Motorenwerke 24,642 EUR 1,920,336.51 1,603,947.78 1.46Bnp Paribas 72,177 EUR 4,082,304.21 3,014,472.41 2.74Daimler Ag /Namen-Akt. 21,051 EUR 1,126,321.88 1,029,920.18 0.93Deutsche Telekom /Nam. 272,283 EUR 3,656,859.23 4,141,969.00 3.76E. On-Namen Akt. 273,176 EUR 2,612,008.09 2,609,103.98 2.37Edf 190,264 EUR 2,360,278.62 2,109,076.44 1.91Enel 419,485 EUR 1,984,109.53 2,575,637.90 2.34Eni Spa Roma 180,981 EUR 2,824,473.94 2,643,408.49 2.40Erste Bank 63,086 EUR 2,195,045.81 2,059,127.04 1.87Evonik Industr Shs 44,649 EUR 1,111,438.73 1,143,460.89 1.04France Telecom Sa 263,689 EUR 3,787,805.11 3,656,047.99 3.32Iberdrola Sa 229,255 EUR 1,572,277.81 2,009,649.33 1.82Ing Group Nv 319,008 EUR 3,378,775.73 3,252,605.57 2.95Intesa Sanpaolo 1,958,334 EUR 4,177,573.90 3,685,584.59 3.34Kbc Groupe Sa 18,634 EUR 1,058,610.86 1,074,063.76 0.97Koninklijke Ahold Delhaize N.V. 48,221 EUR 744,081.38 953,714.94 0.87Mediobanca Bca Credito Finanz. 59,058 EUR 532,390.33 535,419.83 0.49Nn Group Nv 25,504 EUR 952,767.71 902,841.60 0.82Nokia Oy 231,860 EUR 1,019,283.19 1,012,300.76 0.92Nordea Bank Abp 368,634 SEK 3,205,261.93 2,354,833.99 2.14Peugeot Sa 97,810 EUR 2,049,923.44 2,119,542.70 1.92Prysmian Spa 156,525 EUR 2,931,848.07 2,840,928.75 2.58Red Electrica Corporacion. Sa 52,865 EUR 1,033,662.97 968,222.48 0.88Renault Sa 14,000 EUR 798,994.77 774,060.00 0.70Royal Dutch Shell Plc /-A- 88,229 EUR 2,433,286.70 2,533,054.59 2.30Rwe Ag (Neu). Essen A 92,310 EUR 1,885,306.01 2,000,357.70 1.81Sampo Plc A 136,460 EUR 4,017,620.11 5,663,090.00 5.14Sanofi-Aventis 61,940 EUR 4,327,262.70 4,701,865.40 4.27Scor Se 68,041 EUR 1,364,988.55 2,623,660.96 2.38Siemens Ag /Nam. 18,400 EUR 1,449,124.85 1,924,640.00 1.75Total Sa 140,640 EUR 6,072,323.18 6,930,036.00 6.29Unicredit Spa 262,585 EUR 3,562,451.19 2,842,745.21 2.58Uniper Se 81,432 EUR 2,125,660.18 2,168,534.16 1.97Vinci 28,808 EUR 2,432,060.62 2,594,448.48 2.35Volkswagen Ag /Vorzug. 21,749 EUR 3,154,458.61 3,223,636.78 2.93
102,931,394.70 105,839,429.62 96.06
Total - Transferable securities and money market instruments listed on an official stock
exchange and dealt in on another regulated market 102,931,394.70 105,839,429.62 96.06
TOTAL INVESTMENT PORTFOLIO 102,931,394.70 105,839,429.62 96.06
Pramerica Sicav
The accompanying notes form an integral part of these financial statements.
150
* Securities partially or totally lent (see Note 9).
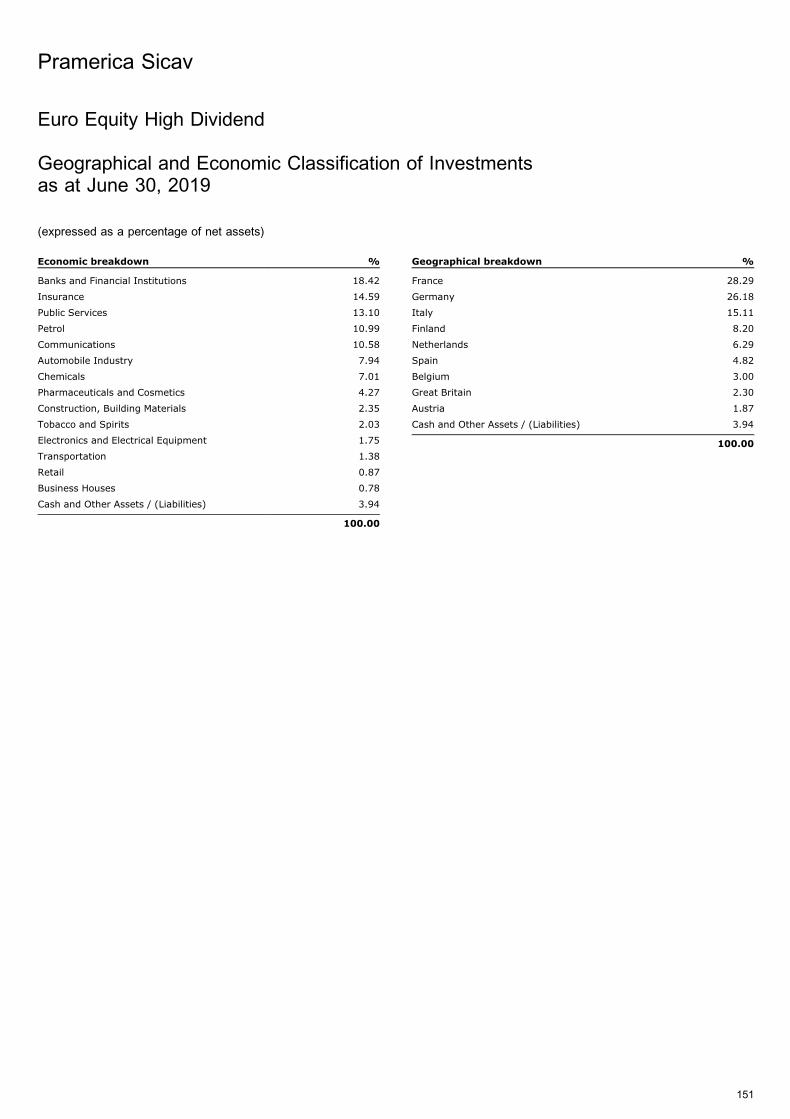
Euro Equity High Dividend
Geographical and Economic Classification of Investmentsas at June 30, 2019
(expressed as a percentage of net assets)
Economic breakdown %
Banks and Financial Institutions 18.42
Insurance 14.59
Public Services 13.10
Petrol 10.99
Communications 10.58
Automobile Industry 7.94
Chemicals 7.01
Pharmaceuticals and Cosmetics 4.27
Construction, Building Materials 2.35
Tobacco and Spirits 2.03
Electronics and Electrical Equipment 1.75
Transportation 1.38
Retail 0.87
Business Houses 0.78
Cash and Other Assets / (Liabilities) 3.94
100.00
Geographical breakdown %
France 28.29
Germany 26.18
Italy 15.11
Finland 8.20
Netherlands 6.29
Spain 4.82
Belgium 3.00
Great Britain 2.30
Austria 1.87
Cash and Other Assets / (Liabilities) 3.94
100.00
Pramerica Sicav
151
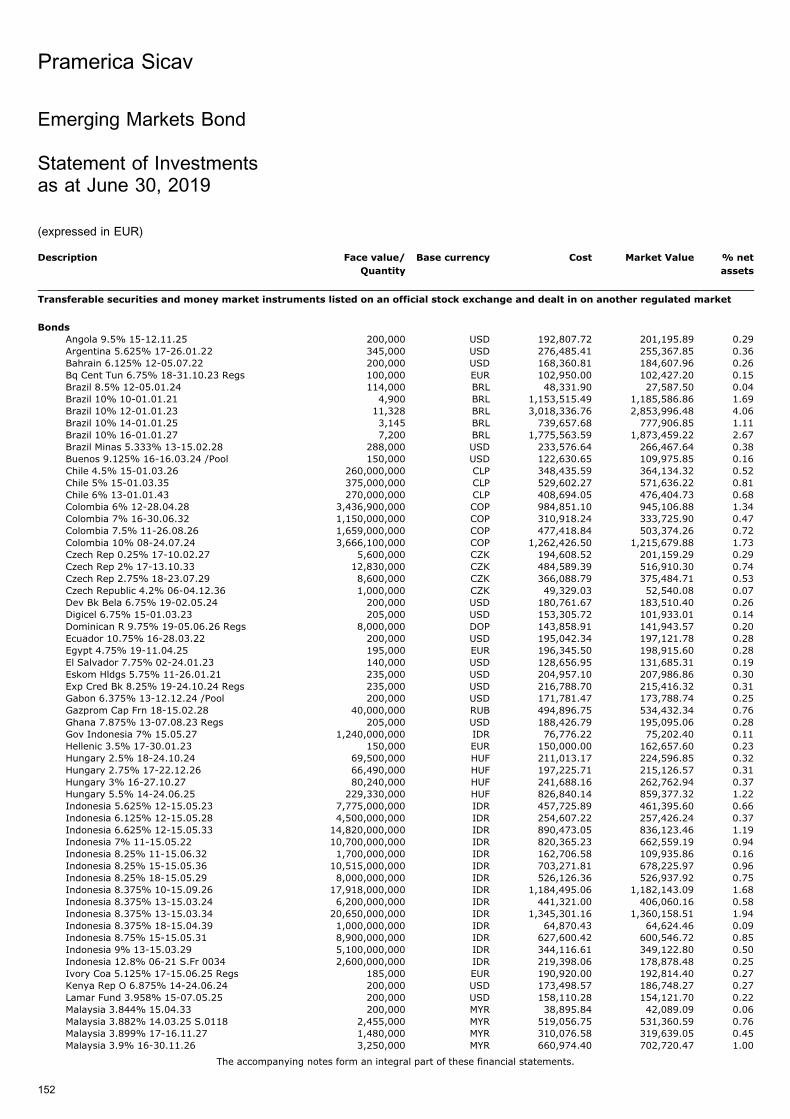
Emerging Markets Bond
Statement of Investmentsas at June 30, 2019
(expressed in EUR)
Description Face value/
Quantity
Base currency Cost Market Value % net
assets
Transferable securities and money market instruments listed on an official stock exchange and dealt in on another regulated market
Bonds
Angola 9.5% 15-12.11.25 200,000 USD 192,807.72 201,195.89 0.29Argentina 5.625% 17-26.01.22 345,000 USD 276,485.41 255,367.85 0.36Bahrain 6.125% 12-05.07.22 200,000 USD 168,360.81 184,607.96 0.26Bq Cent Tun 6.75% 18-31.10.23 Regs 100,000 EUR 102,950.00 102,427.20 0.15Brazil 8.5% 12-05.01.24 114,000 BRL 48,331.90 27,587.50 0.04Brazil 10% 10-01.01.21 4,900 BRL 1,153,515.49 1,185,586.86 1.69Brazil 10% 12-01.01.23 11,328 BRL 3,018,336.76 2,853,996.48 4.06Brazil 10% 14-01.01.25 3,145 BRL 739,657.68 777,906.85 1.11Brazil 10% 16-01.01.27 7,200 BRL 1,775,563.59 1,873,459.22 2.67Brazil Minas 5.333% 13-15.02.28 288,000 USD 233,576.64 266,467.64 0.38Buenos 9.125% 16-16.03.24 /Pool 150,000 USD 122,630.65 109,975.85 0.16Chile 4.5% 15-01.03.26 260,000,000 CLP 348,435.59 364,134.32 0.52Chile 5% 15-01.03.35 375,000,000 CLP 529,602.27 571,636.22 0.81Chile 6% 13-01.01.43 270,000,000 CLP 408,694.05 476,404.73 0.68Colombia 6% 12-28.04.28 3,436,900,000 COP 984,851.10 945,106.88 1.34Colombia 7% 16-30.06.32 1,150,000,000 COP 310,918.24 333,725.90 0.47Colombia 7.5% 11-26.08.26 1,659,000,000 COP 477,418.84 503,374.26 0.72Colombia 10% 08-24.07.24 3,666,100,000 COP 1,262,426.50 1,215,679.88 1.73Czech Rep 0.25% 17-10.02.27 5,600,000 CZK 194,608.52 201,159.29 0.29Czech Rep 2% 17-13.10.33 12,830,000 CZK 484,589.39 516,910.30 0.74Czech Rep 2.75% 18-23.07.29 8,600,000 CZK 366,088.79 375,484.71 0.53Czech Republic 4.2% 06-04.12.36 1,000,000 CZK 49,329.03 52,540.08 0.07Dev Bk Bela 6.75% 19-02.05.24 200,000 USD 180,761.67 183,510.40 0.26Digicel 6.75% 15-01.03.23 205,000 USD 153,305.72 101,933.01 0.14Dominican R 9.75% 19-05.06.26 Regs 8,000,000 DOP 143,858.91 141,943.57 0.20Ecuador 10.75% 16-28.03.22 200,000 USD 195,042.34 197,121.78 0.28Egypt 4.75% 19-11.04.25 195,000 EUR 196,345.50 198,915.60 0.28El Salvador 7.75% 02-24.01.23 140,000 USD 128,656.95 131,685.31 0.19Eskom Hldgs 5.75% 11-26.01.21 235,000 USD 204,957.10 207,986.86 0.30Exp Cred Bk 8.25% 19-24.10.24 Regs 235,000 USD 216,788.70 215,416.32 0.31Gabon 6.375% 13-12.12.24 /Pool 200,000 USD 171,781.47 173,788.74 0.25Gazprom Cap Frn 18-15.02.28 40,000,000 RUB 494,896.75 534,432.34 0.76Ghana 7.875% 13-07.08.23 Regs 205,000 USD 188,426.79 195,095.06 0.28Gov Indonesia 7% 15.05.27 1,240,000,000 IDR 76,776.22 75,202.40 0.11Hellenic 3.5% 17-30.01.23 150,000 EUR 150,000.00 162,657.60 0.23Hungary 2.5% 18-24.10.24 69,500,000 HUF 211,013.17 224,596.85 0.32Hungary 2.75% 17-22.12.26 66,490,000 HUF 197,225.71 215,126.57 0.31Hungary 3% 16-27.10.27 80,240,000 HUF 241,688.16 262,762.94 0.37Hungary 5.5% 14-24.06.25 229,330,000 HUF 826,840.14 859,377.32 1.22Indonesia 5.625% 12-15.05.23 7,775,000,000 IDR 457,725.89 461,395.60 0.66Indonesia 6.125% 12-15.05.28 4,500,000,000 IDR 254,607.22 257,426.24 0.37Indonesia 6.625% 12-15.05.33 14,820,000,000 IDR 890,473.05 836,123.46 1.19Indonesia 7% 11-15.05.22 10,700,000,000 IDR 820,365.23 662,559.19 0.94Indonesia 8.25% 11-15.06.32 1,700,000,000 IDR 162,706.58 109,935.86 0.16Indonesia 8.25% 15-15.05.36 10,515,000,000 IDR 703,271.81 678,225.97 0.96Indonesia 8.25% 18-15.05.29 8,000,000,000 IDR 526,126.36 526,937.92 0.75Indonesia 8.375% 10-15.09.26 17,918,000,000 IDR 1,184,495.06 1,182,143.09 1.68Indonesia 8.375% 13-15.03.24 6,200,000,000 IDR 441,321.00 406,060.16 0.58Indonesia 8.375% 13-15.03.34 20,650,000,000 IDR 1,345,301.16 1,360,158.51 1.94Indonesia 8.375% 18-15.04.39 1,000,000,000 IDR 64,870.43 64,624.46 0.09Indonesia 8.75% 15-15.05.31 8,900,000,000 IDR 627,600.42 600,546.72 0.85Indonesia 9% 13-15.03.29 5,100,000,000 IDR 344,116.61 349,122.80 0.50Indonesia 12.8% 06-21 S.Fr 0034 2,600,000,000 IDR 219,398.06 178,878.48 0.25Ivory Coa 5.125% 17-15.06.25 Regs 185,000 EUR 190,920.00 192,814.40 0.27Kenya Rep O 6.875% 14-24.06.24 200,000 USD 173,498.57 186,748.27 0.27Lamar Fund 3.958% 15-07.05.25 200,000 USD 158,110.28 154,121.70 0.22Malaysia 3.844% 15.04.33 200,000 MYR 38,895.84 42,089.09 0.06Malaysia 3.882% 14.03.25 S.0118 2,455,000 MYR 519,056.75 531,360.59 0.76Malaysia 3.899% 17-16.11.27 1,480,000 MYR 310,076.58 319,639.05 0.45Malaysia 3.9% 16-30.11.26 3,250,000 MYR 660,974.40 702,720.47 1.00
Pramerica Sicav
The accompanying notes form an integral part of these financial statements.
152
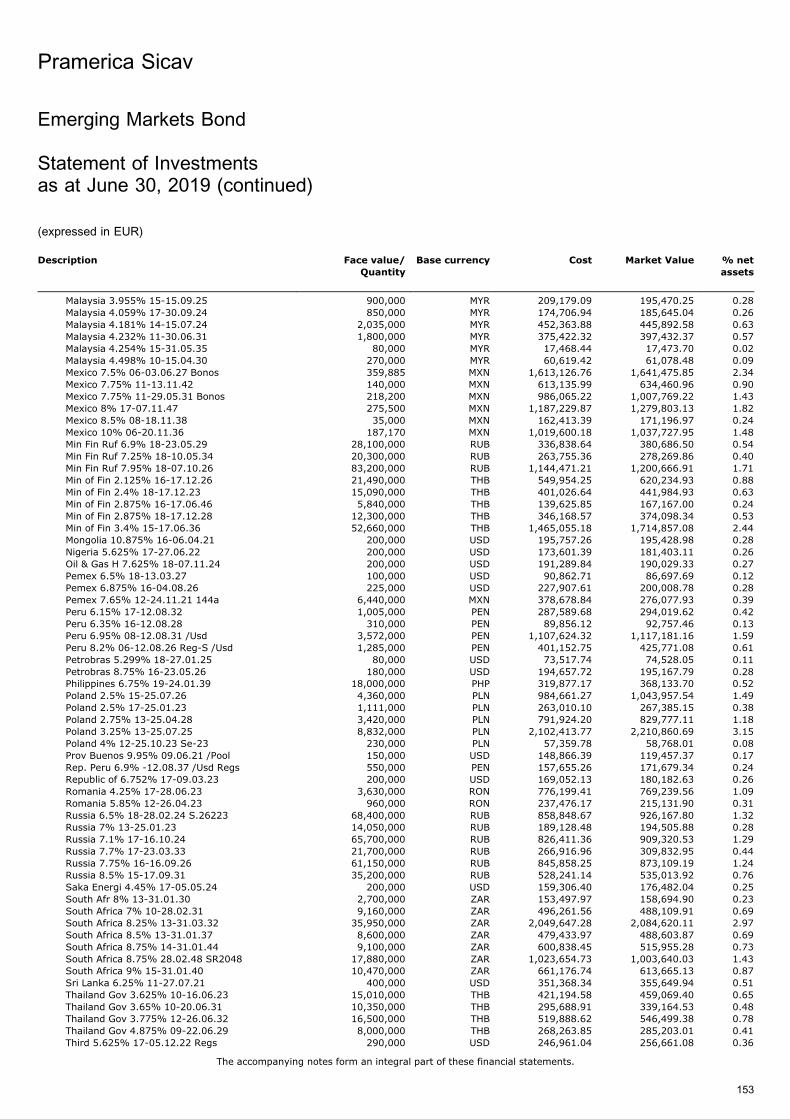
Description Face value/
Quantity
Base currency Cost Market Value % net
assets
Malaysia 3.955% 15-15.09.25 900,000 MYR 209,179.09 195,470.25 0.28Malaysia 4.059% 17-30.09.24 850,000 MYR 174,706.94 185,645.04 0.26Malaysia 4.181% 14-15.07.24 2,035,000 MYR 452,363.88 445,892.58 0.63Malaysia 4.232% 11-30.06.31 1,800,000 MYR 375,422.32 397,432.37 0.57Malaysia 4.254% 15-31.05.35 80,000 MYR 17,468.44 17,473.70 0.02Malaysia 4.498% 10-15.04.30 270,000 MYR 60,619.42 61,078.48 0.09Mexico 7.5% 06-03.06.27 Bonos 359,885 MXN 1,613,126.76 1,641,475.85 2.34Mexico 7.75% 11-13.11.42 140,000 MXN 613,135.99 634,460.96 0.90Mexico 7.75% 11-29.05.31 Bonos 218,200 MXN 986,065.22 1,007,769.22 1.43Mexico 8% 17-07.11.47 275,500 MXN 1,187,229.87 1,279,803.13 1.82Mexico 8.5% 08-18.11.38 35,000 MXN 162,413.39 171,196.97 0.24Mexico 10% 06-20.11.36 187,170 MXN 1,019,600.18 1,037,727.95 1.48Min Fin Ruf 6.9% 18-23.05.29 28,100,000 RUB 336,838.64 380,686.50 0.54Min Fin Ruf 7.25% 18-10.05.34 20,300,000 RUB 263,755.36 278,269.86 0.40Min Fin Ruf 7.95% 18-07.10.26 83,200,000 RUB 1,144,471.21 1,200,666.91 1.71Min of Fin 2.125% 16-17.12.26 21,490,000 THB 549,954.25 620,234.93 0.88Min of Fin 2.4% 18-17.12.23 15,090,000 THB 401,026.64 441,984.93 0.63Min of Fin 2.875% 16-17.06.46 5,840,000 THB 139,625.85 167,167.00 0.24Min of Fin 2.875% 18-17.12.28 12,300,000 THB 346,168.57 374,098.34 0.53Min of Fin 3.4% 15-17.06.36 52,660,000 THB 1,465,055.18 1,714,857.08 2.44Mongolia 10.875% 16-06.04.21 200,000 USD 195,757.26 195,428.98 0.28Nigeria 5.625% 17-27.06.22 200,000 USD 173,601.39 181,403.11 0.26Oil & Gas H 7.625% 18-07.11.24 200,000 USD 191,289.84 190,029.33 0.27Pemex 6.5% 18-13.03.27 100,000 USD 90,862.71 86,697.69 0.12Pemex 6.875% 16-04.08.26 225,000 USD 227,907.61 200,008.78 0.28Pemex 7.65% 12-24.11.21 144a 6,440,000 MXN 378,678.84 276,077.93 0.39Peru 6.15% 17-12.08.32 1,005,000 PEN 287,589.68 294,019.62 0.42Peru 6.35% 16-12.08.28 310,000 PEN 89,856.12 92,757.46 0.13Peru 6.95% 08-12.08.31 /Usd 3,572,000 PEN 1,107,624.32 1,117,181.16 1.59Peru 8.2% 06-12.08.26 Reg-S /Usd 1,285,000 PEN 401,152.75 425,771.08 0.61Petrobras 5.299% 18-27.01.25 80,000 USD 73,517.74 74,528.05 0.11Petrobras 8.75% 16-23.05.26 180,000 USD 194,657.72 195,167.79 0.28Philippines 6.75% 19-24.01.39 18,000,000 PHP 319,877.17 368,133.70 0.52Poland 2.5% 15-25.07.26 4,360,000 PLN 984,661.27 1,043,957.54 1.49Poland 2.5% 17-25.01.23 1,111,000 PLN 263,010.10 267,385.15 0.38Poland 2.75% 13-25.04.28 3,420,000 PLN 791,924.20 829,777.11 1.18Poland 3.25% 13-25.07.25 8,832,000 PLN 2,102,413.77 2,210,860.69 3.15Poland 4% 12-25.10.23 Se-23 230,000 PLN 57,359.78 58,768.01 0.08Prov Buenos 9.95% 09.06.21 /Pool 150,000 USD 148,866.39 119,457.37 0.17Rep. Peru 6.9% -12.08.37 /Usd Regs 550,000 PEN 157,655.26 171,679.34 0.24Republic of 6.752% 17-09.03.23 200,000 USD 169,052.13 180,182.63 0.26Romania 4.25% 17-28.06.23 3,630,000 RON 776,199.41 769,239.56 1.09Romania 5.85% 12-26.04.23 960,000 RON 237,476.17 215,131.90 0.31Russia 6.5% 18-28.02.24 S.26223 68,400,000 RUB 858,848.67 926,167.80 1.32Russia 7% 13-25.01.23 14,050,000 RUB 189,128.48 194,505.88 0.28Russia 7.1% 17-16.10.24 65,700,000 RUB 826,411.36 909,320.53 1.29Russia 7.7% 17-23.03.33 21,700,000 RUB 266,916.96 309,832.95 0.44Russia 7.75% 16-16.09.26 61,150,000 RUB 845,858.25 873,109.19 1.24Russia 8.5% 15-17.09.31 35,200,000 RUB 528,241.14 535,013.92 0.76Saka Energi 4.45% 17-05.05.24 200,000 USD 159,306.40 176,482.04 0.25South Afr 8% 13-31.01.30 2,700,000 ZAR 153,497.97 158,694.90 0.23South Africa 7% 10-28.02.31 9,160,000 ZAR 496,261.56 488,109.91 0.69South Africa 8.25% 13-31.03.32 35,950,000 ZAR 2,049,647.28 2,084,620.11 2.97South Africa 8.5% 13-31.01.37 8,600,000 ZAR 479,433.97 488,603.87 0.69South Africa 8.75% 14-31.01.44 9,100,000 ZAR 600,838.45 515,955.28 0.73South Africa 8.75% 28.02.48 SR2048 17,880,000 ZAR 1,023,654.73 1,003,640.03 1.43South Africa 9% 15-31.01.40 10,470,000 ZAR 661,176.74 613,665.13 0.87Sri Lanka 6.25% 11-27.07.21 400,000 USD 351,368.34 355,649.94 0.51Thailand Gov 3.625% 10-16.06.23 15,010,000 THB 421,194.58 459,069.40 0.65Thailand Gov 3.65% 10-20.06.31 10,350,000 THB 295,688.91 339,164.53 0.48Thailand Gov 3.775% 12-26.06.32 16,500,000 THB 519,888.62 546,499.38 0.78Thailand Gov 4.875% 09-22.06.29 8,000,000 THB 268,263.85 285,203.01 0.41Third 5.625% 17-05.12.22 Regs 290,000 USD 246,961.04 256,661.08 0.36
Pramerica Sicav
The accompanying notes form an integral part of these financial statements.
153
Emerging Markets Bond
Statement of Investmentsas at June 30, 2019 (continued)
(expressed in EUR)
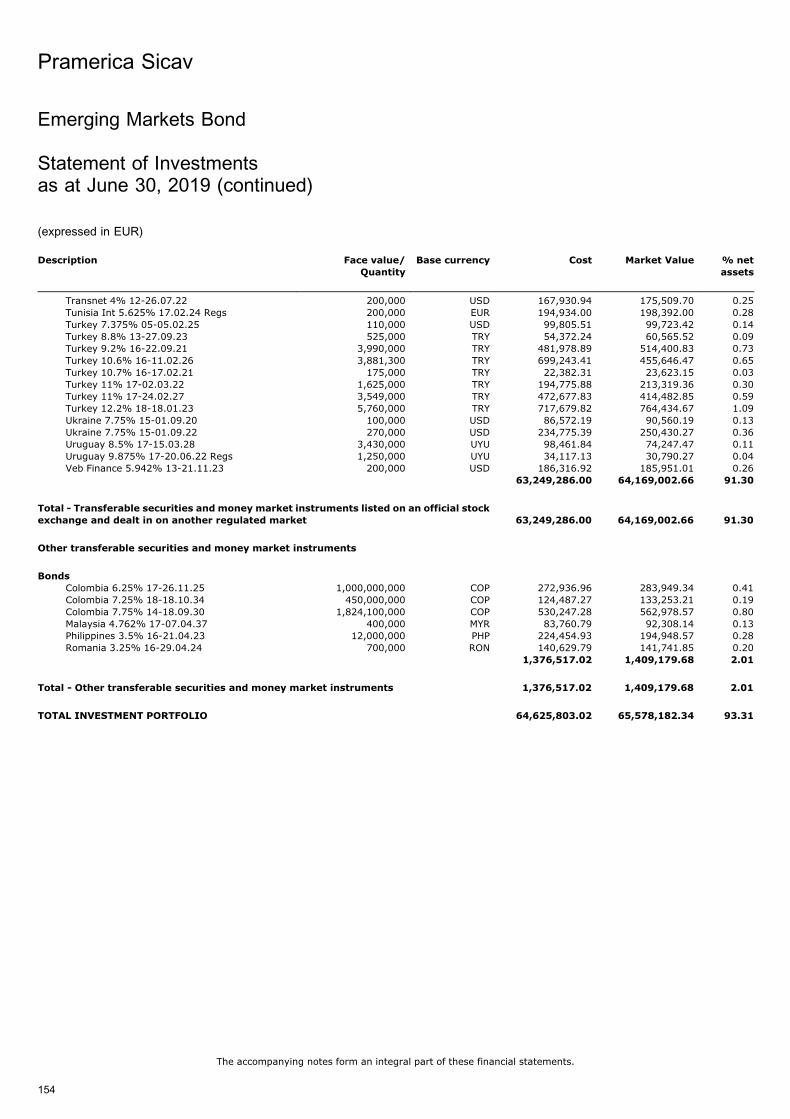
Description Face value/
Quantity
Base currency Cost Market Value % net
assets
Transnet 4% 12-26.07.22 200,000 USD 167,930.94 175,509.70 0.25Tunisia Int 5.625% 17.02.24 Regs 200,000 EUR 194,934.00 198,392.00 0.28Turkey 7.375% 05-05.02.25 110,000 USD 99,805.51 99,723.42 0.14Turkey 8.8% 13-27.09.23 525,000 TRY 54,372.24 60,565.52 0.09Turkey 9.2% 16-22.09.21 3,990,000 TRY 481,978.89 514,400.83 0.73Turkey 10.6% 16-11.02.26 3,881,300 TRY 699,243.41 455,646.47 0.65Turkey 10.7% 16-17.02.21 175,000 TRY 22,382.31 23,623.15 0.03Turkey 11% 17-02.03.22 1,625,000 TRY 194,775.88 213,319.36 0.30Turkey 11% 17-24.02.27 3,549,000 TRY 472,677.83 414,482.85 0.59Turkey 12.2% 18-18.01.23 5,760,000 TRY 717,679.82 764,434.67 1.09Ukraine 7.75% 15-01.09.20 100,000 USD 86,572.19 90,560.19 0.13Ukraine 7.75% 15-01.09.22 270,000 USD 234,775.39 250,430.27 0.36Uruguay 8.5% 17-15.03.28 3,430,000 UYU 98,461.84 74,247.47 0.11Uruguay 9.875% 17-20.06.22 Regs 1,250,000 UYU 34,117.13 30,790.27 0.04Veb Finance 5.942% 13-21.11.23 200,000 USD 186,316.92 185,951.01 0.26
63,249,286.00 64,169,002.66 91.30
Total - Transferable securities and money market instruments listed on an official stock
exchange and dealt in on another regulated market 63,249,286.00 64,169,002.66 91.30
Other transferable securities and money market instruments
BondsColombia 6.25% 17-26.11.25 1,000,000,000 COP 272,936.96 283,949.34 0.41Colombia 7.25% 18-18.10.34 450,000,000 COP 124,487.27 133,253.21 0.19Colombia 7.75% 14-18.09.30 1,824,100,000 COP 530,247.28 562,978.57 0.80Malaysia 4.762% 17-07.04.37 400,000 MYR 83,760.79 92,308.14 0.13Philippines 3.5% 16-21.04.23 12,000,000 PHP 224,454.93 194,948.57 0.28Romania 3.25% 16-29.04.24 700,000 RON 140,629.79 141,741.85 0.20
1,376,517.02 1,409,179.68 2.01
Total - Other transferable securities and money market instruments 1,376,517.02 1,409,179.68 2.01
TOTAL INVESTMENT PORTFOLIO 64,625,803.02 65,578,182.34 93.31
Pramerica Sicav
The accompanying notes form an integral part of these financial statements.
154
Emerging Markets Bond
Statement of Investmentsas at June 30, 2019 (continued)
(expressed in EUR)
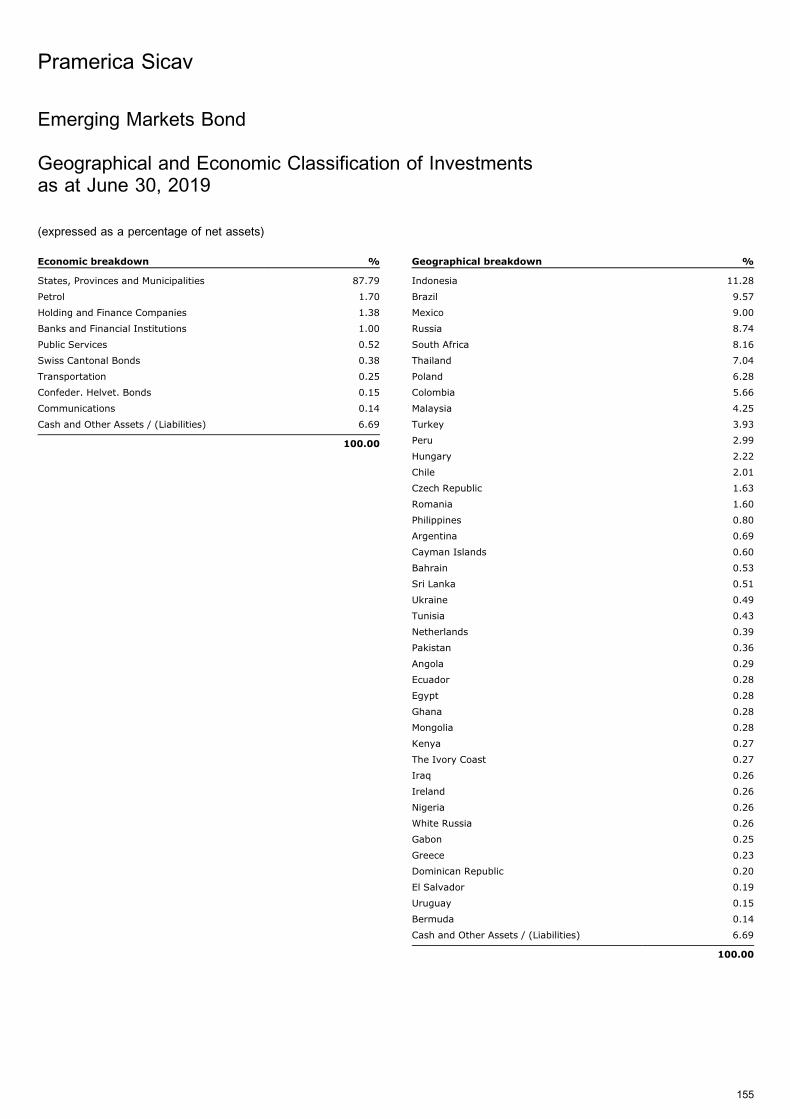
Emerging Markets Bond
Geographical and Economic Classification of Investmentsas at June 30, 2019
(expressed as a percentage of net assets)
Economic breakdown %
States, Provinces and Municipalities 87.79
Petrol 1.70
Holding and Finance Companies 1.38
Banks and Financial Institutions 1.00
Public Services 0.52
Swiss Cantonal Bonds 0.38
Transportation 0.25
Confeder. Helvet. Bonds 0.15
Communications 0.14
Cash and Other Assets / (Liabilities) 6.69
100.00
Geographical breakdown %
Indonesia 11.28
Brazil 9.57
Mexico 9.00
Russia 8.74
South Africa 8.16
Thailand 7.04
Poland 6.28
Colombia 5.66
Malaysia 4.25
Turkey 3.93
Peru 2.99
Hungary 2.22
Chile 2.01
Czech Republic 1.63
Romania 1.60
Philippines 0.80
Argentina 0.69
Cayman Islands 0.60
Bahrain 0.53
Sri Lanka 0.51
Ukraine 0.49
Tunisia 0.43
Netherlands 0.39
Pakistan 0.36
Angola 0.29
Ecuador 0.28
Egypt 0.28
Ghana 0.28
Mongolia 0.28
Kenya 0.27
The Ivory Coast 0.27
Iraq 0.26
Ireland 0.26
Nigeria 0.26
White Russia 0.26
Gabon 0.25
Greece 0.23
Dominican Republic 0.20
El Salvador 0.19
Uruguay 0.15
Bermuda 0.14
Cash and Other Assets / (Liabilities) 6.69
100.00
Pramerica Sicav
155
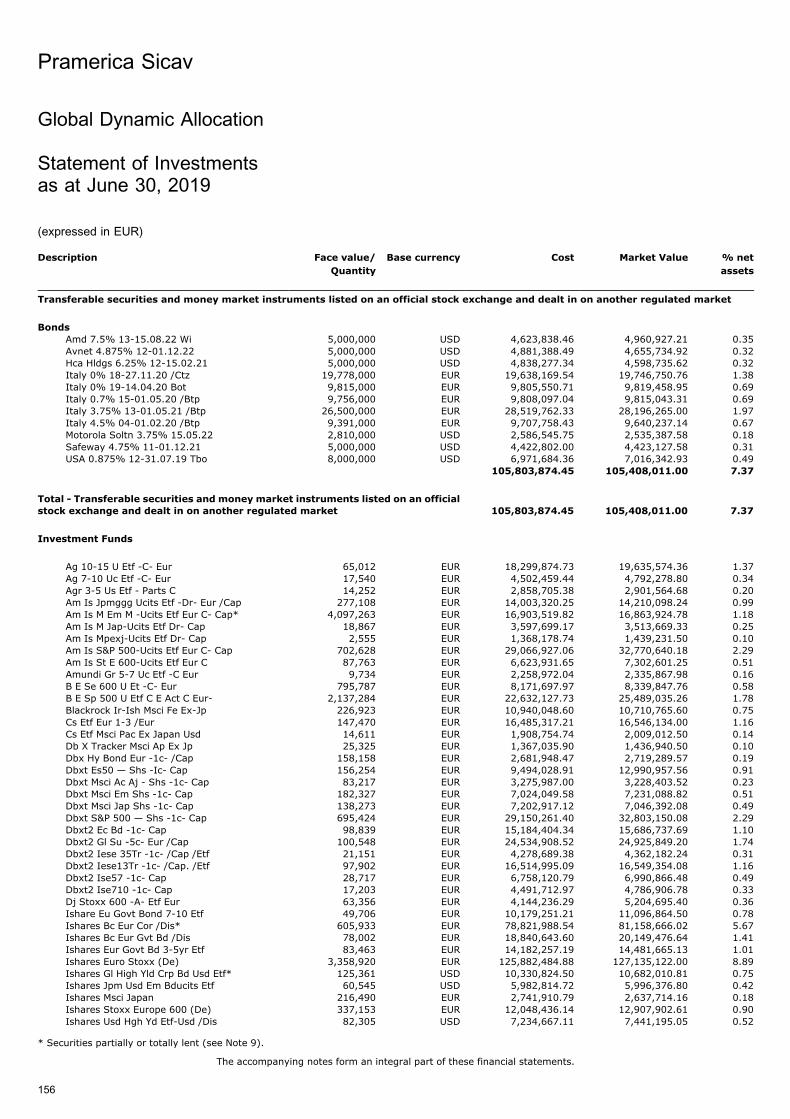
Global Dynamic Allocation
Statement of Investmentsas at June 30, 2019
(expressed in EUR)
Description Face value/
Quantity
Base currency Cost Market Value % net
assets
Transferable securities and money market instruments listed on an official stock exchange and dealt in on another regulated market
Bonds
Amd 7.5% 13-15.08.22 Wi 5,000,000 USD 4,623,838.46 4,960,927.21 0.35Avnet 4.875% 12-01.12.22 5,000,000 USD 4,881,388.49 4,655,734.92 0.32Hca Hldgs 6.25% 12-15.02.21 5,000,000 USD 4,838,277.34 4,598,735.62 0.32Italy 0% 18-27.11.20 /Ctz 19,778,000 EUR 19,638,169.54 19,746,750.76 1.38Italy 0% 19-14.04.20 Bot 9,815,000 EUR 9,805,550.71 9,819,458.95 0.69Italy 0.7% 15-01.05.20 /Btp 9,756,000 EUR 9,808,097.04 9,815,043.31 0.69Italy 3.75% 13-01.05.21 /Btp 26,500,000 EUR 28,519,762.33 28,196,265.00 1.97Italy 4.5% 04-01.02.20 /Btp 9,391,000 EUR 9,707,758.43 9,640,237.14 0.67Motorola Soltn 3.75% 15.05.22 2,810,000 USD 2,586,545.75 2,535,387.58 0.18Safeway 4.75% 11-01.12.21 5,000,000 USD 4,422,802.00 4,423,127.58 0.31USA 0.875% 12-31.07.19 Tbo 8,000,000 USD 6,971,684.36 7,016,342.93 0.49
105,803,874.45 105,408,011.00 7.37
Total - Transferable securities and money market instruments listed on an officialstock exchange and dealt in on another regulated market 105,803,874.45 105,408,011.00 7.37
Investment Funds
Ag 10-15 U Etf -C- Eur 65,012 EUR 18,299,874.73 19,635,574.36 1.37Ag 7-10 Uc Etf -C- Eur 17,540 EUR 4,502,459.44 4,792,278.80 0.34Agr 3-5 Us Etf - Parts C 14,252 EUR 2,858,705.38 2,901,564.68 0.20Am Is Jpmggg Ucits Etf -Dr- Eur /Cap 277,108 EUR 14,003,320.25 14,210,098.24 0.99Am Is M Em M -Ucits Etf Eur C- Cap* 4,097,263 EUR 16,903,519.82 16,863,924.78 1.18Am Is M Jap-Ucits Etf Dr- Cap 18,867 EUR 3,597,699.17 3,513,669.33 0.25Am Is Mpexj-Ucits Etf Dr- Cap 2,555 EUR 1,368,178.74 1,439,231.50 0.10Am Is S&P 500-Ucits Etf Eur C- Cap 702,628 EUR 29,066,927.06 32,770,640.18 2.29Am Is St E 600-Ucits Etf Eur C 87,763 EUR 6,623,931.65 7,302,601.25 0.51Amundi Gr 5-7 Uc Etf -C Eur 9,734 EUR 2,258,972.04 2,335,867.98 0.16B E Se 600 U Et -C- Eur 795,787 EUR 8,171,697.97 8,339,847.76 0.58B E Sp 500 U Etf C E Act C Eur- 2,137,284 EUR 22,632,127.73 25,489,035.26 1.78Blackrock Ir-Ish Msci Fe Ex-Jp 226,923 EUR 10,940,048.60 10,710,765.60 0.75Cs Etf Eur 1-3 /Eur 147,470 EUR 16,485,317.21 16,546,134.00 1.16Cs Etf Msci Pac Ex Japan Usd 14,611 EUR 1,908,754.74 2,009,012.50 0.14Db X Tracker Msci Ap Ex Jp 25,325 EUR 1,367,035.90 1,436,940.50 0.10Dbx Hy Bond Eur -1c- /Cap 158,158 EUR 2,681,948.47 2,719,289.57 0.19Dbxt Es50 — Shs -Ic- Cap 156,254 EUR 9,494,028.91 12,990,957.56 0.91Dbxt Msci Ac Aj - Shs -1c- Cap 83,217 EUR 3,275,987.00 3,228,403.52 0.23Dbxt Msci Em Shs -1c- Cap 182,327 EUR 7,024,049.58 7,231,088.82 0.51Dbxt Msci Jap Shs -1c- Cap 138,273 EUR 7,202,917.12 7,046,392.08 0.49Dbxt S&P 500 — Shs -1c- Cap 695,424 EUR 29,150,261.40 32,803,150.08 2.29Dbxt2 Ec Bd -1c- Cap 98,839 EUR 15,184,404.34 15,686,737.69 1.10Dbxt2 Gl Su -5c- Eur /Cap 100,548 EUR 24,534,908.52 24,925,849.20 1.74Dbxt2 Iese 35Tr -1c- /Cap /Etf 21,151 EUR 4,278,689.38 4,362,182.24 0.31Dbxt2 Iese13Tr -1c- /Cap. /Etf 97,902 EUR 16,514,995.09 16,549,354.08 1.16Dbxt2 Ise57 -1c- Cap 28,717 EUR 6,758,120.79 6,990,866.48 0.49Dbxt2 Ise710 -1c- Cap 17,203 EUR 4,491,712.97 4,786,906.78 0.33Dj Stoxx 600 -A- Etf Eur 63,356 EUR 4,144,236.29 5,204,695.40 0.36Ishare Eu Govt Bond 7-10 Etf 49,706 EUR 10,179,251.21 11,096,864.50 0.78Ishares Bc Eur Cor /Dis* 605,933 EUR 78,821,988.54 81,158,666.02 5.67Ishares Bc Eur Gvt Bd /Dis 78,002 EUR 18,840,643.60 20,149,476.64 1.41Ishares Eur Govt Bd 3-5yr Etf 83,463 EUR 14,182,257.19 14,481,665.13 1.01Ishares Euro Stoxx (De) 3,358,920 EUR 125,882,484.88 127,135,122.00 8.89Ishares Gl High Yld Crp Bd Usd Etf* 125,361 USD 10,330,824.50 10,682,010.81 0.75Ishares Jpm Usd Em Bducits Etf 60,545 USD 5,982,814.72 5,996,376.80 0.42Ishares Msci Japan 216,490 EUR 2,741,910.79 2,637,714.16 0.18Ishares Stoxx Europe 600 (De) 337,153 EUR 12,048,436.14 12,907,902.61 0.90Ishares Usd Hgh Yd Etf-Usd /Dis 82,305 USD 7,234,667.11 7,441,195.05 0.52
Pramerica Sicav
The accompanying notes form an integral part of these financial statements.
156
* Securities partially or totally lent (see Note 9).
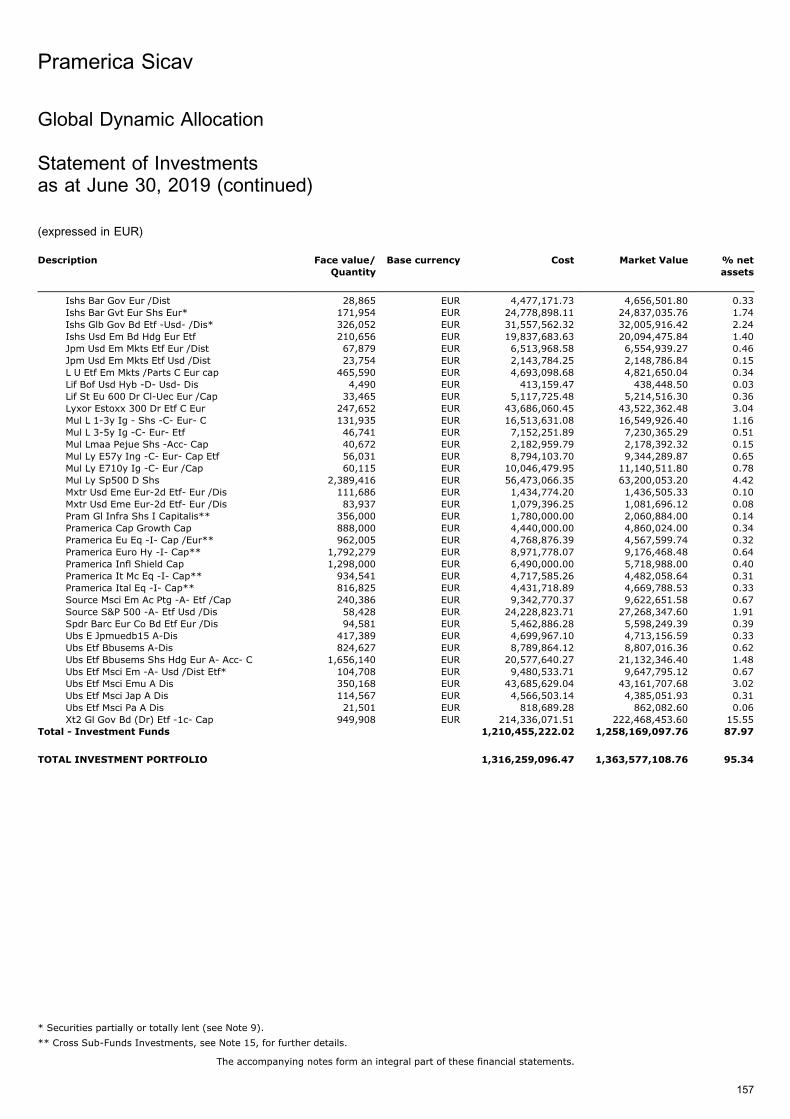
Description Face value/
Quantity
Base currency Cost Market Value % net
assets
Ishs Bar Gov Eur /Dist 28,865 EUR 4,477,171.73 4,656,501.80 0.33Ishs Bar Gvt Eur Shs Eur* 171,954 EUR 24,778,898.11 24,837,035.76 1.74Ishs Glb Gov Bd Etf -Usd- /Dis* 326,052 EUR 31,557,562.32 32,005,916.42 2.24Ishs Usd Em Bd Hdg Eur Etf 210,656 EUR 19,837,683.63 20,094,475.84 1.40Jpm Usd Em Mkts Etf Eur /Dist 67,879 EUR 6,513,968.58 6,554,939.27 0.46Jpm Usd Em Mkts Etf Usd /Dist 23,754 EUR 2,143,784.25 2,148,786.84 0.15L U Etf Em Mkts /Parts C Eur cap 465,590 EUR 4,693,098.68 4,821,650.04 0.34Lif Bof Usd Hyb -D- Usd- Dis 4,490 EUR 413,159.47 438,448.50 0.03Lif St Eu 600 Dr Cl-Uec Eur /Cap 33,465 EUR 5,117,725.48 5,214,516.30 0.36Lyxor Estoxx 300 Dr Etf C Eur 247,652 EUR 43,686,060.45 43,522,362.48 3.04Mul L 1-3y Ig - Shs -C- Eur- C 131,935 EUR 16,513,631.08 16,549,926.40 1.16Mul L 3-5y Ig -C- Eur- Etf 46,741 EUR 7,152,251.89 7,230,365.29 0.51Mul Lmaa Pejue Shs -Acc- Cap 40,672 EUR 2,182,959.79 2,178,392.32 0.15Mul Ly E57y Ing -C- Eur- Cap Etf 56,031 EUR 8,794,103.70 9,344,289.87 0.65Mul Ly E710y Ig -C- Eur /Cap 60,115 EUR 10,046,479.95 11,140,511.80 0.78Mul Ly Sp500 D Shs 2,389,416 EUR 56,473,066.35 63,200,053.20 4.42Mxtr Usd Eme Eur-2d Etf- Eur /Dis 111,686 EUR 1,434,774.20 1,436,505.33 0.10Mxtr Usd Eme Eur-2d Etf- Eur /Dis 83,937 EUR 1,079,396.25 1,081,696.12 0.08Pram Gl Infra Shs I Capitalis** 356,000 EUR 1,780,000.00 2,060,884.00 0.14Pramerica Cap Growth Cap 888,000 EUR 4,440,000.00 4,860,024.00 0.34Pramerica Eu Eq -I- Cap /Eur** 962,005 EUR 4,768,876.39 4,567,599.74 0.32Pramerica Euro Hy -I- Cap** 1,792,279 EUR 8,971,778.07 9,176,468.48 0.64Pramerica Infl Shield Cap 1,298,000 EUR 6,490,000.00 5,718,988.00 0.40Pramerica It Mc Eq -I- Cap** 934,541 EUR 4,717,585.26 4,482,058.64 0.31Pramerica Ital Eq -I- Cap** 816,825 EUR 4,431,718.89 4,669,788.53 0.33Source Msci Em Ac Ptg -A- Etf /Cap 240,386 EUR 9,342,770.37 9,622,651.58 0.67Source S&P 500 -A- Etf Usd /Dis 58,428 EUR 24,228,823.71 27,268,347.60 1.91Spdr Barc Eur Co Bd Etf Eur /Dis 94,581 EUR 5,462,886.28 5,598,249.39 0.39Ubs E Jpmuedb15 A-Dis 417,389 EUR 4,699,967.10 4,713,156.59 0.33Ubs Etf Bbusems A-Dis 824,627 EUR 8,789,864.12 8,807,016.36 0.62Ubs Etf Bbusems Shs Hdg Eur A- Acc- C 1,656,140 EUR 20,577,640.27 21,132,346.40 1.48Ubs Etf Msci Em -A- Usd /Dist Etf* 104,708 EUR 9,480,533.71 9,647,795.12 0.67Ubs Etf Msci Emu A Dis 350,168 EUR 43,685,629.04 43,161,707.68 3.02Ubs Etf Msci Jap A Dis 114,567 EUR 4,566,503.14 4,385,051.93 0.31Ubs Etf Msci Pa A Dis 21,501 EUR 818,689.28 862,082.60 0.06Xt2 Gl Gov Bd (Dr) Etf -1c- Cap 949,908 EUR 214,336,071.51 222,468,453.60 15.55
Total - Investment Funds 1,210,455,222.02 1,258,169,097.76 87.97
TOTAL INVESTMENT PORTFOLIO 1,316,259,096.47 1,363,577,108.76 95.34
Pramerica Sicav
The accompanying notes form an integral part of these financial statements.
157
Global Dynamic Allocation
Statement of Investmentsas at June 30, 2019 (continued)
(expressed in EUR)
* Securities partially or totally lent (see Note 9).
** Cross Sub-Funds Investments, see Note 15, for further details.
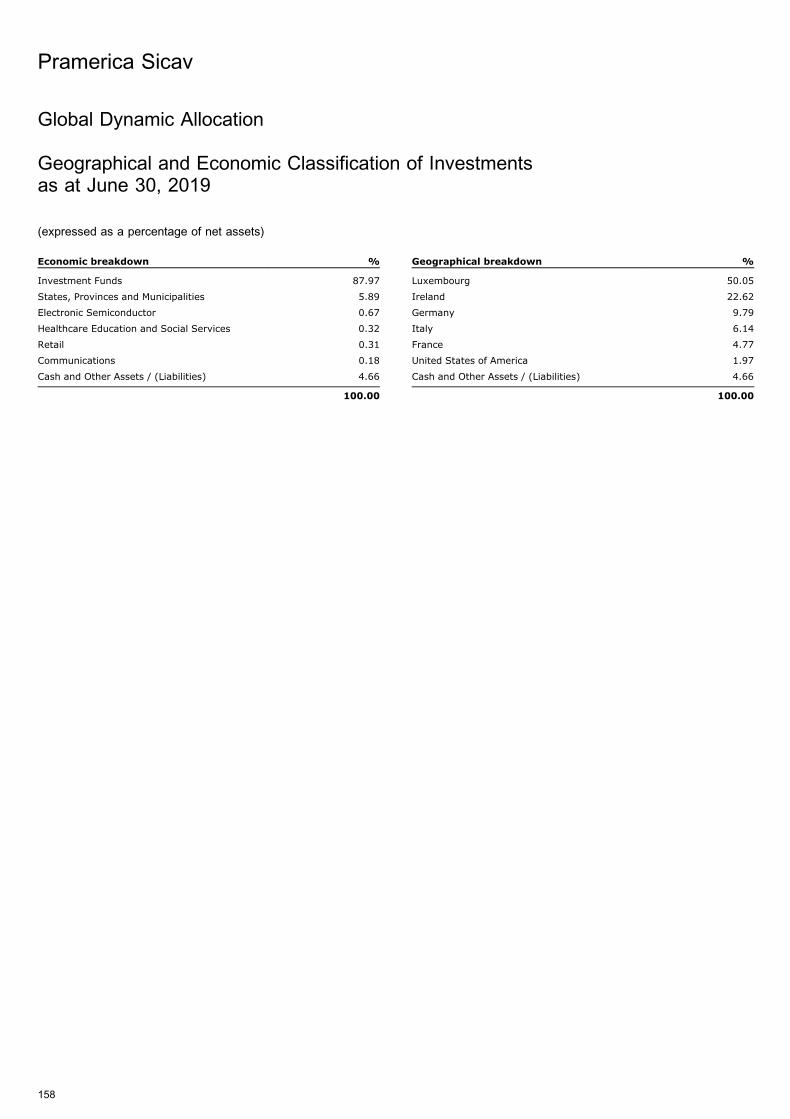
Global Dynamic Allocation
Geographical and Economic Classification of Investmentsas at June 30, 2019
(expressed as a percentage of net assets)
Economic breakdown %
Investment Funds 87.97
States, Provinces and Municipalities 5.89
Electronic Semiconductor 0.67
Healthcare Education and Social Services 0.32
Retail 0.31
Communications 0.18
Cash and Other Assets / (Liabilities) 4.66
100.00
Geographical breakdown %
Luxembourg 50.05
Ireland 22.62
Germany 9.79
Italy 6.14
France 4.77
United States of America 1.97
Cash and Other Assets / (Liabilities) 4.66
100.00
Pramerica Sicav
158
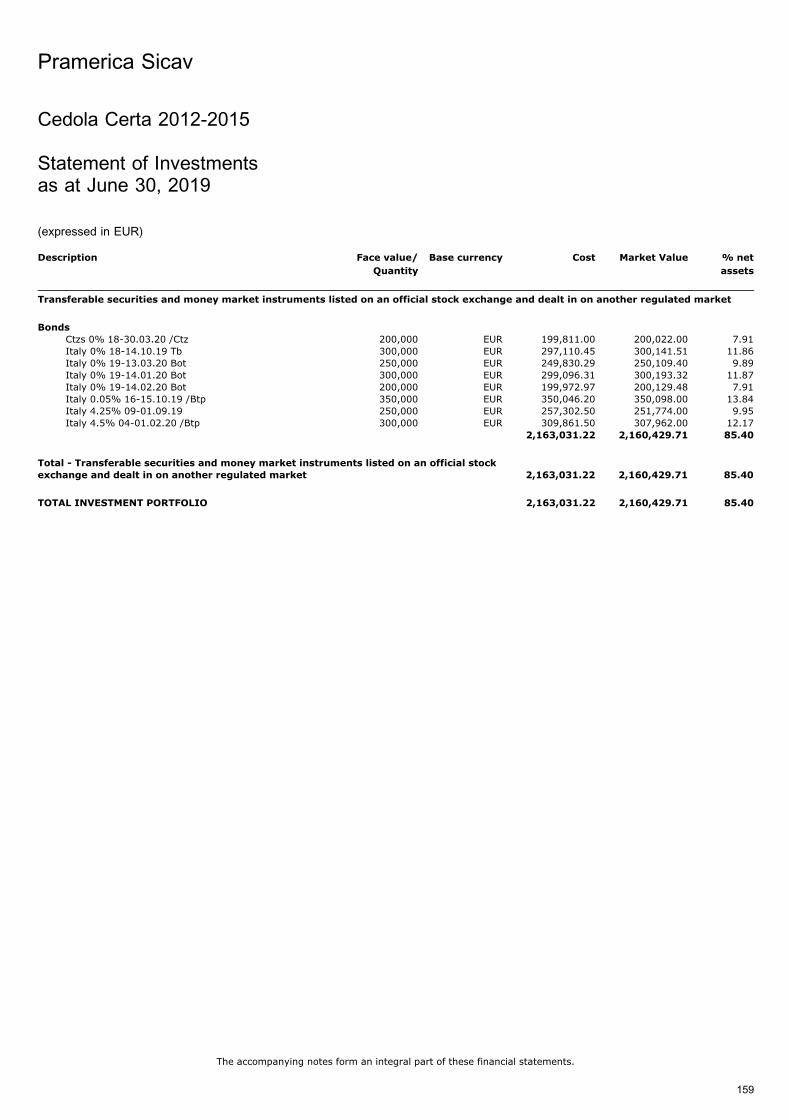
Cedola Certa 2012-2015
Statement of Investmentsas at June 30, 2019
(expressed in EUR)
Description Face value/
Quantity
Base currency Cost Market Value % net
assets
Transferable securities and money market instruments listed on an official stock exchange and dealt in on another regulated market
Bonds
Ctzs 0% 18-30.03.20 /Ctz 200,000 EUR 199,811.00 200,022.00 7.91Italy 0% 18-14.10.19 Tb 300,000 EUR 297,110.45 300,141.51 11.86Italy 0% 19-13.03.20 Bot 250,000 EUR 249,830.29 250,109.40 9.89Italy 0% 19-14.01.20 Bot 300,000 EUR 299,096.31 300,193.32 11.87Italy 0% 19-14.02.20 Bot 200,000 EUR 199,972.97 200,129.48 7.91Italy 0.05% 16-15.10.19 /Btp 350,000 EUR 350,046.20 350,098.00 13.84Italy 4.25% 09-01.09.19 250,000 EUR 257,302.50 251,774.00 9.95Italy 4.5% 04-01.02.20 /Btp 300,000 EUR 309,861.50 307,962.00 12.17
2,163,031.22 2,160,429.71 85.40
Total - Transferable securities and money market instruments listed on an official stock
exchange and dealt in on another regulated market 2,163,031.22 2,160,429.71 85.40
TOTAL INVESTMENT PORTFOLIO 2,163,031.22 2,160,429.71 85.40
Pramerica Sicav
The accompanying notes form an integral part of these financial statements.
159
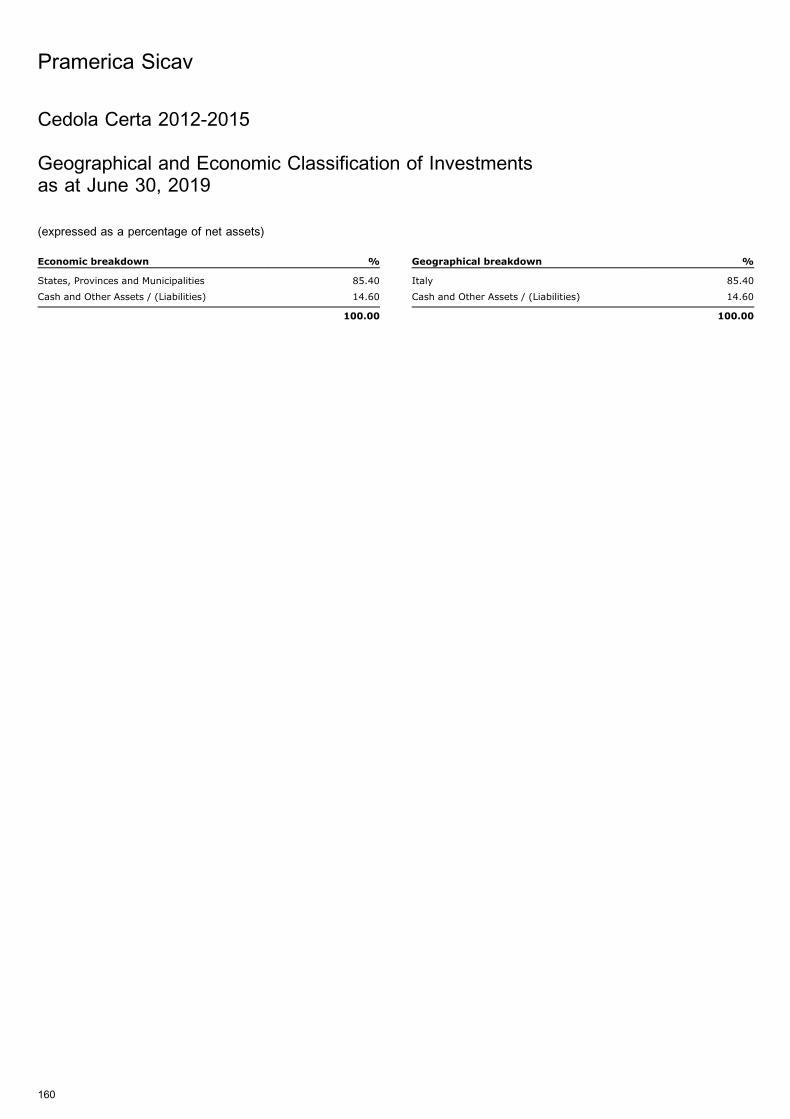
Cedola Certa 2012-2015
Geographical and Economic Classification of Investmentsas at June 30, 2019
(expressed as a percentage of net assets)
Economic breakdown %
States, Provinces and Municipalities 85.40
Cash and Other Assets / (Liabilities) 14.60
100.00
Geographical breakdown %
Italy 85.40
Cash and Other Assets / (Liabilities) 14.60
100.00
Pramerica Sicav
160
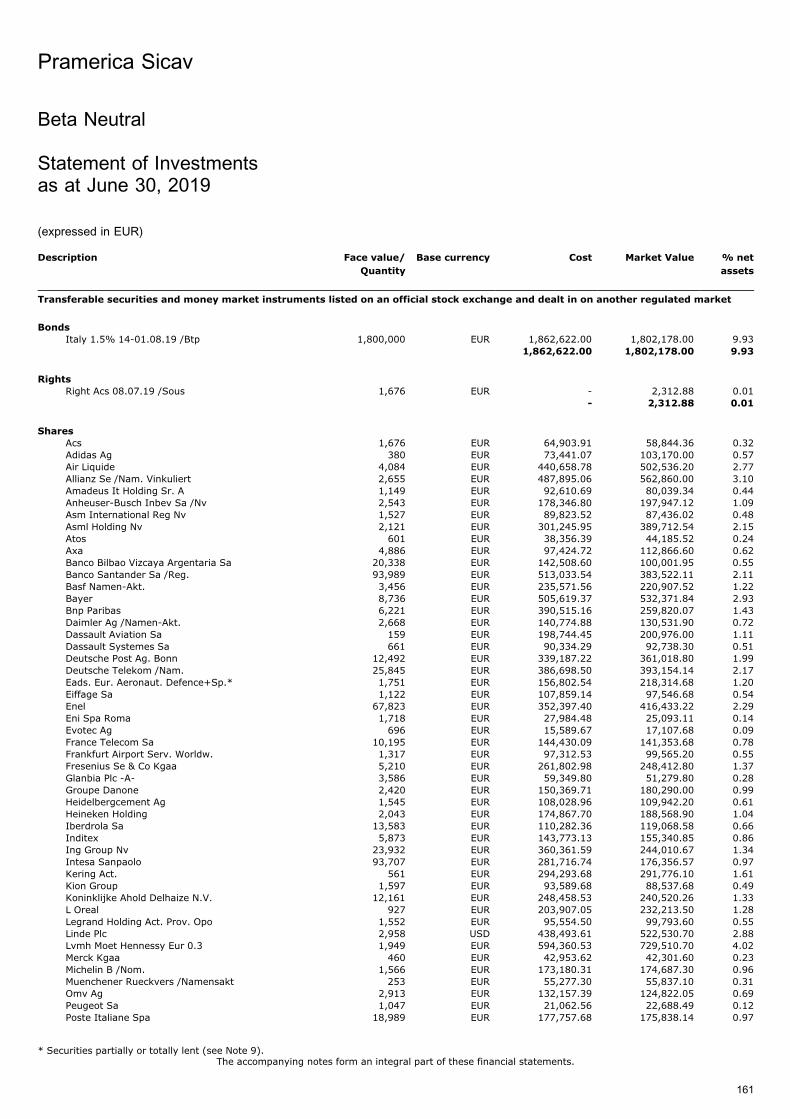
Beta Neutral
Statement of Investmentsas at June 30, 2019
(expressed in EUR)
Description Face value/
Quantity
Base currency Cost Market Value % net
assets
Transferable securities and money market instruments listed on an official stock exchange and dealt in on another regulated market
Bonds
Italy 1.5% 14-01.08.19 /Btp 1,800,000 EUR 1,862,622.00 1,802,178.00 9.931,862,622.00 1,802,178.00 9.93
Rights
Right Acs 08.07.19 /Sous 1,676 EUR - 2,312.88 0.01- 2,312.88 0.01
Shares
Acs 1,676 EUR 64,903.91 58,844.36 0.32Adidas Ag 380 EUR 73,441.07 103,170.00 0.57Air Liquide 4,084 EUR 440,658.78 502,536.20 2.77Allianz Se /Nam. Vinkuliert 2,655 EUR 487,895.06 562,860.00 3.10Amadeus It Holding Sr. A 1,149 EUR 92,610.69 80,039.34 0.44Anheuser-Busch Inbev Sa /Nv 2,543 EUR 178,346.80 197,947.12 1.09Asm International Reg Nv 1,527 EUR 89,823.52 87,436.02 0.48Asml Holding Nv 2,121 EUR 301,245.95 389,712.54 2.15Atos 601 EUR 38,356.39 44,185.52 0.24Axa 4,886 EUR 97,424.72 112,866.60 0.62Banco Bilbao Vizcaya Argentaria Sa 20,338 EUR 142,508.60 100,001.95 0.55Banco Santander Sa /Reg. 93,989 EUR 513,033.54 383,522.11 2.11Basf Namen-Akt. 3,456 EUR 235,571.56 220,907.52 1.22Bayer 8,736 EUR 505,619.37 532,371.84 2.93Bnp Paribas 6,221 EUR 390,515.16 259,820.07 1.43Daimler Ag /Namen-Akt. 2,668 EUR 140,774.88 130,531.90 0.72Dassault Aviation Sa 159 EUR 198,744.45 200,976.00 1.11Dassault Systemes Sa 661 EUR 90,334.29 92,738.30 0.51Deutsche Post Ag. Bonn 12,492 EUR 339,187.22 361,018.80 1.99Deutsche Telekom /Nam. 25,845 EUR 386,698.50 393,154.14 2.17Eads. Eur. Aeronaut. Defence+Sp.* 1,751 EUR 156,802.54 218,314.68 1.20Eiffage Sa 1,122 EUR 107,859.14 97,546.68 0.54Enel 67,823 EUR 352,397.40 416,433.22 2.29Eni Spa Roma 1,718 EUR 27,984.48 25,093.11 0.14Evotec Ag 696 EUR 15,589.67 17,107.68 0.09France Telecom Sa 10,195 EUR 144,430.09 141,353.68 0.78Frankfurt Airport Serv. Worldw. 1,317 EUR 97,312.53 99,565.20 0.55Fresenius Se & Co Kgaa 5,210 EUR 261,802.98 248,412.80 1.37Glanbia Plc -A- 3,586 EUR 59,349.80 51,279.80 0.28Groupe Danone 2,420 EUR 150,369.71 180,290.00 0.99Heidelbergcement Ag 1,545 EUR 108,028.96 109,942.20 0.61Heineken Holding 2,043 EUR 174,867.70 188,568.90 1.04Iberdrola Sa 13,583 EUR 110,282.36 119,068.58 0.66Inditex 5,873 EUR 143,773.13 155,340.85 0.86Ing Group Nv 23,932 EUR 360,361.59 244,010.67 1.34Intesa Sanpaolo 93,707 EUR 281,716.74 176,356.57 0.97Kering Act. 561 EUR 294,293.68 291,776.10 1.61Kion Group 1,597 EUR 93,589.68 88,537.68 0.49Koninklijke Ahold Delhaize N.V. 12,161 EUR 248,458.53 240,520.26 1.33L Oreal 927 EUR 203,907.05 232,213.50 1.28Legrand Holding Act. Prov. Opo 1,552 EUR 95,554.50 99,793.60 0.55Linde Plc 2,958 USD 438,493.61 522,530.70 2.88Lvmh Moet Hennessy Eur 0.3 1,949 EUR 594,360.53 729,510.70 4.02Merck Kgaa 460 EUR 42,953.62 42,301.60 0.23Michelin B /Nom. 1,566 EUR 173,180.31 174,687.30 0.96Muenchener Rueckvers /Namensakt 253 EUR 55,277.30 55,837.10 0.31Omv Ag 2,913 EUR 132,157.39 124,822.05 0.69Peugeot Sa 1,047 EUR 21,062.56 22,688.49 0.12Poste Italiane Spa 18,989 EUR 177,757.68 175,838.14 0.97
Pramerica Sicav
The accompanying notes form an integral part of these financial statements.
161
* Securities partially or totally lent (see Note 9).
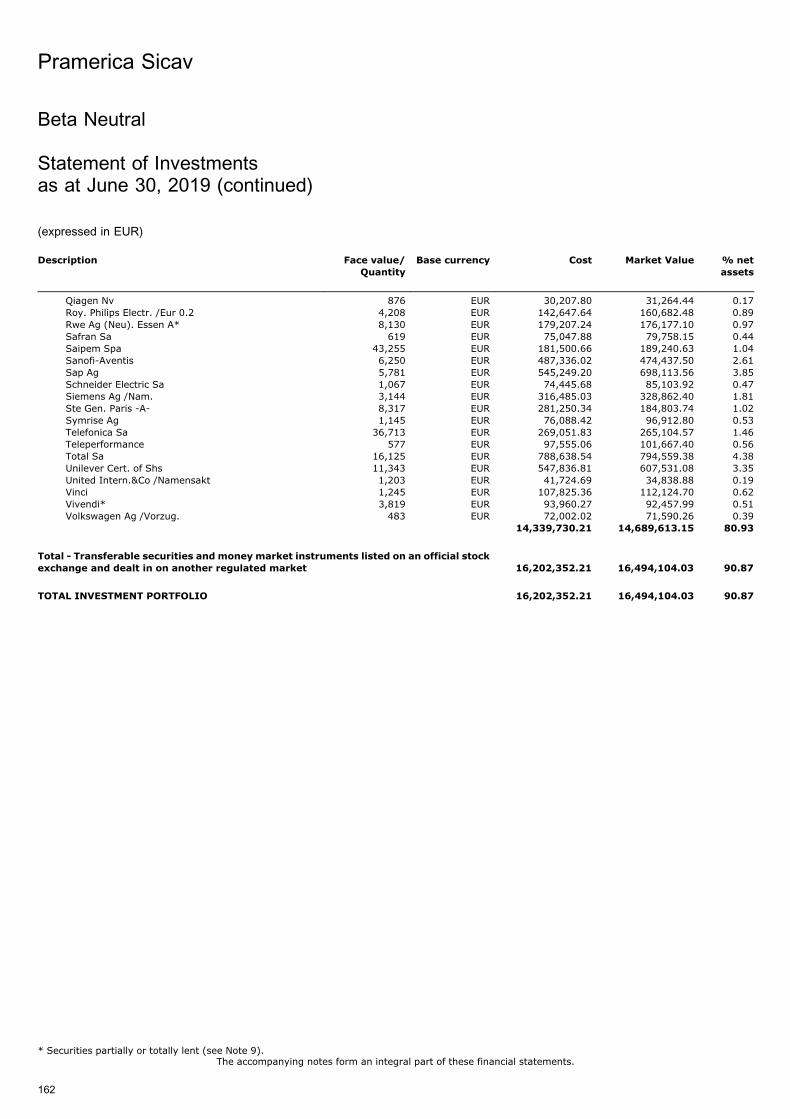
Description Face value/
Quantity
Base currency Cost Market Value % net
assets
Qiagen Nv 876 EUR 30,207.80 31,264.44 0.17Roy. Philips Electr. /Eur 0.2 4,208 EUR 142,647.64 160,682.48 0.89Rwe Ag (Neu). Essen A* 8,130 EUR 179,207.24 176,177.10 0.97Safran Sa 619 EUR 75,047.88 79,758.15 0.44Saipem Spa 43,255 EUR 181,500.66 189,240.63 1.04Sanofi-Aventis 6,250 EUR 487,336.02 474,437.50 2.61Sap Ag 5,781 EUR 545,249.20 698,113.56 3.85Schneider Electric Sa 1,067 EUR 74,445.68 85,103.92 0.47Siemens Ag /Nam. 3,144 EUR 316,485.03 328,862.40 1.81Ste Gen. Paris -A- 8,317 EUR 281,250.34 184,803.74 1.02Symrise Ag 1,145 EUR 76,088.42 96,912.80 0.53Telefonica Sa 36,713 EUR 269,051.83 265,104.57 1.46Teleperformance 577 EUR 97,555.06 101,667.40 0.56Total Sa 16,125 EUR 788,638.54 794,559.38 4.38Unilever Cert. of Shs 11,343 EUR 547,836.81 607,531.08 3.35United Intern.&Co /Namensakt 1,203 EUR 41,724.69 34,838.88 0.19Vinci 1,245 EUR 107,825.36 112,124.70 0.62Vivendi* 3,819 EUR 93,960.27 92,457.99 0.51Volkswagen Ag /Vorzug. 483 EUR 72,002.02 71,590.26 0.39
14,339,730.21 14,689,613.15 80.93
Total - Transferable securities and money market instruments listed on an official stock
exchange and dealt in on another regulated market 16,202,352.21 16,494,104.03 90.87
TOTAL INVESTMENT PORTFOLIO 16,202,352.21 16,494,104.03 90.87
Pramerica Sicav
The accompanying notes form an integral part of these financial statements.
162
Beta Neutral
Statement of Investmentsas at June 30, 2019 (continued)
(expressed in EUR)
* Securities partially or totally lent (see Note 9).
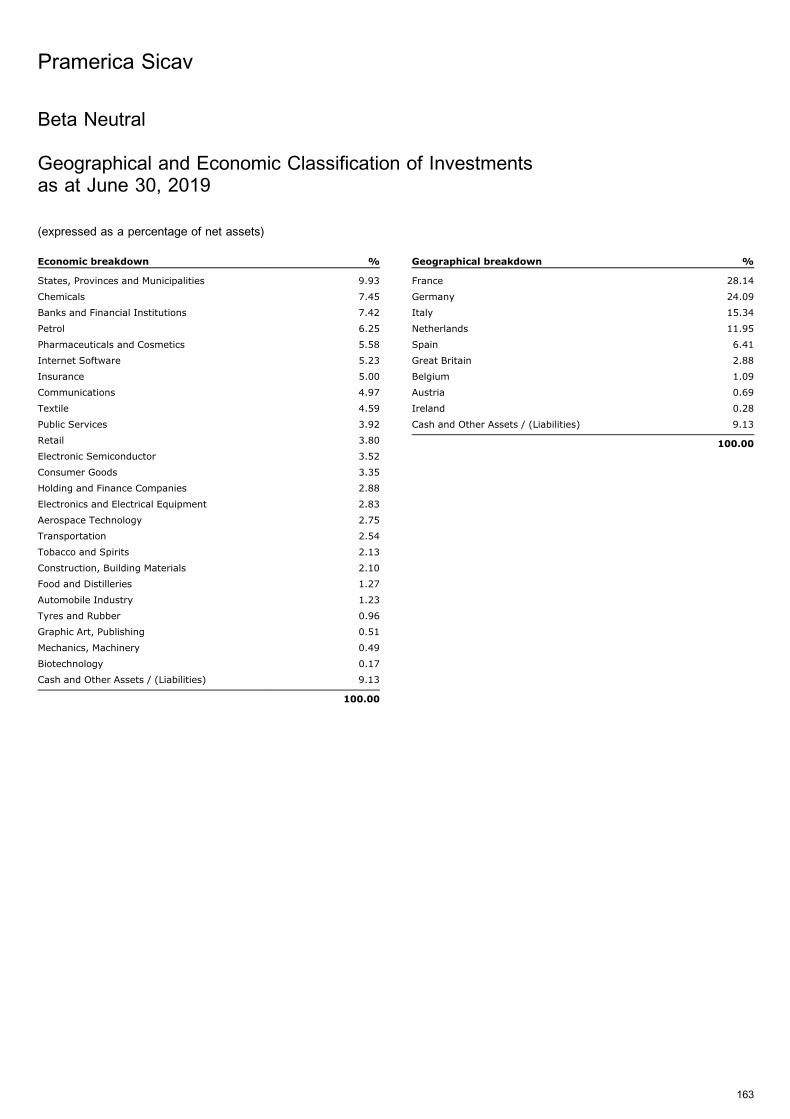
Beta Neutral
Geographical and Economic Classification of Investmentsas at June 30, 2019
(expressed as a percentage of net assets)
Economic breakdown %
States, Provinces and Municipalities 9.93
Chemicals 7.45
Banks and Financial Institutions 7.42
Petrol 6.25
Pharmaceuticals and Cosmetics 5.58
Internet Software 5.23
Insurance 5.00
Communications 4.97
Textile 4.59
Public Services 3.92
Retail 3.80
Electronic Semiconductor 3.52
Consumer Goods 3.35
Holding and Finance Companies 2.88
Electronics and Electrical Equipment 2.83
Aerospace Technology 2.75
Transportation 2.54
Tobacco and Spirits 2.13
Construction, Building Materials 2.10
Food and Distilleries 1.27
Automobile Industry 1.23
Tyres and Rubber 0.96
Graphic Art, Publishing 0.51
Mechanics, Machinery 0.49
Biotechnology 0.17
Cash and Other Assets / (Liabilities) 9.13
100.00
Geographical breakdown %
France 28.14
Germany 24.09
Italy 15.34
Netherlands 11.95
Spain 6.41
Great Britain 2.88
Belgium 1.09
Austria 0.69
Ireland 0.28
Cash and Other Assets / (Liabilities) 9.13
100.00
Pramerica Sicav
163
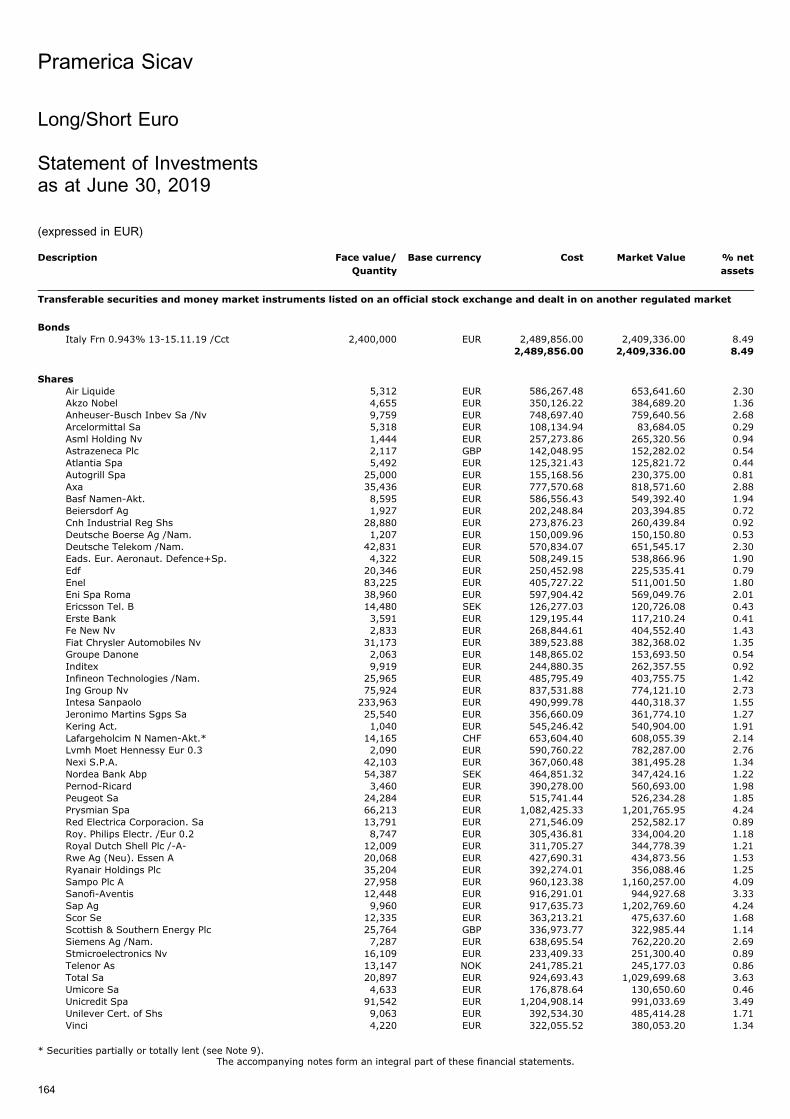
Long/Short Euro
Statement of Investmentsas at June 30, 2019
(expressed in EUR)
Description Face value/
Quantity
Base currency Cost Market Value % net
assets
Transferable securities and money market instruments listed on an official stock exchange and dealt in on another regulated market
Bonds
Italy Frn 0.943% 13-15.11.19 /Cct 2,400,000 EUR 2,489,856.00 2,409,336.00 8.492,489,856.00 2,409,336.00 8.49
Shares
Air Liquide 5,312 EUR 586,267.48 653,641.60 2.30Akzo Nobel 4,655 EUR 350,126.22 384,689.20 1.36Anheuser-Busch Inbev Sa /Nv 9,759 EUR 748,697.40 759,640.56 2.68Arcelormittal Sa 5,318 EUR 108,134.94 83,684.05 0.29Asml Holding Nv 1,444 EUR 257,273.86 265,320.56 0.94Astrazeneca Plc 2,117 GBP 142,048.95 152,282.02 0.54Atlantia Spa 5,492 EUR 125,321.43 125,821.72 0.44Autogrill Spa 25,000 EUR 155,168.56 230,375.00 0.81Axa 35,436 EUR 777,570.68 818,571.60 2.88Basf Namen-Akt. 8,595 EUR 586,556.43 549,392.40 1.94Beiersdorf Ag 1,927 EUR 202,248.84 203,394.85 0.72Cnh Industrial Reg Shs 28,880 EUR 273,876.23 260,439.84 0.92Deutsche Boerse Ag /Nam. 1,207 EUR 150,009.96 150,150.80 0.53Deutsche Telekom /Nam. 42,831 EUR 570,834.07 651,545.17 2.30Eads. Eur. Aeronaut. Defence+Sp. 4,322 EUR 508,249.15 538,866.96 1.90Edf 20,346 EUR 250,452.98 225,535.41 0.79Enel 83,225 EUR 405,727.22 511,001.50 1.80Eni Spa Roma 38,960 EUR 597,904.42 569,049.76 2.01Ericsson Tel. B 14,480 SEK 126,277.03 120,726.08 0.43Erste Bank 3,591 EUR 129,195.44 117,210.24 0.41Fe New Nv 2,833 EUR 268,844.61 404,552.40 1.43Fiat Chrysler Automobiles Nv 31,173 EUR 389,523.88 382,368.02 1.35Groupe Danone 2,063 EUR 148,865.02 153,693.50 0.54Inditex 9,919 EUR 244,880.35 262,357.55 0.92Infineon Technologies /Nam. 25,965 EUR 485,795.49 403,755.75 1.42Ing Group Nv 75,924 EUR 837,531.88 774,121.10 2.73Intesa Sanpaolo 233,963 EUR 490,999.78 440,318.37 1.55Jeronimo Martins Sgps Sa 25,540 EUR 356,660.09 361,774.10 1.27Kering Act. 1,040 EUR 545,246.42 540,904.00 1.91Lafargeholcim N Namen-Akt.* 14,165 CHF 653,604.40 608,055.39 2.14Lvmh Moet Hennessy Eur 0.3 2,090 EUR 590,760.22 782,287.00 2.76Nexi S.P.A. 42,103 EUR 367,060.48 381,495.28 1.34Nordea Bank Abp 54,387 SEK 464,851.32 347,424.16 1.22Pernod-Ricard 3,460 EUR 390,278.00 560,693.00 1.98Peugeot Sa 24,284 EUR 515,741.44 526,234.28 1.85Prysmian Spa 66,213 EUR 1,082,425.33 1,201,765.95 4.24Red Electrica Corporacion. Sa 13,791 EUR 271,546.09 252,582.17 0.89Roy. Philips Electr. /Eur 0.2 8,747 EUR 305,436.81 334,004.20 1.18Royal Dutch Shell Plc /-A- 12,009 EUR 311,705.27 344,778.39 1.21Rwe Ag (Neu). Essen A 20,068 EUR 427,690.31 434,873.56 1.53Ryanair Holdings Plc 35,204 EUR 392,274.01 356,088.46 1.25Sampo Plc A 27,958 EUR 960,123.38 1,160,257.00 4.09Sanofi-Aventis 12,448 EUR 916,291.01 944,927.68 3.33Sap Ag 9,960 EUR 917,635.73 1,202,769.60 4.24Scor Se 12,335 EUR 363,213.21 475,637.60 1.68Scottish & Southern Energy Plc 25,764 GBP 336,973.77 322,985.44 1.14Siemens Ag /Nam. 7,287 EUR 638,695.54 762,220.20 2.69Stmicroelectronics Nv 16,109 EUR 233,409.33 251,300.40 0.89Telenor As 13,147 NOK 241,785.21 245,177.03 0.86Total Sa 20,897 EUR 924,693.43 1,029,699.68 3.63Umicore Sa 4,633 EUR 176,878.64 130,650.60 0.46Unicredit Spa 91,542 EUR 1,204,908.14 991,033.69 3.49Unilever Cert. of Shs 9,063 EUR 392,534.30 485,414.28 1.71Vinci 4,220 EUR 322,055.52 380,053.20 1.34
Pramerica Sicav
The accompanying notes form an integral part of these financial statements.
164
* Securities partially or totally lent (see Note 9).
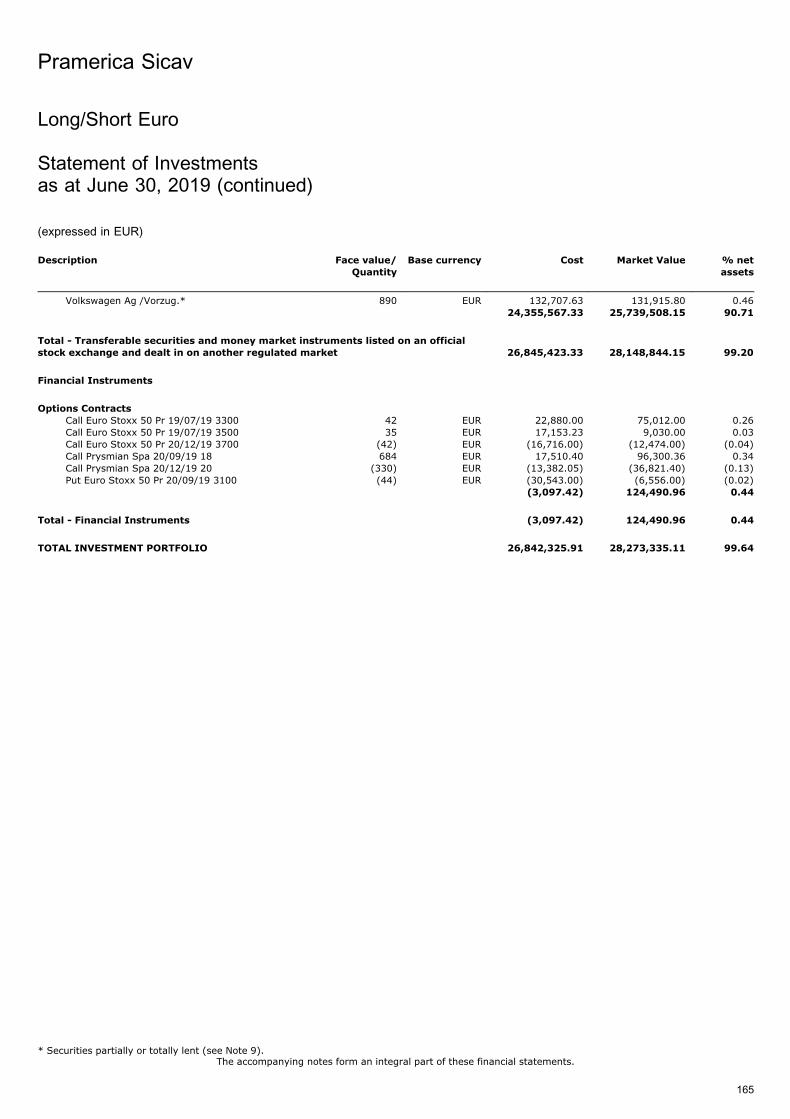
Description Face value/
Quantity
Base currency Cost Market Value % net
assets
Volkswagen Ag /Vorzug.* 890 EUR 132,707.63 131,915.80 0.4624,355,567.33 25,739,508.15 90.71
Total - Transferable securities and money market instruments listed on an officialstock exchange and dealt in on another regulated market 26,845,423.33 28,148,844.15 99.20
Financial Instruments
Options Contracts
Call Euro Stoxx 50 Pr 19/07/19 3300 42 EUR 22,880.00 75,012.00 0.26Call Euro Stoxx 50 Pr 19/07/19 3500 35 EUR 17,153.23 9,030.00 0.03Call Euro Stoxx 50 Pr 20/12/19 3700 (42) EUR (16,716.00) (12,474.00) (0.04)Call Prysmian Spa 20/09/19 18 684 EUR 17,510.40 96,300.36 0.34Call Prysmian Spa 20/12/19 20 (330) EUR (13,382.05) (36,821.40) (0.13)Put Euro Stoxx 50 Pr 20/09/19 3100 (44) EUR (30,543.00) (6,556.00) (0.02)
(3,097.42) 124,490.96 0.44
Total - Financial Instruments (3,097.42) 124,490.96 0.44
TOTAL INVESTMENT PORTFOLIO 26,842,325.91 28,273,335.11 99.64
Pramerica Sicav
The accompanying notes form an integral part of these financial statements.
165
Long/Short Euro
Statement of Investmentsas at June 30, 2019 (continued)
(expressed in EUR)
* Securities partially or totally lent (see Note 9).
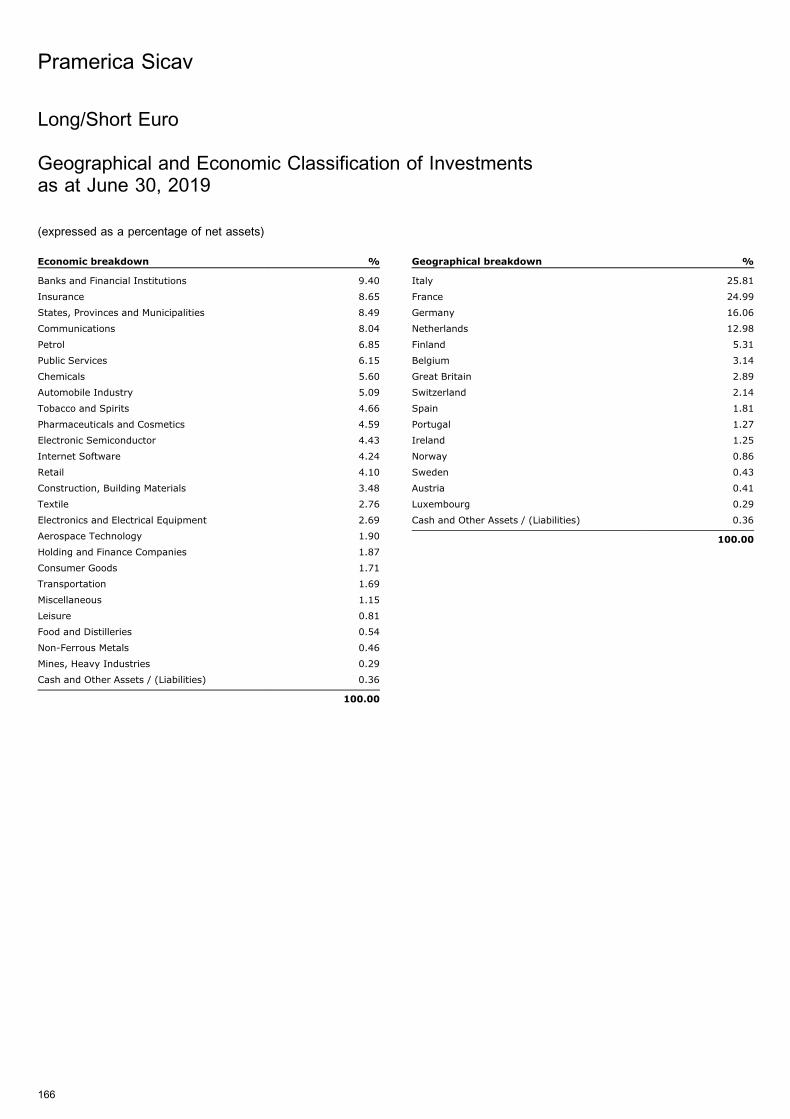
Long/Short Euro
Geographical and Economic Classification of Investmentsas at June 30, 2019
(expressed as a percentage of net assets)
Economic breakdown %
Banks and Financial Institutions 9.40
Insurance 8.65
States, Provinces and Municipalities 8.49
Communications 8.04
Petrol 6.85
Public Services 6.15
Chemicals 5.60
Automobile Industry 5.09
Tobacco and Spirits 4.66
Pharmaceuticals and Cosmetics 4.59
Electronic Semiconductor 4.43
Internet Software 4.24
Retail 4.10
Construction, Building Materials 3.48
Textile 2.76
Electronics and Electrical Equipment 2.69
Aerospace Technology 1.90
Holding and Finance Companies 1.87
Consumer Goods 1.71
Transportation 1.69
Miscellaneous 1.15
Leisure 0.81
Food and Distilleries 0.54
Non-Ferrous Metals 0.46
Mines, Heavy Industries 0.29
Cash and Other Assets / (Liabilities) 0.36
100.00
Geographical breakdown %
Italy 25.81
France 24.99
Germany 16.06
Netherlands 12.98
Finland 5.31
Belgium 3.14
Great Britain 2.89
Switzerland 2.14
Spain 1.81
Portugal 1.27
Ireland 1.25
Norway 0.86
Sweden 0.43
Austria 0.41
Luxembourg 0.29
Cash and Other Assets / (Liabilities) 0.36
100.00
Pramerica Sicav
166

Cedola Certa 2013-2016
Statement of Investmentsas at June 30, 2019
(expressed in EUR)
Description Face value/
Quantity
Base currency Cost Market Value % net
assets
Transferable securities and money market instruments listed on an official stock exchange and dealt in on another regulated market
Bonds
Ctzs 0% 18-30.03.20 /Ctz 1,500,000 EUR 1,499,275.00 1,500,165.00 13.10Italy 0% 18-14.10.19 Tb 1,500,000 EUR 1,485,552.26 1,500,707.55 13.11Italy 0% 19-13.03.20 Bot 900,000 EUR 899,468.31 900,393.84 7.86Italy 0% 19-14.01.20 Bot 1,500,000 EUR 1,495,481.57 1,500,966.60 13.11Italy 0.05% 16-15.10.19 /Btp 1,000,000 EUR 1,000,132.00 1,000,280.00 8.74Italy 4.25% 09-01.09.19 2,000,000 EUR 2,058,237.50 2,014,192.00 17.59Italy 4.5% 04-01.02.20 /Btp 1,500,000 EUR 1,550,130.00 1,539,810.00 13.45
9,988,276.64 9,956,514.99 86.96
Total - Transferable securities and money market instruments listed on an officialstock exchange and dealt in on another regulated market 9,988,276.64 9,956,514.99 86.96
TOTAL INVESTMENT PORTFOLIO 9,988,276.64 9,956,514.99 86.96
Pramerica Sicav
The accompanying notes form an integral part of these financial statements.
167

Cedola Certa 2013-2016
Geographical and Economic Classification of Investmentsas at June 30, 2019
(expressed as a percentage of net assets)
Economic breakdown %
States, Provinces and Municipalities 86.96
Cash and Other Assets / (Liabilities) 13.04
100.00
Geographical breakdown %
Italy 86.96
Cash and Other Assets / (Liabilities) 13.04
100.00
Pramerica Sicav
168
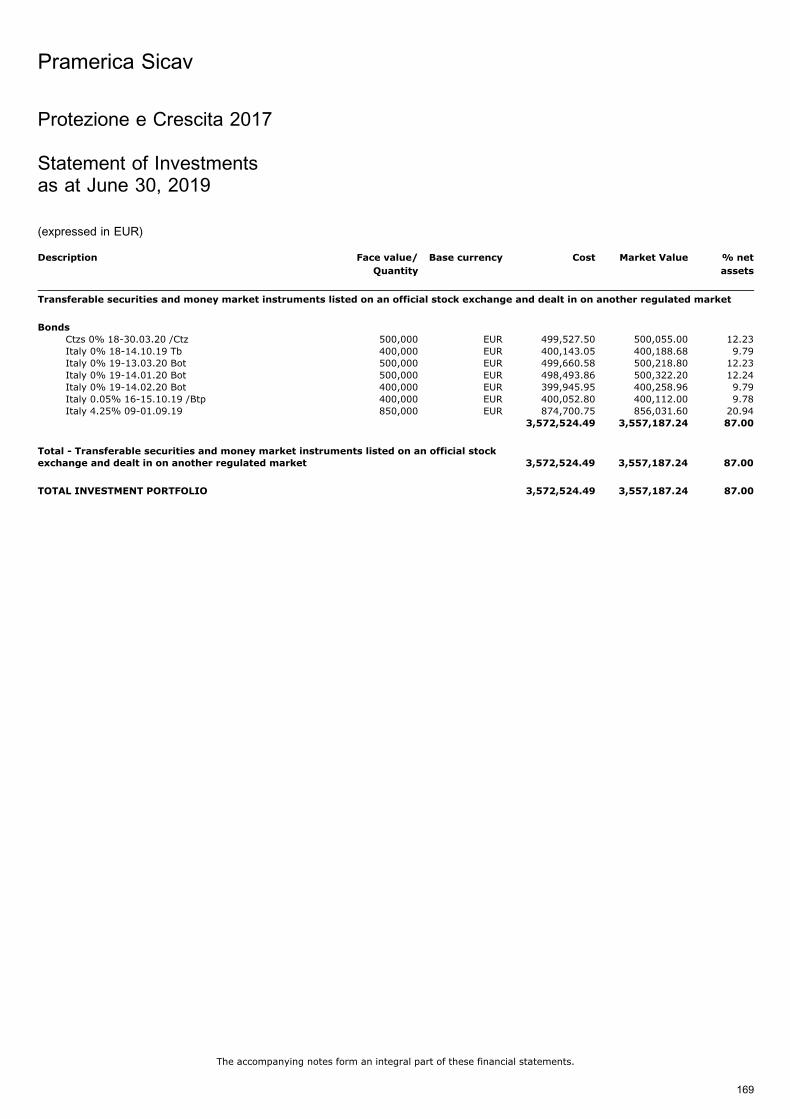
Protezione e Crescita 2017
Statement of Investmentsas at June 30, 2019
(expressed in EUR)
Description Face value/
Quantity
Base currency Cost Market Value % net
assets
Transferable securities and money market instruments listed on an official stock exchange and dealt in on another regulated market
Bonds
Ctzs 0% 18-30.03.20 /Ctz 500,000 EUR 499,527.50 500,055.00 12.23Italy 0% 18-14.10.19 Tb 400,000 EUR 400,143.05 400,188.68 9.79Italy 0% 19-13.03.20 Bot 500,000 EUR 499,660.58 500,218.80 12.23Italy 0% 19-14.01.20 Bot 500,000 EUR 498,493.86 500,322.20 12.24Italy 0% 19-14.02.20 Bot 400,000 EUR 399,945.95 400,258.96 9.79Italy 0.05% 16-15.10.19 /Btp 400,000 EUR 400,052.80 400,112.00 9.78Italy 4.25% 09-01.09.19 850,000 EUR 874,700.75 856,031.60 20.94
3,572,524.49 3,557,187.24 87.00
Total - Transferable securities and money market instruments listed on an official stockexchange and dealt in on another regulated market 3,572,524.49 3,557,187.24 87.00
TOTAL INVESTMENT PORTFOLIO 3,572,524.49 3,557,187.24 87.00
Pramerica Sicav
The accompanying notes form an integral part of these financial statements.
169

Protezione e Crescita 2019
Geographical and Economic Classification of Investmentsas at June 30, 2019
(expressed as a percentage of net assets)
Economic breakdown %
States, Provinces and Municipalities 87.00
Cash and Other Assets / (Liabilities) 13.00
100.00
Geographical breakdown %
Italy 87.00
Cash and Other Assets / (Liabilities) 13.00
100.00
Pramerica Sicav
170
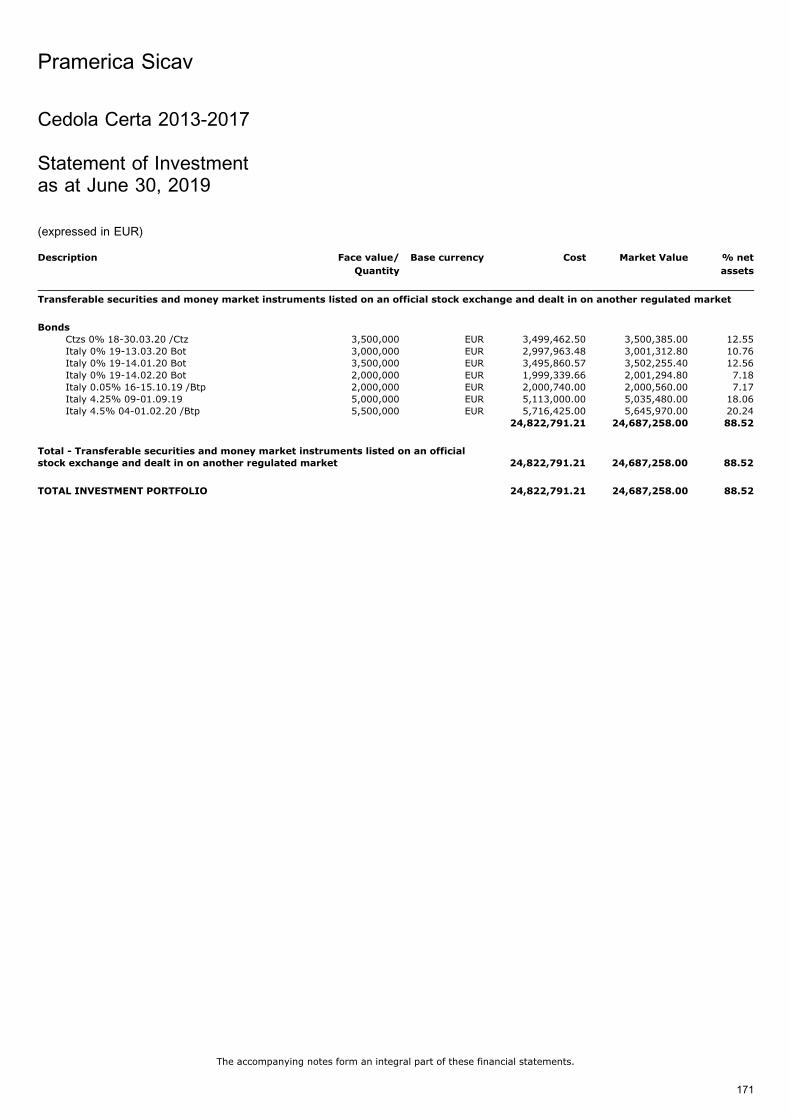
Cedola Certa 2013-2017
Statement of Investmentas at June 30, 2019
(expressed in EUR)
Description Face value/
Quantity
Base currency Cost Market Value % net
assets
Transferable securities and money market instruments listed on an official stock exchange and dealt in on another regulated market
Bonds
Ctzs 0% 18-30.03.20 /Ctz 3,500,000 EUR 3,499,462.50 3,500,385.00 12.55Italy 0% 19-13.03.20 Bot 3,000,000 EUR 2,997,963.48 3,001,312.80 10.76Italy 0% 19-14.01.20 Bot 3,500,000 EUR 3,495,860.57 3,502,255.40 12.56Italy 0% 19-14.02.20 Bot 2,000,000 EUR 1,999,339.66 2,001,294.80 7.18Italy 0.05% 16-15.10.19 /Btp 2,000,000 EUR 2,000,740.00 2,000,560.00 7.17Italy 4.25% 09-01.09.19 5,000,000 EUR 5,113,000.00 5,035,480.00 18.06Italy 4.5% 04-01.02.20 /Btp 5,500,000 EUR 5,716,425.00 5,645,970.00 20.24
24,822,791.21 24,687,258.00 88.52
Total - Transferable securities and money market instruments listed on an officialstock exchange and dealt in on another regulated market 24,822,791.21 24,687,258.00 88.52
TOTAL INVESTMENT PORTFOLIO 24,822,791.21 24,687,258.00 88.52
Pramerica Sicav
The accompanying notes form an integral part of these financial statements.
171

Cedola Certa 2013-2017
Geographical and Economic Classification of Investmentsas at June 30, 2019
(expressed as a percentage of net assets)
Economic breakdown %
States, Provinces and Municipalities 88.52
Cash and Other Assets / (Liabilities) 11.48
100.00
Geographical breakdown %
Italy 88.52
Cash and Other Assets / (Liabilities) 11.48
100.00
Pramerica Sicav
172
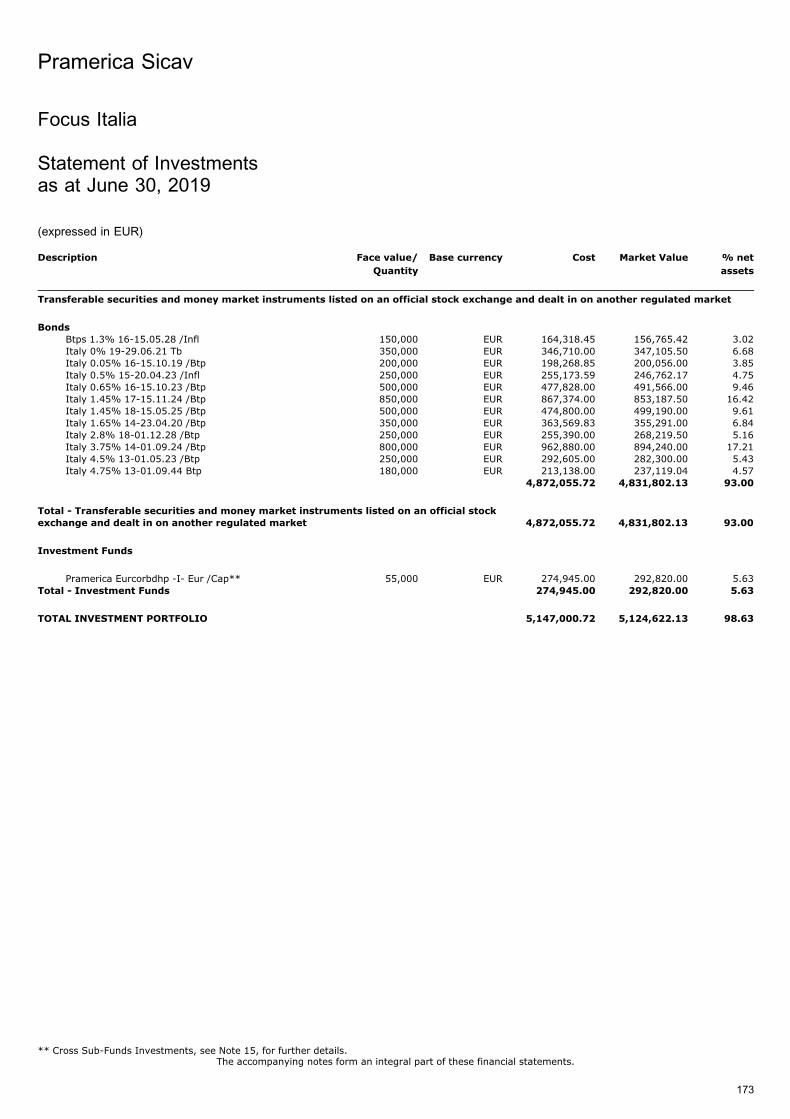
Focus Italia
Statement of Investmentsas at June 30, 2019
(expressed in EUR)
Description Face value/
Quantity
Base currency Cost Market Value % net
assets
Transferable securities and money market instruments listed on an official stock exchange and dealt in on another regulated market
Bonds
Btps 1.3% 16-15.05.28 /Infl 150,000 EUR 164,318.45 156,765.42 3.02Italy 0% 19-29.06.21 Tb 350,000 EUR 346,710.00 347,105.50 6.68Italy 0.05% 16-15.10.19 /Btp 200,000 EUR 198,268.85 200,056.00 3.85Italy 0.5% 15-20.04.23 /Infl 250,000 EUR 255,173.59 246,762.17 4.75Italy 0.65% 16-15.10.23 /Btp 500,000 EUR 477,828.00 491,566.00 9.46Italy 1.45% 17-15.11.24 /Btp 850,000 EUR 867,374.00 853,187.50 16.42Italy 1.45% 18-15.05.25 /Btp 500,000 EUR 474,800.00 499,190.00 9.61Italy 1.65% 14-23.04.20 /Btp 350,000 EUR 363,569.83 355,291.00 6.84Italy 2.8% 18-01.12.28 /Btp 250,000 EUR 255,390.00 268,219.50 5.16Italy 3.75% 14-01.09.24 /Btp 800,000 EUR 962,880.00 894,240.00 17.21Italy 4.5% 13-01.05.23 /Btp 250,000 EUR 292,605.00 282,300.00 5.43Italy 4.75% 13-01.09.44 Btp 180,000 EUR 213,138.00 237,119.04 4.57
4,872,055.72 4,831,802.13 93.00
Total - Transferable securities and money market instruments listed on an official stock
exchange and dealt in on another regulated market 4,872,055.72 4,831,802.13 93.00
Investment Funds
Pramerica Eurcorbdhp -I- Eur /Cap** 55,000 EUR 274,945.00 292,820.00 5.63Total - Investment Funds 274,945.00 292,820.00 5.63
TOTAL INVESTMENT PORTFOLIO 5,147,000.72 5,124,622.13 98.63
Pramerica Sicav
The accompanying notes form an integral part of these financial statements.
173
** Cross Sub-Funds Investments, see Note 15, for further details.
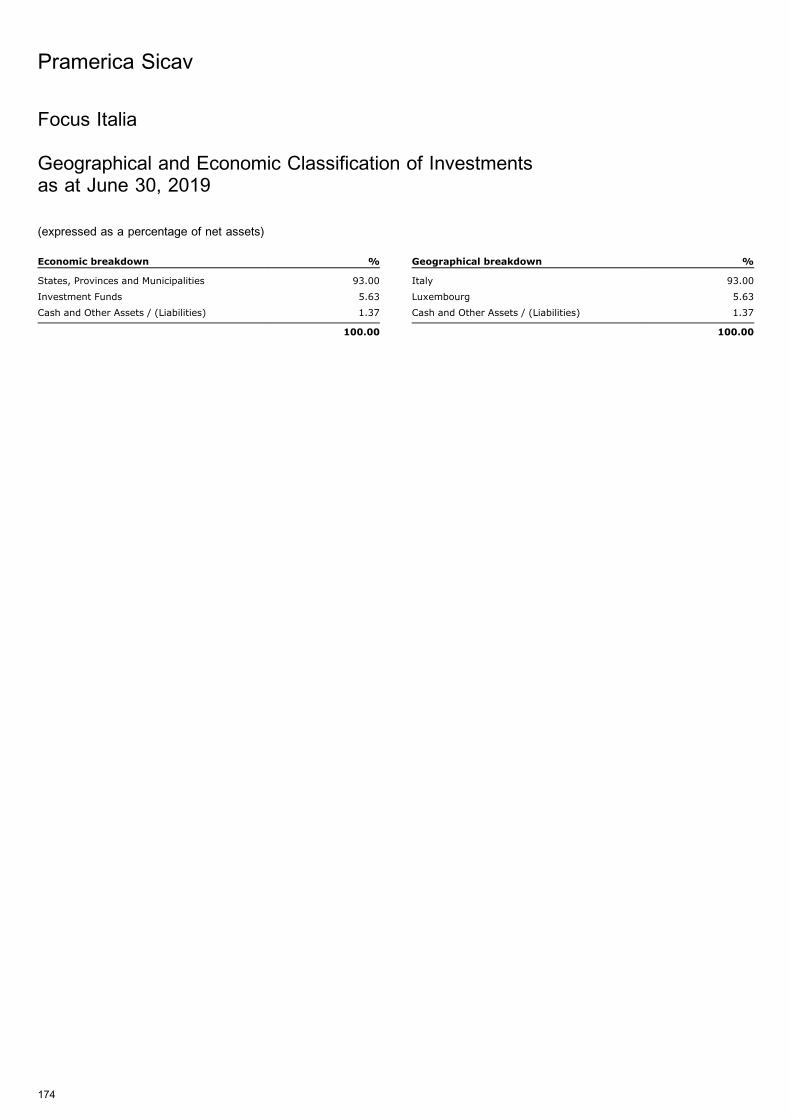
Focus Italia
Geographical and Economic Classification of Investmentsas at June 30, 2019
(expressed as a percentage of net assets)
Economic breakdown %
States, Provinces and Municipalities 93.00
Investment Funds 5.63
Cash and Other Assets / (Liabilities) 1.37
100.00
Geographical breakdown %
Italy 93.00
Luxembourg 5.63
Cash and Other Assets / (Liabilities) 1.37
100.00
Pramerica Sicav
174
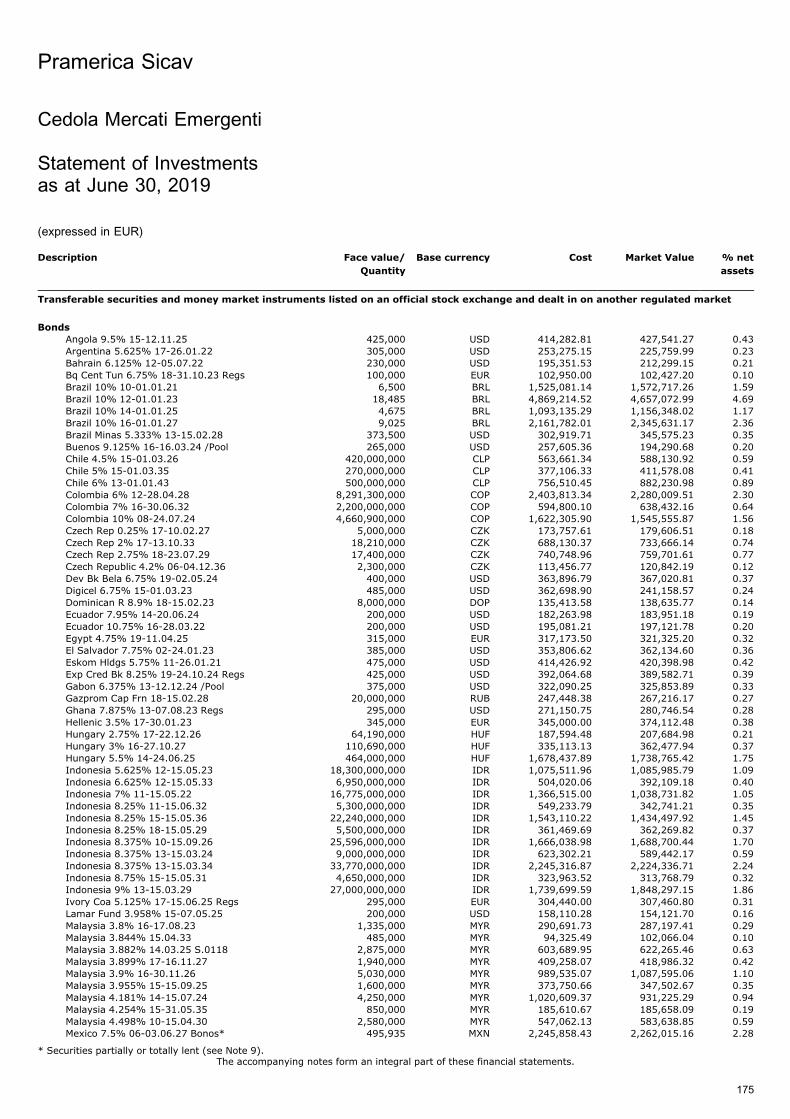
Cedola Mercati Emergenti
Statement of Investmentsas at June 30, 2019
(expressed in EUR)
Description Face value/
Quantity
Base currency Cost Market Value % net
assets
Transferable securities and money market instruments listed on an official stock exchange and dealt in on another regulated market
Bonds
Angola 9.5% 15-12.11.25 425,000 USD 414,282.81 427,541.27 0.43Argentina 5.625% 17-26.01.22 305,000 USD 253,275.15 225,759.99 0.23Bahrain 6.125% 12-05.07.22 230,000 USD 195,351.53 212,299.15 0.21Bq Cent Tun 6.75% 18-31.10.23 Regs 100,000 EUR 102,950.00 102,427.20 0.10Brazil 10% 10-01.01.21 6,500 BRL 1,525,081.14 1,572,717.26 1.59Brazil 10% 12-01.01.23 18,485 BRL 4,869,214.52 4,657,072.99 4.69Brazil 10% 14-01.01.25 4,675 BRL 1,093,135.29 1,156,348.02 1.17Brazil 10% 16-01.01.27 9,025 BRL 2,161,782.01 2,345,631.17 2.36Brazil Minas 5.333% 13-15.02.28 373,500 USD 302,919.71 345,575.23 0.35Buenos 9.125% 16-16.03.24 /Pool 265,000 USD 257,605.36 194,290.68 0.20Chile 4.5% 15-01.03.26 420,000,000 CLP 563,661.34 588,130.92 0.59Chile 5% 15-01.03.35 270,000,000 CLP 377,106.33 411,578.08 0.41Chile 6% 13-01.01.43 500,000,000 CLP 756,510.45 882,230.98 0.89Colombia 6% 12-28.04.28 8,291,300,000 COP 2,403,813.34 2,280,009.51 2.30Colombia 7% 16-30.06.32 2,200,000,000 COP 594,800.10 638,432.16 0.64Colombia 10% 08-24.07.24 4,660,900,000 COP 1,622,305.90 1,545,555.87 1.56Czech Rep 0.25% 17-10.02.27 5,000,000 CZK 173,757.61 179,606.51 0.18Czech Rep 2% 17-13.10.33 18,210,000 CZK 688,130.37 733,666.14 0.74Czech Rep 2.75% 18-23.07.29 17,400,000 CZK 740,748.96 759,701.61 0.77Czech Republic 4.2% 06-04.12.36 2,300,000 CZK 113,456.77 120,842.19 0.12Dev Bk Bela 6.75% 19-02.05.24 400,000 USD 363,896.79 367,020.81 0.37Digicel 6.75% 15-01.03.23 485,000 USD 362,698.90 241,158.57 0.24Dominican R 8.9% 18-15.02.23 8,000,000 DOP 135,413.58 138,635.77 0.14Ecuador 7.95% 14-20.06.24 200,000 USD 182,263.98 183,951.18 0.19Ecuador 10.75% 16-28.03.22 200,000 USD 195,081.21 197,121.78 0.20Egypt 4.75% 19-11.04.25 315,000 EUR 317,173.50 321,325.20 0.32El Salvador 7.75% 02-24.01.23 385,000 USD 353,806.62 362,134.60 0.36Eskom Hldgs 5.75% 11-26.01.21 475,000 USD 414,426.92 420,398.98 0.42Exp Cred Bk 8.25% 19-24.10.24 Regs 425,000 USD 392,064.68 389,582.71 0.39Gabon 6.375% 13-12.12.24 /Pool 375,000 USD 322,090.25 325,853.89 0.33Gazprom Cap Frn 18-15.02.28 20,000,000 RUB 247,448.38 267,216.17 0.27Ghana 7.875% 13-07.08.23 Regs 295,000 USD 271,150.75 280,746.54 0.28Hellenic 3.5% 17-30.01.23 345,000 EUR 345,000.00 374,112.48 0.38Hungary 2.75% 17-22.12.26 64,190,000 HUF 187,594.48 207,684.98 0.21Hungary 3% 16-27.10.27 110,690,000 HUF 335,113.13 362,477.94 0.37Hungary 5.5% 14-24.06.25 464,000,000 HUF 1,678,437.89 1,738,765.42 1.75Indonesia 5.625% 12-15.05.23 18,300,000,000 IDR 1,075,511.96 1,085,985.79 1.09Indonesia 6.625% 12-15.05.33 6,950,000,000 IDR 504,020.06 392,109.18 0.40Indonesia 7% 11-15.05.22 16,775,000,000 IDR 1,366,515.00 1,038,731.82 1.05Indonesia 8.25% 11-15.06.32 5,300,000,000 IDR 549,233.79 342,741.21 0.35Indonesia 8.25% 15-15.05.36 22,240,000,000 IDR 1,543,110.22 1,434,497.92 1.45Indonesia 8.25% 18-15.05.29 5,500,000,000 IDR 361,469.69 362,269.82 0.37Indonesia 8.375% 10-15.09.26 25,596,000,000 IDR 1,666,038.98 1,688,700.44 1.70Indonesia 8.375% 13-15.03.24 9,000,000,000 IDR 623,302.21 589,442.17 0.59Indonesia 8.375% 13-15.03.34 33,770,000,000 IDR 2,245,316.87 2,224,336.71 2.24Indonesia 8.75% 15-15.05.31 4,650,000,000 IDR 323,963.52 313,768.79 0.32Indonesia 9% 13-15.03.29 27,000,000,000 IDR 1,739,699.59 1,848,297.15 1.86Ivory Coa 5.125% 17-15.06.25 Regs 295,000 EUR 304,440.00 307,460.80 0.31Lamar Fund 3.958% 15-07.05.25 200,000 USD 158,110.28 154,121.70 0.16Malaysia 3.8% 16-17.08.23 1,335,000 MYR 290,691.73 287,197.41 0.29Malaysia 3.844% 15.04.33 485,000 MYR 94,325.49 102,066.04 0.10Malaysia 3.882% 14.03.25 S.0118 2,875,000 MYR 603,689.95 622,265.46 0.63Malaysia 3.899% 17-16.11.27 1,940,000 MYR 409,258.07 418,986.32 0.42Malaysia 3.9% 16-30.11.26 5,030,000 MYR 989,535.07 1,087,595.06 1.10Malaysia 3.955% 15-15.09.25 1,600,000 MYR 373,750.66 347,502.67 0.35Malaysia 4.181% 14-15.07.24 4,250,000 MYR 1,020,609.37 931,225.29 0.94Malaysia 4.254% 15-31.05.35 850,000 MYR 185,610.67 185,658.09 0.19Malaysia 4.498% 10-15.04.30 2,580,000 MYR 547,062.13 583,638.85 0.59Mexico 7.5% 06-03.06.27 Bonos* 495,935 MXN 2,245,858.43 2,262,015.16 2.28
Pramerica Sicav
The accompanying notes form an integral part of these financial statements.
175
* Securities partially or totally lent (see Note 9).
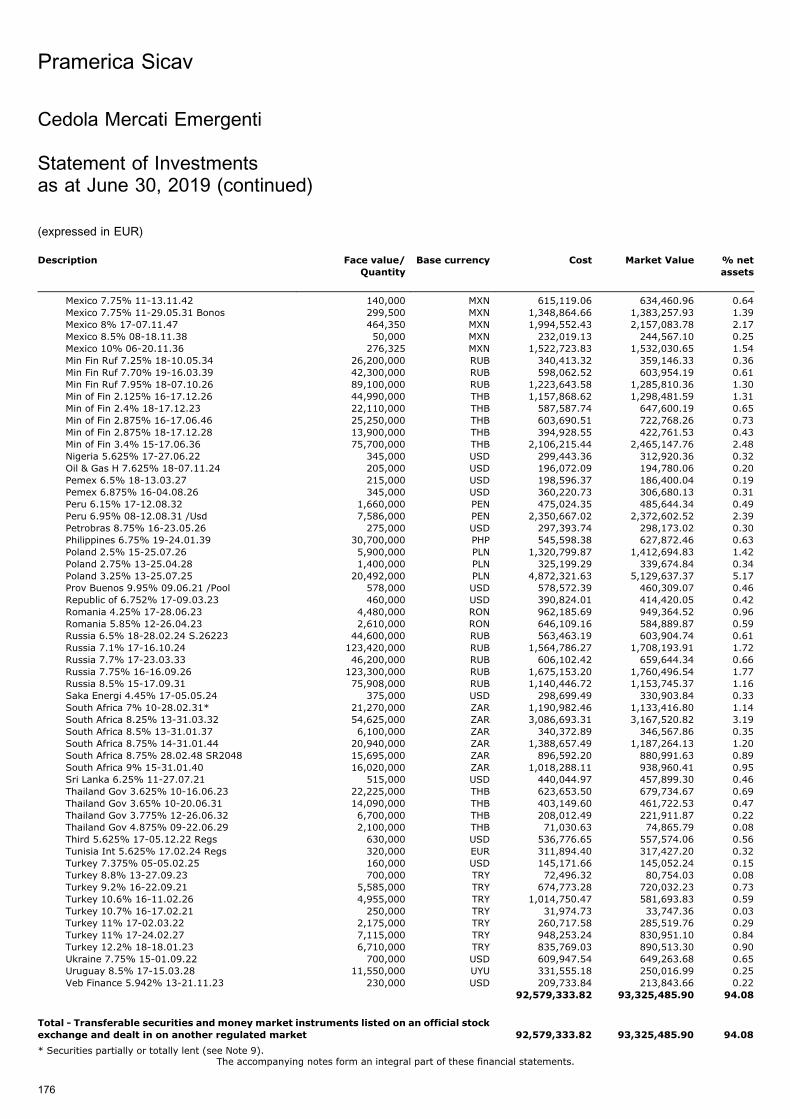
Description Face value/
Quantity
Base currency Cost Market Value % net
assets
Mexico 7.75% 11-13.11.42 140,000 MXN 615,119.06 634,460.96 0.64Mexico 7.75% 11-29.05.31 Bonos 299,500 MXN 1,348,864.66 1,383,257.93 1.39Mexico 8% 17-07.11.47 464,350 MXN 1,994,552.43 2,157,083.78 2.17Mexico 8.5% 08-18.11.38 50,000 MXN 232,019.13 244,567.10 0.25Mexico 10% 06-20.11.36 276,325 MXN 1,522,723.83 1,532,030.65 1.54Min Fin Ruf 7.25% 18-10.05.34 26,200,000 RUB 340,413.32 359,146.33 0.36Min Fin Ruf 7.70% 19-16.03.39 42,300,000 RUB 598,062.52 603,954.19 0.61Min Fin Ruf 7.95% 18-07.10.26 89,100,000 RUB 1,223,643.58 1,285,810.36 1.30Min of Fin 2.125% 16-17.12.26 44,990,000 THB 1,157,868.62 1,298,481.59 1.31Min of Fin 2.4% 18-17.12.23 22,110,000 THB 587,587.74 647,600.19 0.65Min of Fin 2.875% 16-17.06.46 25,250,000 THB 603,690.51 722,768.26 0.73Min of Fin 2.875% 18-17.12.28 13,900,000 THB 394,928.55 422,761.53 0.43Min of Fin 3.4% 15-17.06.36 75,700,000 THB 2,106,215.44 2,465,147.76 2.48Nigeria 5.625% 17-27.06.22 345,000 USD 299,443.36 312,920.36 0.32Oil & Gas H 7.625% 18-07.11.24 205,000 USD 196,072.09 194,780.06 0.20Pemex 6.5% 18-13.03.27 215,000 USD 198,596.37 186,400.04 0.19Pemex 6.875% 16-04.08.26 345,000 USD 360,220.73 306,680.13 0.31Peru 6.15% 17-12.08.32 1,660,000 PEN 475,024.35 485,644.34 0.49Peru 6.95% 08-12.08.31 /Usd 7,586,000 PEN 2,350,667.02 2,372,602.52 2.39Petrobras 8.75% 16-23.05.26 275,000 USD 297,393.74 298,173.02 0.30Philippines 6.75% 19-24.01.39 30,700,000 PHP 545,598.38 627,872.46 0.63Poland 2.5% 15-25.07.26 5,900,000 PLN 1,320,799.87 1,412,694.83 1.42Poland 2.75% 13-25.04.28 1,400,000 PLN 325,199.29 339,674.84 0.34Poland 3.25% 13-25.07.25 20,492,000 PLN 4,872,321.63 5,129,637.37 5.17Prov Buenos 9.95% 09.06.21 /Pool 578,000 USD 578,572.39 460,309.07 0.46Republic of 6.752% 17-09.03.23 460,000 USD 390,824.01 414,420.05 0.42Romania 4.25% 17-28.06.23 4,480,000 RON 962,185.69 949,364.52 0.96Romania 5.85% 12-26.04.23 2,610,000 RON 646,109.16 584,889.87 0.59Russia 6.5% 18-28.02.24 S.26223 44,600,000 RUB 563,463.19 603,904.74 0.61Russia 7.1% 17-16.10.24 123,420,000 RUB 1,564,786.27 1,708,193.91 1.72Russia 7.7% 17-23.03.33 46,200,000 RUB 606,102.42 659,644.34 0.66Russia 7.75% 16-16.09.26 123,300,000 RUB 1,675,153.20 1,760,496.54 1.77Russia 8.5% 15-17.09.31 75,908,000 RUB 1,140,446.72 1,153,745.37 1.16Saka Energi 4.45% 17-05.05.24 375,000 USD 298,699.49 330,903.84 0.33South Africa 7% 10-28.02.31* 21,270,000 ZAR 1,190,982.46 1,133,416.80 1.14South Africa 8.25% 13-31.03.32 54,625,000 ZAR 3,086,693.31 3,167,520.82 3.19South Africa 8.5% 13-31.01.37 6,100,000 ZAR 340,372.89 346,567.86 0.35South Africa 8.75% 14-31.01.44 20,940,000 ZAR 1,388,657.49 1,187,264.13 1.20South Africa 8.75% 28.02.48 SR2048 15,695,000 ZAR 896,592.20 880,991.63 0.89South Africa 9% 15-31.01.40 16,020,000 ZAR 1,018,288.11 938,960.41 0.95Sri Lanka 6.25% 11-27.07.21 515,000 USD 440,044.97 457,899.30 0.46Thailand Gov 3.625% 10-16.06.23 22,225,000 THB 623,653.50 679,734.67 0.69Thailand Gov 3.65% 10-20.06.31 14,090,000 THB 403,149.60 461,722.53 0.47Thailand Gov 3.775% 12-26.06.32 6,700,000 THB 208,012.49 221,911.87 0.22Thailand Gov 4.875% 09-22.06.29 2,100,000 THB 71,030.63 74,865.79 0.08Third 5.625% 17-05.12.22 Regs 630,000 USD 536,776.65 557,574.06 0.56Tunisia Int 5.625% 17.02.24 Regs 320,000 EUR 311,894.40 317,427.20 0.32Turkey 7.375% 05-05.02.25 160,000 USD 145,171.66 145,052.24 0.15Turkey 8.8% 13-27.09.23 700,000 TRY 72,496.32 80,754.03 0.08Turkey 9.2% 16-22.09.21 5,585,000 TRY 674,773.28 720,032.23 0.73Turkey 10.6% 16-11.02.26 4,955,000 TRY 1,014,750.47 581,693.83 0.59Turkey 10.7% 16-17.02.21 250,000 TRY 31,974.73 33,747.36 0.03Turkey 11% 17-02.03.22 2,175,000 TRY 260,717.58 285,519.76 0.29Turkey 11% 17-24.02.27 7,115,000 TRY 948,253.24 830,951.10 0.84Turkey 12.2% 18-18.01.23 6,710,000 TRY 835,769.03 890,513.30 0.90Ukraine 7.75% 15-01.09.22 700,000 USD 609,947.54 649,263.68 0.65Uruguay 8.5% 17-15.03.28 11,550,000 UYU 331,555.18 250,016.99 0.25Veb Finance 5.942% 13-21.11.23 230,000 USD 209,733.84 213,843.66 0.22
92,579,333.82 93,325,485.90 94.08
Total - Transferable securities and money market instruments listed on an official stock
exchange and dealt in on another regulated market 92,579,333.82 93,325,485.90 94.08
Pramerica Sicav
The accompanying notes form an integral part of these financial statements.
176
Cedola Mercati Emergenti
Statement of Investmentsas at June 30, 2019 (continued)
(expressed in EUR)
* Securities partially or totally lent (see Note 9).
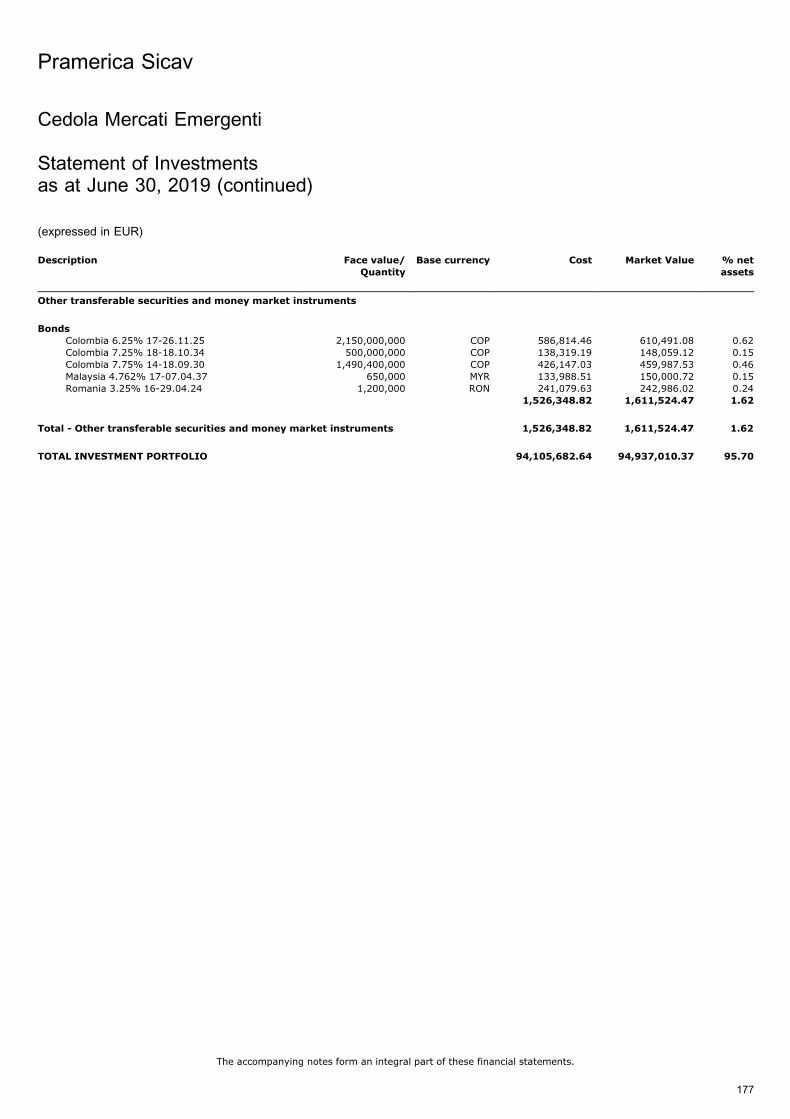
Description Face value/
Quantity
Base currency Cost Market Value % net
assets
Other transferable securities and money market instruments
Bonds
Colombia 6.25% 17-26.11.25 2,150,000,000 COP 586,814.46 610,491.08 0.62Colombia 7.25% 18-18.10.34 500,000,000 COP 138,319.19 148,059.12 0.15Colombia 7.75% 14-18.09.30 1,490,400,000 COP 426,147.03 459,987.53 0.46Malaysia 4.762% 17-07.04.37 650,000 MYR 133,988.51 150,000.72 0.15Romania 3.25% 16-29.04.24 1,200,000 RON 241,079.63 242,986.02 0.24
1,526,348.82 1,611,524.47 1.62
Total - Other transferable securities and money market instruments 1,526,348.82 1,611,524.47 1.62
TOTAL INVESTMENT PORTFOLIO 94,105,682.64 94,937,010.37 95.70
Pramerica Sicav
The accompanying notes form an integral part of these financial statements.
177
Cedola Mercati Emergenti
Statement of Investmentsas at June 30, 2019 (continued)
(expressed in EUR)
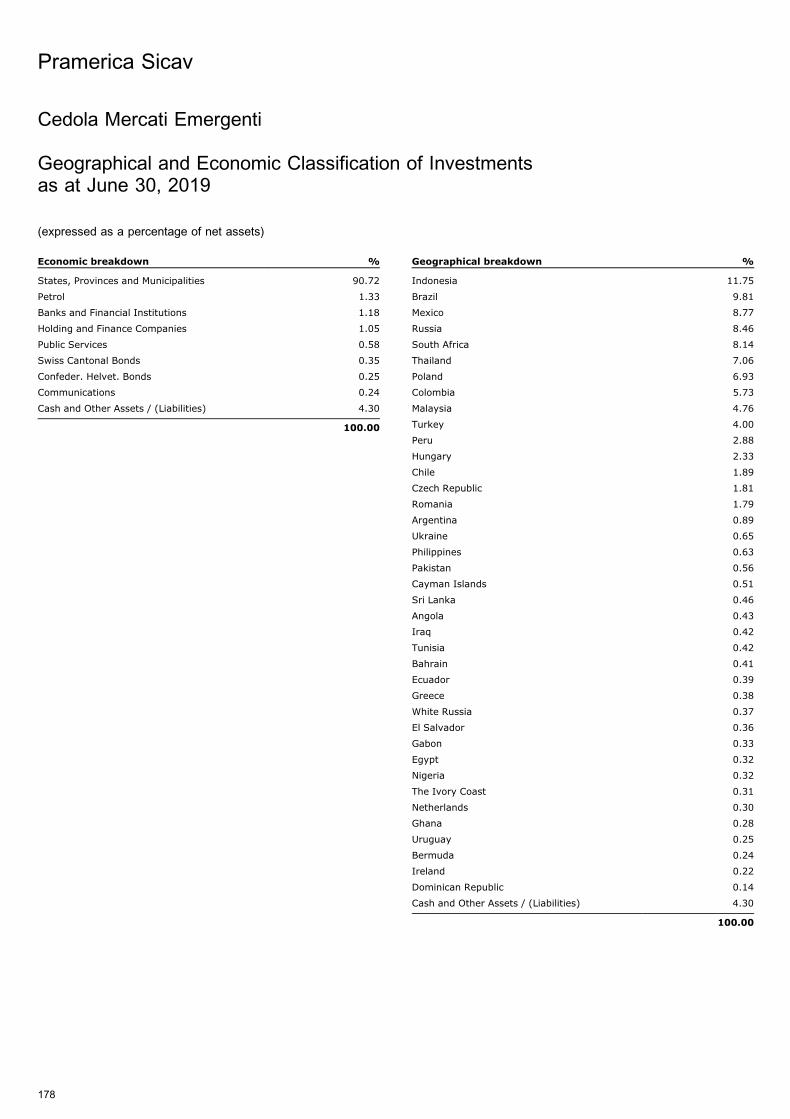
Cedola Mercati Emergenti
Geographical and Economic Classification of Investmentsas at June 30, 2019
(expressed as a percentage of net assets)
Economic breakdown %
States, Provinces and Municipalities 90.72
Petrol 1.33
Banks and Financial Institutions 1.18
Holding and Finance Companies 1.05
Public Services 0.58
Swiss Cantonal Bonds 0.35
Confeder. Helvet. Bonds 0.25
Communications 0.24
Cash and Other Assets / (Liabilities) 4.30
100.00
Geographical breakdown %
Indonesia 11.75
Brazil 9.81
Mexico 8.77
Russia 8.46
South Africa 8.14
Thailand 7.06
Poland 6.93
Colombia 5.73
Malaysia 4.76
Turkey 4.00
Peru 2.88
Hungary 2.33
Chile 1.89
Czech Republic 1.81
Romania 1.79
Argentina 0.89
Ukraine 0.65
Philippines 0.63
Pakistan 0.56
Cayman Islands 0.51
Sri Lanka 0.46
Angola 0.43
Iraq 0.42
Tunisia 0.42
Bahrain 0.41
Ecuador 0.39
Greece 0.38
White Russia 0.37
El Salvador 0.36
Gabon 0.33
Egypt 0.32
Nigeria 0.32
The Ivory Coast 0.31
Netherlands 0.30
Ghana 0.28
Uruguay 0.25
Bermuda 0.24
Ireland 0.22
Dominican Republic 0.14
Cash and Other Assets / (Liabilities) 4.30
100.00
Pramerica Sicav
178
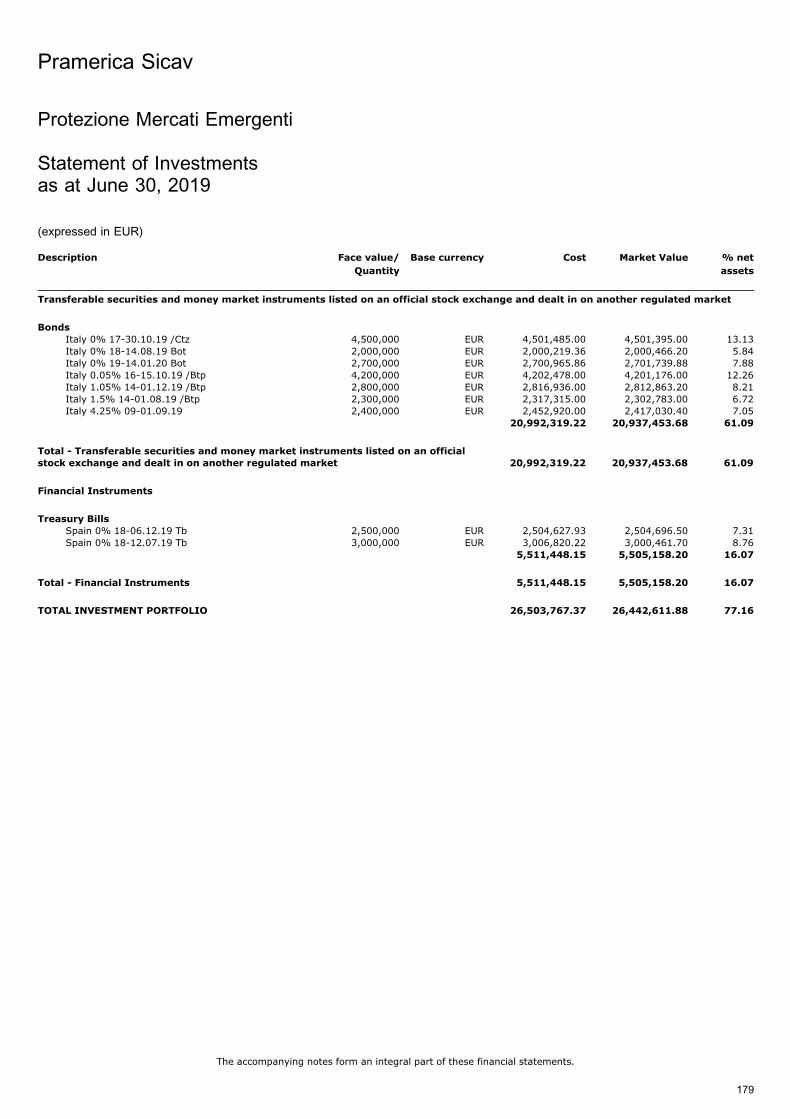
Protezione Mercati Emergenti
Statement of Investmentsas at June 30, 2019
(expressed in EUR)
Description Face value/
Quantity
Base currency Cost Market Value % net
assets
Transferable securities and money market instruments listed on an official stock exchange and dealt in on another regulated market
Bonds
Italy 0% 17-30.10.19 /Ctz 4,500,000 EUR 4,501,485.00 4,501,395.00 13.13Italy 0% 18-14.08.19 Bot 2,000,000 EUR 2,000,219.36 2,000,466.20 5.84Italy 0% 19-14.01.20 Bot 2,700,000 EUR 2,700,965.86 2,701,739.88 7.88Italy 0.05% 16-15.10.19 /Btp 4,200,000 EUR 4,202,478.00 4,201,176.00 12.26Italy 1.05% 14-01.12.19 /Btp 2,800,000 EUR 2,816,936.00 2,812,863.20 8.21Italy 1.5% 14-01.08.19 /Btp 2,300,000 EUR 2,317,315.00 2,302,783.00 6.72Italy 4.25% 09-01.09.19 2,400,000 EUR 2,452,920.00 2,417,030.40 7.05
20,992,319.22 20,937,453.68 61.09
Total - Transferable securities and money market instruments listed on an officialstock exchange and dealt in on another regulated market 20,992,319.22 20,937,453.68 61.09
Financial Instruments
Treasury Bills
Spain 0% 18-06.12.19 Tb 2,500,000 EUR 2,504,627.93 2,504,696.50 7.31Spain 0% 18-12.07.19 Tb 3,000,000 EUR 3,006,820.22 3,000,461.70 8.76
5,511,448.15 5,505,158.20 16.07
Total - Financial Instruments 5,511,448.15 5,505,158.20 16.07
TOTAL INVESTMENT PORTFOLIO 26,503,767.37 26,442,611.88 77.16
Pramerica Sicav
The accompanying notes form an integral part of these financial statements.
179
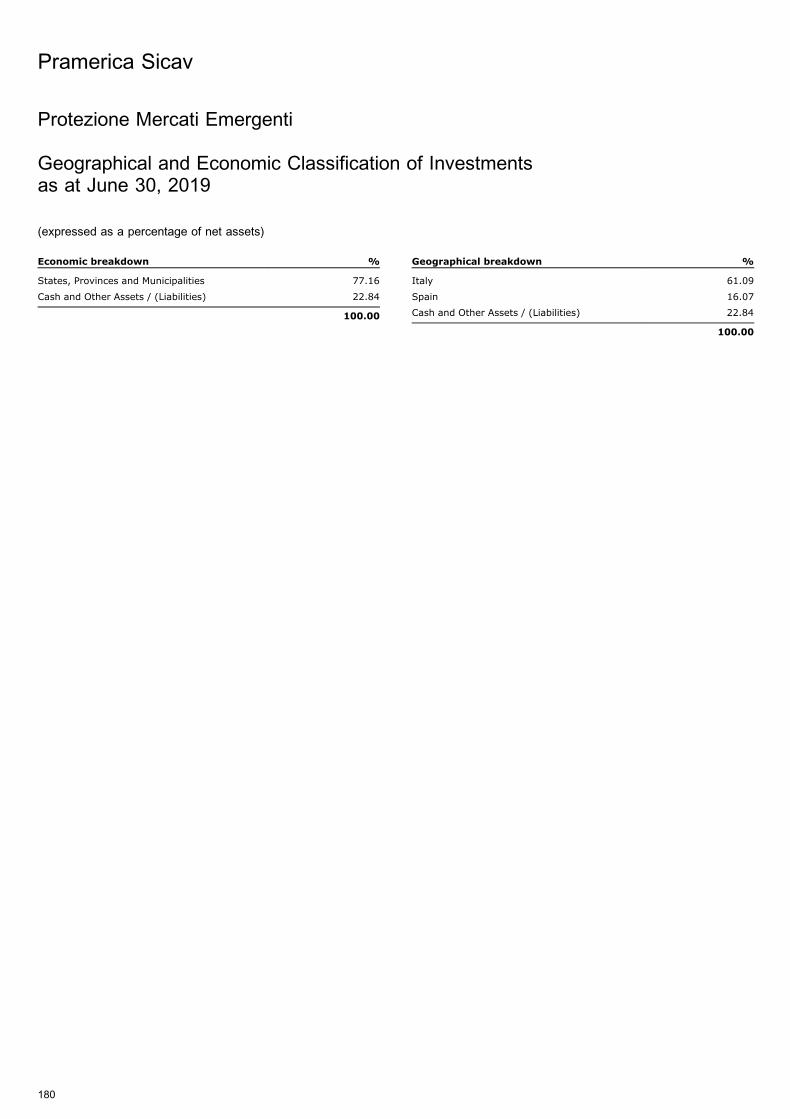
Protezione Mercati Emergenti
Geographical and Economic Classification of Investmentsas at June 30, 2019
(expressed as a percentage of net assets)
Economic breakdown %
States, Provinces and Municipalities 77.16
Cash and Other Assets / (Liabilities) 22.84
100.00
Geographical breakdown %
Italy 61.09
Spain 16.07
Cash and Other Assets / (Liabilities) 22.84
100.00
Pramerica Sicav
180
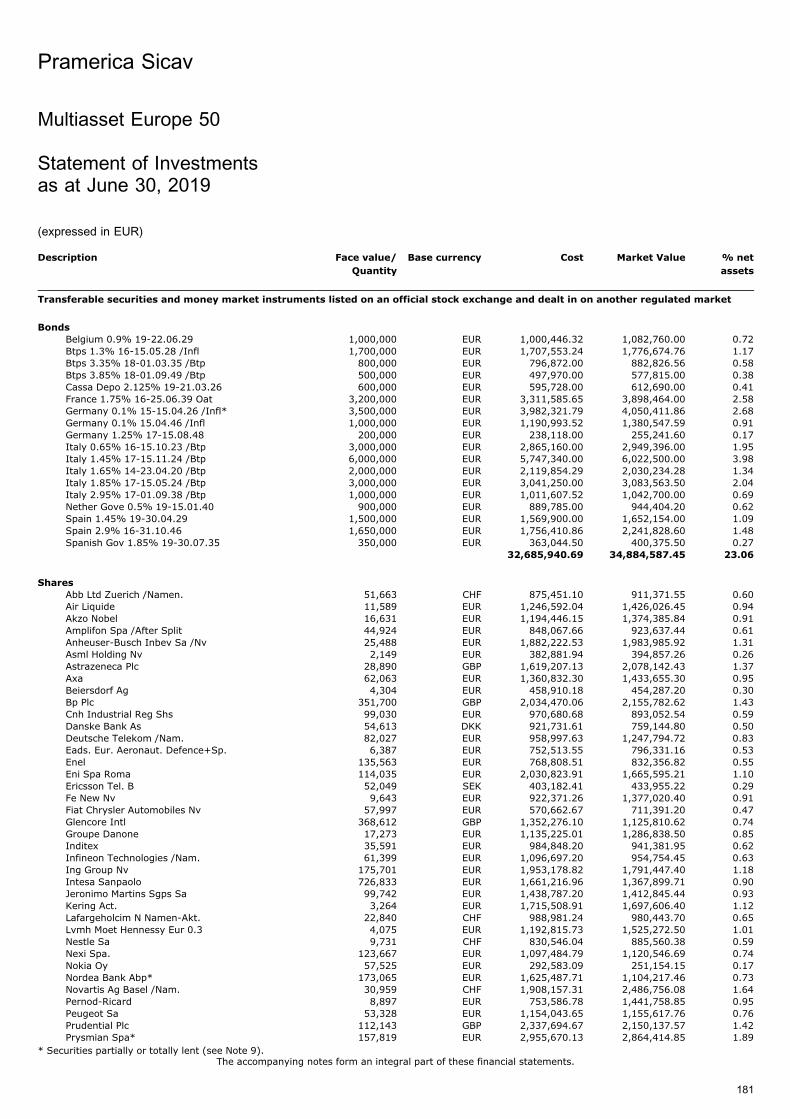
Multiasset Europe 50
Statement of Investmentsas at June 30, 2019
(expressed in EUR)
Description Face value/
Quantity
Base currency Cost Market Value % net
assets
Transferable securities and money market instruments listed on an official stock exchange and dealt in on another regulated market
Bonds
Belgium 0.9% 19-22.06.29 1,000,000 EUR 1,000,446.32 1,082,760.00 0.72Btps 1.3% 16-15.05.28 /Infl 1,700,000 EUR 1,707,553.24 1,776,674.76 1.17Btps 3.35% 18-01.03.35 /Btp 800,000 EUR 796,872.00 882,826.56 0.58Btps 3.85% 18-01.09.49 /Btp 500,000 EUR 497,970.00 577,815.00 0.38Cassa Depo 2.125% 19-21.03.26 600,000 EUR 595,728.00 612,690.00 0.41France 1.75% 16-25.06.39 Oat 3,200,000 EUR 3,311,585.65 3,898,464.00 2.58Germany 0.1% 15-15.04.26 /Infl* 3,500,000 EUR 3,982,321.79 4,050,411.86 2.68Germany 0.1% 15.04.46 /Infl 1,000,000 EUR 1,190,993.52 1,380,547.59 0.91Germany 1.25% 17-15.08.48 200,000 EUR 238,118.00 255,241.60 0.17Italy 0.65% 16-15.10.23 /Btp 3,000,000 EUR 2,865,160.00 2,949,396.00 1.95Italy 1.45% 17-15.11.24 /Btp 6,000,000 EUR 5,747,340.00 6,022,500.00 3.98Italy 1.65% 14-23.04.20 /Btp 2,000,000 EUR 2,119,854.29 2,030,234.28 1.34Italy 1.85% 17-15.05.24 /Btp 3,000,000 EUR 3,041,250.00 3,083,563.50 2.04Italy 2.95% 17-01.09.38 /Btp 1,000,000 EUR 1,011,607.52 1,042,700.00 0.69Nether Gove 0.5% 19-15.01.40 900,000 EUR 889,785.00 944,404.20 0.62Spain 1.45% 19-30.04.29 1,500,000 EUR 1,569,900.00 1,652,154.00 1.09Spain 2.9% 16-31.10.46 1,650,000 EUR 1,756,410.86 2,241,828.60 1.48Spanish Gov 1.85% 19-30.07.35 350,000 EUR 363,044.50 400,375.50 0.27
32,685,940.69 34,884,587.45 23.06
Shares
Abb Ltd Zuerich /Namen. 51,663 CHF 875,451.10 911,371.55 0.60Air Liquide 11,589 EUR 1,246,592.04 1,426,026.45 0.94Akzo Nobel 16,631 EUR 1,194,446.15 1,374,385.84 0.91Amplifon Spa /After Split 44,924 EUR 848,067.66 923,637.44 0.61Anheuser-Busch Inbev Sa /Nv 25,488 EUR 1,882,222.53 1,983,985.92 1.31Asml Holding Nv 2,149 EUR 382,881.94 394,857.26 0.26Astrazeneca Plc 28,890 GBP 1,619,207.13 2,078,142.43 1.37Axa 62,063 EUR 1,360,832.30 1,433,655.30 0.95Beiersdorf Ag 4,304 EUR 458,910.18 454,287.20 0.30Bp Plc 351,700 GBP 2,034,470.06 2,155,782.62 1.43Cnh Industrial Reg Shs 99,030 EUR 970,680.68 893,052.54 0.59Danske Bank As 54,613 DKK 921,731.61 759,144.80 0.50Deutsche Telekom /Nam. 82,027 EUR 958,997.63 1,247,794.72 0.83Eads. Eur. Aeronaut. Defence+Sp. 6,387 EUR 752,513.55 796,331.16 0.53Enel 135,563 EUR 768,808.51 832,356.82 0.55Eni Spa Roma 114,035 EUR 2,030,823.91 1,665,595.21 1.10Ericsson Tel. B 52,049 SEK 403,182.41 433,955.22 0.29Fe New Nv 9,643 EUR 922,371.26 1,377,020.40 0.91Fiat Chrysler Automobiles Nv 57,997 EUR 570,662.67 711,391.20 0.47Glencore Intl 368,612 GBP 1,352,276.10 1,125,810.62 0.74Groupe Danone 17,273 EUR 1,135,225.01 1,286,838.50 0.85Inditex 35,591 EUR 984,848.20 941,381.95 0.62Infineon Technologies /Nam. 61,399 EUR 1,096,697.20 954,754.45 0.63Ing Group Nv 175,701 EUR 1,953,178.82 1,791,447.40 1.18Intesa Sanpaolo 726,833 EUR 1,661,216.96 1,367,899.71 0.90Jeronimo Martins Sgps Sa 99,742 EUR 1,438,787.20 1,412,845.44 0.93Kering Act. 3,264 EUR 1,715,508.91 1,697,606.40 1.12Lafargeholcim N Namen-Akt. 22,840 CHF 988,981.24 980,443.70 0.65Lvmh Moet Hennessy Eur 0.3 4,075 EUR 1,192,815.73 1,525,272.50 1.01Nestle Sa 9,731 CHF 830,546.04 885,560.38 0.59Nexi Spa. 123,667 EUR 1,097,484.79 1,120,546.69 0.74Nokia Oy 57,525 EUR 292,583.09 251,154.15 0.17Nordea Bank Abp* 173,065 EUR 1,625,487.71 1,104,217.46 0.73Novartis Ag Basel /Nam. 30,959 CHF 1,908,157.31 2,486,756.08 1.64Pernod-Ricard 8,897 EUR 753,586.78 1,441,758.85 0.95Peugeot Sa 53,328 EUR 1,154,043.65 1,155,617.76 0.76Prudential Plc 112,143 GBP 2,337,694.67 2,150,137.57 1.42Prysmian Spa* 157,819 EUR 2,955,670.13 2,864,414.85 1.89
Pramerica Sicav
The accompanying notes form an integral part of these financial statements.
181
* Securities partially or totally lent (see Note 9).
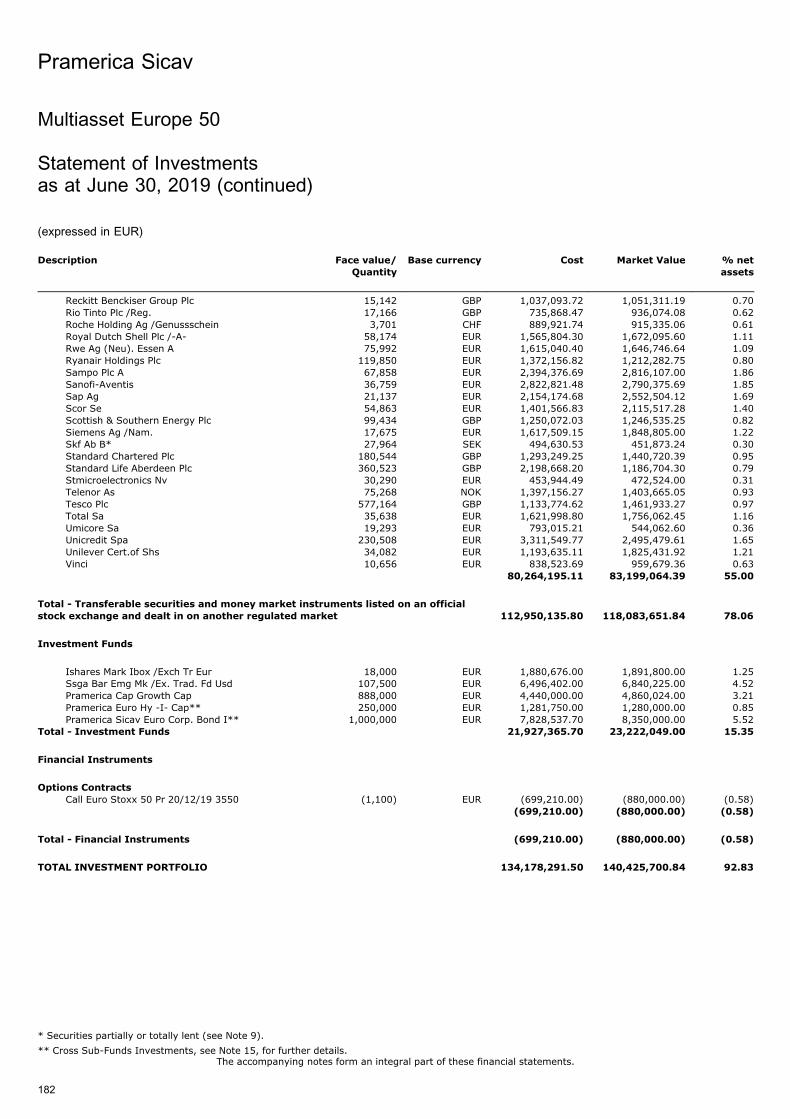
Description Face value/
Quantity
Base currency Cost Market Value % net
assets
Reckitt Benckiser Group Plc 15,142 GBP 1,037,093.72 1,051,311.19 0.70Rio Tinto Plc /Reg. 17,166 GBP 735,868.47 936,074.08 0.62Roche Holding Ag /Genussschein 3,701 CHF 889,921.74 915,335.06 0.61Royal Dutch Shell Plc /-A- 58,174 EUR 1,565,804.30 1,672,095.60 1.11Rwe Ag (Neu). Essen A 75,992 EUR 1,615,040.40 1,646,746.64 1.09Ryanair Holdings Plc 119,850 EUR 1,372,156.82 1,212,282.75 0.80Sampo Plc A 67,858 EUR 2,394,376.69 2,816,107.00 1.86Sanofi-Aventis 36,759 EUR 2,822,821.48 2,790,375.69 1.85Sap Ag 21,137 EUR 2,154,174.68 2,552,504.12 1.69Scor Se 54,863 EUR 1,401,566.83 2,115,517.28 1.40Scottish & Southern Energy Plc 99,434 GBP 1,250,072.03 1,246,535.25 0.82Siemens Ag /Nam. 17,675 EUR 1,617,509.15 1,848,805.00 1.22Skf Ab B* 27,964 SEK 494,630.53 451,873.24 0.30Standard Chartered Plc 180,544 GBP 1,293,249.25 1,440,720.39 0.95Standard Life Aberdeen Plc 360,523 GBP 2,198,668.20 1,186,704.30 0.79Stmicroelectronics Nv 30,290 EUR 453,944.49 472,524.00 0.31Telenor As 75,268 NOK 1,397,156.27 1,403,665.05 0.93Tesco Plc 577,164 GBP 1,133,774.62 1,461,933.27 0.97Total Sa 35,638 EUR 1,621,998.80 1,756,062.45 1.16Umicore Sa 19,293 EUR 793,015.21 544,062.60 0.36Unicredit Spa 230,508 EUR 3,311,549.77 2,495,479.61 1.65Unilever Cert.of Shs 34,082 EUR 1,193,635.11 1,825,431.92 1.21Vinci 10,656 EUR 838,523.69 959,679.36 0.63
80,264,195.11 83,199,064.39 55.00
Total - Transferable securities and money market instruments listed on an official
stock exchange and dealt in on another regulated market 112,950,135.80 118,083,651.84 78.06
Investment Funds
Ishares Mark Ibox /Exch Tr Eur 18,000 EUR 1,880,676.00 1,891,800.00 1.25Ssga Bar Emg Mk /Ex. Trad. Fd Usd 107,500 EUR 6,496,402.00 6,840,225.00 4.52Pramerica Cap Growth Cap 888,000 EUR 4,440,000.00 4,860,024.00 3.21Pramerica Euro Hy -I- Cap** 250,000 EUR 1,281,750.00 1,280,000.00 0.85Pramerica Sicav Euro Corp. Bond I** 1,000,000 EUR 7,828,537.70 8,350,000.00 5.52
Total - Investment Funds 21,927,365.70 23,222,049.00 15.35
Financial Instruments
Options Contracts
Call Euro Stoxx 50 Pr 20/12/19 3550 (1,100) EUR (699,210.00) (880,000.00) (0.58)(699,210.00) (880,000.00) (0.58)
Total - Financial Instruments (699,210.00) (880,000.00) (0.58)
TOTAL INVESTMENT PORTFOLIO 134,178,291.50 140,425,700.84 92.83
Pramerica Sicav
The accompanying notes form an integral part of these financial statements.
182
Multiasset Europe 50
Statement of Investmentsas at June 30, 2019 (continued)
(expressed in EUR)
* Securities partially or totally lent (see Note 9).
** Cross Sub-Funds Investments, see Note 15, for further details.
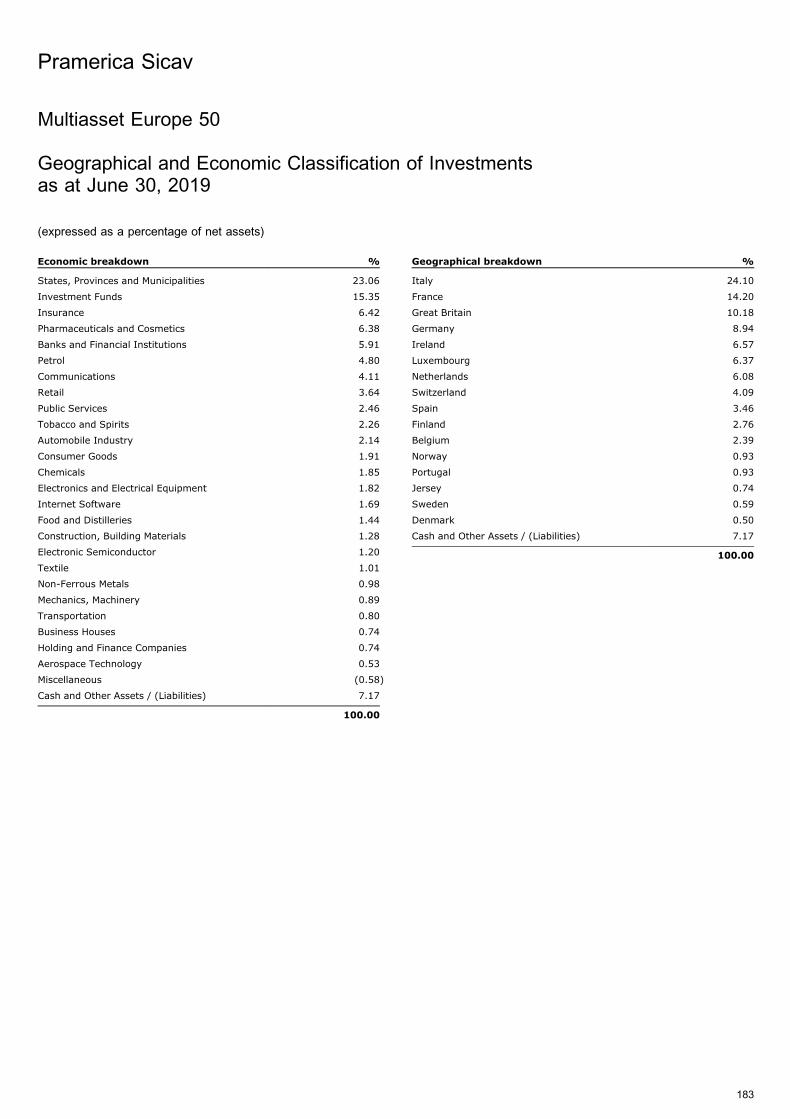
Multiasset Europe 50
Geographical and Economic Classification of Investmentsas at June 30, 2019
(expressed as a percentage of net assets)
Economic breakdown %
States, Provinces and Municipalities 23.06
Investment Funds 15.35
Insurance 6.42
Pharmaceuticals and Cosmetics 6.38
Banks and Financial Institutions 5.91
Petrol 4.80
Communications 4.11
Retail 3.64
Public Services 2.46
Tobacco and Spirits 2.26
Automobile Industry 2.14
Consumer Goods 1.91
Chemicals 1.85
Electronics and Electrical Equipment 1.82
Internet Software 1.69
Food and Distilleries 1.44
Construction, Building Materials 1.28
Electronic Semiconductor 1.20
Textile 1.01
Non-Ferrous Metals 0.98
Mechanics, Machinery 0.89
Transportation 0.80
Business Houses 0.74
Holding and Finance Companies 0.74
Aerospace Technology 0.53
Miscellaneous (0.58)
Cash and Other Assets / (Liabilities) 7.17
100.00
Geographical breakdown %
Italy 24.10
France 14.20
Great Britain 10.18
Germany 8.94
Ireland 6.57
Luxembourg 6.37
Netherlands 6.08
Switzerland 4.09
Spain 3.46
Finland 2.76
Belgium 2.39
Norway 0.93
Portugal 0.93
Jersey 0.74
Sweden 0.59
Denmark 0.50
Cash and Other Assets / (Liabilities) 7.17
100.00
Pramerica Sicav
183
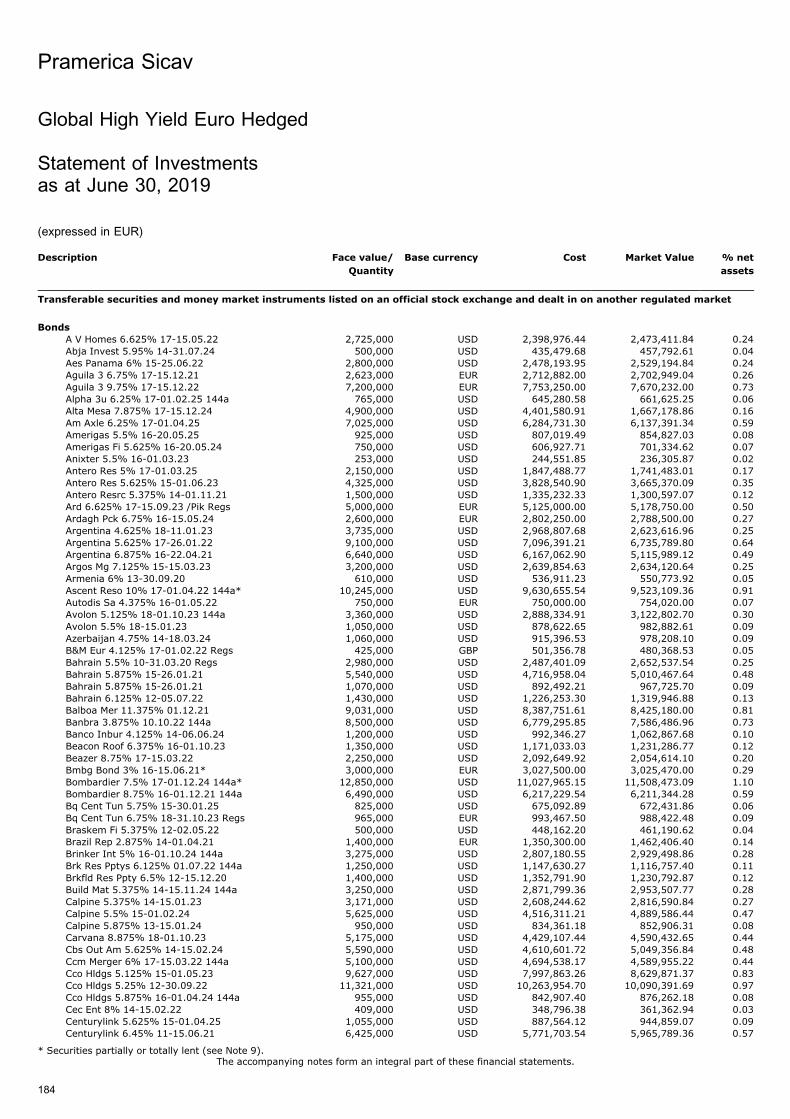
Global High Yield Euro Hedged
Statement of Investmentsas at June 30, 2019
(expressed in EUR)
Description Face value/
Quantity
Base currency Cost Market Value % net
assets
Transferable securities and money market instruments listed on an official stock exchange and dealt in on another regulated market
Bonds
A V Homes 6.625% 17-15.05.22 2,725,000 USD 2,398,976.44 2,473,411.84 0.24Abja Invest 5.95% 14-31.07.24 500,000 USD 435,479.68 457,792.61 0.04Aes Panama 6% 15-25.06.22 2,800,000 USD 2,478,193.95 2,529,194.84 0.24Aguila 3 6.75% 17-15.12.21 2,623,000 EUR 2,712,882.00 2,702,949.04 0.26Aguila 3 9.75% 17-15.12.22 7,200,000 EUR 7,753,250.00 7,670,232.00 0.73Alpha 3u 6.25% 17-01.02.25 144a 765,000 USD 645,280.58 661,625.25 0.06Alta Mesa 7.875% 17-15.12.24 4,900,000 USD 4,401,580.91 1,667,178.86 0.16Am Axle 6.25% 17-01.04.25 7,025,000 USD 6,284,731.30 6,137,391.34 0.59Amerigas 5.5% 16-20.05.25 925,000 USD 807,019.49 854,827.03 0.08Amerigas Fi 5.625% 16-20.05.24 750,000 USD 606,927.71 701,334.62 0.07Anixter 5.5% 16-01.03.23 253,000 USD 244,551.85 236,305.87 0.02Antero Res 5% 17-01.03.25 2,150,000 USD 1,847,488.77 1,741,483.01 0.17Antero Res 5.625% 15-01.06.23 4,325,000 USD 3,828,540.90 3,665,370.09 0.35Antero Resrc 5.375% 14-01.11.21 1,500,000 USD 1,335,232.33 1,300,597.07 0.12Ard 6.625% 17-15.09.23 /Pik Regs 5,000,000 EUR 5,125,000.00 5,178,750.00 0.50Ardagh Pck 6.75% 16-15.05.24 2,600,000 EUR 2,802,250.00 2,788,500.00 0.27Argentina 4.625% 18-11.01.23 3,735,000 USD 2,968,807.68 2,623,616.96 0.25Argentina 5.625% 17-26.01.22 9,100,000 USD 7,096,391.21 6,735,789.80 0.64Argentina 6.875% 16-22.04.21 6,640,000 USD 6,167,062.90 5,115,989.12 0.49Argos Mg 7.125% 15-15.03.23 3,200,000 USD 2,639,854.63 2,634,120.64 0.25Armenia 6% 13-30.09.20 610,000 USD 536,911.23 550,773.92 0.05Ascent Reso 10% 17-01.04.22 144a* 10,245,000 USD 9,630,655.54 9,523,109.36 0.91Autodis Sa 4.375% 16-01.05.22 750,000 EUR 750,000.00 754,020.00 0.07Avolon 5.125% 18-01.10.23 144a 3,360,000 USD 2,888,334.91 3,122,802.70 0.30Avolon 5.5% 18-15.01.23 1,050,000 USD 878,622.65 982,882.61 0.09Azerbaijan 4.75% 14-18.03.24 1,060,000 USD 915,396.53 978,208.10 0.09B&M Eur 4.125% 17-01.02.22 Regs 425,000 GBP 501,356.78 480,368.53 0.05Bahrain 5.5% 10-31.03.20 Regs 2,980,000 USD 2,487,401.09 2,652,537.54 0.25Bahrain 5.875% 15-26.01.21 5,540,000 USD 4,716,958.04 5,010,467.64 0.48Bahrain 5.875% 15-26.01.21 1,070,000 USD 892,492.21 967,725.70 0.09Bahrain 6.125% 12-05.07.22 1,430,000 USD 1,226,253.30 1,319,946.88 0.13Balboa Mer 11.375% 01.12.21 9,031,000 USD 8,387,751.61 8,425,180.00 0.81Banbra 3.875% 10.10.22 144a 8,500,000 USD 6,779,295.85 7,586,486.96 0.73Banco Inbur 4.125% 14-06.06.24 1,200,000 USD 992,346.27 1,062,867.68 0.10Beacon Roof 6.375% 16-01.10.23 1,350,000 USD 1,171,033.03 1,231,286.77 0.12Beazer 8.75% 17-15.03.22 2,250,000 USD 2,092,649.92 2,054,614.10 0.20Bmbg Bond 3% 16-15.06.21* 3,000,000 EUR 3,027,500.00 3,025,470.00 0.29Bombardier 7.5% 17-01.12.24 144a* 12,850,000 USD 11,027,965.15 11,508,473.09 1.10Bombardier 8.75% 16-01.12.21 144a 6,490,000 USD 6,217,229.54 6,211,344.28 0.59Bq Cent Tun 5.75% 15-30.01.25 825,000 USD 675,092.89 672,431.86 0.06Bq Cent Tun 6.75% 18-31.10.23 Regs 965,000 EUR 993,467.50 988,422.48 0.09Braskem Fi 5.375% 12-02.05.22 500,000 USD 448,162.20 461,190.62 0.04Brazil Rep 2.875% 14-01.04.21 1,400,000 EUR 1,350,300.00 1,462,406.40 0.14Brinker Int 5% 16-01.10.24 144a 3,275,000 USD 2,807,180.55 2,929,498.86 0.28Brk Res Pptys 6.125% 01.07.22 144a 1,250,000 USD 1,147,630.27 1,116,757.40 0.11Brkfld Res Ppty 6.5% 12-15.12.20 1,400,000 USD 1,352,791.90 1,230,792.87 0.12Build Mat 5.375% 14-15.11.24 144a 3,250,000 USD 2,871,799.36 2,953,507.77 0.28Calpine 5.375% 14-15.01.23 3,171,000 USD 2,608,244.62 2,816,590.84 0.27Calpine 5.5% 15-01.02.24 5,625,000 USD 4,516,311.21 4,889,586.44 0.47Calpine 5.875% 13-15.01.24 950,000 USD 834,361.18 852,906.31 0.08Carvana 8.875% 18-01.10.23 5,175,000 USD 4,429,107.44 4,590,432.65 0.44Cbs Out Am 5.625% 14-15.02.24 5,590,000 USD 4,610,601.72 5,049,356.84 0.48Ccm Merger 6% 17-15.03.22 144a 5,100,000 USD 4,694,538.17 4,589,955.22 0.44Cco Hldgs 5.125% 15-01.05.23 9,627,000 USD 7,997,863.26 8,629,871.37 0.83Cco Hldgs 5.25% 12-30.09.22 11,321,000 USD 10,263,954.70 10,090,391.69 0.97Cco Hldgs 5.875% 16-01.04.24 144a 955,000 USD 842,907.40 876,262.18 0.08Cec Ent 8% 14-15.02.22 409,000 USD 348,796.38 361,362.94 0.03Centurylink 5.625% 15-01.04.25 1,055,000 USD 887,564.12 944,859.07 0.09Centurylink 6.45% 11-15.06.21 6,425,000 USD 5,771,703.54 5,965,789.36 0.57
Pramerica Sicav
The accompanying notes form an integral part of these financial statements.
184
* Securities partially or totally lent (see Note 9).
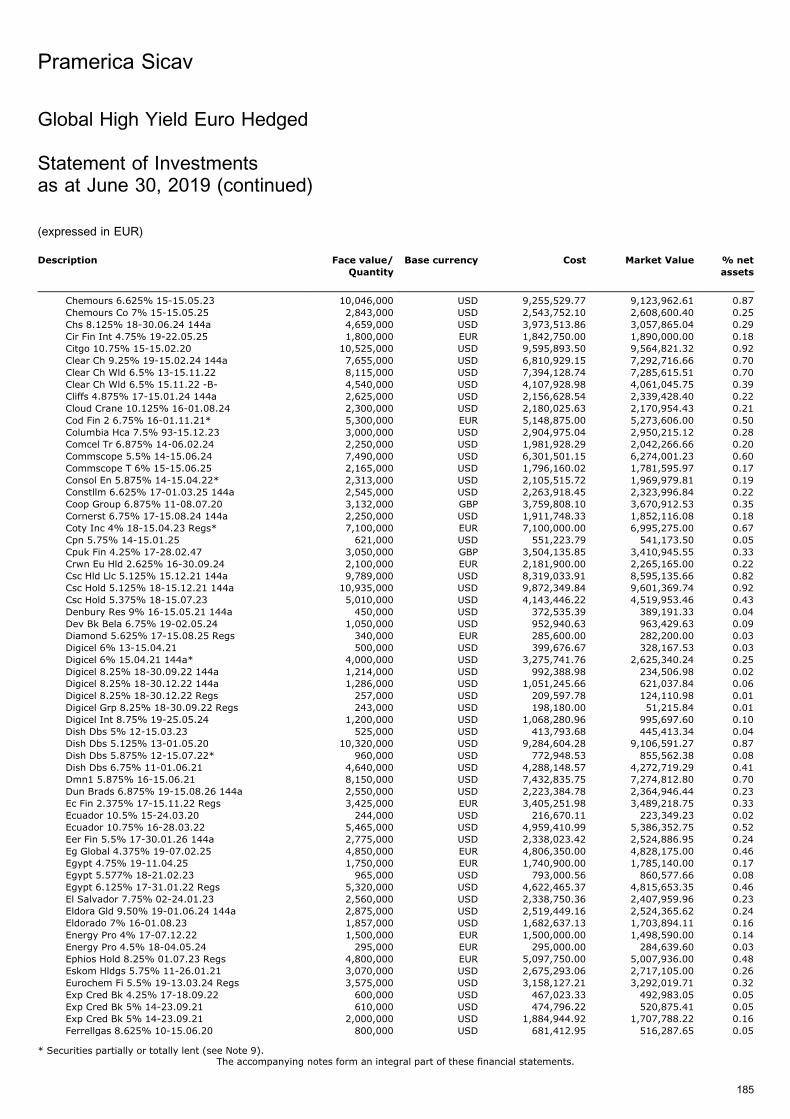
Description Face value/
Quantity
Base currency Cost Market Value % net
assets
Chemours 6.625% 15-15.05.23 10,046,000 USD 9,255,529.77 9,123,962.61 0.87Chemours Co 7% 15-15.05.25 2,843,000 USD 2,543,752.10 2,608,600.40 0.25Chs 8.125% 18-30.06.24 144a 4,659,000 USD 3,973,513.86 3,057,865.04 0.29Cir Fin Int 4.75% 19-22.05.25 1,800,000 EUR 1,842,750.00 1,890,000.00 0.18Citgo 10.75% 15-15.02.20 10,525,000 USD 9,595,893.50 9,564,821.32 0.92Clear Ch 9.25% 19-15.02.24 144a 7,655,000 USD 6,810,929.15 7,292,716.66 0.70Clear Ch Wld 6.5% 13-15.11.22 8,115,000 USD 7,394,128.74 7,285,615.51 0.70Clear Ch Wld 6.5% 15.11.22 -B- 4,540,000 USD 4,107,928.98 4,061,045.75 0.39Cliffs 4.875% 17-15.01.24 144a 2,625,000 USD 2,156,628.54 2,339,428.40 0.22Cloud Crane 10.125% 16-01.08.24 2,300,000 USD 2,180,025.63 2,170,954.43 0.21Cod Fin 2 6.75% 16-01.11.21* 5,300,000 EUR 5,148,875.00 5,273,606.00 0.50Columbia Hca 7.5% 93-15.12.23 3,000,000 USD 2,904,975.04 2,950,215.12 0.28Comcel Tr 6.875% 14-06.02.24 2,250,000 USD 1,981,928.29 2,042,266.66 0.20Commscope 5.5% 14-15.06.24 7,490,000 USD 6,301,501.15 6,274,001.23 0.60Commscope T 6% 15-15.06.25 2,165,000 USD 1,796,160.02 1,781,595.97 0.17Consol En 5.875% 14-15.04.22* 2,313,000 USD 2,105,515.72 1,969,979.81 0.19Constllm 6.625% 17-01.03.25 144a 2,545,000 USD 2,263,918.45 2,323,996.84 0.22Coop Group 6.875% 11-08.07.20 3,132,000 GBP 3,759,808.10 3,670,912.53 0.35Cornerst 6.75% 17-15.08.24 144a 2,250,000 USD 1,911,748.33 1,852,116.08 0.18Coty Inc 4% 18-15.04.23 Regs* 7,100,000 EUR 7,100,000.00 6,995,275.00 0.67Cpn 5.75% 14-15.01.25 621,000 USD 551,223.79 541,173.50 0.05Cpuk Fin 4.25% 17-28.02.47 3,050,000 GBP 3,504,135.85 3,410,945.55 0.33Crwn Eu Hld 2.625% 16-30.09.24 2,100,000 EUR 2,181,900.00 2,265,165.00 0.22Csc Hld Llc 5.125% 15.12.21 144a 9,789,000 USD 8,319,033.91 8,595,135.66 0.82Csc Hold 5.125% 18-15.12.21 144a 10,935,000 USD 9,872,349.84 9,601,369.74 0.92Csc Hold 5.375% 18-15.07.23 5,010,000 USD 4,143,446.22 4,519,953.46 0.43Denbury Res 9% 16-15.05.21 144a 450,000 USD 372,535.39 389,191.33 0.04Dev Bk Bela 6.75% 19-02.05.24 1,050,000 USD 952,940.63 963,429.63 0.09Diamond 5.625% 17-15.08.25 Regs 340,000 EUR 285,600.00 282,200.00 0.03Digicel 6% 13-15.04.21 500,000 USD 399,676.67 328,167.53 0.03Digicel 6% 15.04.21 144a* 4,000,000 USD 3,275,741.76 2,625,340.24 0.25Digicel 8.25% 18-30.09.22 144a 1,214,000 USD 992,388.98 234,506.98 0.02Digicel 8.25% 18-30.12.22 144a 1,286,000 USD 1,051,245.66 621,037.84 0.06Digicel 8.25% 18-30.12.22 Regs 257,000 USD 209,597.78 124,110.98 0.01Digicel Grp 8.25% 18-30.09.22 Regs 243,000 USD 198,180.00 51,215.84 0.01Digicel Int 8.75% 19-25.05.24 1,200,000 USD 1,068,280.96 995,697.60 0.10Dish Dbs 5% 12-15.03.23 525,000 USD 413,793.68 445,413.34 0.04Dish Dbs 5.125% 13-01.05.20 10,320,000 USD 9,284,604.28 9,106,591.27 0.87Dish Dbs 5.875% 12-15.07.22* 960,000 USD 772,948.53 855,562.38 0.08Dish Dbs 6.75% 11-01.06.21 4,640,000 USD 4,288,148.57 4,272,719.29 0.41Dmn1 5.875% 16-15.06.21 8,150,000 USD 7,432,835.75 7,274,812.80 0.70Dun Brads 6.875% 19-15.08.26 144a 2,550,000 USD 2,223,384.78 2,364,946.44 0.23Ec Fin 2.375% 17-15.11.22 Regs 3,425,000 EUR 3,405,251.98 3,489,218.75 0.33Ecuador 10.5% 15-24.03.20 244,000 USD 216,670.11 223,349.23 0.02Ecuador 10.75% 16-28.03.22 5,465,000 USD 4,959,410.99 5,386,352.75 0.52Eer Fin 5.5% 17-30.01.26 144a 2,775,000 USD 2,338,023.42 2,524,886.95 0.24Eg Global 4.375% 19-07.02.25 4,850,000 EUR 4,806,350.00 4,828,175.00 0.46Egypt 4.75% 19-11.04.25 1,750,000 EUR 1,740,900.00 1,785,140.00 0.17Egypt 5.577% 18-21.02.23 965,000 USD 793,000.56 860,577.66 0.08Egypt 6.125% 17-31.01.22 Regs 5,320,000 USD 4,622,465.37 4,815,653.35 0.46El Salvador 7.75% 02-24.01.23 2,560,000 USD 2,338,750.36 2,407,959.96 0.23Eldora Gld 9.50% 19-01.06.24 144a 2,875,000 USD 2,519,449.16 2,524,365.62 0.24Eldorado 7% 16-01.08.23 1,857,000 USD 1,682,637.13 1,703,894.11 0.16Energy Pro 4% 17-07.12.22 1,500,000 EUR 1,500,000.00 1,498,590.00 0.14Energy Pro 4.5% 18-04.05.24 295,000 EUR 295,000.00 284,639.60 0.03Ephios Hold 8.25% 01.07.23 Regs 4,800,000 EUR 5,097,750.00 5,007,936.00 0.48Eskom Hldgs 5.75% 11-26.01.21 3,070,000 USD 2,675,293.06 2,717,105.00 0.26Eurochem Fi 5.5% 19-13.03.24 Regs 3,575,000 USD 3,158,127.21 3,292,019.71 0.32Exp Cred Bk 4.25% 17-18.09.22 600,000 USD 467,023.33 492,983.05 0.05Exp Cred Bk 5% 14-23.09.21 610,000 USD 474,796.22 520,875.41 0.05Exp Cred Bk 5% 14-23.09.21 2,000,000 USD 1,884,944.92 1,707,788.22 0.16Ferrellgas 8.625% 10-15.06.20 800,000 USD 681,412.95 516,287.65 0.05
Pramerica Sicav
The accompanying notes form an integral part of these financial statements.
185
Global High Yield Euro Hedged
Statement of Investmentsas at June 30, 2019 (continued)
(expressed in EUR)
* Securities partially or totally lent (see Note 9).
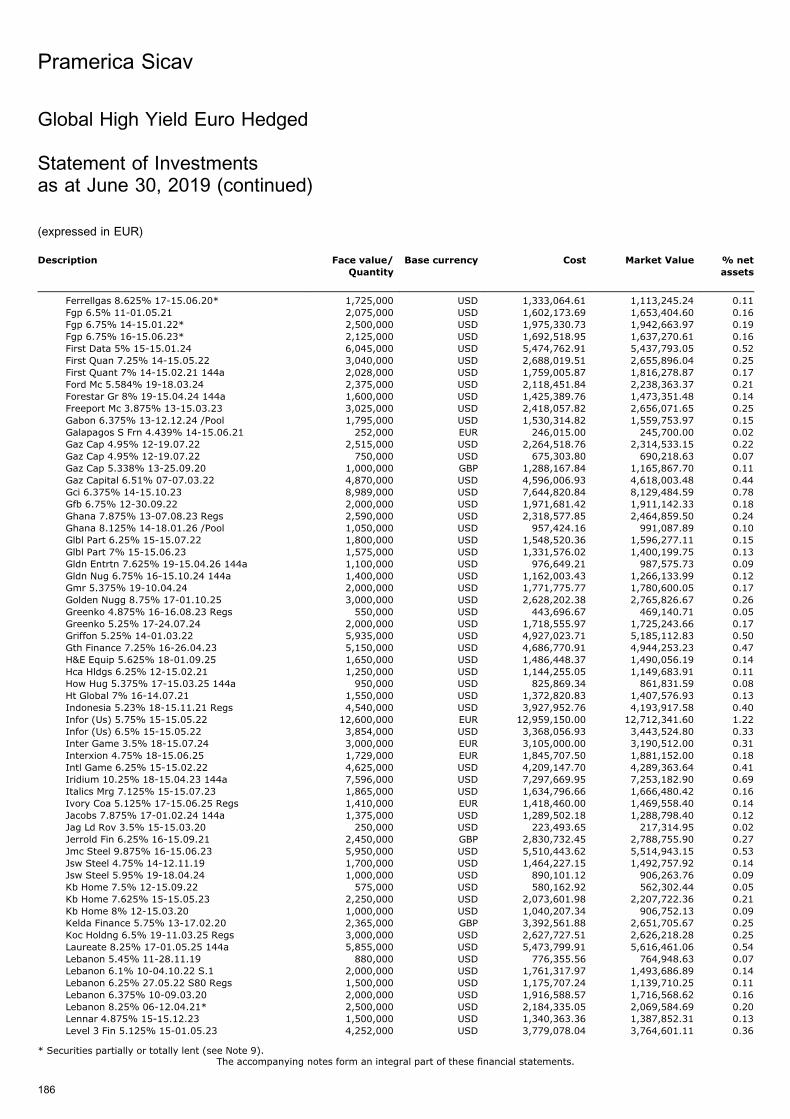
Description Face value/
Quantity
Base currency Cost Market Value % net
assets
Ferrellgas 8.625% 17-15.06.20* 1,725,000 USD 1,333,064.61 1,113,245.24 0.11Fgp 6.5% 11-01.05.21 2,075,000 USD 1,602,173.69 1,653,404.60 0.16Fgp 6.75% 14-15.01.22* 2,500,000 USD 1,975,330.73 1,942,663.97 0.19Fgp 6.75% 16-15.06.23* 2,125,000 USD 1,692,518.95 1,637,270.61 0.16First Data 5% 15-15.01.24 6,045,000 USD 5,474,762.91 5,437,793.05 0.52First Quan 7.25% 14-15.05.22 3,040,000 USD 2,688,019.51 2,655,896.04 0.25First Quant 7% 14-15.02.21 144a 2,028,000 USD 1,759,005.87 1,816,278.87 0.17Ford Mc 5.584% 19-18.03.24 2,375,000 USD 2,118,451.84 2,238,363.37 0.21Forestar Gr 8% 19-15.04.24 144a 1,600,000 USD 1,425,389.76 1,473,351.48 0.14Freeport Mc 3.875% 13-15.03.23 3,025,000 USD 2,418,057.82 2,656,071.65 0.25Gabon 6.375% 13-12.12.24 /Pool 1,795,000 USD 1,530,314.82 1,559,753.97 0.15Galapagos S Frn 4.439% 14-15.06.21 252,000 EUR 246,015.00 245,700.00 0.02Gaz Cap 4.95% 12-19.07.22 2,515,000 USD 2,264,518.76 2,314,533.15 0.22Gaz Cap 4.95% 12-19.07.22 750,000 USD 675,303.80 690,218.63 0.07Gaz Cap 5.338% 13-25.09.20 1,000,000 GBP 1,288,167.84 1,165,867.70 0.11Gaz Capital 6.51% 07-07.03.22 4,870,000 USD 4,596,006.93 4,618,003.48 0.44Gci 6.375% 14-15.10.23 8,989,000 USD 7,644,820.84 8,129,484.59 0.78Gfb 6.75% 12-30.09.22 2,000,000 USD 1,971,681.42 1,911,142.33 0.18Ghana 7.875% 13-07.08.23 Regs 2,590,000 USD 2,318,577.85 2,464,859.50 0.24Ghana 8.125% 14-18.01.26 /Pool 1,050,000 USD 957,424.16 991,087.89 0.10Glbl Part 6.25% 15-15.07.22 1,800,000 USD 1,548,520.36 1,596,277.11 0.15Glbl Part 7% 15-15.06.23 1,575,000 USD 1,331,576.02 1,400,199.75 0.13Gldn Entrtn 7.625% 19-15.04.26 144a 1,100,000 USD 976,649.21 987,575.73 0.09Gldn Nug 6.75% 16-15.10.24 144a 1,400,000 USD 1,162,003.43 1,266,133.99 0.12Gmr 5.375% 19-10.04.24 2,000,000 USD 1,771,775.77 1,780,600.05 0.17Golden Nugg 8.75% 17-01.10.25 3,000,000 USD 2,628,202.38 2,765,826.67 0.26Greenko 4.875% 16-16.08.23 Regs 550,000 USD 443,696.67 469,140.71 0.05Greenko 5.25% 17-24.07.24 2,000,000 USD 1,718,555.97 1,725,243.66 0.17Griffon 5.25% 14-01.03.22 5,935,000 USD 4,927,023.71 5,185,112.83 0.50Gth Finance 7.25% 16-26.04.23 5,150,000 USD 4,686,770.91 4,944,253.23 0.47H&E Equip 5.625% 18-01.09.25 1,650,000 USD 1,486,448.37 1,490,056.19 0.14Hca Hldgs 6.25% 12-15.02.21 1,250,000 USD 1,144,255.05 1,149,683.91 0.11How Hug 5.375% 17-15.03.25 144a 950,000 USD 825,869.34 861,831.59 0.08Ht Global 7% 16-14.07.21 1,550,000 USD 1,372,820.83 1,407,576.93 0.13Indonesia 5.23% 18-15.11.21 Regs 4,540,000 USD 3,927,952.76 4,193,917.58 0.40Infor (Us) 5.75% 15-15.05.22 12,600,000 EUR 12,959,150.00 12,712,341.60 1.22Infor (Us) 6.5% 15-15.05.22 3,854,000 USD 3,368,056.93 3,443,524.80 0.33Inter Game 3.5% 18-15.07.24 3,000,000 EUR 3,105,000.00 3,190,512.00 0.31Interxion 4.75% 18-15.06.25 1,729,000 EUR 1,845,707.50 1,881,152.00 0.18Intl Game 6.25% 15-15.02.22 4,625,000 USD 4,209,147.70 4,289,363.64 0.41Iridium 10.25% 18-15.04.23 144a 7,596,000 USD 7,297,669.95 7,253,182.90 0.69Italics Mrg 7.125% 15-15.07.23 1,865,000 USD 1,634,796.66 1,666,480.42 0.16Ivory Coa 5.125% 17-15.06.25 Regs 1,410,000 EUR 1,418,460.00 1,469,558.40 0.14Jacobs 7.875% 17-01.02.24 144a 1,375,000 USD 1,289,502.18 1,288,798.40 0.12Jag Ld Rov 3.5% 15-15.03.20 250,000 USD 223,493.65 217,314.95 0.02Jerrold Fin 6.25% 16-15.09.21 2,450,000 GBP 2,830,732.45 2,788,755.90 0.27Jmc Steel 9.875% 16-15.06.23 5,950,000 USD 5,510,443.62 5,514,943.15 0.53Jsw Steel 4.75% 14-12.11.19 1,700,000 USD 1,464,227.15 1,492,757.92 0.14Jsw Steel 5.95% 19-18.04.24 1,000,000 USD 890,101.12 906,263.76 0.09Kb Home 7.5% 12-15.09.22 575,000 USD 580,162.92 562,302.44 0.05Kb Home 7.625% 15-15.05.23 2,250,000 USD 2,073,601.98 2,207,722.36 0.21Kb Home 8% 12-15.03.20 1,000,000 USD 1,040,207.34 906,752.13 0.09Kelda Finance 5.75% 13-17.02.20 2,365,000 GBP 3,392,561.88 2,651,705.67 0.25Koc Holdng 6.5% 19-11.03.25 Regs 3,000,000 USD 2,627,727.51 2,626,218.28 0.25Laureate 8.25% 17-01.05.25 144a 5,855,000 USD 5,473,799.91 5,616,461.06 0.54Lebanon 5.45% 11-28.11.19 880,000 USD 776,355.56 764,948.63 0.07Lebanon 6.1% 10-04.10.22 S.1 2,000,000 USD 1,761,317.97 1,493,686.89 0.14Lebanon 6.25% 27.05.22 S80 Regs 1,500,000 USD 1,175,707.24 1,139,710.25 0.11Lebanon 6.375% 10-09.03.20 2,000,000 USD 1,916,588.57 1,716,568.62 0.16Lebanon 8.25% 06-12.04.21* 2,500,000 USD 2,184,335.05 2,069,584.69 0.20Lennar 4.875% 15-15.12.23 1,500,000 USD 1,340,363.36 1,387,852.31 0.13Level 3 Fin 5.125% 15-01.05.23 4,252,000 USD 3,779,078.04 3,764,601.11 0.36
Pramerica Sicav
The accompanying notes form an integral part of these financial statements.
186
Global High Yield Euro Hedged
Statement of Investmentsas at June 30, 2019 (continued)
(expressed in EUR)
* Securities partially or totally lent (see Note 9).

Description Face value/
Quantity
Base currency Cost Market Value % net
assets
Level 3 Fin 5.375% 15-15.08.22 4,800,000 USD 4,156,707.59 4,219,861.27 0.40Level 3 Fin 6.125% 14-15.01.21 9,114,000 USD 8,182,427.27 8,042,470.81 0.77Lge Holdco 7.125% 14-15.05.24 708,187 EUR 733,419.88 737,238.42 0.07Lions Gate 6.375% 19-01.02.24 144a 4,950,000 USD 4,360,381.90 4,569,046.89 0.44Loxam 3.5% 17-15.04.22 Regs 605,000 EUR 605,000.00 616,797.50 0.06Loxam 4.5% 19-15.04.27 Regs 5,070,000 EUR 5,093,175.00 5,044,508.04 0.48Ltd Brands 5.625% 13-15.10.23* 10,050,000 USD 8,826,809.57 9,150,715.16 0.88Lvlt 5.75% 14-01.12.22 1,015,000 USD 886,922.39 899,008.91 0.09M I Homes 6.75% 15-15.01.21 4,515,000 USD 4,098,457.72 4,028,772.28 0.39Mallin 4.875% 15-15.04.20* 2,746,000 USD 2,482,810.71 2,323,696.11 0.22Marble Ii 5.3% 17-20.06.22* 750,000 USD 627,211.53 667,778.82 0.06Mattamy 6.875% 16-15.12.23 144a 925,000 USD 855,724.82 845,689.92 0.08Mednax Inc 5.25% 15-01.12.23 7,350,000 USD 6,418,098.59 6,372,925.63 0.61Meg Ener 6.375% 12-30.01.23 144a 9,525,000 USD 7,044,715.97 7,966,074.72 0.76Meg Energy 7% 13-31.03.24 650,000 USD 450,485.36 542,189.83 0.05Midcontin 6.875% 15-15.08.23 144a 3,095,000 USD 2,688,022.13 2,819,442.01 0.27Mongolia 5.625% 17-01.05.23 1,910,000 USD 1,568,760.74 1,706,952.02 0.16Mongolia 8.75% 17-09.03.24 Regs 430,000 USD 398,967.17 426,302.24 0.04Mongolia 10.875% 16-06.04.21 1,765,000 USD 1,710,286.07 1,724,660.71 0.17Mtn Mu Invs 5.373% 16-13.02.22 3,000,000 USD 2,550,576.18 2,719,176.40 0.26Mulhacen Pt 6.5% 18-01.08.23 2,400,000 EUR 2,400,000.00 2,304,000.00 0.22Nabors Ind 5.75% 18-01.02.25 1,800,000 USD 1,450,832.89 1,400,693.65 0.13Namibia 5.5% 11-03.11.21 695,000 USD 602,398.86 633,024.23 0.06Ncr Corp 5% 13-15.07.22 1,105,000 USD 952,415.12 978,442.62 0.09Ncx 4.875% 17-01.06.24 10,190,000 USD 8,639,211.23 9,260,382.83 0.89Ncx 5.25% 01.08.23 144a 3,418,000 USD 2,856,990.75 3,042,407.15 0.29Nemak Sab 4.75% 18-23.01.25 Regs 1,000,000 USD 874,022.40 889,015.72 0.09New Gold 6.25% 12-15.11.22 144a 1,236,000 USD 1,126,108.46 1,012,002.81 0.10New Home Co 7.25% 17-01.04.22 4,100,000 USD 3,604,182.61 3,392,966.90 0.32Nexstar 5.625% 16-01.08.24 144a 3,285,000 USD 2,735,908.12 2,988,083.77 0.29Nexstar 6.125% 15.02.22 1,365,000 USD 1,264,769.24 1,213,506.45 0.12Niel Fin 5% 14-15.04.22 144a* 5,980,000 USD 5,065,204.50 5,237,553.78 0.50Nigeria 6.375% 13-12.07.23 2,740,000 USD 2,369,040.11 2,544,165.42 0.24Nigeria 7.625% 18-21.11.25 Regs 2,145,000 USD 2,025,532.36 2,055,327.74 0.20Nine Energ 8.75% 18-01.11.23 675,000 USD 587,416.24 577,860.22 0.06Novelis 6.25% 16-15.08.24 3,125,000 USD 2,660,475.46 2,876,843.88 0.28Orbcomm 8% 17-01.04.24 4,500,000 USD 4,073,771.73 4,069,716.39 0.39Oztel Hldg 5.625% 18-24.10.23 2,800,000 USD 2,407,169.20 2,504,388.45 0.24Pakistan 8.25% 14-15.04.24 2,080,000 USD 1,752,872.55 1,995,824.74 0.19Park Aer 4.5% 17-15.03.23 /144a 440,000 USD 384,211.52 398,762.31 0.04Park Aer 5.25% 17-15.08.22 144a 5,320,000 USD 4,445,814.81 4,931,825.45 0.47Park Aer 5.5% 17-15.02.24 144a 150,000 USD 125,874.24 141,976.47 0.01Pemex 4.875% 12-24.01.22 2,085,000 USD 1,785,677.94 1,826,137.06 0.18Petro Gbl F 6.25% 14-17.03.24 6,000,000 USD 5,240,254.37 5,762,402.32 0.55Picard Grpe Frn 3% 17-30.11.23 Regs* 7,050,000 EUR 7,033,200.00 6,677,760.00 0.64Pilgrims Pr 5.75% 15-15.03.25 2,225,000 USD 2,037,300.37 1,982,944.07 0.19Pinnacle 6.375% 18-15.02.25 Regs 1,531,000 GBP 1,826,819.24 1,808,460.97 0.17Popular Inc 6.125% 18-14.09.23 5,700,000 USD 4,919,306.12 5,311,375.01 0.51Pq Corp 6.75% 16-15.11.22 3,385,000 USD 2,987,387.40 3,077,202.48 0.29Prov Buenos 9.95% 09.06.21 /Pool 5,230,000 USD 4,832,542.58 4,165,080.34 0.40Range Resou 4.875% 15-15.05.25 1,000,000 USD 823,798.12 770,480.29 0.07Range Resou 5% 17-15.03.23 4,975,000 USD 4,183,185.39 4,117,075.69 0.39Range Resou 5.875% 17-01.07.22 1,375,000 USD 1,315,722.26 1,195,232.24 0.11Rdt Hld 6.625% 17-15.02.25 144a 1,740,000 USD 1,478,348.54 1,478,136.80 0.14Rdt Hld 6.875% 18-15.02.23 144a 2,015,000 USD 1,640,458.89 1,769,251.03 0.17Rep Dominican 7.5% 06.05.21 /Pool 946,667 USD 929,784.29 874,858.31 0.08Rep of Bela 6.875% 17-28.02.23 815,000 USD 725,575.36 769,587.85 0.07Republic of 6.752% 17-09.03.23 4,515,000 USD 3,892,676.38 4,067,622.93 0.39Reynolds 5.75% 12-15.10.20 3,499,448 USD 2,931,620.79 3,080,337.67 0.29Rite Aid 6.125% 15-01.04.23 2,259,000 USD 1,946,737.39 1,673,572.09 0.16Rocfin 6.75% 16-15.11.21 144a 5,575,000 USD 5,075,660.92 5,028,220.21 0.48Rocfin 10.25% 16-15.11.22 144a 2,175,000 USD 1,987,483.89 2,048,193.43 0.20
Pramerica Sicav
The accompanying notes form an integral part of these financial statements.
187
Global High Yield Euro Hedged
Statement of Investmentsas at June 30, 2019 (continued)
(expressed in EUR)
* Securities partially or totally lent (see Note 9).
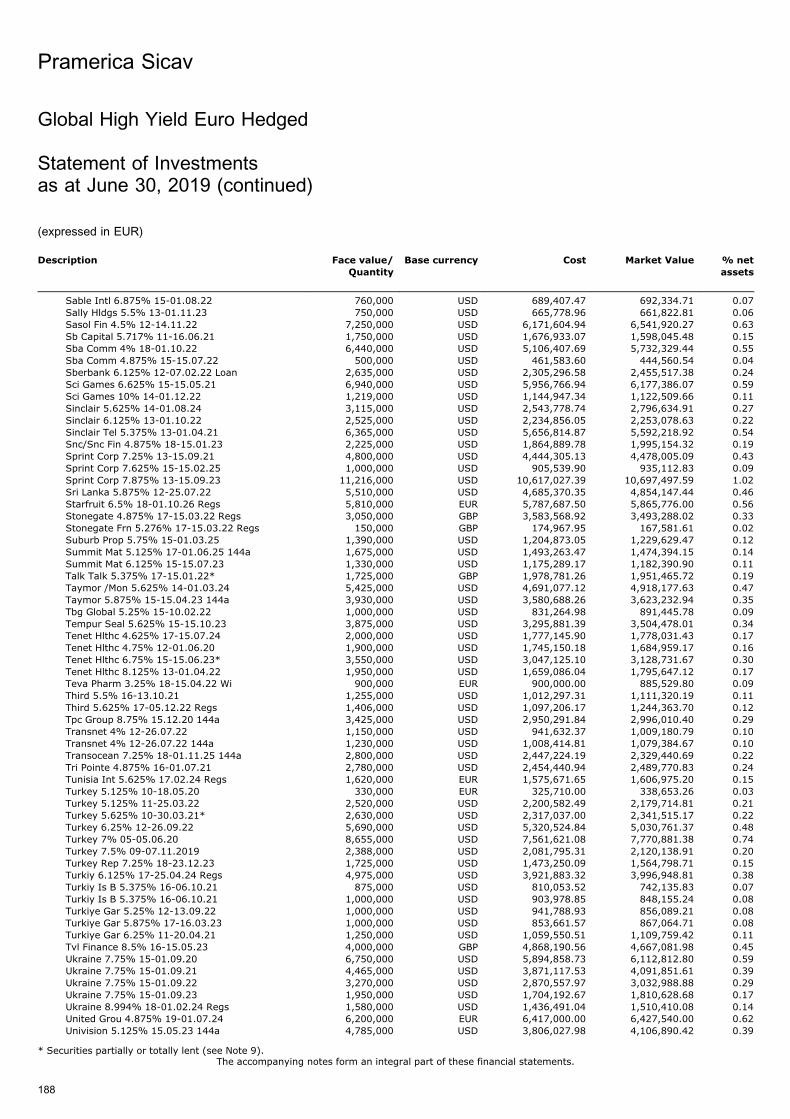
Description Face value/
Quantity
Base currency Cost Market Value % net
assets
Sable Intl 6.875% 15-01.08.22 760,000 USD 689,407.47 692,334.71 0.07Sally Hldgs 5.5% 13-01.11.23 750,000 USD 665,778.96 661,822.81 0.06Sasol Fin 4.5% 12-14.11.22 7,250,000 USD 6,171,604.94 6,541,920.27 0.63Sb Capital 5.717% 11-16.06.21 1,750,000 USD 1,676,933.07 1,598,045.48 0.15Sba Comm 4% 18-01.10.22 6,440,000 USD 5,106,407.69 5,732,329.44 0.55Sba Comm 4.875% 15-15.07.22 500,000 USD 461,583.60 444,560.54 0.04Sberbank 6.125% 12-07.02.22 Loan 2,635,000 USD 2,305,296.58 2,455,517.38 0.24Sci Games 6.625% 15-15.05.21 6,940,000 USD 5,956,766.94 6,177,386.07 0.59Sci Games 10% 14-01.12.22 1,219,000 USD 1,144,947.34 1,122,509.66 0.11Sinclair 5.625% 14-01.08.24 3,115,000 USD 2,543,778.74 2,796,634.91 0.27Sinclair 6.125% 13-01.10.22 2,525,000 USD 2,234,856.05 2,253,078.63 0.22Sinclair Tel 5.375% 13-01.04.21 6,365,000 USD 5,656,814.87 5,592,218.92 0.54Snc/Snc Fin 4.875% 18-15.01.23 2,225,000 USD 1,864,889.78 1,995,154.32 0.19Sprint Corp 7.25% 13-15.09.21 4,800,000 USD 4,444,305.13 4,478,005.09 0.43Sprint Corp 7.625% 15-15.02.25 1,000,000 USD 905,539.90 935,112.83 0.09Sprint Corp 7.875% 13-15.09.23 11,216,000 USD 10,617,027.39 10,697,497.59 1.02Sri Lanka 5.875% 12-25.07.22 5,510,000 USD 4,685,370.35 4,854,147.44 0.46Starfruit 6.5% 18-01.10.26 Regs 5,810,000 EUR 5,787,687.50 5,865,776.00 0.56Stonegate 4.875% 17-15.03.22 Regs 3,050,000 GBP 3,583,568.92 3,493,288.02 0.33Stonegate Frn 5.276% 17-15.03.22 Regs 150,000 GBP 174,967.95 167,581.61 0.02Suburb Prop 5.75% 15-01.03.25 1,390,000 USD 1,204,873.05 1,229,629.47 0.12Summit Mat 5.125% 17-01.06.25 144a 1,675,000 USD 1,493,263.47 1,474,394.15 0.14Summit Mat 6.125% 15-15.07.23 1,330,000 USD 1,175,289.17 1,182,390.90 0.11Talk Talk 5.375% 17-15.01.22* 1,725,000 GBP 1,978,781.26 1,951,465.72 0.19Taymor /Mon 5.625% 14-01.03.24 5,425,000 USD 4,691,077.12 4,918,177.63 0.47Taymor 5.875% 15-15.04.23 144a 3,930,000 USD 3,580,688.26 3,623,232.94 0.35Tbg Global 5.25% 15-10.02.22 1,000,000 USD 831,264.98 891,445.78 0.09Tempur Seal 5.625% 15-15.10.23 3,875,000 USD 3,295,881.39 3,504,478.01 0.34Tenet Hlthc 4.625% 17-15.07.24 2,000,000 USD 1,777,145.90 1,778,031.43 0.17Tenet Hlthc 4.75% 12-01.06.20 1,900,000 USD 1,745,150.18 1,684,959.17 0.16Tenet Hlthc 6.75% 15-15.06.23* 3,550,000 USD 3,047,125.10 3,128,731.67 0.30Tenet Hlthc 8.125% 13-01.04.22 1,950,000 USD 1,659,086.04 1,795,647.12 0.17Teva Pharm 3.25% 18-15.04.22 Wi 900,000 EUR 900,000.00 885,529.80 0.09Third 5.5% 16-13.10.21 1,255,000 USD 1,012,297.31 1,111,320.19 0.11Third 5.625% 17-05.12.22 Regs 1,406,000 USD 1,097,206.17 1,244,363.70 0.12Tpc Group 8.75% 15.12.20 144a 3,425,000 USD 2,950,291.84 2,996,010.40 0.29Transnet 4% 12-26.07.22 1,150,000 USD 941,632.37 1,009,180.79 0.10Transnet 4% 12-26.07.22 144a 1,230,000 USD 1,008,414.81 1,079,384.67 0.10Transocean 7.25% 18-01.11.25 144a 2,800,000 USD 2,447,224.19 2,329,440.69 0.22Tri Pointe 4.875% 16-01.07.21 2,780,000 USD 2,454,440.94 2,489,770.83 0.24Tunisia Int 5.625% 17.02.24 Regs 1,620,000 EUR 1,575,671.65 1,606,975.20 0.15Turkey 5.125% 10-18.05.20 330,000 EUR 325,710.00 338,653.26 0.03Turkey 5.125% 11-25.03.22 2,520,000 USD 2,200,582.49 2,179,714.81 0.21Turkey 5.625% 10-30.03.21* 2,630,000 USD 2,317,037.00 2,341,515.17 0.22Turkey 6.25% 12-26.09.22 5,690,000 USD 5,320,524.84 5,030,761.37 0.48Turkey 7% 05-05.06.20 8,655,000 USD 7,561,621.08 7,770,881.38 0.74Turkey 7.5% 09-07.11.2019 2,388,000 USD 2,081,795.31 2,120,138.91 0.20Turkey Rep 7.25% 18-23.12.23 1,725,000 USD 1,473,250.09 1,564,798.71 0.15Turkiy 6.125% 17-25.04.24 Regs 4,975,000 USD 3,921,883.32 3,996,948.81 0.38Turkiy Is B 5.375% 16-06.10.21 875,000 USD 810,053.52 742,135.83 0.07Turkiy Is B 5.375% 16-06.10.21 1,000,000 USD 903,978.85 848,155.24 0.08Turkiye Gar 5.25% 12-13.09.22 1,000,000 USD 941,788.93 856,089.21 0.08Turkiye Gar 5.875% 17-16.03.23 1,000,000 USD 853,661.57 867,064.71 0.08Turkiye Gar 6.25% 11-20.04.21 1,250,000 USD 1,059,550.51 1,109,759.42 0.11Tvl Finance 8.5% 16-15.05.23 4,000,000 GBP 4,868,190.56 4,667,081.98 0.45Ukraine 7.75% 15-01.09.20 6,750,000 USD 5,894,858.73 6,112,812.80 0.59Ukraine 7.75% 15-01.09.21 4,465,000 USD 3,871,117.53 4,091,851.61 0.39Ukraine 7.75% 15-01.09.22 3,270,000 USD 2,870,557.97 3,032,988.88 0.29Ukraine 7.75% 15-01.09.23 1,950,000 USD 1,704,192.67 1,810,628.68 0.17Ukraine 8.994% 18-01.02.24 Regs 1,580,000 USD 1,436,491.04 1,510,410.08 0.14United Grou 4.875% 19-01.07.24 6,200,000 EUR 6,417,000.00 6,427,540.00 0.62Univision 5.125% 15.05.23 144a 4,785,000 USD 3,806,027.98 4,106,890.42 0.39
Pramerica Sicav
The accompanying notes form an integral part of these financial statements.
188
Global High Yield Euro Hedged
Statement of Investmentsas at June 30, 2019 (continued)
(expressed in EUR)
* Securities partially or totally lent (see Note 9).
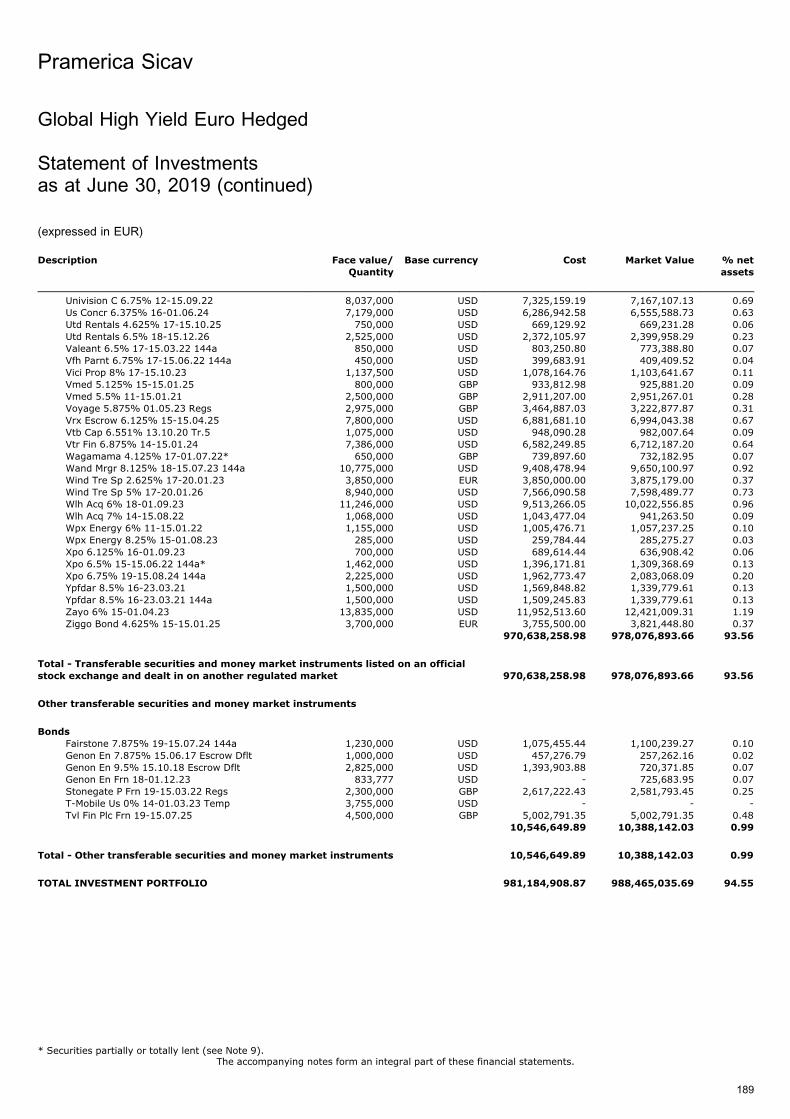
Description Face value/
Quantity
Base currency Cost Market Value % net
assets
Univision C 6.75% 12-15.09.22 8,037,000 USD 7,325,159.19 7,167,107.13 0.69Us Concr 6.375% 16-01.06.24 7,179,000 USD 6,286,942.58 6,555,588.73 0.63Utd Rentals 4.625% 17-15.10.25 750,000 USD 669,129.92 669,231.28 0.06Utd Rentals 6.5% 18-15.12.26 2,525,000 USD 2,372,105.97 2,399,958.29 0.23Valeant 6.5% 17-15.03.22 144a 850,000 USD 803,250.80 773,388.80 0.07Vfh Parnt 6.75% 17-15.06.22 144a 450,000 USD 399,683.91 409,409.52 0.04Vici Prop 8% 17-15.10.23 1,137,500 USD 1,078,164.76 1,103,641.67 0.11Vmed 5.125% 15-15.01.25 800,000 GBP 933,812.98 925,881.20 0.09Vmed 5.5% 11-15.01.21 2,500,000 GBP 2,911,207.00 2,951,267.01 0.28Voyage 5.875% 01.05.23 Regs 2,975,000 GBP 3,464,887.03 3,222,877.87 0.31Vrx Escrow 6.125% 15-15.04.25 7,800,000 USD 6,881,681.10 6,994,043.38 0.67Vtb Cap 6.551% 13.10.20 Tr.5 1,075,000 USD 948,090.28 982,007.64 0.09Vtr Fin 6.875% 14-15.01.24 7,386,000 USD 6,582,249.85 6,712,187.20 0.64Wagamama 4.125% 17-01.07.22* 650,000 GBP 739,897.60 732,182.95 0.07Wand Mrgr 8.125% 18-15.07.23 144a 10,775,000 USD 9,408,478.94 9,650,100.97 0.92Wind Tre Sp 2.625% 17-20.01.23 3,850,000 EUR 3,850,000.00 3,875,179.00 0.37Wind Tre Sp 5% 17-20.01.26 8,940,000 USD 7,566,090.58 7,598,489.77 0.73Wlh Acq 6% 18-01.09.23 11,246,000 USD 9,513,266.05 10,022,556.85 0.96Wlh Acq 7% 14-15.08.22 1,068,000 USD 1,043,477.04 941,263.50 0.09Wpx Energy 6% 11-15.01.22 1,155,000 USD 1,005,476.71 1,057,237.25 0.10Wpx Energy 8.25% 15-01.08.23 285,000 USD 259,784.44 285,275.27 0.03Xpo 6.125% 16-01.09.23 700,000 USD 689,614.44 636,908.42 0.06Xpo 6.5% 15-15.06.22 144a* 1,462,000 USD 1,396,171.81 1,309,368.69 0.13Xpo 6.75% 19-15.08.24 144a 2,225,000 USD 1,962,773.47 2,083,068.09 0.20Ypfdar 8.5% 16-23.03.21 1,500,000 USD 1,569,848.82 1,339,779.61 0.13Ypfdar 8.5% 16-23.03.21 144a 1,500,000 USD 1,509,245.83 1,339,779.61 0.13Zayo 6% 15-01.04.23 13,835,000 USD 11,952,513.60 12,421,009.31 1.19Ziggo Bond 4.625% 15-15.01.25 3,700,000 EUR 3,755,500.00 3,821,448.80 0.37
970,638,258.98 978,076,893.66 93.56
Total - Transferable securities and money market instruments listed on an official
stock exchange and dealt in on another regulated market 970,638,258.98 978,076,893.66 93.56
Other transferable securities and money market instruments
Bonds
Fairstone 7.875% 19-15.07.24 144a 1,230,000 USD 1,075,455.44 1,100,239.27 0.10Genon En 7.875% 15.06.17 Escrow Dflt 1,000,000 USD 457,276.79 257,262.16 0.02Genon En 9.5% 15.10.18 Escrow Dflt 2,825,000 USD 1,393,903.88 720,371.85 0.07Genon En Frn 18-01.12.23 833,777 USD - 725,683.95 0.07Stonegate P Frn 19-15.03.22 Regs 2,300,000 GBP 2,617,222.43 2,581,793.45 0.25T-Mobile Us 0% 14-01.03.23 Temp 3,755,000 USD - - -Tvl Fin Plc Frn 19-15.07.25 4,500,000 GBP 5,002,791.35 5,002,791.35 0.48
10,546,649.89 10,388,142.03 0.99
Total - Other transferable securities and money market instruments 10,546,649.89 10,388,142.03 0.99
TOTAL INVESTMENT PORTFOLIO 981,184,908.87 988,465,035.69 94.55
Pramerica Sicav
The accompanying notes form an integral part of these financial statements.
189
Global High Yield Euro Hedged
Statement of Investmentsas at June 30, 2019 (continued)
(expressed in EUR)
* Securities partially or totally lent (see Note 9).
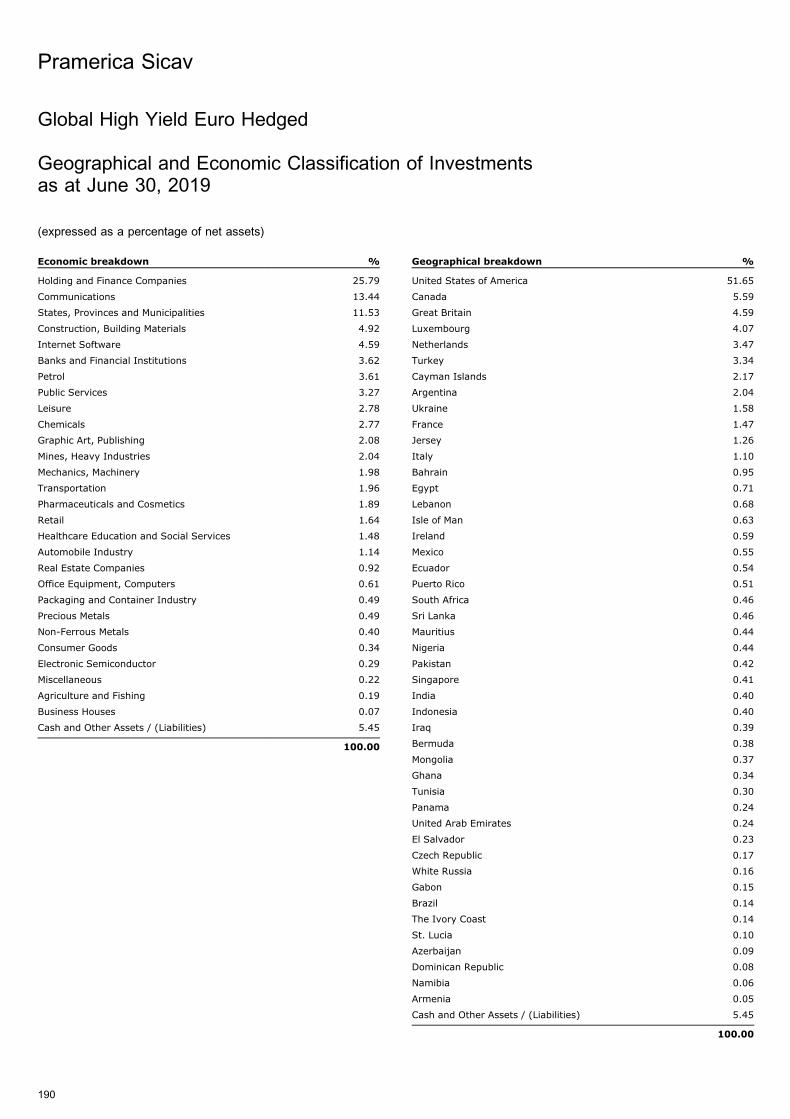
Global High Yield Euro Hedged
Geographical and Economic Classification of Investmentsas at June 30, 2019
(expressed as a percentage of net assets)
Economic breakdown %
Holding and Finance Companies 25.79
Communications 13.44
States, Provinces and Municipalities 11.53
Construction, Building Materials 4.92
Internet Software 4.59
Banks and Financial Institutions 3.62
Petrol 3.61
Public Services 3.27
Leisure 2.78
Chemicals 2.77
Graphic Art, Publishing 2.08
Mines, Heavy Industries 2.04
Mechanics, Machinery 1.98
Transportation 1.96
Pharmaceuticals and Cosmetics 1.89
Retail 1.64
Healthcare Education and Social Services 1.48
Automobile Industry 1.14
Real Estate Companies 0.92
Office Equipment, Computers 0.61
Packaging and Container Industry 0.49
Precious Metals 0.49
Non-Ferrous Metals 0.40
Consumer Goods 0.34
Electronic Semiconductor 0.29
Miscellaneous 0.22
Agriculture and Fishing 0.19
Business Houses 0.07
Cash and Other Assets / (Liabilities) 5.45
100.00
Geographical breakdown %
United States of America 51.65
Canada 5.59
Great Britain 4.59
Luxembourg 4.07
Netherlands 3.47
Turkey 3.34
Cayman Islands 2.17
Argentina 2.04
Ukraine 1.58
France 1.47
Jersey 1.26
Italy 1.10
Bahrain 0.95
Egypt 0.71
Lebanon 0.68
Isle of Man 0.63
Ireland 0.59
Mexico 0.55
Ecuador 0.54
Puerto Rico 0.51
South Africa 0.46
Sri Lanka 0.46
Mauritius 0.44
Nigeria 0.44
Pakistan 0.42
Singapore 0.41
India 0.40
Indonesia 0.40
Iraq 0.39
Bermuda 0.38
Mongolia 0.37
Ghana 0.34
Tunisia 0.30
Panama 0.24
United Arab Emirates 0.24
El Salvador 0.23
Czech Republic 0.17
White Russia 0.16
Gabon 0.15
Brazil 0.14
The Ivory Coast 0.14
St. Lucia 0.10
Azerbaijan 0.09
Dominican Republic 0.08
Namibia 0.06
Armenia 0.05
Cash and Other Assets / (Liabilities) 5.45
100.00
Pramerica Sicav
190
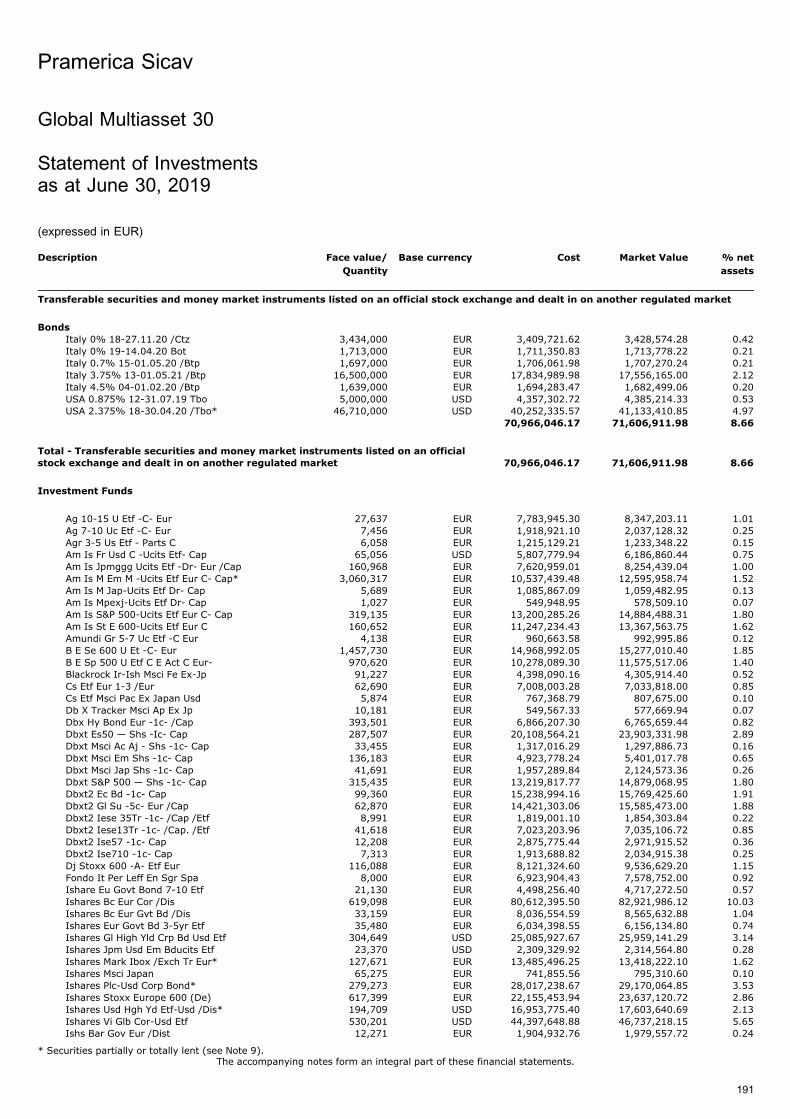
Global Multiasset 30
Statement of Investmentsas at June 30, 2019
(expressed in EUR)
Description Face value/
Quantity
Base currency Cost Market Value % net
assets
Transferable securities and money market instruments listed on an official stock exchange and dealt in on another regulated market
Bonds
Italy 0% 18-27.11.20 /Ctz 3,434,000 EUR 3,409,721.62 3,428,574.28 0.42Italy 0% 19-14.04.20 Bot 1,713,000 EUR 1,711,350.83 1,713,778.22 0.21Italy 0.7% 15-01.05.20 /Btp 1,697,000 EUR 1,706,061.98 1,707,270.24 0.21Italy 3.75% 13-01.05.21 /Btp 16,500,000 EUR 17,834,989.98 17,556,165.00 2.12Italy 4.5% 04-01.02.20 /Btp 1,639,000 EUR 1,694,283.47 1,682,499.06 0.20USA 0.875% 12-31.07.19 Tbo 5,000,000 USD 4,357,302.72 4,385,214.33 0.53USA 2.375% 18-30.04.20 /Tbo* 46,710,000 USD 40,252,335.57 41,133,410.85 4.97
70,966,046.17 71,606,911.98 8.66
Total - Transferable securities and money market instruments listed on an officialstock exchange and dealt in on another regulated market 70,966,046.17 71,606,911.98 8.66
Investment Funds
Ag 10-15 U Etf -C- Eur 27,637 EUR 7,783,945.30 8,347,203.11 1.01Ag 7-10 Uc Etf -C- Eur 7,456 EUR 1,918,921.10 2,037,128.32 0.25Agr 3-5 Us Etf - Parts C 6,058 EUR 1,215,129.21 1,233,348.22 0.15Am Is Fr Usd C -Ucits Etf- Cap 65,056 USD 5,807,779.94 6,186,860.44 0.75Am Is Jpmggg Ucits Etf -Dr- Eur /Cap 160,968 EUR 7,620,959.01 8,254,439.04 1.00Am Is M Em M -Ucits Etf Eur C- Cap* 3,060,317 EUR 10,537,439.48 12,595,958.74 1.52Am Is M Jap-Ucits Etf Dr- Cap 5,689 EUR 1,085,867.09 1,059,482.95 0.13Am Is Mpexj-Ucits Etf Dr- Cap 1,027 EUR 549,948.95 578,509.10 0.07Am Is S&P 500-Ucits Etf Eur C- Cap 319,135 EUR 13,200,285.26 14,884,488.31 1.80Am Is St E 600-Ucits Etf Eur C 160,652 EUR 11,247,234.43 13,367,563.75 1.62Amundi Gr 5-7 Uc Etf -C Eur 4,138 EUR 960,663.58 992,995.86 0.12B E Se 600 U Et -C- Eur 1,457,730 EUR 14,968,992.05 15,277,010.40 1.85B E Sp 500 U Etf C E Act C Eur- 970,620 EUR 10,278,089.30 11,575,517.06 1.40Blackrock Ir-Ish Msci Fe Ex-Jp 91,227 EUR 4,398,090.16 4,305,914.40 0.52Cs Etf Eur 1-3 /Eur 62,690 EUR 7,008,003.28 7,033,818.00 0.85Cs Etf Msci Pac Ex Japan Usd 5,874 EUR 767,368.79 807,675.00 0.10Db X Tracker Msci Ap Ex Jp 10,181 EUR 549,567.33 577,669.94 0.07Dbx Hy Bond Eur -1c- /Cap 393,501 EUR 6,866,207.30 6,765,659.44 0.82Dbxt Es50 — Shs -Ic- Cap 287,507 EUR 20,108,564.21 23,903,331.98 2.89Dbxt Msci Ac Aj - Shs -1c- Cap 33,455 EUR 1,317,016.29 1,297,886.73 0.16Dbxt Msci Em Shs -1c- Cap 136,183 EUR 4,923,778.24 5,401,017.78 0.65Dbxt Msci Jap Shs -1c- Cap 41,691 EUR 1,957,289.84 2,124,573.36 0.26Dbxt S&P 500 — Shs -1c- Cap 315,435 EUR 13,219,817.77 14,879,068.95 1.80Dbxt2 Ec Bd -1c- Cap 99,360 EUR 15,238,994.16 15,769,425.60 1.91Dbxt2 Gl Su -5c- Eur /Cap 62,870 EUR 14,421,303.06 15,585,473.00 1.88Dbxt2 Iese 35Tr -1c- /Cap /Etf 8,991 EUR 1,819,001.10 1,854,303.84 0.22Dbxt2 Iese13Tr -1c- /Cap. /Etf 41,618 EUR 7,023,203.96 7,035,106.72 0.85Dbxt2 Ise57 -1c- Cap 12,208 EUR 2,875,775.44 2,971,915.52 0.36Dbxt2 Ise710 -1c- Cap 7,313 EUR 1,913,688.82 2,034,915.38 0.25Dj Stoxx 600 -A- Etf Eur 116,088 EUR 8,121,324.60 9,536,629.20 1.15Fondo It Per Leff En Sgr Spa 8,000 EUR 6,923,904.43 7,578,752.00 0.92Ishare Eu Govt Bond 7-10 Etf 21,130 EUR 4,498,256.40 4,717,272.50 0.57Ishares Bc Eur Cor /Dis 619,098 EUR 80,612,395.50 82,921,986.12 10.03Ishares Bc Eur Gvt Bd /Dis 33,159 EUR 8,036,554.59 8,565,632.88 1.04Ishares Eur Govt Bd 3-5yr Etf 35,480 EUR 6,034,398.55 6,156,134.80 0.74Ishares Gl High Yld Crp Bd Usd Etf 304,649 USD 25,085,927.67 25,959,141.29 3.14Ishares Jpm Usd Em Bducits Etf 23,370 USD 2,309,329.92 2,314,564.80 0.28Ishares Mark Ibox /Exch Tr Eur* 127,671 EUR 13,485,496.25 13,418,222.10 1.62Ishares Msci Japan 65,275 EUR 741,855.56 795,310.60 0.10Ishares Plc-Usd Corp Bond* 279,273 EUR 28,017,238.67 29,170,064.85 3.53Ishares Stoxx Europe 600 (De) 617,399 EUR 22,155,453.94 23,637,120.72 2.86Ishares Usd Hgh Yd Etf-Usd /Dis* 194,709 USD 16,953,775.40 17,603,640.69 2.13Ishares Vi Glb Cor-Usd Etf 530,201 USD 44,397,648.88 46,737,218.15 5.65Ishs Bar Gov Eur /Dist 12,271 EUR 1,904,932.76 1,979,557.72 0.24
Pramerica Sicav
The accompanying notes form an integral part of these financial statements.
191
* Securities partially or totally lent (see Note 9).
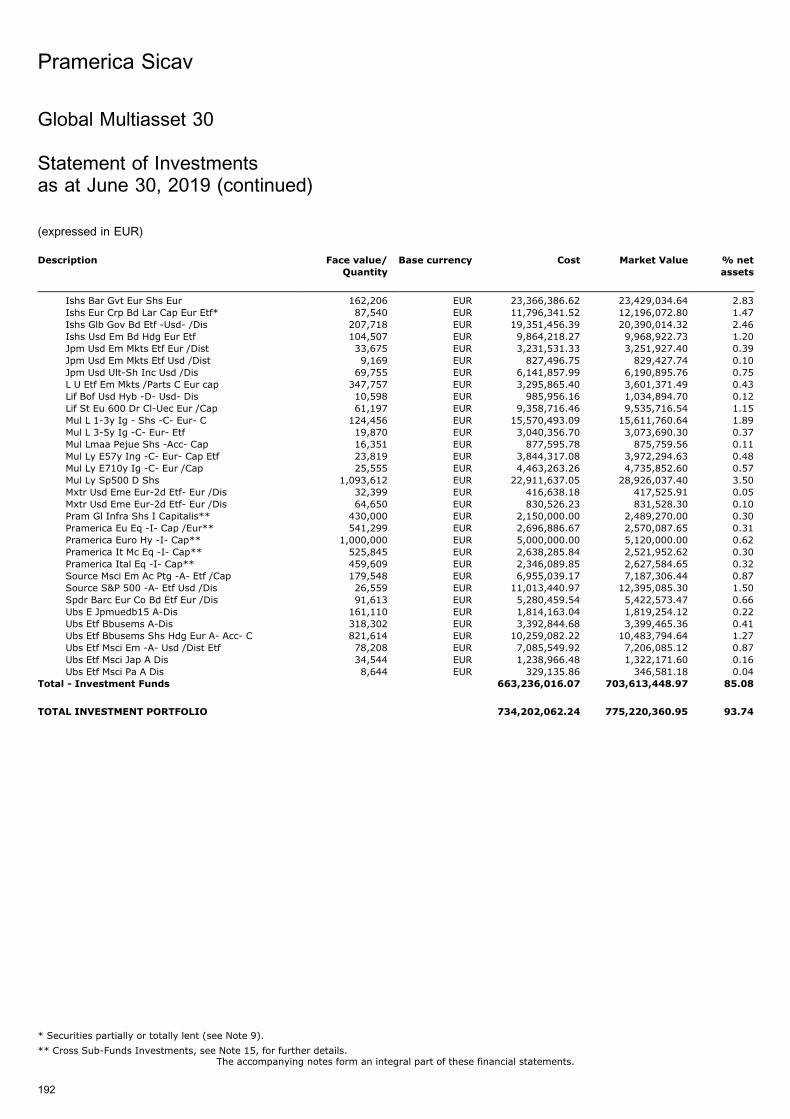
Description Face value/
Quantity
Base currency Cost Market Value % net
assets
Ishs Bar Gvt Eur Shs Eur 162,206 EUR 23,366,386.62 23,429,034.64 2.83Ishs Eur Crp Bd Lar Cap Eur Etf* 87,540 EUR 11,796,341.52 12,196,072.80 1.47Ishs Glb Gov Bd Etf -Usd- /Dis 207,718 EUR 19,351,456.39 20,390,014.32 2.46Ishs Usd Em Bd Hdg Eur Etf 104,507 EUR 9,864,218.27 9,968,922.73 1.20Jpm Usd Em Mkts Etf Eur /Dist 33,675 EUR 3,231,531.33 3,251,927.40 0.39Jpm Usd Em Mkts Etf Usd /Dist 9,169 EUR 827,496.75 829,427.74 0.10Jpm Usd Ult-Sh Inc Usd /Dis 69,755 EUR 6,141,857.99 6,190,895.76 0.75L U Etf Em Mkts /Parts C Eur cap 347,757 EUR 3,295,865.40 3,601,371.49 0.43Lif Bof Usd Hyb -D- Usd- Dis 10,598 EUR 985,956.16 1,034,894.70 0.12Lif St Eu 600 Dr Cl-Uec Eur /Cap 61,197 EUR 9,358,716.46 9,535,716.54 1.15Mul L 1-3y Ig - Shs -C- Eur- C 124,456 EUR 15,570,493.09 15,611,760.64 1.89Mul L 3-5y Ig -C- Eur- Etf 19,870 EUR 3,040,356.70 3,073,690.30 0.37Mul Lmaa Pejue Shs -Acc- Cap 16,351 EUR 877,595.78 875,759.56 0.11Mul Ly E57y Ing -C- Eur- Cap Etf 23,819 EUR 3,844,317.08 3,972,294.63 0.48Mul Ly E710y Ig -C- Eur /Cap 25,555 EUR 4,463,263.26 4,735,852.60 0.57Mul Ly Sp500 D Shs 1,093,612 EUR 22,911,637.05 28,926,037.40 3.50Mxtr Usd Eme Eur-2d Etf- Eur /Dis 32,399 EUR 416,638.18 417,525.91 0.05Mxtr Usd Eme Eur-2d Etf- Eur /Dis 64,650 EUR 830,526.23 831,528.30 0.10Pram Gl Infra Shs I Capitalis** 430,000 EUR 2,150,000.00 2,489,270.00 0.30Pramerica Eu Eq -I- Cap /Eur** 541,299 EUR 2,696,886.67 2,570,087.65 0.31Pramerica Euro Hy -I- Cap** 1,000,000 EUR 5,000,000.00 5,120,000.00 0.62Pramerica It Mc Eq -I- Cap** 525,845 EUR 2,638,285.84 2,521,952.62 0.30Pramerica Ital Eq -I- Cap** 459,609 EUR 2,346,089.85 2,627,584.65 0.32Source Msci Em Ac Ptg -A- Etf /Cap 179,548 EUR 6,955,039.17 7,187,306.44 0.87Source S&P 500 -A- Etf Usd /Dis 26,559 EUR 11,013,440.97 12,395,085.30 1.50Spdr Barc Eur Co Bd Etf Eur /Dis 91,613 EUR 5,280,459.54 5,422,573.47 0.66Ubs E Jpmuedb15 A-Dis 161,110 EUR 1,814,163.04 1,819,254.12 0.22Ubs Etf Bbusems A-Dis 318,302 EUR 3,392,844.68 3,399,465.36 0.41Ubs Etf Bbusems Shs Hdg Eur A- Acc- C 821,614 EUR 10,259,082.22 10,483,794.64 1.27Ubs Etf Msci Em -A- Usd /Dist Etf 78,208 EUR 7,085,549.92 7,206,085.12 0.87Ubs Etf Msci Jap A Dis 34,544 EUR 1,238,966.48 1,322,171.60 0.16Ubs Etf Msci Pa A Dis 8,644 EUR 329,135.86 346,581.18 0.04
Total - Investment Funds 663,236,016.07 703,613,448.97 85.08
TOTAL INVESTMENT PORTFOLIO 734,202,062.24 775,220,360.95 93.74
Pramerica Sicav
The accompanying notes form an integral part of these financial statements.
192
Global Multiasset 30
Statement of Investmentsas at June 30, 2019 (continued)
(expressed in EUR)
* Securities partially or totally lent (see Note 9).
** Cross Sub-Funds Investments, see Note 15, for further details.
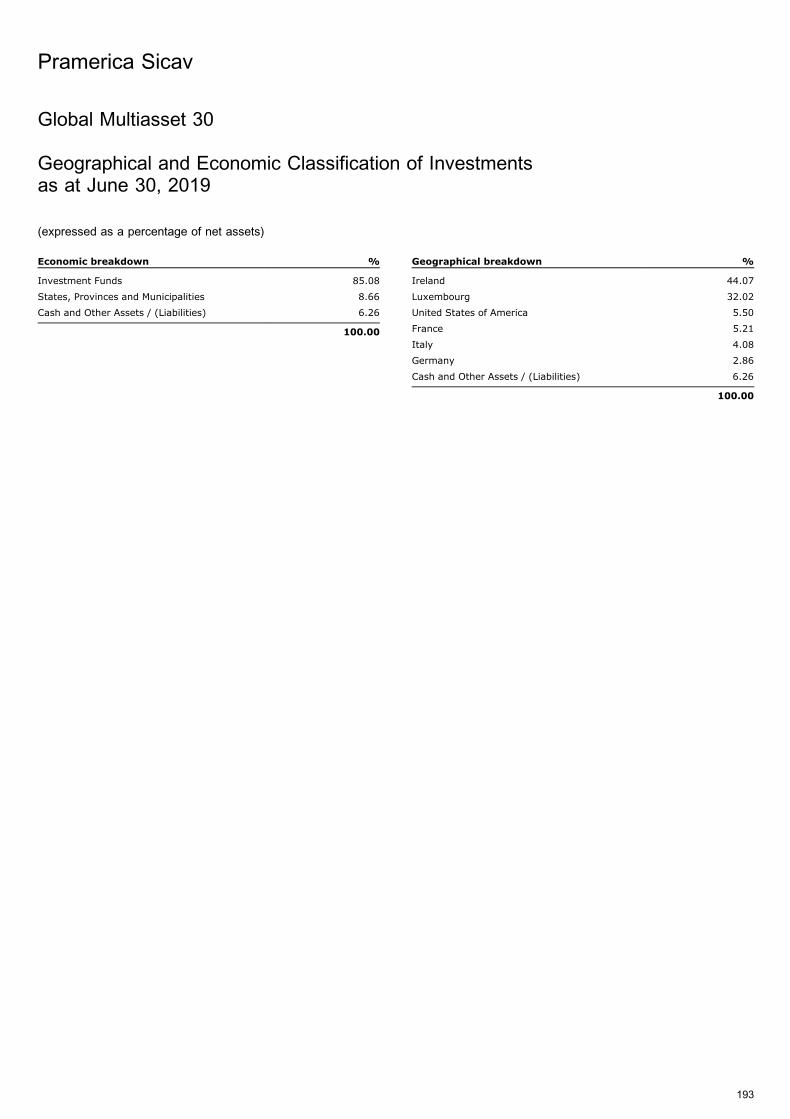
Global Multiasset 30
Geographical and Economic Classification of Investmentsas at June 30, 2019
(expressed as a percentage of net assets)
Economic breakdown %
Investment Funds 85.08
States, Provinces and Municipalities 8.66
Cash and Other Assets / (Liabilities) 6.26
100.00
Geographical breakdown %
Ireland 44.07
Luxembourg 32.02
United States of America 5.50
France 5.21
Italy 4.08
Germany 2.86
Cash and Other Assets / (Liabilities) 6.26
100.00
Pramerica Sicav
193
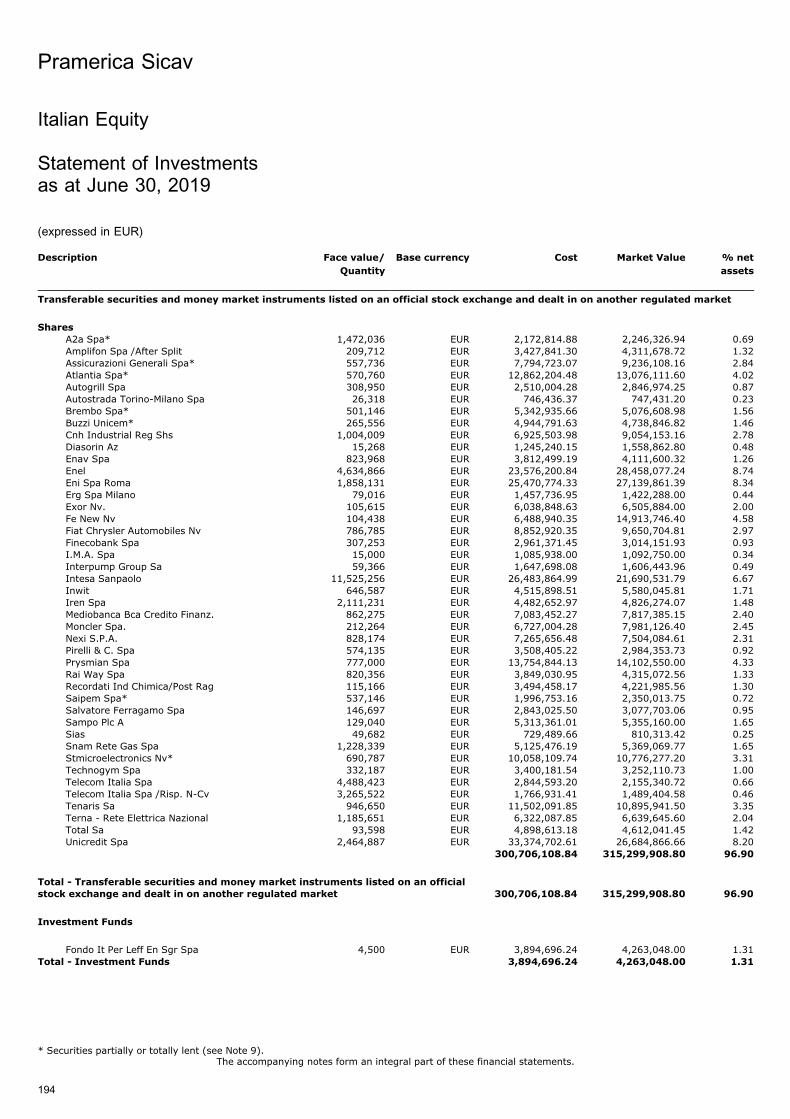
Italian Equity
Statement of Investmentsas at June 30, 2019
(expressed in EUR)
Description Face value/
Quantity
Base currency Cost Market Value % net
assets
Transferable securities and money market instruments listed on an official stock exchange and dealt in on another regulated market
Shares
A2a Spa* 1,472,036 EUR 2,172,814.88 2,246,326.94 0.69Amplifon Spa /After Split 209,712 EUR 3,427,841.30 4,311,678.72 1.32Assicurazioni Generali Spa* 557,736 EUR 7,794,723.07 9,236,108.16 2.84Atlantia Spa* 570,760 EUR 12,862,204.48 13,076,111.60 4.02Autogrill Spa 308,950 EUR 2,510,004.28 2,846,974.25 0.87Autostrada Torino-Milano Spa 26,318 EUR 746,436.37 747,431.20 0.23Brembo Spa* 501,146 EUR 5,342,935.66 5,076,608.98 1.56Buzzi Unicem* 265,556 EUR 4,944,791.63 4,738,846.82 1.46Cnh Industrial Reg Shs 1,004,009 EUR 6,925,503.98 9,054,153.16 2.78Diasorin Az 15,268 EUR 1,245,240.15 1,558,862.80 0.48Enav Spa 823,968 EUR 3,812,499.19 4,111,600.32 1.26Enel 4,634,866 EUR 23,576,200.84 28,458,077.24 8.74Eni Spa Roma 1,858,131 EUR 25,470,774.33 27,139,861.39 8.34Erg Spa Milano 79,016 EUR 1,457,736.95 1,422,288.00 0.44Exor Nv. 105,615 EUR 6,038,848.63 6,505,884.00 2.00Fe New Nv 104,438 EUR 6,488,940.35 14,913,746.40 4.58Fiat Chrysler Automobiles Nv 786,785 EUR 8,852,920.35 9,650,704.81 2.97Finecobank Spa 307,253 EUR 2,961,371.45 3,014,151.93 0.93I.M.A. Spa 15,000 EUR 1,085,938.00 1,092,750.00 0.34Interpump Group Sa 59,366 EUR 1,647,698.08 1,606,443.96 0.49Intesa Sanpaolo 11,525,256 EUR 26,483,864.99 21,690,531.79 6.67Inwit 646,587 EUR 4,515,898.51 5,580,045.81 1.71Iren Spa 2,111,231 EUR 4,482,652.97 4,826,274.07 1.48Mediobanca Bca Credito Finanz. 862,275 EUR 7,083,452.27 7,817,385.15 2.40Moncler Spa. 212,264 EUR 6,727,004.28 7,981,126.40 2.45Nexi S.P.A. 828,174 EUR 7,265,656.48 7,504,084.61 2.31Pirelli & C. Spa 574,135 EUR 3,508,405.22 2,984,353.73 0.92Prysmian Spa 777,000 EUR 13,754,844.13 14,102,550.00 4.33Rai Way Spa 820,356 EUR 3,849,030.95 4,315,072.56 1.33Recordati Ind Chimica/Post Rag 115,166 EUR 3,494,458.17 4,221,985.56 1.30Saipem Spa* 537,146 EUR 1,996,753.16 2,350,013.75 0.72Salvatore Ferragamo Spa 146,697 EUR 2,843,025.50 3,077,703.06 0.95Sampo Plc A 129,040 EUR 5,313,361.01 5,355,160.00 1.65Sias 49,682 EUR 729,489.66 810,313.42 0.25Snam Rete Gas Spa 1,228,339 EUR 5,125,476.19 5,369,069.77 1.65Stmicroelectronics Nv* 690,787 EUR 10,058,109.74 10,776,277.20 3.31Technogym Spa 332,187 EUR 3,400,181.54 3,252,110.73 1.00Telecom Italia Spa 4,488,423 EUR 2,844,593.20 2,155,340.72 0.66Telecom Italia Spa /Risp. N-Cv 3,265,522 EUR 1,766,931.41 1,489,404.58 0.46Tenaris Sa 946,650 EUR 11,502,091.85 10,895,941.50 3.35Terna - Rete Elettrica Nazional 1,185,651 EUR 6,322,087.85 6,639,645.60 2.04Total Sa 93,598 EUR 4,898,613.18 4,612,041.45 1.42Unicredit Spa 2,464,887 EUR 33,374,702.61 26,684,866.66 8.20
300,706,108.84 315,299,908.80 96.90
Total - Transferable securities and money market instruments listed on an officialstock exchange and dealt in on another regulated market 300,706,108.84 315,299,908.80 96.90
Investment Funds
Fondo It Per Leff En Sgr Spa 4,500 EUR 3,894,696.24 4,263,048.00 1.31Total - Investment Funds 3,894,696.24 4,263,048.00 1.31
Pramerica Sicav
The accompanying notes form an integral part of these financial statements.
194
* Securities partially or totally lent (see Note 9).

Description Face value/
Quantity
Base currency Cost Market Value % net
assets
Financial Instruments
Options ContractsCall Ftse Mib Index 19/07/19 22000 225 EUR 177,578.75 32,062.50 0.01Call Ftse Mib Index 20/12/19 23500 (248) EUR (168,255.60) (91,760.00) (0.03)Call Prysmian Spa 20/09/19 18 6,894 EUR 176,486.40 970,606.26 0.30Call Prysmian Spa 20/12/19 20 (3,708) EUR (150,169.06) (413,738.64) (0.13)
35,640.49 497,170.12 0.15
Total - Financial Instruments 35,640.49 497,170.12 0.15
TOTAL INVESTMENT PORTFOLIO 304,636,445.57 320,060,126.92 98.36
Pramerica Sicav
The accompanying notes form an integral part of these financial statements.
195
Italian Equity
Statement of Investmentsas at June 30, 2019 (continued)
(expressed in EUR)
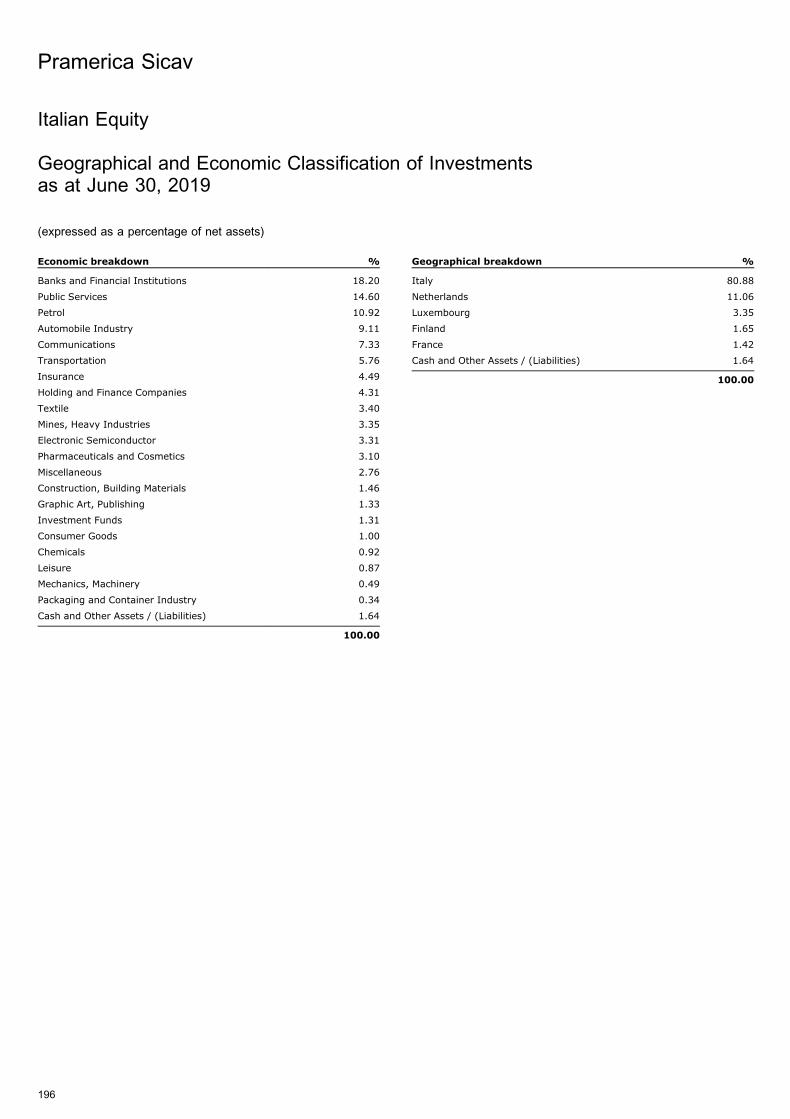
Italian Equity
Geographical and Economic Classification of Investmentsas at June 30, 2019
(expressed as a percentage of net assets)
Economic breakdown %
Banks and Financial Institutions 18.20
Public Services 14.60
Petrol 10.92
Automobile Industry 9.11
Communications 7.33
Transportation 5.76
Insurance 4.49
Holding and Finance Companies 4.31
Textile 3.40
Mines, Heavy Industries 3.35
Electronic Semiconductor 3.31
Pharmaceuticals and Cosmetics 3.10
Miscellaneous 2.76
Construction, Building Materials 1.46
Graphic Art, Publishing 1.33
Investment Funds 1.31
Consumer Goods 1.00
Chemicals 0.92
Leisure 0.87
Mechanics, Machinery 0.49
Packaging and Container Industry 0.34
Cash and Other Assets / (Liabilities) 1.64
100.00
Geographical breakdown %
Italy 80.88
Netherlands 11.06
Luxembourg 3.35
Finland 1.65
France 1.42
Cash and Other Assets / (Liabilities) 1.64
100.00
Pramerica Sicav
196
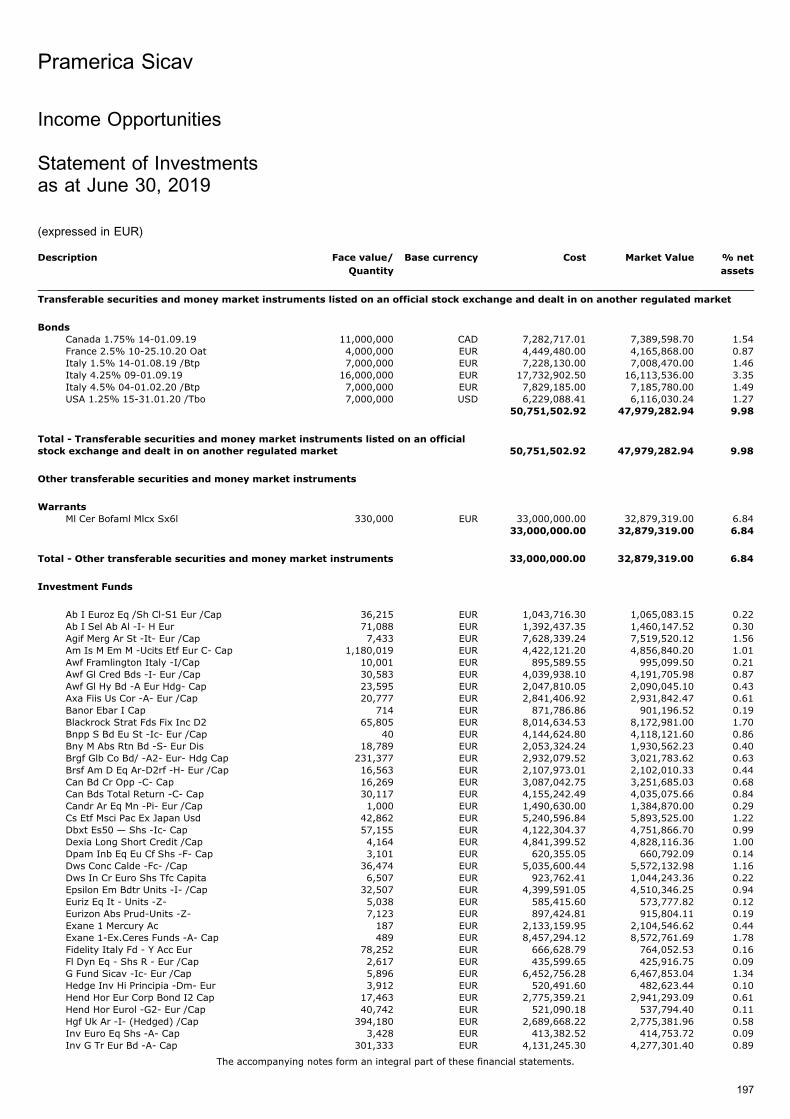
Income Opportunities
Statement of Investmentsas at June 30, 2019
(expressed in EUR)
Description Face value/
Quantity
Base currency Cost Market Value % net
assets
Transferable securities and money market instruments listed on an official stock exchange and dealt in on another regulated market
Bonds
Canada 1.75% 14-01.09.19 11,000,000 CAD 7,282,717.01 7,389,598.70 1.54France 2.5% 10-25.10.20 Oat 4,000,000 EUR 4,449,480.00 4,165,868.00 0.87Italy 1.5% 14-01.08.19 /Btp 7,000,000 EUR 7,228,130.00 7,008,470.00 1.46Italy 4.25% 09-01.09.19 16,000,000 EUR 17,732,902.50 16,113,536.00 3.35Italy 4.5% 04-01.02.20 /Btp 7,000,000 EUR 7,829,185.00 7,185,780.00 1.49USA 1.25% 15-31.01.20 /Tbo 7,000,000 USD 6,229,088.41 6,116,030.24 1.27
50,751,502.92 47,979,282.94 9.98
Total - Transferable securities and money market instruments listed on an official
stock exchange and dealt in on another regulated market 50,751,502.92 47,979,282.94 9.98
Other transferable securities and money market instruments
Warrants
Ml Cer Bofaml Mlcx Sx6l 330,000 EUR 33,000,000.00 32,879,319.00 6.8433,000,000.00 32,879,319.00 6.84
Total - Other transferable securities and money market instruments 33,000,000.00 32,879,319.00 6.84
Investment Funds
Ab I Euroz Eq /Sh Cl-S1 Eur /Cap 36,215 EUR 1,043,716.30 1,065,083.15 0.22Ab I Sel Ab Al -I- H Eur 71,088 EUR 1,392,437.35 1,460,147.52 0.30Agif Merg Ar St -It- Eur /Cap 7,433 EUR 7,628,339.24 7,519,520.12 1.56Am Is M Em M -Ucits Etf Eur C- Cap 1,180,019 EUR 4,422,121.20 4,856,840.20 1.01Awf Framlington Italy -I/Cap 10,001 EUR 895,589.55 995,099.50 0.21Awf Gl Cred Bds -I- Eur /Cap 30,583 EUR 4,039,938.10 4,191,705.98 0.87Awf Gl Hy Bd -A Eur Hdg- Cap 23,595 EUR 2,047,810.05 2,090,045.10 0.43Axa Fiis Us Cor -A- Eur /Cap 20,777 EUR 2,841,406.92 2,931,842.47 0.61Banor Ebar I Cap 714 EUR 871,786.86 901,196.52 0.19Blackrock Strat Fds Fix Inc D2 65,805 EUR 8,014,634.53 8,172,981.00 1.70Bnpp S Bd Eu St -Ic- Eur /Cap 40 EUR 4,144,624.80 4,118,121.60 0.86Bny M Abs Rtn Bd -S- Eur Dis 18,789 EUR 2,053,324.24 1,930,562.23 0.40Brgf Glb Co Bd/ -A2- Eur- Hdg Cap 231,377 EUR 2,932,079.52 3,021,783.62 0.63Brsf Am D Eq Ar-D2rf -H- Eur /Cap 16,563 EUR 2,107,973.01 2,102,010.33 0.44Can Bd Cr Opp -C- Cap 16,269 EUR 3,087,042.75 3,251,685.03 0.68Can Bds Total Return -C- Cap 30,117 EUR 4,155,242.49 4,035,075.66 0.84Candr Ar Eq Mn -Pi- Eur /Cap 1,000 EUR 1,490,630.00 1,384,870.00 0.29Cs Etf Msci Pac Ex Japan Usd 42,862 EUR 5,240,596.84 5,893,525.00 1.22Dbxt Es50 — Shs -Ic- Cap 57,155 EUR 4,122,304.37 4,751,866.70 0.99Dexia Long Short Credit /Cap 4,164 EUR 4,841,399.52 4,828,116.36 1.00Dpam Inb Eq Eu Cf Shs -F- Cap 3,101 EUR 620,355.05 660,792.09 0.14Dws Conc Calde -Fc- /Cap 36,474 EUR 5,035,600.44 5,572,132.98 1.16Dws In Cr Euro Shs Tfc Capita 6,507 EUR 923,762.41 1,044,243.36 0.22Epsilon Em Bdtr Units -I- /Cap 32,507 EUR 4,399,591.05 4,510,346.25 0.94Euriz Eq It - Units -Z- 5,038 EUR 585,415.60 573,777.82 0.12Eurizon Abs Prud-Units -Z- 7,123 EUR 897,424.81 915,804.11 0.19Exane 1 Mercury Ac 187 EUR 2,133,159.95 2,104,546.62 0.44Exane 1-Ex.Ceres Funds -A- Cap 489 EUR 8,457,294.12 8,572,761.69 1.78Fidelity Italy Fd - Y Acc Eur 78,252 EUR 666,628.79 764,052.53 0.16Fl Dyn Eq - Shs R - Eur /Cap 2,617 EUR 435,599.65 425,916.75 0.09G Fund Sicav -Ic- Eur /Cap 5,896 EUR 6,452,756.28 6,467,853.04 1.34Hedge Inv Hi Principia -Dm- Eur 3,912 EUR 520,491.60 482,623.44 0.10Hend Hor Eur Corp Bond I2 Cap 17,463 EUR 2,775,359.21 2,941,293.09 0.61Hend Hor Eurol -G2- Eur /Cap 40,742 EUR 521,090.18 537,794.40 0.11Hgf Uk Ar -I- (Hedged) /Cap 394,180 EUR 2,689,668.22 2,775,381.96 0.58Inv Euro Eq Shs -A- Cap 3,428 EUR 413,382.52 414,753.72 0.09Inv G Tr Eur Bd -A- Cap 301,333 EUR 4,131,245.30 4,277,301.40 0.89
Pramerica Sicav
The accompanying notes form an integral part of these financial statements.
197
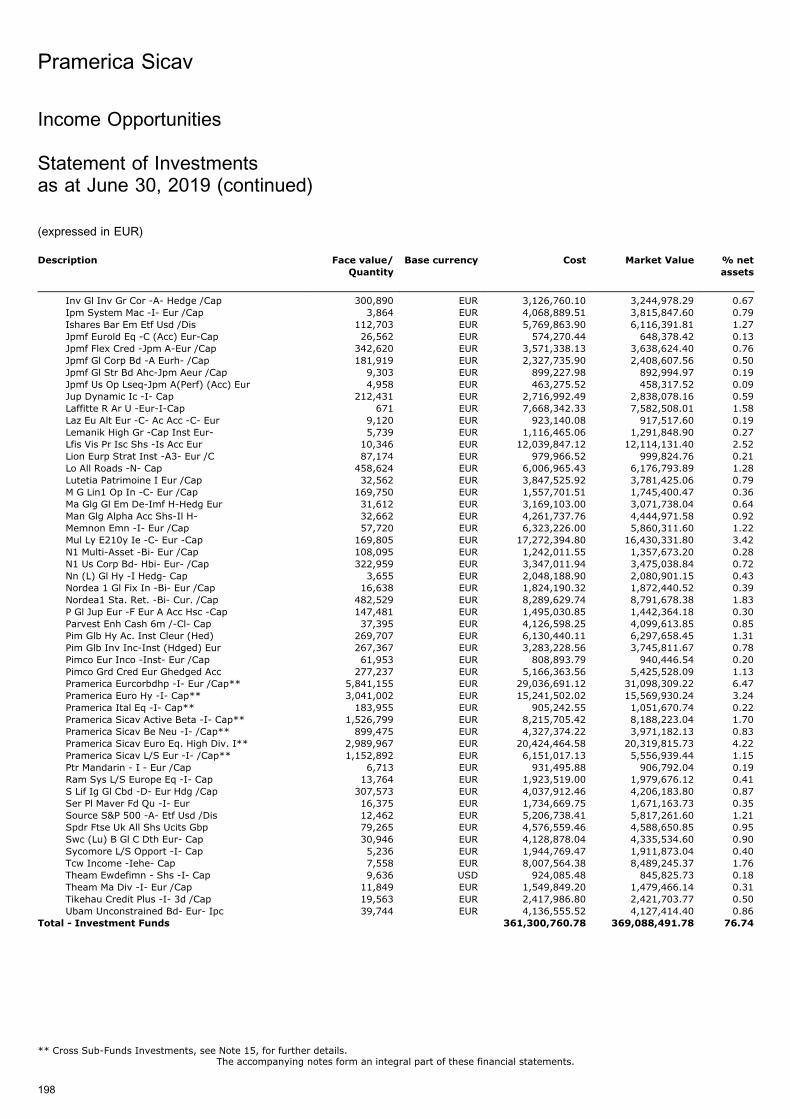
Description Face value/
Quantity
Base currency Cost Market Value % net
assets
Inv Gl Inv Gr Cor -A- Hedge /Cap 300,890 EUR 3,126,760.10 3,244,978.29 0.67Ipm System Mac -I- Eur /Cap 3,864 EUR 4,068,889.51 3,815,847.60 0.79Ishares Bar Em Etf Usd /Dis 112,703 EUR 5,769,863.90 6,116,391.81 1.27Jpmf Eurold Eq -C (Acc) Eur-Cap 26,562 EUR 574,270.44 648,378.42 0.13Jpmf Flex Cred -Jpm A-Eur /Cap 342,620 EUR 3,571,338.13 3,638,624.40 0.76Jpmf Gl Corp Bd -A Eurh- /Cap 181,919 EUR 2,327,735.90 2,408,607.56 0.50Jpmf Gl Str Bd Ahc-Jpm Aeur /Cap 9,303 EUR 899,227.98 892,994.97 0.19Jpmf Us Op Lseq-Jpm A(Perf) (Acc) Eur 4,958 EUR 463,275.52 458,317.52 0.09Jup Dynamic Ic -I- Cap 212,431 EUR 2,716,992.49 2,838,078.16 0.59Laffitte R Ar U -Eur-I-Cap 671 EUR 7,668,342.33 7,582,508.01 1.58Laz Eu Alt Eur -C- Ac Acc -C- Eur 9,120 EUR 923,140.08 917,517.60 0.19Lemanik High Gr -Cap Inst Eur- 5,739 EUR 1,116,465.06 1,291,848.90 0.27Lfis Vis Pr Isc Shs -Is Acc Eur 10,346 EUR 12,039,847.12 12,114,131.40 2.52Lion Eurp Strat Inst -A3- Eur /C 87,174 EUR 979,966.52 999,824.76 0.21Lo All Roads -N- Cap 458,624 EUR 6,006,965.43 6,176,793.89 1.28Lutetia Patrimoine I Eur /Cap 32,562 EUR 3,847,525.92 3,781,425.06 0.79M G Lin1 Op In -C- Eur /Cap 169,750 EUR 1,557,701.51 1,745,400.47 0.36Ma Glg Gl Em De-Imf H-Hedg Eur 31,612 EUR 3,169,103.00 3,071,738.04 0.64Man Glg Alpha Acc Shs-Il H- 32,662 EUR 4,261,737.76 4,444,971.58 0.92Memnon Emn -I- Eur /Cap 57,720 EUR 6,323,226.00 5,860,311.60 1.22Mul Ly E210y Ie -C- Eur -Cap 169,805 EUR 17,272,394.80 16,430,331.80 3.42N1 Multi-Asset -Bi- Eur /Cap 108,095 EUR 1,242,011.55 1,357,673.20 0.28N1 Us Corp Bd- Hbi- Eur- /Cap 322,959 EUR 3,347,011.94 3,475,038.84 0.72Nn (L) Gl Hy -I Hedg- Cap 3,655 EUR 2,048,188.90 2,080,901.15 0.43Nordea 1 Gl Fix In -Bi- Eur /Cap 16,638 EUR 1,824,190.32 1,872,440.52 0.39Nordea1 Sta. Ret. -Bi- Cur. /Cap 482,529 EUR 8,289,629.74 8,791,678.38 1.83P Gl Jup Eur -F Eur A Acc Hsc -Cap 147,481 EUR 1,495,030.85 1,442,364.18 0.30Parvest Enh Cash 6m /-Cl- Cap 37,395 EUR 4,126,598.25 4,099,613.85 0.85Pim Glb Hy Ac. Inst Cleur (Hed) 269,707 EUR 6,130,440.11 6,297,658.45 1.31Pim Glb Inv Inc-Inst (Hdged) Eur 267,367 EUR 3,283,228.56 3,745,811.67 0.78Pimco Eur Inco -Inst- Eur /Cap 61,953 EUR 808,893.79 940,446.54 0.20Pimco Grd Cred Eur Ghedged Acc 277,237 EUR 5,166,363.56 5,425,528.09 1.13Pramerica Eurcorbdhp -I- Eur /Cap** 5,841,155 EUR 29,036,691.12 31,098,309.22 6.47Pramerica Euro Hy -I- Cap** 3,041,002 EUR 15,241,502.02 15,569,930.24 3.24Pramerica Ital Eq -I- Cap** 183,955 EUR 905,242.55 1,051,670.74 0.22Pramerica Sicav Active Beta -I- Cap** 1,526,799 EUR 8,215,705.42 8,188,223.04 1.70Pramerica Sicav Be Neu -I- /Cap** 899,475 EUR 4,327,374.22 3,971,182.13 0.83Pramerica Sicav Euro Eq. High Div. I** 2,989,967 EUR 20,424,464.58 20,319,815.73 4.22Pramerica Sicav L/S Eur -I- /Cap** 1,152,892 EUR 6,151,017.13 5,556,939.44 1.15Ptr Mandarin - I - Eur /Cap 6,713 EUR 931,495.88 906,792.04 0.19Ram Sys L/S Europe Eq -I- Cap 13,764 EUR 1,923,519.00 1,979,676.12 0.41S Lif Ig Gl Cbd -D- Eur Hdg /Cap 307,573 EUR 4,037,912.46 4,206,183.80 0.87Ser Pl Maver Fd Qu -I- Eur 16,375 EUR 1,734,669.75 1,671,163.73 0.35Source S&P 500 -A- Etf Usd /Dis 12,462 EUR 5,206,738.41 5,817,261.60 1.21Spdr Ftse Uk All Shs Ucits Gbp 79,265 EUR 4,576,559.46 4,588,650.85 0.95Swc (Lu) B Gl C Dth Eur- Cap 30,946 EUR 4,128,878.04 4,335,534.60 0.90Sycomore L/S Opport -I- Cap 5,236 EUR 1,944,769.47 1,911,873.04 0.40Tcw Income -Iehe- Cap 7,558 EUR 8,007,564.38 8,489,245.37 1.76Theam Ewdefimn - Shs -I- Cap 9,636 USD 924,085.48 845,825.73 0.18Theam Ma Div -I- Eur /Cap 11,849 EUR 1,549,849.20 1,479,466.14 0.31Tikehau Credit Plus -I- 3d /Cap 19,563 EUR 2,417,986.80 2,421,703.77 0.50Ubam Unconstrained Bd- Eur- Ipc 39,744 EUR 4,136,555.52 4,127,414.40 0.86
Total - Investment Funds 361,300,760.78 369,088,491.78 76.74
Pramerica Sicav
The accompanying notes form an integral part of these financial statements.
198
Income Opportunities
Statement of Investmentsas at June 30, 2019 (continued)
(expressed in EUR)
** Cross Sub-Funds Investments, see Note 15, for further details.
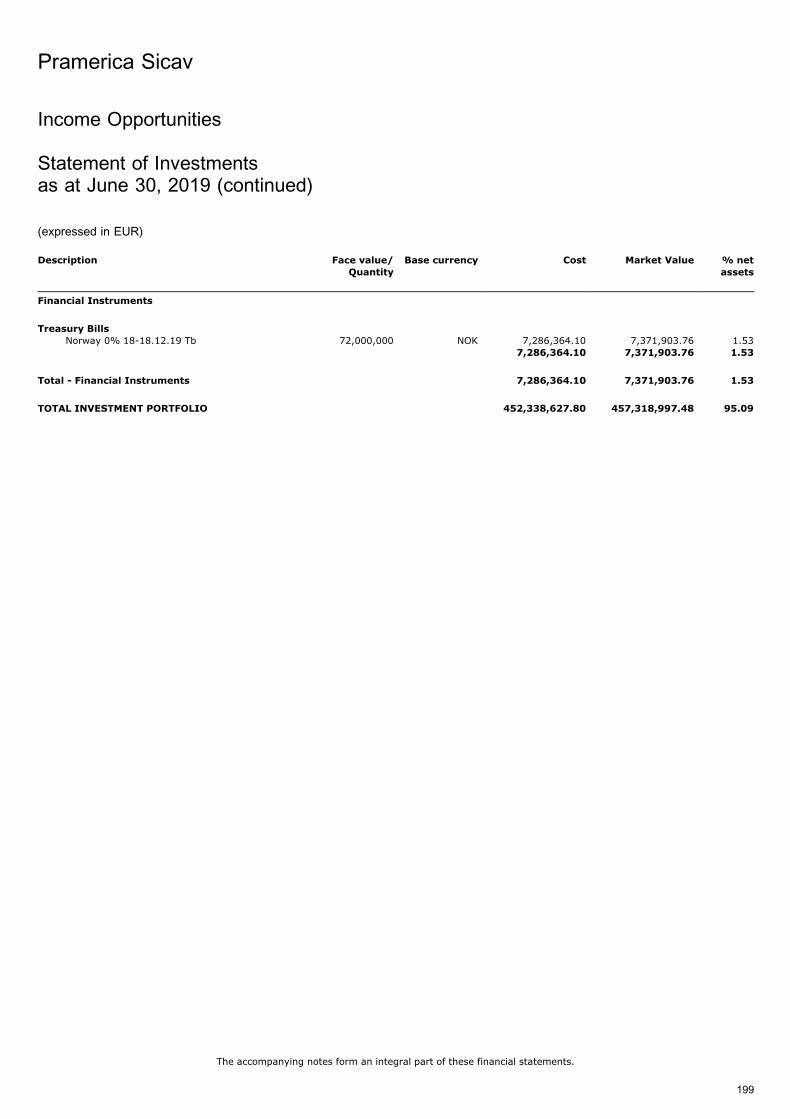
Description Face value/
Quantity
Base currency Cost Market Value % net
assets
Financial Instruments
Treasury Bills
Norway 0% 18-18.12.19 Tb 72,000,000 NOK 7,286,364.10 7,371,903.76 1.537,286,364.10 7,371,903.76 1.53
Total - Financial Instruments 7,286,364.10 7,371,903.76 1.53
TOTAL INVESTMENT PORTFOLIO 452,338,627.80 457,318,997.48 95.09
Pramerica Sicav
The accompanying notes form an integral part of these financial statements.
199
Income Opportunities
Statement of Investmentsas at June 30, 2019 (continued)
(expressed in EUR)
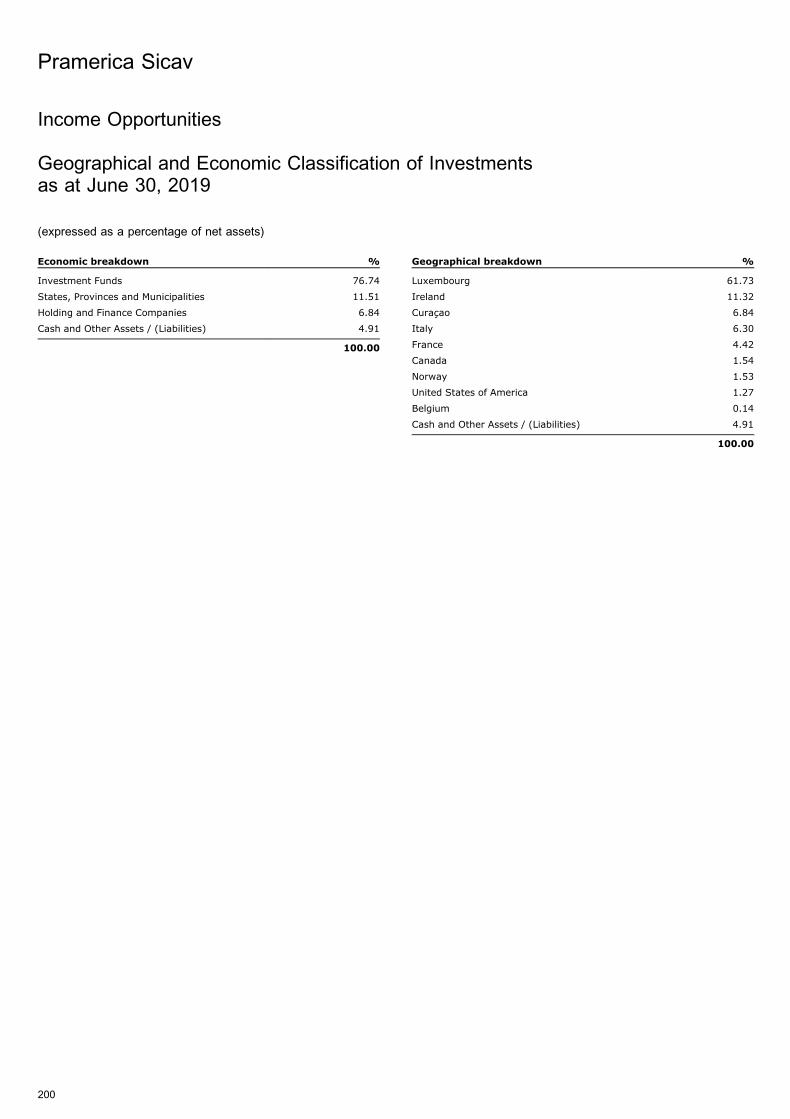
Income Opportunities
Geographical and Economic Classification of Investmentsas at June 30, 2019
(expressed as a percentage of net assets)
Economic breakdown %
Investment Funds 76.74
States, Provinces and Municipalities 11.51
Holding and Finance Companies 6.84
Cash and Other Assets / (Liabilities) 4.91
100.00
Geographical breakdown %
Luxembourg 61.73
Ireland 11.32
Curacao 6.84
Italy 6.30
France 4.42
Canada 1.54
Norway 1.53
United States of America 1.27
Belgium 0.14
Cash and Other Assets / (Liabilities) 4.91
100.00
Pramerica Sicav
200
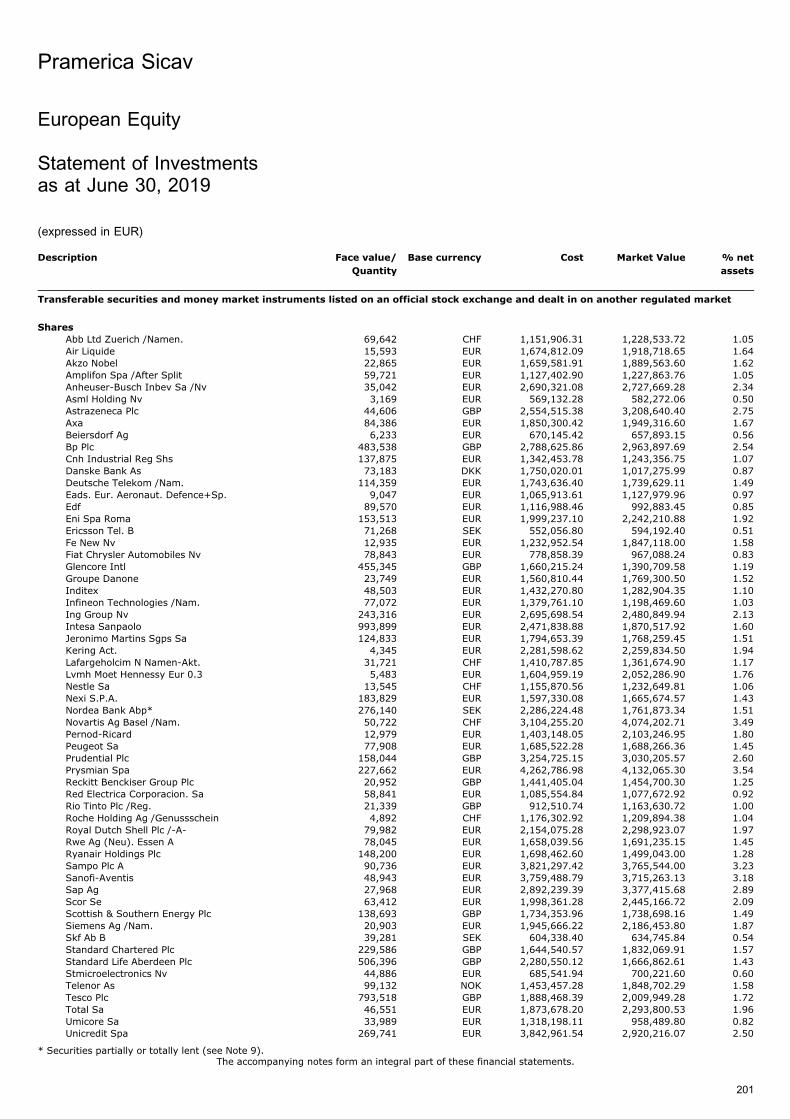
European Equity
Statement of Investmentsas at June 30, 2019
(expressed in EUR)
Description Face value/
Quantity
Base currency Cost Market Value % net
assets
Transferable securities and money market instruments listed on an official stock exchange and dealt in on another regulated market
Shares
Abb Ltd Zuerich /Namen. 69,642 CHF 1,151,906.31 1,228,533.72 1.05Air Liquide 15,593 EUR 1,674,812.09 1,918,718.65 1.64Akzo Nobel 22,865 EUR 1,659,581.91 1,889,563.60 1.62Amplifon Spa /After Split 59,721 EUR 1,127,402.90 1,227,863.76 1.05Anheuser-Busch Inbev Sa /Nv 35,042 EUR 2,690,321.08 2,727,669.28 2.34Asml Holding Nv 3,169 EUR 569,132.28 582,272.06 0.50Astrazeneca Plc 44,606 GBP 2,554,515.38 3,208,640.40 2.75Axa 84,386 EUR 1,850,300.42 1,949,316.60 1.67Beiersdorf Ag 6,233 EUR 670,145.42 657,893.15 0.56Bp Plc 483,538 GBP 2,788,625.86 2,963,897.69 2.54Cnh Industrial Reg Shs 137,875 EUR 1,342,453.78 1,243,356.75 1.07Danske Bank As 73,183 DKK 1,750,020.01 1,017,275.99 0.87Deutsche Telekom /Nam. 114,359 EUR 1,743,636.40 1,739,629.11 1.49Eads. Eur. Aeronaut. Defence+Sp. 9,047 EUR 1,065,913.61 1,127,979.96 0.97Edf 89,570 EUR 1,116,988.46 992,883.45 0.85Eni Spa Roma 153,513 EUR 1,999,237.10 2,242,210.88 1.92Ericsson Tel. B 71,268 SEK 552,056.80 594,192.40 0.51Fe New Nv 12,935 EUR 1,232,952.54 1,847,118.00 1.58Fiat Chrysler Automobiles Nv 78,843 EUR 778,858.39 967,088.24 0.83Glencore Intl 455,345 GBP 1,660,215.24 1,390,709.58 1.19Groupe Danone 23,749 EUR 1,560,810.44 1,769,300.50 1.52Inditex 48,503 EUR 1,432,270.80 1,282,904.35 1.10Infineon Technologies /Nam. 77,072 EUR 1,379,761.10 1,198,469.60 1.03Ing Group Nv 243,316 EUR 2,695,698.54 2,480,849.94 2.13Intesa Sanpaolo 993,899 EUR 2,471,838.88 1,870,517.92 1.60Jeronimo Martins Sgps Sa 124,833 EUR 1,794,653.39 1,768,259.45 1.51Kering Act. 4,345 EUR 2,281,598.62 2,259,834.50 1.94Lafargeholcim N Namen-Akt. 31,721 CHF 1,410,787.85 1,361,674.90 1.17Lvmh Moet Hennessy Eur 0.3 5,483 EUR 1,604,959.19 2,052,286.90 1.76Nestle Sa 13,545 CHF 1,155,870.56 1,232,649.81 1.06Nexi S.P.A. 183,829 EUR 1,597,330.08 1,665,674.57 1.43Nordea Bank Abp* 276,140 SEK 2,286,224.48 1,761,873.34 1.51Novartis Ag Basel /Nam. 50,722 CHF 3,104,255.20 4,074,202.71 3.49Pernod-Ricard 12,979 EUR 1,403,148.05 2,103,246.95 1.80Peugeot Sa 77,908 EUR 1,685,522.28 1,688,266.36 1.45Prudential Plc 158,044 GBP 3,254,725.15 3,030,205.57 2.60Prysmian Spa 227,662 EUR 4,262,786.98 4,132,065.30 3.54Reckitt Benckiser Group Plc 20,952 GBP 1,441,405.04 1,454,700.30 1.25Red Electrica Corporacion. Sa 58,841 EUR 1,085,554.84 1,077,672.92 0.92Rio Tinto Plc /Reg. 21,339 GBP 912,510.74 1,163,630.72 1.00Roche Holding Ag /Genussschein 4,892 CHF 1,176,302.92 1,209,894.38 1.04Royal Dutch Shell Plc /-A- 79,982 EUR 2,154,075.28 2,298,923.07 1.97Rwe Ag (Neu). Essen A 78,045 EUR 1,658,039.56 1,691,235.15 1.45Ryanair Holdings Plc 148,200 EUR 1,698,462.60 1,499,043.00 1.28Sampo Plc A 90,736 EUR 3,821,297.42 3,765,544.00 3.23Sanofi-Aventis 48,943 EUR 3,759,488.79 3,715,263.13 3.18Sap Ag 27,968 EUR 2,892,239.39 3,377,415.68 2.89Scor Se 63,412 EUR 1,998,361.28 2,445,166.72 2.09Scottish & Southern Energy Plc 138,693 GBP 1,734,353.96 1,738,698.16 1.49Siemens Ag /Nam. 20,903 EUR 1,945,666.22 2,186,453.80 1.87Skf Ab B 39,281 SEK 604,338.40 634,745.84 0.54Standard Chartered Plc 229,586 GBP 1,644,540.57 1,832,069.91 1.57Standard Life Aberdeen Plc 506,396 GBP 2,280,550.12 1,666,862.61 1.43Stmicroelectronics Nv 44,886 EUR 685,541.94 700,221.60 0.60Telenor As 99,132 NOK 1,453,457.28 1,848,702.29 1.58Tesco Plc 793,518 GBP 1,888,468.39 2,009,949.28 1.72Total Sa 46,551 EUR 1,873,678.20 2,293,800.53 1.96Umicore Sa 33,989 EUR 1,318,198.11 958,489.80 0.82Unicredit Spa 269,741 EUR 3,842,961.54 2,920,216.07 2.50
Pramerica Sicav
The accompanying notes form an integral part of these financial statements.
201
* Securities partially or totally lent (see Note 9).
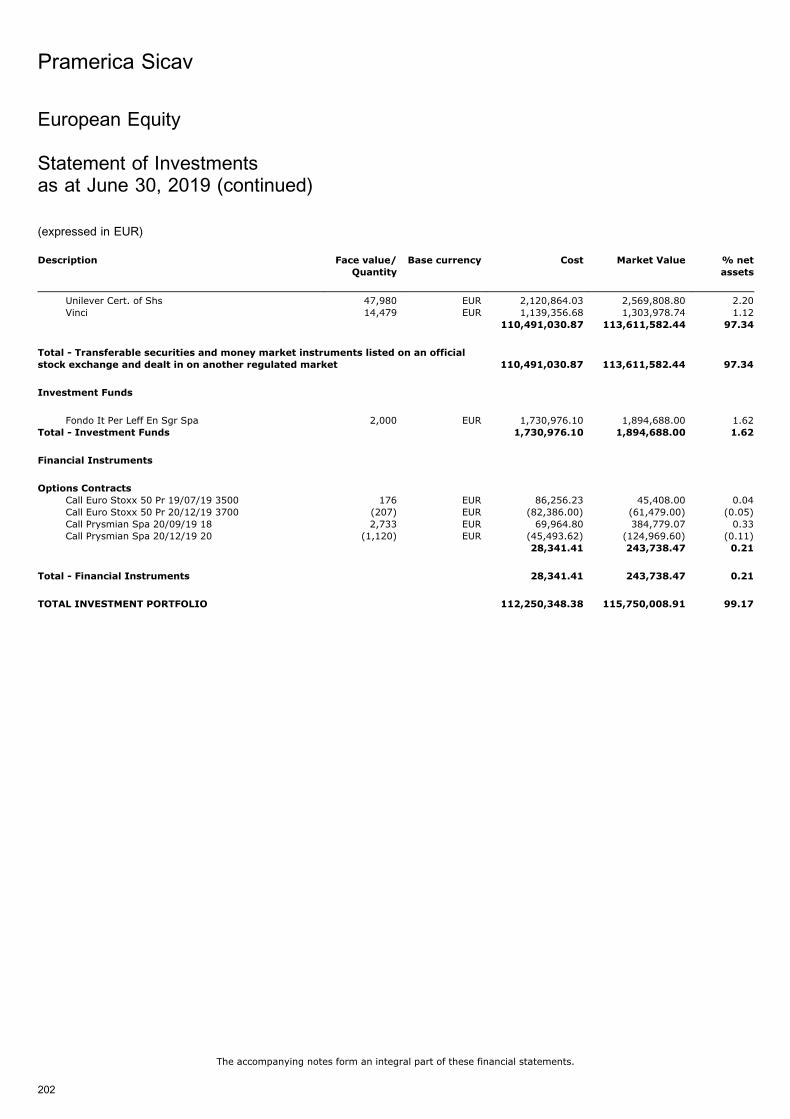
Description Face value/
Quantity
Base currency Cost Market Value % net
assets
Unilever Cert. of Shs 47,980 EUR 2,120,864.03 2,569,808.80 2.20Vinci 14,479 EUR 1,139,356.68 1,303,978.74 1.12
110,491,030.87 113,611,582.44 97.34
Total - Transferable securities and money market instruments listed on an official
stock exchange and dealt in on another regulated market 110,491,030.87 113,611,582.44 97.34
Investment Funds
Fondo It Per Leff En Sgr Spa 2,000 EUR 1,730,976.10 1,894,688.00 1.62Total - Investment Funds 1,730,976.10 1,894,688.00 1.62
Financial Instruments
Options Contracts
Call Euro Stoxx 50 Pr 19/07/19 3500 176 EUR 86,256.23 45,408.00 0.04Call Euro Stoxx 50 Pr 20/12/19 3700 (207) EUR (82,386.00) (61,479.00) (0.05)Call Prysmian Spa 20/09/19 18 2,733 EUR 69,964.80 384,779.07 0.33Call Prysmian Spa 20/12/19 20 (1,120) EUR (45,493.62) (124,969.60) (0.11)
28,341.41 243,738.47 0.21
Total - Financial Instruments 28,341.41 243,738.47 0.21
TOTAL INVESTMENT PORTFOLIO 112,250,348.38 115,750,008.91 99.17
Pramerica Sicav
The accompanying notes form an integral part of these financial statements.
202
European Equity
Statement of Investmentsas at June 30, 2019 (continued)
(expressed in EUR)
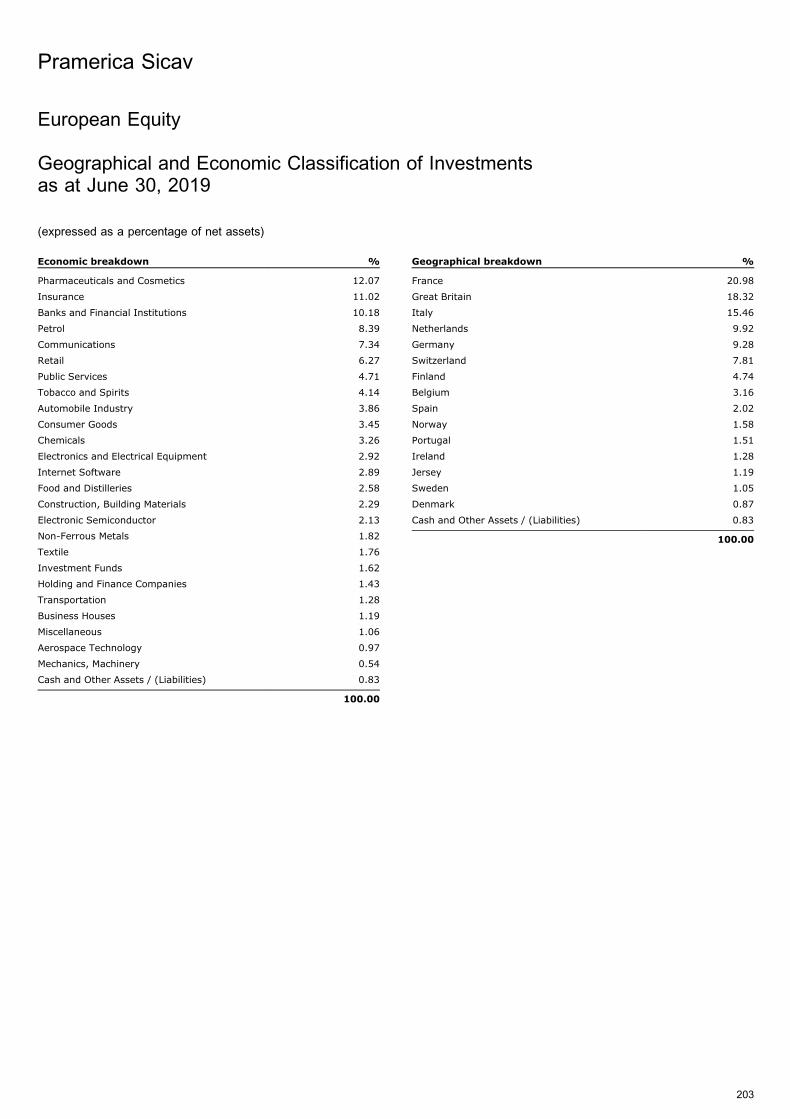
European Equity
Geographical and Economic Classification of Investmentsas at June 30, 2019
(expressed as a percentage of net assets)
Economic breakdown %
Pharmaceuticals and Cosmetics 12.07
Insurance 11.02
Banks and Financial Institutions 10.18
Petrol 8.39
Communications 7.34
Retail 6.27
Public Services 4.71
Tobacco and Spirits 4.14
Automobile Industry 3.86
Consumer Goods 3.45
Chemicals 3.26
Electronics and Electrical Equipment 2.92
Internet Software 2.89
Food and Distilleries 2.58
Construction, Building Materials 2.29
Electronic Semiconductor 2.13
Non-Ferrous Metals 1.82
Textile 1.76
Investment Funds 1.62
Holding and Finance Companies 1.43
Transportation 1.28
Business Houses 1.19
Miscellaneous 1.06
Aerospace Technology 0.97
Mechanics, Machinery 0.54
Cash and Other Assets / (Liabilities) 0.83
100.00
Geographical breakdown %
France 20.98
Great Britain 18.32
Italy 15.46
Netherlands 9.92
Germany 9.28
Switzerland 7.81
Finland 4.74
Belgium 3.16
Spain 2.02
Norway 1.58
Portugal 1.51
Ireland 1.28
Jersey 1.19
Sweden 1.05
Denmark 0.87
Cash and Other Assets / (Liabilities) 0.83
100.00
Pramerica Sicav
203
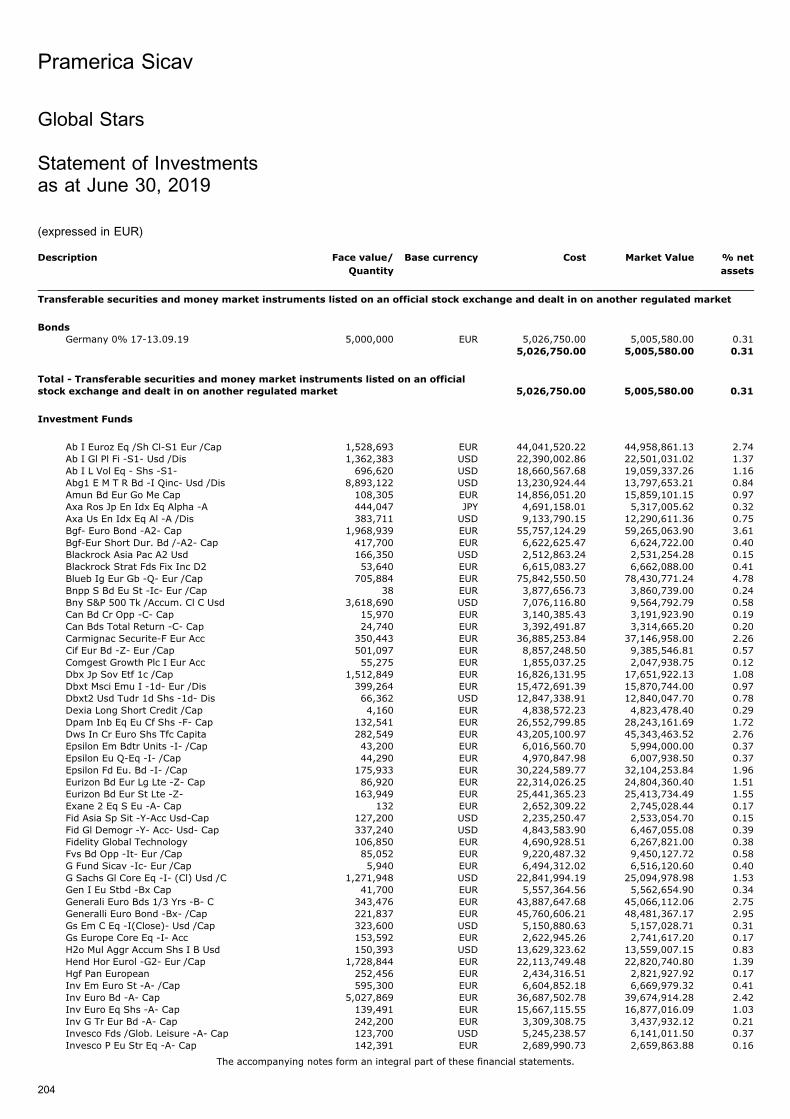
Global Stars
Statement of Investmentsas at June 30, 2019
(expressed in EUR)
Description Face value/
Quantity
Base currency Cost Market Value % net
assets
Transferable securities and money market instruments listed on an official stock exchange and dealt in on another regulated market
Bonds
Germany 0% 17-13.09.19 5,000,000 EUR 5,026,750.00 5,005,580.00 0.315,026,750.00 5,005,580.00 0.31
Total - Transferable securities and money market instruments listed on an official
stock exchange and dealt in on another regulated market 5,026,750.00 5,005,580.00 0.31
Investment Funds
Ab I Euroz Eq /Sh Cl-S1 Eur /Cap 1,528,693 EUR 44,041,520.22 44,958,861.13 2.74Ab I Gl Pl Fi -S1- Usd /Dis 1,362,383 USD 22,390,002.86 22,501,031.02 1.37Ab I L Vol Eq - Shs -S1- 696,620 USD 18,660,567.68 19,059,337.26 1.16Abg1 E M T R Bd -I Qinc- Usd /Dis 8,893,122 USD 13,230,924.44 13,797,653.21 0.84Amun Bd Eur Go Me Cap 108,305 EUR 14,856,051.20 15,859,101.15 0.97Axa Ros Jp En Idx Eq Alpha -A 444,047 JPY 4,691,158.01 5,317,005.62 0.32Axa Us En Idx Eq Al -A /Dis 383,711 USD 9,133,790.15 12,290,611.36 0.75Bgf- Euro Bond -A2- Cap 1,968,939 EUR 55,757,124.29 59,265,063.90 3.61Bgf-Eur Short Dur. Bd /-A2- Cap 417,700 EUR 6,622,625.47 6,624,722.00 0.40Blackrock Asia Pac A2 Usd 166,350 USD 2,512,863.24 2,531,254.28 0.15Blackrock Strat Fds Fix Inc D2 53,640 EUR 6,615,083.27 6,662,088.00 0.41Blueb Ig Eur Gb -Q- Eur /Cap 705,884 EUR 75,842,550.50 78,430,771.24 4.78Bnpp S Bd Eu St -Ic- Eur /Cap 38 EUR 3,877,656.73 3,860,739.00 0.24Bny S&P 500 Tk /Accum. Cl C Usd 3,618,690 USD 7,076,116.80 9,564,792.79 0.58Can Bd Cr Opp -C- Cap 15,970 EUR 3,140,385.43 3,191,923.90 0.19Can Bds Total Return -C- Cap 24,740 EUR 3,392,491.87 3,314,665.20 0.20Carmignac Securite-F Eur Acc 350,443 EUR 36,885,253.84 37,146,958.00 2.26Cif Eur Bd -Z- Eur /Cap 501,097 EUR 8,857,248.50 9,385,546.81 0.57Comgest Growth Plc I Eur Acc 55,275 EUR 1,855,037.25 2,047,938.75 0.12Dbx Jp Sov Etf 1c /Cap 1,512,849 EUR 16,826,131.95 17,651,922.13 1.08Dbxt Msci Emu I -1d- Eur /Dis 399,264 EUR 15,472,691.39 15,870,744.00 0.97Dbxt2 Usd Tudr 1d Shs -1d- Dis 66,362 USD 12,847,338.91 12,840,047.70 0.78Dexia Long Short Credit /Cap 4,160 EUR 4,838,572.23 4,823,478.40 0.29Dpam Inb Eq Eu Cf Shs -F- Cap 132,541 EUR 26,552,799.85 28,243,161.69 1.72Dws In Cr Euro Shs Tfc Capita 282,549 EUR 43,205,100.97 45,343,463.52 2.76Epsilon Em Bdtr Units -I- /Cap 43,200 EUR 6,016,560.70 5,994,000.00 0.37Epsilon Eu Q-Eq -I- /Cap 44,290 EUR 4,970,847.98 6,007,938.50 0.37Epsilon Fd Eu. Bd -I- /Cap 175,933 EUR 30,224,589.77 32,104,253.84 1.96Eurizon Bd Eur Lg Lte -Z- Cap 86,920 EUR 22,314,026.25 24,804,360.40 1.51Eurizon Bd Eur St Lte -Z- 163,949 EUR 25,441,365.23 25,413,734.49 1.55Exane 2 Eq S Eu -A- Cap 132 EUR 2,652,309.22 2,745,028.44 0.17Fid Asia Sp Sit -Y-Acc Usd-Cap 127,200 USD 2,235,250.47 2,533,054.70 0.15Fid Gl Demogr -Y- Acc- Usd- Cap 337,240 USD 4,843,583.90 6,467,055.08 0.39Fidelity Global Technology 106,850 EUR 4,690,928.51 6,267,821.00 0.38Fvs Bd Opp -It- Eur /Cap 85,052 EUR 9,220,487.32 9,450,127.72 0.58G Fund Sicav -Ic- Eur /Cap 5,940 EUR 6,494,312.02 6,516,120.60 0.40G Sachs Gl Core Eq -I- (Cl) Usd /C 1,271,948 USD 22,841,994.19 25,094,978.98 1.53Gen I Eu Stbd -Bx Cap 41,700 EUR 5,557,364.56 5,562,654.90 0.34Generali Euro Bds 1/3 Yrs -B- C 343,476 EUR 43,887,647.68 45,066,112.06 2.75Generalli Euro Bond -Bx- /Cap 221,837 EUR 45,760,606.21 48,481,367.17 2.95Gs Em C Eq -I(Close)- Usd /Cap 323,600 USD 5,150,880.63 5,157,028.71 0.31Gs Europe Core Eq -I- Acc 153,592 EUR 2,622,945.26 2,741,617.20 0.17H2o Mul Aggr Accum Shs I B Usd 150,393 USD 13,629,323.62 13,559,007.15 0.83Hend Hor Eurol -G2- Eur /Cap 1,728,844 EUR 22,113,749.48 22,820,740.80 1.39Hgf Pan European 252,456 EUR 2,434,316.51 2,821,927.92 0.17Inv Em Euro St -A- /Cap 595,300 EUR 6,604,852.18 6,669,979.32 0.41Inv Euro Bd -A- Cap 5,027,869 EUR 36,687,502.78 39,674,914.28 2.42Inv Euro Eq Shs -A- Cap 139,491 EUR 15,667,115.55 16,877,016.09 1.03Inv G Tr Eur Bd -A- Cap 242,200 EUR 3,309,308.75 3,437,932.12 0.21Invesco Fds /Glob. Leisure -A- Cap 123,700 USD 5,245,238.57 6,141,011.50 0.37Invesco P Eu Str Eq -A- Cap 142,391 EUR 2,689,990.73 2,659,863.88 0.16
Pramerica Sicav
The accompanying notes form an integral part of these financial statements.
204
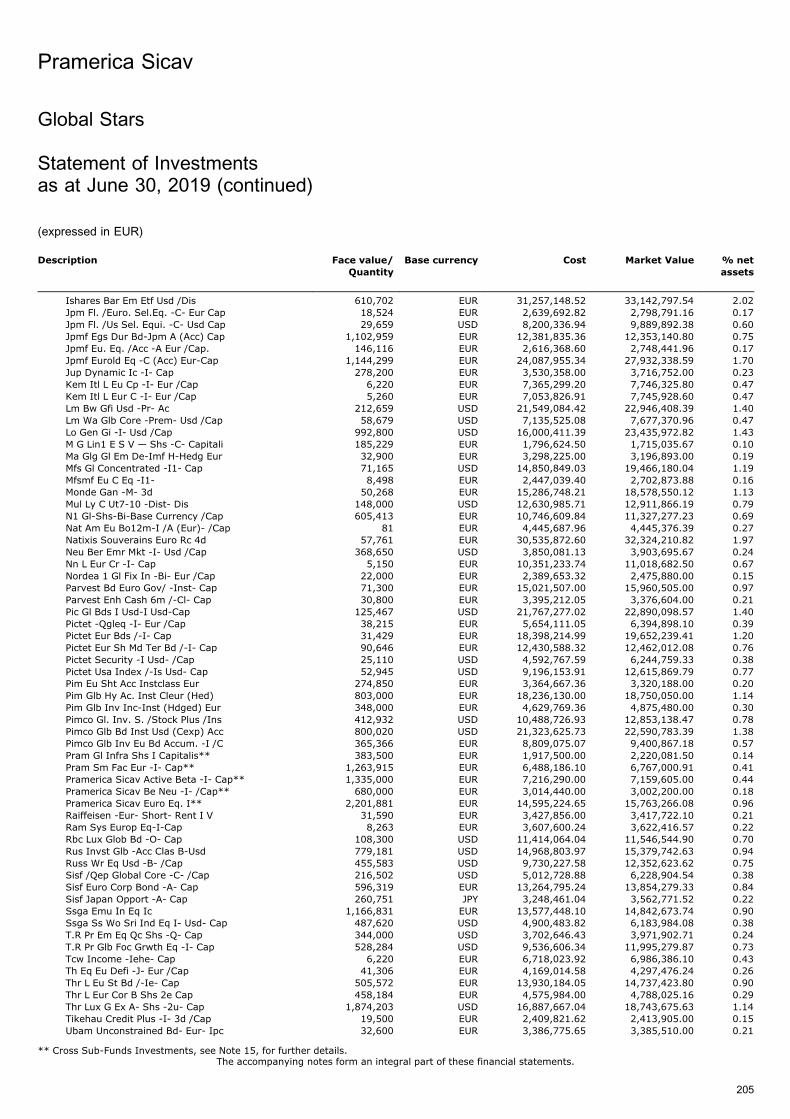
Description Face value/
Quantity
Base currency Cost Market Value % net
assets
Ishares Bar Em Etf Usd /Dis 610,702 EUR 31,257,148.52 33,142,797.54 2.02Jpm Fl. /Euro. Sel.Eq. -C- Eur Cap 18,524 EUR 2,639,692.82 2,798,791.16 0.17Jpm Fl. /Us Sel. Equi. -C- Usd Cap 29,659 USD 8,200,336.94 9,889,892.38 0.60Jpmf Egs Dur Bd-Jpm A (Acc) Cap 1,102,959 EUR 12,381,835.36 12,353,140.80 0.75Jpmf Eu. Eq. /Acc -A Eur /Cap. 146,116 EUR 2,616,368.60 2,748,441.96 0.17Jpmf Eurold Eq -C (Acc) Eur-Cap 1,144,299 EUR 24,087,955.34 27,932,338.59 1.70Jup Dynamic Ic -I- Cap 278,200 EUR 3,530,358.00 3,716,752.00 0.23Kem Itl L Eu Cp -I- Eur /Cap 6,220 EUR 7,365,299.20 7,746,325.80 0.47Kem Itl L Eur C -I- Eur /Cap 5,260 EUR 7,053,826.91 7,745,928.60 0.47Lm Bw Gfi Usd -Pr- Ac 212,659 USD 21,549,084.42 22,946,408.39 1.40Lm Wa Glb Core -Prem- Usd /Cap 58,679 USD 7,135,525.08 7,677,370.96 0.47Lo Gen Gi -I- Usd /Cap 992,800 USD 16,000,411.39 23,435,972.82 1.43M G Lin1 E S V — Shs -C- Capitali 185,229 EUR 1,796,624.50 1,715,035.67 0.10Ma Glg Gl Em De-Imf H-Hedg Eur 32,900 EUR 3,298,225.00 3,196,893.00 0.19Mfs Gl Concentrated -I1- Cap 71,165 USD 14,850,849.03 19,466,180.04 1.19Mfsmf Eu C Eq -I1- 8,498 EUR 2,447,039.40 2,702,873.88 0.16Monde Gan -M- 3d 50,268 EUR 15,286,748.21 18,578,550.12 1.13Mul Ly C Ut7-10 -Dist- Dis 148,000 USD 12,630,985.71 12,911,866.19 0.79N1 Gl-Shs-Bi-Base Currency /Cap 605,413 EUR 10,746,609.84 11,327,277.23 0.69Nat Am Eu Bo12m-I /A (Eur)- /Cap 81 EUR 4,445,687.96 4,445,376.39 0.27Natixis Souverains Euro Rc 4d 57,761 EUR 30,535,872.60 32,324,210.82 1.97Neu Ber Emr Mkt -I- Usd /Cap 368,650 USD 3,850,081.13 3,903,695.67 0.24Nn L Eur Cr -I- Cap 5,150 EUR 10,351,233.74 11,018,682.50 0.67Nordea 1 Gl Fix In -Bi- Eur /Cap 22,000 EUR 2,389,653.32 2,475,880.00 0.15Parvest Bd Euro Gov/ -Inst- Cap 71,300 EUR 15,021,507.00 15,960,505.00 0.97Parvest Enh Cash 6m /-Cl- Cap 30,800 EUR 3,395,212.05 3,376,604.00 0.21Pic Gl Bds I Usd-I Usd-Cap 125,467 USD 21,767,277.02 22,890,098.57 1.40Pictet -Qgleq -I- Eur /Cap 38,215 EUR 5,654,111.05 6,394,898.10 0.39Pictet Eur Bds /-I- Cap 31,429 EUR 18,398,214.99 19,652,239.41 1.20Pictet Eur Sh Md Ter Bd /-I- Cap 90,646 EUR 12,430,588.32 12,462,012.08 0.76Pictet Security -I Usd- /Cap 25,110 USD 4,592,767.59 6,244,759.33 0.38Pictet Usa Index /-Is Usd- Cap 52,945 USD 9,196,153.91 12,615,869.79 0.77Pim Eu Sht Acc Instclass Eur 274,850 EUR 3,364,667.36 3,320,188.00 0.20Pim Glb Hy Ac. Inst Cleur (Hed) 803,000 EUR 18,236,130.00 18,750,050.00 1.14Pim Glb Inv Inc-Inst (Hdged) Eur 348,000 EUR 4,629,769.36 4,875,480.00 0.30Pimco Gl. Inv. S. /Stock Plus /Ins 412,932 USD 10,488,726.93 12,853,138.47 0.78Pimco Glb Bd Inst Usd (Cexp) Acc 800,020 USD 21,323,625.73 22,590,783.39 1.38Pimco Glb Inv Eu Bd Accum. -I /C 365,366 EUR 8,809,075.07 9,400,867.18 0.57Pram Gl Infra Shs I Capitalis** 383,500 EUR 1,917,500.00 2,220,081.50 0.14Pram Sm Fac Eur -I- Cap** 1,263,915 EUR 6,488,186.10 6,767,000.91 0.41Pramerica Sicav Active Beta -I- Cap** 1,335,000 EUR 7,216,290.00 7,159,605.00 0.44Pramerica Sicav Be Neu -I- /Cap** 680,000 EUR 3,014,440.00 3,002,200.00 0.18Pramerica Sicav Euro Eq. I** 2,201,881 EUR 14,595,224.65 15,763,266.08 0.96Raiffeisen -Eur- Short- Rent I V 31,590 EUR 3,427,856.00 3,417,722.10 0.21Ram Sys Europ Eq-I-Cap 8,263 EUR 3,607,600.24 3,622,416.57 0.22Rbc Lux Glob Bd -O- Cap 108,300 USD 11,414,064.04 11,546,544.90 0.70Rus Invst Glb -Acc Clas B-Usd 779,181 USD 14,968,803.97 15,379,742.63 0.94Russ Wr Eq Usd -B- /Cap 455,583 USD 9,730,227.58 12,352,623.62 0.75Sisf /Qep Global Core -C- /Cap 216,502 USD 5,012,728.88 6,228,904.54 0.38Sisf Euro Corp Bond -A- Cap 596,319 EUR 13,264,795.24 13,854,279.33 0.84Sisf Japan Opport -A- Cap 260,751 JPY 3,248,461.04 3,562,771.52 0.22Ssga Emu In Eq Ic 1,166,831 EUR 13,577,448.10 14,842,673.74 0.90Ssga Ss Wo Sri Ind Eq I- Usd- Cap 487,620 USD 4,900,483.82 6,183,984.08 0.38T.R Pr Em Eq Qc Shs -Q- Cap 344,000 USD 3,702,646.43 3,971,902.71 0.24T.R Pr Glb Foc Grwth Eq -I- Cap 528,284 USD 9,536,606.34 11,995,279.87 0.73Tcw Income -Iehe- Cap 6,220 EUR 6,718,023.92 6,986,386.10 0.43Th Eq Eu Defi -J- Eur /Cap 41,306 EUR 4,169,014.58 4,297,476.24 0.26Thr L Eu St Bd /-Ie- Cap 505,572 EUR 13,930,184.05 14,737,423.80 0.90Thr L Eur Cor B Shs 2e Cap 458,184 EUR 4,575,984.00 4,788,025.16 0.29Thr Lux G Ex A- Shs -2u- Cap 1,874,203 USD 16,887,667.04 18,743,675.63 1.14Tikehau Credit Plus -I- 3d /Cap 19,500 EUR 2,409,821.62 2,413,905.00 0.15Ubam Unconstrained Bd- Eur- Ipc 32,600 EUR 3,386,775.65 3,385,510.00 0.21
Pramerica Sicav
The accompanying notes form an integral part of these financial statements.
205
Global Stars
Statement of Investmentsas at June 30, 2019 (continued)
(expressed in EUR)
** Cross Sub-Funds Investments, see Note 15, for further details.
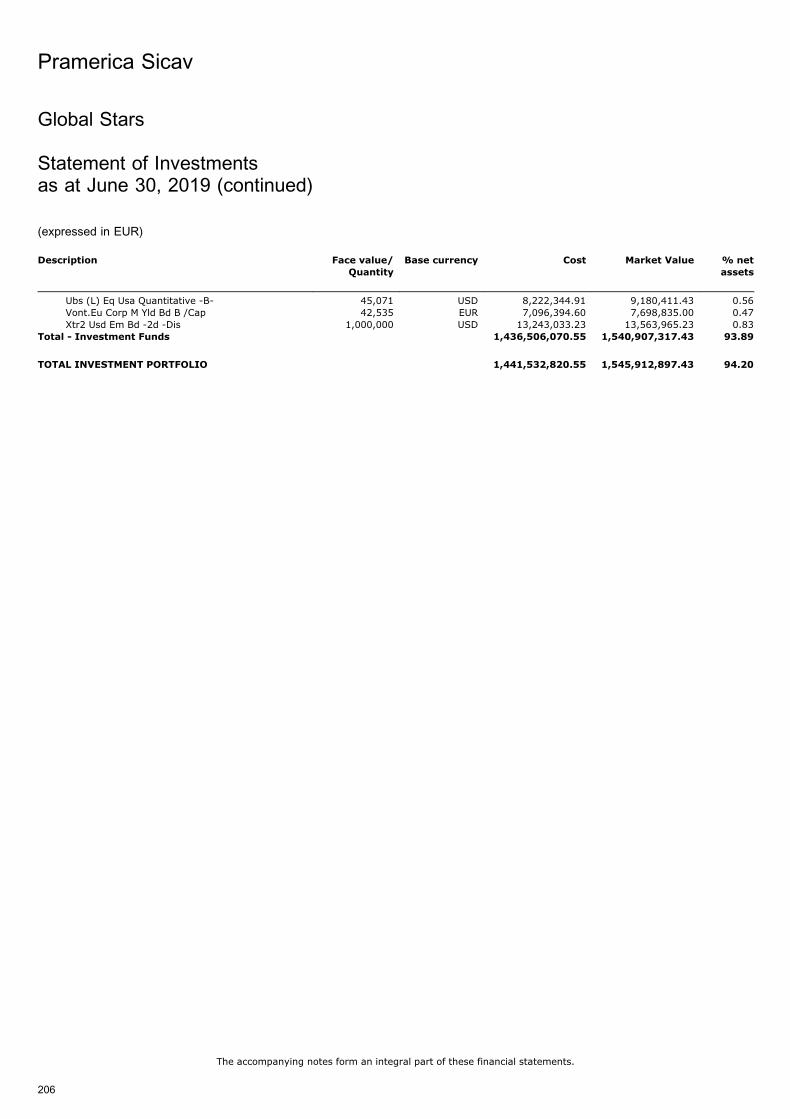
Description Face value/
Quantity
Base currency Cost Market Value % net
assets
Ubs (L) Eq Usa Quantitative -B- 45,071 USD 8,222,344.91 9,180,411.43 0.56Vont.Eu Corp M Yld Bd B /Cap 42,535 EUR 7,096,394.60 7,698,835.00 0.47Xtr2 Usd Em Bd -2d -Dis 1,000,000 USD 13,243,033.23 13,563,965.23 0.83
Total - Investment Funds 1,436,506,070.55 1,540,907,317.43 93.89
TOTAL INVESTMENT PORTFOLIO 1,441,532,820.55 1,545,912,897.43 94.20
Pramerica Sicav
The accompanying notes form an integral part of these financial statements.
206
Global Stars
Statement of Investmentsas at June 30, 2019 (continued)
(expressed in EUR)
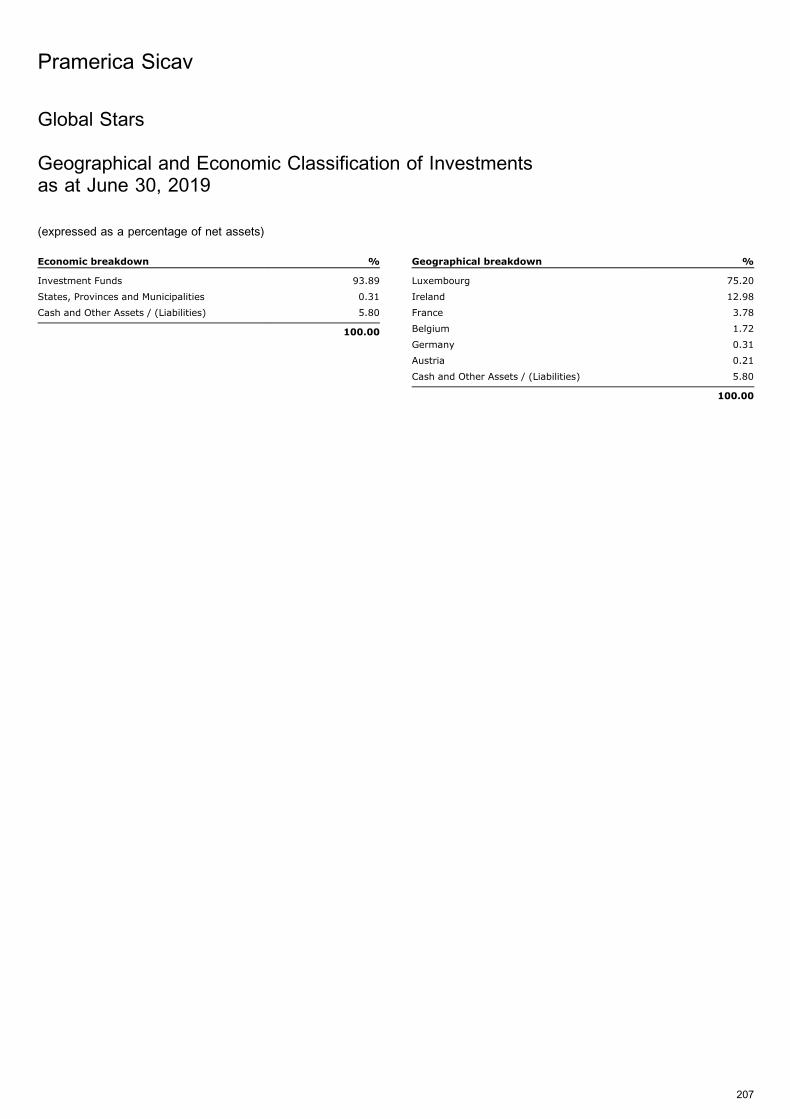
Global Stars
Geographical and Economic Classification of Investmentsas at June 30, 2019
(expressed as a percentage of net assets)
Economic breakdown %
Investment Funds 93.89
States, Provinces and Municipalities 0.31
Cash and Other Assets / (Liabilities) 5.80
100.00
Geographical breakdown %
Luxembourg 75.20
Ireland 12.98
France 3.78
Belgium 1.72
Germany 0.31
Austria 0.21
Cash and Other Assets / (Liabilities) 5.80
100.00
Pramerica Sicav
207
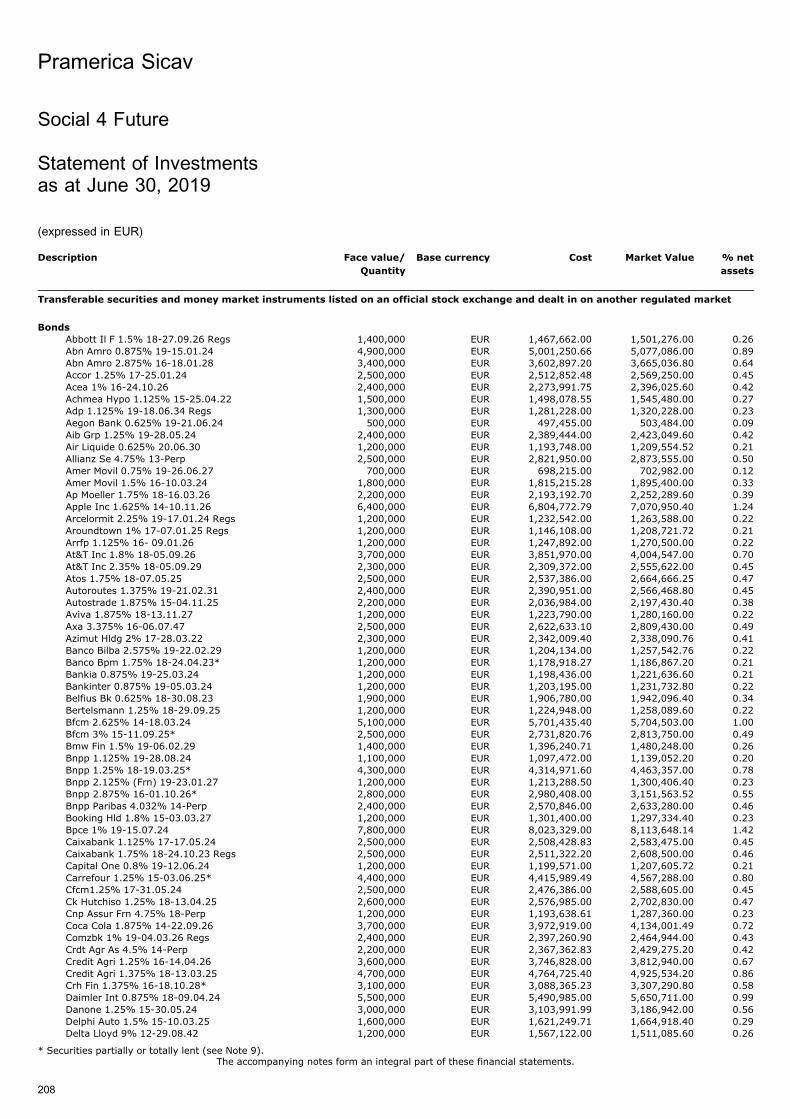
Social 4 Future
Statement of Investmentsas at June 30, 2019
(expressed in EUR)
Description Face value/
Quantity
Base currency Cost Market Value % net
assets
Transferable securities and money market instruments listed on an official stock exchange and dealt in on another regulated market
Bonds
Abbott Il F 1.5% 18-27.09.26 Regs 1,400,000 EUR 1,467,662.00 1,501,276.00 0.26Abn Amro 0.875% 19-15.01.24 4,900,000 EUR 5,001,250.66 5,077,086.00 0.89Abn Amro 2.875% 16-18.01.28 3,400,000 EUR 3,602,897.20 3,665,036.80 0.64Accor 1.25% 17-25.01.24 2,500,000 EUR 2,512,852.48 2,569,250.00 0.45Acea 1% 16-24.10.26 2,400,000 EUR 2,273,991.75 2,396,025.60 0.42Achmea Hypo 1.125% 15-25.04.22 1,500,000 EUR 1,498,078.55 1,545,480.00 0.27Adp 1.125% 19-18.06.34 Regs 1,300,000 EUR 1,281,228.00 1,320,228.00 0.23Aegon Bank 0.625% 19-21.06.24 500,000 EUR 497,455.00 503,484.00 0.09Aib Grp 1.25% 19-28.05.24 2,400,000 EUR 2,389,444.00 2,423,049.60 0.42Air Liquide 0.625% 20.06.30 1,200,000 EUR 1,193,748.00 1,209,554.52 0.21Allianz Se 4.75% 13-Perp 2,500,000 EUR 2,821,950.00 2,873,555.00 0.50Amer Movil 0.75% 19-26.06.27 700,000 EUR 698,215.00 702,982.00 0.12Amer Movil 1.5% 16-10.03.24 1,800,000 EUR 1,815,215.28 1,895,400.00 0.33Ap Moeller 1.75% 18-16.03.26 2,200,000 EUR 2,193,192.70 2,252,289.60 0.39Apple Inc 1.625% 14-10.11.26 6,400,000 EUR 6,804,772.79 7,070,950.40 1.24Arcelormit 2.25% 19-17.01.24 Regs 1,200,000 EUR 1,232,542.00 1,263,588.00 0.22Aroundtown 1% 17-07.01.25 Regs 1,200,000 EUR 1,146,108.00 1,208,721.72 0.21Arrfp 1.125% 16- 09.01.26 1,200,000 EUR 1,247,892.00 1,270,500.00 0.22At&T Inc 1.8% 18-05.09.26 3,700,000 EUR 3,851,970.00 4,004,547.00 0.70At&T Inc 2.35% 18-05.09.29 2,300,000 EUR 2,309,372.00 2,555,622.00 0.45Atos 1.75% 18-07.05.25 2,500,000 EUR 2,537,386.00 2,664,666.25 0.47Autoroutes 1.375% 19-21.02.31 2,400,000 EUR 2,390,951.00 2,566,468.80 0.45Autostrade 1.875% 15-04.11.25 2,200,000 EUR 2,036,984.00 2,197,430.40 0.38Aviva 1.875% 18-13.11.27 1,200,000 EUR 1,223,790.00 1,280,160.00 0.22Axa 3.375% 16-06.07.47 2,500,000 EUR 2,622,633.10 2,809,430.00 0.49Azimut Hldg 2% 17-28.03.22 2,300,000 EUR 2,342,009.40 2,338,090.76 0.41Banco Bilba 2.575% 19-22.02.29 1,200,000 EUR 1,204,134.00 1,257,542.76 0.22Banco Bpm 1.75% 18-24.04.23* 1,200,000 EUR 1,178,918.27 1,186,867.20 0.21Bankia 0.875% 19-25.03.24 1,200,000 EUR 1,198,436.00 1,221,636.60 0.21Bankinter 0.875% 19-05.03.24 1,200,000 EUR 1,203,195.00 1,231,732.80 0.22Belfius Bk 0.625% 18-30.08.23 1,900,000 EUR 1,906,780.00 1,942,096.40 0.34Bertelsmann 1.25% 18-29.09.25 1,200,000 EUR 1,224,948.00 1,258,089.60 0.22Bfcm 2.625% 14-18.03.24 5,100,000 EUR 5,701,435.40 5,704,503.00 1.00Bfcm 3% 15-11.09.25* 2,500,000 EUR 2,731,820.76 2,813,750.00 0.49Bmw Fin 1.5% 19-06.02.29 1,400,000 EUR 1,396,240.71 1,480,248.00 0.26Bnpp 1.125% 19-28.08.24 1,100,000 EUR 1,097,472.00 1,139,052.20 0.20Bnpp 1.25% 18-19.03.25* 4,300,000 EUR 4,314,971.60 4,463,357.00 0.78Bnpp 2.125% (Frn) 19-23.01.27 1,200,000 EUR 1,213,288.50 1,300,406.40 0.23Bnpp 2.875% 16-01.10.26* 2,800,000 EUR 2,980,408.00 3,151,563.52 0.55Bnpp Paribas 4.032% 14-Perp 2,400,000 EUR 2,570,846.00 2,633,280.00 0.46Booking Hld 1.8% 15-03.03.27 1,200,000 EUR 1,301,400.00 1,297,334.40 0.23Bpce 1% 19-15.07.24 7,800,000 EUR 8,023,329.00 8,113,648.14 1.42Caixabank 1.125% 17-17.05.24 2,500,000 EUR 2,508,428.83 2,583,475.00 0.45Caixabank 1.75% 18-24.10.23 Regs 2,500,000 EUR 2,511,322.20 2,608,500.00 0.46Capital One 0.8% 19-12.06.24 1,200,000 EUR 1,199,571.00 1,207,605.72 0.21Carrefour 1.25% 15-03.06.25* 4,400,000 EUR 4,415,989.49 4,567,288.00 0.80Cfcm1.25% 17-31.05.24 2,500,000 EUR 2,476,386.00 2,588,605.00 0.45Ck Hutchiso 1.25% 18-13.04.25 2,600,000 EUR 2,576,985.00 2,702,830.00 0.47Cnp Assur Frn 4.75% 18-Perp 1,200,000 EUR 1,193,638.61 1,287,360.00 0.23Coca Cola 1.875% 14-22.09.26 3,700,000 EUR 3,972,919.00 4,134,001.49 0.72Comzbk 1% 19-04.03.26 Regs 2,400,000 EUR 2,397,260.90 2,464,944.00 0.43Crdt Agr As 4.5% 14-Perp 2,200,000 EUR 2,367,362.83 2,429,275.20 0.42Credit Agri 1.25% 16-14.04.26 3,600,000 EUR 3,746,828.00 3,812,940.00 0.67Credit Agri 1.375% 18-13.03.25 4,700,000 EUR 4,764,725.40 4,925,534.20 0.86Crh Fin 1.375% 16-18.10.28* 3,100,000 EUR 3,088,365.23 3,307,290.80 0.58Daimler Int 0.875% 18-09.04.24 5,500,000 EUR 5,490,985.00 5,650,711.00 0.99Danone 1.25% 15-30.05.24 3,000,000 EUR 3,103,991.99 3,186,942.00 0.56Delphi Auto 1.5% 15-10.03.25 1,600,000 EUR 1,621,249.71 1,664,918.40 0.29Delta Lloyd 9% 12-29.08.42 1,200,000 EUR 1,567,122.00 1,511,085.60 0.26
Pramerica Sicav
The accompanying notes form an integral part of these financial statements.
208
* Securities partially or totally lent (see Note 9).
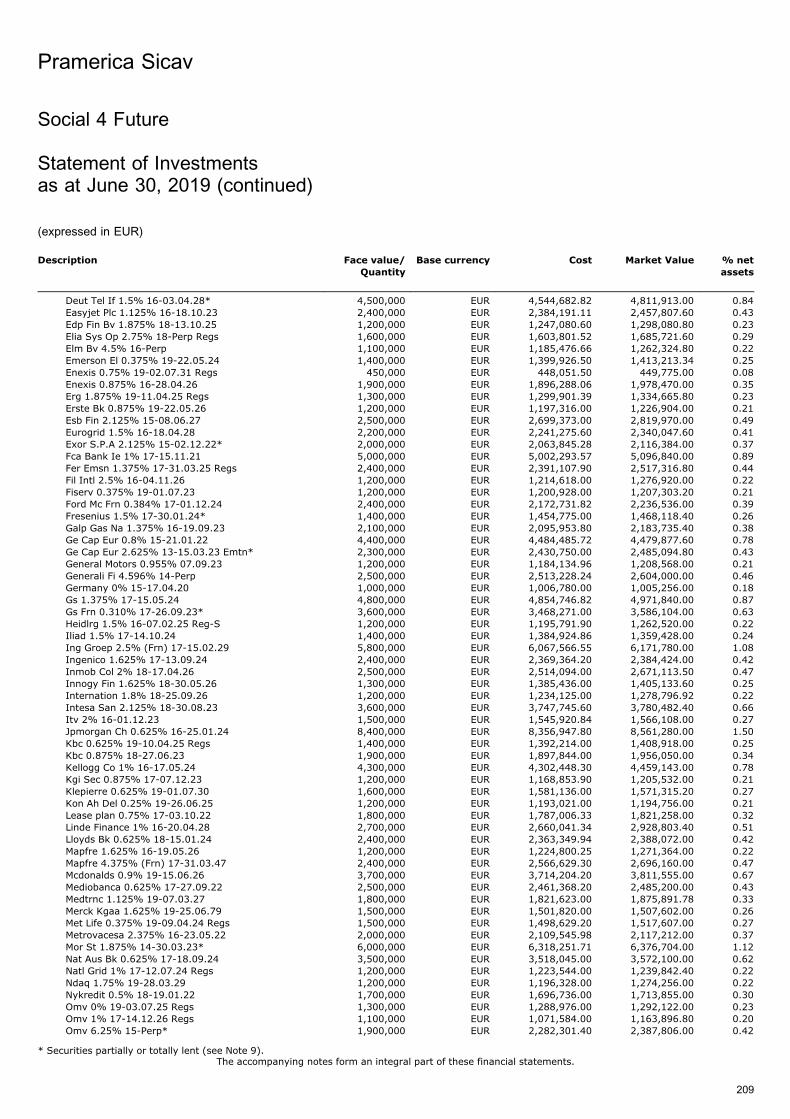
Description Face value/
Quantity
Base currency Cost Market Value % net
assets
Deut Tel If 1.5% 16-03.04.28* 4,500,000 EUR 4,544,682.82 4,811,913.00 0.84Easyjet Plc 1.125% 16-18.10.23 2,400,000 EUR 2,384,191.11 2,457,807.60 0.43Edp Fin Bv 1.875% 18-13.10.25 1,200,000 EUR 1,247,080.60 1,298,080.80 0.23Elia Sys Op 2.75% 18-Perp Regs 1,600,000 EUR 1,603,801.52 1,685,721.60 0.29Elm Bv 4.5% 16-Perp 1,100,000 EUR 1,185,476.66 1,262,324.80 0.22Emerson El 0.375% 19-22.05.24 1,400,000 EUR 1,399,926.50 1,413,213.34 0.25Enexis 0.75% 19-02.07.31 Regs 450,000 EUR 448,051.50 449,775.00 0.08Enexis 0.875% 16-28.04.26 1,900,000 EUR 1,896,288.06 1,978,470.00 0.35Erg 1.875% 19-11.04.25 Regs 1,300,000 EUR 1,299,901.39 1,334,665.80 0.23Erste Bk 0.875% 19-22.05.26 1,200,000 EUR 1,197,316.00 1,226,904.00 0.21Esb Fin 2.125% 15-08.06.27 2,500,000 EUR 2,699,373.00 2,819,970.00 0.49Eurogrid 1.5% 16-18.04.28 2,200,000 EUR 2,241,275.60 2,340,047.60 0.41Exor S.P.A 2.125% 15-02.12.22* 2,000,000 EUR 2,063,845.28 2,116,384.00 0.37Fca Bank Ie 1% 17-15.11.21 5,000,000 EUR 5,002,293.57 5,096,840.00 0.89Fer Emsn 1.375% 17-31.03.25 Regs 2,400,000 EUR 2,391,107.90 2,517,316.80 0.44Fil Intl 2.5% 16-04.11.26 1,200,000 EUR 1,214,618.00 1,276,920.00 0.22Fiserv 0.375% 19-01.07.23 1,200,000 EUR 1,200,928.00 1,207,303.20 0.21Ford Mc Frn 0.384% 17-01.12.24 2,400,000 EUR 2,172,731.82 2,236,536.00 0.39Fresenius 1.5% 17-30.01.24* 1,400,000 EUR 1,454,775.00 1,468,118.40 0.26Galp Gas Na 1.375% 16-19.09.23 2,100,000 EUR 2,095,953.80 2,183,735.40 0.38Ge Cap Eur 0.8% 15-21.01.22 4,400,000 EUR 4,484,485.72 4,479,877.60 0.78Ge Cap Eur 2.625% 13-15.03.23 Emtn* 2,300,000 EUR 2,430,750.00 2,485,094.80 0.43General Motors 0.955% 07.09.23 1,200,000 EUR 1,184,134.96 1,208,568.00 0.21Generali Fi 4.596% 14-Perp 2,500,000 EUR 2,513,228.24 2,604,000.00 0.46Germany 0% 15-17.04.20 1,000,000 EUR 1,006,780.00 1,005,256.00 0.18Gs 1.375% 17-15.05.24 4,800,000 EUR 4,854,746.82 4,971,840.00 0.87Gs Frn 0.310% 17-26.09.23* 3,600,000 EUR 3,468,271.00 3,586,104.00 0.63Heidlrg 1.5% 16-07.02.25 Reg-S 1,200,000 EUR 1,195,791.90 1,262,520.00 0.22Iliad 1.5% 17-14.10.24 1,400,000 EUR 1,384,924.86 1,359,428.00 0.24Ing Groep 2.5% (Frn) 17-15.02.29 5,800,000 EUR 6,067,566.55 6,171,780.00 1.08Ingenico 1.625% 17-13.09.24 2,400,000 EUR 2,369,364.20 2,384,424.00 0.42Inmob Col 2% 18-17.04.26 2,500,000 EUR 2,514,094.00 2,671,113.50 0.47Innogy Fin 1.625% 18-30.05.26 1,300,000 EUR 1,385,436.00 1,405,133.60 0.25Internation 1.8% 18-25.09.26 1,200,000 EUR 1,234,125.00 1,278,796.92 0.22Intesa San 2.125% 18-30.08.23 3,600,000 EUR 3,747,745.60 3,780,482.40 0.66Itv 2% 16-01.12.23 1,500,000 EUR 1,545,920.84 1,566,108.00 0.27Jpmorgan Ch 0.625% 16-25.01.24 8,400,000 EUR 8,356,947.80 8,561,280.00 1.50Kbc 0.625% 19-10.04.25 Regs 1,400,000 EUR 1,392,214.00 1,408,918.00 0.25Kbc 0.875% 18-27.06.23 1,900,000 EUR 1,897,844.00 1,956,050.00 0.34Kellogg Co 1% 16-17.05.24 4,300,000 EUR 4,302,448.30 4,459,143.00 0.78Kgi Sec 0.875% 17-07.12.23 1,200,000 EUR 1,168,853.90 1,205,532.00 0.21Klepierre 0.625% 19-01.07.30 1,600,000 EUR 1,581,136.00 1,571,315.20 0.27Kon Ah Del 0.25% 19-26.06.25 1,200,000 EUR 1,193,021.00 1,194,756.00 0.21Lease plan 0.75% 17-03.10.22 1,800,000 EUR 1,787,006.33 1,821,258.00 0.32Linde Finance 1% 16-20.04.28 2,700,000 EUR 2,660,041.34 2,928,803.40 0.51Lloyds Bk 0.625% 18-15.01.24 2,400,000 EUR 2,363,349.94 2,388,072.00 0.42Mapfre 1.625% 16-19.05.26 1,200,000 EUR 1,224,800.25 1,271,364.00 0.22Mapfre 4.375% (Frn) 17-31.03.47 2,400,000 EUR 2,566,629.30 2,696,160.00 0.47Mcdonalds 0.9% 19-15.06.26 3,700,000 EUR 3,714,204.20 3,811,555.00 0.67Mediobanca 0.625% 17-27.09.22 2,500,000 EUR 2,461,368.20 2,485,200.00 0.43Medtrnc 1.125% 19-07.03.27 1,800,000 EUR 1,821,623.00 1,875,891.78 0.33Merck Kgaa 1.625% 19-25.06.79 1,500,000 EUR 1,501,820.00 1,507,602.00 0.26Met Life 0.375% 19-09.04.24 Regs 1,500,000 EUR 1,498,629.20 1,517,607.00 0.27Metrovacesa 2.375% 16-23.05.22 2,000,000 EUR 2,109,545.98 2,117,212.00 0.37Mor St 1.875% 14-30.03.23* 6,000,000 EUR 6,318,251.71 6,376,704.00 1.12Nat Aus Bk 0.625% 17-18.09.24 3,500,000 EUR 3,518,045.00 3,572,100.00 0.62Natl Grid 1% 17-12.07.24 Regs 1,200,000 EUR 1,223,544.00 1,239,842.40 0.22Ndaq 1.75% 19-28.03.29 1,200,000 EUR 1,196,328.00 1,274,256.00 0.22Nykredit 0.5% 18-19.01.22 1,700,000 EUR 1,696,736.00 1,713,855.00 0.30Omv 0% 19-03.07.25 Regs 1,300,000 EUR 1,288,976.00 1,292,122.00 0.23Omv 1% 17-14.12.26 Regs 1,100,000 EUR 1,071,584.00 1,163,896.80 0.20Omv 6.25% 15-Perp* 1,900,000 EUR 2,282,301.40 2,387,806.00 0.42
Pramerica Sicav
The accompanying notes form an integral part of these financial statements.
209
Social 4 Future
Statement of Investmentsas at June 30, 2019 (continued)
(expressed in EUR)
* Securities partially or totally lent (see Note 9).
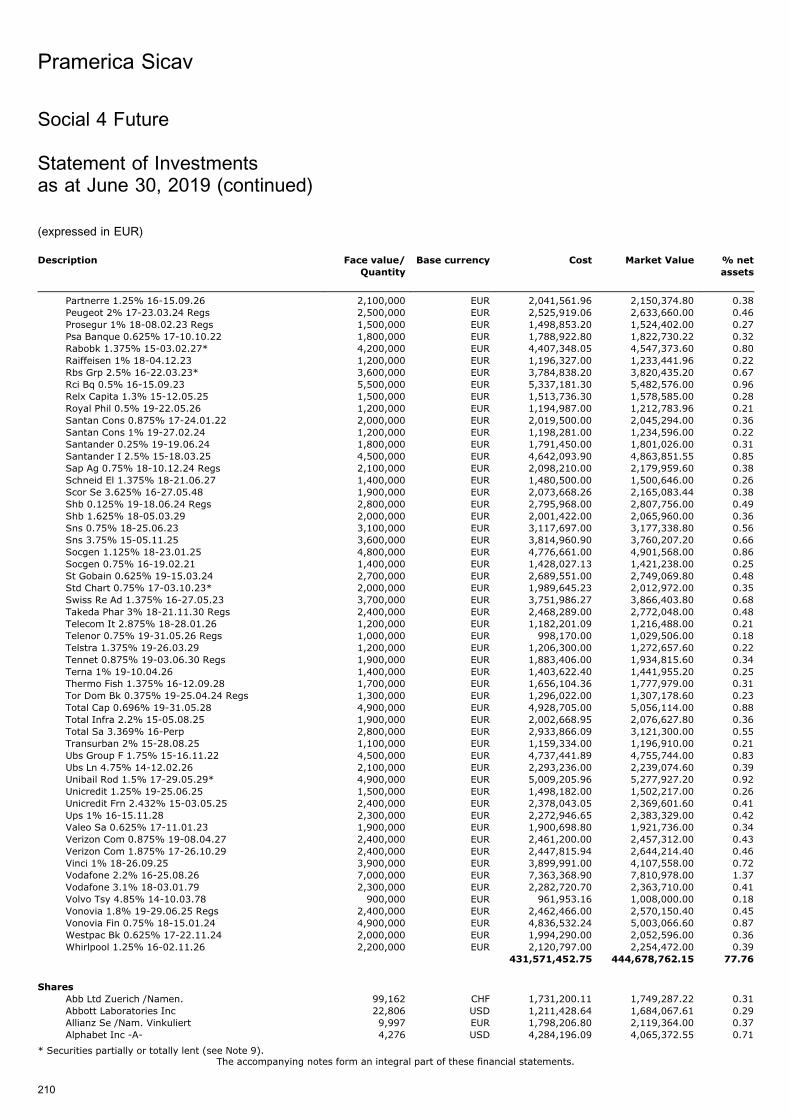
Description Face value/
Quantity
Base currency Cost Market Value % net
assets
Partnerre 1.25% 16-15.09.26 2,100,000 EUR 2,041,561.96 2,150,374.80 0.38Peugeot 2% 17-23.03.24 Regs 2,500,000 EUR 2,525,919.06 2,633,660.00 0.46Prosegur 1% 18-08.02.23 Regs 1,500,000 EUR 1,498,853.20 1,524,402.00 0.27Psa Banque 0.625% 17-10.10.22 1,800,000 EUR 1,788,922.80 1,822,730.22 0.32Rabobk 1.375% 15-03.02.27* 4,200,000 EUR 4,407,348.05 4,547,373.60 0.80Raiffeisen 1% 18-04.12.23 1,200,000 EUR 1,196,327.00 1,233,441.96 0.22Rbs Grp 2.5% 16-22.03.23* 3,600,000 EUR 3,784,838.20 3,820,435.20 0.67Rci Bq 0.5% 16-15.09.23 5,500,000 EUR 5,337,181.30 5,482,576.00 0.96Relx Capita 1.3% 15-12.05.25 1,500,000 EUR 1,513,736.30 1,578,585.00 0.28Royal Phil 0.5% 19-22.05.26 1,200,000 EUR 1,194,987.00 1,212,783.96 0.21Santan Cons 0.875% 17-24.01.22 2,000,000 EUR 2,019,500.00 2,045,294.00 0.36Santan Cons 1% 19-27.02.24 1,200,000 EUR 1,198,281.00 1,234,596.00 0.22Santander 0.25% 19-19.06.24 1,800,000 EUR 1,791,450.00 1,801,026.00 0.31Santander I 2.5% 15-18.03.25 4,500,000 EUR 4,642,093.90 4,863,851.55 0.85Sap Ag 0.75% 18-10.12.24 Regs 2,100,000 EUR 2,098,210.00 2,179,959.60 0.38Schneid El 1.375% 18-21.06.27 1,400,000 EUR 1,480,500.00 1,500,646.00 0.26Scor Se 3.625% 16-27.05.48 1,900,000 EUR 2,073,668.26 2,165,083.44 0.38Shb 0.125% 19-18.06.24 Regs 2,800,000 EUR 2,795,968.00 2,807,756.00 0.49Shb 1.625% 18-05.03.29 2,000,000 EUR 2,001,422.00 2,065,960.00 0.36Sns 0.75% 18-25.06.23 3,100,000 EUR 3,117,697.00 3,177,338.80 0.56Sns 3.75% 15-05.11.25 3,600,000 EUR 3,814,960.90 3,760,207.20 0.66Socgen 1.125% 18-23.01.25 4,800,000 EUR 4,776,661.00 4,901,568.00 0.86Socgen 0.75% 16-19.02.21 1,400,000 EUR 1,428,027.13 1,421,238.00 0.25St Gobain 0.625% 19-15.03.24 2,700,000 EUR 2,689,551.00 2,749,069.80 0.48Std Chart 0.75% 17-03.10.23* 2,000,000 EUR 1,989,645.23 2,012,972.00 0.35Swiss Re Ad 1.375% 16-27.05.23 3,700,000 EUR 3,751,986.27 3,866,403.80 0.68Takeda Phar 3% 18-21.11.30 Regs 2,400,000 EUR 2,468,289.00 2,772,048.00 0.48Telecom It 2.875% 18-28.01.26 1,200,000 EUR 1,182,201.09 1,216,488.00 0.21Telenor 0.75% 19-31.05.26 Regs 1,000,000 EUR 998,170.00 1,029,506.00 0.18Telstra 1.375% 19-26.03.29 1,200,000 EUR 1,206,300.00 1,272,657.60 0.22Tennet 0.875% 19-03.06.30 Regs 1,900,000 EUR 1,883,406.00 1,934,815.60 0.34Terna 1% 19-10.04.26 1,400,000 EUR 1,403,622.40 1,441,955.20 0.25Thermo Fish 1.375% 16-12.09.28 1,700,000 EUR 1,656,104.36 1,777,979.00 0.31Tor Dom Bk 0.375% 19-25.04.24 Regs 1,300,000 EUR 1,296,022.00 1,307,178.60 0.23Total Cap 0.696% 19-31.05.28 4,900,000 EUR 4,928,705.00 5,056,114.00 0.88Total Infra 2.2% 15-05.08.25 1,900,000 EUR 2,002,668.95 2,076,627.80 0.36Total Sa 3.369% 16-Perp 2,800,000 EUR 2,933,866.09 3,121,300.00 0.55Transurban 2% 15-28.08.25 1,100,000 EUR 1,159,334.00 1,196,910.00 0.21Ubs Group F 1.75% 15-16.11.22 4,500,000 EUR 4,737,441.89 4,755,744.00 0.83Ubs Ln 4.75% 14-12.02.26 2,100,000 EUR 2,293,236.00 2,239,074.60 0.39Unibail Rod 1.5% 17-29.05.29* 4,900,000 EUR 5,009,205.96 5,277,927.20 0.92Unicredit 1.25% 19-25.06.25 1,500,000 EUR 1,498,182.00 1,502,217.00 0.26Unicredit Frn 2.432% 15-03.05.25 2,400,000 EUR 2,378,043.05 2,369,601.60 0.41Ups 1% 16-15.11.28 2,300,000 EUR 2,272,946.65 2,383,329.00 0.42Valeo Sa 0.625% 17-11.01.23 1,900,000 EUR 1,900,698.80 1,921,736.00 0.34Verizon Com 0.875% 19-08.04.27 2,400,000 EUR 2,461,200.00 2,457,312.00 0.43Verizon Com 1.875% 17-26.10.29 2,400,000 EUR 2,447,815.94 2,644,214.40 0.46Vinci 1% 18-26.09.25 3,900,000 EUR 3,899,991.00 4,107,558.00 0.72Vodafone 2.2% 16-25.08.26 7,000,000 EUR 7,363,368.90 7,810,978.00 1.37Vodafone 3.1% 18-03.01.79 2,300,000 EUR 2,282,720.70 2,363,710.00 0.41Volvo Tsy 4.85% 14-10.03.78 900,000 EUR 961,953.16 1,008,000.00 0.18Vonovia 1.8% 19-29.06.25 Regs 2,400,000 EUR 2,462,466.00 2,570,150.40 0.45Vonovia Fin 0.75% 18-15.01.24 4,900,000 EUR 4,836,532.24 5,003,066.60 0.87Westpac Bk 0.625% 17-22.11.24 2,000,000 EUR 1,994,290.00 2,052,596.00 0.36Whirlpool 1.25% 16-02.11.26 2,200,000 EUR 2,120,797.00 2,254,472.00 0.39
431,571,452.75 444,678,762.15 77.76
Shares
Abb Ltd Zuerich /Namen. 99,162 CHF 1,731,200.11 1,749,287.22 0.31Abbott Laboratories Inc 22,806 USD 1,211,428.64 1,684,067.61 0.29Allianz Se /Nam. Vinkuliert 9,997 EUR 1,798,206.80 2,119,364.00 0.37Alphabet Inc -A- 4,276 USD 4,284,196.09 4,065,372.55 0.71
Pramerica Sicav
The accompanying notes form an integral part of these financial statements.
210
Social 4 Future
Statement of Investmentsas at June 30, 2019 (continued)
(expressed in EUR)
* Securities partially or totally lent (see Note 9).
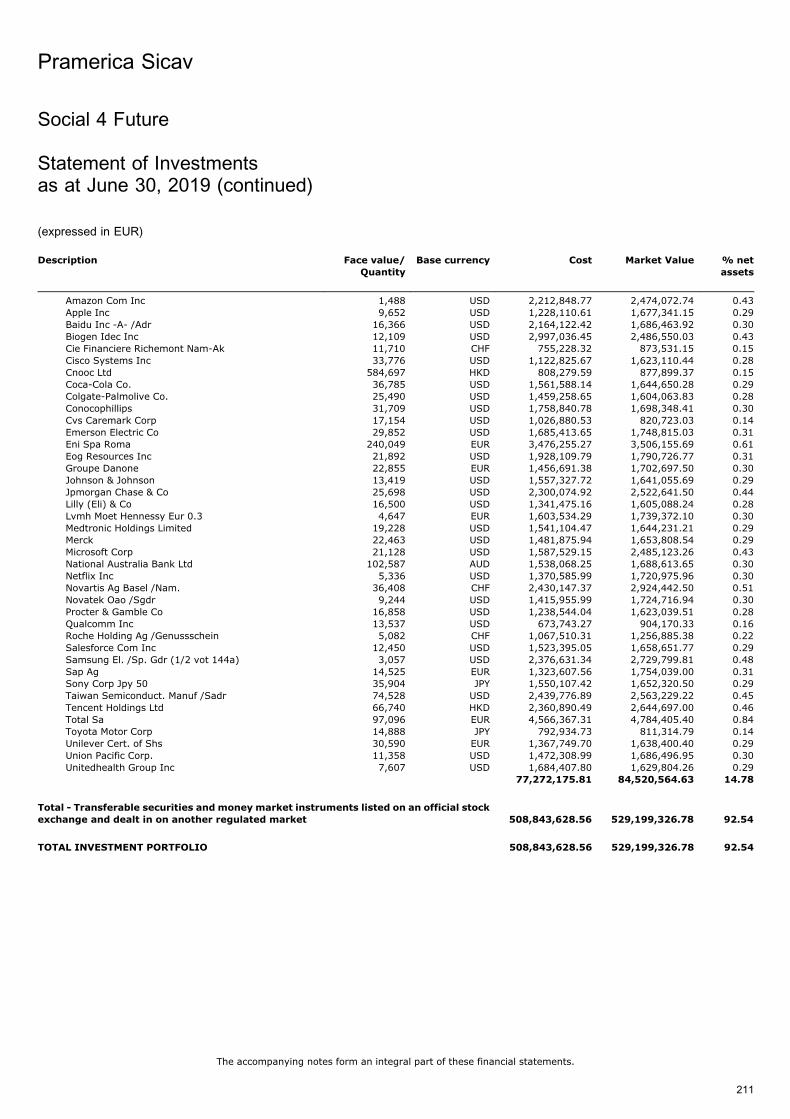
Description Face value/
Quantity
Base currency Cost Market Value % net
assets
Amazon Com Inc 1,488 USD 2,212,848.77 2,474,072.74 0.43Apple Inc 9,652 USD 1,228,110.61 1,677,341.15 0.29Baidu Inc -A- /Adr 16,366 USD 2,164,122.42 1,686,463.92 0.30Biogen Idec Inc 12,109 USD 2,997,036.45 2,486,550.03 0.43Cie Financiere Richemont Nam-Ak 11,710 CHF 755,228.32 873,531.15 0.15Cisco Systems Inc 33,776 USD 1,122,825.67 1,623,110.44 0.28Cnooc Ltd 584,697 HKD 808,279.59 877,899.37 0.15Coca-Cola Co. 36,785 USD 1,561,588.14 1,644,650.28 0.29Colgate-Palmolive Co. 25,490 USD 1,459,258.65 1,604,063.83 0.28Conocophillips 31,709 USD 1,758,840.78 1,698,348.41 0.30Cvs Caremark Corp 17,154 USD 1,026,880.53 820,723.03 0.14Emerson Electric Co 29,852 USD 1,685,413.65 1,748,815.03 0.31Eni Spa Roma 240,049 EUR 3,476,255.27 3,506,155.69 0.61Eog Resources Inc 21,892 USD 1,928,109.79 1,790,726.77 0.31Groupe Danone 22,855 EUR 1,456,691.38 1,702,697.50 0.30Johnson & Johnson 13,419 USD 1,557,327.72 1,641,055.69 0.29Jpmorgan Chase & Co 25,698 USD 2,300,074.92 2,522,641.50 0.44Lilly (Eli) & Co 16,500 USD 1,341,475.16 1,605,088.24 0.28Lvmh Moet Hennessy Eur 0.3 4,647 EUR 1,603,534.29 1,739,372.10 0.30Medtronic Holdings Limited 19,228 USD 1,541,104.47 1,644,231.21 0.29Merck 22,463 USD 1,481,875.94 1,653,808.54 0.29Microsoft Corp 21,128 USD 1,587,529.15 2,485,123.26 0.43National Australia Bank Ltd 102,587 AUD 1,538,068.25 1,688,613.65 0.30Netflix Inc 5,336 USD 1,370,585.99 1,720,975.96 0.30Novartis Ag Basel /Nam. 36,408 CHF 2,430,147.37 2,924,442.50 0.51Novatek Oao /Sgdr 9,244 USD 1,415,955.99 1,724,716.94 0.30Procter & Gamble Co 16,858 USD 1,238,544.04 1,623,039.51 0.28Qualcomm Inc 13,537 USD 673,743.27 904,170.33 0.16Roche Holding Ag /Genussschein 5,082 CHF 1,067,510.31 1,256,885.38 0.22Salesforce Com Inc 12,450 USD 1,523,395.05 1,658,651.77 0.29Samsung El. /Sp. Gdr (1/2 vot 144a) 3,057 USD 2,376,631.34 2,729,799.81 0.48Sap Ag 14,525 EUR 1,323,607.56 1,754,039.00 0.31Sony Corp Jpy 50 35,904 JPY 1,550,107.42 1,652,320.50 0.29Taiwan Semiconduct. Manuf /Sadr 74,528 USD 2,439,776.89 2,563,229.22 0.45Tencent Holdings Ltd 66,740 HKD 2,360,890.49 2,644,697.00 0.46Total Sa 97,096 EUR 4,566,367.31 4,784,405.40 0.84Toyota Motor Corp 14,888 JPY 792,934.73 811,314.79 0.14Unilever Cert. of Shs 30,590 EUR 1,367,749.70 1,638,400.40 0.29Union Pacific Corp. 11,358 USD 1,472,308.99 1,686,496.95 0.30Unitedhealth Group Inc 7,607 USD 1,684,407.80 1,629,804.26 0.29
77,272,175.81 84,520,564.63 14.78
Total - Transferable securities and money market instruments listed on an official stock
exchange and dealt in on another regulated market 508,843,628.56 529,199,326.78 92.54
TOTAL INVESTMENT PORTFOLIO 508,843,628.56 529,199,326.78 92.54
Pramerica Sicav
The accompanying notes form an integral part of these financial statements.
211
Social 4 Future
Statement of Investmentsas at June 30, 2019 (continued)
(expressed in EUR)
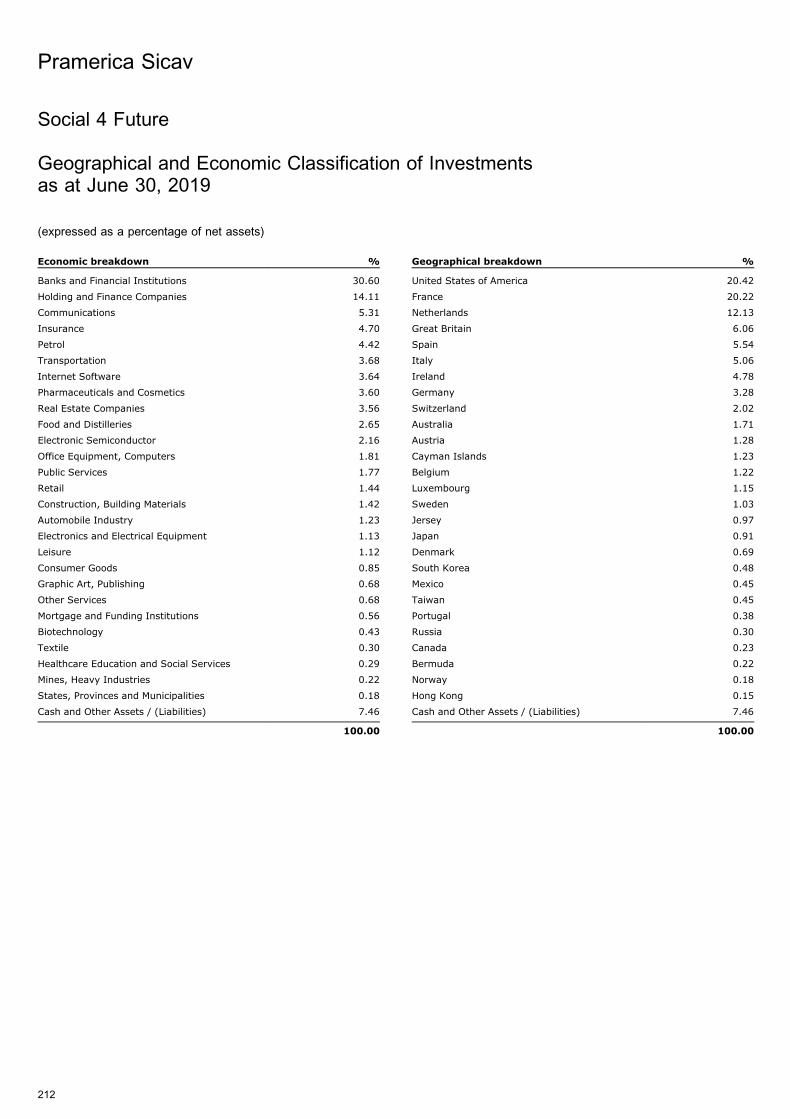
Social 4 Future
Geographical and Economic Classification of Investmentsas at June 30, 2019
(expressed as a percentage of net assets)
Economic breakdown %
Banks and Financial Institutions 30.60
Holding and Finance Companies 14.11
Communications 5.31
Insurance 4.70
Petrol 4.42
Transportation 3.68
Internet Software 3.64
Pharmaceuticals and Cosmetics 3.60
Real Estate Companies 3.56
Food and Distilleries 2.65
Electronic Semiconductor 2.16
Office Equipment, Computers 1.81
Public Services 1.77
Retail 1.44
Construction, Building Materials 1.42
Automobile Industry 1.23
Electronics and Electrical Equipment 1.13
Leisure 1.12
Consumer Goods 0.85
Graphic Art, Publishing 0.68
Other Services 0.68
Mortgage and Funding Institutions 0.56
Biotechnology 0.43
Textile 0.30
Healthcare Education and Social Services 0.29
Mines, Heavy Industries 0.22
States, Provinces and Municipalities 0.18
Cash and Other Assets / (Liabilities) 7.46
100.00
Geographical breakdown %
United States of America 20.42
France 20.22
Netherlands 12.13
Great Britain 6.06
Spain 5.54
Italy 5.06
Ireland 4.78
Germany 3.28
Switzerland 2.02
Australia 1.71
Austria 1.28
Cayman Islands 1.23
Belgium 1.22
Luxembourg 1.15
Sweden 1.03
Jersey 0.97
Japan 0.91
Denmark 0.69
South Korea 0.48
Mexico 0.45
Taiwan 0.45
Portugal 0.38
Russia 0.30
Canada 0.23
Bermuda 0.22
Norway 0.18
Hong Kong 0.15
Cash and Other Assets / (Liabilities) 7.46
100.00
Pramerica Sicav
212

Global Multiasset 15
Statement of Investmentsas at June 30, 2019
(expressed in EUR)
Description Face value/
Quantity
Base currency Cost Market Value % net
assets
Transferable securities and money market instruments listed on an official stock exchange and dealt in on another regulated market
Bonds
Italy 0% 18-27.11.20 /Ctz 21,514,000 EUR 21,361,896.02 21,480,007.88 2.19Italy 0% 19-14.04.20 Bot 10,793,000 EUR 10,782,609.15 10,797,903.26 1.10Italy 0.7% 15-01.05.20 /Btp 10,688,000 EUR 10,745,073.92 10,752,683.78 1.09Italy 3.75% 13-01.05.21 /Btp 18,000,000 EUR 19,447,297.86 19,152,180.00 1.95Italy 4.5% 04-01.02.20 /Btp 10,327,000 EUR 10,675,329.71 10,601,078.58 1.08USA 0.875% 12-31.07.19 Tbo 5,500,000 USD 4,793,033.00 4,823,735.76 0.49USA 2.375% 18-30.04.20 /Tbo* 38,670,000 USD 33,415,002.38 34,053,286.18 3.46
111,220,242.04 111,660,875.44 11.36
Total - Transferable securities and money market instruments listed on an officialstock exchange and dealt in on another regulated market 111,220,242.04 111,660,875.44 11.36
Investment Funds
Ag 10-15 U Etf -C- Eur 56,478 EUR 15,411,089.26 17,058,050.34 1.74Ag 7-10 Uc Etf -C- Eur 15,238 EUR 3,853,619.49 4,163,326.36 0.42Agr 3-5 Us Etf - Parts C 12,381 EUR 2,475,603.77 2,520,647.79 0.26Am Is Fr Ec 1-3-Ucits Etf- Cap 281,672 EUR 28,632,884.19 28,438,421.97 2.89Am Is Fr Usd C -Ucits Etf- Cap 25,785 USD 2,256,544.72 2,452,167.31 0.25Am Is Jpmggg Ucits Etf -Dr- Eur /Cap 192,551 EUR 9,114,301.35 9,874,015.28 1.01Am Is M Em M -Ucits Etf Eur C- Cap* 2,736,944 EUR 10,403,691.47 11,264,987.81 1.15Am Is M Jap-Ucits Etf Dr- Cap 6,357 EUR 1,213,668.90 1,183,887.00 0.12Am Is Mpexj-Ucits Etf Dr- Cap 1,148 EUR 614,743.32 646,668.40 0.07Am Is S&P 500-Ucits Etf Eur C- Cap 94,396 EUR 3,904,473.43 4,402,638.88 0.45Am Is St E 600-Ucits Etf Eur C 101,664 EUR 7,466,472.64 8,459,278.44 0.86Amundi Gr 5-7 Uc Etf -C Eur 8,456 EUR 1,945,440.25 2,029,186.32 0.21B E Se 600 U Et -C- Eur 921,841 EUR 9,466,108.68 9,660,893.68 0.98B E Sp 500 U Etf C E Act C Eur- 288,260 EUR 3,052,442.79 3,437,759.93 0.35Blackrock Ir-Ish Msci Fe Ex-Jp 101,941 EUR 4,914,616.39 4,811,615.20 0.49Cs Etf Eur 1-3 /Eur 128,112 EUR 14,323,768.40 14,374,166.40 1.46Cs Etf Msci Pac Ex Japan Usd 6,564 EUR 857,509.14 902,550.00 0.09Db X Tracker Msci Ap Ex Jp 11,377 EUR 614,127.05 645,530.98 0.07Dbx Hy Bond Eur -1c- /Cap 111,094 EUR 1,893,873.32 1,910,094.69 0.19Dbxt Es50 — Shs -Ic- Cap 181,005 EUR 13,203,822.78 15,048,755.70 1.53Dbxt Msci Ac Aj - Shs -1c- Cap 37,384 EUR 1,471,688.45 1,450,312.28 0.15Dbxt Msci Em Shs -1c- Cap 121,793 EUR 4,459,392.44 4,830,310.38 0.49Dbxt Msci Jap Shs -1c- Cap 46,588 EUR 2,278,456.47 2,374,124.48 0.24Dbxt S&P 500 — Shs -1c- Cap 93,211 EUR 3,906,454.37 4,396,762.87 0.45Dbxt2 Ec Bd -1c- Cap 114,958 EUR 17,605,823.03 18,244,984.18 1.86Dbxt2 Gl Su -5c- Eur /Cap 71,522 EUR 16,401,951.64 17,730,303.80 1.80Dbxt2 Iese 35Tr -1c- /Cap /Etf 18,375 EUR 3,706,540.85 3,789,660.00 0.39Dbxt2 Iese13Tr -1c- /Cap. /Etf 85,051 EUR 14,349,297.86 14,377,021.04 1.46Dbxt2 Ise57 -1c- Cap 24,947 EUR 5,827,136.79 6,073,097.68 0.62Dbxt2 Ise710 -1c- Cap 14,945 EUR 3,845,047.05 4,158,595.70 0.42Dj Stoxx 600 -A- Etf Eur 73,391 EUR 5,280,344.80 6,029,070.65 0.61Fondo It Per Leff En Sgr Spa 3,000 EUR 2,596,464.16 2,842,032.00 0.29Ishare Eu Govt Bond 7-10 Etf 43,181 EUR 9,030,635.43 9,640,158.25 0.98Ishares Bc Eur Cor /Dis 703,318 EUR 91,638,727.40 94,202,412.92 9.59Ishares Bc Eur Gvt Bd /Dis 67,763 EUR 15,504,355.33 17,504,538.16 1.78Ishares Eur Govt Bd 3-5yr Etf 72,507 EUR 12,332,157.36 12,580,689.57 1.28Ishares Gl High Yld Crp Bd Usd Etf 151,426 USD 12,515,513.26 12,903,009.46 1.31Ishares Jpm Usd Em Bducits Etf 27,602 USD 2,727,519.23 2,733,702.08 0.28Ishares Msci Japan 72,941 EUR 880,877.51 888,713.14 0.09Ishares Plc-Usd Corp Bond* 330,640 EUR 33,601,323.94 34,535,348.00 3.51Ishares Stoxx Europe 600 (De) 390,559 EUR 14,315,283.83 14,952,551.32 1.52Ishares Usd Hgh Yd Etf-Usd /Dis 93,792 USD 8,234,126.25 8,479,734.72 0.86Ishares Vi Glb Cor-Usd Etf 623,902 USD 52,314,211.98 54,996,961.30 5.60Ishs Bar Gov Eur /Dist 25,076 EUR 3,893,346.89 4,045,260.32 0.41
Pramerica Sicav
The accompanying notes form an integral part of these financial statements.
213
* Securities partially or totally lent (see Note 9).
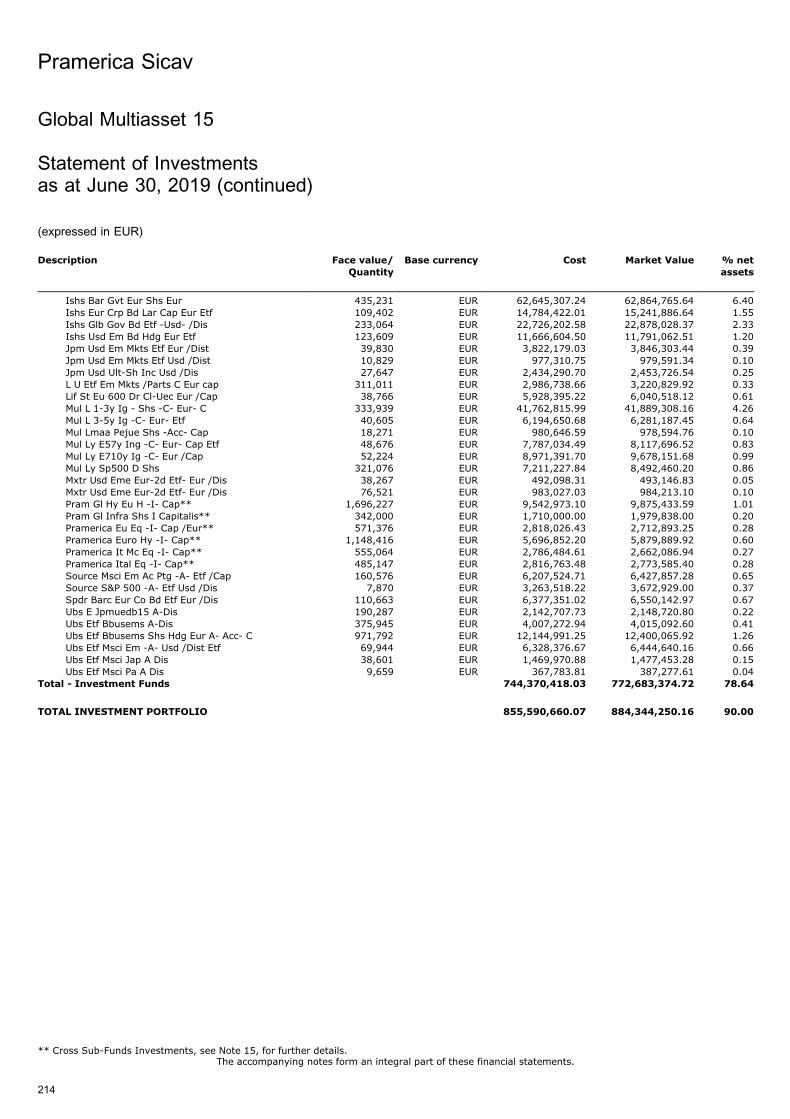
Description Face value/
Quantity
Base currency Cost Market Value % net
assets
Ishs Bar Gvt Eur Shs Eur 435,231 EUR 62,645,307.24 62,864,765.64 6.40Ishs Eur Crp Bd Lar Cap Eur Etf 109,402 EUR 14,784,422.01 15,241,886.64 1.55Ishs Glb Gov Bd Etf -Usd- /Dis 233,064 EUR 22,726,202.58 22,878,028.37 2.33Ishs Usd Em Bd Hdg Eur Etf 123,609 EUR 11,666,604.50 11,791,062.51 1.20Jpm Usd Em Mkts Etf Eur /Dist 39,830 EUR 3,822,179.03 3,846,303.44 0.39Jpm Usd Em Mkts Etf Usd /Dist 10,829 EUR 977,310.75 979,591.34 0.10Jpm Usd Ult-Sh Inc Usd /Dis 27,647 EUR 2,434,290.70 2,453,726.54 0.25L U Etf Em Mkts /Parts C Eur cap 311,011 EUR 2,986,738.66 3,220,829.92 0.33Lif St Eu 600 Dr Cl-Uec Eur /Cap 38,766 EUR 5,928,395.22 6,040,518.12 0.61Mul L 1-3y Ig - Shs -C- Eur- C 333,939 EUR 41,762,815.99 41,889,308.16 4.26Mul L 3-5y Ig -C- Eur- Etf 40,605 EUR 6,194,650.68 6,281,187.45 0.64Mul Lmaa Pejue Shs -Acc- Cap 18,271 EUR 980,646.59 978,594.76 0.10Mul Ly E57y Ing -C- Eur- Cap Etf 48,676 EUR 7,787,034.49 8,117,696.52 0.83Mul Ly E710y Ig -C- Eur /Cap 52,224 EUR 8,971,391.70 9,678,151.68 0.99Mul Ly Sp500 D Shs 321,076 EUR 7,211,227.84 8,492,460.20 0.86Mxtr Usd Eme Eur-2d Etf- Eur /Dis 38,267 EUR 492,098.31 493,146.83 0.05Mxtr Usd Eme Eur-2d Etf- Eur /Dis 76,521 EUR 983,027.03 984,213.10 0.10Pram Gl Hy Eu H -I- Cap** 1,696,227 EUR 9,542,973.10 9,875,433.59 1.01Pram Gl Infra Shs I Capitalis** 342,000 EUR 1,710,000.00 1,979,838.00 0.20Pramerica Eu Eq -I- Cap /Eur** 571,376 EUR 2,818,026.43 2,712,893.25 0.28Pramerica Euro Hy -I- Cap** 1,148,416 EUR 5,696,852.20 5,879,889.92 0.60Pramerica It Mc Eq -I- Cap** 555,064 EUR 2,786,484.61 2,662,086.94 0.27Pramerica Ital Eq -I- Cap** 485,147 EUR 2,816,763.48 2,773,585.40 0.28Source Msci Em Ac Ptg -A- Etf /Cap 160,576 EUR 6,207,524.71 6,427,857.28 0.65Source S&P 500 -A- Etf Usd /Dis 7,870 EUR 3,263,518.22 3,672,929.00 0.37Spdr Barc Eur Co Bd Etf Eur /Dis 110,663 EUR 6,377,351.02 6,550,142.97 0.67Ubs E Jpmuedb15 A-Dis 190,287 EUR 2,142,707.73 2,148,720.80 0.22Ubs Etf Bbusems A-Dis 375,945 EUR 4,007,272.94 4,015,092.60 0.41Ubs Etf Bbusems Shs Hdg Eur A- Acc- C 971,792 EUR 12,144,991.25 12,400,065.92 1.26Ubs Etf Msci Em -A- Usd /Dist Etf 69,944 EUR 6,328,376.67 6,444,640.16 0.66Ubs Etf Msci Jap A Dis 38,601 EUR 1,469,970.88 1,477,453.28 0.15Ubs Etf Msci Pa A Dis 9,659 EUR 367,783.81 387,277.61 0.04
Total - Investment Funds 744,370,418.03 772,683,374.72 78.64
TOTAL INVESTMENT PORTFOLIO 855,590,660.07 884,344,250.16 90.00
Pramerica Sicav
The accompanying notes form an integral part of these financial statements.
214
Global Multiasset 15
Statement of Investmentsas at June 30, 2019 (continued)
(expressed in EUR)
** Cross Sub-Funds Investments, see Note 15, for further details.
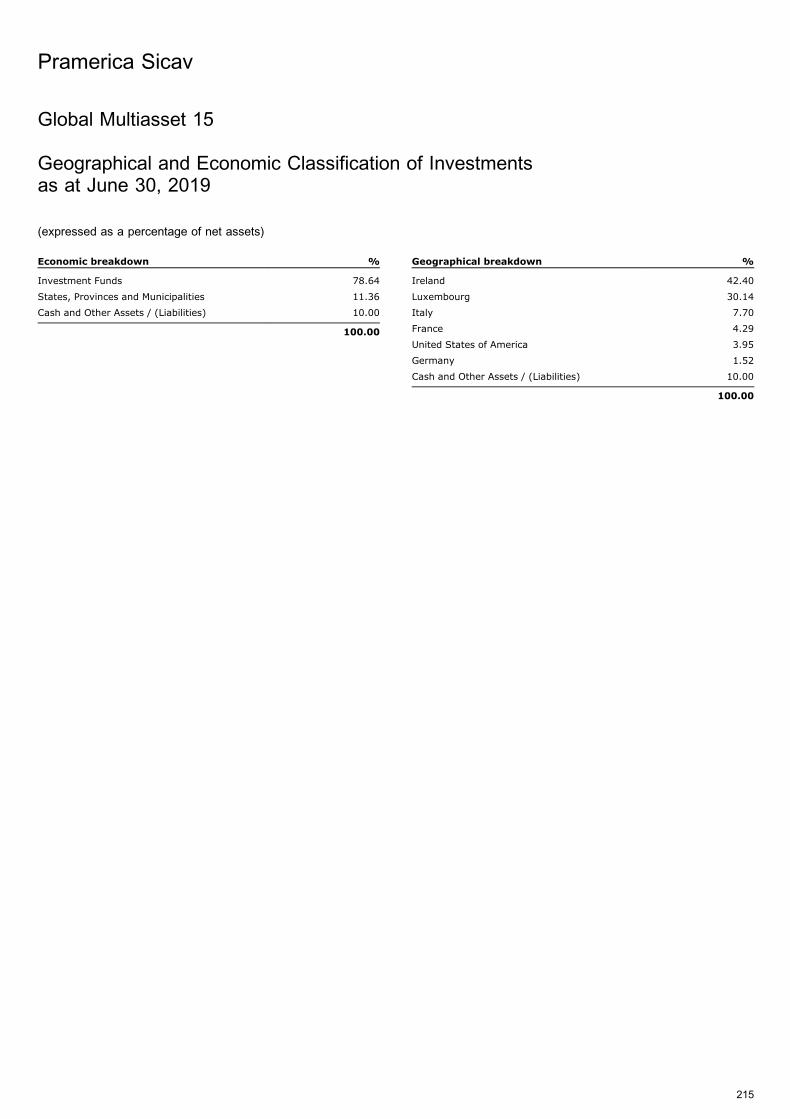
Global Multiasset 15
Geographical and Economic Classification of Investmentsas at June 30, 2019
(expressed as a percentage of net assets)
Economic breakdown %
Investment Funds 78.64
States, Provinces and Municipalities 11.36
Cash and Other Assets / (Liabilities) 10.00
100.00
Geographical breakdown %
Ireland 42.40
Luxembourg 30.14
Italy 7.70
France 4.29
United States of America 3.95
Germany 1.52
Cash and Other Assets / (Liabilities) 10.00
100.00
Pramerica Sicav
215
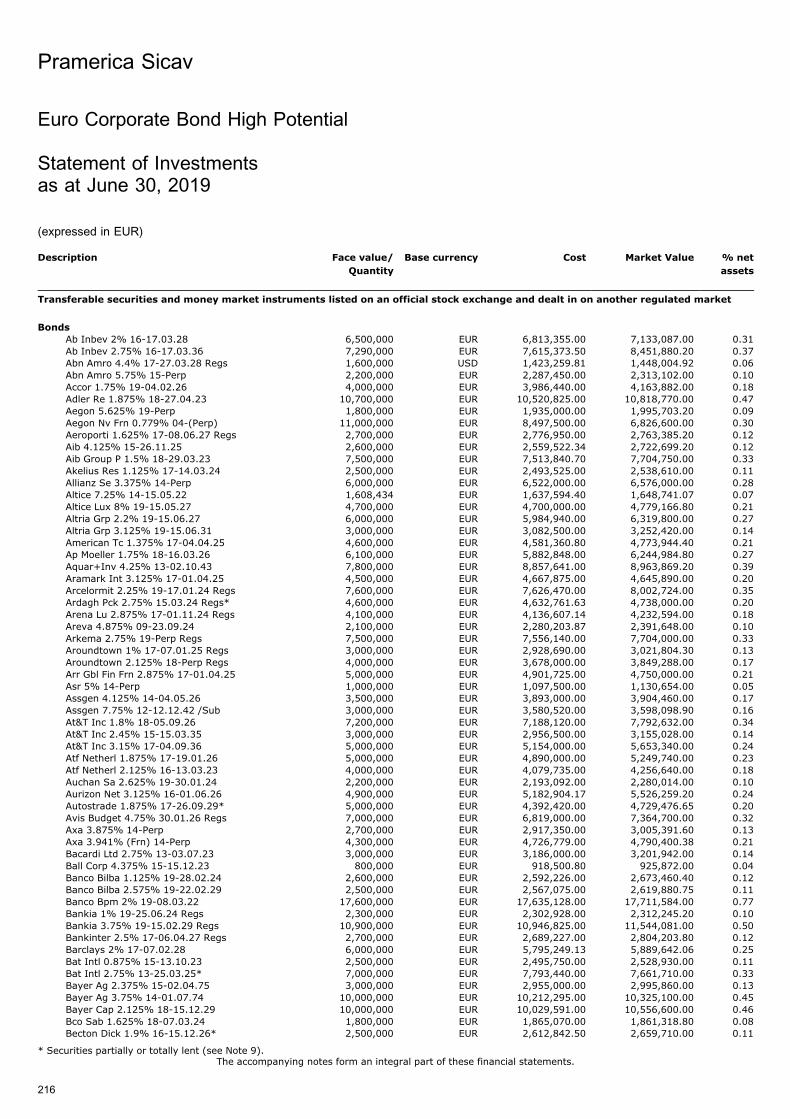
Euro Corporate Bond High Potential
Statement of Investmentsas at June 30, 2019
(expressed in EUR)
Description Face value/
Quantity
Base currency Cost Market Value % net
assets
Transferable securities and money market instruments listed on an official stock exchange and dealt in on another regulated market
Bonds
Ab Inbev 2% 16-17.03.28 6,500,000 EUR 6,813,355.00 7,133,087.00 0.31Ab Inbev 2.75% 16-17.03.36 7,290,000 EUR 7,615,373.50 8,451,880.20 0.37Abn Amro 4.4% 17-27.03.28 Regs 1,600,000 USD 1,423,259.81 1,448,004.92 0.06Abn Amro 5.75% 15-Perp 2,200,000 EUR 2,287,450.00 2,313,102.00 0.10Accor 1.75% 19-04.02.26 4,000,000 EUR 3,986,440.00 4,163,882.00 0.18Adler Re 1.875% 18-27.04.23 10,700,000 EUR 10,520,825.00 10,818,770.00 0.47Aegon 5.625% 19-Perp 1,800,000 EUR 1,935,000.00 1,995,703.20 0.09Aegon Nv Frn 0.779% 04-(Perp) 11,000,000 EUR 8,497,500.00 6,826,600.00 0.30Aeroporti 1.625% 17-08.06.27 Regs 2,700,000 EUR 2,776,950.00 2,763,385.20 0.12Aib 4.125% 15-26.11.25 2,600,000 EUR 2,559,522.34 2,722,699.20 0.12Aib Group P 1.5% 18-29.03.23 7,500,000 EUR 7,513,840.70 7,704,750.00 0.33Akelius Res 1.125% 17-14.03.24 2,500,000 EUR 2,493,525.00 2,538,610.00 0.11Allianz Se 3.375% 14-Perp 6,000,000 EUR 6,522,000.00 6,576,000.00 0.28Altice 7.25% 14-15.05.22 1,608,434 EUR 1,637,594.40 1,648,741.07 0.07Altice Lux 8% 19-15.05.27 4,700,000 EUR 4,700,000.00 4,779,166.80 0.21Altria Grp 2.2% 19-15.06.27 6,000,000 EUR 5,984,940.00 6,319,800.00 0.27Altria Grp 3.125% 19-15.06.31 3,000,000 EUR 3,082,500.00 3,252,420.00 0.14American Tc 1.375% 17-04.04.25 4,600,000 EUR 4,581,360.80 4,773,944.40 0.21Ap Moeller 1.75% 18-16.03.26 6,100,000 EUR 5,882,848.00 6,244,984.80 0.27Aquar+Inv 4.25% 13-02.10.43 7,800,000 EUR 8,857,641.00 8,963,869.20 0.39Aramark Int 3.125% 17-01.04.25 4,500,000 EUR 4,667,875.00 4,645,890.00 0.20Arcelormit 2.25% 19-17.01.24 Regs 7,600,000 EUR 7,626,470.00 8,002,724.00 0.35Ardagh Pck 2.75% 15.03.24 Regs* 4,600,000 EUR 4,632,761.63 4,738,000.00 0.20Arena Lu 2.875% 17-01.11.24 Regs 4,100,000 EUR 4,136,607.14 4,232,594.00 0.18Areva 4.875% 09-23.09.24 2,100,000 EUR 2,280,203.87 2,391,648.00 0.10Arkema 2.75% 19-Perp Regs 7,500,000 EUR 7,556,140.00 7,704,000.00 0.33Aroundtown 1% 17-07.01.25 Regs 3,000,000 EUR 2,928,690.00 3,021,804.30 0.13Aroundtown 2.125% 18-Perp Regs 4,000,000 EUR 3,678,000.00 3,849,288.00 0.17Arr Gbl Fin Frn 2.875% 17-01.04.25 5,000,000 EUR 4,901,725.00 4,750,000.00 0.21Asr 5% 14-Perp 1,000,000 EUR 1,097,500.00 1,130,654.00 0.05Assgen 4.125% 14-04.05.26 3,500,000 EUR 3,893,000.00 3,904,460.00 0.17Assgen 7.75% 12-12.12.42 /Sub 3,000,000 EUR 3,580,520.00 3,598,098.90 0.16At&T Inc 1.8% 18-05.09.26 7,200,000 EUR 7,188,120.00 7,792,632.00 0.34At&T Inc 2.45% 15-15.03.35 3,000,000 EUR 2,956,500.00 3,155,028.00 0.14At&T Inc 3.15% 17-04.09.36 5,000,000 EUR 5,154,000.00 5,653,340.00 0.24Atf Netherl 1.875% 17-19.01.26 5,000,000 EUR 4,890,000.00 5,249,740.00 0.23Atf Netherl 2.125% 16-13.03.23 4,000,000 EUR 4,079,735.00 4,256,640.00 0.18Auchan Sa 2.625% 19-30.01.24 2,200,000 EUR 2,193,092.00 2,280,014.00 0.10Aurizon Net 3.125% 16-01.06.26 4,900,000 EUR 5,182,904.17 5,526,259.20 0.24Autostrade 1.875% 17-26.09.29* 5,000,000 EUR 4,392,420.00 4,729,476.65 0.20Avis Budget 4.75% 30.01.26 Regs 7,000,000 EUR 6,819,000.00 7,364,700.00 0.32Axa 3.875% 14-Perp 2,700,000 EUR 2,917,350.00 3,005,391.60 0.13Axa 3.941% (Frn) 14-Perp 4,300,000 EUR 4,726,779.00 4,790,400.38 0.21Bacardi Ltd 2.75% 13-03.07.23 3,000,000 EUR 3,186,000.00 3,201,942.00 0.14Ball Corp 4.375% 15-15.12.23 800,000 EUR 918,500.80 925,872.00 0.04Banco Bilba 1.125% 19-28.02.24 2,600,000 EUR 2,592,226.00 2,673,460.40 0.12Banco Bilba 2.575% 19-22.02.29 2,500,000 EUR 2,567,075.00 2,619,880.75 0.11Banco Bpm 2% 19-08.03.22 17,600,000 EUR 17,635,128.00 17,711,584.00 0.77Bankia 1% 19-25.06.24 Regs 2,300,000 EUR 2,302,928.00 2,312,245.20 0.10Bankia 3.75% 19-15.02.29 Regs 10,900,000 EUR 10,946,825.00 11,544,081.00 0.50Bankinter 2.5% 17-06.04.27 Regs 2,700,000 EUR 2,689,227.00 2,804,203.80 0.12Barclays 2% 17-07.02.28 6,000,000 EUR 5,795,249.13 5,889,642.06 0.25Bat Intl 0.875% 15-13.10.23 2,500,000 EUR 2,495,750.00 2,528,930.00 0.11Bat Intl 2.75% 13-25.03.25* 7,000,000 EUR 7,793,440.00 7,661,710.00 0.33Bayer Ag 2.375% 15-02.04.75 3,000,000 EUR 2,955,000.00 2,995,860.00 0.13Bayer Ag 3.75% 14-01.07.74 10,000,000 EUR 10,212,295.00 10,325,100.00 0.45Bayer Cap 2.125% 18-15.12.29 10,000,000 EUR 10,029,591.00 10,556,600.00 0.46Bco Sab 1.625% 18-07.03.24 1,800,000 EUR 1,865,070.00 1,861,318.80 0.08Becton Dick 1.9% 16-15.12.26* 2,500,000 EUR 2,612,842.50 2,659,710.00 0.11
Pramerica Sicav
The accompanying notes form an integral part of these financial statements.
216
* Securities partially or totally lent (see Note 9).
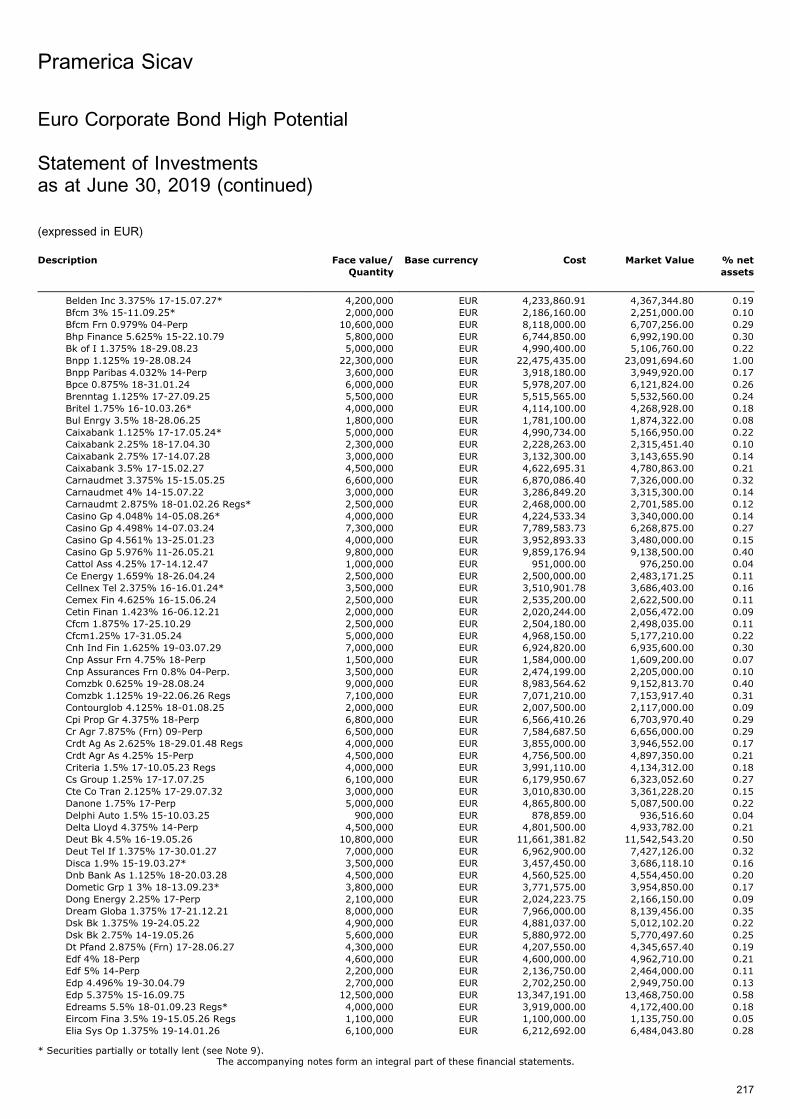
Description Face value/
Quantity
Base currency Cost Market Value % net
assets
Belden Inc 3.375% 17-15.07.27* 4,200,000 EUR 4,233,860.91 4,367,344.80 0.19Bfcm 3% 15-11.09.25* 2,000,000 EUR 2,186,160.00 2,251,000.00 0.10Bfcm Frn 0.979% 04-Perp 10,600,000 EUR 8,118,000.00 6,707,256.00 0.29Bhp Finance 5.625% 15-22.10.79 5,800,000 EUR 6,744,850.00 6,992,190.00 0.30Bk of I 1.375% 18-29.08.23 5,000,000 EUR 4,990,400.00 5,106,760.00 0.22Bnpp 1.125% 19-28.08.24 22,300,000 EUR 22,475,435.00 23,091,694.60 1.00Bnpp Paribas 4.032% 14-Perp 3,600,000 EUR 3,918,180.00 3,949,920.00 0.17Bpce 0.875% 18-31.01.24 6,000,000 EUR 5,978,207.00 6,121,824.00 0.26Brenntag 1.125% 17-27.09.25 5,500,000 EUR 5,515,565.00 5,532,560.00 0.24Britel 1.75% 16-10.03.26* 4,000,000 EUR 4,114,100.00 4,268,928.00 0.18Bul Enrgy 3.5% 18-28.06.25 1,800,000 EUR 1,781,100.00 1,874,322.00 0.08Caixabank 1.125% 17-17.05.24* 5,000,000 EUR 4,990,734.00 5,166,950.00 0.22Caixabank 2.25% 18-17.04.30 2,300,000 EUR 2,228,263.00 2,315,451.40 0.10Caixabank 2.75% 17-14.07.28 3,000,000 EUR 3,132,300.00 3,143,655.90 0.14Caixabank 3.5% 17-15.02.27 4,500,000 EUR 4,622,695.31 4,780,863.00 0.21Carnaudmet 3.375% 15-15.05.25 6,600,000 EUR 6,870,086.40 7,326,000.00 0.32Carnaudmet 4% 14-15.07.22 3,000,000 EUR 3,286,849.20 3,315,300.00 0.14Carnaudmt 2.875% 18-01.02.26 Regs* 2,500,000 EUR 2,468,000.00 2,701,585.00 0.12Casino Gp 4.048% 14-05.08.26* 4,000,000 EUR 4,224,533.34 3,340,000.00 0.14Casino Gp 4.498% 14-07.03.24 7,300,000 EUR 7,789,583.73 6,268,875.00 0.27Casino Gp 4.561% 13-25.01.23 4,000,000 EUR 3,952,893.33 3,480,000.00 0.15Casino Gp 5.976% 11-26.05.21 9,800,000 EUR 9,859,176.94 9,138,500.00 0.40Cattol Ass 4.25% 17-14.12.47 1,000,000 EUR 951,000.00 976,250.00 0.04Ce Energy 1.659% 18-26.04.24 2,500,000 EUR 2,500,000.00 2,483,171.25 0.11Cellnex Tel 2.375% 16-16.01.24* 3,500,000 EUR 3,510,901.78 3,686,403.00 0.16Cemex Fin 4.625% 16-15.06.24 2,500,000 EUR 2,535,200.00 2,622,500.00 0.11Cetin Finan 1.423% 16-06.12.21 2,000,000 EUR 2,020,244.00 2,056,472.00 0.09Cfcm 1.875% 17-25.10.29 2,500,000 EUR 2,504,180.00 2,498,035.00 0.11Cfcm1.25% 17-31.05.24 5,000,000 EUR 4,968,150.00 5,177,210.00 0.22Cnh Ind Fin 1.625% 19-03.07.29 7,000,000 EUR 6,924,820.00 6,935,600.00 0.30Cnp Assur Frn 4.75% 18-Perp 1,500,000 EUR 1,584,000.00 1,609,200.00 0.07Cnp Assurances Frn 0.8% 04-Perp. 3,500,000 EUR 2,474,199.00 2,205,000.00 0.10Comzbk 0.625% 19-28.08.24 9,000,000 EUR 8,983,564.62 9,152,813.70 0.40Comzbk 1.125% 19-22.06.26 Regs 7,100,000 EUR 7,071,210.00 7,153,917.40 0.31Contourglob 4.125% 18-01.08.25 2,000,000 EUR 2,007,500.00 2,117,000.00 0.09Cpi Prop Gr 4.375% 18-Perp 6,800,000 EUR 6,566,410.26 6,703,970.40 0.29Cr Agr 7.875% (Frn) 09-Perp 6,500,000 EUR 7,584,687.50 6,656,000.00 0.29Crdt Ag As 2.625% 18-29.01.48 Regs 4,000,000 EUR 3,855,000.00 3,946,552.00 0.17Crdt Agr As 4.25% 15-Perp 4,500,000 EUR 4,756,500.00 4,897,350.00 0.21Criteria 1.5% 17-10.05.23 Regs 4,000,000 EUR 3,991,110.00 4,134,312.00 0.18Cs Group 1.25% 17-17.07.25 6,100,000 EUR 6,179,950.67 6,323,052.60 0.27Cte Co Tran 2.125% 17-29.07.32 3,000,000 EUR 3,010,830.00 3,361,228.20 0.15Danone 1.75% 17-Perp 5,000,000 EUR 4,865,800.00 5,087,500.00 0.22Delphi Auto 1.5% 15-10.03.25 900,000 EUR 878,859.00 936,516.60 0.04Delta Lloyd 4.375% 14-Perp 4,500,000 EUR 4,801,500.00 4,933,782.00 0.21Deut Bk 4.5% 16-19.05.26 10,800,000 EUR 11,661,381.82 11,542,543.20 0.50Deut Tel If 1.375% 17-30.01.27 7,000,000 EUR 6,962,900.00 7,427,126.00 0.32Disca 1.9% 15-19.03.27* 3,500,000 EUR 3,457,450.00 3,686,118.10 0.16Dnb Bank As 1.125% 18-20.03.28 4,500,000 EUR 4,560,525.00 4,554,450.00 0.20Dometic Grp 1 3% 18-13.09.23* 3,800,000 EUR 3,771,575.00 3,954,850.00 0.17Dong Energy 2.25% 17-Perp 2,100,000 EUR 2,024,223.75 2,166,150.00 0.09Dream Globa 1.375% 17-21.12.21 8,000,000 EUR 7,966,000.00 8,139,456.00 0.35Dsk Bk 1.375% 19-24.05.22 4,900,000 EUR 4,881,037.00 5,012,102.20 0.22Dsk Bk 2.75% 14-19.05.26 5,600,000 EUR 5,880,972.00 5,770,497.60 0.25Dt Pfand 2.875% (Frn) 17-28.06.27 4,300,000 EUR 4,207,550.00 4,345,657.40 0.19Edf 4% 18-Perp 4,600,000 EUR 4,600,000.00 4,962,710.00 0.21Edf 5% 14-Perp 2,200,000 EUR 2,136,750.00 2,464,000.00 0.11Edp 4.496% 19-30.04.79 2,700,000 EUR 2,702,250.00 2,949,750.00 0.13Edp 5.375% 15-16.09.75 12,500,000 EUR 13,347,191.00 13,468,750.00 0.58Edreams 5.5% 18-01.09.23 Regs* 4,000,000 EUR 3,919,000.00 4,172,400.00 0.18Eircom Fina 3.5% 19-15.05.26 Regs 1,100,000 EUR 1,100,000.00 1,135,750.00 0.05Elia Sys Op 1.375% 19-14.01.26 6,100,000 EUR 6,212,692.00 6,484,043.80 0.28
Pramerica Sicav
The accompanying notes form an integral part of these financial statements.
217
Euro Corporate Bond High Potential
Statement of Investmentsas at June 30, 2019 (continued)
(expressed in EUR)
* Securities partially or totally lent (see Note 9).

Description Face value/
Quantity
Base currency Cost Market Value % net
assets
Elia Sys Op 2.75% 18-Perp Regs 5,300,000 EUR 5,348,660.00 5,583,952.80 0.24Elis 1.75% 19-11.04.24 6,000,000 EUR 6,014,390.00 6,195,000.00 0.27Enel 2.5% 18-24.11.78 Regs 11,200,000 EUR 10,767,003.98 11,276,899.20 0.49Enel 3.5% 19-24.05.80 2,400,000 EUR 2,384,088.00 2,497,872.00 0.11Enel Fin 1.5% 19-21.07.25 5,200,000 EUR 5,125,380.00 5,520,330.40 0.24Energy Pro 4% 17-07.12.22 2,200,000 EUR 2,213,820.97 2,197,932.00 0.09Energy Pro 4.5% 18-04.05.24 2,000,000 EUR 1,835,392.00 1,929,760.00 0.08Engie 1.625% 19-Perp 8,500,000 EUR 8,463,960.00 8,500,000.00 0.37Equinix Inc 2.875% 17-01.02.26 4,500,000 EUR 4,358,243.18 4,711,212.00 0.20Equinix Inc 2.875% 17-01.10.25* 3,000,000 EUR 2,975,625.00 3,127,650.00 0.14Eutelsat 2% 18-02.10.25 4,700,000 EUR 4,671,800.00 4,834,937.00 0.21Evonik Ind 2.125% 17-07.07.77 2,700,000 EUR 2,595,024.00 2,777,646.60 0.12Fastighets 3% 17-07.03.78 Regs* 5,500,000 EUR 5,473,510.00 5,534,375.00 0.24Faurecia 3.125% 19-15.06.26 6,000,000 EUR 6,063,990.00 6,315,000.00 0.27Fca Bank Ie 0.625% 19-24.11.22 4,300,000 EUR 4,287,702.00 4,317,174.20 0.19Fca Bank Ie 1% 17-15.11.21* 2,300,000 EUR 2,334,500.00 2,344,546.40 0.10Fca Bank Ie 1.25% 19-21.06.22 5,400,000 EUR 5,405,298.00 5,530,744.80 0.24Fcc Aqualia 2.629% 17-08.06.27 5,700,000 EUR 5,688,450.00 6,104,157.93 0.26Fdml Llc An 5% 17-15.07.24 2,000,000 EUR 2,062,500.00 1,965,820.00 0.08Fed Mogul 4.875% 17-15.04.22 Regs 2,100,000 EUR 2,152,500.00 2,068,080.00 0.09Fedex Corp 1% 16-11.01.23 3,300,000 EUR 3,332,333.00 3,378,843.60 0.15Ferrari 1.5% 16-16.03.23 4,000,000 EUR 4,046,841.25 4,128,832.00 0.18Ferrovial N 2.124% 17-Perp 9,200,000 EUR 8,641,689.27 8,688,020.00 0.38Fiat 1.75% 19-25.03.27 6,500,000 EUR 6,408,805.00 6,672,497.00 0.29Fiat Invest 3.75% 16-29.03.24* 16,300,000 EUR 17,485,920.49 18,109,300.00 0.78Fil Intl 2.5% 16-04.11.26* 4,000,000 EUR 4,008,810.00 4,256,400.00 0.18Financial 4.5% 18-15.05.26 3,300,000 EUR 3,279,375.00 3,373,880.40 0.15Finmeccan 1.5% 17-07.06.24* 7,400,000 EUR 7,203,137.53 7,491,152.46 0.32Fiserv 1.125% 19-01.07.27 4,000,000 EUR 3,966,080.00 4,051,576.00 0.18Fnac Darty 2.625% 19-30.05.26 3,400,000 EUR 3,413,000.00 3,547,424.00 0.15Ford Mc 1.355% 18-07.02.25* 10,400,000 EUR 9,886,776.40 10,197,824.00 0.44Ford Mc 3.021% 19-06.03.24 1,900,000 EUR 1,900,000.00 2,012,331.80 0.09Fortum 0.875% 19-27.02.23 5,200,000 EUR 5,181,748.00 5,308,368.00 0.23Fortum 2.125% 19-27.02.29 Regs 2,500,000 EUR 2,473,825.00 2,645,195.00 0.11Fresenius 1.875% 19-15.02.25 4,700,000 EUR 4,705,187.86 5,044,184.76 0.22G4s 1.5% 16-09.01.23 3,500,000 EUR 3,526,730.00 3,562,580.00 0.15G4s Int Fin 1.5% 17-02.06.24 4,250,000 EUR 4,224,287.50 4,322,012.00 0.19Galp Gas Na 1.375% 16-19.09.23 5,400,000 EUR 5,363,076.46 5,615,319.60 0.24Gas Nat 0.875% 17-15.05.25 Regs 3,000,000 EUR 2,932,860.00 3,096,030.00 0.13Gas Nat Fen 3.375% 15-29.12.49 2,800,000 EUR 2,741,900.00 2,943,612.00 0.13Gas Nat Fen 4.125% 14-Perpetual 7,900,000 EUR 8,269,213.00 8,581,596.20 0.37Gaz Cap 3.125% 16-17.11.23 10,600,000 EUR 10,898,170.00 11,448,000.00 0.50Gdf Suez 1.375% 18-Perp 3,200,000 EUR 2,947,200.00 3,200,000.00 0.14Gdf Suez 3.25% 19-Perp 5,000,000 EUR 4,932,300.00 5,453,010.00 0.24Gen Elec 0.875% 17-17.05.25 4,600,000 EUR 4,142,760.00 4,577,184.00 0.20Gen Elec 1.5% 17-17.05.29* 5,500,000 EUR 4,633,224.00 5,418,633.00 0.23Gen Elec 2.125% 17-17.05.37* 2,400,000 EUR 1,901,850.00 2,258,736.00 0.10General Motors 2.2% 19-1.04.24 3,100,000 EUR 3,099,530.44 3,259,377.20 0.14Generali Fi 4.596% 14-Perp 2,700,000 EUR 2,733,750.00 2,812,320.00 0.12Germany 0.25% 14-11.10.19 10,000,000 EUR 10,069,750.00 10,023,000.00 0.43Gestamp Aut 3.25% 18-30.04.26 300,000 EUR 295,455.00 294,000.00 0.01Gestamp Fdg 3.5% 16-15.05.23* 5,000,000 EUR 5,168,473.50 5,087,080.00 0.22Getlink 3.625% 18-01.10.23* 900,000 EUR 903,886.37 944,514.00 0.04Gie Psa Tresorer. 6% 03-19.09.33 2,700,000 EUR 3,376,755.00 3,657,231.00 0.16Glencore Fi 1.75% 15-17.03.25 2,900,000 EUR 2,914,889.69 3,016,411.80 0.13Glencore FI 1.875% 16-13.09.23* 7,500,000 EUR 7,684,500.00 7,874,325.00 0.34Goodman Aus 1.375% 17-27.09.25* 1,800,000 EUR 1,795,806.00 1,852,470.00 0.08Gr City 1.375% 17-03.08.26 Regs 4,500,000 EUR 4,356,900.00 4,625,865.00 0.20Gs 1.25% 16-01.05.25 7,000,000 EUR 7,114,800.00 7,219,072.00 0.31Hannover Ru 3.375% 14-Perp 4,900,000 EUR 5,369,551.00 5,408,375.00 0.23Heid. C lux 1.125% 19-01.12.27 6,500,000 EUR 6,481,330.00 6,543,849.00 0.28Hera Spa 0.875% 19-05.07.27 2,250,000 EUR 2,214,157.50 2,248,177.50 0.10
Pramerica Sicav
The accompanying notes form an integral part of these financial statements.
218
Euro Corporate Bond High Potential
Statement of Investmentsas at June 30, 2019 (continued)
(expressed in EUR)
* Securities partially or totally lent (see Note 9).
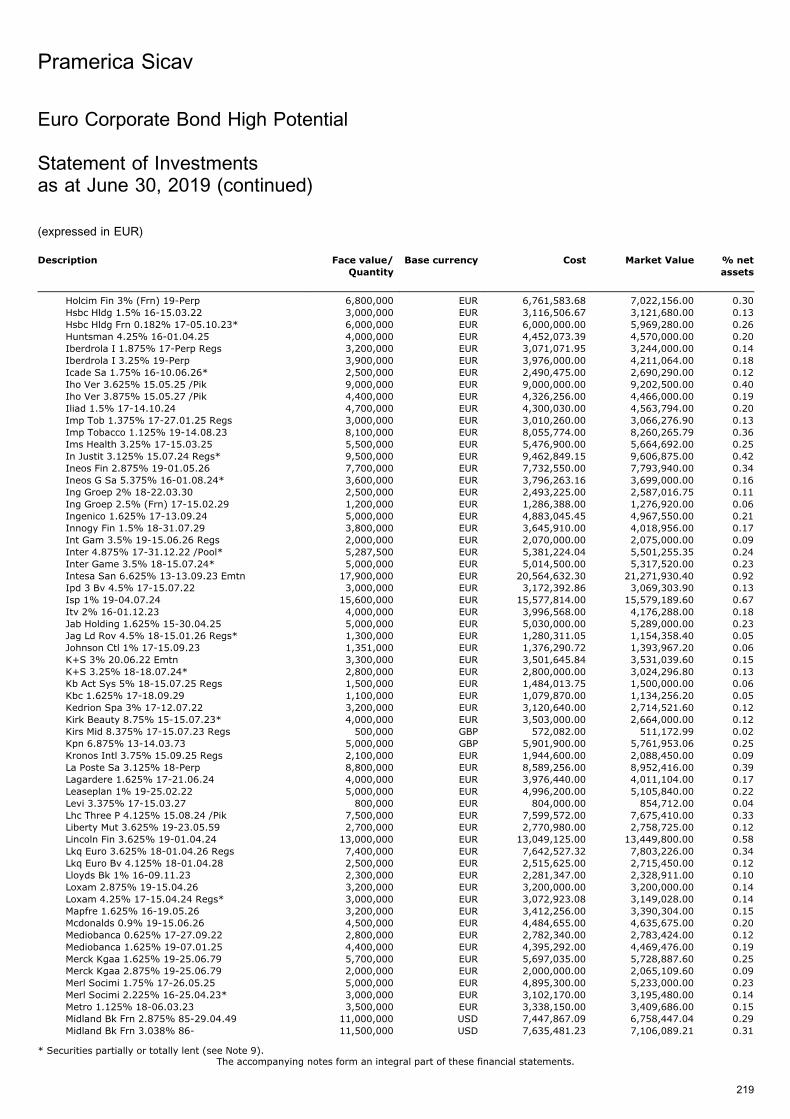
Description Face value/
Quantity
Base currency Cost Market Value % net
assets
Holcim Fin 3% (Frn) 19-Perp 6,800,000 EUR 6,761,583.68 7,022,156.00 0.30Hsbc Hldg 1.5% 16-15.03.22 3,000,000 EUR 3,116,506.67 3,121,680.00 0.13Hsbc Hldg Frn 0.182% 17-05.10.23* 6,000,000 EUR 6,000,000.00 5,969,280.00 0.26Huntsman 4.25% 16-01.04.25 4,000,000 EUR 4,452,073.39 4,570,000.00 0.20Iberdrola I 1.875% 17-Perp Regs 3,200,000 EUR 3,071,071.95 3,244,000.00 0.14Iberdrola I 3.25% 19-Perp 3,900,000 EUR 3,976,000.00 4,211,064.00 0.18Icade Sa 1.75% 16-10.06.26* 2,500,000 EUR 2,490,475.00 2,690,290.00 0.12Iho Ver 3.625% 15.05.25 /Pik 9,000,000 EUR 9,000,000.00 9,202,500.00 0.40Iho Ver 3.875% 15.05.27 /Pik 4,400,000 EUR 4,326,256.00 4,466,000.00 0.19Iliad 1.5% 17-14.10.24 4,700,000 EUR 4,300,030.00 4,563,794.00 0.20Imp Tob 1.375% 17-27.01.25 Regs 3,000,000 EUR 3,010,260.00 3,066,276.90 0.13Imp Tobacco 1.125% 19-14.08.23 8,100,000 EUR 8,055,774.00 8,260,265.79 0.36Ims Health 3.25% 17-15.03.25 5,500,000 EUR 5,476,900.00 5,664,692.00 0.25In Justit 3.125% 15.07.24 Regs* 9,500,000 EUR 9,462,849.15 9,606,875.00 0.42Ineos Fin 2.875% 19-01.05.26 7,700,000 EUR 7,732,550.00 7,793,940.00 0.34Ineos G Sa 5.375% 16-01.08.24* 3,600,000 EUR 3,796,263.16 3,699,000.00 0.16Ing Groep 2% 18-22.03.30 2,500,000 EUR 2,493,225.00 2,587,016.75 0.11Ing Groep 2.5% (Frn) 17-15.02.29 1,200,000 EUR 1,286,388.00 1,276,920.00 0.06Ingenico 1.625% 17-13.09.24 5,000,000 EUR 4,883,045.45 4,967,550.00 0.21Innogy Fin 1.5% 18-31.07.29 3,800,000 EUR 3,645,910.00 4,018,956.00 0.17Int Gam 3.5% 19-15.06.26 Regs 2,000,000 EUR 2,070,000.00 2,075,000.00 0.09Inter 4.875% 17-31.12.22 /Pool* 5,287,500 EUR 5,381,224.04 5,501,255.35 0.24Inter Game 3.5% 18-15.07.24* 5,000,000 EUR 5,014,500.00 5,317,520.00 0.23Intesa San 6.625% 13-13.09.23 Emtn 17,900,000 EUR 20,564,632.30 21,271,930.40 0.92Ipd 3 Bv 4.5% 17-15.07.22 3,000,000 EUR 3,172,392.86 3,069,303.90 0.13Isp 1% 19-04.07.24 15,600,000 EUR 15,577,814.00 15,579,189.60 0.67Itv 2% 16-01.12.23 4,000,000 EUR 3,996,568.00 4,176,288.00 0.18Jab Holding 1.625% 15-30.04.25 5,000,000 EUR 5,030,000.00 5,289,000.00 0.23Jag Ld Rov 4.5% 18-15.01.26 Regs* 1,300,000 EUR 1,280,311.05 1,154,358.40 0.05Johnson Ctl 1% 17-15.09.23 1,351,000 EUR 1,376,290.72 1,393,967.20 0.06K+S 3% 20.06.22 Emtn 3,300,000 EUR 3,501,645.84 3,531,039.60 0.15K+S 3.25% 18-18.07.24* 2,800,000 EUR 2,800,000.00 3,024,296.80 0.13Kb Act Sys 5% 18-15.07.25 Regs 1,500,000 EUR 1,484,013.75 1,500,000.00 0.06Kbc 1.625% 17-18.09.29 1,100,000 EUR 1,079,870.00 1,134,256.20 0.05Kedrion Spa 3% 17-12.07.22 3,200,000 EUR 3,120,640.00 2,714,521.60 0.12Kirk Beauty 8.75% 15-15.07.23* 4,000,000 EUR 3,503,000.00 2,664,000.00 0.12Kirs Mid 8.375% 17-15.07.23 Regs 500,000 GBP 572,082.00 511,172.99 0.02Kpn 6.875% 13-14.03.73 5,000,000 GBP 5,901,900.00 5,761,953.06 0.25Kronos Intl 3.75% 15.09.25 Regs 2,100,000 EUR 1,944,600.00 2,088,450.00 0.09La Poste Sa 3.125% 18-Perp 8,800,000 EUR 8,589,256.00 8,952,416.00 0.39Lagardere 1.625% 17-21.06.24 4,000,000 EUR 3,976,440.00 4,011,104.00 0.17Leaseplan 1% 19-25.02.22 5,000,000 EUR 4,996,200.00 5,105,840.00 0.22Levi 3.375% 17-15.03.27 800,000 EUR 804,000.00 854,712.00 0.04Lhc Three P 4.125% 15.08.24 /Pik 7,500,000 EUR 7,599,572.00 7,675,410.00 0.33Liberty Mut 3.625% 19-23.05.59 2,700,000 EUR 2,770,980.00 2,758,725.00 0.12Lincoln Fin 3.625% 19-01.04.24 13,000,000 EUR 13,049,125.00 13,449,800.00 0.58Lkq Euro 3.625% 18-01.04.26 Regs 7,400,000 EUR 7,642,527.32 7,803,226.00 0.34Lkq Euro Bv 4.125% 18-01.04.28 2,500,000 EUR 2,515,625.00 2,715,450.00 0.12Lloyds Bk 1% 16-09.11.23 2,300,000 EUR 2,281,347.00 2,328,911.00 0.10Loxam 2.875% 19-15.04.26 3,200,000 EUR 3,200,000.00 3,200,000.00 0.14Loxam 4.25% 17-15.04.24 Regs* 3,000,000 EUR 3,072,923.08 3,149,028.00 0.14Mapfre 1.625% 16-19.05.26 3,200,000 EUR 3,412,256.00 3,390,304.00 0.15Mcdonalds 0.9% 19-15.06.26 4,500,000 EUR 4,484,655.00 4,635,675.00 0.20Mediobanca 0.625% 17-27.09.22 2,800,000 EUR 2,782,340.00 2,783,424.00 0.12Mediobanca 1.625% 19-07.01.25 4,400,000 EUR 4,395,292.00 4,469,476.00 0.19Merck Kgaa 1.625% 19-25.06.79 5,700,000 EUR 5,697,035.00 5,728,887.60 0.25Merck Kgaa 2.875% 19-25.06.79 2,000,000 EUR 2,000,000.00 2,065,109.60 0.09Merl Socimi 1.75% 17-26.05.25 5,000,000 EUR 4,895,300.00 5,233,000.00 0.23Merl Socimi 2.225% 16-25.04.23* 3,000,000 EUR 3,102,170.00 3,195,480.00 0.14Metro 1.125% 18-06.03.23 3,500,000 EUR 3,338,150.00 3,409,686.00 0.15Midland Bk Frn 2.875% 85-29.04.49 11,000,000 USD 7,447,867.09 6,758,447.04 0.29Midland Bk Frn 3.038% 86- 11,500,000 USD 7,635,481.23 7,106,089.21 0.31
Pramerica Sicav
The accompanying notes form an integral part of these financial statements.
219
Euro Corporate Bond High Potential
Statement of Investmentsas at June 30, 2019 (continued)
(expressed in EUR)
* Securities partially or totally lent (see Note 9).

Description Face value/
Quantity
Base currency Cost Market Value % net
assets
Molson Coor 1.25% 16-15.07.24 3,700,000 EUR 3,706,926.40 3,799,988.80 0.16Mpt Op Ptnr 3.325% 17-24.03.25 4,200,000 EUR 4,225,854.02 4,548,516.00 0.20Mulhacen Pt 6.5% 18-01.08.23* 9,600,000 EUR 9,562,500.00 9,216,000.00 0.40Mylan 2.25% 16-22.11.24 10,000,000 EUR 10,020,420.00 10,174,000.00 0.44Ndaq 1.75% 19-28.03.29 3,100,000 EUR 3,087,910.00 3,291,828.00 0.14Netflix 3.625% 18-15.05.27 8,700,000 EUR 8,730,230.00 9,499,356.00 0.41Nn Group 1.625% 17-01.06.27 3,200,000 EUR 3,424,000.00 3,412,339.20 0.15Nn Group 4.5% 14-Perp* 2,000,000 EUR 2,179,154.00 2,206,262.40 0.10Nokia Oyj 2% 19-11.03.26 4,400,000 EUR 4,376,988.00 4,554,000.00 0.20Odyssey Eur 8% 18-15.05.23 2,500,000 EUR 2,474,575.00 2,362,500.00 0.10Oi European 3.125% 16-15.11.24 3,800,000 EUR 3,919,040.00 4,127,750.00 0.18Omv 6.25% 15-Perp* 5,500,000 EUR 6,722,420.83 6,912,070.00 0.30Orange 2% 19-15.01.29 7,000,000 EUR 7,168,000.00 7,828,874.20 0.34Orange 2.375% 19-Perp 7,300,000 EUR 7,249,703.00 7,550,025.00 0.33Orange 5% 14-Perp 3,000,000 EUR 3,371,250.00 3,551,250.00 0.15Orano Sa 3.375% 19-23.04.26 11,000,000 EUR 10,940,527.00 11,395,560.00 0.49Orc Germany 2.125% 17-04.10.24 8,200,000 EUR 8,210,002.00 8,380,400.00 0.36Orc Germany 4.875% 19-Perp 5,900,000 EUR 5,821,884.00 5,820,621.40 0.25Outoku Oyj 4.125% 18-18.06.24* 1,600,000 EUR 1,618,057.14 1,606,800.00 0.07Paternoster 8.5% 15-15.02.23 5,080,000 EUR 5,150,810.00 5,156,677.52 0.22Pemex 3.75% 14-16.04.26 12,800,000 EUR 12,752,350.00 12,211,200.00 0.53Petrobras 4.75% 14-14.01.25* 2,700,000 EUR 2,867,950.00 3,044,250.00 0.13Peugeot 2% 17-23.03.24 Regs 2,700,000 EUR 2,743,898.35 2,844,352.80 0.12Pirelli 1.375% 18-25.01.23 Regs 4,500,000 EUR 4,336,875.00 4,469,490.00 0.19Playtech 3.75% 18-12.10.23 5,700,000 EUR 5,690,386.30 5,997,939.00 0.26Playtech 4.25% 19-07.03.26 3,000,000 EUR 3,163,500.00 3,172,500.00 0.14Prysmian 2.5% 15-11.04.22 2,200,000 EUR 2,322,750.27 2,270,400.00 0.10Psa Banque 0.625% 19-21.06.24 3,700,000 EUR 3,678,836.00 3,726,751.00 0.16Psa Banque 0.75% 18-19.04.23 3,000,000 EUR 2,974,200.00 3,040,770.00 0.13Rabobk 6.875% 10-19.03.20 10,000,000 EUR 11,890,615.38 10,475,000.00 0.45Rci Banq 1.375% 08.03.24 Regs 5,000,000 EUR 5,057,500.00 5,127,880.00 0.22Rci Bq 1.625% 18-26.05.26 8,200,000 EUR 7,917,625.00 8,394,553.20 0.36Rci Bq 2% 19-11.07.24 6,200,000 EUR 6,177,060.00 6,551,118.40 0.28Repsm 3.875% 15-Perp 5,700,000 EUR 5,959,310.70 5,999,250.00 0.26Repsm 4.5% 15-25.03.75 9,100,000 EUR 9,193,434.96 10,336,926.60 0.45Residomo 3.375% 17-15.10.24 Regs 3,000,000 EUR 3,021,206.25 3,112,500.00 0.13Rexel 2.125% 17-15.06.25* 10,700,000 EUR 10,360,434.60 11,030,951.00 0.48Roadster Fi 2.375% 17-08.12.17 2,500,000 EUR 2,494,842.40 2,505,420.00 0.11Rwe Ag 2.75% 15-21.04.75 1,650,000 EUR 1,688,637.15 1,683,976.80 0.07Rwe Ag 3.5% 15-21.04.75 2,500,000 EUR 2,441,620.00 2,635,190.00 0.11Rzd Capital 3.3744% 13-20.05.21 5,500,000 EUR 5,760,562.50 5,797,550.00 0.25Saipem Fi 2.625% 17-07.01.25 Regs 3,500,000 EUR 3,371,222.83 3,585,890.00 0.16Saipem Fin 3.75% 16-08.09.23* 2,500,000 EUR 2,601,689.73 2,740,275.00 0.12Salini 1.75% 17-26.10.24 Regs 6,900,000 EUR 5,119,745.79 5,433,750.00 0.24Sampo Bk 3.375% 19-23.05.49 4,700,000 EUR 4,711,275.03 5,026,697.00 0.22Samsonite 3.5% 18-15.05.26 Regs 1,500,000 EUR 1,485,750.00 1,523,250.00 0.07San Con 1.125% 18-09.10.23 4,400,000 EUR 4,523,860.00 4,555,320.00 0.20Sanpolo Vi 4.75% /Frn 14-Perp 900,000 EUR 897,723.00 927,954.00 0.04Santander 1% 17-Perp 12,300,000 EUR 9,739,987.16 10,138,348.80 0.44Sappi Papie 3.125% 19-15.04.26 10,000,000 EUR 10,072,550.00 10,263,800.00 0.44Schaeff Fin 3.25% 15-15.05.25 4,000,000 EUR 4,205,477.54 4,139,680.00 0.18Schaeffler 1.875% 19-26.03.24 4,700,000 EUR 4,754,628.24 4,906,189.00 0.21Schaeffler 2.875% 19-26.03.27 Regs 2,250,000 EUR 2,237,962.50 2,444,220.00 0.11Seb 1.375% (Frn) 16-31.10.28* 6,700,000 EUR 6,717,390.00 6,828,975.00 0.30Ses 4.625% 16-Perp 9,000,000 EUR 9,226,629.99 9,477,000.00 0.41Ses 5.625% (Frn) 16-Perp 6,400,000 EUR 7,035,640.00 7,040,000.00 0.30Shb 1.625% 18-05.03.29 4,400,000 EUR 4,560,947.60 4,545,112.00 0.20Silgan Hldg 3.25% 17-15.03.25 1,000,000 EUR 1,007,834.80 1,033,330.00 0.04Smurfit 2.375% 17-01.02.24 Regs* 4,500,000 EUR 4,533,210.00 4,823,865.00 0.21Smurfit Kap 2.875% 18-15.01.26 6,100,000 EUR 6,123,020.00 6,634,848.00 0.29Sns 3.75% 15-05.11.25 4,000,000 EUR 4,187,670.00 4,178,008.00 0.18Socgen 1.25% 19-15.02.24 8,000,000 EUR 7,952,000.00 8,247,088.00 0.36
Pramerica Sicav
The accompanying notes form an integral part of these financial statements.
220
Euro Corporate Bond High Potential
Statement of Investmentsas at June 30, 2019 (continued)
(expressed in EUR)
* Securities partially or totally lent (see Note 9).
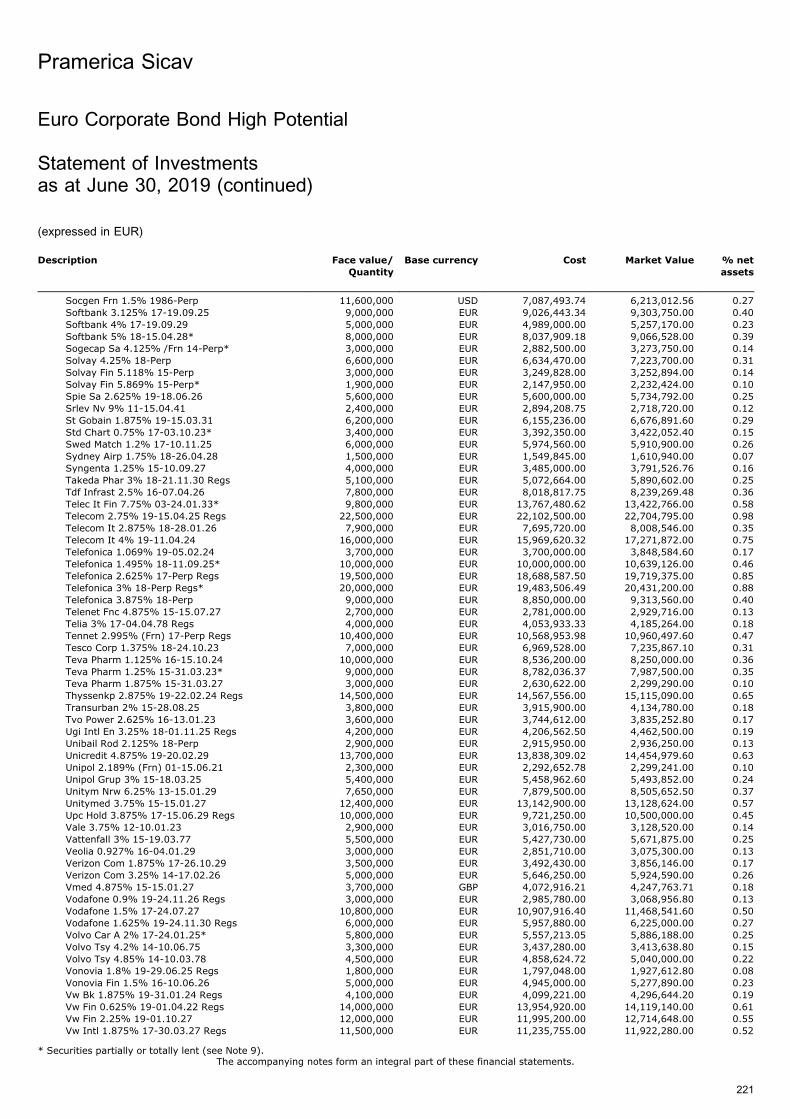
Description Face value/
Quantity
Base currency Cost Market Value % net
assets
Socgen Frn 1.5% 1986-Perp 11,600,000 USD 7,087,493.74 6,213,012.56 0.27Softbank 3.125% 17-19.09.25 9,000,000 EUR 9,026,443.34 9,303,750.00 0.40Softbank 4% 17-19.09.29 5,000,000 EUR 4,989,000.00 5,257,170.00 0.23Softbank 5% 18-15.04.28* 8,000,000 EUR 8,037,909.18 9,066,528.00 0.39Sogecap Sa 4.125% /Frn 14-Perp* 3,000,000 EUR 2,882,500.00 3,273,750.00 0.14Solvay 4.25% 18-Perp 6,600,000 EUR 6,634,470.00 7,223,700.00 0.31Solvay Fin 5.118% 15-Perp 3,000,000 EUR 3,249,828.00 3,252,894.00 0.14Solvay Fin 5.869% 15-Perp* 1,900,000 EUR 2,147,950.00 2,232,424.00 0.10Spie Sa 2.625% 19-18.06.26 5,600,000 EUR 5,600,000.00 5,734,792.00 0.25Srlev Nv 9% 11-15.04.41 2,400,000 EUR 2,894,208.75 2,718,720.00 0.12St Gobain 1.875% 19-15.03.31 6,200,000 EUR 6,155,236.00 6,676,891.60 0.29Std Chart 0.75% 17-03.10.23* 3,400,000 EUR 3,392,350.00 3,422,052.40 0.15Swed Match 1.2% 17-10.11.25 6,000,000 EUR 5,974,560.00 5,910,900.00 0.26Sydney Airp 1.75% 18-26.04.28 1,500,000 EUR 1,549,845.00 1,610,940.00 0.07Syngenta 1.25% 15-10.09.27 4,000,000 EUR 3,485,000.00 3,791,526.76 0.16Takeda Phar 3% 18-21.11.30 Regs 5,100,000 EUR 5,072,664.00 5,890,602.00 0.25Tdf Infrast 2.5% 16-07.04.26 7,800,000 EUR 8,018,817.75 8,239,269.48 0.36Telec It Fin 7.75% 03-24.01.33* 9,800,000 EUR 13,767,480.62 13,422,766.00 0.58Telecom 2.75% 19-15.04.25 Regs 22,500,000 EUR 22,102,500.00 22,704,795.00 0.98Telecom It 2.875% 18-28.01.26 7,900,000 EUR 7,695,720.00 8,008,546.00 0.35Telecom It 4% 19-11.04.24 16,000,000 EUR 15,969,620.32 17,271,872.00 0.75Telefonica 1.069% 19-05.02.24 3,700,000 EUR 3,700,000.00 3,848,584.60 0.17Telefonica 1.495% 18-11.09.25* 10,000,000 EUR 10,000,000.00 10,639,126.00 0.46Telefonica 2.625% 17-Perp Regs 19,500,000 EUR 18,688,587.50 19,719,375.00 0.85Telefonica 3% 18-Perp Regs* 20,000,000 EUR 19,483,506.49 20,431,200.00 0.88Telefonica 3.875% 18-Perp 9,000,000 EUR 8,850,000.00 9,313,560.00 0.40Telenet Fnc 4.875% 15-15.07.27 2,700,000 EUR 2,781,000.00 2,929,716.00 0.13Telia 3% 17-04.04.78 Regs 4,000,000 EUR 4,053,933.33 4,185,264.00 0.18Tennet 2.995% (Frn) 17-Perp Regs 10,400,000 EUR 10,568,953.98 10,960,497.60 0.47Tesco Corp 1.375% 18-24.10.23 7,000,000 EUR 6,969,528.00 7,235,867.10 0.31Teva Pharm 1.125% 16-15.10.24 10,000,000 EUR 8,536,200.00 8,250,000.00 0.36Teva Pharm 1.25% 15-31.03.23* 9,000,000 EUR 8,782,036.37 7,987,500.00 0.35Teva Pharm 1.875% 15-31.03.27 3,000,000 EUR 2,630,622.00 2,299,290.00 0.10Thyssenkp 2.875% 19-22.02.24 Regs 14,500,000 EUR 14,567,556.00 15,115,090.00 0.65Transurban 2% 15-28.08.25 3,800,000 EUR 3,915,900.00 4,134,780.00 0.18Tvo Power 2.625% 16-13.01.23 3,600,000 EUR 3,744,612.00 3,835,252.80 0.17Ugi Intl En 3.25% 18-01.11.25 Regs 4,200,000 EUR 4,206,562.50 4,462,500.00 0.19Unibail Rod 2.125% 18-Perp 2,900,000 EUR 2,915,950.00 2,936,250.00 0.13Unicredit 4.875% 19-20.02.29 13,700,000 EUR 13,838,309.02 14,454,979.60 0.63Unipol 2.189% (Frn) 01-15.06.21 2,300,000 EUR 2,292,652.78 2,299,241.00 0.10Unipol Grup 3% 15-18.03.25 5,400,000 EUR 5,458,962.60 5,493,852.00 0.24Unitym Nrw 6.25% 13-15.01.29 7,650,000 EUR 7,879,500.00 8,505,652.50 0.37Unitymed 3.75% 15-15.01.27 12,400,000 EUR 13,142,900.00 13,128,624.00 0.57Upc Hold 3.875% 17-15.06.29 Regs 10,000,000 EUR 9,721,250.00 10,500,000.00 0.45Vale 3.75% 12-10.01.23 2,900,000 EUR 3,016,750.00 3,128,520.00 0.14Vattenfall 3% 15-19.03.77 5,500,000 EUR 5,427,730.00 5,671,875.00 0.25Veolia 0.927% 16-04.01.29 3,000,000 EUR 2,851,710.00 3,075,300.00 0.13Verizon Com 1.875% 17-26.10.29 3,500,000 EUR 3,492,430.00 3,856,146.00 0.17Verizon Com 3.25% 14-17.02.26 5,000,000 EUR 5,646,250.00 5,924,590.00 0.26Vmed 4.875% 15-15.01.27 3,700,000 GBP 4,072,916.21 4,247,763.71 0.18Vodafone 0.9% 19-24.11.26 Regs 3,000,000 EUR 2,985,780.00 3,068,956.80 0.13Vodafone 1.5% 17-24.07.27 10,800,000 EUR 10,907,916.40 11,468,541.60 0.50Vodafone 1.625% 19-24.11.30 Regs 6,000,000 EUR 5,957,880.00 6,225,000.00 0.27Volvo Car A 2% 17-24.01.25* 5,800,000 EUR 5,557,213.05 5,886,188.00 0.25Volvo Tsy 4.2% 14-10.06.75 3,300,000 EUR 3,437,280.00 3,413,638.80 0.15Volvo Tsy 4.85% 14-10.03.78 4,500,000 EUR 4,858,624.72 5,040,000.00 0.22Vonovia 1.8% 19-29.06.25 Regs 1,800,000 EUR 1,797,048.00 1,927,612.80 0.08Vonovia Fin 1.5% 16-10.06.26 5,000,000 EUR 4,945,000.00 5,277,890.00 0.23Vw Bk 1.875% 19-31.01.24 Regs 4,100,000 EUR 4,099,221.00 4,296,644.20 0.19Vw Fin 0.625% 19-01.04.22 Regs 14,000,000 EUR 13,954,920.00 14,119,140.00 0.61Vw Fin 2.25% 19-01.10.27 12,000,000 EUR 11,995,200.00 12,714,648.00 0.55Vw Intl 1.875% 17-30.03.27 Regs 11,500,000 EUR 11,235,755.00 11,922,280.00 0.52
Pramerica Sicav
The accompanying notes form an integral part of these financial statements.
221
Euro Corporate Bond High Potential
Statement of Investmentsas at June 30, 2019 (continued)
(expressed in EUR)
* Securities partially or totally lent (see Note 9).
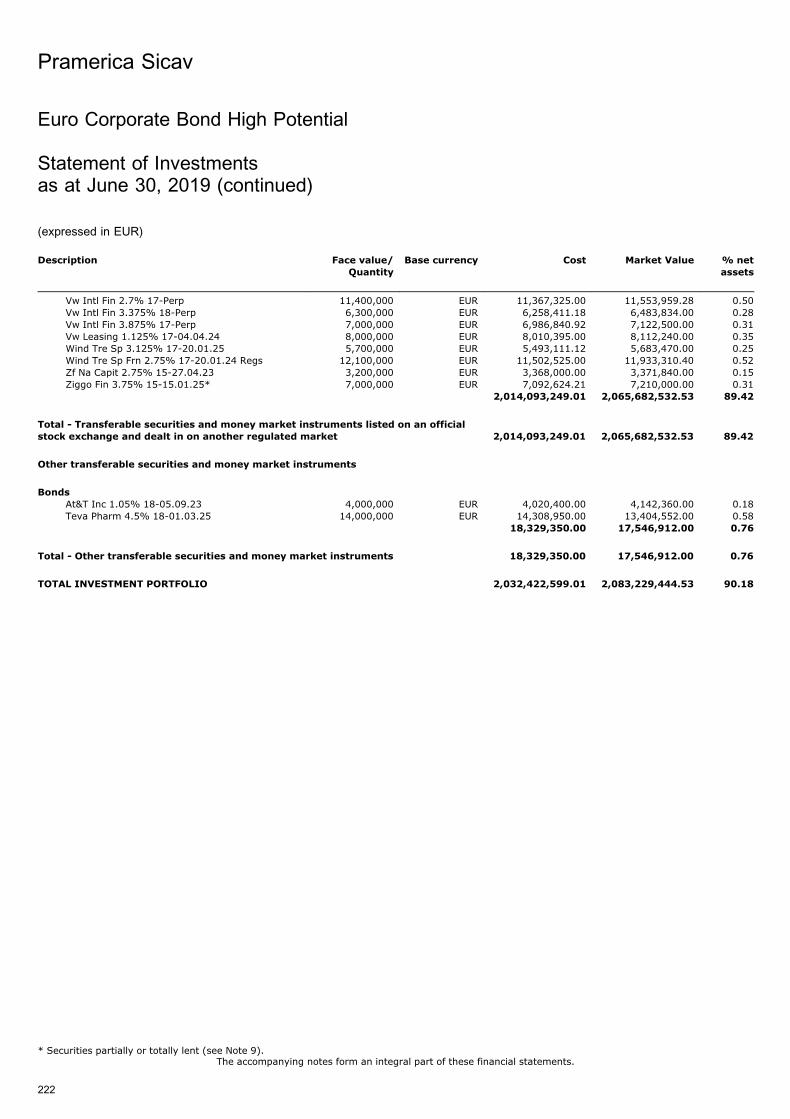
Description Face value/
Quantity
Base currency Cost Market Value % net
assets
Vw Intl Fin 2.7% 17-Perp 11,400,000 EUR 11,367,325.00 11,553,959.28 0.50Vw Intl Fin 3.375% 18-Perp 6,300,000 EUR 6,258,411.18 6,483,834.00 0.28Vw Intl Fin 3.875% 17-Perp 7,000,000 EUR 6,986,840.92 7,122,500.00 0.31Vw Leasing 1.125% 17-04.04.24 8,000,000 EUR 8,010,395.00 8,112,240.00 0.35Wind Tre Sp 3.125% 17-20.01.25 5,700,000 EUR 5,493,111.12 5,683,470.00 0.25Wind Tre Sp Frn 2.75% 17-20.01.24 Regs 12,100,000 EUR 11,502,525.00 11,933,310.40 0.52Zf Na Capit 2.75% 15-27.04.23 3,200,000 EUR 3,368,000.00 3,371,840.00 0.15Ziggo Fin 3.75% 15-15.01.25* 7,000,000 EUR 7,092,624.21 7,210,000.00 0.31
2,014,093,249.01 2,065,682,532.53 89.42
Total - Transferable securities and money market instruments listed on an official
stock exchange and dealt in on another regulated market 2,014,093,249.01 2,065,682,532.53 89.42
Other transferable securities and money market instruments
Bonds
At&T Inc 1.05% 18-05.09.23 4,000,000 EUR 4,020,400.00 4,142,360.00 0.18Teva Pharm 4.5% 18-01.03.25 14,000,000 EUR 14,308,950.00 13,404,552.00 0.58
18,329,350.00 17,546,912.00 0.76
Total - Other transferable securities and money market instruments 18,329,350.00 17,546,912.00 0.76
TOTAL INVESTMENT PORTFOLIO 2,032,422,599.01 2,083,229,444.53 90.18
Pramerica Sicav
The accompanying notes form an integral part of these financial statements.
222
Euro Corporate Bond High Potential
Statement of Investmentsas at June 30, 2019 (continued)
(expressed in EUR)
* Securities partially or totally lent (see Note 9).
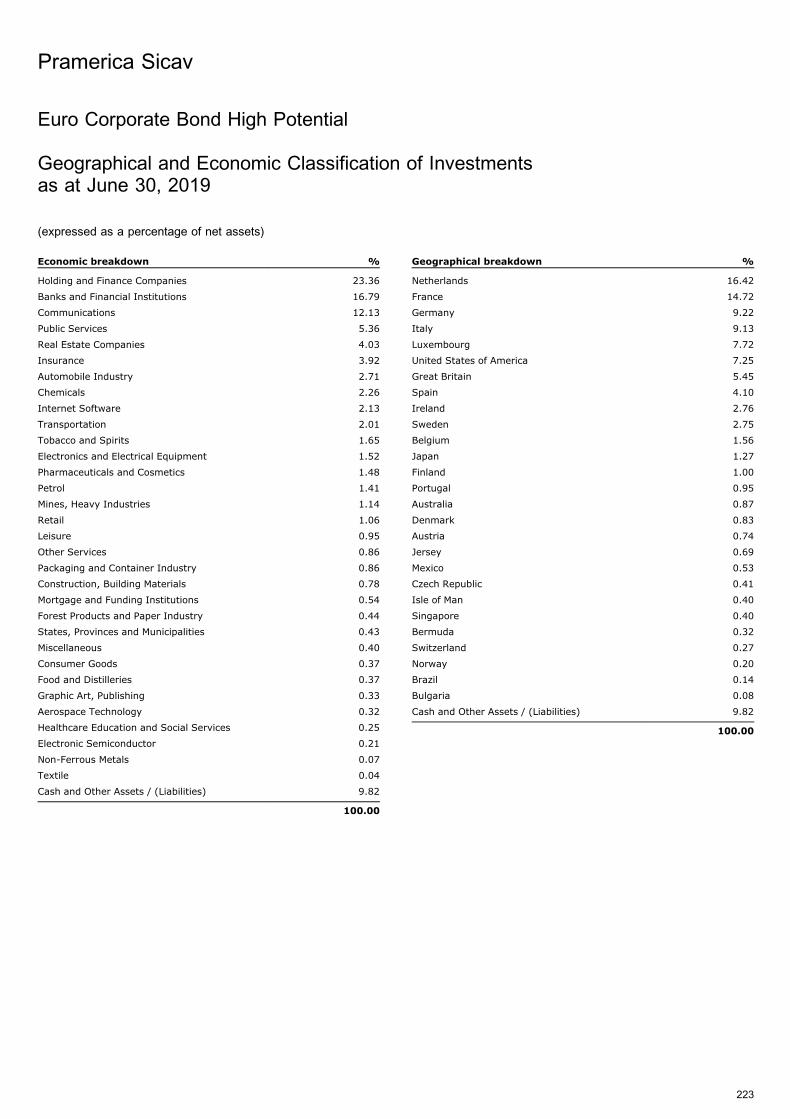
Euro Corporate Bond High Potential
Geographical and Economic Classification of Investmentsas at June 30, 2019
(expressed as a percentage of net assets)
Economic breakdown %
Holding and Finance Companies 23.36
Banks and Financial Institutions 16.79
Communications 12.13
Public Services 5.36
Real Estate Companies 4.03
Insurance 3.92
Automobile Industry 2.71
Chemicals 2.26
Internet Software 2.13
Transportation 2.01
Tobacco and Spirits 1.65
Electronics and Electrical Equipment 1.52
Pharmaceuticals and Cosmetics 1.48
Petrol 1.41
Mines, Heavy Industries 1.14
Retail 1.06
Leisure 0.95
Other Services 0.86
Packaging and Container Industry 0.86
Construction, Building Materials 0.78
Mortgage and Funding Institutions 0.54
Forest Products and Paper Industry 0.44
States, Provinces and Municipalities 0.43
Miscellaneous 0.40
Consumer Goods 0.37
Food and Distilleries 0.37
Graphic Art, Publishing 0.33
Aerospace Technology 0.32
Healthcare Education and Social Services 0.25
Electronic Semiconductor 0.21
Non-Ferrous Metals 0.07
Textile 0.04
Cash and Other Assets / (Liabilities) 9.82
100.00
Geographical breakdown %
Netherlands 16.42
France 14.72
Germany 9.22
Italy 9.13
Luxembourg 7.72
United States of America 7.25
Great Britain 5.45
Spain 4.10
Ireland 2.76
Sweden 2.75
Belgium 1.56
Japan 1.27
Finland 1.00
Portugal 0.95
Australia 0.87
Denmark 0.83
Austria 0.74
Jersey 0.69
Mexico 0.53
Czech Republic 0.41
Isle of Man 0.40
Singapore 0.40
Bermuda 0.32
Switzerland 0.27
Norway 0.20
Brazil 0.14
Bulgaria 0.08
Cash and Other Assets / (Liabilities) 9.82
100.00
Pramerica Sicav
223
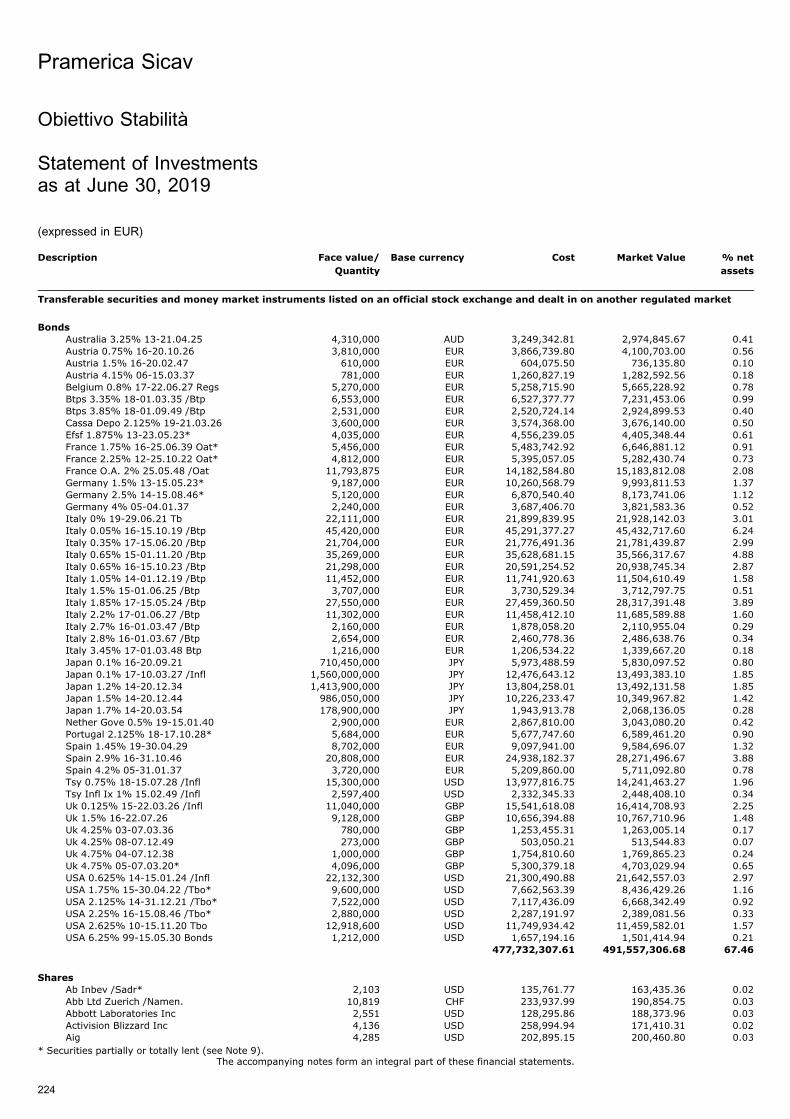
Obiettivo Stabilita
Statement of Investmentsas at June 30, 2019
(expressed in EUR)
Description Face value/
Quantity
Base currency Cost Market Value % net
assets
Transferable securities and money market instruments listed on an official stock exchange and dealt in on another regulated market
Bonds
Australia 3.25% 13-21.04.25 4,310,000 AUD 3,249,342.81 2,974,845.67 0.41Austria 0.75% 16-20.10.26 3,810,000 EUR 3,866,739.80 4,100,703.00 0.56Austria 1.5% 16-20.02.47 610,000 EUR 604,075.50 736,135.80 0.10Austria 4.15% 06-15.03.37 781,000 EUR 1,260,827.19 1,282,592.56 0.18Belgium 0.8% 17-22.06.27 Regs 5,270,000 EUR 5,258,715.90 5,665,228.92 0.78Btps 3.35% 18-01.03.35 /Btp 6,553,000 EUR 6,527,377.77 7,231,453.06 0.99Btps 3.85% 18-01.09.49 /Btp 2,531,000 EUR 2,520,724.14 2,924,899.53 0.40Cassa Depo 2.125% 19-21.03.26 3,600,000 EUR 3,574,368.00 3,676,140.00 0.50Efsf 1.875% 13-23.05.23* 4,035,000 EUR 4,556,239.05 4,405,348.44 0.61France 1.75% 16-25.06.39 Oat* 5,456,000 EUR 5,483,742.92 6,646,881.12 0.91France 2.25% 12-25.10.22 Oat* 4,812,000 EUR 5,395,057.05 5,282,430.74 0.73France O.A. 2% 25.05.48 /Oat 11,793,875 EUR 14,182,584.80 15,183,812.08 2.08Germany 1.5% 13-15.05.23* 9,187,000 EUR 10,260,568.79 9,993,811.53 1.37Germany 2.5% 14-15.08.46* 5,120,000 EUR 6,870,540.40 8,173,741.06 1.12Germany 4% 05-04.01.37 2,240,000 EUR 3,687,406.70 3,821,583.36 0.52Italy 0% 19-29.06.21 Tb 22,111,000 EUR 21,899,839.95 21,928,142.03 3.01Italy 0.05% 16-15.10.19 /Btp 45,420,000 EUR 45,291,377.27 45,432,717.60 6.24Italy 0.35% 17-15.06.20 /Btp 21,704,000 EUR 21,776,491.36 21,781,439.87 2.99Italy 0.65% 15-01.11.20 /Btp 35,269,000 EUR 35,628,681.15 35,566,317.67 4.88Italy 0.65% 16-15.10.23 /Btp 21,298,000 EUR 20,591,254.52 20,938,745.34 2.87Italy 1.05% 14-01.12.19 /Btp 11,452,000 EUR 11,741,920.63 11,504,610.49 1.58Italy 1.5% 15-01.06.25 /Btp 3,707,000 EUR 3,730,529.34 3,712,797.75 0.51Italy 1.85% 17-15.05.24 /Btp 27,550,000 EUR 27,459,360.50 28,317,391.48 3.89Italy 2.2% 17-01.06.27 /Btp 11,302,000 EUR 11,458,412.10 11,685,589.88 1.60Italy 2.7% 16-01.03.47 /Btp 2,160,000 EUR 1,878,058.20 2,110,955.04 0.29Italy 2.8% 16-01.03.67 /Btp 2,654,000 EUR 2,460,778.36 2,486,638.76 0.34Italy 3.45% 17-01.03.48 Btp 1,216,000 EUR 1,206,534.22 1,339,667.20 0.18Japan 0.1% 16-20.09.21 710,450,000 JPY 5,973,488.59 5,830,097.52 0.80Japan 0.1% 17-10.03.27 /Infl 1,560,000,000 JPY 12,476,643.12 13,493,383.10 1.85Japan 1.2% 14-20.12.34 1,413,900,000 JPY 13,804,258.01 13,492,131.58 1.85Japan 1.5% 14-20.12.44 986,050,000 JPY 10,226,233.47 10,349,967.82 1.42Japan 1.7% 14-20.03.54 178,900,000 JPY 1,943,913.78 2,068,136.05 0.28Nether Gove 0.5% 19-15.01.40 2,900,000 EUR 2,867,810.00 3,043,080.20 0.42Portugal 2.125% 18-17.10.28* 5,684,000 EUR 5,677,747.60 6,589,461.20 0.90Spain 1.45% 19-30.04.29 8,702,000 EUR 9,097,941.00 9,584,696.07 1.32Spain 2.9% 16-31.10.46 20,808,000 EUR 24,938,182.37 28,271,496.67 3.88Spain 4.2% 05-31.01.37 3,720,000 EUR 5,209,860.00 5,711,092.80 0.78Tsy 0.75% 18-15.07.28 /Infl 15,300,000 USD 13,977,816.75 14,241,463.27 1.96Tsy Infl Ix 1% 15.02.49 /Infl 2,597,400 USD 2,332,345.33 2,448,408.10 0.34Uk 0.125% 15-22.03.26 /Infl 11,040,000 GBP 15,541,618.08 16,414,708.93 2.25Uk 1.5% 16-22.07.26 9,128,000 GBP 10,656,394.88 10,767,710.96 1.48Uk 4.25% 03-07.03.36 780,000 GBP 1,253,455.31 1,263,005.14 0.17Uk 4.25% 08-07.12.49 273,000 GBP 503,050.21 513,544.83 0.07Uk 4.75% 04-07.12.38 1,000,000 GBP 1,754,810.60 1,769,865.23 0.24Uk 4.75% 05-07.03.20* 4,096,000 GBP 5,300,379.18 4,703,029.94 0.65USA 0.625% 14-15.01.24 /Infl 22,132,300 USD 21,300,490.88 21,642,557.03 2.97USA 1.75% 15-30.04.22 /Tbo* 9,600,000 USD 7,662,563.39 8,436,429.26 1.16USA 2.125% 14-31.12.21 /Tbo* 7,522,000 USD 7,117,436.09 6,668,342.49 0.92USA 2.25% 16-15.08.46 /Tbo* 2,880,000 USD 2,287,191.97 2,389,081.56 0.33USA 2.625% 10-15.11.20 Tbo 12,918,600 USD 11,749,934.42 11,459,582.01 1.57USA 6.25% 99-15.05.30 Bonds 1,212,000 USD 1,657,194.16 1,501,414.94 0.21
477,732,307.61 491,557,306.68 67.46
SharesAb Inbev /Sadr* 2,103 USD 135,761.77 163,435.36 0.02Abb Ltd Zuerich /Namen. 10,819 CHF 233,937.99 190,854.75 0.03Abbott Laboratories Inc 2,551 USD 128,295.86 188,373.96 0.03Activision Blizzard Inc 4,136 USD 258,994.94 171,410.31 0.02Aig 4,285 USD 202,895.15 200,460.80 0.03
Pramerica Sicav
The accompanying notes form an integral part of these financial statements.
224
* Securities partially or totally lent (see Note 9).
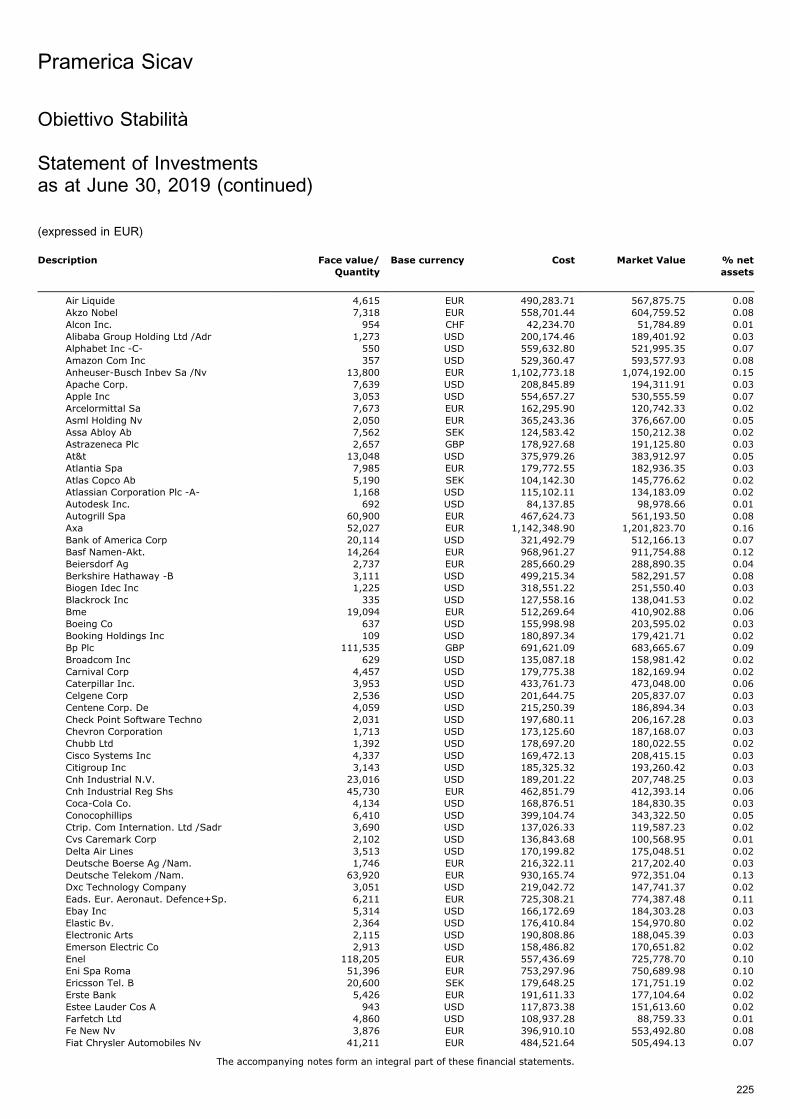
Description Face value/
Quantity
Base currency Cost Market Value % net
assets
Air Liquide 4,615 EUR 490,283.71 567,875.75 0.08Akzo Nobel 7,318 EUR 558,701.44 604,759.52 0.08Alcon Inc. 954 CHF 42,234.70 51,784.89 0.01Alibaba Group Holding Ltd /Adr 1,273 USD 200,174.46 189,401.92 0.03Alphabet Inc -C- 550 USD 559,632.80 521,995.35 0.07Amazon Com Inc 357 USD 529,360.47 593,577.93 0.08Anheuser-Busch Inbev Sa /Nv 13,800 EUR 1,102,773.18 1,074,192.00 0.15Apache Corp. 7,639 USD 208,845.89 194,311.91 0.03Apple Inc 3,053 USD 554,657.27 530,555.59 0.07Arcelormittal Sa 7,673 EUR 162,295.90 120,742.33 0.02Asml Holding Nv 2,050 EUR 365,243.36 376,667.00 0.05Assa Abloy Ab 7,562 SEK 124,583.42 150,212.38 0.02Astrazeneca Plc 2,657 GBP 178,927.68 191,125.80 0.03At&t 13,048 USD 375,979.26 383,912.97 0.05Atlantia Spa 7,985 EUR 179,772.55 182,936.35 0.03Atlas Copco Ab 5,190 SEK 104,142.30 145,776.62 0.02Atlassian Corporation Plc -A- 1,168 USD 115,102.11 134,183.09 0.02Autodesk Inc. 692 USD 84,137.85 98,978.66 0.01Autogrill Spa 60,900 EUR 467,624.73 561,193.50 0.08Axa 52,027 EUR 1,142,348.90 1,201,823.70 0.16Bank of America Corp 20,114 USD 321,492.79 512,166.13 0.07Basf Namen-Akt. 14,264 EUR 968,961.27 911,754.88 0.12Beiersdorf Ag 2,737 EUR 285,660.29 288,890.35 0.04Berkshire Hathaway -B 3,111 USD 499,215.34 582,291.57 0.08Biogen Idec Inc 1,225 USD 318,551.22 251,550.40 0.03Blackrock Inc 335 USD 127,558.16 138,041.53 0.02Bme 19,094 EUR 512,269.64 410,902.88 0.06Boeing Co 637 USD 155,998.98 203,595.02 0.03Booking Holdings Inc 109 USD 180,897.34 179,421.71 0.02Bp Plc 111,535 GBP 691,621.09 683,665.67 0.09Broadcom Inc 629 USD 135,087.18 158,981.42 0.02Carnival Corp 4,457 USD 179,775.38 182,169.94 0.02Caterpillar Inc. 3,953 USD 433,761.73 473,048.00 0.06Celgene Corp 2,536 USD 201,644.75 205,837.07 0.03Centene Corp. De 4,059 USD 215,250.39 186,894.34 0.03Check Point Software Techno 2,031 USD 197,680.11 206,167.28 0.03Chevron Corporation 1,713 USD 173,125.60 187,168.07 0.03Chubb Ltd 1,392 USD 178,697.20 180,022.55 0.02Cisco Systems Inc 4,337 USD 169,472.13 208,415.15 0.03Citigroup Inc 3,143 USD 185,325.32 193,260.42 0.03Cnh Industrial N.V. 23,016 USD 189,201.22 207,748.25 0.03Cnh Industrial Reg Shs 45,730 EUR 462,851.79 412,393.14 0.06Coca-Cola Co. 4,134 USD 168,876.51 184,830.35 0.03Conocophillips 6,410 USD 399,104.74 343,322.50 0.05Ctrip. Com Internation. Ltd /Sadr 3,690 USD 137,026.33 119,587.23 0.02Cvs Caremark Corp 2,102 USD 136,843.68 100,568.95 0.01Delta Air Lines 3,513 USD 170,199.82 175,048.51 0.02Deutsche Boerse Ag /Nam. 1,746 EUR 216,322.11 217,202.40 0.03Deutsche Telekom /Nam. 63,920 EUR 930,165.74 972,351.04 0.13Dxc Technology Company 3,051 USD 219,042.72 147,741.37 0.02Eads. Eur. Aeronaut. Defence+Sp. 6,211 EUR 725,308.21 774,387.48 0.11Ebay Inc 5,314 USD 166,172.69 184,303.28 0.03Elastic Bv. 2,364 USD 176,410.84 154,970.80 0.02Electronic Arts 2,115 USD 190,808.86 188,045.39 0.03Emerson Electric Co 2,913 USD 158,486.82 170,651.82 0.02Enel 118,205 EUR 557,436.69 725,778.70 0.10Eni Spa Roma 51,396 EUR 753,297.96 750,689.98 0.10Ericsson Tel. B 20,600 SEK 179,648.25 171,751.19 0.02Erste Bank 5,426 EUR 191,611.33 177,104.64 0.02Estee Lauder Cos A 943 USD 117,873.38 151,613.60 0.02Farfetch Ltd 4,860 USD 108,937.28 88,759.33 0.01Fe New Nv 3,876 EUR 396,910.10 553,492.80 0.08Fiat Chrysler Automobiles Nv 41,211 EUR 484,521.64 505,494.13 0.07
Pramerica Sicav
The accompanying notes form an integral part of these financial statements.
225
Obiettivo Stabilita
Statement of Investmentsas at June 30, 2019 (continued)
(expressed in EUR)

Description Face value/
Quantity
Base currency Cost Market Value % net
assets
Gaz De France 27,103 EUR 382,785.71 361,554.02 0.05Gilead Sciences Inc 3,096 USD 207,591.45 183,655.95 0.03Glaxosmithkline Plc 7,894 GBP 131,274.27 139,057.82 0.02Glencore Intl 51,000 GBP 182,938.29 155,763.63 0.02Goldman Sachs Group Inc 784 USD 122,256.46 140,843.27 0.02Groupe Danone 2,931 EUR 211,663.85 218,359.50 0.03Hasbro Inc. 4,722 USD 418,431.47 438,160.47 0.06Hess Corp 3,537 USD 183,505.00 197,424.79 0.03Honeywell International Inc. 1,645 USD 196,159.08 252,173.63 0.03Humana Inc. 637 USD 149,033.41 148,385.37 0.02Iberdrola Sa 46,441 EUR 299,273.91 407,101.81 0.06Imi Plc 10,283 GBP 106,444.38 119,259.77 0.02Inditex 13,204 EUR 387,430.18 349,245.80 0.05Infineon Technologies /Nam. 36,795 EUR 713,861.73 572,162.25 0.08Ing Group Nv 106,843 EUR 1,176,378.02 1,089,371.23 0.15Intesa Sanpaolo 332,155 EUR 771,352.61 625,115.71 0.09Jeronimo Martins Sgps Sa 38,389 EUR 570,287.22 543,780.19 0.07Johnson & Johnson 3,679 USD 447,919.54 449,917.57 0.06Jpmorgan Chase & Co 6,279 USD 536,137.54 616,377.38 0.08Kering Act. 1,436 EUR 756,820.12 746,863.60 0.10Lafargeholcim N Namen-Akt. 20,282 CHF 918,832.61 870,637.44 0.12Levi Strauss Class -A- 7,101 USD 143,744.48 130,186.04 0.02Lilly (Eli) & Co 3,059 USD 223,894.30 297,573.63 0.04Linde Plc 676 USD 82,365.26 119,185.88 0.02Lockheed Martin Corp 726 USD 201,547.28 231,741.19 0.03Lvmh Moet Hennessy Eur 0.3 3,033 EUR 880,406.83 1,135,251.90 0.16Marvell Technology Group 9,767 USD 156,776.09 204,704.79 0.03Medtronic Holdings Limited 1,819 USD 126,103.25 155,546.94 0.02Merck 5,486 USD 306,684.48 403,899.46 0.06Metlife Inc 3,515 USD 151,971.89 153,297.08 0.02Microsoft Corp 6,597 USD 624,053.88 775,954.10 0.11Mondelez International Inc Wi 3,890 USD 142,889.06 184,099.57 0.03Nexi S.P.A. 57,693 EUR 508,226.27 522,756.27 0.07Nordea Bank Abp 106,827 SEK 930,495.75 682,410.88 0.09Novartis Ag Basel /Nam. 4,612 CHF 299,538.04 370,455.09 0.05Nvidia Corp 1,113 USD 201,409.86 160,495.21 0.02Nxp Semiconductor 2,265 USD 191,021.60 194,122.97 0.03Parker-Hannifin 1,150 USD 159,757.43 171,666.96 0.02Pernod-Ricard 4,915 EUR 640,363.79 796,475.75 0.11Peugeot Sa 34,149 EUR 739,189.50 740,008.83 0.10Philip Morris Int. 2,739 USD 227,723.77 188,860.89 0.03Phillips 66 - Shs When Issued 2,187 USD 208,522.24 179,622.43 0.02Pinterest Inc -A- 8,120 USD 178,822.15 194,070.07 0.03Pioneer Natural Resources Co 2,782 USD 365,791.91 375,835.03 0.05Prada Shs* 85,373 HKD 261,357.41 231,710.17 0.03Procter & Gamble Co 2,680 USD 214,583.89 258,022.65 0.04Prysmian Spa 76,410 EUR 1,617,202.42 1,386,841.50 0.19Ptc Inc Shs 1,370 USD 105,837.85 107,973.66 0.01Public Storage 361 USD 64,165.04 75,493.34 0.01Qualcomm Inc 3,721 USD 173,942.74 248,534.96 0.03Raytheon Company 911 USD 139,150.04 139,085.68 0.02Red Electrica Corporacion. Sa 9,441 EUR 185,892.67 172,911.92 0.02Roy. Philips Electr. /Eur 0.2 12,424 EUR 432,291.96 474,410.44 0.07Royal Dutch Shell Plc /-A- 17,057 EUR 442,731.01 489,706.47 0.07Rwe Ag (Neu). Essen A 33,071 EUR 690,556.89 716,648.57 0.10Ryanair Holdings Plc 43,431 EUR 490,184.14 439,304.57 0.06Salesforce Com Inc 991 USD 142,139.70 132,026.02 0.02Sampo Plc A 57,034 EUR 2,431,722.29 2,366,911.00 0.32Sandvik Ab 10,285 SEK 143,771.81 166,050.40 0.02Sanofi-Aventis 19,105 EUR 1,407,521.53 1,450,260.55 0.20Sap Ag 14,175 EUR 1,339,594.36 1,711,773.00 0.23Scor Se 15,419 EUR 497,966.72 594,556.64 0.08
Pramerica Sicav
The accompanying notes form an integral part of these financial statements.
226
Obiettivo Stabilita
Statement of Investmentsas at June 30, 2019 (continued)
(expressed in EUR)
* Securities partially or totally lent (see Note 9).
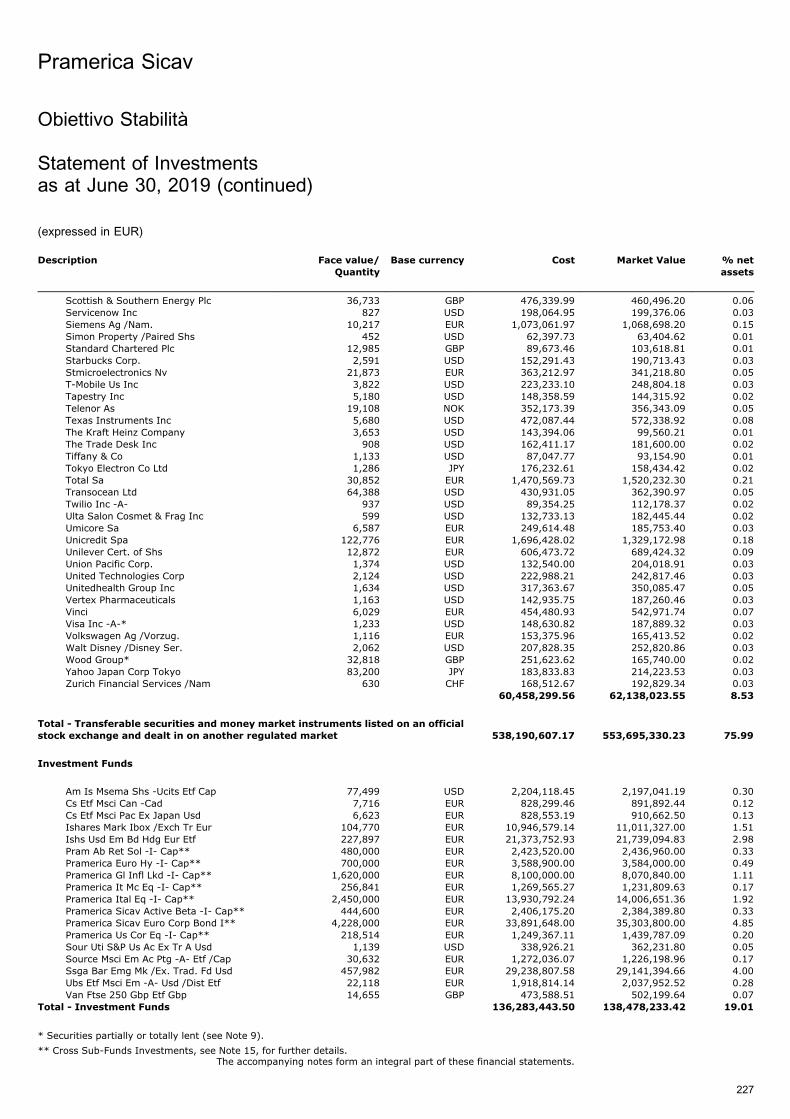
Description Face value/
Quantity
Base currency Cost Market Value % net
assets
Scottish & Southern Energy Plc 36,733 GBP 476,339.99 460,496.20 0.06Servicenow Inc 827 USD 198,064.95 199,376.06 0.03Siemens Ag /Nam. 10,217 EUR 1,073,061.97 1,068,698.20 0.15Simon Property /Paired Shs 452 USD 62,397.73 63,404.62 0.01Standard Chartered Plc 12,985 GBP 89,673.46 103,618.81 0.01Starbucks Corp. 2,591 USD 152,291.43 190,713.43 0.03Stmicroelectronics Nv 21,873 EUR 363,212.97 341,218.80 0.05T-Mobile Us Inc 3,822 USD 223,233.10 248,804.18 0.03Tapestry Inc 5,180 USD 148,358.59 144,315.92 0.02Telenor As 19,108 NOK 352,173.39 356,343.09 0.05Texas Instruments Inc 5,680 USD 472,087.44 572,338.92 0.08The Kraft Heinz Company 3,653 USD 143,394.06 99,560.21 0.01The Trade Desk Inc 908 USD 162,411.17 181,600.00 0.02Tiffany & Co 1,133 USD 87,047.77 93,154.90 0.01Tokyo Electron Co Ltd 1,286 JPY 176,232.61 158,434.42 0.02Total Sa 30,852 EUR 1,470,569.73 1,520,232.30 0.21Transocean Ltd 64,388 USD 430,931.05 362,390.97 0.05Twilio Inc -A- 937 USD 89,354.25 112,178.37 0.02Ulta Salon Cosmet & Frag Inc 599 USD 132,733.13 182,445.44 0.02Umicore Sa 6,587 EUR 249,614.48 185,753.40 0.03Unicredit Spa 122,776 EUR 1,696,428.02 1,329,172.98 0.18Unilever Cert. of Shs 12,872 EUR 606,473.72 689,424.32 0.09Union Pacific Corp. 1,374 USD 132,540.00 204,018.91 0.03United Technologies Corp 2,124 USD 222,988.21 242,817.46 0.03Unitedhealth Group Inc 1,634 USD 317,363.67 350,085.47 0.05Vertex Pharmaceuticals 1,163 USD 142,935.75 187,260.46 0.03Vinci 6,029 EUR 454,480.93 542,971.74 0.07Visa Inc -A-* 1,233 USD 148,630.82 187,889.32 0.03Volkswagen Ag /Vorzug. 1,116 EUR 153,375.96 165,413.52 0.02Walt Disney /Disney Ser. 2,062 USD 207,828.35 252,820.86 0.03Wood Group* 32,818 GBP 251,623.62 165,740.00 0.02Yahoo Japan Corp Tokyo 83,200 JPY 183,833.83 214,223.53 0.03Zurich Financial Services /Nam 630 CHF 168,512.67 192,829.34 0.03
60,458,299.56 62,138,023.55 8.53
Total - Transferable securities and money market instruments listed on an officialstock exchange and dealt in on another regulated market 538,190,607.17 553,695,330.23 75.99
Investment Funds
Am Is Msema Shs -Ucits Etf Cap 77,499 USD 2,204,118.45 2,197,041.19 0.30Cs Etf Msci Can -Cad 7,716 EUR 828,299.46 891,892.44 0.12Cs Etf Msci Pac Ex Japan Usd 6,623 EUR 828,553.19 910,662.50 0.13Ishares Mark Ibox /Exch Tr Eur 104,770 EUR 10,946,579.14 11,011,327.00 1.51Ishs Usd Em Bd Hdg Eur Etf 227,897 EUR 21,373,752.93 21,739,094.83 2.98Pram Ab Ret Sol -I- Cap** 480,000 EUR 2,423,520.00 2,436,960.00 0.33Pramerica Euro Hy -I- Cap** 700,000 EUR 3,588,900.00 3,584,000.00 0.49Pramerica Gl Infl Lkd -I- Cap** 1,620,000 EUR 8,100,000.00 8,070,840.00 1.11Pramerica It Mc Eq -I- Cap** 256,841 EUR 1,269,565.27 1,231,809.63 0.17Pramerica Ital Eq -I- Cap** 2,450,000 EUR 13,930,792.24 14,006,651.36 1.92Pramerica Sicav Active Beta -I- Cap** 444,600 EUR 2,406,175.20 2,384,389.80 0.33Pramerica Sicav Euro Corp Bond I** 4,228,000 EUR 33,891,648.00 35,303,800.00 4.85Pramerica Us Cor Eq -I- Cap** 218,514 EUR 1,249,367.11 1,439,787.09 0.20Sour Uti S&P Us Ac Ex Tr A Usd 1,139 USD 338,926.21 362,231.80 0.05Source Msci Em Ac Ptg -A- Etf /Cap 30,632 EUR 1,272,036.07 1,226,198.96 0.17Ssga Bar Emg Mk /Ex. Trad. Fd Usd 457,982 EUR 29,238,807.58 29,141,394.66 4.00Ubs Etf Msci Em -A- Usd /Dist Etf 22,118 EUR 1,918,814.14 2,037,952.52 0.28Van Ftse 250 Gbp Etf Gbp 14,655 GBP 473,588.51 502,199.64 0.07
Total - Investment Funds 136,283,443.50 138,478,233.42 19.01
Pramerica Sicav
The accompanying notes form an integral part of these financial statements.
227
Obiettivo Stabilita
Statement of Investmentsas at June 30, 2019 (continued)
(expressed in EUR)
* Securities partially or totally lent (see Note 9).
** Cross Sub-Funds Investments, see Note 15, for further details.

Description Face value/
Quantity
Base currency Cost Market Value % net
assets
Financial Instruments
Options Contracts
Call Euro Stoxx 50 Pr 19/07/19 3300 670 EUR 463,439.00 1,196,620.00 0.16Call Euro Stoxx 50 Pr 19/07/19 3500 631 EUR 302,880.00 162,798.00 0.02Call Euro Stoxx 50 Pr 20/12/19 3550 (2,270) EUR (1,244,840.50) (1,816,000.00) (0.25)Call Euro Stoxx 50 Pr 20/12/19 3700 (631) EUR (243,061.17) (187,407.00) (0.02)Put 10y Treasury Notes Usa 26/07/19 127 415 USD 119,679.98 91,096.67 0.01
(601,902.69) (552,892.33) (0.08)
Total - Financial Instruments (601,902.69) (552,892.33) (0.08)
TOTAL INVESTMENT PORTFOLIO 673,872,147.98 691,620,671.32 94.92
Pramerica Sicav
The accompanying notes form an integral part of these financial statements.
228
Obiettivo Stabilita
Statement of Investmentsas at June 30, 2019 (continued)
(expressed in EUR)

Obiettivo Stabilita
Geographical and Economic Classification of Investmentsas at June 30, 2019
(expressed as a percentage of net assets)
Economic breakdown %
States, Provinces and Municipalities 66.85
Investment Funds 19.01
Petrol 0.75
Banks and Financial Institutions 0.74
Internet Software 0.72
Insurance 0.64
Supranational 0.61
Pharmaceuticals and Cosmetics 0.56
Communications 0.50
Electronic Semiconductor 0.43
Public Services 0.39
Retail 0.37
Holding and Finance Companies 0.31
Tobacco and Spirits 0.31
Chemicals 0.28
Automobile Industry 0.27
Aerospace Technology 0.25
Textile 0.23
Electronics and Electrical Equipment 0.20
Construction, Building Materials 0.19
Consumer Goods 0.19
Mechanics, Machinery 0.16
Leisure 0.15
Transportation 0.14
Biotechnology 0.12
Office Equipment, Computers 0.12
Healthcare Education and Social Services 0.11
Food and Distilleries 0.10
Business Houses 0.08
Other Services 0.06
Non-Ferrous Metals 0.03
Mines, Heavy Industries 0.02
Real Estate Companies 0.02
Miscellaneous 0.01
Cash and Other Assets / (Liabilities) 5.08
100.00
Geographical breakdown %
Italy 31.22
United States of America 11.99
Luxembourg 10.61
Ireland 9.11
Japan 6.25
Spain 6.17
Great Britain 5.22
France 5.07
Germany 3.82
Netherlands 1.23
Belgium 0.98
Portugal 0.97
Austria 0.86
Australia 0.41
Finland 0.41
Switzerland 0.31
Sweden 0.08
Cayman Islands 0.06
Norway 0.05
Bermuda 0.03
Israel 0.03
Jersey 0.02
Panama 0.02
Cash and Other Assets / (Liabilities) 5.08
100.00
Pramerica Sicav
229

Obiettivo Controllo
Statement of Investmentsas at June 30, 2019
(expressed in EUR)
Description Face value/
Quantity
Base currency Cost Market Value % net
assets
Transferable securities and money market instruments listed on an official stock exchange and dealt in on another regulated market
Bonds
Australia 3.25% 13-21.04.25 2,910,000 AUD 2,140,736.81 2,008,538.49 0.31Austria 0.75% 16-20.10.26 3,210,000 EUR 3,269,104.00 3,454,923.00 0.53Austria 1.5% 16-20.02.47 510,000 EUR 505,864.00 615,457.80 0.09Austria 4.15% 06-15.03.37 659,000 EUR 1,039,826.51 1,082,238.80 0.17Belgium 0.8% 17-22.06.27 Regs 4,440,000 EUR 4,465,484.50 4,772,982.24 0.73Btps 3.35% 18-01.03.35 /Btp 6,040,000 EUR 6,026,992.56 6,665,340.53 1.02Btps 3.85% 18-01.09.49 /Btp 2,185,000 EUR 2,176,128.90 2,525,051.55 0.39Cassa Depo 2.125% 19-21.03.26 3,100,000 EUR 3,077,928.00 3,165,565.00 0.48Efsf 1.875% 13-23.05.23* 3,423,000 EUR 3,824,478.29 3,737,176.63 0.57France 1.75% 16-25.06.39 Oat 4,709,000 EUR 4,834,146.67 5,736,833.43 0.88France 2.25% 12-25.10.22 Oat* 4,076,000 EUR 4,580,831.77 4,474,477.91 0.68France O.A. 2% 25.05.48 /Oat 10,547,630 EUR 12,641,893.84 13,579,356.39 2.08Germany 1.5% 13-15.05.23* 7,743,000 EUR 8,584,008.51 8,422,998.00 1.29Germany 2.5% 14-15.08.46* 4,740,000 EUR 6,372,892.10 7,567,096.21 1.16Germany 4% 05-04.01.37 1,893,000 EUR 3,045,721.01 3,229,579.15 0.49Italy 0% 19-29.06.21 Tb 13,212,000 EUR 13,085,825.40 13,102,736.76 2.00Italy 0.05% 16-15.10.19 /Btp 22,650,000 EUR 22,596,736.62 22,656,342.00 3.47Italy 0.35% 17-15.06.20 /Btp 12,942,000 EUR 12,985,226.28 12,988,177.06 1.99Italy 0.65% 15-01.11.20 /Btp 21,440,000 EUR 21,690,876.20 21,620,739.20 3.31Italy 0.65% 16-15.10.23 /Btp 19,047,000 EUR 18,506,241.41 18,725,715.20 2.87Italy 1.5% 15-01.06.25 /Btp 3,199,000 EUR 3,175,119.89 3,204,003.24 0.49Italy 1.85% 17-15.05.24 /Btp 24,250,000 EUR 24,170,217.50 24,925,471.63 3.81Italy 2.2% 17-01.06.27 /Btp 9,472,000 EUR 9,617,165.30 9,793,479.68 1.50Italy 2.7% 16-01.03.47 /Btp 1,826,000 EUR 1,606,103.72 1,784,538.84 0.27Italy 2.8% 16-01.03.67 /Btp 2,242,000 EUR 1,949,832.88 2,100,619.48 0.32Italy 3.45% 17-01.03.48 Btp 1,049,000 EUR 1,060,594.45 1,155,683.30 0.18Japan 0.1% 16-20.09.21 479,600,000 JPY 3,945,470.98 3,935,695.36 0.60Japan 0.1% 17-10.03.27 /Infl 1,124,900,000 JPY 9,041,855.31 9,729,940.16 1.49Japan 1.2% 14-20.12.34 1,044,650,000 JPY 9,751,622.44 9,968,565.85 1.53Japan 1.5% 14-20.12.44 728,500,000 JPY 7,167,895.82 7,646,621.93 1.17Japan 1.7% 14-20.03.54 132,200,000 JPY 1,378,643.41 1,528,270.46 0.23Nether Gove 0.5% 19-15.01.40 2,683,000 EUR 2,653,218.70 2,815,373.85 0.43Portugal 2.125% 18-17.10.28* 4,877,000 EUR 4,871,635.30 5,653,906.10 0.86Spain 1.45% 19-30.04.29 7,806,000 EUR 8,161,173.00 8,597,809.42 1.32Spain 2.9% 16-31.10.46 18,608,000 EUR 22,270,589.20 25,282,391.87 3.87Spain 4.2% 05-31.01.37 3,334,000 EUR 4,669,267.00 5,118,490.16 0.78Tsy 0.75% 18-15.07.28 /Infl 11,000,000 USD 10,049,410.73 10,238,960.52 1.57Tsy Infl Ix 1% 15.02.49 /Infl 1,862,300 USD 1,672,259.46 1,755,474.86 0.27Uk 0.125% 15-22.03.26 /Infl 7,474,000 GBP 10,521,562.81 11,112,639.00 1.70Uk 1.5% 16-22.07.26 6,156,000 GBP 7,234,089.91 7,261,834.87 1.11Uk 4.25% 03-07.03.36 528,000 GBP 848,356.17 854,957.32 0.13Uk 4.25% 08-07.12.49 187,000 GBP 345,007.95 351,768.80 0.05Uk 4.75% 04-07.12.38 670,000 GBP 1,176,163.01 1,185,809.71 0.18Uk 4.75% 05-07.03.20* 2,762,000 GBP 3,547,687.66 3,171,330.25 0.49USA 0.625% 14-15.01.24 /Infl 15,835,600 USD 15,240,442.85 15,485,190.25 2.37USA 1.75% 15-30.04.22 /Tbo* 6,450,000 USD 5,148,284.78 5,668,225.91 0.87USA 2.125% 14-31.12.21 /Tbo* 4,644,000 USD 4,287,357.06 4,116,961.25 0.63USA 2.25% 16-15.08.46 /Tbo* 1,980,000 USD 1,555,761.48 1,642,493.57 0.25USA 2.625% 10-15.11.20 Tbo 9,025,000 USD 8,089,455.91 8,005,722.57 1.22USA 6.25% 99-15.05.30 Bonds 820,000 USD 1,058,004.20 1,015,808.79 0.16
341,715,192.26 355,239,364.35 54.36
Shares
Ab Inbev /Sadr* 3,784 USD 244,378.39 294,074.84 0.04Abb Ltd Zuerich /Namen. 19,357 CHF 418,554.20 341,471.05 0.05Abbott Laboratories Inc 4,578 USD 232,752.59 338,054.09 0.05Activision Blizzard Inc 7,424 USD 464,081.73 307,676.53 0.05Aig 7,691 USD 359,472.58 359,800.23 0.06Air Liquide 12,505 EUR 1,328,466.95 1,538,740.25 0.24
Pramerica Sicav
The accompanying notes form an integral part of these financial statements.
230
* Securities partially or totally lent (see Note 9).

Description Face value/
Quantity
Base currency Cost Market Value % net
assets
Akzo Nobel 19,654 EUR 1,497,102.09 1,624,206.56 0.25Alcon Inc. 1,660 CHF 73,487.50 90,107.87 0.01Alibaba Group Holding Ltd /Adr 2,285 USD 359,307.65 339,971.24 0.05Alphabet Inc -C- 987 USD 1,004,542.56 936,744.38 0.14Amazon Com Inc 641 USD 950,476.36 1,065,779.99 0.16Anheuser-Busch Inbev Sa /Nv 37,392 EUR 2,978,222.91 2,910,593.28 0.45Apache Corp. 13,765 USD 376,346.83 350,137.90 0.05Apple Inc 5,479 USD 1,034,059.03 952,150.04 0.15Arcelormittal Sa 20,704 EUR 437,921.84 325,798.14 0.05Asml Holding Nv 5,512 EUR 982,059.21 1,012,774.88 0.15Assa Abloy Ab 13,572 SEK 223,323.02 269,595.67 0.04Astrazeneca Plc 7,195 GBP 484,523.71 517,557.45 0.08At&t 23,417 USD 674,320.64 689,001.38 0.11Atlantia Spa 21,547 EUR 485,104.48 493,641.77 0.08Atlas Copco Ab 9,315 SEK 186,914.36 261,639.54 0.04Atlassian Corporation Plc -A- 2,096 USD 206,553.11 240,794.31 0.04Autodesk Inc. 1,243 USD 151,132.00 177,789.71 0.03Autogrill Spa 187,950 EUR 1,630,659.99 1,731,959.25 0.26Axa 139,728 EUR 3,067,625.44 3,227,716.80 0.49Bank of America Corp 36,185 USD 644,787.79 921,384.67 0.14Basf Namen-Akt. 38,311 EUR 2,603,330.46 2,448,839.12 0.37Beiersdorf Ag 7,358 EUR 767,887.19 776,636.90 0.12Berkshire Hathaway -B 5,597 USD 898,411.15 1,047,600.75 0.16Biogen Idec Inc 2,199 USD 570,083.62 451,558.64 0.07Blackrock Inc 601 USD 227,921.17 247,650.63 0.04Bme 45,016 EUR 1,294,960.37 968,744.32 0.15Boeing Co 1,145 USD 281,337.05 365,959.65 0.06Booking Holdings Inc 197 USD 326,942.89 324,275.94 0.05Bp Plc 200,168 GBP 1,240,966.80 1,226,951.09 0.19Broadcom Inc 1,130 USD 242,684.44 285,610.50 0.04Carnival Corp 7,990 USD 322,280.76 326,573.45 0.05Caterpillar Inc. 7,111 USD 780,556.01 850,959.86 0.13Celgene Corp 4,552 USD 358,497.11 369,467.80 0.06Centene Corp. De 7,260 USD 384,695.77 334,282.55 0.05Check Point Software Techno 3,646 USD 365,339.56 370,106.30 0.06Chevron Corporation 3,089 USD 312,134.33 337,514.41 0.05Chubb Ltd 2,499 USD 318,945.59 323,187.03 0.05Cisco Systems Inc 7,783 USD 322,148.55 374,013.16 0.06Citigroup Inc 5,655 USD 333,422.66 347,721.18 0.05Cnh Industrial N.V. 41,356 USD 339,963.69 373,289.74 0.06Cnh Industrial Reg Shs 123,391 EUR 1,229,089.58 1,112,740.04 0.17Coca-Cola Co. 7,419 USD 302,996.71 331,702.06 0.05Conocophillips 11,505 USD 714,187.52 616,213.01 0.09Ctrip. Com Internation. Ltd /Sadr 6,624 USD 245,978.97 214,673.67 0.03Cvs Caremark Corp 3,773 USD 245,712.52 180,516.96 0.03Delta Air Lines 6,304 USD 305,268.33 314,120.64 0.05Deutsche Boerse Ag /Nam. 4,712 EUR 583,797.10 586,172.80 0.09Deutsche Telekom /Nam. 172,472 EUR 2,626,011.39 2,623,644.06 0.40Dxc Technology Company 5,475 USD 394,360.64 265,120.95 0.04Eads. Eur. Aeronaut. Defence+Sp. 16,760 EUR 1,957,395.92 2,089,636.80 0.32Ebay Inc 9,537 USD 298,229.02 330,767.85 0.05Elastic Bv. 4,244 USD 316,659.40 278,213.22 0.04Electronic Arts 3,796 USD 342,291.72 337,503.70 0.05Emerson Electric Co 5,241 USD 285,162.42 307,032.68 0.05Enel 317,686 EUR 1,495,530.54 1,950,592.04 0.30Eni Spa Roma 139,256 EUR 1,961,528.85 2,033,973.14 0.31Ericsson Tel. B 55,395 SEK 483,088.11 461,852.28 0.07Erste Bank 14,574 EUR 515,020.34 475,695.36 0.07Estee Lauder Cos A 1,693 USD 213,441.77 272,197.06 0.04Farfetch Ltd 8,722 USD 195,501.19 159,291.95 0.02Fe New Nv 10,502 EUR 1,028,435.69 1,499,685.60 0.23Fiat Chrysler Automobiles Nv 110,681 EUR 1,335,151.60 1,357,613.15 0.21Gaz De France 73,435 EUR 1,037,149.70 979,622.90 0.15
Pramerica Sicav
The accompanying notes form an integral part of these financial statements.
231
Obiettivo Controllo
Statement of Investmentsas at June 30, 2019 (continued)
(expressed in EUR)
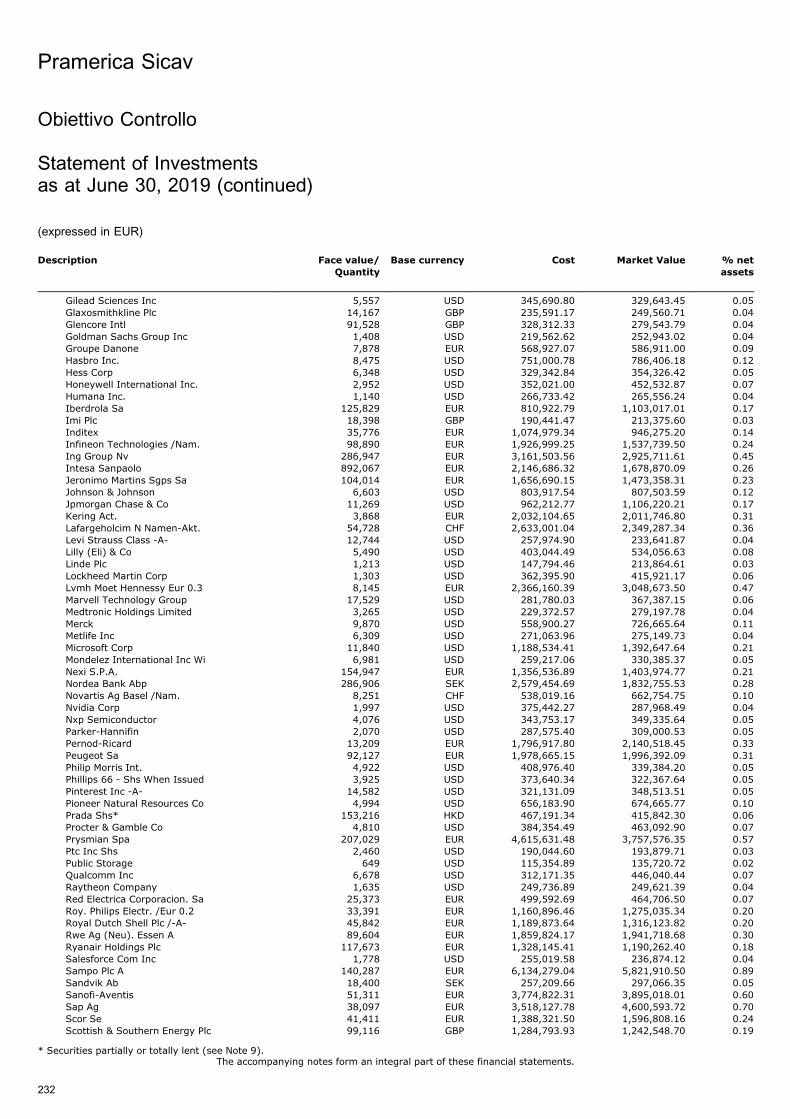
Description Face value/
Quantity
Base currency Cost Market Value % net
assets
Gilead Sciences Inc 5,557 USD 345,690.80 329,643.45 0.05Glaxosmithkline Plc 14,167 GBP 235,591.17 249,560.71 0.04Glencore Intl 91,528 GBP 328,312.33 279,543.79 0.04Goldman Sachs Group Inc 1,408 USD 219,562.62 252,943.02 0.04Groupe Danone 7,878 EUR 568,927.07 586,911.00 0.09Hasbro Inc. 8,475 USD 751,000.78 786,406.18 0.12Hess Corp 6,348 USD 329,342.84 354,326.42 0.05Honeywell International Inc. 2,952 USD 352,021.00 452,532.87 0.07Humana Inc. 1,140 USD 266,733.42 265,556.24 0.04Iberdrola Sa 125,829 EUR 810,922.79 1,103,017.01 0.17Imi Plc 18,398 GBP 190,441.47 213,375.60 0.03Inditex 35,776 EUR 1,074,979.34 946,275.20 0.14Infineon Technologies /Nam. 98,890 EUR 1,926,999.25 1,537,739.50 0.24Ing Group Nv 286,947 EUR 3,161,503.56 2,925,711.61 0.45Intesa Sanpaolo 892,067 EUR 2,146,686.32 1,678,870.09 0.26Jeronimo Martins Sgps Sa 104,014 EUR 1,656,690.15 1,473,358.31 0.23Johnson & Johnson 6,603 USD 803,917.54 807,503.59 0.12Jpmorgan Chase & Co 11,269 USD 962,212.77 1,106,220.21 0.17Kering Act. 3,868 EUR 2,032,104.65 2,011,746.80 0.31Lafargeholcim N Namen-Akt. 54,728 CHF 2,633,001.04 2,349,287.34 0.36Levi Strauss Class -A- 12,744 USD 257,974.90 233,641.87 0.04Lilly (Eli) & Co 5,490 USD 403,044.49 534,056.63 0.08Linde Plc 1,213 USD 147,794.46 213,864.61 0.03Lockheed Martin Corp 1,303 USD 362,395.90 415,921.17 0.06Lvmh Moet Hennessy Eur 0.3 8,145 EUR 2,366,160.39 3,048,673.50 0.47Marvell Technology Group 17,529 USD 281,780.03 367,387.15 0.06Medtronic Holdings Limited 3,265 USD 229,372.57 279,197.78 0.04Merck 9,870 USD 558,900.27 726,665.64 0.11Metlife Inc 6,309 USD 271,063.96 275,149.73 0.04Microsoft Corp 11,840 USD 1,188,534.41 1,392,647.64 0.21Mondelez International Inc Wi 6,981 USD 259,217.06 330,385.37 0.05Nexi S.P.A. 154,947 EUR 1,356,536.89 1,403,974.77 0.21Nordea Bank Abp 286,906 SEK 2,579,454.69 1,832,755.53 0.28Novartis Ag Basel /Nam. 8,251 CHF 538,019.16 662,754.75 0.10Nvidia Corp 1,997 USD 375,442.27 287,968.49 0.04Nxp Semiconductor 4,076 USD 343,753.17 349,335.64 0.05Parker-Hannifin 2,070 USD 287,575.40 309,000.53 0.05Pernod-Ricard 13,209 EUR 1,796,917.80 2,140,518.45 0.33Peugeot Sa 92,127 EUR 1,978,665.15 1,996,392.09 0.31Philip Morris Int. 4,922 USD 408,976.40 339,384.20 0.05Phillips 66 - Shs When Issued 3,925 USD 373,640.34 322,367.64 0.05Pinterest Inc -A- 14,582 USD 321,131.09 348,513.51 0.05Pioneer Natural Resources Co 4,994 USD 656,183.90 674,665.77 0.10Prada Shs* 153,216 HKD 467,191.34 415,842.30 0.06Procter & Gamble Co 4,810 USD 384,354.49 463,092.90 0.07Prysmian Spa 207,029 EUR 4,615,631.48 3,757,576.35 0.57Ptc Inc Shs 2,460 USD 190,044.60 193,879.71 0.03Public Storage 649 USD 115,354.89 135,720.72 0.02Qualcomm Inc 6,678 USD 312,171.35 446,040.44 0.07Raytheon Company 1,635 USD 249,736.89 249,621.39 0.04Red Electrica Corporacion. Sa 25,373 EUR 499,592.69 464,706.50 0.07Roy. Philips Electr. /Eur 0.2 33,391 EUR 1,160,896.46 1,275,035.34 0.20Royal Dutch Shell Plc /-A- 45,842 EUR 1,189,873.64 1,316,123.82 0.20Rwe Ag (Neu). Essen A 89,604 EUR 1,859,824.17 1,941,718.68 0.30Ryanair Holdings Plc 117,673 EUR 1,328,145.41 1,190,262.40 0.18Salesforce Com Inc 1,778 USD 255,019.58 236,874.12 0.04Sampo Plc A 140,287 EUR 6,134,279.04 5,821,910.50 0.89Sandvik Ab 18,400 SEK 257,209.66 297,066.35 0.05Sanofi-Aventis 51,311 EUR 3,774,822.31 3,895,018.01 0.60Sap Ag 38,097 EUR 3,518,127.78 4,600,593.72 0.70Scor Se 41,411 EUR 1,388,321.50 1,596,808.16 0.24Scottish & Southern Energy Plc 99,116 GBP 1,284,793.93 1,242,548.70 0.19
Pramerica Sicav
The accompanying notes form an integral part of these financial statements.
232
Obiettivo Controllo
Statement of Investmentsas at June 30, 2019 (continued)
(expressed in EUR)
* Securities partially or totally lent (see Note 9).
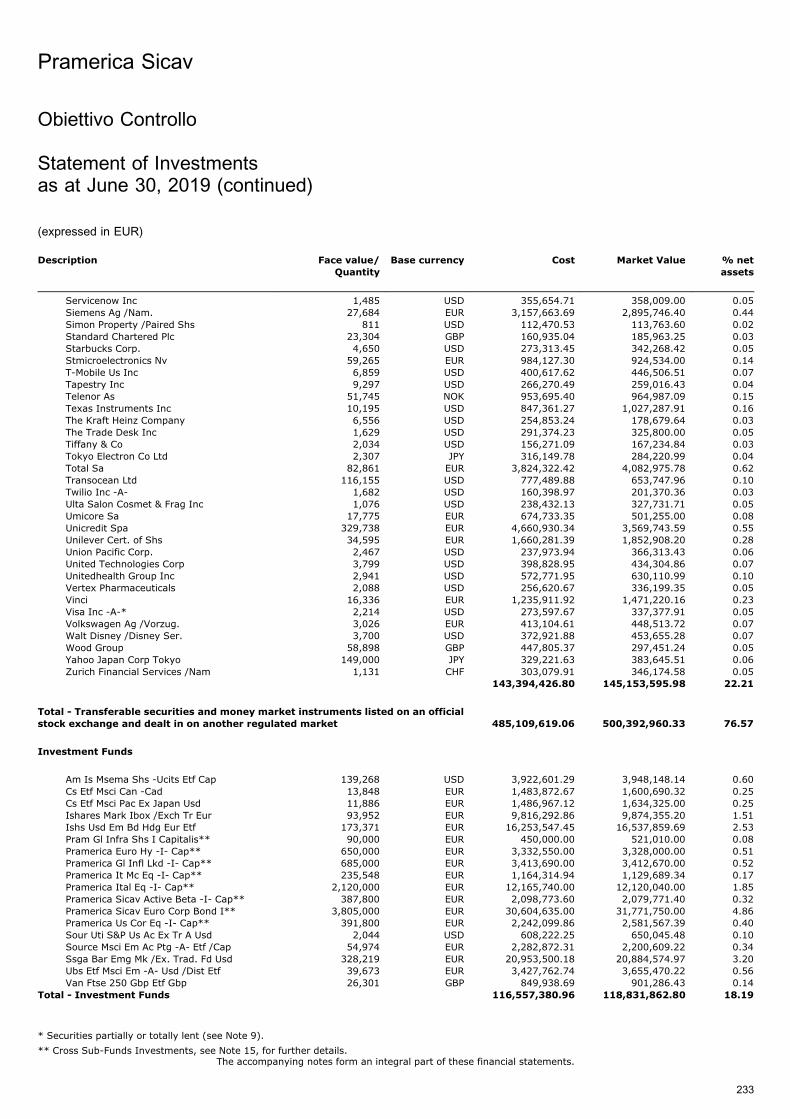
Description Face value/
Quantity
Base currency Cost Market Value % net
assets
Servicenow Inc 1,485 USD 355,654.71 358,009.00 0.05Siemens Ag /Nam. 27,684 EUR 3,157,663.69 2,895,746.40 0.44Simon Property /Paired Shs 811 USD 112,470.53 113,763.60 0.02Standard Chartered Plc 23,304 GBP 160,935.04 185,963.25 0.03Starbucks Corp. 4,650 USD 273,313.45 342,268.42 0.05Stmicroelectronics Nv 59,265 EUR 984,127.30 924,534.00 0.14T-Mobile Us Inc 6,859 USD 400,617.62 446,506.51 0.07Tapestry Inc 9,297 USD 266,270.49 259,016.43 0.04Telenor As 51,745 NOK 953,695.40 964,987.09 0.15Texas Instruments Inc 10,195 USD 847,361.27 1,027,287.91 0.16The Kraft Heinz Company 6,556 USD 254,853.24 178,679.64 0.03The Trade Desk Inc 1,629 USD 291,374.23 325,800.00 0.05Tiffany & Co 2,034 USD 156,271.09 167,234.84 0.03Tokyo Electron Co Ltd 2,307 JPY 316,149.78 284,220.99 0.04Total Sa 82,861 EUR 3,824,322.42 4,082,975.78 0.62Transocean Ltd 116,155 USD 777,489.88 653,747.96 0.10Twilio Inc -A- 1,682 USD 160,398.97 201,370.36 0.03Ulta Salon Cosmet & Frag Inc 1,076 USD 238,432.13 327,731.71 0.05Umicore Sa 17,775 EUR 674,733.35 501,255.00 0.08Unicredit Spa 329,738 EUR 4,660,930.34 3,569,743.59 0.55Unilever Cert. of Shs 34,595 EUR 1,660,281.39 1,852,908.20 0.28Union Pacific Corp. 2,467 USD 237,973.94 366,313.43 0.06United Technologies Corp 3,799 USD 398,828.95 434,304.86 0.07Unitedhealth Group Inc 2,941 USD 572,771.95 630,110.99 0.10Vertex Pharmaceuticals 2,088 USD 256,620.67 336,199.35 0.05Vinci 16,336 EUR 1,235,911.92 1,471,220.16 0.23Visa Inc -A-* 2,214 USD 273,597.67 337,377.91 0.05Volkswagen Ag /Vorzug. 3,026 EUR 413,104.61 448,513.72 0.07Walt Disney /Disney Ser. 3,700 USD 372,921.88 453,655.28 0.07Wood Group 58,898 GBP 447,805.37 297,451.24 0.05Yahoo Japan Corp Tokyo 149,000 JPY 329,221.63 383,645.51 0.06Zurich Financial Services /Nam 1,131 CHF 303,079.91 346,174.58 0.05
143,394,426.80 145,153,595.98 22.21
Total - Transferable securities and money market instruments listed on an official
stock exchange and dealt in on another regulated market 485,109,619.06 500,392,960.33 76.57
Investment Funds
Am Is Msema Shs -Ucits Etf Cap 139,268 USD 3,922,601.29 3,948,148.14 0.60Cs Etf Msci Can -Cad 13,848 EUR 1,483,872.67 1,600,690.32 0.25Cs Etf Msci Pac Ex Japan Usd 11,886 EUR 1,486,967.12 1,634,325.00 0.25Ishares Mark Ibox /Exch Tr Eur 93,952 EUR 9,816,292.86 9,874,355.20 1.51Ishs Usd Em Bd Hdg Eur Etf 173,371 EUR 16,253,547.45 16,537,859.69 2.53Pram Gl Infra Shs I Capitalis** 90,000 EUR 450,000.00 521,010.00 0.08Pramerica Euro Hy -I- Cap** 650,000 EUR 3,332,550.00 3,328,000.00 0.51Pramerica Gl Infl Lkd -I- Cap** 685,000 EUR 3,413,690.00 3,412,670.00 0.52Pramerica It Mc Eq -I- Cap** 235,548 EUR 1,164,314.94 1,129,689.34 0.17Pramerica Ital Eq -I- Cap** 2,120,000 EUR 12,165,740.00 12,120,040.00 1.85Pramerica Sicav Active Beta -I- Cap** 387,800 EUR 2,098,773.60 2,079,771.40 0.32Pramerica Sicav Euro Corp Bond I** 3,805,000 EUR 30,604,635.00 31,771,750.00 4.86Pramerica Us Cor Eq -I- Cap** 391,800 EUR 2,242,099.86 2,581,567.39 0.40Sour Uti S&P Us Ac Ex Tr A Usd 2,044 USD 608,222.25 650,045.48 0.10Source Msci Em Ac Ptg -A- Etf /Cap 54,974 EUR 2,282,872.31 2,200,609.22 0.34Ssga Bar Emg Mk /Ex. Trad. Fd Usd 328,219 EUR 20,953,500.18 20,884,574.97 3.20Ubs Etf Msci Em -A- Usd /Dist Etf 39,673 EUR 3,427,762.74 3,655,470.22 0.56Van Ftse 250 Gbp Etf Gbp 26,301 GBP 849,938.69 901,286.43 0.14
Total - Investment Funds 116,557,380.96 118,831,862.80 18.19
Pramerica Sicav
The accompanying notes form an integral part of these financial statements.
233
Obiettivo Controllo
Statement of Investmentsas at June 30, 2019 (continued)
(expressed in EUR)
* Securities partially or totally lent (see Note 9).
** Cross Sub-Funds Investments, see Note 15, for further details.

Description Face value/
Quantity
Base currency Cost Market Value % net
assets
Financial Instruments
Options Contracts
Call Euro Stoxx 50 Pr 19/07/19 3300 1,000 EUR 703,000.00 1,786,000.00 0.27Call Euro Stoxx 50 Pr 19/07/19 3500 1,141 EUR 547,680.00 294,378.00 0.05Call Euro Stoxx 50 Pr 20/12/19 3550 (3,350) EUR (1,833,899.00) (2,680,000.00) (0.41)Call Euro Stoxx 50 Pr 20/12/19 3700 (1,141) EUR (439,513.14) (338,877.00) (0.05)Put 10y Treasury Notes Usa 26/07/19 127 300 USD 86,516.96 65,853.02 0.01
(936,215.18) (872,645.98) (0.13)
Total - Financial Instruments (936,215.18) (872,645.98) (0.13)
TOTAL INVESTMENT PORTFOLIO 600,730,784.84 618,352,177.15 94.63
Pramerica Sicav
The accompanying notes form an integral part of these financial statements.
234
Obiettivo Controllo
Statement of Investmentsas at June 30, 2019 (continued)
(expressed in EUR)
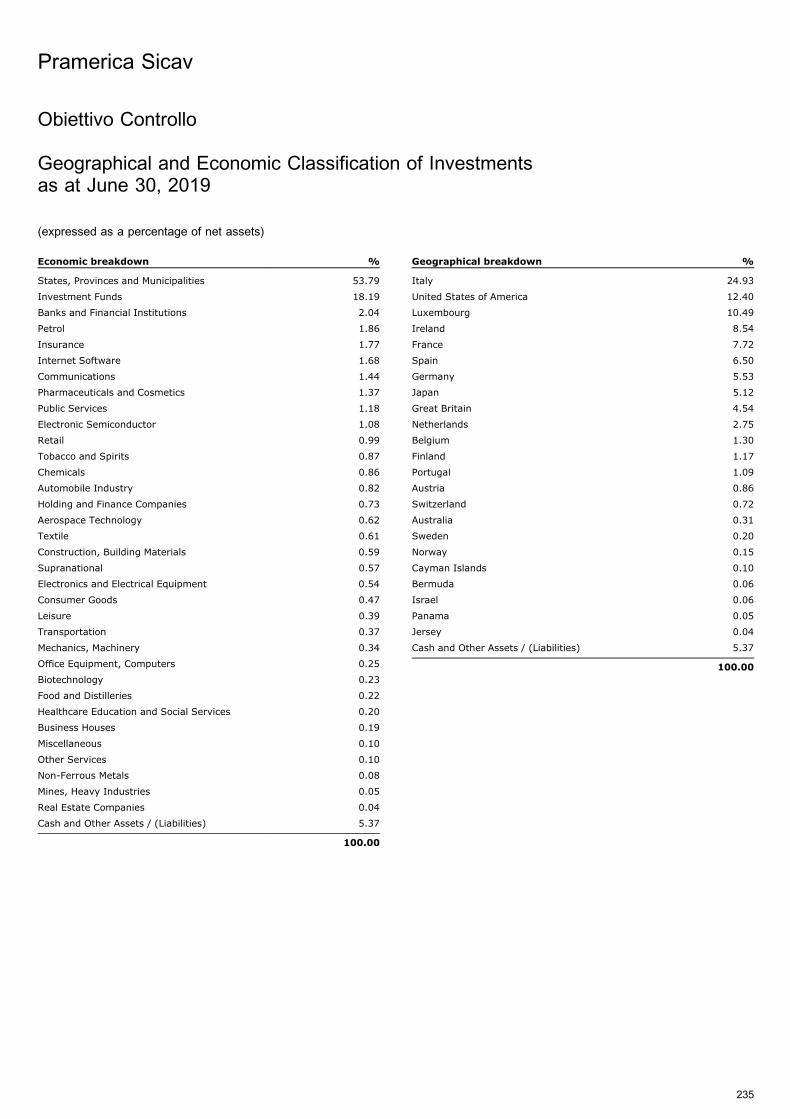
Obiettivo Controllo
Geographical and Economic Classification of Investmentsas at June 30, 2019
(expressed as a percentage of net assets)
Economic breakdown %
States, Provinces and Municipalities 53.79
Investment Funds 18.19
Banks and Financial Institutions 2.04
Petrol 1.86
Insurance 1.77
Internet Software 1.68
Communications 1.44
Pharmaceuticals and Cosmetics 1.37
Public Services 1.18
Electronic Semiconductor 1.08
Retail 0.99
Tobacco and Spirits 0.87
Chemicals 0.86
Automobile Industry 0.82
Holding and Finance Companies 0.73
Aerospace Technology 0.62
Textile 0.61
Construction, Building Materials 0.59
Supranational 0.57
Electronics and Electrical Equipment 0.54
Consumer Goods 0.47
Leisure 0.39
Transportation 0.37
Mechanics, Machinery 0.34
Office Equipment, Computers 0.25
Biotechnology 0.23
Food and Distilleries 0.22
Healthcare Education and Social Services 0.20
Business Houses 0.19
Miscellaneous 0.10
Other Services 0.10
Non-Ferrous Metals 0.08
Mines, Heavy Industries 0.05
Real Estate Companies 0.04
Cash and Other Assets / (Liabilities) 5.37
100.00
Geographical breakdown %
Italy 24.93
United States of America 12.40
Luxembourg 10.49
Ireland 8.54
France 7.72
Spain 6.50
Germany 5.53
Japan 5.12
Great Britain 4.54
Netherlands 2.75
Belgium 1.30
Finland 1.17
Portugal 1.09
Austria 0.86
Switzerland 0.72
Australia 0.31
Sweden 0.20
Norway 0.15
Cayman Islands 0.10
Bermuda 0.06
Israel 0.06
Panama 0.05
Jersey 0.04
Cash and Other Assets / (Liabilities) 5.37
100.00
Pramerica Sicav
235

Obiettivo Equilibrio
Statement of Investmentsas at June 30, 2019
(expressed in EUR)
Description Face value/
Quantity
Base currency Cost Market Value % net
assets
Transferable securities and money market instruments listed on an official stock exchange and dealt in on another regulated market
Bonds
Australia 3.25% 13-21.04.25 1,190,000 AUD 789,686.99 821,361.10 0.18Austria 0.75% 16-20.10.26 1,310,000 EUR 1,316,797.70 1,409,953.00 0.30Austria 1.5% 16-20.02.47 250,000 EUR 246,241.50 301,695.00 0.06Austria 4.15% 06-15.03.37 265,000 EUR 394,605.95 435,194.66 0.09Belgium 0.8% 17-22.06.27 Regs 1,830,000 EUR 1,826,840.00 1,967,242.68 0.42Btps 3.35% 18-01.03.35 /Btp 2,891,000 EUR 2,879,696.19 3,190,314.48 0.68Btps 3.85% 18-01.09.49 /Btp 878,000 EUR 874,435.32 1,014,643.14 0.22Cassa Depo 2.125% 19-21.03.26 1,500,000 EUR 1,489,320.00 1,531,725.00 0.33Efsf 1.875% 13-23.05.23* 1,325,000 EUR 1,442,095.25 1,446,613.80 0.31France 1.75% 16-25.06.39 Oat 2,430,000 EUR 2,568,035.90 2,960,396.10 0.63France 2.25% 12-25.10.22 Oat* 1,690,000 EUR 1,866,052.50 1,855,217.78 0.40France O.A. 2% 25.05.48 /Oat 5,358,734 EUR 6,440,398.71 6,899,005.63 1.47Germany 1.5% 13-15.05.23* 3,140,000 EUR 3,381,304.60 3,415,757.94 0.73Germany 2.5% 14-15.08.46* 2,330,000 EUR 3,099,278.30 3,719,690.75 0.79Germany 4% 05-04.01.37 1,020,000 EUR 1,555,360.20 1,740,185.28 0.37Italy 0% 19-29.06.21 Tb 4,724,000 EUR 4,678,885.80 4,684,932.52 1.00Italy 0.05% 16-15.10.19 /Btp 15,199,000 EUR 15,167,140.56 15,203,255.72 3.25Italy 0.35% 17-15.06.20 /Btp 4,601,000 EUR 4,616,367.34 4,617,416.37 0.99Italy 0.65% 15-01.11.20 /Btp 8,500,000 EUR 8,639,685.00 8,571,655.00 1.83Italy 0.65% 16-15.10.23 /Btp 9,675,000 EUR 9,504,144.80 9,511,802.10 2.03Italy 1.5% 15-01.06.25 /Btp 1,190,000 EUR 1,189,841.60 1,191,861.16 0.25Italy 1.85% 17-15.05.24 /Btp 11,600,000 EUR 11,561,836.00 11,923,112.20 2.55Italy 2.2% 17-01.06.27 /Btp 3,800,000 EUR 3,895,002.00 3,928,972.00 0.84Italy 2.7% 16-01.03.47 /Btp 775,000 EUR 733,889.50 757,402.85 0.16Italy 2.8% 16-01.03.67 /Btp 915,000 EUR 829,307.30 857,300.10 0.18Italy 3.45% 17-01.03.48 Btp 422,000 EUR 454,226.52 464,917.40 0.10Japan 0.1% 16-20.09.21 202,800,000 JPY 1,528,873.21 1,664,218.14 0.35Japan 0.1% 17-10.03.27 /Infl 435,000,000 JPY 3,467,795.01 3,762,577.98 0.80Japan 1.2% 14-20.12.34 406,000,000 JPY 3,416,215.80 3,874,252.37 0.83Japan 1.5% 14-20.12.44 279,000,000 JPY 2,464,716.04 2,928,493.51 0.62Japan 1.7% 14-20.03.54 51,000,000 JPY 475,450.99 589,574.84 0.13Nether Gove 0.5% 19-15.01.40 1,378,000 EUR 1,362,704.20 1,445,987.76 0.31Portugal 2.125% 18-17.10.28* 2,547,000 EUR 2,596,978.30 2,952,737.10 0.63Spain 1.45% 19-30.04.29 3,902,000 EUR 4,079,541.00 4,297,803.27 0.92Spain 2.9% 16-31.10.46 9,455,000 EUR 11,394,818.55 12,846,357.22 2.74Spain 4.2% 05-31.01.37 1,666,000 EUR 2,333,233.00 2,557,709.84 0.55Tsy 0.75% 18-15.07.28 /Infl 5,700,000 USD 5,207,421.92 5,305,643.18 1.13Tsy Infl Ix 1% 15.02.49 /Infl 973,500 USD 874,158.07 917,658.15 0.20Uk 0.125% 15-22.03.26 /Infl 4,333,781 GBP 6,188,832.89 6,443,636.81 1.38Uk 1.5% 16-22.07.26 2,620,000 GBP 3,001,263.54 3,090,644.47 0.66Uk 4.25% 03-07.03.36 311,677 GBP 506,406.83 504,679.58 0.11Uk 4.25% 08-07.12.49 120,000 GBP 211,540.62 225,733.99 0.05Uk 4.75% 04-07.12.38 270,000 GBP 455,917.80 477,863.61 0.10Uk 4.75% 05-07.03.20 1,180,000 GBP 1,459,476.11 1,354,876.79 0.29USA 0.625% 14-15.01.24 /Infl 8,306,400 USD 7,994,216.48 8,122,596.20 1.73USA 1.75% 15-30.04.22 /Tbo* 3,823,100 USD 3,133,221.01 3,359,720.07 0.72USA 2.125% 14-31.12.21 /Tbo* 2,500,000 USD 2,040,625.78 2,216,279.74 0.47USA 2.25% 16-15.08.46 /Tbo* 1,090,000 USD 761,866.58 904,201.01 0.19USA 2.625% 10-15.11.20 Tbo 4,690,000 USD 4,115,919.83 4,160,314.56 0.89USA 6.25% 99-15.05.30 Bonds 380,000 USD 424,440.13 470,740.65 0.10
160,936,109.22 168,895,924.60 36.06
Shares
Ab Inbev /Sadr* 6,633 USD 429,056.64 515,485.85 0.11Abb Ltd Zuerich /Namen. 33,924 CHF 704,253.69 598,443.15 0.13Abbott Laboratories Inc 7,939 USD 428,749.50 586,241.02 0.13Activision Blizzard Inc 12,874 USD 798,227.74 533,543.59 0.11Aig 13,338 USD 556,424.87 623,978.08 0.13Air Liquide 14,589 EUR 1,549,601.75 1,795,176.45 0.38
Pramerica Sicav
The accompanying notes form an integral part of these financial statements.
236
* Securities partially or totally lent (see Note 9).
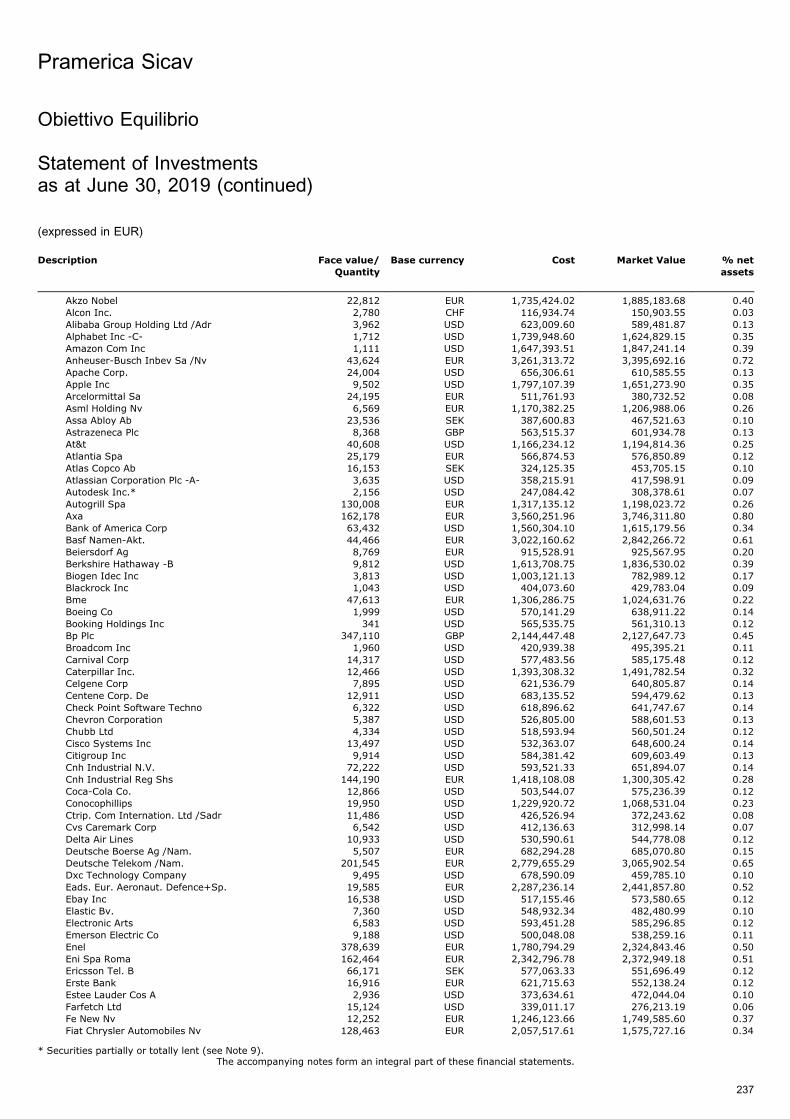
Description Face value/
Quantity
Base currency Cost Market Value % net
assets
Akzo Nobel 22,812 EUR 1,735,424.02 1,885,183.68 0.40Alcon Inc. 2,780 CHF 116,934.74 150,903.55 0.03Alibaba Group Holding Ltd /Adr 3,962 USD 623,009.60 589,481.87 0.13Alphabet Inc -C- 1,712 USD 1,739,948.60 1,624,829.15 0.35Amazon Com Inc 1,111 USD 1,647,393.51 1,847,241.14 0.39Anheuser-Busch Inbev Sa /Nv 43,624 EUR 3,261,313.72 3,395,692.16 0.72Apache Corp. 24,004 USD 656,306.61 610,585.55 0.13Apple Inc 9,502 USD 1,797,107.39 1,651,273.90 0.35Arcelormittal Sa 24,195 EUR 511,761.93 380,732.52 0.08Asml Holding Nv 6,569 EUR 1,170,382.25 1,206,988.06 0.26Assa Abloy Ab 23,536 SEK 387,600.83 467,521.63 0.10Astrazeneca Plc 8,368 GBP 563,515.37 601,934.78 0.13At&t 40,608 USD 1,166,234.12 1,194,814.36 0.25Atlantia Spa 25,179 EUR 566,874.53 576,850.89 0.12Atlas Copco Ab 16,153 SEK 324,125.35 453,705.15 0.10Atlassian Corporation Plc -A- 3,635 USD 358,215.91 417,598.91 0.09Autodesk Inc.* 2,156 USD 247,084.42 308,378.61 0.07Autogrill Spa 130,008 EUR 1,317,135.12 1,198,023.72 0.26Axa 162,178 EUR 3,560,251.96 3,746,311.80 0.80Bank of America Corp 63,432 USD 1,560,304.10 1,615,179.56 0.34Basf Namen-Akt. 44,466 EUR 3,022,160.62 2,842,266.72 0.61Beiersdorf Ag 8,769 EUR 915,528.91 925,567.95 0.20Berkshire Hathaway -B 9,812 USD 1,613,708.75 1,836,530.02 0.39Biogen Idec Inc 3,813 USD 1,003,121.13 782,989.12 0.17Blackrock Inc 1,043 USD 404,073.60 429,783.04 0.09Bme 47,613 EUR 1,306,286.75 1,024,631.76 0.22Boeing Co 1,999 USD 570,141.29 638,911.22 0.14Booking Holdings Inc 341 USD 565,535.75 561,310.13 0.12Bp Plc 347,110 GBP 2,144,447.48 2,127,647.73 0.45Broadcom Inc 1,960 USD 420,939.38 495,395.21 0.11Carnival Corp 14,317 USD 577,483.56 585,175.48 0.12Caterpillar Inc. 12,466 USD 1,393,308.32 1,491,782.54 0.32Celgene Corp 7,895 USD 621,536.79 640,805.87 0.14Centene Corp. De 12,911 USD 683,135.52 594,479.62 0.13Check Point Software Techno 6,322 USD 618,896.62 641,747.67 0.14Chevron Corporation 5,387 USD 526,805.00 588,601.53 0.13Chubb Ltd 4,334 USD 518,593.94 560,501.24 0.12Cisco Systems Inc 13,497 USD 532,363.07 648,600.24 0.14Citigroup Inc 9,914 USD 584,381.42 609,603.49 0.13Cnh Industrial N.V. 72,222 USD 593,521.33 651,894.07 0.14Cnh Industrial Reg Shs 144,190 EUR 1,418,108.08 1,300,305.42 0.28Coca-Cola Co. 12,866 USD 503,544.07 575,236.39 0.12Conocophillips 19,950 USD 1,229,920.72 1,068,531.04 0.23Ctrip. Com Internation. Ltd /Sadr 11,486 USD 426,526.94 372,243.62 0.08Cvs Caremark Corp 6,542 USD 412,136.63 312,998.14 0.07Delta Air Lines 10,933 USD 530,590.61 544,778.08 0.12Deutsche Boerse Ag /Nam. 5,507 EUR 682,294.28 685,070.80 0.15Deutsche Telekom /Nam. 201,545 EUR 2,779,655.29 3,065,902.54 0.65Dxc Technology Company 9,495 USD 678,590.09 459,785.10 0.10Eads. Eur. Aeronaut. Defence+Sp. 19,585 EUR 2,287,236.14 2,441,857.80 0.52Ebay Inc 16,538 USD 517,155.46 573,580.65 0.12Elastic Bv. 7,360 USD 548,932.34 482,480.99 0.10Electronic Arts 6,583 USD 593,451.28 585,296.85 0.12Emerson Electric Co 9,188 USD 500,048.08 538,259.16 0.11Enel 378,639 EUR 1,780,794.29 2,324,843.46 0.50Eni Spa Roma 162,464 EUR 2,342,796.78 2,372,949.18 0.51Ericsson Tel. B 66,171 SEK 577,063.33 551,696.49 0.12Erste Bank 16,916 EUR 621,715.63 552,138.24 0.12Estee Lauder Cos A 2,936 USD 373,634.61 472,044.04 0.10Farfetch Ltd 15,124 USD 339,011.17 276,213.19 0.06Fe New Nv 12,252 EUR 1,246,123.66 1,749,585.60 0.37Fiat Chrysler Automobiles Nv 128,463 EUR 2,057,517.61 1,575,727.16 0.34
Pramerica Sicav
The accompanying notes form an integral part of these financial statements.
237
Obiettivo Equilibrio
Statement of Investmentsas at June 30, 2019 (continued)
(expressed in EUR)
* Securities partially or totally lent (see Note 9).
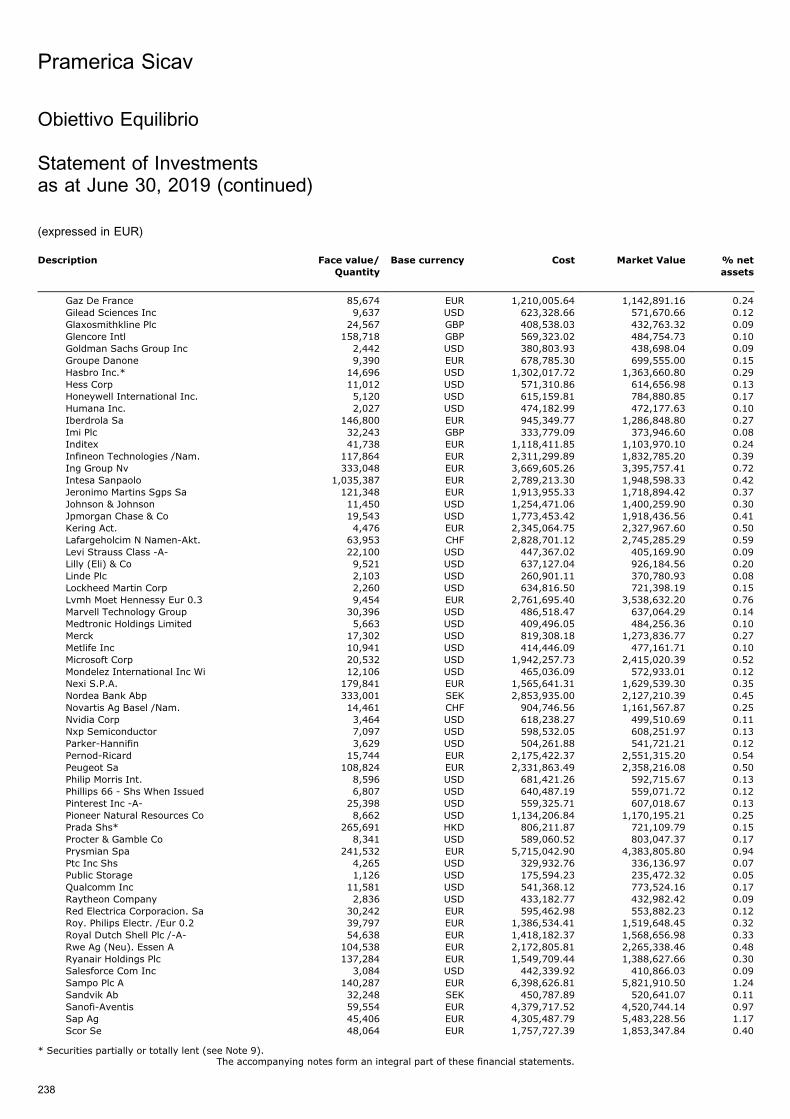
Description Face value/
Quantity
Base currency Cost Market Value % net
assets
Gaz De France 85,674 EUR 1,210,005.64 1,142,891.16 0.24Gilead Sciences Inc 9,637 USD 623,328.66 571,670.66 0.12Glaxosmithkline Plc 24,567 GBP 408,538.03 432,763.32 0.09Glencore Intl 158,718 GBP 569,323.02 484,754.73 0.10Goldman Sachs Group Inc 2,442 USD 380,803.93 438,698.04 0.09Groupe Danone 9,390 EUR 678,785.30 699,555.00 0.15Hasbro Inc.* 14,696 USD 1,302,017.72 1,363,660.80 0.29Hess Corp 11,012 USD 571,310.86 614,656.98 0.13Honeywell International Inc. 5,120 USD 615,159.81 784,880.85 0.17Humana Inc. 2,027 USD 474,182.99 472,177.63 0.10Iberdrola Sa 146,800 EUR 945,349.77 1,286,848.80 0.27Imi Plc 32,243 GBP 333,779.09 373,946.60 0.08Inditex 41,738 EUR 1,118,411.85 1,103,970.10 0.24Infineon Technologies /Nam. 117,864 EUR 2,311,299.89 1,832,785.20 0.39Ing Group Nv 333,048 EUR 3,669,605.26 3,395,757.41 0.72Intesa Sanpaolo 1,035,387 EUR 2,789,213.30 1,948,598.33 0.42Jeronimo Martins Sgps Sa 121,348 EUR 1,913,955.33 1,718,894.42 0.37Johnson & Johnson 11,450 USD 1,254,471.06 1,400,259.90 0.30Jpmorgan Chase & Co 19,543 USD 1,773,453.42 1,918,436.56 0.41Kering Act. 4,476 EUR 2,345,064.75 2,327,967.60 0.50Lafargeholcim N Namen-Akt. 63,953 CHF 2,828,701.12 2,745,285.29 0.59Levi Strauss Class -A- 22,100 USD 447,367.02 405,169.90 0.09Lilly (Eli) & Co 9,521 USD 637,127.04 926,184.56 0.20Linde Plc 2,103 USD 260,901.11 370,780.93 0.08Lockheed Martin Corp 2,260 USD 634,816.50 721,398.19 0.15Lvmh Moet Hennessy Eur 0.3 9,454 EUR 2,761,695.40 3,538,632.20 0.76Marvell Technology Group 30,396 USD 486,518.47 637,064.29 0.14Medtronic Holdings Limited 5,663 USD 409,496.05 484,256.36 0.10Merck 17,302 USD 819,308.18 1,273,836.77 0.27Metlife Inc 10,941 USD 414,446.09 477,161.71 0.10Microsoft Corp 20,532 USD 1,942,257.73 2,415,020.39 0.52Mondelez International Inc Wi 12,106 USD 465,036.09 572,933.01 0.12Nexi S.P.A. 179,841 EUR 1,565,641.31 1,629,539.30 0.35Nordea Bank Abp 333,001 SEK 2,853,935.00 2,127,210.39 0.45Novartis Ag Basel /Nam. 14,461 CHF 904,746.56 1,161,567.87 0.25Nvidia Corp 3,464 USD 618,238.27 499,510.69 0.11Nxp Semiconductor 7,097 USD 598,532.05 608,251.97 0.13Parker-Hannifin 3,629 USD 504,261.88 541,721.21 0.12Pernod-Ricard 15,744 EUR 2,175,422.37 2,551,315.20 0.54Peugeot Sa 108,824 EUR 2,331,863.49 2,358,216.08 0.50Philip Morris Int. 8,596 USD 681,421.26 592,715.67 0.13Phillips 66 - Shs When Issued 6,807 USD 640,487.19 559,071.72 0.12Pinterest Inc -A- 25,398 USD 559,325.71 607,018.67 0.13Pioneer Natural Resources Co 8,662 USD 1,134,206.84 1,170,195.21 0.25Prada Shs* 265,691 HKD 806,211.87 721,109.79 0.15Procter & Gamble Co 8,341 USD 589,060.52 803,047.37 0.17Prysmian Spa 241,532 EUR 5,715,042.90 4,383,805.80 0.94Ptc Inc Shs 4,265 USD 329,932.76 336,136.97 0.07Public Storage 1,126 USD 175,594.23 235,472.32 0.05Qualcomm Inc 11,581 USD 541,368.12 773,524.16 0.17Raytheon Company 2,836 USD 433,182.77 432,982.42 0.09Red Electrica Corporacion. Sa 30,242 EUR 595,462.98 553,882.23 0.12Roy. Philips Electr. /Eur 0.2 39,797 EUR 1,386,534.41 1,519,648.45 0.32Royal Dutch Shell Plc /-A- 54,638 EUR 1,418,182.37 1,568,656.98 0.33Rwe Ag (Neu). Essen A 104,538 EUR 2,172,805.81 2,265,338.46 0.48Ryanair Holdings Plc 137,284 EUR 1,549,709.44 1,388,627.66 0.30Salesforce Com Inc 3,084 USD 442,339.92 410,866.03 0.09Sampo Plc A 140,287 EUR 6,398,626.81 5,821,910.50 1.24Sandvik Ab 32,248 SEK 450,787.89 520,641.07 0.11Sanofi-Aventis 59,554 EUR 4,379,717.52 4,520,744.14 0.97Sap Ag 45,406 EUR 4,305,487.79 5,483,228.56 1.17Scor Se 48,064 EUR 1,757,727.39 1,853,347.84 0.40
Pramerica Sicav
The accompanying notes form an integral part of these financial statements.
238
Obiettivo Equilibrio
Statement of Investmentsas at June 30, 2019 (continued)
(expressed in EUR)
* Securities partially or totally lent (see Note 9).
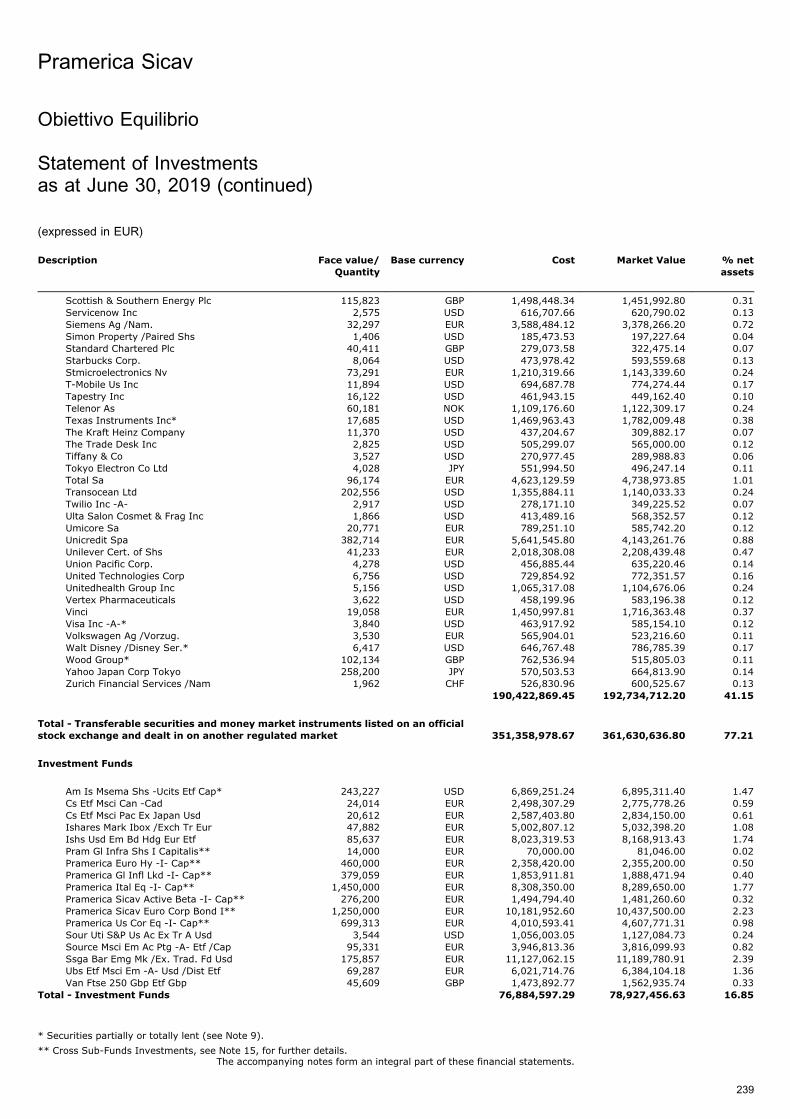
Description Face value/
Quantity
Base currency Cost Market Value % net
assets
Scottish & Southern Energy Plc 115,823 GBP 1,498,448.34 1,451,992.80 0.31Servicenow Inc 2,575 USD 616,707.66 620,790.02 0.13Siemens Ag /Nam. 32,297 EUR 3,588,484.12 3,378,266.20 0.72Simon Property /Paired Shs 1,406 USD 185,473.53 197,227.64 0.04Standard Chartered Plc 40,411 GBP 279,073.58 322,475.14 0.07Starbucks Corp. 8,064 USD 473,978.42 593,559.68 0.13Stmicroelectronics Nv 73,291 EUR 1,210,319.66 1,143,339.60 0.24T-Mobile Us Inc 11,894 USD 694,687.78 774,274.44 0.17Tapestry Inc 16,122 USD 461,943.15 449,162.40 0.10Telenor As 60,181 NOK 1,109,176.60 1,122,309.17 0.24Texas Instruments Inc* 17,685 USD 1,469,963.43 1,782,009.48 0.38The Kraft Heinz Company 11,370 USD 437,204.67 309,882.17 0.07The Trade Desk Inc 2,825 USD 505,299.07 565,000.00 0.12Tiffany & Co 3,527 USD 270,977.45 289,988.83 0.06Tokyo Electron Co Ltd 4,028 JPY 551,994.50 496,247.14 0.11Total Sa 96,174 EUR 4,623,129.59 4,738,973.85 1.01Transocean Ltd 202,556 USD 1,355,884.11 1,140,033.33 0.24Twilio Inc -A- 2,917 USD 278,171.10 349,225.52 0.07Ulta Salon Cosmet & Frag Inc 1,866 USD 413,489.16 568,352.57 0.12Umicore Sa 20,771 EUR 789,251.10 585,742.20 0.12Unicredit Spa 382,714 EUR 5,641,545.80 4,143,261.76 0.88Unilever Cert. of Shs 41,233 EUR 2,018,308.08 2,208,439.48 0.47Union Pacific Corp. 4,278 USD 456,885.44 635,220.46 0.14United Technologies Corp 6,756 USD 729,854.92 772,351.57 0.16Unitedhealth Group Inc 5,156 USD 1,065,317.08 1,104,676.06 0.24Vertex Pharmaceuticals 3,622 USD 458,199.96 583,196.38 0.12Vinci 19,058 EUR 1,450,997.81 1,716,363.48 0.37Visa Inc -A-* 3,840 USD 463,917.92 585,154.10 0.12Volkswagen Ag /Vorzug. 3,530 EUR 565,904.01 523,216.60 0.11Walt Disney /Disney Ser.* 6,417 USD 646,767.48 786,785.39 0.17Wood Group* 102,134 GBP 762,536.94 515,805.03 0.11Yahoo Japan Corp Tokyo 258,200 JPY 570,503.53 664,813.90 0.14Zurich Financial Services /Nam 1,962 CHF 526,830.96 600,525.67 0.13
190,422,869.45 192,734,712.20 41.15
Total - Transferable securities and money market instruments listed on an officialstock exchange and dealt in on another regulated market 351,358,978.67 361,630,636.80 77.21
Investment Funds
Am Is Msema Shs -Ucits Etf Cap* 243,227 USD 6,869,251.24 6,895,311.40 1.47Cs Etf Msci Can -Cad 24,014 EUR 2,498,307.29 2,775,778.26 0.59Cs Etf Msci Pac Ex Japan Usd 20,612 EUR 2,587,403.80 2,834,150.00 0.61Ishares Mark Ibox /Exch Tr Eur 47,882 EUR 5,002,807.12 5,032,398.20 1.08Ishs Usd Em Bd Hdg Eur Etf 85,637 EUR 8,023,319.53 8,168,913.43 1.74Pram Gl Infra Shs I Capitalis** 14,000 EUR 70,000.00 81,046.00 0.02Pramerica Euro Hy -I- Cap** 460,000 EUR 2,358,420.00 2,355,200.00 0.50Pramerica Gl Infl Lkd -I- Cap** 379,059 EUR 1,853,911.81 1,888,471.94 0.40Pramerica Ital Eq -I- Cap** 1,450,000 EUR 8,308,350.00 8,289,650.00 1.77Pramerica Sicav Active Beta -I- Cap** 276,200 EUR 1,494,794.40 1,481,260.60 0.32Pramerica Sicav Euro Corp Bond I** 1,250,000 EUR 10,181,952.60 10,437,500.00 2.23Pramerica Us Cor Eq -I- Cap** 699,313 EUR 4,010,593.41 4,607,771.31 0.98Sour Uti S&P Us Ac Ex Tr A Usd 3,544 USD 1,056,003.05 1,127,084.73 0.24Source Msci Em Ac Ptg -A- Etf /Cap 95,331 EUR 3,946,813.36 3,816,099.93 0.82Ssga Bar Emg Mk /Ex. Trad. Fd Usd 175,857 EUR 11,127,062.15 11,189,780.91 2.39Ubs Etf Msci Em -A- Usd /Dist Etf 69,287 EUR 6,021,714.76 6,384,104.18 1.36Van Ftse 250 Gbp Etf Gbp 45,609 GBP 1,473,892.77 1,562,935.74 0.33
Total - Investment Funds 76,884,597.29 78,927,456.63 16.85
Pramerica Sicav
The accompanying notes form an integral part of these financial statements.
239
Obiettivo Equilibrio
Statement of Investmentsas at June 30, 2019 (continued)
(expressed in EUR)
* Securities partially or totally lent (see Note 9).
** Cross Sub-Funds Investments, see Note 15, for further details.
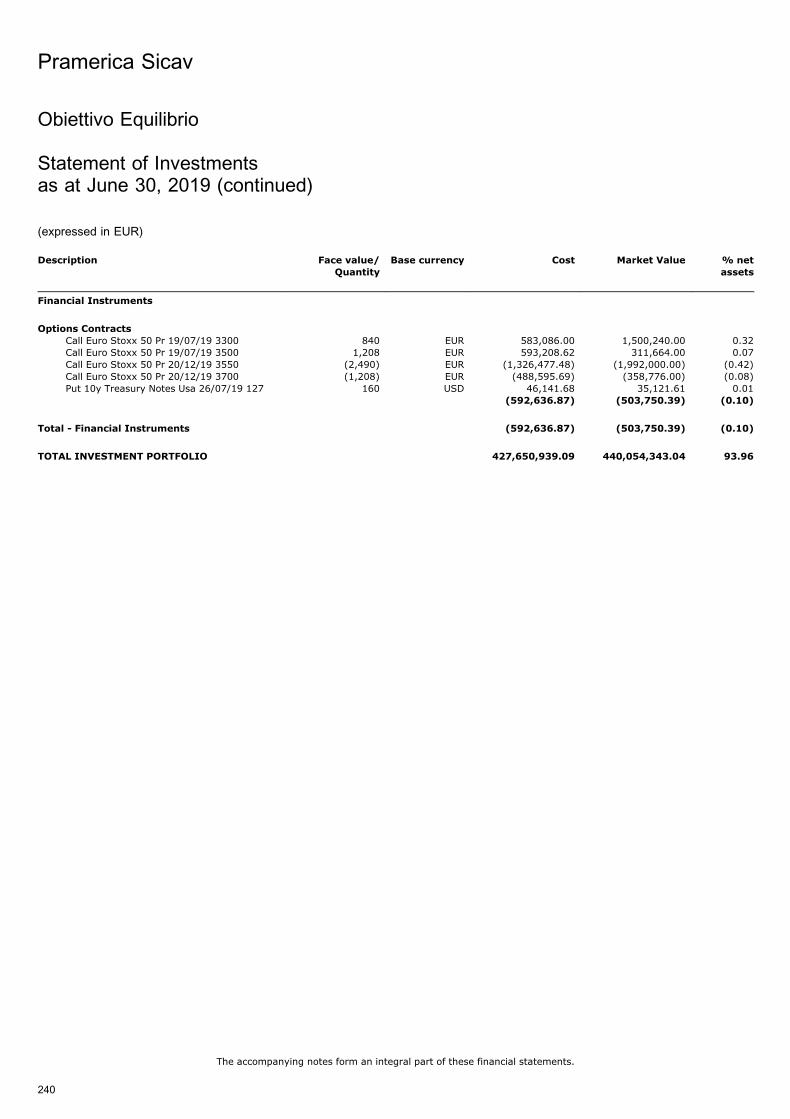
Description Face value/
Quantity
Base currency Cost Market Value % net
assets
Financial Instruments
Options Contracts
Call Euro Stoxx 50 Pr 19/07/19 3300 840 EUR 583,086.00 1,500,240.00 0.32Call Euro Stoxx 50 Pr 19/07/19 3500 1,208 EUR 593,208.62 311,664.00 0.07Call Euro Stoxx 50 Pr 20/12/19 3550 (2,490) EUR (1,326,477.48) (1,992,000.00) (0.42)Call Euro Stoxx 50 Pr 20/12/19 3700 (1,208) EUR (488,595.69) (358,776.00) (0.08)Put 10y Treasury Notes Usa 26/07/19 127 160 USD 46,141.68 35,121.61 0.01
(592,636.87) (503,750.39) (0.10)
Total - Financial Instruments (592,636.87) (503,750.39) (0.10)
TOTAL INVESTMENT PORTFOLIO 427,650,939.09 440,054,343.04 93.96
Pramerica Sicav
The accompanying notes form an integral part of these financial statements.
240
Obiettivo Equilibrio
Statement of Investmentsas at June 30, 2019 (continued)
(expressed in EUR)

Obiettivo Equilibrio
Geographical and Economic Classification of Investmentsas at June 30, 2019
(expressed as a percentage of net assets)
Economic breakdown %
States, Provinces and Municipalities 35.75
Investment Funds 16.85
Petrol 3.64
Banks and Financial Institutions 3.63
Internet Software 3.54
Insurance 2.80
Pharmaceuticals and Cosmetics 2.72
Communications 2.54
Electronic Semiconductor 2.08
Public Services 1.92
Retail 1.86
Holding and Finance Companies 1.54
Tobacco and Spirits 1.50
Chemicals 1.39
Automobile Industry 1.32
Aerospace Technology 1.23
Textile 1.10
Construction, Building Materials 0.96
Electronics and Electrical Equipment 0.96
Consumer Goods 0.93
Mechanics, Machinery 0.83
Transportation 0.68
Office Equipment, Computers 0.60
Leisure 0.59
Biotechnology 0.55
Healthcare Education and Social Services 0.50
Food and Distilleries 0.46
Business Houses 0.32
Miscellaneous 0.32
Supranational 0.31
Other Services 0.25
Non-Ferrous Metals 0.12
Real Estate Companies 0.09
Mines, Heavy Industries 0.08
Cash and Other Assets / (Liabilities) 6.04
100.00
Geographical breakdown %
Italy 18.91
United States of America 17.69
Luxembourg 9.44
France 9.12
Ireland 8.20
Germany 6.26
Spain 5.06
Great Britain 4.33
Netherlands 4.23
Japan 2.98
Finland 1.69
Switzerland 1.49
Belgium 1.37
Portugal 1.00
Austria 0.57
Sweden 0.43
Cayman Islands 0.27
Norway 0.24
Australia 0.18
Bermuda 0.14
Israel 0.14
Panama 0.12
Jersey 0.10
Cash and Other Assets / (Liabilities) 6.04
100.00
Pramerica Sicav
241
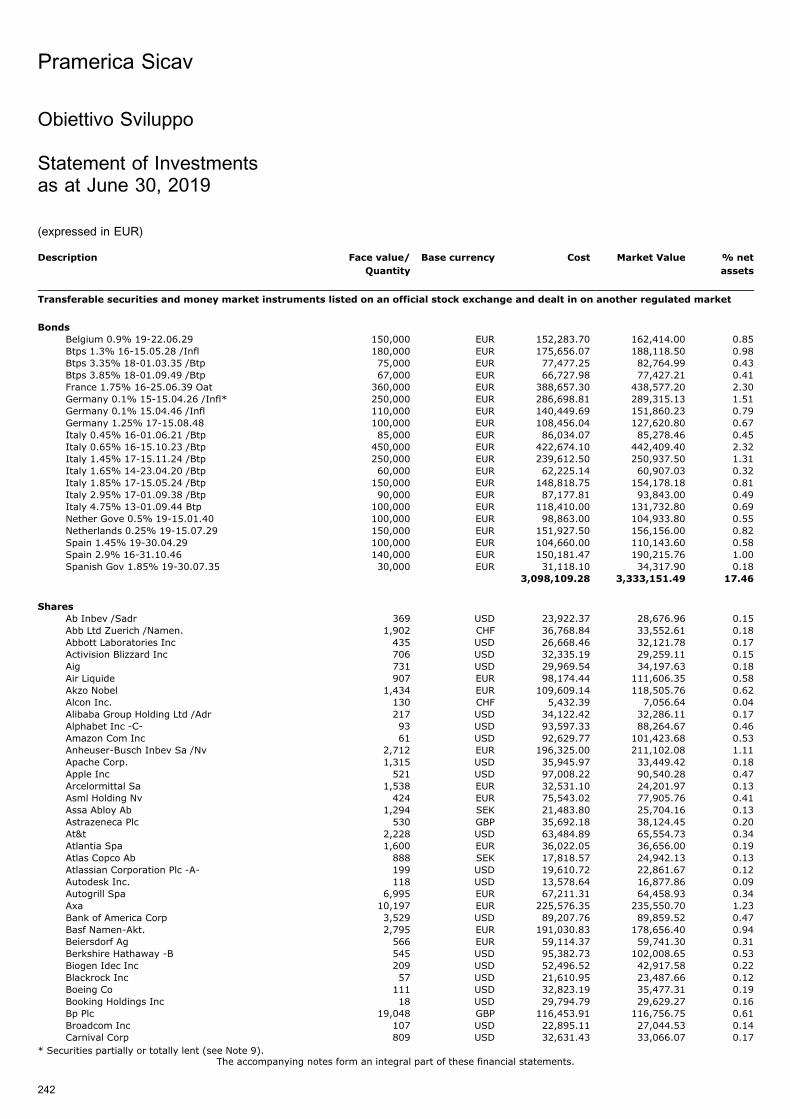
Obiettivo Sviluppo
Statement of Investmentsas at June 30, 2019
(expressed in EUR)
Description Face value/
Quantity
Base currency Cost Market Value % net
assets
Transferable securities and money market instruments listed on an official stock exchange and dealt in on another regulated market
Bonds
Belgium 0.9% 19-22.06.29 150,000 EUR 152,283.70 162,414.00 0.85Btps 1.3% 16-15.05.28 /Infl 180,000 EUR 175,656.07 188,118.50 0.98Btps 3.35% 18-01.03.35 /Btp 75,000 EUR 77,477.25 82,764.99 0.43Btps 3.85% 18-01.09.49 /Btp 67,000 EUR 66,727.98 77,427.21 0.41France 1.75% 16-25.06.39 Oat 360,000 EUR 388,657.30 438,577.20 2.30Germany 0.1% 15-15.04.26 /Infl* 250,000 EUR 286,698.81 289,315.13 1.51Germany 0.1% 15.04.46 /Infl 110,000 EUR 140,449.69 151,860.23 0.79Germany 1.25% 17-15.08.48 100,000 EUR 108,456.04 127,620.80 0.67Italy 0.45% 16-01.06.21 /Btp 85,000 EUR 86,034.07 85,278.46 0.45Italy 0.65% 16-15.10.23 /Btp 450,000 EUR 422,674.10 442,409.40 2.32Italy 1.45% 17-15.11.24 /Btp 250,000 EUR 239,612.50 250,937.50 1.31Italy 1.65% 14-23.04.20 /Btp 60,000 EUR 62,225.14 60,907.03 0.32Italy 1.85% 17-15.05.24 /Btp 150,000 EUR 148,818.75 154,178.18 0.81Italy 2.95% 17-01.09.38 /Btp 90,000 EUR 87,177.81 93,843.00 0.49Italy 4.75% 13-01.09.44 Btp 100,000 EUR 118,410.00 131,732.80 0.69Nether Gove 0.5% 19-15.01.40 100,000 EUR 98,863.00 104,933.80 0.55Netherlands 0.25% 19-15.07.29 150,000 EUR 151,927.50 156,156.00 0.82Spain 1.45% 19-30.04.29 100,000 EUR 104,660.00 110,143.60 0.58Spain 2.9% 16-31.10.46 140,000 EUR 150,181.47 190,215.76 1.00Spanish Gov 1.85% 19-30.07.35 30,000 EUR 31,118.10 34,317.90 0.18
3,098,109.28 3,333,151.49 17.46
Shares
Ab Inbev /Sadr 369 USD 23,922.37 28,676.96 0.15Abb Ltd Zuerich /Namen. 1,902 CHF 36,768.84 33,552.61 0.18Abbott Laboratories Inc 435 USD 26,668.46 32,121.78 0.17Activision Blizzard Inc 706 USD 32,335.19 29,259.11 0.15Aig 731 USD 29,969.54 34,197.63 0.18Air Liquide 907 EUR 98,174.44 111,606.35 0.58Akzo Nobel 1,434 EUR 109,609.14 118,505.76 0.62Alcon Inc. 130 CHF 5,432.39 7,056.64 0.04Alibaba Group Holding Ltd /Adr 217 USD 34,122.42 32,286.11 0.17Alphabet Inc -C- 93 USD 93,597.33 88,264.67 0.46Amazon Com Inc 61 USD 92,629.77 101,423.68 0.53Anheuser-Busch Inbev Sa /Nv 2,712 EUR 196,325.00 211,102.08 1.11Apache Corp. 1,315 USD 35,945.97 33,449.42 0.18Apple Inc 521 USD 97,008.22 90,540.28 0.47Arcelormittal Sa 1,538 EUR 32,531.10 24,201.97 0.13Asml Holding Nv 424 EUR 75,543.02 77,905.76 0.41Assa Abloy Ab 1,294 SEK 21,483.80 25,704.16 0.13Astrazeneca Plc 530 GBP 35,692.18 38,124.45 0.20At&t 2,228 USD 63,484.89 65,554.73 0.34Atlantia Spa 1,600 EUR 36,022.05 36,656.00 0.19Atlas Copco Ab 888 SEK 17,818.57 24,942.13 0.13Atlassian Corporation Plc -A- 199 USD 19,610.72 22,861.67 0.12Autodesk Inc. 118 USD 13,578.64 16,877.86 0.09Autogrill Spa 6,995 EUR 67,211.31 64,458.93 0.34Axa 10,197 EUR 225,576.35 235,550.70 1.23Bank of America Corp 3,529 USD 89,207.76 89,859.52 0.47Basf Namen-Akt. 2,795 EUR 191,030.83 178,656.40 0.94Beiersdorf Ag 566 EUR 59,114.37 59,741.30 0.31Berkshire Hathaway -B 545 USD 95,382.73 102,008.65 0.53Biogen Idec Inc 209 USD 52,496.52 42,917.58 0.22Blackrock Inc 57 USD 21,610.95 23,487.66 0.12Boeing Co 111 USD 32,823.19 35,477.31 0.19Booking Holdings Inc 18 USD 29,794.79 29,629.27 0.16Bp Plc 19,048 GBP 116,453.91 116,756.75 0.61Broadcom Inc 107 USD 22,895.11 27,044.53 0.14Carnival Corp 809 USD 32,631.43 33,066.07 0.17
Pramerica Sicav
The accompanying notes form an integral part of these financial statements.
242
* Securities partially or totally lent (see Note 9).
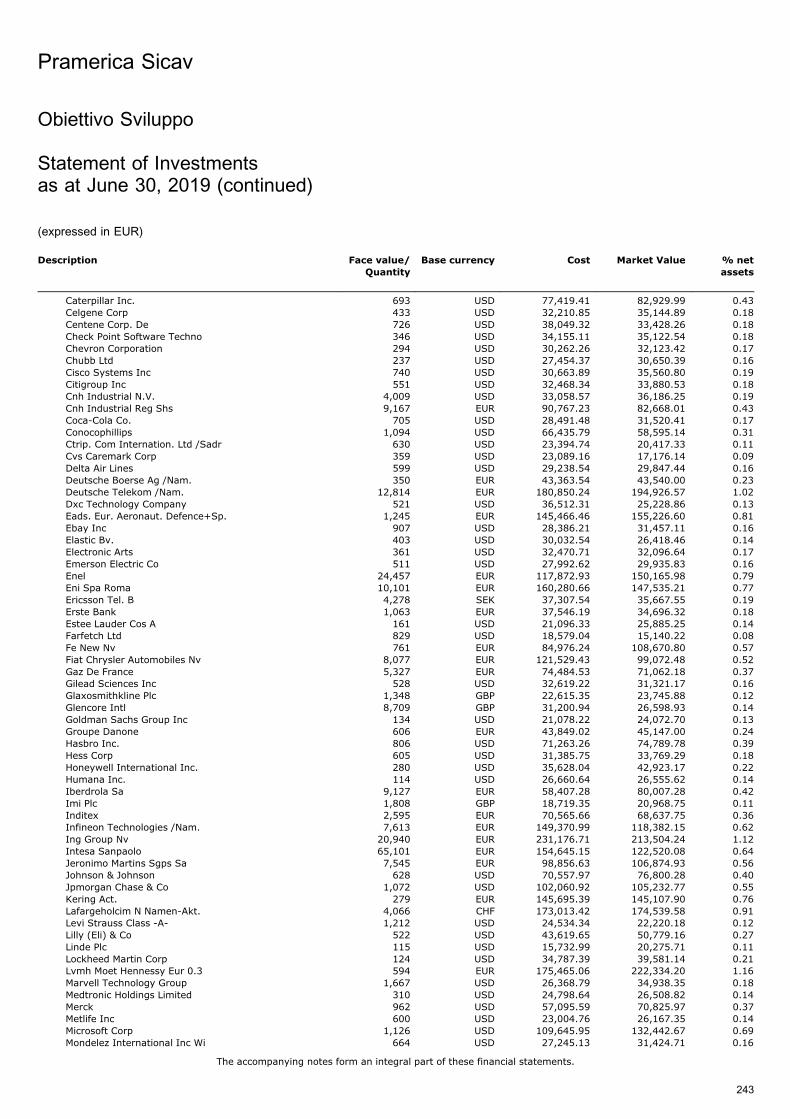
Description Face value/
Quantity
Base currency Cost Market Value % net
assets
Caterpillar Inc. 693 USD 77,419.41 82,929.99 0.43Celgene Corp 433 USD 32,210.85 35,144.89 0.18Centene Corp. De 726 USD 38,049.32 33,428.26 0.18Check Point Software Techno 346 USD 34,155.11 35,122.54 0.18Chevron Corporation 294 USD 30,262.26 32,123.42 0.17Chubb Ltd 237 USD 27,454.37 30,650.39 0.16Cisco Systems Inc 740 USD 30,663.89 35,560.80 0.19Citigroup Inc 551 USD 32,468.34 33,880.53 0.18Cnh Industrial N.V. 4,009 USD 33,058.57 36,186.25 0.19Cnh Industrial Reg Shs 9,167 EUR 90,767.23 82,668.01 0.43Coca-Cola Co. 705 USD 28,491.48 31,520.41 0.17Conocophillips 1,094 USD 66,435.79 58,595.14 0.31Ctrip. Com Internation. Ltd /Sadr 630 USD 23,394.74 20,417.33 0.11Cvs Caremark Corp 359 USD 23,089.16 17,176.14 0.09Delta Air Lines 599 USD 29,238.54 29,847.44 0.16Deutsche Boerse Ag /Nam. 350 EUR 43,363.54 43,540.00 0.23Deutsche Telekom /Nam. 12,814 EUR 180,850.24 194,926.57 1.02Dxc Technology Company 521 USD 36,512.31 25,228.86 0.13Eads. Eur. Aeronaut. Defence+Sp. 1,245 EUR 145,466.46 155,226.60 0.81Ebay Inc 907 USD 28,386.21 31,457.11 0.16Elastic Bv. 403 USD 30,032.54 26,418.46 0.14Electronic Arts 361 USD 32,470.71 32,096.64 0.17Emerson Electric Co 511 USD 27,992.62 29,935.83 0.16Enel 24,457 EUR 117,872.93 150,165.98 0.79Eni Spa Roma 10,101 EUR 160,280.66 147,535.21 0.77Ericsson Tel. B 4,278 SEK 37,307.54 35,667.55 0.19Erste Bank 1,063 EUR 37,546.19 34,696.32 0.18Estee Lauder Cos A 161 USD 21,096.33 25,885.25 0.14Farfetch Ltd 829 USD 18,579.04 15,140.22 0.08Fe New Nv 761 EUR 84,976.24 108,670.80 0.57Fiat Chrysler Automobiles Nv 8,077 EUR 121,529.43 99,072.48 0.52Gaz De France 5,327 EUR 74,484.53 71,062.18 0.37Gilead Sciences Inc 528 USD 32,619.22 31,321.17 0.16Glaxosmithkline Plc 1,348 GBP 22,615.35 23,745.88 0.12Glencore Intl 8,709 GBP 31,200.94 26,598.93 0.14Goldman Sachs Group Inc 134 USD 21,078.22 24,072.70 0.13Groupe Danone 606 EUR 43,849.02 45,147.00 0.24Hasbro Inc. 806 USD 71,263.26 74,789.78 0.39Hess Corp 605 USD 31,385.75 33,769.29 0.18Honeywell International Inc. 280 USD 35,628.04 42,923.17 0.22Humana Inc. 114 USD 26,660.64 26,555.62 0.14Iberdrola Sa 9,127 EUR 58,407.28 80,007.28 0.42Imi Plc 1,808 GBP 18,719.35 20,968.75 0.11Inditex 2,595 EUR 70,565.66 68,637.75 0.36Infineon Technologies /Nam. 7,613 EUR 149,370.99 118,382.15 0.62Ing Group Nv 20,940 EUR 231,176.71 213,504.24 1.12Intesa Sanpaolo 65,101 EUR 154,645.15 122,520.08 0.64Jeronimo Martins Sgps Sa 7,545 EUR 98,856.63 106,874.93 0.56Johnson & Johnson 628 USD 70,557.97 76,800.28 0.40Jpmorgan Chase & Co 1,072 USD 102,060.92 105,232.77 0.55Kering Act. 279 EUR 145,695.39 145,107.90 0.76Lafargeholcim N Namen-Akt. 4,066 CHF 173,013.42 174,539.58 0.91Levi Strauss Class -A- 1,212 USD 24,534.34 22,220.18 0.12Lilly (Eli) & Co 522 USD 43,619.65 50,779.16 0.27Linde Plc 115 USD 15,732.99 20,275.71 0.11Lockheed Martin Corp 124 USD 34,787.39 39,581.14 0.21Lvmh Moet Hennessy Eur 0.3 594 EUR 175,465.06 222,334.20 1.16Marvell Technology Group 1,667 USD 26,368.79 34,938.35 0.18Medtronic Holdings Limited 310 USD 24,798.64 26,508.82 0.14Merck 962 USD 57,095.59 70,825.97 0.37Metlife Inc 600 USD 23,004.76 26,167.35 0.14Microsoft Corp 1,126 USD 109,645.95 132,442.67 0.69Mondelez International Inc Wi 664 USD 27,245.13 31,424.71 0.16
Pramerica Sicav
The accompanying notes form an integral part of these financial statements.
243
Obiettivo Sviluppo
Statement of Investmentsas at June 30, 2019 (continued)
(expressed in EUR)

Description Face value/
Quantity
Base currency Cost Market Value % net
assets
Nexi S.P.A. 11,307 EUR 97,806.42 102,452.73 0.54Nordea Bank Abp 20,937 SEK 166,608.28 133,745.56 0.70Novartis Ag Basel /Nam. 810 CHF 51,696.60 65,062.58 0.34Nvidia Corp 190 USD 31,882.92 27,398.10 0.14Nxp Semiconductor 391 USD 32,970.83 33,510.85 0.18Parker-Hannifin 201 USD 27,978.69 30,004.40 0.16Pernod-Ricard 1,016 EUR 146,175.38 164,642.80 0.86Peugeot Sa 6,932 EUR 150,075.94 150,216.44 0.79Philip Morris Int. 477 USD 34,892.01 32,890.34 0.17Phillips 66 - Shs When Issued 373 USD 34,240.48 30,635.19 0.16Pinterest Inc -A- 1,406 USD 30,963.55 33,603.76 0.18Pioneer Natural Resources Co 476 USD 62,098.63 64,305.35 0.34Prada Shs* 14,579 HKD 43,393.40 39,568.75 0.21Procter & Gamble Co 457 USD 34,255.75 43,998.64 0.23Prysmian Spa 15,017 EUR 311,503.32 272,558.55 1.43Ptc Inc Shs 234 USD 18,520.18 18,442.22 0.10Public Storage 61 USD 11,072.77 12,756.49 0.07Qualcomm Inc 635 USD 30,003.50 42,413.25 0.22Raytheon Company 155 USD 23,764.36 23,664.41 0.12Red Electrica Corporacion. Sa 1,953 EUR 38,454.45 35,769.20 0.19Roy. Philips Electr. /Eur 0.2 2,570 EUR 90,220.97 98,135.45 0.51Royal Dutch Shell Plc /-A- 3,529 EUR 91,598.62 101,317.59 0.53Rwe Ag (Neu). Essen A 6,499 EUR 135,979.88 140,833.33 0.74Ryanair Holdings Plc 8,536 EUR 97,554.01 86,341.64 0.45Salesforce Com Inc 169 USD 24,239.76 22,515.03 0.12Sampo Plc A 7,308 EUR 315,339.32 303,282.00 1.59Sandvik Ab 1,808 SEK 25,273.65 29,190.00 0.15Sanofi-Aventis 3,744 EUR 277,670.10 284,207.04 1.49Sap Ag 2,932 EUR 298,544.86 354,068.32 1.85Scor Se 3,022 EUR 109,849.23 116,528.32 0.61Scottish & Southern Energy Plc 7,364 GBP 94,986.66 92,317.37 0.48Servicenow Inc 141 USD 33,769.24 33,992.77 0.18Siemens Ag /Nam. 2,008 EUR 220,184.47 210,036.80 1.10Simon Property /Paired Shs 77 USD 11,241.94 10,801.23 0.06Standard Chartered Plc 2,217 GBP 15,311.36 17,691.40 0.09Starbucks Corp.* 442 USD 22,059.91 32,533.90 0.17Stmicroelectronics Nv 4,734 EUR 77,906.39 73,850.40 0.39T-Mobile Us Inc 652 USD 38,320.73 42,443.83 0.22Tapestry Inc 884 USD 25,331.02 24,628.43 0.13Telenor As 3,813 NOK 70,276.17 71,108.24 0.37Texas Instruments Inc 971 USD 80,928.62 97,841.74 0.51The Kraft Heinz Company 623 USD 23,112.68 16,979.47 0.09The Trade Desk Inc 155 USD 27,724.38 31,000.00 0.16Tiffany & Co 193 USD 14,828.08 15,868.40 0.08Tokyo Electron Co Ltd 222 JPY 30,422.73 27,350.26 0.14Total Sa 6,047 EUR 315,857.58 297,965.93 1.56Transocean Ltd 11,229 USD 75,168.86 63,199.48 0.33Twilio Inc -A- 160 USD 15,257.93 19,155.33 0.10Ulta Salon Cosmet & Frag Inc 102 USD 23,487.11 31,067.50 0.16Umicore Sa 1,320 EUR 50,171.20 37,224.00 0.19Unicredit Spa 24,063 EUR 322,518.72 260,506.04 1.36Unilever Cert. of Shs 2,663 EUR 134,554.40 142,630.28 0.75Union Pacific Corp. 234 USD 31,154.13 34,745.58 0.18United Technologies Corp 379 USD 41,774.69 43,327.60 0.23Unitedhealth Group Inc 286 USD 62,643.91 61,275.67 0.32Vertex Pharmaceuticals 198 USD 28,525.60 31,880.97 0.17Vinci 1,185 EUR 90,807.37 106,721.10 0.56Visa Inc -A-* 210 USD 26,233.15 32,000.61 0.17Volkswagen Ag /Vorzug. 219 EUR 33,269.48 32,460.18 0.17Walt Disney /Disney Ser. 352 USD 35,330.96 43,158.56 0.23Wood Group 5,604 GBP 38,993.49 28,301.75 0.15Yahoo Japan Corp Tokyo 13,600 JPY 30,049.76 35,017.31 0.18
Pramerica Sicav
The accompanying notes form an integral part of these financial statements.
244
Obiettivo Sviluppo
Statement of Investmentsas at June 30, 2019 (continued)
(expressed in EUR)
* Securities partially or totally lent (see Note 9).
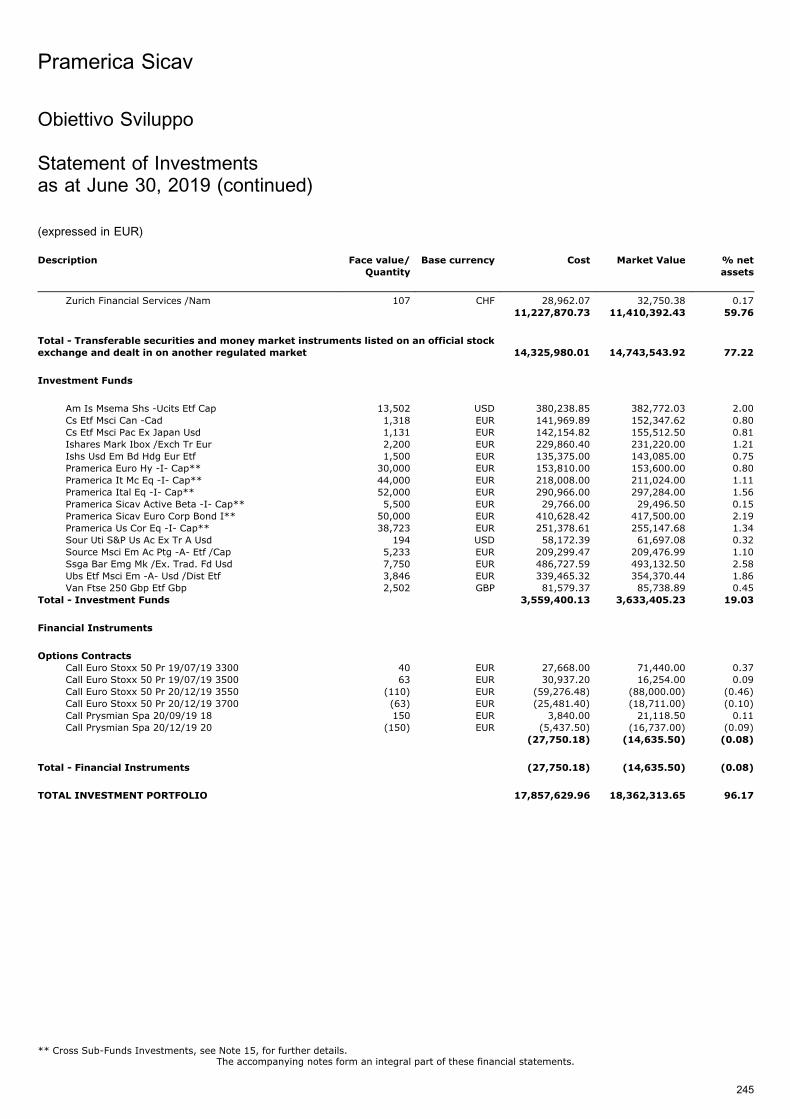
Description Face value/
Quantity
Base currency Cost Market Value % net
assets
Zurich Financial Services /Nam 107 CHF 28,962.07 32,750.38 0.1711,227,870.73 11,410,392.43 59.76
Total - Transferable securities and money market instruments listed on an official stockexchange and dealt in on another regulated market 14,325,980.01 14,743,543.92 77.22
Investment Funds
Am Is Msema Shs -Ucits Etf Cap 13,502 USD 380,238.85 382,772.03 2.00Cs Etf Msci Can -Cad 1,318 EUR 141,969.89 152,347.62 0.80Cs Etf Msci Pac Ex Japan Usd 1,131 EUR 142,154.82 155,512.50 0.81Ishares Mark Ibox /Exch Tr Eur 2,200 EUR 229,860.40 231,220.00 1.21Ishs Usd Em Bd Hdg Eur Etf 1,500 EUR 135,375.00 143,085.00 0.75Pramerica Euro Hy -I- Cap** 30,000 EUR 153,810.00 153,600.00 0.80Pramerica It Mc Eq -I- Cap** 44,000 EUR 218,008.00 211,024.00 1.11Pramerica Ital Eq -I- Cap** 52,000 EUR 290,966.00 297,284.00 1.56Pramerica Sicav Active Beta -I- Cap** 5,500 EUR 29,766.00 29,496.50 0.15Pramerica Sicav Euro Corp Bond I** 50,000 EUR 410,628.42 417,500.00 2.19Pramerica Us Cor Eq -I- Cap** 38,723 EUR 251,378.61 255,147.68 1.34Sour Uti S&P Us Ac Ex Tr A Usd 194 USD 58,172.39 61,697.08 0.32Source Msci Em Ac Ptg -A- Etf /Cap 5,233 EUR 209,299.47 209,476.99 1.10Ssga Bar Emg Mk /Ex. Trad. Fd Usd 7,750 EUR 486,727.59 493,132.50 2.58Ubs Etf Msci Em -A- Usd /Dist Etf 3,846 EUR 339,465.32 354,370.44 1.86Van Ftse 250 Gbp Etf Gbp 2,502 GBP 81,579.37 85,738.89 0.45
Total - Investment Funds 3,559,400.13 3,633,405.23 19.03
Financial Instruments
Options Contracts
Call Euro Stoxx 50 Pr 19/07/19 3300 40 EUR 27,668.00 71,440.00 0.37Call Euro Stoxx 50 Pr 19/07/19 3500 63 EUR 30,937.20 16,254.00 0.09Call Euro Stoxx 50 Pr 20/12/19 3550 (110) EUR (59,276.48) (88,000.00) (0.46)Call Euro Stoxx 50 Pr 20/12/19 3700 (63) EUR (25,481.40) (18,711.00) (0.10)Call Prysmian Spa 20/09/19 18 150 EUR 3,840.00 21,118.50 0.11Call Prysmian Spa 20/12/19 20 (150) EUR (5,437.50) (16,737.00) (0.09)
(27,750.18) (14,635.50) (0.08)
Total - Financial Instruments (27,750.18) (14,635.50) (0.08)
TOTAL INVESTMENT PORTFOLIO 17,857,629.96 18,362,313.65 96.17
Pramerica Sicav
The accompanying notes form an integral part of these financial statements.
245
Obiettivo Sviluppo
Statement of Investmentsas at June 30, 2019 (continued)
(expressed in EUR)
** Cross Sub-Funds Investments, see Note 15, for further details.
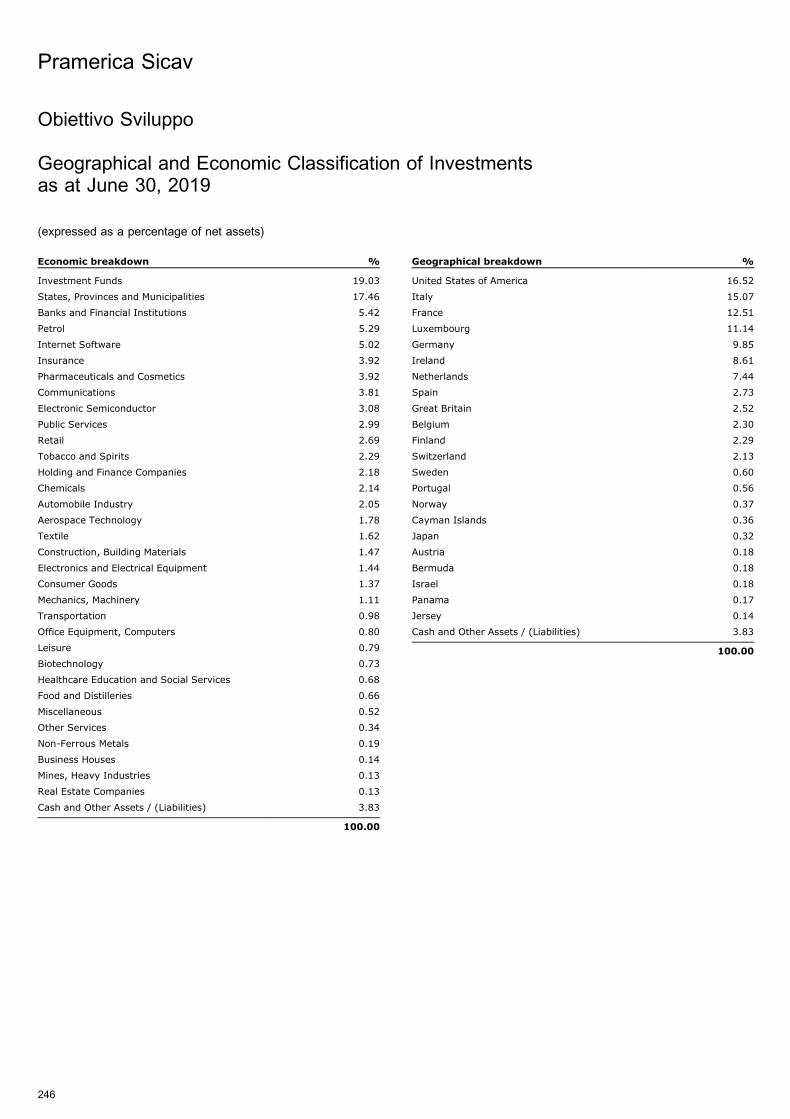
Obiettivo Sviluppo
Geographical and Economic Classification of Investmentsas at June 30, 2019
(expressed as a percentage of net assets)
Economic breakdown %
Investment Funds 19.03
States, Provinces and Municipalities 17.46
Banks and Financial Institutions 5.42
Petrol 5.29
Internet Software 5.02
Insurance 3.92
Pharmaceuticals and Cosmetics 3.92
Communications 3.81
Electronic Semiconductor 3.08
Public Services 2.99
Retail 2.69
Tobacco and Spirits 2.29
Holding and Finance Companies 2.18
Chemicals 2.14
Automobile Industry 2.05
Aerospace Technology 1.78
Textile 1.62
Construction, Building Materials 1.47
Electronics and Electrical Equipment 1.44
Consumer Goods 1.37
Mechanics, Machinery 1.11
Transportation 0.98
Office Equipment, Computers 0.80
Leisure 0.79
Biotechnology 0.73
Healthcare Education and Social Services 0.68
Food and Distilleries 0.66
Miscellaneous 0.52
Other Services 0.34
Non-Ferrous Metals 0.19
Business Houses 0.14
Mines, Heavy Industries 0.13
Real Estate Companies 0.13
Cash and Other Assets / (Liabilities) 3.83
100.00
Geographical breakdown %
United States of America 16.52
Italy 15.07
France 12.51
Luxembourg 11.14
Germany 9.85
Ireland 8.61
Netherlands 7.44
Spain 2.73
Great Britain 2.52
Belgium 2.30
Finland 2.29
Switzerland 2.13
Sweden 0.60
Portugal 0.56
Norway 0.37
Cayman Islands 0.36
Japan 0.32
Austria 0.18
Bermuda 0.18
Israel 0.18
Panama 0.17
Jersey 0.14
Cash and Other Assets / (Liabilities) 3.83
100.00
Pramerica Sicav
246

Globo (Global Bond)
Statement of Investmentsas at June 30, 2019
(expressed in EUR)
Description Face value/
Quantity
Base currency Cost Market Value % net
assets
Transferable securities and money market instruments listed on an official stock exchange and dealt in on another regulated market
Bonds
Abfc Frn 3.206% 04-25.06.34 Opt 5 A1 1,091,437 USD 963,013.84 953,607.72 0.49Abn Amro 4.75% 15-28.07.25 750,000 USD 722,086.00 704,851.17 0.36Adient Glob 3.5% 16-15.08.24 375,000 EUR 373,125.00 311,250.00 0.16Afdb 0.5% 11-21.09.21 350,000 NZD 200,466.55 200,009.18 0.10Ageas 3.25% 19-02.07.49 200,000 EUR 198,412.00 208,693.60 0.11Aguila 3 6.75% 17-15.12.21 200,000 EUR 206,500.00 206,096.00 0.11Altria Grp 3.125% 19-15.06.31 300,000 EUR 299,940.00 325,242.00 0.17Amc Ent 6.375% 16-15.11.24 Regs 150,000 GBP 166,703.70 163,059.15 0.08Anadko Pet 5.55% 16-15.03.26 1,500,000 USD 1,563,032.94 1,480,216.83 0.76Anthem 4.101% 18-01.03.28 235,000 USD 192,575.55 220,737.34 0.11Arab Rep 4.75% 18-16.04.26 Regs 100,000 EUR 100,000.00 100,476.00 0.05Argentina 5% 16-15.01.27 1,000,000 EUR 968,750.00 727,960.00 0.38Argentina 5.25% 17-15.01.28 245,000 EUR 247,719.30 177,556.40 0.09Argentina 7.82% 09-31.12.33 /Pik 577,964 EUR 489,569.35 472,831.98 0.24Argentina St -Up- 31.12.38 150,000 EUR 84,300.00 83,437.50 0.04Ascent Reso 10% 17-01.04.22 144a 50,000 USD 48,971.56 46,476.86 0.02Ascent Reso 7% 18-01.11.26 100,000 USD 86,915.72 80,121.17 0.04At&T Inc 4.35% 19-01.03.29 600,000 USD 543,811.82 567,432.26 0.29At&T Inc 4.85% 19-01.03.39 300,000 USD 258,351.85 282,701.89 0.15At&T Inc 5.1% 18-25.11.48 Rest 200,000 CAD 140,273.16 146,093.77 0.08Austria 5.375% 04-01.12.34 144a 200,000 CAD 177,394.82 184,471.89 0.10Bafc 3.366% (Frn) 18-23.01.26 585,000 USD 477,902.13 530,034.35 0.27Bank 2017 3.02% 17.06.60 Bnk5 A3 1,000,000 USD 904,262.69 897,565.46 0.46Bank 3.175% 17-17.09.60 Bnk7 A4 1,200,000 USD 1,011,661.10 1,091,926.03 0.56Bank 3.229% 17-17.11.50 Bnk8 A3 1,200,000 USD 1,046,241.92 1,096,530.48 0.57Bank B 3.125% 16.07.60 Bnk6 A3 1,700,000 USD 1,499,686.58 1,530,783.80 0.79Barclays 2.375% 17-06.10.23 700,000 GBP 792,245.53 782,532.43 0.40Barclays 3.65% 15-16.03.25 950,000 USD 853,377.96 838,342.26 0.43Barclays 4.338% 18-16.05.24 300,000 USD 256,695.67 272,077.69 0.14Barclays 4.972% 18-16.05.29 300,000 USD 258,856.01 280,950.57 0.14Bausch 7.25% 19-30.05.29 144a 40,000 USD 35,615.71 36,526.47 0.02Bausch Hl 5.75% 19-15.08.27 25,000 USD 22,043.91 23,070.07 0.01Bayer Cap 1.5% 18-26.06.26 600,000 EUR 597,534.00 621,461.28 0.32Bbccr 3.966% 15-12.08.33 Gtp A 1,200,000 USD 1,076,635.15 1,127,461.80 0.58Beazer 8.75% 17-15.03.22 425,000 USD 383,872.90 388,093.77 0.20Bgaria-Flir 3.125% 15-26.03.35 1,000,000 EUR 1,032,000.00 1,207,200.00 0.62Blackstone 2% 19-15.02.24 Regs 300,000 EUR 299,943.00 314,576.43 0.16Bmir Frn 4.206% 17-25.10.27 1 M1 144a 96,449 USD 81,819.30 85,209.40 0.04Bmw Fin 1.5% 19-06.02.29 300,000 EUR 298,125.00 317,196.00 0.16Bombardier 7.5% 15-15.03.25 75,000 USD 61,750.02 66,037.40 0.03Bombardier 7.5% 17-01.12.24 144a 370,000 USD 314,683.77 331,372.38 0.17Bombardier 7.875% 15.04.27 144a 305,000 USD 278,295.03 268,137.02 0.14Bpcm 1.827% 19-08.09.25 Regs 400,000 GBP 466,037.60 454,193.34 0.23Brazil Loan 5.477% 24.07.23 /Pool 308,469 USD 280,743.41 281,682.08 0.15Brazil Minas 5.333% 13-15.02.28 2,722,500 USD 2,308,424.70 2,518,951.95 1.30Bristol Mye 3.20% 19-15.06.26 144a 220,000 USD 196,086.87 200,704.50 0.10Bristol Mye 3.4% 19-26.07.29 144a 525,000 USD 465,339.84 482,609.69 0.25Caixabank 2.25% 18-17.04.30 500,000 EUR 472,600.00 503,359.00 0.26Cco Hldgs 5.5% 16-01.05.26 650,000 USD 609,949.38 597,293.44 0.31Cenovus 6.75% 10-15.11.39 730,000 USD 728,828.01 766,015.56 0.40Chemours Co 4% 18-15.05.26 500,000 EUR 500,000.00 500,000.00 0.26Chile 1.44% 18-01.02.29 340,000 EUR 337,620.00 366,350.00 0.19Cim Frn 4.349% 17-25.01.57 3 A1 144a 563,259 USD 522,930.78 504,003.64 0.26Citigroup I 4.4% 15-10.06.25 1,400,000 USD 1,358,932.14 1,311,918.13 0.68Citm Frn 3.856% 25.10.37 1 1a 589,611 USD 554,763.62 523,571.14 0.27Clear Ch 9.25% 19-15.02.24 144a 225,000 USD 214,977.73 214,351.57 0.11Cnac Hk Fin 1.75% 18-14.06.22 800,000 EUR 797,560.00 820,316.80 0.42Colombia Re 3.875% 16-22.03.26* 2,100,000 EUR 2,372,700.00 2,479,050.00 1.28Comzbk 7.75% 11-16.03.21 /Sub 500,000 EUR 596,750.00 562,150.00 0.29
Pramerica Sicav
The accompanying notes form an integral part of these financial statements.
247
* Securities partially or totally lent (see Note 9).
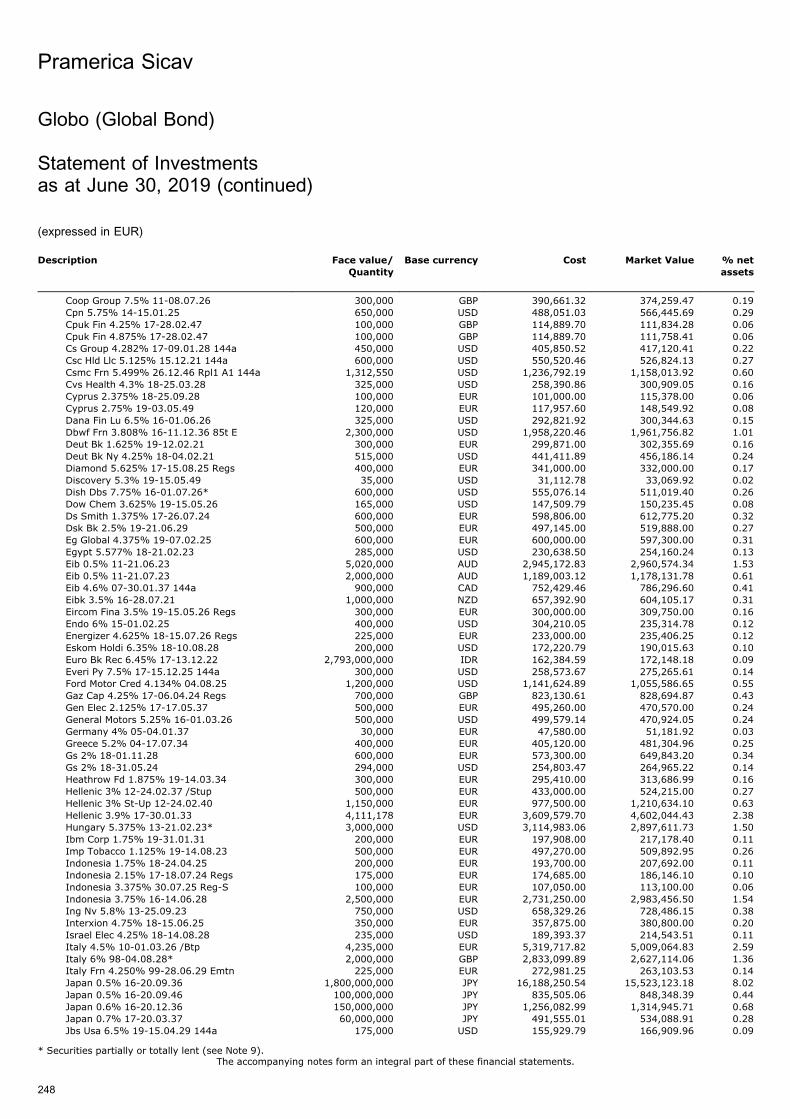
Description Face value/
Quantity
Base currency Cost Market Value % net
assets
Coop Group 7.5% 11-08.07.26 300,000 GBP 390,661.32 374,259.47 0.19Cpn 5.75% 14-15.01.25 650,000 USD 488,051.03 566,445.69 0.29Cpuk Fin 4.25% 17-28.02.47 100,000 GBP 114,889.70 111,834.28 0.06Cpuk Fin 4.875% 17-28.02.47 100,000 GBP 114,889.70 111,758.41 0.06Cs Group 4.282% 17-09.01.28 144a 450,000 USD 405,850.52 417,120.41 0.22Csc Hld Llc 5.125% 15.12.21 144a 600,000 USD 550,520.46 526,824.13 0.27Csmc Frn 5.499% 26.12.46 Rpl1 A1 144a 1,312,550 USD 1,236,792.19 1,158,013.92 0.60Cvs Health 4.3% 18-25.03.28 325,000 USD 258,390.86 300,909.05 0.16Cyprus 2.375% 18-25.09.28 100,000 EUR 101,000.00 115,378.00 0.06Cyprus 2.75% 19-03.05.49 120,000 EUR 117,957.60 148,549.92 0.08Dana Fin Lu 6.5% 16-01.06.26 325,000 USD 292,821.92 300,344.63 0.15Dbwf Frn 3.808% 16-11.12.36 85t E 2,300,000 USD 1,958,220.46 1,961,756.82 1.01Deut Bk 1.625% 19-12.02.21 300,000 EUR 299,871.00 302,355.69 0.16Deut Bk Ny 4.25% 18-04.02.21 515,000 USD 441,411.89 456,186.14 0.24Diamond 5.625% 17-15.08.25 Regs 400,000 EUR 341,000.00 332,000.00 0.17Discovery 5.3% 19-15.05.49 35,000 USD 31,112.78 33,069.92 0.02Dish Dbs 7.75% 16-01.07.26* 600,000 USD 555,076.14 511,019.40 0.26Dow Chem 3.625% 19-15.05.26 165,000 USD 147,509.79 150,235.45 0.08Ds Smith 1.375% 17-26.07.24 600,000 EUR 598,806.00 612,775.20 0.32Dsk Bk 2.5% 19-21.06.29 500,000 EUR 497,145.00 519,888.00 0.27Eg Global 4.375% 19-07.02.25 600,000 EUR 600,000.00 597,300.00 0.31Egypt 5.577% 18-21.02.23 285,000 USD 230,638.50 254,160.24 0.13Eib 0.5% 11-21.06.23 5,020,000 AUD 2,945,172.83 2,960,574.34 1.53Eib 0.5% 11-21.07.23 2,000,000 AUD 1,189,003.12 1,178,131.78 0.61Eib 4.6% 07-30.01.37 144a 900,000 CAD 752,429.46 786,296.60 0.41Eibk 3.5% 16-28.07.21 1,000,000 NZD 657,392.90 604,105.17 0.31Eircom Fina 3.5% 19-15.05.26 Regs 300,000 EUR 300,000.00 309,750.00 0.16Endo 6% 15-01.02.25 400,000 USD 304,210.05 235,314.78 0.12Energizer 4.625% 18-15.07.26 Regs 225,000 EUR 233,000.00 235,406.25 0.12Eskom Holdi 6.35% 18-10.08.28 200,000 USD 172,220.79 190,015.63 0.10Euro Bk Rec 6.45% 17-13.12.22 2,793,000,000 IDR 162,384.59 172,148.18 0.09Everi Py 7.5% 17-15.12.25 144a 300,000 USD 258,573.67 275,265.61 0.14Ford Motor Cred 4.134% 04.08.25 1,200,000 USD 1,141,624.89 1,055,586.65 0.55Gaz Cap 4.25% 17-06.04.24 Regs 700,000 GBP 823,130.61 828,694.87 0.43Gen Elec 2.125% 17-17.05.37 500,000 EUR 495,260.00 470,570.00 0.24General Motors 5.25% 16-01.03.26 500,000 USD 499,579.14 470,924.05 0.24Germany 4% 05-04.01.37 30,000 EUR 47,580.00 51,181.92 0.03Greece 5.2% 04-17.07.34 400,000 EUR 405,120.00 481,304.96 0.25Gs 2% 18-01.11.28 600,000 EUR 573,300.00 649,843.20 0.34Gs 2% 18-31.05.24 294,000 USD 254,803.47 264,965.22 0.14Heathrow Fd 1.875% 19-14.03.34 300,000 EUR 295,410.00 313,686.99 0.16Hellenic 3% 12-24.02.37 /Stup 500,000 EUR 433,000.00 524,215.00 0.27Hellenic 3% St-Up 12-24.02.40 1,150,000 EUR 977,500.00 1,210,634.10 0.63Hellenic 3.9% 17-30.01.33 4,111,178 EUR 3,609,579.70 4,602,044.43 2.38Hungary 5.375% 13-21.02.23* 3,000,000 USD 3,114,983.06 2,897,611.73 1.50Ibm Corp 1.75% 19-31.01.31 200,000 EUR 197,908.00 217,178.40 0.11Imp Tobacco 1.125% 19-14.08.23 500,000 EUR 497,270.00 509,892.95 0.26Indonesia 1.75% 18-24.04.25 200,000 EUR 193,700.00 207,692.00 0.11Indonesia 2.15% 17-18.07.24 Regs 175,000 EUR 174,685.00 186,146.10 0.10Indonesia 3.375% 30.07.25 Reg-S 100,000 EUR 107,050.00 113,100.00 0.06Indonesia 3.75% 16-14.06.28 2,500,000 EUR 2,731,250.00 2,983,456.50 1.54Ing Nv 5.8% 13-25.09.23 750,000 USD 658,329.26 728,486.15 0.38Interxion 4.75% 18-15.06.25 350,000 EUR 357,875.00 380,800.00 0.20Israel Elec 4.25% 18-14.08.28 235,000 USD 189,393.37 214,543.51 0.11Italy 4.5% 10-01.03.26 /Btp 4,235,000 EUR 5,319,717.82 5,009,064.83 2.59Italy 6% 98-04.08.28* 2,000,000 GBP 2,833,099.89 2,627,114.06 1.36Italy Frn 4.250% 99-28.06.29 Emtn 225,000 EUR 272,981.25 263,103.53 0.14Japan 0.5% 16-20.09.36 1,800,000,000 JPY 16,188,250.54 15,523,123.18 8.02Japan 0.5% 16-20.09.46 100,000,000 JPY 835,505.06 848,348.39 0.44Japan 0.6% 16-20.12.36 150,000,000 JPY 1,256,082.99 1,314,945.71 0.68Japan 0.7% 17-20.03.37 60,000,000 JPY 491,555.01 534,088.91 0.28Jbs Usa 6.5% 19-15.04.29 144a 175,000 USD 155,929.79 166,909.96 0.09
Pramerica Sicav
The accompanying notes form an integral part of these financial statements.
248
Globo (Global Bond)
Statement of Investmentsas at June 30, 2019 (continued)
(expressed in EUR)
* Securities partially or totally lent (see Note 9).

Description Face value/
Quantity
Base currency Cost Market Value % net
assets
Jpmcc 3.3422% 17.03.50 Jp5 A3 450,000 USD 429,502.08 407,674.91 0.21Jpmcc 3.3785% 15.09.50 Jp7 A3 550,000 USD 476,406.88 501,090.90 0.26Jpmdb 3.0477% 17.10.50 C7 A3 1,200,000 USD 1,023,907.07 1,076,771.94 0.56Kazakhstan 1.55% 18-09.11.23 100,000 EUR 101,400.00 104,963.00 0.05Kazakhstan 2.375% 18-09.11.28 200,000 EUR 195,700.00 216,516.00 0.11Kazakhstan 2.375% 18-09.11.28 Regs 285,000 EUR 285,000.00 308,535.30 0.16Lazio 3.088% 17-31.03.43 /Pool 241,129 EUR 241,129.48 233,292.77 0.12Lennar 5.25% 18-01.06.26 575,000 USD 523,180.24 537,689.88 0.28Lloyds Bk 2.907% 17-07.11.23 600,000 USD 514,977.26 527,699.34 0.27Logicor Fin 0.5% 19-30.04.21 500,000 EUR 499,960.00 503,997.20 0.26Loxam 2.875% 19-15.04.26 100,000 EUR 100,000.00 100,000.00 0.05Loxam 4.5% 19-15.04.27 Regs 400,000 EUR 400,400.00 397,988.80 0.21Lyondellbas 4.625% 15-26.02.55 750,000 USD 654,894.79 658,391.87 0.34Malaysia 4.048% 14-30.09.21 3,860,000 MYR 829,555.94 832,523.08 0.43Mars Inc 3.6% 19-01.04.34 144a 50,000 USD 44,155.29 46,736.30 0.02Medtrnc 1.625% 19-07.03.31 200,000 EUR 198,276.00 214,780.40 0.11Medtrnc 1.75% 19-02.07.49 200,000 EUR 194,662.00 193,500.00 0.10Medtrnc 4.25% 19-07.03.39 200,000 EUR 197,970.00 226,132.00 0.12Mexico 1.75% 18-17.04.28 3,900,000 EUR 3,850,791.18 3,989,317.80 2.06Mgm Gr 4.5% 17-01.09.26 450,000 USD 399,854.23 405,489.95 0.21Min Fin Ruf 2.875% 18-04.12.25 2,000,000 EUR 2,007,000.00 2,141,496.00 1.11Mpt Op Ptnr 3.325% 17-24.03.25 500,000 EUR 500,000.00 541,490.00 0.28Msbam 16- 2.731% 18.11.49 C31 500,000 USD 416,759.18 445,141.28 0.23Msbam 3.295% 17-17.05.50 C33 A3 2,000,000 USD 1,845,220.06 1,818,819.39 0.94Msc H1 3.153% 17.06.50 H1 A3 1,300,000 USD 1,173,863.16 1,173,501.63 0.61Nbaduh 4.8% 18-01.06.21 2,000,000 CNH 268,493.61 262,742.13 0.14Nutrien 4.2% 19-01.04.29 65,000 USD 57,088.77 61,714.28 0.03Odart 3.42% 15.10.24 2a D 144a 100,000 USD 84,812.18 88,450.82 0.05Odart 3.91% 16.08.21 1a C 144a 600,000 USD 562,214.45 530,041.34 0.27Omfit 3.35% 14.09.32 1a C 144a 100,000 USD 83,126.39 88,063.67 0.05Optn 4.1% 18-08.10.24 C A 300,000 USD 259,405.69 270,140.77 0.14Optn 4.15% 18-09.12.24 D A 200,000 USD 176,606.45 180,578.59 0.09Panama 8.875% 97-30.09.27 1,200,000 USD 1,602,754.62 1,492,239.88 0.77Paragon Frn 1.446% 15.06.41 10x B1a 461,546 GBP 477,544.54 487,018.34 0.25Paragon Mtg Frn 0.229% 15.06.41 197,805 EUR 181,486.42 186,846.15 0.10Pemex 2.5% 17-21.08.21* 200,000 EUR 202,700.00 200,240.00 0.10Pemex 3.625% 18-24.11.25 2,610,000 EUR 2,602,952.50 2,489,940.00 1.29Pemex 3.75% 17-21.02.24 350,000 EUR 356,963.00 347,767.00 0.18Pemex 4.875% 17-21.02.28 100,000 EUR 99,600.00 97,600.00 0.05Peru 2.75% 15-30.01.26* 1,800,000 EUR 2,002,500.00 2,064,852.00 1.07Peru 3.75% 16-01.03.30 100,000 EUR 122,250.00 127,320.80 0.07Perusahaan 2.875% 18-25.10.25 300,000 EUR 297,663.00 322,537.50 0.17Petro Gbl Fin 5.375% 01.10.29 400,000 GBP 475,577.03 464,245.63 0.24Petsmart 5.875% 17-01.06.25 75,000 USD 51,400.33 63,877.43 0.03Pnmsr Frn 5.156% 18-25.08.23 Gt2 A 144a 100,000 USD 86,258.95 88,113.88 0.05Pnmsr Frn 5.356% 18-25.02.23 Gt1 A 144a 160,000 USD 129,859.59 140,711.10 0.07Portugal 4.1% 06-15.04.37 1,425,000 EUR 1,720,172.10 2,134,062.90 1.10Portugal R 5.125% 14-15.10.24 2,000,000 USD 1,823,976.55 1,962,419.88 1.01Portuguese 3.875% 14-15.02.30 4,315,000 EUR 5,138,030.45 5,783,239.16 2.99Prov Buenos 5.375% 17-20.01.23 100,000 EUR 106,600.00 75,862.00 0.04Qnb Fin 3.8% 19-25.04.22 2,000,000 CNH 263,883.12 256,113.83 0.13Rbc 4.269% 19-22.03.25 1,060,000 USD 934,958.90 962,544.96 0.50Rbs Group 4.445% (Frn) 19-08.05.30 300,000 USD 268,192.38 272,663.70 0.14Rci Bq 0.75% 19-10.04.23 500,000 EUR 498,885.00 503,964.00 0.26Rep Dominican 7.5% 06.05.21 /Pool 666,667 USD 676,068.37 616,097.40 0.32Rep of Cypr 3.75% 16-26.07.23 2,600,000 EUR 2,706,600.00 2,978,560.00 1.54Rep of Cypr 4.25% 15-04.11.25 1,100,000 EUR 1,188,650.00 1,370,655.00 0.71Romania 2.5% 18-08.02.30 Regs 200,000 EUR 198,100.00 212,075.20 0.11Romania 3.875% 15-29.10.35 1,000,000 EUR 1,122,500.00 1,145,270.00 0.59Romania 4.125% 18-11.03.39 150,000 EUR 154,500.00 171,750.00 0.09Rossini Sar 6.75% 18-30.10.25* 255,000 EUR 255,000.00 276,947.85 0.14Sally Hldgs 5.625% 15-01.12.25 350,000 USD 299,039.21 301,536.57 0.16
Pramerica Sicav
The accompanying notes form an integral part of these financial statements.
249
Globo (Global Bond)
Statement of Investmentsas at June 30, 2019 (continued)
(expressed in EUR)
* Securities partially or totally lent (see Note 9).
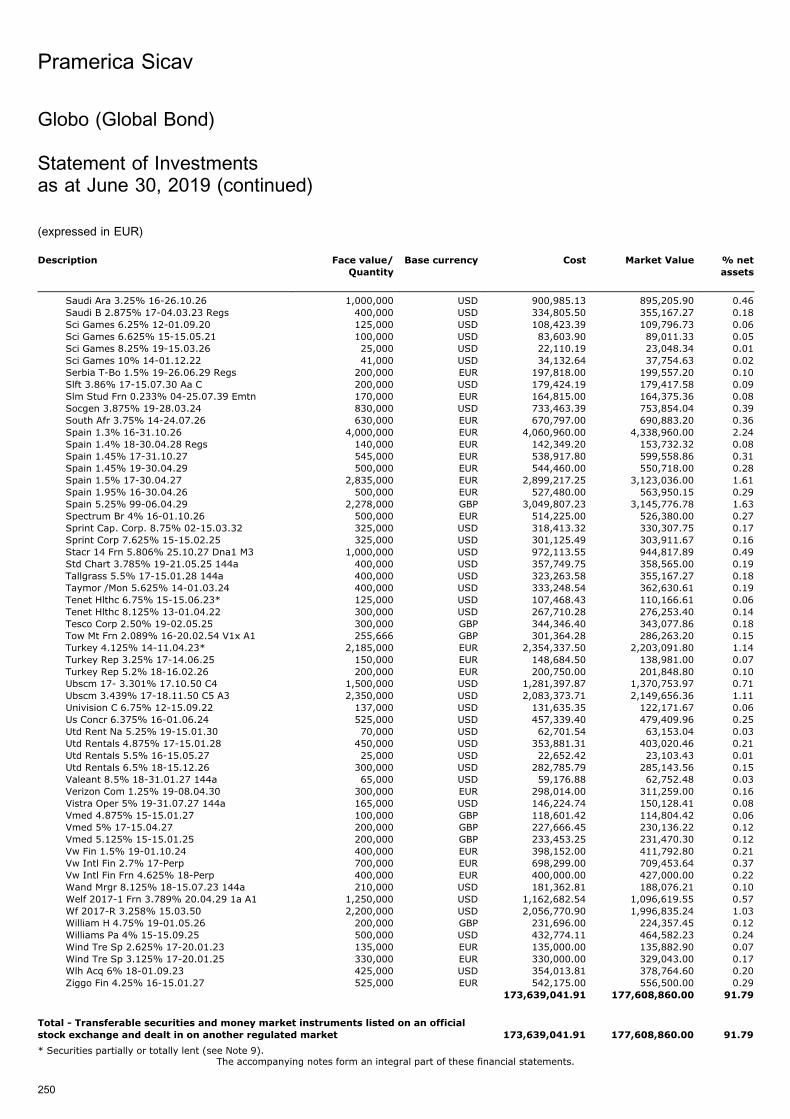
Description Face value/
Quantity
Base currency Cost Market Value % net
assets
Saudi Ara 3.25% 16-26.10.26 1,000,000 USD 900,985.13 895,205.90 0.46Saudi B 2.875% 17-04.03.23 Regs 400,000 USD 334,805.50 355,167.27 0.18Sci Games 6.25% 12-01.09.20 125,000 USD 108,423.39 109,796.73 0.06Sci Games 6.625% 15-15.05.21 100,000 USD 83,603.90 89,011.33 0.05Sci Games 8.25% 19-15.03.26 25,000 USD 22,110.19 23,048.34 0.01Sci Games 10% 14-01.12.22 41,000 USD 34,132.64 37,754.63 0.02Serbia T-Bo 1.5% 19-26.06.29 Regs 200,000 EUR 197,818.00 199,557.20 0.10Slft 3.86% 17-15.07.30 Aa C 200,000 USD 179,424.19 179,417.58 0.09Slm Stud Frn 0.233% 04-25.07.39 Emtn 170,000 EUR 164,815.00 164,375.36 0.08Socgen 3.875% 19-28.03.24 830,000 USD 733,463.39 753,854.04 0.39South Afr 3.75% 14-24.07.26 630,000 EUR 670,797.00 690,883.20 0.36Spain 1.3% 16-31.10.26 4,000,000 EUR 4,060,960.00 4,338,960.00 2.24Spain 1.4% 18-30.04.28 Regs 140,000 EUR 142,349.20 153,732.32 0.08Spain 1.45% 17-31.10.27 545,000 EUR 538,917.80 599,558.86 0.31Spain 1.45% 19-30.04.29 500,000 EUR 544,460.00 550,718.00 0.28Spain 1.5% 17-30.04.27 2,835,000 EUR 2,899,217.25 3,123,036.00 1.61Spain 1.95% 16-30.04.26 500,000 EUR 527,480.00 563,950.15 0.29Spain 5.25% 99-06.04.29 2,278,000 GBP 3,049,807.23 3,145,776.78 1.63Spectrum Br 4% 16-01.10.26 500,000 EUR 514,225.00 526,380.00 0.27Sprint Cap. Corp. 8.75% 02-15.03.32 325,000 USD 318,413.32 330,307.75 0.17Sprint Corp 7.625% 15-15.02.25 325,000 USD 301,125.49 303,911.67 0.16Stacr 14 Frn 5.806% 25.10.27 Dna1 M3 1,000,000 USD 972,113.55 944,817.89 0.49Std Chart 3.785% 19-21.05.25 144a 400,000 USD 357,749.75 358,565.00 0.19Tallgrass 5.5% 17-15.01.28 144a 400,000 USD 323,263.58 355,167.27 0.18Taymor /Mon 5.625% 14-01.03.24 400,000 USD 333,248.54 362,630.61 0.19Tenet Hlthc 6.75% 15-15.06.23* 125,000 USD 107,468.43 110,166.61 0.06Tenet Hlthc 8.125% 13-01.04.22 300,000 USD 267,710.28 276,253.40 0.14Tesco Corp 2.50% 19-02.05.25 300,000 GBP 344,346.40 343,077.86 0.18Tow Mt Frn 2.089% 16-20.02.54 V1x A1 255,666 GBP 301,364.28 286,263.20 0.15Turkey 4.125% 14-11.04.23* 2,185,000 EUR 2,354,337.50 2,203,091.80 1.14Turkey Rep 3.25% 17-14.06.25 150,000 EUR 148,684.50 138,981.00 0.07Turkey Rep 5.2% 18-16.02.26 200,000 EUR 200,750.00 201,848.80 0.10Ubscm 17- 3.301% 17.10.50 C4 1,500,000 USD 1,281,397.87 1,370,753.97 0.71Ubscm 3.439% 17-18.11.50 C5 A3 2,350,000 USD 2,083,373.71 2,149,656.36 1.11Univision C 6.75% 12-15.09.22 137,000 USD 131,635.35 122,171.67 0.06Us Concr 6.375% 16-01.06.24 525,000 USD 457,339.40 479,409.96 0.25Utd Rent Na 5.25% 19-15.01.30 70,000 USD 62,701.54 63,153.04 0.03Utd Rentals 4.875% 17-15.01.28 450,000 USD 353,881.31 403,020.46 0.21Utd Rentals 5.5% 16-15.05.27 25,000 USD 22,652.42 23,103.43 0.01Utd Rentals 6.5% 18-15.12.26 300,000 USD 282,785.79 285,143.56 0.15Valeant 8.5% 18-31.01.27 144a 65,000 USD 59,176.88 62,752.48 0.03Verizon Com 1.25% 19-08.04.30 300,000 EUR 298,014.00 311,259.00 0.16Vistra Oper 5% 19-31.07.27 144a 165,000 USD 146,224.74 150,128.41 0.08Vmed 4.875% 15-15.01.27 100,000 GBP 118,601.42 114,804.42 0.06Vmed 5% 17-15.04.27 200,000 GBP 227,666.45 230,136.22 0.12Vmed 5.125% 15-15.01.25 200,000 GBP 233,453.25 231,470.30 0.12Vw Fin 1.5% 19-01.10.24 400,000 EUR 398,152.00 411,792.80 0.21Vw Intl Fin 2.7% 17-Perp 700,000 EUR 698,299.00 709,453.64 0.37Vw Intl Fin Frn 4.625% 18-Perp 400,000 EUR 400,000.00 427,000.00 0.22Wand Mrgr 8.125% 18-15.07.23 144a 210,000 USD 181,362.81 188,076.21 0.10Welf 2017-1 Frn 3.789% 20.04.29 1a A1 1,250,000 USD 1,162,682.54 1,096,619.55 0.57Wf 2017-R 3.258% 15.03.50 2,200,000 USD 2,056,770.90 1,996,835.24 1.03William H 4.75% 19-01.05.26 200,000 GBP 231,696.00 224,357.45 0.12Williams Pa 4% 15-15.09.25 500,000 USD 432,774.11 464,582.23 0.24Wind Tre Sp 2.625% 17-20.01.23 135,000 EUR 135,000.00 135,882.90 0.07Wind Tre Sp 3.125% 17-20.01.25 330,000 EUR 330,000.00 329,043.00 0.17Wlh Acq 6% 18-01.09.23 425,000 USD 354,013.81 378,764.60 0.20Ziggo Fin 4.25% 16-15.01.27 525,000 EUR 542,175.00 556,500.00 0.29
173,639,041.91 177,608,860.00 91.79
Total - Transferable securities and money market instruments listed on an official
stock exchange and dealt in on another regulated market 173,639,041.91 177,608,860.00 91.79
Pramerica Sicav
The accompanying notes form an integral part of these financial statements.
250
Globo (Global Bond)
Statement of Investmentsas at June 30, 2019 (continued)
(expressed in EUR)
* Securities partially or totally lent (see Note 9).
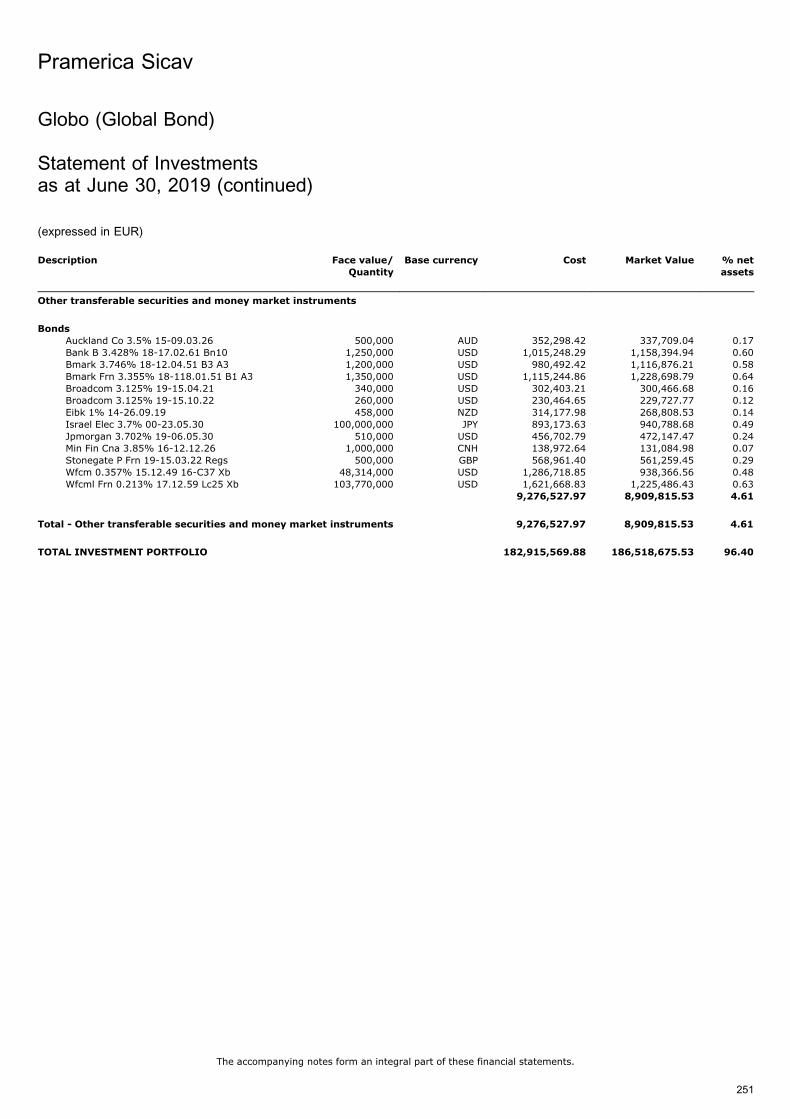
Description Face value/
Quantity
Base currency Cost Market Value % net
assets
Other transferable securities and money market instruments
Bonds
Auckland Co 3.5% 15-09.03.26 500,000 AUD 352,298.42 337,709.04 0.17Bank B 3.428% 18-17.02.61 Bn10 1,250,000 USD 1,015,248.29 1,158,394.94 0.60Bmark 3.746% 18-12.04.51 B3 A3 1,200,000 USD 980,492.42 1,116,876.21 0.58Bmark Frn 3.355% 18-118.01.51 B1 A3 1,350,000 USD 1,115,244.86 1,228,698.79 0.64Broadcom 3.125% 19-15.04.21 340,000 USD 302,403.21 300,466.68 0.16Broadcom 3.125% 19-15.10.22 260,000 USD 230,464.65 229,727.77 0.12Eibk 1% 14-26.09.19 458,000 NZD 314,177.98 268,808.53 0.14Israel Elec 3.7% 00-23.05.30 100,000,000 JPY 893,173.63 940,788.68 0.49Jpmorgan 3.702% 19-06.05.30 510,000 USD 456,702.79 472,147.47 0.24Min Fin Cna 3.85% 16-12.12.26 1,000,000 CNH 138,972.64 131,084.98 0.07Stonegate P Frn 19-15.03.22 Regs 500,000 GBP 568,961.40 561,259.45 0.29Wfcm 0.357% 15.12.49 16-C37 Xb 48,314,000 USD 1,286,718.85 938,366.56 0.48Wfcml Frn 0.213% 17.12.59 Lc25 Xb 103,770,000 USD 1,621,668.83 1,225,486.43 0.63
9,276,527.97 8,909,815.53 4.61
Total - Other transferable securities and money market instruments 9,276,527.97 8,909,815.53 4.61
TOTAL INVESTMENT PORTFOLIO 182,915,569.88 186,518,675.53 96.40
Pramerica Sicav
The accompanying notes form an integral part of these financial statements.
251
Globo (Global Bond)
Statement of Investmentsas at June 30, 2019 (continued)
(expressed in EUR)
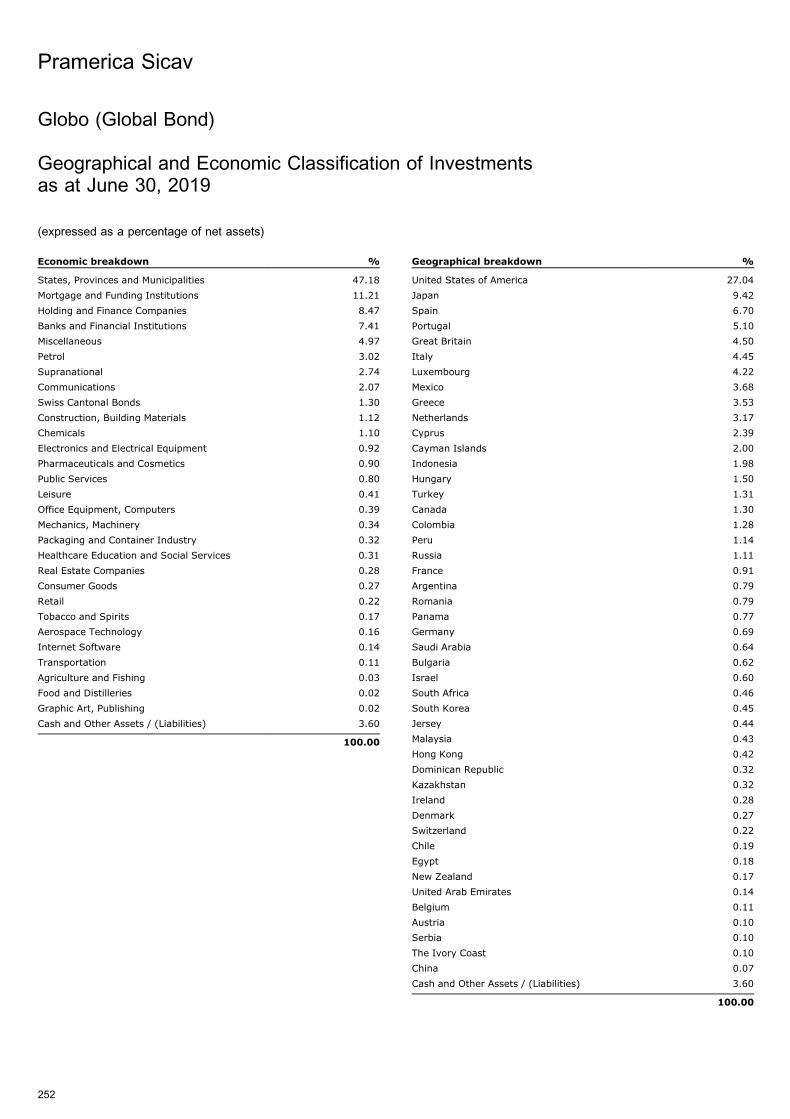
Globo (Global Bond)
Geographical and Economic Classification of Investmentsas at June 30, 2019
(expressed as a percentage of net assets)
Economic breakdown %
States, Provinces and Municipalities 47.18
Mortgage and Funding Institutions 11.21
Holding and Finance Companies 8.47
Banks and Financial Institutions 7.41
Miscellaneous 4.97
Petrol 3.02
Supranational 2.74
Communications 2.07
Swiss Cantonal Bonds 1.30
Construction, Building Materials 1.12
Chemicals 1.10
Electronics and Electrical Equipment 0.92
Pharmaceuticals and Cosmetics 0.90
Public Services 0.80
Leisure 0.41
Office Equipment, Computers 0.39
Mechanics, Machinery 0.34
Packaging and Container Industry 0.32
Healthcare Education and Social Services 0.31
Real Estate Companies 0.28
Consumer Goods 0.27
Retail 0.22
Tobacco and Spirits 0.17
Aerospace Technology 0.16
Internet Software 0.14
Transportation 0.11
Agriculture and Fishing 0.03
Food and Distilleries 0.02
Graphic Art, Publishing 0.02
Cash and Other Assets / (Liabilities) 3.60
100.00
Geographical breakdown %
United States of America 27.04
Japan 9.42
Spain 6.70
Portugal 5.10
Great Britain 4.50
Italy 4.45
Luxembourg 4.22
Mexico 3.68
Greece 3.53
Netherlands 3.17
Cyprus 2.39
Cayman Islands 2.00
Indonesia 1.98
Hungary 1.50
Turkey 1.31
Canada 1.30
Colombia 1.28
Peru 1.14
Russia 1.11
France 0.91
Argentina 0.79
Romania 0.79
Panama 0.77
Germany 0.69
Saudi Arabia 0.64
Bulgaria 0.62
Israel 0.60
South Africa 0.46
South Korea 0.45
Jersey 0.44
Malaysia 0.43
Hong Kong 0.42
Dominican Republic 0.32
Kazakhstan 0.32
Ireland 0.28
Denmark 0.27
Switzerland 0.22
Chile 0.19
Egypt 0.18
New Zealand 0.17
United Arab Emirates 0.14
Belgium 0.11
Austria 0.10
Serbia 0.10
The Ivory Coast 0.10
China 0.07
Cash and Other Assets / (Liabilities) 3.60
100.00
Pramerica Sicav
252
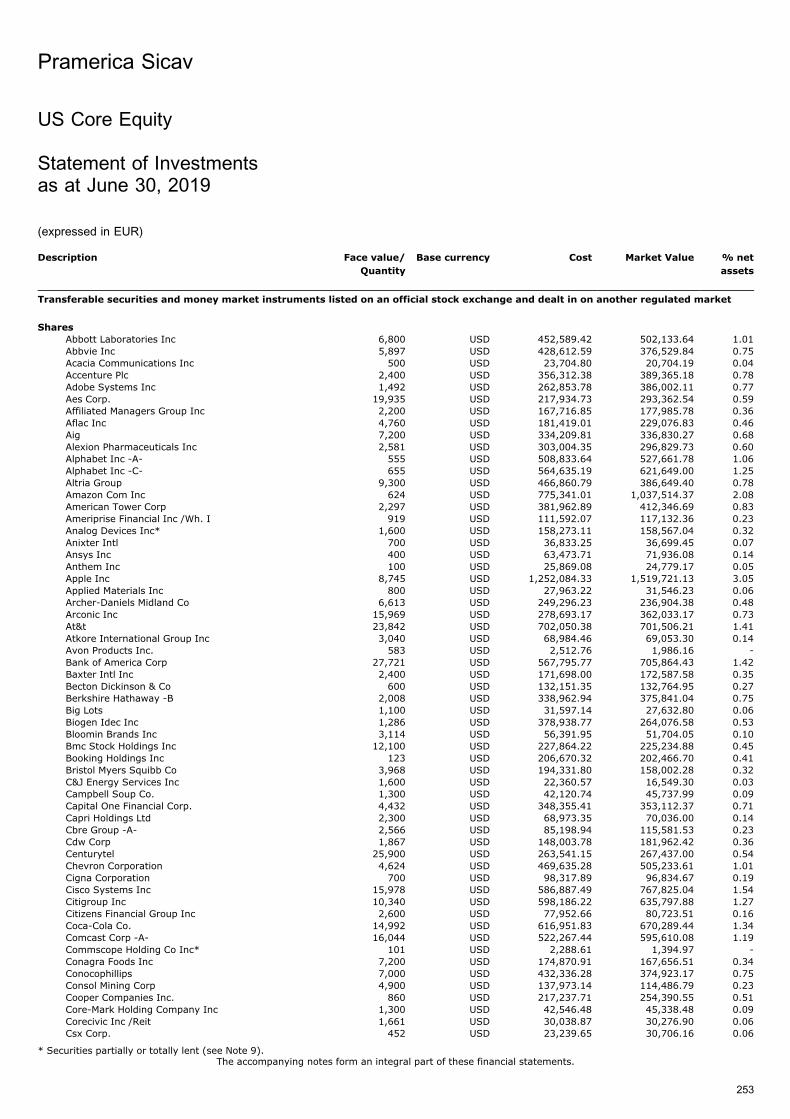
US Core Equity
Statement of Investmentsas at June 30, 2019
(expressed in EUR)
Description Face value/
Quantity
Base currency Cost Market Value % net
assets
Transferable securities and money market instruments listed on an official stock exchange and dealt in on another regulated market
Shares
Abbott Laboratories Inc 6,800 USD 452,589.42 502,133.64 1.01Abbvie Inc 5,897 USD 428,612.59 376,529.84 0.75Acacia Communications Inc 500 USD 23,704.80 20,704.19 0.04Accenture Plc 2,400 USD 356,312.38 389,365.18 0.78Adobe Systems Inc 1,492 USD 262,853.78 386,002.11 0.77Aes Corp. 19,935 USD 217,934.73 293,362.54 0.59Affiliated Managers Group Inc 2,200 USD 167,716.85 177,985.78 0.36Aflac Inc 4,760 USD 181,419.01 229,076.83 0.46Aig 7,200 USD 334,209.81 336,830.27 0.68Alexion Pharmaceuticals Inc 2,581 USD 303,004.35 296,829.73 0.60Alphabet Inc -A- 555 USD 508,833.64 527,661.78 1.06Alphabet Inc -C- 655 USD 564,635.19 621,649.00 1.25Altria Group 9,300 USD 466,860.79 386,649.40 0.78Amazon Com Inc 624 USD 775,341.01 1,037,514.37 2.08American Tower Corp 2,297 USD 381,962.89 412,346.69 0.83Ameriprise Financial Inc /Wh. I 919 USD 111,592.07 117,132.36 0.23Analog Devices Inc* 1,600 USD 158,273.11 158,567.04 0.32Anixter Intl 700 USD 36,833.25 36,699.45 0.07Ansys Inc 400 USD 63,473.71 71,936.08 0.14Anthem Inc 100 USD 25,869.08 24,779.17 0.05Apple Inc 8,745 USD 1,252,084.33 1,519,721.13 3.05Applied Materials Inc 800 USD 27,963.22 31,546.23 0.06Archer-Daniels Midland Co 6,613 USD 249,296.23 236,904.38 0.48Arconic Inc 15,969 USD 278,693.17 362,033.17 0.73At&t 23,842 USD 702,050.38 701,506.21 1.41Atkore International Group Inc 3,040 USD 68,984.46 69,053.30 0.14Avon Products Inc. 583 USD 2,512.76 1,986.16 -Bank of America Corp 27,721 USD 567,795.77 705,864.43 1.42Baxter Intl Inc 2,400 USD 171,698.00 172,587.58 0.35Becton Dickinson & Co 600 USD 132,151.35 132,764.95 0.27Berkshire Hathaway -B 2,008 USD 338,962.94 375,841.04 0.75Big Lots 1,100 USD 31,597.14 27,632.80 0.06Biogen Idec Inc 1,286 USD 378,938.77 264,076.58 0.53Bloomin Brands Inc 3,114 USD 56,391.95 51,704.05 0.10Bmc Stock Holdings Inc 12,100 USD 227,864.22 225,234.88 0.45Booking Holdings Inc 123 USD 206,670.32 202,466.70 0.41Bristol Myers Squibb Co 3,968 USD 194,331.80 158,002.28 0.32C&J Energy Services Inc 1,600 USD 22,360.57 16,549.30 0.03Campbell Soup Co. 1,300 USD 42,120.74 45,737.99 0.09Capital One Financial Corp. 4,432 USD 348,355.41 353,112.37 0.71Capri Holdings Ltd 2,300 USD 68,973.35 70,036.00 0.14Cbre Group -A- 2,566 USD 85,198.94 115,581.53 0.23Cdw Corp 1,867 USD 148,003.78 181,962.42 0.36Centurytel 25,900 USD 263,541.15 267,437.00 0.54Chevron Corporation 4,624 USD 469,635.28 505,233.61 1.01Cigna Corporation 700 USD 98,317.89 96,834.67 0.19Cisco Systems Inc 15,978 USD 586,887.49 767,825.04 1.54Citigroup Inc 10,340 USD 598,186.22 635,797.88 1.27Citizens Financial Group Inc 2,600 USD 77,952.66 80,723.51 0.16Coca-Cola Co. 14,992 USD 616,951.83 670,289.44 1.34Comcast Corp -A- 16,044 USD 522,267.44 595,610.08 1.19Commscope Holding Co Inc* 101 USD 2,288.61 1,394.97 -Conagra Foods Inc 7,200 USD 174,870.91 167,656.51 0.34Conocophillips 7,000 USD 432,336.28 374,923.17 0.75Consol Mining Corp 4,900 USD 137,973.14 114,486.79 0.23Cooper Companies Inc. 860 USD 217,237.71 254,390.55 0.51Core-Mark Holding Company Inc 1,300 USD 42,546.48 45,338.48 0.09Corecivic Inc /Reit 1,661 USD 30,038.87 30,276.90 0.06Csx Corp. 452 USD 23,239.65 30,706.16 0.06
Pramerica Sicav
The accompanying notes form an integral part of these financial statements.
253
* Securities partially or totally lent (see Note 9).
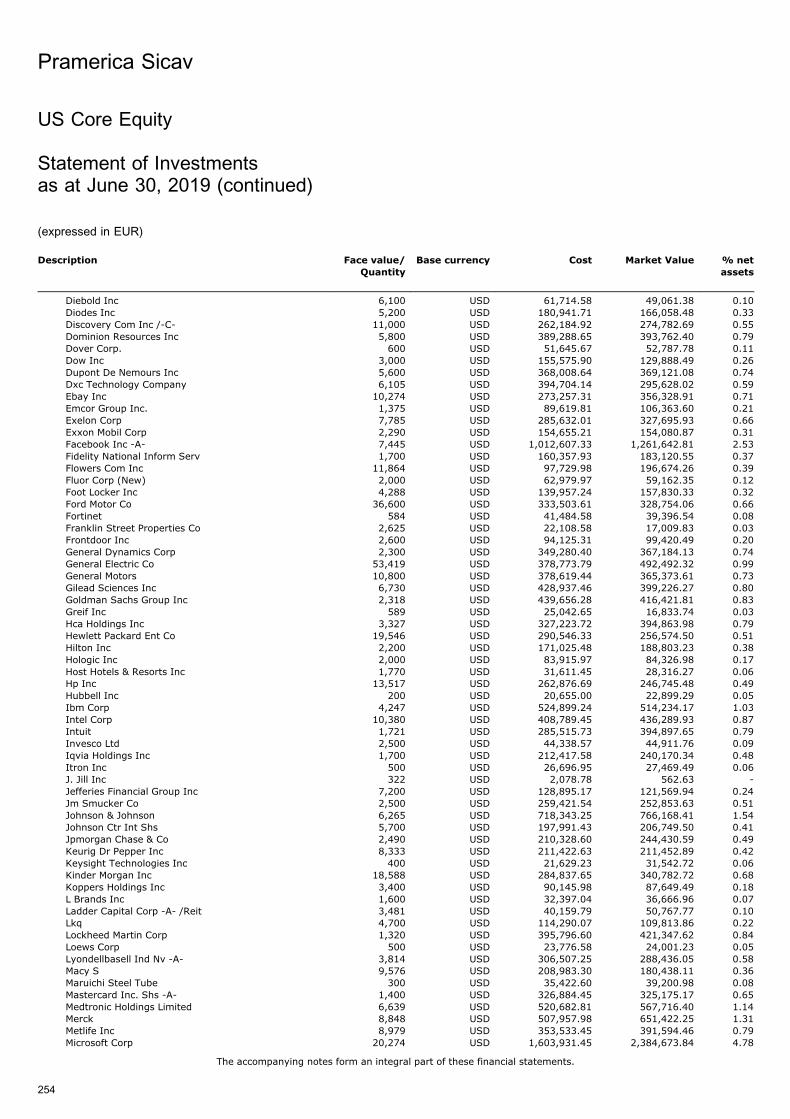
Description Face value/
Quantity
Base currency Cost Market Value % net
assets
Diebold Inc 6,100 USD 61,714.58 49,061.38 0.10Diodes Inc 5,200 USD 180,941.71 166,058.48 0.33Discovery Com Inc /-C- 11,000 USD 262,184.92 274,782.69 0.55Dominion Resources Inc 5,800 USD 389,288.65 393,762.40 0.79Dover Corp. 600 USD 51,645.67 52,787.78 0.11Dow Inc 3,000 USD 155,575.90 129,888.49 0.26Dupont De Nemours Inc 5,600 USD 368,008.64 369,121.08 0.74Dxc Technology Company 6,105 USD 394,704.14 295,628.02 0.59Ebay Inc 10,274 USD 273,257.31 356,328.91 0.71Emcor Group Inc. 1,375 USD 89,619.81 106,363.60 0.21Exelon Corp 7,785 USD 285,632.01 327,695.93 0.66Exxon Mobil Corp 2,290 USD 154,655.21 154,080.87 0.31Facebook Inc -A- 7,445 USD 1,012,607.33 1,261,642.81 2.53Fidelity National Inform Serv 1,700 USD 160,357.93 183,120.55 0.37Flowers Com Inc 11,864 USD 97,729.98 196,674.26 0.39Fluor Corp (New) 2,000 USD 62,979.97 59,162.35 0.12Foot Locker Inc 4,288 USD 139,957.24 157,830.33 0.32Ford Motor Co 36,600 USD 333,503.61 328,754.06 0.66Fortinet 584 USD 41,484.58 39,396.54 0.08Franklin Street Properties Co 2,625 USD 22,108.58 17,009.83 0.03Frontdoor Inc 2,600 USD 94,125.31 99,420.49 0.20General Dynamics Corp 2,300 USD 349,280.40 367,184.13 0.74General Electric Co 53,419 USD 378,773.79 492,492.32 0.99General Motors 10,800 USD 378,619.44 365,373.61 0.73Gilead Sciences Inc 6,730 USD 428,937.46 399,226.27 0.80Goldman Sachs Group Inc 2,318 USD 439,656.28 416,421.81 0.83Greif Inc 589 USD 25,042.65 16,833.74 0.03Hca Holdings Inc 3,327 USD 327,223.72 394,863.98 0.79Hewlett Packard Ent Co 19,546 USD 290,546.33 256,574.50 0.51Hilton Inc 2,200 USD 171,025.48 188,803.23 0.38Hologic Inc 2,000 USD 83,915.97 84,326.98 0.17Host Hotels & Resorts Inc 1,770 USD 31,611.45 28,316.27 0.06Hp Inc 13,517 USD 262,876.69 246,745.48 0.49Hubbell Inc 200 USD 20,655.00 22,899.29 0.05Ibm Corp 4,247 USD 524,899.24 514,234.17 1.03Intel Corp 10,380 USD 408,789.45 436,289.93 0.87Intuit 1,721 USD 285,515.73 394,897.65 0.79Invesco Ltd 2,500 USD 44,338.57 44,911.76 0.09Iqvia Holdings Inc 1,700 USD 212,417.58 240,170.34 0.48Itron Inc 500 USD 26,696.95 27,469.49 0.06J. Jill Inc 322 USD 2,078.78 562.63 -Jefferies Financial Group Inc 7,200 USD 128,895.17 121,569.94 0.24Jm Smucker Co 2,500 USD 259,421.54 252,853.63 0.51Johnson & Johnson 6,265 USD 718,343.25 766,168.41 1.54Johnson Ctr Int Shs 5,700 USD 197,991.43 206,749.50 0.41Jpmorgan Chase & Co 2,490 USD 210,328.60 244,430.59 0.49Keurig Dr Pepper Inc 8,333 USD 211,422.63 211,452.89 0.42Keysight Technologies Inc 400 USD 21,629.23 31,542.72 0.06Kinder Morgan Inc 18,588 USD 284,837.65 340,782.72 0.68Koppers Holdings Inc 3,400 USD 90,145.98 87,649.49 0.18L Brands Inc 1,600 USD 32,397.04 36,666.96 0.07Ladder Capital Corp -A- /Reit 3,481 USD 40,159.79 50,767.77 0.10Lkq 4,700 USD 114,290.07 109,813.86 0.22Lockheed Martin Corp 1,320 USD 395,796.60 421,347.62 0.84Loews Corp 500 USD 23,776.58 24,001.23 0.05Lyondellbasell Ind Nv -A- 3,814 USD 306,507.25 288,436.05 0.58Macy S 9,576 USD 208,983.30 180,438.11 0.36Maruichi Steel Tube 300 USD 35,422.60 39,200.98 0.08Mastercard Inc. Shs -A- 1,400 USD 326,884.45 325,175.17 0.65Medtronic Holdings Limited 6,639 USD 520,682.81 567,716.40 1.14Merck 8,848 USD 507,957.98 651,422.25 1.31Metlife Inc 8,979 USD 353,533.45 391,594.46 0.79Microsoft Corp 20,274 USD 1,603,931.45 2,384,673.84 4.78
Pramerica Sicav
The accompanying notes form an integral part of these financial statements.
254
US Core Equity
Statement of Investmentsas at June 30, 2019 (continued)
(expressed in EUR)
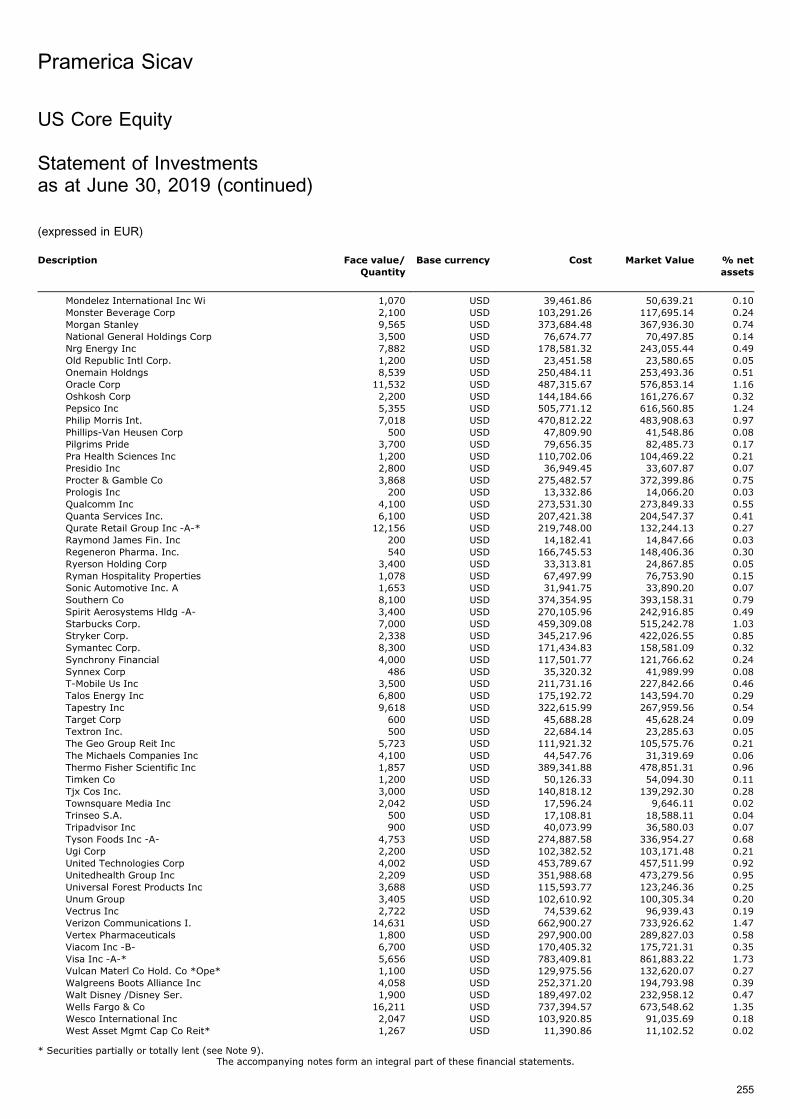
Description Face value/
Quantity
Base currency Cost Market Value % net
assets
Mondelez International Inc Wi 1,070 USD 39,461.86 50,639.21 0.10Monster Beverage Corp 2,100 USD 103,291.26 117,695.14 0.24Morgan Stanley 9,565 USD 373,684.48 367,936.30 0.74National General Holdings Corp 3,500 USD 76,674.77 70,497.85 0.14Nrg Energy Inc 7,882 USD 178,581.32 243,055.44 0.49Old Republic Intl Corp. 1,200 USD 23,451.58 23,580.65 0.05Onemain Holdngs 8,539 USD 250,484.11 253,493.36 0.51Oracle Corp 11,532 USD 487,315.67 576,853.14 1.16Oshkosh Corp 2,200 USD 144,184.66 161,276.67 0.32Pepsico Inc 5,355 USD 505,771.12 616,560.85 1.24Philip Morris Int. 7,018 USD 470,812.22 483,908.63 0.97Phillips-Van Heusen Corp 500 USD 47,809.90 41,548.86 0.08Pilgrims Pride 3,700 USD 79,656.35 82,485.73 0.17Pra Health Sciences Inc 1,200 USD 110,702.06 104,469.22 0.21Presidio Inc 2,800 USD 36,949.45 33,607.87 0.07Procter & Gamble Co 3,868 USD 275,482.57 372,399.86 0.75Prologis Inc 200 USD 13,332.86 14,066.20 0.03Qualcomm Inc 4,100 USD 273,531.30 273,849.33 0.55Quanta Services Inc. 6,100 USD 207,421.38 204,547.37 0.41Qurate Retail Group Inc -A-* 12,156 USD 219,748.00 132,244.13 0.27Raymond James Fin. Inc 200 USD 14,182.41 14,847.66 0.03Regeneron Pharma. Inc. 540 USD 166,745.53 148,406.36 0.30Ryerson Holding Corp 3,400 USD 33,313.81 24,867.85 0.05Ryman Hospitality Properties 1,078 USD 67,497.99 76,753.90 0.15Sonic Automotive Inc. A 1,653 USD 31,941.75 33,890.20 0.07Southern Co 8,100 USD 374,354.95 393,158.31 0.79Spirit Aerosystems Hldg -A- 3,400 USD 270,105.96 242,916.85 0.49Starbucks Corp. 7,000 USD 459,309.08 515,242.78 1.03Stryker Corp. 2,338 USD 345,217.96 422,026.55 0.85Symantec Corp. 8,300 USD 171,434.83 158,581.09 0.32Synchrony Financial 4,000 USD 117,501.77 121,766.62 0.24Synnex Corp 486 USD 35,320.32 41,989.99 0.08T-Mobile Us Inc 3,500 USD 211,731.16 227,842.66 0.46Talos Energy Inc 6,800 USD 175,192.72 143,594.70 0.29Tapestry Inc 9,618 USD 322,615.99 267,959.56 0.54Target Corp 600 USD 45,688.28 45,628.24 0.09Textron Inc. 500 USD 22,684.14 23,285.63 0.05The Geo Group Reit Inc 5,723 USD 111,921.32 105,575.76 0.21The Michaels Companies Inc 4,100 USD 44,547.76 31,319.69 0.06Thermo Fisher Scientific Inc 1,857 USD 389,341.88 478,851.31 0.96Timken Co 1,200 USD 50,126.33 54,094.30 0.11Tjx Cos Inc. 3,000 USD 140,818.12 139,292.30 0.28Townsquare Media Inc 2,042 USD 17,596.24 9,646.11 0.02Trinseo S.A. 500 USD 17,108.81 18,588.11 0.04Tripadvisor Inc 900 USD 40,073.99 36,580.03 0.07Tyson Foods Inc -A- 4,753 USD 274,887.58 336,954.27 0.68Ugi Corp 2,200 USD 102,382.52 103,171.48 0.21United Technologies Corp 4,002 USD 453,789.67 457,511.99 0.92Unitedhealth Group Inc 2,209 USD 351,988.68 473,279.56 0.95Universal Forest Products Inc 3,688 USD 115,593.77 123,246.36 0.25Unum Group 3,405 USD 102,610.92 100,305.34 0.20Vectrus Inc 2,722 USD 74,539.62 96,939.43 0.19Verizon Communications I. 14,631 USD 662,900.27 733,926.62 1.47Vertex Pharmaceuticals 1,800 USD 297,900.00 289,827.03 0.58Viacom Inc -B- 6,700 USD 170,405.32 175,721.31 0.35Visa Inc -A-* 5,656 USD 783,409.81 861,883.22 1.73Vulcan Materl Co Hold. Co *Ope* 1,100 USD 129,975.56 132,620.07 0.27Walgreens Boots Alliance Inc 4,058 USD 252,371.20 194,793.98 0.39Walt Disney /Disney Ser. 1,900 USD 189,497.02 232,958.12 0.47Wells Fargo & Co 16,211 USD 737,394.57 673,548.62 1.35Wesco International Inc 2,047 USD 103,920.85 91,035.69 0.18West Asset Mgmt Cap Co Reit* 1,267 USD 11,390.86 11,102.52 0.02
Pramerica Sicav
The accompanying notes form an integral part of these financial statements.
255
US Core Equity
Statement of Investmentsas at June 30, 2019 (continued)
(expressed in EUR)
* Securities partially or totally lent (see Note 9).
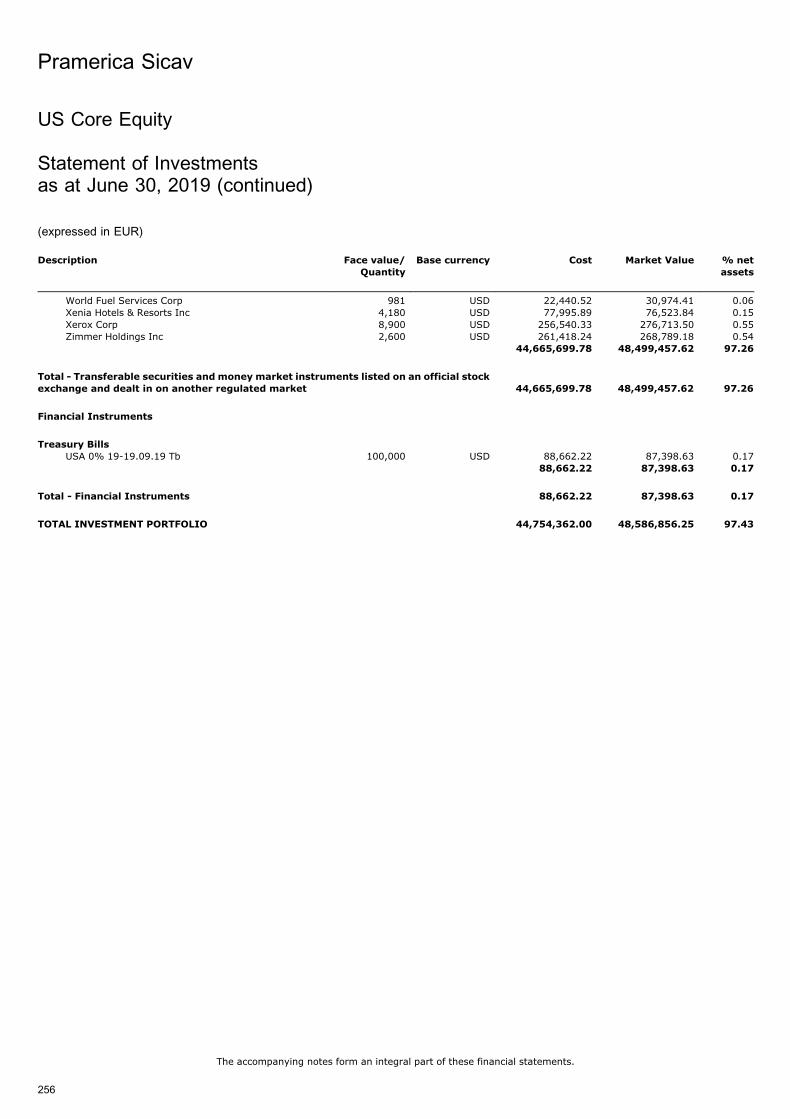
Description Face value/
Quantity
Base currency Cost Market Value % net
assets
World Fuel Services Corp 981 USD 22,440.52 30,974.41 0.06Xenia Hotels & Resorts Inc 4,180 USD 77,995.89 76,523.84 0.15Xerox Corp 8,900 USD 256,540.33 276,713.50 0.55Zimmer Holdings Inc 2,600 USD 261,418.24 268,789.18 0.54
44,665,699.78 48,499,457.62 97.26
Total - Transferable securities and money market instruments listed on an official stock
exchange and dealt in on another regulated market 44,665,699.78 48,499,457.62 97.26
Financial Instruments
Treasury Bills
USA 0% 19-19.09.19 Tb 100,000 USD 88,662.22 87,398.63 0.1788,662.22 87,398.63 0.17
Total - Financial Instruments 88,662.22 87,398.63 0.17
TOTAL INVESTMENT PORTFOLIO 44,754,362.00 48,586,856.25 97.43
Pramerica Sicav
The accompanying notes form an integral part of these financial statements.
256
US Core Equity
Statement of Investmentsas at June 30, 2019 (continued)
(expressed in EUR)
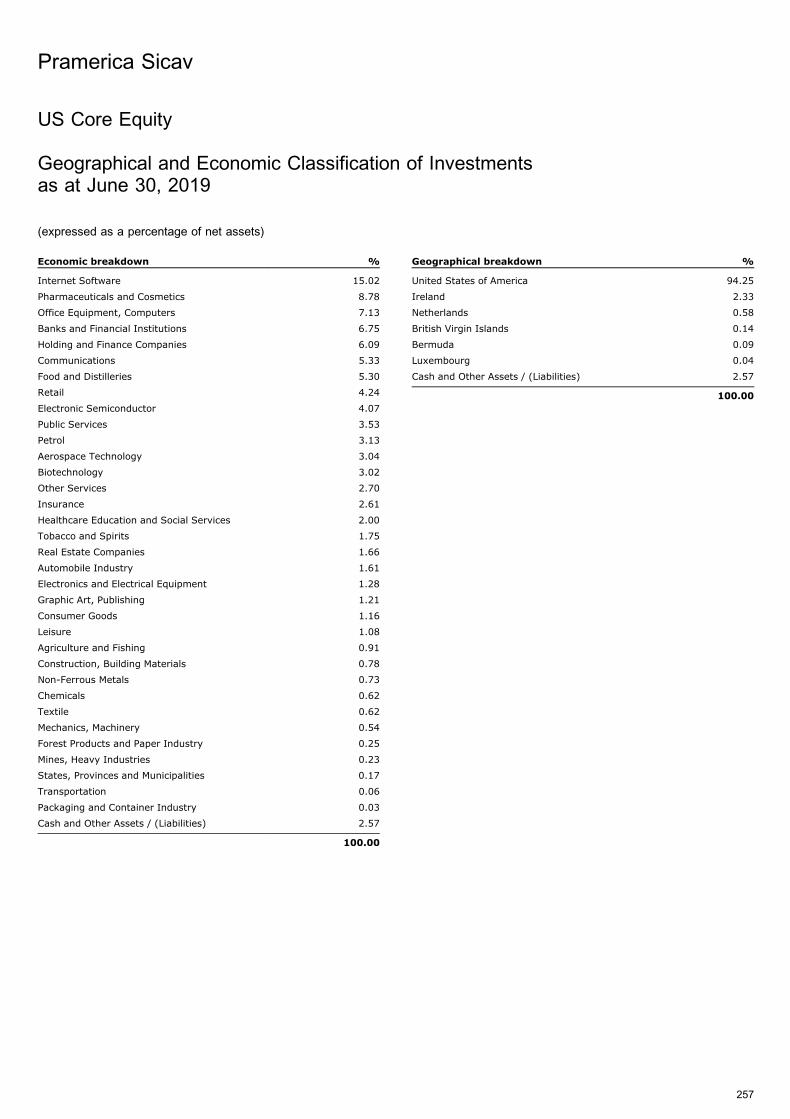
US Core Equity
Geographical and Economic Classification of Investmentsas at June 30, 2019
(expressed as a percentage of net assets)
Economic breakdown %
Internet Software 15.02
Pharmaceuticals and Cosmetics 8.78
Office Equipment, Computers 7.13
Banks and Financial Institutions 6.75
Holding and Finance Companies 6.09
Communications 5.33
Food and Distilleries 5.30
Retail 4.24
Electronic Semiconductor 4.07
Public Services 3.53
Petrol 3.13
Aerospace Technology 3.04
Biotechnology 3.02
Other Services 2.70
Insurance 2.61
Healthcare Education and Social Services 2.00
Tobacco and Spirits 1.75
Real Estate Companies 1.66
Automobile Industry 1.61
Electronics and Electrical Equipment 1.28
Graphic Art, Publishing 1.21
Consumer Goods 1.16
Leisure 1.08
Agriculture and Fishing 0.91
Construction, Building Materials 0.78
Non-Ferrous Metals 0.73
Chemicals 0.62
Textile 0.62
Mechanics, Machinery 0.54
Forest Products and Paper Industry 0.25
Mines, Heavy Industries 0.23
States, Provinces and Municipalities 0.17
Transportation 0.06
Packaging and Container Industry 0.03
Cash and Other Assets / (Liabilities) 2.57
100.00
Geographical breakdown %
United States of America 94.25
Ireland 2.33
Netherlands 0.58
British Virgin Islands 0.14
Bermuda 0.09
Luxembourg 0.04
Cash and Other Assets / (Liabilities) 2.57
100.00
Pramerica Sicav
257
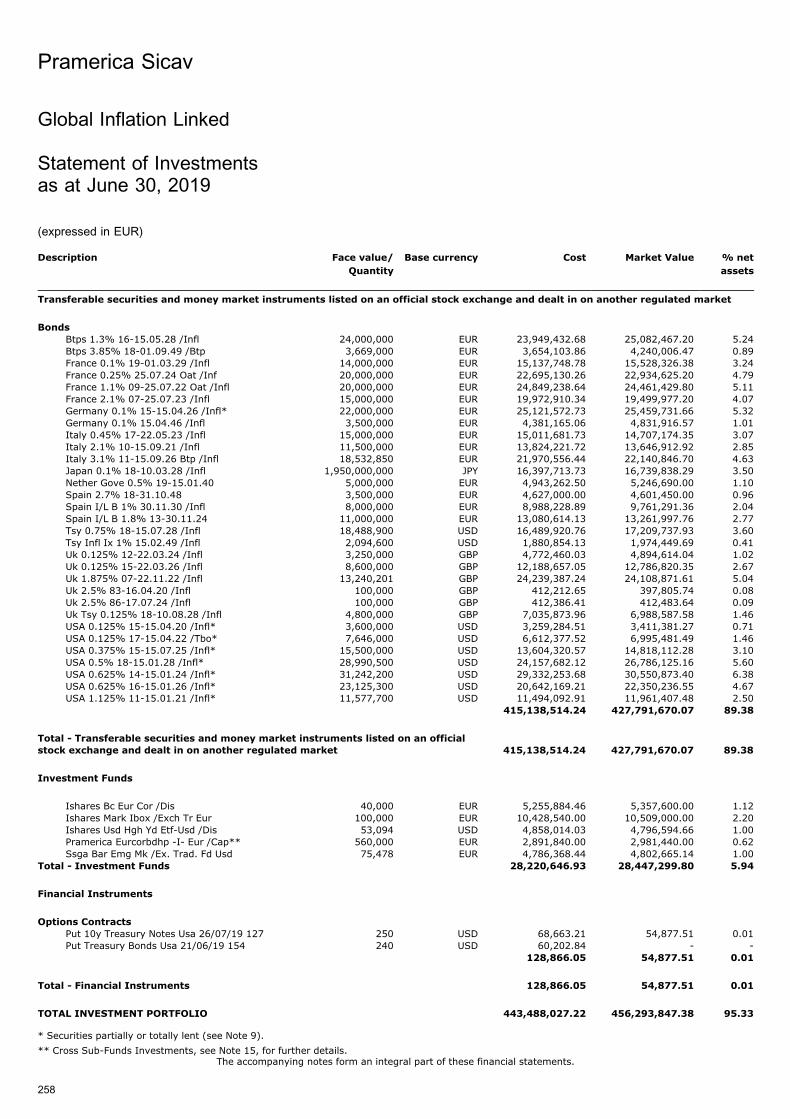
Global Inflation Linked
Statement of Investmentsas at June 30, 2019
(expressed in EUR)
Description Face value/
Quantity
Base currency Cost Market Value % net
assets
Transferable securities and money market instruments listed on an official stock exchange and dealt in on another regulated market
Bonds
Btps 1.3% 16-15.05.28 /Infl 24,000,000 EUR 23,949,432.68 25,082,467.20 5.24Btps 3.85% 18-01.09.49 /Btp 3,669,000 EUR 3,654,103.86 4,240,006.47 0.89France 0.1% 19-01.03.29 /Infl 14,000,000 EUR 15,137,748.78 15,528,326.38 3.24France 0.25% 25.07.24 Oat /Inf 20,000,000 EUR 22,695,130.26 22,934,625.20 4.79France 1.1% 09-25.07.22 Oat /Infl 20,000,000 EUR 24,849,238.64 24,461,429.80 5.11France 2.1% 07-25.07.23 /Infl 15,000,000 EUR 19,972,910.34 19,499,977.20 4.07Germany 0.1% 15-15.04.26 /Infl* 22,000,000 EUR 25,121,572.73 25,459,731.66 5.32Germany 0.1% 15.04.46 /Infl 3,500,000 EUR 4,381,165.06 4,831,916.57 1.01Italy 0.45% 17-22.05.23 /Infl 15,000,000 EUR 15,011,681.73 14,707,174.35 3.07Italy 2.1% 10-15.09.21 /Infl 11,500,000 EUR 13,824,221.72 13,646,912.92 2.85Italy 3.1% 11-15.09.26 Btp /Infl 18,532,850 EUR 21,970,556.44 22,140,846.70 4.63Japan 0.1% 18-10.03.28 /Infl 1,950,000,000 JPY 16,397,713.73 16,739,838.29 3.50Nether Gove 0.5% 19-15.01.40 5,000,000 EUR 4,943,262.50 5,246,690.00 1.10Spain 2.7% 18-31.10.48 3,500,000 EUR 4,627,000.00 4,601,450.00 0.96Spain I/L B 1% 30.11.30 /Infl 8,000,000 EUR 8,988,228.89 9,761,291.36 2.04Spain I/L B 1.8% 13-30.11.24 11,000,000 EUR 13,080,614.13 13,261,997.76 2.77Tsy 0.75% 18-15.07.28 /Infl 18,488,900 USD 16,489,920.76 17,209,737.93 3.60Tsy Infl Ix 1% 15.02.49 /Infl 2,094,600 USD 1,880,854.13 1,974,449.69 0.41Uk 0.125% 12-22.03.24 /Infl 3,250,000 GBP 4,772,460.03 4,894,614.04 1.02Uk 0.125% 15-22.03.26 /Infl 8,600,000 GBP 12,188,657.05 12,786,820.35 2.67Uk 1.875% 07-22.11.22 /Infl 13,240,201 GBP 24,239,387.24 24,108,871.61 5.04Uk 2.5% 83-16.04.20 /Infl 100,000 GBP 412,212.65 397,805.74 0.08Uk 2.5% 86-17.07.24 /Infl 100,000 GBP 412,386.41 412,483.64 0.09Uk Tsy 0.125% 18-10.08.28 /Infl 4,800,000 GBP 7,035,873.96 6,988,587.58 1.46USA 0.125% 15-15.04.20 /Infl* 3,600,000 USD 3,259,284.51 3,411,381.27 0.71USA 0.125% 17-15.04.22 /Tbo* 7,646,000 USD 6,612,377.52 6,995,481.49 1.46USA 0.375% 15-15.07.25 /Infl* 15,500,000 USD 13,604,320.57 14,818,112.28 3.10USA 0.5% 18-15.01.28 /Infl* 28,990,500 USD 24,157,682.12 26,786,125.16 5.60USA 0.625% 14-15.01.24 /Infl* 31,242,200 USD 29,332,253.68 30,550,873.40 6.38USA 0.625% 16-15.01.26 /Infl* 23,125,300 USD 20,642,169.21 22,350,236.55 4.67USA 1.125% 11-15.01.21 /Infl* 11,577,700 USD 11,494,092.91 11,961,407.48 2.50
415,138,514.24 427,791,670.07 89.38
Total - Transferable securities and money market instruments listed on an officialstock exchange and dealt in on another regulated market 415,138,514.24 427,791,670.07 89.38
Investment Funds
Ishares Bc Eur Cor /Dis 40,000 EUR 5,255,884.46 5,357,600.00 1.12Ishares Mark Ibox /Exch Tr Eur 100,000 EUR 10,428,540.00 10,509,000.00 2.20Ishares Usd Hgh Yd Etf-Usd /Dis 53,094 USD 4,858,014.03 4,796,594.66 1.00Pramerica Eurcorbdhp -I- Eur /Cap** 560,000 EUR 2,891,840.00 2,981,440.00 0.62Ssga Bar Emg Mk /Ex. Trad. Fd Usd 75,478 EUR 4,786,368.44 4,802,665.14 1.00
Total - Investment Funds 28,220,646.93 28,447,299.80 5.94
Financial Instruments
Options Contracts
Put 10y Treasury Notes Usa 26/07/19 127 250 USD 68,663.21 54,877.51 0.01Put Treasury Bonds Usa 21/06/19 154 240 USD 60,202.84 - -
128,866.05 54,877.51 0.01
Total - Financial Instruments 128,866.05 54,877.51 0.01
TOTAL INVESTMENT PORTFOLIO 443,488,027.22 456,293,847.38 95.33
Pramerica Sicav
The accompanying notes form an integral part of these financial statements.
258
* Securities partially or totally lent (see Note 9).
** Cross Sub-Funds Investments, see Note 15, for further details.
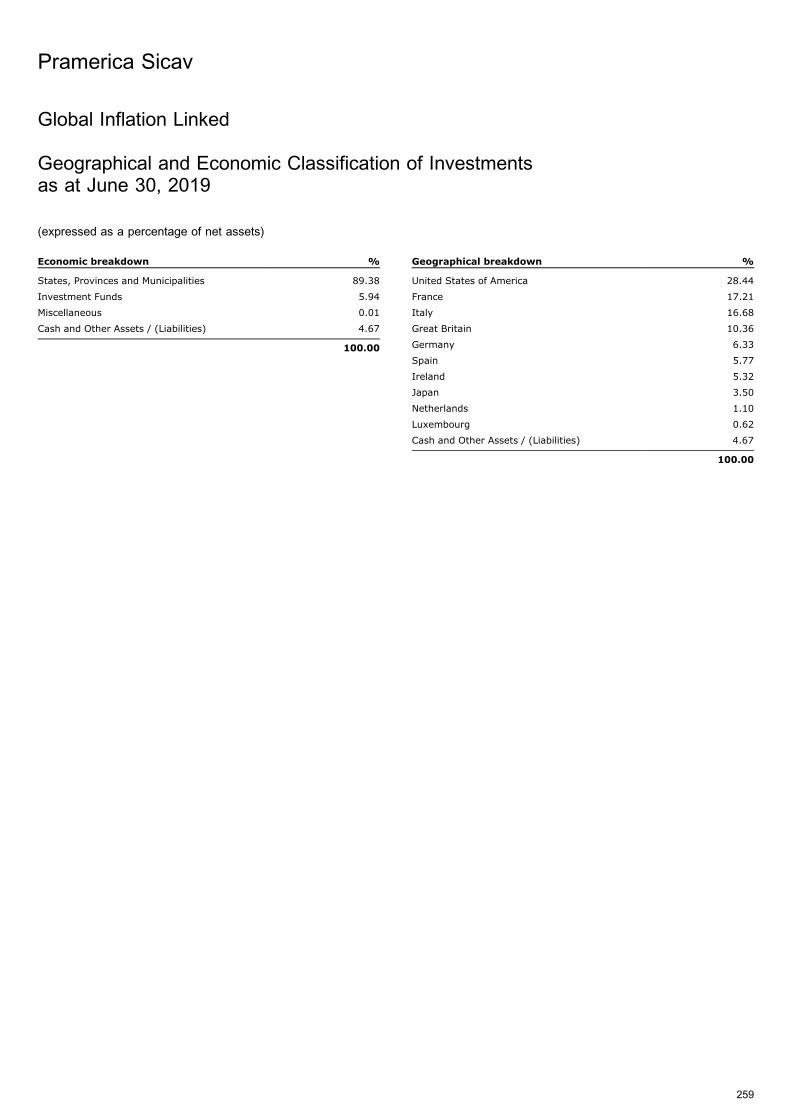
Global Inflation Linked
Geographical and Economic Classification of Investmentsas at June 30, 2019
(expressed as a percentage of net assets)
Economic breakdown %
States, Provinces and Municipalities 89.38
Investment Funds 5.94
Miscellaneous 0.01
Cash and Other Assets / (Liabilities) 4.67
100.00
Geographical breakdown %
United States of America 28.44
France 17.21
Italy 16.68
Great Britain 10.36
Germany 6.33
Spain 5.77
Ireland 5.32
Japan 3.50
Netherlands 1.10
Luxembourg 0.62
Cash and Other Assets / (Liabilities) 4.67
100.00
Pramerica Sicav
259
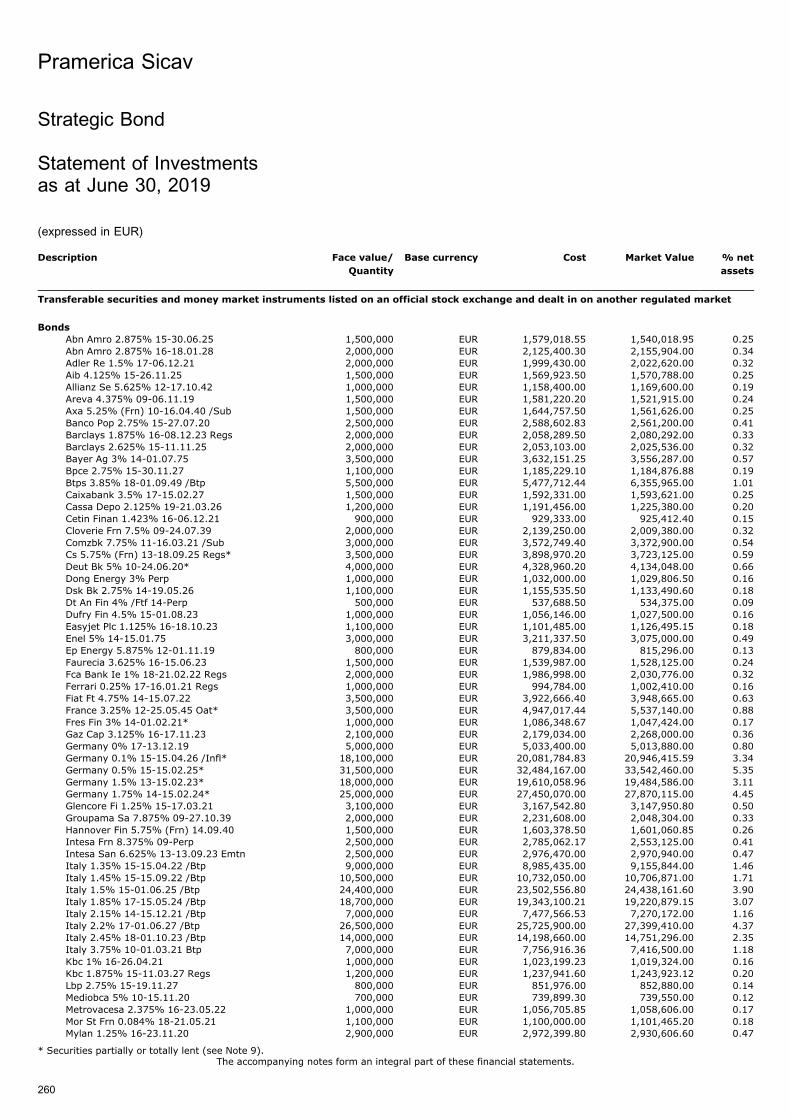
Strategic Bond
Statement of Investmentsas at June 30, 2019
(expressed in EUR)
Description Face value/
Quantity
Base currency Cost Market Value % net
assets
Transferable securities and money market instruments listed on an official stock exchange and dealt in on another regulated market
Bonds
Abn Amro 2.875% 15-30.06.25 1,500,000 EUR 1,579,018.55 1,540,018.95 0.25Abn Amro 2.875% 16-18.01.28 2,000,000 EUR 2,125,400.30 2,155,904.00 0.34Adler Re 1.5% 17-06.12.21 2,000,000 EUR 1,999,430.00 2,022,620.00 0.32Aib 4.125% 15-26.11.25 1,500,000 EUR 1,569,923.50 1,570,788.00 0.25Allianz Se 5.625% 12-17.10.42 1,000,000 EUR 1,158,400.00 1,169,600.00 0.19Areva 4.375% 09-06.11.19 1,500,000 EUR 1,581,220.20 1,521,915.00 0.24Axa 5.25% (Frn) 10-16.04.40 /Sub 1,500,000 EUR 1,644,757.50 1,561,626.00 0.25Banco Pop 2.75% 15-27.07.20 2,500,000 EUR 2,588,602.83 2,561,200.00 0.41Barclays 1.875% 16-08.12.23 Regs 2,000,000 EUR 2,058,289.50 2,080,292.00 0.33Barclays 2.625% 15-11.11.25 2,000,000 EUR 2,053,103.00 2,025,536.00 0.32Bayer Ag 3% 14-01.07.75 3,500,000 EUR 3,632,151.25 3,556,287.00 0.57Bpce 2.75% 15-30.11.27 1,100,000 EUR 1,185,229.10 1,184,876.88 0.19Btps 3.85% 18-01.09.49 /Btp 5,500,000 EUR 5,477,712.44 6,355,965.00 1.01Caixabank 3.5% 17-15.02.27 1,500,000 EUR 1,592,331.00 1,593,621.00 0.25Cassa Depo 2.125% 19-21.03.26 1,200,000 EUR 1,191,456.00 1,225,380.00 0.20Cetin Finan 1.423% 16-06.12.21 900,000 EUR 929,333.00 925,412.40 0.15Cloverie Frn 7.5% 09-24.07.39 2,000,000 EUR 2,139,250.00 2,009,380.00 0.32Comzbk 7.75% 11-16.03.21 /Sub 3,000,000 EUR 3,572,749.40 3,372,900.00 0.54Cs 5.75% (Frn) 13-18.09.25 Regs* 3,500,000 EUR 3,898,970.20 3,723,125.00 0.59Deut Bk 5% 10-24.06.20* 4,000,000 EUR 4,328,960.20 4,134,048.00 0.66Dong Energy 3% Perp 1,000,000 EUR 1,032,000.00 1,029,806.50 0.16Dsk Bk 2.75% 14-19.05.26 1,100,000 EUR 1,155,535.50 1,133,490.60 0.18Dt An Fin 4% /Ftf 14-Perp 500,000 EUR 537,688.50 534,375.00 0.09Dufry Fin 4.5% 15-01.08.23 1,000,000 EUR 1,056,146.00 1,027,500.00 0.16Easyjet Plc 1.125% 16-18.10.23 1,100,000 EUR 1,101,485.00 1,126,495.15 0.18Enel 5% 14-15.01.75 3,000,000 EUR 3,211,337.50 3,075,000.00 0.49Ep Energy 5.875% 12-01.11.19 800,000 EUR 879,834.00 815,296.00 0.13Faurecia 3.625% 16-15.06.23 1,500,000 EUR 1,539,987.00 1,528,125.00 0.24Fca Bank Ie 1% 18-21.02.22 Regs 2,000,000 EUR 1,986,998.00 2,030,776.00 0.32Ferrari 0.25% 17-16.01.21 Regs 1,000,000 EUR 994,784.00 1,002,410.00 0.16Fiat Ft 4.75% 14-15.07.22 3,500,000 EUR 3,922,666.40 3,948,665.00 0.63France 3.25% 12-25.05.45 Oat* 3,500,000 EUR 4,947,017.44 5,537,140.00 0.88Fres Fin 3% 14-01.02.21* 1,000,000 EUR 1,086,348.67 1,047,424.00 0.17Gaz Cap 3.125% 16-17.11.23 2,100,000 EUR 2,179,034.00 2,268,000.00 0.36Germany 0% 17-13.12.19 5,000,000 EUR 5,033,400.00 5,013,880.00 0.80Germany 0.1% 15-15.04.26 /Infl* 18,100,000 EUR 20,081,784.83 20,946,415.59 3.34Germany 0.5% 15-15.02.25* 31,500,000 EUR 32,484,167.00 33,542,460.00 5.35Germany 1.5% 13-15.02.23* 18,000,000 EUR 19,610,058.96 19,484,586.00 3.11Germany 1.75% 14-15.02.24* 25,000,000 EUR 27,450,070.00 27,870,115.00 4.45Glencore Fi 1.25% 15-17.03.21 3,100,000 EUR 3,167,542.80 3,147,950.80 0.50Groupama Sa 7.875% 09-27.10.39 2,000,000 EUR 2,231,608.00 2,048,304.00 0.33Hannover Fin 5.75% (Frn) 14.09.40 1,500,000 EUR 1,603,378.50 1,601,060.85 0.26Intesa Frn 8.375% 09-Perp 2,500,000 EUR 2,785,062.17 2,553,125.00 0.41Intesa San 6.625% 13-13.09.23 Emtn 2,500,000 EUR 2,976,470.00 2,970,940.00 0.47Italy 1.35% 15-15.04.22 /Btp 9,000,000 EUR 8,985,435.00 9,155,844.00 1.46Italy 1.45% 15-15.09.22 /Btp 10,500,000 EUR 10,732,050.00 10,706,871.00 1.71Italy 1.5% 15-01.06.25 /Btp 24,400,000 EUR 23,502,556.80 24,438,161.60 3.90Italy 1.85% 17-15.05.24 /Btp 18,700,000 EUR 19,343,100.21 19,220,879.15 3.07Italy 2.15% 14-15.12.21 /Btp 7,000,000 EUR 7,477,566.53 7,270,172.00 1.16Italy 2.2% 17-01.06.27 /Btp 26,500,000 EUR 25,725,900.00 27,399,410.00 4.37Italy 2.45% 18-01.10.23 /Btp 14,000,000 EUR 14,198,660.00 14,751,296.00 2.35Italy 3.75% 10-01.03.21 Btp 7,000,000 EUR 7,756,916.36 7,416,500.00 1.18Kbc 1% 16-26.04.21 1,000,000 EUR 1,023,199.23 1,019,324.00 0.16Kbc 1.875% 15-11.03.27 Regs 1,200,000 EUR 1,237,941.60 1,243,923.12 0.20Lbp 2.75% 15-19.11.27 800,000 EUR 851,976.00 852,880.00 0.14Mediobca 5% 10-15.11.20 700,000 EUR 739,899.30 739,550.00 0.12Metrovacesa 2.375% 16-23.05.22 1,000,000 EUR 1,056,705.85 1,058,606.00 0.17Mor St Frn 0.084% 18-21.05.21 1,100,000 EUR 1,100,000.00 1,101,465.20 0.18Mylan 1.25% 16-23.11.20 2,900,000 EUR 2,972,399.80 2,930,606.60 0.47
Pramerica Sicav
The accompanying notes form an integral part of these financial statements.
260
* Securities partially or totally lent (see Note 9).
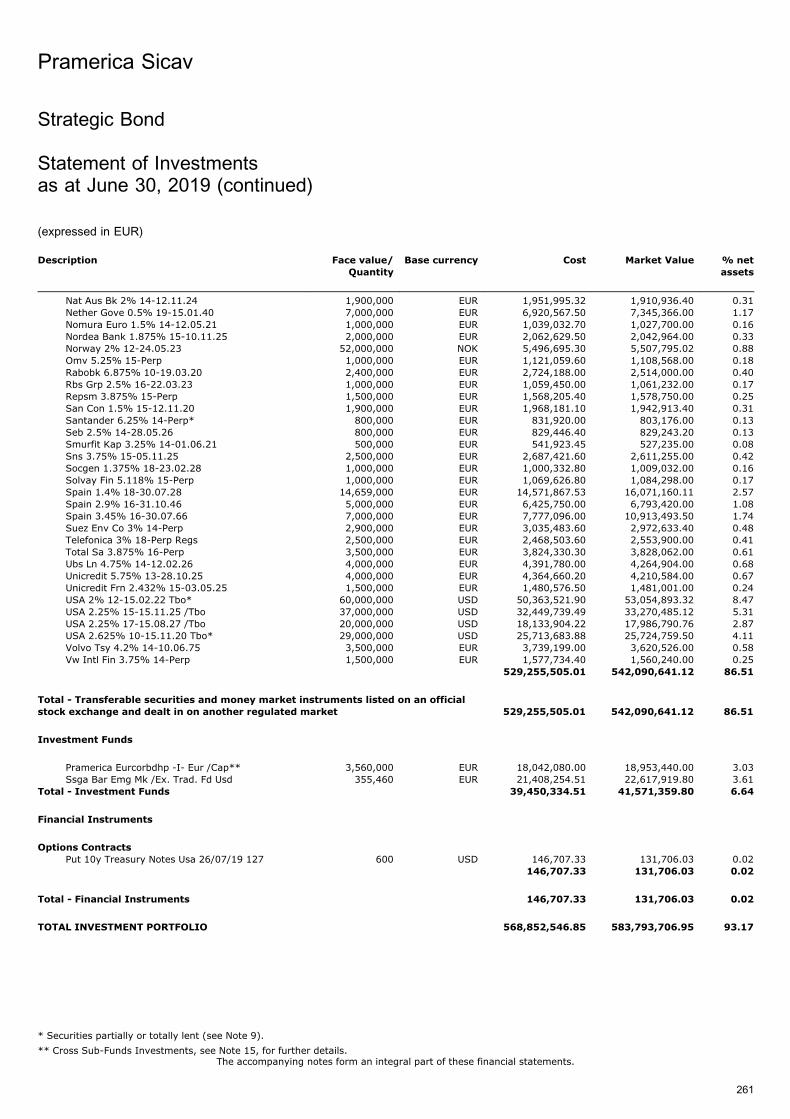
Description Face value/
Quantity
Base currency Cost Market Value % net
assets
Nat Aus Bk 2% 14-12.11.24 1,900,000 EUR 1,951,995.32 1,910,936.40 0.31Nether Gove 0.5% 19-15.01.40 7,000,000 EUR 6,920,567.50 7,345,366.00 1.17Nomura Euro 1.5% 14-12.05.21 1,000,000 EUR 1,039,032.70 1,027,700.00 0.16Nordea Bank 1.875% 15-10.11.25 2,000,000 EUR 2,062,629.50 2,042,964.00 0.33Norway 2% 12-24.05.23 52,000,000 NOK 5,496,695.30 5,507,795.02 0.88Omv 5.25% 15-Perp 1,000,000 EUR 1,121,059.60 1,108,568.00 0.18Rabobk 6.875% 10-19.03.20 2,400,000 EUR 2,724,188.00 2,514,000.00 0.40Rbs Grp 2.5% 16-22.03.23 1,000,000 EUR 1,059,450.00 1,061,232.00 0.17Repsm 3.875% 15-Perp 1,500,000 EUR 1,568,205.40 1,578,750.00 0.25San Con 1.5% 15-12.11.20 1,900,000 EUR 1,968,181.10 1,942,913.40 0.31Santander 6.25% 14-Perp* 800,000 EUR 831,920.00 803,176.00 0.13Seb 2.5% 14-28.05.26 800,000 EUR 829,446.40 829,243.20 0.13Smurfit Kap 3.25% 14-01.06.21 500,000 EUR 541,923.45 527,235.00 0.08Sns 3.75% 15-05.11.25 2,500,000 EUR 2,687,421.60 2,611,255.00 0.42Socgen 1.375% 18-23.02.28 1,000,000 EUR 1,000,332.80 1,009,032.00 0.16Solvay Fin 5.118% 15-Perp 1,000,000 EUR 1,069,626.80 1,084,298.00 0.17Spain 1.4% 18-30.07.28 14,659,000 EUR 14,571,867.53 16,071,160.11 2.57Spain 2.9% 16-31.10.46 5,000,000 EUR 6,425,750.00 6,793,420.00 1.08Spain 3.45% 16-30.07.66 7,000,000 EUR 7,777,096.00 10,913,493.50 1.74Suez Env Co 3% 14-Perp 2,900,000 EUR 3,035,483.60 2,972,633.40 0.48Telefonica 3% 18-Perp Regs 2,500,000 EUR 2,468,503.60 2,553,900.00 0.41Total Sa 3.875% 16-Perp 3,500,000 EUR 3,824,330.30 3,828,062.00 0.61Ubs Ln 4.75% 14-12.02.26 4,000,000 EUR 4,391,780.00 4,264,904.00 0.68Unicredit 5.75% 13-28.10.25 4,000,000 EUR 4,364,660.20 4,210,584.00 0.67Unicredit Frn 2.432% 15-03.05.25 1,500,000 EUR 1,480,576.50 1,481,001.00 0.24USA 2% 12-15.02.22 Tbo* 60,000,000 USD 50,363,521.90 53,054,893.32 8.47USA 2.25% 15-15.11.25 /Tbo 37,000,000 USD 32,449,739.49 33,270,485.12 5.31USA 2.25% 17-15.08.27 /Tbo 20,000,000 USD 18,133,904.22 17,986,790.76 2.87USA 2.625% 10-15.11.20 Tbo* 29,000,000 USD 25,713,683.88 25,724,759.50 4.11Volvo Tsy 4.2% 14-10.06.75 3,500,000 EUR 3,739,199.00 3,620,526.00 0.58Vw Intl Fin 3.75% 14-Perp 1,500,000 EUR 1,577,734.40 1,560,240.00 0.25
529,255,505.01 542,090,641.12 86.51
Total - Transferable securities and money market instruments listed on an official
stock exchange and dealt in on another regulated market 529,255,505.01 542,090,641.12 86.51
Investment Funds
Pramerica Eurcorbdhp -I- Eur /Cap** 3,560,000 EUR 18,042,080.00 18,953,440.00 3.03Ssga Bar Emg Mk /Ex. Trad. Fd Usd 355,460 EUR 21,408,254.51 22,617,919.80 3.61
Total - Investment Funds 39,450,334.51 41,571,359.80 6.64
Financial Instruments
Options Contracts
Put 10y Treasury Notes Usa 26/07/19 127 600 USD 146,707.33 131,706.03 0.02146,707.33 131,706.03 0.02
Total - Financial Instruments 146,707.33 131,706.03 0.02
TOTAL INVESTMENT PORTFOLIO 568,852,546.85 583,793,706.95 93.17
Pramerica Sicav
The accompanying notes form an integral part of these financial statements.
261
Strategic Bond
Statement of Investmentsas at June 30, 2019 (continued)
(expressed in EUR)
* Securities partially or totally lent (see Note 9).
** Cross Sub-Funds Investments, see Note 15, for further details.
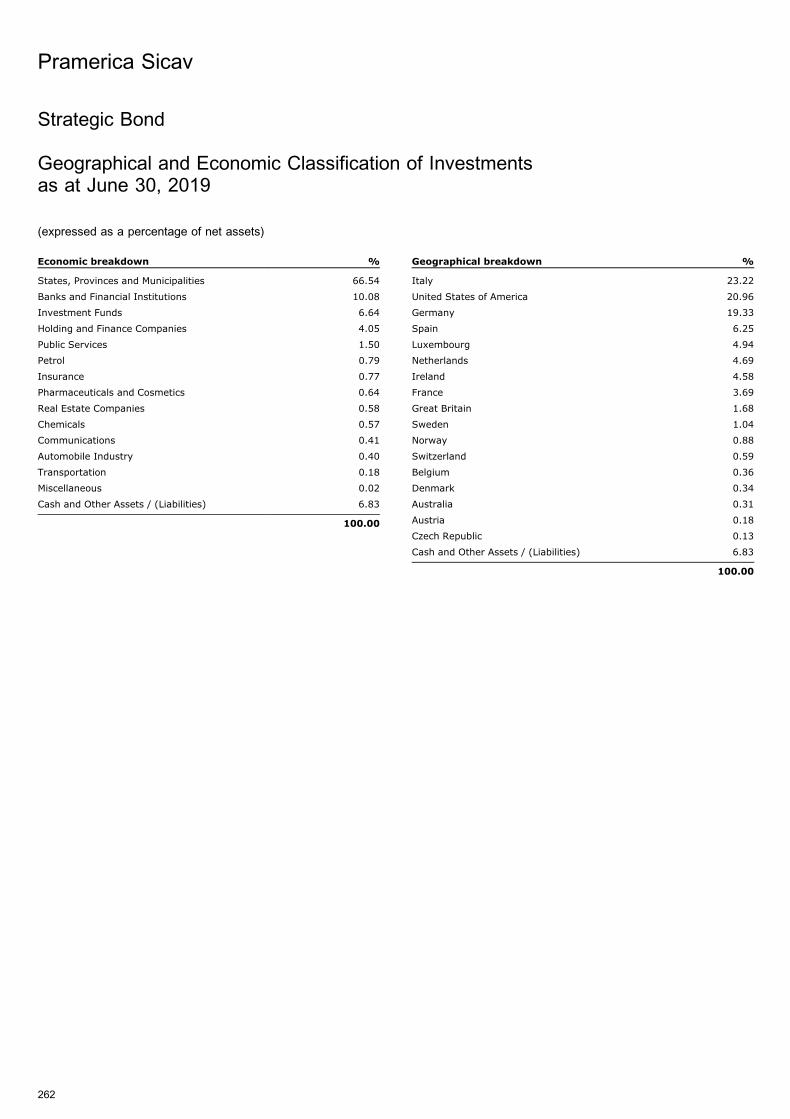
Strategic Bond
Geographical and Economic Classification of Investmentsas at June 30, 2019
(expressed as a percentage of net assets)
Economic breakdown %
States, Provinces and Municipalities 66.54
Banks and Financial Institutions 10.08
Investment Funds 6.64
Holding and Finance Companies 4.05
Public Services 1.50
Petrol 0.79
Insurance 0.77
Pharmaceuticals and Cosmetics 0.64
Real Estate Companies 0.58
Chemicals 0.57
Communications 0.41
Automobile Industry 0.40
Transportation 0.18
Miscellaneous 0.02
Cash and Other Assets / (Liabilities) 6.83
100.00
Geographical breakdown %
Italy 23.22
United States of America 20.96
Germany 19.33
Spain 6.25
Luxembourg 4.94
Netherlands 4.69
Ireland 4.58
France 3.69
Great Britain 1.68
Sweden 1.04
Norway 0.88
Switzerland 0.59
Belgium 0.36
Denmark 0.34
Australia 0.31
Austria 0.18
Czech Republic 0.13
Cash and Other Assets / (Liabilities) 6.83
100.00
Pramerica Sicav
262
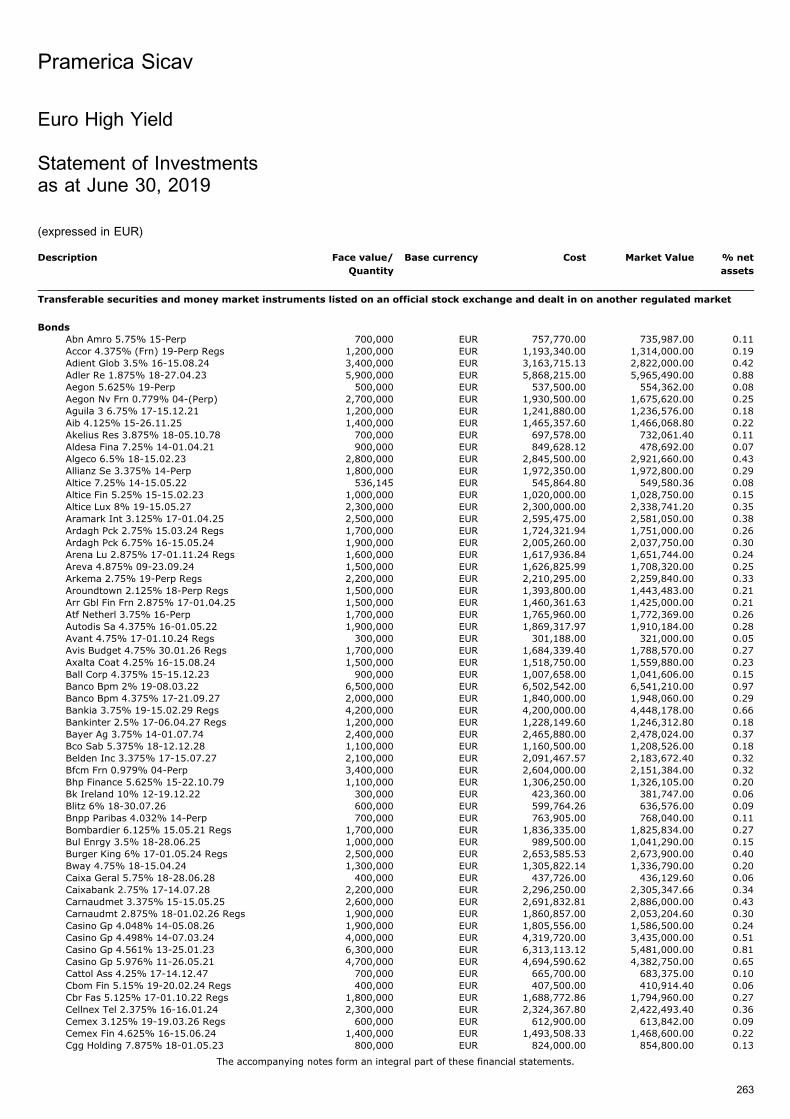
Euro High Yield
Statement of Investmentsas at June 30, 2019
(expressed in EUR)
Description Face value/
Quantity
Base currency Cost Market Value % net
assets
Transferable securities and money market instruments listed on an official stock exchange and dealt in on another regulated market
Bonds
Abn Amro 5.75% 15-Perp 700,000 EUR 757,770.00 735,987.00 0.11Accor 4.375% (Frn) 19-Perp Regs 1,200,000 EUR 1,193,340.00 1,314,000.00 0.19Adient Glob 3.5% 16-15.08.24 3,400,000 EUR 3,163,715.13 2,822,000.00 0.42Adler Re 1.875% 18-27.04.23 5,900,000 EUR 5,868,215.00 5,965,490.00 0.88Aegon 5.625% 19-Perp 500,000 EUR 537,500.00 554,362.00 0.08Aegon Nv Frn 0.779% 04-(Perp) 2,700,000 EUR 1,930,500.00 1,675,620.00 0.25Aguila 3 6.75% 17-15.12.21 1,200,000 EUR 1,241,880.00 1,236,576.00 0.18Aib 4.125% 15-26.11.25 1,400,000 EUR 1,465,357.60 1,466,068.80 0.22Akelius Res 3.875% 18-05.10.78 700,000 EUR 697,578.00 732,061.40 0.11Aldesa Fina 7.25% 14-01.04.21 900,000 EUR 849,628.12 478,692.00 0.07Algeco 6.5% 18-15.02.23 2,800,000 EUR 2,845,500.00 2,921,660.00 0.43Allianz Se 3.375% 14-Perp 1,800,000 EUR 1,972,350.00 1,972,800.00 0.29Altice 7.25% 14-15.05.22 536,145 EUR 545,864.80 549,580.36 0.08Altice Fin 5.25% 15-15.02.23 1,000,000 EUR 1,020,000.00 1,028,750.00 0.15Altice Lux 8% 19-15.05.27 2,300,000 EUR 2,300,000.00 2,338,741.20 0.35Aramark Int 3.125% 17-01.04.25 2,500,000 EUR 2,595,475.00 2,581,050.00 0.38Ardagh Pck 2.75% 15.03.24 Regs 1,700,000 EUR 1,724,321.94 1,751,000.00 0.26Ardagh Pck 6.75% 16-15.05.24 1,900,000 EUR 2,005,260.00 2,037,750.00 0.30Arena Lu 2.875% 17-01.11.24 Regs 1,600,000 EUR 1,617,936.84 1,651,744.00 0.24Areva 4.875% 09-23.09.24 1,500,000 EUR 1,626,825.99 1,708,320.00 0.25Arkema 2.75% 19-Perp Regs 2,200,000 EUR 2,210,295.00 2,259,840.00 0.33Aroundtown 2.125% 18-Perp Regs 1,500,000 EUR 1,393,800.00 1,443,483.00 0.21Arr Gbl Fin Frn 2.875% 17-01.04.25 1,500,000 EUR 1,460,361.63 1,425,000.00 0.21Atf Netherl 3.75% 16-Perp 1,700,000 EUR 1,765,960.00 1,772,369.00 0.26Autodis Sa 4.375% 16-01.05.22 1,900,000 EUR 1,869,317.97 1,910,184.00 0.28Avant 4.75% 17-01.10.24 Regs 300,000 EUR 301,188.00 321,000.00 0.05Avis Budget 4.75% 30.01.26 Regs 1,700,000 EUR 1,684,339.40 1,788,570.00 0.27Axalta Coat 4.25% 16-15.08.24 1,500,000 EUR 1,518,750.00 1,559,880.00 0.23Ball Corp 4.375% 15-15.12.23 900,000 EUR 1,007,658.00 1,041,606.00 0.15Banco Bpm 2% 19-08.03.22 6,500,000 EUR 6,502,542.00 6,541,210.00 0.97Banco Bpm 4.375% 17-21.09.27 2,000,000 EUR 1,840,000.00 1,948,060.00 0.29Bankia 3.75% 19-15.02.29 Regs 4,200,000 EUR 4,200,000.00 4,448,178.00 0.66Bankinter 2.5% 17-06.04.27 Regs 1,200,000 EUR 1,228,149.60 1,246,312.80 0.18Bayer Ag 3.75% 14-01.07.74 2,400,000 EUR 2,465,880.00 2,478,024.00 0.37Bco Sab 5.375% 18-12.12.28 1,100,000 EUR 1,160,500.00 1,208,526.00 0.18Belden Inc 3.375% 17-15.07.27 2,100,000 EUR 2,091,467.57 2,183,672.40 0.32Bfcm Frn 0.979% 04-Perp 3,400,000 EUR 2,604,000.00 2,151,384.00 0.32Bhp Finance 5.625% 15-22.10.79 1,100,000 EUR 1,306,250.00 1,326,105.00 0.20Bk Ireland 10% 12-19.12.22 300,000 EUR 423,360.00 381,747.00 0.06Blitz 6% 18-30.07.26 600,000 EUR 599,764.26 636,576.00 0.09Bnpp Paribas 4.032% 14-Perp 700,000 EUR 763,905.00 768,040.00 0.11Bombardier 6.125% 15.05.21 Regs 1,700,000 EUR 1,836,335.00 1,825,834.00 0.27Bul Enrgy 3.5% 18-28.06.25 1,000,000 EUR 989,500.00 1,041,290.00 0.15Burger King 6% 17-01.05.24 Regs 2,500,000 EUR 2,653,585.53 2,673,900.00 0.40Bway 4.75% 18-15.04.24 1,300,000 EUR 1,305,822.14 1,336,790.00 0.20Caixa Geral 5.75% 18-28.06.28 400,000 EUR 437,726.00 436,129.60 0.06Caixabank 2.75% 17-14.07.28 2,200,000 EUR 2,296,250.00 2,305,347.66 0.34Carnaudmet 3.375% 15-15.05.25 2,600,000 EUR 2,691,832.81 2,886,000.00 0.43Carnaudmt 2.875% 18-01.02.26 Regs 1,900,000 EUR 1,860,857.00 2,053,204.60 0.30Casino Gp 4.048% 14-05.08.26 1,900,000 EUR 1,805,556.00 1,586,500.00 0.24Casino Gp 4.498% 14-07.03.24 4,000,000 EUR 4,319,720.00 3,435,000.00 0.51Casino Gp 4.561% 13-25.01.23 6,300,000 EUR 6,313,113.12 5,481,000.00 0.81Casino Gp 5.976% 11-26.05.21 4,700,000 EUR 4,694,590.62 4,382,750.00 0.65Cattol Ass 4.25% 17-14.12.47 700,000 EUR 665,700.00 683,375.00 0.10Cbom Fin 5.15% 19-20.02.24 Regs 400,000 EUR 407,500.00 410,914.40 0.06Cbr Fas 5.125% 17-01.10.22 Regs 1,800,000 EUR 1,688,772.86 1,794,960.00 0.27Cellnex Tel 2.375% 16-16.01.24 2,300,000 EUR 2,324,367.80 2,422,493.40 0.36Cemex 3.125% 19-19.03.26 Regs 600,000 EUR 612,900.00 613,842.00 0.09Cemex Fin 4.625% 16-15.06.24 1,400,000 EUR 1,493,508.33 1,468,600.00 0.22Cgg Holding 7.875% 18-01.05.23 800,000 EUR 824,000.00 854,800.00 0.13
Pramerica Sicav
The accompanying notes form an integral part of these financial statements.
263
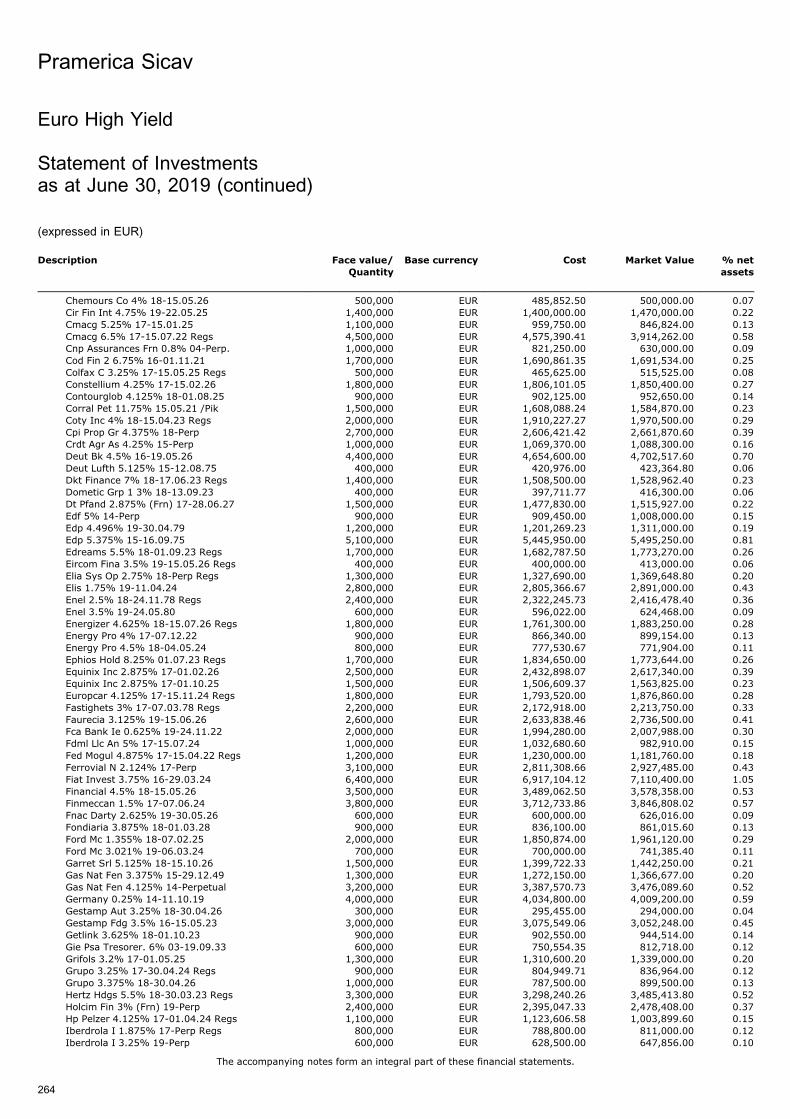
Description Face value/
Quantity
Base currency Cost Market Value % net
assets
Chemours Co 4% 18-15.05.26 500,000 EUR 485,852.50 500,000.00 0.07Cir Fin Int 4.75% 19-22.05.25 1,400,000 EUR 1,400,000.00 1,470,000.00 0.22Cmacg 5.25% 17-15.01.25 1,100,000 EUR 959,750.00 846,824.00 0.13Cmacg 6.5% 17-15.07.22 Regs 4,500,000 EUR 4,575,390.41 3,914,262.00 0.58Cnp Assurances Frn 0.8% 04-Perp. 1,000,000 EUR 821,250.00 630,000.00 0.09Cod Fin 2 6.75% 16-01.11.21 1,700,000 EUR 1,690,861.35 1,691,534.00 0.25Colfax C 3.25% 17-15.05.25 Regs 500,000 EUR 465,625.00 515,525.00 0.08Constellium 4.25% 17-15.02.26 1,800,000 EUR 1,806,101.05 1,850,400.00 0.27Contourglob 4.125% 18-01.08.25 900,000 EUR 902,125.00 952,650.00 0.14Corral Pet 11.75% 15.05.21 /Pik 1,500,000 EUR 1,608,088.24 1,584,870.00 0.23Coty Inc 4% 18-15.04.23 Regs 2,000,000 EUR 1,910,227.27 1,970,500.00 0.29Cpi Prop Gr 4.375% 18-Perp 2,700,000 EUR 2,606,421.42 2,661,870.60 0.39Crdt Agr As 4.25% 15-Perp 1,000,000 EUR 1,069,370.00 1,088,300.00 0.16Deut Bk 4.5% 16-19.05.26 4,400,000 EUR 4,654,600.00 4,702,517.60 0.70Deut Lufth 5.125% 15-12.08.75 400,000 EUR 420,976.00 423,364.80 0.06Dkt Finance 7% 18-17.06.23 Regs 1,400,000 EUR 1,508,500.00 1,528,962.40 0.23Dometic Grp 1 3% 18-13.09.23 400,000 EUR 397,711.77 416,300.00 0.06Dt Pfand 2.875% (Frn) 17-28.06.27 1,500,000 EUR 1,477,830.00 1,515,927.00 0.22Edf 5% 14-Perp 900,000 EUR 909,450.00 1,008,000.00 0.15Edp 4.496% 19-30.04.79 1,200,000 EUR 1,201,269.23 1,311,000.00 0.19Edp 5.375% 15-16.09.75 5,100,000 EUR 5,445,950.00 5,495,250.00 0.81Edreams 5.5% 18-01.09.23 Regs 1,700,000 EUR 1,682,787.50 1,773,270.00 0.26Eircom Fina 3.5% 19-15.05.26 Regs 400,000 EUR 400,000.00 413,000.00 0.06Elia Sys Op 2.75% 18-Perp Regs 1,300,000 EUR 1,327,690.00 1,369,648.80 0.20Elis 1.75% 19-11.04.24 2,800,000 EUR 2,805,366.67 2,891,000.00 0.43Enel 2.5% 18-24.11.78 Regs 2,400,000 EUR 2,322,245.73 2,416,478.40 0.36Enel 3.5% 19-24.05.80 600,000 EUR 596,022.00 624,468.00 0.09Energizer 4.625% 18-15.07.26 Regs 1,800,000 EUR 1,761,300.00 1,883,250.00 0.28Energy Pro 4% 17-07.12.22 900,000 EUR 866,340.00 899,154.00 0.13Energy Pro 4.5% 18-04.05.24 800,000 EUR 777,530.67 771,904.00 0.11Ephios Hold 8.25% 01.07.23 Regs 1,700,000 EUR 1,834,650.00 1,773,644.00 0.26Equinix Inc 2.875% 17-01.02.26 2,500,000 EUR 2,432,898.07 2,617,340.00 0.39Equinix Inc 2.875% 17-01.10.25 1,500,000 EUR 1,506,609.37 1,563,825.00 0.23Europcar 4.125% 17-15.11.24 Regs 1,800,000 EUR 1,793,520.00 1,876,860.00 0.28Fastighets 3% 17-07.03.78 Regs 2,200,000 EUR 2,172,918.00 2,213,750.00 0.33Faurecia 3.125% 19-15.06.26 2,600,000 EUR 2,633,838.46 2,736,500.00 0.41Fca Bank Ie 0.625% 19-24.11.22 2,000,000 EUR 1,994,280.00 2,007,988.00 0.30Fdml Llc An 5% 17-15.07.24 1,000,000 EUR 1,032,680.60 982,910.00 0.15Fed Mogul 4.875% 17-15.04.22 Regs 1,200,000 EUR 1,230,000.00 1,181,760.00 0.18Ferrovial N 2.124% 17-Perp 3,100,000 EUR 2,811,308.66 2,927,485.00 0.43Fiat Invest 3.75% 16-29.03.24 6,400,000 EUR 6,917,104.12 7,110,400.00 1.05Financial 4.5% 18-15.05.26 3,500,000 EUR 3,489,062.50 3,578,358.00 0.53Finmeccan 1.5% 17-07.06.24 3,800,000 EUR 3,712,733.86 3,846,808.02 0.57Fnac Darty 2.625% 19-30.05.26 600,000 EUR 600,000.00 626,016.00 0.09Fondiaria 3.875% 18-01.03.28 900,000 EUR 836,100.00 861,015.60 0.13Ford Mc 1.355% 18-07.02.25 2,000,000 EUR 1,850,874.00 1,961,120.00 0.29Ford Mc 3.021% 19-06.03.24 700,000 EUR 700,000.00 741,385.40 0.11Garret Srl 5.125% 18-15.10.26 1,500,000 EUR 1,399,722.33 1,442,250.00 0.21Gas Nat Fen 3.375% 15-29.12.49 1,300,000 EUR 1,272,150.00 1,366,677.00 0.20Gas Nat Fen 4.125% 14-Perpetual 3,200,000 EUR 3,387,570.73 3,476,089.60 0.52Germany 0.25% 14-11.10.19 4,000,000 EUR 4,034,800.00 4,009,200.00 0.59Gestamp Aut 3.25% 18-30.04.26 300,000 EUR 295,455.00 294,000.00 0.04Gestamp Fdg 3.5% 16-15.05.23 3,000,000 EUR 3,075,549.06 3,052,248.00 0.45Getlink 3.625% 18-01.10.23 900,000 EUR 902,550.00 944,514.00 0.14Gie Psa Tresorer. 6% 03-19.09.33 600,000 EUR 750,554.35 812,718.00 0.12Grifols 3.2% 17-01.05.25 1,300,000 EUR 1,310,600.20 1,339,000.00 0.20Grupo 3.25% 17-30.04.24 Regs 900,000 EUR 804,949.71 836,964.00 0.12Grupo 3.375% 18-30.04.26 1,000,000 EUR 787,500.00 899,500.00 0.13Hertz Hdgs 5.5% 18-30.03.23 Regs 3,300,000 EUR 3,298,240.26 3,485,413.80 0.52Holcim Fin 3% (Frn) 19-Perp 2,400,000 EUR 2,395,047.33 2,478,408.00 0.37Hp Pelzer 4.125% 17-01.04.24 Regs 1,100,000 EUR 1,123,606.58 1,003,899.60 0.15Iberdrola I 1.875% 17-Perp Regs 800,000 EUR 788,800.00 811,000.00 0.12Iberdrola I 3.25% 19-Perp 600,000 EUR 628,500.00 647,856.00 0.10
Pramerica Sicav
The accompanying notes form an integral part of these financial statements.
264
Euro High Yield
Statement of Investmentsas at June 30, 2019 (continued)
(expressed in EUR)

Description Face value/
Quantity
Base currency Cost Market Value % net
assets
Iho Ver 3.625% 15.05.25 /Pik 4,500,000 EUR 4,500,000.00 4,601,250.00 0.68Iho Ver 3.875% 15.05.27 /Pik 2,600,000 EUR 2,556,424.00 2,639,000.00 0.39Ims Health 3.25% 17-15.03.25 2,000,000 EUR 2,024,909.09 2,059,888.00 0.31In Justit 3.125% 15.07.24 Regs 4,000,000 EUR 3,913,947.88 4,045,000.00 0.60Ineos Fin 2.875% 19-01.05.26 3,400,000 EUR 3,417,060.00 3,441,480.00 0.51Ineos G Sa 5.375% 16-01.08.24 1,600,000 EUR 1,673,792.60 1,644,000.00 0.24Ingenico 1.625% 17-13.09.24 1,100,000 EUR 1,028,500.00 1,092,861.00 0.16Int Gam 3.5% 19-15.06.26 Regs 1,000,000 EUR 1,035,000.00 1,037,500.00 0.15Inter 4.875% 17-31.12.22 /Pool 1,468,750 EUR 1,503,128.00 1,528,126.49 0.23Inter Game 3.5% 18-15.07.24 2,600,000 EUR 2,605,058.18 2,765,110.40 0.41Interxion 4.75% 18-15.06.25 3,800,000 EUR 3,897,054.37 4,134,400.00 0.61Intesa San 6.625% 13-13.09.23 Emtn 8,600,000 EUR 10,105,349.08 10,220,033.60 1.51Ipd 3 Bv 4.5% 17-15.07.22 3,000,000 EUR 3,102,690.00 3,069,303.90 0.45Isp 1% 19-04.07.24 2,100,000 EUR 2,097,172.00 2,097,198.60 0.31Jag Ld Rov 4.5% 18-15.01.26 Regs 1,200,000 EUR 1,182,790.24 1,065,561.60 0.16James Hard 3.625% 01.10.26 Regs 400,000 EUR 394,500.00 423,660.00 0.06K+S 3% 20.06.22 Emtn 2,200,000 EUR 2,344,203.78 2,354,026.40 0.35K+S 3.25% 18-18.07.24 1,400,000 EUR 1,381,350.38 1,512,148.40 0.22Kaefer Isol 5.5% 18-10.01.24 300,000 EUR 286,500.00 315,750.00 0.05Kb Act Sys 5% 18-15.07.25 Regs 700,000 EUR 695,595.62 700,000.00 0.10Kedrion Spa 3% 17-12.07.22 1,000,000 EUR 973,051.67 848,288.00 0.13Kirk Beauty 6.25% 15-15.07.22 600,000 EUR 578,400.00 563,664.00 0.08Kirk Beauty 8.75% 15-15.07.23 1,500,000 EUR 1,495,432.50 999,000.00 0.15Kirs Mid 8.375% 17-15.07.23 Regs 500,000 GBP 587,006.24 511,172.99 0.08Kme Ag 6.75% 18-01.02.23 900,000 EUR 855,000.00 869,850.00 0.13Kraton 5.25% 18-15.05.26 Regs 1,700,000 EUR 1,661,600.00 1,755,250.00 0.26Kronos Intl 3.75% 15.09.25 Regs 900,000 EUR 907,450.31 895,050.00 0.13La Poste Sa 3.125% 18-Perp 3,200,000 EUR 3,099,278.22 3,255,424.00 0.48Lanxess 4.5% 16-06.12.76 Regs 500,000 EUR 521,855.00 550,625.00 0.08Lecta 6.5% 16-01.08.23 1,600,000 EUR 1,603,274.49 1,211,680.00 0.18Levi 3.375% 17-15.03.27 300,000 EUR 301,500.00 320,517.00 0.05Lhc Three P 4.125% 15.08.24 /Pik 3,000,000 EUR 3,058,675.00 3,070,164.00 0.45Liberbank 6.875% 17-14.03.27 200,000 EUR 218,462.00 217,000.00 0.03Liberty Mut 3.625% 19-23.05.59 1,200,000 EUR 1,231,545.00 1,226,100.00 0.18Lincoln Fin 3.625% 19-01.04.24 5,400,000 EUR 5,403,650.00 5,586,840.00 0.83Lkq Euro 3.625% 18-01.04.26 Regs 4,300,000 EUR 4,407,871.48 4,534,307.00 0.67Lkq Euro Bv 4.125% 18-01.04.28 800,000 EUR 805,000.00 868,944.00 0.13Loxam 2.875% 19-15.04.26 2,500,000 EUR 2,508,500.00 2,500,000.00 0.37Loxam 4.25% 17-15.04.24 Regs 1,900,000 EUR 1,958,261.71 1,994,384.40 0.30Loxam 6% 17-15.04.25 Regs 1,500,000 EUR 1,611,666.67 1,577,100.00 0.23Lsf10 Wolve 5% 18-15.03.24 500,000 EUR 500,000.00 512,194.00 0.08Marcolin Frn 17-15.02.23 Regs 2,400,000 EUR 2,404,500.00 2,399,712.00 0.36Matterhorn 4% 17-15.11.27 Regs 2,000,000 EUR 1,927,000.00 1,987,948.00 0.29Matthorn Te 4.875% 15-01.05.23 1,000,000 EUR 971,350.00 1,010,938.00 0.15Maxeda Diy 6.125% 17-15.07.22 1,800,000 EUR 1,792,935.00 1,782,900.00 0.26Mediobanca 0.625% 17-27.09.22 2,900,000 EUR 2,861,267.60 2,882,832.00 0.43Mediobanca 5.75% 13-18.04.23 600,000 EUR 702,780.00 675,084.00 0.10Metro 1.125% 18-06.03.23 800,000 EUR 763,040.00 779,356.80 0.12Midland Bk Frn 2.875% 85-29.04.49 3,100,000 USD 2,098,944.36 1,904,653.25 0.28Midland Bk Frn 3.038% 86- 3,300,000 USD 2,191,051.14 2,039,138.64 0.30Mobilux 5.5% 16-15.11.24 500,000 EUR 527,170.59 515,729.00 0.08Mpt Op Ptnr 3.325% 17-24.03.25 800,000 EUR 822,300.00 866,384.00 0.13Mulhacen Pt 6.5% 18-01.08.23 4,500,000 EUR 4,462,500.00 4,320,000.00 0.64N&W Global 7% 16-15.10.23 1,200,000 EUR 1,273,946.00 1,262,966.40 0.19Ncg Banco 6.125% 19-18.01.29 300,000 EUR 305,100.00 315,375.00 0.05Nemak 3.25% 17-15.03.24 Regs 500,000 EUR 494,245.00 516,250.00 0.08Netflix 3.625% 18-15.05.27 5,800,000 EUR 5,817,061.00 6,332,904.00 0.94Nidda Bondc 5% 17-30.09.25 Regs 800,000 EUR 750,000.00 783,688.00 0.12Nokia Oyj 2% 19-11.03.26 2,400,000 EUR 2,387,448.00 2,484,000.00 0.37Nomad Foods 3.25% 17-15.05.24 1,800,000 EUR 1,804,500.00 1,862,640.00 0.28Nordex 6.5% 18-01.02.23 Regs 750,000 EUR 720,015.63 757,458.00 0.11Norican Gro 4.5% 17-15.05.23 1,000,000 EUR 980,092.86 932,840.00 0.14Novo Banco 8.5% 18-06.07.28 400,000 EUR 406,766.00 412,153.60 0.06
Pramerica Sicav
The accompanying notes form an integral part of these financial statements.
265
Euro High Yield
Statement of Investmentsas at June 30, 2019 (continued)
(expressed in EUR)
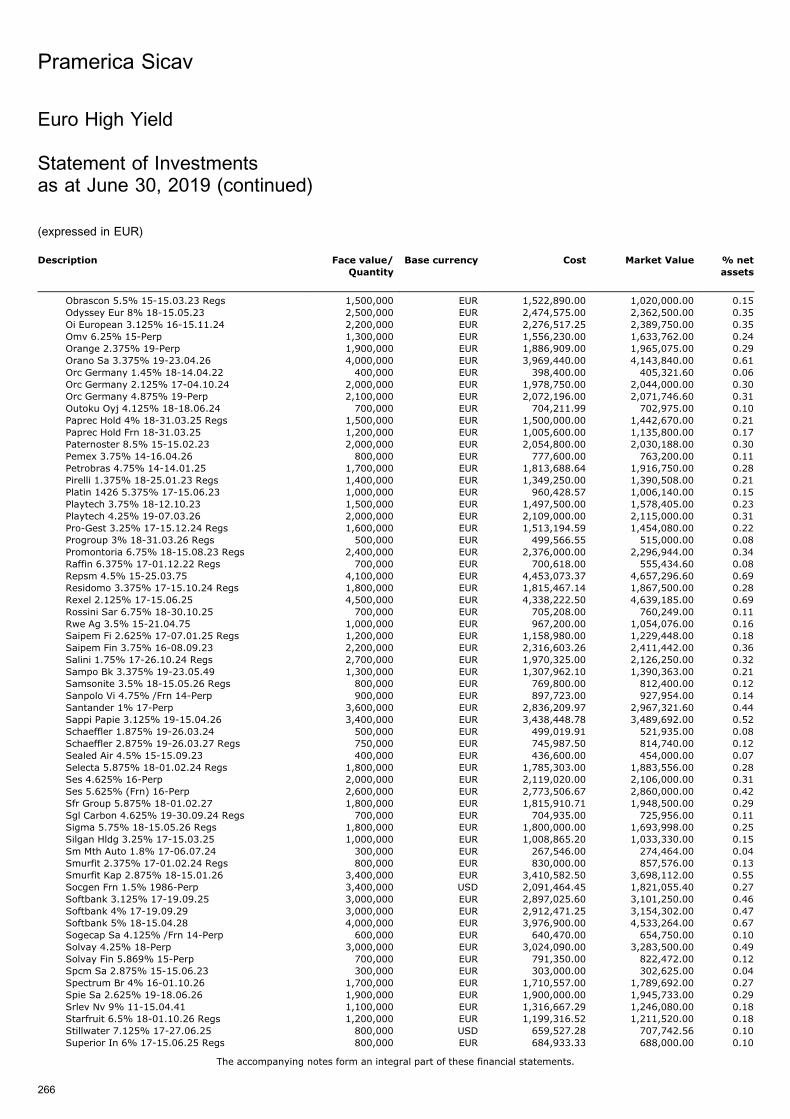
Description Face value/
Quantity
Base currency Cost Market Value % net
assets
Obrascon 5.5% 15-15.03.23 Regs 1,500,000 EUR 1,522,890.00 1,020,000.00 0.15Odyssey Eur 8% 18-15.05.23 2,500,000 EUR 2,474,575.00 2,362,500.00 0.35Oi European 3.125% 16-15.11.24 2,200,000 EUR 2,276,517.25 2,389,750.00 0.35Omv 6.25% 15-Perp 1,300,000 EUR 1,556,230.00 1,633,762.00 0.24Orange 2.375% 19-Perp 1,900,000 EUR 1,886,909.00 1,965,075.00 0.29Orano Sa 3.375% 19-23.04.26 4,000,000 EUR 3,969,440.00 4,143,840.00 0.61Orc Germany 1.45% 18-14.04.22 400,000 EUR 398,400.00 405,321.60 0.06Orc Germany 2.125% 17-04.10.24 2,000,000 EUR 1,978,750.00 2,044,000.00 0.30Orc Germany 4.875% 19-Perp 2,100,000 EUR 2,072,196.00 2,071,746.60 0.31Outoku Oyj 4.125% 18-18.06.24 700,000 EUR 704,211.99 702,975.00 0.10Paprec Hold 4% 18-31.03.25 Regs 1,500,000 EUR 1,500,000.00 1,442,670.00 0.21Paprec Hold Frn 18-31.03.25 1,200,000 EUR 1,005,600.00 1,135,800.00 0.17Paternoster 8.5% 15-15.02.23 2,000,000 EUR 2,054,800.00 2,030,188.00 0.30Pemex 3.75% 14-16.04.26 800,000 EUR 777,600.00 763,200.00 0.11Petrobras 4.75% 14-14.01.25 1,700,000 EUR 1,813,688.64 1,916,750.00 0.28Pirelli 1.375% 18-25.01.23 Regs 1,400,000 EUR 1,349,250.00 1,390,508.00 0.21Platin 1426 5.375% 17-15.06.23 1,000,000 EUR 960,428.57 1,006,140.00 0.15Playtech 3.75% 18-12.10.23 1,500,000 EUR 1,497,500.00 1,578,405.00 0.23Playtech 4.25% 19-07.03.26 2,000,000 EUR 2,109,000.00 2,115,000.00 0.31Pro-Gest 3.25% 17-15.12.24 Regs 1,600,000 EUR 1,513,194.59 1,454,080.00 0.22Progroup 3% 18-31.03.26 Regs 500,000 EUR 499,566.55 515,000.00 0.08Promontoria 6.75% 18-15.08.23 Regs 2,400,000 EUR 2,376,000.00 2,296,944.00 0.34Raffin 6.375% 17-01.12.22 Regs 700,000 EUR 700,618.00 555,434.60 0.08Repsm 4.5% 15-25.03.75 4,100,000 EUR 4,453,073.37 4,657,296.60 0.69Residomo 3.375% 17-15.10.24 Regs 1,800,000 EUR 1,815,467.14 1,867,500.00 0.28Rexel 2.125% 17-15.06.25 4,500,000 EUR 4,338,222.50 4,639,185.00 0.69Rossini Sar 6.75% 18-30.10.25 700,000 EUR 705,208.00 760,249.00 0.11Rwe Ag 3.5% 15-21.04.75 1,000,000 EUR 967,200.00 1,054,076.00 0.16Saipem Fi 2.625% 17-07.01.25 Regs 1,200,000 EUR 1,158,980.00 1,229,448.00 0.18Saipem Fin 3.75% 16-08.09.23 2,200,000 EUR 2,316,603.26 2,411,442.00 0.36Salini 1.75% 17-26.10.24 Regs 2,700,000 EUR 1,970,325.00 2,126,250.00 0.32Sampo Bk 3.375% 19-23.05.49 1,300,000 EUR 1,307,962.10 1,390,363.00 0.21Samsonite 3.5% 18-15.05.26 Regs 800,000 EUR 769,800.00 812,400.00 0.12Sanpolo Vi 4.75% /Frn 14-Perp 900,000 EUR 897,723.00 927,954.00 0.14Santander 1% 17-Perp 3,600,000 EUR 2,836,209.97 2,967,321.60 0.44Sappi Papie 3.125% 19-15.04.26 3,400,000 EUR 3,438,448.78 3,489,692.00 0.52Schaeffler 1.875% 19-26.03.24 500,000 EUR 499,019.91 521,935.00 0.08Schaeffler 2.875% 19-26.03.27 Regs 750,000 EUR 745,987.50 814,740.00 0.12Sealed Air 4.5% 15-15.09.23 400,000 EUR 436,600.00 454,000.00 0.07Selecta 5.875% 18-01.02.24 Regs 1,800,000 EUR 1,785,303.00 1,883,556.00 0.28Ses 4.625% 16-Perp 2,000,000 EUR 2,119,020.00 2,106,000.00 0.31Ses 5.625% (Frn) 16-Perp 2,600,000 EUR 2,773,506.67 2,860,000.00 0.42Sfr Group 5.875% 18-01.02.27 1,800,000 EUR 1,815,910.71 1,948,500.00 0.29Sgl Carbon 4.625% 19-30.09.24 Regs 700,000 EUR 704,935.00 725,956.00 0.11Sigma 5.75% 18-15.05.26 Regs 1,800,000 EUR 1,800,000.00 1,693,998.00 0.25Silgan Hldg 3.25% 17-15.03.25 1,000,000 EUR 1,008,865.20 1,033,330.00 0.15Sm Mth Auto 1.8% 17-06.07.24 300,000 EUR 267,546.00 274,464.00 0.04Smurfit 2.375% 17-01.02.24 Regs 800,000 EUR 830,000.00 857,576.00 0.13Smurfit Kap 2.875% 18-15.01.26 3,400,000 EUR 3,410,582.50 3,698,112.00 0.55Socgen Frn 1.5% 1986-Perp 3,400,000 USD 2,091,464.45 1,821,055.40 0.27Softbank 3.125% 17-19.09.25 3,000,000 EUR 2,897,025.60 3,101,250.00 0.46Softbank 4% 17-19.09.29 3,000,000 EUR 2,912,471.25 3,154,302.00 0.47Softbank 5% 18-15.04.28 4,000,000 EUR 3,976,900.00 4,533,264.00 0.67Sogecap Sa 4.125% /Frn 14-Perp 600,000 EUR 640,470.00 654,750.00 0.10Solvay 4.25% 18-Perp 3,000,000 EUR 3,024,090.00 3,283,500.00 0.49Solvay Fin 5.869% 15-Perp 700,000 EUR 791,350.00 822,472.00 0.12Spcm Sa 2.875% 15-15.06.23 300,000 EUR 303,000.00 302,625.00 0.04Spectrum Br 4% 16-01.10.26 1,700,000 EUR 1,710,557.00 1,789,692.00 0.27Spie Sa 2.625% 19-18.06.26 1,900,000 EUR 1,900,000.00 1,945,733.00 0.29Srlev Nv 9% 11-15.04.41 1,100,000 EUR 1,316,667.29 1,246,080.00 0.18Starfruit 6.5% 18-01.10.26 Regs 1,200,000 EUR 1,199,316.52 1,211,520.00 0.18Stillwater 7.125% 17-27.06.25 800,000 USD 659,527.28 707,742.56 0.10Superior In 6% 17-15.06.25 Regs 800,000 EUR 684,933.33 688,000.00 0.10
Pramerica Sicav
The accompanying notes form an integral part of these financial statements.
266
Euro High Yield
Statement of Investmentsas at June 30, 2019 (continued)
(expressed in EUR)
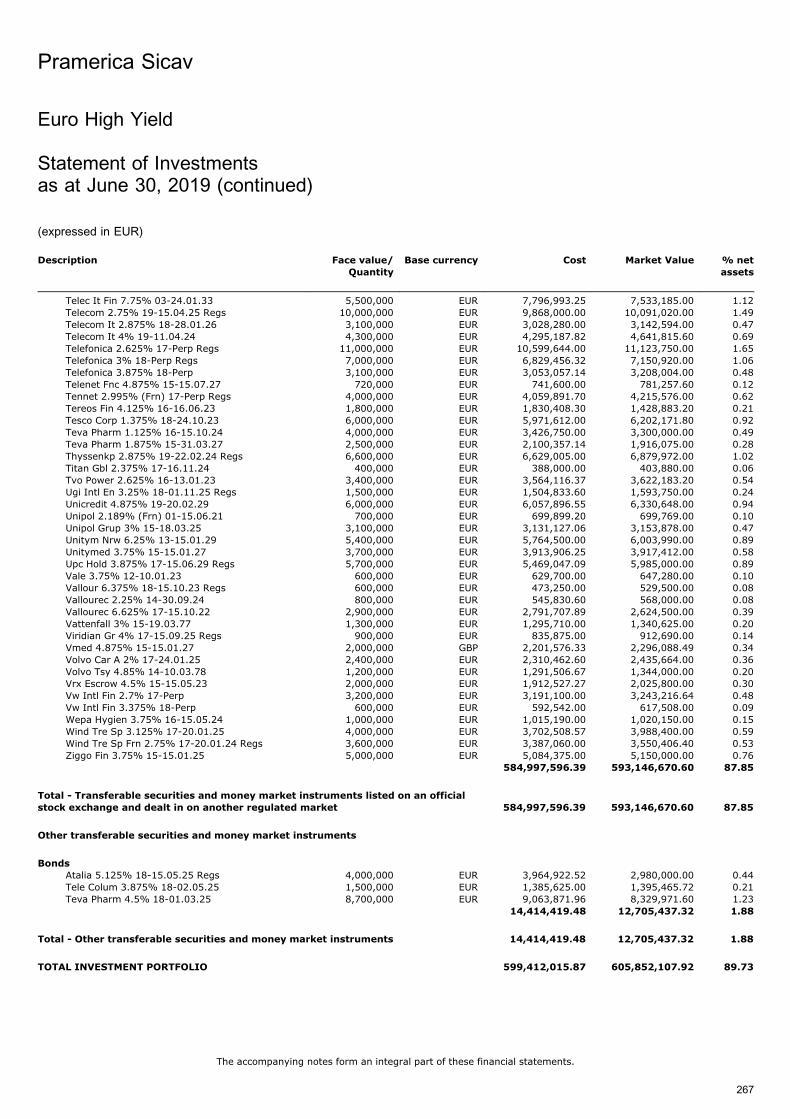
Description Face value/
Quantity
Base currency Cost Market Value % net
assets
Telec It Fin 7.75% 03-24.01.33 5,500,000 EUR 7,796,993.25 7,533,185.00 1.12Telecom 2.75% 19-15.04.25 Regs 10,000,000 EUR 9,868,000.00 10,091,020.00 1.49Telecom It 2.875% 18-28.01.26 3,100,000 EUR 3,028,280.00 3,142,594.00 0.47Telecom It 4% 19-11.04.24 4,300,000 EUR 4,295,187.82 4,641,815.60 0.69Telefonica 2.625% 17-Perp Regs 11,000,000 EUR 10,599,644.00 11,123,750.00 1.65Telefonica 3% 18-Perp Regs 7,000,000 EUR 6,829,456.32 7,150,920.00 1.06Telefonica 3.875% 18-Perp 3,100,000 EUR 3,053,057.14 3,208,004.00 0.48Telenet Fnc 4.875% 15-15.07.27 720,000 EUR 741,600.00 781,257.60 0.12Tennet 2.995% (Frn) 17-Perp Regs 4,000,000 EUR 4,059,891.70 4,215,576.00 0.62Tereos Fin 4.125% 16-16.06.23 1,800,000 EUR 1,830,408.30 1,428,883.20 0.21Tesco Corp 1.375% 18-24.10.23 6,000,000 EUR 5,971,612.00 6,202,171.80 0.92Teva Pharm 1.125% 16-15.10.24 4,000,000 EUR 3,426,750.00 3,300,000.00 0.49Teva Pharm 1.875% 15-31.03.27 2,500,000 EUR 2,100,357.14 1,916,075.00 0.28Thyssenkp 2.875% 19-22.02.24 Regs 6,600,000 EUR 6,629,005.00 6,879,972.00 1.02Titan Gbl 2.375% 17-16.11.24 400,000 EUR 388,000.00 403,880.00 0.06Tvo Power 2.625% 16-13.01.23 3,400,000 EUR 3,564,116.37 3,622,183.20 0.54Ugi Intl En 3.25% 18-01.11.25 Regs 1,500,000 EUR 1,504,833.60 1,593,750.00 0.24Unicredit 4.875% 19-20.02.29 6,000,000 EUR 6,057,896.55 6,330,648.00 0.94Unipol 2.189% (Frn) 01-15.06.21 700,000 EUR 699,899.20 699,769.00 0.10Unipol Grup 3% 15-18.03.25 3,100,000 EUR 3,131,127.06 3,153,878.00 0.47Unitym Nrw 6.25% 13-15.01.29 5,400,000 EUR 5,764,500.00 6,003,990.00 0.89Unitymed 3.75% 15-15.01.27 3,700,000 EUR 3,913,906.25 3,917,412.00 0.58Upc Hold 3.875% 17-15.06.29 Regs 5,700,000 EUR 5,469,047.09 5,985,000.00 0.89Vale 3.75% 12-10.01.23 600,000 EUR 629,700.00 647,280.00 0.10Vallour 6.375% 18-15.10.23 Regs 600,000 EUR 473,250.00 529,500.00 0.08Vallourec 2.25% 14-30.09.24 800,000 EUR 545,830.60 568,000.00 0.08Vallourec 6.625% 17-15.10.22 2,900,000 EUR 2,791,707.89 2,624,500.00 0.39Vattenfall 3% 15-19.03.77 1,300,000 EUR 1,295,710.00 1,340,625.00 0.20Viridian Gr 4% 17-15.09.25 Regs 900,000 EUR 835,875.00 912,690.00 0.14Vmed 4.875% 15-15.01.27 2,000,000 GBP 2,201,576.33 2,296,088.49 0.34Volvo Car A 2% 17-24.01.25 2,400,000 EUR 2,310,462.60 2,435,664.00 0.36Volvo Tsy 4.85% 14-10.03.78 1,200,000 EUR 1,291,506.67 1,344,000.00 0.20Vrx Escrow 4.5% 15-15.05.23 2,000,000 EUR 1,912,527.27 2,025,800.00 0.30Vw Intl Fin 2.7% 17-Perp 3,200,000 EUR 3,191,100.00 3,243,216.64 0.48Vw Intl Fin 3.375% 18-Perp 600,000 EUR 592,542.00 617,508.00 0.09Wepa Hygien 3.75% 16-15.05.24 1,000,000 EUR 1,015,190.00 1,020,150.00 0.15Wind Tre Sp 3.125% 17-20.01.25 4,000,000 EUR 3,702,508.57 3,988,400.00 0.59Wind Tre Sp Frn 2.75% 17-20.01.24 Regs 3,600,000 EUR 3,387,060.00 3,550,406.40 0.53Ziggo Fin 3.75% 15-15.01.25 5,000,000 EUR 5,084,375.00 5,150,000.00 0.76
584,997,596.39 593,146,670.60 87.85
Total - Transferable securities and money market instruments listed on an official
stock exchange and dealt in on another regulated market 584,997,596.39 593,146,670.60 87.85
Other transferable securities and money market instruments
BondsAtalia 5.125% 18-15.05.25 Regs 4,000,000 EUR 3,964,922.52 2,980,000.00 0.44Tele Colum 3.875% 18-02.05.25 1,500,000 EUR 1,385,625.00 1,395,465.72 0.21Teva Pharm 4.5% 18-01.03.25 8,700,000 EUR 9,063,871.96 8,329,971.60 1.23
14,414,419.48 12,705,437.32 1.88
Total - Other transferable securities and money market instruments 14,414,419.48 12,705,437.32 1.88
TOTAL INVESTMENT PORTFOLIO 599,412,015.87 605,852,107.92 89.73
Pramerica Sicav
The accompanying notes form an integral part of these financial statements.
267
Euro High Yield
Statement of Investmentsas at June 30, 2019 (continued)
(expressed in EUR)
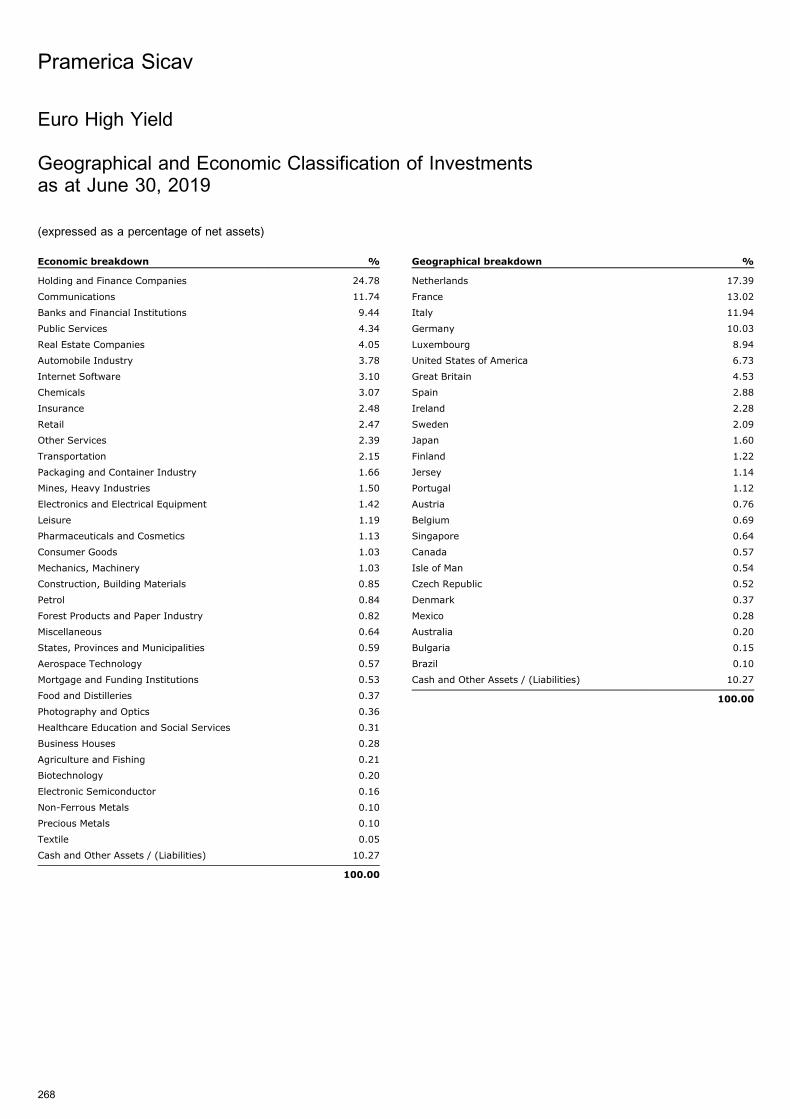
Euro High Yield
Geographical and Economic Classification of Investmentsas at June 30, 2019
(expressed as a percentage of net assets)
Economic breakdown %
Holding and Finance Companies 24.78
Communications 11.74
Banks and Financial Institutions 9.44
Public Services 4.34
Real Estate Companies 4.05
Automobile Industry 3.78
Internet Software 3.10
Chemicals 3.07
Insurance 2.48
Retail 2.47
Other Services 2.39
Transportation 2.15
Packaging and Container Industry 1.66
Mines, Heavy Industries 1.50
Electronics and Electrical Equipment 1.42
Leisure 1.19
Pharmaceuticals and Cosmetics 1.13
Consumer Goods 1.03
Mechanics, Machinery 1.03
Construction, Building Materials 0.85
Petrol 0.84
Forest Products and Paper Industry 0.82
Miscellaneous 0.64
States, Provinces and Municipalities 0.59
Aerospace Technology 0.57
Mortgage and Funding Institutions 0.53
Food and Distilleries 0.37
Photography and Optics 0.36
Healthcare Education and Social Services 0.31
Business Houses 0.28
Agriculture and Fishing 0.21
Biotechnology 0.20
Electronic Semiconductor 0.16
Non-Ferrous Metals 0.10
Precious Metals 0.10
Textile 0.05
Cash and Other Assets / (Liabilities) 10.27
100.00
Geographical breakdown %
Netherlands 17.39
France 13.02
Italy 11.94
Germany 10.03
Luxembourg 8.94
United States of America 6.73
Great Britain 4.53
Spain 2.88
Ireland 2.28
Sweden 2.09
Japan 1.60
Finland 1.22
Jersey 1.14
Portugal 1.12
Austria 0.76
Belgium 0.69
Singapore 0.64
Canada 0.57
Isle of Man 0.54
Czech Republic 0.52
Denmark 0.37
Mexico 0.28
Australia 0.20
Bulgaria 0.15
Brazil 0.10
Cash and Other Assets / (Liabilities) 10.27
100.00
Pramerica Sicav
268
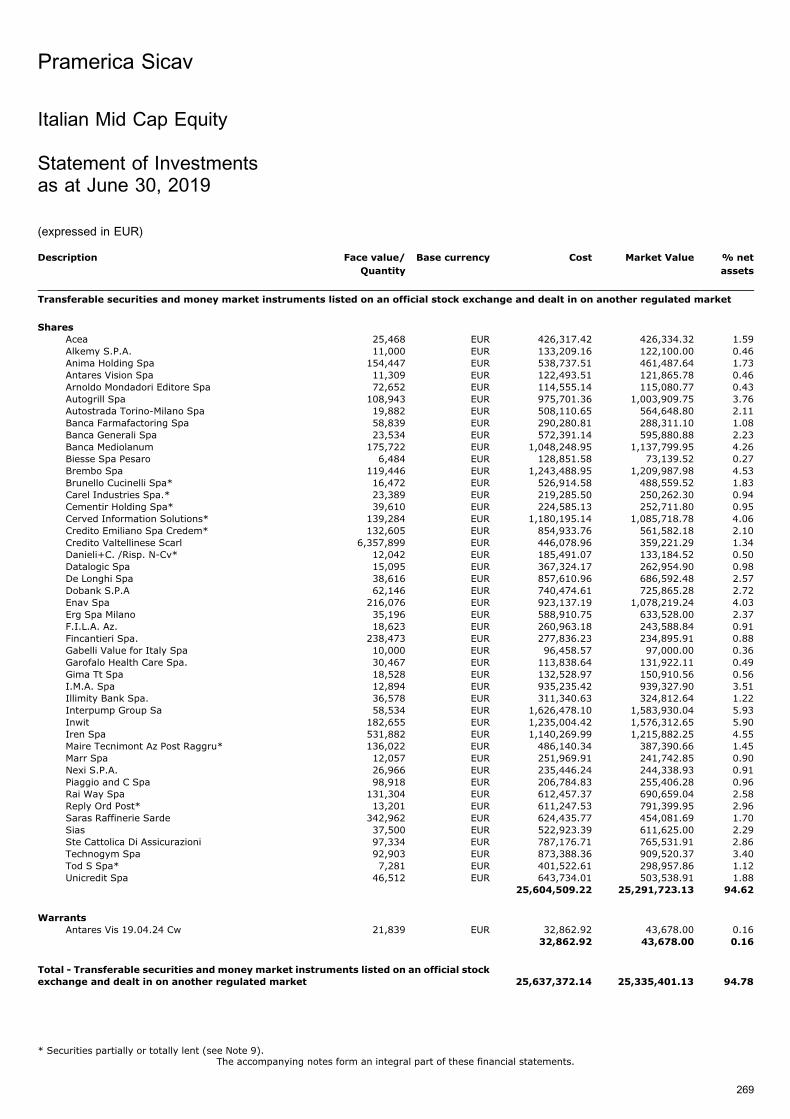
Italian Mid Cap Equity
Statement of Investmentsas at June 30, 2019
(expressed in EUR)
Description Face value/
Quantity
Base currency Cost Market Value % net
assets
Transferable securities and money market instruments listed on an official stock exchange and dealt in on another regulated market
Shares
Acea 25,468 EUR 426,317.42 426,334.32 1.59Alkemy S.P.A. 11,000 EUR 133,209.16 122,100.00 0.46Anima Holding Spa 154,447 EUR 538,737.51 461,487.64 1.73Antares Vision Spa 11,309 EUR 122,493.51 121,865.78 0.46Arnoldo Mondadori Editore Spa 72,652 EUR 114,555.14 115,080.77 0.43Autogrill Spa 108,943 EUR 975,701.36 1,003,909.75 3.76Autostrada Torino-Milano Spa 19,882 EUR 508,110.65 564,648.80 2.11Banca Farmafactoring Spa 58,839 EUR 290,280.81 288,311.10 1.08Banca Generali Spa 23,534 EUR 572,391.14 595,880.88 2.23Banca Mediolanum 175,722 EUR 1,048,248.95 1,137,799.95 4.26Biesse Spa Pesaro 6,484 EUR 128,851.58 73,139.52 0.27Brembo Spa 119,446 EUR 1,243,488.95 1,209,987.98 4.53Brunello Cucinelli Spa* 16,472 EUR 526,914.58 488,559.52 1.83Carel Industries Spa.* 23,389 EUR 219,285.50 250,262.30 0.94Cementir Holding Spa* 39,610 EUR 224,585.13 252,711.80 0.95Cerved Information Solutions* 139,284 EUR 1,180,195.14 1,085,718.78 4.06Credito Emiliano Spa Credem* 132,605 EUR 854,933.76 561,582.18 2.10Credito Valtellinese Scarl 6,357,899 EUR 446,078.96 359,221.29 1.34Danieli+C. /Risp. N-Cv* 12,042 EUR 185,491.07 133,184.52 0.50Datalogic Spa 15,095 EUR 367,324.17 262,954.90 0.98De Longhi Spa 38,616 EUR 857,610.96 686,592.48 2.57Dobank S.P.A 62,146 EUR 740,474.61 725,865.28 2.72Enav Spa 216,076 EUR 923,137.19 1,078,219.24 4.03Erg Spa Milano 35,196 EUR 588,910.75 633,528.00 2.37F.I.L.A. Az. 18,623 EUR 260,963.18 243,588.84 0.91Fincantieri Spa. 238,473 EUR 277,836.23 234,895.91 0.88Gabelli Value for Italy Spa 10,000 EUR 96,458.57 97,000.00 0.36Garofalo Health Care Spa. 30,467 EUR 113,838.64 131,922.11 0.49Gima Tt Spa 18,528 EUR 132,528.97 150,910.56 0.56I.M.A. Spa 12,894 EUR 935,235.42 939,327.90 3.51Illimity Bank Spa. 36,578 EUR 311,340.63 324,812.64 1.22Interpump Group Sa 58,534 EUR 1,626,478.10 1,583,930.04 5.93Inwit 182,655 EUR 1,235,004.42 1,576,312.65 5.90Iren Spa 531,882 EUR 1,140,269.99 1,215,882.25 4.55Maire Tecnimont Az Post Raggru* 136,022 EUR 486,140.34 387,390.66 1.45Marr Spa 12,057 EUR 251,969.91 241,742.85 0.90Nexi S.P.A. 26,966 EUR 235,446.24 244,338.93 0.91Piaggio and C Spa 98,918 EUR 206,784.83 255,406.28 0.96Rai Way Spa 131,304 EUR 612,457.37 690,659.04 2.58Reply Ord Post* 13,201 EUR 611,247.53 791,399.95 2.96Saras Raffinerie Sarde 342,962 EUR 624,435.77 454,081.69 1.70Sias 37,500 EUR 522,923.39 611,625.00 2.29Ste Cattolica Di Assicurazioni 97,334 EUR 787,176.71 765,531.91 2.86Technogym Spa 92,903 EUR 873,388.36 909,520.37 3.40Tod S Spa* 7,281 EUR 401,522.61 298,957.86 1.12Unicredit Spa 46,512 EUR 643,734.01 503,538.91 1.88
25,604,509.22 25,291,723.13 94.62
Warrants
Antares Vis 19.04.24 Cw 21,839 EUR 32,862.92 43,678.00 0.1632,862.92 43,678.00 0.16
Total - Transferable securities and money market instruments listed on an official stock
exchange and dealt in on another regulated market 25,637,372.14 25,335,401.13 94.78
Pramerica Sicav
The accompanying notes form an integral part of these financial statements.
269
* Securities partially or totally lent (see Note 9).
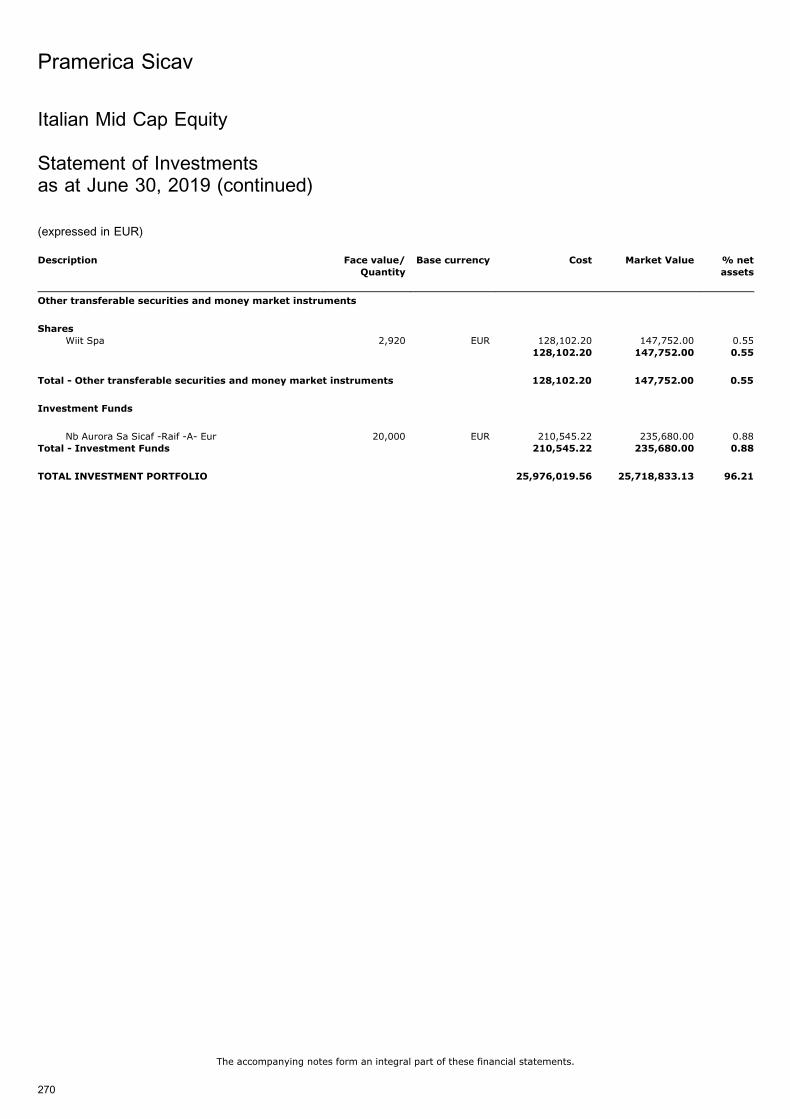
Description Face value/
Quantity
Base currency Cost Market Value % net
assets
Other transferable securities and money market instruments
Shares
Wiit Spa 2,920 EUR 128,102.20 147,752.00 0.55128,102.20 147,752.00 0.55
Total - Other transferable securities and money market instruments 128,102.20 147,752.00 0.55
Investment Funds
Nb Aurora Sa Sicaf -Raif -A- Eur 20,000 EUR 210,545.22 235,680.00 0.88Total - Investment Funds 210,545.22 235,680.00 0.88
TOTAL INVESTMENT PORTFOLIO 25,976,019.56 25,718,833.13 96.21
Pramerica Sicav
The accompanying notes form an integral part of these financial statements.
270
Italian Mid Cap Equity
Statement of Investmentsas at June 30, 2019 (continued)
(expressed in EUR)
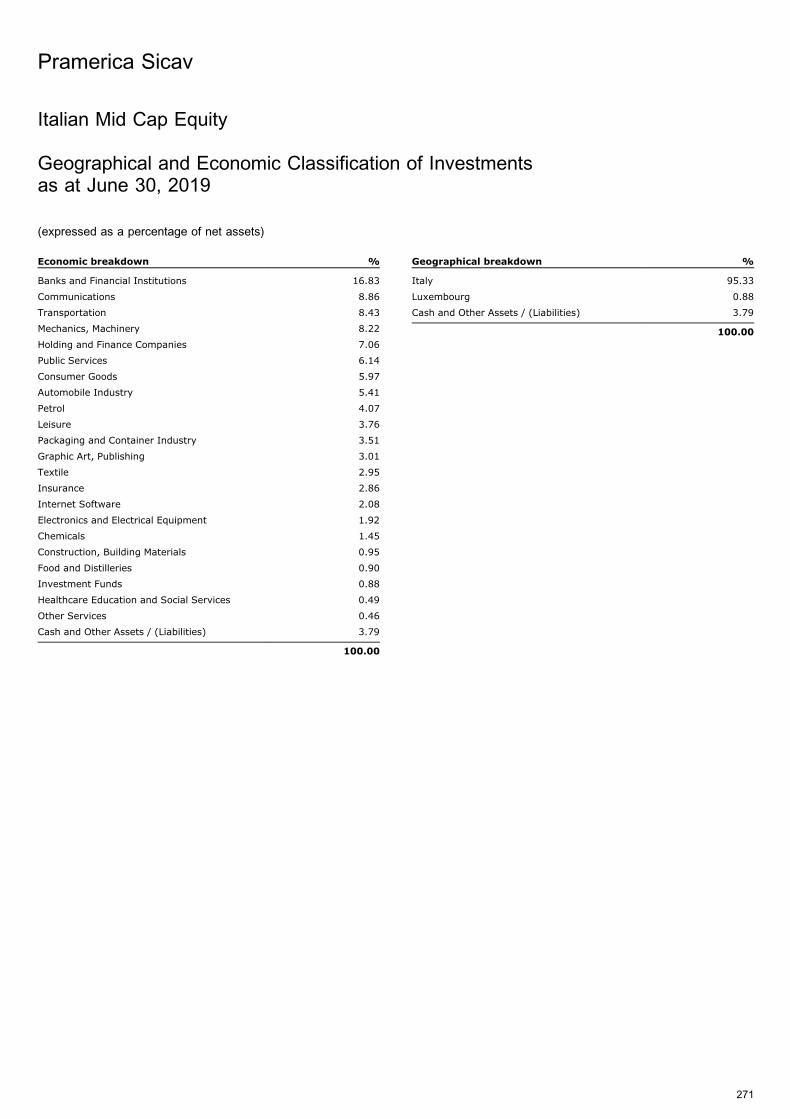
Italian Mid Cap Equity
Geographical and Economic Classification of Investmentsas at June 30, 2019
(expressed as a percentage of net assets)
Economic breakdown %
Banks and Financial Institutions 16.83
Communications 8.86
Transportation 8.43
Mechanics, Machinery 8.22
Holding and Finance Companies 7.06
Public Services 6.14
Consumer Goods 5.97
Automobile Industry 5.41
Petrol 4.07
Leisure 3.76
Packaging and Container Industry 3.51
Graphic Art, Publishing 3.01
Textile 2.95
Insurance 2.86
Internet Software 2.08
Electronics and Electrical Equipment 1.92
Chemicals 1.45
Construction, Building Materials 0.95
Food and Distilleries 0.90
Investment Funds 0.88
Healthcare Education and Social Services 0.49
Other Services 0.46
Cash and Other Assets / (Liabilities) 3.79
100.00
Geographical breakdown %
Italy 95.33
Luxembourg 0.88
Cash and Other Assets / (Liabilities) 3.79
100.00
Pramerica Sicav
271

Social 4 Planet
Statement of Investmentsas at June 30, 2019
(expressed in EUR)
Description Face value/
Quantity
Base currency Cost Market Value % net
assets
Transferable securities and money market instruments listed on an official stock exchange and dealt in on another regulated market
Bonds
Abbott Il F 0.875% 18-27.09.23 1,100,000 EUR 1,132,525.00 1,137,345.00 0.17Abbott Il F 1.5% 18-27.09.26 Regs 1,000,000 EUR 1,050,994.30 1,072,340.00 0.16Abn Amro 0.875% 19-15.01.24 3,600,000 EUR 3,679,900.60 3,730,104.00 0.54Abn Amro 2.875% 16-18.01.28 1,400,000 EUR 1,481,302.94 1,509,132.80 0.22Accor 1.25% 17-25.01.24 2,100,000 EUR 2,132,881.73 2,158,170.00 0.31Acea 1% 16-24.10.26 1,900,000 EUR 1,808,967.01 1,896,853.60 0.28Achmea Hypo 1.125% 15-25.04.22 1,000,000 EUR 1,021,434.70 1,030,320.00 0.15Actavis Fd 1.25% 17-01.06.24 1,200,000 EUR 1,182,992.00 1,230,960.00 0.18Adp 1.125% 19-18.06.34 Regs 1,200,000 EUR 1,189,008.00 1,218,672.00 0.18Aegon Bank 0.625% 19-21.06.24 400,000 EUR 397,964.00 402,787.20 0.06Aib Grp 1.25% 19-28.05.24 2,000,000 EUR 1,993,249.00 2,019,208.00 0.29Air Liquide 0.625% 20.06.30 800,000 EUR 795,832.00 806,369.68 0.12Allianz Se 4.75% 13-Perp 1,900,000 EUR 2,146,900.00 2,183,901.80 0.32Amer Movil 0.75% 19-26.06.27 600,000 EUR 598,470.00 602,556.00 0.09Amer Movil 1.5% 16-10.03.24 1,000,000 EUR 1,026,694.54 1,053,000.00 0.15Amgen 1.25% 16-25.02.22 800,000 EUR 817,280.00 824,788.80 0.12Ap Moeller 1.75% 18-16.03.26 1,200,000 EUR 1,182,510.20 1,228,521.60 0.18Apple Inc 1.625% 14-10.11.26* 5,700,000 EUR 6,097,203.00 6,297,565.20 0.91Arcelormit 2.25% 19-17.01.24 Regs 600,000 EUR 617,242.00 631,794.00 0.09Aroundtown 1% 17-07.01.25 Regs 1,300,000 EUR 1,270,669.00 1,309,448.53 0.19Arrfp 1.125% 16- 09.01.26 900,000 EUR 935,454.00 952,875.00 0.14At&T Inc 1.8% 18-05.09.26 4,200,000 EUR 4,394,883.00 4,545,702.00 0.66At&T Inc 2.35% 18-05.09.29 1,900,000 EUR 1,953,631.00 2,111,166.00 0.31Atos 1.75% 18-07.05.25 1,900,000 EUR 1,946,242.00 2,025,146.35 0.29Autoroutes 1.375% 19-21.02.31 1,800,000 EUR 1,816,205.00 1,924,851.60 0.28Autostrade 1.875% 15-04.11.25 1,700,000 EUR 1,595,455.00 1,698,014.40 0.25Aviva 1.875% 18-13.11.27 900,000 EUR 931,530.00 960,120.00 0.14Axa 3.375% 16-06.07.47 1,900,000 EUR 2,022,239.00 2,135,166.80 0.31Azimut Hldg 2% 17-28.03.22 1,600,000 EUR 1,617,525.10 1,626,497.92 0.24Banco Bilba 1.125% 19-28.02.24 2,100,000 EUR 2,130,678.00 2,159,333.40 0.31Banco Bilba 2.575% 19-22.02.29 1,100,000 EUR 1,119,344.00 1,152,747.53 0.17Banco Bpm 1.75% 18-24.04.23 700,000 EUR 678,621.23 692,339.20 0.10Bankia 0.875% 19-25.03.24 1,100,000 EUR 1,106,693.00 1,119,833.55 0.16Bankia 3.75% 19-15.02.29 Regs 500,000 EUR 500,000.00 529,545.00 0.08Bankinter 0.875% 19-05.03.24 1,100,000 EUR 1,113,243.00 1,129,088.40 0.16Basf 1.5% 18-22.05.30 12y 2,100,000 EUR 2,270,100.00 2,308,551.00 0.34Bayer Ag 3.75% 14-01.07.74 1,100,000 EUR 1,118,080.00 1,135,761.00 0.16Bayer Cap 2.125% 18-15.12.29 1,800,000 EUR 1,828,506.00 1,900,188.00 0.28Belfius Bk 0.625% 18-30.08.23 1,000,000 EUR 1,003,810.00 1,022,156.00 0.15Bertelsmann 1.25% 18-29.09.25 1,100,000 EUR 1,133,101.50 1,153,248.80 0.17Bfcm 0.75% 19-15.06.23 4,800,000 EUR 4,894,080.00 4,930,876.80 0.72Bfcm 3% 15-11.09.25 2,100,000 EUR 2,296,325.41 2,363,550.00 0.34Bmw Fin 0.75% 16-15.04.24 2,700,000 EUR 2,708,028.00 2,775,297.60 0.40Bmw Fin 1.5% 19-06.02.29 1,100,000 EUR 1,116,466.04 1,163,052.00 0.17Bnpp 1.125% 19-28.08.24 900,000 EUR 906,419.00 931,951.80 0.14Bnpp 1.25% 18-19.03.25 3,000,000 EUR 3,026,797.50 3,113,970.00 0.45Bnpp 2.125% (Frn) 19-23.01.27 1,100,000 EUR 1,137,655.00 1,192,039.20 0.17Bnpp 2.375% 15-17.02.25 1,900,000 EUR 2,022,700.00 2,052,209.00 0.30Bnpp Paribas 4.032% 14-Perp 1,000,000 EUR 1,071,088.62 1,097,200.00 0.16Booking Hld 1.8% 15-03.03.27 1,100,000 EUR 1,192,536.00 1,189,223.20 0.17Bpce 1% 19-15.07.24 5,500,000 EUR 5,663,290.00 5,721,162.15 0.83Britel 1.75% 16-10.03.26 1,100,000 EUR 1,121,699.00 1,173,955.20 0.17Caixabank 1.125% 17-17.05.24 2,100,000 EUR 2,115,981.48 2,170,119.00 0.32Caixabank 1.75% 18-24.10.23 Regs 1,100,000 EUR 1,110,196.92 1,147,740.00 0.17Capital One 0.8% 19-12.06.24 1,000,000 EUR 999,689.00 1,006,338.10 0.15Carrefour 1.25% 15-03.06.25 3,500,000 EUR 3,502,663.50 3,633,070.00 0.53Ck Hutchiso 1.25% 18-13.04.25 1,500,000 EUR 1,482,706.00 1,559,325.00 0.23Cnh Ind Fin 1.75% 17-12.09.25 2,900,000 EUR 2,944,670.00 3,034,136.60 0.44Coca Cola 1.875% 14-22.09.26 4,200,000 EUR 4,549,486.00 4,692,650.34 0.68
Pramerica Sicav
The accompanying notes form an integral part of these financial statements.
272
* Securities partially or totally lent (see Note 9).

Description Face value/
Quantity
Base currency Cost Market Value % net
assets
Comzbk 1% 19-04.03.26 Regs 2,000,000 EUR 1,999,350.47 2,054,120.00 0.30Crdt Agr As 4.5% 14-Perp 1,100,000 EUR 1,184,514.45 1,214,637.60 0.18Credit Agri 1.25% 16-14.04.26 3,000,000 EUR 3,129,260.00 3,177,450.00 0.46Credit Agri 1.375% 18-13.03.25 3,600,000 EUR 3,658,844.40 3,772,749.60 0.55Crh Fin 1.375% 16-18.10.28* 2,900,000 EUR 2,896,541.00 3,093,917.20 0.45Daimler Int 0.875% 18-09.04.24 5,300,000 EUR 5,345,470.00 5,445,230.60 0.79Danone 1.25% 15-30.05.24 1,900,000 EUR 1,964,963.97 2,018,396.60 0.29Delphi Auto 1.5% 15-10.03.25 900,000 EUR 916,612.92 936,516.60 0.14Deut Tel If 1.5% 16-03.04.28 3,700,000 EUR 3,752,848.00 3,956,461.80 0.57Diageo Fin 1% 18-22.04.25 Regs 1,700,000 EUR 1,717,789.00 1,773,780.00 0.26Easyjet Plc 1.125% 16-18.10.23 1,500,000 EUR 1,508,116.30 1,536,129.75 0.22Edf 1% 16-13.10.26 4,000,000 EUR 4,050,931.00 4,203,928.00 0.61Edf 2% 18-02.10.30 1,000,000 EUR 1,047,872.00 1,109,384.00 0.16Edf 4% 18-Perp 1,100,000 EUR 1,144,147.66 1,186,735.00 0.17Edp Fin Bv 1.875% 18-13.10.25 600,000 EUR 622,370.00 649,040.40 0.09Elia Sys Op 2.75% 18-Perp Regs 1,000,000 EUR 1,002,530.91 1,053,576.00 0.15Emerson El 0.375% 19-22.05.24 800,000 EUR 799,864.50 807,550.48 0.12Enel 2.5% 18-24.11.78 Regs 1,700,000 EUR 1,654,153.07 1,711,672.20 0.25Enel Fin 1.966% 15-27.01.25 2,100,000 EUR 2,234,371.00 2,282,355.60 0.33Enexis 0.75% 19-02.07.31 Regs 350,000 EUR 348,484.50 349,825.00 0.05Enexis 0.875% 16-28.04.26 1,100,000 EUR 1,101,805.70 1,145,430.00 0.17Erg 1.875% 19-11.04.25 Regs 1,000,000 EUR 1,003,078.60 1,026,666.00 0.15Erste Bk 0.875% 19-22.05.26 1,000,000 EUR 998,314.00 1,022,420.00 0.15Esb Fin 2.125% 15-08.06.27 2,100,000 EUR 2,293,669.20 2,368,774.80 0.34Eurogrid 1.5% 16-18.04.28 1,800,000 EUR 1,829,696.50 1,914,584.40 0.28Eutelsat 2% 18-02.10.25 1,900,000 EUR 1,907,961.10 1,954,549.00 0.28Exor S.P.A 2.125% 15-02.12.22 1,300,000 EUR 1,373,576.00 1,375,649.60 0.20Fca Bank Ie 1% 17-15.11.21 3,800,000 EUR 3,844,621.50 3,873,598.40 0.56Fer Emsn 1.375% 17-31.03.25 Regs 2,300,000 EUR 2,324,610.10 2,412,428.60 0.35Fil Intl 2.5% 16-04.11.26 800,000 EUR 812,560.10 851,280.00 0.12Fiserv 0.375% 19-01.07.23 600,000 EUR 598,904.00 603,651.60 0.09Ford Mc Frn 0.384% 17-01.12.24 1,000,000 EUR 907,000.00 931,890.00 0.14Fortum 0.875% 19-27.02.23 1,600,000 EUR 1,603,838.00 1,633,344.00 0.24Fresenius 1.5% 17-30.01.24 1,200,000 EUR 1,242,112.80 1,258,387.20 0.18Galp Gas Na 1.375% 16-19.09.23 1,500,000 EUR 1,517,804.30 1,559,811.00 0.23Gdf Suez 1% 15-13.03.26 4,000,000 EUR 4,078,577.00 4,226,551.60 0.61Gdf Suez 3.875% 14-Perp 800,000 EUR 860,928.20 893,542.40 0.13Ge Cap Eur 0.8% 15-21.01.22 3,300,000 EUR 3,346,307.21 3,359,908.20 0.49Ge Cap Eur 2.625% 13-15.03.23 Emtn 1,900,000 EUR 2,019,909.00 2,052,904.40 0.30Gen Elec 0.875% 17-17.05.25 1,000,000 EUR 973,762.00 995,040.00 0.14General Motors 0.955% 07.09.23 1,100,000 EUR 1,093,303.60 1,107,854.00 0.16Generali Fi 4.596% 14-Perp 1,900,000 EUR 1,922,135.38 1,979,040.00 0.29Germany 0% 15-17.04.20 700,000 EUR 704,746.00 703,679.20 0.10Gs 1.375% 17-15.05.24 5,900,000 EUR 6,019,741.52 6,111,220.00 0.89Heidlrg 1.5% 16-07.02.25 Reg-S 1,000,000 EUR 1,027,807.22 1,052,100.00 0.15Heineken Nv 1% 16-04.05.26 2,000,000 EUR 2,020,786.05 2,088,704.00 0.30Iberdrola I 1.75% 15-17.09.23 1,100,000 EUR 1,160,515.00 1,184,733.00 0.17Iberdrola I 3.25% 19-Perp 1,100,000 EUR 1,141,632.00 1,187,736.00 0.17Ibm Corp 1.25% 19-29.01.27 3,200,000 EUR 3,258,536.00 3,379,148.80 0.49Iliad 1.5% 17-14.10.24 800,000 EUR 769,106.97 776,816.00 0.11Ing Groep 1% 18-20.09.23 1,800,000 EUR 1,812,325.00 1,856,786.40 0.27Ing Groep 2.5% (Frn) 17-15.02.29 4,800,000 EUR 4,992,160.52 5,107,680.00 0.74Ingenico 1.625% 17-13.09.24 200,000 EUR 197,078.67 198,702.00 0.03Inmob Col 2% 18-17.04.26 2,100,000 EUR 2,124,846.00 2,243,735.34 0.33Innogy Fin 1.625% 18-30.05.26 1,100,000 EUR 1,177,679.00 1,188,959.20 0.17Internation 1.8% 18-25.09.26 2,100,000 EUR 2,148,491.00 2,237,894.61 0.32Intesa San 2.125% 18-30.08.23 3,000,000 EUR 3,128,445.60 3,150,402.00 0.46Itv 2% 16-01.12.23 1,000,000 EUR 1,039,097.40 1,044,072.00 0.15Jpmorgan Ch 0.625% 16-25.01.24 6,900,000 EUR 6,888,780.32 7,032,480.00 1.02Kbc 0.625% 19-10.04.25 Regs 800,000 EUR 795,550.00 805,096.00 0.12Kbc 0.875% 18-27.06.23 1,300,000 EUR 1,304,902.00 1,338,350.00 0.19Kellogg Co 1% 16-17.05.24 3,200,000 EUR 3,230,042.00 3,318,432.00 0.48
Pramerica Sicav
The accompanying notes form an integral part of these financial statements.
273
Social 4 Planet
Statement of Investmentsas at June 30, 2019 (continued)
(expressed in EUR)
* Securities partially or totally lent (see Note 9).

Description Face value/
Quantity
Base currency Cost Market Value % net
assets
Klepierre 0.625% 19-01.07.30 1,200,000 EUR 1,185,852.00 1,178,486.40 0.17Kon Ah Del 0.25% 19-26.06.25 400,000 EUR 397,088.00 398,252.00 0.06Lease plan 0.75% 17-03.10.22 2,000,000 EUR 1,994,452.50 2,023,620.00 0.29Lloyds Bk 0.625% 18-15.01.24 2,000,000 EUR 1,960,752.94 1,990,060.00 0.29Mapfre 1.625% 16-19.05.26 1,000,000 EUR 1,030,288.20 1,059,470.00 0.15Mapfre 4.375% (Frn) 17-31.03.47 1,800,000 EUR 1,953,888.70 2,022,120.00 0.29Mcdonalds 0.9% 19-15.06.26 2,900,000 EUR 2,917,890.30 2,987,435.00 0.43Mediobanca 0.625% 17-27.09.22 1,900,000 EUR 1,862,640.97 1,888,752.00 0.27Medtrnc 1.125% 19-07.03.27 1,500,000 EUR 1,533,255.20 1,563,243.15 0.23Merck Kgaa 1.625% 19-25.06.79 1,100,000 EUR 1,101,265.00 1,105,574.80 0.16Met Life 0.375% 19-09.04.24 Regs 1,100,000 EUR 1,099,294.96 1,112,911.80 0.16Metrovacesa 2.375% 16-23.05.22 1,100,000 EUR 1,163,414.00 1,164,466.60 0.17Mor St 1.875% 14-30.03.23 6,000,000 EUR 6,328,211.13 6,376,704.00 0.93Munich Re 3.25% 18-26.05.49 900,000 EUR 907,038.00 1,041,787.80 0.15Nat Aus Bk 0.625% 17-18.09.24 2,700,000 EUR 2,725,196.00 2,755,620.00 0.40Natl Grid 1% 17-12.07.24 Regs 1,300,000 EUR 1,334,144.00 1,343,162.60 0.19Ndaq 1.75% 19-28.03.29 1,000,000 EUR 1,010,708.00 1,061,880.00 0.15Newbelco 1.15% 18-22.01.27 5,300,000 EUR 5,366,441.20 5,515,445.00 0.80Nykredit 0.5% 18-19.01.22 1,300,000 EUR 1,296,820.00 1,310,595.00 0.19Omv 0% 19-03.07.25 Regs 1,200,000 EUR 1,189,824.00 1,192,728.00 0.17Omv 1% 17-14.12.26 Regs 900,000 EUR 900,452.00 952,279.20 0.14Omv 6.25% 15-Perp* 1,000,000 EUR 1,203,483.00 1,256,740.00 0.18Orange 1% 16-12.05.25 1,000,000 EUR 1,021,132.00 1,045,910.00 0.15Orange 1.125% 19-15.07.24 Regs 1,800,000 EUR 1,869,384.00 1,887,634.80 0.27Partnerre 1.25% 16-15.09.26 1,500,000 EUR 1,457,986.00 1,535,982.00 0.22Peugeot 2% 17-23.03.24 Regs 1,900,000 EUR 1,957,737.58 2,001,581.60 0.29Pricelineco 2.375% 14-23.09.24 900,000 EUR 988,317.00 995,652.45 0.14Prosegur 1% 18-08.02.23 Regs 900,000 EUR 897,650.00 914,641.20 0.13Psa Banque 0.625% 17-10.10.22 1,400,000 EUR 1,387,360.00 1,417,679.06 0.21Rabobk 0.75% 18-29.08.23 100,000 EUR 99,618.39 102,540.00 0.01Rabobk 1.25% 16-23.03.26 3,500,000 EUR 3,703,000.00 3,759,539.00 0.55Raiffeisen 1% 18-04.12.23 1,100,000 EUR 1,110,312.00 1,130,655.13 0.16Rbs Grp 2.5% 16-22.03.23 2,800,000 EUR 2,959,983.00 2,971,449.60 0.43Rci Bq 0.5% 16-15.09.23 5,300,000 EUR 5,198,132.42 5,283,209.60 0.77Relx Capita 1.3% 15-12.05.25 1,000,000 EUR 1,019,329.33 1,052,390.00 0.15Royal Phil 0.5% 19-22.05.26 1,300,000 EUR 1,299,254.00 1,313,849.29 0.19Rte 1% 16-19.10.26 1,900,000 EUR 1,952,449.00 1,998,746.80 0.29Sanofi 0.5% 16-13.01.27 800,000 EUR 800,395.20 814,331.36 0.12Santan Cons 0.875% 17-24.01.22 1,300,000 EUR 1,314,282.00 1,329,441.10 0.19Santan Cons 1% 19-27.02.24 1,300,000 EUR 1,313,799.20 1,337,479.00 0.19Santander 0.25% 19-19.06.24 1,400,000 EUR 1,393,350.00 1,400,798.00 0.20Santander I 2.5% 15-18.03.25 3,700,000 EUR 3,811,052.40 3,999,166.83 0.58Sap Ag 0.75% 18-10.12.24 Regs 1,700,000 EUR 1,713,011.00 1,764,729.20 0.26Schneid El 1.375% 18-21.06.27 800,000 EUR 846,000.00 857,512.00 0.12Scor Se 3.625% 16-27.05.48 1,000,000 EUR 1,080,176.15 1,139,517.60 0.17Shb 0.125% 19-18.06.24 Regs 2,300,000 EUR 2,296,688.00 2,306,371.00 0.33Shb 1.625% 18-05.03.29 1,300,000 EUR 1,301,898.00 1,342,874.00 0.19Sky Regd Guar 2.5% 14-15.09.26 1,300,000 EUR 1,469,565.00 1,475,669.00 0.21Sns 0.75% 18-25.06.23 2,100,000 EUR 2,116,036.10 2,152,390.80 0.31Sns 3.75% 15-05.11.25 800,000 EUR 847,076.04 835,601.60 0.12Socgen 1.125% 18-23.01.25 2,000,000 EUR 1,980,583.02 2,042,320.00 0.30Socgen 1.25% 19-15.02.24 1,800,000 EUR 1,832,220.00 1,855,594.80 0.27Socgen 2.625% 15-27.02.25 1,000,000 EUR 1,069,500.00 1,087,398.00 0.16St Gobain 0.625% 19-15.03.24 1,700,000 EUR 1,694,707.00 1,730,895.80 0.25Std Chart 0.75% 17-03.10.23 1,200,000 EUR 1,186,736.00 1,207,783.20 0.18Swiss Re Ad 1.375% 16-27.05.23 3,000,000 EUR 3,099,080.69 3,134,922.00 0.46Takeda Phar 3% 18-21.11.30 Regs 2,000,000 EUR 2,110,674.00 2,310,040.00 0.34Telecom It 2.875% 18-28.01.26 600,000 EUR 595,532.00 608,244.00 0.09Telefonica 1.069% 19-05.02.24 1,900,000 EUR 1,926,876.00 1,976,300.20 0.29Telefonica 1.788% 19-12.03.29 1,100,000 EUR 1,114,160.00 1,187,476.40 0.17Telefonica 3.75% 16-Perp 1,400,000 EUR 1,431,978.00 1,478,780.80 0.21Telenor 0.75% 19-31.05.26 Regs 700,000 EUR 698,719.00 720,654.20 0.10
Pramerica Sicav
The accompanying notes form an integral part of these financial statements.
274
Social 4 Planet
Statement of Investmentsas at June 30, 2019 (continued)
(expressed in EUR)
* Securities partially or totally lent (see Note 9).
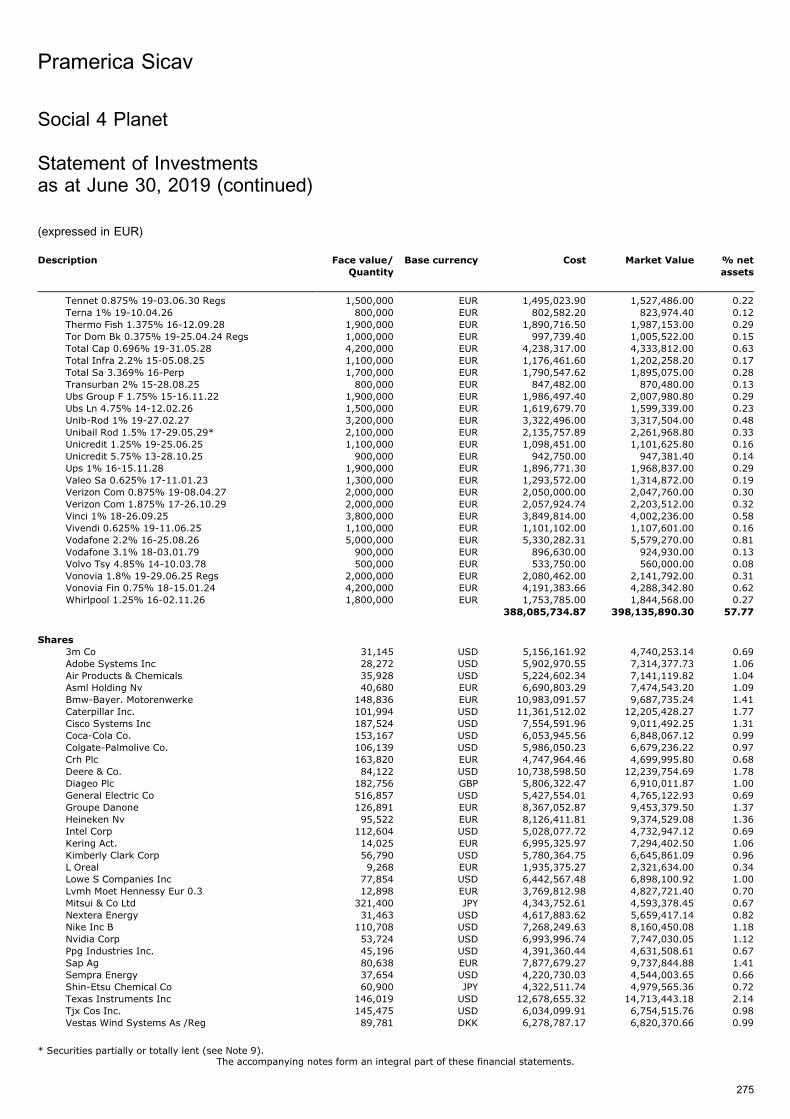
Description Face value/
Quantity
Base currency Cost Market Value % net
assets
Tennet 0.875% 19-03.06.30 Regs 1,500,000 EUR 1,495,023.90 1,527,486.00 0.22Terna 1% 19-10.04.26 800,000 EUR 802,582.20 823,974.40 0.12Thermo Fish 1.375% 16-12.09.28 1,900,000 EUR 1,890,716.50 1,987,153.00 0.29Tor Dom Bk 0.375% 19-25.04.24 Regs 1,000,000 EUR 997,739.40 1,005,522.00 0.15Total Cap 0.696% 19-31.05.28 4,200,000 EUR 4,238,317.00 4,333,812.00 0.63Total Infra 2.2% 15-05.08.25 1,100,000 EUR 1,176,461.60 1,202,258.20 0.17Total Sa 3.369% 16-Perp 1,700,000 EUR 1,790,547.62 1,895,075.00 0.28Transurban 2% 15-28.08.25 800,000 EUR 847,482.00 870,480.00 0.13Ubs Group F 1.75% 15-16.11.22 1,900,000 EUR 1,986,497.40 2,007,980.80 0.29Ubs Ln 4.75% 14-12.02.26 1,500,000 EUR 1,619,679.70 1,599,339.00 0.23Unib-Rod 1% 19-27.02.27 3,200,000 EUR 3,322,496.00 3,317,504.00 0.48Unibail Rod 1.5% 17-29.05.29* 2,100,000 EUR 2,135,757.89 2,261,968.80 0.33Unicredit 1.25% 19-25.06.25 1,100,000 EUR 1,098,451.00 1,101,625.80 0.16Unicredit 5.75% 13-28.10.25 900,000 EUR 942,750.00 947,381.40 0.14Ups 1% 16-15.11.28 1,900,000 EUR 1,896,771.30 1,968,837.00 0.29Valeo Sa 0.625% 17-11.01.23 1,300,000 EUR 1,293,572.00 1,314,872.00 0.19Verizon Com 0.875% 19-08.04.27 2,000,000 EUR 2,050,000.00 2,047,760.00 0.30Verizon Com 1.875% 17-26.10.29 2,000,000 EUR 2,057,924.74 2,203,512.00 0.32Vinci 1% 18-26.09.25 3,800,000 EUR 3,849,814.00 4,002,236.00 0.58Vivendi 0.625% 19-11.06.25 1,100,000 EUR 1,101,102.00 1,107,601.00 0.16Vodafone 2.2% 16-25.08.26 5,000,000 EUR 5,330,282.31 5,579,270.00 0.81Vodafone 3.1% 18-03.01.79 900,000 EUR 896,630.00 924,930.00 0.13Volvo Tsy 4.85% 14-10.03.78 500,000 EUR 533,750.00 560,000.00 0.08Vonovia 1.8% 19-29.06.25 Regs 2,000,000 EUR 2,080,462.00 2,141,792.00 0.31Vonovia Fin 0.75% 18-15.01.24 4,200,000 EUR 4,191,383.66 4,288,342.80 0.62Whirlpool 1.25% 16-02.11.26 1,800,000 EUR 1,753,785.00 1,844,568.00 0.27
388,085,734.87 398,135,890.30 57.77
Shares
3m Co 31,145 USD 5,156,161.92 4,740,253.14 0.69Adobe Systems Inc 28,272 USD 5,902,970.55 7,314,377.73 1.06Air Products & Chemicals 35,928 USD 5,224,602.34 7,141,119.82 1.04Asml Holding Nv 40,680 EUR 6,690,803.29 7,474,543.20 1.09Bmw-Bayer. Motorenwerke 148,836 EUR 10,983,091.57 9,687,735.24 1.41Caterpillar Inc. 101,994 USD 11,361,512.02 12,205,428.27 1.77Cisco Systems Inc 187,524 USD 7,554,591.96 9,011,492.25 1.31Coca-Cola Co. 153,167 USD 6,053,945.56 6,848,067.12 0.99Colgate-Palmolive Co. 106,139 USD 5,986,050.23 6,679,236.22 0.97Crh Plc 163,820 EUR 4,747,964.46 4,699,995.80 0.68Deere & Co. 84,122 USD 10,738,598.50 12,239,754.69 1.78Diageo Plc 182,756 GBP 5,806,322.47 6,910,011.87 1.00General Electric Co 516,857 USD 5,427,554.01 4,765,122.93 0.69Groupe Danone 126,891 EUR 8,367,052.87 9,453,379.50 1.37Heineken Nv 95,522 EUR 8,126,411.81 9,374,529.08 1.36Intel Corp 112,604 USD 5,028,077.72 4,732,947.12 0.69Kering Act. 14,025 EUR 6,995,325.97 7,294,402.50 1.06Kimberly Clark Corp 56,790 USD 5,780,364.75 6,645,861.09 0.96L Oreal 9,268 EUR 1,935,375.27 2,321,634.00 0.34Lowe S Companies Inc 77,854 USD 6,442,567.48 6,898,100.92 1.00Lvmh Moet Hennessy Eur 0.3 12,898 EUR 3,769,812.98 4,827,721.40 0.70Mitsui & Co Ltd 321,400 JPY 4,343,752.61 4,593,378.45 0.67Nextera Energy 31,463 USD 4,617,883.62 5,659,417.14 0.82Nike Inc B 110,708 USD 7,268,249.63 8,160,450.08 1.18Nvidia Corp 53,724 USD 6,993,996.74 7,747,030.05 1.12Ppg Industries Inc. 45,196 USD 4,391,360.44 4,631,508.61 0.67Sap Ag 80,638 EUR 7,877,679.27 9,737,844.88 1.41Sempra Energy 37,654 USD 4,220,730.03 4,544,003.65 0.66Shin-Etsu Chemical Co 60,900 JPY 4,322,511.74 4,979,565.36 0.72Texas Instruments Inc 146,019 USD 12,678,655.32 14,713,443.18 2.14Tjx Cos Inc. 145,475 USD 6,034,099.91 6,754,515.76 0.98Vestas Wind Systems As /Reg 89,781 DKK 6,278,787.17 6,820,370.66 0.99
Pramerica Sicav
The accompanying notes form an integral part of these financial statements.
275
Social 4 Planet
Statement of Investmentsas at June 30, 2019 (continued)
(expressed in EUR)
* Securities partially or totally lent (see Note 9).
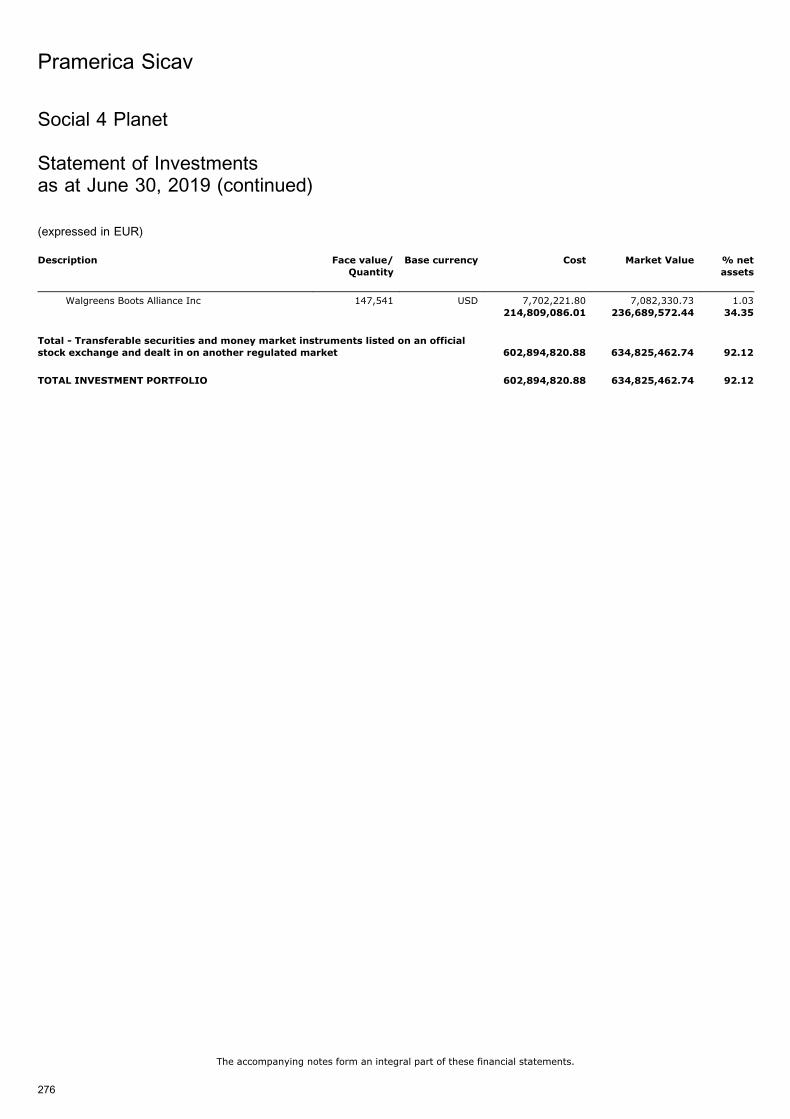
Description Face value/
Quantity
Base currency Cost Market Value % net
assets
Walgreens Boots Alliance Inc 147,541 USD 7,702,221.80 7,082,330.73 1.03214,809,086.01 236,689,572.44 34.35
Total - Transferable securities and money market instruments listed on an officialstock exchange and dealt in on another regulated market 602,894,820.88 634,825,462.74 92.12
TOTAL INVESTMENT PORTFOLIO 602,894,820.88 634,825,462.74 92.12
Pramerica Sicav
The accompanying notes form an integral part of these financial statements.
276
Social 4 Planet
Statement of Investmentsas at June 30, 2019 (continued)
(expressed in EUR)
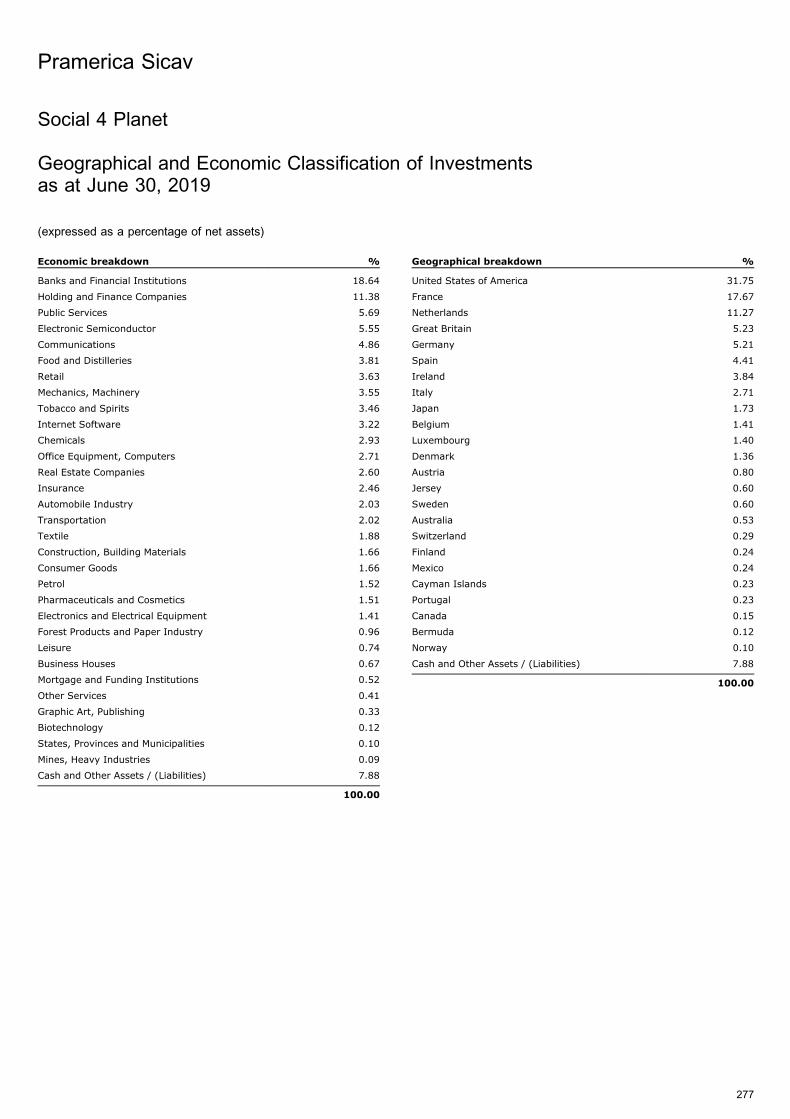
Social 4 Planet
Geographical and Economic Classification of Investmentsas at June 30, 2019
(expressed as a percentage of net assets)
Economic breakdown %
Banks and Financial Institutions 18.64
Holding and Finance Companies 11.38
Public Services 5.69
Electronic Semiconductor 5.55
Communications 4.86
Food and Distilleries 3.81
Retail 3.63
Mechanics, Machinery 3.55
Tobacco and Spirits 3.46
Internet Software 3.22
Chemicals 2.93
Office Equipment, Computers 2.71
Real Estate Companies 2.60
Insurance 2.46
Automobile Industry 2.03
Transportation 2.02
Textile 1.88
Construction, Building Materials 1.66
Consumer Goods 1.66
Petrol 1.52
Pharmaceuticals and Cosmetics 1.51
Electronics and Electrical Equipment 1.41
Forest Products and Paper Industry 0.96
Leisure 0.74
Business Houses 0.67
Mortgage and Funding Institutions 0.52
Other Services 0.41
Graphic Art, Publishing 0.33
Biotechnology 0.12
States, Provinces and Municipalities 0.10
Mines, Heavy Industries 0.09
Cash and Other Assets / (Liabilities) 7.88
100.00
Geographical breakdown %
United States of America 31.75
France 17.67
Netherlands 11.27
Great Britain 5.23
Germany 5.21
Spain 4.41
Ireland 3.84
Italy 2.71
Japan 1.73
Belgium 1.41
Luxembourg 1.40
Denmark 1.36
Austria 0.80
Jersey 0.60
Sweden 0.60
Australia 0.53
Switzerland 0.29
Finland 0.24
Mexico 0.24
Cayman Islands 0.23
Portugal 0.23
Canada 0.15
Bermuda 0.12
Norway 0.10
Cash and Other Assets / (Liabilities) 7.88
100.00
Pramerica Sicav
277
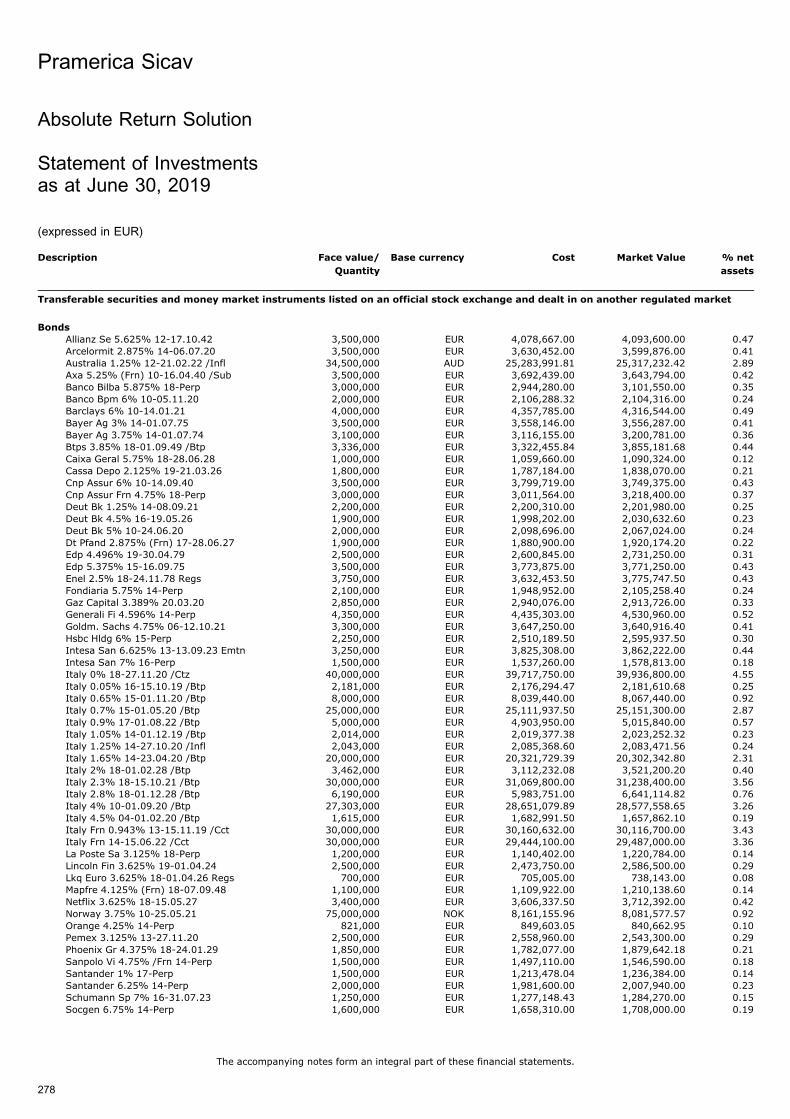
Absolute Return Solution
Statement of Investmentsas at June 30, 2019
(expressed in EUR)
Description Face value/
Quantity
Base currency Cost Market Value % net
assets
Transferable securities and money market instruments listed on an official stock exchange and dealt in on another regulated market
Bonds
Allianz Se 5.625% 12-17.10.42 3,500,000 EUR 4,078,667.00 4,093,600.00 0.47Arcelormit 2.875% 14-06.07.20 3,500,000 EUR 3,630,452.00 3,599,876.00 0.41Australia 1.25% 12-21.02.22 /Infl 34,500,000 AUD 25,283,991.81 25,317,232.42 2.89Axa 5.25% (Frn) 10-16.04.40 /Sub 3,500,000 EUR 3,692,439.00 3,643,794.00 0.42Banco Bilba 5.875% 18-Perp 3,000,000 EUR 2,944,280.00 3,101,550.00 0.35Banco Bpm 6% 10-05.11.20 2,000,000 EUR 2,106,288.32 2,104,316.00 0.24Barclays 6% 10-14.01.21 4,000,000 EUR 4,357,785.00 4,316,544.00 0.49Bayer Ag 3% 14-01.07.75 3,500,000 EUR 3,558,146.00 3,556,287.00 0.41Bayer Ag 3.75% 14-01.07.74 3,100,000 EUR 3,116,155.00 3,200,781.00 0.36Btps 3.85% 18-01.09.49 /Btp 3,336,000 EUR 3,322,455.84 3,855,181.68 0.44Caixa Geral 5.75% 18-28.06.28 1,000,000 EUR 1,059,660.00 1,090,324.00 0.12Cassa Depo 2.125% 19-21.03.26 1,800,000 EUR 1,787,184.00 1,838,070.00 0.21Cnp Assur 6% 10-14.09.40 3,500,000 EUR 3,799,719.00 3,749,375.00 0.43Cnp Assur Frn 4.75% 18-Perp 3,000,000 EUR 3,011,564.00 3,218,400.00 0.37Deut Bk 1.25% 14-08.09.21 2,200,000 EUR 2,200,310.00 2,201,980.00 0.25Deut Bk 4.5% 16-19.05.26 1,900,000 EUR 1,998,202.00 2,030,632.60 0.23Deut Bk 5% 10-24.06.20 2,000,000 EUR 2,098,696.00 2,067,024.00 0.24Dt Pfand 2.875% (Frn) 17-28.06.27 1,900,000 EUR 1,880,900.00 1,920,174.20 0.22Edp 4.496% 19-30.04.79 2,500,000 EUR 2,600,845.00 2,731,250.00 0.31Edp 5.375% 15-16.09.75 3,500,000 EUR 3,773,875.00 3,771,250.00 0.43Enel 2.5% 18-24.11.78 Regs 3,750,000 EUR 3,632,453.50 3,775,747.50 0.43Fondiaria 5.75% 14-Perp 2,100,000 EUR 1,948,952.00 2,105,258.40 0.24Gaz Capital 3.389% 20.03.20 2,850,000 EUR 2,940,076.00 2,913,726.00 0.33Generali Fi 4.596% 14-Perp 4,350,000 EUR 4,435,303.00 4,530,960.00 0.52Goldm. Sachs 4.75% 06-12.10.21 3,300,000 EUR 3,647,250.00 3,640,916.40 0.41Hsbc Hldg 6% 15-Perp 2,250,000 EUR 2,510,189.50 2,595,937.50 0.30Intesa San 6.625% 13-13.09.23 Emtn 3,250,000 EUR 3,825,308.00 3,862,222.00 0.44Intesa San 7% 16-Perp 1,500,000 EUR 1,537,260.00 1,578,813.00 0.18Italy 0% 18-27.11.20 /Ctz 40,000,000 EUR 39,717,750.00 39,936,800.00 4.55Italy 0.05% 16-15.10.19 /Btp 2,181,000 EUR 2,176,294.47 2,181,610.68 0.25Italy 0.65% 15-01.11.20 /Btp 8,000,000 EUR 8,039,440.00 8,067,440.00 0.92Italy 0.7% 15-01.05.20 /Btp 25,000,000 EUR 25,111,937.50 25,151,300.00 2.87Italy 0.9% 17-01.08.22 /Btp 5,000,000 EUR 4,903,950.00 5,015,840.00 0.57Italy 1.05% 14-01.12.19 /Btp 2,014,000 EUR 2,019,377.38 2,023,252.32 0.23Italy 1.25% 14-27.10.20 /Infl 2,043,000 EUR 2,085,368.60 2,083,471.56 0.24Italy 1.65% 14-23.04.20 /Btp 20,000,000 EUR 20,321,729.39 20,302,342.80 2.31Italy 2% 18-01.02.28 /Btp 3,462,000 EUR 3,112,232.08 3,521,200.20 0.40Italy 2.3% 18-15.10.21 /Btp 30,000,000 EUR 31,069,800.00 31,238,400.00 3.56Italy 2.8% 18-01.12.28 /Btp 6,190,000 EUR 5,983,751.00 6,641,114.82 0.76Italy 4% 10-01.09.20 /Btp 27,303,000 EUR 28,651,079.89 28,577,558.65 3.26Italy 4.5% 04-01.02.20 /Btp 1,615,000 EUR 1,682,991.50 1,657,862.10 0.19Italy Frn 0.943% 13-15.11.19 /Cct 30,000,000 EUR 30,160,632.00 30,116,700.00 3.43Italy Frn 14-15.06.22 /Cct 30,000,000 EUR 29,444,100.00 29,487,000.00 3.36La Poste Sa 3.125% 18-Perp 1,200,000 EUR 1,140,402.00 1,220,784.00 0.14Lincoln Fin 3.625% 19-01.04.24 2,500,000 EUR 2,473,750.00 2,586,500.00 0.29Lkq Euro 3.625% 18-01.04.26 Regs 700,000 EUR 705,005.00 738,143.00 0.08Mapfre 4.125% (Frn) 18-07.09.48 1,100,000 EUR 1,109,922.00 1,210,138.60 0.14Netflix 3.625% 18-15.05.27 3,400,000 EUR 3,606,337.50 3,712,392.00 0.42Norway 3.75% 10-25.05.21 75,000,000 NOK 8,161,155.96 8,081,577.57 0.92Orange 4.25% 14-Perp 821,000 EUR 849,603.05 840,662.95 0.10Pemex 3.125% 13-27.11.20 2,500,000 EUR 2,558,960.00 2,543,300.00 0.29Phoenix Gr 4.375% 18-24.01.29 1,850,000 EUR 1,782,077.00 1,879,642.18 0.21Sanpolo Vi 4.75% /Frn 14-Perp 1,500,000 EUR 1,497,110.00 1,546,590.00 0.18Santander 1% 17-Perp 1,500,000 EUR 1,213,478.04 1,236,384.00 0.14Santander 6.25% 14-Perp 2,000,000 EUR 1,981,600.00 2,007,940.00 0.23Schumann Sp 7% 16-31.07.23 1,250,000 EUR 1,277,148.43 1,284,270.00 0.15Socgen 6.75% 14-Perp 1,600,000 EUR 1,658,310.00 1,708,000.00 0.19
Pramerica Sicav
The accompanying notes form an integral part of these financial statements.
278
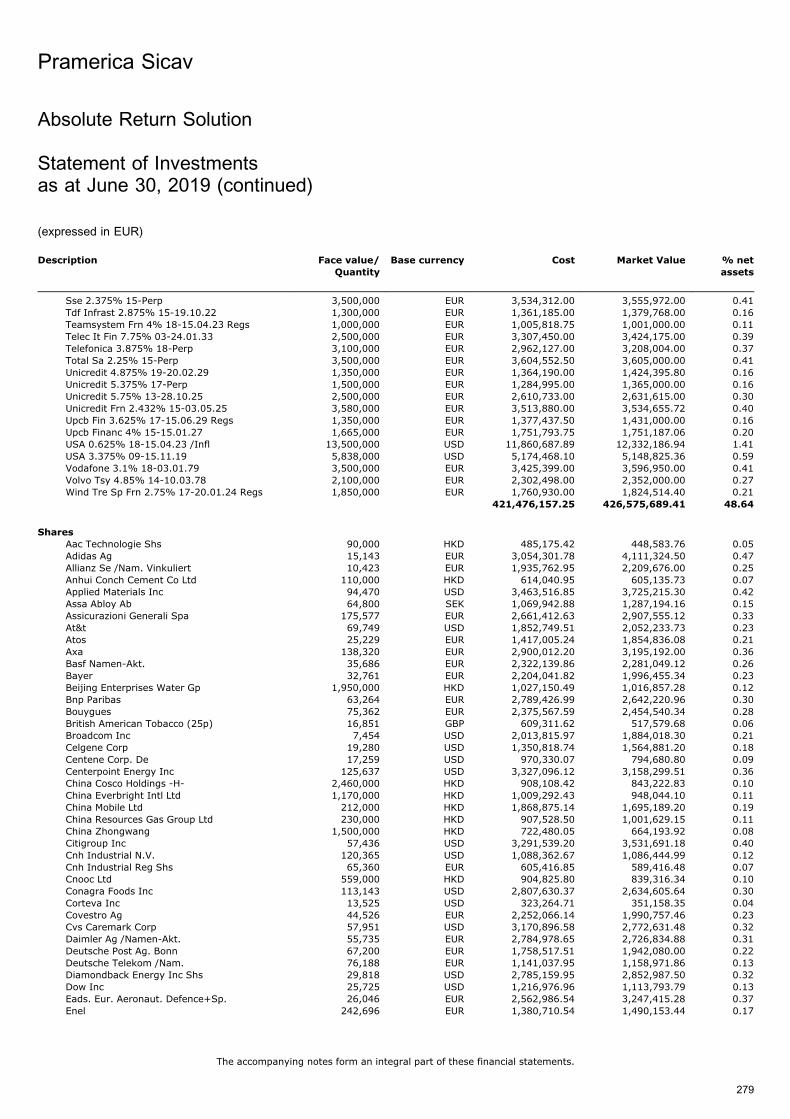
Description Face value/
Quantity
Base currency Cost Market Value % net
assets
Sse 2.375% 15-Perp 3,500,000 EUR 3,534,312.00 3,555,972.00 0.41Tdf Infrast 2.875% 15-19.10.22 1,300,000 EUR 1,361,185.00 1,379,768.00 0.16Teamsystem Frn 4% 18-15.04.23 Regs 1,000,000 EUR 1,005,818.75 1,001,000.00 0.11Telec It Fin 7.75% 03-24.01.33 2,500,000 EUR 3,307,450.00 3,424,175.00 0.39Telefonica 3.875% 18-Perp 3,100,000 EUR 2,962,127.00 3,208,004.00 0.37Total Sa 2.25% 15-Perp 3,500,000 EUR 3,604,552.50 3,605,000.00 0.41Unicredit 4.875% 19-20.02.29 1,350,000 EUR 1,364,190.00 1,424,395.80 0.16Unicredit 5.375% 17-Perp 1,500,000 EUR 1,284,995.00 1,365,000.00 0.16Unicredit 5.75% 13-28.10.25 2,500,000 EUR 2,610,733.00 2,631,615.00 0.30Unicredit Frn 2.432% 15-03.05.25 3,580,000 EUR 3,513,880.00 3,534,655.72 0.40Upcb Fin 3.625% 17-15.06.29 Regs 1,350,000 EUR 1,377,437.50 1,431,000.00 0.16Upcb Financ 4% 15-15.01.27 1,665,000 EUR 1,751,793.75 1,751,187.06 0.20USA 0.625% 18-15.04.23 /Infl 13,500,000 USD 11,860,687.89 12,332,186.94 1.41USA 3.375% 09-15.11.19 5,838,000 USD 5,174,468.10 5,148,825.36 0.59Vodafone 3.1% 18-03.01.79 3,500,000 EUR 3,425,399.00 3,596,950.00 0.41Volvo Tsy 4.85% 14-10.03.78 2,100,000 EUR 2,302,498.00 2,352,000.00 0.27Wind Tre Sp Frn 2.75% 17-20.01.24 Regs 1,850,000 EUR 1,760,930.00 1,824,514.40 0.21
421,476,157.25 426,575,689.41 48.64
SharesAac Technologie Shs 90,000 HKD 485,175.42 448,583.76 0.05Adidas Ag 15,143 EUR 3,054,301.78 4,111,324.50 0.47Allianz Se /Nam. Vinkuliert 10,423 EUR 1,935,762.95 2,209,676.00 0.25Anhui Conch Cement Co Ltd 110,000 HKD 614,040.95 605,135.73 0.07Applied Materials Inc 94,470 USD 3,463,516.85 3,725,215.30 0.42Assa Abloy Ab 64,800 SEK 1,069,942.88 1,287,194.16 0.15Assicurazioni Generali Spa 175,577 EUR 2,661,412.63 2,907,555.12 0.33At&t 69,749 USD 1,852,749.51 2,052,233.73 0.23Atos 25,229 EUR 1,417,005.24 1,854,836.08 0.21Axa 138,320 EUR 2,900,012.20 3,195,192.00 0.36Basf Namen-Akt. 35,686 EUR 2,322,139.86 2,281,049.12 0.26Bayer 32,761 EUR 2,204,041.82 1,996,455.34 0.23Beijing Enterprises Water Gp 1,950,000 HKD 1,027,150.49 1,016,857.28 0.12Bnp Paribas 63,264 EUR 2,789,426.99 2,642,220.96 0.30Bouygues 75,362 EUR 2,375,567.59 2,454,540.34 0.28British American Tobacco (25p) 16,851 GBP 609,311.62 517,579.68 0.06Broadcom Inc 7,454 USD 2,013,815.97 1,884,018.30 0.21Celgene Corp 19,280 USD 1,350,818.74 1,564,881.20 0.18Centene Corp. De 17,259 USD 970,330.07 794,680.80 0.09Centerpoint Energy Inc 125,637 USD 3,327,096.12 3,158,299.51 0.36China Cosco Holdings -H- 2,460,000 HKD 908,108.42 843,222.83 0.10China Everbright Intl Ltd 1,170,000 HKD 1,009,292.43 948,044.10 0.11China Mobile Ltd 212,000 HKD 1,868,875.14 1,695,189.20 0.19China Resources Gas Group Ltd 230,000 HKD 907,528.50 1,001,629.15 0.11China Zhongwang 1,500,000 HKD 722,480.05 664,193.92 0.08Citigroup Inc 57,436 USD 3,291,539.20 3,531,691.18 0.40Cnh Industrial N.V. 120,365 USD 1,088,362.67 1,086,444.99 0.12Cnh Industrial Reg Shs 65,360 EUR 605,416.85 589,416.48 0.07Cnooc Ltd 559,000 HKD 904,825.80 839,316.34 0.10Conagra Foods Inc 113,143 USD 2,807,630.37 2,634,605.64 0.30Corteva Inc 13,525 USD 323,264.71 351,158.35 0.04Covestro Ag 44,526 EUR 2,252,066.14 1,990,757.46 0.23Cvs Caremark Corp 57,951 USD 3,170,896.58 2,772,631.48 0.32Daimler Ag /Namen-Akt. 55,735 EUR 2,784,978.65 2,726,834.88 0.31Deutsche Post Ag. Bonn 67,200 EUR 1,758,517.51 1,942,080.00 0.22Deutsche Telekom /Nam. 76,188 EUR 1,141,037.95 1,158,971.86 0.13Diamondback Energy Inc Shs 29,818 USD 2,785,159.95 2,852,987.50 0.32Dow Inc 25,725 USD 1,216,976.96 1,113,793.79 0.13Eads. Eur. Aeronaut. Defence+Sp. 26,046 EUR 2,562,986.54 3,247,415.28 0.37Enel 242,696 EUR 1,380,710.54 1,490,153.44 0.17
Pramerica Sicav
The accompanying notes form an integral part of these financial statements.
279
Absolute Return Solution
Statement of Investmentsas at June 30, 2019 (continued)
(expressed in EUR)
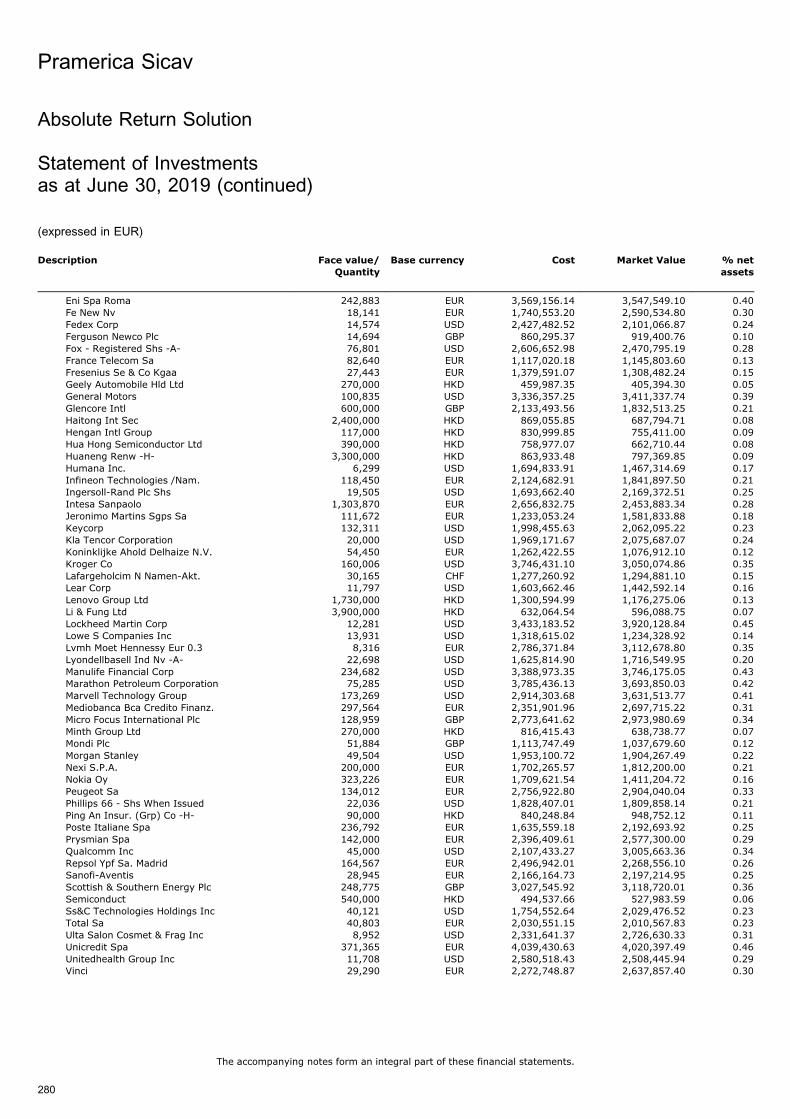
Description Face value/
Quantity
Base currency Cost Market Value % net
assets
Eni Spa Roma 242,883 EUR 3,569,156.14 3,547,549.10 0.40Fe New Nv 18,141 EUR 1,740,553.20 2,590,534.80 0.30Fedex Corp 14,574 USD 2,427,482.52 2,101,066.87 0.24Ferguson Newco Plc 14,694 GBP 860,295.37 919,400.76 0.10Fox - Registered Shs -A- 76,801 USD 2,606,652.98 2,470,795.19 0.28France Telecom Sa 82,640 EUR 1,117,020.18 1,145,803.60 0.13Fresenius Se & Co Kgaa 27,443 EUR 1,379,591.07 1,308,482.24 0.15Geely Automobile Hld Ltd 270,000 HKD 459,987.35 405,394.30 0.05General Motors 100,835 USD 3,336,357.25 3,411,337.74 0.39Glencore Intl 600,000 GBP 2,133,493.56 1,832,513.25 0.21Haitong Int Sec 2,400,000 HKD 869,055.85 687,794.71 0.08Hengan Intl Group 117,000 HKD 830,999.85 755,411.00 0.09Hua Hong Semiconductor Ltd 390,000 HKD 758,977.07 662,710.44 0.08Huaneng Renw -H- 3,300,000 HKD 863,933.48 797,369.85 0.09Humana Inc. 6,299 USD 1,694,833.91 1,467,314.69 0.17Infineon Technologies /Nam. 118,450 EUR 2,124,682.91 1,841,897.50 0.21Ingersoll-Rand Plc Shs 19,505 USD 1,693,662.40 2,169,372.51 0.25Intesa Sanpaolo 1,303,870 EUR 2,656,832.75 2,453,883.34 0.28Jeronimo Martins Sgps Sa 111,672 EUR 1,233,053.24 1,581,833.88 0.18Keycorp 132,311 USD 1,998,455.63 2,062,095.22 0.23Kla Tencor Corporation 20,000 USD 1,969,171.67 2,075,687.07 0.24Koninklijke Ahold Delhaize N.V. 54,450 EUR 1,262,422.55 1,076,912.10 0.12Kroger Co 160,006 USD 3,746,431.10 3,050,074.86 0.35Lafargeholcim N Namen-Akt. 30,165 CHF 1,277,260.92 1,294,881.10 0.15Lear Corp 11,797 USD 1,603,662.46 1,442,592.14 0.16Lenovo Group Ltd 1,730,000 HKD 1,300,594.99 1,176,275.06 0.13Li & Fung Ltd 3,900,000 HKD 632,064.54 596,088.75 0.07Lockheed Martin Corp 12,281 USD 3,433,183.52 3,920,128.84 0.45Lowe S Companies Inc 13,931 USD 1,318,615.02 1,234,328.92 0.14Lvmh Moet Hennessy Eur 0.3 8,316 EUR 2,786,371.84 3,112,678.80 0.35Lyondellbasell Ind Nv -A- 22,698 USD 1,625,814.90 1,716,549.95 0.20Manulife Financial Corp 234,682 USD 3,388,973.35 3,746,175.05 0.43Marathon Petroleum Corporation 75,285 USD 3,785,436.13 3,693,850.03 0.42Marvell Technology Group 173,269 USD 2,914,303.68 3,631,513.77 0.41Mediobanca Bca Credito Finanz. 297,564 EUR 2,351,901.96 2,697,715.22 0.31Micro Focus International Plc 128,959 GBP 2,773,641.62 2,973,980.69 0.34Minth Group Ltd 270,000 HKD 816,415.43 638,738.77 0.07Mondi Plc 51,884 GBP 1,113,747.49 1,037,679.60 0.12Morgan Stanley 49,504 USD 1,953,100.72 1,904,267.49 0.22Nexi S.P.A. 200,000 EUR 1,702,265.57 1,812,200.00 0.21Nokia Oy 323,226 EUR 1,709,621.54 1,411,204.72 0.16Peugeot Sa 134,012 EUR 2,756,922.80 2,904,040.04 0.33Phillips 66 - Shs When Issued 22,036 USD 1,828,407.01 1,809,858.14 0.21Ping An Insur. (Grp) Co -H- 90,000 HKD 840,248.84 948,752.12 0.11Poste Italiane Spa 236,792 EUR 1,635,559.18 2,192,693.92 0.25Prysmian Spa 142,000 EUR 2,396,409.61 2,577,300.00 0.29Qualcomm Inc 45,000 USD 2,107,433.27 3,005,663.36 0.34Repsol Ypf Sa. Madrid 164,567 EUR 2,496,942.01 2,268,556.10 0.26Sanofi-Aventis 28,945 EUR 2,166,164.73 2,197,214.95 0.25Scottish & Southern Energy Plc 248,775 GBP 3,027,545.92 3,118,720.01 0.36Semiconduct 540,000 HKD 494,537.66 527,983.59 0.06Ss&C Technologies Holdings Inc 40,121 USD 1,754,552.64 2,029,476.52 0.23Total Sa 40,803 EUR 2,030,551.15 2,010,567.83 0.23Ulta Salon Cosmet & Frag Inc 8,952 USD 2,331,641.37 2,726,630.33 0.31Unicredit Spa 371,365 EUR 4,039,430.63 4,020,397.49 0.46Unitedhealth Group Inc 11,708 USD 2,580,518.43 2,508,445.94 0.29Vinci 29,290 EUR 2,272,748.87 2,637,857.40 0.30
Pramerica Sicav
The accompanying notes form an integral part of these financial statements.
280
Absolute Return Solution
Statement of Investmentsas at June 30, 2019 (continued)
(expressed in EUR)
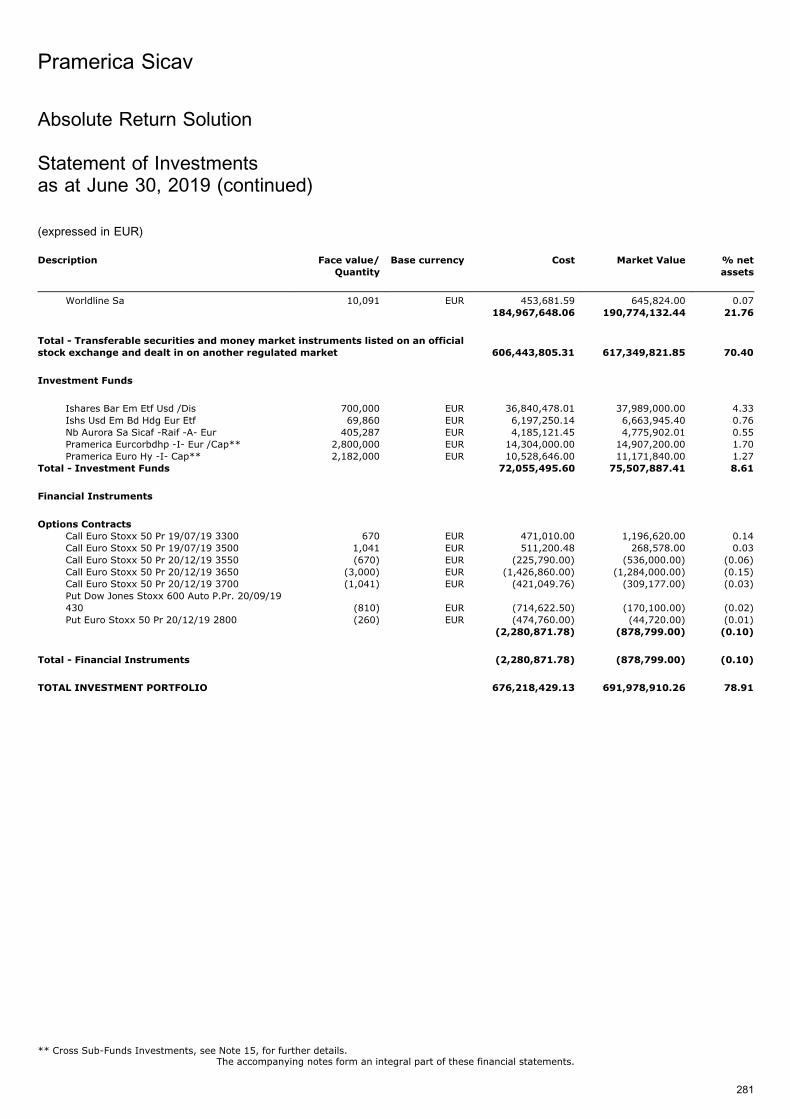
Description Face value/
Quantity
Base currency Cost Market Value % net
assets
Worldline Sa 10,091 EUR 453,681.59 645,824.00 0.07184,967,648.06 190,774,132.44 21.76
Total - Transferable securities and money market instruments listed on an officialstock exchange and dealt in on another regulated market 606,443,805.31 617,349,821.85 70.40
Investment Funds
Ishares Bar Em Etf Usd /Dis 700,000 EUR 36,840,478.01 37,989,000.00 4.33Ishs Usd Em Bd Hdg Eur Etf 69,860 EUR 6,197,250.14 6,663,945.40 0.76Nb Aurora Sa Sicaf -Raif -A- Eur 405,287 EUR 4,185,121.45 4,775,902.01 0.55Pramerica Eurcorbdhp -I- Eur /Cap** 2,800,000 EUR 14,304,000.00 14,907,200.00 1.70Pramerica Euro Hy -I- Cap** 2,182,000 EUR 10,528,646.00 11,171,840.00 1.27
Total - Investment Funds 72,055,495.60 75,507,887.41 8.61
Financial Instruments
Options ContractsCall Euro Stoxx 50 Pr 19/07/19 3300 670 EUR 471,010.00 1,196,620.00 0.14Call Euro Stoxx 50 Pr 19/07/19 3500 1,041 EUR 511,200.48 268,578.00 0.03Call Euro Stoxx 50 Pr 20/12/19 3550 (670) EUR (225,790.00) (536,000.00) (0.06)Call Euro Stoxx 50 Pr 20/12/19 3650 (3,000) EUR (1,426,860.00) (1,284,000.00) (0.15)Call Euro Stoxx 50 Pr 20/12/19 3700 (1,041) EUR (421,049.76) (309,177.00) (0.03)Put Dow Jones Stoxx 600 Auto P.Pr. 20/09/19430 (810) EUR (714,622.50) (170,100.00) (0.02)Put Euro Stoxx 50 Pr 20/12/19 2800 (260) EUR (474,760.00) (44,720.00) (0.01)
(2,280,871.78) (878,799.00) (0.10)
Total - Financial Instruments (2,280,871.78) (878,799.00) (0.10)
TOTAL INVESTMENT PORTFOLIO 676,218,429.13 691,978,910.26 78.91
Pramerica Sicav
The accompanying notes form an integral part of these financial statements.
281
Absolute Return Solution
Statement of Investmentsas at June 30, 2019 (continued)
(expressed in EUR)
** Cross Sub-Funds Investments, see Note 15, for further details.
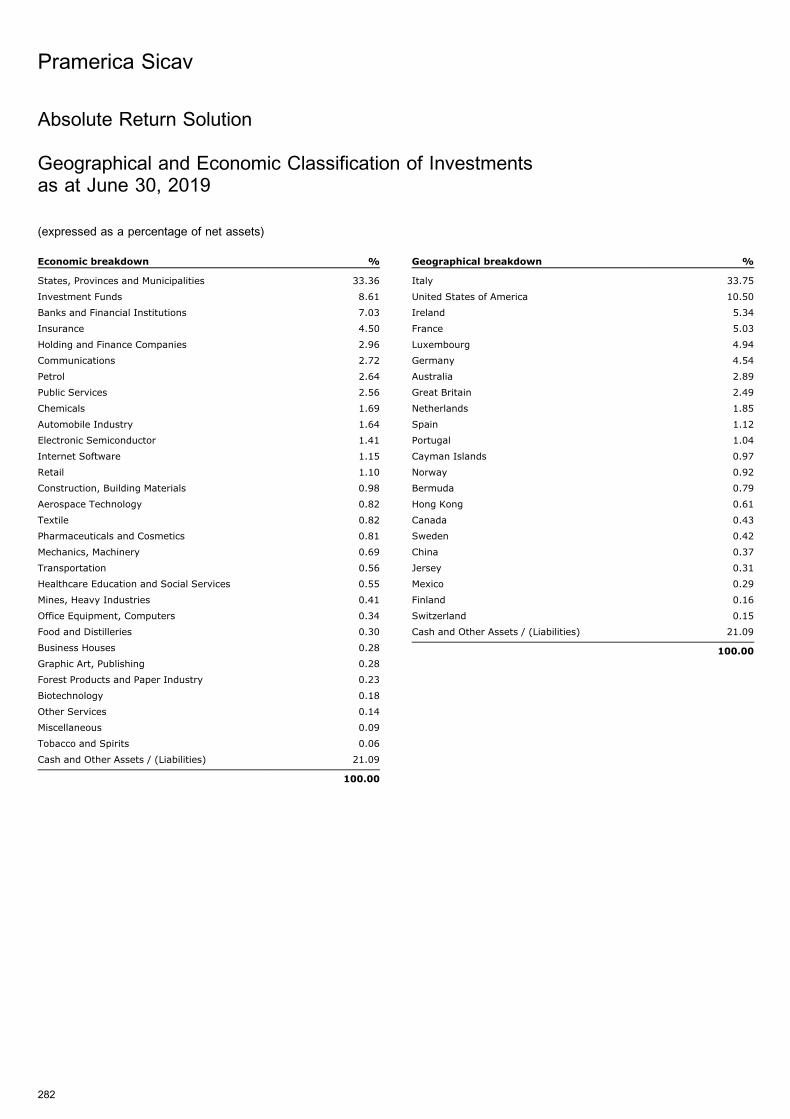
Absolute Return Solution
Geographical and Economic Classification of Investmentsas at June 30, 2019
(expressed as a percentage of net assets)
Economic breakdown %
States, Provinces and Municipalities 33.36
Investment Funds 8.61
Banks and Financial Institutions 7.03
Insurance 4.50
Holding and Finance Companies 2.96
Communications 2.72
Petrol 2.64
Public Services 2.56
Chemicals 1.69
Automobile Industry 1.64
Electronic Semiconductor 1.41
Internet Software 1.15
Retail 1.10
Construction, Building Materials 0.98
Aerospace Technology 0.82
Textile 0.82
Pharmaceuticals and Cosmetics 0.81
Mechanics, Machinery 0.69
Transportation 0.56
Healthcare Education and Social Services 0.55
Mines, Heavy Industries 0.41
Office Equipment, Computers 0.34
Food and Distilleries 0.30
Business Houses 0.28
Graphic Art, Publishing 0.28
Forest Products and Paper Industry 0.23
Biotechnology 0.18
Other Services 0.14
Miscellaneous 0.09
Tobacco and Spirits 0.06
Cash and Other Assets / (Liabilities) 21.09
100.00
Geographical breakdown %
Italy 33.75
United States of America 10.50
Ireland 5.34
France 5.03
Luxembourg 4.94
Germany 4.54
Australia 2.89
Great Britain 2.49
Netherlands 1.85
Spain 1.12
Portugal 1.04
Cayman Islands 0.97
Norway 0.92
Bermuda 0.79
Hong Kong 0.61
Canada 0.43
Sweden 0.42
China 0.37
Jersey 0.31
Mexico 0.29
Finland 0.16
Switzerland 0.15
Cash and Other Assets / (Liabilities) 21.09
100.00
Pramerica Sicav
282
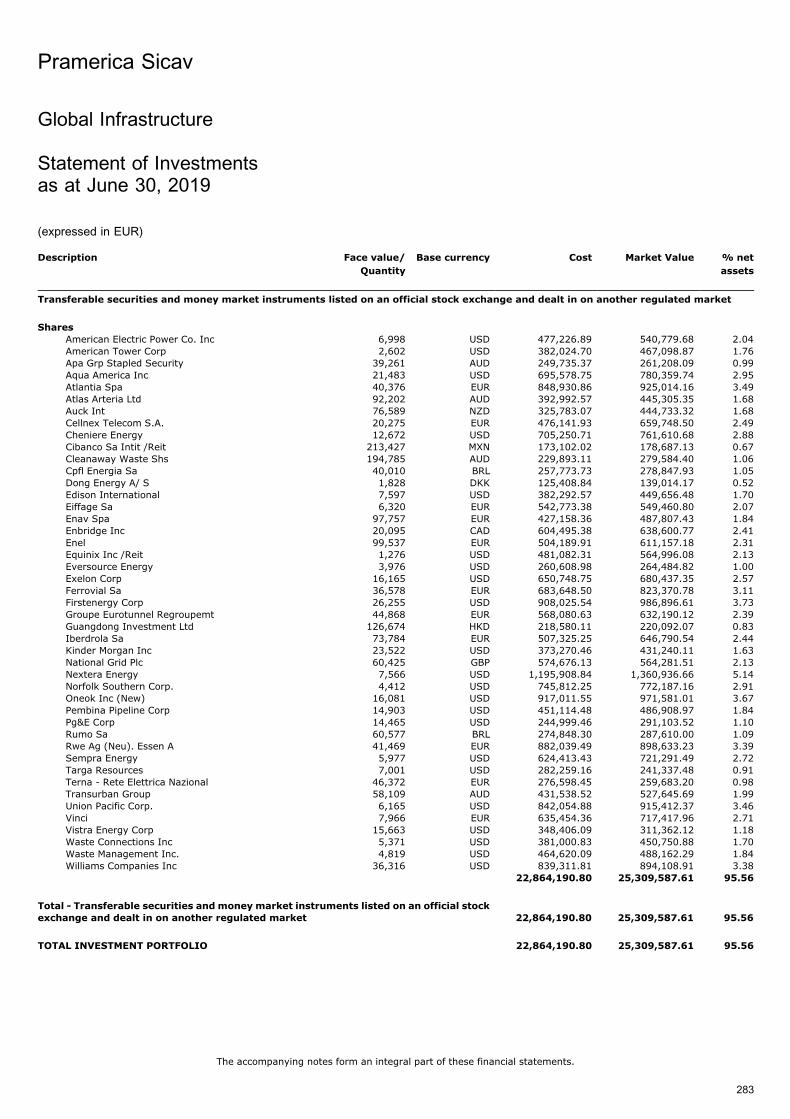
Global Infrastructure
Statement of Investmentsas at June 30, 2019
(expressed in EUR)
Description Face value/
Quantity
Base currency Cost Market Value % net
assets
Transferable securities and money market instruments listed on an official stock exchange and dealt in on another regulated market
Shares
American Electric Power Co. Inc 6,998 USD 477,226.89 540,779.68 2.04American Tower Corp 2,602 USD 382,024.70 467,098.87 1.76Apa Grp Stapled Security 39,261 AUD 249,735.37 261,208.09 0.99Aqua America Inc 21,483 USD 695,578.75 780,359.74 2.95Atlantia Spa 40,376 EUR 848,930.86 925,014.16 3.49Atlas Arteria Ltd 92,202 AUD 392,992.57 445,305.35 1.68Auck Int 76,589 NZD 325,783.07 444,733.32 1.68Cellnex Telecom S.A. 20,275 EUR 476,141.93 659,748.50 2.49Cheniere Energy 12,672 USD 705,250.71 761,610.68 2.88Cibanco Sa Intit /Reit 213,427 MXN 173,102.02 178,687.13 0.67Cleanaway Waste Shs 194,785 AUD 229,893.11 279,584.40 1.06Cpfl Energia Sa 40,010 BRL 257,773.73 278,847.93 1.05Dong Energy A/ S 1,828 DKK 125,408.84 139,014.17 0.52Edison International 7,597 USD 382,292.57 449,656.48 1.70Eiffage Sa 6,320 EUR 542,773.38 549,460.80 2.07Enav Spa 97,757 EUR 427,158.36 487,807.43 1.84Enbridge Inc 20,095 CAD 604,495.38 638,600.77 2.41Enel 99,537 EUR 504,189.91 611,157.18 2.31Equinix Inc /Reit 1,276 USD 481,082.31 564,996.08 2.13Eversource Energy 3,976 USD 260,608.98 264,484.82 1.00Exelon Corp 16,165 USD 650,748.75 680,437.35 2.57Ferrovial Sa 36,578 EUR 683,648.50 823,370.78 3.11Firstenergy Corp 26,255 USD 908,025.54 986,896.61 3.73Groupe Eurotunnel Regroupemt 44,868 EUR 568,080.63 632,190.12 2.39Guangdong Investment Ltd 126,674 HKD 218,580.11 220,092.07 0.83Iberdrola Sa 73,784 EUR 507,325.25 646,790.54 2.44Kinder Morgan Inc 23,522 USD 373,270.46 431,240.11 1.63National Grid Plc 60,425 GBP 574,676.13 564,281.51 2.13Nextera Energy 7,566 USD 1,195,908.84 1,360,936.66 5.14Norfolk Southern Corp. 4,412 USD 745,812.25 772,187.16 2.91Oneok Inc (New) 16,081 USD 917,011.55 971,581.01 3.67Pembina Pipeline Corp 14,903 USD 451,114.48 486,908.97 1.84Pg&E Corp 14,465 USD 244,999.46 291,103.52 1.10Rumo Sa 60,577 BRL 274,848.30 287,610.00 1.09Rwe Ag (Neu). Essen A 41,469 EUR 882,039.49 898,633.23 3.39Sempra Energy 5,977 USD 624,413.43 721,291.49 2.72Targa Resources 7,001 USD 282,259.16 241,337.48 0.91Terna - Rete Elettrica Nazional 46,372 EUR 276,598.45 259,683.20 0.98Transurban Group 58,109 AUD 431,538.52 527,645.69 1.99Union Pacific Corp. 6,165 USD 842,054.88 915,412.37 3.46Vinci 7,966 EUR 635,454.36 717,417.96 2.71Vistra Energy Corp 15,663 USD 348,406.09 311,362.12 1.18Waste Connections Inc 5,371 USD 381,000.83 450,750.88 1.70Waste Management Inc. 4,819 USD 464,620.09 488,162.29 1.84Williams Companies Inc 36,316 USD 839,311.81 894,108.91 3.38
22,864,190.80 25,309,587.61 95.56
Total - Transferable securities and money market instruments listed on an official stock
exchange and dealt in on another regulated market 22,864,190.80 25,309,587.61 95.56
TOTAL INVESTMENT PORTFOLIO 22,864,190.80 25,309,587.61 95.56
Pramerica Sicav
The accompanying notes form an integral part of these financial statements.
283
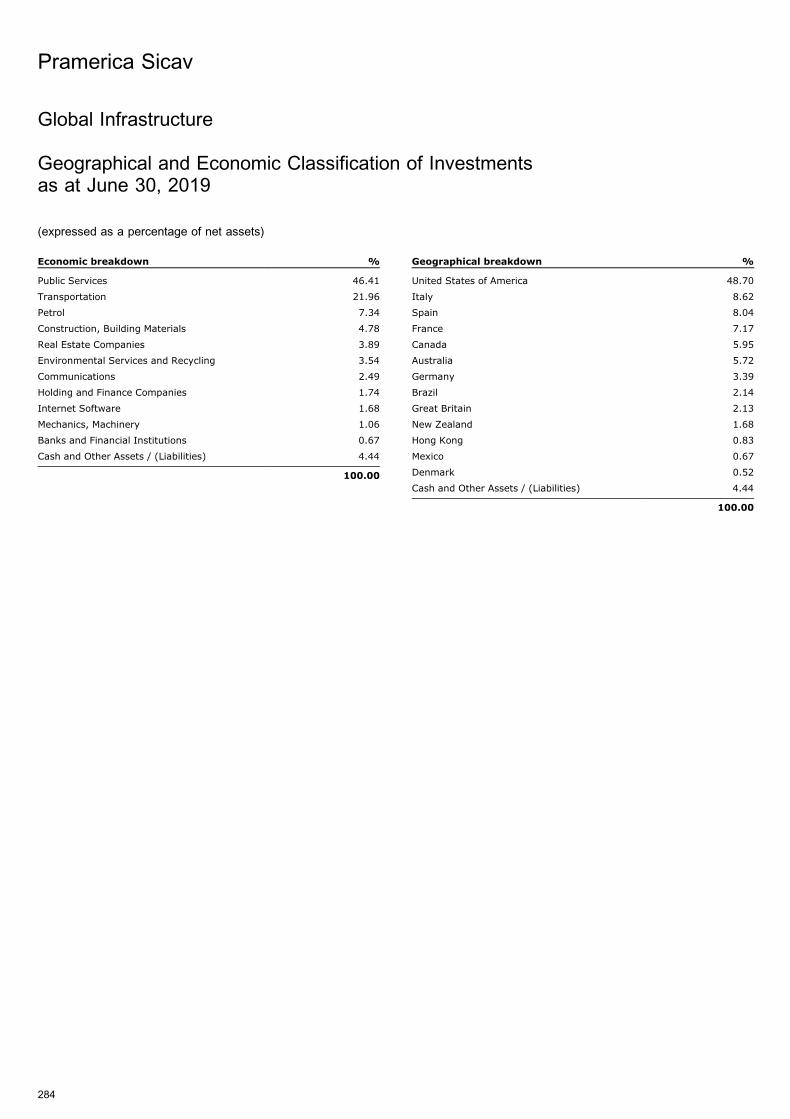
Global Infrastructure
Geographical and Economic Classification of Investmentsas at June 30, 2019
(expressed as a percentage of net assets)
Economic breakdown %
Public Services 46.41
Transportation 21.96
Petrol 7.34
Construction, Building Materials 4.78
Real Estate Companies 3.89
Environmental Services and Recycling 3.54
Communications 2.49
Holding and Finance Companies 1.74
Internet Software 1.68
Mechanics, Machinery 1.06
Banks and Financial Institutions 0.67
Cash and Other Assets / (Liabilities) 4.44
100.00
Geographical breakdown %
United States of America 48.70
Italy 8.62
Spain 8.04
France 7.17
Canada 5.95
Australia 5.72
Germany 3.39
Brazil 2.14
Great Britain 2.13
New Zealand 1.68
Hong Kong 0.83
Mexico 0.67
Denmark 0.52
Cash and Other Assets / (Liabilities) 4.44
100.00
Pramerica Sicav
284
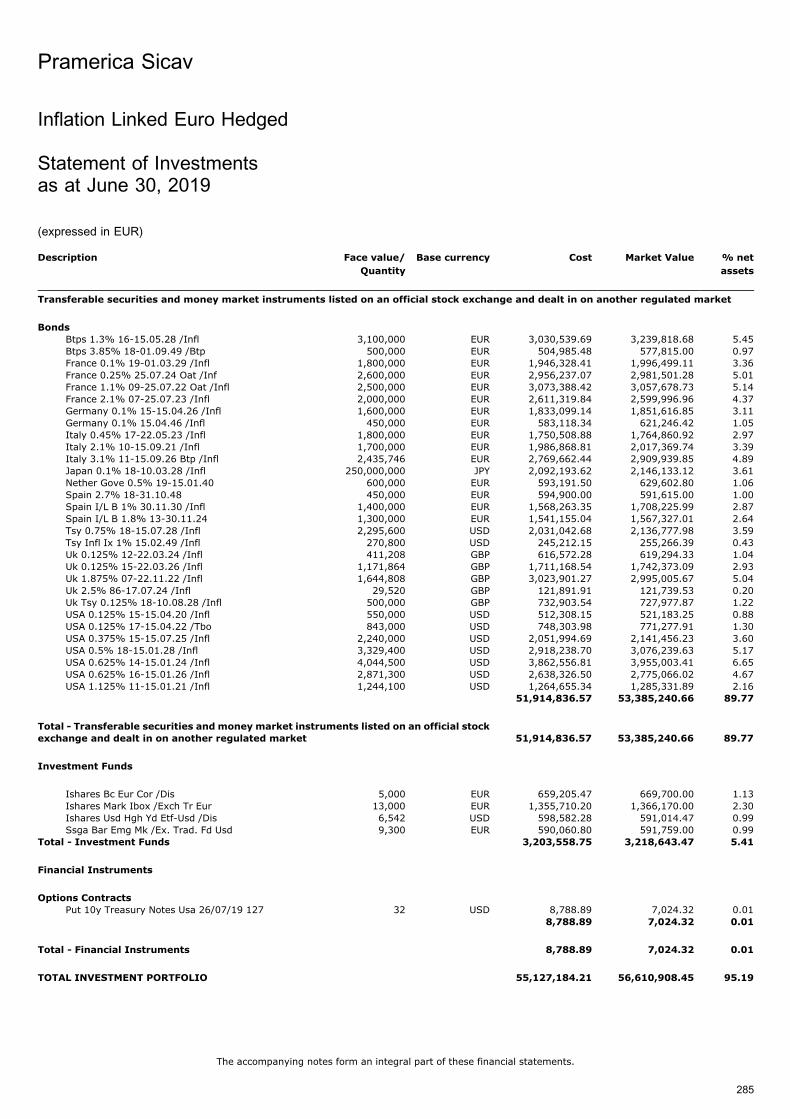
Inflation Linked Euro Hedged
Statement of Investmentsas at June 30, 2019
(expressed in EUR)
Description Face value/
Quantity
Base currency Cost Market Value % net
assets
Transferable securities and money market instruments listed on an official stock exchange and dealt in on another regulated market
Bonds
Btps 1.3% 16-15.05.28 /Infl 3,100,000 EUR 3,030,539.69 3,239,818.68 5.45Btps 3.85% 18-01.09.49 /Btp 500,000 EUR 504,985.48 577,815.00 0.97France 0.1% 19-01.03.29 /Infl 1,800,000 EUR 1,946,328.41 1,996,499.11 3.36France 0.25% 25.07.24 Oat /Inf 2,600,000 EUR 2,956,237.07 2,981,501.28 5.01France 1.1% 09-25.07.22 Oat /Infl 2,500,000 EUR 3,073,388.42 3,057,678.73 5.14France 2.1% 07-25.07.23 /Infl 2,000,000 EUR 2,611,319.84 2,599,996.96 4.37Germany 0.1% 15-15.04.26 /Infl 1,600,000 EUR 1,833,099.14 1,851,616.85 3.11Germany 0.1% 15.04.46 /Infl 450,000 EUR 583,118.34 621,246.42 1.05Italy 0.45% 17-22.05.23 /Infl 1,800,000 EUR 1,750,508.88 1,764,860.92 2.97Italy 2.1% 10-15.09.21 /Infl 1,700,000 EUR 1,986,868.81 2,017,369.74 3.39Italy 3.1% 11-15.09.26 Btp /Infl 2,435,746 EUR 2,769,662.44 2,909,939.85 4.89Japan 0.1% 18-10.03.28 /Infl 250,000,000 JPY 2,092,193.62 2,146,133.12 3.61Nether Gove 0.5% 19-15.01.40 600,000 EUR 593,191.50 629,602.80 1.06Spain 2.7% 18-31.10.48 450,000 EUR 594,900.00 591,615.00 1.00Spain I/L B 1% 30.11.30 /Infl 1,400,000 EUR 1,568,263.35 1,708,225.99 2.87Spain I/L B 1.8% 13-30.11.24 1,300,000 EUR 1,541,155.04 1,567,327.01 2.64Tsy 0.75% 18-15.07.28 /Infl 2,295,600 USD 2,031,042.68 2,136,777.98 3.59Tsy Infl Ix 1% 15.02.49 /Infl 270,800 USD 245,212.15 255,266.39 0.43Uk 0.125% 12-22.03.24 /Infl 411,208 GBP 616,572.28 619,294.33 1.04Uk 0.125% 15-22.03.26 /Infl 1,171,864 GBP 1,711,168.54 1,742,373.09 2.93Uk 1.875% 07-22.11.22 /Infl 1,644,808 GBP 3,023,901.27 2,995,005.67 5.04Uk 2.5% 86-17.07.24 /Infl 29,520 GBP 121,891.91 121,739.53 0.20Uk Tsy 0.125% 18-10.08.28 /Infl 500,000 GBP 732,903.54 727,977.87 1.22USA 0.125% 15-15.04.20 /Infl 550,000 USD 512,308.15 521,183.25 0.88USA 0.125% 17-15.04.22 /Tbo 843,000 USD 748,303.98 771,277.91 1.30USA 0.375% 15-15.07.25 /Infl 2,240,000 USD 2,051,994.69 2,141,456.23 3.60USA 0.5% 18-15.01.28 /Infl 3,329,400 USD 2,918,238.70 3,076,239.63 5.17USA 0.625% 14-15.01.24 /Infl 4,044,500 USD 3,862,556.81 3,955,003.41 6.65USA 0.625% 16-15.01.26 /Infl 2,871,300 USD 2,638,326.50 2,775,066.02 4.67USA 1.125% 11-15.01.21 /Infl 1,244,100 USD 1,264,655.34 1,285,331.89 2.16
51,914,836.57 53,385,240.66 89.77
Total - Transferable securities and money market instruments listed on an official stock
exchange and dealt in on another regulated market 51,914,836.57 53,385,240.66 89.77
Investment Funds
Ishares Bc Eur Cor /Dis 5,000 EUR 659,205.47 669,700.00 1.13Ishares Mark Ibox /Exch Tr Eur 13,000 EUR 1,355,710.20 1,366,170.00 2.30Ishares Usd Hgh Yd Etf-Usd /Dis 6,542 USD 598,582.28 591,014.47 0.99Ssga Bar Emg Mk /Ex. Trad. Fd Usd 9,300 EUR 590,060.80 591,759.00 0.99
Total - Investment Funds 3,203,558.75 3,218,643.47 5.41
Financial Instruments
Options Contracts
Put 10y Treasury Notes Usa 26/07/19 127 32 USD 8,788.89 7,024.32 0.018,788.89 7,024.32 0.01
Total - Financial Instruments 8,788.89 7,024.32 0.01
TOTAL INVESTMENT PORTFOLIO 55,127,184.21 56,610,908.45 95.19
Pramerica Sicav
The accompanying notes form an integral part of these financial statements.
285
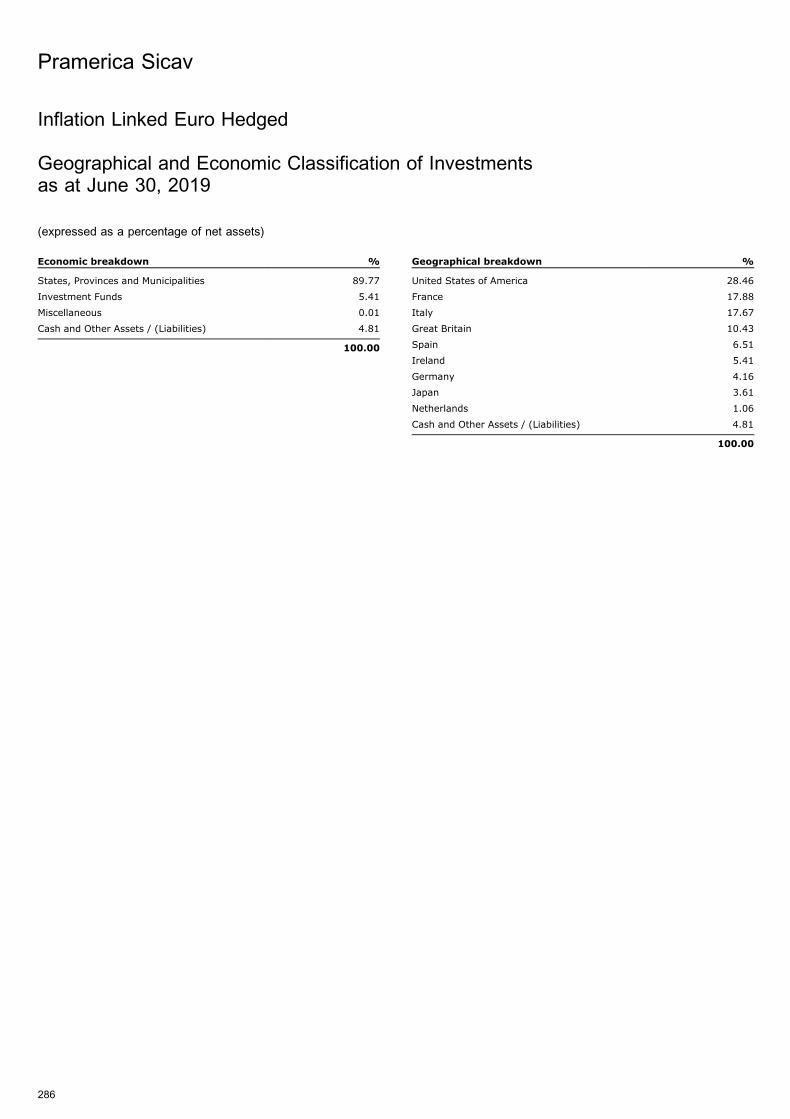
Inflation Linked Euro Hedged
Geographical and Economic Classification of Investmentsas at June 30, 2019
(expressed as a percentage of net assets)
Economic breakdown %
States, Provinces and Municipalities 89.77
Investment Funds 5.41
Miscellaneous 0.01
Cash and Other Assets / (Liabilities) 4.81
100.00
Geographical breakdown %
United States of America 28.46
France 17.88
Italy 17.67
Great Britain 10.43
Spain 6.51
Ireland 5.41
Germany 4.16
Japan 3.61
Netherlands 1.06
Cash and Other Assets / (Liabilities) 4.81
100.00
Pramerica Sicav
286
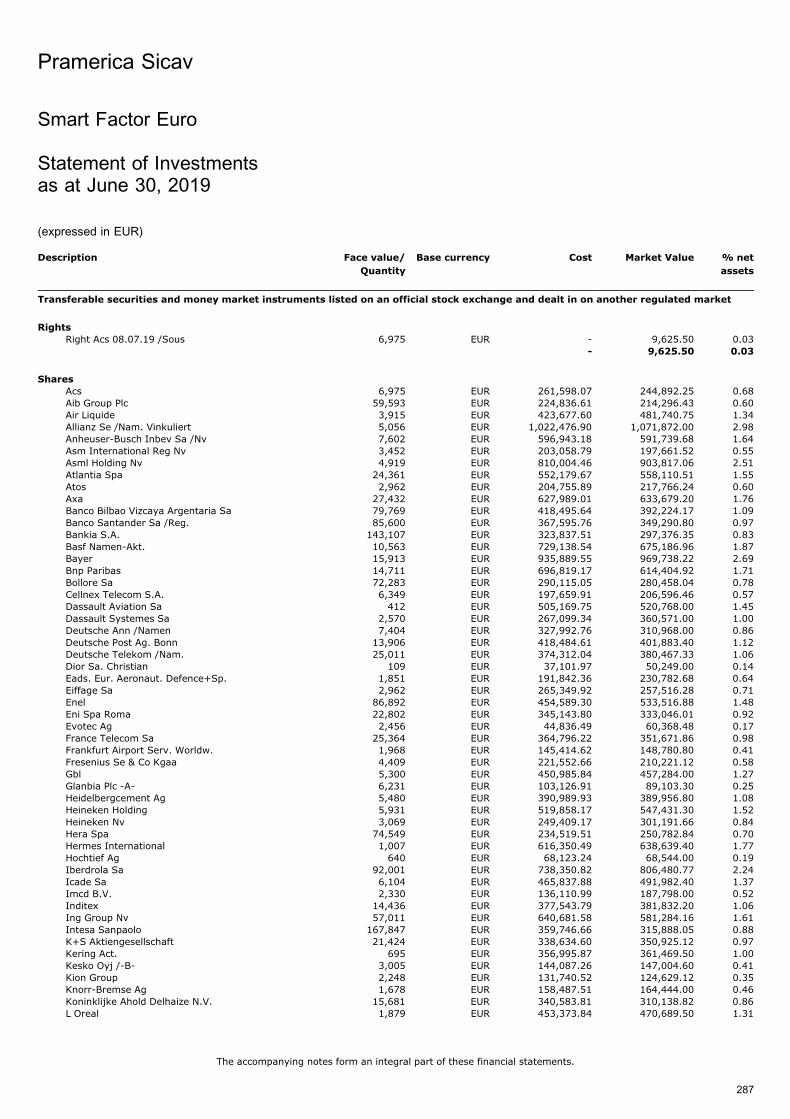
Smart Factor Euro
Statement of Investmentsas at June 30, 2019
(expressed in EUR)
Description Face value/
Quantity
Base currency Cost Market Value % net
assets
Transferable securities and money market instruments listed on an official stock exchange and dealt in on another regulated market
Rights
Right Acs 08.07.19 /Sous 6,975 EUR - 9,625.50 0.03- 9,625.50 0.03
Shares
Acs 6,975 EUR 261,598.07 244,892.25 0.68Aib Group Plc 59,593 EUR 224,836.61 214,296.43 0.60Air Liquide 3,915 EUR 423,677.60 481,740.75 1.34Allianz Se /Nam. Vinkuliert 5,056 EUR 1,022,476.90 1,071,872.00 2.98Anheuser-Busch Inbev Sa /Nv 7,602 EUR 596,943.18 591,739.68 1.64Asm International Reg Nv 3,452 EUR 203,058.79 197,661.52 0.55Asml Holding Nv 4,919 EUR 810,004.46 903,817.06 2.51Atlantia Spa 24,361 EUR 552,179.67 558,110.51 1.55Atos 2,962 EUR 204,755.89 217,766.24 0.60Axa 27,432 EUR 627,989.01 633,679.20 1.76Banco Bilbao Vizcaya Argentaria Sa 79,769 EUR 418,495.64 392,224.17 1.09Banco Santander Sa /Reg. 85,600 EUR 367,595.76 349,290.80 0.97Bankia S.A. 143,107 EUR 323,837.51 297,376.35 0.83Basf Namen-Akt. 10,563 EUR 729,138.54 675,186.96 1.87Bayer 15,913 EUR 935,889.55 969,738.22 2.69Bnp Paribas 14,711 EUR 696,819.17 614,404.92 1.71Bollore Sa 72,283 EUR 290,115.05 280,458.04 0.78Cellnex Telecom S.A. 6,349 EUR 197,659.91 206,596.46 0.57Dassault Aviation Sa 412 EUR 505,169.75 520,768.00 1.45Dassault Systemes Sa 2,570 EUR 267,099.34 360,571.00 1.00Deutsche Ann /Namen 7,404 EUR 327,992.76 310,968.00 0.86Deutsche Post Ag. Bonn 13,906 EUR 418,484.61 401,883.40 1.12Deutsche Telekom /Nam. 25,011 EUR 374,312.04 380,467.33 1.06Dior Sa. Christian 109 EUR 37,101.97 50,249.00 0.14Eads. Eur. Aeronaut. Defence+Sp. 1,851 EUR 191,842.36 230,782.68 0.64Eiffage Sa 2,962 EUR 265,349.92 257,516.28 0.71Enel 86,892 EUR 454,589.30 533,516.88 1.48Eni Spa Roma 22,802 EUR 345,143.80 333,046.01 0.92Evotec Ag 2,456 EUR 44,836.49 60,368.48 0.17France Telecom Sa 25,364 EUR 364,796.22 351,671.86 0.98Frankfurt Airport Serv. Worldw. 1,968 EUR 145,414.62 148,780.80 0.41Fresenius Se & Co Kgaa 4,409 EUR 221,552.66 210,221.12 0.58Gbl 5,300 EUR 450,985.84 457,284.00 1.27Glanbia Plc -A- 6,231 EUR 103,126.91 89,103.30 0.25Heidelbergcement Ag 5,480 EUR 390,989.93 389,956.80 1.08Heineken Holding 5,931 EUR 519,858.17 547,431.30 1.52Heineken Nv 3,069 EUR 249,409.17 301,191.66 0.84Hera Spa 74,549 EUR 234,519.51 250,782.84 0.70Hermes International 1,007 EUR 616,350.49 638,639.40 1.77Hochtief Ag 640 EUR 68,123.24 68,544.00 0.19Iberdrola Sa 92,001 EUR 738,350.82 806,480.77 2.24Icade Sa 6,104 EUR 465,837.88 491,982.40 1.37Imcd B.V. 2,330 EUR 136,110.99 187,798.00 0.52Inditex 14,436 EUR 377,543.79 381,832.20 1.06Ing Group Nv 57,011 EUR 640,681.58 581,284.16 1.61Intesa Sanpaolo 167,847 EUR 359,746.66 315,888.05 0.88K+S Aktiengesellschaft 21,424 EUR 338,634.60 350,925.12 0.97Kering Act. 695 EUR 356,995.87 361,469.50 1.00Kesko Oyj /-B- 3,005 EUR 144,087.26 147,004.60 0.41Kion Group 2,248 EUR 131,740.52 124,629.12 0.35Knorr-Bremse Ag 1,678 EUR 158,487.51 164,444.00 0.46Koninklijke Ahold Delhaize N.V. 15,681 EUR 340,583.81 310,138.82 0.86L Oreal 1,879 EUR 453,373.84 470,689.50 1.31
Pramerica Sicav
The accompanying notes form an integral part of these financial statements.
287
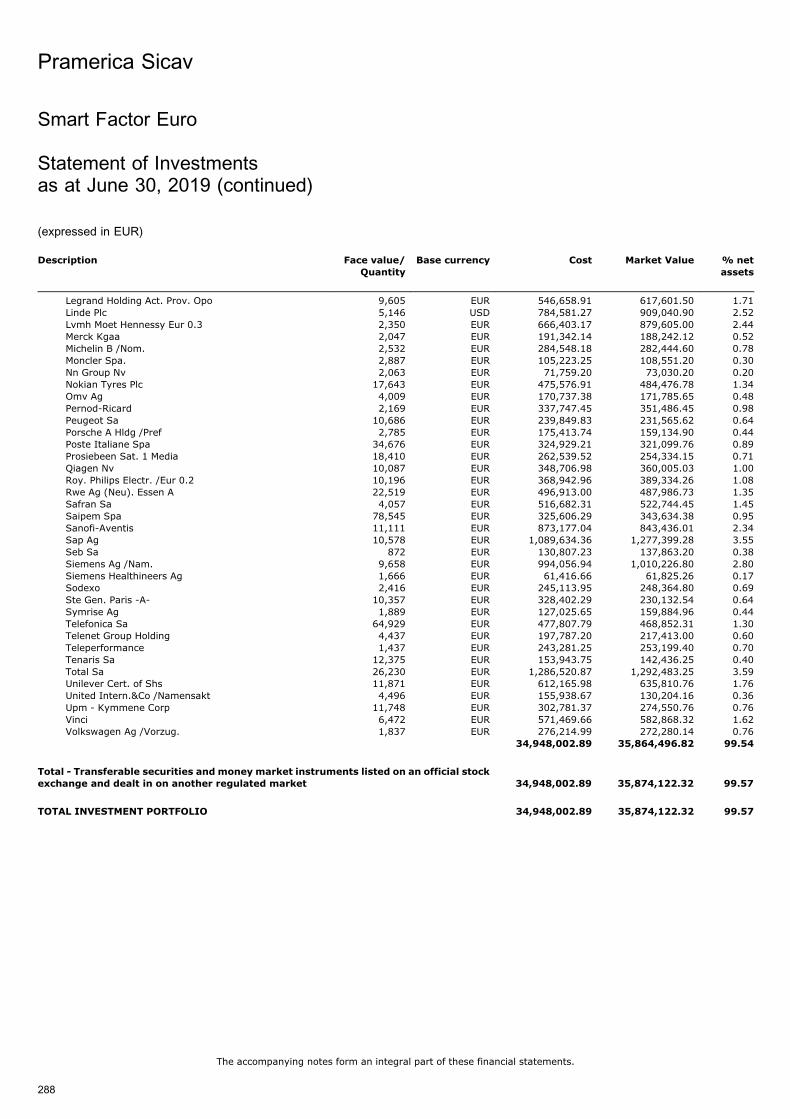
Description Face value/
Quantity
Base currency Cost Market Value % net
assets
Legrand Holding Act. Prov. Opo 9,605 EUR 546,658.91 617,601.50 1.71Linde Plc 5,146 USD 784,581.27 909,040.90 2.52Lvmh Moet Hennessy Eur 0.3 2,350 EUR 666,403.17 879,605.00 2.44Merck Kgaa 2,047 EUR 191,342.14 188,242.12 0.52Michelin B /Nom. 2,532 EUR 284,548.18 282,444.60 0.78Moncler Spa. 2,887 EUR 105,223.25 108,551.20 0.30Nn Group Nv 2,063 EUR 71,759.20 73,030.20 0.20Nokian Tyres Plc 17,643 EUR 475,576.91 484,476.78 1.34Omv Ag 4,009 EUR 170,737.38 171,785.65 0.48Pernod-Ricard 2,169 EUR 337,747.45 351,486.45 0.98Peugeot Sa 10,686 EUR 239,849.83 231,565.62 0.64Porsche A Hldg /Pref 2,785 EUR 175,413.74 159,134.90 0.44Poste Italiane Spa 34,676 EUR 324,929.21 321,099.76 0.89Prosiebeen Sat. 1 Media 18,410 EUR 262,539.52 254,334.15 0.71Qiagen Nv 10,087 EUR 348,706.98 360,005.03 1.00Roy. Philips Electr. /Eur 0.2 10,196 EUR 368,942.96 389,334.26 1.08Rwe Ag (Neu). Essen A 22,519 EUR 496,913.00 487,986.73 1.35Safran Sa 4,057 EUR 516,682.31 522,744.45 1.45Saipem Spa 78,545 EUR 325,606.29 343,634.38 0.95Sanofi-Aventis 11,111 EUR 873,177.04 843,436.01 2.34Sap Ag 10,578 EUR 1,089,634.36 1,277,399.28 3.55Seb Sa 872 EUR 130,807.23 137,863.20 0.38Siemens Ag /Nam. 9,658 EUR 994,056.94 1,010,226.80 2.80Siemens Healthineers Ag 1,666 EUR 61,416.66 61,825.26 0.17Sodexo 2,416 EUR 245,113.95 248,364.80 0.69Ste Gen. Paris -A- 10,357 EUR 328,402.29 230,132.54 0.64Symrise Ag 1,889 EUR 127,025.65 159,884.96 0.44Telefonica Sa 64,929 EUR 477,807.79 468,852.31 1.30Telenet Group Holding 4,437 EUR 197,787.20 217,413.00 0.60Teleperformance 1,437 EUR 243,281.25 253,199.40 0.70Tenaris Sa 12,375 EUR 153,943.75 142,436.25 0.40Total Sa 26,230 EUR 1,286,520.87 1,292,483.25 3.59Unilever Cert. of Shs 11,871 EUR 612,165.98 635,810.76 1.76United Intern.&Co /Namensakt 4,496 EUR 155,938.67 130,204.16 0.36Upm - Kymmene Corp 11,748 EUR 302,781.37 274,550.76 0.76Vinci 6,472 EUR 571,469.66 582,868.32 1.62Volkswagen Ag /Vorzug. 1,837 EUR 276,214.99 272,280.14 0.76
34,948,002.89 35,864,496.82 99.54
Total - Transferable securities and money market instruments listed on an official stockexchange and dealt in on another regulated market 34,948,002.89 35,874,122.32 99.57
TOTAL INVESTMENT PORTFOLIO 34,948,002.89 35,874,122.32 99.57
Pramerica Sicav
The accompanying notes form an integral part of these financial statements.
288
Smart Factor Euro
Statement of Investmentsas at June 30, 2019 (continued)
(expressed in EUR)
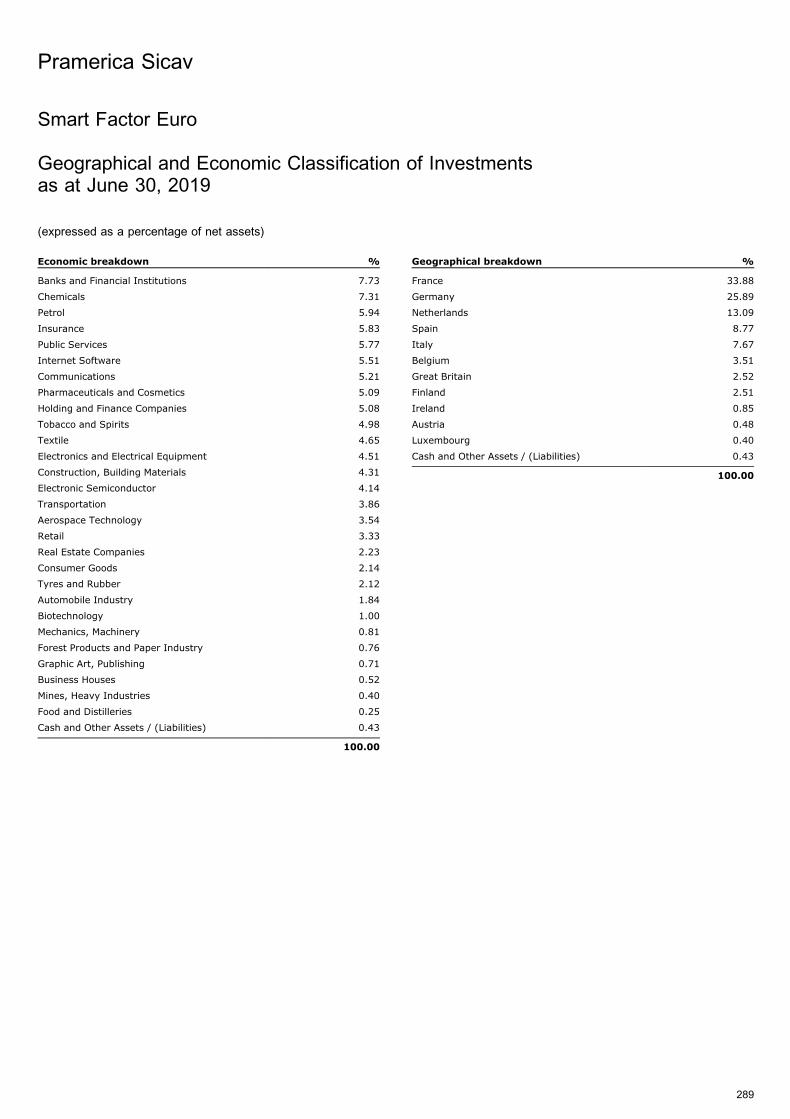
Smart Factor Euro
Geographical and Economic Classification of Investmentsas at June 30, 2019
(expressed as a percentage of net assets)
Economic breakdown %
Banks and Financial Institutions 7.73
Chemicals 7.31
Petrol 5.94
Insurance 5.83
Public Services 5.77
Internet Software 5.51
Communications 5.21
Pharmaceuticals and Cosmetics 5.09
Holding and Finance Companies 5.08
Tobacco and Spirits 4.98
Textile 4.65
Electronics and Electrical Equipment 4.51
Construction, Building Materials 4.31
Electronic Semiconductor 4.14
Transportation 3.86
Aerospace Technology 3.54
Retail 3.33
Real Estate Companies 2.23
Consumer Goods 2.14
Tyres and Rubber 2.12
Automobile Industry 1.84
Biotechnology 1.00
Mechanics, Machinery 0.81
Forest Products and Paper Industry 0.76
Graphic Art, Publishing 0.71
Business Houses 0.52
Mines, Heavy Industries 0.40
Food and Distilleries 0.25
Cash and Other Assets / (Liabilities) 0.43
100.00
Geographical breakdown %
France 33.88
Germany 25.89
Netherlands 13.09
Spain 8.77
Italy 7.67
Belgium 3.51
Great Britain 2.52
Finland 2.51
Ireland 0.85
Austria 0.48
Luxembourg 0.40
Cash and Other Assets / (Liabilities) 0.43
100.00
Pramerica Sicav
289
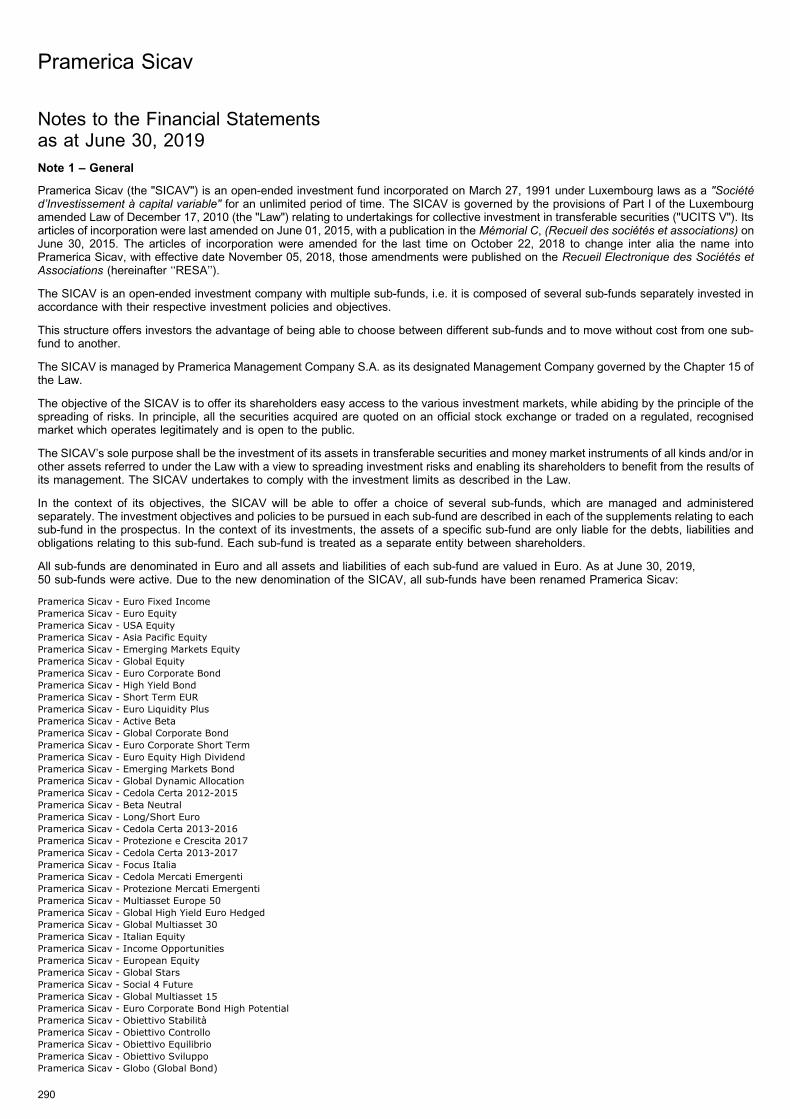
Notes to the Financial Statementsas at June 30, 2019
Note 1 – General
Pramerica Sicav (the "SICAV") is an open-ended investment fund incorporated on March 27, 1991 under Luxembourg laws as a "Societed’Investissement a capital variable" for an unlimited period of time. The SICAV is governed by the provisions of Part I of the Luxembourgamended Law of December 17, 2010 (the "Law") relating to undertakings for collective investment in transferable securities ("UCITS V"). Itsarticles of incorporation were last amended on June 01, 2015, with a publication in the Memorial C, (Recueil des societes et associations) onJune 30, 2015. The articles of incorporation were amended for the last time on October 22, 2018 to change inter alia the name intoPramerica Sicav, with effective date November 05, 2018, those amendments were published on the Recueil Electronique des Societes etAssociations (hereinafter ‘‘RESA’’).
The SICAV is an open-ended investment company with multiple sub-funds, i.e. it is composed of several sub-funds separately invested inaccordance with their respective investment policies and objectives.
This structure offers investors the advantage of being able to choose between different sub-funds and to move without cost from one sub-fund to another.
The SICAV is managed by Pramerica Management Company S.A. as its designated Management Company governed by the Chapter 15 ofthe Law.
The objective of the SICAV is to offer its shareholders easy access to the various investment markets, while abiding by the principle of thespreading of risks. In principle, all the securities acquired are quoted on an official stock exchange or traded on a regulated, recognisedmarket which operates legitimately and is open to the public.
The SICAV’s sole purpose shall be the investment of its assets in transferable securities and money market instruments of all kinds and/or inother assets referred to under the Law with a view to spreading investment risks and enabling its shareholders to benefit from the results ofits management. The SICAV undertakes to comply with the investment limits as described in the Law.
In the context of its objectives, the SICAV will be able to offer a choice of several sub-funds, which are managed and administeredseparately. The investment objectives and policies to be pursued in each sub-fund are described in each of the supplements relating to eachsub-fund in the prospectus. In the context of its investments, the assets of a specific sub-fund are only liable for the debts, liabilities andobligations relating to this sub-fund. Each sub-fund is treated as a separate entity between shareholders.
All sub-funds are denominated in Euro and all assets and liabilities of each sub-fund are valued in Euro. As at June 30, 2019,50 sub-funds were active. Due to the new denomination of the SICAV, all sub-funds have been renamed Pramerica Sicav:
Pramerica Sicav - Euro Fixed IncomePramerica Sicav - Euro EquityPramerica Sicav - USA EquityPramerica Sicav - Asia Pacific EquityPramerica Sicav - Emerging Markets EquityPramerica Sicav - Global EquityPramerica Sicav - Euro Corporate BondPramerica Sicav - High Yield BondPramerica Sicav - Short Term EURPramerica Sicav - Euro Liquidity PlusPramerica Sicav - Active BetaPramerica Sicav - Global Corporate BondPramerica Sicav - Euro Corporate Short TermPramerica Sicav - Euro Equity High DividendPramerica Sicav - Emerging Markets BondPramerica Sicav - Global Dynamic AllocationPramerica Sicav - Cedola Certa 2012-2015Pramerica Sicav - Beta NeutralPramerica Sicav - Long/Short EuroPramerica Sicav - Cedola Certa 2013-2016Pramerica Sicav - Protezione e Crescita 2017Pramerica Sicav - Cedola Certa 2013-2017Pramerica Sicav - Focus ItaliaPramerica Sicav - Cedola Mercati EmergentiPramerica Sicav - Protezione Mercati EmergentiPramerica Sicav - Multiasset Europe 50Pramerica Sicav - Global High Yield Euro HedgedPramerica Sicav - Global Multiasset 30Pramerica Sicav - Italian EquityPramerica Sicav - Income OpportunitiesPramerica Sicav - European EquityPramerica Sicav - Global StarsPramerica Sicav - Social 4 FuturePramerica Sicav - Global Multiasset 15Pramerica Sicav - Euro Corporate Bond High PotentialPramerica Sicav - Obiettivo StabilitaPramerica Sicav - Obiettivo ControlloPramerica Sicav - Obiettivo EquilibrioPramerica Sicav - Obiettivo SviluppoPramerica Sicav - Globo (Global Bond)
Pramerica Sicav
290
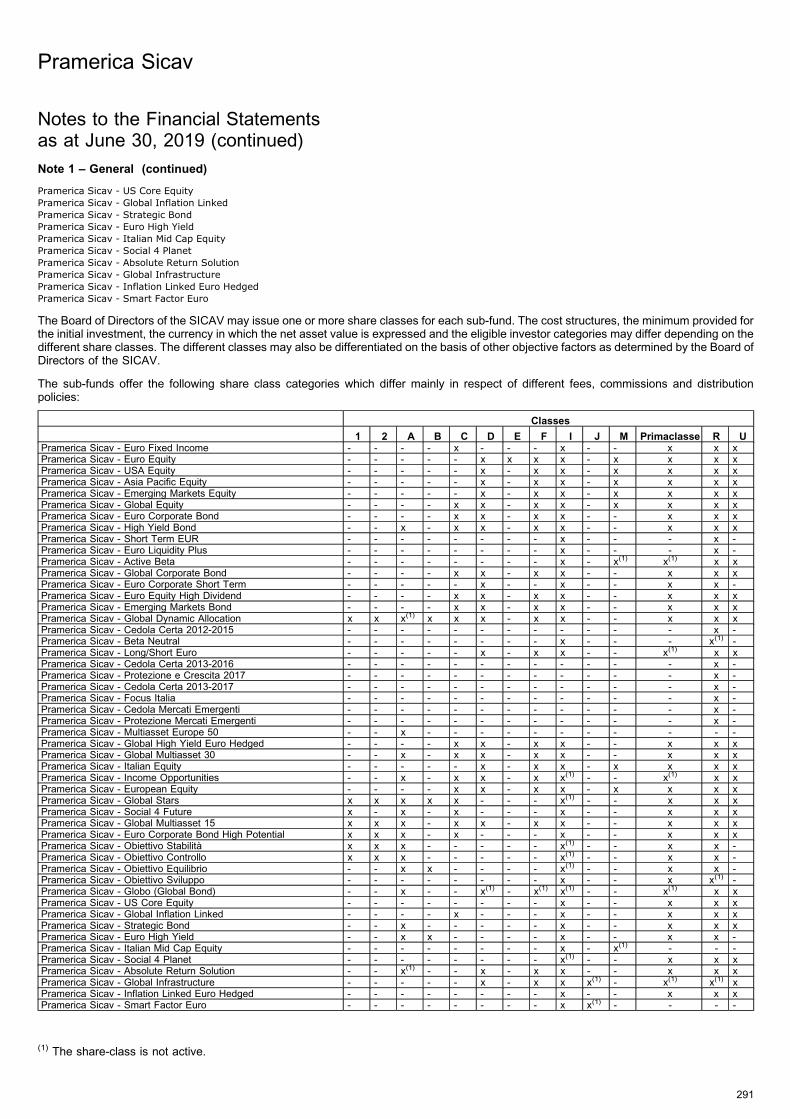
Note 1 – General (continued)
Pramerica Sicav - US Core EquityPramerica Sicav - Global Inflation LinkedPramerica Sicav - Strategic BondPramerica Sicav - Euro High YieldPramerica Sicav - Italian Mid Cap EquityPramerica Sicav - Social 4 PlanetPramerica Sicav - Absolute Return SolutionPramerica Sicav - Global InfrastructurePramerica Sicav - Inflation Linked Euro HedgedPramerica Sicav - Smart Factor Euro
The Board of Directors of the SICAV may issue one or more share classes for each sub-fund. The cost structures, the minimum provided forthe initial investment, the currency in which the net asset value is expressed and the eligible investor categories may differ depending on thedifferent share classes. The different classes may also be differentiated on the basis of other objective factors as determined by the Board ofDirectors of the SICAV.
The sub-funds offer the following share class categories which differ mainly in respect of different fees, commissions and distributionpolicies:
Classes
1 2 A B C D E F I J M Primaclasse R UPramerica Sicav - Euro Fixed Income - - - - x - - - x - - x x xPramerica Sicav - Euro Equity - - - - - x x x x - x x x xPramerica Sicav - USA Equity - - - - - x - x x - x x x xPramerica Sicav - Asia Pacific Equity - - - - - x - x x - x x x xPramerica Sicav - Emerging Markets Equity - - - - - x - x x - x x x xPramerica Sicav - Global Equity - - - - x x - x x - x x x xPramerica Sicav - Euro Corporate Bond - - - - x x - x x - - x x xPramerica Sicav - High Yield Bond - - x - x x - x x - - x x xPramerica Sicav - Short Term EUR - - - - - - - - x - - - x -Pramerica Sicav - Euro Liquidity Plus - - - - - - - - x - - - x -Pramerica Sicav - Active Beta - - - - - - - - x - x(1) x(1) x xPramerica Sicav - Global Corporate Bond - - - - x x - x x - - x x xPramerica Sicav - Euro Corporate Short Term - - - - - x - - x - - x x -Pramerica Sicav - Euro Equity High Dividend - - - - x x - x x - - x x xPramerica Sicav - Emerging Markets Bond - - - - x x - x x - - x x xPramerica Sicav - Global Dynamic Allocation x x x(1) x x x - x x - - x x xPramerica Sicav - Cedola Certa 2012-2015 - - - - - - - - - - - - x -Pramerica Sicav - Beta Neutral - - - - - - - - x - - - x(1) -Pramerica Sicav - Long/Short Euro - - - - - x - x x - - x(1) x xPramerica Sicav - Cedola Certa 2013-2016 - - - - - - - - - - - - x -Pramerica Sicav - Protezione e Crescita 2017 - - - - - - - - - - - - x -Pramerica Sicav - Cedola Certa 2013-2017 - - - - - - - - - - - - x -Pramerica Sicav - Focus Italia - - - - - - - - - - - - x -Pramerica Sicav - Cedola Mercati Emergenti - - - - - - - - - - - - x -Pramerica Sicav - Protezione Mercati Emergenti - - - - - - - - - - - - x -Pramerica Sicav - Multiasset Europe 50 - - x - - - - - - - - - - -Pramerica Sicav - Global High Yield Euro Hedged - - - - x x - x x - - x x xPramerica Sicav - Global Multiasset 30 - - x - x x - x x - - x x xPramerica Sicav - Italian Equity - - - - - x - x x - x x x xPramerica Sicav - Income Opportunities - - x - x x - x x(1) - - x(1) x xPramerica Sicav - European Equity - - - - x x - x x - x x x xPramerica Sicav - Global Stars x x x x x - - - x(1) - - x x xPramerica Sicav - Social 4 Future x - x - x - - - x - - x x xPramerica Sicav - Global Multiasset 15 x x x - x x - x x - - x x xPramerica Sicav - Euro Corporate Bond High Potential x x x - x - - - x - - x x xPramerica Sicav - Obiettivo Stabilita x x x - - - - - x(1) - - x x -Pramerica Sicav - Obiettivo Controllo x x x - - - - - x(1) - - x x -Pramerica Sicav - Obiettivo Equilibrio - - x x - - - - x(1) - - x x -Pramerica Sicav - Obiettivo Sviluppo - - - - - - - - x - - x x(1) -Pramerica Sicav - Globo (Global Bond) - - x - - x(1) - x(1) x(1) - - x(1) x xPramerica Sicav - US Core Equity - - - - - - - - x - - x x xPramerica Sicav - Global Inflation Linked - - - - x - - - x - - x x xPramerica Sicav - Strategic Bond - - x - - - - - x - - x x xPramerica Sicav - Euro High Yield - - x x - - - - x - - x x -Pramerica Sicav - Italian Mid Cap Equity - - - - - - - - x - x(1) - - -Pramerica Sicav - Social 4 Planet - - - - - - - - x(1) - - x x xPramerica Sicav - Absolute Return Solution - - x(1) - - x - x x - - x x xPramerica Sicav - Global Infrastructure - - - - - x - x x x(1) - x(1) x(1) xPramerica Sicav - Inflation Linked Euro Hedged - - - - - - - - x - - x x xPramerica Sicav - Smart Factor Euro - - - - - - - - x x(1) - - - -
Pramerica Sicav
291
Notes to the Financial Statementsas at June 30, 2019 (continued)
(1) The share-class is not active.
The groups of Shares Classes being available are as follows:
- Retail and Institutional investors- Institutional investors- Class ‘‘I’’ shares intended to Institutional investors and Class ‘‘M’’ shares that are intended to feeder undertakings for collective investmentin transferable securities (UCITS) of the sub-fund as approved and designated by the Board of Directors of the SICAV
The investment objectives and policies to be pursued in each sub-fund and the specificities of each class offered are described in each of thesupplements relating to each sub-fund in the current prospectus.
The current prospectus and the key investor information document (KIID) are available free of charge on request from the SICAV’sregistered office.
Note 2 – Significant Accounting Policies
a) Presentation of the financial statements
The financial statements are prepared in accordance with Luxembourg legal and regulatory requirements relating to undertakings forcollective investment in transferable securities and with generally accepted accounting principles. The financial statements reflect the NetAsset Value as calculated on June 30, 2019 based on latest available market prices of the investment.
The figures of each Sub-Fund are presented in EUR that is the base currency for all of them, the combined financial statements arepresented for information purposes only. The combined statement of the SICAV’s net assets and the combined statement of changes in netassets are the sum of the statement of net assets, the statement of changes in net assets of each sub-fund converted into the currency of theSICAV using exchange rates prevailing at the closing date.
All cross sub-fund investment related amounts have not been eliminated from the calculation of the combined figures. As at June 30, 2019the total cross-fund investment amounted to EUR 438,622,495.94 and therefore the total combined Net Asset at period end without crosssub-fund investments would have been EUR 19,707,021,620.03 (See Note 15).
b) Investments in securities and money market instruments
The value of all portfolio securities and money market instruments or listed derivatives that are listed on an official stock exchange or tradedon any other regulated market are based on the last available price on the principal market on which such securities or money marketinstruments are traded, as furnished by a recognised pricing service approved by the Board of Directors of the SICAV. If such prices are notrepresentative of the fair value, such securities, money market instruments or derivatives as well as other permitted assets, the value of suchsecurities and money market instruments or listed derivatives is defined by the Board of Directors of the SICAV based on the reasonablyforeseeable sale proceeds determined prudently and in good faith.
The value of securities and money market instruments which are not quoted or dealt in on any regulated market are based on the lastavailable price, unless such price is not representative of their true value; in this case, they may be valued at a fair value at which it isexpected that they may be resold, as determined prudently and in good faith by and under the direction of the Board of Directors of theSICAV.
The value of the investment in investment funds shall be based on the last available valuation. Generally, investment in investment funds willbe valued in accordance with the methods described in the instruments governing such investment funds. These valuations shall normally beprovided by the fund administrator or valuation agent of an investment fund. To ensure consistency within the valuation of each sub-fund, ifthe time at which the valuation of an investment fund was calculated does not coincide with the valuation time of any sub-fund, and suchvaluation is determined to have changed materially since it was calculated, then the Net Asset Value may be adjusted to reflect thesechanges as determined in good faith by and under the direction of the Board of Directors of the SICAV.
The value of an investment represented by a undertakings for collective investment/UCITS in which the SICAV invests may be affected byfluctuations in the currency of the country where such UCI/UCITSs invests, or by foreign exchange rules, the application of various tax lawsof the relevant countries, including withholding taxes, government changes or variations of the monetary and economic policy of the relevantcountries. Furthermore, it is to be noted that the Net Asset Value per Share will fluctuate mainly in light of the net asset value of the targetedUCIs/UCITSs. Investments in other investment funds may for the investor result in a duplication of management fees and other operatingfund related expenses.
c) Valuation of other assets
The value of any cash in hand or on deposits, discount notes, bills and demand notes and accounts receivable, prepaid expenses, cashdividends and interest declared or accrued as aforesaid and not yet received, are deemed the full amount thereof, unless in any case thesame is unlikely to be paid or received in full, in which case the value thereof are arrived at after making such discount as the Board ofDirectors of the SICAV may consider appropriate in such case to reflect the true value thereof.
Pramerica Sicav
292
Notes to the Financial Statementsas at June 30, 2019 (continued)
Note 1 – General (continued)
Note 2 – Significant Accounting Policies (continued)
d) Valuation of derivatives
- Swaps Transactions
The SICAV may enter into Interest Rate Swaps (IRS), Credit Default Swaps (CDS) and Total Return Swaps (TRS). Interest Rate Swaps arevalued on the basis of their market value established by reference to the applicable interest rate curve. Credit Default Swaps are valued byreference to the net present value of the expected future cash flows based on the market interest rates and the markets expected default andrecovery rate of the underlying asset. Total Return Swaps are valued by reference to the mark to market value based on the market value ofthe underlying asset. The estimated market value is based on the valuation elements laid down in the contracts, and is obtained from thirdparties pricing agents, market makers or internal models. The net realised profit/(loss) and change in net unrealised appreciation/(depreciation) arising on swap contracts are recorded in the Statement of Operations and Changes in Net Assets. The unrealised profit/(loss)on swap contracts are disclosed in the statement of net assets under «Unrealised profit/(loss) on swaps contracts».
- Swaptions
The value of a swaption is determined by a comparison between the discounted future flows on the value of the annual premium paid by theprotection buyer, and the current value of the expected losses on the reference asset if credit events specified in the swap contract shouldoccur. The change in net unrealised appreciation/(depreciation) arising on swaptions transactions is recorded in the Statement of Operationsand Changes in Net Assets.
- Options contracts
Outstanding options traded on a regulated market are valued at the last available market price on the valuation date. Over-the-counter (OTC)options are valued based on prices received from third party pricing agents or internal model. The net realised profit/(loss) and change in netunrealised appreciation/(depreciation) arising at the time of reporting from the valuation of options trades are taken into account in theStatement of Operations and Changes in Net Assets.
e) Valuation of forward foreign exchange contracts
Unrealised profit/(loss) resulting from outstanding forward foreign exchange contracts is determined on the valuation date on the basis of theforward rates applicable on that date and is recorded net in the Statement of Net Assets. The net realised profit/(loss) and change in netunrealised appreciation/(depreciation) is recorded in the Statement of Operations and Changes in Net Assets. The unrealised profit/(loss) onforward foreign exchange contracts are disclosed in the statement of net assets under «Unrealised profit/(loss) on forward foreign exchangecontracts».
f) Valuation of futures contracts
Futures contracts are valued using quoted daily settlement prices established by the stock exchange on which they are traded. The SICAVand the broker agree to exchange an amount of cash equal to the daily fluctuations in the value of the futures contract (the ‘‘variationmargin’’). For open futures contracts, changes in the value of the contract are recognised as net unrealised profit/(loss) are recorded in theStatement of Net Assets. When the contract is closed, the difference between the proceeds (or cost) of the closing transactions and theoriginal transaction is recorded as a net realised profit or loss and change in net unrealised appreciation/(depreciation) in the Statement ofOperations and Changes in Net Assets.
g) Dividend and interest income
Dividends are shown net of withholding tax deducted at source, and are recorded as income on the ex-dividend date. Interest income isaccrued on a daily basis.
h) Contract for Differences
At each valuation date the difference between the opening price and the current market price of the underlying security to the contract ofdifference is recorded as net unrealised profit/(loss) contracts for difference in Statement of Net Assets. When the sub-fund enters a closingtransaction, the difference between the opening notional amount and the closing notional amount of the underlying security is recorded as anet realised profit/(loss) and change in net unrealised appreciation/(depreciation) in the Statement of Operations and Changes in Net Assets.
i) Foreign currency translation for each sub-fund
The accounts are maintained in EUR and the financial statements are expressed in that currency. Assets and liabilities expressed incurrencies other than the sub-fund’s currency are translated into the sub-fund’s currency at the exchange rates applicable as at period end.Income and expenses in currencies other than the sub-fund’s currency are translated into the sub-fund’s currency at the exchange ratesapplicable at the transaction date.
Applicable exchange rates used as at June 30, 2019 are:
EUR 1 = AED 4.183702 EUR 1 = GBP 0.895000 EUR 1 = PLN 4.247297
EUR 1 = ARS 48.274839 EUR 1 = HKD 8.898004 EUR 1 = QAR 4.147895
EUR 1 = AUD 1.623299 EUR 1 = HUF 322.850404 EUR 1 = RON 4.730791
EUR 1 = BRL 4.366194 EUR 1 = IDR 16,092.977250 EUR 1 = RUB 71.859423
Pramerica Sicav
293
Notes to the Financial Statementsas at June 30, 2019 (continued)
Note 2 – Significant Accounting Policies (continued)
i) Foreign currency translation for each sub-fund (continued)
EUR 1 = CAD 1.488400 EUR 1 = ILS 4.062799 EUR 1 = SEK 10.566797
EUR 1 = CHF 1.110500 EUR 1 = INR 78.626165 EUR 1 = SGD 1.541299
EUR 1 = CLP 773.709239 EUR 1 = JPY 122.727880 EUR 1 = THB 34.930225
EUR 1 = CNH 7.827976 EUR 1 = KRW 1,315.127021 EUR 1 = TRY 6.593108
EUR 1 = CNY 7.822277 EUR 1 = MXN 21.881725 EUR 1 = TWD 35.377256
EUR 1 = COP 3,650.320513 EUR 1 = MYR 4.709409 EUR 1 = UAH 29.804773
EUR 1 = CZK 25.449142 EUR 1 = NOK 9.711031 EUR 1 = USD 1.138900
EUR 1 = DKK 7.463792 EUR 1 = NZD 1.696301 EUR 1 = UYU 40.191269
EUR 1 = DOP 57.560902 EUR 1 = PEN 3.747306 EUR 1 = ZAR 16.063923
EUR 1 = EGP 19.053753 EUR 1 = PHP 58.357245
j) Net realised profit/(loss) on sale of investments
Investments in securities are accounted for on a trade date basis. Net realised profit/(loss) on sale of investments in securities are based onthe average cost basis. The net realised profit/(loss) and change in net unrealised appreciation/(depreciation) on investments are recorded inthe Statement of Operations and Changes in Net Assets.
k) Valuation of securities lending
The SICAV may lend securities included in its portfolio to a borrower through a third party broker; the assets continue to be valued as part ofthe portfolio of the SICAV. If the prices of securities lent are not representative of their fair value, all such securities will be valued at their fairvalue at which it is expected they may be resold as determined in good faith by or under the direction of the Board of Directors of the SICAV.Securities lending generates additional income for the SICAV according to the contracts; the remuneration is recorded as "Income fromsecurities lending" in the Statement of Operations and Changes in Net Assets.
l) Unrealised capital gain tax on investments
Accrued at each NAV calculation, a capital gain tax on Indian and Thai securities is payable when selling a stock with a profit.
The currencies used to calculate the tax are Indian Rupee (INR) and Thai Baht (THB). The capital gain tax calculation is as follows:Tax% * (Market Value in security currency - Book cost in security currency) * Exchange rate of the day
The change in net unrealised appreciation/(depreciation) on unrealised capital gain tax is recorded in the Statement of Operations andChanges in Net Assets.
m) Start-up fees
On the first valuation day of the following sub-funds a start-up fee was charged to their shareholders as follows:
Pramerica Sicav - High Yield Bond 2.60% (applicable to Class A shares only) starting 09/04/2013
Pramerica Sicav - Global Dynamic Allocation 3.00% (applicable to Class A shares and B shares)2.60% (applicable to Class 1 shares and Class 2 shares)
starting 15/01/2013
Pramerica Sicav - Protezione Mercati Emergenti 3.00% starting 21/05/2013
Pramerica Sicav - Multiasset Europe 50 2.70% starting 22/10/2013
Pramerica Sicav - Global Multiasset 30 2.90% (applicable to Class A shares only) starting 04/02/2015
Pramerica Sicav - Income Opportunities 2.60% (applicable to Class A shares only) starting 22/07/2015
Pramerica Sicav - Global Stars 2.90% (applicable to Class A shares, Class 1 shares,Class 2 shares and Class B shares)
starting 03/02/2016
Pramerica Sicav - Social 4 Future 2.50% (applicable to Class A shares andClass 1 shares)
starting 03/02/2016
Pramerica Sicav - Global Multiasset 15 2.90% (applicable to Class A shares, Class 1 sharesand Class 2 shares)
starting 04/05/2016
Pramerica Sicav - Euro Corporate Bond High Potential 2.90% (applicable to Class A shares)2.60% (applicable to Class 1 shares and Class 2 shares)
starting 04/05/2016
Pramerica Sicav - Obiettivo Stabilita 2.60% (applicable to Class A shares, Class 1 sharesand Class 2 shares)
starting 26/10/2016
Pramerica Sicav - Obiettivo Controllo 2.60% (applicable to Class A shares, Class 1 sharesand Class 2 shares only)
starting 26/10/2016
Pramerica Sicav
294
Notes to the Financial Statementsas at June 30, 2019 (continued)
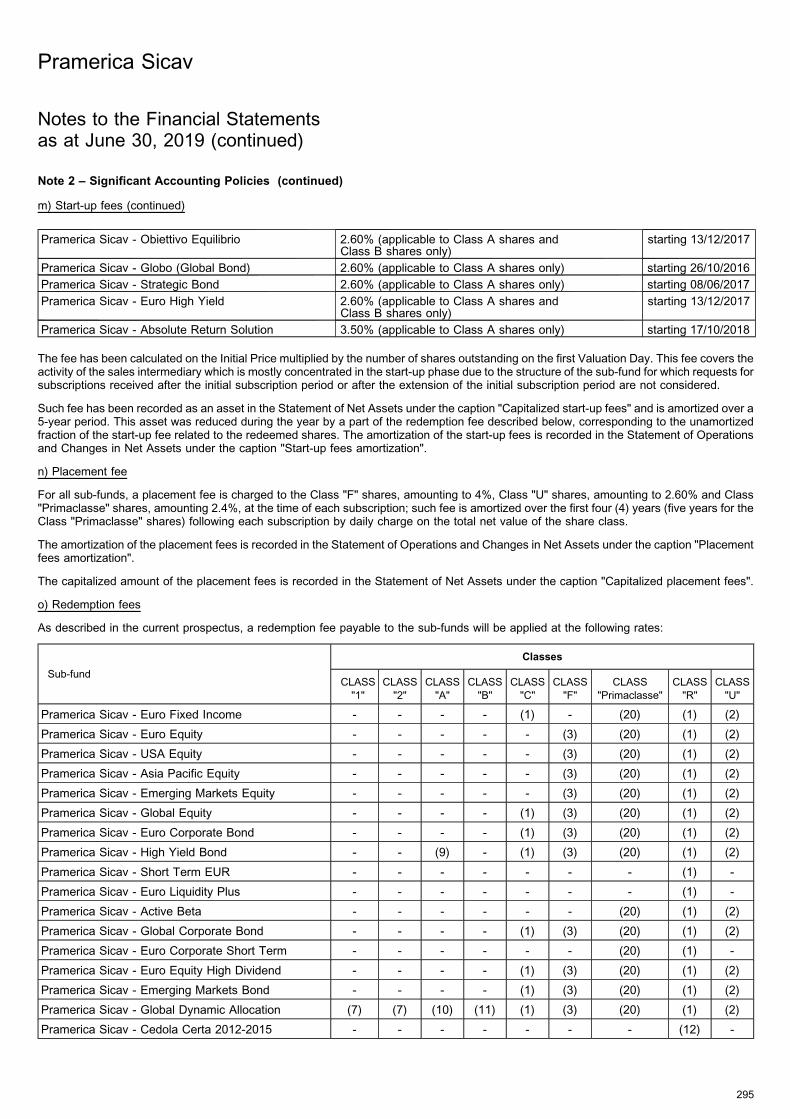
Note 2 – Significant Accounting Policies (continued)
m) Start-up fees (continued)
Pramerica Sicav - Obiettivo Equilibrio 2.60% (applicable to Class A shares andClass B shares only)
starting 13/12/2017
Pramerica Sicav - Globo (Global Bond) 2.60% (applicable to Class A shares only) starting 26/10/2016
Pramerica Sicav - Strategic Bond 2.60% (applicable to Class A shares only) starting 08/06/2017
Pramerica Sicav - Euro High Yield 2.60% (applicable to Class A shares andClass B shares only)
starting 13/12/2017
Pramerica Sicav - Absolute Return Solution 3.50% (applicable to Class A shares only) starting 17/10/2018
The fee has been calculated on the Initial Price multiplied by the number of shares outstanding on the first Valuation Day. This fee covers theactivity of the sales intermediary which is mostly concentrated in the start-up phase due to the structure of the sub-fund for which requests forsubscriptions received after the initial subscription period or after the extension of the initial subscription period are not considered.
Such fee has been recorded as an asset in the Statement of Net Assets under the caption "Capitalized start-up fees" and is amortized over a5-year period. This asset was reduced during the year by a part of the redemption fee described below, corresponding to the unamortizedfraction of the start-up fee related to the redeemed shares. The amortization of the start-up fees is recorded in the Statement of Operationsand Changes in Net Assets under the caption "Start-up fees amortization".
n) Placement fee
For all sub-funds, a placement fee is charged to the Class "F" shares, amounting to 4%, Class "U" shares, amounting to 2.60% and Class"Primaclasse" shares, amounting 2.4%, at the time of each subscription; such fee is amortized over the first four (4) years (five years for theClass "Primaclasse" shares) following each subscription by daily charge on the total net value of the share class.
The amortization of the placement fees is recorded in the Statement of Operations and Changes in Net Assets under the caption "Placementfees amortization".
The capitalized amount of the placement fees is recorded in the Statement of Net Assets under the caption "Capitalized placement fees".
o) Redemption fees
As described in the current prospectus, a redemption fee payable to the sub-funds will be applied at the following rates:
Sub-fund
Classes
CLASS
"1"
CLASS
"2"
CLASS
"A"
CLASS
"B"
CLASS
"C"
CLASS
"F"
CLASS
"Primaclasse"
CLASS
"R"
CLASS
"U"
Pramerica Sicav - Euro Fixed Income - - - - (1) - (20) (1) (2)
Pramerica Sicav - Euro Equity - - - - - (3) (20) (1) (2)
Pramerica Sicav - USA Equity - - - - - (3) (20) (1) (2)
Pramerica Sicav - Asia Pacific Equity - - - - - (3) (20) (1) (2)
Pramerica Sicav - Emerging Markets Equity - - - - - (3) (20) (1) (2)
Pramerica Sicav - Global Equity - - - - (1) (3) (20) (1) (2)
Pramerica Sicav - Euro Corporate Bond - - - - (1) (3) (20) (1) (2)
Pramerica Sicav - High Yield Bond - - (9) - (1) (3) (20) (1) (2)
Pramerica Sicav - Short Term EUR - - - - - - - (1) -
Pramerica Sicav - Euro Liquidity Plus - - - - - - - (1) -
Pramerica Sicav - Active Beta - - - - - - (20) (1) (2)
Pramerica Sicav - Global Corporate Bond - - - - (1) (3) (20) (1) (2)
Pramerica Sicav - Euro Corporate Short Term - - - - - - (20) (1) -
Pramerica Sicav - Euro Equity High Dividend - - - - (1) (3) (20) (1) (2)
Pramerica Sicav - Emerging Markets Bond - - - - (1) (3) (20) (1) (2)
Pramerica Sicav - Global Dynamic Allocation (7) (7) (10) (11) (1) (3) (20) (1) (2)
Pramerica Sicav - Cedola Certa 2012-2015 - - - - - - - (12) -
Pramerica Sicav
295
Notes to the Financial Statementsas at June 30, 2019 (continued)
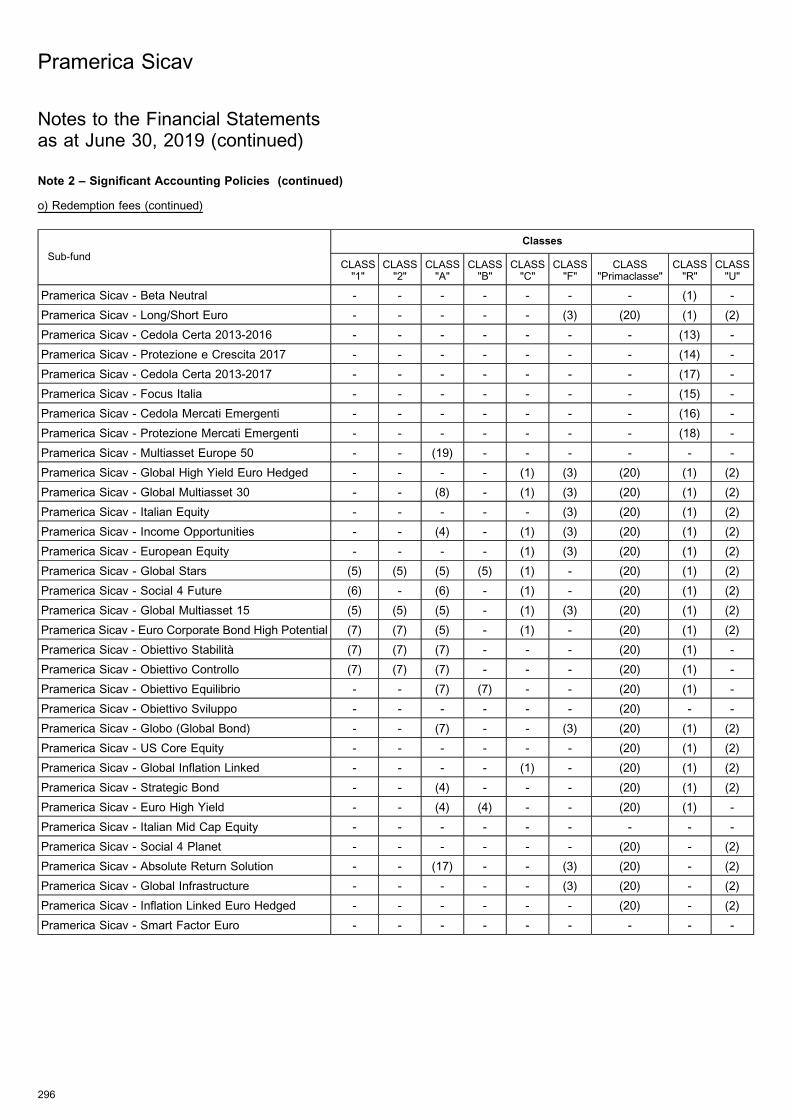
Note 2 – Significant Accounting Policies (continued)
o) Redemption fees (continued)
Sub-fund
Classes
CLASS"1"
CLASS"2"
CLASS"A"
CLASS"B"
CLASS"C"
CLASS"F"
CLASS"Primaclasse"
CLASS"R"
CLASS"U"
Pramerica Sicav - Beta Neutral - - - - - - - (1) -
Pramerica Sicav - Long/Short Euro - - - - - (3) (20) (1) (2)
Pramerica Sicav - Cedola Certa 2013-2016 - - - - - - - (13) -
Pramerica Sicav - Protezione e Crescita 2017 - - - - - - - (14) -
Pramerica Sicav - Cedola Certa 2013-2017 - - - - - - - (17) -
Pramerica Sicav - Focus Italia - - - - - - - (15) -
Pramerica Sicav - Cedola Mercati Emergenti - - - - - - - (16) -
Pramerica Sicav - Protezione Mercati Emergenti - - - - - - - (18) -
Pramerica Sicav - Multiasset Europe 50 - - (19) - - - - - -
Pramerica Sicav - Global High Yield Euro Hedged - - - - (1) (3) (20) (1) (2)
Pramerica Sicav - Global Multiasset 30 - - (8) - (1) (3) (20) (1) (2)
Pramerica Sicav - Italian Equity - - - - - (3) (20) (1) (2)
Pramerica Sicav - Income Opportunities - - (4) - (1) (3) (20) (1) (2)
Pramerica Sicav - European Equity - - - - (1) (3) (20) (1) (2)
Pramerica Sicav - Global Stars (5) (5) (5) (5) (1) - (20) (1) (2)
Pramerica Sicav - Social 4 Future (6) - (6) - (1) - (20) (1) (2)
Pramerica Sicav - Global Multiasset 15 (5) (5) (5) - (1) (3) (20) (1) (2)
Pramerica Sicav - Euro Corporate Bond High Potential (7) (7) (5) - (1) - (20) (1) (2)
Pramerica Sicav - Obiettivo Stabilita (7) (7) (7) - - - (20) (1) -
Pramerica Sicav - Obiettivo Controllo (7) (7) (7) - - - (20) (1) -
Pramerica Sicav - Obiettivo Equilibrio - - (7) (7) - - (20) (1) -
Pramerica Sicav - Obiettivo Sviluppo - - - - - - (20) - -
Pramerica Sicav - Globo (Global Bond) - - (7) - - (3) (20) (1) (2)
Pramerica Sicav - US Core Equity - - - - - - (20) (1) (2)
Pramerica Sicav - Global Inflation Linked - - - - (1) - (20) (1) (2)
Pramerica Sicav - Strategic Bond - - (4) - - - (20) (1) (2)
Pramerica Sicav - Euro High Yield - - (4) (4) - - (20) (1) -
Pramerica Sicav - Italian Mid Cap Equity - - - - - - - - -
Pramerica Sicav - Social 4 Planet - - - - - - (20) - (2)
Pramerica Sicav - Absolute Return Solution - - (17) - - (3) (20) - (2)
Pramerica Sicav - Global Infrastructure - - - - - (3) (20) - (2)
Pramerica Sicav - Inflation Linked Euro Hedged - - - - - - (20) - (2)
Pramerica Sicav - Smart Factor Euro - - - - - - - - -
Pramerica Sicav
296
Notes to the Financial Statementsas at June 30, 2019 (continued)
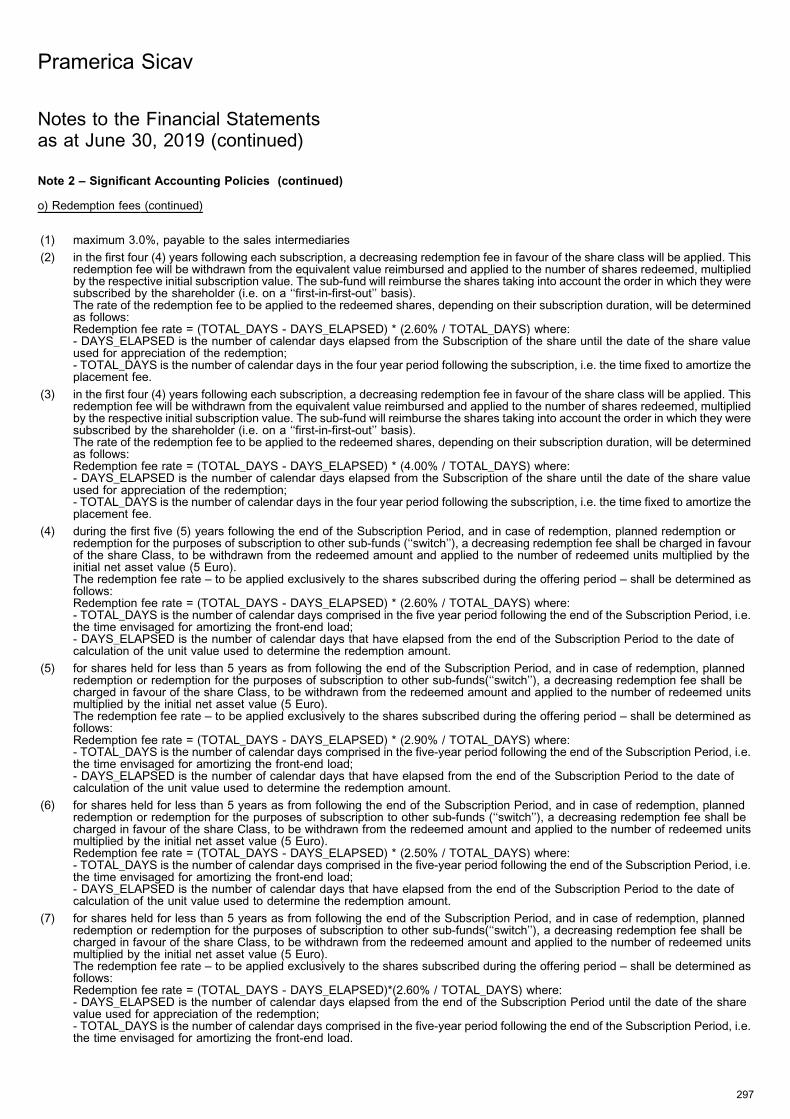
Note 2 – Significant Accounting Policies (continued)
o) Redemption fees (continued)
(1) maximum 3.0%, payable to the sales intermediaries
(2) in the first four (4) years following each subscription, a decreasing redemption fee in favour of the share class will be applied. Thisredemption fee will be withdrawn from the equivalent value reimbursed and applied to the number of shares redeemed, multipliedby the respective initial subscription value. The sub-fund will reimburse the shares taking into account the order in which they weresubscribed by the shareholder (i.e. on a ‘‘first-in-first-out’’ basis).The rate of the redemption fee to be applied to the redeemed shares, depending on their subscription duration, will be determinedas follows:Redemption fee rate = (TOTAL_DAYS - DAYS_ELAPSED) * (2.60% / TOTAL_DAYS) where:- DAYS_ELAPSED is the number of calendar days elapsed from the Subscription of the share until the date of the share valueused for appreciation of the redemption;- TOTAL_DAYS is the number of calendar days in the four year period following the subscription, i.e. the time fixed to amortize theplacement fee.
(3) in the first four (4) years following each subscription, a decreasing redemption fee in favour of the share class will be applied. Thisredemption fee will be withdrawn from the equivalent value reimbursed and applied to the number of shares redeemed, multipliedby the respective initial subscription value. The sub-fund will reimburse the shares taking into account the order in which they weresubscribed by the shareholder (i.e. on a ‘‘first-in-first-out’’ basis).The rate of the redemption fee to be applied to the redeemed shares, depending on their subscription duration, will be determinedas follows:Redemption fee rate = (TOTAL_DAYS - DAYS_ELAPSED) * (4.00% / TOTAL_DAYS) where:- DAYS_ELAPSED is the number of calendar days elapsed from the Subscription of the share until the date of the share valueused for appreciation of the redemption;- TOTAL_DAYS is the number of calendar days in the four year period following the subscription, i.e. the time fixed to amortize theplacement fee.
(4) during the first five (5) years following the end of the Subscription Period, and in case of redemption, planned redemption orredemption for the purposes of subscription to other sub-funds (‘‘switch’’), a decreasing redemption fee shall be charged in favourof the share Class, to be withdrawn from the redeemed amount and applied to the number of redeemed units multiplied by theinitial net asset value (5 Euro).The redemption fee rate – to be applied exclusively to the shares subscribed during the offering period – shall be determined asfollows:Redemption fee rate = (TOTAL_DAYS - DAYS_ELAPSED) * (2.60% / TOTAL_DAYS) where:- TOTAL_DAYS is the number of calendar days comprised in the five year period following the end of the Subscription Period, i.e.the time envisaged for amortizing the front-end load;- DAYS_ELAPSED is the number of calendar days that have elapsed from the end of the Subscription Period to the date ofcalculation of the unit value used to determine the redemption amount.
(5) for shares held for less than 5 years as from following the end of the Subscription Period, and in case of redemption, plannedredemption or redemption for the purposes of subscription to other sub-funds(‘‘switch’’), a decreasing redemption fee shall becharged in favour of the share Class, to be withdrawn from the redeemed amount and applied to the number of redeemed unitsmultiplied by the initial net asset value (5 Euro).The redemption fee rate – to be applied exclusively to the shares subscribed during the offering period – shall be determined asfollows:Redemption fee rate = (TOTAL_DAYS - DAYS_ELAPSED) * (2.90% / TOTAL_DAYS) where:- TOTAL_DAYS is the number of calendar days comprised in the five-year period following the end of the Subscription Period, i.e.the time envisaged for amortizing the front-end load;- DAYS_ELAPSED is the number of calendar days that have elapsed from the end of the Subscription Period to the date ofcalculation of the unit value used to determine the redemption amount.
(6) for shares held for less than 5 years as from following the end of the Subscription Period, and in case of redemption, plannedredemption or redemption for the purposes of subscription to other sub-funds (‘‘switch’’), a decreasing redemption fee shall becharged in favour of the share Class, to be withdrawn from the redeemed amount and applied to the number of redeemed unitsmultiplied by the initial net asset value (5 Euro).Redemption fee rate = (TOTAL_DAYS - DAYS_ELAPSED) * (2.50% / TOTAL_DAYS) where:- TOTAL_DAYS is the number of calendar days comprised in the five-year period following the end of the Subscription Period, i.e.the time envisaged for amortizing the front-end load;- DAYS_ELAPSED is the number of calendar days that have elapsed from the end of the Subscription Period to the date ofcalculation of the unit value used to determine the redemption amount.
(7) for shares held for less than 5 years as from following the end of the Subscription Period, and in case of redemption, plannedredemption or redemption for the purposes of subscription to other sub-funds(‘‘switch’’), a decreasing redemption fee shall becharged in favour of the share Class, to be withdrawn from the redeemed amount and applied to the number of redeemed unitsmultiplied by the initial net asset value (5 Euro).The redemption fee rate – to be applied exclusively to the shares subscribed during the offering period – shall be determined asfollows:Redemption fee rate = (TOTAL_DAYS - DAYS_ELAPSED)*(2.60% / TOTAL_DAYS) where:- DAYS_ELAPSED is the number of calendar days elapsed from the end of the Subscription Period until the date of the sharevalue used for appreciation of the redemption;- TOTAL_DAYS is the number of calendar days comprised in the five-year period following the end of the Subscription Period, i.e.the time envisaged for amortizing the front-end load.
Pramerica Sicav
297
Notes to the Financial Statementsas at June 30, 2019 (continued)
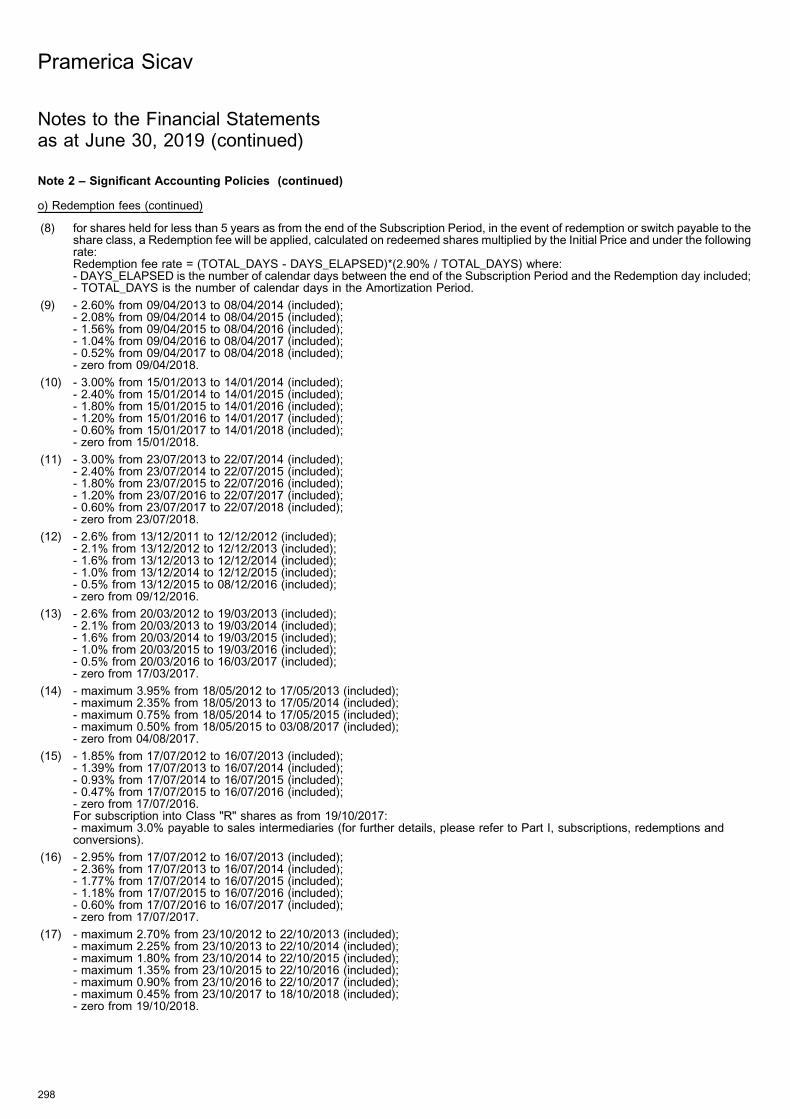
Note 2 – Significant Accounting Policies (continued)
o) Redemption fees (continued)
(8) for shares held for less than 5 years as from the end of the Subscription Period, in the event of redemption or switch payable to theshare class, a Redemption fee will be applied, calculated on redeemed shares multiplied by the Initial Price and under the followingrate:Redemption fee rate = (TOTAL_DAYS - DAYS_ELAPSED)*(2.90% / TOTAL_DAYS) where:- DAYS_ELAPSED is the number of calendar days between the end of the Subscription Period and the Redemption day included;- TOTAL_DAYS is the number of calendar days in the Amortization Period.
(9) - 2.60% from 09/04/2013 to 08/04/2014 (included);- 2.08% from 09/04/2014 to 08/04/2015 (included);- 1.56% from 09/04/2015 to 08/04/2016 (included);- 1.04% from 09/04/2016 to 08/04/2017 (included);- 0.52% from 09/04/2017 to 08/04/2018 (included);- zero from 09/04/2018.
(10) - 3.00% from 15/01/2013 to 14/01/2014 (included);- 2.40% from 15/01/2014 to 14/01/2015 (included);- 1.80% from 15/01/2015 to 14/01/2016 (included);- 1.20% from 15/01/2016 to 14/01/2017 (included);- 0.60% from 15/01/2017 to 14/01/2018 (included);- zero from 15/01/2018.
(11) - 3.00% from 23/07/2013 to 22/07/2014 (included);- 2.40% from 23/07/2014 to 22/07/2015 (included);- 1.80% from 23/07/2015 to 22/07/2016 (included);- 1.20% from 23/07/2016 to 22/07/2017 (included);- 0.60% from 23/07/2017 to 22/07/2018 (included);- zero from 23/07/2018.
(12) - 2.6% from 13/12/2011 to 12/12/2012 (included);- 2.1% from 13/12/2012 to 12/12/2013 (included);- 1.6% from 13/12/2013 to 12/12/2014 (included);- 1.0% from 13/12/2014 to 12/12/2015 (included);- 0.5% from 13/12/2015 to 08/12/2016 (included);- zero from 09/12/2016.
(13) - 2.6% from 20/03/2012 to 19/03/2013 (included);- 2.1% from 20/03/2013 to 19/03/2014 (included);- 1.6% from 20/03/2014 to 19/03/2015 (included);- 1.0% from 20/03/2015 to 19/03/2016 (included);- 0.5% from 20/03/2016 to 16/03/2017 (included);- zero from 17/03/2017.
(14) - maximum 3.95% from 18/05/2012 to 17/05/2013 (included);- maximum 2.35% from 18/05/2013 to 17/05/2014 (included);- maximum 0.75% from 18/05/2014 to 17/05/2015 (included);- maximum 0.50% from 18/05/2015 to 03/08/2017 (included);- zero from 04/08/2017.
(15) - 1.85% from 17/07/2012 to 16/07/2013 (included);- 1.39% from 17/07/2013 to 16/07/2014 (included);- 0.93% from 17/07/2014 to 16/07/2015 (included);- 0.47% from 17/07/2015 to 16/07/2016 (included);- zero from 17/07/2016.For subscription into Class "R" shares as from 19/10/2017:- maximum 3.0% payable to sales intermediaries (for further details, please refer to Part I, subscriptions, redemptions andconversions).
(16) - 2.95% from 17/07/2012 to 16/07/2013 (included);- 2.36% from 17/07/2013 to 16/07/2014 (included);- 1.77% from 17/07/2014 to 16/07/2015 (included);- 1.18% from 17/07/2015 to 16/07/2016 (included);- 0.60% from 17/07/2016 to 16/07/2017 (included);- zero from 17/07/2017.
(17) - maximum 2.70% from 23/10/2012 to 22/10/2013 (included);- maximum 2.25% from 23/10/2013 to 22/10/2014 (included);- maximum 1.80% from 23/10/2014 to 22/10/2015 (included);- maximum 1.35% from 23/10/2015 to 22/10/2016 (included);- maximum 0.90% from 23/10/2016 to 22/10/2017 (included);- maximum 0.45% from 23/10/2017 to 18/10/2018 (included);- zero from 19/10/2018.
Pramerica Sicav
298
Notes to the Financial Statementsas at June 30, 2019 (continued)
Note 2 – Significant Accounting Policies (continued)
o) Redemption fees (continued)
(18) - maximum 3.35% from 21/05/2013 to 20/05/2014 (included);- maximum 2.75% from 21/05/2014 to 20/05/2015 (included);- maximum 2.15% from 21/05/2015 to 20/05/2016 (included);- maximum 1.55% from 21/05/2016 to 20/05/2017 (included);- maximum 0.95% from 21/05/2017 to 20/05/2018 (included);- 0.20% from 21/05/2018.
(19) - 2.70% from 22/10/2013 to 21/10/2014 (included);- 2.16% from 22/10/2014 to 21/10/2015 (included);- 1.62% from 22/10/2015 to 21/10/2016 (included);- 1.08% from 22/10/2016 to 21/10/2017 (included);- 0.54% from 22/10/2017 to 21/10/2018 (included);- zero from 22/10/2018.
(20) in the first five (5) years following each subscription, a decreasing redemption fee in favour of the share class will be applied. Thisredemption fee will be withdrawn from the equivalent value reimbursed and applied to the number of shares redeemed, multipliedby the respective initial subscription value. The sub-fund will reimburse the shares taking into account the order in which they weresubscribed by the shareholder (i.e. on a ‘‘first-in-first-out’’ basis).The rate of the redemption fee to be applied to the redeemed shares, depending on their subscription duration, will be determinedas follows:Redemption fee rate = (TOTAL_DAYS - DAYS_ELAPSED)*(2.40% / TOTAL_DAYS) where:- DAYS_ELAPSED is the number of calendar days elapsed from the Subscription of the share until the date of the share valueused for appreciation of the redemption;- TOTAL_DAYS is the number of calendar days in the five-year period following the subscription, i.e. the time fixed to amortize theplacement fee.
(21) during the first five (5) years following the end of the Subscription Period, and in case of redemption, planned redemption orredemption for the purpose of subscription to other sub-funds ("switch"), a decreasing redemption fee shall be charged in favour ofthe share class, to be withdrawn from the redeemed amount and applied to the number of redeemed units multiplied by the initialnet asset value (5 Euro).The redemption fee rate – to be applied exclusively to the shares subscribed during the offering period – shall be determined asfollows:Redemption fee rate = (TOTAL_DAYS - DAYS_ELAPSED)*(maximum 3.50% / TOTAL_DAYS) where:- TOTAL_DAYS is the number of calendar days comprised in the five-year period following the end of the Subscription Period, i.e.the time envisaged for amortizing the front-end load;- DAYS_ELAPSED is the number of calendar days that have elapsed from the end of the Subscription Period to the date ofcalculation of the unit value used to determine the redemption amount.
If not listed or mentioned above no decreasing redemption fee shall be charged.
Except Class U, Class F and Primaclasse, in case of conversion of a sub-fund, including share classes with startup fee, in another sub-fund/share class before the end of the redemption fee period, the redemption fee is still applied to the conversion.
The "Other income" contains the "Redemption fees" in the Statement of Operations and Charges in Net Assets.
Pramerica Sicav
299
Notes to the Financial Statementsas at June 30, 2019 (continued)
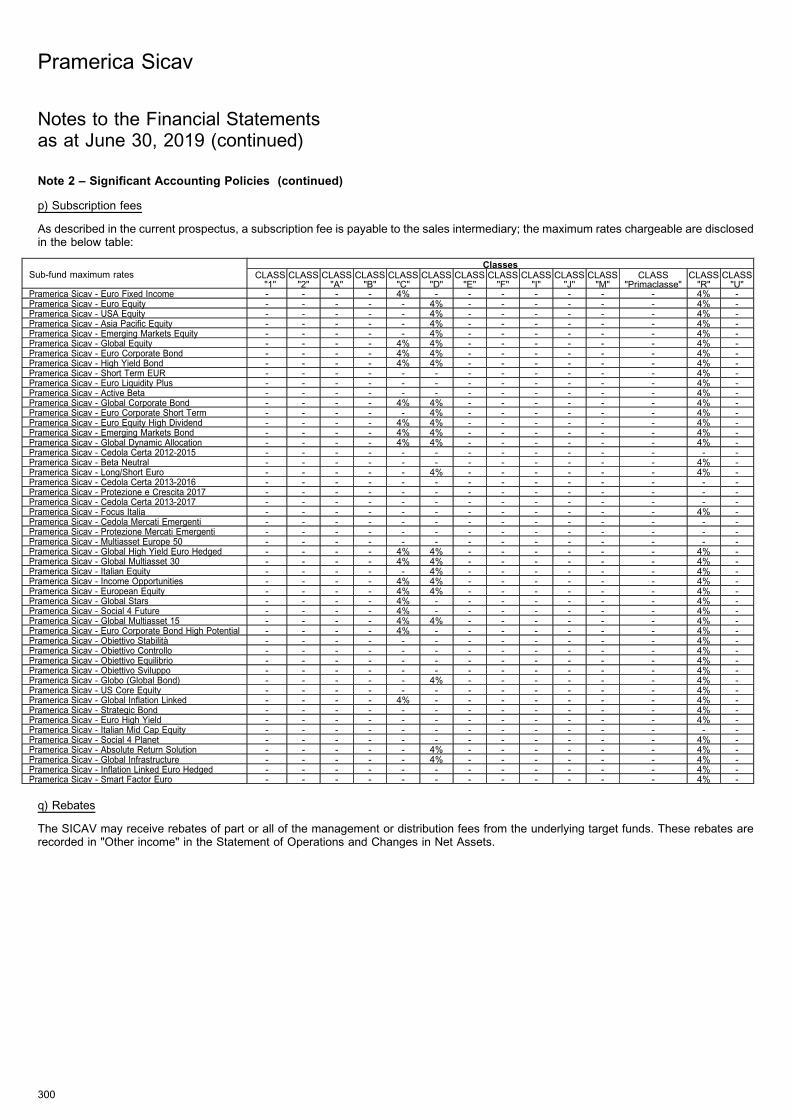
Note 2 – Significant Accounting Policies (continued)
p) Subscription fees
As described in the current prospectus, a subscription fee is payable to the sales intermediary; the maximum rates chargeable are disclosedin the below table:
Sub-fund maximum ratesClasses
CLASS"1"
CLASS"2"
CLASS"A"
CLASS"B"
CLASS"C"
CLASS"D"
CLASS"E"
CLASS"F"
CLASS"I"
CLASS"J"
CLASS"M"
CLASS"Primaclasse"
CLASS"R"
CLASS"U"
Pramerica Sicav - Euro Fixed Income - - - - 4% - - - - - - - 4% -Pramerica Sicav - Euro Equity - - - - - 4% - - - - - - 4% -Pramerica Sicav - USA Equity - - - - - 4% - - - - - - 4% -Pramerica Sicav - Asia Pacific Equity - - - - - 4% - - - - - - 4% -Pramerica Sicav - Emerging Markets Equity - - - - - 4% - - - - - - 4% -Pramerica Sicav - Global Equity - - - - 4% 4% - - - - - - 4% -Pramerica Sicav - Euro Corporate Bond - - - - 4% 4% - - - - - - 4% -Pramerica Sicav - High Yield Bond - - - - 4% 4% - - - - - - 4% -Pramerica Sicav - Short Term EUR - - - - - - - - - - - - 4% -Pramerica Sicav - Euro Liquidity Plus - - - - - - - - - - - - 4% -Pramerica Sicav - Active Beta - - - - - - - - - - - - 4% -Pramerica Sicav - Global Corporate Bond - - - - 4% 4% - - - - - - 4% -Pramerica Sicav - Euro Corporate Short Term - - - - - 4% - - - - - - 4% -Pramerica Sicav - Euro Equity High Dividend - - - - 4% 4% - - - - - - 4% -Pramerica Sicav - Emerging Markets Bond - - - - 4% 4% - - - - - - 4% -Pramerica Sicav - Global Dynamic Allocation - - - - 4% 4% - - - - - - 4% -Pramerica Sicav - Cedola Certa 2012-2015 - - - - - - - - - - - - - -Pramerica Sicav - Beta Neutral - - - - - - - - - - - - 4% -Pramerica Sicav - Long/Short Euro - - - - - 4% - - - - - - 4% -Pramerica Sicav - Cedola Certa 2013-2016 - - - - - - - - - - - - - -Pramerica Sicav - Protezione e Crescita 2017 - - - - - - - - - - - - - -Pramerica Sicav - Cedola Certa 2013-2017 - - - - - - - - - - - - - -Pramerica Sicav - Focus Italia - - - - - - - - - - - - 4% -Pramerica Sicav - Cedola Mercati Emergenti - - - - - - - - - - - - - -Pramerica Sicav - Protezione Mercati Emergenti - - - - - - - - - - - - - -Pramerica Sicav - Multiasset Europe 50 - - - - - - - - - - - - - -Pramerica Sicav - Global High Yield Euro Hedged - - - - 4% 4% - - - - - - 4% -Pramerica Sicav - Global Multiasset 30 - - - - 4% 4% - - - - - - 4% -Pramerica Sicav - Italian Equity - - - - - 4% - - - - - - 4% -Pramerica Sicav - Income Opportunities - - - - 4% 4% - - - - - - 4% -Pramerica Sicav - European Equity - - - - 4% 4% - - - - - - 4% -Pramerica Sicav - Global Stars - - - - 4% - - - - - - - 4% -Pramerica Sicav - Social 4 Future - - - - 4% - - - - - - - 4% -Pramerica Sicav - Global Multiasset 15 - - - - 4% 4% - - - - - - 4% -Pramerica Sicav - Euro Corporate Bond High Potential - - - - 4% - - - - - - - 4% -Pramerica Sicav - Obiettivo Stabilita - - - - - - - - - - - - 4% -Pramerica Sicav - Obiettivo Controllo - - - - - - - - - - - - 4% -Pramerica Sicav - Obiettivo Equilibrio - - - - - - - - - - - - 4% -Pramerica Sicav - Obiettivo Sviluppo - - - - - - - - - - - - 4% -Pramerica Sicav - Globo (Global Bond) - - - - - 4% - - - - - - 4% -Pramerica Sicav - US Core Equity - - - - - - - - - - - - 4% -Pramerica Sicav - Global Inflation Linked - - - - 4% - - - - - - - 4% -Pramerica Sicav - Strategic Bond - - - - - - - - - - - - 4% -Pramerica Sicav - Euro High Yield - - - - - - - - - - - - 4% -Pramerica Sicav - Italian Mid Cap Equity - - - - - - - - - - - - - -Pramerica Sicav - Social 4 Planet - - - - - - - - - - - - 4% -Pramerica Sicav - Absolute Return Solution - - - - - 4% - - - - - - 4% -Pramerica Sicav - Global Infrastructure - - - - - 4% - - - - - - 4% -Pramerica Sicav - Inflation Linked Euro Hedged - - - - - - - - - - - - 4% -Pramerica Sicav - Smart Factor Euro - - - - - - - - - - - - 4% -
q) Rebates
The SICAV may receive rebates of part or all of the management or distribution fees from the underlying target funds. These rebates arerecorded in "Other income" in the Statement of Operations and Changes in Net Assets.
Pramerica Sicav
300
Notes to the Financial Statementsas at June 30, 2019 (continued)
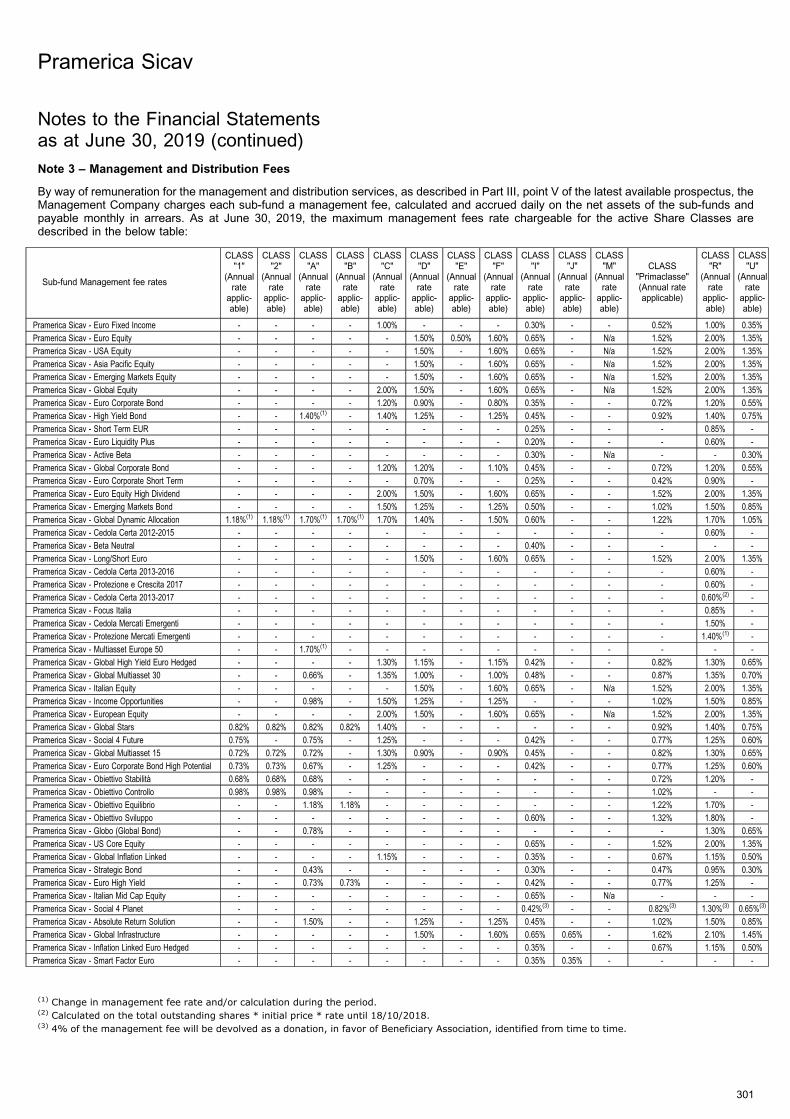
Note 3 – Management and Distribution Fees
By way of remuneration for the management and distribution services, as described in Part III, point V of the latest available prospectus, theManagement Company charges each sub-fund a management fee, calculated and accrued daily on the net assets of the sub-funds andpayable monthly in arrears. As at June 30, 2019, the maximum management fees rate chargeable for the active Share Classes aredescribed in the below table:
Sub-fund Management fee rates
CLASS"1"
(Annualrate
applic-able)
CLASS"2"
(Annualrate
applic-able)
CLASS"A"
(Annualrate
applic-able)
CLASS"B"
(Annualrate
applic-able)
CLASS"C"
(Annualrate
applic-able)
CLASS"D"
(Annualrate
applic-able)
CLASS"E"
(Annualrate
applic-able)
CLASS"F"
(Annualrate
applic-able)
CLASS"I"
(Annualrate
applic-able)
CLASS"J"
(Annualrate
applic-able)
CLASS"M"
(Annualrate
applic-able)
CLASS"Primaclasse"(Annual rateapplicable)
CLASS"R"
(Annualrate
applic-able)
CLASS"U"
(Annualrate
applic-able)
Pramerica Sicav - Euro Fixed Income - - - - 1.00% - - - 0.30% - - 0.52% 1.00% 0.35%
Pramerica Sicav - Euro Equity - - - - - 1.50% 0.50% 1.60% 0.65% - N/a 1.52% 2.00% 1.35%
Pramerica Sicav - USA Equity - - - - - 1.50% - 1.60% 0.65% - N/a 1.52% 2.00% 1.35%
Pramerica Sicav - Asia Pacific Equity - - - - - 1.50% - 1.60% 0.65% - N/a 1.52% 2.00% 1.35%
Pramerica Sicav - Emerging Markets Equity - - - - - 1.50% - 1.60% 0.65% - N/a 1.52% 2.00% 1.35%
Pramerica Sicav - Global Equity - - - - 2.00% 1.50% - 1.60% 0.65% - N/a 1.52% 2.00% 1.35%
Pramerica Sicav - Euro Corporate Bond - - - - 1.20% 0.90% - 0.80% 0.35% - - 0.72% 1.20% 0.55%
Pramerica Sicav - High Yield Bond - - 1.40%(1) - 1.40% 1.25% - 1.25% 0.45% - - 0.92% 1.40% 0.75%
Pramerica Sicav - Short Term EUR - - - - - - - - 0.25% - - - 0.85% -
Pramerica Sicav - Euro Liquidity Plus - - - - - - - - 0.20% - - - 0.60% -
Pramerica Sicav - Active Beta - - - - - - - - 0.30% - N/a - - 0.30%
Pramerica Sicav - Global Corporate Bond - - - - 1.20% 1.20% - 1.10% 0.45% - - 0.72% 1.20% 0.55%
Pramerica Sicav - Euro Corporate Short Term - - - - - 0.70% - - 0.25% - - 0.42% 0.90% -
Pramerica Sicav - Euro Equity High Dividend - - - - 2.00% 1.50% - 1.60% 0.65% - - 1.52% 2.00% 1.35%
Pramerica Sicav - Emerging Markets Bond - - - - 1.50% 1.25% - 1.25% 0.50% - - 1.02% 1.50% 0.85%
Pramerica Sicav - Global Dynamic Allocation 1.18%(1) 1.18%(1) 1.70%(1) 1.70%(1) 1.70% 1.40% - 1.50% 0.60% - - 1.22% 1.70% 1.05%
Pramerica Sicav - Cedola Certa 2012-2015 - - - - - - - - - - - - 0.60% -
Pramerica Sicav - Beta Neutral - - - - - - - - 0.40% - - - - -
Pramerica Sicav - Long/Short Euro - - - - - 1.50% - 1.60% 0.65% - - 1.52% 2.00% 1.35%
Pramerica Sicav - Cedola Certa 2013-2016 - - - - - - - - - - - - 0.60% -
Pramerica Sicav - Protezione e Crescita 2017 - - - - - - - - - - - - 0.60% -
Pramerica Sicav - Cedola Certa 2013-2017 - - - - - - - - - - - - 0.60%(2) -
Pramerica Sicav - Focus Italia - - - - - - - - - - - - 0.85% -
Pramerica Sicav - Cedola Mercati Emergenti - - - - - - - - - - - - 1.50% -
Pramerica Sicav - Protezione Mercati Emergenti - - - - - - - - - - - - 1.40%(1) -
Pramerica Sicav - Multiasset Europe 50 - - 1.70%(1) - - - - - - - - - - -
Pramerica Sicav - Global High Yield Euro Hedged - - - - 1.30% 1.15% - 1.15% 0.42% - - 0.82% 1.30% 0.65%
Pramerica Sicav - Global Multiasset 30 - - 0.66% - 1.35% 1.00% - 1.00% 0.48% - - 0.87% 1.35% 0.70%
Pramerica Sicav - Italian Equity - - - - - 1.50% - 1.60% 0.65% - N/a 1.52% 2.00% 1.35%
Pramerica Sicav - Income Opportunities - - 0.98% - 1.50% 1.25% - 1.25% - - - 1.02% 1.50% 0.85%
Pramerica Sicav - European Equity - - - - 2.00% 1.50% - 1.60% 0.65% - N/a 1.52% 2.00% 1.35%
Pramerica Sicav - Global Stars 0.82% 0.82% 0.82% 0.82% 1.40% - - - - - - 0.92% 1.40% 0.75%
Pramerica Sicav - Social 4 Future 0.75% - 0.75% - 1.25% - - - 0.42% - - 0.77% 1.25% 0.60%
Pramerica Sicav - Global Multiasset 15 0.72% 0.72% 0.72% - 1.30% 0.90% - 0.90% 0.45% - - 0.82% 1.30% 0.65%
Pramerica Sicav - Euro Corporate Bond High Potential 0.73% 0.73% 0.67% - 1.25% - - - 0.42% - - 0.77% 1.25% 0.60%
Pramerica Sicav - Obiettivo Stabilita 0.68% 0.68% 0.68% - - - - - - - - 0.72% 1.20% -
Pramerica Sicav - Obiettivo Controllo 0.98% 0.98% 0.98% - - - - - - - - 1.02% - -
Pramerica Sicav - Obiettivo Equilibrio - - 1.18% 1.18% - - - - - - - 1.22% 1.70% -
Pramerica Sicav - Obiettivo Sviluppo - - - - - - - - 0.60% - - 1.32% 1.80% -
Pramerica Sicav - Globo (Global Bond) - - 0.78% - - - - - - - - - 1.30% 0.65%
Pramerica Sicav - US Core Equity - - - - - - - - 0.65% - - 1.52% 2.00% 1.35%
Pramerica Sicav - Global Inflation Linked - - - - 1.15% - - - 0.35% - - 0.67% 1.15% 0.50%
Pramerica Sicav - Strategic Bond - - 0.43% - - - - - 0.30% - - 0.47% 0.95% 0.30%
Pramerica Sicav - Euro High Yield - - 0.73% 0.73% - - - - 0.42% - - 0.77% 1.25% -
Pramerica Sicav - Italian Mid Cap Equity - - - - - - - - 0.65% - N/a - - -
Pramerica Sicav - Social 4 Planet - - - - - - - - 0.42%(3) - - 0.82%(3) 1.30%(3) 0.65%(3)
Pramerica Sicav - Absolute Return Solution - - 1.50% - - 1.25% - 1.25% 0.45% - - 1.02% 1.50% 0.85%
Pramerica Sicav - Global Infrastructure - - - - - 1.50% - 1.60% 0.65% 0.65% - 1.62% 2.10% 1.45%
Pramerica Sicav - Inflation Linked Euro Hedged - - - - - - - - 0.35% - - 0.67% 1.15% 0.50%
Pramerica Sicav - Smart Factor Euro - - - - - - - - 0.35% 0.35% - - - -
(1) Change in management fee rate and/or calculation during the period.(2) Calculated on the total outstanding shares * initial price * rate until 18/10/2018.(3) 4% of the management fee will be devolved as a donation, in favor of Beneficiary Association, identified from time to time.
Pramerica Sicav
301
Notes to the Financial Statementsas at June 30, 2019 (continued)
Note 3 – Management and Distribution Fees (continued)
The management rates of several classes changed/ will change on the dates below for the following sub-funds:
Pramerica Sicav - High Yield BondClass "A" shares:- from 09/04/2018 calculated daily on the total net assets of the share class and payable monthly in arrears: maximum 1.40% p.a..
Pramerica Sicav - Global Dynamic AllocationClass "1" shares:- from 22/03/2018 to 21/03/2023 (first 5 years): maximum 1.18% p.a., calculated daily on the total net assets of the share class and payablemonthly in arrears.- from 22/03/2023: maximum 1.70% p.a., calculated daily on the total net assets of the share class and payable monthly in arrears.Class "2" shares:- from 24/04/2018 to 23/04/2023 (first 5 years): maximum 1.18% p.a., calculated daily on the total net assets of the share class and payablemonthly in arrears.- from 24/04/2023: maximum 1.70% p.a., calculated daily on the total net assets of the share class and payable monthly in arrears.Class "A" shares:- from 15/01/2018 calculated daily on the total net assets of the share class and payable monthly in arrears: maximum 1.70% p.a..Class "B" shares:- from 23/07/2018 calculated daily on the total net assets of the share class and payable monthly in arrears: maximum 1.70% p.a..
Pramerica Sicav - Cedola Certa 2012-2015Class "R" shares:- as from 09/12/2016 calculated daily on the total net assets of the sub-fund and payable monthly in arrears: maximum 0.60% p.a..
Pramerica Sicav - Cedola Certa 2013-2016Class "R" shares:- as from 17/03/2017 calculated daily on the total net assets of the sub-fund and payable monthly in arrears: maximum 0.60% p.a..
Pramerica Sicav - Protezione e Crescita 2017Class "R" shares:- from 07/08/2017 calculated daily on the total net assets of the sub-fund and payable monthly in arrears: maximum 0.60% p.a..
Pramerica Sicav - Cedola Certa 2013-2017Class "R" shares:- as from 19/10/2018 calculated daily on the total net assets of the sub-fund and payable monthly in arrears: maximum 0.60% p.a..
Pramerica Sicav - Cedola Mercati EmergentiClass "R" shares:- as from 17/07/2017 from the 6th year calculated daily on the total net assets of the sub-fund and payable monthly in arrears: maximum1.50% p.a..
Pramerica Sicav - Protezione Mercati EmergentiClass "R" shares:- from 21/05/2018 calculated daily on the total net assets of the sub-fund and payable monthly in arrears: maximum 1.40% p.a..
Pramerica Sicav - Multiasset Europe 50Class "A" shares:- from 22/10/2018 calculated daily on the total net assets of the share class and payable monthly in arrears: maximum 1.70% p.a..
Pramerica Sicav - Global Multiasset 30Class "A" shares:- from the 6th year calculated daily on the total net assets of the share class and payable monthly in arrears: maximum 1.35% p.a..
Pramerica Sicav - Income OpportunitiesClass "A" shares:- from 22/07/2020 calculated daily on the total net assets of the share class and payable monthly in arrears: maximum 1.50% p.a..
Pramerica Sicav
302
Notes to the Financial Statementsas at June 30, 2019 (continued)
Note 3 – Management and Distribution Fees (continued)
Pramerica Sicav - Global StarsClass "A" shares:- from 03/02/2021 calculated daily on the total net assets of the share class and payable monthly in arrears: maximum 1.40% p.a..Class "1" shares:- from 14/12/2021 calculated daily on the total net assets of the share class and payable monthly in arrears: maximum 1.40% p.a..Class "2" shares:- from 08/02/2022 calculated daily on the total net assets of the share class and payable monthly in arrears: maximum 1.40% p.a..Class "B" shares:- from 02/03/2021 calculated daily on the total net assets of the share class and payable monthly in arrears: maximum 1.40% p.a..
Pramerica Sicav - Social 4 FutureClass "A" shares:- from 03/02/2021 calculated daily on the total net assets of the share class and payable monthly in arrears: maximum 1.25% p.a..- 4% of the management fee will be devolved for the Management Company, at the end of each year and as a donation, in favor ofBeneficiary Association, identified from time to time.Class "1" shares:- from 14/12/2021 calculated daily on the total net assets of the share class and payable monthly in arrears: maximum 1.25% p.a..- 4% of the management fee will be devolved for the Management Company, at the end of each year and as a donation, in favor ofBeneficiary Association, identified from time to time.
Pramerica Sicav - Global Multiasset 15Class "A" shares:- from the 6th year calculated daily on the total net assets of the share class and payable monthly in arrears: maximum 1.30% p.a..Class "1" shares:- from 14/12/2021 calculated daily on the total net assets of the share class and payable monthly in arrears: maximum 1.30% p.a..Class "2" shares:- from 08/02/2022 calculated daily on the total net assets of the share class and payable monthly in arrears: maximum 1.30% p.a..
Pramerica Sicav - Euro Corporate Bond High PotentialClass "A" shares:- from the 6th year calculated daily on the total net assets of the share class and payable monthly in arrears: maximum 1.25% p.a..Class "1" shares:- from 24/03/2022 calculated daily on the total net assets of the share class and payable monthly in arrears: maximum 1.25% p.a..Class "2" shares:- from 10/05/2022 calculated daily on the total net assets of the share class and payable monthly in arrears: maximum 1.25% p.a..
Pramerica Sicav - Obiettivo StabilitaClass "A" shares:- from 26/10/2021 calculated daily on the total net assets of the share class and payable monthly in arrears: maximum 1.20% p.a..Class "1" shares:- from 24/03/2022 calculated daily on the total net assets of the share class and payable monthly in arrears: maximum 1.20% p.a..Class "2" shares:- from 10/05/2022 calculated daily on the total net assets of the share class and payable monthly in arrears: maximum 1.20% p.a..
Pramerica Sicav - Obiettivo ControlloClass "A" shares:- from the 6th year calculated daily on the total net assets of the share class and payable monthly in arrears: maximum 1.50% p.a..Class "1" shares:- from 09/06/2022 calculated daily on the total net assets of the share class and payable monthly in arrears: maximum 1.50% p.a..Class "2" shares:- from 11/07/2022 calculated daily on the total net assets of the share class and payable monthly in arrears: maximum 1.50% p.a..
Pramerica Sicav - Obiettivo EquilibrioClass "A" shares:- from 13/12/2022 calculated daily on the total net assets of the share class and payable monthly in arrears: maximum 1.70% p.a..Class "B" shares:- from 08/02/2023 calculated daily on the total net assets of the share class and payable monthly in arrears: maximum 1.70% p.a..
Pramerica Sicav
303
Notes to the Financial Statementsas at June 30, 2019 (continued)
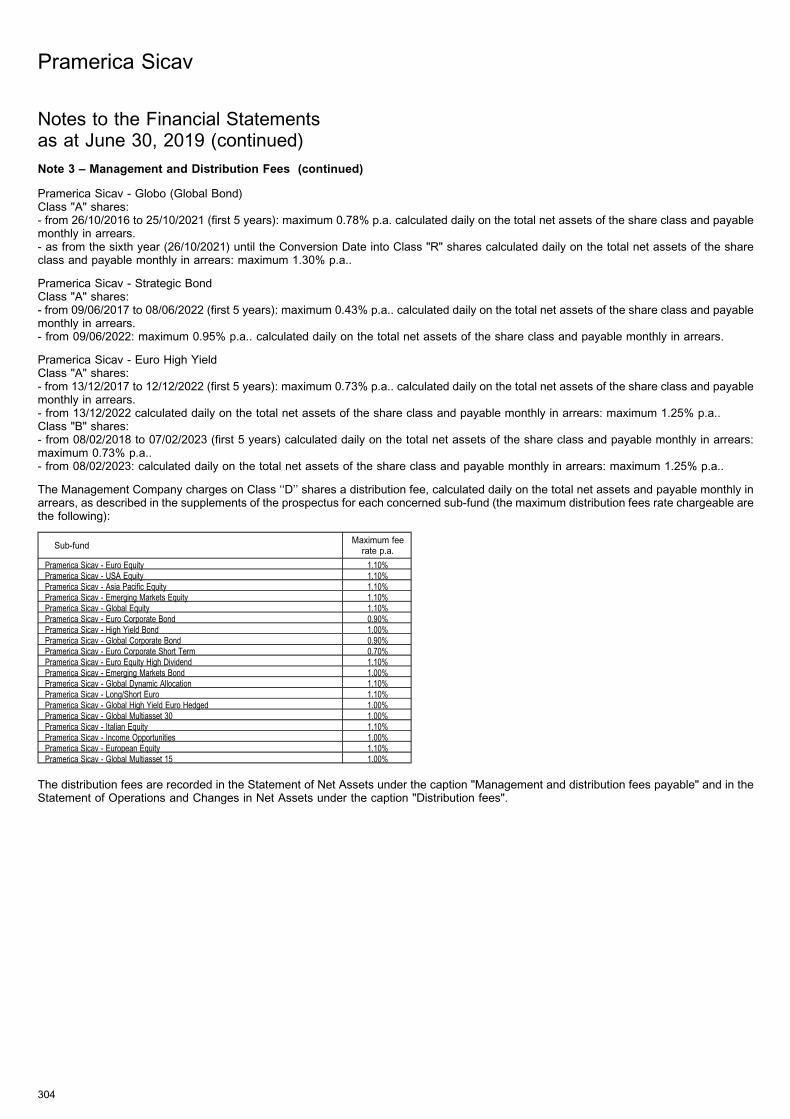
Note 3 – Management and Distribution Fees (continued)
Pramerica Sicav - Globo (Global Bond)Class "A" shares:- from 26/10/2016 to 25/10/2021 (first 5 years): maximum 0.78% p.a. calculated daily on the total net assets of the share class and payablemonthly in arrears.- as from the sixth year (26/10/2021) until the Conversion Date into Class "R" shares calculated daily on the total net assets of the shareclass and payable monthly in arrears: maximum 1.30% p.a..
Pramerica Sicav - Strategic BondClass "A" shares:- from 09/06/2017 to 08/06/2022 (first 5 years): maximum 0.43% p.a.. calculated daily on the total net assets of the share class and payablemonthly in arrears.- from 09/06/2022: maximum 0.95% p.a.. calculated daily on the total net assets of the share class and payable monthly in arrears.
Pramerica Sicav - Euro High YieldClass "A" shares:- from 13/12/2017 to 12/12/2022 (first 5 years): maximum 0.73% p.a.. calculated daily on the total net assets of the share class and payablemonthly in arrears.- from 13/12/2022 calculated daily on the total net assets of the share class and payable monthly in arrears: maximum 1.25% p.a..Class "B" shares:- from 08/02/2018 to 07/02/2023 (first 5 years) calculated daily on the total net assets of the share class and payable monthly in arrears:maximum 0.73% p.a..- from 08/02/2023: calculated daily on the total net assets of the share class and payable monthly in arrears: maximum 1.25% p.a..
The Management Company charges on Class ‘‘D’’ shares a distribution fee, calculated daily on the total net assets and payable monthly inarrears, as described in the supplements of the prospectus for each concerned sub-fund (the maximum distribution fees rate chargeable arethe following):
Sub-fundMaximum fee
rate p.a.
Pramerica Sicav - Euro Equity 1.10%Pramerica Sicav - USA Equity 1.10%Pramerica Sicav - Asia Pacific Equity 1.10%Pramerica Sicav - Emerging Markets Equity 1.10%Pramerica Sicav - Global Equity 1.10%Pramerica Sicav - Euro Corporate Bond 0.90%Pramerica Sicav - High Yield Bond 1.00%Pramerica Sicav - Global Corporate Bond 0.90%Pramerica Sicav - Euro Corporate Short Term 0.70%Pramerica Sicav - Euro Equity High Dividend 1.10%Pramerica Sicav - Emerging Markets Bond 1.00%Pramerica Sicav - Global Dynamic Allocation 1.10%Pramerica Sicav - Long/Short Euro 1.10%Pramerica Sicav - Global High Yield Euro Hedged 1.00%Pramerica Sicav - Global Multiasset 30 1.00%Pramerica Sicav - Italian Equity 1.10%Pramerica Sicav - Income Opportunities 1.00%Pramerica Sicav - European Equity 1.10%Pramerica Sicav - Global Multiasset 15 1.00%
The distribution fees are recorded in the Statement of Net Assets under the caption "Management and distribution fees payable" and in theStatement of Operations and Changes in Net Assets under the caption "Distribution fees".
Pramerica Sicav
304
Notes to the Financial Statementsas at June 30, 2019 (continued)
Note 4 – Performance Fees
For certain sub-funds and classes of shares, as specified in the last available prospectus supplement of each sub-fund, the ManagementCompany also receives a performance fee when the performance of a sub-fund is higher than the performance of its benchmark over a 90days rolling period, independently of the absolute performance of the sub-fund.
The performance fee is:
– calculated and accrued daily only when the sub-fund return exceeds the benchmark return;
– equal a percentage to 20% (‘‘P’’) of the over-performance of the sub-fund versus its benchmark during the last 90 day period;
– payable quarterly in arrears.
Calculation of the performance fee is made every day. If the over-performance of the relevant sub-fund is greater than zero the performancefee is equal to:
Over-performance x P x Net Asset Value90
For Class ‘‘M’’ shares, as specified in the supplement of each sub-fund, the Management Company receives a Performance Fee equal to25% of the outperformance attained in the calendar year (or, in the year in which the Class ‘‘M’’ shares are launched, in the period betweenthe first net asset value referring to Class ‘‘M’’ shares and the end of the calendar year), calculated on the lower of the latest total net assetvalue of the Class ‘‘M’’ shares available on the calculation day, and the average total net asset value of the Class ‘‘M’’ shares’’ during theperformance’s reference period (calendar year or period between the first net asset value referring to the Class ‘‘M’’ shares and the end ofthe calendar year, in the case of interim launch of the Class ‘‘M’’ shares). Outperformance means the positive difference between thepercentage variation of the sub-fund’s Class ‘‘M’’ shares value, considering the total value of the share class netted of all costs except for theperformance fee itself and the percentage variation of the benchmark value referring to the same period. The performance fee is applied alsoin case of decrease in the sub-funds’ Class ‘‘M’’ shares value if this decrease is less than the decrease recorded on the same period by thebenchmark adopted in the calculation of the performance fee. The indices composing the benchmark used for the calculation of theperformance fee for Class ‘‘M’’ shares is calculated by assuming the reinvestment of dividends (‘‘total return" indices) and, should they beoriginally expressed in a different currency, is considered as converted into Euros (the denomination currency for the Class ‘‘M’’ shares). Theperformance fee is calculated on a daily basis, by allocating an accrual which refers to the outperformance attained with respect to the valueof Class ‘‘M’’ shares and regarding the last day of the previous calendar year. In order to calculate the total net asset value of Class ‘‘M’’shares, every day the allocation of the previous day is credited to Class ‘‘M’’ shares and the allocation referring to the calculation day ischarged. The fee is deducted from the liquid assets of Class ‘‘M’’ shares on the third business day following the closing of the calendar year.
For new sub-funds, if applicable, the calculation and accrual of the performance fee does not begin before a period of ninety days after thelaunch date have elapsed.
For certain sub-funds and classes of shares, for which there is no benchmark due to their specific investment style, as specified in thesupplement of each sub-fund, the Management Company also receives a performance fee equal to 10% of the increase in the net assetvalue per share of the sub-fund.
The performance fee is:
– calculated and accrued daily only when the daily return of the sub-fund is positive and the net asset value per share of the sub-fundexceeds every net asset value per share previously recorded (High Water Mark);
– equal to 10% of the positive daily return;
– payable quarterly in arrears.
The High Water Mark methodology applies such that if the net asset value per share of the sub-fund declines, no performance fee is accruedin subsequent days to the extent that any subsequent increase in net asset value per share is merely recouping previous declines in the netasset value per share, thus ensuring that performance fees are accrued on each business day only in case of positive absolute performancefor the sub-fund.
For certain sub-funds and classes of shares, as specified in the supplement of each sub-fund, the Management Company also receives aperformance fee equal to 25% of the over performance over a 90 days rolling period (as defined in Part I Charges, fees and taxation of thelatest prospectus).
Each time the performance fee is accrued the net asset value per share of that day is set as the new High Water Mark.
Pramerica Sicav
305
Notes to the Financial Statementsas at June 30, 2019 (continued)
Note 4 – Performance Fees (continued)
A performance fee once accrued will not be reimbursed to shareholders, regardless of any subsequent under-performance.
For the sub-funds Pramerica Sicav – Global Infrastructure and Pramerica Sicav – Inflation Linked Euro Hedged, for certain classes ofshares, the Management Company receives a Performance Fee equal to 25% of the outperformance attained in the calendar year (or, in theyear in which the Class shares are launched, in the period between the first net asset value referring to Class shares and the end of thecalendar year (the ‘‘First Launched Year’’)), calculated on the lower of the latest total net asset value of the Class shares available on thecalculation day, and the average total net asset value of the Class shares during the performance’s reference period (calendar year or FirstLaunched Year).
Outperformance means the positive difference between the percentage variation of the sub-fund’s Class shares value, considering the totalvalue of the share class netted of all costs except for the Performance Fee itself and the percentage variation of the benchmark valuereferring to the same period.
For the calculation of the Performance Fee, the indices which are representative of equity markets within the benchmarks are calculated onthe assumption that dividends are not reinvested (Price index). The Performance Fee is calculated on a daily basis, by allocating an accrualwhich refers to the outperformance attained with respect to the value of Class shares and regarding the last day of the previous calendaryear.
In order to calculate the total net asset value of Class shares, every day the allocation of the previous day is credited to Class shares and theallocation referring to the calculation day is charged.
Once a year, following the end of the calendar year, the Performance Fee is deducted from the liquid assets of the relevant Class shares,calculated on the outperformance during the calendar year or First Launched Year, as applicable (the ‘‘Relevant Period’’). For the end of yearcalculation, the daily accrued positions of the Performance Fee during the Relevant Period is adjusted (depending on the variation of therelevant Class of Shares compare to the benchmark). For sake of clarity in case of negative outperformance nothing is accrued.
The Management Company receives a Performance Fee also in case of decrease of the Net Asset Value of the sub-fund, gross of thePerformance Fee itself, when this decrease is lower than the decrease recorded by the benchmark used for the calculation of thePerformance Fee.
For the sub-fund Pramerica Sicav – Absolute Return Solution, for certain classes of shares, the Management Company receives aPerformance Fee equal to 15% of the over performance with HWM (as defined in Part I Charges, fees and taxation), payable yearly inarrears.
Pramerica Sicav
306
Notes to the Financial Statementsas at June 30, 2019 (continued)
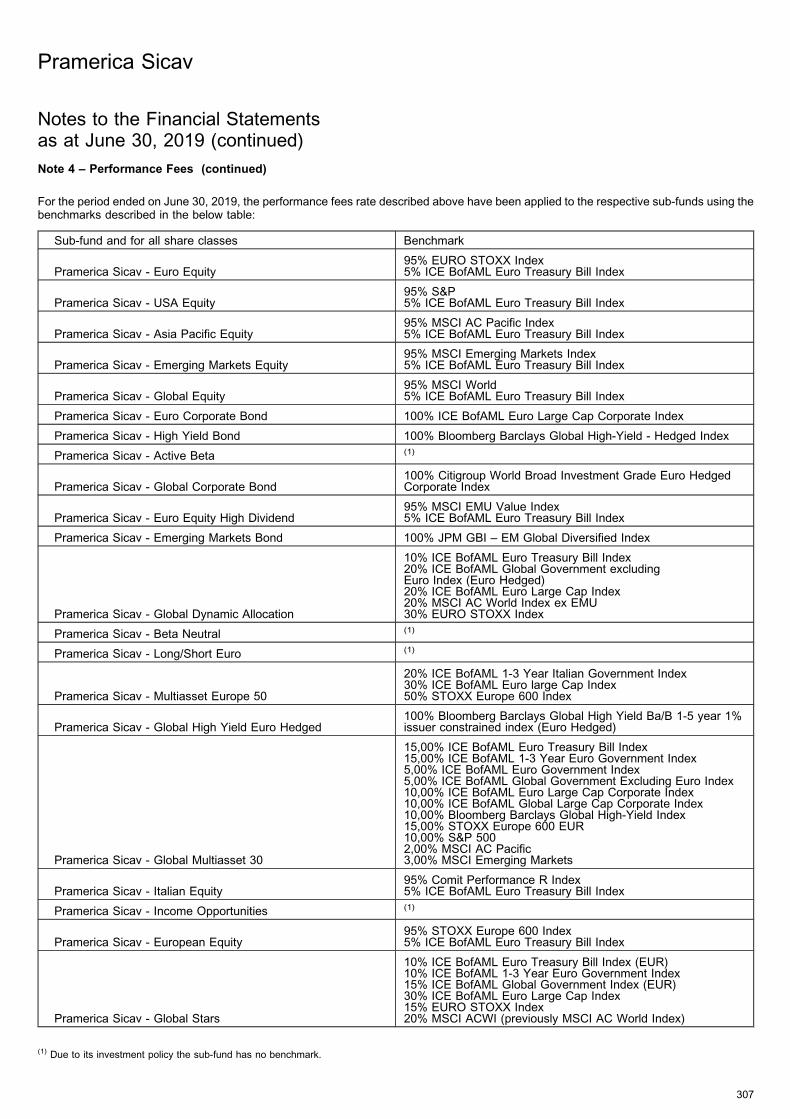
Note 4 – Performance Fees (continued)
For the period ended on June 30, 2019, the performance fees rate described above have been applied to the respective sub-funds using thebenchmarks described in the below table:
Sub-fund and for all share classes Benchmark
Pramerica Sicav - Euro Equity95% EURO STOXX Index5% ICE BofAML Euro Treasury Bill Index
Pramerica Sicav - USA Equity95% S&P5% ICE BofAML Euro Treasury Bill Index
Pramerica Sicav - Asia Pacific Equity95% MSCI AC Pacific Index5% ICE BofAML Euro Treasury Bill Index
Pramerica Sicav - Emerging Markets Equity95% MSCI Emerging Markets Index5% ICE BofAML Euro Treasury Bill Index
Pramerica Sicav - Global Equity95% MSCI World5% ICE BofAML Euro Treasury Bill Index
Pramerica Sicav - Euro Corporate Bond 100% ICE BofAML Euro Large Cap Corporate Index
Pramerica Sicav - High Yield Bond 100% Bloomberg Barclays Global High-Yield - Hedged Index
Pramerica Sicav - Active Beta (1)
Pramerica Sicav - Global Corporate Bond100% Citigroup World Broad Investment Grade Euro HedgedCorporate Index
Pramerica Sicav - Euro Equity High Dividend95% MSCI EMU Value Index5% ICE BofAML Euro Treasury Bill Index
Pramerica Sicav - Emerging Markets Bond 100% JPM GBI – EM Global Diversified Index
Pramerica Sicav - Global Dynamic Allocation
10% ICE BofAML Euro Treasury Bill Index20% ICE BofAML Global Government excludingEuro Index (Euro Hedged)20% ICE BofAML Euro Large Cap Index20% MSCI AC World Index ex EMU30% EURO STOXX Index
Pramerica Sicav - Beta Neutral (1)
Pramerica Sicav - Long/Short Euro (1)
Pramerica Sicav - Multiasset Europe 50
20% ICE BofAML 1-3 Year Italian Government Index30% ICE BofAML Euro large Cap Index50% STOXX Europe 600 Index
Pramerica Sicav - Global High Yield Euro Hedged100% Bloomberg Barclays Global High Yield Ba/B 1-5 year 1%issuer constrained index (Euro Hedged)
Pramerica Sicav - Global Multiasset 30
15,00% ICE BofAML Euro Treasury Bill Index15,00% ICE BofAML 1-3 Year Euro Government Index5,00% ICE BofAML Euro Government Index5,00% ICE BofAML Global Government Excluding Euro Index10,00% ICE BofAML Euro Large Cap Corporate Index10,00% ICE BofAML Global Large Cap Corporate Index10,00% Bloomberg Barclays Global High-Yield Index15,00% STOXX Europe 600 EUR10,00% S&P 5002,00% MSCI AC Pacific3,00% MSCI Emerging Markets
Pramerica Sicav - Italian Equity95% Comit Performance R Index5% ICE BofAML Euro Treasury Bill Index
Pramerica Sicav - Income Opportunities (1)
Pramerica Sicav - European Equity95% STOXX Europe 600 Index5% ICE BofAML Euro Treasury Bill Index
Pramerica Sicav - Global Stars
10% ICE BofAML Euro Treasury Bill Index (EUR)10% ICE BofAML 1-3 Year Euro Government Index15% ICE BofAML Global Government Index (EUR)30% ICE BofAML Euro Large Cap Index15% EURO STOXX Index20% MSCI ACWI (previously MSCI AC World Index)
Pramerica Sicav
307
Notes to the Financial Statementsas at June 30, 2019 (continued)
(1) Due to its investment policy the sub-fund has no benchmark.
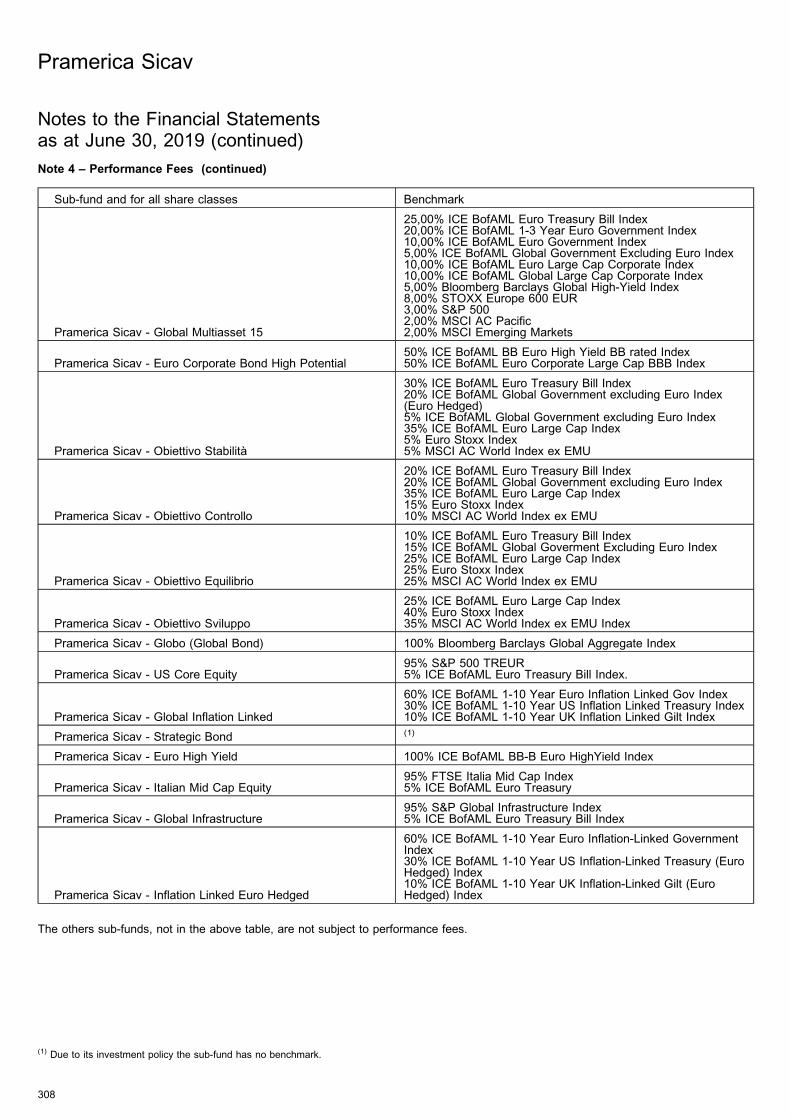
Note 4 – Performance Fees (continued)
Sub-fund and for all share classes Benchmark
Pramerica Sicav - Global Multiasset 15
25,00% ICE BofAML Euro Treasury Bill Index20,00% ICE BofAML 1-3 Year Euro Government Index10,00% ICE BofAML Euro Government Index5,00% ICE BofAML Global Government Excluding Euro Index10,00% ICE BofAML Euro Large Cap Corporate Index10,00% ICE BofAML Global Large Cap Corporate Index5,00% Bloomberg Barclays Global High-Yield Index8,00% STOXX Europe 600 EUR3,00% S&P 5002,00% MSCI AC Pacific2,00% MSCI Emerging Markets
Pramerica Sicav - Euro Corporate Bond High Potential50% ICE BofAML BB Euro High Yield BB rated Index50% ICE BofAML Euro Corporate Large Cap BBB Index
Pramerica Sicav - Obiettivo Stabilita
30% ICE BofAML Euro Treasury Bill Index20% ICE BofAML Global Government excluding Euro Index(Euro Hedged)5% ICE BofAML Global Government excluding Euro Index35% ICE BofAML Euro Large Cap Index5% Euro Stoxx Index5% MSCI AC World Index ex EMU
Pramerica Sicav - Obiettivo Controllo
20% ICE BofAML Euro Treasury Bill Index20% ICE BofAML Global Government excluding Euro Index35% ICE BofAML Euro Large Cap Index15% Euro Stoxx Index10% MSCI AC World Index ex EMU
Pramerica Sicav - Obiettivo Equilibrio
10% ICE BofAML Euro Treasury Bill Index15% ICE BofAML Global Goverment Excluding Euro Index25% ICE BofAML Euro Large Cap Index25% Euro Stoxx Index25% MSCI AC World Index ex EMU
Pramerica Sicav - Obiettivo Sviluppo
25% ICE BofAML Euro Large Cap Index40% Euro Stoxx Index35% MSCI AC World Index ex EMU Index
Pramerica Sicav - Globo (Global Bond) 100% Bloomberg Barclays Global Aggregate Index
Pramerica Sicav - US Core Equity95% S&P 500 TREUR5% ICE BofAML Euro Treasury Bill Index.
Pramerica Sicav - Global Inflation Linked
60% ICE BofAML 1-10 Year Euro Inflation Linked Gov Index30% ICE BofAML 1-10 Year US Inflation Linked Treasury Index10% ICE BofAML 1-10 Year UK Inflation Linked Gilt Index
Pramerica Sicav - Strategic Bond (1)
Pramerica Sicav - Euro High Yield 100% ICE BofAML BB-B Euro HighYield Index
Pramerica Sicav - Italian Mid Cap Equity95% FTSE Italia Mid Cap Index5% ICE BofAML Euro Treasury
Pramerica Sicav - Global Infrastructure95% S&P Global Infrastructure Index5% ICE BofAML Euro Treasury Bill Index
Pramerica Sicav - Inflation Linked Euro Hedged
60% ICE BofAML 1-10 Year Euro Inflation-Linked GovernmentIndex30% ICE BofAML 1-10 Year US Inflation-Linked Treasury (EuroHedged) Index10% ICE BofAML 1-10 Year UK Inflation-Linked Gilt (EuroHedged) Index
The others sub-funds, not in the above table, are not subject to performance fees.
Pramerica Sicav
308
Notes to the Financial Statementsas at June 30, 2019 (continued)
(1) Due to its investment policy the sub-fund has no benchmark.
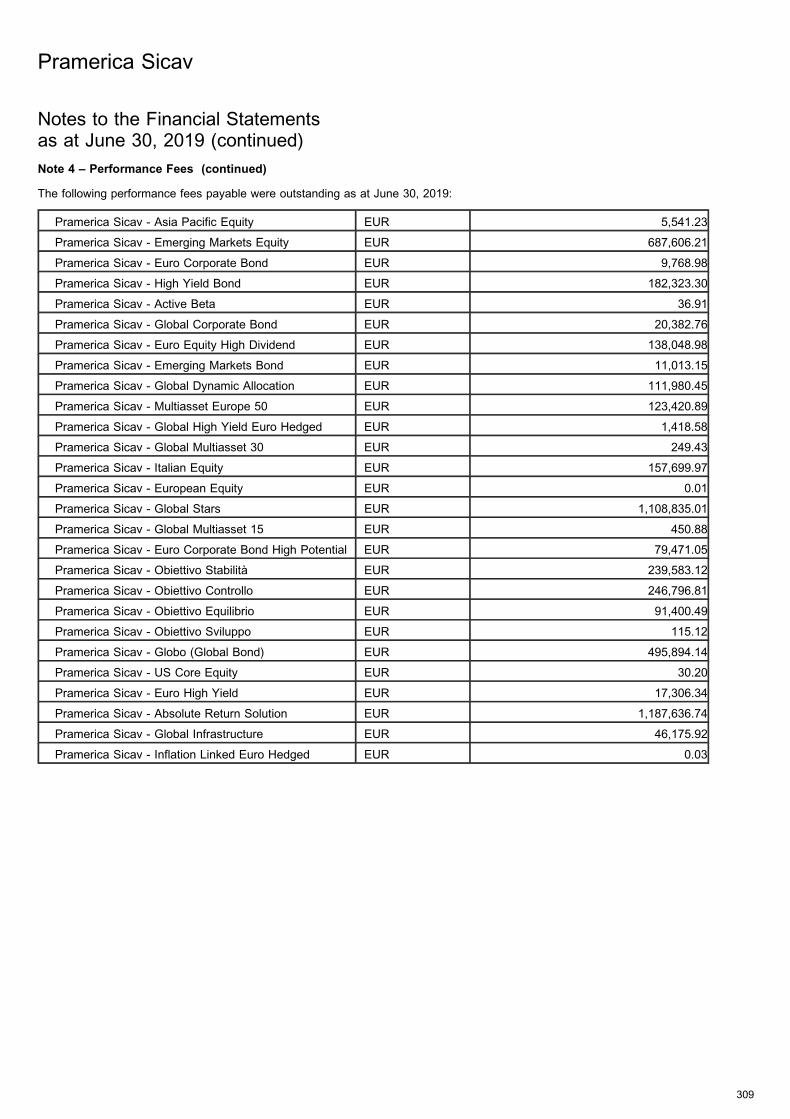
Note 4 – Performance Fees (continued)
The following performance fees payable were outstanding as at June 30, 2019:
Pramerica Sicav - Asia Pacific Equity EUR 5,541.23
Pramerica Sicav - Emerging Markets Equity EUR 687,606.21
Pramerica Sicav - Euro Corporate Bond EUR 9,768.98
Pramerica Sicav - High Yield Bond EUR 182,323.30
Pramerica Sicav - Active Beta EUR 36.91
Pramerica Sicav - Global Corporate Bond EUR 20,382.76
Pramerica Sicav - Euro Equity High Dividend EUR 138,048.98
Pramerica Sicav - Emerging Markets Bond EUR 11,013.15
Pramerica Sicav - Global Dynamic Allocation EUR 111,980.45
Pramerica Sicav - Multiasset Europe 50 EUR 123,420.89
Pramerica Sicav - Global High Yield Euro Hedged EUR 1,418.58
Pramerica Sicav - Global Multiasset 30 EUR 249.43
Pramerica Sicav - Italian Equity EUR 157,699.97
Pramerica Sicav - European Equity EUR 0.01
Pramerica Sicav - Global Stars EUR 1,108,835.01
Pramerica Sicav - Global Multiasset 15 EUR 450.88
Pramerica Sicav - Euro Corporate Bond High Potential EUR 79,471.05
Pramerica Sicav - Obiettivo Stabilita EUR 239,583.12
Pramerica Sicav - Obiettivo Controllo EUR 246,796.81
Pramerica Sicav - Obiettivo Equilibrio EUR 91,400.49
Pramerica Sicav - Obiettivo Sviluppo EUR 115.12
Pramerica Sicav - Globo (Global Bond) EUR 495,894.14
Pramerica Sicav - US Core Equity EUR 30.20
Pramerica Sicav - Euro High Yield EUR 17,306.34
Pramerica Sicav - Absolute Return Solution EUR 1,187,636.74
Pramerica Sicav - Global Infrastructure EUR 46,175.92
Pramerica Sicav - Inflation Linked Euro Hedged EUR 0.03
Pramerica Sicav
309
Notes to the Financial Statementsas at June 30, 2019 (continued)
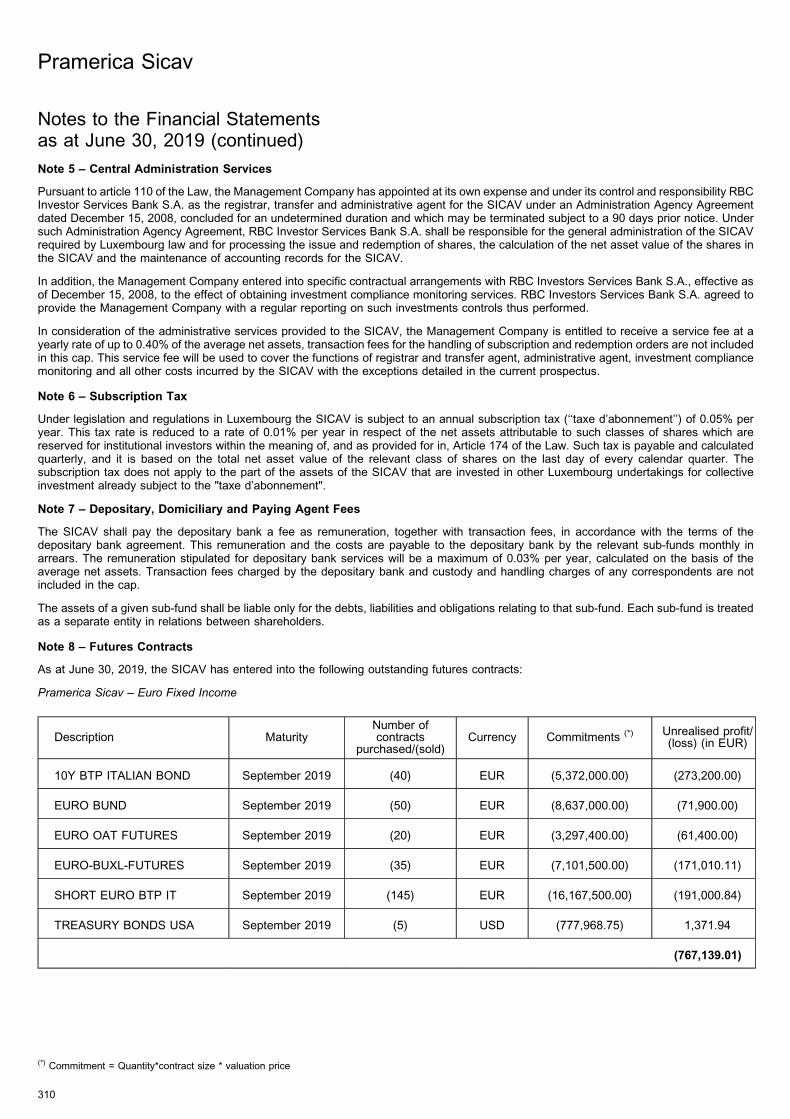
Note 5 – Central Administration Services
Pursuant to article 110 of the Law, the Management Company has appointed at its own expense and under its control and responsibility RBCInvestor Services Bank S.A. as the registrar, transfer and administrative agent for the SICAV under an Administration Agency Agreementdated December 15, 2008, concluded for an undetermined duration and which may be terminated subject to a 90 days prior notice. Undersuch Administration Agency Agreement, RBC Investor Services Bank S.A. shall be responsible for the general administration of the SICAVrequired by Luxembourg law and for processing the issue and redemption of shares, the calculation of the net asset value of the shares inthe SICAV and the maintenance of accounting records for the SICAV.
In addition, the Management Company entered into specific contractual arrangements with RBC Investors Services Bank S.A., effective asof December 15, 2008, to the effect of obtaining investment compliance monitoring services. RBC Investors Services Bank S.A. agreed toprovide the Management Company with a regular reporting on such investments controls thus performed.
In consideration of the administrative services provided to the SICAV, the Management Company is entitled to receive a service fee at ayearly rate of up to 0.40% of the average net assets, transaction fees for the handling of subscription and redemption orders are not includedin this cap. This service fee will be used to cover the functions of registrar and transfer agent, administrative agent, investment compliancemonitoring and all other costs incurred by the SICAV with the exceptions detailed in the current prospectus.
Note 6 – Subscription Tax
Under legislation and regulations in Luxembourg the SICAV is subject to an annual subscription tax (‘‘taxe d’abonnement’’) of 0.05% peryear. This tax rate is reduced to a rate of 0.01% per year in respect of the net assets attributable to such classes of shares which arereserved for institutional investors within the meaning of, and as provided for in, Article 174 of the Law. Such tax is payable and calculatedquarterly, and it is based on the total net asset value of the relevant class of shares on the last day of every calendar quarter. Thesubscription tax does not apply to the part of the assets of the SICAV that are invested in other Luxembourg undertakings for collectiveinvestment already subject to the "taxe d’abonnement".
Note 7 – Depositary, Domiciliary and Paying Agent Fees
The SICAV shall pay the depositary bank a fee as remuneration, together with transaction fees, in accordance with the terms of thedepositary bank agreement. This remuneration and the costs are payable to the depositary bank by the relevant sub-funds monthly inarrears. The remuneration stipulated for depositary bank services will be a maximum of 0.03% per year, calculated on the basis of theaverage net assets. Transaction fees charged by the depositary bank and custody and handling charges of any correspondents are notincluded in the cap.
The assets of a given sub-fund shall be liable only for the debts, liabilities and obligations relating to that sub-fund. Each sub-fund is treatedas a separate entity in relations between shareholders.
Note 8 – Futures Contracts
As at June 30, 2019, the SICAV has entered into the following outstanding futures contracts:
Pramerica Sicav – Euro Fixed Income
Description MaturityNumber ofcontracts
purchased/(sold)Currency Commitments (*) Unrealised profit/
(loss) (in EUR)
10Y BTP ITALIAN BOND September 2019 (40) EUR (5,372,000.00) (273,200.00)
EURO BUND September 2019 (50) EUR (8,637,000.00) (71,900.00)
EURO OAT FUTURES September 2019 (20) EUR (3,297,400.00) (61,400.00)
EURO-BUXL-FUTURES September 2019 (35) EUR (7,101,500.00) (171,010.11)
SHORT EURO BTP IT September 2019 (145) EUR (16,167,500.00) (191,000.84)
TREASURY BONDS USA September 2019 (5) USD (777,968.75) 1,371.94
(767,139.01)
Pramerica Sicav
310
Notes to the Financial Statementsas at June 30, 2019 (continued)
(*) Commitment = Quantity*contract size * valuation price
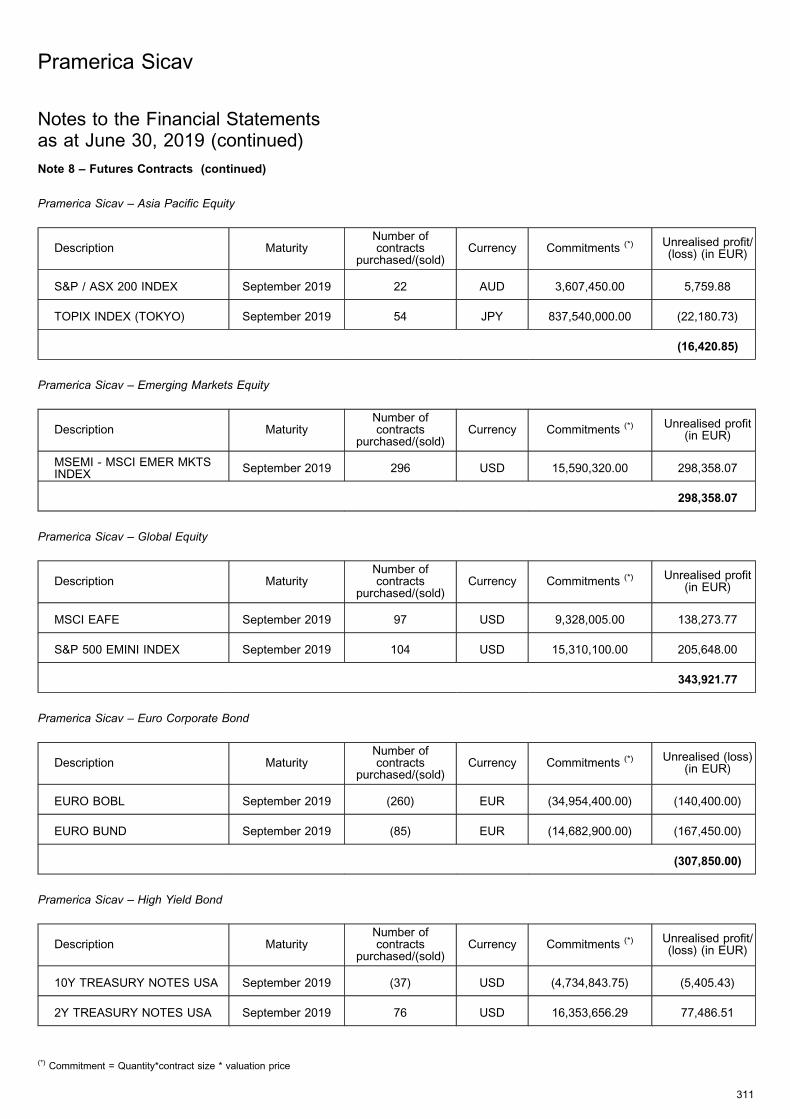
Note 8 – Futures Contracts (continued)
Pramerica Sicav – Asia Pacific Equity
Description MaturityNumber ofcontracts
purchased/(sold)Currency Commitments (*) Unrealised profit/
(loss) (in EUR)
S&P / ASX 200 INDEX September 2019 22 AUD 3,607,450.00 5,759.88
TOPIX INDEX (TOKYO) September 2019 54 JPY 837,540,000.00 (22,180.73)
(16,420.85)
Pramerica Sicav – Emerging Markets Equity
Description MaturityNumber ofcontracts
purchased/(sold)Currency Commitments (*) Unrealised profit
(in EUR)
MSEMI - MSCI EMER MKTSINDEX
September 2019 296 USD 15,590,320.00 298,358.07
298,358.07
Pramerica Sicav – Global Equity
Description MaturityNumber ofcontracts
purchased/(sold)Currency Commitments (*) Unrealised profit
(in EUR)
MSCI EAFE September 2019 97 USD 9,328,005.00 138,273.77
S&P 500 EMINI INDEX September 2019 104 USD 15,310,100.00 205,648.00
343,921.77
Pramerica Sicav – Euro Corporate Bond
Description MaturityNumber ofcontracts
purchased/(sold)Currency Commitments (*) Unrealised (loss)
(in EUR)
EURO BOBL September 2019 (260) EUR (34,954,400.00) (140,400.00)
EURO BUND September 2019 (85) EUR (14,682,900.00) (167,450.00)
(307,850.00)
Pramerica Sicav – High Yield Bond
Description MaturityNumber ofcontracts
purchased/(sold)Currency Commitments (*) Unrealised profit/
(loss) (in EUR)
10Y TREASURY NOTES USA September 2019 (37) USD (4,734,843.75) (5,405.43)
2Y TREASURY NOTES USA September 2019 76 USD 16,353,656.29 77,486.51
Pramerica Sicav
311
Notes to the Financial Statementsas at June 30, 2019 (continued)
(*) Commitment = Quantity*contract size * valuation price
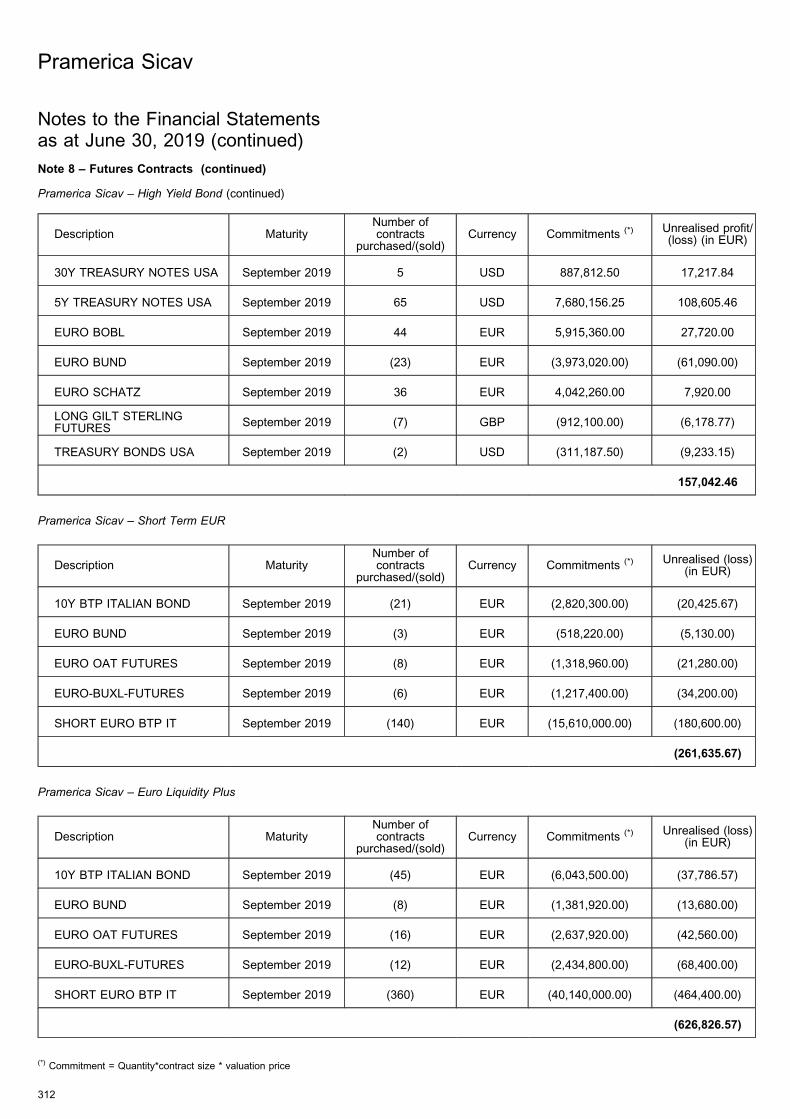
Note 8 – Futures Contracts (continued)
Pramerica Sicav – High Yield Bond (continued)
Description MaturityNumber ofcontracts
purchased/(sold)Currency Commitments (*) Unrealised profit/
(loss) (in EUR)
30Y TREASURY NOTES USA September 2019 5 USD 887,812.50 17,217.84
5Y TREASURY NOTES USA September 2019 65 USD 7,680,156.25 108,605.46
EURO BOBL September 2019 44 EUR 5,915,360.00 27,720.00
EURO BUND September 2019 (23) EUR (3,973,020.00) (61,090.00)
EURO SCHATZ September 2019 36 EUR 4,042,260.00 7,920.00
LONG GILT STERLINGFUTURES
September 2019 (7) GBP (912,100.00) (6,178.77)
TREASURY BONDS USA September 2019 (2) USD (311,187.50) (9,233.15)
157,042.46
Pramerica Sicav – Short Term EUR
Description MaturityNumber ofcontracts
purchased/(sold)Currency Commitments (*) Unrealised (loss)
(in EUR)
10Y BTP ITALIAN BOND September 2019 (21) EUR (2,820,300.00) (20,425.67)
EURO BUND September 2019 (3) EUR (518,220.00) (5,130.00)
EURO OAT FUTURES September 2019 (8) EUR (1,318,960.00) (21,280.00)
EURO-BUXL-FUTURES September 2019 (6) EUR (1,217,400.00) (34,200.00)
SHORT EURO BTP IT September 2019 (140) EUR (15,610,000.00) (180,600.00)
(261,635.67)
Pramerica Sicav – Euro Liquidity Plus
Description MaturityNumber ofcontracts
purchased/(sold)Currency Commitments (*) Unrealised (loss)
(in EUR)
10Y BTP ITALIAN BOND September 2019 (45) EUR (6,043,500.00) (37,786.57)
EURO BUND September 2019 (8) EUR (1,381,920.00) (13,680.00)
EURO OAT FUTURES September 2019 (16) EUR (2,637,920.00) (42,560.00)
EURO-BUXL-FUTURES September 2019 (12) EUR (2,434,800.00) (68,400.00)
SHORT EURO BTP IT September 2019 (360) EUR (40,140,000.00) (464,400.00)
(626,826.57)
Pramerica Sicav
312
Notes to the Financial Statementsas at June 30, 2019 (continued)
(*) Commitment = Quantity*contract size * valuation price
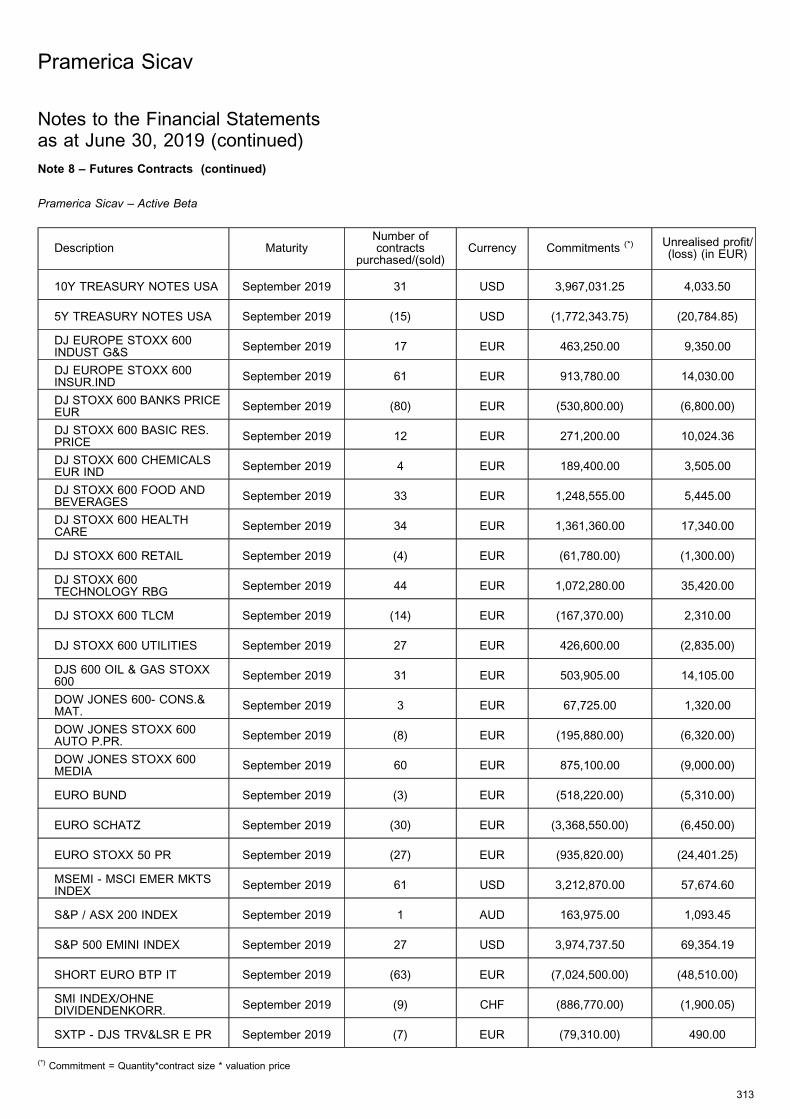
Note 8 – Futures Contracts (continued)
Pramerica Sicav – Active Beta
Description MaturityNumber ofcontracts
purchased/(sold)Currency Commitments (*) Unrealised profit/
(loss) (in EUR)
10Y TREASURY NOTES USA September 2019 31 USD 3,967,031.25 4,033.50
5Y TREASURY NOTES USA September 2019 (15) USD (1,772,343.75) (20,784.85)
DJ EUROPE STOXX 600INDUST G&S
September 2019 17 EUR 463,250.00 9,350.00
DJ EUROPE STOXX 600INSUR.IND
September 2019 61 EUR 913,780.00 14,030.00
DJ STOXX 600 BANKS PRICEEUR
September 2019 (80) EUR (530,800.00) (6,800.00)
DJ STOXX 600 BASIC RES.PRICE
September 2019 12 EUR 271,200.00 10,024.36
DJ STOXX 600 CHEMICALSEUR IND
September 2019 4 EUR 189,400.00 3,505.00
DJ STOXX 600 FOOD ANDBEVERAGES
September 2019 33 EUR 1,248,555.00 5,445.00
DJ STOXX 600 HEALTHCARE
September 2019 34 EUR 1,361,360.00 17,340.00
DJ STOXX 600 RETAIL September 2019 (4) EUR (61,780.00) (1,300.00)
DJ STOXX 600TECHNOLOGY RBG
September 2019 44 EUR 1,072,280.00 35,420.00
DJ STOXX 600 TLCM September 2019 (14) EUR (167,370.00) 2,310.00
DJ STOXX 600 UTILITIES September 2019 27 EUR 426,600.00 (2,835.00)
DJS 600 OIL & GAS STOXX600
September 2019 31 EUR 503,905.00 14,105.00
DOW JONES 600- CONS.&MAT.
September 2019 3 EUR 67,725.00 1,320.00
DOW JONES STOXX 600AUTO P.PR.
September 2019 (8) EUR (195,880.00) (6,320.00)
DOW JONES STOXX 600MEDIA
September 2019 60 EUR 875,100.00 (9,000.00)
EURO BUND September 2019 (3) EUR (518,220.00) (5,310.00)
EURO SCHATZ September 2019 (30) EUR (3,368,550.00) (6,450.00)
EURO STOXX 50 PR September 2019 (27) EUR (935,820.00) (24,401.25)
MSEMI - MSCI EMER MKTSINDEX
September 2019 61 USD 3,212,870.00 57,674.60
S&P / ASX 200 INDEX September 2019 1 AUD 163,975.00 1,093.45
S&P 500 EMINI INDEX September 2019 27 USD 3,974,737.50 69,354.19
SHORT EURO BTP IT September 2019 (63) EUR (7,024,500.00) (48,510.00)
SMI INDEX/OHNEDIVIDENDENKORR.
September 2019 (9) CHF (886,770.00) (1,900.05)
SXTP - DJS TRV&LSR E PR September 2019 (7) EUR (79,310.00) 490.00
Pramerica Sicav
313
Notes to the Financial Statementsas at June 30, 2019 (continued)
(*) Commitment = Quantity*contract size * valuation price
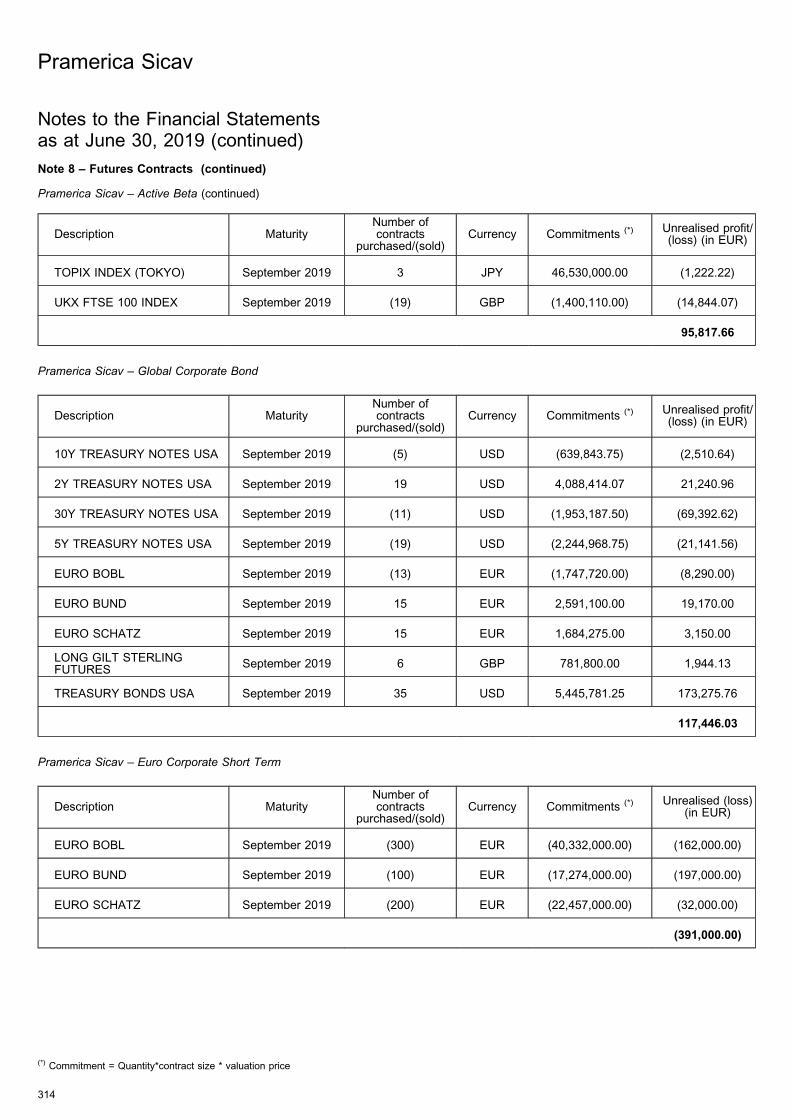
Note 8 – Futures Contracts (continued)
Pramerica Sicav – Active Beta (continued)
Description MaturityNumber ofcontracts
purchased/(sold)Currency Commitments (*) Unrealised profit/
(loss) (in EUR)
TOPIX INDEX (TOKYO) September 2019 3 JPY 46,530,000.00 (1,222.22)
UKX FTSE 100 INDEX September 2019 (19) GBP (1,400,110.00) (14,844.07)
95,817.66
Pramerica Sicav – Global Corporate Bond
Description MaturityNumber ofcontracts
purchased/(sold)Currency Commitments (*) Unrealised profit/
(loss) (in EUR)
10Y TREASURY NOTES USA September 2019 (5) USD (639,843.75) (2,510.64)
2Y TREASURY NOTES USA September 2019 19 USD 4,088,414.07 21,240.96
30Y TREASURY NOTES USA September 2019 (11) USD (1,953,187.50) (69,392.62)
5Y TREASURY NOTES USA September 2019 (19) USD (2,244,968.75) (21,141.56)
EURO BOBL September 2019 (13) EUR (1,747,720.00) (8,290.00)
EURO BUND September 2019 15 EUR 2,591,100.00 19,170.00
EURO SCHATZ September 2019 15 EUR 1,684,275.00 3,150.00
LONG GILT STERLINGFUTURES
September 2019 6 GBP 781,800.00 1,944.13
TREASURY BONDS USA September 2019 35 USD 5,445,781.25 173,275.76
117,446.03
Pramerica Sicav – Euro Corporate Short Term
Description MaturityNumber ofcontracts
purchased/(sold)Currency Commitments (*) Unrealised (loss)
(in EUR)
EURO BOBL September 2019 (300) EUR (40,332,000.00) (162,000.00)
EURO BUND September 2019 (100) EUR (17,274,000.00) (197,000.00)
EURO SCHATZ September 2019 (200) EUR (22,457,000.00) (32,000.00)
(391,000.00)
Pramerica Sicav
314
Notes to the Financial Statementsas at June 30, 2019 (continued)
(*) Commitment = Quantity*contract size * valuation price
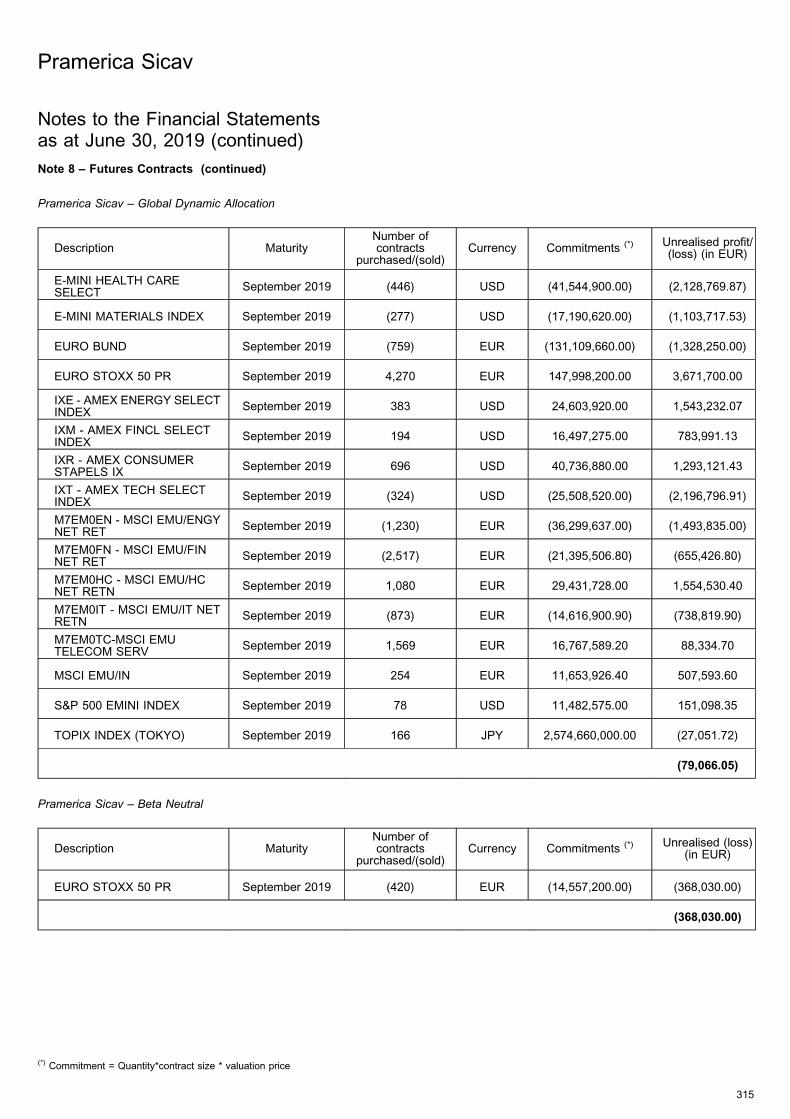
Note 8 – Futures Contracts (continued)
Pramerica Sicav – Global Dynamic Allocation
Description MaturityNumber ofcontracts
purchased/(sold)Currency Commitments (*) Unrealised profit/
(loss) (in EUR)
E-MINI HEALTH CARESELECT
September 2019 (446) USD (41,544,900.00) (2,128,769.87)
E-MINI MATERIALS INDEX September 2019 (277) USD (17,190,620.00) (1,103,717.53)
EURO BUND September 2019 (759) EUR (131,109,660.00) (1,328,250.00)
EURO STOXX 50 PR September 2019 4,270 EUR 147,998,200.00 3,671,700.00
IXE - AMEX ENERGY SELECTINDEX
September 2019 383 USD 24,603,920.00 1,543,232.07
IXM - AMEX FINCL SELECTINDEX
September 2019 194 USD 16,497,275.00 783,991.13
IXR - AMEX CONSUMERSTAPELS IX
September 2019 696 USD 40,736,880.00 1,293,121.43
IXT - AMEX TECH SELECTINDEX
September 2019 (324) USD (25,508,520.00) (2,196,796.91)
M7EM0EN - MSCI EMU/ENGYNET RET
September 2019 (1,230) EUR (36,299,637.00) (1,493,835.00)
M7EM0FN - MSCI EMU/FINNET RET
September 2019 (2,517) EUR (21,395,506.80) (655,426.80)
M7EM0HC - MSCI EMU/HCNET RETN
September 2019 1,080 EUR 29,431,728.00 1,554,530.40
M7EM0IT - MSCI EMU/IT NETRETN
September 2019 (873) EUR (14,616,900.90) (738,819.90)
M7EM0TC-MSCI EMUTELECOM SERV
September 2019 1,569 EUR 16,767,589.20 88,334.70
MSCI EMU/IN September 2019 254 EUR 11,653,926.40 507,593.60
S&P 500 EMINI INDEX September 2019 78 USD 11,482,575.00 151,098.35
TOPIX INDEX (TOKYO) September 2019 166 JPY 2,574,660,000.00 (27,051.72)
(79,066.05)
Pramerica Sicav – Beta Neutral
Description MaturityNumber ofcontracts
purchased/(sold)Currency Commitments (*) Unrealised (loss)
(in EUR)
EURO STOXX 50 PR September 2019 (420) EUR (14,557,200.00) (368,030.00)
(368,030.00)
Pramerica Sicav
315
Notes to the Financial Statementsas at June 30, 2019 (continued)
(*) Commitment = Quantity*contract size * valuation price
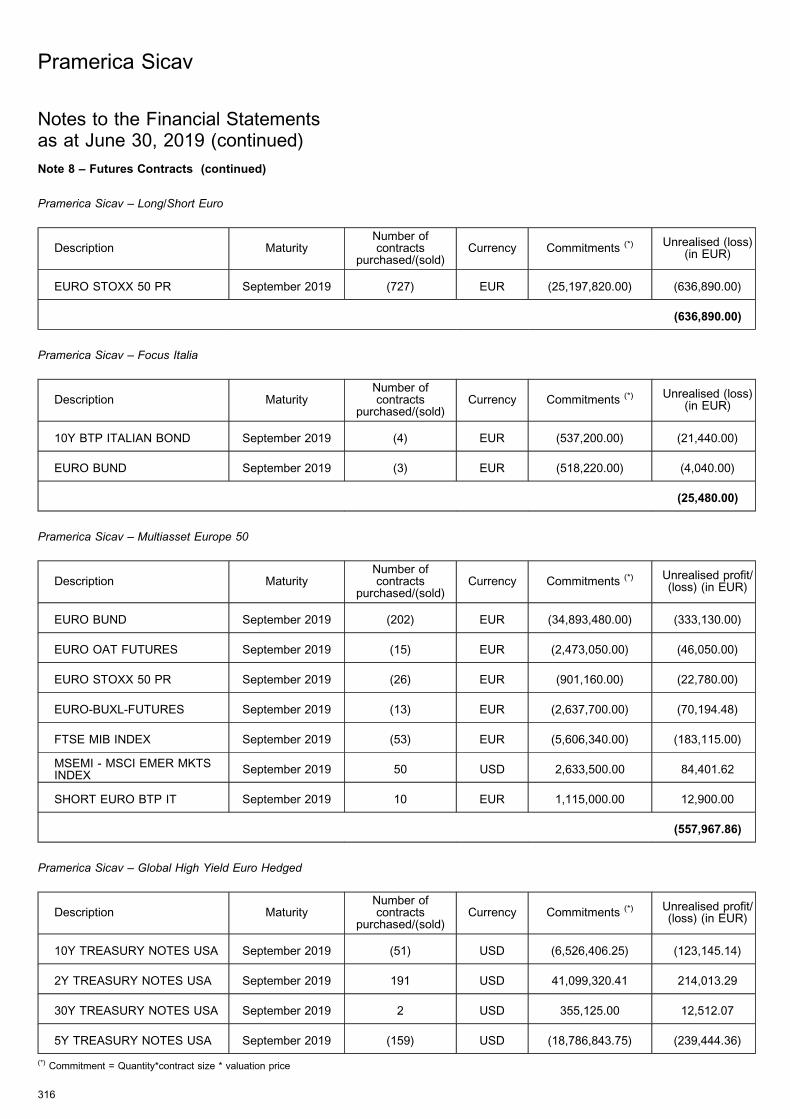
Note 8 – Futures Contracts (continued)
Pramerica Sicav – Long/Short Euro
Description MaturityNumber ofcontracts
purchased/(sold)Currency Commitments (*) Unrealised (loss)
(in EUR)
EURO STOXX 50 PR September 2019 (727) EUR (25,197,820.00) (636,890.00)
(636,890.00)
Pramerica Sicav – Focus Italia
Description MaturityNumber ofcontracts
purchased/(sold)Currency Commitments (*) Unrealised (loss)
(in EUR)
10Y BTP ITALIAN BOND September 2019 (4) EUR (537,200.00) (21,440.00)
EURO BUND September 2019 (3) EUR (518,220.00) (4,040.00)
(25,480.00)
Pramerica Sicav – Multiasset Europe 50
Description MaturityNumber ofcontracts
purchased/(sold)Currency Commitments (*) Unrealised profit/
(loss) (in EUR)
EURO BUND September 2019 (202) EUR (34,893,480.00) (333,130.00)
EURO OAT FUTURES September 2019 (15) EUR (2,473,050.00) (46,050.00)
EURO STOXX 50 PR September 2019 (26) EUR (901,160.00) (22,780.00)
EURO-BUXL-FUTURES September 2019 (13) EUR (2,637,700.00) (70,194.48)
FTSE MIB INDEX September 2019 (53) EUR (5,606,340.00) (183,115.00)
MSEMI - MSCI EMER MKTSINDEX
September 2019 50 USD 2,633,500.00 84,401.62
SHORT EURO BTP IT September 2019 10 EUR 1,115,000.00 12,900.00
(557,967.86)
Pramerica Sicav – Global High Yield Euro Hedged
Description MaturityNumber ofcontracts
purchased/(sold)Currency Commitments (*) Unrealised profit/
(loss) (in EUR)
10Y TREASURY NOTES USA September 2019 (51) USD (6,526,406.25) (123,145.14)
2Y TREASURY NOTES USA September 2019 191 USD 41,099,320.41 214,013.29
30Y TREASURY NOTES USA September 2019 2 USD 355,125.00 12,512.07
5Y TREASURY NOTES USA September 2019 (159) USD (18,786,843.75) (239,444.36)
Pramerica Sicav
316
Notes to the Financial Statementsas at June 30, 2019 (continued)
(*) Commitment = Quantity*contract size * valuation price
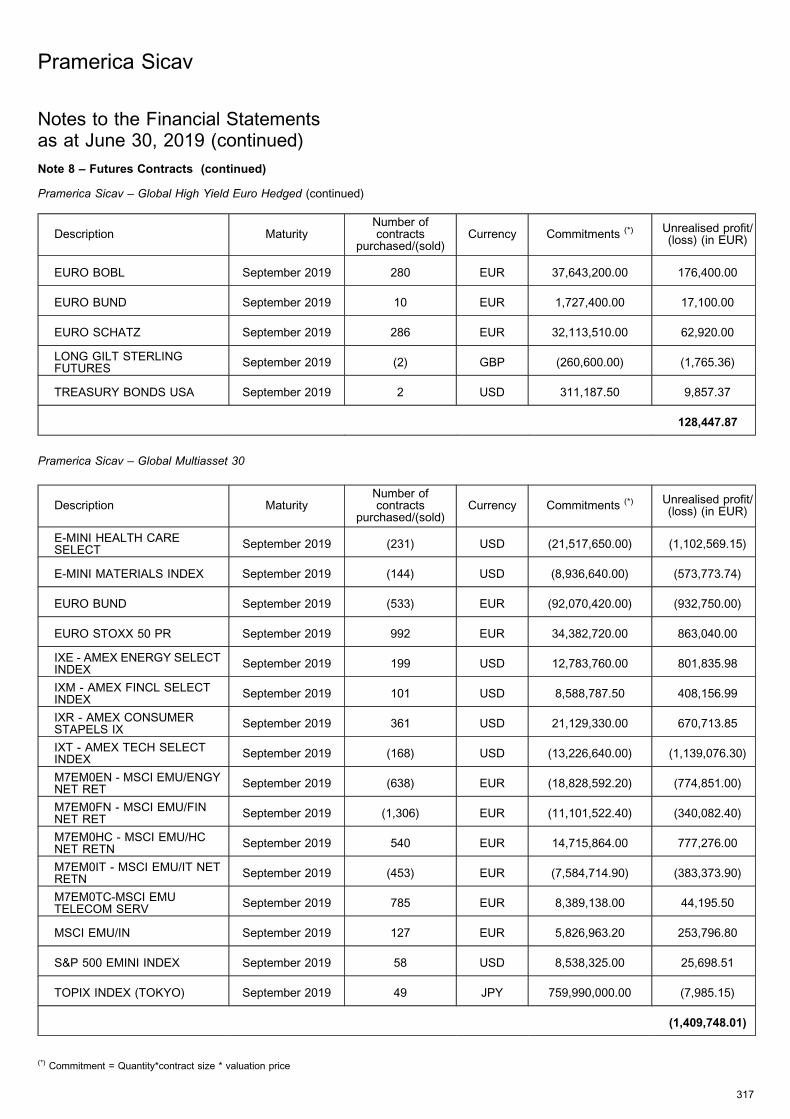
Note 8 – Futures Contracts (continued)
Pramerica Sicav – Global High Yield Euro Hedged (continued)
Description MaturityNumber ofcontracts
purchased/(sold)Currency Commitments (*) Unrealised profit/
(loss) (in EUR)
EURO BOBL September 2019 280 EUR 37,643,200.00 176,400.00
EURO BUND September 2019 10 EUR 1,727,400.00 17,100.00
EURO SCHATZ September 2019 286 EUR 32,113,510.00 62,920.00
LONG GILT STERLINGFUTURES
September 2019 (2) GBP (260,600.00) (1,765.36)
TREASURY BONDS USA September 2019 2 USD 311,187.50 9,857.37
128,447.87
Pramerica Sicav – Global Multiasset 30
Description MaturityNumber ofcontracts
purchased/(sold)Currency Commitments (*) Unrealised profit/
(loss) (in EUR)
E-MINI HEALTH CARESELECT
September 2019 (231) USD (21,517,650.00) (1,102,569.15)
E-MINI MATERIALS INDEX September 2019 (144) USD (8,936,640.00) (573,773.74)
EURO BUND September 2019 (533) EUR (92,070,420.00) (932,750.00)
EURO STOXX 50 PR September 2019 992 EUR 34,382,720.00 863,040.00
IXE - AMEX ENERGY SELECTINDEX
September 2019 199 USD 12,783,760.00 801,835.98
IXM - AMEX FINCL SELECTINDEX
September 2019 101 USD 8,588,787.50 408,156.99
IXR - AMEX CONSUMERSTAPELS IX
September 2019 361 USD 21,129,330.00 670,713.85
IXT - AMEX TECH SELECTINDEX
September 2019 (168) USD (13,226,640.00) (1,139,076.30)
M7EM0EN - MSCI EMU/ENGYNET RET
September 2019 (638) EUR (18,828,592.20) (774,851.00)
M7EM0FN - MSCI EMU/FINNET RET
September 2019 (1,306) EUR (11,101,522.40) (340,082.40)
M7EM0HC - MSCI EMU/HCNET RETN
September 2019 540 EUR 14,715,864.00 777,276.00
M7EM0IT - MSCI EMU/IT NETRETN
September 2019 (453) EUR (7,584,714.90) (383,373.90)
M7EM0TC-MSCI EMUTELECOM SERV
September 2019 785 EUR 8,389,138.00 44,195.50
MSCI EMU/IN September 2019 127 EUR 5,826,963.20 253,796.80
S&P 500 EMINI INDEX September 2019 58 USD 8,538,325.00 25,698.51
TOPIX INDEX (TOKYO) September 2019 49 JPY 759,990,000.00 (7,985.15)
(1,409,748.01)
Pramerica Sicav
317
Notes to the Financial Statementsas at June 30, 2019 (continued)
(*) Commitment = Quantity*contract size * valuation price
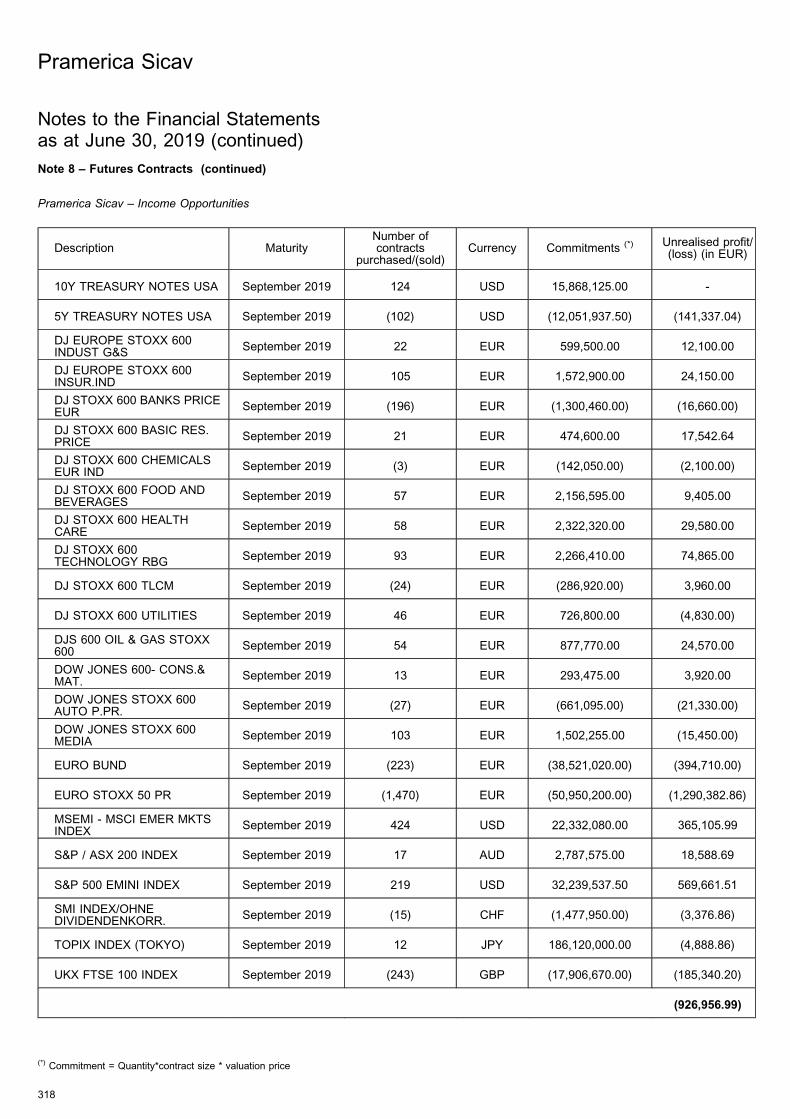
Note 8 – Futures Contracts (continued)
Pramerica Sicav – Income Opportunities
Description MaturityNumber ofcontracts
purchased/(sold)Currency Commitments (*) Unrealised profit/
(loss) (in EUR)
10Y TREASURY NOTES USA September 2019 124 USD 15,868,125.00 -
5Y TREASURY NOTES USA September 2019 (102) USD (12,051,937.50) (141,337.04)
DJ EUROPE STOXX 600INDUST G&S
September 2019 22 EUR 599,500.00 12,100.00
DJ EUROPE STOXX 600INSUR.IND
September 2019 105 EUR 1,572,900.00 24,150.00
DJ STOXX 600 BANKS PRICEEUR
September 2019 (196) EUR (1,300,460.00) (16,660.00)
DJ STOXX 600 BASIC RES.PRICE
September 2019 21 EUR 474,600.00 17,542.64
DJ STOXX 600 CHEMICALSEUR IND
September 2019 (3) EUR (142,050.00) (2,100.00)
DJ STOXX 600 FOOD ANDBEVERAGES
September 2019 57 EUR 2,156,595.00 9,405.00
DJ STOXX 600 HEALTHCARE
September 2019 58 EUR 2,322,320.00 29,580.00
DJ STOXX 600TECHNOLOGY RBG
September 2019 93 EUR 2,266,410.00 74,865.00
DJ STOXX 600 TLCM September 2019 (24) EUR (286,920.00) 3,960.00
DJ STOXX 600 UTILITIES September 2019 46 EUR 726,800.00 (4,830.00)
DJS 600 OIL & GAS STOXX600
September 2019 54 EUR 877,770.00 24,570.00
DOW JONES 600- CONS.&MAT.
September 2019 13 EUR 293,475.00 3,920.00
DOW JONES STOXX 600AUTO P.PR.
September 2019 (27) EUR (661,095.00) (21,330.00)
DOW JONES STOXX 600MEDIA
September 2019 103 EUR 1,502,255.00 (15,450.00)
EURO BUND September 2019 (223) EUR (38,521,020.00) (394,710.00)
EURO STOXX 50 PR September 2019 (1,470) EUR (50,950,200.00) (1,290,382.86)
MSEMI - MSCI EMER MKTSINDEX
September 2019 424 USD 22,332,080.00 365,105.99
S&P / ASX 200 INDEX September 2019 17 AUD 2,787,575.00 18,588.69
S&P 500 EMINI INDEX September 2019 219 USD 32,239,537.50 569,661.51
SMI INDEX/OHNEDIVIDENDENKORR.
September 2019 (15) CHF (1,477,950.00) (3,376.86)
TOPIX INDEX (TOKYO) September 2019 12 JPY 186,120,000.00 (4,888.86)
UKX FTSE 100 INDEX September 2019 (243) GBP (17,906,670.00) (185,340.20)
(926,956.99)
Pramerica Sicav
318
Notes to the Financial Statementsas at June 30, 2019 (continued)
(*) Commitment = Quantity*contract size * valuation price
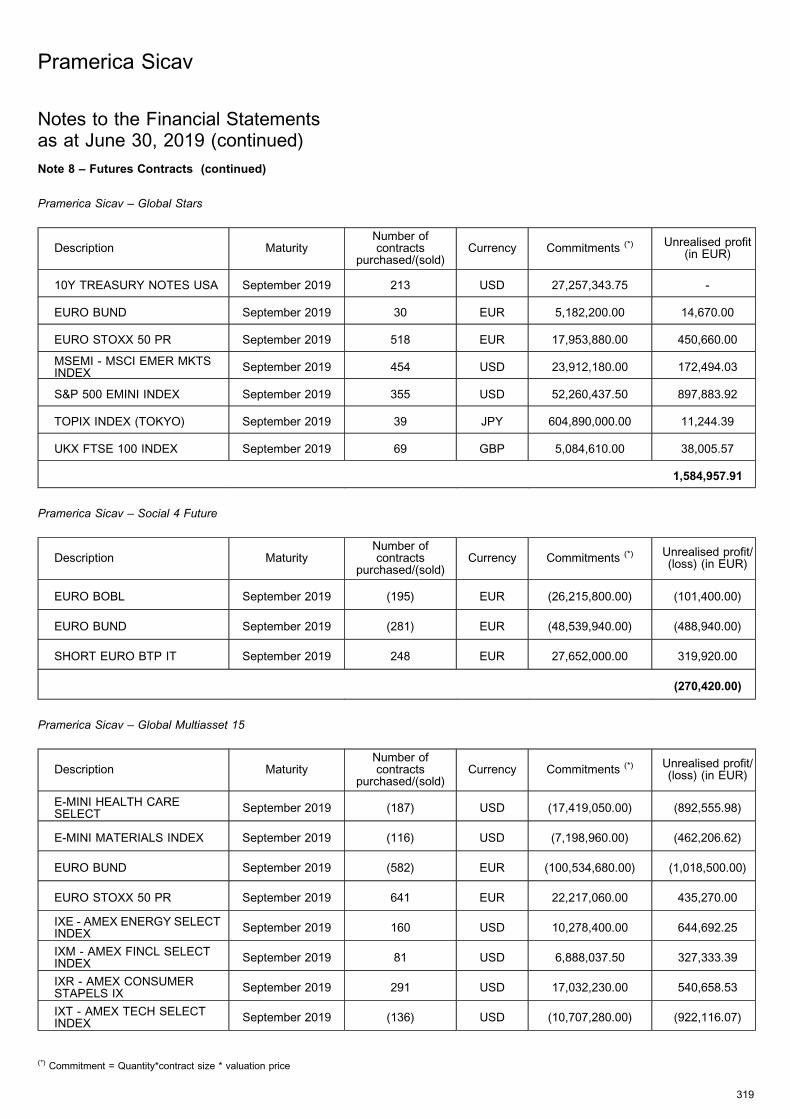
Note 8 – Futures Contracts (continued)
Pramerica Sicav – Global Stars
Description MaturityNumber ofcontracts
purchased/(sold)Currency Commitments (*) Unrealised profit
(in EUR)
10Y TREASURY NOTES USA September 2019 213 USD 27,257,343.75 -
EURO BUND September 2019 30 EUR 5,182,200.00 14,670.00
EURO STOXX 50 PR September 2019 518 EUR 17,953,880.00 450,660.00
MSEMI - MSCI EMER MKTSINDEX
September 2019 454 USD 23,912,180.00 172,494.03
S&P 500 EMINI INDEX September 2019 355 USD 52,260,437.50 897,883.92
TOPIX INDEX (TOKYO) September 2019 39 JPY 604,890,000.00 11,244.39
UKX FTSE 100 INDEX September 2019 69 GBP 5,084,610.00 38,005.57
1,584,957.91
Pramerica Sicav – Social 4 Future
Description MaturityNumber ofcontracts
purchased/(sold)Currency Commitments (*) Unrealised profit/
(loss) (in EUR)
EURO BOBL September 2019 (195) EUR (26,215,800.00) (101,400.00)
EURO BUND September 2019 (281) EUR (48,539,940.00) (488,940.00)
SHORT EURO BTP IT September 2019 248 EUR 27,652,000.00 319,920.00
(270,420.00)
Pramerica Sicav – Global Multiasset 15
Description MaturityNumber ofcontracts
purchased/(sold)Currency Commitments (*) Unrealised profit/
(loss) (in EUR)
E-MINI HEALTH CARESELECT
September 2019 (187) USD (17,419,050.00) (892,555.98)
E-MINI MATERIALS INDEX September 2019 (116) USD (7,198,960.00) (462,206.62)
EURO BUND September 2019 (582) EUR (100,534,680.00) (1,018,500.00)
EURO STOXX 50 PR September 2019 641 EUR 22,217,060.00 435,270.00
IXE - AMEX ENERGY SELECTINDEX
September 2019 160 USD 10,278,400.00 644,692.25
IXM - AMEX FINCL SELECTINDEX
September 2019 81 USD 6,888,037.50 327,333.39
IXR - AMEX CONSUMERSTAPELS IX
September 2019 291 USD 17,032,230.00 540,658.53
IXT - AMEX TECH SELECTINDEX
September 2019 (136) USD (10,707,280.00) (922,116.07)
Pramerica Sicav
319
Notes to the Financial Statementsas at June 30, 2019 (continued)
(*) Commitment = Quantity*contract size * valuation price
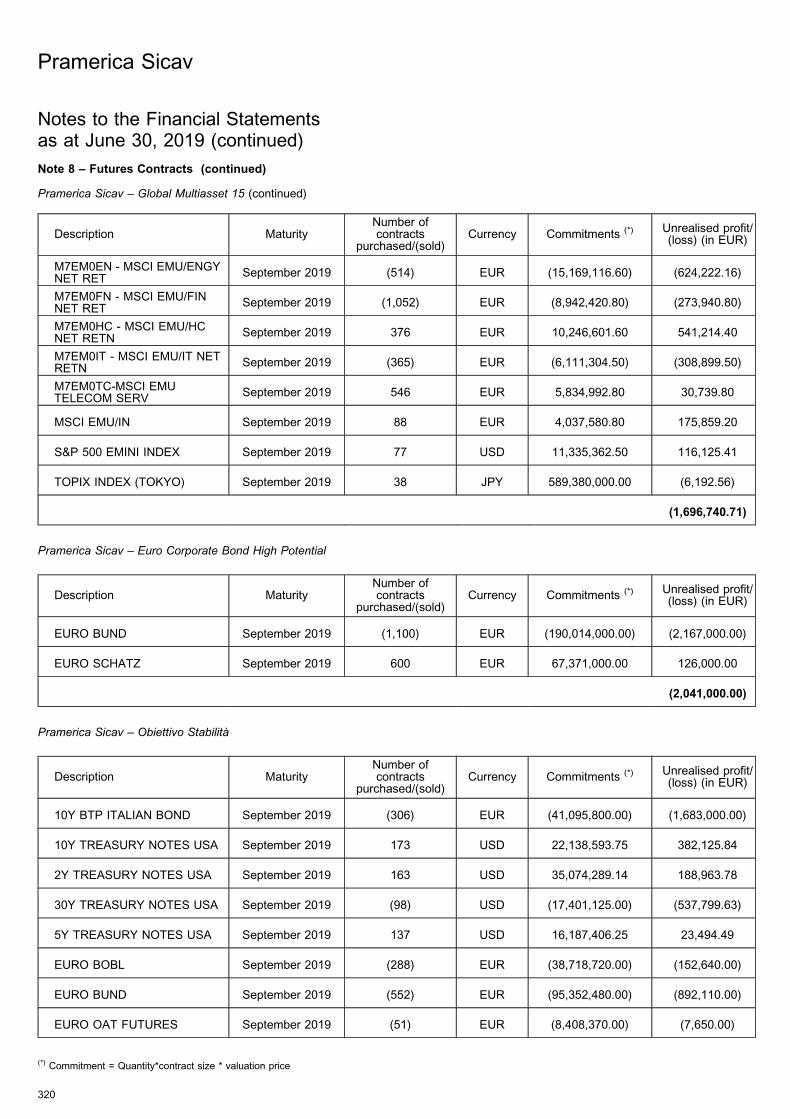
Note 8 – Futures Contracts (continued)
Pramerica Sicav – Global Multiasset 15 (continued)
Description MaturityNumber ofcontracts
purchased/(sold)Currency Commitments (*) Unrealised profit/
(loss) (in EUR)
M7EM0EN - MSCI EMU/ENGYNET RET
September 2019 (514) EUR (15,169,116.60) (624,222.16)
M7EM0FN - MSCI EMU/FINNET RET
September 2019 (1,052) EUR (8,942,420.80) (273,940.80)
M7EM0HC - MSCI EMU/HCNET RETN
September 2019 376 EUR 10,246,601.60 541,214.40
M7EM0IT - MSCI EMU/IT NETRETN
September 2019 (365) EUR (6,111,304.50) (308,899.50)
M7EM0TC-MSCI EMUTELECOM SERV
September 2019 546 EUR 5,834,992.80 30,739.80
MSCI EMU/IN September 2019 88 EUR 4,037,580.80 175,859.20
S&P 500 EMINI INDEX September 2019 77 USD 11,335,362.50 116,125.41
TOPIX INDEX (TOKYO) September 2019 38 JPY 589,380,000.00 (6,192.56)
(1,696,740.71)
Pramerica Sicav – Euro Corporate Bond High Potential
Description MaturityNumber ofcontracts
purchased/(sold)Currency Commitments (*) Unrealised profit/
(loss) (in EUR)
EURO BUND September 2019 (1,100) EUR (190,014,000.00) (2,167,000.00)
EURO SCHATZ September 2019 600 EUR 67,371,000.00 126,000.00
(2,041,000.00)
Pramerica Sicav – Obiettivo Stabilita
Description MaturityNumber ofcontracts
purchased/(sold)Currency Commitments (*) Unrealised profit/
(loss) (in EUR)
10Y BTP ITALIAN BOND September 2019 (306) EUR (41,095,800.00) (1,683,000.00)
10Y TREASURY NOTES USA September 2019 173 USD 22,138,593.75 382,125.84
2Y TREASURY NOTES USA September 2019 163 USD 35,074,289.14 188,963.78
30Y TREASURY NOTES USA September 2019 (98) USD (17,401,125.00) (537,799.63)
5Y TREASURY NOTES USA September 2019 137 USD 16,187,406.25 23,494.49
EURO BOBL September 2019 (288) EUR (38,718,720.00) (152,640.00)
EURO BUND September 2019 (552) EUR (95,352,480.00) (892,110.00)
EURO OAT FUTURES September 2019 (51) EUR (8,408,370.00) (7,650.00)
Pramerica Sicav
320
Notes to the Financial Statementsas at June 30, 2019 (continued)
(*) Commitment = Quantity*contract size * valuation price
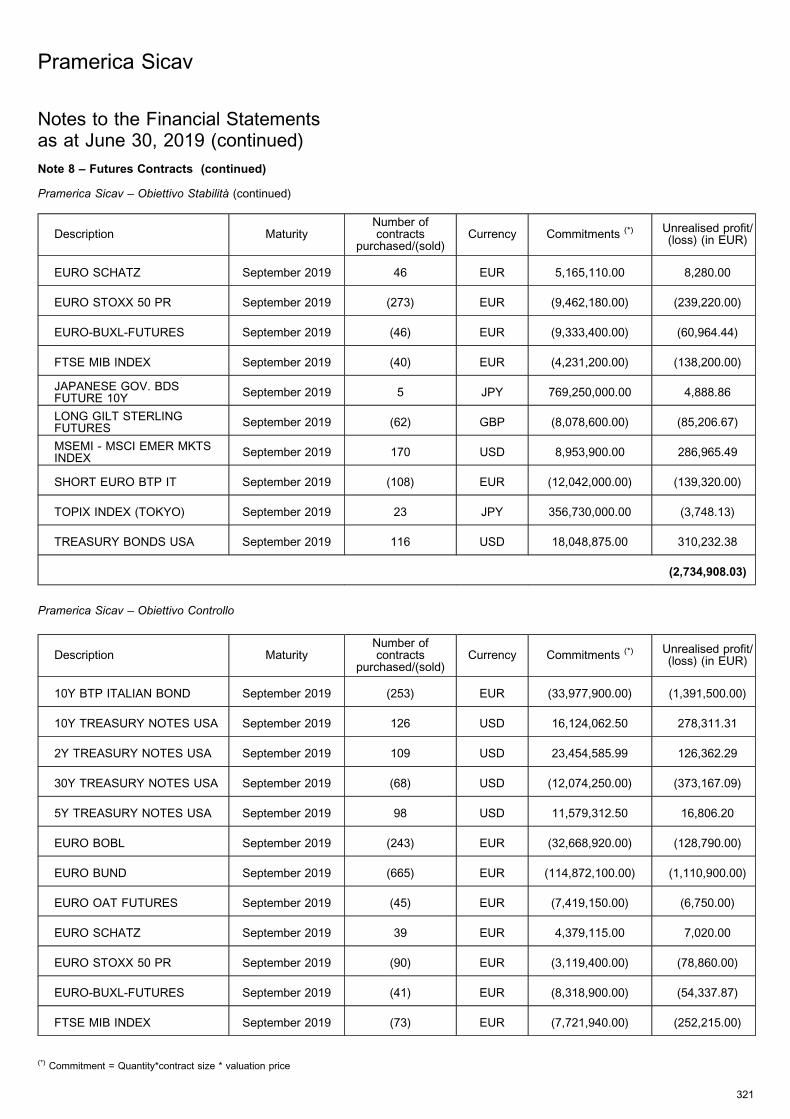
Note 8 – Futures Contracts (continued)
Pramerica Sicav – Obiettivo Stabilita (continued)
Description MaturityNumber ofcontracts
purchased/(sold)Currency Commitments (*) Unrealised profit/
(loss) (in EUR)
EURO SCHATZ September 2019 46 EUR 5,165,110.00 8,280.00
EURO STOXX 50 PR September 2019 (273) EUR (9,462,180.00) (239,220.00)
EURO-BUXL-FUTURES September 2019 (46) EUR (9,333,400.00) (60,964.44)
FTSE MIB INDEX September 2019 (40) EUR (4,231,200.00) (138,200.00)
JAPANESE GOV. BDSFUTURE 10Y
September 2019 5 JPY 769,250,000.00 4,888.86
LONG GILT STERLINGFUTURES
September 2019 (62) GBP (8,078,600.00) (85,206.67)
MSEMI - MSCI EMER MKTSINDEX
September 2019 170 USD 8,953,900.00 286,965.49
SHORT EURO BTP IT September 2019 (108) EUR (12,042,000.00) (139,320.00)
TOPIX INDEX (TOKYO) September 2019 23 JPY 356,730,000.00 (3,748.13)
TREASURY BONDS USA September 2019 116 USD 18,048,875.00 310,232.38
(2,734,908.03)
Pramerica Sicav – Obiettivo Controllo
Description MaturityNumber ofcontracts
purchased/(sold)Currency Commitments (*) Unrealised profit/
(loss) (in EUR)
10Y BTP ITALIAN BOND September 2019 (253) EUR (33,977,900.00) (1,391,500.00)
10Y TREASURY NOTES USA September 2019 126 USD 16,124,062.50 278,311.31
2Y TREASURY NOTES USA September 2019 109 USD 23,454,585.99 126,362.29
30Y TREASURY NOTES USA September 2019 (68) USD (12,074,250.00) (373,167.09)
5Y TREASURY NOTES USA September 2019 98 USD 11,579,312.50 16,806.20
EURO BOBL September 2019 (243) EUR (32,668,920.00) (128,790.00)
EURO BUND September 2019 (665) EUR (114,872,100.00) (1,110,900.00)
EURO OAT FUTURES September 2019 (45) EUR (7,419,150.00) (6,750.00)
EURO SCHATZ September 2019 39 EUR 4,379,115.00 7,020.00
EURO STOXX 50 PR September 2019 (90) EUR (3,119,400.00) (78,860.00)
EURO-BUXL-FUTURES September 2019 (41) EUR (8,318,900.00) (54,337.87)
FTSE MIB INDEX September 2019 (73) EUR (7,721,940.00) (252,215.00)
Pramerica Sicav
321
Notes to the Financial Statementsas at June 30, 2019 (continued)
(*) Commitment = Quantity*contract size * valuation price
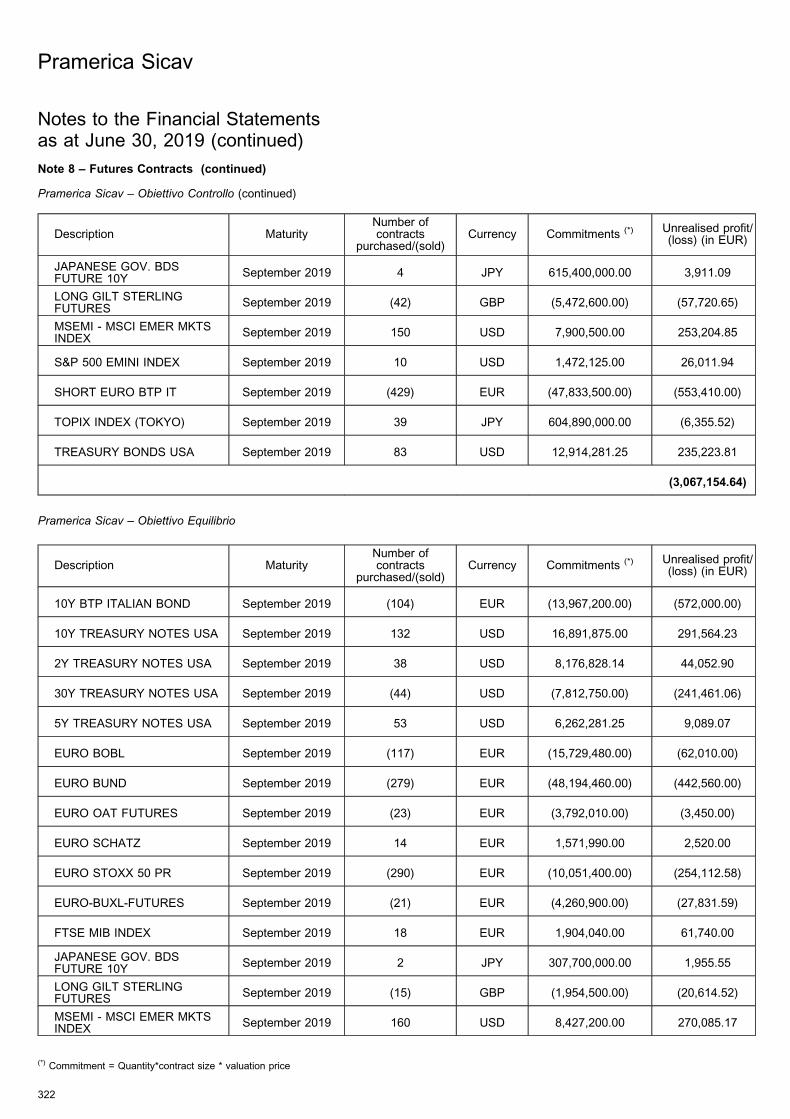
Note 8 – Futures Contracts (continued)
Pramerica Sicav – Obiettivo Controllo (continued)
Description MaturityNumber ofcontracts
purchased/(sold)Currency Commitments (*) Unrealised profit/
(loss) (in EUR)
JAPANESE GOV. BDSFUTURE 10Y
September 2019 4 JPY 615,400,000.00 3,911.09
LONG GILT STERLINGFUTURES
September 2019 (42) GBP (5,472,600.00) (57,720.65)
MSEMI - MSCI EMER MKTSINDEX
September 2019 150 USD 7,900,500.00 253,204.85
S&P 500 EMINI INDEX September 2019 10 USD 1,472,125.00 26,011.94
SHORT EURO BTP IT September 2019 (429) EUR (47,833,500.00) (553,410.00)
TOPIX INDEX (TOKYO) September 2019 39 JPY 604,890,000.00 (6,355.52)
TREASURY BONDS USA September 2019 83 USD 12,914,281.25 235,223.81
(3,067,154.64)
Pramerica Sicav – Obiettivo Equilibrio
Description MaturityNumber ofcontracts
purchased/(sold)Currency Commitments (*) Unrealised profit/
(loss) (in EUR)
10Y BTP ITALIAN BOND September 2019 (104) EUR (13,967,200.00) (572,000.00)
10Y TREASURY NOTES USA September 2019 132 USD 16,891,875.00 291,564.23
2Y TREASURY NOTES USA September 2019 38 USD 8,176,828.14 44,052.90
30Y TREASURY NOTES USA September 2019 (44) USD (7,812,750.00) (241,461.06)
5Y TREASURY NOTES USA September 2019 53 USD 6,262,281.25 9,089.07
EURO BOBL September 2019 (117) EUR (15,729,480.00) (62,010.00)
EURO BUND September 2019 (279) EUR (48,194,460.00) (442,560.00)
EURO OAT FUTURES September 2019 (23) EUR (3,792,010.00) (3,450.00)
EURO SCHATZ September 2019 14 EUR 1,571,990.00 2,520.00
EURO STOXX 50 PR September 2019 (290) EUR (10,051,400.00) (254,112.58)
EURO-BUXL-FUTURES September 2019 (21) EUR (4,260,900.00) (27,831.59)
FTSE MIB INDEX September 2019 18 EUR 1,904,040.00 61,740.00
JAPANESE GOV. BDSFUTURE 10Y
September 2019 2 JPY 307,700,000.00 1,955.55
LONG GILT STERLINGFUTURES
September 2019 (15) GBP (1,954,500.00) (20,614.52)
MSEMI - MSCI EMER MKTSINDEX
September 2019 160 USD 8,427,200.00 270,085.17
Pramerica Sicav
322
Notes to the Financial Statementsas at June 30, 2019 (continued)
(*) Commitment = Quantity*contract size * valuation price
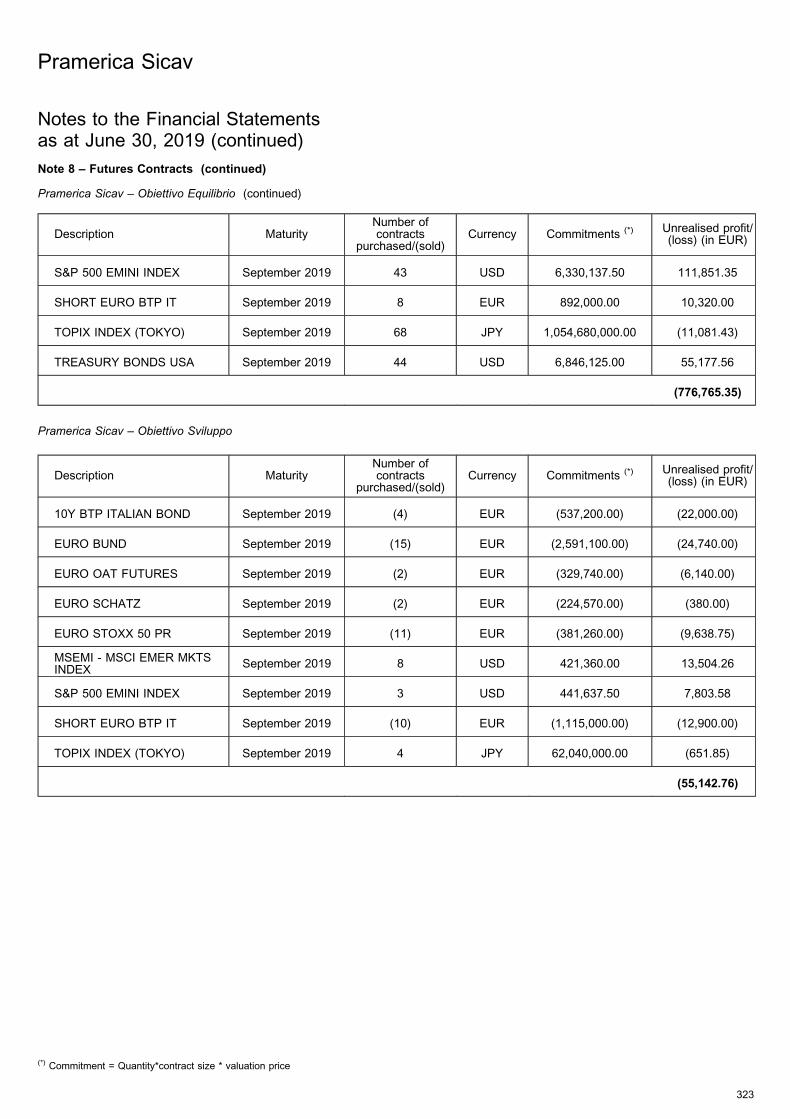
Note 8 – Futures Contracts (continued)
Pramerica Sicav – Obiettivo Equilibrio (continued)
Description MaturityNumber ofcontracts
purchased/(sold)Currency Commitments (*) Unrealised profit/
(loss) (in EUR)
S&P 500 EMINI INDEX September 2019 43 USD 6,330,137.50 111,851.35
SHORT EURO BTP IT September 2019 8 EUR 892,000.00 10,320.00
TOPIX INDEX (TOKYO) September 2019 68 JPY 1,054,680,000.00 (11,081.43)
TREASURY BONDS USA September 2019 44 USD 6,846,125.00 55,177.56
(776,765.35)
Pramerica Sicav – Obiettivo Sviluppo
Description MaturityNumber ofcontracts
purchased/(sold)Currency Commitments (*) Unrealised profit/
(loss) (in EUR)
10Y BTP ITALIAN BOND September 2019 (4) EUR (537,200.00) (22,000.00)
EURO BUND September 2019 (15) EUR (2,591,100.00) (24,740.00)
EURO OAT FUTURES September 2019 (2) EUR (329,740.00) (6,140.00)
EURO SCHATZ September 2019 (2) EUR (224,570.00) (380.00)
EURO STOXX 50 PR September 2019 (11) EUR (381,260.00) (9,638.75)
MSEMI - MSCI EMER MKTSINDEX
September 2019 8 USD 421,360.00 13,504.26
S&P 500 EMINI INDEX September 2019 3 USD 441,637.50 7,803.58
SHORT EURO BTP IT September 2019 (10) EUR (1,115,000.00) (12,900.00)
TOPIX INDEX (TOKYO) September 2019 4 JPY 62,040,000.00 (651.85)
(55,142.76)
Pramerica Sicav
323
Notes to the Financial Statementsas at June 30, 2019 (continued)
(*) Commitment = Quantity*contract size * valuation price
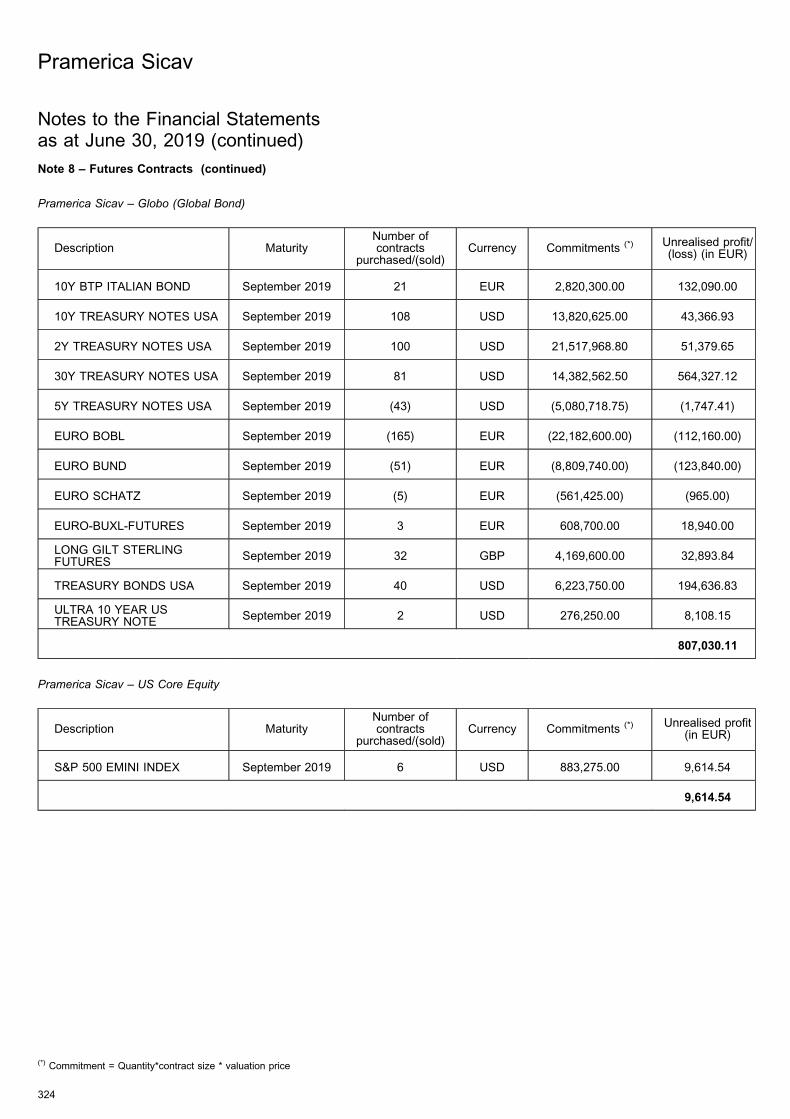
Note 8 – Futures Contracts (continued)
Pramerica Sicav – Globo (Global Bond)
Description MaturityNumber ofcontracts
purchased/(sold)Currency Commitments (*) Unrealised profit/
(loss) (in EUR)
10Y BTP ITALIAN BOND September 2019 21 EUR 2,820,300.00 132,090.00
10Y TREASURY NOTES USA September 2019 108 USD 13,820,625.00 43,366.93
2Y TREASURY NOTES USA September 2019 100 USD 21,517,968.80 51,379.65
30Y TREASURY NOTES USA September 2019 81 USD 14,382,562.50 564,327.12
5Y TREASURY NOTES USA September 2019 (43) USD (5,080,718.75) (1,747.41)
EURO BOBL September 2019 (165) EUR (22,182,600.00) (112,160.00)
EURO BUND September 2019 (51) EUR (8,809,740.00) (123,840.00)
EURO SCHATZ September 2019 (5) EUR (561,425.00) (965.00)
EURO-BUXL-FUTURES September 2019 3 EUR 608,700.00 18,940.00
LONG GILT STERLINGFUTURES
September 2019 32 GBP 4,169,600.00 32,893.84
TREASURY BONDS USA September 2019 40 USD 6,223,750.00 194,636.83
ULTRA 10 YEAR USTREASURY NOTE
September 2019 2 USD 276,250.00 8,108.15
807,030.11
Pramerica Sicav – US Core Equity
Description MaturityNumber ofcontracts
purchased/(sold)Currency Commitments (*) Unrealised profit
(in EUR)
S&P 500 EMINI INDEX September 2019 6 USD 883,275.00 9,614.54
9,614.54
Pramerica Sicav
324
Notes to the Financial Statementsas at June 30, 2019 (continued)
(*) Commitment = Quantity*contract size * valuation price
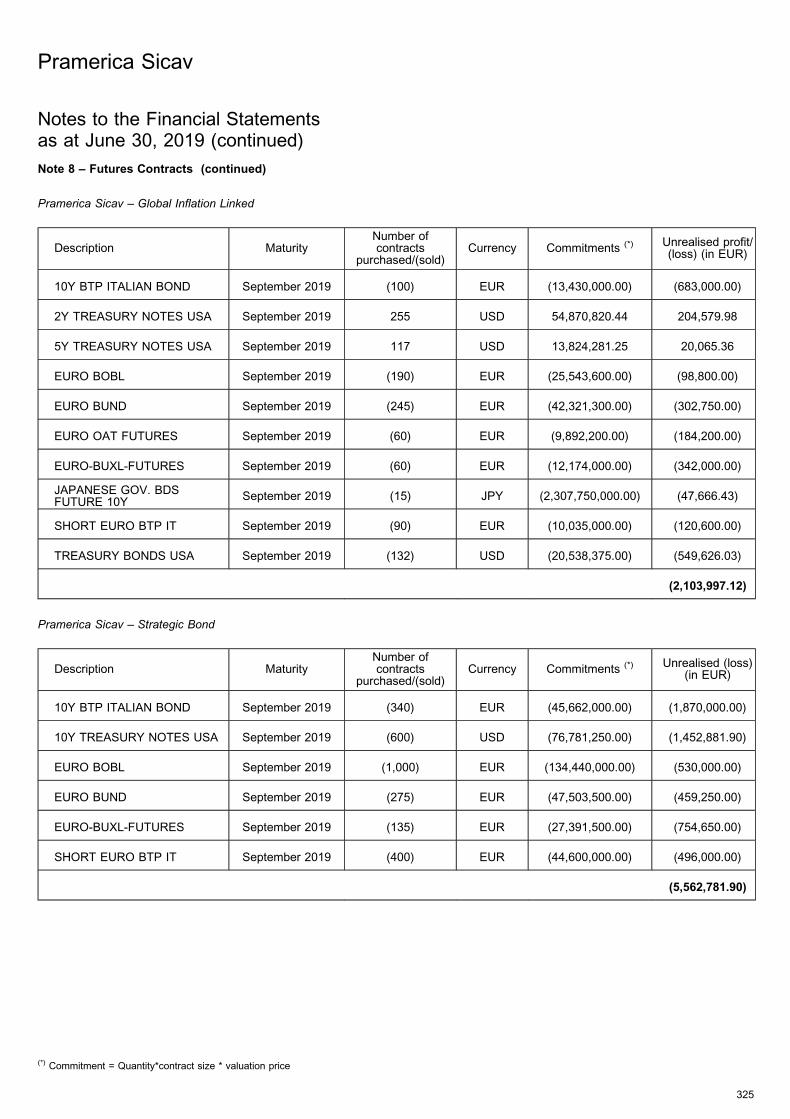
Note 8 – Futures Contracts (continued)
Pramerica Sicav – Global Inflation Linked
Description MaturityNumber ofcontracts
purchased/(sold)Currency Commitments (*) Unrealised profit/
(loss) (in EUR)
10Y BTP ITALIAN BOND September 2019 (100) EUR (13,430,000.00) (683,000.00)
2Y TREASURY NOTES USA September 2019 255 USD 54,870,820.44 204,579.98
5Y TREASURY NOTES USA September 2019 117 USD 13,824,281.25 20,065.36
EURO BOBL September 2019 (190) EUR (25,543,600.00) (98,800.00)
EURO BUND September 2019 (245) EUR (42,321,300.00) (302,750.00)
EURO OAT FUTURES September 2019 (60) EUR (9,892,200.00) (184,200.00)
EURO-BUXL-FUTURES September 2019 (60) EUR (12,174,000.00) (342,000.00)
JAPANESE GOV. BDSFUTURE 10Y
September 2019 (15) JPY (2,307,750,000.00) (47,666.43)
SHORT EURO BTP IT September 2019 (90) EUR (10,035,000.00) (120,600.00)
TREASURY BONDS USA September 2019 (132) USD (20,538,375.00) (549,626.03)
(2,103,997.12)
Pramerica Sicav – Strategic Bond
Description MaturityNumber ofcontracts
purchased/(sold)Currency Commitments (*) Unrealised (loss)
(in EUR)
10Y BTP ITALIAN BOND September 2019 (340) EUR (45,662,000.00) (1,870,000.00)
10Y TREASURY NOTES USA September 2019 (600) USD (76,781,250.00) (1,452,881.90)
EURO BOBL September 2019 (1,000) EUR (134,440,000.00) (530,000.00)
EURO BUND September 2019 (275) EUR (47,503,500.00) (459,250.00)
EURO-BUXL-FUTURES September 2019 (135) EUR (27,391,500.00) (754,650.00)
SHORT EURO BTP IT September 2019 (400) EUR (44,600,000.00) (496,000.00)
(5,562,781.90)
Pramerica Sicav
325
Notes to the Financial Statementsas at June 30, 2019 (continued)
(*) Commitment = Quantity*contract size * valuation price
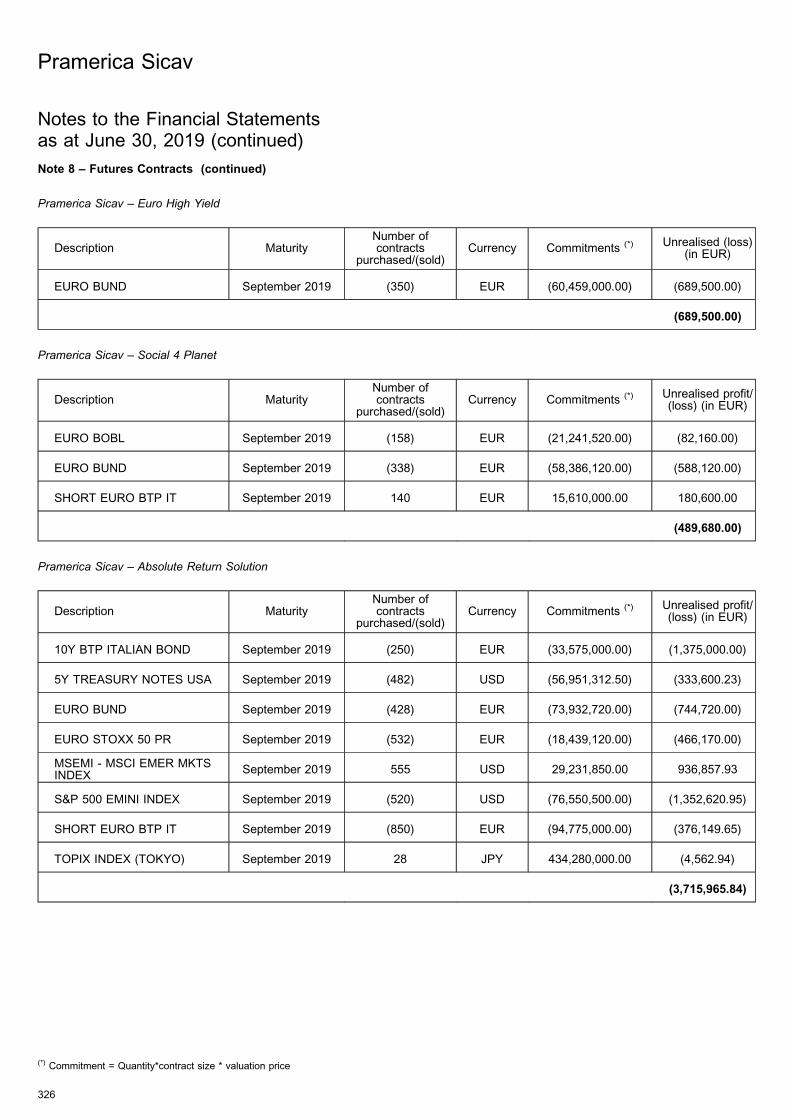
Note 8 – Futures Contracts (continued)
Pramerica Sicav – Euro High Yield
Description MaturityNumber ofcontracts
purchased/(sold)Currency Commitments (*) Unrealised (loss)
(in EUR)
EURO BUND September 2019 (350) EUR (60,459,000.00) (689,500.00)
(689,500.00)
Pramerica Sicav – Social 4 Planet
Description MaturityNumber ofcontracts
purchased/(sold)Currency Commitments (*) Unrealised profit/
(loss) (in EUR)
EURO BOBL September 2019 (158) EUR (21,241,520.00) (82,160.00)
EURO BUND September 2019 (338) EUR (58,386,120.00) (588,120.00)
SHORT EURO BTP IT September 2019 140 EUR 15,610,000.00 180,600.00
(489,680.00)
Pramerica Sicav – Absolute Return Solution
Description MaturityNumber ofcontracts
purchased/(sold)Currency Commitments (*) Unrealised profit/
(loss) (in EUR)
10Y BTP ITALIAN BOND September 2019 (250) EUR (33,575,000.00) (1,375,000.00)
5Y TREASURY NOTES USA September 2019 (482) USD (56,951,312.50) (333,600.23)
EURO BUND September 2019 (428) EUR (73,932,720.00) (744,720.00)
EURO STOXX 50 PR September 2019 (532) EUR (18,439,120.00) (466,170.00)
MSEMI - MSCI EMER MKTSINDEX
September 2019 555 USD 29,231,850.00 936,857.93
S&P 500 EMINI INDEX September 2019 (520) USD (76,550,500.00) (1,352,620.95)
SHORT EURO BTP IT September 2019 (850) EUR (94,775,000.00) (376,149.65)
TOPIX INDEX (TOKYO) September 2019 28 JPY 434,280,000.00 (4,562.94)
(3,715,965.84)
Pramerica Sicav
326
Notes to the Financial Statementsas at June 30, 2019 (continued)
(*) Commitment = Quantity*contract size * valuation price
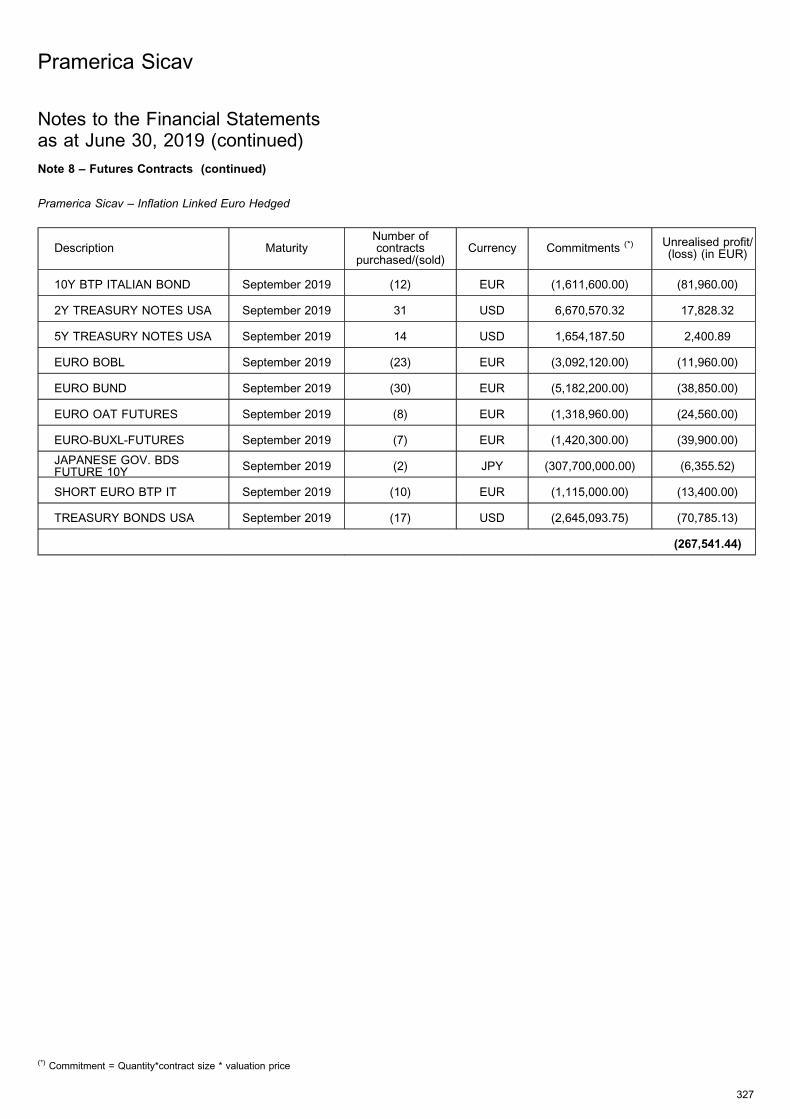
Note 8 – Futures Contracts (continued)
Pramerica Sicav – Inflation Linked Euro Hedged
Description MaturityNumber ofcontracts
purchased/(sold)Currency Commitments (*) Unrealised profit/
(loss) (in EUR)
10Y BTP ITALIAN BOND September 2019 (12) EUR (1,611,600.00) (81,960.00)
2Y TREASURY NOTES USA September 2019 31 USD 6,670,570.32 17,828.32
5Y TREASURY NOTES USA September 2019 14 USD 1,654,187.50 2,400.89
EURO BOBL September 2019 (23) EUR (3,092,120.00) (11,960.00)
EURO BUND September 2019 (30) EUR (5,182,200.00) (38,850.00)
EURO OAT FUTURES September 2019 (8) EUR (1,318,960.00) (24,560.00)
EURO-BUXL-FUTURES September 2019 (7) EUR (1,420,300.00) (39,900.00)
JAPANESE GOV. BDSFUTURE 10Y
September 2019 (2) JPY (307,700,000.00) (6,355.52)
SHORT EURO BTP IT September 2019 (10) EUR (1,115,000.00) (13,400.00)
TREASURY BONDS USA September 2019 (17) USD (2,645,093.75) (70,785.13)
(267,541.44)
Pramerica Sicav
327
Notes to the Financial Statementsas at June 30, 2019 (continued)
(*) Commitment = Quantity*contract size * valuation price
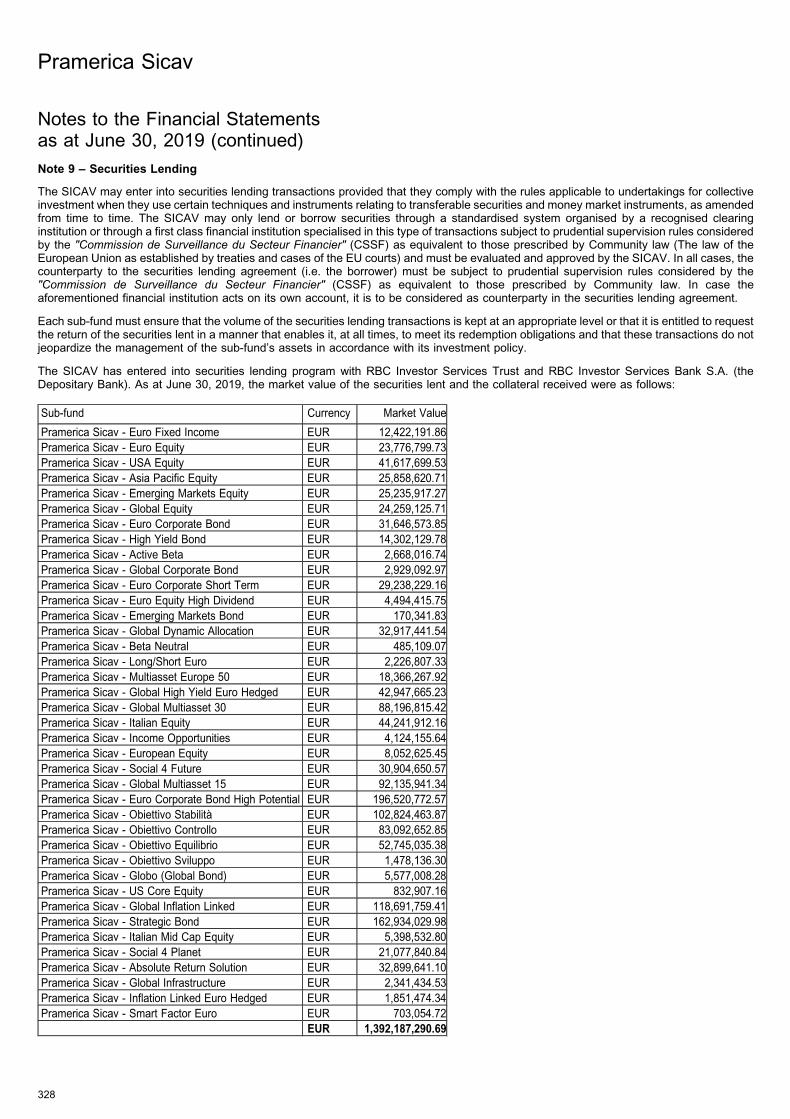
Note 9 – Securities Lending
The SICAV may enter into securities lending transactions provided that they comply with the rules applicable to undertakings for collectiveinvestment when they use certain techniques and instruments relating to transferable securities and money market instruments, as amendedfrom time to time. The SICAV may only lend or borrow securities through a standardised system organised by a recognised clearinginstitution or through a first class financial institution specialised in this type of transactions subject to prudential supervision rules consideredby the "Commission de Surveillance du Secteur Financier" (CSSF) as equivalent to those prescribed by Community law (The law of theEuropean Union as established by treaties and cases of the EU courts) and must be evaluated and approved by the SICAV. In all cases, thecounterparty to the securities lending agreement (i.e. the borrower) must be subject to prudential supervision rules considered by the"Commission de Surveillance du Secteur Financier" (CSSF) as equivalent to those prescribed by Community law. In case theaforementioned financial institution acts on its own account, it is to be considered as counterparty in the securities lending agreement.
Each sub-fund must ensure that the volume of the securities lending transactions is kept at an appropriate level or that it is entitled to requestthe return of the securities lent in a manner that enables it, at all times, to meet its redemption obligations and that these transactions do notjeopardize the management of the sub-fund’s assets in accordance with its investment policy.
The SICAV has entered into securities lending program with RBC Investor Services Trust and RBC Investor Services Bank S.A. (theDepositary Bank). As at June 30, 2019, the market value of the securities lent and the collateral received were as follows:
Sub-fund Currency Market Value
Pramerica Sicav - Euro Fixed Income EUR 12,422,191.86
Pramerica Sicav - Euro Equity EUR 23,776,799.73
Pramerica Sicav - USA Equity EUR 41,617,699.53
Pramerica Sicav - Asia Pacific Equity EUR 25,858,620.71
Pramerica Sicav - Emerging Markets Equity EUR 25,235,917.27
Pramerica Sicav - Global Equity EUR 24,259,125.71
Pramerica Sicav - Euro Corporate Bond EUR 31,646,573.85
Pramerica Sicav - High Yield Bond EUR 14,302,129.78
Pramerica Sicav - Active Beta EUR 2,668,016.74
Pramerica Sicav - Global Corporate Bond EUR 2,929,092.97
Pramerica Sicav - Euro Corporate Short Term EUR 29,238,229.16
Pramerica Sicav - Euro Equity High Dividend EUR 4,494,415.75
Pramerica Sicav - Emerging Markets Bond EUR 170,341.83
Pramerica Sicav - Global Dynamic Allocation EUR 32,917,441.54
Pramerica Sicav - Beta Neutral EUR 485,109.07
Pramerica Sicav - Long/Short Euro EUR 2,226,807.33
Pramerica Sicav - Multiasset Europe 50 EUR 18,366,267.92
Pramerica Sicav - Global High Yield Euro Hedged EUR 42,947,665.23
Pramerica Sicav - Global Multiasset 30 EUR 88,196,815.42
Pramerica Sicav - Italian Equity EUR 44,241,912.16
Pramerica Sicav - Income Opportunities EUR 4,124,155.64
Pramerica Sicav - European Equity EUR 8,052,625.45
Pramerica Sicav - Social 4 Future EUR 30,904,650.57
Pramerica Sicav - Global Multiasset 15 EUR 92,135,941.34
Pramerica Sicav - Euro Corporate Bond High Potential EUR 196,520,772.57
Pramerica Sicav - Obiettivo Stabilita EUR 102,824,463.87
Pramerica Sicav - Obiettivo Controllo EUR 83,092,652.85
Pramerica Sicav - Obiettivo Equilibrio EUR 52,745,035.38
Pramerica Sicav - Obiettivo Sviluppo EUR 1,478,136.30
Pramerica Sicav - Globo (Global Bond) EUR 5,577,008.28
Pramerica Sicav - US Core Equity EUR 832,907.16
Pramerica Sicav - Global Inflation Linked EUR 118,691,759.41
Pramerica Sicav - Strategic Bond EUR 162,934,029.98
Pramerica Sicav - Italian Mid Cap Equity EUR 5,398,532.80
Pramerica Sicav - Social 4 Planet EUR 21,077,840.84
Pramerica Sicav - Absolute Return Solution EUR 32,899,641.10
Pramerica Sicav - Global Infrastructure EUR 2,341,434.53
Pramerica Sicav - Inflation Linked Euro Hedged EUR 1,851,474.34
Pramerica Sicav - Smart Factor Euro EUR 703,054.72
EUR 1,392,187,290.69
Pramerica Sicav
328
Notes to the Financial Statementsas at June 30, 2019 (continued)
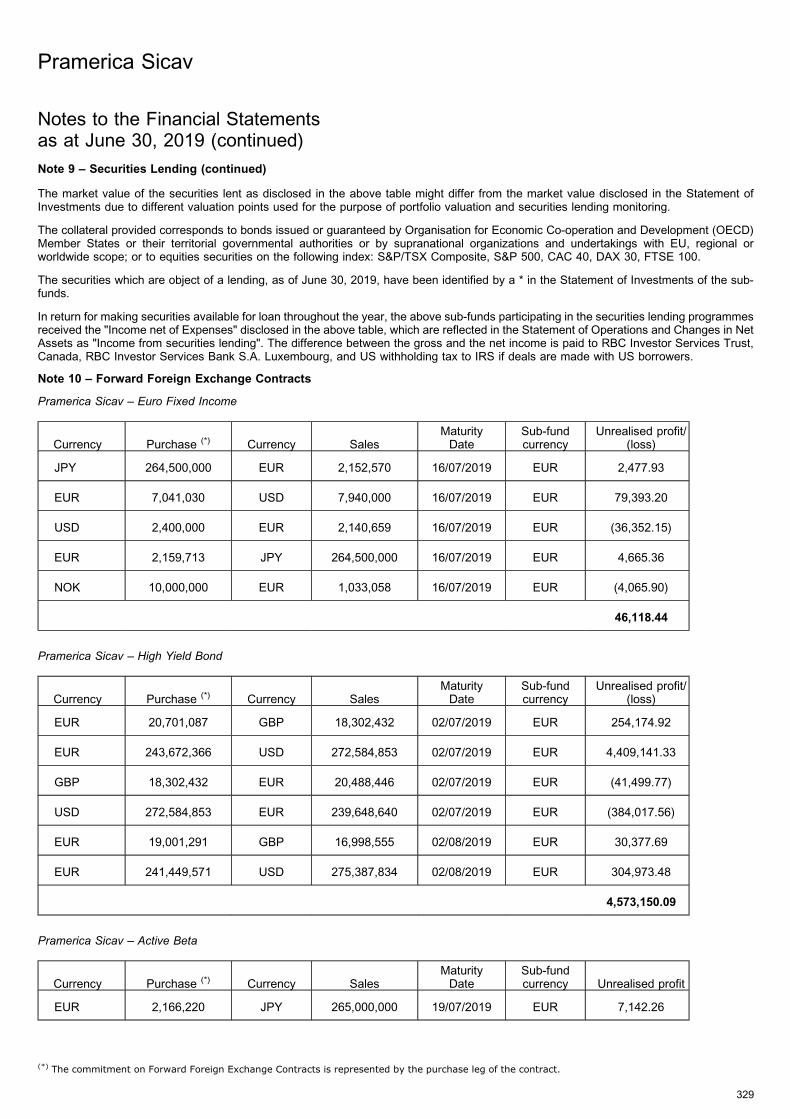
Note 9 – Securities Lending (continued)
The market value of the securities lent as disclosed in the above table might differ from the market value disclosed in the Statement ofInvestments due to different valuation points used for the purpose of portfolio valuation and securities lending monitoring.
The collateral provided corresponds to bonds issued or guaranteed by Organisation for Economic Co-operation and Development (OECD)Member States or their territorial governmental authorities or by supranational organizations and undertakings with EU, regional orworldwide scope; or to equities securities on the following index: S&P/TSX Composite, S&P 500, CAC 40, DAX 30, FTSE 100.
The securities which are object of a lending, as of June 30, 2019, have been identified by a * in the Statement of Investments of the sub-funds.
In return for making securities available for loan throughout the year, the above sub-funds participating in the securities lending programmesreceived the "Income net of Expenses" disclosed in the above table, which are reflected in the Statement of Operations and Changes in NetAssets as "Income from securities lending". The difference between the gross and the net income is paid to RBC Investor Services Trust,Canada, RBC Investor Services Bank S.A. Luxembourg, and US withholding tax to IRS if deals are made with US borrowers.
Note 10 – Forward Foreign Exchange Contracts
Pramerica Sicav – Euro Fixed Income
Currency Purchase (*) Currency SalesMaturityDate
Sub-fundcurrency
Unrealised profit/(loss)
JPY 264,500,000 EUR 2,152,570 16/07/2019 EUR 2,477.93
EUR 7,041,030 USD 7,940,000 16/07/2019 EUR 79,393.20
USD 2,400,000 EUR 2,140,659 16/07/2019 EUR (36,352.15)
EUR 2,159,713 JPY 264,500,000 16/07/2019 EUR 4,665.36
NOK 10,000,000 EUR 1,033,058 16/07/2019 EUR (4,065.90)
46,118.44
Pramerica Sicav – High Yield Bond
Currency Purchase (*) Currency SalesMaturityDate
Sub-fundcurrency
Unrealised profit/(loss)
EUR 20,701,087 GBP 18,302,432 02/07/2019 EUR 254,174.92
EUR 243,672,366 USD 272,584,853 02/07/2019 EUR 4,409,141.33
GBP 18,302,432 EUR 20,488,446 02/07/2019 EUR (41,499.77)
USD 272,584,853 EUR 239,648,640 02/07/2019 EUR (384,017.56)
EUR 19,001,291 GBP 16,998,555 02/08/2019 EUR 30,377.69
EUR 241,449,571 USD 275,387,834 02/08/2019 EUR 304,973.48
4,573,150.09
Pramerica Sicav – Active Beta
Currency Purchase (*) Currency SalesMaturityDate
Sub-fundcurrency Unrealised profit
EUR 2,166,220 JPY 265,000,000 19/07/2019 EUR 7,142.26
Pramerica Sicav
329
Notes to the Financial Statementsas at June 30, 2019 (continued)
(*) The commitment on Forward Foreign Exchange Contracts is represented by the purchase leg of the contract.
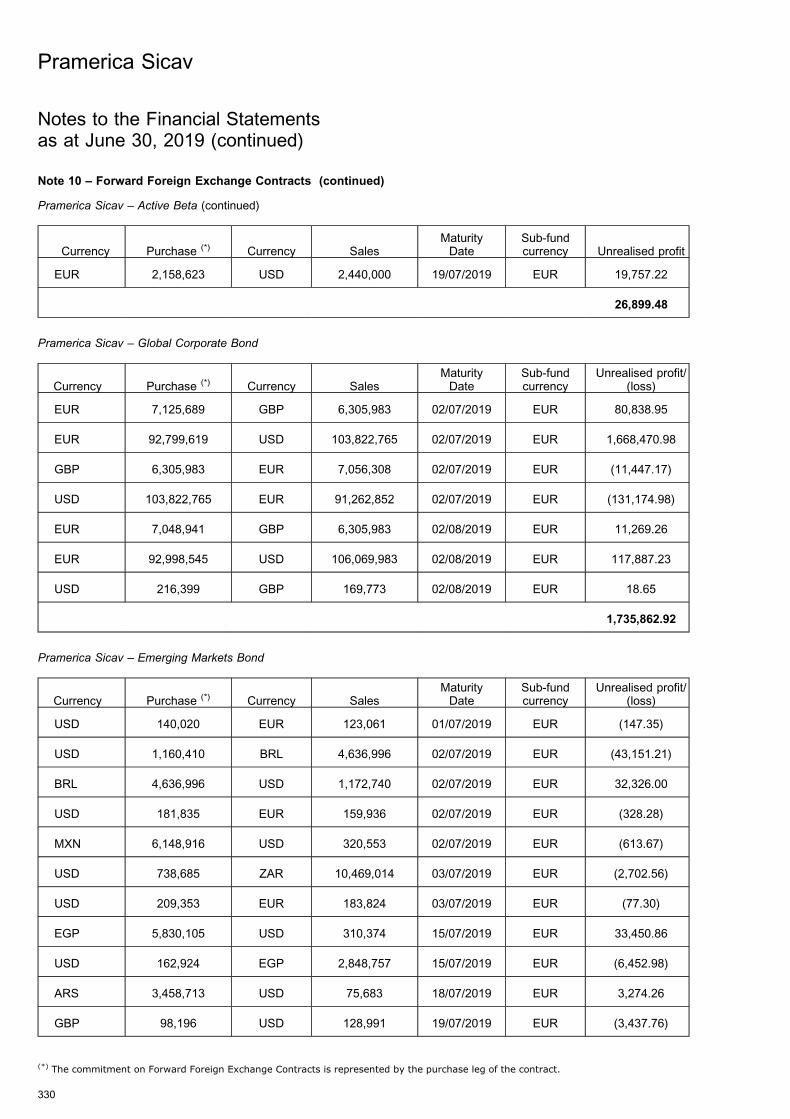
Note 10 – Forward Foreign Exchange Contracts (continued)
Pramerica Sicav – Active Beta (continued)
Currency Purchase (*) Currency SalesMaturityDate
Sub-fundcurrency Unrealised profit
EUR 2,158,623 USD 2,440,000 19/07/2019 EUR 19,757.22
26,899.48
Pramerica Sicav – Global Corporate Bond
Currency Purchase (*) Currency SalesMaturityDate
Sub-fundcurrency
Unrealised profit/(loss)
EUR 7,125,689 GBP 6,305,983 02/07/2019 EUR 80,838.95
EUR 92,799,619 USD 103,822,765 02/07/2019 EUR 1,668,470.98
GBP 6,305,983 EUR 7,056,308 02/07/2019 EUR (11,447.17)
USD 103,822,765 EUR 91,262,852 02/07/2019 EUR (131,174.98)
EUR 7,048,941 GBP 6,305,983 02/08/2019 EUR 11,269.26
EUR 92,998,545 USD 106,069,983 02/08/2019 EUR 117,887.23
USD 216,399 GBP 169,773 02/08/2019 EUR 18.65
1,735,862.92
Pramerica Sicav – Emerging Markets Bond
Currency Purchase (*) Currency SalesMaturityDate
Sub-fundcurrency
Unrealised profit/(loss)
USD 140,020 EUR 123,061 01/07/2019 EUR (147.35)
USD 1,160,410 BRL 4,636,996 02/07/2019 EUR (43,151.21)
BRL 4,636,996 USD 1,172,740 02/07/2019 EUR 32,326.00
USD 181,835 EUR 159,936 02/07/2019 EUR (328.28)
MXN 6,148,916 USD 320,553 02/07/2019 EUR (613.67)
USD 738,685 ZAR 10,469,014 03/07/2019 EUR (2,702.56)
USD 209,353 EUR 183,824 03/07/2019 EUR (77.30)
EGP 5,830,105 USD 310,374 15/07/2019 EUR 33,450.86
USD 162,924 EGP 2,848,757 15/07/2019 EUR (6,452.98)
ARS 3,458,713 USD 75,683 18/07/2019 EUR 3,274.26
GBP 98,196 USD 128,991 19/07/2019 EUR (3,437.76)
Pramerica Sicav
330
Notes to the Financial Statementsas at June 30, 2019 (continued)
(*) The commitment on Forward Foreign Exchange Contracts is represented by the purchase leg of the contract.
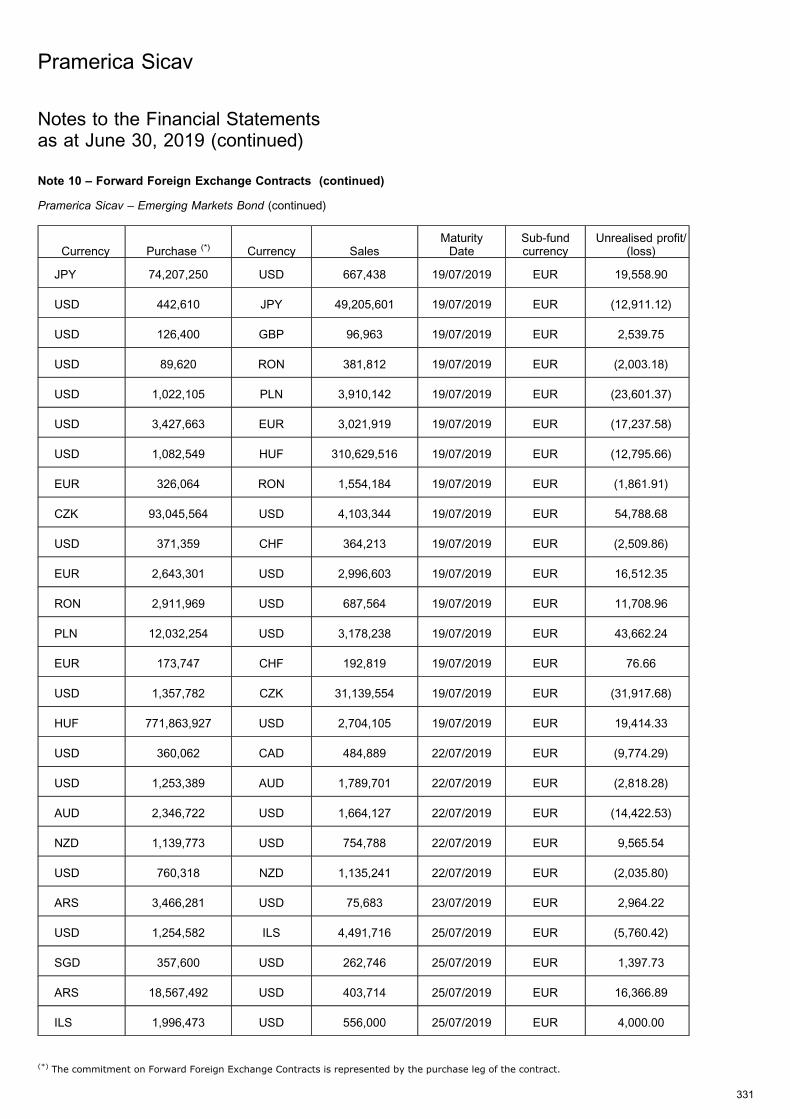
Note 10 – Forward Foreign Exchange Contracts (continued)
Pramerica Sicav – Emerging Markets Bond (continued)
Currency Purchase (*) Currency SalesMaturityDate
Sub-fundcurrency
Unrealised profit/(loss)
JPY 74,207,250 USD 667,438 19/07/2019 EUR 19,558.90
USD 442,610 JPY 49,205,601 19/07/2019 EUR (12,911.12)
USD 126,400 GBP 96,963 19/07/2019 EUR 2,539.75
USD 89,620 RON 381,812 19/07/2019 EUR (2,003.18)
USD 1,022,105 PLN 3,910,142 19/07/2019 EUR (23,601.37)
USD 3,427,663 EUR 3,021,919 19/07/2019 EUR (17,237.58)
USD 1,082,549 HUF 310,629,516 19/07/2019 EUR (12,795.66)
EUR 326,064 RON 1,554,184 19/07/2019 EUR (1,861.91)
CZK 93,045,564 USD 4,103,344 19/07/2019 EUR 54,788.68
USD 371,359 CHF 364,213 19/07/2019 EUR (2,509.86)
EUR 2,643,301 USD 2,996,603 19/07/2019 EUR 16,512.35
RON 2,911,969 USD 687,564 19/07/2019 EUR 11,708.96
PLN 12,032,254 USD 3,178,238 19/07/2019 EUR 43,662.24
EUR 173,747 CHF 192,819 19/07/2019 EUR 76.66
USD 1,357,782 CZK 31,139,554 19/07/2019 EUR (31,917.68)
HUF 771,863,927 USD 2,704,105 19/07/2019 EUR 19,414.33
USD 360,062 CAD 484,889 22/07/2019 EUR (9,774.29)
USD 1,253,389 AUD 1,789,701 22/07/2019 EUR (2,818.28)
AUD 2,346,722 USD 1,664,127 22/07/2019 EUR (14,422.53)
NZD 1,139,773 USD 754,788 22/07/2019 EUR 9,565.54
USD 760,318 NZD 1,135,241 22/07/2019 EUR (2,035.80)
ARS 3,466,281 USD 75,683 23/07/2019 EUR 2,964.22
USD 1,254,582 ILS 4,491,716 25/07/2019 EUR (5,760.42)
SGD 357,600 USD 262,746 25/07/2019 EUR 1,397.73
ARS 18,567,492 USD 403,714 25/07/2019 EUR 16,366.89
ILS 1,996,473 USD 556,000 25/07/2019 EUR 4,000.00
Pramerica Sicav
331
Notes to the Financial Statementsas at June 30, 2019 (continued)
(*) The commitment on Forward Foreign Exchange Contracts is represented by the purchase leg of the contract.
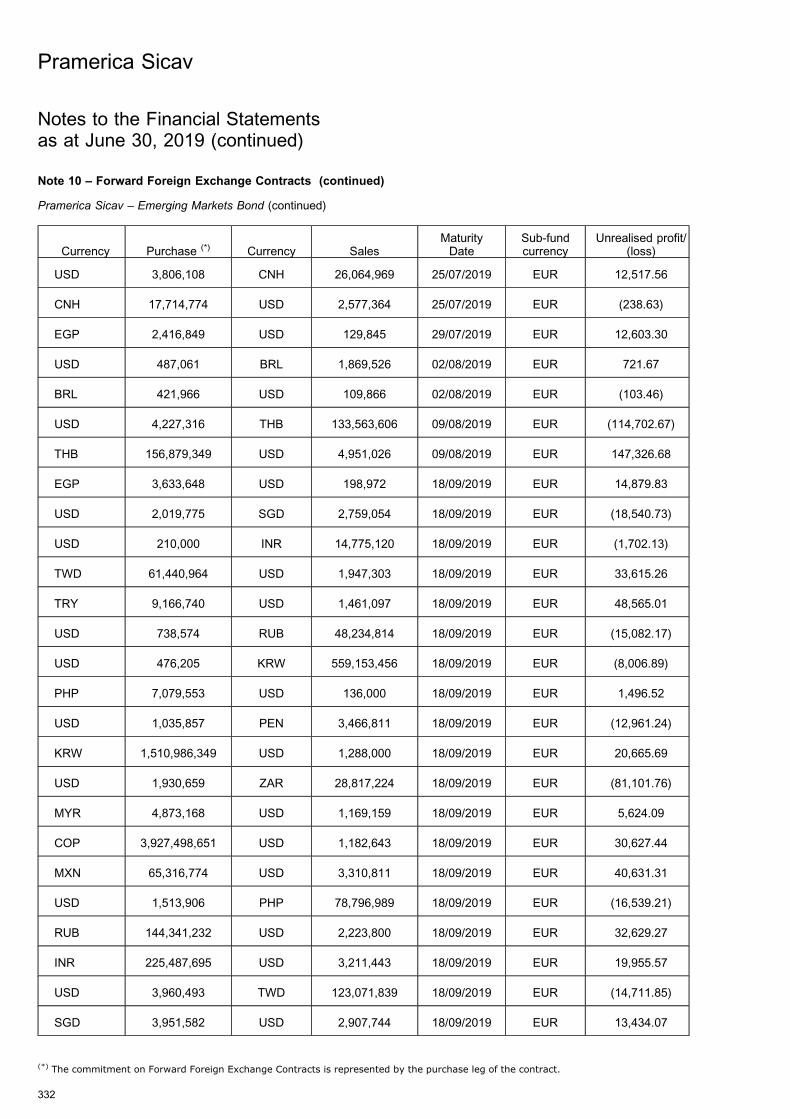
Note 10 – Forward Foreign Exchange Contracts (continued)
Pramerica Sicav – Emerging Markets Bond (continued)
Currency Purchase (*) Currency SalesMaturityDate
Sub-fundcurrency
Unrealised profit/(loss)
USD 3,806,108 CNH 26,064,969 25/07/2019 EUR 12,517.56
CNH 17,714,774 USD 2,577,364 25/07/2019 EUR (238.63)
EGP 2,416,849 USD 129,845 29/07/2019 EUR 12,603.30
USD 487,061 BRL 1,869,526 02/08/2019 EUR 721.67
BRL 421,966 USD 109,866 02/08/2019 EUR (103.46)
USD 4,227,316 THB 133,563,606 09/08/2019 EUR (114,702.67)
THB 156,879,349 USD 4,951,026 09/08/2019 EUR 147,326.68
EGP 3,633,648 USD 198,972 18/09/2019 EUR 14,879.83
USD 2,019,775 SGD 2,759,054 18/09/2019 EUR (18,540.73)
USD 210,000 INR 14,775,120 18/09/2019 EUR (1,702.13)
TWD 61,440,964 USD 1,947,303 18/09/2019 EUR 33,615.26
TRY 9,166,740 USD 1,461,097 18/09/2019 EUR 48,565.01
USD 738,574 RUB 48,234,814 18/09/2019 EUR (15,082.17)
USD 476,205 KRW 559,153,456 18/09/2019 EUR (8,006.89)
PHP 7,079,553 USD 136,000 18/09/2019 EUR 1,496.52
USD 1,035,857 PEN 3,466,811 18/09/2019 EUR (12,961.24)
KRW 1,510,986,349 USD 1,288,000 18/09/2019 EUR 20,665.69
USD 1,930,659 ZAR 28,817,224 18/09/2019 EUR (81,101.76)
MYR 4,873,168 USD 1,169,159 18/09/2019 EUR 5,624.09
COP 3,927,498,651 USD 1,182,643 18/09/2019 EUR 30,627.44
MXN 65,316,774 USD 3,310,811 18/09/2019 EUR 40,631.31
USD 1,513,906 PHP 78,796,989 18/09/2019 EUR (16,539.21)
RUB 144,341,232 USD 2,223,800 18/09/2019 EUR 32,629.27
INR 225,487,695 USD 3,211,443 18/09/2019 EUR 19,955.57
USD 3,960,493 TWD 123,071,839 18/09/2019 EUR (14,711.85)
SGD 3,951,582 USD 2,907,744 18/09/2019 EUR 13,434.07
Pramerica Sicav
332
Notes to the Financial Statementsas at June 30, 2019 (continued)
(*) The commitment on Forward Foreign Exchange Contracts is represented by the purchase leg of the contract.
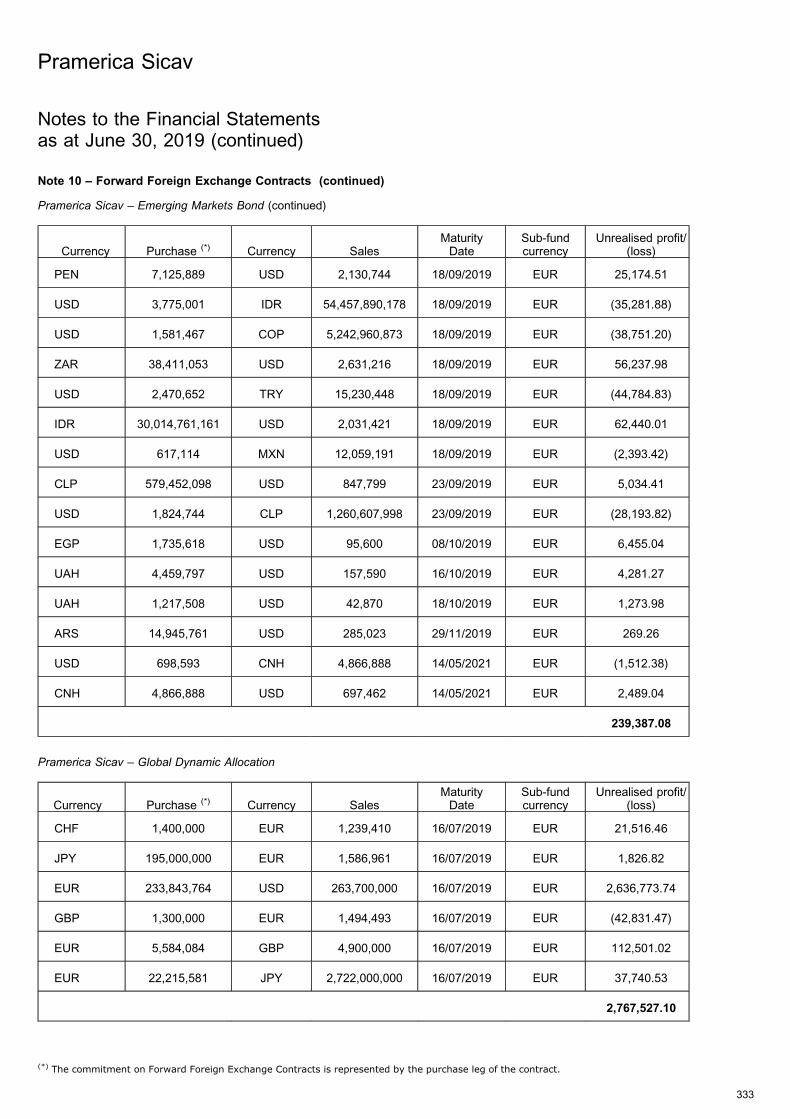
Note 10 – Forward Foreign Exchange Contracts (continued)
Pramerica Sicav – Emerging Markets Bond (continued)
Currency Purchase (*) Currency SalesMaturityDate
Sub-fundcurrency
Unrealised profit/(loss)
PEN 7,125,889 USD 2,130,744 18/09/2019 EUR 25,174.51
USD 3,775,001 IDR 54,457,890,178 18/09/2019 EUR (35,281.88)
USD 1,581,467 COP 5,242,960,873 18/09/2019 EUR (38,751.20)
ZAR 38,411,053 USD 2,631,216 18/09/2019 EUR 56,237.98
USD 2,470,652 TRY 15,230,448 18/09/2019 EUR (44,784.83)
IDR 30,014,761,161 USD 2,031,421 18/09/2019 EUR 62,440.01
USD 617,114 MXN 12,059,191 18/09/2019 EUR (2,393.42)
CLP 579,452,098 USD 847,799 23/09/2019 EUR 5,034.41
USD 1,824,744 CLP 1,260,607,998 23/09/2019 EUR (28,193.82)
EGP 1,735,618 USD 95,600 08/10/2019 EUR 6,455.04
UAH 4,459,797 USD 157,590 16/10/2019 EUR 4,281.27
UAH 1,217,508 USD 42,870 18/10/2019 EUR 1,273.98
ARS 14,945,761 USD 285,023 29/11/2019 EUR 269.26
USD 698,593 CNH 4,866,888 14/05/2021 EUR (1,512.38)
CNH 4,866,888 USD 697,462 14/05/2021 EUR 2,489.04
239,387.08
Pramerica Sicav – Global Dynamic Allocation
Currency Purchase (*) Currency SalesMaturityDate
Sub-fundcurrency
Unrealised profit/(loss)
CHF 1,400,000 EUR 1,239,410 16/07/2019 EUR 21,516.46
JPY 195,000,000 EUR 1,586,961 16/07/2019 EUR 1,826.82
EUR 233,843,764 USD 263,700,000 16/07/2019 EUR 2,636,773.74
GBP 1,300,000 EUR 1,494,493 16/07/2019 EUR (42,831.47)
EUR 5,584,084 GBP 4,900,000 16/07/2019 EUR 112,501.02
EUR 22,215,581 JPY 2,722,000,000 16/07/2019 EUR 37,740.53
2,767,527.10
Pramerica Sicav
333
Notes to the Financial Statementsas at June 30, 2019 (continued)
(*) The commitment on Forward Foreign Exchange Contracts is represented by the purchase leg of the contract.
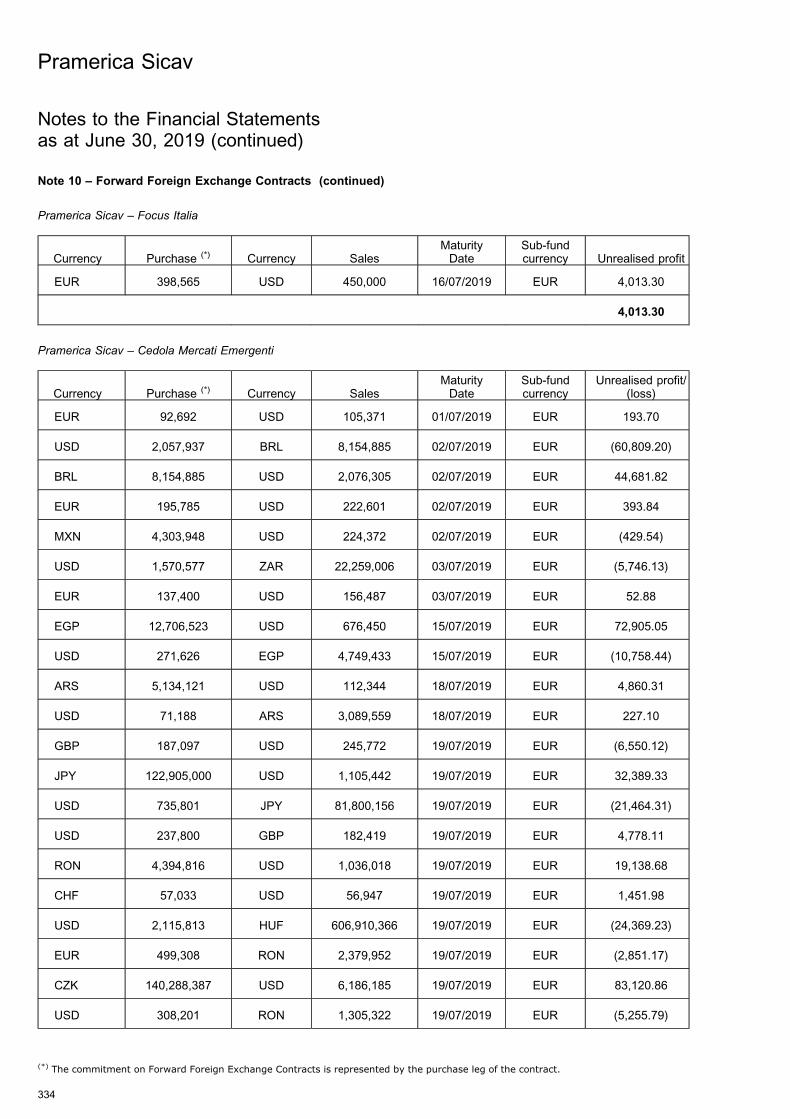
Note 10 – Forward Foreign Exchange Contracts (continued)
Pramerica Sicav – Focus Italia
Currency Purchase (*) Currency SalesMaturityDate
Sub-fundcurrency Unrealised profit
EUR 398,565 USD 450,000 16/07/2019 EUR 4,013.30
4,013.30
Pramerica Sicav – Cedola Mercati Emergenti
Currency Purchase (*) Currency SalesMaturityDate
Sub-fundcurrency
Unrealised profit/(loss)
EUR 92,692 USD 105,371 01/07/2019 EUR 193.70
USD 2,057,937 BRL 8,154,885 02/07/2019 EUR (60,809.20)
BRL 8,154,885 USD 2,076,305 02/07/2019 EUR 44,681.82
EUR 195,785 USD 222,601 02/07/2019 EUR 393.84
MXN 4,303,948 USD 224,372 02/07/2019 EUR (429.54)
USD 1,570,577 ZAR 22,259,006 03/07/2019 EUR (5,746.13)
EUR 137,400 USD 156,487 03/07/2019 EUR 52.88
EGP 12,706,523 USD 676,450 15/07/2019 EUR 72,905.05
USD 271,626 EGP 4,749,433 15/07/2019 EUR (10,758.44)
ARS 5,134,121 USD 112,344 18/07/2019 EUR 4,860.31
USD 71,188 ARS 3,089,559 18/07/2019 EUR 227.10
GBP 187,097 USD 245,772 19/07/2019 EUR (6,550.12)
JPY 122,905,000 USD 1,105,442 19/07/2019 EUR 32,389.33
USD 735,801 JPY 81,800,156 19/07/2019 EUR (21,464.31)
USD 237,800 GBP 182,419 19/07/2019 EUR 4,778.11
RON 4,394,816 USD 1,036,018 19/07/2019 EUR 19,138.68
CHF 57,033 USD 56,947 19/07/2019 EUR 1,451.98
USD 2,115,813 HUF 606,910,366 19/07/2019 EUR (24,369.23)
EUR 499,308 RON 2,379,952 19/07/2019 EUR (2,851.17)
CZK 140,288,387 USD 6,186,185 19/07/2019 EUR 83,120.86
USD 308,201 RON 1,305,322 19/07/2019 EUR (5,255.79)
Pramerica Sicav
334
Notes to the Financial Statementsas at June 30, 2019 (continued)
(*) The commitment on Forward Foreign Exchange Contracts is represented by the purchase leg of the contract.
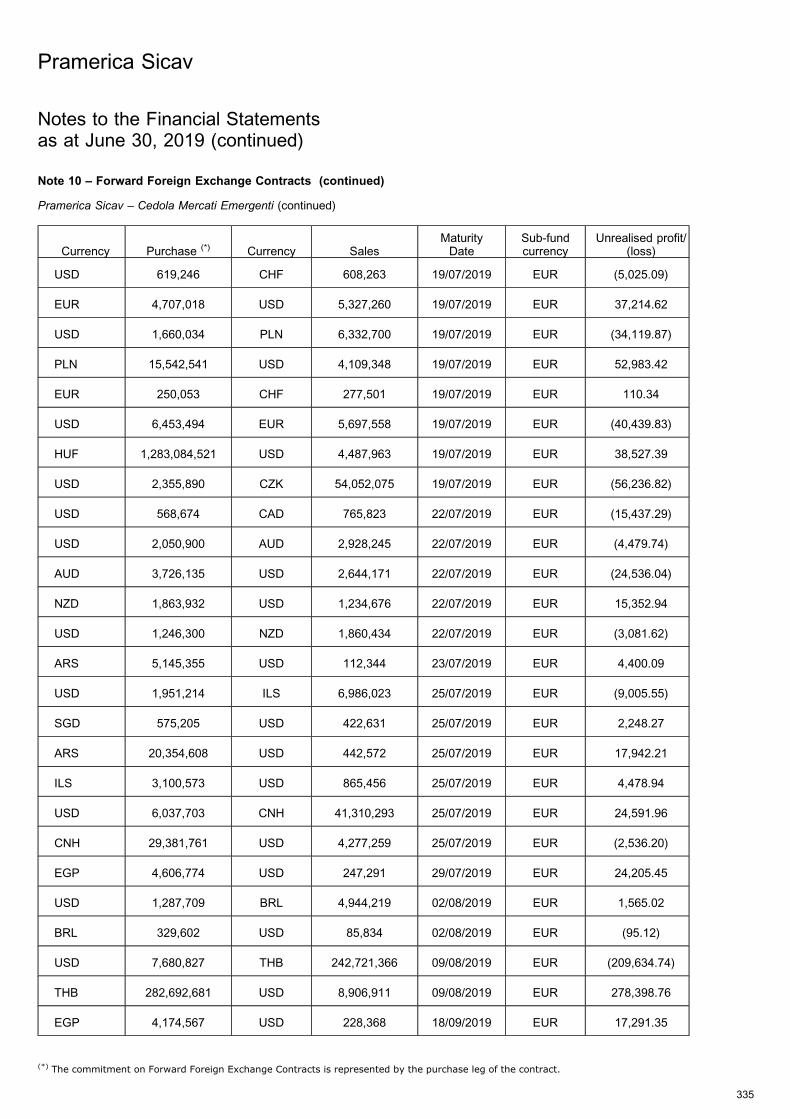
Note 10 – Forward Foreign Exchange Contracts (continued)
Pramerica Sicav – Cedola Mercati Emergenti (continued)
Currency Purchase (*) Currency SalesMaturityDate
Sub-fundcurrency
Unrealised profit/(loss)
USD 619,246 CHF 608,263 19/07/2019 EUR (5,025.09)
EUR 4,707,018 USD 5,327,260 19/07/2019 EUR 37,214.62
USD 1,660,034 PLN 6,332,700 19/07/2019 EUR (34,119.87)
PLN 15,542,541 USD 4,109,348 19/07/2019 EUR 52,983.42
EUR 250,053 CHF 277,501 19/07/2019 EUR 110.34
USD 6,453,494 EUR 5,697,558 19/07/2019 EUR (40,439.83)
HUF 1,283,084,521 USD 4,487,963 19/07/2019 EUR 38,527.39
USD 2,355,890 CZK 54,052,075 19/07/2019 EUR (56,236.82)
USD 568,674 CAD 765,823 22/07/2019 EUR (15,437.29)
USD 2,050,900 AUD 2,928,245 22/07/2019 EUR (4,479.74)
AUD 3,726,135 USD 2,644,171 22/07/2019 EUR (24,536.04)
NZD 1,863,932 USD 1,234,676 22/07/2019 EUR 15,352.94
USD 1,246,300 NZD 1,860,434 22/07/2019 EUR (3,081.62)
ARS 5,145,355 USD 112,344 23/07/2019 EUR 4,400.09
USD 1,951,214 ILS 6,986,023 25/07/2019 EUR (9,005.55)
SGD 575,205 USD 422,631 25/07/2019 EUR 2,248.27
ARS 20,354,608 USD 442,572 25/07/2019 EUR 17,942.21
ILS 3,100,573 USD 865,456 25/07/2019 EUR 4,478.94
USD 6,037,703 CNH 41,310,293 25/07/2019 EUR 24,591.96
CNH 29,381,761 USD 4,277,259 25/07/2019 EUR (2,536.20)
EGP 4,606,774 USD 247,291 29/07/2019 EUR 24,205.45
USD 1,287,709 BRL 4,944,219 02/08/2019 EUR 1,565.02
BRL 329,602 USD 85,834 02/08/2019 EUR (95.12)
USD 7,680,827 THB 242,721,366 09/08/2019 EUR (209,634.74)
THB 282,692,681 USD 8,906,911 09/08/2019 EUR 278,398.76
EGP 4,174,567 USD 228,368 18/09/2019 EUR 17,291.35
Pramerica Sicav
335
Notes to the Financial Statementsas at June 30, 2019 (continued)
(*) The commitment on Forward Foreign Exchange Contracts is represented by the purchase leg of the contract.

Note 10 – Forward Foreign Exchange Contracts (continued)
Pramerica Sicav – Cedola Mercati Emergenti (continued)
Currency Purchase (*) Currency SalesMaturityDate
Sub-fundcurrency
Unrealised profit/(loss)
USD 99,937 EGP 1,814,854 18/09/2019 EUR (6,982.23)
USD 3,220,603 SGD 4,399,290 18/09/2019 EUR (29,486.13)
MYR 6,399,316 USD 1,535,334 18/09/2019 EUR 7,363.00
TRY 13,071,960 USD 2,072,877 18/09/2019 EUR 78,630.22
TWD 95,661,913 USD 3,031,803 18/09/2019 EUR 52,421.85
USD 383,657 INR 26,996,511 18/09/2019 EUR (3,151.42)
USD 738,502 KRW 867,172,115 18/09/2019 EUR (12,442.00)
PHP 10,411,108 USD 200,000 18/09/2019 EUR 2,200.77
USD 1,458,671 PEN 4,887,140 18/09/2019 EUR (19,653.54)
USD 1,339,664 RUB 87,363,531 18/09/2019 EUR (25,584.50)
KRW 2,277,235,640 USD 1,941,000 18/09/2019 EUR 31,293.84
USD 2,391,745 ZAR 35,589,718 18/09/2019 EUR (93,639.66)
COP 5,447,966,448 USD 1,634,699 18/09/2019 EUR 47,563.97
USD 273,849 MYR 1,137,613 18/09/2019 EUR (510.28)
MXN 99,419,604 USD 5,005,878 18/09/2019 EUR 91,308.42
USD 2,004,529 PHP 104,312,912 18/09/2019 EUR (21,550.17)
RUB 271,252,684 USD 4,169,388 18/09/2019 EUR 69,816.72
INR 336,924,207 USD 4,798,473 18/09/2019 EUR 29,880.72
USD 6,176,540 IDR 89,157,955,470 18/09/2019 EUR (61,185.02)
USD 5,872,153 TWD 182,526,254 18/09/2019 EUR (23,220.69)
SGD 5,970,317 USD 4,391,646 18/09/2019 EUR 21,676.13
PEN 10,850,096 USD 3,245,313 18/09/2019 EUR 37,473.76
USD 2,483,010 COP 8,224,018,958 18/09/2019 EUR (58,709.45)
USD 3,376,946 TRY 20,892,251 18/09/2019 EUR (72,574.91)
ZAR 51,941,907 USD 3,584,025 18/09/2019 EUR 53,285.04
IDR 49,416,927,755 USD 3,355,934 18/09/2019 EUR 92,828.39
Pramerica Sicav
336
Notes to the Financial Statementsas at June 30, 2019 (continued)
(*) The commitment on Forward Foreign Exchange Contracts is represented by the purchase leg of the contract.
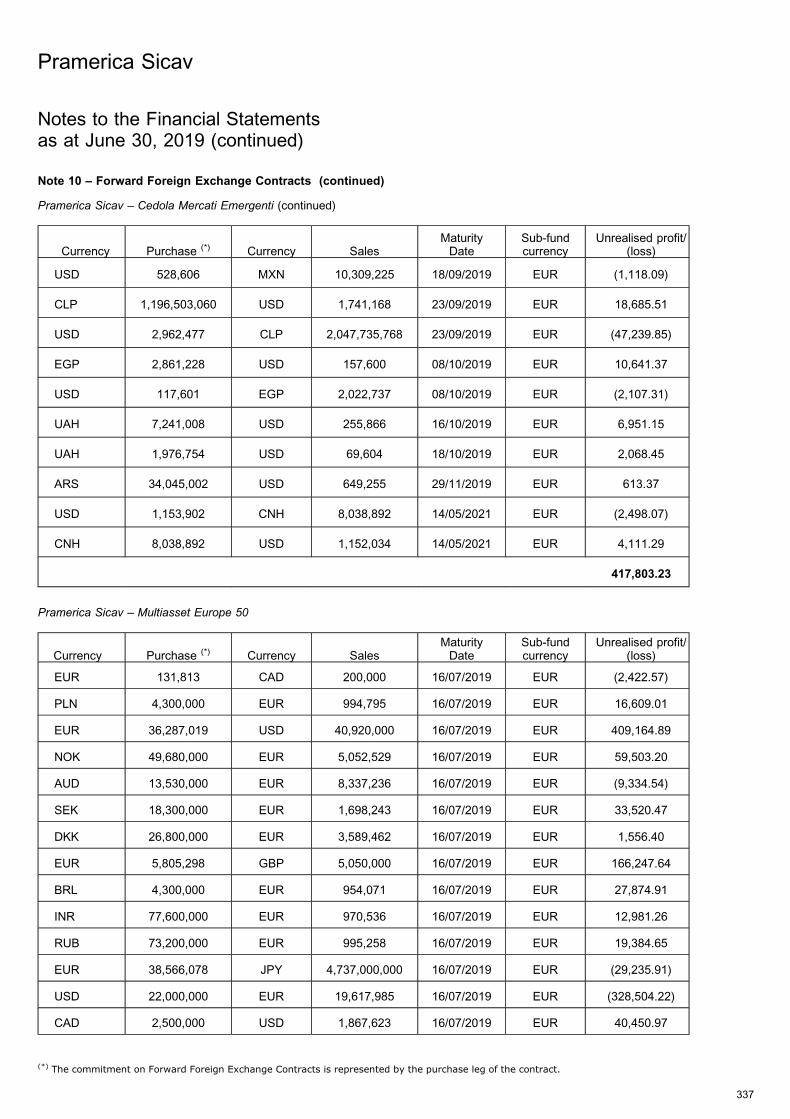
Note 10 – Forward Foreign Exchange Contracts (continued)
Pramerica Sicav – Cedola Mercati Emergenti (continued)
Currency Purchase (*) Currency SalesMaturityDate
Sub-fundcurrency
Unrealised profit/(loss)
USD 528,606 MXN 10,309,225 18/09/2019 EUR (1,118.09)
CLP 1,196,503,060 USD 1,741,168 23/09/2019 EUR 18,685.51
USD 2,962,477 CLP 2,047,735,768 23/09/2019 EUR (47,239.85)
EGP 2,861,228 USD 157,600 08/10/2019 EUR 10,641.37
USD 117,601 EGP 2,022,737 08/10/2019 EUR (2,107.31)
UAH 7,241,008 USD 255,866 16/10/2019 EUR 6,951.15
UAH 1,976,754 USD 69,604 18/10/2019 EUR 2,068.45
ARS 34,045,002 USD 649,255 29/11/2019 EUR 613.37
USD 1,153,902 CNH 8,038,892 14/05/2021 EUR (2,498.07)
CNH 8,038,892 USD 1,152,034 14/05/2021 EUR 4,111.29
417,803.23
Pramerica Sicav – Multiasset Europe 50
Currency Purchase (*) Currency SalesMaturityDate
Sub-fundcurrency
Unrealised profit/(loss)
EUR 131,813 CAD 200,000 16/07/2019 EUR (2,422.57)
PLN 4,300,000 EUR 994,795 16/07/2019 EUR 16,609.01
EUR 36,287,019 USD 40,920,000 16/07/2019 EUR 409,164.89
NOK 49,680,000 EUR 5,052,529 16/07/2019 EUR 59,503.20
AUD 13,530,000 EUR 8,337,236 16/07/2019 EUR (9,334.54)
SEK 18,300,000 EUR 1,698,243 16/07/2019 EUR 33,520.47
DKK 26,800,000 EUR 3,589,462 16/07/2019 EUR 1,556.40
EUR 5,805,298 GBP 5,050,000 16/07/2019 EUR 166,247.64
BRL 4,300,000 EUR 954,071 16/07/2019 EUR 27,874.91
INR 77,600,000 EUR 970,536 16/07/2019 EUR 12,981.26
RUB 73,200,000 EUR 995,258 16/07/2019 EUR 19,384.65
EUR 38,566,078 JPY 4,737,000,000 16/07/2019 EUR (29,235.91)
USD 22,000,000 EUR 19,617,985 16/07/2019 EUR (328,504.22)
CAD 2,500,000 USD 1,867,623 16/07/2019 EUR 40,450.97
Pramerica Sicav
337
Notes to the Financial Statementsas at June 30, 2019 (continued)
(*) The commitment on Forward Foreign Exchange Contracts is represented by the purchase leg of the contract.
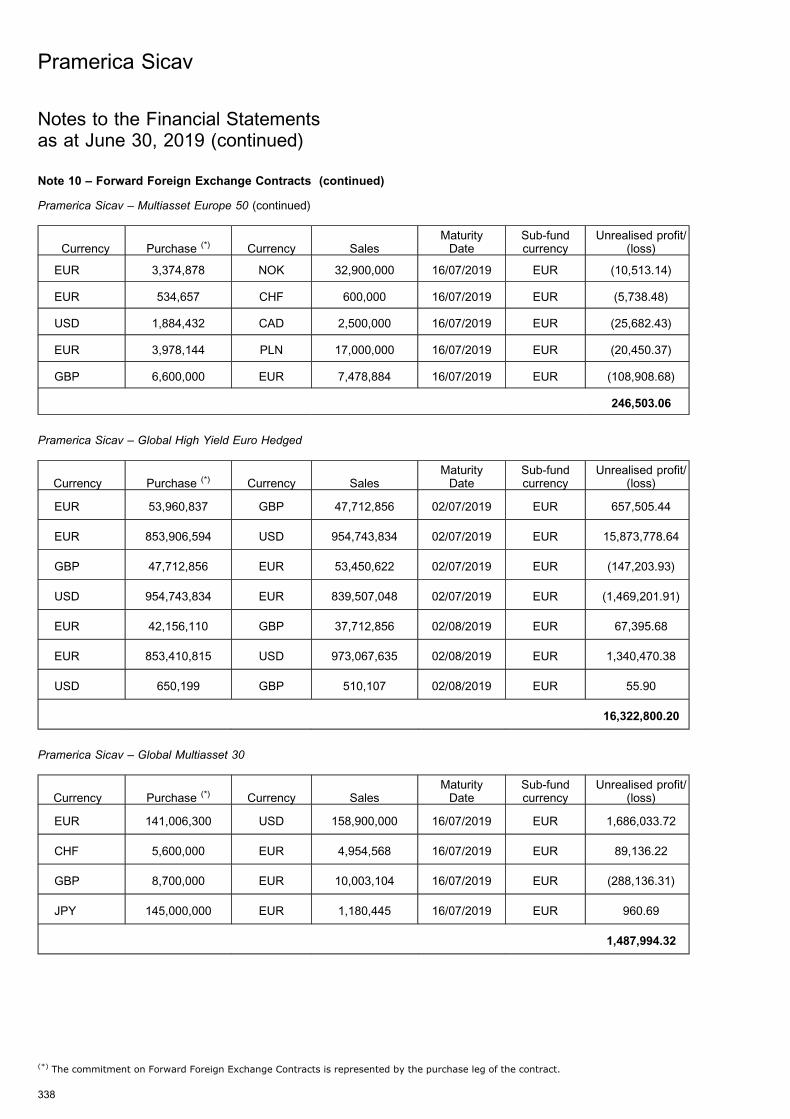
Note 10 – Forward Foreign Exchange Contracts (continued)
Pramerica Sicav – Multiasset Europe 50 (continued)
Currency Purchase (*) Currency SalesMaturityDate
Sub-fundcurrency
Unrealised profit/(loss)
EUR 3,374,878 NOK 32,900,000 16/07/2019 EUR (10,513.14)
EUR 534,657 CHF 600,000 16/07/2019 EUR (5,738.48)
USD 1,884,432 CAD 2,500,000 16/07/2019 EUR (25,682.43)
EUR 3,978,144 PLN 17,000,000 16/07/2019 EUR (20,450.37)
GBP 6,600,000 EUR 7,478,884 16/07/2019 EUR (108,908.68)
246,503.06
Pramerica Sicav – Global High Yield Euro Hedged
Currency Purchase (*) Currency SalesMaturityDate
Sub-fundcurrency
Unrealised profit/(loss)
EUR 53,960,837 GBP 47,712,856 02/07/2019 EUR 657,505.44
EUR 853,906,594 USD 954,743,834 02/07/2019 EUR 15,873,778.64
GBP 47,712,856 EUR 53,450,622 02/07/2019 EUR (147,203.93)
USD 954,743,834 EUR 839,507,048 02/07/2019 EUR (1,469,201.91)
EUR 42,156,110 GBP 37,712,856 02/08/2019 EUR 67,395.68
EUR 853,410,815 USD 973,067,635 02/08/2019 EUR 1,340,470.38
USD 650,199 GBP 510,107 02/08/2019 EUR 55.90
16,322,800.20
Pramerica Sicav – Global Multiasset 30
Currency Purchase (*) Currency SalesMaturityDate
Sub-fundcurrency
Unrealised profit/(loss)
EUR 141,006,300 USD 158,900,000 16/07/2019 EUR 1,686,033.72
CHF 5,600,000 EUR 4,954,568 16/07/2019 EUR 89,136.22
GBP 8,700,000 EUR 10,003,104 16/07/2019 EUR (288,136.31)
JPY 145,000,000 EUR 1,180,445 16/07/2019 EUR 960.69
1,487,994.32
Pramerica Sicav
338
Notes to the Financial Statementsas at June 30, 2019 (continued)
(*) The commitment on Forward Foreign Exchange Contracts is represented by the purchase leg of the contract.
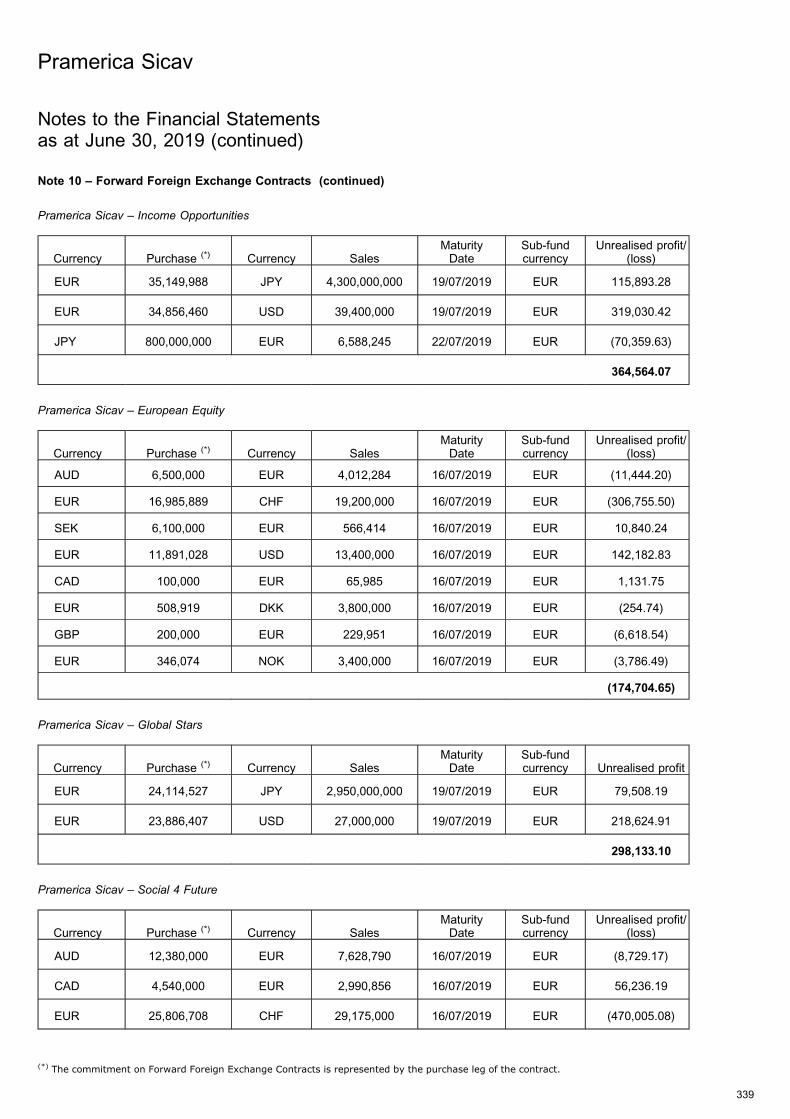
Note 10 – Forward Foreign Exchange Contracts (continued)
Pramerica Sicav – Income Opportunities
Currency Purchase (*) Currency SalesMaturityDate
Sub-fundcurrency
Unrealised profit/(loss)
EUR 35,149,988 JPY 4,300,000,000 19/07/2019 EUR 115,893.28
EUR 34,856,460 USD 39,400,000 19/07/2019 EUR 319,030.42
JPY 800,000,000 EUR 6,588,245 22/07/2019 EUR (70,359.63)
364,564.07
Pramerica Sicav – European Equity
Currency Purchase (*) Currency SalesMaturityDate
Sub-fundcurrency
Unrealised profit/(loss)
AUD 6,500,000 EUR 4,012,284 16/07/2019 EUR (11,444.20)
EUR 16,985,889 CHF 19,200,000 16/07/2019 EUR (306,755.50)
SEK 6,100,000 EUR 566,414 16/07/2019 EUR 10,840.24
EUR 11,891,028 USD 13,400,000 16/07/2019 EUR 142,182.83
CAD 100,000 EUR 65,985 16/07/2019 EUR 1,131.75
EUR 508,919 DKK 3,800,000 16/07/2019 EUR (254.74)
GBP 200,000 EUR 229,951 16/07/2019 EUR (6,618.54)
EUR 346,074 NOK 3,400,000 16/07/2019 EUR (3,786.49)
(174,704.65)
Pramerica Sicav – Global Stars
Currency Purchase (*) Currency SalesMaturityDate
Sub-fundcurrency Unrealised profit
EUR 24,114,527 JPY 2,950,000,000 19/07/2019 EUR 79,508.19
EUR 23,886,407 USD 27,000,000 19/07/2019 EUR 218,624.91
298,133.10
Pramerica Sicav – Social 4 Future
Currency Purchase (*) Currency SalesMaturityDate
Sub-fundcurrency
Unrealised profit/(loss)
AUD 12,380,000 EUR 7,628,790 16/07/2019 EUR (8,729.17)
CAD 4,540,000 EUR 2,990,856 16/07/2019 EUR 56,236.19
EUR 25,806,708 CHF 29,175,000 16/07/2019 EUR (470,005.08)
Pramerica Sicav
339
Notes to the Financial Statementsas at June 30, 2019 (continued)
(*) The commitment on Forward Foreign Exchange Contracts is represented by the purchase leg of the contract.
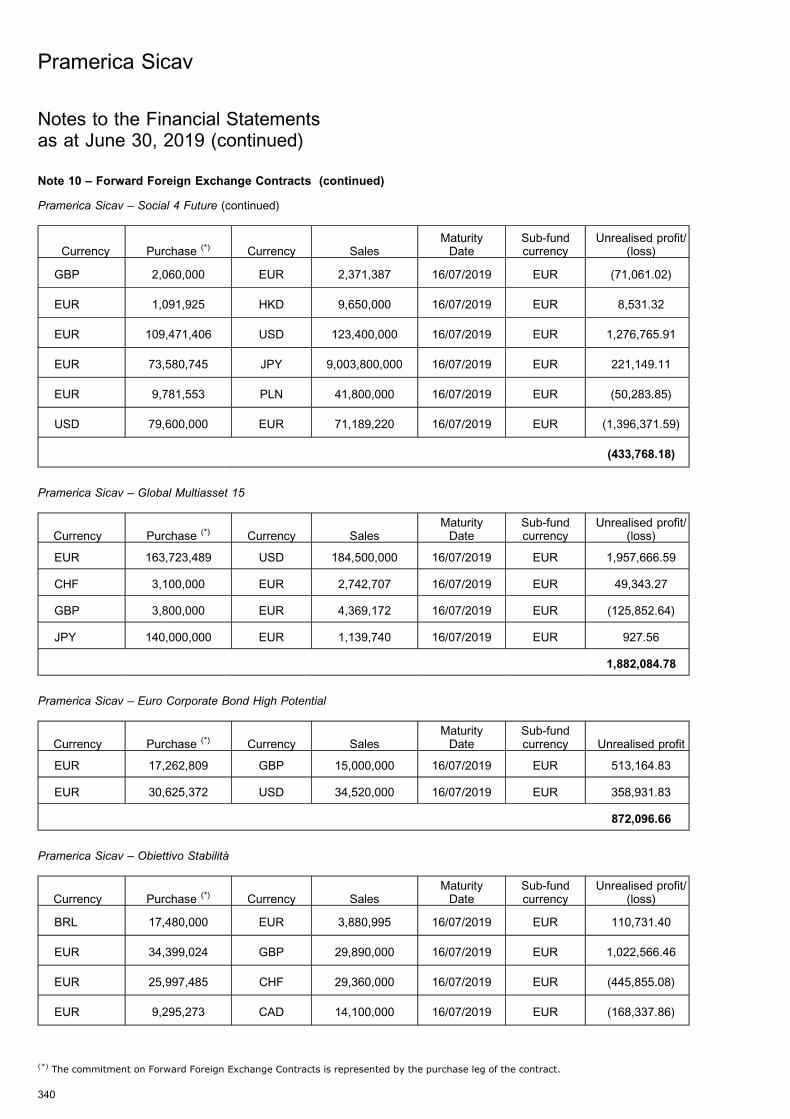
Note 10 – Forward Foreign Exchange Contracts (continued)
Pramerica Sicav – Social 4 Future (continued)
Currency Purchase (*) Currency SalesMaturityDate
Sub-fundcurrency
Unrealised profit/(loss)
GBP 2,060,000 EUR 2,371,387 16/07/2019 EUR (71,061.02)
EUR 1,091,925 HKD 9,650,000 16/07/2019 EUR 8,531.32
EUR 109,471,406 USD 123,400,000 16/07/2019 EUR 1,276,765.91
EUR 73,580,745 JPY 9,003,800,000 16/07/2019 EUR 221,149.11
EUR 9,781,553 PLN 41,800,000 16/07/2019 EUR (50,283.85)
USD 79,600,000 EUR 71,189,220 16/07/2019 EUR (1,396,371.59)
(433,768.18)
Pramerica Sicav – Global Multiasset 15
Currency Purchase (*) Currency SalesMaturityDate
Sub-fundcurrency
Unrealised profit/(loss)
EUR 163,723,489 USD 184,500,000 16/07/2019 EUR 1,957,666.59
CHF 3,100,000 EUR 2,742,707 16/07/2019 EUR 49,343.27
GBP 3,800,000 EUR 4,369,172 16/07/2019 EUR (125,852.64)
JPY 140,000,000 EUR 1,139,740 16/07/2019 EUR 927.56
1,882,084.78
Pramerica Sicav – Euro Corporate Bond High Potential
Currency Purchase (*) Currency SalesMaturityDate
Sub-fundcurrency Unrealised profit
EUR 17,262,809 GBP 15,000,000 16/07/2019 EUR 513,164.83
EUR 30,625,372 USD 34,520,000 16/07/2019 EUR 358,931.83
872,096.66
Pramerica Sicav – Obiettivo Stabilita
Currency Purchase (*) Currency SalesMaturityDate
Sub-fundcurrency
Unrealised profit/(loss)
BRL 17,480,000 EUR 3,880,995 16/07/2019 EUR 110,731.40
EUR 34,399,024 GBP 29,890,000 16/07/2019 EUR 1,022,566.46
EUR 25,997,485 CHF 29,360,000 16/07/2019 EUR (445,855.08)
EUR 9,295,273 CAD 14,100,000 16/07/2019 EUR (168,337.86)
Pramerica Sicav
340
Notes to the Financial Statementsas at June 30, 2019 (continued)
(*) The commitment on Forward Foreign Exchange Contracts is represented by the purchase leg of the contract.
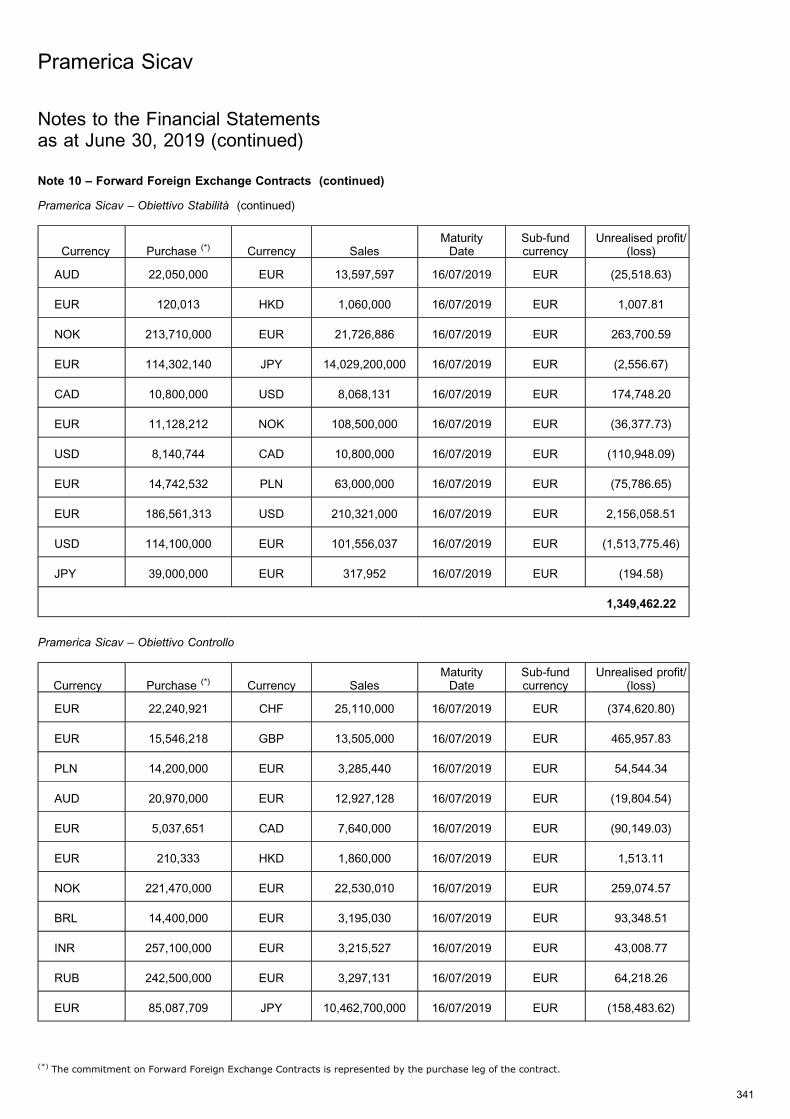
Note 10 – Forward Foreign Exchange Contracts (continued)
Pramerica Sicav – Obiettivo Stabilita (continued)
Currency Purchase (*) Currency SalesMaturityDate
Sub-fundcurrency
Unrealised profit/(loss)
AUD 22,050,000 EUR 13,597,597 16/07/2019 EUR (25,518.63)
EUR 120,013 HKD 1,060,000 16/07/2019 EUR 1,007.81
NOK 213,710,000 EUR 21,726,886 16/07/2019 EUR 263,700.59
EUR 114,302,140 JPY 14,029,200,000 16/07/2019 EUR (2,556.67)
CAD 10,800,000 USD 8,068,131 16/07/2019 EUR 174,748.20
EUR 11,128,212 NOK 108,500,000 16/07/2019 EUR (36,377.73)
USD 8,140,744 CAD 10,800,000 16/07/2019 EUR (110,948.09)
EUR 14,742,532 PLN 63,000,000 16/07/2019 EUR (75,786.65)
EUR 186,561,313 USD 210,321,000 16/07/2019 EUR 2,156,058.51
USD 114,100,000 EUR 101,556,037 16/07/2019 EUR (1,513,775.46)
JPY 39,000,000 EUR 317,952 16/07/2019 EUR (194.58)
1,349,462.22
Pramerica Sicav – Obiettivo Controllo
Currency Purchase (*) Currency SalesMaturityDate
Sub-fundcurrency
Unrealised profit/(loss)
EUR 22,240,921 CHF 25,110,000 16/07/2019 EUR (374,620.80)
EUR 15,546,218 GBP 13,505,000 16/07/2019 EUR 465,957.83
PLN 14,200,000 EUR 3,285,440 16/07/2019 EUR 54,544.34
AUD 20,970,000 EUR 12,927,128 16/07/2019 EUR (19,804.54)
EUR 5,037,651 CAD 7,640,000 16/07/2019 EUR (90,149.03)
EUR 210,333 HKD 1,860,000 16/07/2019 EUR 1,513.11
NOK 221,470,000 EUR 22,530,010 16/07/2019 EUR 259,074.57
BRL 14,400,000 EUR 3,195,030 16/07/2019 EUR 93,348.51
INR 257,100,000 EUR 3,215,527 16/07/2019 EUR 43,008.77
RUB 242,500,000 EUR 3,297,131 16/07/2019 EUR 64,218.26
EUR 85,087,709 JPY 10,462,700,000 16/07/2019 EUR (158,483.62)
Pramerica Sicav
341
Notes to the Financial Statementsas at June 30, 2019 (continued)
(*) The commitment on Forward Foreign Exchange Contracts is represented by the purchase leg of the contract.
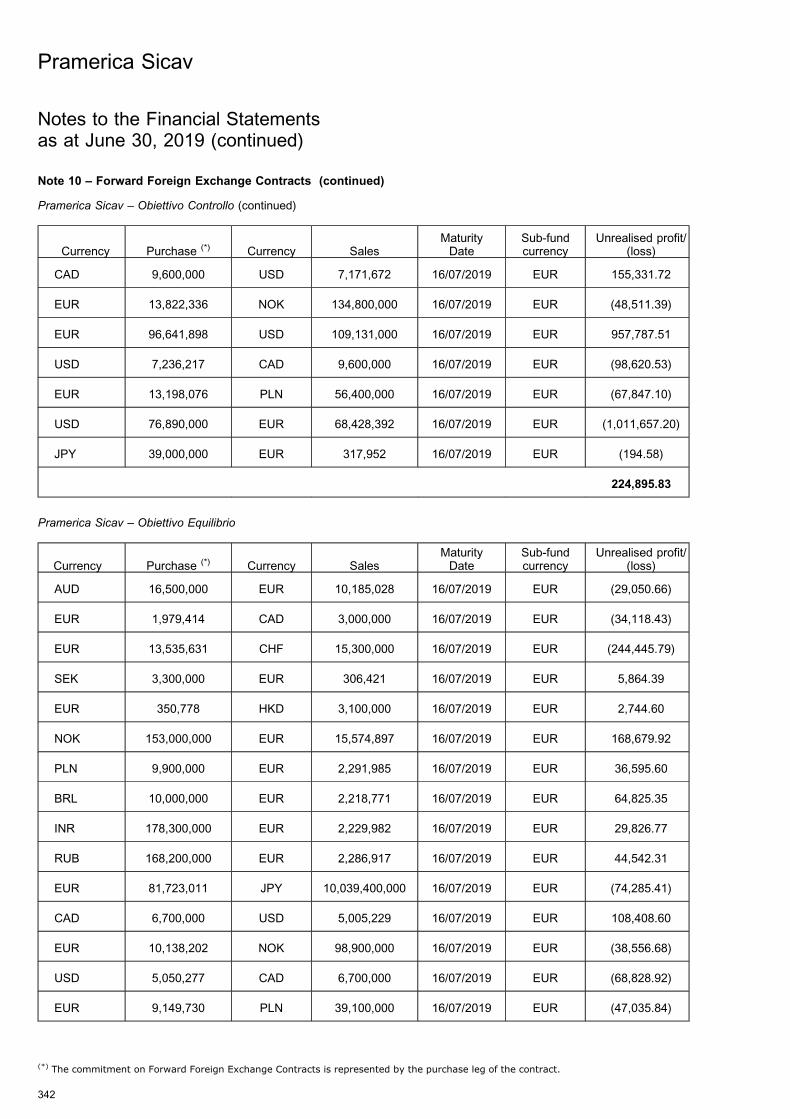
Note 10 – Forward Foreign Exchange Contracts (continued)
Pramerica Sicav – Obiettivo Controllo (continued)
Currency Purchase (*) Currency SalesMaturityDate
Sub-fundcurrency
Unrealised profit/(loss)
CAD 9,600,000 USD 7,171,672 16/07/2019 EUR 155,331.72
EUR 13,822,336 NOK 134,800,000 16/07/2019 EUR (48,511.39)
EUR 96,641,898 USD 109,131,000 16/07/2019 EUR 957,787.51
USD 7,236,217 CAD 9,600,000 16/07/2019 EUR (98,620.53)
EUR 13,198,076 PLN 56,400,000 16/07/2019 EUR (67,847.10)
USD 76,890,000 EUR 68,428,392 16/07/2019 EUR (1,011,657.20)
JPY 39,000,000 EUR 317,952 16/07/2019 EUR (194.58)
224,895.83
Pramerica Sicav – Obiettivo Equilibrio
Currency Purchase (*) Currency SalesMaturityDate
Sub-fundcurrency
Unrealised profit/(loss)
AUD 16,500,000 EUR 10,185,028 16/07/2019 EUR (29,050.66)
EUR 1,979,414 CAD 3,000,000 16/07/2019 EUR (34,118.43)
EUR 13,535,631 CHF 15,300,000 16/07/2019 EUR (244,445.79)
SEK 3,300,000 EUR 306,421 16/07/2019 EUR 5,864.39
EUR 350,778 HKD 3,100,000 16/07/2019 EUR 2,744.60
NOK 153,000,000 EUR 15,574,897 16/07/2019 EUR 168,679.92
PLN 9,900,000 EUR 2,291,985 16/07/2019 EUR 36,595.60
BRL 10,000,000 EUR 2,218,771 16/07/2019 EUR 64,825.35
INR 178,300,000 EUR 2,229,982 16/07/2019 EUR 29,826.77
RUB 168,200,000 EUR 2,286,917 16/07/2019 EUR 44,542.31
EUR 81,723,011 JPY 10,039,400,000 16/07/2019 EUR (74,285.41)
CAD 6,700,000 USD 5,005,229 16/07/2019 EUR 108,408.60
EUR 10,138,202 NOK 98,900,000 16/07/2019 EUR (38,556.68)
USD 5,050,277 CAD 6,700,000 16/07/2019 EUR (68,828.92)
EUR 9,149,730 PLN 39,100,000 16/07/2019 EUR (47,035.84)
Pramerica Sicav
342
Notes to the Financial Statementsas at June 30, 2019 (continued)
(*) The commitment on Forward Foreign Exchange Contracts is represented by the purchase leg of the contract.
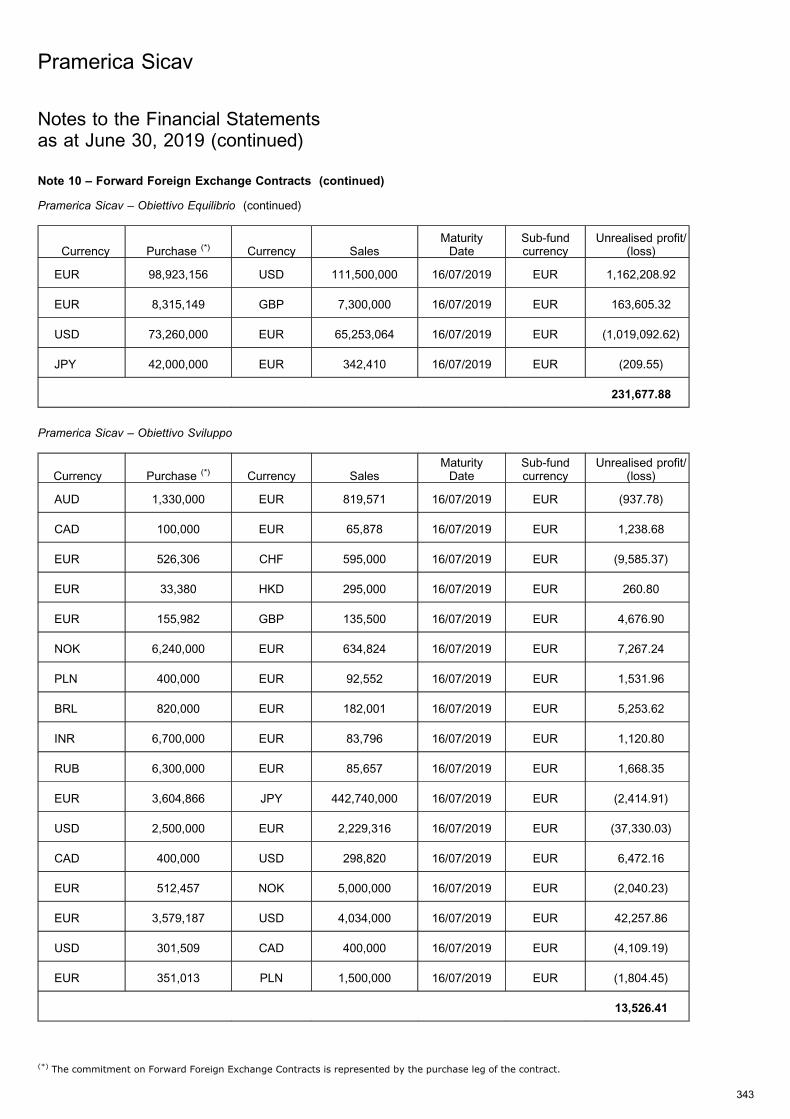
Note 10 – Forward Foreign Exchange Contracts (continued)
Pramerica Sicav – Obiettivo Equilibrio (continued)
Currency Purchase (*) Currency SalesMaturityDate
Sub-fundcurrency
Unrealised profit/(loss)
EUR 98,923,156 USD 111,500,000 16/07/2019 EUR 1,162,208.92
EUR 8,315,149 GBP 7,300,000 16/07/2019 EUR 163,605.32
USD 73,260,000 EUR 65,253,064 16/07/2019 EUR (1,019,092.62)
JPY 42,000,000 EUR 342,410 16/07/2019 EUR (209.55)
231,677.88
Pramerica Sicav – Obiettivo Sviluppo
Currency Purchase (*) Currency SalesMaturityDate
Sub-fundcurrency
Unrealised profit/(loss)
AUD 1,330,000 EUR 819,571 16/07/2019 EUR (937.78)
CAD 100,000 EUR 65,878 16/07/2019 EUR 1,238.68
EUR 526,306 CHF 595,000 16/07/2019 EUR (9,585.37)
EUR 33,380 HKD 295,000 16/07/2019 EUR 260.80
EUR 155,982 GBP 135,500 16/07/2019 EUR 4,676.90
NOK 6,240,000 EUR 634,824 16/07/2019 EUR 7,267.24
PLN 400,000 EUR 92,552 16/07/2019 EUR 1,531.96
BRL 820,000 EUR 182,001 16/07/2019 EUR 5,253.62
INR 6,700,000 EUR 83,796 16/07/2019 EUR 1,120.80
RUB 6,300,000 EUR 85,657 16/07/2019 EUR 1,668.35
EUR 3,604,866 JPY 442,740,000 16/07/2019 EUR (2,414.91)
USD 2,500,000 EUR 2,229,316 16/07/2019 EUR (37,330.03)
CAD 400,000 USD 298,820 16/07/2019 EUR 6,472.16
EUR 512,457 NOK 5,000,000 16/07/2019 EUR (2,040.23)
EUR 3,579,187 USD 4,034,000 16/07/2019 EUR 42,257.86
USD 301,509 CAD 400,000 16/07/2019 EUR (4,109.19)
EUR 351,013 PLN 1,500,000 16/07/2019 EUR (1,804.45)
13,526.41
Pramerica Sicav
343
Notes to the Financial Statementsas at June 30, 2019 (continued)
(*) The commitment on Forward Foreign Exchange Contracts is represented by the purchase leg of the contract.
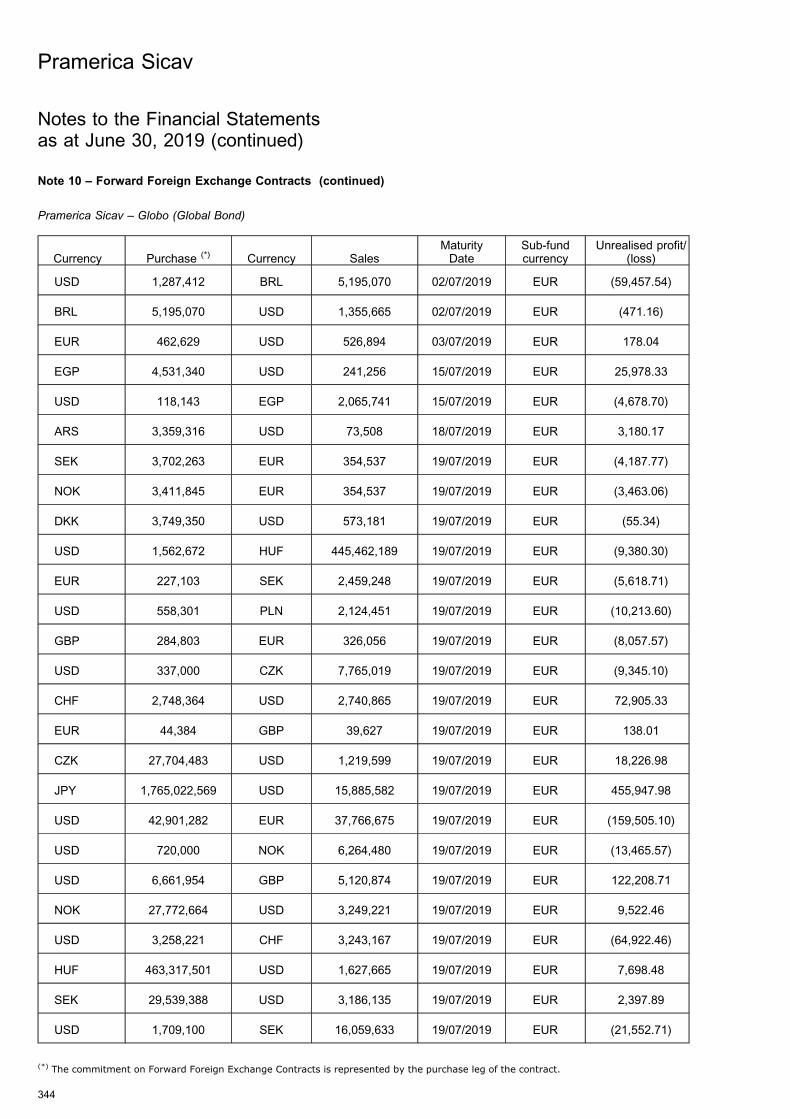
Note 10 – Forward Foreign Exchange Contracts (continued)
Pramerica Sicav – Globo (Global Bond)
Currency Purchase (*) Currency SalesMaturityDate
Sub-fundcurrency
Unrealised profit/(loss)
USD 1,287,412 BRL 5,195,070 02/07/2019 EUR (59,457.54)
BRL 5,195,070 USD 1,355,665 02/07/2019 EUR (471.16)
EUR 462,629 USD 526,894 03/07/2019 EUR 178.04
EGP 4,531,340 USD 241,256 15/07/2019 EUR 25,978.33
USD 118,143 EGP 2,065,741 15/07/2019 EUR (4,678.70)
ARS 3,359,316 USD 73,508 18/07/2019 EUR 3,180.17
SEK 3,702,263 EUR 354,537 19/07/2019 EUR (4,187.77)
NOK 3,411,845 EUR 354,537 19/07/2019 EUR (3,463.06)
DKK 3,749,350 USD 573,181 19/07/2019 EUR (55.34)
USD 1,562,672 HUF 445,462,189 19/07/2019 EUR (9,380.30)
EUR 227,103 SEK 2,459,248 19/07/2019 EUR (5,618.71)
USD 558,301 PLN 2,124,451 19/07/2019 EUR (10,213.60)
GBP 284,803 EUR 326,056 19/07/2019 EUR (8,057.57)
USD 337,000 CZK 7,765,019 19/07/2019 EUR (9,345.10)
CHF 2,748,364 USD 2,740,865 19/07/2019 EUR 72,905.33
EUR 44,384 GBP 39,627 19/07/2019 EUR 138.01
CZK 27,704,483 USD 1,219,599 19/07/2019 EUR 18,226.98
JPY 1,765,022,569 USD 15,885,582 19/07/2019 EUR 455,947.98
USD 42,901,282 EUR 37,766,675 19/07/2019 EUR (159,505.10)
USD 720,000 NOK 6,264,480 19/07/2019 EUR (13,465.57)
USD 6,661,954 GBP 5,120,874 19/07/2019 EUR 122,208.71
NOK 27,772,664 USD 3,249,221 19/07/2019 EUR 9,522.46
USD 3,258,221 CHF 3,243,167 19/07/2019 EUR (64,922.46)
HUF 463,317,501 USD 1,627,665 19/07/2019 EUR 7,698.48
SEK 29,539,388 USD 3,186,135 19/07/2019 EUR 2,397.89
USD 1,709,100 SEK 16,059,633 19/07/2019 EUR (21,552.71)
Pramerica Sicav
344
Notes to the Financial Statementsas at June 30, 2019 (continued)
(*) The commitment on Forward Foreign Exchange Contracts is represented by the purchase leg of the contract.

Note 10 – Forward Foreign Exchange Contracts (continued)
Pramerica Sicav – Globo (Global Bond) (continued)
Currency Purchase (*) Currency SalesMaturityDate
Sub-fundcurrency
Unrealised profit/(loss)
GBP 2,439,550 USD 3,166,984 19/07/2019 EUR (52,369.84)
PLN 5,068,616 USD 1,338,000 19/07/2019 EUR 19,130.72
EUR 164,675 CHF 182,752 19/07/2019 EUR 72.66
EUR 7,358,791 USD 8,325,901 19/07/2019 EUR 60,424.06
USD 3,138,442 JPY 341,139,210 19/07/2019 EUR (28,271.37)
CAD 7,417,816 USD 5,555,730 22/07/2019 EUR 107,876.66
USD 5,431,830 AUD 7,706,175 22/07/2019 EUR 18,513.18
AUD 2,735,253 USD 1,917,389 22/07/2019 EUR 2,731.83
USD 1,443,430 CAD 1,930,197 22/07/2019 EUR (30,016.13)
NZD 3,252,861 USD 2,146,183 22/07/2019 EUR 34,278.84
USD 3,087,866 NZD 4,607,543 22/07/2019 EUR (6,504.95)
ARS 3,366,712 USD 73,509 23/07/2019 EUR 2,879.07
USD 935,492 ILS 3,357,886 25/07/2019 EUR (6,409.75)
SGD 387,333 USD 284,592 25/07/2019 EUR 1,513.94
ARS 13,902,258 USD 302,278 25/07/2019 EUR 12,254.58
ILS 1,875,225 USD 523,316 25/07/2019 EUR 2,806.87
USD 4,250,667 CNH 28,999,996 25/07/2019 EUR 27,954.61
CNY 9,115,824 USD 1,340,351 25/07/2019 EUR (12,587.31)
CNH 17,026,322 USD 2,478,872 25/07/2019 EUR (1,697.86)
EGP 2,060,601 USD 110,781 29/07/2019 EUR 10,679.36
USD 1,253,982 BRL 4,816,859 02/08/2019 EUR 1,034.65
BRL 418,854 USD 109,000 02/08/2019 EUR (53.58)
USD 3,296,155 THB 104,136,130 09/08/2019 EUR (89,233.88)
THB 119,030,521 USD 3,753,842 09/08/2019 EUR 114,149.57
CNH 4,575,616 USD 660,453 05/09/2019 EUR 4,223.27
CNY 4,565,112 USD 658,936 05/09/2019 EUR 3,640.38
Pramerica Sicav
345
Notes to the Financial Statementsas at June 30, 2019 (continued)
(*) The commitment on Forward Foreign Exchange Contracts is represented by the purchase leg of the contract.
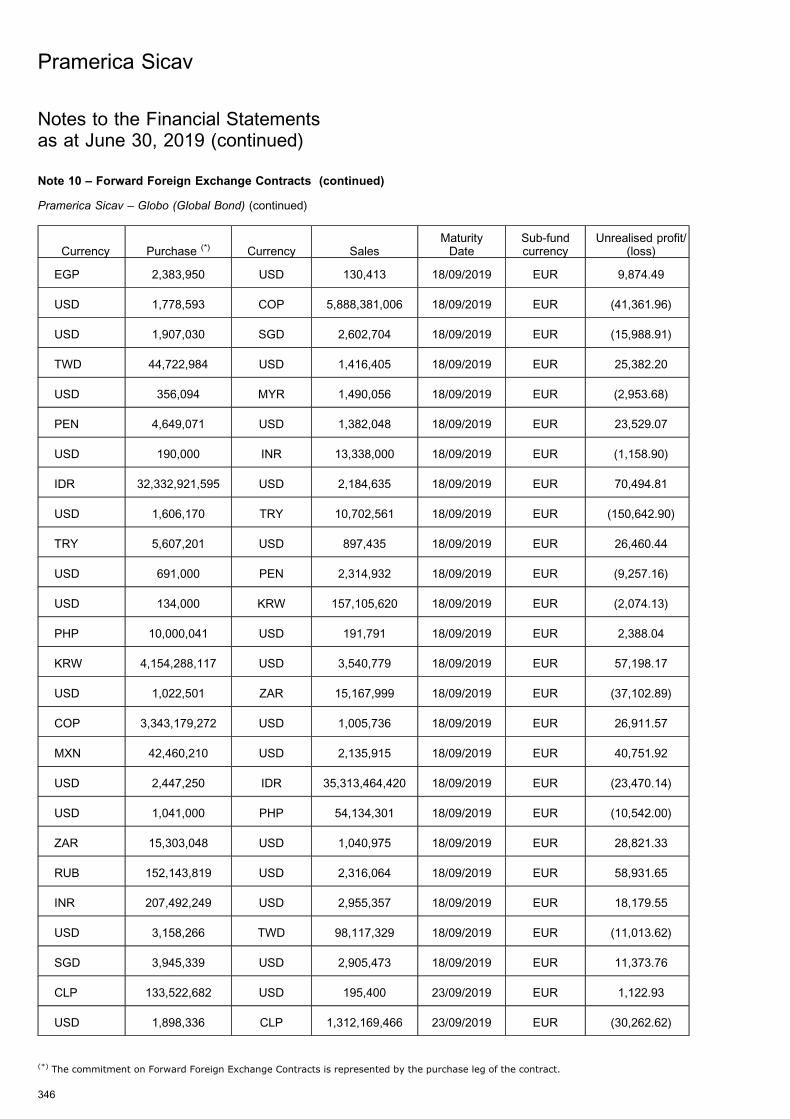
Note 10 – Forward Foreign Exchange Contracts (continued)
Pramerica Sicav – Globo (Global Bond) (continued)
Currency Purchase (*) Currency SalesMaturityDate
Sub-fundcurrency
Unrealised profit/(loss)
EGP 2,383,950 USD 130,413 18/09/2019 EUR 9,874.49
USD 1,778,593 COP 5,888,381,006 18/09/2019 EUR (41,361.96)
USD 1,907,030 SGD 2,602,704 18/09/2019 EUR (15,988.91)
TWD 44,722,984 USD 1,416,405 18/09/2019 EUR 25,382.20
USD 356,094 MYR 1,490,056 18/09/2019 EUR (2,953.68)
PEN 4,649,071 USD 1,382,048 18/09/2019 EUR 23,529.07
USD 190,000 INR 13,338,000 18/09/2019 EUR (1,158.90)
IDR 32,332,921,595 USD 2,184,635 18/09/2019 EUR 70,494.81
USD 1,606,170 TRY 10,702,561 18/09/2019 EUR (150,642.90)
TRY 5,607,201 USD 897,435 18/09/2019 EUR 26,460.44
USD 691,000 PEN 2,314,932 18/09/2019 EUR (9,257.16)
USD 134,000 KRW 157,105,620 18/09/2019 EUR (2,074.13)
PHP 10,000,041 USD 191,791 18/09/2019 EUR 2,388.04
KRW 4,154,288,117 USD 3,540,779 18/09/2019 EUR 57,198.17
USD 1,022,501 ZAR 15,167,999 18/09/2019 EUR (37,102.89)
COP 3,343,179,272 USD 1,005,736 18/09/2019 EUR 26,911.57
MXN 42,460,210 USD 2,135,915 18/09/2019 EUR 40,751.92
USD 2,447,250 IDR 35,313,464,420 18/09/2019 EUR (23,470.14)
USD 1,041,000 PHP 54,134,301 18/09/2019 EUR (10,542.00)
ZAR 15,303,048 USD 1,040,975 18/09/2019 EUR 28,821.33
RUB 152,143,819 USD 2,316,064 18/09/2019 EUR 58,931.65
INR 207,492,249 USD 2,955,357 18/09/2019 EUR 18,179.55
USD 3,158,266 TWD 98,117,329 18/09/2019 EUR (11,013.62)
SGD 3,945,339 USD 2,905,473 18/09/2019 EUR 11,373.76
CLP 133,522,682 USD 195,400 23/09/2019 EUR 1,122.93
USD 1,898,336 CLP 1,312,169,466 23/09/2019 EUR (30,262.62)
Pramerica Sicav
346
Notes to the Financial Statementsas at June 30, 2019 (continued)
(*) The commitment on Forward Foreign Exchange Contracts is represented by the purchase leg of the contract.
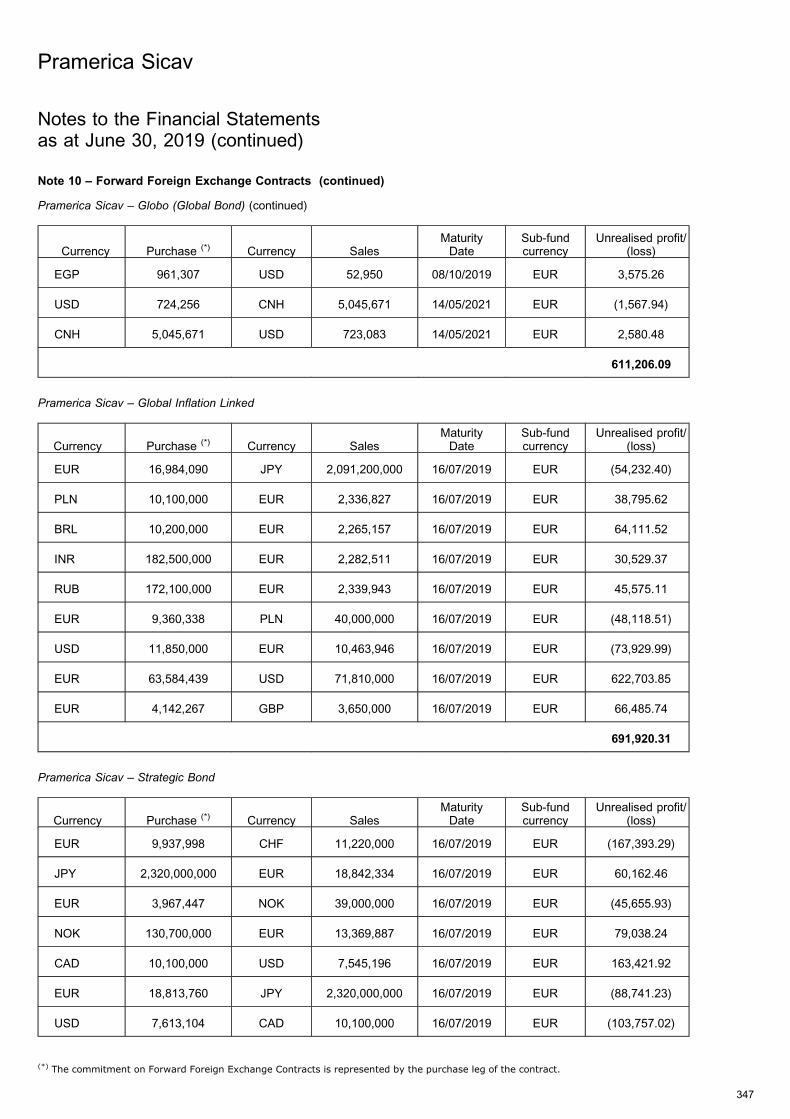
Note 10 – Forward Foreign Exchange Contracts (continued)
Pramerica Sicav – Globo (Global Bond) (continued)
Currency Purchase (*) Currency SalesMaturityDate
Sub-fundcurrency
Unrealised profit/(loss)
EGP 961,307 USD 52,950 08/10/2019 EUR 3,575.26
USD 724,256 CNH 5,045,671 14/05/2021 EUR (1,567.94)
CNH 5,045,671 USD 723,083 14/05/2021 EUR 2,580.48
611,206.09
Pramerica Sicav – Global Inflation Linked
Currency Purchase (*) Currency SalesMaturityDate
Sub-fundcurrency
Unrealised profit/(loss)
EUR 16,984,090 JPY 2,091,200,000 16/07/2019 EUR (54,232.40)
PLN 10,100,000 EUR 2,336,827 16/07/2019 EUR 38,795.62
BRL 10,200,000 EUR 2,265,157 16/07/2019 EUR 64,111.52
INR 182,500,000 EUR 2,282,511 16/07/2019 EUR 30,529.37
RUB 172,100,000 EUR 2,339,943 16/07/2019 EUR 45,575.11
EUR 9,360,338 PLN 40,000,000 16/07/2019 EUR (48,118.51)
USD 11,850,000 EUR 10,463,946 16/07/2019 EUR (73,929.99)
EUR 63,584,439 USD 71,810,000 16/07/2019 EUR 622,703.85
EUR 4,142,267 GBP 3,650,000 16/07/2019 EUR 66,485.74
691,920.31
Pramerica Sicav – Strategic Bond
Currency Purchase (*) Currency SalesMaturityDate
Sub-fundcurrency
Unrealised profit/(loss)
EUR 9,937,998 CHF 11,220,000 16/07/2019 EUR (167,393.29)
JPY 2,320,000,000 EUR 18,842,334 16/07/2019 EUR 60,162.46
EUR 3,967,447 NOK 39,000,000 16/07/2019 EUR (45,655.93)
NOK 130,700,000 EUR 13,369,887 16/07/2019 EUR 79,038.24
CAD 10,100,000 USD 7,545,196 16/07/2019 EUR 163,421.92
EUR 18,813,760 JPY 2,320,000,000 16/07/2019 EUR (88,741.23)
USD 7,613,104 CAD 10,100,000 16/07/2019 EUR (103,757.02)
Pramerica Sicav
347
Notes to the Financial Statementsas at June 30, 2019 (continued)
(*) The commitment on Forward Foreign Exchange Contracts is represented by the purchase leg of the contract.
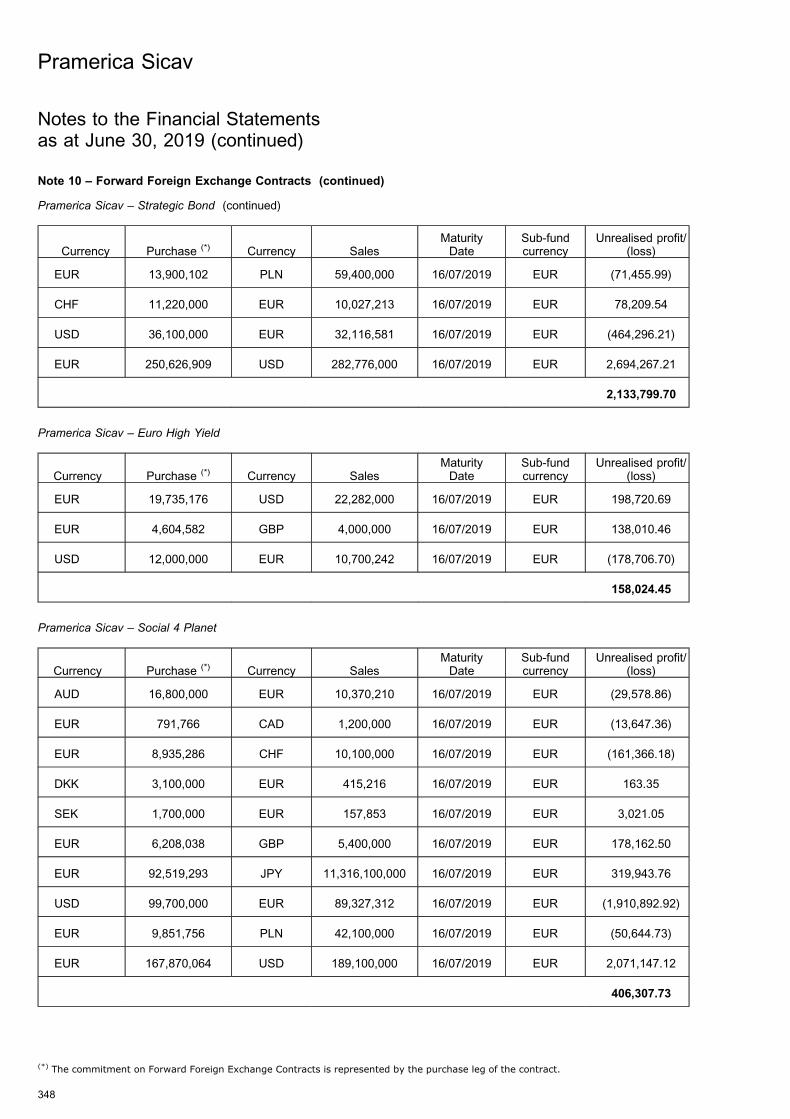
Note 10 – Forward Foreign Exchange Contracts (continued)
Pramerica Sicav – Strategic Bond (continued)
Currency Purchase (*) Currency SalesMaturityDate
Sub-fundcurrency
Unrealised profit/(loss)
EUR 13,900,102 PLN 59,400,000 16/07/2019 EUR (71,455.99)
CHF 11,220,000 EUR 10,027,213 16/07/2019 EUR 78,209.54
USD 36,100,000 EUR 32,116,581 16/07/2019 EUR (464,296.21)
EUR 250,626,909 USD 282,776,000 16/07/2019 EUR 2,694,267.21
2,133,799.70
Pramerica Sicav – Euro High Yield
Currency Purchase (*) Currency SalesMaturityDate
Sub-fundcurrency
Unrealised profit/(loss)
EUR 19,735,176 USD 22,282,000 16/07/2019 EUR 198,720.69
EUR 4,604,582 GBP 4,000,000 16/07/2019 EUR 138,010.46
USD 12,000,000 EUR 10,700,242 16/07/2019 EUR (178,706.70)
158,024.45
Pramerica Sicav – Social 4 Planet
Currency Purchase (*) Currency SalesMaturityDate
Sub-fundcurrency
Unrealised profit/(loss)
AUD 16,800,000 EUR 10,370,210 16/07/2019 EUR (29,578.86)
EUR 791,766 CAD 1,200,000 16/07/2019 EUR (13,647.36)
EUR 8,935,286 CHF 10,100,000 16/07/2019 EUR (161,366.18)
DKK 3,100,000 EUR 415,216 16/07/2019 EUR 163.35
SEK 1,700,000 EUR 157,853 16/07/2019 EUR 3,021.05
EUR 6,208,038 GBP 5,400,000 16/07/2019 EUR 178,162.50
EUR 92,519,293 JPY 11,316,100,000 16/07/2019 EUR 319,943.76
USD 99,700,000 EUR 89,327,312 16/07/2019 EUR (1,910,892.92)
EUR 9,851,756 PLN 42,100,000 16/07/2019 EUR (50,644.73)
EUR 167,870,064 USD 189,100,000 16/07/2019 EUR 2,071,147.12
406,307.73
Pramerica Sicav
348
Notes to the Financial Statementsas at June 30, 2019 (continued)
(*) The commitment on Forward Foreign Exchange Contracts is represented by the purchase leg of the contract.
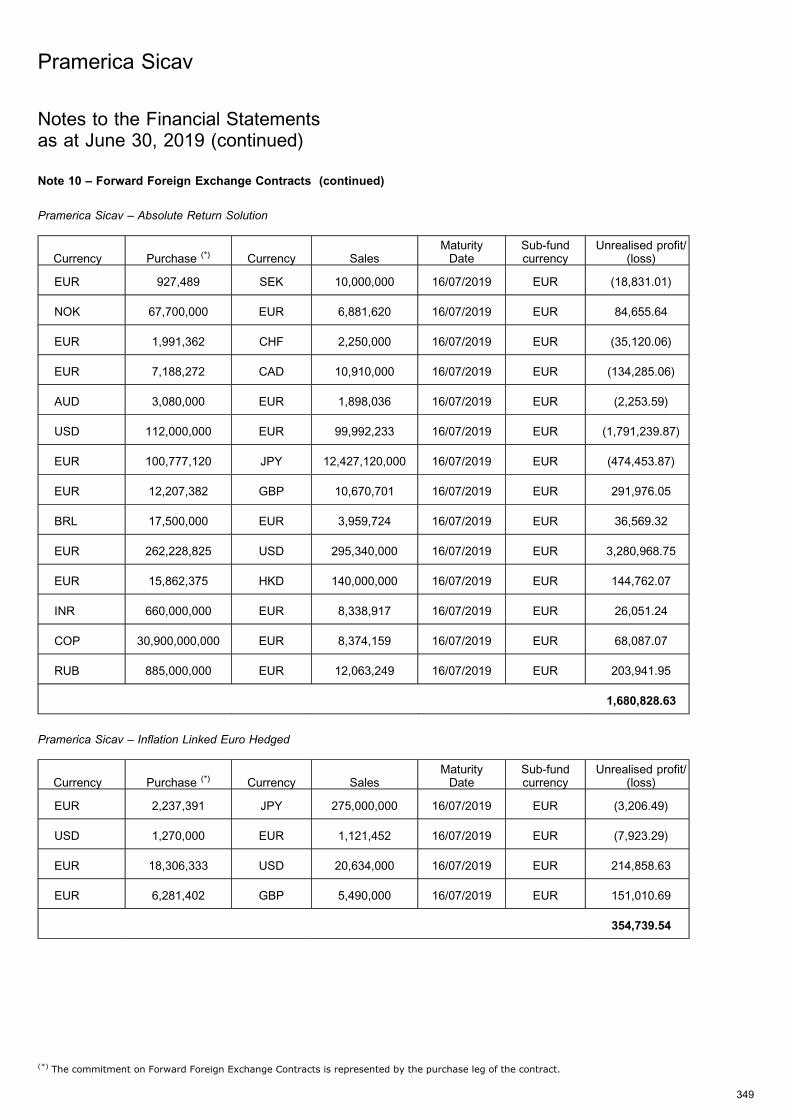
Note 10 – Forward Foreign Exchange Contracts (continued)
Pramerica Sicav – Absolute Return Solution
Currency Purchase (*) Currency SalesMaturityDate
Sub-fundcurrency
Unrealised profit/(loss)
EUR 927,489 SEK 10,000,000 16/07/2019 EUR (18,831.01)
NOK 67,700,000 EUR 6,881,620 16/07/2019 EUR 84,655.64
EUR 1,991,362 CHF 2,250,000 16/07/2019 EUR (35,120.06)
EUR 7,188,272 CAD 10,910,000 16/07/2019 EUR (134,285.06)
AUD 3,080,000 EUR 1,898,036 16/07/2019 EUR (2,253.59)
USD 112,000,000 EUR 99,992,233 16/07/2019 EUR (1,791,239.87)
EUR 100,777,120 JPY 12,427,120,000 16/07/2019 EUR (474,453.87)
EUR 12,207,382 GBP 10,670,701 16/07/2019 EUR 291,976.05
BRL 17,500,000 EUR 3,959,724 16/07/2019 EUR 36,569.32
EUR 262,228,825 USD 295,340,000 16/07/2019 EUR 3,280,968.75
EUR 15,862,375 HKD 140,000,000 16/07/2019 EUR 144,762.07
INR 660,000,000 EUR 8,338,917 16/07/2019 EUR 26,051.24
COP 30,900,000,000 EUR 8,374,159 16/07/2019 EUR 68,087.07
RUB 885,000,000 EUR 12,063,249 16/07/2019 EUR 203,941.95
1,680,828.63
Pramerica Sicav – Inflation Linked Euro Hedged
Currency Purchase (*) Currency SalesMaturityDate
Sub-fundcurrency
Unrealised profit/(loss)
EUR 2,237,391 JPY 275,000,000 16/07/2019 EUR (3,206.49)
USD 1,270,000 EUR 1,121,452 16/07/2019 EUR (7,923.29)
EUR 18,306,333 USD 20,634,000 16/07/2019 EUR 214,858.63
EUR 6,281,402 GBP 5,490,000 16/07/2019 EUR 151,010.69
354,739.54
Pramerica Sicav
349
Notes to the Financial Statementsas at June 30, 2019 (continued)
(*) The commitment on Forward Foreign Exchange Contracts is represented by the purchase leg of the contract.
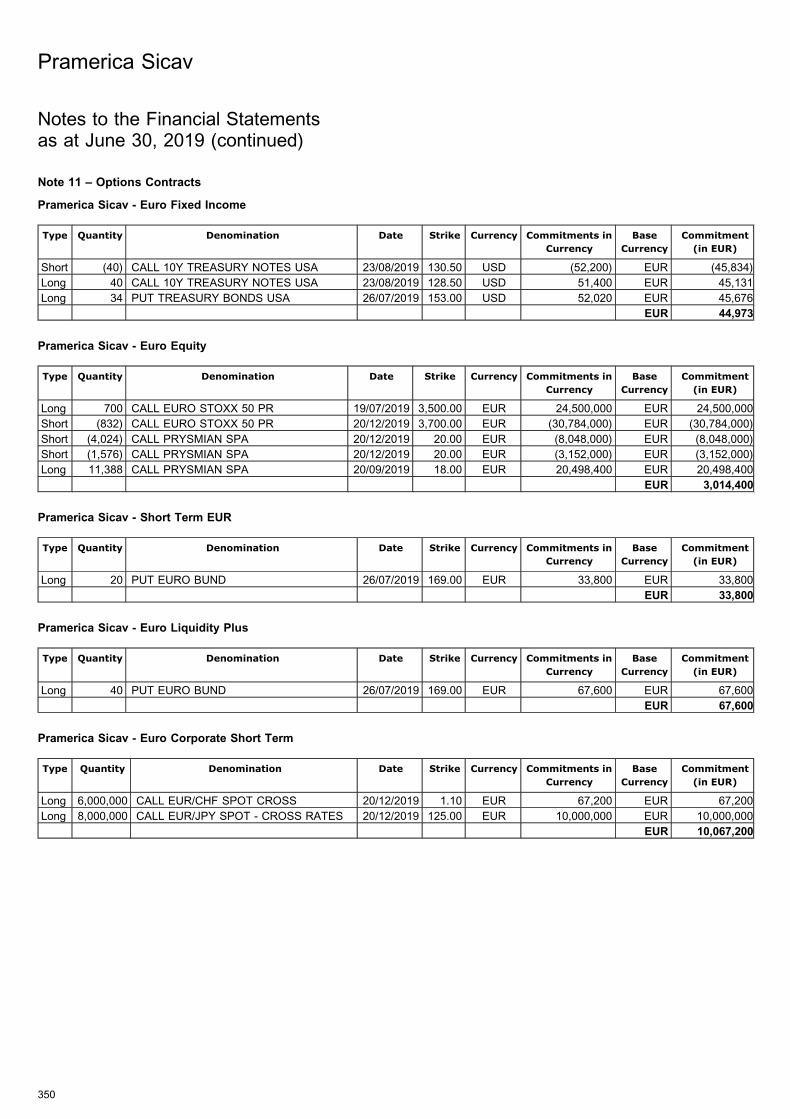
Note 11 – Options Contracts
Pramerica Sicav - Euro Fixed Income
Type Quantity Denomination Date Strike Currency Commitments in
Currency
Base
Currency
Commitment
(in EUR)
Short (40) CALL 10Y TREASURY NOTES USA 23/08/2019 130.50 USD (52,200) EUR (45,834)
Long 40 CALL 10Y TREASURY NOTES USA 23/08/2019 128.50 USD 51,400 EUR 45,131
Long 34 PUT TREASURY BONDS USA 26/07/2019 153.00 USD 52,020 EUR 45,676
EUR 44,973
Pramerica Sicav - Euro Equity
Type Quantity Denomination Date Strike Currency Commitments in
Currency
Base
Currency
Commitment
(in EUR)
Long 700 CALL EURO STOXX 50 PR 19/07/2019 3,500.00 EUR 24,500,000 EUR 24,500,000
Short (832) CALL EURO STOXX 50 PR 20/12/2019 3,700.00 EUR (30,784,000) EUR (30,784,000)
Short (4,024) CALL PRYSMIAN SPA 20/12/2019 20.00 EUR (8,048,000) EUR (8,048,000)
Short (1,576) CALL PRYSMIAN SPA 20/12/2019 20.00 EUR (3,152,000) EUR (3,152,000)
Long 11,388 CALL PRYSMIAN SPA 20/09/2019 18.00 EUR 20,498,400 EUR 20,498,400
EUR 3,014,400
Pramerica Sicav - Short Term EUR
Type Quantity Denomination Date Strike Currency Commitments in
Currency
Base
Currency
Commitment
(in EUR)
Long 20 PUT EURO BUND 26/07/2019 169.00 EUR 33,800 EUR 33,800
EUR 33,800
Pramerica Sicav - Euro Liquidity Plus
Type Quantity Denomination Date Strike Currency Commitments in
Currency
Base
Currency
Commitment
(in EUR)
Long 40 PUT EURO BUND 26/07/2019 169.00 EUR 67,600 EUR 67,600
EUR 67,600
Pramerica Sicav - Euro Corporate Short Term
Type Quantity Denomination Date Strike Currency Commitments in
Currency
Base
Currency
Commitment
(in EUR)
Long 6,000,000 CALL EUR/CHF SPOT CROSS 20/12/2019 1.10 EUR 67,200 EUR 67,200
Long 8,000,000 CALL EUR/JPY SPOT - CROSS RATES 20/12/2019 125.00 EUR 10,000,000 EUR 10,000,000
EUR 10,067,200
Pramerica Sicav
350
Notes to the Financial Statementsas at June 30, 2019 (continued)
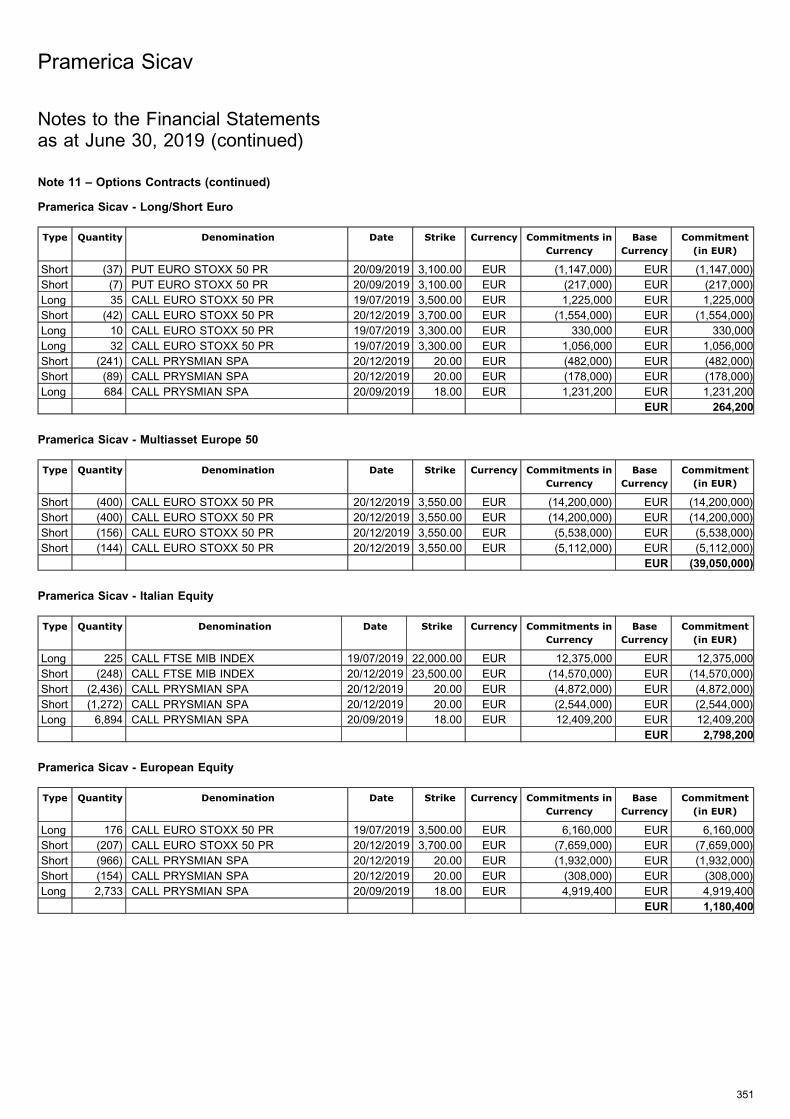
Note 11 – Options Contracts (continued)
Pramerica Sicav - Long/Short Euro
Type Quantity Denomination Date Strike Currency Commitments in
Currency
Base
Currency
Commitment
(in EUR)
Short (37) PUT EURO STOXX 50 PR 20/09/2019 3,100.00 EUR (1,147,000) EUR (1,147,000)
Short (7) PUT EURO STOXX 50 PR 20/09/2019 3,100.00 EUR (217,000) EUR (217,000)
Long 35 CALL EURO STOXX 50 PR 19/07/2019 3,500.00 EUR 1,225,000 EUR 1,225,000
Short (42) CALL EURO STOXX 50 PR 20/12/2019 3,700.00 EUR (1,554,000) EUR (1,554,000)
Long 10 CALL EURO STOXX 50 PR 19/07/2019 3,300.00 EUR 330,000 EUR 330,000
Long 32 CALL EURO STOXX 50 PR 19/07/2019 3,300.00 EUR 1,056,000 EUR 1,056,000
Short (241) CALL PRYSMIAN SPA 20/12/2019 20.00 EUR (482,000) EUR (482,000)
Short (89) CALL PRYSMIAN SPA 20/12/2019 20.00 EUR (178,000) EUR (178,000)
Long 684 CALL PRYSMIAN SPA 20/09/2019 18.00 EUR 1,231,200 EUR 1,231,200
EUR 264,200
Pramerica Sicav - Multiasset Europe 50
Type Quantity Denomination Date Strike Currency Commitments in
Currency
Base
Currency
Commitment
(in EUR)
Short (400) CALL EURO STOXX 50 PR 20/12/2019 3,550.00 EUR (14,200,000) EUR (14,200,000)
Short (400) CALL EURO STOXX 50 PR 20/12/2019 3,550.00 EUR (14,200,000) EUR (14,200,000)
Short (156) CALL EURO STOXX 50 PR 20/12/2019 3,550.00 EUR (5,538,000) EUR (5,538,000)
Short (144) CALL EURO STOXX 50 PR 20/12/2019 3,550.00 EUR (5,112,000) EUR (5,112,000)
EUR (39,050,000)
Pramerica Sicav - Italian Equity
Type Quantity Denomination Date Strike Currency Commitments in
Currency
Base
Currency
Commitment
(in EUR)
Long 225 CALL FTSE MIB INDEX 19/07/2019 22,000.00 EUR 12,375,000 EUR 12,375,000
Short (248) CALL FTSE MIB INDEX 20/12/2019 23,500.00 EUR (14,570,000) EUR (14,570,000)
Short (2,436) CALL PRYSMIAN SPA 20/12/2019 20.00 EUR (4,872,000) EUR (4,872,000)
Short (1,272) CALL PRYSMIAN SPA 20/12/2019 20.00 EUR (2,544,000) EUR (2,544,000)
Long 6,894 CALL PRYSMIAN SPA 20/09/2019 18.00 EUR 12,409,200 EUR 12,409,200
EUR 2,798,200
Pramerica Sicav - European Equity
Type Quantity Denomination Date Strike Currency Commitments in
Currency
Base
Currency
Commitment
(in EUR)
Long 176 CALL EURO STOXX 50 PR 19/07/2019 3,500.00 EUR 6,160,000 EUR 6,160,000
Short (207) CALL EURO STOXX 50 PR 20/12/2019 3,700.00 EUR (7,659,000) EUR (7,659,000)
Short (966) CALL PRYSMIAN SPA 20/12/2019 20.00 EUR (1,932,000) EUR (1,932,000)
Short (154) CALL PRYSMIAN SPA 20/12/2019 20.00 EUR (308,000) EUR (308,000)
Long 2,733 CALL PRYSMIAN SPA 20/09/2019 18.00 EUR 4,919,400 EUR 4,919,400
EUR 1,180,400
Pramerica Sicav
351
Notes to the Financial Statementsas at June 30, 2019 (continued)
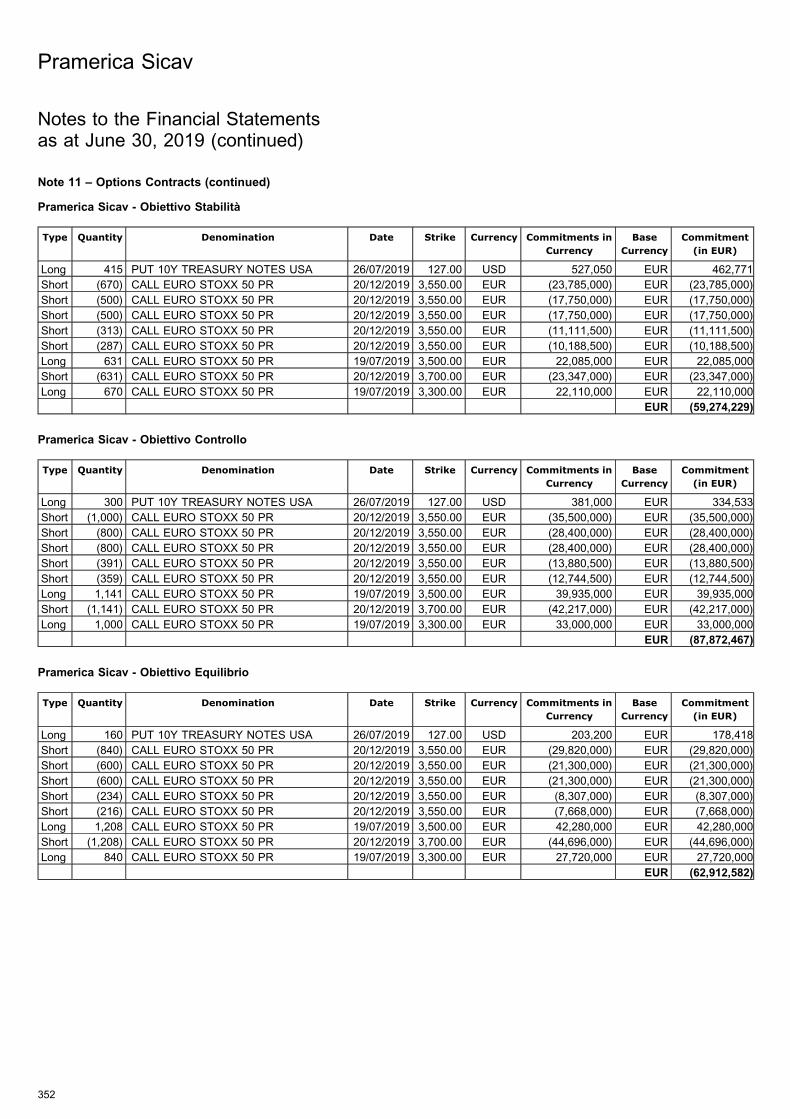
Note 11 – Options Contracts (continued)
Pramerica Sicav - Obiettivo Stabilita
Type Quantity Denomination Date Strike Currency Commitments in
Currency
Base
Currency
Commitment
(in EUR)
Long 415 PUT 10Y TREASURY NOTES USA 26/07/2019 127.00 USD 527,050 EUR 462,771
Short (670) CALL EURO STOXX 50 PR 20/12/2019 3,550.00 EUR (23,785,000) EUR (23,785,000)
Short (500) CALL EURO STOXX 50 PR 20/12/2019 3,550.00 EUR (17,750,000) EUR (17,750,000)
Short (500) CALL EURO STOXX 50 PR 20/12/2019 3,550.00 EUR (17,750,000) EUR (17,750,000)
Short (313) CALL EURO STOXX 50 PR 20/12/2019 3,550.00 EUR (11,111,500) EUR (11,111,500)
Short (287) CALL EURO STOXX 50 PR 20/12/2019 3,550.00 EUR (10,188,500) EUR (10,188,500)
Long 631 CALL EURO STOXX 50 PR 19/07/2019 3,500.00 EUR 22,085,000 EUR 22,085,000
Short (631) CALL EURO STOXX 50 PR 20/12/2019 3,700.00 EUR (23,347,000) EUR (23,347,000)
Long 670 CALL EURO STOXX 50 PR 19/07/2019 3,300.00 EUR 22,110,000 EUR 22,110,000
EUR (59,274,229)
Pramerica Sicav - Obiettivo Controllo
Type Quantity Denomination Date Strike Currency Commitments in
Currency
Base
Currency
Commitment
(in EUR)
Long 300 PUT 10Y TREASURY NOTES USA 26/07/2019 127.00 USD 381,000 EUR 334,533
Short (1,000) CALL EURO STOXX 50 PR 20/12/2019 3,550.00 EUR (35,500,000) EUR (35,500,000)
Short (800) CALL EURO STOXX 50 PR 20/12/2019 3,550.00 EUR (28,400,000) EUR (28,400,000)
Short (800) CALL EURO STOXX 50 PR 20/12/2019 3,550.00 EUR (28,400,000) EUR (28,400,000)
Short (391) CALL EURO STOXX 50 PR 20/12/2019 3,550.00 EUR (13,880,500) EUR (13,880,500)
Short (359) CALL EURO STOXX 50 PR 20/12/2019 3,550.00 EUR (12,744,500) EUR (12,744,500)
Long 1,141 CALL EURO STOXX 50 PR 19/07/2019 3,500.00 EUR 39,935,000 EUR 39,935,000
Short (1,141) CALL EURO STOXX 50 PR 20/12/2019 3,700.00 EUR (42,217,000) EUR (42,217,000)
Long 1,000 CALL EURO STOXX 50 PR 19/07/2019 3,300.00 EUR 33,000,000 EUR 33,000,000
EUR (87,872,467)
Pramerica Sicav - Obiettivo Equilibrio
Type Quantity Denomination Date Strike Currency Commitments in
Currency
Base
Currency
Commitment
(in EUR)
Long 160 PUT 10Y TREASURY NOTES USA 26/07/2019 127.00 USD 203,200 EUR 178,418
Short (840) CALL EURO STOXX 50 PR 20/12/2019 3,550.00 EUR (29,820,000) EUR (29,820,000)
Short (600) CALL EURO STOXX 50 PR 20/12/2019 3,550.00 EUR (21,300,000) EUR (21,300,000)
Short (600) CALL EURO STOXX 50 PR 20/12/2019 3,550.00 EUR (21,300,000) EUR (21,300,000)
Short (234) CALL EURO STOXX 50 PR 20/12/2019 3,550.00 EUR (8,307,000) EUR (8,307,000)
Short (216) CALL EURO STOXX 50 PR 20/12/2019 3,550.00 EUR (7,668,000) EUR (7,668,000)
Long 1,208 CALL EURO STOXX 50 PR 19/07/2019 3,500.00 EUR 42,280,000 EUR 42,280,000
Short (1,208) CALL EURO STOXX 50 PR 20/12/2019 3,700.00 EUR (44,696,000) EUR (44,696,000)
Long 840 CALL EURO STOXX 50 PR 19/07/2019 3,300.00 EUR 27,720,000 EUR 27,720,000
EUR (62,912,582)
Pramerica Sicav
352
Notes to the Financial Statementsas at June 30, 2019 (continued)
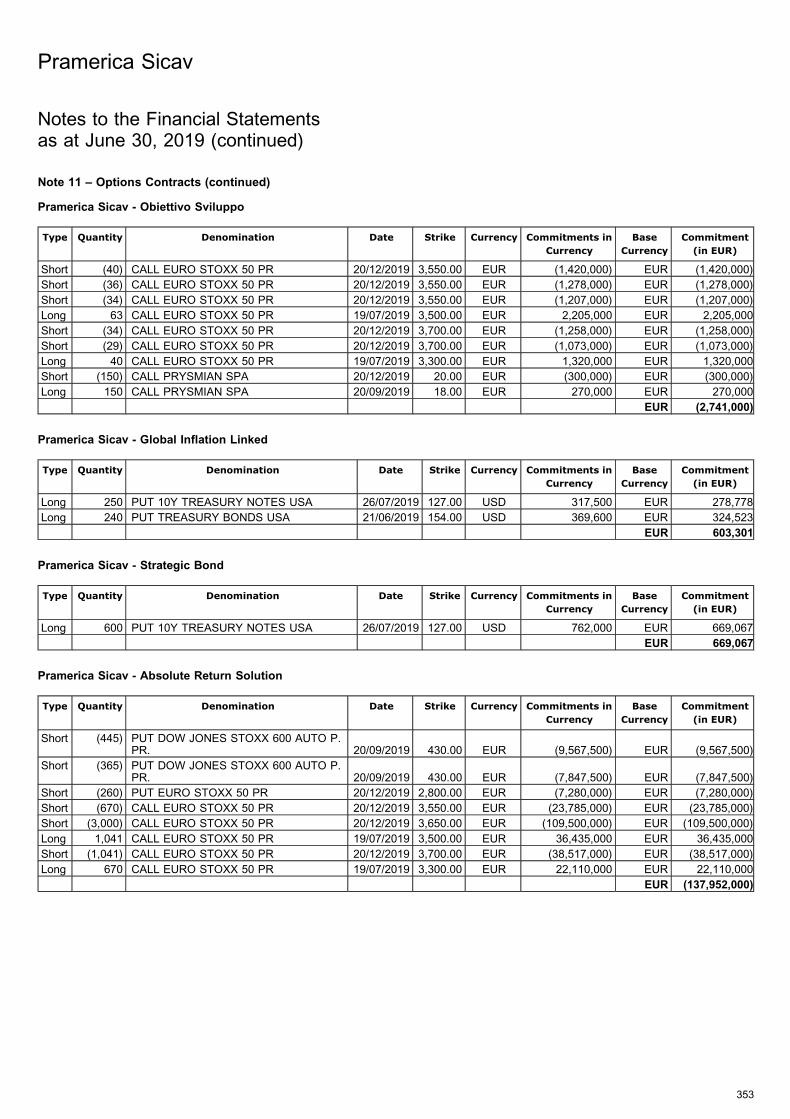
Note 11 – Options Contracts (continued)
Pramerica Sicav - Obiettivo Sviluppo
Type Quantity Denomination Date Strike Currency Commitments in
Currency
Base
Currency
Commitment
(in EUR)
Short (40) CALL EURO STOXX 50 PR 20/12/2019 3,550.00 EUR (1,420,000) EUR (1,420,000)
Short (36) CALL EURO STOXX 50 PR 20/12/2019 3,550.00 EUR (1,278,000) EUR (1,278,000)
Short (34) CALL EURO STOXX 50 PR 20/12/2019 3,550.00 EUR (1,207,000) EUR (1,207,000)
Long 63 CALL EURO STOXX 50 PR 19/07/2019 3,500.00 EUR 2,205,000 EUR 2,205,000
Short (34) CALL EURO STOXX 50 PR 20/12/2019 3,700.00 EUR (1,258,000) EUR (1,258,000)
Short (29) CALL EURO STOXX 50 PR 20/12/2019 3,700.00 EUR (1,073,000) EUR (1,073,000)
Long 40 CALL EURO STOXX 50 PR 19/07/2019 3,300.00 EUR 1,320,000 EUR 1,320,000
Short (150) CALL PRYSMIAN SPA 20/12/2019 20.00 EUR (300,000) EUR (300,000)
Long 150 CALL PRYSMIAN SPA 20/09/2019 18.00 EUR 270,000 EUR 270,000
EUR (2,741,000)
Pramerica Sicav - Global Inflation Linked
Type Quantity Denomination Date Strike Currency Commitments in
Currency
Base
Currency
Commitment
(in EUR)
Long 250 PUT 10Y TREASURY NOTES USA 26/07/2019 127.00 USD 317,500 EUR 278,778
Long 240 PUT TREASURY BONDS USA 21/06/2019 154.00 USD 369,600 EUR 324,523
EUR 603,301
Pramerica Sicav - Strategic Bond
Type Quantity Denomination Date Strike Currency Commitments in
Currency
Base
Currency
Commitment
(in EUR)
Long 600 PUT 10Y TREASURY NOTES USA 26/07/2019 127.00 USD 762,000 EUR 669,067
EUR 669,067
Pramerica Sicav - Absolute Return Solution
Type Quantity Denomination Date Strike Currency Commitments in
Currency
Base
Currency
Commitment
(in EUR)
Short (445) PUT DOW JONES STOXX 600 AUTO P.PR. 20/09/2019 430.00 EUR (9,567,500) EUR (9,567,500)
Short (365) PUT DOW JONES STOXX 600 AUTO P.PR. 20/09/2019 430.00 EUR (7,847,500) EUR (7,847,500)
Short (260) PUT EURO STOXX 50 PR 20/12/2019 2,800.00 EUR (7,280,000) EUR (7,280,000)
Short (670) CALL EURO STOXX 50 PR 20/12/2019 3,550.00 EUR (23,785,000) EUR (23,785,000)
Short (3,000) CALL EURO STOXX 50 PR 20/12/2019 3,650.00 EUR (109,500,000) EUR (109,500,000)
Long 1,041 CALL EURO STOXX 50 PR 19/07/2019 3,500.00 EUR 36,435,000 EUR 36,435,000
Short (1,041) CALL EURO STOXX 50 PR 20/12/2019 3,700.00 EUR (38,517,000) EUR (38,517,000)
Long 670 CALL EURO STOXX 50 PR 19/07/2019 3,300.00 EUR 22,110,000 EUR 22,110,000
EUR (137,952,000)
Pramerica Sicav
353
Notes to the Financial Statementsas at June 30, 2019 (continued)
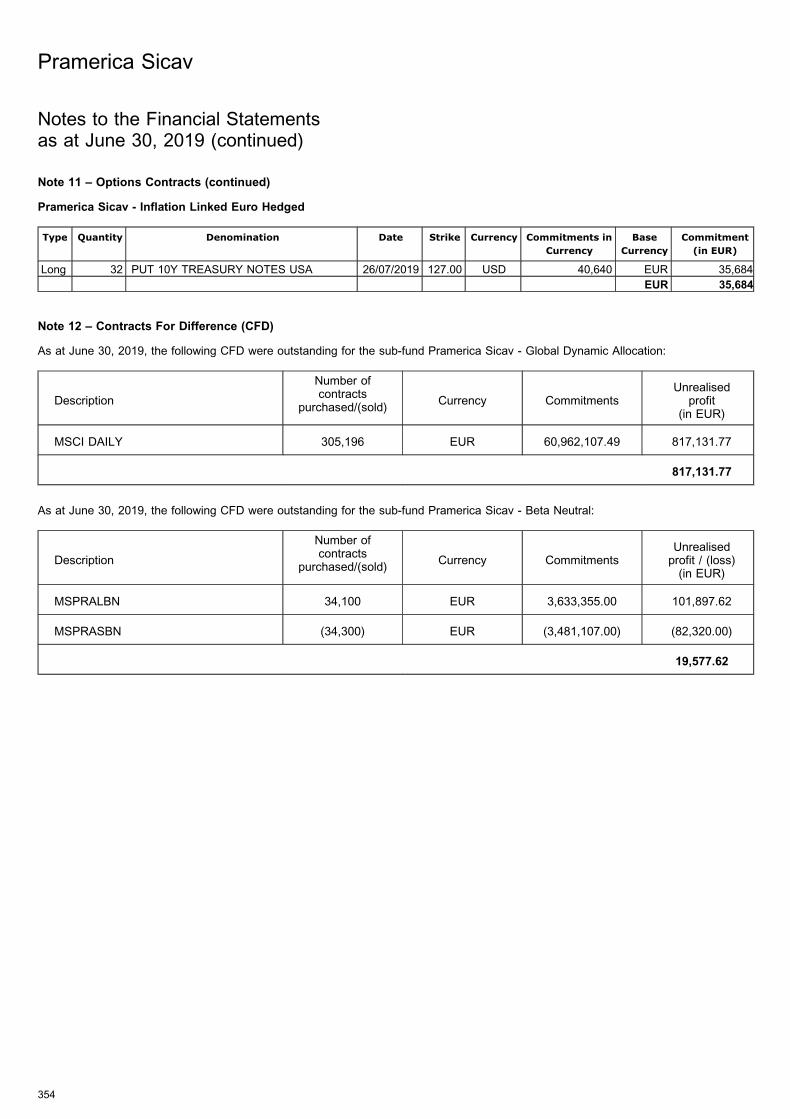
Note 11 – Options Contracts (continued)
Pramerica Sicav - Inflation Linked Euro Hedged
Type Quantity Denomination Date Strike Currency Commitments in
Currency
Base
Currency
Commitment
(in EUR)
Long 32 PUT 10Y TREASURY NOTES USA 26/07/2019 127.00 USD 40,640 EUR 35,684
EUR 35,684
Note 12 – Contracts For Difference (CFD)
As at June 30, 2019, the following CFD were outstanding for the sub-fund Pramerica Sicav - Global Dynamic Allocation:
Description
Number ofcontracts
purchased/(sold)Currency Commitments
Unrealisedprofit
(in EUR)
MSCI DAILY 305,196 EUR 60,962,107.49 817,131.77
817,131.77
As at June 30, 2019, the following CFD were outstanding for the sub-fund Pramerica Sicav - Beta Neutral:
Description
Number ofcontracts
purchased/(sold)Currency Commitments
Unrealisedprofit / (loss)(in EUR)
MSPRALBN 34,100 EUR 3,633,355.00 101,897.62
MSPRASBN (34,300) EUR (3,481,107.00) (82,320.00)
19,577.62
Pramerica Sicav
354
Notes to the Financial Statementsas at June 30, 2019 (continued)
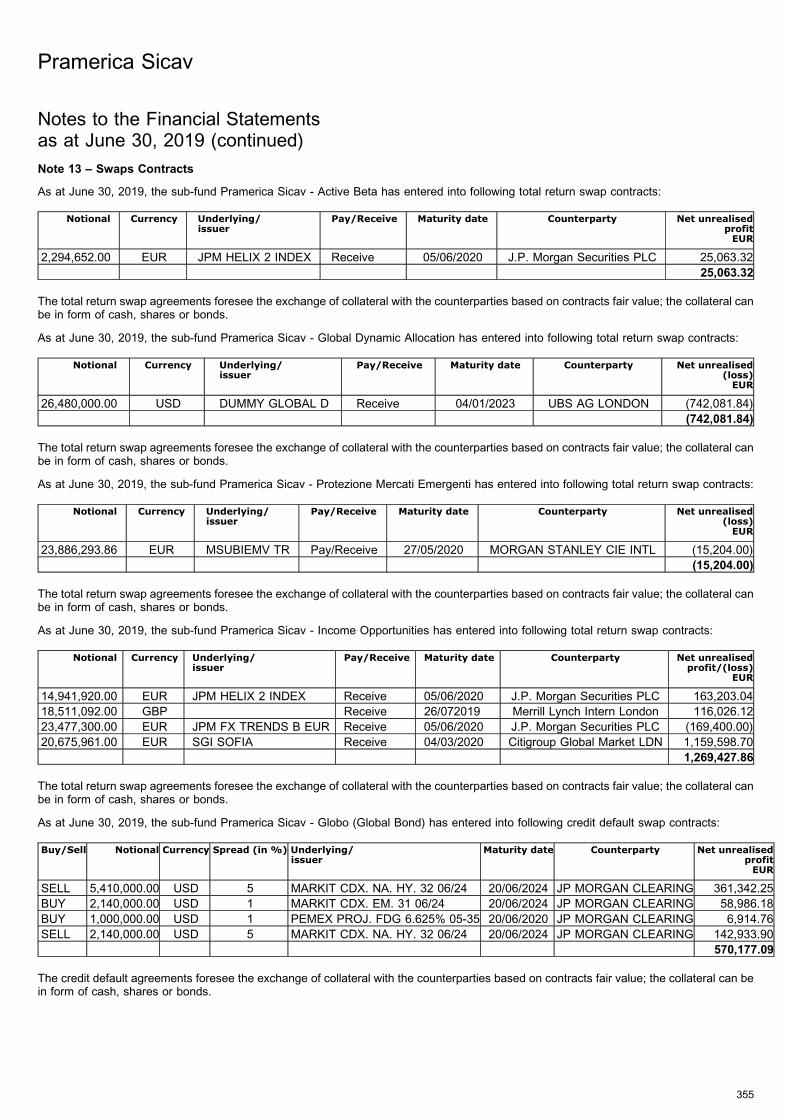
Note 13 – Swaps Contracts
As at June 30, 2019, the sub-fund Pramerica Sicav - Active Beta has entered into following total return swap contracts:
Notional Currency Underlying/issuer
Pay/Receive Maturity date Counterparty Net unrealisedprofitEUR
2,294,652.00 EUR JPM HELIX 2 INDEX Receive 05/06/2020 J.P. Morgan Securities PLC 25,063.32
25,063.32
The total return swap agreements foresee the exchange of collateral with the counterparties based on contracts fair value; the collateral canbe in form of cash, shares or bonds.
As at June 30, 2019, the sub-fund Pramerica Sicav - Global Dynamic Allocation has entered into following total return swap contracts:
Notional Currency Underlying/issuer
Pay/Receive Maturity date Counterparty Net unrealised(loss)EUR
26,480,000.00 USD DUMMY GLOBAL D Receive 04/01/2023 UBS AG LONDON (742,081.84)
(742,081.84)
The total return swap agreements foresee the exchange of collateral with the counterparties based on contracts fair value; the collateral canbe in form of cash, shares or bonds.
As at June 30, 2019, the sub-fund Pramerica Sicav - Protezione Mercati Emergenti has entered into following total return swap contracts:
Notional Currency Underlying/issuer
Pay/Receive Maturity date Counterparty Net unrealised(loss)EUR
23,886,293.86 EUR MSUBIEMV TR Pay/Receive 27/05/2020 MORGAN STANLEY CIE INTL (15,204.00)
(15,204.00)
The total return swap agreements foresee the exchange of collateral with the counterparties based on contracts fair value; the collateral canbe in form of cash, shares or bonds.
As at June 30, 2019, the sub-fund Pramerica Sicav - Income Opportunities has entered into following total return swap contracts:
Notional Currency Underlying/issuer
Pay/Receive Maturity date Counterparty Net unrealisedprofit/(loss)
EUR
14,941,920.00 EUR JPM HELIX 2 INDEX Receive 05/06/2020 J.P. Morgan Securities PLC 163,203.04
18,511,092.00 GBP Receive 26/072019 Merrill Lynch Intern London 116,026.12
23,477,300.00 EUR JPM FX TRENDS B EUR Receive 05/06/2020 J.P. Morgan Securities PLC (169,400.00)
20,675,961.00 EUR SGI SOFIA Receive 04/03/2020 Citigroup Global Market LDN 1,159,598.70
1,269,427.86
The total return swap agreements foresee the exchange of collateral with the counterparties based on contracts fair value; the collateral canbe in form of cash, shares or bonds.
As at June 30, 2019, the sub-fund Pramerica Sicav - Globo (Global Bond) has entered into following credit default swap contracts:
Buy/Sell Notional Currency Spread (in %) Underlying/issuer
Maturity date Counterparty Net unrealisedprofitEUR
SELL 5,410,000.00 USD 5 MARKIT CDX. NA. HY. 32 06/24 20/06/2024 JP MORGAN CLEARING 361,342.25
BUY 2,140,000.00 USD 1 MARKIT CDX. EM. 31 06/24 20/06/2024 JP MORGAN CLEARING 58,986.18
BUY 1,000,000.00 USD 1 PEMEX PROJ. FDG 6.625% 05-35 20/06/2020 JP MORGAN CLEARING 6,914.76
SELL 2,140,000.00 USD 5 MARKIT CDX. NA. HY. 32 06/24 20/06/2024 JP MORGAN CLEARING 142,933.90
570,177.09
The credit default agreements foresee the exchange of collateral with the counterparties based on contracts fair value; the collateral can bein form of cash, shares or bonds.
Pramerica Sicav
355
Notes to the Financial Statementsas at June 30, 2019 (continued)
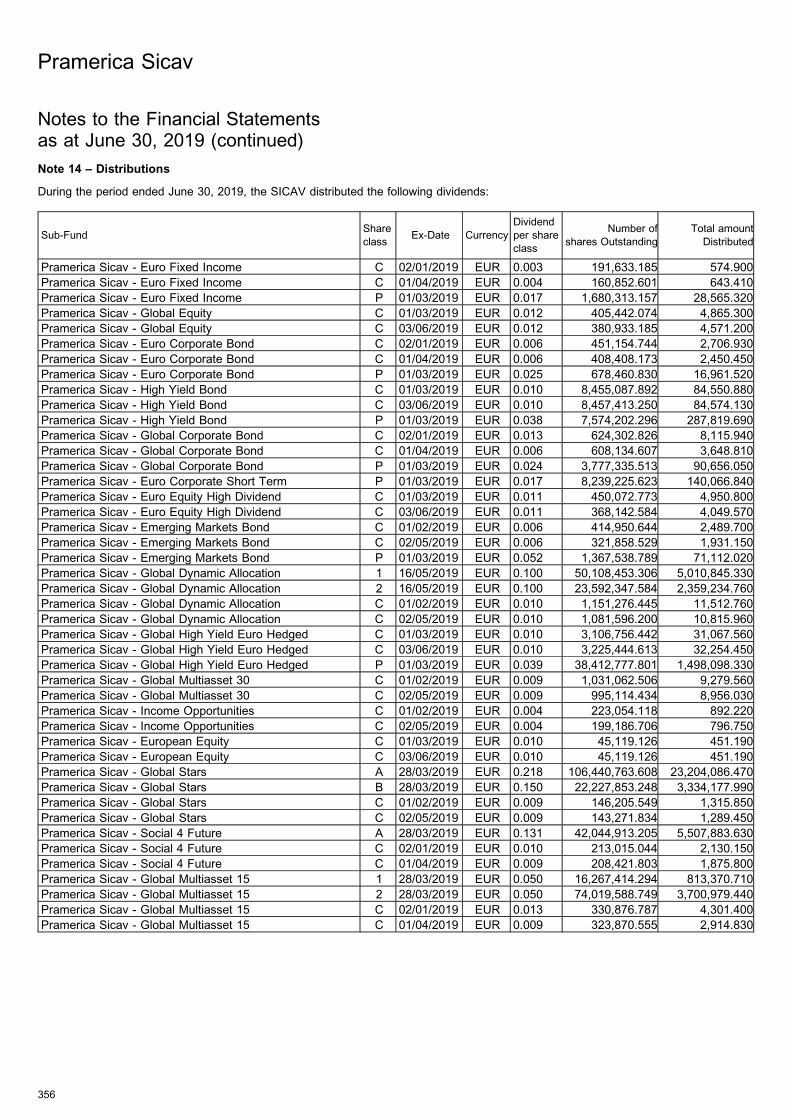
Note 14 – Distributions
During the period ended June 30, 2019, the SICAV distributed the following dividends:
Sub-FundShare
classEx-Date Currency
Dividend
per share
class
Number of
shares Outstanding
Total amount
Distributed
Pramerica Sicav - Euro Fixed Income C 02/01/2019 EUR 0.003 191,633.185 574.900
Pramerica Sicav - Euro Fixed Income C 01/04/2019 EUR 0.004 160,852.601 643.410
Pramerica Sicav - Euro Fixed Income P 01/03/2019 EUR 0.017 1,680,313.157 28,565.320
Pramerica Sicav - Global Equity C 01/03/2019 EUR 0.012 405,442.074 4,865.300
Pramerica Sicav - Global Equity C 03/06/2019 EUR 0.012 380,933.185 4,571.200
Pramerica Sicav - Euro Corporate Bond C 02/01/2019 EUR 0.006 451,154.744 2,706.930
Pramerica Sicav - Euro Corporate Bond C 01/04/2019 EUR 0.006 408,408.173 2,450.450
Pramerica Sicav - Euro Corporate Bond P 01/03/2019 EUR 0.025 678,460.830 16,961.520
Pramerica Sicav - High Yield Bond C 01/03/2019 EUR 0.010 8,455,087.892 84,550.880
Pramerica Sicav - High Yield Bond C 03/06/2019 EUR 0.010 8,457,413.250 84,574.130
Pramerica Sicav - High Yield Bond P 01/03/2019 EUR 0.038 7,574,202.296 287,819.690
Pramerica Sicav - Global Corporate Bond C 02/01/2019 EUR 0.013 624,302.826 8,115.940
Pramerica Sicav - Global Corporate Bond C 01/04/2019 EUR 0.006 608,134.607 3,648.810
Pramerica Sicav - Global Corporate Bond P 01/03/2019 EUR 0.024 3,777,335.513 90,656.050
Pramerica Sicav - Euro Corporate Short Term P 01/03/2019 EUR 0.017 8,239,225.623 140,066.840
Pramerica Sicav - Euro Equity High Dividend C 01/03/2019 EUR 0.011 450,072.773 4,950.800
Pramerica Sicav - Euro Equity High Dividend C 03/06/2019 EUR 0.011 368,142.584 4,049.570
Pramerica Sicav - Emerging Markets Bond C 01/02/2019 EUR 0.006 414,950.644 2,489.700
Pramerica Sicav - Emerging Markets Bond C 02/05/2019 EUR 0.006 321,858.529 1,931.150
Pramerica Sicav - Emerging Markets Bond P 01/03/2019 EUR 0.052 1,367,538.789 71,112.020
Pramerica Sicav - Global Dynamic Allocation 1 16/05/2019 EUR 0.100 50,108,453.306 5,010,845.330
Pramerica Sicav - Global Dynamic Allocation 2 16/05/2019 EUR 0.100 23,592,347.584 2,359,234.760
Pramerica Sicav - Global Dynamic Allocation C 01/02/2019 EUR 0.010 1,151,276.445 11,512.760
Pramerica Sicav - Global Dynamic Allocation C 02/05/2019 EUR 0.010 1,081,596.200 10,815.960
Pramerica Sicav - Global High Yield Euro Hedged C 01/03/2019 EUR 0.010 3,106,756.442 31,067.560
Pramerica Sicav - Global High Yield Euro Hedged C 03/06/2019 EUR 0.010 3,225,444.613 32,254.450
Pramerica Sicav - Global High Yield Euro Hedged P 01/03/2019 EUR 0.039 38,412,777.801 1,498,098.330
Pramerica Sicav - Global Multiasset 30 C 01/02/2019 EUR 0.009 1,031,062.506 9,279.560
Pramerica Sicav - Global Multiasset 30 C 02/05/2019 EUR 0.009 995,114.434 8,956.030
Pramerica Sicav - Income Opportunities C 01/02/2019 EUR 0.004 223,054.118 892.220
Pramerica Sicav - Income Opportunities C 02/05/2019 EUR 0.004 199,186.706 796.750
Pramerica Sicav - European Equity C 01/03/2019 EUR 0.010 45,119.126 451.190
Pramerica Sicav - European Equity C 03/06/2019 EUR 0.010 45,119.126 451.190
Pramerica Sicav - Global Stars A 28/03/2019 EUR 0.218 106,440,763.608 23,204,086.470
Pramerica Sicav - Global Stars B 28/03/2019 EUR 0.150 22,227,853.248 3,334,177.990
Pramerica Sicav - Global Stars C 01/02/2019 EUR 0.009 146,205.549 1,315.850
Pramerica Sicav - Global Stars C 02/05/2019 EUR 0.009 143,271.834 1,289.450
Pramerica Sicav - Social 4 Future A 28/03/2019 EUR 0.131 42,044,913.205 5,507,883.630
Pramerica Sicav - Social 4 Future C 02/01/2019 EUR 0.010 213,015.044 2,130.150
Pramerica Sicav - Social 4 Future C 01/04/2019 EUR 0.009 208,421.803 1,875.800
Pramerica Sicav - Global Multiasset 15 1 28/03/2019 EUR 0.050 16,267,414.294 813,370.710
Pramerica Sicav - Global Multiasset 15 2 28/03/2019 EUR 0.050 74,019,588.749 3,700,979.440
Pramerica Sicav - Global Multiasset 15 C 02/01/2019 EUR 0.013 330,876.787 4,301.400
Pramerica Sicav - Global Multiasset 15 C 01/04/2019 EUR 0.009 323,870.555 2,914.830
Pramerica Sicav
356
Notes to the Financial Statementsas at June 30, 2019 (continued)
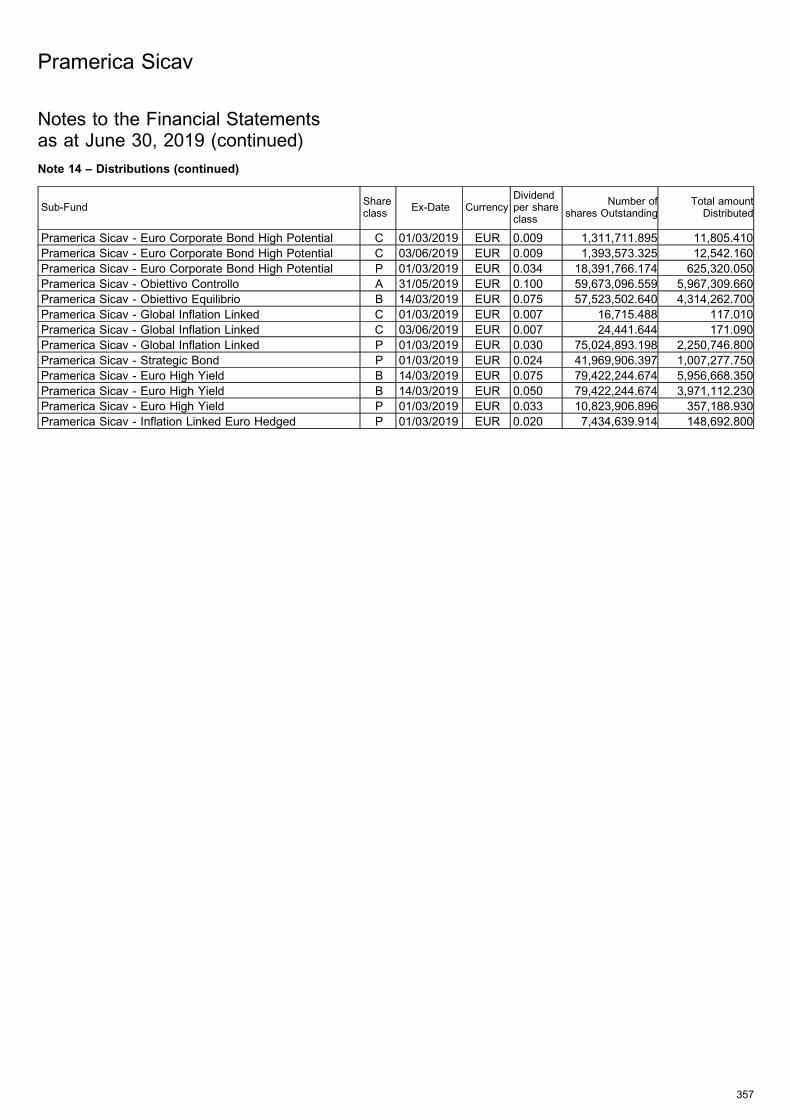
Note 14 – Distributions (continued)
Sub-FundShareclass
Ex-Date CurrencyDividendper shareclass
Number ofshares Outstanding
Total amountDistributed
Pramerica Sicav - Euro Corporate Bond High Potential C 01/03/2019 EUR 0.009 1,311,711.895 11,805.410
Pramerica Sicav - Euro Corporate Bond High Potential C 03/06/2019 EUR 0.009 1,393,573.325 12,542.160
Pramerica Sicav - Euro Corporate Bond High Potential P 01/03/2019 EUR 0.034 18,391,766.174 625,320.050
Pramerica Sicav - Obiettivo Controllo A 31/05/2019 EUR 0.100 59,673,096.559 5,967,309.660
Pramerica Sicav - Obiettivo Equilibrio B 14/03/2019 EUR 0.075 57,523,502.640 4,314,262.700
Pramerica Sicav - Global Inflation Linked C 01/03/2019 EUR 0.007 16,715.488 117.010
Pramerica Sicav - Global Inflation Linked C 03/06/2019 EUR 0.007 24,441.644 171.090
Pramerica Sicav - Global Inflation Linked P 01/03/2019 EUR 0.030 75,024,893.198 2,250,746.800
Pramerica Sicav - Strategic Bond P 01/03/2019 EUR 0.024 41,969,906.397 1,007,277.750
Pramerica Sicav - Euro High Yield B 14/03/2019 EUR 0.075 79,422,244.674 5,956,668.350
Pramerica Sicav - Euro High Yield B 14/03/2019 EUR 0.050 79,422,244.674 3,971,112.230
Pramerica Sicav - Euro High Yield P 01/03/2019 EUR 0.033 10,823,906.896 357,188.930
Pramerica Sicav - Inflation Linked Euro Hedged P 01/03/2019 EUR 0.020 7,434,639.914 148,692.800
Pramerica Sicav
357
Notes to the Financial Statementsas at June 30, 2019 (continued)
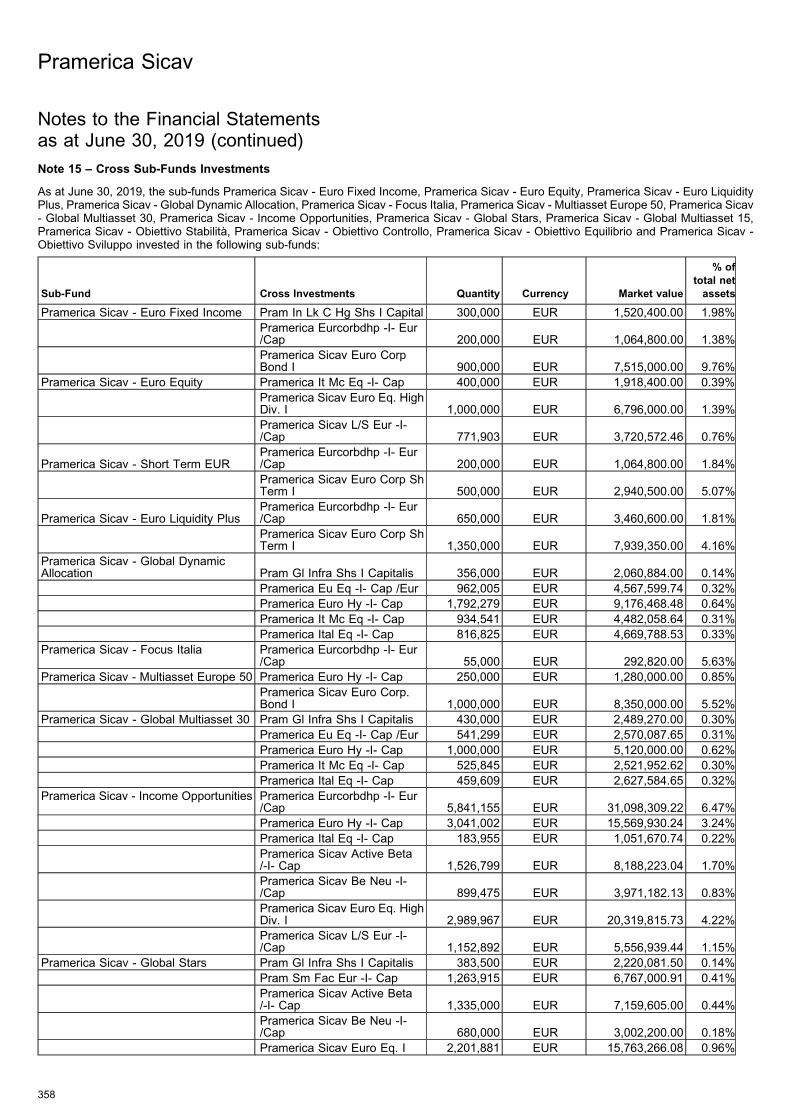
Note 15 – Cross Sub-Funds Investments
As at June 30, 2019, the sub-funds Pramerica Sicav - Euro Fixed Income, Pramerica Sicav - Euro Equity, Pramerica Sicav - Euro LiquidityPlus, Pramerica Sicav - Global Dynamic Allocation, Pramerica Sicav - Focus Italia, Pramerica Sicav - Multiasset Europe 50, Pramerica Sicav- Global Multiasset 30, Pramerica Sicav - Income Opportunities, Pramerica Sicav - Global Stars, Pramerica Sicav - Global Multiasset 15,Pramerica Sicav - Obiettivo Stabilita, Pramerica Sicav - Obiettivo Controllo, Pramerica Sicav - Obiettivo Equilibrio and Pramerica Sicav -Obiettivo Sviluppo invested in the following sub-funds:
Sub-Fund Cross Investments Quantity Currency Market value
% of
total net
assets
Pramerica Sicav - Euro Fixed Income Pram In Lk C Hg Shs I Capital 300,000 EUR 1,520,400.00 1.98%
Pramerica Eurcorbdhp -I- Eur/Cap 200,000 EUR 1,064,800.00 1.38%
Pramerica Sicav Euro CorpBond I 900,000 EUR 7,515,000.00 9.76%
Pramerica Sicav - Euro Equity Pramerica It Mc Eq -I- Cap 400,000 EUR 1,918,400.00 0.39%
Pramerica Sicav Euro Eq. HighDiv. I 1,000,000 EUR 6,796,000.00 1.39%
Pramerica Sicav L/S Eur -I-/Cap 771,903 EUR 3,720,572.46 0.76%
Pramerica Sicav - Short Term EURPramerica Eurcorbdhp -I- Eur/Cap 200,000 EUR 1,064,800.00 1.84%
Pramerica Sicav Euro Corp ShTerm I 500,000 EUR 2,940,500.00 5.07%
Pramerica Sicav - Euro Liquidity PlusPramerica Eurcorbdhp -I- Eur/Cap 650,000 EUR 3,460,600.00 1.81%
Pramerica Sicav Euro Corp ShTerm I 1,350,000 EUR 7,939,350.00 4.16%
Pramerica Sicav - Global DynamicAllocation Pram Gl Infra Shs I Capitalis 356,000 EUR 2,060,884.00 0.14%
Pramerica Eu Eq -I- Cap /Eur 962,005 EUR 4,567,599.74 0.32%
Pramerica Euro Hy -I- Cap 1,792,279 EUR 9,176,468.48 0.64%
Pramerica It Mc Eq -I- Cap 934,541 EUR 4,482,058.64 0.31%
Pramerica Ital Eq -I- Cap 816,825 EUR 4,669,788.53 0.33%
Pramerica Sicav - Focus Italia Pramerica Eurcorbdhp -I- Eur/Cap 55,000 EUR 292,820.00 5.63%
Pramerica Sicav - Multiasset Europe 50 Pramerica Euro Hy -I- Cap 250,000 EUR 1,280,000.00 0.85%
Pramerica Sicav Euro Corp.Bond I 1,000,000 EUR 8,350,000.00 5.52%
Pramerica Sicav - Global Multiasset 30 Pram Gl Infra Shs I Capitalis 430,000 EUR 2,489,270.00 0.30%
Pramerica Eu Eq -I- Cap /Eur 541,299 EUR 2,570,087.65 0.31%
Pramerica Euro Hy -I- Cap 1,000,000 EUR 5,120,000.00 0.62%
Pramerica It Mc Eq -I- Cap 525,845 EUR 2,521,952.62 0.30%
Pramerica Ital Eq -I- Cap 459,609 EUR 2,627,584.65 0.32%
Pramerica Sicav - Income Opportunities Pramerica Eurcorbdhp -I- Eur/Cap 5,841,155 EUR 31,098,309.22 6.47%
Pramerica Euro Hy -I- Cap 3,041,002 EUR 15,569,930.24 3.24%
Pramerica Ital Eq -I- Cap 183,955 EUR 1,051,670.74 0.22%
Pramerica Sicav Active Beta/-I- Cap 1,526,799 EUR 8,188,223.04 1.70%
Pramerica Sicav Be Neu -I-/Cap 899,475 EUR 3,971,182.13 0.83%
Pramerica Sicav Euro Eq. HighDiv. I 2,989,967 EUR 20,319,815.73 4.22%
Pramerica Sicav L/S Eur -I-/Cap 1,152,892 EUR 5,556,939.44 1.15%
Pramerica Sicav - Global Stars Pram Gl Infra Shs I Capitalis 383,500 EUR 2,220,081.50 0.14%
Pram Sm Fac Eur -I- Cap 1,263,915 EUR 6,767,000.91 0.41%
Pramerica Sicav Active Beta/-I- Cap 1,335,000 EUR 7,159,605.00 0.44%
Pramerica Sicav Be Neu -I-/Cap 680,000 EUR 3,002,200.00 0.18%
Pramerica Sicav Euro Eq. I 2,201,881 EUR 15,763,266.08 0.96%
Pramerica Sicav
358
Notes to the Financial Statementsas at June 30, 2019 (continued)
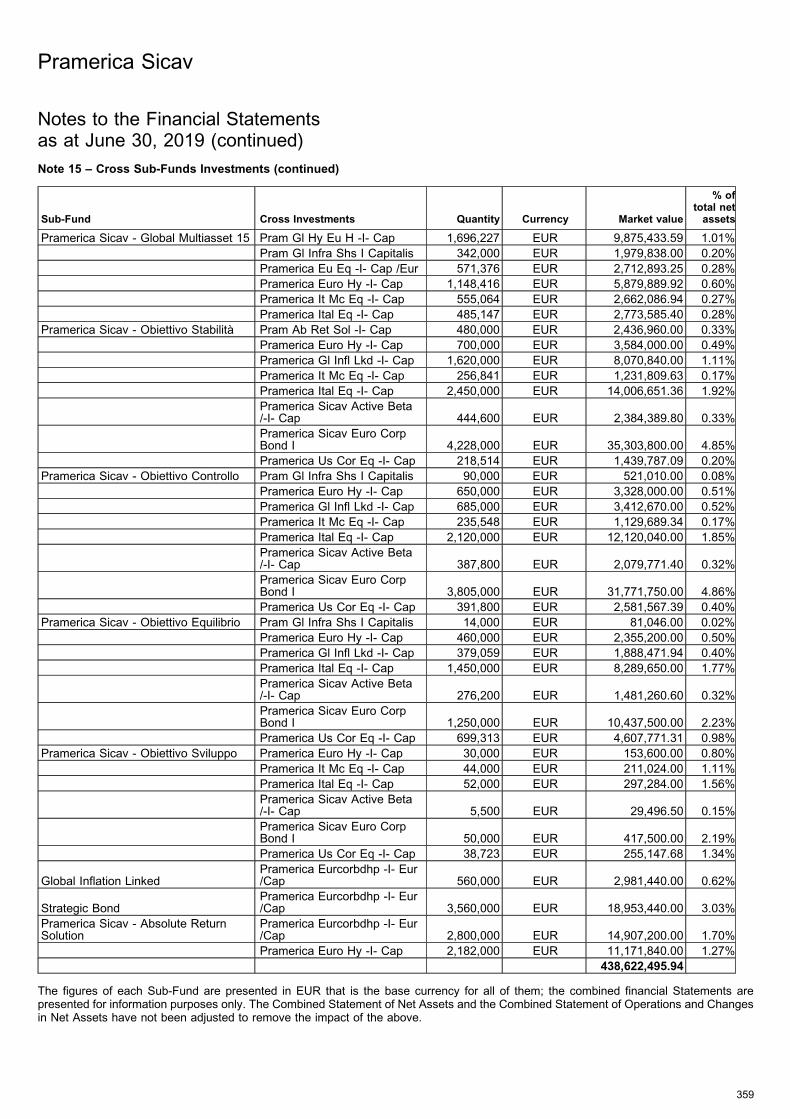
Note 15 – Cross Sub-Funds Investments (continued)
Sub-Fund Cross Investments Quantity Currency Market value
% oftotal netassets
Pramerica Sicav - Global Multiasset 15 Pram Gl Hy Eu H -I- Cap 1,696,227 EUR 9,875,433.59 1.01%
Pram Gl Infra Shs I Capitalis 342,000 EUR 1,979,838.00 0.20%
Pramerica Eu Eq -I- Cap /Eur 571,376 EUR 2,712,893.25 0.28%
Pramerica Euro Hy -I- Cap 1,148,416 EUR 5,879,889.92 0.60%
Pramerica It Mc Eq -I- Cap 555,064 EUR 2,662,086.94 0.27%
Pramerica Ital Eq -I- Cap 485,147 EUR 2,773,585.40 0.28%
Pramerica Sicav - Obiettivo Stabilita Pram Ab Ret Sol -I- Cap 480,000 EUR 2,436,960.00 0.33%
Pramerica Euro Hy -I- Cap 700,000 EUR 3,584,000.00 0.49%
Pramerica Gl Infl Lkd -I- Cap 1,620,000 EUR 8,070,840.00 1.11%
Pramerica It Mc Eq -I- Cap 256,841 EUR 1,231,809.63 0.17%
Pramerica Ital Eq -I- Cap 2,450,000 EUR 14,006,651.36 1.92%
Pramerica Sicav Active Beta/-I- Cap 444,600 EUR 2,384,389.80 0.33%
Pramerica Sicav Euro CorpBond I 4,228,000 EUR 35,303,800.00 4.85%
Pramerica Us Cor Eq -I- Cap 218,514 EUR 1,439,787.09 0.20%
Pramerica Sicav - Obiettivo Controllo Pram Gl Infra Shs I Capitalis 90,000 EUR 521,010.00 0.08%
Pramerica Euro Hy -I- Cap 650,000 EUR 3,328,000.00 0.51%
Pramerica Gl Infl Lkd -I- Cap 685,000 EUR 3,412,670.00 0.52%
Pramerica It Mc Eq -I- Cap 235,548 EUR 1,129,689.34 0.17%
Pramerica Ital Eq -I- Cap 2,120,000 EUR 12,120,040.00 1.85%
Pramerica Sicav Active Beta/-I- Cap 387,800 EUR 2,079,771.40 0.32%
Pramerica Sicav Euro CorpBond I 3,805,000 EUR 31,771,750.00 4.86%
Pramerica Us Cor Eq -I- Cap 391,800 EUR 2,581,567.39 0.40%
Pramerica Sicav - Obiettivo Equilibrio Pram Gl Infra Shs I Capitalis 14,000 EUR 81,046.00 0.02%
Pramerica Euro Hy -I- Cap 460,000 EUR 2,355,200.00 0.50%
Pramerica Gl Infl Lkd -I- Cap 379,059 EUR 1,888,471.94 0.40%
Pramerica Ital Eq -I- Cap 1,450,000 EUR 8,289,650.00 1.77%
Pramerica Sicav Active Beta/-I- Cap 276,200 EUR 1,481,260.60 0.32%
Pramerica Sicav Euro CorpBond I 1,250,000 EUR 10,437,500.00 2.23%
Pramerica Us Cor Eq -I- Cap 699,313 EUR 4,607,771.31 0.98%
Pramerica Sicav - Obiettivo Sviluppo Pramerica Euro Hy -I- Cap 30,000 EUR 153,600.00 0.80%
Pramerica It Mc Eq -I- Cap 44,000 EUR 211,024.00 1.11%
Pramerica Ital Eq -I- Cap 52,000 EUR 297,284.00 1.56%
Pramerica Sicav Active Beta/-I- Cap 5,500 EUR 29,496.50 0.15%
Pramerica Sicav Euro CorpBond I 50,000 EUR 417,500.00 2.19%
Pramerica Us Cor Eq -I- Cap 38,723 EUR 255,147.68 1.34%
Global Inflation LinkedPramerica Eurcorbdhp -I- Eur/Cap 560,000 EUR 2,981,440.00 0.62%
Strategic BondPramerica Eurcorbdhp -I- Eur/Cap 3,560,000 EUR 18,953,440.00 3.03%
Pramerica Sicav - Absolute ReturnSolution
Pramerica Eurcorbdhp -I- Eur/Cap 2,800,000 EUR 14,907,200.00 1.70%
Pramerica Euro Hy -I- Cap 2,182,000 EUR 11,171,840.00 1.27%
438,622,495.94
The figures of each Sub-Fund are presented in EUR that is the base currency for all of them; the combined financial Statements arepresented for information purposes only. The Combined Statement of Net Assets and the Combined Statement of Operations and Changesin Net Assets have not been adjusted to remove the impact of the above.
Pramerica Sicav
359
Notes to the Financial Statementsas at June 30, 2019 (continued)

360
Pramerica Sicav
Notes to the Financial Statementsas at June 30, 2019 (continued)Note 16 – Changes in Portfolio
Upon request to be addressed to the registered office of the SICAV a copy of the statement of changes in the portfolio for the period ended June 30, 2019 is available free of charge.
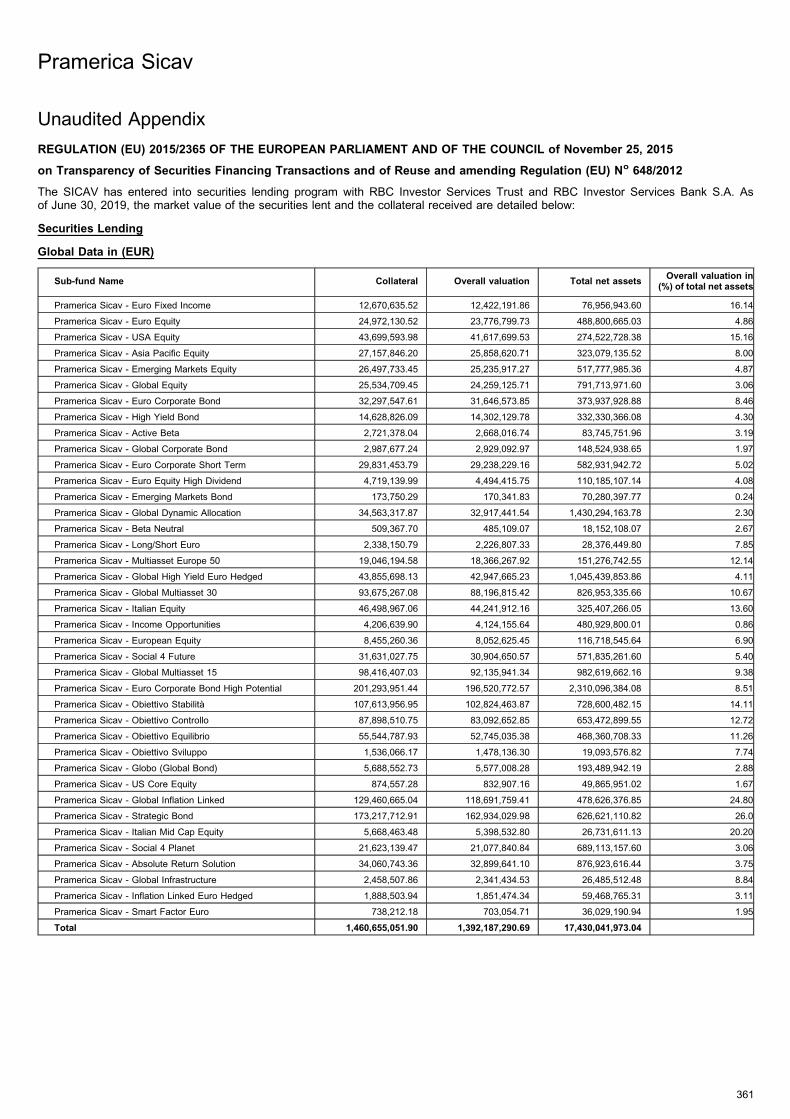
Unaudited Appendix
REGULATION (EU) 2015/2365 OF THE EUROPEAN PARLIAMENT AND OF THE COUNCIL of November 25, 2015
on Transparency of Securities Financing Transactions and of Reuse and amending Regulation (EU) No 648/2012
The SICAV has entered into securities lending program with RBC Investor Services Trust and RBC Investor Services Bank S.A. Asof June 30, 2019, the market value of the securities lent and the collateral received are detailed below:
Securities Lending
Global Data in (EUR)
Sub-fund Name Collateral Overall valuation Total net assetsOverall valuation in
(%) of total net assets
Pramerica Sicav - Euro Fixed Income 12,670,635.52 12,422,191.86 76,956,943.60 16.14
Pramerica Sicav - Euro Equity 24,972,130.52 23,776,799.73 488,800,665.03 4.86
Pramerica Sicav - USA Equity 43,699,593.98 41,617,699.53 274,522,728.38 15.16
Pramerica Sicav - Asia Pacific Equity 27,157,846.20 25,858,620.71 323,079,135.52 8.00
Pramerica Sicav - Emerging Markets Equity 26,497,733.45 25,235,917.27 517,777,985.36 4.87
Pramerica Sicav - Global Equity 25,534,709.45 24,259,125.71 791,713,971.60 3.06
Pramerica Sicav - Euro Corporate Bond 32,297,547.61 31,646,573.85 373,937,928.88 8.46
Pramerica Sicav - High Yield Bond 14,628,826.09 14,302,129.78 332,330,366.08 4.30
Pramerica Sicav - Active Beta 2,721,378.04 2,668,016.74 83,745,751.96 3.19
Pramerica Sicav - Global Corporate Bond 2,987,677.24 2,929,092.97 148,524,938.65 1.97
Pramerica Sicav - Euro Corporate Short Term 29,831,453.79 29,238,229.16 582,931,942.72 5.02
Pramerica Sicav - Euro Equity High Dividend 4,719,139.99 4,494,415.75 110,185,107.14 4.08
Pramerica Sicav - Emerging Markets Bond 173,750.29 170,341.83 70,280,397.77 0.24
Pramerica Sicav - Global Dynamic Allocation 34,563,317.87 32,917,441.54 1,430,294,163.78 2.30
Pramerica Sicav - Beta Neutral 509,367.70 485,109.07 18,152,108.07 2.67
Pramerica Sicav - Long/Short Euro 2,338,150.79 2,226,807.33 28,376,449.80 7.85
Pramerica Sicav - Multiasset Europe 50 19,046,194.58 18,366,267.92 151,276,742.55 12.14
Pramerica Sicav - Global High Yield Euro Hedged 43,855,698.13 42,947,665.23 1,045,439,853.86 4.11
Pramerica Sicav - Global Multiasset 30 93,675,267.08 88,196,815.42 826,953,335.66 10.67
Pramerica Sicav - Italian Equity 46,498,967.06 44,241,912.16 325,407,266.05 13.60
Pramerica Sicav - Income Opportunities 4,206,639.90 4,124,155.64 480,929,800.01 0.86
Pramerica Sicav - European Equity 8,455,260.36 8,052,625.45 116,718,545.64 6.90
Pramerica Sicav - Social 4 Future 31,631,027.75 30,904,650.57 571,835,261.60 5.40
Pramerica Sicav - Global Multiasset 15 98,416,407.03 92,135,941.34 982,619,662.16 9.38
Pramerica Sicav - Euro Corporate Bond High Potential 201,293,951.44 196,520,772.57 2,310,096,384.08 8.51
Pramerica Sicav - Obiettivo Stabilita 107,613,956.95 102,824,463.87 728,600,482.15 14.11
Pramerica Sicav - Obiettivo Controllo 87,898,510.75 83,092,652.85 653,472,899.55 12.72
Pramerica Sicav - Obiettivo Equilibrio 55,544,787.93 52,745,035.38 468,360,708.33 11.26
Pramerica Sicav - Obiettivo Sviluppo 1,536,066.17 1,478,136.30 19,093,576.82 7.74
Pramerica Sicav - Globo (Global Bond) 5,688,552.73 5,577,008.28 193,489,942.19 2.88
Pramerica Sicav - US Core Equity 874,557.28 832,907.16 49,865,951.02 1.67
Pramerica Sicav - Global Inflation Linked 129,460,665.04 118,691,759.41 478,626,376.85 24.80
Pramerica Sicav - Strategic Bond 173,217,712.91 162,934,029.98 626,621,110.82 26.0
Pramerica Sicav - Italian Mid Cap Equity 5,668,463.48 5,398,532.80 26,731,611.13 20.20
Pramerica Sicav - Social 4 Planet 21,623,139.47 21,077,840.84 689,113,157.60 3.06
Pramerica Sicav - Absolute Return Solution 34,060,743.36 32,899,641.10 876,923,616.44 3.75
Pramerica Sicav - Global Infrastructure 2,458,507.86 2,341,434.53 26,485,512.48 8.84
Pramerica Sicav - Inflation Linked Euro Hedged 1,888,503.94 1,851,474.34 59,468,765.31 3.11
Pramerica Sicav - Smart Factor Euro 738,212.18 703,054.71 36,029,190.94 1.95
Total 1,460,655,051.90 1,392,187,290.69 17,430,041,973.04
Pramerica Sicav
361
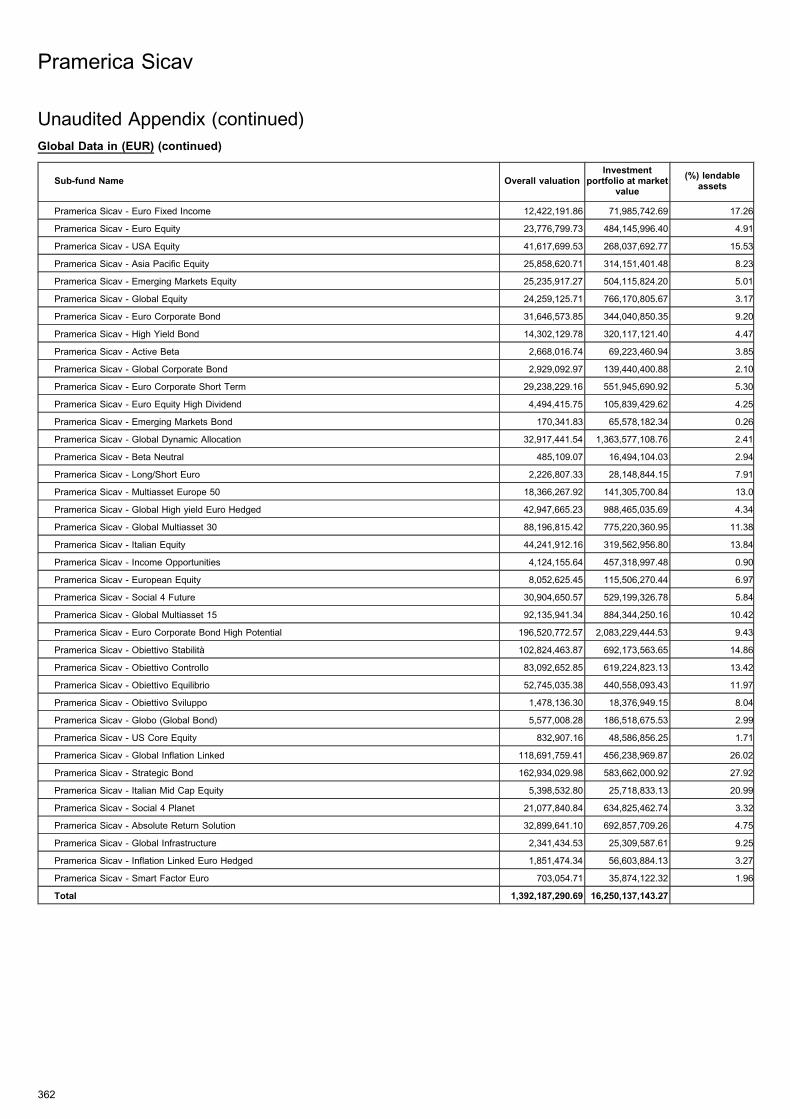
Global Data in (EUR) (continued)
Sub-fund Name Overall valuationInvestment
portfolio at marketvalue
(%) lendableassets
Pramerica Sicav - Euro Fixed Income 12,422,191.86 71,985,742.69 17.26
Pramerica Sicav - Euro Equity 23,776,799.73 484,145,996.40 4.91
Pramerica Sicav - USA Equity 41,617,699.53 268,037,692.77 15.53
Pramerica Sicav - Asia Pacific Equity 25,858,620.71 314,151,401.48 8.23
Pramerica Sicav - Emerging Markets Equity 25,235,917.27 504,115,824.20 5.01
Pramerica Sicav - Global Equity 24,259,125.71 766,170,805.67 3.17
Pramerica Sicav - Euro Corporate Bond 31,646,573.85 344,040,850.35 9.20
Pramerica Sicav - High Yield Bond 14,302,129.78 320,117,121.40 4.47
Pramerica Sicav - Active Beta 2,668,016.74 69,223,460.94 3.85
Pramerica Sicav - Global Corporate Bond 2,929,092.97 139,440,400.88 2.10
Pramerica Sicav - Euro Corporate Short Term 29,238,229.16 551,945,690.92 5.30
Pramerica Sicav - Euro Equity High Dividend 4,494,415.75 105,839,429.62 4.25
Pramerica Sicav - Emerging Markets Bond 170,341.83 65,578,182.34 0.26
Pramerica Sicav - Global Dynamic Allocation 32,917,441.54 1,363,577,108.76 2.41
Pramerica Sicav - Beta Neutral 485,109.07 16,494,104.03 2.94
Pramerica Sicav - Long/Short Euro 2,226,807.33 28,148,844.15 7.91
Pramerica Sicav - Multiasset Europe 50 18,366,267.92 141,305,700.84 13.0
Pramerica Sicav - Global High yield Euro Hedged 42,947,665.23 988,465,035.69 4.34
Pramerica Sicav - Global Multiasset 30 88,196,815.42 775,220,360.95 11.38
Pramerica Sicav - Italian Equity 44,241,912.16 319,562,956.80 13.84
Pramerica Sicav - Income Opportunities 4,124,155.64 457,318,997.48 0.90
Pramerica Sicav - European Equity 8,052,625.45 115,506,270.44 6.97
Pramerica Sicav - Social 4 Future 30,904,650.57 529,199,326.78 5.84
Pramerica Sicav - Global Multiasset 15 92,135,941.34 884,344,250.16 10.42
Pramerica Sicav - Euro Corporate Bond High Potential 196,520,772.57 2,083,229,444.53 9.43
Pramerica Sicav - Obiettivo Stabilita 102,824,463.87 692,173,563.65 14.86
Pramerica Sicav - Obiettivo Controllo 83,092,652.85 619,224,823.13 13.42
Pramerica Sicav - Obiettivo Equilibrio 52,745,035.38 440,558,093.43 11.97
Pramerica Sicav - Obiettivo Sviluppo 1,478,136.30 18,376,949.15 8.04
Pramerica Sicav - Globo (Global Bond) 5,577,008.28 186,518,675.53 2.99
Pramerica Sicav - US Core Equity 832,907.16 48,586,856.25 1.71
Pramerica Sicav - Global Inflation Linked 118,691,759.41 456,238,969.87 26.02
Pramerica Sicav - Strategic Bond 162,934,029.98 583,662,000.92 27.92
Pramerica Sicav - Italian Mid Cap Equity 5,398,532.80 25,718,833.13 20.99
Pramerica Sicav - Social 4 Planet 21,077,840.84 634,825,462.74 3.32
Pramerica Sicav - Absolute Return Solution 32,899,641.10 692,857,709.26 4.75
Pramerica Sicav - Global Infrastructure 2,341,434.53 25,309,587.61 9.25
Pramerica Sicav - Inflation Linked Euro Hedged 1,851,474.34 56,603,884.13 3.27
Pramerica Sicav - Smart Factor Euro 703,054.71 35,874,122.32 1.96
Total 1,392,187,290.69 16,250,137,143.27
Pramerica Sicav
362
Unaudited Appendix (continued)
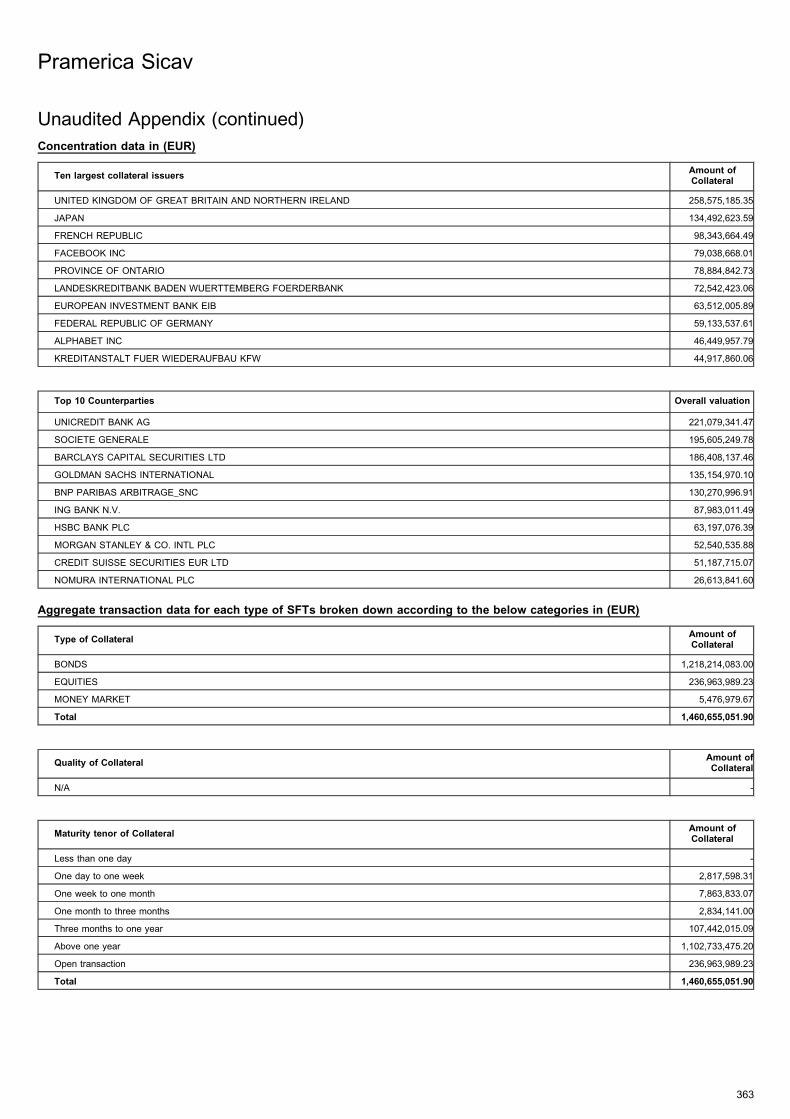
Concentration data in (EUR)
Ten largest collateral issuersAmount ofCollateral
UNITED KINGDOM OF GREAT BRITAIN AND NORTHERN IRELAND 258,575,185.35
JAPAN 134,492,623.59
FRENCH REPUBLIC 98,343,664.49
FACEBOOK INC 79,038,668.01
PROVINCE OF ONTARIO 78,884,842.73
LANDESKREDITBANK BADEN WUERTTEMBERG FOERDERBANK 72,542,423.06
EUROPEAN INVESTMENT BANK EIB 63,512,005.89
FEDERAL REPUBLIC OF GERMANY 59,133,537.61
ALPHABET INC 46,449,957.79
KREDITANSTALT FUER WIEDERAUFBAU KFW 44,917,860.06
Top 10 Counterparties Overall valuation
UNICREDIT BANK AG 221,079,341.47
SOCIETE GENERALE 195,605,249.78
BARCLAYS CAPITAL SECURITIES LTD 186,408,137.46
GOLDMAN SACHS INTERNATIONAL 135,154,970.10
BNP PARIBAS ARBITRAGE_SNC 130,270,996.91
ING BANK N.V. 87,983,011.49
HSBC BANK PLC 63,197,076.39
MORGAN STANLEY & CO. INTL PLC 52,540,535.88
CREDIT SUISSE SECURITIES EUR LTD 51,187,715.07
NOMURA INTERNATIONAL PLC 26,613,841.60
Aggregate transaction data for each type of SFTs broken down according to the below categories in (EUR)
Type of CollateralAmount ofCollateral
BONDS 1,218,214,083.00
EQUITIES 236,963,989.23
MONEY MARKET 5,476,979.67
Total 1,460,655,051.90
Quality of CollateralAmount ofCollateral
N/A -
Maturity tenor of CollateralAmount ofCollateral
Less than one day -
One day to one week 2,817,598.31
One week to one month 7,863,833.07
One month to three months 2,834,141.00
Three months to one year 107,442,015.09
Above one year 1,102,733,475.20
Open transaction 236,963,989.23
Total 1,460,655,051.90
Pramerica Sicav
363
Unaudited Appendix (continued)
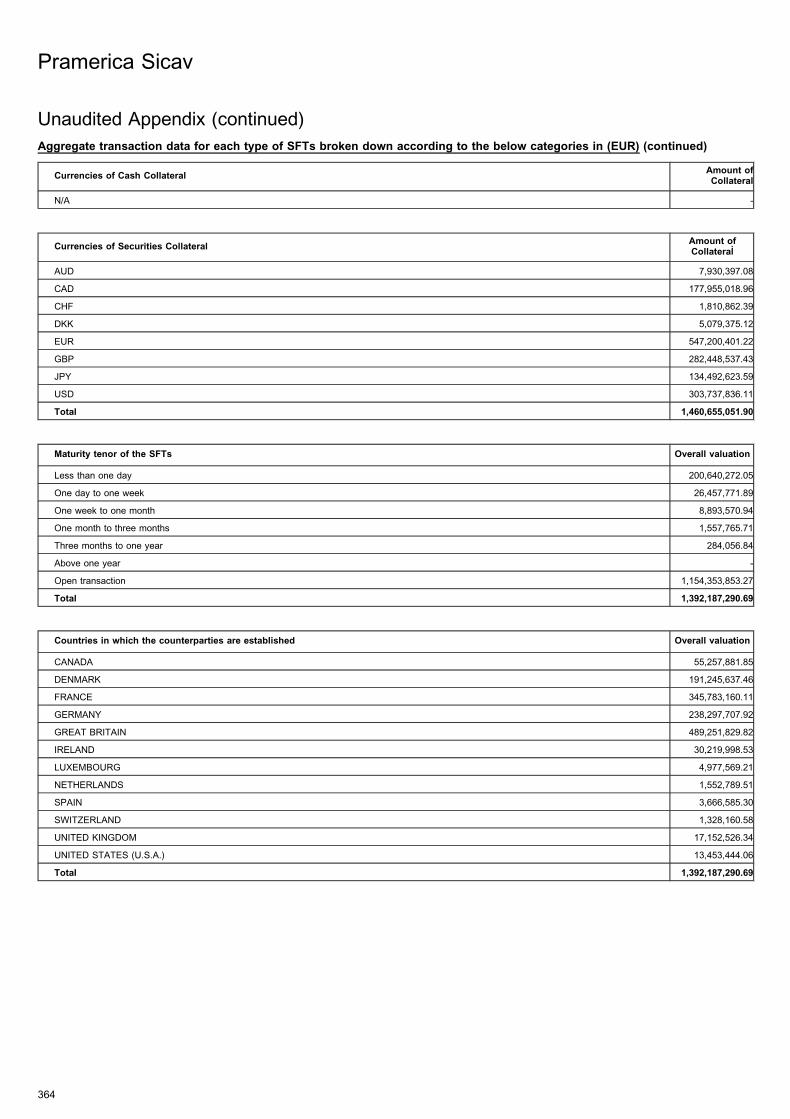
Aggregate transaction data for each type of SFTs broken down according to the below categories in (EUR) (continued)
Currencies of Cash CollateralAmount ofCollateral
N/A -
Currencies of Securities CollateralAmount ofCollateral
AUD 7,930,397.08
CAD 177,955,018.96
CHF 1,810,862.39
DKK 5,079,375.12
EUR 547,200,401.22
GBP 282,448,537.43
JPY 134,492,623.59
USD 303,737,836.11
Total 1,460,655,051.90
Maturity tenor of the SFTs Overall valuation
Less than one day 200,640,272.05
One day to one week 26,457,771.89
One week to one month 8,893,570.94
One month to three months 1,557,765.71
Three months to one year 284,056.84
Above one year -
Open transaction 1,154,353,853.27
Total 1,392,187,290.69
Countries in which the counterparties are established Overall valuation
CANADA 55,257,881.85
DENMARK 191,245,637.46
FRANCE 345,783,160.11
GERMANY 238,297,707.92
GREAT BRITAIN 489,251,829.82
IRELAND 30,219,998.53
LUXEMBOURG 4,977,569.21
NETHERLANDS 1,552,789.51
SPAIN 3,666,585.30
SWITZERLAND 1,328,160.58
UNITED KINGDOM 17,152,526.34
UNITED STATES (U.S.A.) 13,453,444.06
Total 1,392,187,290.69
Pramerica Sicav
364
Unaudited Appendix (continued)
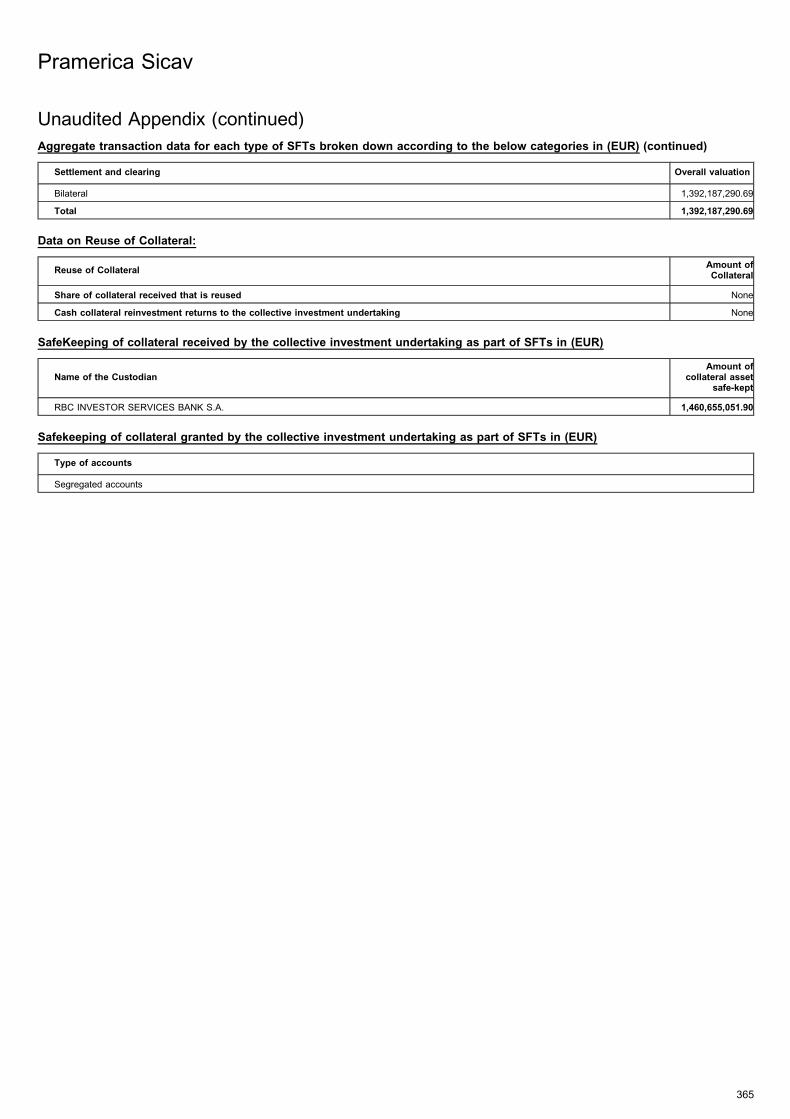
Aggregate transaction data for each type of SFTs broken down according to the below categories in (EUR) (continued)
Settlement and clearing Overall valuation
Bilateral 1,392,187,290.69
Total 1,392,187,290.69
Data on Reuse of Collateral:
Reuse of CollateralAmount ofCollateral
Share of collateral received that is reused None
Cash collateral reinvestment returns to the collective investment undertaking None
SafeKeeping of collateral received by the collective investment undertaking as part of SFTs in (EUR)
Name of the CustodianAmount of
collateral assetsafe-kept
RBC INVESTOR SERVICES BANK S.A. 1,460,655,051.90
Safekeeping of collateral granted by the collective investment undertaking as part of SFTs in (EUR)
Type of accounts
Segregated accounts
Pramerica Sicav
365
Unaudited Appendix (continued)
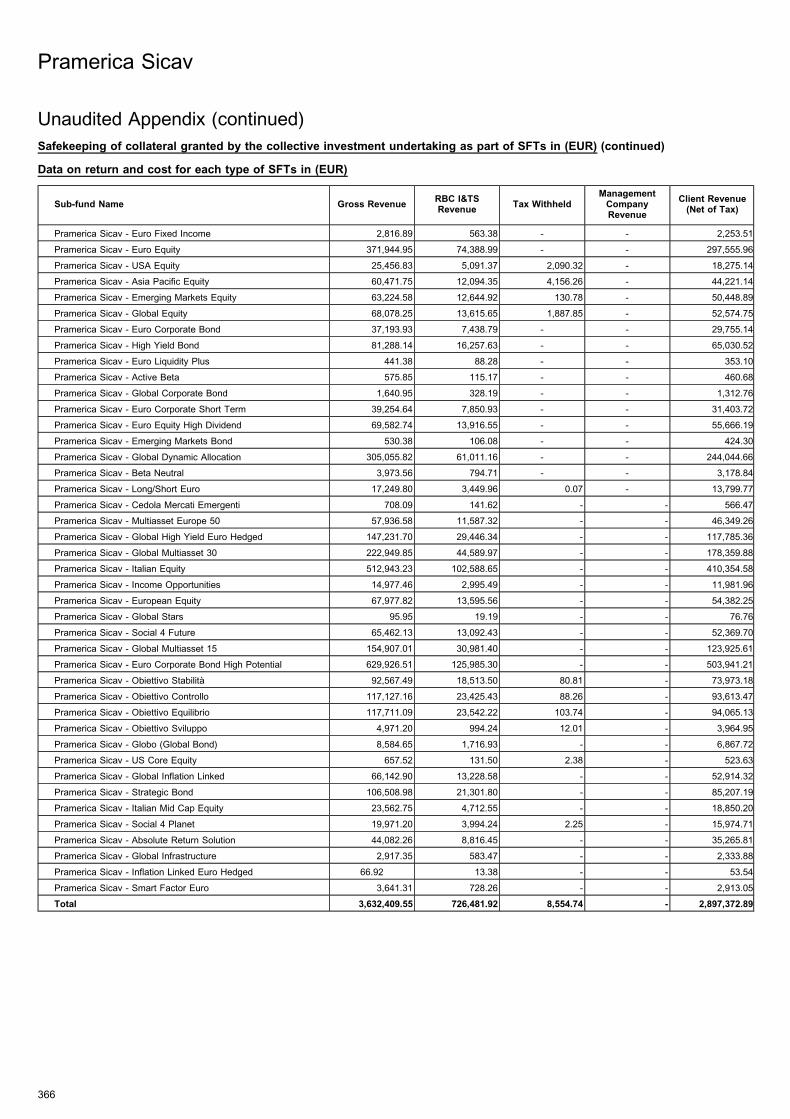
Safekeeping of collateral granted by the collective investment undertaking as part of SFTs in (EUR) (continued)
Data on return and cost for each type of SFTs in (EUR)
Sub-fund Name Gross RevenueRBC I&TSRevenue
Tax WithheldManagementCompanyRevenue
Client Revenue(Net of Tax)
Pramerica Sicav - Euro Fixed Income 2,816.89 563.38 - - 2,253.51
Pramerica Sicav - Euro Equity 371,944.95 74,388.99 - - 297,555.96
Pramerica Sicav - USA Equity 25,456.83 5,091.37 2,090.32 - 18,275.14
Pramerica Sicav - Asia Pacific Equity 60,471.75 12,094.35 4,156.26 - 44,221.14
Pramerica Sicav - Emerging Markets Equity 63,224.58 12,644.92 130.78 - 50,448.89
Pramerica Sicav - Global Equity 68,078.25 13,615.65 1,887.85 - 52,574.75
Pramerica Sicav - Euro Corporate Bond 37,193.93 7,438.79 - - 29,755.14
Pramerica Sicav - High Yield Bond 81,288.14 16,257.63 - - 65,030.52
Pramerica Sicav - Euro Liquidity Plus 441.38 88.28 - - 353.10
Pramerica Sicav - Active Beta 575.85 115.17 - - 460.68
Pramerica Sicav - Global Corporate Bond 1,640.95 328.19 - - 1,312.76
Pramerica Sicav - Euro Corporate Short Term 39,254.64 7,850.93 - - 31,403.72
Pramerica Sicav - Euro Equity High Dividend 69,582.74 13,916.55 - - 55,666.19
Pramerica Sicav - Emerging Markets Bond 530.38 106.08 - - 424.30
Pramerica Sicav - Global Dynamic Allocation 305,055.82 61,011.16 - - 244,044.66
Pramerica Sicav - Beta Neutral 3,973.56 794.71 - - 3,178.84
Pramerica Sicav - Long/Short Euro 17,249.80 3,449.96 0.07 - 13,799.77
Pramerica Sicav - Cedola Mercati Emergenti 708.09 141.62 - - 566.47
Pramerica Sicav - Multiasset Europe 50 57,936.58 11,587.32 - - 46,349.26
Pramerica Sicav - Global High Yield Euro Hedged 147,231.70 29,446.34 - - 117,785.36
Pramerica Sicav - Global Multiasset 30 222,949.85 44,589.97 - - 178,359.88
Pramerica Sicav - Italian Equity 512,943.23 102,588.65 - - 410,354.58
Pramerica Sicav - Income Opportunities 14,977.46 2,995.49 - - 11,981.96
Pramerica Sicav - European Equity 67,977.82 13,595.56 - - 54,382.25
Pramerica Sicav - Global Stars 95.95 19.19 - - 76.76
Pramerica Sicav - Social 4 Future 65,462.13 13,092.43 - - 52,369.70
Pramerica Sicav - Global Multiasset 15 154,907.01 30,981.40 - - 123,925.61
Pramerica Sicav - Euro Corporate Bond High Potential 629,926.51 125,985.30 - - 503,941.21
Pramerica Sicav - Obiettivo Stabilita 92,567.49 18,513.50 80.81 - 73,973.18
Pramerica Sicav - Obiettivo Controllo 117,127.16 23,425.43 88.26 - 93,613.47
Pramerica Sicav - Obiettivo Equilibrio 117,711.09 23,542.22 103.74 - 94,065.13
Pramerica Sicav - Obiettivo Sviluppo 4,971.20 994.24 12.01 - 3,964.95
Pramerica Sicav - Globo (Global Bond) 8,584.65 1,716.93 - - 6,867.72
Pramerica Sicav - US Core Equity 657.52 131.50 2.38 - 523.63
Pramerica Sicav - Global Inflation Linked 66,142.90 13,228.58 - - 52,914.32
Pramerica Sicav - Strategic Bond 106,508.98 21,301.80 - - 85,207.19
Pramerica Sicav - Italian Mid Cap Equity 23,562.75 4,712.55 - - 18,850.20
Pramerica Sicav - Social 4 Planet 19,971.20 3,994.24 2.25 - 15,974.71
Pramerica Sicav - Absolute Return Solution 44,082.26 8,816.45 - - 35,265.81
Pramerica Sicav - Global Infrastructure 2,917.35 583.47 - - 2,333.88
Pramerica Sicav - Inflation Linked Euro Hedged 66.92 13.38 - - 53.54
Pramerica Sicav - Smart Factor Euro 3,641.31 728.26 - - 2,913.05
Total 3,632,409.55 726,481.92 8,554.74 - 2,897,372.89
Pramerica Sicav
366
Unaudited Appendix (continued)
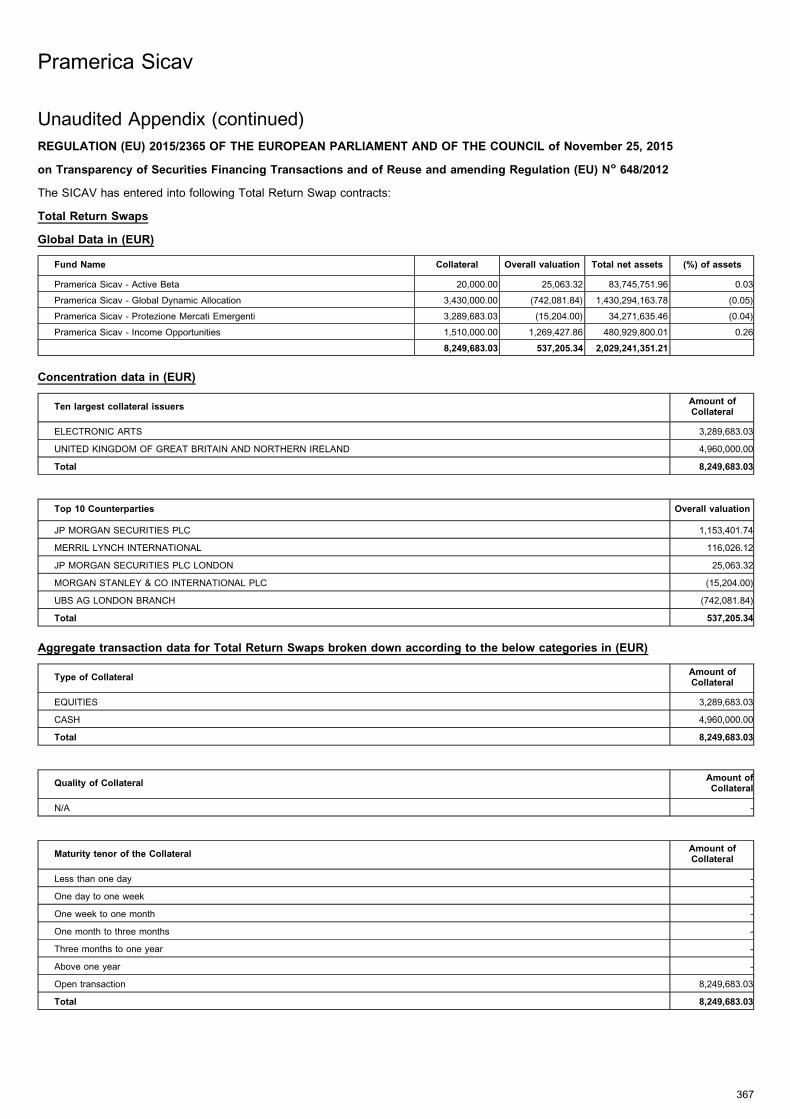
REGULATION (EU) 2015/2365 OF THE EUROPEAN PARLIAMENT AND OF THE COUNCIL of November 25, 2015
on Transparency of Securities Financing Transactions and of Reuse and amending Regulation (EU) No 648/2012
The SICAV has entered into following Total Return Swap contracts:
Total Return Swaps
Global Data in (EUR)
Fund Name Collateral Overall valuation Total net assets (%) of assets
Pramerica Sicav - Active Beta 20,000.00 25,063.32 83,745,751.96 0.03
Pramerica Sicav - Global Dynamic Allocation 3,430,000.00 (742,081.84) 1,430,294,163.78 (0.05)
Pramerica Sicav - Protezione Mercati Emergenti 3,289,683.03 (15,204.00) 34,271,635.46 (0.04)
Pramerica Sicav - Income Opportunities 1,510,000.00 1,269,427.86 480,929,800.01 0.26
8,249,683.03 537,205.34 2,029,241,351.21
Concentration data in (EUR)
Ten largest collateral issuersAmount ofCollateral
ELECTRONIC ARTS 3,289,683.03
UNITED KINGDOM OF GREAT BRITAIN AND NORTHERN IRELAND 4,960,000.00
Total 8,249,683.03
Top 10 Counterparties Overall valuation
JP MORGAN SECURITIES PLC 1,153,401.74
MERRIL LYNCH INTERNATIONAL 116,026.12
JP MORGAN SECURITIES PLC LONDON 25,063.32
MORGAN STANLEY & CO INTERNATIONAL PLC (15,204.00)
UBS AG LONDON BRANCH (742,081.84)
Total 537,205.34
Aggregate transaction data for Total Return Swaps broken down according to the below categories in (EUR)
Type of CollateralAmount ofCollateral
EQUITIES 3,289,683.03
CASH 4,960,000.00
Total 8,249,683.03
Quality of CollateralAmount ofCollateral
N/A -
Maturity tenor of the CollateralAmount ofCollateral
Less than one day -
One day to one week -
One week to one month -
One month to three months -
Three months to one year -
Above one year -
Open transaction 8,249,683.03
Total 8,249,683.03
Pramerica Sicav
367
Unaudited Appendix (continued)
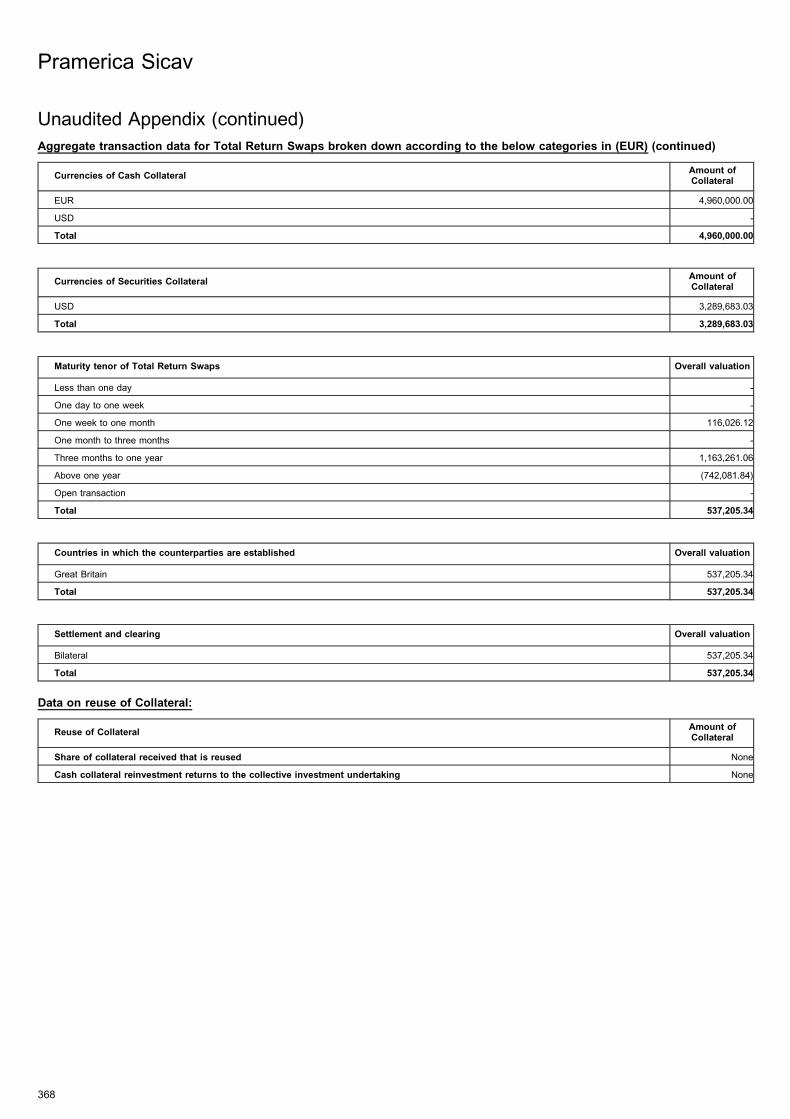
Aggregate transaction data for Total Return Swaps broken down according to the below categories in (EUR) (continued)
Currencies of Cash CollateralAmount ofCollateral
EUR 4,960,000.00
USD -
Total 4,960,000.00
Currencies of Securities CollateralAmount ofCollateral
USD 3,289,683.03
Total 3,289,683.03
Maturity tenor of Total Return Swaps Overall valuation
Less than one day -
One day to one week -
One week to one month 116,026.12
One month to three months -
Three months to one year 1,163,261.06
Above one year (742,081.84)
Open transaction -
Total 537,205.34
Countries in which the counterparties are established Overall valuation
Great Britain 537,205.34
Total 537,205.34
Settlement and clearing Overall valuation
Bilateral 537,205.34
Total 537,205.34
Data on reuse of Collateral:
Reuse of CollateralAmount ofCollateral
Share of collateral received that is reused None
Cash collateral reinvestment returns to the collective investment undertaking None
Pramerica Sicav
368
Unaudited Appendix (continued)
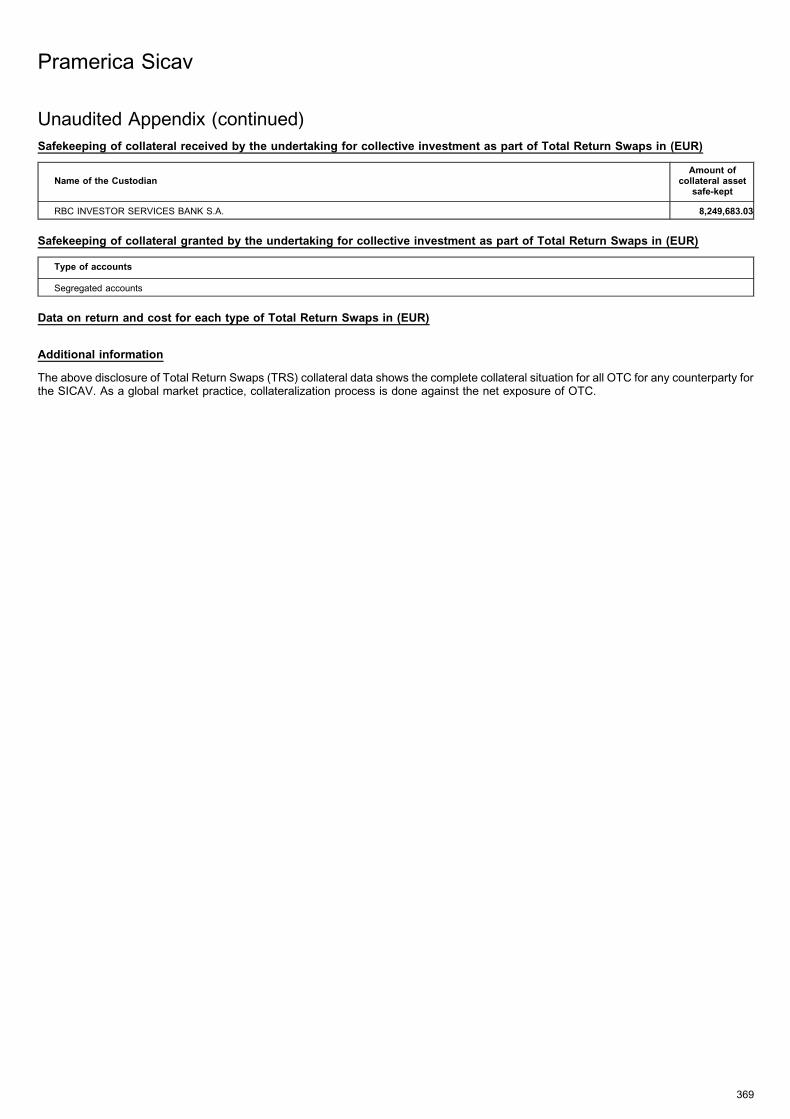
Safekeeping of collateral received by the undertaking for collective investment as part of Total Return Swaps in (EUR)
Name of the CustodianAmount of
collateral assetsafe-kept
RBC INVESTOR SERVICES BANK S.A. 8,249,683.03
Safekeeping of collateral granted by the undertaking for collective investment as part of Total Return Swaps in (EUR)
Type of accounts
Segregated accounts
Data on return and cost for each type of Total Return Swaps in (EUR)
Additional information
The above disclosure of Total Return Swaps (TRS) collateral data shows the complete collateral situation for all OTC for any counterparty forthe SICAV. As a global market practice, collateralization process is done against the net exposure of OTC.
Pramerica Sicav
369
Unaudited Appendix (continued)
Related Documents