Employment, Social Affairs and Inclusion SEPTEMBER 2016 PRACTITIONER’S TOOLKIT PERFORMANCE MANAGEMENT IN PES

Welcome message from author
This document is posted to help you gain knowledge. Please leave a comment to let me know what you think about it! Share it to your friends and learn new things together.
Transcript

Employment,Social Affairsand Inclusion
SEPTEMBER 2016
PRACTITIONER’S TOOLKIT
PERFORMANCE MANAGEMENT IN PES

More information on the European Union is available on the internet (http://europa.eu).
Luxembourg: Publications Office of the European Union, 2016
ISBN 978-92-79-63217-4
doi:10.2767/79776
© European Union, 2016
Reproduction is authorised provided the source is acknowledged.
Cover picture: © European Union
The European Network of Public Employment Services was created following a Decision of the European Parliament and Council in June 2014 (DECISION No 573/2014/EU). Its objective is to reinforce PES capacity, effectiveness and efficiency. This activity has been developed within the work programme of the European PES Network. For further information: http://ec.europa.eu/social/PESNetwork.
This activity has received financial support from the European Union Programme for Employment and Social Innovation ‘EaSI’ (2014-2020). For further information please consult: http://ec.europa.eu/social/easi
LEGAL NOTICE
This document has been prepared for the European Commission however it reflects the views only of the authors, and the Commission cannot be held responsible for any use which may be made of the information contained therein.
Europe Direct is a service to help you find answers to your questions about the European Union.
Freephone number (*):
00 800 6 7 8 9 10 11
(*) The information given is free, as are most calls (though some operators, phone boxes or hotels may charge you).

Written by Karsten Bjerre and Peter Sidelmann, Rambøll Management Consulting
In collaboration with Isabelle Puchwein-Roberts, ICF International
SEPTEMBER 2016
PRACTITIONER’S TOOLKIT
PERFORMANCE MANAGEMENT IN PES

ContentsINTRODUCTION 6
What is the purpose of the toolkit? 6
Why have a toolkit on performance management? 6
How is the toolkit structured? 6
Who is the toolkit aimed at? 7
CHAPTER 1. SCOPING: PUTTING STRATEGIC PERFORMANCE MANAGEMENT IN PLACE IN PES: DEVELOPING OBJECTIVES, DETERMINING TARGETS AND PERFORMANCE INDICATORS, AND AGREEING KEY PERFORMANCE INDICATORS (KPIs) 8
1.1 Defining indicators 91.1.1 Theory of Change in practice 91.1.2 Selecting and testing indicators 171.1.3 Key considerations when choosing indicators 19
1.2 Setting targets 211.2.1 Setting robust targets 211.2.2 Top down vs bottom up 221.2.3 Key considerations 24
1.3 Assessing PES performance 241.3.1 Statistical approaches to assessing performance 241.3.2 Holistic approaches to assessing performance 28
1.4 Improving effectiveness with PMS 291.4.1 Before: planning budgets 311.4.2 During: running budgets 311.4.3 After: evaluating programmes 311.4.4 Key considerations 32
1.5 Taking it to the next level 321.5.1 Organising and replacing indicators 321.5.2 Reviewing targets – adjustment cycles? 331.5.3 Advanced forms of performance budgeting 33
CHAPTER 2. IMPLEMENTING: OPERATIONALISING PERFORMANCE MANAGEMENT: BUILDING AND MAINTAINING A ROBUST, EFFICIENT AND EFFECTIVE SYSTEM 35
2.1 Data reporting 352.1.1 Key considerations 37
2.2 Reviewing and using data – dialogues 392.2.1 Dialogues on results and exchanges on performance 402.2.2 Building a cycle of continuous improvement 412.2.3 Key considerations 42
2.3 Ensuring the right incentives are in operation 432.3.1 Rewarding high performance at different organisational levels 432.3.2 Soft incentives: sharing results & celebrating contributions 45
REFERENCE LIST AND FURTHER INFORMATION AND RESOURCES 46
ANNEX ORGANISATIONAL READINESS FOR STRATEGIC PERFORMANCE MANAGEMENT 47
A1.1 Assessing readiness 47A1.2 Key considerations 53

6
What is the purpose of the toolkit?
This toolkit is intended to assist public employ-ment services (PES) in designing, implementing and/or reviewing their approach to perfor-mance management. It provides concrete guidance and tools for PES to develop key components of per-formance management (PM) systems from scratch, or to review and refine existing systems – taking account wider organisational and contextual factors.
The toolkit helps PES to answer the following key questions: ‣ How can PES design, maintain, develop and review robust PM systems?
‣ How can PES use their PM systems to consider the impact of resource allocation on the effec-tiveness of PES operations?
‣ How can PES use the information from PM to inform decision making and hold conversations based on evidence across the organisation?
Why have a toolkit on performance management?Today, most PES have institutionalised – or have committed to – some form of Management-by-Ob-jectives (MbO) system – in order to deliver their services in a more efficient and effective way. Tech-nology has advanced and practitioners have learned from their experiences. Furthermore, European PES are under continuing pressure to deliver more ser-vices with less resources in a labour market that
Introduction cannot integrate the unemployed into employment as quickly and sustainably as it once did. Disad-vantage and unemployment persist (if not actually increasing), whilst PES resources have not grown commensurately.
Understanding what works, what does not work, why and where (?) – are crucial items PES must address in order to make smarter budgetary and policy deci-sions. Evidence-based decision making should drive how PES concentrate their core resources. While some PES have used MbO type (and sometimes more sophisticated) systems for some years now, PES’s PM systems and their ability to design and operate these remain disparate across the EU.
The value of a toolkit on this subject is therefore to: ‣ Provide PES with a set of performance man-agement tools that encompass MbO techniques and constitutive elements, assist in identifying targets and indicators, provide evidence for systemic review, feedback and improvement, and support performance enhancement processes and structures, (e.g. benchmarking, performance dialogues), or provide the rationale for staff incentives – as discussed at a PES Mutual Learning Thematic Review Workshop in October 2015.
‣ Increase PES capacity to implement, review and continuously improve their performance management systems (PMS) for the successful implementation of benchlearning. This helps to meet the requirements of the May 2014 Deci-sion on enhanced cooperation between Public Employment Services, which placed specific obligations on Member States to contribute to the development and implementation of Union-wide, evidence-based benchlearning amongst their PES.
The toolkit aims to inform PES of tools and processes that can be used, whether they are at initial design and implementation, or further down the line at re-design stage.
How is the toolkit structured?
The toolkit is organised around two main chapters, which follow a cycle of continuous improvement:1. Putting strategic performance manage-
ment in place in PES: developing objec-tives, determining targets and performance indicators, agreeing Key Performance Indicators (KPI) and reviewing existing PM systems.

2. Implementation: Operationalising performance management: building and maintaining robust, efficient and effective systems, creating incentives and maintaining performance dialogues.
Each chapter contains a range of practical information concerning what issues should be considered and which actions a PES can take when choosing their approach. This includes ‘practical tips’, tools and templates, links to PES examples and signposts to further information.
In addition, a separate tool is provided in Annex 1 to assist PES in testing their organi-sational readiness for strategic performance management. This is a separate tool to provides
questions for PES to reflect on, namely to map their capacity (as an organisation) to implement performance management or to improve several or individual aspects of existing performance management systems (for example, strategy, culture, etc.).
Who is the toolkit aimed at?
The toolkit is aimed at PES practitioners who are involved in developing, operating and reviewing performance management systems, as well as those who use PM information for the ongoing development and reform of PES service delivery. The toolkit is therefore developed for people with a variety of PES functions, and you can navigate around the information in various ways depending on your role:
Are you a senior PES manager?
If Yes, you should ideally review section 1.1 on defining indicators for performance management, especially with regards to operationalising the strategic vision of your PES with the Theory of Change approach that specifies outcomes for your target group (1.1.1.2.), and selecting and testing indicators (1.1.2 and 1.1.3). Moreover, section 1.2.1 provides insight into setting robust targets and section 1.2.2 outlines two different approaches to setting targets: the top down or the bottom up approach. Section 1.4 looks at improving effectiveness by linking performance management systems into the budget cycle. Furthermore, you will find interesting information in section 2 (implementation) seeing as section 2.1 covers steps for data reporting and highlights considerations on whether to invest in a data warehouse, and seeing as section 2.2 outlines how to review data in the form of dialogues across the PES. In addition, section 2.3 provides information on introducing incentive structures. On a practical side, Annex 1 can also help you to assess your PES in terms of readiness to move towards strategic performance management.
Are you an operational delivery manager?
If Yes, you can familiarise yourself with Step 3 in section 1.1.1.2 on defining target groups and deciding on measures for certain target groups. Section 1.2 on target setting can be of interest for you if you are involved in target setting in a bottom up approach. In addition, section 2.3.2 provides practical tips for you in terms of rewarding staff and celebrating performance.
Are you a policymaker in PES and/or a government ministry?
If Yes, you should consider the introduction to chapter 1 that outlines definitions for performance manage-ment in the context of benchlearning. Section 1.4 looks at improving effectiveness by linking performance management systems into the budget cycle, which can be of interest to you if you are involved in reviewing budgets for the PES. In addition, you could look at the definition of target groups by policy objectives and by the operational level (section 1.1.1.2).
Are you a performance manager?
If Yes, you will find the information for senior PES managers of interest to you. More specifically for your role, you will ideally review section 1.1 on defining indicators for performance management, especially with regard to selecting and testing indicators (1.1.2). Section 1.3 looks at ways of assessing performance of different business units. Section 1.5 provides insights into reviewing and improving existing performance management systems. Moreover, section 2.1 covers considerations on how to report data to different stakeholders, and section 2.2 focuses on reviewing data in the form of dialogues across the PES.
PRACTITIONER’S TOOLKIT
7
This chapter focuses on scoping the (re-)develop-ment of performance management systems. It should be of use to both PES with less experiences in PM and those who are seeking to review and further enhance mature PM systems.
As well as PES maturity in regard to this subject, national political and administrative differences will affect the conditions for developing PM systems and their core elements. Each PES will need to consider this chapter within their own institutional context.
The sections in this chapter will take PES through defining indicators (section 1.1), setting targets (sec-tion 1.2), assessing PES performance (section 1.3), improving effectiveness with PMS (section 1.4) and organisational readiness for strategic performance management (section 1.5).
To obtain maximum benefit from the information contained in this chapter, PES should consider two key aspects.
(a) Using definitions within your PES
The textbox below offers and an overview of key definitions and essential terms used in performance management.
D E F I N I T I O N S
8
‣ Objectives: Objectives are defined as requirements set at the national level determined by either the legal mandate of a PES and/or the governing authority. Examples of commonly used objectives may include ‘preventing and reducing unemployment’, ‘matching labour supply and demand’, ‘securing subsistence by calculating and disbursing benefits’, ‘fostering equal opportunity on the labour market’, ‘improving services for the unemployed’.
‣ Targets: Targets are defined as the expected or predicted success level of an individual or organisation; a list of measurable milestones the organisation will use to monitor progress towards the achievement of its goal. Examples include ‘reducing average duration of unemployment to XX weeks’ or ‘activation of XX % of all unemployed’.
‣ Performance indicators: Performance indicators are defined as the translation of targets into measurable indices together with a precise specification of how to measure them. Examples include ‘average duration of unemployment of jobseekers younger than 25’, ‘number of vacancies filled relative to the number of registered vacancies’, ‘mean of employer satisfaction indices’, ‘number of job placements relative to the number of job seekers, ‘number of activated unemployed relative to the number of total unemployed’. Performance indicators can be outcome indicators or process/activity-based indicators.
‣ Key performance indicators: Key performance indicators (KPI) are defined as performance indicators which are perceived as critical success factors and which are of quantitative nature (i. e. not just a general statement).
Chapter 1. SCOPING: Putting strategic performance management in place in PES: developing objectives, determining targets and performance indicators, and agreeing key performance indicators (KPIs)
(b) Clarity about the scope of the PM system
It is important to start with an agreed understanding of the contextual/geographical dimension within which you are establishing a PM system. Much of the approach to designing PM systems and the components described in this chapter will depend on whether you are looking to defining PM at Macro, Intermediate or Micro level. Many of the processes and tools described below will be impacted by the level of the organisation and decision making that the PES PM system is directed towards.
1.1 Defining indicators
Do PES know if /when they are doing the right thing to achieve the outcomes they seek for those they serve?
This question is central to most PES’ vision and val-ues underpinning the services that they deliver to jobseekers and employers. In this section, you have access to a number of tools that can help you to answer this question, by breaking it down into two, interlinked, components: ‣ What is, and how should the Theory of Change be applied? From this section you will establish how to approach and carry out a Theory of Change, i.e. developing a blueprint to achieve specific outcomes for the specific target groups that your PES serves.
‣ How and what indicators to set? From this section, you will also identify how to select the indicators that will help you determin-ing whether you are doing the right things to achieve the outcomes set by the Theory of Change.
1.1.1 Theory of Change in practice
To deliver complex strategies or policies, organisa-tions need to operationalise the strategic visions that guide their businesses. That also applies for PES, where a Theory of Change is a helpful tool.
In practice, a Theory of Change consists of a series of ‘if – then’ statements that add up to a prescription for the design and management of your PES and the services that you deliver, all of which aim to help your target population to achieve key, sustainable outcomes.
1.1.1.1 How do I start?
A good approach if your PES is new to this practice is to organise a focused workshop that engages a range of people from across the organisation. The box below illustrates how, in practice, your PES could create a Theory of Change in the course of a three to four day workshop.
D E F I N I T I O N S
PRACTITIONER’S TOOLKIT
9
‣ Systematically: ‘Systematically’ is defined as the use of clearly defined methods/tools by specific responsible and accountable people within a clearly determined time interval.
‣ Theory of Change – how do you effect change?: A blueprint illustrates the logically related parts of a programme or service, showing the links between objectives, activities, and expected outcomes. It makes clear who will be served, what should be accomplished and specifically how it will be done? (i.e. written cause-and-effect statements for a given programme design).
‣ Input – what resources are committed?: The resources – money, time, staff, expertise, methods, and facilities – that an organisation commits to a programme in order to produce the intended outputs and outcomes.
‣ Output – what do you count?: The volume of a programme’s actions, such as products created or delivered, the number of people served, and activities and services carried out.
‣ Outcomes – what do you wish to achieve?: Meaningful changes for those you serve, generally defined in terms of expected changes in knowledge, skills, attitudes, behaviour, condition, or status.
Sources: Definitions are adapted from two sources: 1) Revised PES Performance assessment Framework. 2) Mario Morino (2011): Leap of Reason. Managing Outcomes in an Era of Scarcity. Venture Philanthropy Partners in Partnership with McKinsey & Company.

TO O L B O X – T H E T H E O RY O F C H A N G E WO R K S H O P
10
When? The workshop should take place as early as possible when your PES wishes to introduce, review or revitalise a performance management system.
Who? You should invite a vertically integrated team consisting of executive leadership, mid-level managers and a sample of frontline staff. In order to make informed decisions on the future strategy, you need the knowledge from both frontline staff and mid-level managers and authority from the executive leadership.
What to cover? The workshop should explore in detail what long-term outcomes the organisation aims for in relation to specific target populations, and what short-term outcomes, outputs, activities and inputs the PES requires in order to facilitate/achieve these. The descriptions should be precise and concrete, and key indicators should be decided in a group (that is: what information will tell me that I am doing well/ not so well?). It is useful to keep the target population narrowly defined, so that they share sufficiently similar issues and situations, and so that they respond in a reasonably similar fashion to PES interventions.
How to facilitate? Theory of change-workshops require an experienced facilitator with knowledge of facilitation, performance management, PES and the target group covered. The facilitator helps the team to reach consensus on all the matters covered in the steps, and where this is not possible, the executive director should commit to a fully transparent process for making an executive decision.
Outputs from the workshop: ‣ An outcome map, which is a graphic display showing the causal interrelationship between interventions, outcomes and,
ultimately, the organisation‘s strategic goals.
‣ A narrative, which is a text explaining how the organisation (PES) intends to achieve the goals, describing in words the target group, the strategic goal as well as the components of the outcome map. Detailed workshop notes will aid the narrative.
‣ Other items: It is helpful to describe any potential risks that have been identified regarding the implementation of the Theory of Change. This helps the people responsible for the implementation to take risks into consideration. In addition, a to-do list covering future topics should be included (‘what next’).
What do to afterwards? The results of the workshop should be documented to describe the decisions and the reasons for these (choice and justification), so that they are clear and meaningful to the rest of the organisation. After the workshop, it is important to communicate 1) the Theory of Change, 2) when and how it will be implemented and 3) how performance will be measured and managed.
TIP: The workshop agenda can follow the eight steps to a Theory of Change, described below. This is a useful way to break down the discussions into steps.

PRACTITIONER’S TOOLKIT
11
1.1.1.2 What are the key components of the Theory of Change?
In this section, the eight steps to establishing a Theory of Change are described. It is advis-able to take these in the order in which they are presented here.
Step 1: Clarify the conditions for making a Theory of Change
It is important to start the process by clarifying the conditions that influence the Theory of Change (in other words, to bring in the contextual opportunities and/or barriers right at the beginning). In most cases, the Theory of Change needs to take into account a number of existing conditions. Typically, these are (individually or collectively, depending on your context): ‣ Legal conditions: Some activities and services can be required by law and may be contractual binding.
‣ Policies and strategies: The Theory of Change must in some cases comply with PES policies and strategies.
‣ Finances: There is often a fixed budget that must be met – sometimes the budget is linked to outcomes.
‣ Organisation: Often the current organisational structure is set and appears inflexible.
In the Theory of Change workshop, your starting point can be that, whatever is developed, it should optimise long-term outcomes. In some instances, the Theory of Change can even go as far as recom-mending radical changes to PES activities, working methods and organisation. However, the Theory of Change can also simply help your organisation to make sense of the status quo (what you are already doing today) and how improvements can take place within current parameters. Thus, Theory of Change workshops are held within a continuum between incremental change and radical innovation.
Step 2: Clarify the strategic goal
For this step, your starting point is ‘Why and What’: ‣ Why does your organisation exist? (establishing the mission)
‣ What is your organisation aiming to do? (estab-lishing the strategic objectives)
Clarifying the strategic goal(s) of your organisation, department(s), team(s) etc. is central to the devel-opment of a Theory of Change because it sets the frame for discussions on target groups and desired outcomes (see below Steps 3 and 4).
This exercise is different from the development of an organisation’s business strategy. In fact it clarifies the degree to which the strategic goal(s) of a spe-cific programme and/or project are developed for, and aligned with the overall business strategy. In connection with a Theory of Change workshop, the existence of a business strategy can therefore be viewed as a necessary pre-condition for clarifying the strategic goal(s) of a programme and/or project.
Step 3: Define the target population
In this third step, your PES is directed to answer: ‣ Who are we serving?
In other words, what is your target population? Is it prisoners whom you help to move into employ-ment upon their release? People with mental health problems? Citizens who are in between jobs?
The objective of this step is to narrow the target group for the PES by using two types of indicators: 1) demographics and 2) risk-related indicators (see the box overleaf).
A narrow(er) target group increases the possibilities of customising programmes to individual needs, therefore clearly identifying the characteristics of the target group is helpful in that process. Whenever possible, the final target population definition should be summarised in a single statement (e.g. ‘we serve vulnerable pregnant women or mothers below the age of 35 who live in X,Y and Z geographic areas’). Alternatively, a condensed list of statements can be drawn, clarifying what characterises the person, group or organisation in the target population. The box overleaf provides an overview of possible indica-tors that can help you in the process of narrowing the target group(s).

TO O L B O X – I N D I C ATO R S TO D E F I N E TA R G E T P O P U L AT I O N ( S )
12
Narrowly defined target populations improve the conditions for establishing a robust Theory of Change. Ideally, the target population share key characteristics and tend to have similar problems – this helps to define activities that are relevant to a wider range of individuals within that target population.
Two types of indicators can help to narrow the target group in a PES context:
1) Demographic indicators: these are qualities that are fixed or that inherently tend to be slow to change. They define the context within which people live and function. The following demographic indicators can be used when characterising the target population:
‣ Geography/place of residence
‣ Age range
‣ Ethnicity
‣ Gender
‣ Socio-economic status
2) Risk-related indicators: these are malleable conditions which point to the probability that individuals, families or groups who exhibit them will face major challenges to their present well-being and/or future prospects. Examples include:
‣ Substance abuse
‣ Homelessness
‣ Psychological problems
‣ Difficulties adjusting to school requirements
‣ Lack of self-motivation with regard to school or work
‣ Lack of adequate social or adaptive skills
‣ Chronic or acute physical illness
‣ Behaviours that can lead to social isolation
‣ Behaviours that can lead to incarceration
However, when defining the target population for a Theory of Change it is often not possible to simply use the population targeted by wider policy objectives. These target groups tend to be broad, which is meaningful in a political context but not useful in an operational context (e.g. a local office). Therefore, it is often necessary to design more than one Theory of Change to cover all the aspects of a policy objective.
After defining your target group:
Once you have defined your target group using both demographic and risk-related indicators, the target group is operationalised in a two-step process: ‣ A) Enrolment assessment: this consists of assessing potential enrolees to ensure that they fit the profile of people whom you serve in order to meet your mission. All ‘screeners’ must use the same indicators and methods to assess people.
‣ B) Baseline assessment: this uses the risk-related indicators to identify crucial information about each client’s situation and to specify the areas that each function (department or unit) will address through its services. It is best to focus on a few risk indicators which the PES consider key and which they have the competencies and capacity to work with. For example: – If the PES enrols individuals with psychologi-cal problems, there are many issues that could be addressed by working with them. However, it is helpful to narrow the PES focus down to, for
example, employment-related items such as work-readiness, skills and work-related self-efficacy. The PES then uses these as baseline indicators after the person’s enrolment, and the PES will select outcomes and engage in activities to promote these specific indicators.
Step 4: Establish desired outcomes
In this fourth step, your PES is directed to answer: ‣ What are the targeted outcomes that your services should help your target population to achieve?
Outcome means: enduring changes in the people served, which are directly linked to the organisation‘s efforts, and for which the organisation holds itself accountable. It is then useful to identify ‘typical’ outcomes, where relevant, short, medium and long term. For example: ‣ Short-term outcomes could be expressed as changes in skills or knowledge (e.g. improved reading skills).
CHANGES IN KNOWLEDGE
CHANGES IN ATTITUDES
CHANGES IN BEHAVIOUR
CHANGES IN ACHIEVEMENT
Short-term outcomes Long-term outcomes
Examples:
Knowledge on job seeking. Attitudes towards acceptable jobs regarding fields, wages, work conditions and transportation.
Unemployed seek jobs that are realistic.
Length of unemployment periods.
Increased self-knowledge. Motivation to put effort into job seeking.
Competent seeking strategies, e.g. use of network, customising CV's and letters, prepared for job interviews.
Sustainability of employment periods.
Developing new qualifications which are demanded by labour market.
‘Job quality’, e.g. wage and qualification level.
E X A M P L E
PRACTITIONER’S TOOLKIT
13
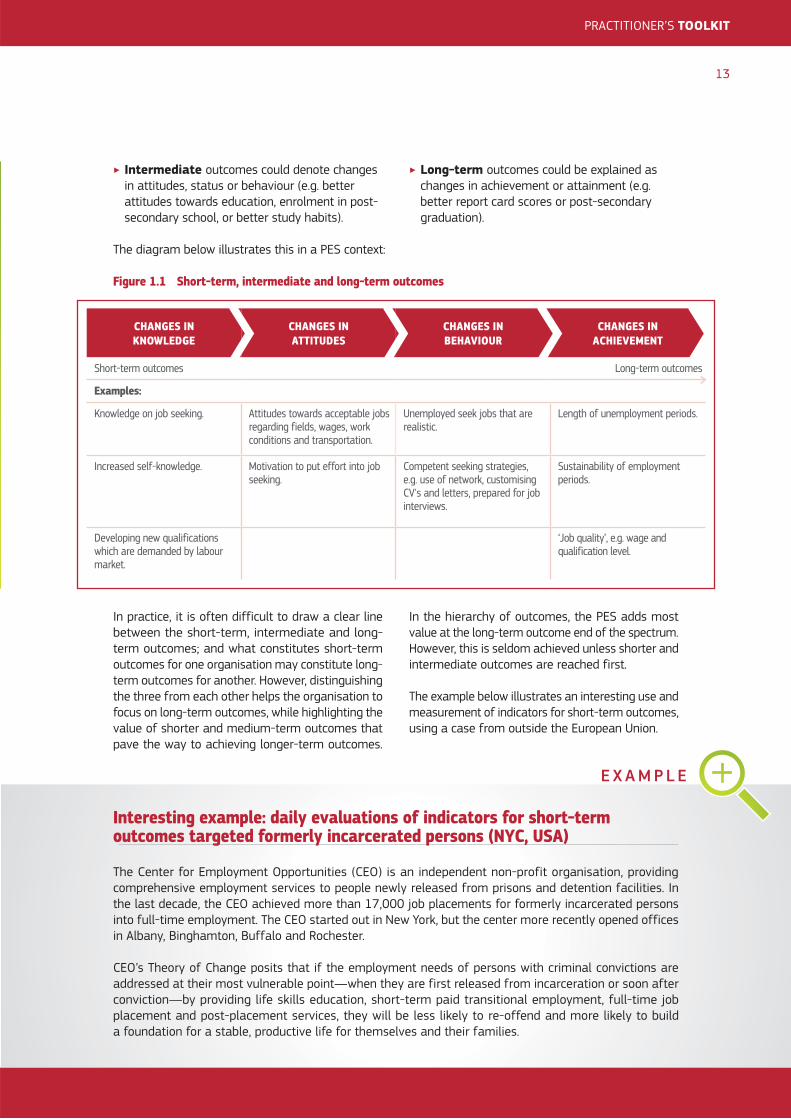
‣ Intermediate outcomes could denote changes in attitudes, status or behaviour (e.g. better attitudes towards education, enrolment in post-secondary school, or better study habits).
‣ Long-term outcomes could be explained as changes in achievement or attainment (e.g. better report card scores or post-secondary graduation).
The diagram below illustrates this in a PES context:
Figure 1.1 Short-term, intermediate and long-term outcomes
In practice, it is often difficult to draw a clear line between the short-term, intermediate and long-term outcomes; and what constitutes short-term outcomes for one organisation may constitute long-term outcomes for another. However, distinguishing the three from each other helps the organisation to focus on long-term outcomes, while highlighting the value of shorter and medium-term outcomes that pave the way to achieving longer-term outcomes.
In the hierarchy of outcomes, the PES adds most value at the long-term outcome end of the spectrum. However, this is seldom achieved unless shorter and intermediate outcomes are reached first.
The example below illustrates an interesting use and measurement of indicators for short-term outcomes, using a case from outside the European Union.
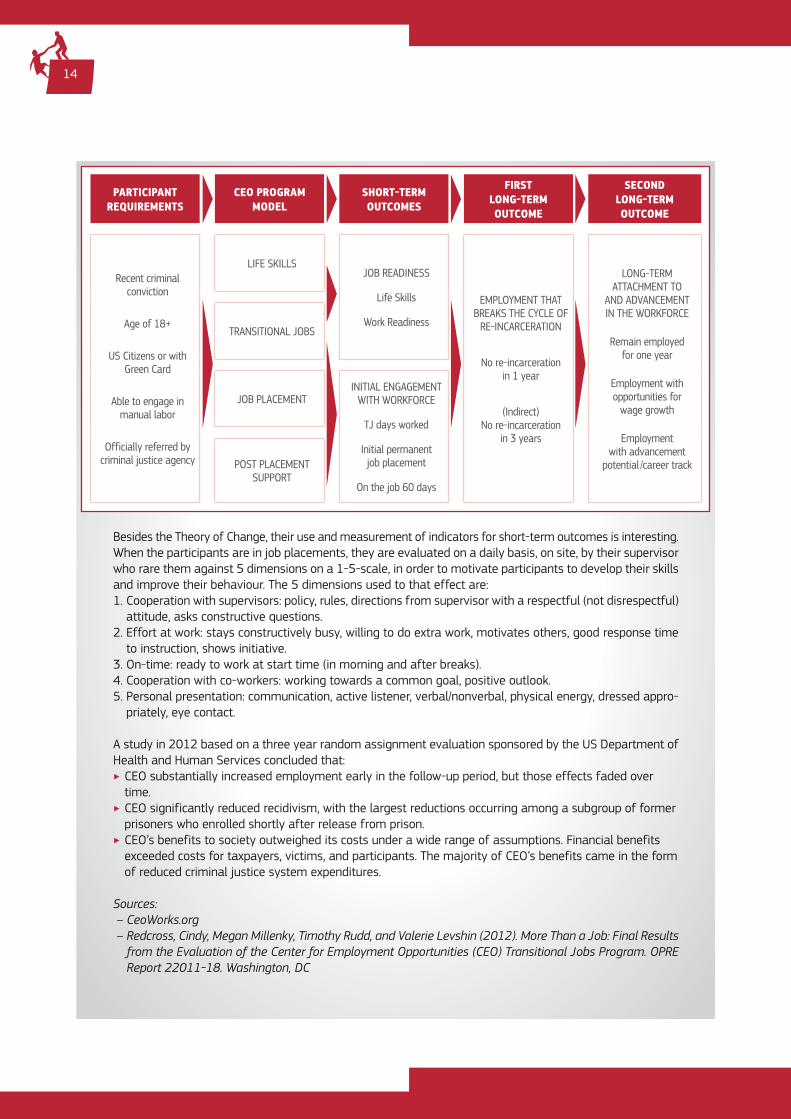
Interesting example: daily evaluations of indicators for short-term outcomes targeted formerly incarcerated persons (NYC, USA)
The Center for Employment Opportunities (CEO) is an independent non-profit organisation, providing comprehensive employment services to people newly released from prisons and detention facilities. In the last decade, the CEO achieved more than 17,000 job placements for formerly incarcerated persons into full-time employment. The CEO started out in New York, but the center more recently opened offices in Albany, Binghamton, Buffalo and Rochester.
CEO’s Theory of Change posits that if the employment needs of persons with criminal convictions are addressed at their most vulnerable point—when they are first released from incarceration or soon after conviction—by providing life skills education, short-term paid transitional employment, full-time job placement and post-placement services, they will be less likely to re-offend and more likely to build a foundation for a stable, productive life for themselves and their families.
PARTICIPANT REQUIREMENTS
CEO PROGRAM MODEL
SHORT-TERM OUTCOMES
FIRST LONG-TERM OUTCOME
SECOND LONG-TERM OUTCOME
Recent criminal conviction
Age of 18+
US Citizens or with Green Card
Able to engage in manual labor
Officially referred by criminal justice agency
LIFE SKILLSJOB READINESS
Life Skills
Work Readiness
EMPLOYMENT THAT BREAKS THE CYCLE OF
RE-INCARCERATION
No re-incarceration in 1 year
(Indirect) No re-incarceration
in 3 years
LONG-TERM ATTACHMENT TO
AND ADVANCEMENT IN THE WORKFORCE
Remain employed for one year
Employment with opportunities for
wage growth
Employment with advancement
potential /career track
TRANSITIONAL JOBS
JOB PLACEMENTINITIAL ENGAGEMENT
WITH WORKFORCE
TJ days worked
Initial permanent job placement
On the job 60 days
POST PLACEMENT SUPPORT
14
Besides the Theory of Change, their use and measurement of indicators for short-term outcomes is interesting. When the participants are in job placements, they are evaluated on a daily basis, on site, by their supervisor who rare them against 5 dimensions on a 1-5-scale, in order to motivate participants to develop their skills and improve their behaviour. The 5 dimensions used to that effect are:1. Cooperation with supervisors: policy, rules, directions from supervisor with a respectful (not disrespectful)
attitude, asks constructive questions.2. Effort at work: stays constructively busy, willing to do extra work, motivates others, good response time
to instruction, shows initiative.3. On-time: ready to work at start time (in morning and after breaks). 4. Cooperation with co-workers: working towards a common goal, positive outlook. 5. Personal presentation: communication, active listener, verbal/nonverbal, physical energy, dressed appro-
priately, eye contact.
A study in 2012 based on a three year random assignment evaluation sponsored by the US Department of Health and Human Services concluded that: ‣ CEO substantially increased employment early in the follow-up period, but those effects faded over time.
‣ CEO significantly reduced recidivism, with the largest reductions occurring among a subgroup of former prisoners who enrolled shortly after release from prison.
‣ CEO’s benefits to society outweighed its costs under a wide range of assumptions. Financial benefits exceeded costs for taxpayers, victims, and participants. The majority of CEO’s benefits came in the form of reduced criminal justice system expenditures.
Sources: – CeoWorks.org – Redcross, Cindy, Megan Millenky, Timothy Rudd, and Valerie Levshin (2012). More Than a Job: Final Results
from the Evaluation of the Center for Employment Opportunities (CEO) Transitional Jobs Program. OPRE Report 22011-18. Washington, DC

Step 5: Outline the activities
Outlining the activities for the PES means clari-fying what your organisation, department(s) and team(s) do with the resources available to them. As such, the activities are the processes, tools, events, technology and actions that are used in/by the PES to bring about the intended programme changes or results.
Examples of such activities for the end user could therefore translate into courses, mentoring pro-grammes, job placements, counselling sessions etc. To each outcome defined in step 4, the PES should link at least one activity.
An important part of the earlier Theory of Change workshop is also to define how the activities should be designed to optimise the likelihood of successful outcomes for the target group. The following ques-tions support this: ‣ At what stage should the activity take place? ‣ What should be the length and frequency of the activity?
‣ What are the professional guidelines for carry-ing out the activity?
‣ What should be the success criteria for the activity and how can you monitor during the activity if progress is being made?
Step 6: Review the activities
Once activities have been defined for each key PES outcome, it is important to review the activities. This can be done in two ways:
A) By asking questions such as: ‣ ‘Is the activity suggested for this outcome the most important activity needed to achieve it?’ ‘Does it take other activities to make sure that the outcome is achieved?’
‣ ‘Is the programme or the wider organisation capable of delivering this activity, or does it require cooperation with other programmes or organisations?’
B) By clarifying assumptions and using evidence in establishing/reviewing a Theory of Change.
This approach systematically addresses the critical assumptions underlying the link between activities and outcomes. In some instances, previous studies provide evidence to support possible causal links in the Theory of Change. In other cases, no such evi-dence exists and the assumptions behind the Theory of Change rely on hypotheses and the expereince of professionals. Should a causal statement appear implausible, it may be opportune to review the logic of the intervention at hand.
E X A M P L E
PRACTITIONER’S TOOLKIT
15
In contrast, the example below describes Ireland’s approach to measuring progression towards longer-term outcomes for specific groups, including the long-term unemployed and young unemployed:
Interesting example: measuring the progression towards employment in Ireland
The Irish (Department for Social Protection) PES strategy ‘Pathways to Work’ focusses on the employment of long-term unemployed and young people. This sits alongside the roll-out of integrated public employment and benefits services through the Intreo ‘one-stop-shop’ model in 2014/2015.
The objective of the services and of ALMPs is to support return of unemployed people to sustainable employment. However, there can be interim outcomes, for example if a person who is distant from the labour market improves his or her employability by training. Evaluations assess the impact of activation measures in terms of improving progression to employability programmes as well as directly to employment. However, measurement of whether employability programmes are cost-effective will continue to focus primarily on ultimate success in terms of entry to employment.
Source: http://www.welfare.ie/en/downloads/pathways-to-work-2015.pdf
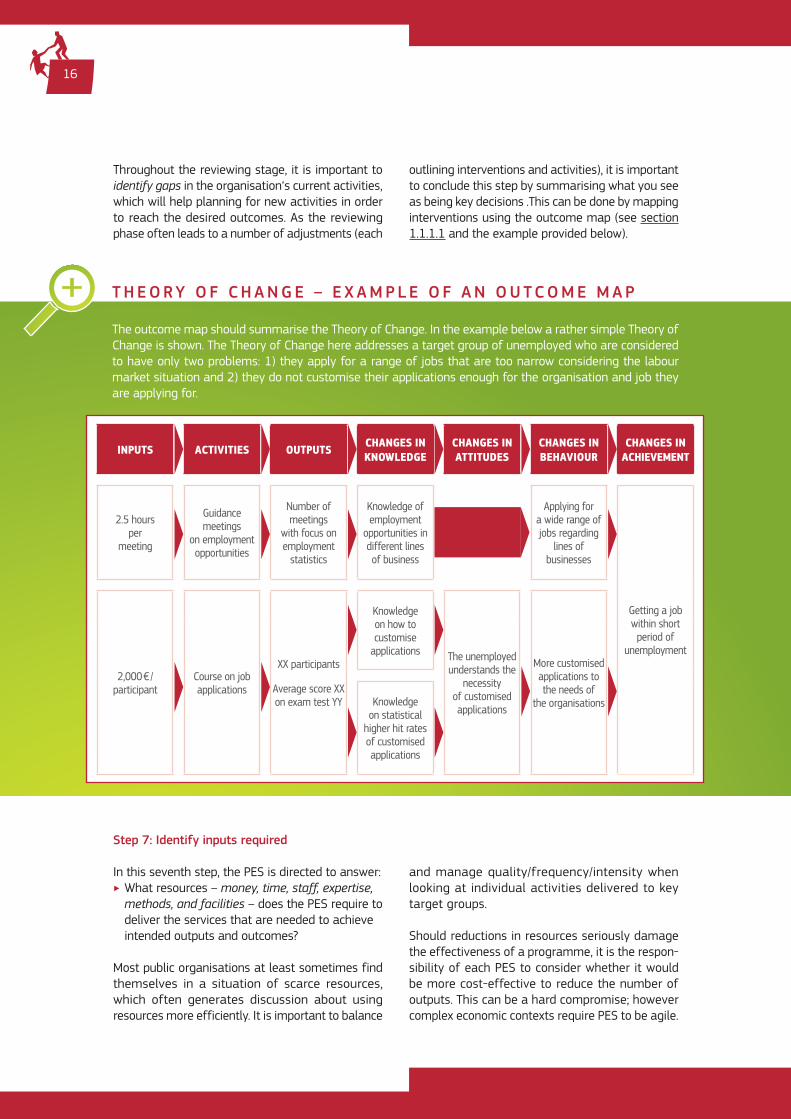
Throughout the reviewing stage, it is important to identify gaps in the organisation‘s current activities, which will help planning for new activities in order to reach the desired outcomes. As the reviewing phase often leads to a number of adjustments (each
outlining interventions and activities), it is important to conclude this step by summarising what you see as being key decisions .This can be done by mapping interventions using the outcome map (see section 1.1.1.1 and the example provided below).
INPUTS ACTIVITIES OUTPUTS CHANGES IN KNOWLEDGE
CHANGES IN ATTITUDES
CHANGES IN BEHAVIOUR
CHANGES IN ACHIEVEMENT
2.5 hours per
meeting
Guidance meetings
on employment opportunities
Number of meetings
with focus on employment
statistics
Knowledge of employment
opportunities in different lines of business
Applying for a wide range of jobs regarding
lines of businesses
Getting a job within short
period of unemployment
2,000 € /participant
Course on job applications
XX participants
Average score XX on exam test YY
Knowledge on how to customise
applications The unemployed understands the
necessity of customisedapplications
More customised applications to the needs of
the organisationsKnowledge on statistical
higher hit rates of customised applications
Step 7: Identify inputs required
In this seventh step, the PES is directed to answer: ‣ What resources – money, time, staff, expertise, methods, and facilities – does the PES require to deliver the services that are needed to achieve intended outputs and outcomes?
Most public organisations at least sometimes find themselves in a situation of scarce resources, which often generates discussion about using resources more efficiently. It is important to balance
and manage quality/frequency/intensity when looking at individual activities delivered to key target groups.
Should reductions in resources seriously damage the effectiveness of a programme, it is the respon-sibility of each PES to consider whether it would be more cost-effective to reduce the number of outputs. This can be a hard compromise; however complex economic contexts require PES to be agile.
T H E O RY O F C H A N G E – E X A M P L E O F A N O U TC O M E M A P
16
The outcome map should summarise the Theory of Change. In the example below a rather simple Theory of Change is shown. The Theory of Change here addresses a target group of unemployed who are considered to have only two problems: 1) they apply for a range of jobs that are too narrow considering the labour market situation and 2) they do not customise their applications enough for the organisation and job they are applying for.

Step 8: Define the key indicators
The outcomes defined in step 4 of this process should be measured and monitored as part of your work, link directly to the efforts of the services the PES delivers, and serve as the basis for account-ability. In order to do so, the PES selects indicators (see next section on selecting indicators). As such, the Theory of Change ends with/leads into, the process of defining key indicators.
1.1.2 Selecting and testing indicators
Once the Theory of Change is established, it has to be made measurable. Without it, it is not possible to track performance against the Theory of Change, and thus it is not possible to adjust/correct interventions. To this end, indicators are a pre-requisite.
1.1.2.1 What is an indicator?
An indicator is a quantitative variable which is a sim-ple and trustworthy tool with which to measure the results, that is to say the products or changes that derive from the intervention.
INDICATORS (TYPES) DESCRIPTION EXAMPLES OF INDICATORS
Input Measure the use of resources Time (hours) Staff competencies
Output Measure the use of resources Career counselling Work practice
Outcome Measure the result from activity Work-related self-efficacy Social skills Work skills Personal skills Entry to employment Sustainable income
Process or quality Measure the short-term – and intermediate outcome
Relevant and competent Individual Action Plans Satisfaction of jobseekers Positive client-case manager relationship
PRACTITIONER’S TOOLKIT
17
The table below outlines a few examples of indicators, by type:
Table 1.1 Indicators, by type (examples)
The box below from Estonia describes an example of a ‘quality-related’ indicator that was introduced in order to improve the quality of Individual Action Plans for jobseekers.

TO O L B O X – R A C E R
E X A M P L E
18
Interesting example: internal quality assurance in the Estonian PES
The Estonian PES (the Estonian Unemployment Insurance Fund) assesses Individual Action Plans (IAP) twice a year to ensure that the plans take into account the needs of the jobseeker and outline relevant support measures. The IAPs are drawn up by the job counsellor and the jobseeker and contain a plan of actions and measures to help jobseekers find suitable employment.
The methodology to assess the quality of IAPs was developed in 2010 because the PES noticed that IAPs were missing background information and that actions were inconsistent. An internal team (consisting of specialists on work-focussed counselling and previous job counsellors) reviews a random sample size of 130 IAPs in total from all regional offices along the following criteria: ‣ accuracy and consistency of information about the jobseeker ‣ coherence of the individual’s opportunities and obstacles to finding employment ‣ relevance of agreed actions ‣ progress reporting, analysis of results ‣ record of appointments and other relevant information ‣ relevance of the services and ALMP measures to the needs of the jobseeker.
The IAPs are assessed within these criteria on a 4-point scale. The average score of IAPs per region and for the whole organisation is used as one of five ‘quality-related’ key performance indicators, together with 13 ‘outcome’ indicators and 30 ‘output’ indicators.
A full PES Practice of this example is available via the PES Practice Repository.
1.1.2.2 How do you choose an indicator?
You will have a wide range of indicators to choose from, ranging from the straightforward to the com-plex, from the purely quantitative to the highly quali-tative kind. In theory, choosing the ‘right’ indicator means making this choice as objective as possible. In practice, a useful way to achieve this is to subject each indicator to a test of validity and reliability. The box below outlines a helpful tool to that effect.
What is RACER? RACER stands for five sequential criteria, which, when applied to indicators, help to test how valid and reliable these will be for future performance management use:
Relevant = closely linked to the objectives to be reached
Accepted = by staff, stakeholders, and other users
Credible = accessible to non-experts, unambiguous and easy to interpret
Easy = feasible to monitor and collect data at reasonable cost
Robust = not easily manipulated
In reality, the ‘perfect’ indicator is often not an option, i.e. few indicators will be entirely relevant, fully accepted, 100 % credible etc. Therefore, trade-offs between the five criteria take place, which can be done in a structured and informed way in order to determine which indicators are chosen (stay) or are set aside (i.e. do not stand the RACER test).

RELEVANT ACCEPTED CREDIBLE EASY ROBUST AVERAGE
Based on survey answer by unemployed 4 5 3 3 2 3.4
Based on monitoring locations of jobs applied 5 5 4 1 4 3.8
Based on scoring of job counsellor 4 4 4 2 4 3.6
PRACTITIONER’S TOOLKIT
19
Table 1.2 RACER-testing alternative indicators for ‘Attitudes towards applying for distant jobs’
A helpful way to undertake this exercise, is to list the different indicator ‘candidates’, and score them against each RACER-criteria on a specified scale.
The example below illustrates this process using a 5 point scale, with 1 being Low and 5 being High.
You can then use the average score as a start-ing point for choosing the most relevant indicator for your organisation. However, using the highest average score as the only guide is not always the best way forward. In fact in most cases, the choice requires judgement based on the relative and comparative importance of each RACER criteria for a given indicator. For some indicators, one or the other criteria might carry more weight, and this needs to from part of the discussion across the organisation.
In the above example the indicator based on moni-toring locations of the jobs applied has the highest average score – however, it is also the hardest to monitor if you don’t have a database containing the appropriate relevant information. So the discussion here would be: Is it feasible to establish and operate such a database?
1.1.3 Key considerations when choosing indicators
Linked to the sections above, a short summary of key considerations is presented here in relation to choos-ing a suitable mix of indicators for your organisation:
1.1.3.1 Who should be involved in choosing?
It is crucial that you identify the most important stakeholders to be included at a suitable stage – and that you engage them in the process.
For example, you can decide who to include on the basis of a short stakeholder analysis. Such an analysis helps you to explore a stakeholder’s priority for you and the decision-making process, as you consider (in a matrix or a scale):
1. Their knowledge of the target group and methodology. 2. Their interests in the decisions made and/or the
impact that the decision will have on them.
Getting the right stakeholders involved helps to align perceptions and expectations and creates ownership. However, the number of participants around the table should also be kept at a reasonable level in order to maintain efficient decision-making.
1.1.3.2 How many indicators do we need?
There is often a trade-off in deciding upon the number of indicators.
On one hand, settling for a smaller number of indicators (i.e. focusing on Key Performance Indicators) is seen as cost-effective in terms of subsequent data collection, and focusing on fewer indicators makes it easier to communicate top priorities across the organisation.
However, choosing too few indicators can reduce the possibilities to identify why performance is changing. Here it is often necessary to explain performance vari-ation due to implementation issues or because targets have been designed upon false premises (i.e. in the Theory of Change). In order to do this you also need output indicators. This is especially important when a number of activities are aimed at the same target group in order to learn which should be adjusted or further studied. If you want to monitor cost-effective-ness, you also need to define input indicators.
If you choose more than a few key performance indi-cators you should carefully consider which results to include in performance reports targeted at different audiences. With too many tables and charts many audi-ences will find the report too complex and confusing.

E X A M P L E
20
Assessing progression factors
In Denmark 10 Danish job-centres worked with researchers and ‘Væksthuset’ (a social enterprise working with vulnerable unemployed) on an Employment Indicator Project (BIP ‘BeskæftigelsesIndikatorProjektet’). The project is a research based investigation of what works in assisting the vulnerable unemployed in getting a job. The unemployed in the target group have typically complex problems on top of unemployment, e.g. health issues, social problems and limited education. The project started in 2011 and is planned to end in 2016.
BIP has analysed the progression of vulnerable unemployed on 11 indicators which partly cover self-assessments of their own capabilities, orientations and beliefs, and partly the professional assessments of case workers regarding the situation of the unemployed.
The project has demonstrated that it is possible to predict the likelihood of vulnerable unemployed getting a job with the help of 11 indicators. The following six indicators are especially significant: ‣ Mastering of health issues. ‣ Knowledge of the unemployed on how to improve the likelihood of getting a job. ‣ Belief of the unemployed that he/she is capable of managing a job. ‣ A realistic expectation of the unemployed regarding wage levels. ‣ Assessment of the case worker that the unemployed is determined to get a job. ‣ Belief of the case worker that it is possible for the unemployed to get a job.
The project also demonstrated 6 types of interventions which are the most effective in driving progress regarding the significant indicators above. The most effective types of intervention are: ‣ Working arrangements as company trainees (‘virksomhedspraktik’). ‣ Wage subsidy jobs. ‣ Temporary work. ‣ Interventions regarding health issues. ‣ Diagnosing and treatment. ‣ Vocational training.
The analysis also shows that the most effective channels for job seeking have been working as a trainee, job seeking through a temporary employment agencyand unsolicited applications. On the other hand responding to job advertisements in newspapers and on the Internet as well as networking have not been effective for the vulnerable unemployed covered by the project. Source: www.jobindikator.dk/
Empowerment and progression factors
The Danish (The Danish Agency for Labour Market and Recruitment) PES strategy also incorporates progres-sion towards employment. In a project aiming at empowering unemployed, empowerment is defined as ‘the ability to gain control over and take responsibility for one’s own life and situation,’ a new tool to monitor progression towards employment.
In 30 Danish municipalities long-term uninsured unemployed are offered empowerment-interventions and access to the tool. The aim is to expand the tool to all municipalities in the future. During the two-year project period the municipalities have measured the progression of participants towards employment using an interactive questionnaire. Participants place a smiley within different domains, such as social network, mental and physical health, and cognitive skills. They can further elaborate on their valuation by answering more questions within each domain. Participants fill out the questionnaire on a regular basis. The evaluation of the project finishes in 2016. The evaluation has two objectives, namely i) estimating the effect of empowerment on employment and ii) assessing the correlations between the different progression domains and employment. Source: http://star.dk/da/Viden-og-analyse/Hvad-virker-i-beskaeftigelsesindsatsen/Videnspiloter/Empowerment-projekt-for-unge-og-voksne.aspx
Interesting example: monitoring vulnerable unemployed in Denmark

TO O L B O X – B E I N G S M A R T TO S E T TA R G E T S
PRACTITIONER’S TOOLKIT
21
1.2 Setting targets
This section focuses on selecting and reviewing tar-gets. Good targets ensure that everyone understands the ambition that is expected from them (or the PES in its entities or entirety), and understands the milestones or benchmarks to reach.
Once you have formulated your Theory of Change (see above section 1.1.1) and defined your indicators, you have a platform to set your targets. As defined in section 1, targets are the expected or predicted success level of an individual (target group, staff member or manager) or the organisation (PES) as a whole. In other words:
What specific results should each staff member and manager realise in order to help the target group succeed? ‣ Your indicators tell you what to measure. ‣ Your targets tell you in specific and measurable terms what you need to accomplish.
For example: ‣ An indicator for ‘reduction of unemployment period for a specific target group (for example people with mental health problems)’.
‣ Can have a target ‘that the total amount of people in the target group with more than 13 weeks of unemployment is reduced by 50 % by no later than 31 December 2016’.
1.2.1 Setting robust targets
To help setting robust targets, a widely used method used in organisations is the SMART-tool, which is described here.
SMART is an acronym for:
‣ Specific
‣ Measurable
‣ Attainable
‣ Realistic
‣ Timely
You should apply these criteria for each target you are setting – you can use these as a ‘test’.
Specific: Specific means that the target is clear and unambiguous; it is therefore not vague, unclear or general. To make targets specific, they must tell you or your team (in their formulation) what is expected, why it is important, who is involved, where it is going to happen and which attributes are important. A specific target has a greater chance of being accomplished than a general target. In setting a specific target you should be able answer the six ‘W’ questions:
‣ Who: Who is involved? (target group from your Theory of Change)
‣ What: What do I want to accomplish? (look at the stated results and outcomes in your Theory of Change)
‣ Where: Identify a location (where is the service delivered?)
‣ When: Establish a time frame
‣ Which: Identify requirements and constraints
‣ Why: Reasons, purpose or benefits of accomplishing the target
Measurable: Here, you establish concrete criteria to measure progress toward reaching each target. When you measure progress, you stay on track, reach your target dates, and experience the achievements that encourage you to continue working towards your final target. To determine if your target is measurable, questions such as these are helpful:
‣ How much?
‣ How many?
‣ How will I know when it is accomplished? What are the milestones I can expect?
Answering these will help you to set a measureable target.
Attainable or agreed: When you identify and prioritise targets, you begin to imagine how they become true/realised. You develop the motivation, abilities, skills, and financial capacity to reach them. You therefore consider what it will take to achieve these targets. Targets are more achievable when the organisation plans the steps towards their achievement and establishes a timeframe in which these will take place.
An achievable target will therefore answer the question ‘How?’:
‣ How can the target be accomplished?
‣ How realistic is the target based on other constraints?
1.2.2 Top down vs bottom up
There at least two ways to formulate targets and perform SMART tests, in order to ensure robust targets are set: the top down or the bottom up approach. A key aspect of making that choice is to determine the level of stakeholder involvement you require.
1.2.2.1 Top down
In a top down process, members from the executive leadership and the management team are driving the target setting process.
Here, it is useful to have a process facilitator (either a person from an internal function or an external consultant trained in performance management) to facilitate the process of bringing management together using the SMART criteria (and questions stated in the box above). The management team should be informed by analysis from the target groups in terms of, such as on questions regarding: What tar-get groups? How many? What are the consequences of setting different targets, financially and in terms of results and outcomes in the Change of Theory? An analyst could therefore also attend the meetings.
A facilitator helps the management team to select a number of indicators to focus on (see chapter on ‘Defining indicators’ in 1.1.1.1). For each indicator, the management team decides what targets to set. Then the SMART test is performed.
Outputs from the meeting should be a list of targets and a short description of why the management team has decided upon these targets. This will help communicate the targets to the wider organisation.
The management team should communicate the targets in writing and orally (where this is possible, depending on the size of your organisation), making sure targets make sense to regional and/or local departments and staff that will be responsible for achieving these.
Management should also communicate why targets are important (what benefits do they accomplish?) and how management will help staff to reach the targets. Ideally, the management team should offer to create a feedback loop to allow designated members of staff to inform them how targets are perceived by staff. Furthermore, the management team should follow-up on the targets frequently,
TO O L B O X – B E I N G S M A R T TO S E T TA R G E T S
22
Find out if the organisation prioritises, or is planning to, initiatives to gain better results and examine what you can expect of these. This will give you an insight into the attainability of targets.
The targets should also be agreed with stakeholders, where buy-in from them is desirable. Decide whether the process of setting targets should be a top-down or a bottom-up process (or a mix) – more about this is described in section 1.2.2 below.
Realistic: To be realistic, targets must represent an objective towards which you, as an organisation and/or as a professional (and your target group), are both willing and able to work. A target can be both ambitious and realistic, these are not mutually exclusive. You can use an analytical approach to make targets realistic, for example by discussing and answering the following questions:
‣ What are the labour market conditions that affect performance, in comparison to the past and in comparison to other parts of the country?
‣ How many funds do we have to do this? Have we access to additional funds or are savings required? What is the context for this target now, and in the foreseeable future?
‣ What is best practice when we compare the results of different local departments?
Timely: Finally, a target should be grounded in a precise timeframe. Without a timeframe, there is no urgency and you will not know when to follow up. Targets have to be delivered in a timely manner and this should be specified for each.

in terms of: Are they met? Why? Why not? What can management do to help staff accomplish these targets? You will find tools on the follow-up process in section 2.2 on ‘Reviewing and using data’.
1.2.2.2 Bottom up
A bottom up process brings together a verti-cally integrated team.
This team usually consists of representatives from the executive leadership, mid-level management and a range of frontline staff from regional and/or local departments. It can also include an analyst and a process consultant to facilitate the process.
This team goes through the following steps:
1) Decision on which indicators to focus on.
2) Using SMART criteria to set targets and analyse the situation (similar to the top-down process).
3) Each person (manager and staff) test the targets in their regional/local department.
4) The vertically integrated team meets again and adjusts the targets on the basis of feedback from their departments.
The output from this process should be the same as with the top-down process, only this time manage-ment clarify that the targets have been set through a bottom-up process involving local staff.
The main benefit of this approach is the early buy-in that can be generated by involving non-management staff from the beginning in the choice, the testing and the communication.
E X A M P L E
PRACTITIONER’S TOOLKIT
23
The Estonian PES sets targets once a year, based on local labour market forecasts and negotiations between the central office and regional offices. The Estonian case mixes a top-down and a bottom-up approach to target setting: target levels are suggested from the top-down, but they are discussed between regional offices and the central office before an agreement is made. This is summarised below:
Setting target levels every autumn
‣ Previous trend of the results ‣ (Local) labour market forecasts ‣ Differences in the local labour markets ‣ Challenge level ‣ Initial target levels suggested by the regional offices or by the central office depending on specific indicators
‣ All the target levels are discussed and agreed upon between the regional offices and the central office
Interesting example: the annual cycle in Estonia

1.3 Assessing PES performance
A critical question for many PES concerns perfor-mance assessment (and especially comparisons). While these should be made on an equal basis, labour market conditions often vary over time and between ‘units’.
Here, two strategies to take labour market conditions into account are presented: 1. Statistical approaches 2. Assessing PES performance based on negotiated
targets and holistic approaches
1.3.1 Statistical approaches to assessing performance
With statistical approaches, it is possible to compare the performance of different units taking different labour market conditions into consideration.
The statistical approach is most useful when: ‣ Comparing results to set performance targets. ‣ Comparing results to performance in other units. ‣ Analysing developments in performance over a period of time.
The (PES) organisation needs to define the start-ing point (the baseline). Sometimes, the clearest
TO O L B O X – K E Y C O N S I D E R AT I O N S
24
1.2.3 Key considerations
Key questions : ‣ What targets do we set in order to guide us towards the results and outcomes we want to deliver
for our target groups?
‣ What is the right number of targets? They should cover key outcomes but there should not be too many.
‣ Do the targets cover local differences? How are targets broken down to meet local differences?
‣ Do targets meet the ambitions of each regional /local department?
‣ Do targets foster perverse incentives? Follow-up to make sure that value is being delivered to all targets groups, since a narrow focus on too few targets and target groups can take the focus away from others.
‣ Should targets be set in a top-down or a bottom-up process?
Top down : ‣ Pro: efficient and strong connection to policy and strategic goals.
‣ Con: staff might not buy into the targets.
Bottom up: ‣ Pro: staff buy-in.
‣ Con: takes time and makes it difficult to discard targets once staff have decided on them.
Note that whether you choose a top-down or a bottom up process, dialogue should always be at the centre of the exercise. In a top down process, you still need at some point to have involved staff and regional/local departments in the process of target testing.
Linked to the sections above, a short summary of key considerations is presented here in relation to setting targets for your organisation. It also helps
to reflect on strengths/weaknesses of different types of processes.

results are achieved by combining different methods. Regardless of the approach, statistical tools are relevant.
A major challenge is that of assessing results within framework conditions. This is a challenge both in time series analysis (as conditions can change over time) and when drawing comparisons across units
subject to different conditions. There are different ways to go about this.
1.3.1.1 Examples – the cluster approach
The cluster approach is particularly suited for draw-ing comparisons across units. The examples from Denmark and Germany below illustrate this approach:
E X A M P L E
PRACTITIONER’S TOOLKIT
25
Interesting example 1: clustering of municipalities and jobcentres in Denmark
The Danish Agency for Labour Market and Recruitment developed the Internet portal, ‘jobindsats.dk’ on the basis of statistical information on employment policies at local, regional and national levels. The portal is open to the public and contains information on the number of unemployed, unemployment benefits and activities to help the unemployed into a job.
The portal enables benchmarking the implementation of reform, in relation to outputs and outcomes, both in time series and comparisons between jobcentres and regions. The database contains sufficiently detailed information to investigate why some jobcentres perform better than others.
Labour market conditions vary among municipalities in Denmark, and it is important to understand these conditions when assessing the performance of a jobcentre. Therefore, the portal has a feature that enables local jobcentres to compare performance to jobcentres with similar labour market conditions. To that effect, the 98 municipalities in Denmark are segmented (by researchers) into 5-7 clusters of similar conditions for integrating the unemployed into the labour market.
The cluster analysis calculates expected results for municipalities and jobcentres, based on a number of explanatory variables: ‣ Age ‣ Family types in relation to marital status, cohabitation and children ‣ Teenage parenting ‣ Education and education of parents and partners ‣ Country of origin ‣ Number of years in Denmark for immigrants ‣ Years of working experience ‣ Housing, e.g. social/public housing ‣ The status of newcomers in relation to benefits ‣ Use of medicine and health benefits ‣ Periods of hospitalisation ‣ Unemployment rate in the area of commuting ‣ Number of employed in jobs requiring low skills ‣ Share of workforce in the municipality between 50 – 69 years
The cluster analysis is done for each of the five benefit categories (unemployment benefits, social security, sickness benefits, permanent benefits and all-benefits), as conditions vary from category to category – even though there is some correlation between the categories It is necessary to repeat the cluster analysis as conditions for municipalities and jobcentres change over time.
Besides comparing municipalities and jobcentres with similar conditions, the portal also enables comparison at national and municipal level and of jobcentres within the same region.

E X A M P L E
26
In the Danish example, clusters can contain munici-palities that are very different in e.g. size and urban density, but they share the same level of expected results according to an advanced statistical model. An example of this is Copenhagen (on some dimen-sions) when compared to its peripheral areas, where
clustering is meaningful from a statistical but not intuitive perspective.
On a similar note, the German example of clustering, offers further insights below.
Interesting example 2: clustering in Germany
The German approach is similar to that of Denmark. However, an important difference is that the results are further segmented, so that classifications are based on factors such as urban density, level of unemployment and level of seasonal labour market variation.
1 Bochum
2 Dortmund
3 Duisburg
4 Düsseldorf
5 Essen
6 Gelsenkirchen
7 Mettmann
8 Oberhausen
9 Solingen/Wuppertal
( ) Number of districts in each type. Source: Statistics department of the Federal Employment Agency © IAB 2013
Type I (5): Predominantly metropolitan districts with favourable labour market conditions
Type IIa (6): Metropolitan districts with above average unemployment rates
Type IIb (11): Metropolitan districts with very high unemployment rates
Type IIc (8): Urbanised districts with slightly above average unemployment rates
Type IIIa (25): Districts with conurbational features with below average unemployment rates
Type IIIb (14): Predominantly rural districts with average unemployment rates
Type IVa (21): Districts with conurbational features with a large manufacturing sector and favourable labour market conditions
Type IVb (22): Predominantly rural districts with favourable labour market conditions and strong seasonal dynamics
Type IVc (7): Rural districts with very strong seasonal dynamics and low unemployment rates
Type Va (7): Predominantly metropolitan districts with high unemployment rates
Type Vb (11): Predominantly rural districts with high unemployment rates
Type Vc (17): Rural districts with very severe labour market conditions
PRACTITIONER’S TOOLKIT
27
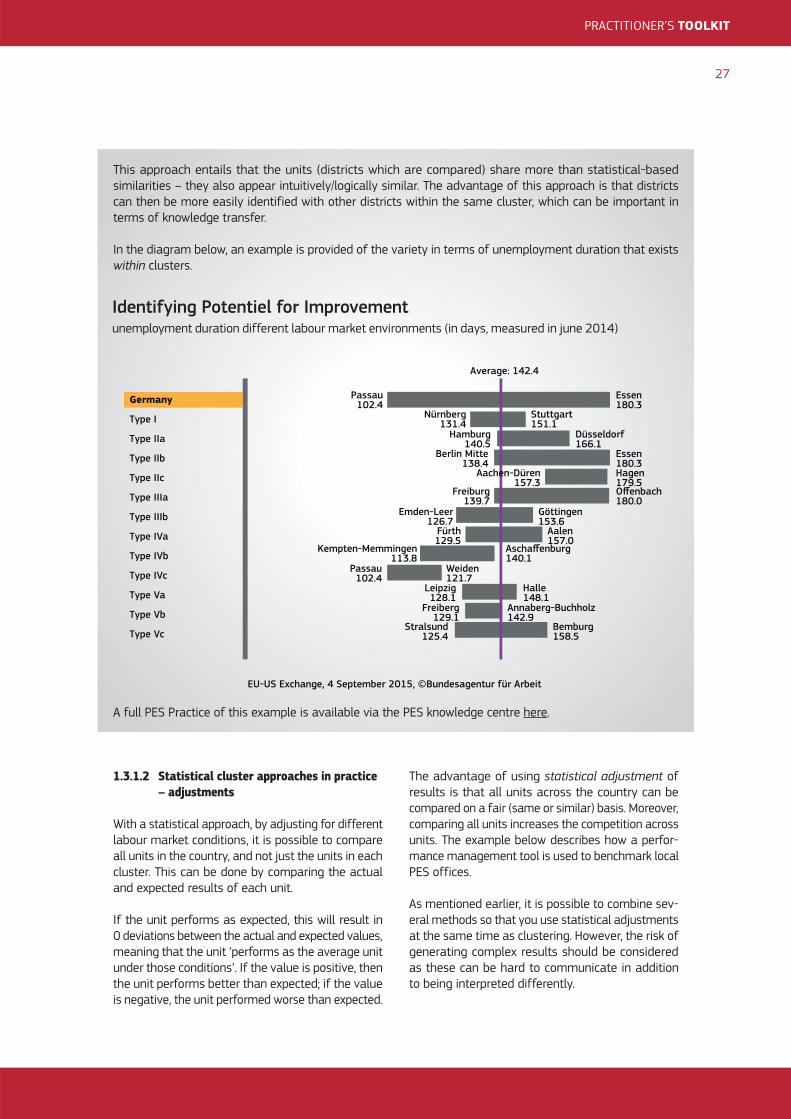
This approach entails that the units (districts which are compared) share more than statistical-based similarities – they also appear intuitively/logically similar. The advantage of this approach is that districts can then be more easily identified with other districts within the same cluster, which can be important in terms of knowledge transfer.
In the diagram below, an example is provided of the variety in terms of unemployment duration that exists within clusters.
1.3.1.2 Statistical cluster approaches in practice – adjustments
With a statistical approach, by adjusting for different labour market conditions, it is possible to compare all units in the country, and not just the units in each cluster. This can be done by comparing the actual and expected results of each unit.
If the unit performs as expected, this will result in 0 deviations between the actual and expected values, meaning that the unit ‘performs as the average unit under those conditions’. If the value is positive, then the unit performs better than expected; if the value is negative, the unit performed worse than expected.
A full PES Practice of this example is available via the PES knowledge centre here.
Identifying Potentiel for Improvementunemployment duration different labour market environments(in days, measured in june 2014)
EU-US Exchange, 4 September 2015, ©Bundesagentur für Arbeit
Germany
Type I
Type IIa
Type IIb
Type IIc
Type IIIa
Type IIIb
Type IVa
Type IVb
Type IVc
Type Va
Type Vb
Type Vc
Average: 142.4
Passau102.4
Essen180.3
Nürnberg131.4
Stuttgart151.1
Hamburg140.5
Düsseldorf166.1
Berlin Mitte138.4
Essen180.3Hagen179.5
Freiburg139.7
Offenbach180.0
Emden-Leer126.7
Göttingen153.6
Fürth129.5
Aalen157.0
Kempten-Memmingen113.8
Aschaffenburg140.1
Passau102.4
Weiden121.7
Leipzig128.1
Halle148.1
Freiberg129.1
Annaberg-Buchholz142.9
Stralsund125.4
Bemburg158.5
Aachen-Düren157.3
The advantage of using statistical adjustment of results is that all units across the country can be compared on a fair (same or similar) basis. Moreover, comparing all units increases the competition across units. The example below describes how a perfor-mance management tool is used to benchmark local PES offices.
As mentioned earlier, it is possible to combine sev-eral methods so that you use statistical adjustments at the same time as clustering. However, the risk of generating complex results should be considered as these can be hard to communicate in addition to being interpreted differently.
Identifying Potentiel for Improvementunemployment duration different labour market environments (in days, measured in june 2014)
E X A M P L E
28
Interesting example: the Balanced Scorecard to compare local offices in Austria
In the Austrian PES (AMS) the Balanced Scorecard (BSC) aims for an objective comparison of local PES offices and regions in terms of their performance. This performance tool addresses many aspects of PES performance. 25 indicators cover a variety of quantitative outcomes, process and quality oriented targets such as reintegration rate of active measures, services to employers, call centre services, and management processes. The BSC is weighted to take account of key resource dimensions, including staffing and budgets, and different local situations.
The tool is used to benchmark the performance of the 100 local PES offices. The performance of an office is measured using different methods: calculation of office specific ‘expectation-result’, benchmarking across two different types of ‘office-clusters’, fixed reference figures for all offices. The BSC is a self-steering instru-ment but also a tool for the federal office and regional branches to monitor local offices. In that way, low and high performers within one cluster are identified and encouraged to share knowledge on performance improvement.
However, using statistical adjustments also requires a strong statistical model that is a good fit at all ends of the scale. Indeed, results can be seen as less intuitive because they compare units subject to very dif-ferent conditions.
A full PES Practice of this example is available via the PES Practice Repository.
1.3.2 Holistic approaches to assessing performance
Another way of assessing performance is to use a holistic approach. This is particularly relevant where there is a high level of uncertainty regarding expected performance. The uncertainty can be due to limited experience or evidence-based knowledge of the target groups, and/or the interventions designed.
P R A C T I C A L T I P – W H AT TO C O N S I D E R I N S TAT I S T I C A L M O D E L S ?
Statistical models are value neutral ways of making performance comparisons between units. However, it can take many resources to develop and maintain a model that has a sufficiently good fit and which is accepted and owned by important stakeholders. Two issues should be considered:
Is the model good enough?
In order to ensure qualified and fair comparisons, the model needs to be based on high quality data, capturing the most relevant labour market conditions. The model also needs to be advanced enough to handle complex causal relations.
Is the model accepted?
The model needs to be explainable and meaningful for the most important stakeholders. Bear in mind that the model will be judged against the credibility of its results and the qualification of researchers.

TO O L B O X – A P P LY I N G A H O L I S T I C A P P R O A C H TO A S S E S S I N G P E R F O R M A N C E
1.4 Improving effectiveness with PMS
Performance management makes critical informa-tion on performance results available for managers at all levels of the organisation, enabling rational decisions to be made on the priority of resources. If performance information is linked to the budget cycle, the information can also be utilised to improve effectiveness as part of the budget cycle.
This section links performance management to the optimisation of effectiveness and cost-effectiveness – economic performance criteria, which are defined in the box below. This section is mostly relevant for PES with a longer experience of performance management systems.
PRACTITIONER’S TOOLKIT
29
A holistic performance assessment takes place in three steps:
1. Assessing performance in line with the implementation of the Theory of Change
In this part of the assessment, the focus is on implementation. Starting from within the organisation, key questions are: ‘Have the activities been implemented as planned in the Theory of Change?’ and ‘What are the enablers and barriers for implementation?’
Following this, you can move forward and inspect the relationship between the organisation and the external stakeholder (i.e. the unemployed, employers, etc.), asking: ‘Do the results confirm the assumptions of causal effects between activities and outcomes?’
2. Assessing performance in light of surrounding factors
A next step is to contextualise the assessment by studying and interpreting results in light of surrounding factors that can influence results, and which are difficult to integrate into a statistical analysis.
To structure this analysis, you can perform a SLEPT-test, examining how the following factors have influenced the targets:
T he S L E P T - Tes t ‣ Social factors include the cultural aspects and
health consciousness, population growth rate, age distribution, career attitudes and emphasis on safety. High trends in social factors affect the demand for services and how PES operates. For example, an ageing population or increase in integration may impact on services – and targets.
‣ Legal factors are changes in law that can affect how a PES operates and its targets, what to focus on, what is possible to do etc.
‣ Economic factors include changes in the economic situation of the country (national, regional and local) as well as EU etc., for example economic growth or structural unemployment etc. that will affect the targets of the PES.
‣ Political factors are the degree to which the government intervenes in the economy. Specifically, political factors include areas including tax policy or labour law which affect what PES need to focus on.
‣ Technological factors could affect how PES operate for example in relation to information technology (collecting and analysing data etc.).
3. Identifying ways to improve performance
While external factors should be recognised, it is also important to work consistently towards optimising outputs from interventions within given framework conditions. It is therefore important to discuss possible ways to improve performance as a third step in holistic performance assessments. The following questions are relevant here:
‣ Are there ways to work around the identified problems?
‣ What can be learned from practice in other organisations?
Traditionally, public managers have primarily been held financially accountable for ensuring:
1. That the spending level is kept within the budget, and
2. That there is a sound legal basis for expenditure.
Note that none of these criteria relate to the effectiveness or cost-effectiveness of public pro-grammes. As much linking programme budgeting with performance and performance audits has been promoted more recently, not enough attention is paid to outputs.
Therefore, effectiveness and cost-effectiveness can be enhanced by rethinking the budget system and the budget planning process, so as to reflect the five economic performance criteria. That way, outcomes are considered more closely in relation to costs.
However, this in turn requires that performance man-agement systems are integrated into the budget cycle – which the tip box here summarises. Each of these steps are detailed further below in section 1.4.1 to 1.4.3.
The toolkit describes possible initiatives to improve performance-based budgeting1. The following sections outline how effectiveness can be improved with PMS through the three key stages of a budget cycle.
1 The sections on performance-based budgeting are inspired by Marc Robinson and Duncan Last (2009): A Basic Model of Performance-Based Budgeting. Technical Notes and Manuals. IMF and by Christopher Pollitt (2001): Integrating Financial Management and Performance Management, OECD.
P R A C T I C A L T I P – I N T E G R AT I N G P E R F O R M A N C E M A N A G E M E N T S Y S T E M S I N TO T H E B U D G E T C YC L E
TO O L B O X – F I V E E C O N O M I C P E R F O R M A N C E C R I T E R I A – A S A B A S I S TO I M P R OV I N G E F F E C T I V E N E S S W I T H P M S
30
‣ Economy-criteria: Are project inputs being purchased at the right price? Could different kinds of resources be purchased more cheaply? Should the tasks be undertaken internally or externally? (This criterion is not in itself a performance criterion, but it clearly affects the business e.g. in terms of efficiency, cost-effectiveness and cost-benefit).
‣ Efficiency-criteria: What is the relationship between investment in inputs and the outputs that are produced? This could e.g. be ‘average costs per training programme per individual participant’.
‣ Effectiveness-criteria: Are outputs leading to expected outcomes? An example could be ‘share of people who are employed 3 months after finishing training’.
‣ Cost-effectiveness-criteria: What is the cost per effective intervention? This could compare the number of people employed after training relative to the cost of providing training. Costs should include the costs of those who are still unemployed 3 months after finishing training.
‣ Cost-benefit-criteria: Are the monetary benefits exceeding the costs? This is the most advanced criteria as it requires you to apply a monetary value to the outcomes that you have generated.
Planning budgets
1. Systematic scrutiny of new spending proposals
2. Information on efficiency and effectiveness
3. Adjustment of funds to performance targets
Running budgets
4. A criteria for ‘keeping within budgets’ should include performance targets
5. Ensure flexibility for management of outcomes
Evaluating programmes
6. Evaluating programmes to improve effectiveness

1.4.1 Before: planning budgets
In the planning phase there are three preconditions that help to initiate a performance-informed budget.
1. There should be systematic scrutiny of new spending proposals
When considering new spending proposals it is important to investigate:
1. How they support the strategic objectives regarding outcomes and impact, and
2. What results could be expected based on evi-dence from research?
A way to handle the risks associated with the uncertainties of new programmes is to start with a small scale pilot project and to use the results to decide if the project should then be implemented on a larger scale.
2. Information should be provided to decision-makers on the efficiency and effectiveness of existing programmes
It is important to provide data on past performance of programmes. This could be based on the economic performance criteria relating to effectiveness and cost (see earlier Box).
However, we have also learned that processes should be designed where decision-makers are able to consider data. This often requires modifications to the traditional budget and planning processes. For example, it is useful to include a strategic phase early in the budget cycle, which looks at broader strategic and expenditure priorities.
3. Performance targets for outputs and out-comes should reflect the level of funds allocated to the programme
When considering different levels of funding, their consequences for expected outputs and outcomes should be assessed. This assessment should be addressed by decision-makers at a relevant stage in the process.
If expenditure prioritisation is to be improved, gov-ernments need the capacity to reduce staffing in low-priority or ineffective programme areas. Yet some countries even have limited possibilities to re-deploy their PES staff.
1.4.2 During: running budgets
Effectiveness requires that strategic and operational decisions are based upon maximising cost-effec-tiveness with a focus on outcomes, as well as costs.
Two prerequisites are needed to support this:
4. Criteria for ‘keeping within budgets’ should include performance targets
In public organisations it is often stressed that public managers should keep expenditures within budgets. When adopting a performance-based budgeting approach, it is equally important that managers are evaluated against criteria which stress that outputs and outcomes are integral to keeping within budgets.
Management decisions should contribute to meeting the five economic performance criteria, however these should not be built into the continuous per-formance information system as this would too complex.
5. Ensure flexibility to manage for outcomes
Managing for outcomes requires managers to have a degree of autonomy in making decisions with regard to inputs, processes and outputs in order to optimise outcomes. Therefore, you should consider whether instructions in the organisation are too tightly defined and therefore hinder managements’ autonomy to maximise outcomes.
The take-up of programme budgeting has increased management autonomy in many public organisa-tions, but it is still often combined with certain restrictions on inputs. These restrictions can be necessary vis-à-vis long-term expenditure man-agement and the prevention of corruption. However, you should consider whether some restrictions are excessive and therefore hinder the optimisation of outcomes.
1.4.3 After: evaluating programmes
In order to ensure that budgeting and financial management support the management of out-comes, it is important that review processes embrace both expenditures and outcomes. This can be done by developing review processes that focus on the economic performance criteria described in the earlier box.
P R A C T I C A L T I P – I N T E G R AT I N G P E R F O R M A N C E M A N A G E M E N T S Y S T E M S I N TO T H E B U D G E T C YC L E
PRACTITIONER’S TOOLKIT
31

6. Evaluating programmes to improve effectiveness
A key concern here is to integrate information on per-formance into the financial accounts, so as to stress the link between performance and costs. However, this is not easy to develop: performance information does not always easily fit into financial reports.
One challenge is the time perspective: while expen-ditures are easier to demarcate in real time, some outcomes are longer-term, which means that they are not known until a while after the end of the financial year.
Another challenge is aligning the categories of performance information and financial information.
If, for example, accounting is conducted only in a highly aggregated way, by department – or, alternatively, only by detailed budget ‘lines’ – whereas performance is measured for each (autonomously) managed local service delivery unit, then managers will not be able to obtain reliable costings of their activities. Since efficiency is usually defined as the ratio between resource inputs and measured outputs, a lack of input cost data grouped by activity means that performance data cannot be turned into efficiency data.
1.4.4 Key considerations
Linked to the sections above, a short summary of key considerations is presented here in relation to target setting for your organisation.
TO O L B O X – K E Y C O N S I D E R AT I O N S
32
Key questions: ‣ Performance-based budgeting is a complex task. Does this challenge fit into the governance conditions of the PES?
Or do we first have to handle more basic challenges regarding the execution of budgets, respecting budgetary rules and procedures?
‣ Are the relevant performance measures established so that they can be integrated into the budget and planning cycles?
‣ Does the PES have the necessary capacity to analyse economic performance criteria?
Pros: ‣ Political and strategic decisions can be guided by
analyses that integrate outcome-focus as well as cost-consciousness.
‣ Managers are held accountable for outcomes as well as expenditure.
‣ Managing costs has a high priority in most PES. If this can be linked to outcomes it can raise the awareness of outcomes at all organisational levels.
Cons: ‣ Resistance towards the performance management
system could develop, if data is used to make major decisions without that data being accepted as reliable or valid.
‣ Economic performance analyses are rather complex. They require sufficient resources and staff competences.
1.5 Taking it to the next level
1.5.1 Organising and replacing indicators
Once the performance management system is functioning it is relevant to define an approach for continuous adjustments so that the indicators are regularly reviewed within a defined frequency, e.g. once a year. Over time an indicator can become
less optimal due to changes in registration systems, changed situations in the labour market or changed policy objectives.
Issues to be considered: ‣ Controlling reliability and validity of data. Even though indicators were chosen based on sound considerations, their relevance can change over time e.g. due to changes in

PRACTITIONER’S TOOLKIT
33
IT-systems, changed situations in the labour market, changed laws or changed policy objectives. Therefore, you could define a cycle for reviewing the indicators – e.g. doing the RACER-test once a year.
‣ Pilot testing new ways of data collection. If your indicator is based on new data to be collected, it is recommended to perform pilot tests e.g. before launching new fields in IT-systems. Do the professionals understand the field as intended? How does the field best fit into the actual work flow? What are the professionals’ motivations to use the field? Does the field make sense to all parts of the target group?
1.5.2 Reviewing targets – adjustment cycles?
This section is about aspects of adjustment: adjust-ing ambitions, cycles of adjustment etc.
It will help to answer the question of ‘how can my PES design and then periodically review targets to minimise, and where possible, eliminate perverse incentives?’
Adjustments in targets are often made because changes occur – you might (should?) get more ambitious as you move closer to achieving a target or as you work more effectively, or maybe you realise that you were a little too ambitious (even with SMART) or that you stretched your organisa-tion a little too far.
Regardless of the reasons, the very essence of performance management is to continuously adjust in order to work well and better than before. Adjustment is at the heart of that continuity, as improvements require reviewing your work and your outcomes. This, in turn, implies testing and adjusting your targets periodically. The ‘How To’ box below shows one way to do this.
1.5.3 Advanced forms of performance budgeting
Two suggestions are made below for PES who want to take performance-based budgeting to the next stage: ‣ Applying a purchaser-provider system. ‣ Producing a summary of programme perfor-mance ratings.
These are explained below in turn.
Having a yearly planning cycle of adjustments is a helpful starting point, as illustrated in the figure below.
The yearly cycle drives performance monitoring to be undertaken by target reviews every quarter; overall target levels are reviewed twice a year. In this example, there is also a yearly review of the Theory of Change (here in Q1).
How often you review the cycle is determined by you and your organisation, and you should adapt it to other/connected review cycles where possible and relevant. However, it is accepted that you should at least follow-up and review your targets once a year, so as to make sure that they align with evolving realities and ambitions.
The review a cycle has three components:
‣ Reviewing performance according to targets: This can be done in different ways, which are described in section 1.3 above on ‘Assessing PES performance’.
‣ Reviewing targets: First test the targets using the SMART-criteria. The team then decide what adjustments need to be made.
‣ Reviewing your Theory of Change and indicators: You should also discuss whether targets foster the right incentives at the level of regional/local departments? You can examine local differences in target realisation at specific intervals – and have a local manager explain the differences and how targets affect the staff.
TESTING AND ADJUSTING TARGETS
‣ Reviewing performance
‣ Reviewing performance
‣ Reviewing targets
‣ Reviewing performance
‣ Reviewing performance
‣ Reviewing targets
‣ Reviewing theory of change and indicators
P R A C T I C A L T I P – H OW TO A DJ U S T TA R G E T S
Q4 Q1
Q3 Q2

D E F I N I T I O N S
34
PURCHASER-PROVIDER SYSTEMS – what is it?The contracts between purchasers and providers can be focused on buying outcomes and thereby create incentives for the provider to deliver the outcomes.
There are several ways to do this. One way is the No Cure No Pay-approach (NCNP). Here the provider’s fee is dependent on the success of reaching a target e.g. a citizen is employed within the training period.
However, it is hard to design an incentive system that takes into account all eventualities. Therefore, it is important to supplement incentives with dialogue.
PRODUCTION OF SUMMARY PROGRAMME PERFORMANCE RATINGSStudies on programme performance are often complex to interpret which can be a barrier for high level decision makers with limited time. Therefore it can be relevant to systematically rate programmes.
The most advanced and well-known example of such a system is the U.S. Program Assessment Rating Tool (PART), under which the performance of each and every U. S. federal programme was rated over a five-year period.
PART itself was a survey instrument, developed by the U.S. Office of Management and Budget (OMB) with external advice (see link below). The instrument comprised 25-30 questions divided into four categories: programme purpose and design, strategic planning, programme management, and programme results. Based upon the responses to those questions, programmes were awarded a numerical rating that aligned with a categorical scale of performance ranging from effective, moderately effective, adequate to ineffective.
Efforts to institutionalise the PART into a permanent process failed in Congress during the Obama administration.
On the one hand, PART can be seen as a source of inspiration on how to work systematically with comparing different programmes. On the other hand, the fact that PART was discontinued shows that creating ownership of such instruments can be difficult especially when budget processes are rather politicised.
Source: https://www.whitehouse.gov/sites/default/files/omb/assets/omb/expectmore/

This chapter focuses on tools and practices in relation to operating a performance management system.
Chapter 2 should appeal to PES who already have a PM system in place and who are looking for advice on improving the operationalisation of their systems.
In this chapter information is provided on data reporting (section 2.1), reviewing and using data (section 2.2) and ensuring that the right incentives are developed and put in place (section 2.3).
2.1 Data reporting
Information management allows designated/key stakeholders to easily access relevant, quality, and purposefully presented information so that it fulfils their needs at different levels.
What information is shared, who the key stakehold-ers are and how the information is presented (and through what channels) is down to each PES and the PES’ information policy. These will also determine the repository in which data is stored and made acces-sible. Data warehouses are one of many solutions, though such versatile systems can be expensive. Key features of one example of a data warehouse platform are described below.
Chapter 2. IMPLEMENTING: Operationalising performance management: building and maintaining a robust, efficient and effective system
E X A M P L E
PRACTITIONER’S TOOLKIT
35
Interesting examples: (1) the data warehouse in DenmarkThe Danish Agency for Labour Market and Recruitment administers a data warehouse, allowing public access, through the website jobindsats.dk.
Through the website everyone can obtain information on different types of benefits e.g. unemployment benefits and other allowances. Performance can be compared across different municipalities, jobcentres and regions. As a user, you define your own query and reports, and you can choose among different types of benefits, different activities, public expenses, gender, age and origin. You can also choose reports that are customised to current national policy reforms. Once you have defined a report, you can then export data and set the report as a ‘favourite’ for future reference. In Denmark, municipalities are clustered into groups in order to benchmark performance across munici-palities that share similar labour market conditions. The data warehouse also provides information by clusters, which allows for a comparison across municipalities. Data for the PES Data Warehouse (DSDW) comes from many sources. The main sources are registrations made by the local municipalities, unemployment funds, Danish Immigration Service (residence permits), the Danish Ministry of Taxation (income), the Ministry of Higher Education and Science (education for people under the age of 30), and CPR (social security number).
36
DSDW consists of five layers to process data:
1. Source Data. Data from the various sources is loaded and filed as a copy.2. Staging. Data is validated and transformed to SAS-datasets (Data is received in many forms – excel,
csv, text etc.).3. Detail Data Store (DDS). In this layer data is updated and if necessary merged with earlier uploaded
data. This is relevant if data is delivered as a delta load. Data delivered as full-load will be replaced. Before saving data, the social security number is transformed to IDs.
4. Data Mart Staging Area (DMSA). Here the following take place:a) Data is made uniform regarding name and contents.b) The content of data is enriched, I.e. calculations between deferent variables is carried out if
necessary.c) Data from different sources are merged.
5. Data Marts (DM). In this layer Data Marts is formed from the data processed in the DMSA layer. It is data in this layer that the end-user can access.
Interesting examples: (2) the data warehouse in GermanyThe German Data Warehouse was developed at the end of the 1990s and is used for performance man-agement by controllers and managers in the PES. Controllers analyse data from the Warehouse for the performance management procedures, and managers mostly use the management information system that contains data from the Data Warehouse.
Data sources for the data warehouse come from the operational systems in local offices. Data is gath-ered and processed by purpose, so not all the data that the PES produces is loaded onto the Warehouse. The functions that drive the data loading process are the unemployment statistics, labour market policies, employment statistics and controlling.
The Data Warehouse processes data in three layers:1. Loading stage: In the first layer of the Data Warehouse, data from the operational systems is loaded
and first selections are undertaken (no functional additions take place). 2. Core Data Warehouse layer (cleansing of data): On the second layer entities and relations between
entities are built. An entity can be a customer, a benefit or a process. There is a historisation of data, so that all changes are recorded. There are always two timestamps for every function so that the data warehouse is able to reproduce the same result at another point of time. In this stage, data is also anonymised and classified. For performance reasons time periods of special interests are created to consider processes that start at a certain time, such as the duration of a benefit or the duration of a jobseeking period.
3. DataMart: In the third layer, key figures and attributes are counted and turned into figures, which are then exported into the reporting tools.
Data validation happens in different ways, either using the stock and flow analysis, time series analysis, relying on knowledge of the operational processes, instinct or external validation, such as correspondence with other statistical information. The most important (used) data validation process is the stock and flow analysis, which compares stock (for example, people in ALMP measures) with certain inflows and outflows into/from this stock.
Robust data is crucial to monitor performance of the PES. There are currently discussions on up-to-date data and transparency of data. The PES aims to speed up data analysis because there are demands for weekly and daily evaluations now. However, no data validation is possible for daily evaluations (despite automatic validation) and cumulative errors need to be traced to retain validity of information over a monthly reporting period.

PRACTITIONER’S TOOLKIT
37
2.1.1 Key considerations
When designing or reviewing the reports to be made available, these are some key questions to address: ‣ Who should have access to data reports? ‣ How should the performance reports be designed?
‣ Should you invest in a data warehouse?
Because data warehouses have been the centre of much attention in the public sector in recent years, part of this toolkit focuses on these. The following sub-sections look into each of these questions in turn.
2.1.1.1 Who should have access to performance reports?
The ideal answer would be ‘everyone’ as an illustra-tion of public transparency. Indeed in some regards it would be useful if the general public had access to all data all the time (as long as personal data remained protected).
However, the question is more complex than this – primarily because of two issues:
All results are not necessarily valid and rel-evant for everyone the whole time
Open access to all reports requires validity of information so that the public has an accurate picture of performance. This implies a mature performance management system, where data is of high quality and reports are accessible and relevant.
Some reports can be hard to interpret for some stakeholders
Performance reports can often be complex to inter-pret. No matter how clear you make charts and tables, it is likely that there will be some people/or a possible stakeholder group who misunderstand information. Such issues can be minimised by sup-plementing reports with remarks and comments to explain context. However, the highest level of control is mostly achieved by limiting the availability of reports and the frequency with which they are updated.
A useful way to approach this question is to ask your stakeholders what they need/would like to see.
When setting up or reviewing data reporting processes, it is useful to undertake interviews with different stakeholders/audiences to obtain a deeper understanding of their needs. These interviews should cover both the content and the format, in order to customise these reports to their requirements. The deeper the understanding that you have of their working realities, the more precisely you will be able to customise data reports to your stakeholders, while helping you to make appropriate IT decisions to support this.
Here are some of the topics you can cover:
1. What are their responsibilities and tasks? And what are their overall needs regarding data reporting?
2. What are their preferences regarding the way data is displayed?
a. Do they prefer diagrams and charts or tables?
b. How much information dot they prefer in one diagram/chart/table?
c. What kind of data are they experienced to handle? For example, if stakeholders have limited experience with statistics, reports should be kept plain and simple.
d. What terms do they use and understand? Are they experienced data warehouse users?
3. What characterises the situations in which they (are going to) use data?
a. E.g. is it at meetings where they present a layout in PowerPoint? Are there regular agendas at these meetings – and could data reports be structured accordingly? How often are these meetings taking place, and do they need reports to be ready a certain period before the meeting/what are the timelines/cut off points we need to be aware of?
b. What conclusions/decisions do they need to make from data? Do they repeatedly treat the same problems, or do problem types vary from situation to situation?
c. What information is most important? And what is needed to implement decisions which are based upon data (e.g. managers carrying out decisions often need detailed data, split by sub-divisions or employees etc.).
4. What happens after data/reports have been issued?
a. Are data reports forwarded to colleagues, employees or higher-level managers? Do they need to comment to discuss the data?
b. Do data reports need to be approved? By whom?
5. What data do they use today? (Perhaps PMS-data can be integrated into other data warehouses etc.?)
a. What data do they use and/or need on performance management?
b. What other types of data do they use?
c. Would it be an advantage if current data was integrated into on reporting structure/data warehouse?
TO O L B O X – I N T E RV I E W I N G S TA K E H O L D E R S O N R E P O R T I N G N E E D S

38
2.1.1.2 How should performance reports be designed?
When designing reports it is important to customise the design to the needs of different stakeholders. Some key issues to decide include:
What kind of performance reports do different target groups need? Who needs what level of detail in the data?
You need to decide on the level of detail and com-plexity that different target groups should have access to. This is both a question of information needs and their capacity to handle complexity, which is bound to differ across the wider public, senior level management, operational management and employees. For example, performance reports for operational managers should cover the employees and areas for which they are responsible. It should be possible for operational managers to compare performance across their employees and to ‘drill down’ into a detailed report on a case by case basis, so as to support management in their follow-up on employee performance.
What benchmarking options should there be?
At each organisational level it is relevant i) to compare your own results to similar units, and ii) to compare results within your own sub-units. The comparison with similar units will indicate if perfor-mance is acceptable, or if there is a potential to learn from other units. The comparison between sub-units serves to explain the results of the unit, which is important when making decisions on prioritising improvements.
Where there is a high number of units to compare, it can be relevant to cluster units e.g. on the basis of labour market conditions – see earlier section 1.3 on ‘Assessing PES Performance’.
What reporting format is required? Predefined data reports or simple queries?
For some users, it can be useful to define, from the start, a rather short and focused report. This increases the likelihood of them looking at it and interpreting results correctly. Pre-defined reporting is useful for stakeholders who need regular access to information in what can be seen as a ‘static’ or systematic way. Over time, reports can grow in volume of information and complexity, to align
with increased requirements from users/readers. However, as a PES, you retain a certain degree of control and you can manage the presentation of such reports. This in turn minimises risks of misin-terpretation when reports are shared outside of the core stakeholder group.
For other users, it is more relevant to leave them to ‘build’ their own queries, e.g. through a flexible online report generator. If a data warehouse is available, it will offer flexibility in defining different queries. For example, a report generator can enable you to develop detailed reports on specific target groups such as women age 25-29. You should ensure that users have the right qualifications to build such queries, as this will prevent frustra-tion and misinterpretation. In terms of qualifica-tions, you should ensure, for example, that users have both the right professional understanding of ‘employment’ definitions and the right technical skills to use a report generator. For this option, you may need to be consider the extent to which query functions are available and how flexibly queries can be built/data can be cut. Indeed, there is a risk that everyone runs such different queries and reports, that it begins to complicate discussions across the organisation. Some framework structure to begin with can be helpful.
How often should data be updated?
For employees and operational managers, data should ideally be updated in real time (or daily) so that they can react quickly to changes in short-term performance. However, at senior management level, too frequent updates may not be an advantage. Often, monthly reports suffice at senior level. How-ever, be careful to align reporting timeframes for managers where different cycles apply.
Should data reports be pushed via email or dashboards?
Data warehouses can be used to build reports when a need for them arises. However, if regular management cycles are defined in the organisa-tion (e.g. plan, do, study, act) this can be supported by sending reports via email to remind employees and managers that it is time for planning and/or follow-ups to take place. If the timing of an email is customised to the need of the organisation, this can be a convenient way to share information for managers and employees.
PRACTICAL TIP – THREE BASIC PRINCIPLES OF SUCCESSFUL DIALOGUES
PRACTITIONER’S TOOLKIT
39
2.1.1.3 When is a data warehouse the right investment?
A data warehouse is a system used by organisations for data analysis and reporting. The main purpose of the data warehouse is to integrate data from a range of different sources into one centralised location. The vast majority of data stored in a data warehouse is current or historical data, which is used to create reports or reveal trends.
Possibly the biggest benefit of a data warehouse is that it makes sense of data from different sources. How-ever, as already mentioned, data warehouses can be expensive to set up, which raises the question for whom and when the data warehouse is a good investment.
Put simply, if your organisation is only (planning to) handling small amounts and sets of data, you can perhaps do without a data warehouse. However, if you are working with PMS and looking to draw on complex data sets for continuous performance monitoring, management and improvement, it is likely that the investment is relevant for your PES. Below are three common indicators that can help you decide/discuss whether you need a data warehouse:
1. You use many spreadsheets If you use a lot of spreadsheets on a routine basis and you are finding it difficult to find the data you need because it is spread across so many different sheets, possibly across different departments, then a structured data warehouse might help.
2. Time and effort are wasted in coordinating data Implementing a data warehouse can help to cen-tralise data collation and make it available to team
members more effectively. This cuts down the time spent on tracking information and communicating it to colleagues.
3. Discrepancies exist in data and reportsDifferent sub-units in organisations can develop different reports based on their own data (needs). This can lead to time wasted in dialogue on data results. A common warehouse with some shared structure in place can help alleviate this issue.
2.2 Reviewing and using data – dialogues
A data-driven learning culture helps to improve services and realise the outcomes of your clients (target groups). Such a culture enables constant reflection on performance, using hard as well as soft evidence: ‣ Hard evidence is the progression and out-comes data which tells you how well your clients (target groups) are doing.
‣ Soft evidence complements hard data by exploring why data looks like it does – soft data digs into the meaning of the hard data.
In order to exploit both hard and soft data, you should facilitate a learning process amongst man-agers and staff, to which dialogue is essential.
This section provides tools to support a data-driven learning process, with a focus on reviewing and using data for progression and outcomes. To begin with, the box below describes the principles of successful dialogues, which can help in com-municating data.
‣ Transparency: It should be clear what you talk about and the dialogue should be based on facts, not on belief or opinions without evidence. It should be clear to all on what data the arguments and decisions are based on and this should be communicated to all staff.
‣ Frequency: Dialogue is the fuel of the learning engine, so in order to learn and improve you should exercise that dialogue on a regular basis. Plan and design ‘structured dialogues’ where learning is the purpose of the dialogue, which means understanding and adjusting actions and services based on a data-driven dialogue.
‣ Appreciative: Dialogue should be grounded on an appreciative inquiry approach, where the focus is on the performance and the outcomes you wish to achieve collectively or individually. Dialogues help to celebrate good performance and should – when under-performance is identified – help to explore what could be done to address the underlying causes of under-performance. Listen as much as you talk, have an open mind and try to understand. This approach advocates collective inquiry into the best practices of today and what could be the everyday practice of tomorrow. Tomorrow is the outcome you want to fulfil for your target groups, and dialogues should focus on this. Data on progression and outcomes will tell you whether you are on the right track.
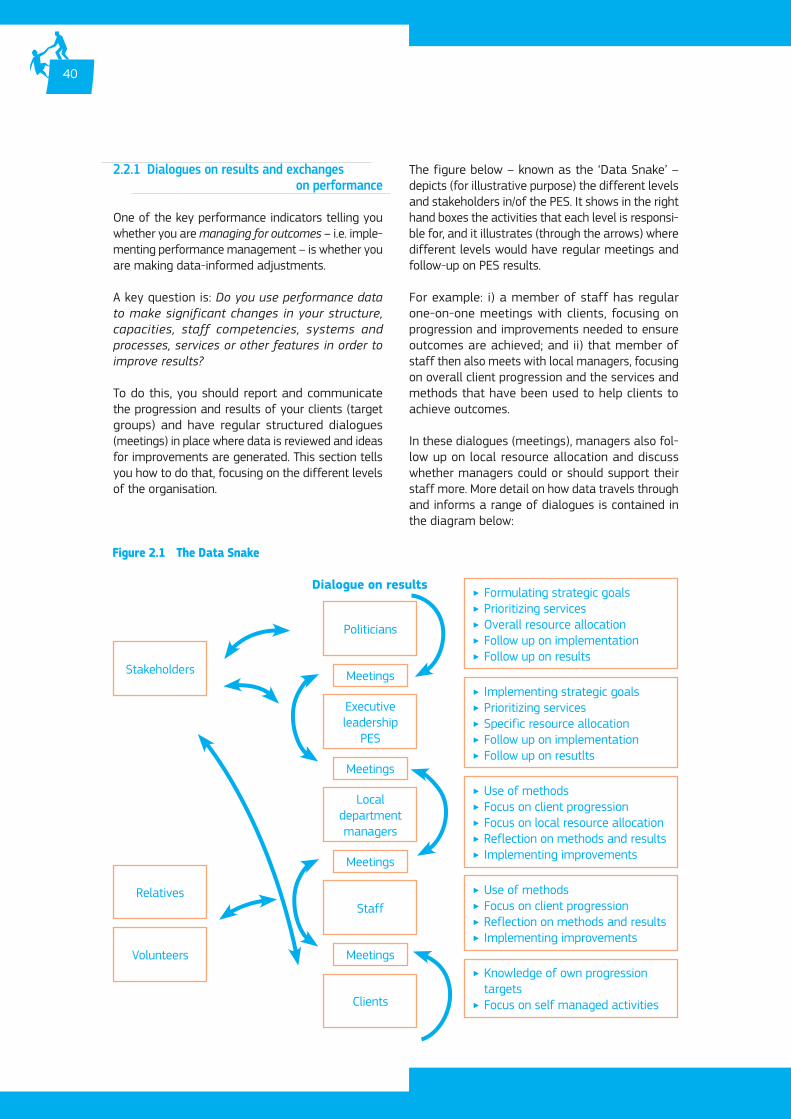
40
2.2.1 Dialogues on results and exchanges on performance
One of the key performance indicators telling you whether you are managing for outcomes – i.e. imple-menting performance management – is whether you are making data-informed adjustments.
A key question is: Do you use performance data to make significant changes in your structure, capacities, staff competencies, systems and processes, services or other features in order to improve results?
To do this, you should report and communicate the progression and results of your clients (target groups) and have regular structured dialogues (meetings) in place where data is reviewed and ideas for improvements are generated. This section tells you how to do that, focusing on the different levels of the organisation.
The figure below – known as the ‘Data Snake’ – depicts (for illustrative purpose) the different levels and stakeholders in/of the PES. It shows in the right hand boxes the activities that each level is responsi-ble for, and it illustrates (through the arrows) where different levels would have regular meetings and follow-up on PES results.
For example: i) a member of staff has regular one-on-one meetings with clients, focusing on progression and improvements needed to ensure outcomes are achieved; and ii) that member of staff then also meets with local managers, focusing on overall client progression and the services and methods that have been used to help clients to achieve outcomes.
In these dialogues (meetings), managers also fol-low up on local resource allocation and discuss whether managers could or should support their staff more. More detail on how data travels through and informs a range of dialogues is contained in the diagram below:
Figure 2.1 The Data Snake
Dialogue on results
Stakeholders
‣ Formulating strategic goals ‣ Prioritizing services ‣ Overall resource allocation ‣ Follow up on implementation ‣ Follow up on results
‣ Implementing strategic goals ‣ Prioritizing services ‣ Specific resource allocation ‣ Follow up on implementation ‣ Follow up on resutlts
‣ Use of methods ‣ Focus on client progression ‣ Focus on local resource allocation ‣ Reflection on methods and results ‣ Implementing improvements
‣ Use of methods ‣ Focus on client progression ‣ Reflection on methods and results ‣ Implementing improvements
‣ Knowledge of own progression targets
‣ Focus on self managed activities
Politicians
Staff
Clients
Meetings
Meetings
Meetings
Meetings
Executiveleadership
PES
Local department managers
Relatives
Volunteers

PRACTITIONER’S TOOLKIT
41
Figure 2.2 PDCA based approach
2.2.2 Building a cycle of continuous improvement
When looking to track and adjust services, frequent reporting and targeted meetings are needed in order to assess progression and track outcome indicators. Such conversations help to show whether strategic goals and targets are achieved, and help to high-light key information on outputs to gain insight, for example, in the number of clients served in a given target group and the resources allocated to serve these. However, continuous improvement pre-supposes a cyclical approach to such reporting and dialogue, which is what the PDCA (Plan, Do, Check, Act) approach can support to achieve. It is one of many ways to approach cyclical reporting for evidenced-based reviewing and decision-making. The advantage of the PDCA approach is that it describes simple, consecutive stages to follow in order to gain more objective insight for continuous improvement. Simplicity is key here, both in applying the approach and in determining the content for each of the stages.
The figure below uses the PDCA approach to depict a continuous evidence-based decision making pro-cess to drive improvements:
ImplementingPlanning and
designing
Monitoring and evaluating
Decision-making and improving
2.2.2.1 (PLAN) – planning and designing
Plan and design new actions: How do we act on data (positives as well as negatives)? What adjustments are needed and on what basis are they needed? Who is accountable for the results and to whom should the adjustments be communicated? How do we celebrate the achieved results and to whom do we communicate these?
Plan and design follow-up: How do we follow-up and review new actions? How often do we follow-up on data (in order to track changes)?
2.2.2.2 (DO) – implementing
The plan decided in the previous phase and new actions are implemented.
2.2.2.3 (CHECK) – monitoring and evaluating
Checking: Are our targets met? Did we perform as planned?
Analysing data: What story does data tell? What are the trends? Is there a progression or digression in relation to the strategic goals and targets and in comparison to last year or with other local depart-ments? Is the data reliable and valid?
Learning and development: What lessons have we learned by looking at data? Why is there a progres-sion/digression? Who has (not) succeeded with what? Is there a connection between our assumptions (in our Theory of Change) and the factual results? Were the assumptions right/wrong or did something go wrong in the implementation of methods and ser-vices intended to achieve progression and results – or both?
2.2.2.4 (ACT) – decision-making for improvements
Going through PDC phases will help you to build a learning culture that focuses on client progres-sion, results and outcomes, and it will help you to see what your different stakeholders (managers, staff etc.) deliver to your clients in order to achieve these results.
The Check phase in particular (monitoring and evaluation) will help you understand what the data is telling you. Focusing on learning helps you to develop staff competencies and PES services,

TOOLBOX – ORGANIS ING LEARNING LABS (MEET INGS)
42
as you begin to understand the aspects of your services that are affecting the progression of your clients – and which aspects are not. This gives you a platform from which you can adjust actions, ser-vices and methods, initiate new services and close services that are not producing intended results. By frequently following up on services, methods and actions, you should then be able to stay on course and adjust in time.
In this phase, you can use targeted ‘learning meet-ings’ at different levels to Act on the information that you have at hand, in order to make decisions that are focused on improvement.
The box below shows you how you can organise such meetings (by using ‘Learning Labs’), with
Content of these meetings
At meetings, you identify progression towards and digression from goals and targets, the number of clients, the demographic and risk-related functions of the clients, expenditures etc. In addition, you can discuss good experiences and barriers in relation to goal attainment. How deep you look into the details of measurements depends on the level of the organisation that is involved at a given meeting.
‣ At executive level, the focus is more likely to be on the overall progression/digression, for example outcomes for clients, overall expenditures.
‣ At meetings with the local departments, the focus is more likely to be on specific results and the progression of individual target groups.
In any of these meetings, you should use quantitative data and indicators to shed light on the progression/digression, which allows you to lead fact-driven discussions on adjustments and actions needed to improve progression. You can also use qualitative data, for example observations and quotes from other staff members, relatives and clients, to explore, qualify and nuance the quantitative information.
Such meetings are held frequently and they are supported by an agenda around analysing, learning and acting (making you go through the PDCA-cycle in the conversation). It is possible for such meetings
a focus on following-up and analysing data, adjusting and planning new services in order to improve client progression and results.
2.2.3 Key considerations
These are some key questions to address when engaging in a PDCA approach to structure continuous improvement: ‣ How often should the PES report on data? In what format, and to whom?
‣ How often should people in the PES meet at spe-cific levels (see the ‘Data Snake’ in section 2.2.1)?
‣ Who should prepare dialogues – and who selects data, runs analyses etc.?
‣ Who should facilitate these dialogues?
to be facilitated by a trained process-facilitator, which can help to make these meetings more productive.
It is also important that decisions and new actions are fully documented and logged, including a description of what is decided, who is responsible and when and how the action will be followed-up. This should be done by a ‘minute-taker’. This ‘minute-taker’ is also responsible to communicate a summary of the meeting to participants, which is to include a list of decisions made. PES staff from the finance, IT and legal departments should be invited to participate and explore the data in its financial, IT and legal consequences for different decisions and actions to be made.
To prepare these meetings, participants receive relevant data (measurements), for example, in a written report, with extracts from selected data from the data warehouse (where applicable) and/or selected charts showing client progression from a unit or local department.
Agenda for such a meeting
A typical Learning Lab meeting in a local department between staff and local managers would run for 2-3 hours, 3-4 times a year after data is selected from the data warehouse. Such a meeting could be integrated into and existing meeting, for example a quarterly team-meeting. The focus for this meeting would be on reflecting and learning to improve PES service.
TO O L B O X – E X A M P L E O F A N A G E N D A
PRACTITIONER’S TOOLKIT
43
2.3 Ensuring the right incentives are in operation
Rewarding high performance can contribute to the motivation of individuals and teams, and is an instrument that can be used at all organisational levels. There can be a lot of organisational energy generated through using incentives, which can be used to enhance performance. Rewards can also be used as a management tool to direct attention to solving specific issues in an organisation.
However, there can also be negative consequences from the use of reward structures. If a reward struc-ture is considered unfair, it can evoke negative emo-tions and demotivate certain employees. Rewards
1. Data analysis: By using charts on progression, results and outcomes, a few indicators are analysed with focus on:
‣ Good results and how they are achieved.
‣ Opportunities to improve service: where can we do better?
‣ Causes of barriers
2. Problem-solving: Generating ideas for actions that will solve problems and improve services – described in an action plan.
3. Plan new actions: Who does what, when? When do we follow up?
Planning the next meeting:
4. Follow up: Focusing on action plans and performances in order to discuss how staff and managers can support service delivery.
5. Evaluation and learning: Discussing whether improvements have the intended outcome – why/ why not?
As mentioned earlier, a facilitator can prepare and run this part of the meeting. The facilitator is then responsible for taking participants through the PDCA-cycle and help them with:
‣ Reflecting on data: What does the data say? What is behind the data? How can we explain data?
‣ Analysing data
‣ Drawing conclusions from data
‣ Working out new actions to improve services
‣ Documenting the meeting
‣ Following-up on new actions
‣ Documenting new knowledge gained
The facilitator could be a team manager or key staff member, who has dedicated time to undertake the role.
Between the meetings, the agreed new actions are carried out and experiences are collected in a learning-log, which could be in an IT-system or simply on paper. This would help to cover the following:
‣ What did I do?
‣ What did I intend to achieve with my actions?
‣ How did it work?
‣ Why did it work/not work?
Experiences can be documented in words, pictures, film etc. and used as input to the next meeting. This way you create a learning process by means of reflection, following-up on new actions and identifying improvement of services, with a focus on client progression and results.
Frequency
In order to follow-up on client progression and the implementation of strategic goals, typically such meetings would take place at least twice a year at leadership and management level. Staff should then meet with managers four times a year (quarterly).
are therefore an instrument requiring careful design and clear communication.
2.3.1 Rewarding high performance at different organisational levels
Rewarding high performance can be done in many ways. Typically, it is linked to wages and bonuses, but it can also be linked to extra vacation or promotions and career development.
A useful starting point when creating a new reward structure is to opt for a balanced approach: focus-ing too heavily on incentives for some parts of the system could hinder an important focus on other parts of the system.

44
The principle of balance applies across several aspects of a reward structure: ‣ Choosing the objectives: If meeting some objectives is heavily rewarded/weighted, other objectives might lose focus. Sufficient priority should be given to outcome measures as these are hardest to ‘manipulate’. However, there should also be a balance between different types of outcome incentives, in order to avoid creaming/skimming of clients. For example, if an incentive structure only counts the rate of unemployed people in work after 4 months of unemployment, this can lead to clients with more than 4 months of unem-ployment and those who are deemed least less likely to find a job within 4 months not being a priority. Finally, should resources be limited, incentives could focus on the effec-tiveness or cost-effectiveness of focussing on inputs, without losing track of outcomes.
‣ Short-term vs. long-term outcomes: When focusing on outcomes, you should consider if you reward the achievement of short-term outcomes or the achievement of more ‘sus-tainable’ outcomes, e.g. clients’ ability to stay in work for a longer period. However, there is no simple answer to how you make that choice. On one hand, long-term outcomes are highly valid and at less risk of opportunistic behaviour from individuals. On the other hand, employees might feel that it is harder to affect long-term outcomes and that more time is needed to observe results – which can be less motivating.
‣ Rewarding teams and/or employees: It is important to determine whether team performance or individual employee perfor-mance is rewarded. An emphasis on individual performance can affect workplace culture, for example by less priority on common innovation and collegial support. When defining incentives, you should also seek to understand how rewards affect different teams and groups of employees. Notably, it is important that groups of employees, whose contribution to the organisation is important but less tangible than for other groups, for example those with support functions, are not disengaged by the incentive regime. This can be handled by giving managers autonomy to reward good performance – even based on less tangible criteria – so long as a criteria structure is in place.
‣ Focusing on specific target groups: The objectives linked to rewards can affect the prioritisation of different client/target groups. Here, it is important to decide if there are groups of unemployed that should be given more attention, and to structure incentives to that effect. However, these incentives should be structured in such a way that they do not directly disadvantage other client groups.
‣ Long-term organisational development vs. current performance: Finally, you also need to consider the time perspective in conjunction with planned organisational development/change: for example, what should the capabilities and the culture of the organisation be in three to five years? If the organisation needs to build new capabilities or change its culture, this should be reflected in the reward structure and consequently reward associated /desired behaviours.
A prudent way to align positive results and rewards is to study and understand the consequences of rewards before launching them. Here the Plan, Do, Check, Act-approach (section 2.2.2) can be of help.
Moreover, reward structures should be seen as a dynamic management tool, which needs con-tinuous adjustment, so that the focus remains on solving current issues. However, at the same time, a reward structure should be transparent and in place long enough to be credible and understood.
It should be noted that employee motivation is a complex subject, and that a lot of research has been done on this subject in recent years. Some researchers point out that individual employees have different motivational profiles and that only some are motivated by rewards. Other employees thrive on other elements, such as social interac-tion with colleagues, work-life-balance, the right amount of challenge and professional inspiration/development. There are also public servants who gain motivation from the impact of their work on society, e.g. helping vulnerable people. These profiles all need to be understood when defining a suitable reward structure for your organisation.

PRACTICAL TIP – SEVEN IDEAS TO CELEBRATE/RECOGNISE
HIGH PERFORMANCEE X A M P L E
E X A M P L E
PRACTITIONER’S TOOLKIT
45
2.3.2 Soft incentives: sharing results & celebrating contributions
Instead of (or alongside) monetary rewards, organi-sations can also introduce what is regarded as soft incentives. Soft incentives are typically understood as non-financial in nature. Typically, such incentives celebrate results and contributions as an important part of the working culture, and aim to spur motiva-tion among teams and individuals through such achievements.
To design and introduce soft incentives, the same considerations apply as described earlier for financial rewards. Teams and employees can be motivated by appreciation; equally, motivation can decrease when employees see that teams and/or employees are consistently recognised and rewarded without clear and accepted reasons. It is noteworthy that perceptions of conflict and negative emotions are lower with non-financial incentives hence soft incen-tives can be used and be seen as a first step towards creating a performance culture.
The box below provides some ideas for the design of soft incentives.
Interesting example: the incentive regime in Estonia
In the Estonian PES there is a widespread use of incentives for the employees with several elements covering both monetary incentives and soft incen-tives. The basic principles of the incentive regime are that incentives should be based on transparency and fairness, e.g. a share of their wages is based on incentives. At the same time they use also non-monetary incentives: a rating of top 10-counsellors and annual rewards for people and teams.
1. Arrange for a team to present to senior management how they improved performance.
2. Create an award for high performing team of the month.
3. Plan a surprise achievement celebration for an employee or a team of employees.
4. Call an employee to your office to thank them.
5. Send thank you notes to employees who improve performance.
6. Designate successful teams and employees as office consultants.
7. Give high performing teams an extra-long lunch break.
The examples are adopted from www.youearnedit.com
Interesting example: incentives for knowledge-sharing in Austria
In Austria, the PES prioritised promotion of knowl-edge-sharing across local offices to encourage the spreading of best practices. Thus, visits to other offices to discuss performance are seen as an indica-tor for good performance, and they are (financially) rewarded as such by the PES.
Equally, a project database exists to share infor-mation on project management and practices between regional and local offices. The aim is to create transparency around successful projects and lessons learnt across the PES. Projects cover all aspects of PES performance, including core pro-cesses, implementing job market goals and improv-ing Balance Score Card indicators such as customer and employee satisfaction.
A jury chooses three projects in the category ‘innova-tive projects’ to be recognised at the Austrian PES annual award ceremony.
A full PES Practice of this example is available via the PES Practice Repository.

In addition, the PES practice examples cited in this paper can be found on the PES Practice Repository.
46
Reference list and further information and resourcesReference list ‣ Christopher Pollitt (2001): Integrating Financial Management and Performance Management, OECD. ‣ David E. K. Hunter (2013), ‘Working Hard & Working Well. A practical guide to performance management for leaders serving children, adults, and families’. Hunter Consulting.
‣ European Commission (2013), ‘Performance management in Public Employment Services: benchmarking, clustering and individual performance management’. Author: Anna Adamecz.
‣ European Commission (2013), ‘Performance Management in Public Employment Services: Toolkit for PES’. Author: Ágota Scharle.
‣ European Commission (2013), ‘Review of Performance Management in Public Employment Services’, Author: Alex Nunn.
‣ European Commission (2014), ‘PES organisation and service delivery: digitalisation, decentralisation, performance and activation’. 4th PES to PES Dialogue Dissemination Conference. Authors: Roger Sumpton, Isabelle Puchwein Roberts and Helen Metcalfe.
‣ European Commission (2015), ‘Assessment report on PES capacity’. Authors: Pat Irving, Danilo Bianchini, Anna Manoudi, Helen Metcalfe, ICF International.
‣ IMF (2010), ‘A Basic Model of Performance-Based Budgeting. Technical notes and manuals’. Authors: Duncan Last, Marc Robinson.
‣ Mario Morino (2011), ‘Leap of Reason. Managing to Outcomes in an Era of Scarcity’. Venture Philantrophy Partners in Partnership with McKinsey & Company.
‣ Nielsen, Steffen Bohni, and Nicolaj Ejler. ‘Improving performance? Exploring the complementarities between evaluation and performance management.’ Evaluation 14.2 (2008): 171-192.
‣ Nielsen, Steffen Bohni, Sebastian Lemire, and Majbritt Skov. ‘Measuring evaluation capacity—Results and implications of a Danish study.’ American Journal of Evaluation 32.3 (2011): 324-344.
‣ SFI – Det Nationale Forskningscenter for Velfærd (2013): ‘Kommunernes rammevilkår for beskæftigelsesindsatsen’. Authors: Brian Krogh Graversen, Mona Larsen, Jacob Nielsen Arendt. (in Danish)
‣ Redcross, Cindy, Megan Millenky, Timothy Rudd, and Valerie Levshin (2012). More Than a Job: Final Results from the Evaluation of the Center for Employment Opportunities (CEO) Transitional Jobs Program. OPRE Report 22011-18. Washington, DC.
Links ‣ www.ceoworks.org ‣ www.jobindikator.dk ‣ www.jobindsats.dk ‣ www.whitehouse.gov/sites/default/files/omb/assets/omb/expectmore ‣ www.youearnedit.com ‣ www.welfare.ie/en/downloads/pathways-to-work-2015.pdf

PRACTITIONER’S TOOLKIT
47
Organisational readiness for strategic performance management
This annex is a tool for PES who are/wish to be considering using data to inform strategic perfor-mance management. It is therefore aimed at more experienced organisations, although less experienced PES and managers will also be able to use content from this section.
The following can assist your organisation to answer the following questions: ‣ Are you, as an organisation, ready for strategic performance management?
‣ Are you ready to take it to improve your perfor-mance management system?
‣ How ready are you? ‣ What do you need to work on in order to be ready?
This is meant to be a simple tool to assess your readiness. It will point out what you need to consider when designing and implementing a performance management system.
A1.1 Assessing readiness
Readiness is assessed by the technological and organisational capacity of your organisation to introduce and operate performance management.
When undertaking this assessment, it is helpful to break down the capabilities framework into a num-ber of sub-dimensions – i.e. organisational structure, management and leadership, organisational culture, staff competencies and work processes as well as available data. There are tools available to map the capacity of an organisation for performance man-agement. Figure A1.1 summarises the logic behind such a tool, and it provides examples of specific questions for each possible sub-dimension. Such a tool, and its sub-dimensions, needs to be adapted to the circumstances of your PES.
Structure
Culture
Work processes
Management and
leadership
Compe -tencies
Strategic framework
• Does the division of tasks between units support the effective delivery of interventions?
• Is the division of responsibilities clear and coherent?
• Does the management have the knowledge and competencies to manage the new strategy?
• Are accountabilities at the management level well defined?
• Is the leadership in a position to drive the strategy implementation process?
• Does the existing workflow support the needed interventions?
• Are there any bottlenecks which might slow the organisation’s service delivery?
• Does the organisational culture across the board support the new strategy?
Outcome
• Does the organisation have the staff competencies necessary to deliver the needed interventions?
• Does the organisation’s HRD framework support staff development in relevant areas?
Figure A1.1 Sub-dimensions ain the organisational framework (© Ramboll Denmark)
Annex

TOOLBOX – HOW READY IS YOUR PES?
48
By assessing PM capability, your PES will identify its strengths as well as the weaknesses it should address when looking to successfully implement performance management. This singles out at what structures, competences and work processes you need to improve.
The tool below provides a step-by-step approach to working with the readiness assessment process, including a framework of questions for each dimen-sion. This includes the possibility of defining actions to improve organisational readiness for PM.
Why use this tool?
The tool helps to map your capacity as an organisation (PES) to implement performance management or to take it to the next level in the following dimensions: strategy, management and leadership, organisation, competences, culture and work processes. Reflecting on and answering the following questions for each dimension will help you to get a clearer picture of your capacity and those areas you wish to improve.
How to use this tool?
There are at least three ways to use this tool (these can also be combined):
1) Qualitative interviewing
2) Quantitative surveying
3) Launching a collective process of discussing and reflecting on capacity
Qualitative interviewing
Gather information and knowledge on triggers and barriers to implement performance management by interviewing key people from the PES board, management and staff, as well as reviewing documents etc.
Quantitative surveying
Send out (the questions in) the tool as a survey to all managers and staff in order to identify areas for
improvement. You can also use the tool as a baseline to compare the answers with those after changes have been implemented (following up on the answers after 1 year).
Launching a collective process
The tool can also be used to launch a collective process including senior leaders, managers and key members of staff from different departments in the PES. With this tool, you can discuss and reflect on the capacity of the PES and obtain a nuanced picture of the organisation. You can also use discussions as a way to focus on and implement solutions that will improve capacity.
Structuring the answers in the tool
You can use a scale to structure the answers to each question in the tool. By using a scale, you can compare the answers between different people over time. Such a scale is described here:
1Not at
all
2A little
bit
3To some extent
4Greatly
5Very much
You can then collect the actions that will help to improve your organisation’s readiness under each sub-dimension (strategy, leadership and management, competences, work processes, culture, outcome). The sub-dimensions and associated questions are described below.
Strategy
DIMENSION QUESTIONS ANSWER (RATING) ACTIONS
Formulation (1) To what extent are strategic goals formulated for your organisation?
Formulation (2) To what extent are SMART-goals formulated for your services?
Planning To what extent is there a logical connection between the goals of the services and your overall strategic goals (for example those stated in a Theory of Change)?
PRACTITIONER’S TOOLKIT
49
Leadership and management
Competences
DIMENSION QUESTIONS ANSWER (RATING) ACTIONS
Leadership (1) To what extent are strategic goals communicated clearly to staff by leaders?
Leadership (2) To what extent is it clear to staff that documentation and evaluation is central to delivering quality and results?
Leadership (3) To what extent are staff supported by leaders and managers in working with documentation and evaluation?
In use (1) To what extent do leaders and managers use data to follow-up and evaluate the results of the services?
In use (2) To what extent do leaders and managers use data to follow-up and evaluate the quality of the services?
Transparency (1) To what extent are the outcomes and success criteria of each service clear to staff?
Transparency (2) To what extent are the outcomes and success criteria of their own work clear to staff?
DIMENSION QUESTIONS ANSWER (RATING) ACTIONS
Management training
To what extent are leaders and managers formally trained in performance management disciplines (for example documentation, evaluation)?
Management experience
To what extent are leaders and managers experienced in using data on results as a way to support the development of staff competences and improve services?
Staff training To what extent have staff obtained formal training in working with documentation and evaluation?
Staff experience To what extent have staff used data on results to improve their services?
Analytical competences
To what extent does the organisation possess competences to collect, analyse and report on data?

TOOLBOX – HOW READY IS YOUR PES?
50
Work processes
DIMENSION QUESTIONS ANSWER (RATING) ACTIONS
Clear roles and responsibilities
To what extent are the roles and responsibilities in relation to documentation and evaluation clear?
Organization To what extent does the organisation of the PES support documentation and evaluation?
Learning (1) To what extent do staff frequently use data on results to evaluate the progression of their target group?
Learning (2) To what extent do staff frequently use data to evaluate the quality of their services?
Continuity To what extent is staff turnover critical to the quality and effectiveness of the service?
Culture
DIMENSION QUESTIONS ANSWER (RATING) ACTIONS
Opinions To what extent do staff buy-in support accurate documentation and evaluation?
Routines To what extent are routines established to follow-up on services and of data (for example in regular staff meetings)?
Visibility (1) To what extent do you visualise the results and outcomes of your services?
Visibility (2) To what extent do you have a tradition of celebrating good outcomes and results for your target groups?

Culture
Work processes Strategy
Competences
Leadership and management
Outcome
PRACTITIONER’S TOOLKIT
51
Outcome
DIMENSION QUESTIONS ANSWER (RATING) ACTIONS
Monitoring input data
To what extent are you able to monitor resources (input data)?
Monitoring output data
To what extent are you able to monitor productivity (output data)?
Monitoring progression
To what extent are you able to monitor the progression of your target groups (progression data)?
Monitoring outcomes
To what extent are you able to monitor outcomes (outcome data)?
Evaluation To what extent do you evaluate the inputs, outputs, progression and outcomes?
Reporting To what extent do you report on the inputs, outputs, progression and outcomes?
A useful way to analyse the results of this mapping is to use a ‘spider web’ visual (for example by using Excel), which shows the different scores in each dimension and sub-dimension as illustrated below (calculating the average score by using the scale mentioned above).
Example of a spider web representation of results across an organisation (illustrative):

TOOLBOX – SWOT ANALYSIS
52
After mapping your readiness to implement per-formance management, you can obtain an over-view and insight into your strengths, weaknesses,
opportunities and threats to implement performance management or improving it, by using the following tool, a SWOT-analysis.
Why use this tool?
The SWOT-analysis will help you get a simple and systematic overview of the issues you can control (your strengths and weaknesses) and the issues you can’t control that are coming from outside of the organisation (opportunities and threats). With this overview at hand, you can then focus your actions to get ready to implement performance management (or to improve performance management and service delivery).
How to use this tool?
Gather the same group of people from the board, management and staff as mentioned above (in the collective process of mapping your capacity) to undertake this analysis. Use the matrix below and fill out the four areas.
SUPPORTS IMPLEMENTING PM
BARRIERS TO IMPLEMENTING PM
Insi
de th
e or
gani
zatio
n 1. Strengths 2. Weaknesses
Outs
ide
the
orga
niza
tion 3. Opportunities 4. Threats

KEY QUESTIONS
PRACTITIONER’S TOOLKIT
53
A1.2 Key considerations
The tools provided in this section will help you to gather, structure and prioritise information to identify where you can/wish to improve technological and organisational capacity to implement performance
management. Before you get started on your journey to implement performance management or improve your existing system, there are key questions you would want to answer.
The following is a list of questions and performance indicators to assess your capacity for managing outcomes – i.e. implementing and taking performance management to the next level:
‣ Strategy – Do you have a clear strategy for your organisation?
‣ Clarity of organisational purpose (mission) – Does your organisation have a specific mission regarding its purpose for existing, whom it serves, where it works, and what it expects to accomplish?
‣ Consistency – Does your organisation have a history of keeping its focus on its mission, goals, and targets?
‣ Do you have objectives and a strategy for working with data and documentation?
‣ Accountability for outcomes – Do you have clear performance standards and agreed outcome measurements that you monitor and use to understand and improve staff performance?
‣ Are actions, responsibilities and roles in relation to data-driven documentation and evaluation defined and communicated to staff?
‣ Data integrity – Is performance data entered into the performance management system accurately, completely, and on time?
‣ Outcomes focus – Do you track internal processes and outputs (such as number of people served) and also track the results your organisation seeks to achieve?
‣ Making data-informed adjustments – Do you use performance data to make significant changes in your structure, capacities, staff competencies, systems and processes, programmes, services or other features in order to improve results?
‣ Linking staff activities to client outcomes – Do you systematically review staff activities and the time spent in serving them in relation to results/achievements?
‣ Do you have the right people in the right places with the right competences to gather and use data to improve your services?
‣ Delivering services with fidelity – Are your core services codified (i.e. described and written down, for example in manuals), and are they subject to both implementation and performance standards (telling you whether the services are in use and are delivered as they should)?
‣ Do you monitor implementation and performance, making adjustments as indicated (so that, as an organisation, you deliver services at high levels of quality that conform with the design features of the service model – all of which suggest that you can deliver the outcomes because your services are designed to enable this?)?
‣ Evidence for service impact – Do you have credible information to support your belief that the kinds of services provided actually produce the intended outcomes for clients?
‣ Do you have a culture that supports using data to improve your services?
‣ Budgeting for performance – Do you deploy your resources with a focus on supporting areas that drive client outcomes?
By answering and taking actions to improve these performance indicators, you are ready to implement or improve your performance management.


HOW TO OBTAIN EU PUBLICATIONS
Free publications:• one copy:
via EU Bookshop (http://bookshop.europa.eu)• more than one copy or posters/maps:
from the European Union’s representations (http://ec.europa.eu/represent_en.htm); from the delegations in non-EU countries (http://eeas.europa.eu/delegations/index_en.htm); by contacting the Europe Direct service (http://europa.eu/europedirect/index_en.htm) orcalling 00 800 6 7 8 9 10 11 (freephone number from anywhere in the EU) (*).
(*) The information given is free, as are most calls (though some operators, phone boxes or hotels may charge you).
Priced publications:• via EU Bookshop (http://bookshop.europa.eu).

KE-04-16-989-EN-N
Related Documents