1 Practical Hematology COLLECTED AND PREPARED BY: Mohammed O. Jaber Ibtisam H. Al Aswad REVIEWED BY: Ahmed Sh. Silmi ISLAMIC UNIVERSITY OF GAZA Medical Laboratory Sciences

Welcome message from author
This document is posted to help you gain knowledge. Please leave a comment to let me know what you think about it! Share it to your friends and learn new things together.
Transcript

1
Practical Hematology
COLLECTED AND PREPARED BY:Mohammed O. Jaber Ibtisam H. Al Aswad
REVIEWED BY:Ahmed Sh. Silmi
ISLAMIC UNIVERSITY OF GAZA
Medical Laboratory Sciences
2011

CONTRIBUTORS
Aida Z. Al Masri, MT
Teacher assistant, Medical laboratory sciencesIslamic University of GazaGaza, El Remal
Mohammed M. Laqqan, MT
MSc. Medical TechnologyTeacher, Medical laboratory sciencesIslamic University of GazaGaza, El Remal
2
PRACTICAL HEMATOLOGY
LAB NO. SubjectLAB 1 Slide preparation and staining,The White Blood Cell Differential , and
Platelet estimation.LAB2 Assessing Red Blood Cell Morphology.LAB3 Reticulocyte counts,Alkaline & Acid Hemoglobin Electrophoresis.LAB4 Detection of sickle cell . Quiz 1LAB5 Hemoglobin A2 Determination, Quantification of fetal hemoglobin.LAB6 Hemoglobin F Acid Stain,Screening test for G6PDH Deficiency.LAB7 Quantification of methemoglobin,Blood Sucrose Test. Quiz 2LAB8 Osmotic Fragility test.LAB9 Automated Hematology Cell Counters.LAB10 Normal Cell Maturation, Leukemia Classification.LAB11 Leukemia Classification, Special stains.
QUIZ 1& 2 10
LAB RESULTS 10
SLIDE EXAM 20
MANUAL FINAL EXAM 20
FINAL PERSPECTIVE EXAM 40
3

Content
Evaluation of peripheral Blood smearA Slide preparation and staining.B The White Blood Cell Differential and Platelet estimation.C Assessing Red Blood Cell Morphology.
Methods used in detection and monitoring of anemiaA Reticulocyte counts, Reticukocyte counts Using the Miller Disc.
Standard Methods for specific anemia's.A Detection of sickle cell.B Alkaline Hemoglobin Electrophoresis.C Acid Hemoglobin Electrophoresis.D Hemoglobin A2 Determination .E Hemoglobin F Acid Stain.F Screening test for G6PDH Deficiency.
Methods to Detect RED Cell Membrane DisordersA Blood Sucrose Test.B Osmotic Fragility test.
Automated Hematology Cell Counters.
Normal Cell Maturation.
Leukemia Classification according Morphology & special stain.
Special stains.
4
A Peripheral blood smear preparation and stainingWhen automated differentials do not meet specified criteriaprogrammed into the automated hematologyinstrument, the technologist/technician must perform amanual differential count from a prepared smear.There are three types of blood smears:
1. The cover glass smear.2. the wedge smear 3. thespun smear.
The wedge blood smear will be discussed in this lab. and It is the most common smear preparation in the hematology laboratory and Wright stain, a Romanowsky stain, is the most common dye.The are two additional types of blood smear used for specific purposes.
1. The Buffy coat smear is for use on patient specimens when the patient's white blood cell count is less than 1.0×10⁹/L and it is desirable to perform a 100-cell differential. This procedure concentrates the nucleated cells present in the blood.
2. Thick blood smears are commonly used when specifically looking for blood parasites such as malaria.
Proper Preparation of a Peripheral Blood Smear
Objective At the completion of this laboratory, the student will be able to:
1. State the appropriate sample used for preparing a peripheral blood smear.2. Describe the appearance of a well prepared blood smear.3. Demonstrate the appropriate technique for preparing a peripheral blood smear.4. Evaluate prepared blood smears for acceptability in the clinical laboratory.
Principle The wedge smear will be discussed in thisprocedure. Smears are prepared by placing a drop ofblood on a clean glass slide and spreading the dropusing another glass slide at an angle. The slide is thenstained and observed microscopically.Specimen
1. EDTA specimen 2. Smears are made from EDTAa. EDTA blood within 2 to 3 hoursb. Check all Microtainers for clots with applicatorsticks
Requirements for Proper Smear Preparation:1) Perfectly clean glass slides or coverslips2) Proper size blood drop3) Quick, smooth spreading of drop4) Rapid drying of smear5) Proper placement of drop6) Preparation of smear within 3 hours of collection
5
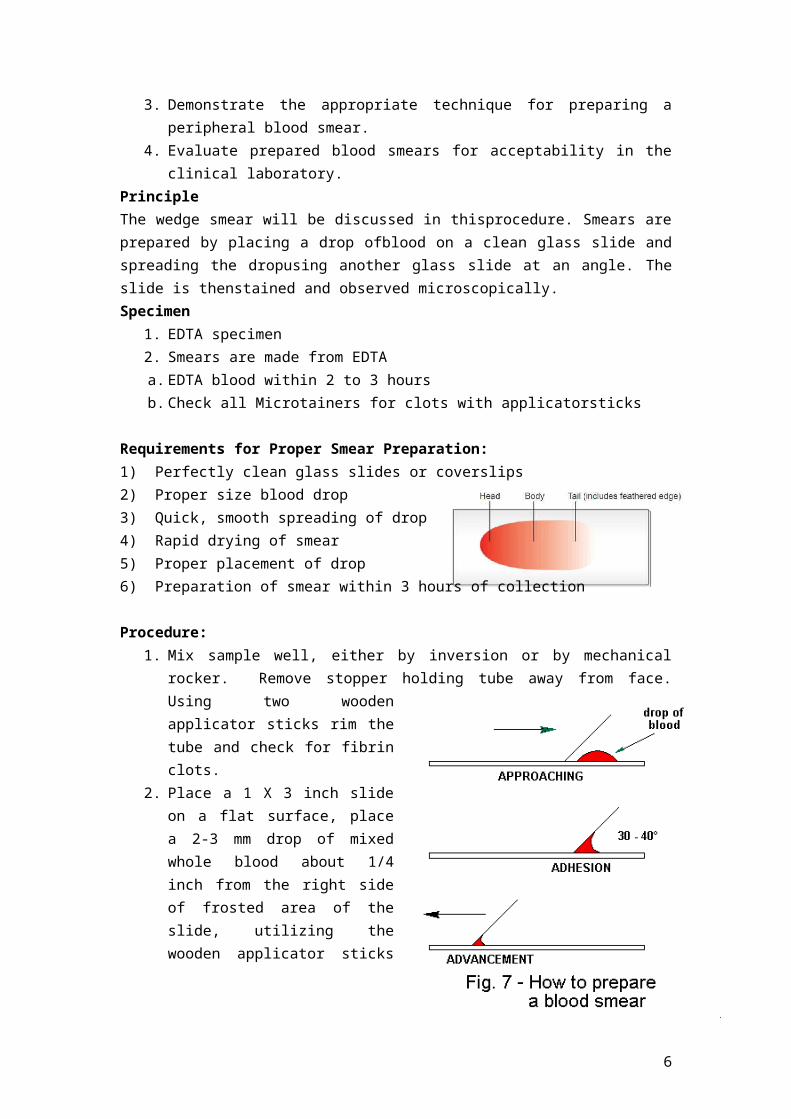
Procedure:1. Mix sample well, either by inversion or by mechanical rocker. Remove stopper
holding tube away from face. Using two wooden applicator sticks rim the tube and check for fibrin clots.
2. Place a 1 X 3 inch slide on a flat surface, place a 2-3 mm drop of mixed whole blood about 1/4 inch from the right side of frosted area of the slide, utilizing the wooden applicator sticks or filled a capillary tube three-quarter full with anticoagulated specimen .
3. Grasp a second slide (spreader slide) in the right hand between thumb and forefinger.
4. Place the spreader slide onto the lower slide in front of the blood drop, and pull the slide back until it touches the drop.
5. Allow the blood to spread by capillary action almost to the edges of the lower slide.
6. Push the spreader slide forward at approximately a 30-40° angle, using a rapid, even motion. The weight of the spreader slide should be the only weight applied. Do NOT press down. Perform this step quickly. The drop of blood must be spread within seconds or the cell distribution will be uneven. A thin film of blood in the shape of a bullet with a feathered edge will remain on the slide.
7. Label the frosted edge with patient name, ID# and date.8. Allow the blood film to air-dry completely before staining. (Do not blow to dry. The
Procedure Not1. Characteristics of a Good Smear
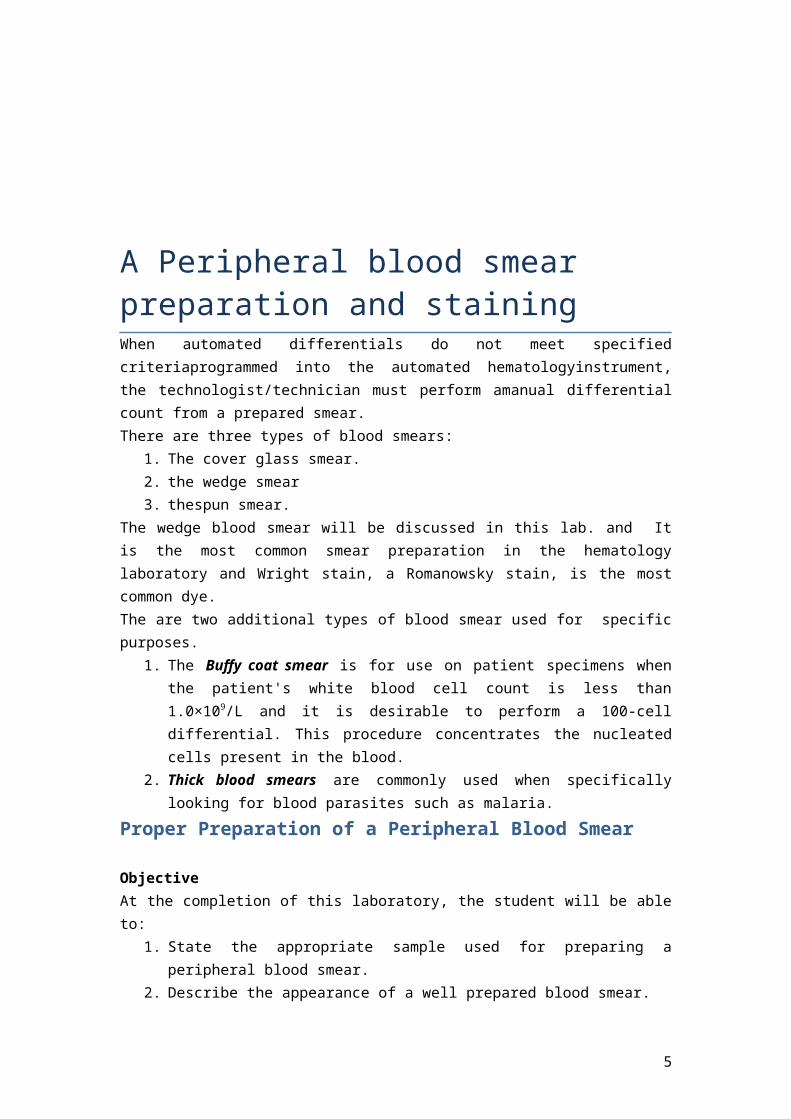
1. Thick at one end, thinning out to a smooth rounded feather edge.2. Should occupy 2/3 of the total slide area.3. Should not touch any edge of the slide.4. Should be margin free, except for point of application.A well made, well distributed peripheral smearwill have a counting area at the thin portion of thewedge smear which is approximately 200 red cells nottouching. A good counting area is an essential ingredientin a peripheral smear for evaluating the numbers ofand types of white cells present and evaluating red celland platelet morphology.
2. As soon as the drop of blood is placed on the glass slide, the smear should be made without delay. Any delay results in an abnormal distribution of the white blood cells, with many of the large white cells accumulating at the thin edge of the smear.Rouleaux of the red blood cells and platelet clumping may also occur.
6
3. The thickness of the spread when pulling the smear is determined bya. Theangle of the spreader slide (the greater the angle, the thicker and shorter the
smear).b. Size of the blood drop .c. Speed of spreading.
example1. If the hematocrit is increased, the angle of the spreader slide should be decreased.2. If the hematocrit is decreased, the angle of the spreader slide should be increased.
4. Common causes of a poor blood smear:a. Drop of blood too large or too small.b. Spreader slide pushed across the slide in a jerky manner.c. Failure to keep the entire edge of the spreader slide against the slide while making
the smear.d. Failure to keep the spreader slide at a 30° angle with the slide.e. Failure to push the spreader slide completely across the slide.f. Irregular spread with ridges and long tail: Edge of spreader dirty or chipped; dusty
slideg. Holes in film: Slide contaminated with fat or greaseh. Cellular degenerative changes: delay in fixing, inadequate fixing time or methanol
contaminated with water.
5. Although this is the easiest and most popular methods for producing a blood smear, it does not produce a quality smear. The WBCs are unevenly distributed and RBC distortion is seen at the edges. Smaller WBCs such as lymphocytes tend to reside in the middle of the feathered edge. Large cells such as monocytes, immature cells and abnormal cells can be found in the outer limits of this area. Spun smears produce the most uniform distribution of blood cells.
6. Biologic causes of a poor smear a. Cold agglutinin - RBCs will clump together. Warm the blood at 37° C for 5 minutes,
and then remake the smear.b. Lipemia - holes will appear in the smear. There is nothing you can do to correct
this.c. Rouleaux - RBC’s will form into stacks resembling coins. There is nothing you can
do to correct this.
7
Slide Staining With Romanowsky Stain
Romanowsky staining
Romanowsky stain are routinely used to stain peripheral blood and bone marrow smears. they are considered polychromatic stains in that the dyes present procedure multiple colors when applied on cells and cellular elements.
Principle The main components of a Romanowsky stain are:
1. A cationic or basic dye (methylene blue or its oxidation products such as azure B*), which binds to anionic sites and gives a blue-grey color to nucleic acids (DNA or RNA), nucleoproteins, granules of basophils and weakly to granules of neutrophils
2. An anionic or acidic dye such as eosin Y or eosin B, which binds to cationic sites on proteins and gives an orange-red color to hemoglobin and eosinophil granules.
*Azure B ( trimethylthionin, a product of the oxidation of methylene blue) and eosin Y are the most important components of the stain.
The quantity of dyes used to prepare the stain are controlled in order to yield a neutral compound . When the buffer solution is added to the stain, ionization occurs , during which time staining takes place. The eosin ions are negatively charged and stain the basic components of the cells an orange to pink color. The acid structures of the cells are stained varying shades of blue to purple by the positively charged azure B. neutrophil granules are probably stained by the azure compounds.
The stains include in this category 1. Wright's stain is composed of oxidized methylene blue and eosin azures. It is a
simpler method .2. Giemsa stain is thought to produce more delicate staining characteristics. It
combines eosin Y with azure B and methylene blue in methanol with glycerin added as a stabilizer.
3. Leishman's stain is similar to Wright's stain except for the method used to oxidize the methylene blue. It is also a simple method, which is especially suitable when a stained blood film is required urgently or the routine stain is not available (e.g. at night).
4. May-Gruwald is a good method for routine work. 5. Field's stain is a rapid stain used primarily on thin films for malarial parasites.
Fixation is important step, films must be fixed as soon as possible after they have dried to does not allow any further change in the cells and makes them adhere to the Glass slide. It is important to prevent contact with water before fixation is complete. The presence of water during methanol fixation produces refractile body artifacts (water spots) in the erythrocytes.
8

These water spots persist through staining of the smear and cover items of interest in the smear. Further, they are distracting to the person evaluating the smear. In some cases, the water spots may interfere with diagnosis. To prevent the alcohol from becoming contaminated by absorbed water, it must be stored in a bottle with a tightly fitting stopper and not left exposed to the atmosphere, especially in humid climates.
The preferred Alcohol is Methyl alcohol ( methanol), although ethyl alcohol ("absolute alcohol") can be used as fixative in Fixation.
We use in this Lab leishmen's stain, It does not need to step fixation before staining, because the fixative present with the stain, but with the Wright, Giemsa satinare needed to it.
LEISHMAN'S STAIN
Preparation of reagents
Staining Solution
Powder stain was weighed (0.2g) and transferred to a mortar. It was ground with about 25 ml of methanol and allowed to settle. The supernatant was transferred through filter paper to a flask. Grinding was repeated with 25ml of alcohol each time until all alcohol was finished and all powder was dissolved.
The flask was placed in a water bath at 50°C for 15 minutes. It was then filtered in a clean brown bottle. Mixture was left for at least 2-3 days to mature. Required amount for daily use was filtered into a smaller dropping bottle every morning.
Buffer pH 6.8
Stock buffer solution -A
1. Anhydrous monobasic potassium phosphate( KH2PO4), 0.067 M. 9.1g2. dissolve and dilute to 1L of distilled water and stored at 40°C.
Stock buffer solution -B
1. Anhydrous Dibasic potassium phosphate( K2HPO4), 0.067 M. 9.4g2. Dissolve and dilute to 1L distilled water and stored at 4°C.
Working buffer solution PH 6.8 was made by mixing 50.8 ml of stock solution A with 49.2 ml of stock solution -B and diluting it up to 2 liters with distilled water.
REAGENTS OFFERED:
1. Leishman's stain – Ready-To-Use2. Buffer-pH 6.8 phosphate buffer
9

Staining Procedure
1. Thin smear are air dried.2. Flood the smear with stain.3. Stain for 1-5 min. Experience will indicate the optimum time.4. Add an equal amount of buffer solution and mix the stain by blowing an eddy in the
fluid.5. Leave the mixture on the slide for 10-15 min.6. Wash off by running water directly to the centre of the slide to prevent a residue of
precipitated stain.7. Stand slide on end, and let dry in air.8. Staining characteristics of a correctly stained normal film:
Nuclei Purple Cytoplasm
Erythrocytes Deep pink Neutrophils Orange-pink Lymphocytes Blue; some small lymphocytes deep blue Monocytes Grey-blue Basophils Blue
Granules Neutrophils Fine purple Eosinophils Red-orange Basophils Purple-black Monocytes Fine reddish (azurophil) Platelets Purple
Caution !!For using lieshmen's stainINHALATIONProlonged or repeated exposure may cause breathing difficulties and irritation.INGESTIONMay cause discomfort if swallowed.SKIN CONTACTProlonged or repeated exposure may cause irritation.EYE CONTACTProlonged contact may cause transient eye irritation.
Discussion
1. The phosphate buffer controls the pH of the stain. If the pH is too acid, those cells or cell parts taking up an acid dye stain will stain pinker and the acid components that stain with the basic dye show very pale staining. If the stain-buffer mixture is too alkaline, the red blood cells will appear grayish-blue and the white cell nuclei will stain very deeply purple. Therefore, to stain all cells and cell parts well, the pH of the phosphate buffer is critical.
10
Causes & correctionToo Acid Stain:
1) insufficient staining time2) prolonged buffering or washing3) old stain
Correction: 1) lengthen staining time2) check stain and buffer pH3) shorten buffering or wash time
Too Alkaline Stain:
1) thick blood smear2) prolonged staining3) insufficient washing4) alkaline pH of stain components
Correction: 1) check pH2) shorten stain time3) prolong buffering time
2. The staining rack must be exactly level to guard against uneven staining of the smear.
3. Insufficient washing of the smears when removing the stain and buffer mixture may cause stain precipitate on the dried smear.
4. Excessive rinsing of the stained smear will cause the stain to fade. If it is desirable to restain a slide, the original stain may be removed with methanol. Flood the smear with methanol and rinse with tap water as many times as necessary to remove the stain and then restain the slide according to the previously described procedure. For best results, however, make a new smear.
11

Performing A Manual differential And assessing RBC Morphology Introduction
When blood samples are evaluated by the use of automated hematology analyzers, this analysis includes automated differentials. Specific criteria pertaining to normal, abnormal, and critical values have been programmed into the analyzers by the institution, and if the differentials do not meet these criteria, verification is necessary. This is done by performing manual differentials and further evaluating the peripheral smear.
objective
1. To determine the relative number of each type of white cell present in the blood by performing differential cell counts on five relatively normal blood smears and five sets of abnormal blood smears within a ± 15% accuracy of the instructor's values.
2. To determine within one qualitative unit the red cell, white cell, and platelet morphology of each of the above blood smears.
3. To determine within ± 20% accuracy an estimate of the white cell counts and the platelet counts of each of the above blood smears.
Principle
First, a differential white blood cell (WBC) count is performed to determine the relative number of each type of white cell present. Technologists/technicians must recognize and properly record the type(s) of white cell observed. Simultaneously, red cell, white cell, and platelet morphology is noted and recorded. Also, a rough estimate of platelets and WBC counts is made to determine if these numbers generally correlate with the automated hematology analyzer. Technologists/technicians must be proficient at recognizing red and white cell abnormalities, identifying them correctly, and quantifying them.
Reagents and equipment
1. Manual cell counter designed for differential counts2. Microscope, immersion oil and lens paper
Specimen
Peripheral blood smear made from EDTA-anticoagulated blood. Smears should be made within 1 hour of blood collection from EDTA specimens stored at room temperature to avoid distortion of cell morphology. Unstained smears can be stored for indefinite periods in a dry environment, but stained smears gradually fade unless cover slipped.
12

Procedure
Observations Under×10
1. Place a well-stained slide on the stage of the microscope, smear side up, and focus using the low-power objective (×10).
2. Find an optimal area for the detailed examination of blood cells in which:a. Free of ragged edges and cell clumps.b. The RBCs are well separated from each other without touching each other.c. Avoid the areas containing large numbers of broken cells or precipitated
stain. 3. Check the WBC distribution over the smear.4. Check that the slide is properly stained.5. Check for the presence of large platelets, platelet clumps, and fibrin strands.6. Check for the presence of any large abnormal cells (bone marrow cells).
Observations Under× 40 x-: WBC Estimates
1. Place a drop of immersion oil on the slide and change the objective to× 50 oil. (In cases where no× 50 is available, use the × 40 high dry with no oil.)
2. Choose a portion of the peripheral smear where there is only slight overlapping of the RBCs. Count 10 fields, take the total number of white cells and divide by 10, and refer to Table 1 to determine the WBC estimate.
3. An alternative technique is to do a WBC estimate by taking the average number of white cells and multiplying by 2000.
Table 1 o Estimated WBC Count From Peripheral Smear
WBC/High-Power Field
Estimated WBC Count
2 to 4 4.0 to 7.0× 10⁹/L4 to 6 7.0 to 10.0× 10⁹/L6 to 10 10.0 to 13.0× 10⁹/L10 to 20 13.0 to 18.0× 10⁹/L
Observations Under× 100: Platelet Estimates
1. Platelet estimates are done under × 100 with the RBCs barely touching, approximately 200 RBCs. This takes place under the × 100 objective (oil). On average there are 8 to 20 platelets per field. See Table 2.
2. Ten fields are counted using the zigzag method. This method of counting is done by going back and forth lengthwise or sidewise (Fig.1).
Platelets per oil immersion field (OIF)
<8 platelets/OIF = decreased8 to 20 platelets/OIF = adequate>20 platelets/OIF = increased
Figure1:Zigzag method of performing differential.
13

3. After the 10 fields are counted, the number of platelets is divided by 10 to get the average. The average number is now multiplied by a factor of 20,000 for wedge preparations. For monolayer preparations, use a factor of 15,000.
Table 2 o Platelet Estimate From Peripheral Smear
Average No.of Platelets per× 100 Field
Platelet Count Estimate
0 to 1 < 20,0001 to 4 20,000 to 80,0005 to 8 100,000 to 160,00010 to 15 200,000 to 300,00016 to 20 320,000 to 400,000>21 > 420,000
Example: 120 platelets/10 fields = 12 platelets per field 12× 20,000 = 240,000 platelets
Manual Differential Counts
1. These counts are done in the same area as WBC and platelet estimates with the red cells barely touching.
2. This takes place under × 100 (oil) using the zigzag method previously described in the platelet estimate (see Fig.1).
3. Count 100 WBCs including all cell lines from immature to mature. Normal values for WBCs can be found in Table 3.
Reporting resultsResults are expressed as a percentage of the total leukocytes counted.It is also helpful to know the actual number of each white cell type per µL of blood.
This is referred to as the absolute count and is calculated as follows:
Absolute number of cells/µl = % of cell type in differential x white cell count
Reference values vary depending on age. For this exercise, the following values will be used
Table 3
Cell Type Birth 1 mo 6 yr 14 yrTotal WBC x 103 /µL
10-26 5-19.5 4.3-13.5 4.5-11.0
Neutrophils % 37-57 25-35 45-55 50-65Lymphocyte % 25-35 50-65 35-45 30-40Monocyte % 3-9 2.5-7.5 0-8 0-10Eosinophil % 1-3 1-4 1-4 0-4Basophil % 0-1 0-1 0-1 0-1
14

Observing and Recording Nucleated Red Blood Cells (nRBCs)
1. If nRBCs are observed while performing the differential, they need to be reported. These elements in a peripheral smear are indicative of increased erythropoietic activity and usually a pathologic condition. Additionally, the presence of nRBCs per 100 white cells will falsely elevate the white count and is clinically significant.
2. Correct the WBC count if the nRBC count is greater than 10 nRBCs/100. The following formula is applied for correcting NRBCs:WBC× 100/NRBC + 100
Example : If WBC = 5000 and 10 NRBCs have been countedThen 5,000× 100/110 = 4545.50The corrected white count is 4545.50.Recording RBC Morphology
1. Scan area using ×100 (oil immersion).2. Observe 10 fields.3. Red cells are observed for size, color, hemoglobin content or pallor, and shape.4. Normal morphology
a. Normocytic: normal cell size and shapeb. Normochromic: normal hemoglobin content and color
5. Abnormal morphology: Red cell morphology is assessed according to size, shape, hemoglobin content, and the presence or absence of inclusions. See the following sample grading system. Note that red cell morphology must be scanned in a good counting area. Two questions should be asked
1. Is the morphology seen in every field? 2. Is the morphology pathologic and not artificially induced?
Table 4 & 5 represents a system derived to determine a quantitative scale.
Table.4 Qualitative Grading of RBC Morphology
Grade Degree of Abnormalities
1 to 5 cells/10 fields Slight
6 to 15 cells/10 fields Moderate
> 15 cells/10 fields Marked
Table 5 Grading Inclusions
Rare 0 to 1/hpf
Few 1 to 2/hpf
Mod 2 to 4 /hpf
Many > 5/hpf
15

hpf, high-power field.
Discussion1. A well-made and well-stained smear is essential to the accuracy of the differential
count. The knowledge and ability of the cell morphologist is critical to high-quality results.
2. When studying a stained smear, do not .progress too far into the thick area of the slide. The morphologic characteristics of the cells are difficult to distinguish in this area. Conversely, do not use the very thin portion of the smear where the red blood cells appear completely filled with hemoglobin and show no area of central pallor. The cells in this area are generally distorted and do not show a true morphologic picture.
3. Before reporting significant abnormalities such as blasts, malaria or other significant finding on a patient’s differential, ask a more experienced tech to review the smear for confirmation. In clinical settings where a pathologist or hematologist is present, the smear is set aside for Pathologist Review.
4. If disrupted cells are present such as smudge cells or basket cells, not them on the report. It may be necessary to make an albumin smear to prevent the disruption of the cells. RBC morphology and WBC morphology must always be performed on the non-albumin smear.
5. When the WBC is very low (below 1,000/µL), it is difficult to find enough WBCs to perform a 100-cell differential. In this situation, a differential is usually performed by counting 50 cells. A notation on the report must be made that only 50 white cells were counted. Multiply each percentage x 2.(Alternatively, a buffy coat smear may be prepared.)
6. When the WBC is very high (>50,000/µL), a 200-cell diff may be performed to increase the accuracy of the diff. The results are then divided by 2 and a note made on the report that 200 white cells were counted.
7. Never hesitate to ask questions concerning morphology or the identification of cells. The differential is one of the most difficult laboratory tests to learn. In fact, learning about cells and their morphology is a process that continues for as long as you perform differentials.
Characteristics of blood cells
Erythrocyte:Shape& size: Biconcave disc , size like lymphocyte nucleus.Nucleus : lost.Cytoplasm: pinkish hue, small area of central pallor. Number in man varies between 5 and 5.5 million per cubic mm of blood
Platelet ( Thrompocytes) Nucleus: No nucleus.
16

Cytoplasm: small amount bluish cytoplasm & contains reddish – purple granules.
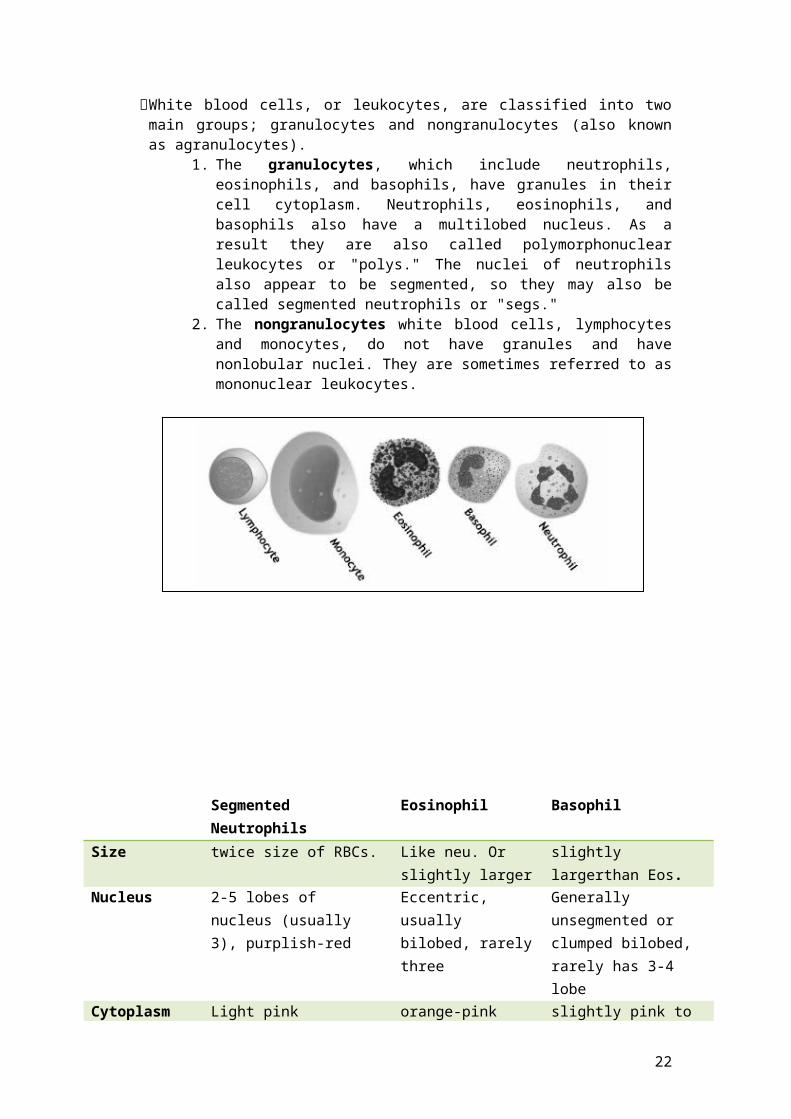
White blood cells White blood cells, or leukocytes, are classified into two main groups; granulocytes and
nongranulocytes (also known as agranulocytes). 1. The granulocytes, which include neutrophils, eosinophils, and basophils,
have granules in their cell cytoplasm. Neutrophils, eosinophils, and basophils also have a multilobed nucleus. As a result they are also called polymorphonuclear leukocytes or "polys." The nuclei of neutrophils also appear to be segmented, so they may also be called segmented neutrophils or "segs."
2. The nongranulocytes white blood cells, lymphocytes and monocytes, do not have granules and have nonlobular nuclei. They are sometimes referred to as mononuclear leukocytes.
Segmented Neutrophils Eosinophil Basophil
Size twice size of RBCs. Like neu. Or slightly larger
slightly largerthan Eos.
Nucleus 2-5 lobes of nucleus (usually 3), purplish-red
Eccentric, usually bilobed, rarely three
Generally unsegmented or clumped bilobed, rarely has 3-4 lobe
Cytoplasm Light pink orange-pink slightly pink to colorlessSPECIFIC granules
Primary &secondry granule either pink or neutral
fine, numerous,& even distributed
orange-reddish orange
uniformly round, large, evenly distributed
if poor stained appear crystalloid
violet-blue( or purple-black)
large(obscure the nucleus) ,abundant, varying in size, Coarse and unevenly distributed
17

nature vary in number ,shape and color, and less numerous than eosinophil granules
water-soluble and tend to wash out when stained ( probably because of improper fixation).
% from the Total WBCs count
40% - 75 % 1 % - 3 % 0.5 % - 1 %
increased in inflammation, and they act as the first line of defense against invading pyogenic organisms.
in allergic states and in parasitic infections.
In inflammatory processes , in immediate & delayed hypersensitivity
granules synthesize
nonspecific : lysosomes , acid phosphatase, peroxidase, esterase, lysozyme.
Specific: aminopeptidase, collagenase, lactofrrin, lysozyme.
highly metabolic and contain histamine and other substances
heparin and histamine
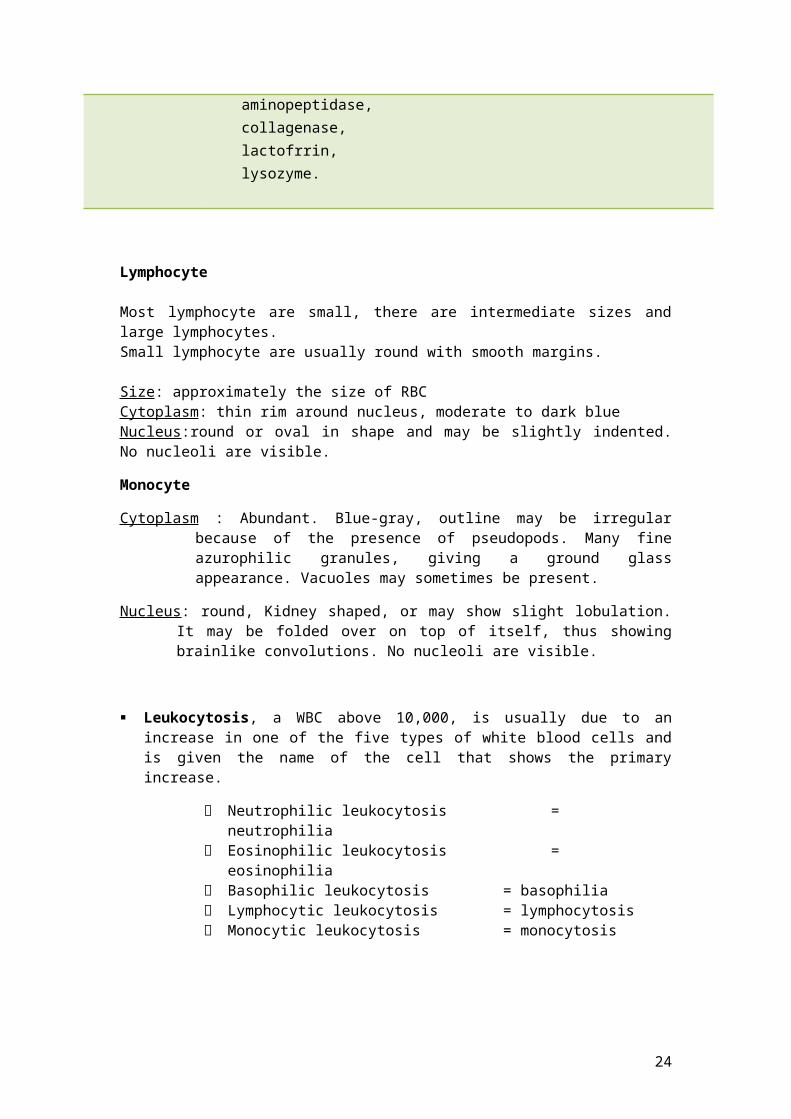
Lymphocyte
Most lymphocyte are small, there are intermediate sizes and large lymphocytes.Small lymphocyte are usually round with smooth margins.
Size: approximately the size of RBCCytoplasm: thin rim around nucleus, moderate to dark blue Nucleus:round or oval in shape and may be slightly indented. No nucleoli are visible.
Monocyte
Cytoplasm : Abundant. Blue-gray, outline may be irregular because of the presence of pseudopods. Many fine azurophilic granules, giving a ground glass appearance. Vacuoles may sometimes be present.
Nucleus: round, Kidney shaped, or may show slight lobulation. It may be folded over on top of itself, thus showing brainlike convolutions. No nucleoli are visible.
Leukocytosis, a WBC above 10,000, is usually due to an increase in one of the five types of white blood cells and is given the name of the cell that shows the primary increase.
18
Neutrophilic leukocytosis = neutrophilia Eosinophilic leukocytosis = eosinophilia Basophilic leukocytosis = basophilia Lymphocytic leukocytosis = lymphocytosis Monocytic leukocytosis = monocytosis
1. Neutrophils
Neutrophils are so named because they are not well stained by either eosin, a red acidic stain, nor by methylene blue, a basic or alkaline stain.
They are the body's primary defense against bacterial infection. Normally, most of the neutrophils circulating in the bloodstream are in a mature form, with the nucleus of the cell being divided or segmented.
The nucleus of less mature neutrophils is not segmented, but has a band or rod-like shape. Less mature neutrophils - those that have recently been released from the bone marrow into the bloodstream - are known as "bands" or "stabs".
Increased neutrophils count (neutrophilia)
An increased need for neutrophils, as with an acute bacterial infection, will cause an increase in both the total number of mature neutrophils and the less mature bands or stabs to respond to the infection. The term "shift to the left" is often used when determining if a patient has an inflammatory process such as acute appendicitis or cholecystitis.
In addition to bacterial infections, neutrophil counts are increased in:
1. Many inflammatory processes.2. During physical stress3. With tissue necrosis that might occur after a severe burn 4. Myocardial infarction. 5. Granulocytic leukemia.
Shift to left Increased ك bands Means acute infection, usually bacterial.Shift to right à Increased hypersegmentedneutrophile.
Decreased neutrophil count (neutropenia)
This take place in the following: Typhoid fever Brucelosis Viral diseases, including hepatitis, influenza, rubella, and mumps. An great infection can also deplete the bone marrow of neutrophils and
produce neutropenia. Many drugs used to treat cancer produce bone marrow depression and can
significantly lower the neutrophil count.
2. Lymphocytes
19

Lymphocytes are the primary components of the body's immune system. They are the source of serum immunoglobulins and of cellular immune response. As a result, they play an important role in immunologic reactions.
All lymphocytes are produced in the bone marrow. The B-cell lymphocyte also matures in the bone marrow and controls the antigen-antibody response that is specific to an offending antigen; the T-cell lymphocyte matures in the thymus gland, the T cells are the master immune cells of the body, consisting of T-4 helper cells, killer cells, cytotoxic cells, and suppressor T-8 cells.
In adults, lymphocytes are the second most common WBC type after neutrophils, hence lymphocytosis is usually associated with neutropenia and lymphopenia is associated with neutropeina. In young children under age 8, lymphocytes are more common than neutrophils.
Lymphocytes increase (lymphocytosis) in:
Many viral infections Tuberculosis. Typhoid fever Lymphocytic leukemia.
A decreased lymphocyte (lymphopenia) count of less than 500 places a patient at very high risk of infection, particularly viral infections.
3. Eosinophils
Eosinophils are associated with IgEantigen-antibody reactions.
1. The most common reasons for an increase in the eosinophil count are Allergic reactions such as hay fever, asthma, or drug hypersensitivity.
2. Parasitic infection3. Eosinophilic leukemia
4. Basophils
The purpose of basophils is not completely understood. Basophils are phagocytes and contain heparin, histamines, and serotonin. Tissue basophils are also called" mast cells." Similar to blood basophils, they produce
and store heparin, histamine, and serotonin. Basophile counts are used to analyze allergic reactions. An alteration in bone marrow function such as leukemia or Hodgkin's disease as well
as allergic reaction may cause an increase in basophils.
5. Monocytes
Monocytes are the largest cells in normal blood. They act as phagocytes in some inflammatory diseases and are the body's second line of defense against infection.
Diseases that cause a monocytosis include: Tuberculosis, Malaria, Brucellosis,Monocytic leukemia,Chronic ulcerative colitis .
20

RBCs Abnormal MorphologyNomenclature of red cell shapes
New Terminology Old terms, synonymsDiscocyte Biconcave discEchinocyte (I-III) Burr cell, crenated cell, berry cellAcanthocyte Spur cell, acanthoid cellStomatocyte Mouth cell, cup form, mushroom cap,
uniconcave discSpherocyte Spherocyte, prelytic sphere,
microspherocytesSchizocyte Schistocyte, helmet cell, fragmented cellElliptocyte&OvalocyteDrepanocyte Sickle cellCodocyte Target cellDacryoctye Teardrop cell, tennis racket cell
21
Hypochromia Grading1+Area of central pallor is one-half of cell diameter2+Area of pallor is two-thirds of cell diameter3+Area of pallor is three-quarters4+Thin rim of hemoglobinAbnormal erythrocyte morphology is found in pathological states that may be abnormalities in size (anisocytosis), in shape (poikilocytosis), in hemoglobin content or the presence of inclusion bodies in erythrocyte and in Red cell distribution.
I. Variation in Red cell Distribution
1. Agglutination
Morphology: Irregular clumps of red cellsFound in:Cold agglutininsWarm autoimmune hemolysis
2. Rouleaux
Morphology: Stacks of RBC's resembling a stack of coins.Found in:HyperfibrinogenaemiaHyperglobulinaemia
II. Variation in erythrocyte size (anisocytosis)
22

1. Microcytosis
Morphology:Decrease in the red cell size. Red cells are smaller than ± 7µm in diameter. The nucleus of a small lymphocyte (± 8,µm) is a useful guide to the size of a red
Found in:Iron deficiency anemia.Thalassaemia.Sideroblastic anemia.Lead poisoning.Anemia of chronic disease.
2. Macrocytosis
Morphology:Increase in the size of a red cell. Red cells are larger than 9µm in diameter. May be round or oval in shape, the diagnostic significance being different.Found in:Folate and B12 deficiencies (oval)Ethanol (round)Liver disease (round)Reticulocytosis (round)
III. Variation in Hemoglobin Content-Color Variation
1. Hypochromasia
Morphology:Increase in the red cells' central pallor which occupies more than the normal third of the red cell diameter.Found in:Iron deficiencyThalassaemiaany of the conditions leading to Microcytosis
2. Polychromasia
23
Morphology : Red cells stain shades of blue-gray as a consequence of uptake of both eosin (by hemoglobin) and basic dyes (by residual ribosomal RNA). Often slightly larger than normal red cells and round in shape - round macrocytosis.
Found in:Any situation with reticulocytosis - for example bleeding, hemolysis or response to haematinic factor replacement
IV. Variation of red cells shape (Poikilocytosis)
RBCs may have different shapes.
1. Target Cells
Morphology:Red cells have an area of increased staining which appears in the area of central pallor.Found in:Obstructive liver diseaseSevere iron deficiencyThalassaemiaHaemoglobinopathies (S &C)Post splenectomy
2. Spherocytosis
Morphology:Red cells are more spherical. Lack the central area of pallor on a stained blood film.Found in:Hereditary spherocytosisImmune haemolytic anemia
24

Zieve's syndromeMicroangiopathichaemolytic anemia.( MAHA)
3. StomatocytosisMorphology:Red cells with a central linear slit or stoma. Seen as mouth-shaped form in peripheral smear.Found in:Alcohol excessAlcoholic liver diseaseHereditary stomatocytosisHereditary spherocytosis
4. Ovalocytes
Morphology:oval shape red blood cellFound in:Thalassaemia major.Hereditary ovalocytosis.Sickle cell anemia.
5. Elliptocytosis
Morphology:The red cells are oval or elliptical in shape. Long axis is twice the short axis.Found in:Hereditary elliptocytosisMegaloblastic anemiaIron deficiencyThalassaemiaMyelofibrosis
6. Sickle Cells
25

Morphology: Sickle shaped red cells
Found in:Hb-S disease
7. Schistocytosis
Morphology: Fragmentation of the red cells.
Found in:DICMicro angiopathichaemolytic anemiaMechanical haemolytic anemia
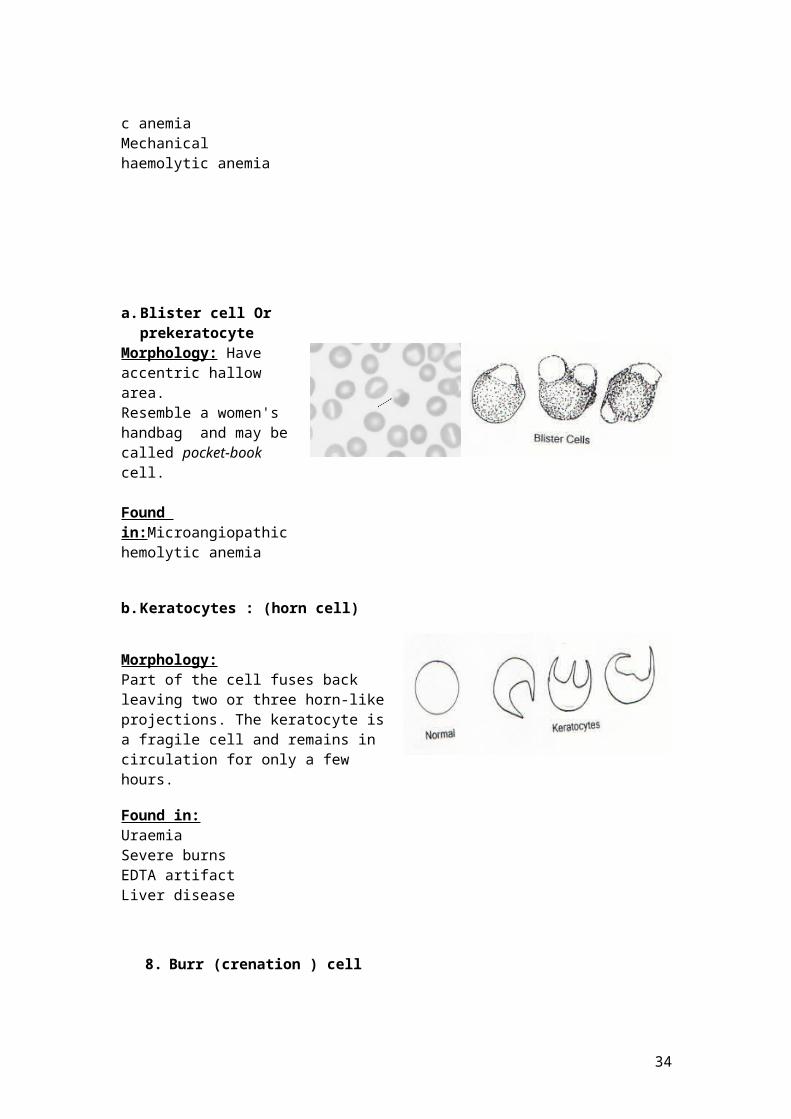
a. Blister cell Or prekeratocyte
Morphology: Have accentric hallow area.Resemble a women's handbag and may be called pocket-book cell.
Found in:Microangiopathic hemolytic anemia
b. Keratocytes : (horn cell)
Morphology:Part of the cell fuses back leaving two or three horn-like projections. The keratocyte is a fragile cell and remains in circulation for only a few hours.
Found in:UraemiaSevere burnsEDTA artifactLiver disease
26

8. Burr (crenation ) cell
Morphology:Red cell with uniformly spaced, pointed projections on their surface.Found in:hemolytic anemiaUremia.Megaloblastic anemia
9. Acanthocytosis
Morphology:are red blood cells with irregularly spaced projections, these projections very in width but usually contain a rounded end, and lack an area of a central pallor.
Found in:Liver diseasePost splenectomyAnorexia nervosa and starvation
10. Teardrop Cells
Morphology : Red cells shaped like a tear drop or pear
Found in:Bone marrow fibrosisMegaloblastic anemiaIron deficiencyThalassaemia
V. Erythrocyte inclusion bodies
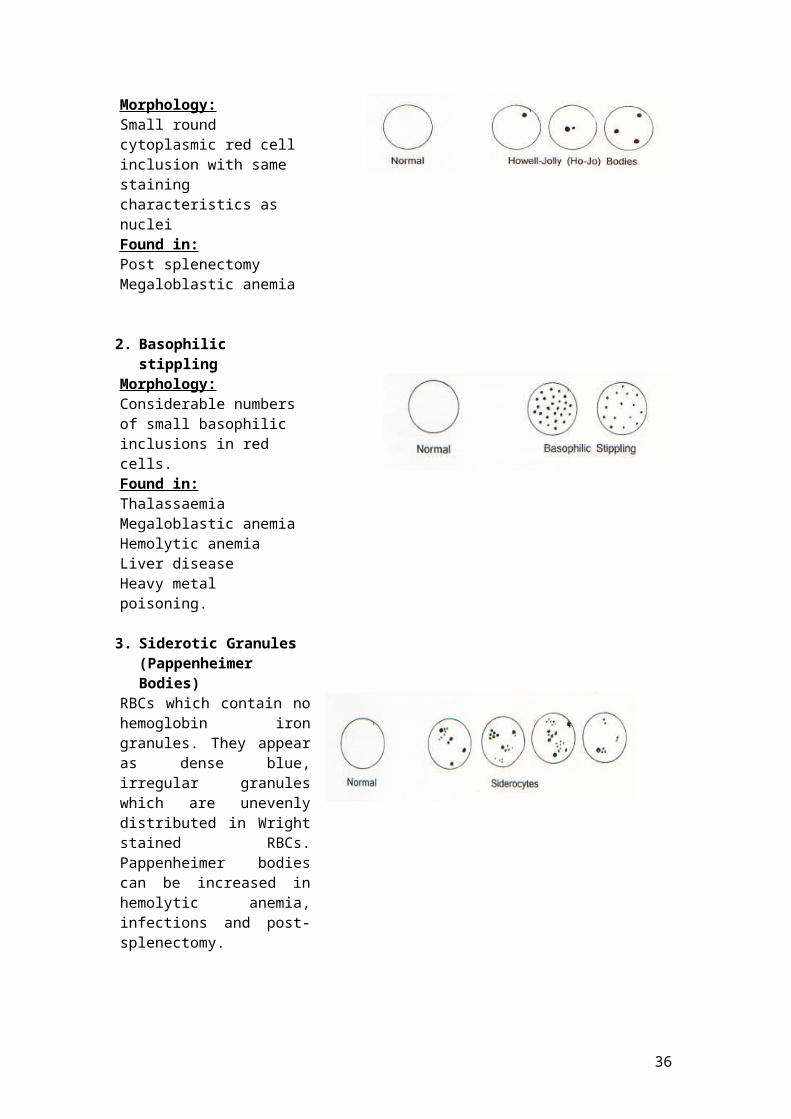
1. Howell-Jolly BodiesMorphology:Small round cytoplasmic red cell inclusion with same staining characteristics as nucleiFound in:Post splenectomyMegaloblastic anemia
27

2. Basophilic stipplingMorphology:Considerable numbers of small basophilic inclusions in red cells.Found in:ThalassaemiaMegaloblastic anemiaHemolytic anemiaLiver diseaseHeavy metal poisoning.
3. Siderotic Granules (Pappenheimer Bodies)
RBCs which contain no hemoglobin iron granules. They appear as dense blue, irregular granules which are unevenly distributed in Wright stained RBCs. Pappenheimer bodies can be increased in hemolytic anemia, infections and post-splenectomy.
4. Heinz BodiesRepresent denatured hemoglobin (methemoglobin - Fe+++) within a cell. With a supravital stain like crystal violet, Heinz bodies appear as round blue precipitates. Presence of Heinz bodies indicates red cell injury and is usually associated with G6PD-deficiency.
5. Cabot RingsReddish-blue threadlike rings in RBCs of severe anemia's. These are remnants of the nuclear membrane or remnants of microtubules and appear as a ring or figure 8 pattern. Very rare finding in patients with
28

Megaloblastic anemia, severe anemia's, lead poisoning, and dyserythropoiesis.
6. ProtozoanInclusionTwo organisms are have a tendency to invade the RBCs.1. All 4 species of the malaria
parasite will invade RBCs. We will see the Plasmodium of different species in RBCs.
2. Bebesiamicroti
Reticulocyte CountReticulocytes are immature RBCs that contain remnant cytoplasmic ribonucleic acid (RNA) and organelles such as mitochondria and ribosomes. We know that the RBCs have six stages of the development to became mature erythrocyte begins with : Pronormoblast, Basophilic normoblast, ,polychromatophilicnormoblast, orthochromicnormoblast, reticulocyte, and mature red blood cell. The first four stages are normally confined to the bone marrow. The reticulocyte, however, is found in both the bone marrow and peripheral blood. In the bone marrow, it spends approximately 2 to 3 days maturing and is then released into the blood, where it ages for an additional day before becoming a mature red blood cell.
The reticulocyte count is an important diagnostic tool. It is a reflection of the amount of effective red blood cell production taking place in the bone marrow. Since the life span of a red cell is 120 days, ± 20 days, the bone marrow replaces approximately 1 % of the adult red blood cells every day. The normal value for a reticulocyte count is therefore 0.5 to 1.5/100 red blood cells (or, 0.5 to 1.5%), with a range of 25 to 75 X 10 9/L for the absolute count (multiply the red blood cell count by the percentage of reticulocytes).
Decreased reticulocyte count indicates that the bone marrow is not producing a normal
29

number of red blood cells. Low production may be caused by a lack of vitamin B, folic acid, or iron in the diet; or by an illness affecting the bone marrow (for example, cancer ). Further tests are needed to diagnose the specific cause. E.g:
1. Aplastic anemia.2. Exposure to radiation or radiation therapy.3. Chronic infection.4. Untreated pernicious anemia, megaloblastic anemia and iron deficiency anemia. 5. Medications such as azathioprine, chloramphenicol, dactinomycin, methotrexate,
and other chemotherapy medications.
Increased reticulocyte count when the bone marrow makes more red cells in response to
1. thalassemia, sideroblastic anemia.2. in acute and chronic blood loss.3. Hemolytic anemias.4. Pregnancy.5. Pernicious Anemia or iron deficiency anemia after treatment.6. Medications such as levodopa, malarial medications, corticotrophin, and fever-
reducing medications.
Counts in newborn may be somewhat higher (2-6%) but return to adult levels in 1-2 weeks.
Reticulocytes are visualized by staining with vital dyes (such as new methylene blue) that precipitate the RNA and organelles, forming a filamentous network of reticulum (Fig. 2). On Wright stain.the reticulocyte appears polychromatophilic or as a macrocytic blue red cell. The reticulocyte is a means of assessing the erythropoietic activity of the bone marrow.
Reagents and Equipment
1. New methylene blue or Brilliant Cresyl Blue (Supravital Stain) solution. New methylene blue (CI 52030) 1.0 g
) certified by the U.S. BiologicalStain Commission( Sodium chloride 0.89gDistilled water 100mLMix for at least 15 minutes, filter, and store at room temperature. Filter again on the day of use.
2. Glass slides. 3. Microscope.
Specimen
Whole blood (1 mL), using tripotassium EDTA as the anticoagulant. Capillary blood may also be used.
Principle
30

After the orthochromicnormoblast loses its nucleus, a small amount of RNA remains in the red blood cell, and the cell is known as a reticulocyte. To detect the presence of RNA and organelles, the red blood cells must be stained while they are still living. This process is called supra¬vital staining. Whole blood is incubated with new methylene blue. Smears of this mixture are then prepared and examined. The number of reticulocytes in 1000 red blood cells is determined. This number is divided by 10 to obtain the reticulocyte count in percent.
Procedure:
1. Mix equal amounts of methylene blue and EDTA (two to three drops) on a small test tube. If anemic use a larger proportion of blood; use a smaller proportion of blood if polycythaemic.
2. Mix the tube and allow standing at room temperature or leaving in water bath or incubator at 37oC for 15-20 minutes.This allows the reticulocytes adequate time to take up the stain.
3. Mix blood and stain mixture thoroughly and make two thinwedge or spun smears and allow to air dry.
4. Place the first slide on the microscope stage and, using the low power objective (10X), find an area in the thin portion of the smear in which the red blood cells are evenly distributed and are not touching each other. Carefully change to the "oil immersion objective (100x) and further locate an area in which there are approximately 100 to 200 red blood cells per oil immersion field.
5. As soon as the proper area is selected, the reticulocytes may be counted. The red blood cells will be a light to medium green in color. The RNA present in the reticulocytes stains a deep blue. The reticulum may be abundant or sparse, depending on the cell's stage of development. The youngest reticulocyte shows
A B CFIG. 1. Stages of maturation in the reticulocyte count.
31
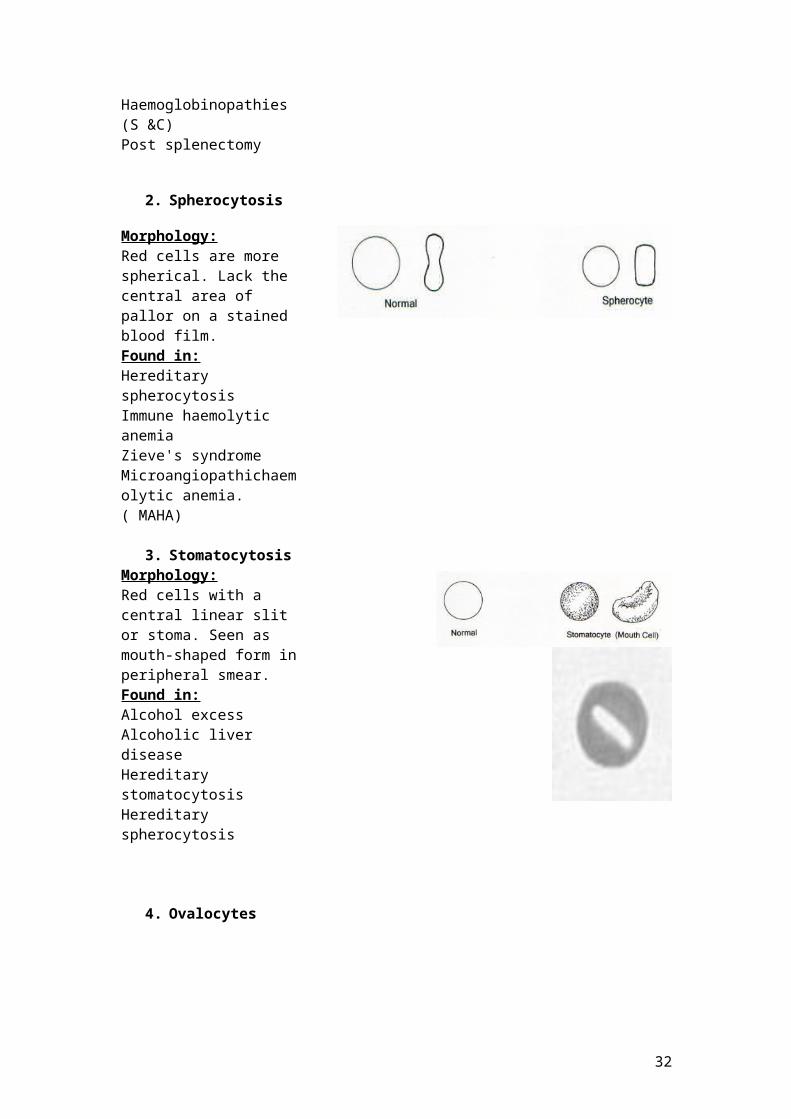
FIG. 2. Reticulocytes. (Supravital staining of the red blood cells with new methylene blue.) (Magnification xl000.)
a larger amount of RNA (Fig. 1 A), whereas the more mature reticulocyte shows only a small amount of RNA (Fig. 1 C). Count all of the red blood cells in the first field on one cell counter. At the same time, enumerate the reticulocytes (Fig. 2) in the same field with a second cell counter. To be considered a reticulocyte the red cell must contain two or more blue-staining particles. Move the slide as described in the Differential Cell Count procedure, using the cross-sectional method, until all reticulocytes in 1000 red blood cells have been counted.
6. A second technologist may repeat the reticulocyte count in the same manner as described in step 7 on the second reticulocyte smear. The two results should agree within ± 20% of each other. If they do not, repeat the reticulocyte count on the third smear.
7. Average the two results and calculate the reticulocyte count as shown below.
% Reticulocytes = Number of reticulocytes in 1000 RBCs × 1001000 (RBC's observed)
EXAMPLE: 25 reticulocytes in 1,000 total RBC’s
Reticulocyte count = 25x 100 = 2.5%1000
8. Calculate the corrected ret. count, absolute reticulocyte count and the reticulocyteproduction index if applicable and/or desired.
9. If no retics are seen in 500 cells, both slides should be scanned for retics. If a retic is found on scan report retic count as <0.1%. If no retics are seen, set it up again, and if no retics are seen on the new slides then report as no retics seen on smear.
Miller Disc Method of Counting
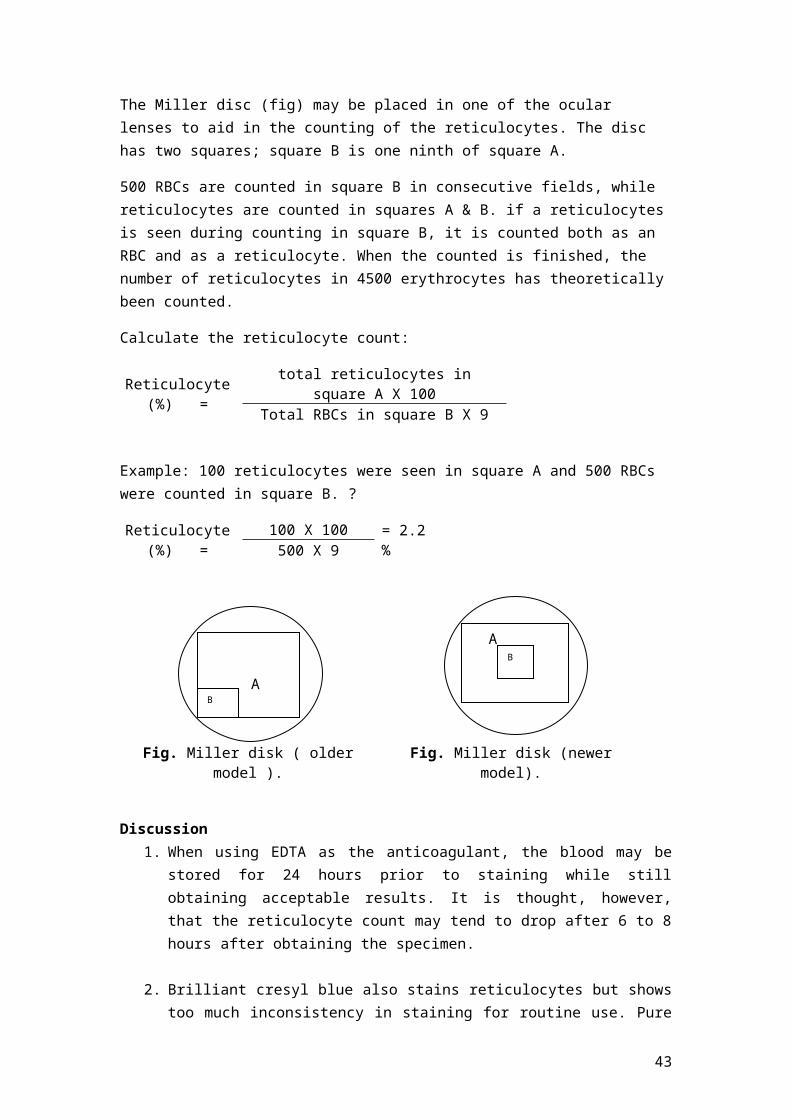
The Miller disc (fig) may be placed in one of the ocular lenses to aid in the counting of the reticulocytes. The disc has two squares; square B is one ninth of square A.
32

500 RBCs are counted in square B in consecutive fields, while reticulocytes are counted in squares A & B. if a reticulocytes is seen during counting in square B, it is counted both as an RBC and as a reticulocyte. When the counted is finished, the number of reticulocytes in 4500 erythrocytes has theoretically been counted.
Calculate the reticulocyte count:
Reticulocyte (%) = total reticulocytes in square A X 100Total RBCs in square B X 9
Example: 100 reticulocytes were seen in square A and 500 RBCs were counted in square B. ?
Reticulocyte (%) = 100 X 100 = 2.2 %500 X 9
Fig. Miller disk ( older model ). Fig. Miller disk (newer model).
Discussion 1. When using EDTA as the anticoagulant, the blood may be stored for 24 hours prior
to staining while still obtaining acceptable results. It is thought, however, that the reticulocyte count may tend to drop after 6 to 8 hours after obtaining the specimen.
2. Brilliant cresyl blue also stains reticulocytes but shows too much inconsistency in staining for routine use. Pure azure B, however, may be used in place of new methylene blue with good results (using the same stain concentration and procedure as described above).
3. The blood-to-stain ratio does not have to be exactly equal. For best results, a larger proportion of blood should be added to the stain when the patient's hematocrit is low. Add a smaller amount of blood to the stain when the patient has an unusually high hematocrit.
4. The time allowed for staining of the reticulocyte is not critical. It should not, however, be less than 10 minutes.
5. The presence of a high blood sugar (glucose) or the use of heparin as the anticoagulant may cause the reticulocytes to show pale staining.
6. It is advisable not to counter stain the reticulocyte smears with Wright stain because any precipitated stain may cause confusion in the identification of reticulocytes
AB
AB
33
7. It is extremely important that the blood and stain be mixed well prior to making smears. The reticulocytes have a lower specific gravity than mature red blood cells and, therefore settle on top of the red blood cells in the mixture.
8. Careful focusing of the microscope is essential. Platelet granules and leukocyte granules will stain with the dye and these may be easily mistaken for reticulocytes.
9. Red blood cells containing areas of high refractility may be noted on the smear. These cells should not be confused with reticulocytes , the RNA remnants in a reticulocyte are not refractile.This condition is probably due to moisture in the air and poor drying of the smear.
10. If the procedure is followed carefully, the distribution of the reticulocytes on the films will be good, and the allowable difference between the number of reticulocytes per 500 RBC’s is 5 reticulocytes.
11. Howell-Jolly bodies, Heinz bodies, and iron particles, if present will also take up the stain.
Howell-Jolly bodies can be distinguished as large, appear as one, sometimes two, round, deep purple staining structures.
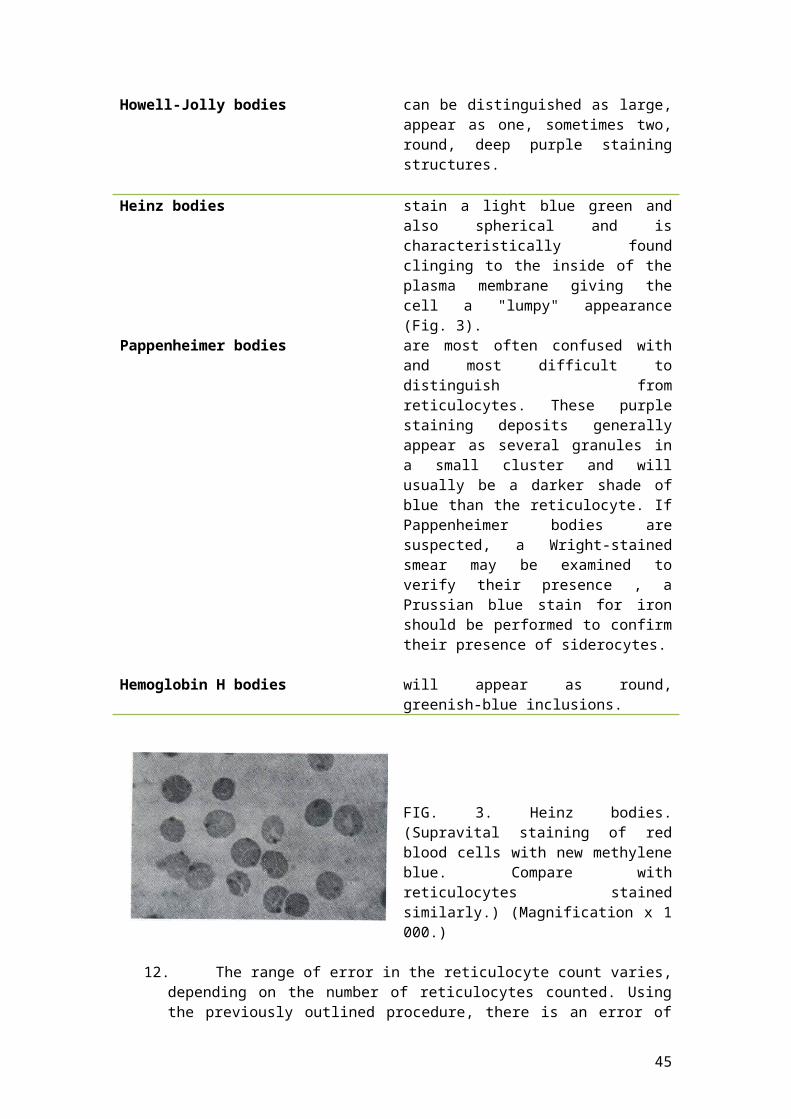
Heinz bodies stain a light blue green and also spherical and is characteristically found clinging to the inside of the plasma membrane giving the cell a "lumpy" appearance (Fig. 3).
Pappenheimer bodies are most often confused with and most difficult to distinguish from reticulocytes. These purple staining deposits generally appear as several granules in a small cluster and will usually be a darker shade of blue than the reticulocyte. If Pappenheimer bodies are suspected, a Wright-stained smear may be examined to verify their presence , a Prussian blue stain for iron should be performed to confirm their presence of siderocytes.
Hemoglobin H bodies will appear as round, greenish-blue inclusions.
34

FIG. 3. Heinz bodies. (Supravital staining of red blood cells with new methylene blue. Compare with reticulocytes stained similarly.) (Magnification x 1 000.)
12. The range of error in the reticulocyte count varies, depending on the number of reticulocytes counted. Using the previously outlined procedure, there is an error of approximately ± 25% in the reticulocyte counts within the normal range. This decreases to ± 10% in a reticulocyte count of 5% and decreases even further as the uncorrected reticulocyte count increases.
13. An automated procedure for counting reticulocytes using flow cytometry with fluorescent dyes . This method is more rapid, precise, and accurate than the manual procedure described here.
Reporting ResultsThe reticulocyte percentage may be misleading if one does not consider the degree of anemiaor of intense erythropoietic stimulation. The reticulocyte count may be truly elevated, indicating increased effective erythropoiesis, or it may only appear elevated because the total number of erythrocytes is decreased. To compensate for this the best and simplest method of reporting Retic is the Absolute Retic Count.
Absolute Reticulocyte Count (ARC): is the actual number of reticulocytes in 1L of whole blood. This is calculated by multiplying the retic % by the RBCs count and dividing by 100. Reference values of ARC is 25.0 - 75,0X10⁹/L.
ARC = Reticulocyte( % )X RBCs count (1012/ L)100
For example, a patient's reticulocyte count is 2% and the RBCs count is 2.20X10¹²/L the normal RBCs count (3.6-5.6) X 1012/L, the ARC would be calculated as follows:
ARC = 2 X (2.20X1012/L) = 44.0X10⁹/L100
Corrected Reticulocyte CountA reticulocyte count should reflect the total production of red blood cells, regardless of the concentration of red cells in the blood (red blood cell count). The reticulocyte count can increase either because more reticulocytes are in the circulation, or because there are fewer mature cells. Therefore, the observed reticulocyte count may be corrected to a normal hematocrit of 45%. As an example, compare the following two patients. Patient # 1 has a hematocrit of 42% and a reticulocyte count of 1.0%. Patient #2 has a hematocrit of 21 % and a reticulocyte count of 2.0%. Patient #2, theoretically, has 1/2 as many red blood cells as patient # 1 but has the same number of reticulocytes as patient # 1 because the reticulocytes are diluted by
35
only 1/2 the number of red blood cells, as in patient # 1. To compensate for this, a corrected reticulocyte count is calculated based on a normal hematocrit of 45%. The formula for this correction is:
Corrected reticulocyte count (%) =Patient'shematocrit
× Reticulocyte count (%) 45%
For example, if a patient presenting with a reticulocyte count of 10% with a hematocrit of 22% , the corrected reticulocyte would be:
Corrected reticulocyte count = 10% × 22% = 4.9%45%
In addition to correcting a reticulocyte count for an abnormally low hematocrit, consideration should also be given to the presence of marrow reticulocytes present in the peripheral blood. In this circumstance, the reticulocyte production index is calculated.
As previously stated, the reticulocytes spend approximately two to three days in the bone marrow before being released into the blood where they spend 1 day maturing in the peripheral circulation. Under some circumstances the marrow reticulocytes are released directly into the blood prior to maturation in the bone marrow. This is detected by nucleated red blood cells and/or polychromatophilicmacrocytes(shift cells) present in the circulating blood. To correct for the increased time spent in maturation in the peripheral blood, the reticulocyte production index is calculated by dividing the corrected reticulocyte count by the number of days the reticulocyte most probably takes to mature in the blood (Tabel 1).
Table 1 Maturation Time of reticulocytesMaturation Time ( Days) Hematocrit (%)
1 451.5 352 253 15
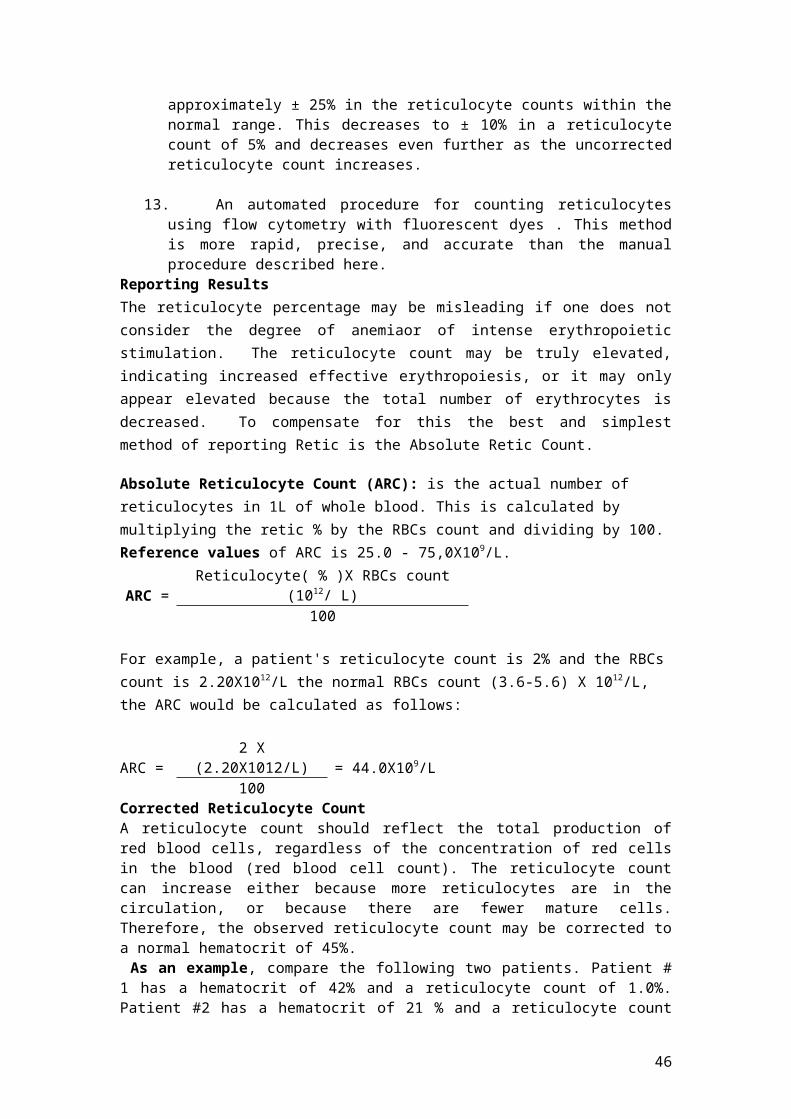
Retic Production Index (RPI) =Corrected retic count (%)
# Days (Maturation time)
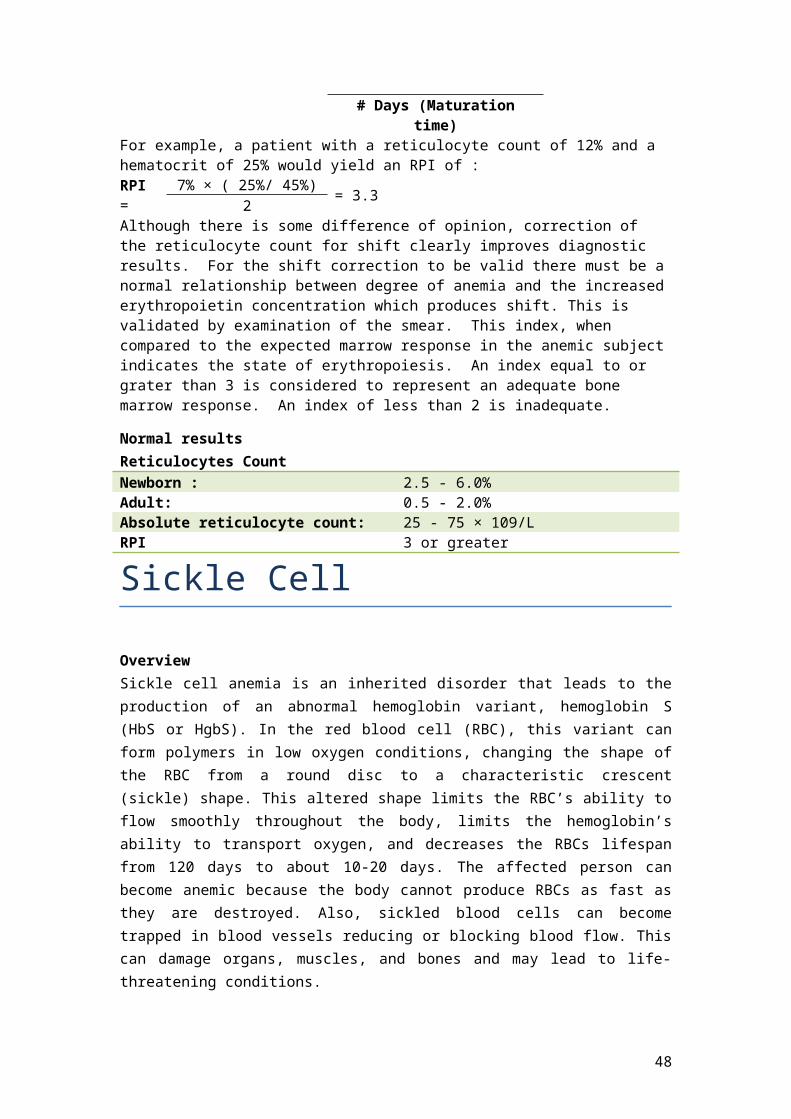
For example, a patient with a reticulocyte count of 12% and a hematocrit of 25% would yield an RPI of :
RPI = 7% × ( 25%/ 45%)= 3.3
2Although there is some difference of opinion, correction of the reticulocyte count for shift clearly improves diagnostic results. For the shift correction to be valid there must be a normal relationship between degree of anemia and the increased erythropoietin concentration which produces shift. This is validated by examination of the smear. This index, when compared to the expected marrow response in the anemic subject indicates the state of erythropoiesis. An index equal to or grater than 3 is considered to represent an adequate bone marrow response. An index of less than 2 is inadequate.
Normal resultsReticulocytes CountNewborn : 2.5 - 6.0%Adult: 0.5 - 2.0%Absolute reticulocyte count: 25 - 75 × 109/L
36

RPI 3 or greater
Sickle Cell
OverviewSickle cell anemia is an inherited disorder that leads to the production of an abnormal hemoglobin variant, hemoglobin S (HbS or HgbS). In the red blood cell (RBC), this variant can form polymers in low oxygen conditions, changing the shape of the RBC from a round disc to a characteristic crescent (sickle) shape. This altered shape limits the RBC’s ability to flow smoothly throughout the body, limits the hemoglobin’s ability to transport oxygen, and decreases the RBCs lifespan from 120 days to about 10-20 days. The affected person can become anemic because the body cannot produce RBCs as fast as they are destroyed. Also, sickled blood cells can become trapped in blood vessels reducing or blocking blood flow. This can damage organs, muscles, and bones and may lead to life-threatening conditions.
Hemoglobin S production arises from an altered (mutated) “S” gene. Hemoglobin S differs from normal adult hemoglobin (hemoglobin A) only by a single amino acid substitution (a valine replacing a glutamine in the 6th position of the beta chain of globing). A person with one altered S gene will have sickle cell trait. In those who have sickle cell trait, 20% to 40% of the hemoglobin is HbS The person does not generally have any symptoms or health problems but can pass the gene on to his children.
When a person has two copies of the S gene (homozygous SS), he has sickle cell anemia. In sickle cell disease, as much as 80% to 100% of the hemoglobin may be HbS. Those individuals who carry both abnormal genes have sickle cell disease. In this condition the person may not experience any symptoms under 'normal' conditions, but may experience episodes called 'sickling crises' brought on by, for example, infection or dehydration. During such episodes symptoms can include joint pain, abdominal pain, fever and seizures. In the long-term, sufferers may experience haemolyticanaemia (breakdown of red blood cells), growth impairment, jaundice and increased risk of serious infections.
Sickle cell test:
A sickle cell test is a blood test done to screen for sickle cell trait or sickle cell disease. Sickle cell disease is an inherited blood disease that causes red blood cells to be deformed (sickle-shaped).
If the screening test is negative, it means that the gene for sickle cell trait is not present. If the screening test is positive, then further haemoglobin testing must be performed to confirm whether one mutated gene or both are present. In unaffected individuals HbS is not present.
37

Principle:
When a drop of blood is sealed between a cover slip and a slide, the decline in oxygen tension due to oxidative processes in the blood cells leads to sickling. This is the common diagnostic test for sickle cell anemia and sickle cell trait used in clinical laboratories.
In another method, a saline citrate suspension of blood is allowed to stand in a test tube under a layer of paraffin oil until sickling takes place.’ In employing any of the common diagnostic tests for sickling it is desirable to obtain blood which has a low. fraction of oxyhemoglobin.
When we add a chemical reducing agents. Sodium dithionite or sodium metabisulfite. This rapidly reduces oxyhemoglobin to reduced hemoglobin, and this property suggested its use in testing erythrocytes for sickling.
Sodium Metabisulfite Method
Specimen:Whole blood using heparin or EDTA as anticoagulant. Capillary blood may also be used.
Reagent and equipment:1. Sodium Metabisulfite 2% (w/v); prepared by dissolving 0.2 gm sodium metabisulfite
in 10 ml DW. Stable for 8 hours at room temperature.2. Petroleum jelly.3. Cover glass.4. Microscope.
Procedure:1. Place one drop of the blood to be tested in a glass slide.2. Add 1- 2 drops of sodium metabisulfite to the drop of blood and mix well with an
applicator stick.3. Place a cover glass on top of the sample and press down lightly on it to remove any
air bubbles and to form a thin layer of the mixture. Wipe of the excess sample.4. Carefully rim the cover gloss with the petroleum jelly, completely sealing the
mixture under the cover slip. 5. Examine the preparation for the present of sickle cells after one hour using 40 X
objective. In some instances, the red blood cells may take on a holly-leaf form. This shape is found in sickle cell trait, and, when present, the test is reported as positive.
6. If there is no sickling present at the end of one hour, allow the preparation to stand at room temperature for 24 hours, and examined at that time.
38
7. When sickle cells or the holly leaf form of the cells are present the results are reported as positive. Normal looking red cells or slightly crenated red blood cells as reported as negative.
Discussion:
1. The sickle cells or the holly-leaf form of the cell must come to a point or points to be considered positive. Elongated cells with a round end must not be confused with sickle cells.
2. Sickling of the cells is maximum at 37oC and decreased as the temperature lowers.
3. This test should not be performed on infants less than six months old.
4. With this method it is not possible to distinguish sickle cell trait from sickle cell disease. Hence if the test is positive, it is advisable to perform hemoglobin electrophoresis to determine the presence of the trait or the anemia and to positively identified the type of the sickling hemoglobin present.
Solubility testErythrocytes are lysed by saponin and the released hemoglobin is reduced by sodium hydrosulfite in a concentrated phosphate buffer. Under these conditions, reduced HbS is characterized by its very low solubility and the formation of crystals. The presences of HbS or HbC are indicated by the turbid solutions. The normal HbA under these same conditions results in a clear non-turbid solutions.
39

Gel ElectrophoresisElectrophoresis is a means of separating hemoglobin's. It depends on the migration of the hemoglobin molecules dissolved in a buffer on, or in, a supporting medium when an electric current is passed through them.Hemoglobin electrophoresis is a test that measures the different types of the oxygen-carrying substance (hemoglobin) in the blood.
Why the test is performed?Hempoglobin electrophoresis is performed to find out abnormal forms of hemoglobin (hemoglobinopathy).Many different types of hemoglobin (Hb) exist. The most common ones are HbA, HbA2, HbF, HbS, HbC, Hgb H, and Hgb M. Healthy adults only have significant levels of HbA and HbA2.Some people may also have small amounts of HbF (which is the main type of hemoglobin in an unborn baby's body). Certain diseases are associated with high HbF levels (when HbF is more than 2% of the total hemoglobin). HbS is an abnormal form of hemoglobin associated with sickle cell anemia. In people with this condition, the red blood cells have a crescent or sickle shape. These misformed cells then break down, or can block small blood vessels.HbC is an abnormal form of hemoglobin associated with hemolytic anemia. The symptoms are much milder than they are in sickle cell anemia.Other, less common, abnormal Hb molecules cause anemias.
Normal ValuesIn adults, these hemoglobin molecules make up the following percentages of total hemoglobin:
Hgb A1: 95% to 98% Hgb A2: 2% to 3% Hgb F: 0.8% to 2% Hgb S: 0% Hgb C: 0%
In infants and children, these hemoglobin molecules make up the following percentages of total hemoglobin:
Hgb F (newborn): 50% to 80% Hgb F (6 months): 8% Hgb F (over 6 months): 1% to 2%
What abnormal results meanThe presence of significant levels of abnormal hemoglobins may indicate:
Hemoglobin C disease Rare hemoglobinopathy
40

Sickle cell anemia
Methods of electrophoresisThere are two common methods: 1-Cellulose Acetate At Alkaline pHCellulose acetate Hb electrophoresis at alkaline pH is the primary screening procedure used to detect variant (abnormal) Hbs, of which there are several hundred. Hb, is made up of heme and globin, is identified according to the structure of the globin chains. Abnormal globin chains will differ in the number, type, and sequence of amino acids: this gives the Hb its identity. The major portion of normal adult Hb is A. In addition, up to 3.5% Hb A 2 is normally present, along with less than 2% Hb F. The more common mutant Hbs are S, C, E, D, G, and lepore. When an abnormal Hb is detected on cellulose acetate electrophoresis at an alkaline pH (8.2-8.6) further testing is frequently indicated: test for Hb S, quantitation of Hb A2 and F, and citrate agar gel; acid/alkaline globin chain or neutral pH electrophoresis may also be warranted.
Principle of the test Electrophoresis is the movement charge particles in an electric field. In an alkaline pH (8.2-8.6) Hb is a negatively charged molecule and will migrate toward the anode (+). The various Hbs moves at different rates depending on their net negative charge, which in turn is controlled by the composition (amino acids) of the Hb molecule (globin chain). The red cell hemolysate (red blood cell membranes are destroyed to free the Hb molecules for testing) is placed in a cellulose acetate membrane, which is positioned in an electrophoresis tray with the inoculated hemolysate near the cathode (-).One end of the cellulose acetate strip is immersed in the buffer (pH 8.2-8.6) on the cathode side and the other end is placed in the buffer on the anode (+) side. An electric current of specific voltage is allowed to run for a timed period. During electrophoresis, the Hb molecules migrate toward the anode because of their negative charge. The difference in the net charge of the Hb molecule determines its mobility and manifests its self by the speed with which it migrates to the positive pole. Example of the fast Hbs are Hb Bart’s and the tow fastest variants Hb H and I, while Hb C is the slowest common Hb. The cellulose acetate membrane is then stained in order to color the proteins (Hbs). By noting the distance each Hb has migrated and comparing this distance with the migration distance of known controls, the types of hemoglobins may be identified.
2- Citrate Agar Electrophoresis ( acid pH)
Citrate agar separates Hb fractions that migrate together on cellulose acetate agar, all Hb specimens that show an abnormal electrophoretic pattern in alkaline media (cellulose acetate agar) should undergo electrophoresis on an acid citrate agar. Citrate agar electrophoresis is used to confirm variant Hbs and further differentiates Hb S from Hb D and G, and Hb C from Hb E, O Arab, and CHarlem. Theprocedure should not be used as a screening procedure because many abnormal Hbs migrate with Hb A. However, this procedure is the method of choice when examining newborns (cord blood specimens) and infants under 3 months of age for some abnormal Hbs such as S and C because the test is able to detect quantities of Hb not easily seen by other techniques.
41

Cellulose Acetate Agar pH 8.4cathode
- + anode
Normal
Sickle trait
Hb D trait
SC disease
SE disease
Normal cord blood
C Harlem trait
control
0 A2 S F AC DE GO
Citrate Agar pH 6.0-6.2cathod
- + anode
Normal
Sickle trait
Hb D trait
SC disease
SE disease
Normal cord blood
C Harlem trait
control
C S A FDG
42
EOA2
Hemoglobin A2
Determination of A2 hemoglobin (Hb A2) in bloodIntroduction
Hemoglobin A2 is a normal variant of hemoglobin A that consists of two alpha and two delta chains and is found in small quantity in normal human blood.
Normal value of Hb A2 in the adult is ( 1.8% – 3.5%). Elevated level (up to 8%) generally indicate β. Thalassemia trait, although some patients with homozygous. Thalassemia may show an increased HbA2. Decreased level may be found in iron deficiency anemia, Hb H disease, hereditary persistence of Hb F, fibroblastic anemia, and in carriers of α Thalassemia.
The anion exchange micro chromatography procedure outlined below is an accurate and easily performed method for HbA2 Quantization.
Principle
A hemolysate is prepared from the patients red blood cells. A specific amount of hemolysate is then added to the top of the resin column. The diethyl amino ethyl DEDE resin is a preparation of cellulose attached to positively charged molecules, thus giving the cellulose appositive charge.
When the hemolysate is added to the column, the PH of the buffer present determines the net negative charge of the Hb, which then binds to the positively charged cellulose resin. The Hbare selectively removed from cellulose according to the PH of the developer. In this procedure the HbA2 (originally bound to the resin) is released from the resin and eluted by the developer as it passes through the column. Most other normal and abnormal HbS remain bound to the resin in the column. The eluted HbA2 is then measured spectrophotometrically and compared with the amount of total Hb in the specimen to calculate the percent of HbA2 present.
43
The Kit used in this lab does not need PH developer, because Hb A 2 originally not bounded to the resin. Its free, but using separating Filter for isolation .
Reagent & Equipment
1. Test tubes: 2.5 ml of buffered DAEA resin 2. Lysis reagent : 20 ml of a TritonX100 solution 3. Separating filters4. HbA2 DEVELOPER( not used in this Lab )
Ingredients: HbA2 Developer contains 0.2 M glycine in deionized water. Potassium cyanide (0.01 %) has been added as a preservative.
5. Automatic pipettes6. Disposable test tubes7. Spectrophotometer set at 415 nm
Specimen Whole blood with Heparin or EDTA.Hb A2 is stable 1 week in blood at 4°C or 15 frozen at -20°C.
Procedure
1. Hemolisate preparation 1- Blood 50 µl 2- hemolysis reagent 300 µl, Wait 5 minutes. 3- Good mixing and leaved it for 5 min at R.T.
2. Separation and reading HbA2
1. Pipet in test tube 1 ( resin) Hb A2100µl from hemolisate.
2. Turn upside down test tube 1 till complete resuspension of theresin. Continue to shake gently the test tubes for 5 minutesusing a stirrer or turn upside down al least 6 times at intervals of1 minute.
3. Separate the liquid phase by gently pressing the separating filterin the test tube.4. Determine at 415 nm the absorbance of the liquid phase of thetest tube (A HbA2)
against a reagent blank made of liquid phasefrom a test tube without hemolisate. 3. Reading of total hemoglobin1. Pipet in Test tube 2 (empty) Hbtot 20µl from hemolisate and 10 ml from distilled
water.2. read the absorbance of totalhemoglobin (A Hb tot) against a reagent blank made of
distilled water.
CALCULATION
% Hb A2 =A Hb A2 x 100
A Hb tot x 22
Notes: This test must not be performed before six months age.
44
If the patient heterozygous for β- thalassemia also has iron deficiency, the hemoglobin A2 may be within the normal range.
If the patient has received a transfusion recently this test should not be performed. Some of the abnormal hemoglobin (Hb S, C, O, E, G, S-G hybrid) are interfere with
Hb A2 in this method. The presence of the abnormal hemoglobin should be confirmed by electrophoretic techniques. Hb F does not interfere with this method.
Hemoglobin F Acid StainHEMOGLOBIN F STAIN, ACID ELUTION (KLEIHAUER BETKE TEST)The acid elution test is employed to assess the distribution of hemoglobin F in the red blood cell:to determine whether hemoglobin F is present in the same amount in all red blood cells, or whether it is present in varying amounts in only some of the red blood cells.This information is useful in helping to diagnose hereditary persistence of fetal hemoglobin and in determining the presence of fetal red cells in the maternal circulation during pregnancy.
Reagents and Equipment1. Fetal cell fixing solution isEthyl alcohol, 80% (v/v). Stable in the refrigerator for 1
month (or 100 slides), unless the solution becomes cloudy. 2. Fetal cell buffer solutionis Citric acid-phosphate buffer, pH 3.2 to 3.3.
a. Dibasic sodium phosphate, 0.2 Mi. Dibasic sodium phosphate 14.2 g (Na2HPO4)
ii. Dilute to 500 mL with distilled water. Stable for 6 months when stored in the refrigerator.
b. Citric acid, 0.1 Mi. Citric acid (C6H8O7.H2O) 10.5 g
ii. Dilute to 500 mL with distilled water. Stable for 6 months when stored in the refrigerator.
Prior to use, prepare the citric acid-phosphate buffer: a. Dibasic sodium 13.3 mL
i. phosphate, 0.2 Mb. Citric acid, 0.1 M 36.7 mL
Check the pH of this mixture on a pH meter. The pH must be within 3.2 and 3.3.Fetal cell stain:
3. Erythrosin B (eosin B) stain, 0.1% (w/v), aqueous solution. Eosin yellowish, 1.25% (w/v), may be used as an alternative (0.5 g of eosin yellowish in 120 mL of absolute alcohol and 280 mL of distilled water), Add two to three drops of glacialacid.
4. Ehrlich's acid hematoxylin.Hematoxylin, crystalline 4.0 g Ethyl alcohol, 80% (v/v) 200 mL10% aqueous solutionof sodium iodate 8 mL Distilled water 200 ml
Heat the above solution until it boils, until lukewarm, and add the following: Glycerine 200 Aluminum sulfate 6.0 Glacial acetic acid 200
45
Mix, and store at room temper (Mayer's hematoxylin may also be used.)5. Coplin jars. 6. Waterbath, 37°C.
Specimen
Obtain four blood smears from thefingertip (toe or heel), or make blood smears from venous blood collected in EDTA anticoagulant. Obtain a similar blood specimen for a normal and abnormal control at the same time the patient's blood is collected. For best result blood should be less than 6 hours old, although successful staining has been achieve on specimens refrigerated for up to 2 weeks The smears should be fixed within 2 hours of preparation.
Principle
Blood smears are fixed with ethyl alcohol and then incubated in a citric acid-buffer solution In an acid medium (pH 3.2 to 3.3), hemoglobin F is resistant to elution from the red blood cell, while other types are removed from the red cells. The slides are stained with hematoxylin (stains the white cell nuclei) and erythrosin B (stains the red cells). The smears are then reviewed microscopically to mine the presence of hemoglobin F, and percentage of red blood cells containing fetal hemoglobin may be assessed.
Procedure
1. Prewarm citric acid-phosphate buffer. Place 50 mL of the buffer solution into a coplin jar and cover. Incubate at 37°C for 30 minutes. (Make certain the level of water in the incubator is level with, or above, the level of buffer in the coplin jar.)
2. Preparation of blood smears. a. Patient-Make several thin (a monolayer of cells) blood smears. b. Normal control-Make two thin blood smears from a normal adult. c. Positive control-Mix two drops of cord blood with two drops of normal, ABO
compatible, whole blood. Make two thin blood smears. (As an alternative, use cord blood, alone, as the positive control.
3. Allow the blood smears to air-dry for at least 10 minutes. 4. Fix blood smears (patient and controls) in 80% ethyl alcohol for 5 minutes5. Rinse the smears carefully in distilled water and allow to air-dry.
6. Place the dry smears in the prewarmed citric acid-phosphate buffer solution for 5 minutes. At 1 and 3 minutes (of incubation), carefully lift each slide out of the buffer solution and immediately replace. This action will provide a gentle stirring of the solution.
7. After 5 minutes, remove the slides from the citric acid-phosphate buffer solution and carefully rinse with distilled water. Air-dry.
46

8. Stain the dry smears in acid hematoxylin for 3 minutes. Rinse with distilled water and remove as much of the water as possible from the smears by gently tapping one end of the slide on an absorbent material.
9. Counterstain the smears with erythrosin B for 4 minutes. Rinse with distilled water, allow to air-dry, and coverslip (if desired).
10. Examine the slides microscopically, (oil immersion objective [1000]), for the presence of hemoglobin F. Red cells containing large amounts of hemoglobin F will stain a deep pink. The intensity of the pink staining is directly proportional to the concentration of hemoglobin F.Cells containing normal amounts (less than 2%) of hemoglobin F will stain as very pale ghost cells.
11. To determine the percentage of red blood cells containing fetal hemoglobin: a. Count the number of red blood cells in three to five microscopic fields and
determine the average # of red cells/ field. b. Examine 20 to 25 microscopic fields, counting the number of red cells con-
taining hemoglobin F. c. Calculate the percentage of RBC containing hemoglobin F as shown below:
Number of hgb F RBC/field =Number of hgb F RBC countedNumber of fields counted
% RBC with hgb F = Number of hgb F RBC/ field × 100Average number of RBC/field
Normal value
full-term newborns: Hb F cells are > 90%; normal adults Hb F cells are < 0.01%.
Discussion
1. Reticulocytes may resist elution and would, therefore, give the appearance of cells containing hemoglobin F.
2. The degree of elution of adult hemoglobin may very from patient to patient.3. In hereditary persistence of fetal hemoglobin, the amount of hemoglobin F in each
cell is constant and, therefore, all of the red blood cells are consistently stained. Conversely, in diseases such as sickle cell anemia, thalassemia, acquired aplastic anemia, and several other hemoglobinopathies, the amount of hemoglobin F present in the red blood cells varies. This shows up as an inconsistent staining of the red cells.
4. The pH of the citric acid-phosphate buffer is critical. A pH below 3.1 may cause elution of hemoglobin F from the red cells, while a pH above 3.3 may retard the elution of non-F hemoglobin from the cells.
5. A temperature above 25°C during fixation in the ethyl alcohol will inhibit elution of normal hemoglobin.
6. Ethyl alcohol concentrations above 80% may cause the elution of hemoglobin F, while concentrations below 80% may cause morphologic alterations.
47
Gluose-6-phosphate dehydrogenase (G-6-PD)
Glucose-6-Phosphate Dehydrogenase (G6PD) deficiency is the most common human enzyme deficiency in the world; it affects an estimated 400 million people. G6PD deficiency is also known as "favism," since G6PD deficient individuals are also sometimes allergic to fava beans. G6PD deficiency is an allelic abnormality which is inherited in an X-linked recessive fashion.
When someone has G6PD deficiency, complications can arise; hemolytic anemia and prolonged neonatal jaundice are the two major pathologies associated with G6PD deficiency. Both of these conditions are directly related to the inability of specific cell types to regenerate reduced nicotinamide adenine dinucleotide phosphate (NADPH); this reaction is normally catalyzed by the G6PD enzyme. In G6PD deficient individuals, anemia is usually caused by certain oxidative drugs, infections, or fava beans. When any one of these agents, or their metabolites, enters a G6PD deficient red blood cell, hemoglobin becomes denatured, thus destroying its function as the principal oxygen carrying molecule. In addition to being susceptible to hemolytic anemia, G6PD deficient individuals are also predisposed to prolonged neonatal jaundice. This can be a potentially serious problem as it can cause severe neurological complications and even death.
Principle:Glucose-6-phosphate dehydrogenase (G6PDH, D-glucose-6-phosphate) catalyzas the first step in the pentose phosphate shunt ,oxidising glucose-6-phosphate (G-6-P)to 6-phosphogluconate(6-PG) and reducing NADP to NADPH, which illustrate by the following equation: G-6-P + NADP+ 6-PG + NADPH + H+
NADP is reduced by G-6-PDH in the presence of G-6-P. The rate of formation of NADPH is directly proportional to the G-6-PDH activity and is measured spectrophotometrically as an increased in absorbance at 340nm. Production of a second molar equivalent of NADPH by erythrocyte 6-phosphogluconate dehydrogenase (6-PGDH) according to the reaction :
6-PG + NADP+
G-6PDH
Ribulose-5- phosphate + NADPH + H+ + CO26-PGDH
48

Specimen collection and storage
Whole blood collected with EDTA, heparine or acid citrate dextrose .Red cell G-6-PDH is stable in whole blood for one week refrigerated (2-8 ⁰c),but is unstable in red cell hemolysates. since activity is reported in term of number of red blood cell or gram hemoglobin, the red cell count or hemoglobin concentration should be determined prior to performing the G6PDH assay.
Procedure
The temperature of the reaction mixture should be maintained at 30⁰c or some other constant temperature.
1. prepare reaction mixture: Add 0.01ml blood directly to vial containing G-6-PDH assay solution
and mix thoroughly to completely suspend erythrocytes, let stand at room temperature (18-25⁰c) for 5-10min.
Add 2.0ml G-6-PDH substrate solution directly to vial and mix gently by inverting several times.
Transfer contents of vial to cuvet.2. Place cuvet in constant temperature cuvet compartment or water bath and
incubate for approximately 5min. to attain thermo; equilibrium.3. Read and record absorbance (A1) of test at 340 nm vs water or potassium
dichromate solution. This is initial A .(if using a water bath or incubator ,return cuvet to it)
4. Exactly 5min later, again read and record (A2), this is final A.5. To determine G-6-PDH activity do the following calculation.
Calculation:
ΔA per minutes = A2-A1/5 G-6-PDH activity is expressed as U/1012 erythrocyte (RBC)or as U/g hemoglobin
(Hb). G-6-PDH (U/1012 RBC) = ΔA per min X 3.01 X 10¹² X TCF / 0.01 X 6.22 X (N X 10*6) X 1000
Where:
3.01 = total reaction volume(ml)1012 = factor for expressing activity in 1012 cells0.01 = sample volume (ml)6.22 = millimolar absorptive of NADPH at 340 nmN X 106 = red cell count (red cells/mm³) determined for each specimen1000 = conversion of red cell count from mm³ to mlTCF =temperature correction factor (1at 30ºc)
49

This equation reduced to: G-6-PDH ( U/1012 RBC)= ΔA/min X (48,390/N) X TCF
Where:N = red cell count divided by 106TCF = temperature correction factor (1at 30⁰c)
G-6-PDH(U/gHb) = ΔA per min X 100 X 3.01 / ((0.01 X6.22 X Hb(g/dl)) X TCF = ΔA per min X 4839 / Hb (g/dl) X TCF
Where:
100 = factor to convert activity to 100ml3.01 = total reaction volume (ml)0.01 = sample volume (ml)6.22 = mill molar absorptive of NADPH at 340 nmHb (g/dl) = hemoglobin concentration determined for each specimenTCF = temperature correction factor (1 at 30⁰c)
Note: If anemia and/or leukocytosis is present: Use buffy coat free blood sample for assay (platelets and WBCs marked activity in this enzyme)
Normal range:
G-6-PDH (U/1012 RBC): (146-376)G-6-PDH (U/gHb): (4.6-13.5)
Qualitative method in G-6-DP determination:
Principle
Glucose -6-phosphate dehydrogenase,present in the red blood cell hemoysate, act on glucose -6-phosphate and reduces NADP to NADPH which, with the help of PMS, reduces blue colored 2,6Dichlorophenol Indophenol into acolorless form.the rate of decolorization is proportional to the enzynme activity. The reaction can be represented as:
G-6-phosphate +NADP 6-phosphogluconic acid +NADPH NADPH+2,6Dichlorophenol indophenol (DCPIP) NADP+ Reduced DCPIP (Blue color) (colorless)
Rate of declorization is directly proportional to the activity of G-6-PD.
Note:
50
Fresh blood sample should be use since refrigeration reduces the enzyme activity.
Heparine sample should not be use as interfer with enzyme reaction. Avoid exposure of substrate vial to the light (it is photosensitive).
Procedure:
Step1: Preparation of red cell hemolysate:Purified water : 2.5mlFresh blood : 0.05mlMix well and allow standing for 5min at R.T.
Step2: Assay of the enzyme:Add 1ml of the hemolysate (step 1) to the vial of solution 1 and mix gently.Add immediately about 1ml of reagent 3.Seal the vial with aluminum foil and incubate in water bath at 37ºc.
Observe: the time taken for the color change from initial deep blue to reddish purple. Follow up to Amax. Of 6 hours with 30 min intervals.
Results:Normal : 30-60 min.G-6-PD deficient (heterozygous males, homozygous female): 140min-24hrG-6-PD carriers (heterozygous females): 90min-several hours.
51

QUANTITATION OF METHEMOGLOBIN
methemoglobin (Hi) is a form of hemoglobin In which the ferrous ion( Fe2+) has been oxidized to the ferric state(Fe3+) and is, therefore, incapable of reversibly combining with oxygen (and, therefore, cannot transport the oxygen molecule). Normally, a small amount of methemoglobin is continuously being formed in the red cell, but is, in turn, reduced by the red blood cell enzyme systems: NADH methemoglobinreductase (cytochrome-b5 reductase) (major pathway), NADPH methemoglobinreductase (minor pathway) and to a lesser extent the ascorbic acid and glutathione enzyme systems.
Increased amounts may be found in both hereditary and acquired disorders.
a. The hereditary form of methemoglobinemia is found 1) in disorders in which the red blood cell reducing systems are abnormal and unable
to reduce methemoglobin back to oxyhemoglobin.2) in the presence of hemoglobin M, where the structure of the polypeptide chains
making up the hemoglobin molecule is abnormal (there is a tendency toward oxidation of hemoglobin, with a decreased ability to reduce it back to oxyhemoglobin).
b. The acquired causes of methemoglobinemia are mainly due to certain drugs and chemicals, such as nitrates, nitrites, quinones, chlorates, sulfonamides and aniline dyes.
Methemoglobin is normally present in the blood in a concentration of 0.03 to 0.13 g/ dL, but a normal range should be determined by each laboratory. Slightly higher levels are present in infants and heavy smokers.
Reagents and Equipment
1. Phosphate buffer, 0.067 M, pH 6.6. a. Solution 1 (potassium dihydrogen phosphate, 0.067 M(
I. Monobasic potassium phosphate)KH2PO4( 9.1 gII. Distilled water 1L
b. Solution 2 (dibasic sodium hydrogen phosphate, 0.067 M(I. Dibasic sodium phosphate (Na2HPO4( 5.9gII. Distilled water 1 L
52
For phosphate buffer, 0.067 M, pH 6.6, mix:
a. Solution 1 63.0 mLb. Solution 2 37.0 mL
2. Phosphate buffer, 0.017 M (pH 6.6)a. Phosphate buffer (0.067M, pH 6.6) 1 volumeb. Distilled water 3 volumesc. Add approximately 0.2 g of saponin.
3. Sodium cyanide, 10% w/v. a. Sodium cyanide 10 gb. Distilled water 100 mL
4. Potassium ferricyanide, 20% w/v. a. Potassium ferricyanide 20 gb. Distilled water 100 mL
5. Acetic acid, 12% v/v. 6. Neutralized sodium cyanide. Prepare this reagent under a fume hood, just prior to
use. Place four drops of 10% sodium cyanide in a small (12 x 75 mm) test tube. While carefully shaking the tube, add four drops of 12% acetic acid. Stopper tube as soon as possible. This reagent must be used within 1 hour of preparation.
7. Test tubes, 13 x 125 mm. 8. Pipets, 5 mL, 50 µL, and 20 µL. 9. Spectrophotometer.
Specimen
Fresh anticoagulated whole blood, using EDTA or heparin as the anticoagulant. This test should be perform d within 1 hour of blood collection. However, once the blood has been diluted in the buffer reagent, it may be stored at 2 to 6° C for a maximum of 24 hours.
Principle
Whole blood is diluted with a phosphate buffer solution. Methemoglobin has a maximum absorbance at a wavelength of 630 nm. The diluted specimen is read in a spectrophotometer at 630 nm and the absorbance reading noted (D1). Neutralized sodium cyanide is added to the mixture, converting the methemoglobin to cyanmethemoglobin, and read on the spectrophotometer (D2). The change in optical density is directly proportional to the amount of methemoglobin present. The methemoglobin in g/dL is then calculated using a factor, previously determined, for the spectrophotometer used.
Procedure
1. Determination of calculation factor, F.Before the methemoglobin results can be calculated, a calibration factor for the spectrophotometer being used must be determined. This is done one time only, or whenever a different spectrophotometer is used for the procedure.
53

a. Obtain a whole blood sample and determine the hemoglobin concentration in g/dL.
b. Place 5.0 mL of 0.017 M phosphate buffer into each of two test tubes. Add 50 µL of the whole blood specimen to one tube and mix. The second tube is to be used as the blank.
c. Add 20 µL of freshly prepared 20% potassium ferricyanide to both tubes. Mix and allow to stand for 2 minutes.
d. Read on the spectrophotometer at 630 nm, using the blank to set the optical density at 0, and record the absorbance ( Dx).
e. Add 20µLof neutralized sodium cyanide to both tubes. Mix and allow to standfor 2 minutes. Read on the spectrophotometer as above and record the optical density ( Dy).
f.
2. Procedure for testing patient specimen. a. Label and place 5 mL of 0.0 17M phosphate buffer into one tube for each
specimen and control to be tested and one additional tube to serve as a blank.
b. Add 50 µL of whole blood to the appropriately labeled tube and mix well. Allow to sit at room temperature for 5 minutes .
c. Read on the spectrophotometer at a wavelength of 630 nm, using the blank to set the optical density at 0. Record the absorbance of the solution (D1)
d. Add 20 µL of neutralized sodium cyanide reagent to each tube including the blank, and mix. Allow to sit for 2 minutes. Read as in step c above record the optical density (D2).
e. Calculation of results:
Methemoglobin (g/dL) = ( D1 – D2) x F
Normal value:
Methaemoglobin<2% of total haemoglobin in normal blood, slightly higher in infants, particularly if premature.
Discussion
1. Sulfhemoglobin (SHb ) is not measured at any time during the above procedures.
2. The presence of a large amount of SHb will result in an erroneously low measurement of total Hb.
54
F =Hgb (g/dL)
Dx - Dy
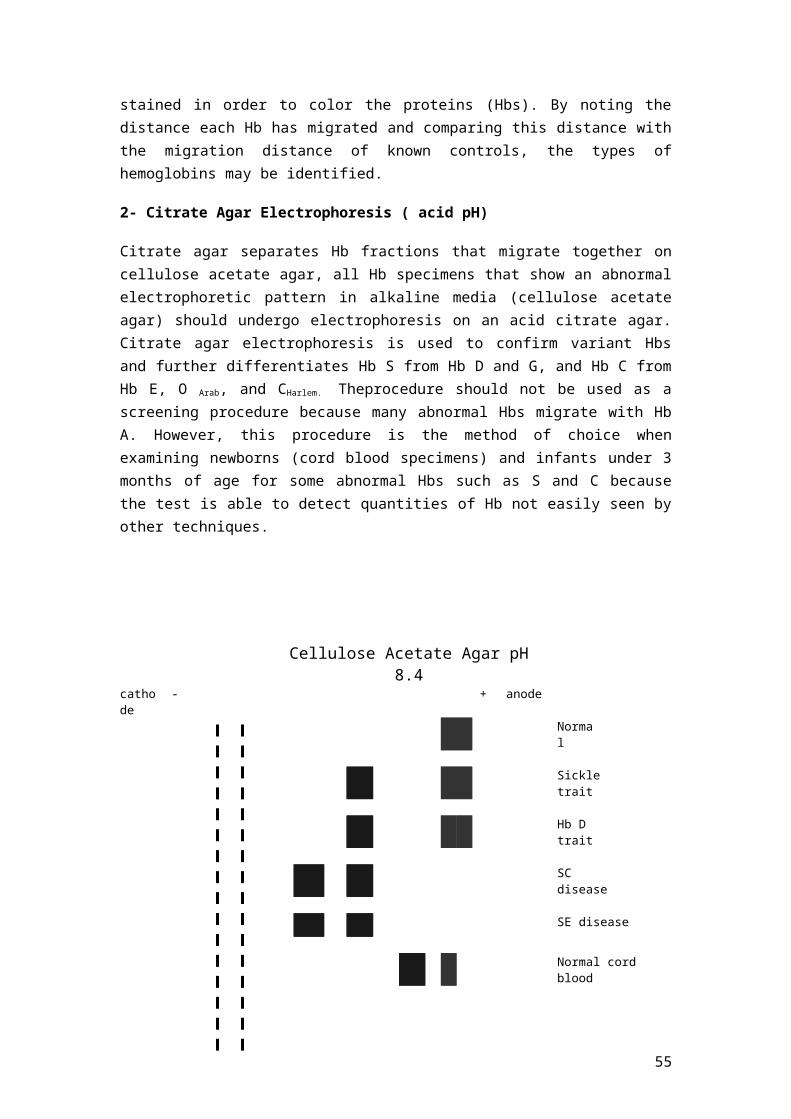
SUCROSE HEMOLYSIS TESTThe sucrose hemolysis test is used as a confirmatory test for paroxysmal nocturnal hemoglobinuria (PNH) when the sugar water test is positive.
Reagents and Equipment
1. Sodium phosphate, 50mmol/L (NaH2PO4• 2H2O) 7.8gDissolve and dilute to 1 liter with distilled water.
2. Sodium phosphate,50 mmol/L (Na2HPO4) 7.1gDissolve and dilute to 1 liter with distilledwater.
3. Sucrose solution (isotonic).Sucrose (reagent grade) 92.4 gNaH2PO4 (50 mmol/L) 91mLNa2HPO4 (50 mmol/L) 9 mLMix and adjust pH to 6.1, if necessary, using dilute NaOH or HCl. Dilute to 1 liter with distilled water. Reagent is stable at refrigerator temperature for 2 weeks .
4. cyanmethemoglobin reagent.5. Test tubes.6. ABO compatible serum (or serum fromtype AB blood) from a normal donor.7. Specimen must be fresh.8. Sodium chloride, 0.85% w/v. 9. Pipets,Spectrophotometer. 540 nm.
Specimen
Citrated whole blood: 1 part 0.109 M sodium citrate to 9 parts whole blood. Obtain a blood specimen (preferably the same blood type) for the normal control at the same time the patient's blood is collected.
Principle
Washed red blood cells are incubated in an isotonic sucrose solution containing normal ABO compatible serum. At low ionic concentrations, red blood cells absorb complement components from serum. Because PNH red blood cells are much more sensitive than normal red cells they will hemolyzed under these conditions. The normal red blood cells will not. At the end of the incubation period the mixture is examined for hemolysis.
Procedure
55

1. place 1 mL of patient and control bloods in respective test tubes. Wash red cells by adding 0.85% sodium chloride to each tube. Centrifuge specimens at 1200 to 1500 g for 5 minutes. Carefully remove supernatant. Wash the red blood cells a second time in the samemanner.
2. Prepare a 50% solution of red cells forboth patient and control: add 3 drops ofwashed red blood cells to 3 drops of 0.85% sodium chloride. Mix.
3. Into appropriately labeled test tubes (one tube for each patient and control, and one tube for the blank), pipet 1.7 mL of sucrose solution. Add 0.1 mL of ABO compatible serum (or serum from a type AB donor) to each tube.
4. Add 0.2 mL of the 50% suspension of red cells to each appropriately labeled tube, Gently mix each tube by inversion.
5. Incubate all tubes at room temperaturefor 30 minutes. 6. While the tubes are incubating, labeltest tubes, "Total" and "Test" for each patient
and control, and 1 tube for the blank. Pipet 9.5 mL of cyanmethemoglobinreagent(drabkin's reagent) into each tube.
7. At the end of the 30-minute incubation, remix each blood-sucrose tube very gently. Remove 0.5 mL of the mixture from each tube and add to the appropriately labeled "Total" tube containing cyanmethemoglobin reagent. Transfer 0.5 mL from the tube labeled blank to the cyanmethemoglobin tube labeled blank. Mix well by inversion. Allow tosit for 10 minutes.
8. Centrifuge the remaining blood-sucrosemixtures at 1200 to 1500 rbm for 5 minutes. 9. Add 0.5 mL of each supernatant to theappropriately labeled "Test" tube containing
cyanmethemoglobin reagent. Mix all tubes well by inversion and allow to sit for 10 minutes.
10. Transfer above mixtures to a cuvet and read in a spectrophotometer at a wavelength of 540 nm. setting the blank al 0.0 optical density. Record the O.D. readings for each sample.
11. Calculate the percent hemolysis for eachspecimen as shown below.
Percent Hemolysis =O.D. Test
x 100O.D. Total
Interpretation of results1. Hemolysis 5%, or less is considered negative within normal limits. 2. Hemolysis of 6 to 10% is thought to beborderline. 3. Positiveresults will show greater than 10%molysis.
Discussion1. Increased hemolysis (generally less than 10%) may be found in some patients with
leukemia or myelosclerosis, whereas patients with PNH show 10% to 80% hemolysis (will only rarely be as Iowa 5%).
2. Results of the sucrose hemolysis test should correlate with the acid serum test.
56

OSMOTIC FRAGILITY TESTDefinition
The osmotic fragility test is a measure of the ability of the red cells to take up fluid without lysing. Or it is a test to measures red blood cell (RBC) resistance to hemolysis when exposed to a series of increasingly dilute saline solutions.
This procedure is employed to help diagnose different types of anemias, in which the physical properties of the red blood cell are altered.
The primary factor affecting the osmotic fragility test is the shape of the red cell, which, in turn, depends on the volume, surface area, and functional state of the red blood cell membrane.
1. Increased surface- to – volume ratios, (it is more resistant to hemolysis and has decreased fragility) The larger the amount of red cell membrane (surface area) in relation to the size of the cell, the more fluid the cell is capable of absorbing before rupturing .as
1. Reticulocytes2. iron-deficiency anemia3. thalassemia4. sickle cell anemia5. andoccurs following splenectomy, in liver disease, polycythemia vera, and
conditions in which target cells are present.
The target cell has the largest surface area (amount of membrane) for its size and therefore shows decreased fragility. As the red cell takes in fluid it becomes more round (spherocytic). It therefore follows that the spherocyte has the smallest surface area for its volume, ruptures the most quickly, and has increased fragility.
2. Decreased surface-to – Volume ratios, Increased osmotic fragility (decreased resistance) is found in
1. hemolytic anemias2. hereditary spherocytosis 3. And wheneverspherocytes are found. 4. the older red cells are also more fragile.
Reagents and Equipment
57

1. Buffered sodium chloride stock solution (osmotically equivalent to 10% sodium chloride).
i. sodium chloride (Dry for 24 hours in a desiccator with calcium chloride prior to weighing out.) 90 g
ii. Dibasic sodium phosphate (Na2HPO4) 13.65 g
iii. Monobasic sodium phosphate (NaH2PO4.2 H2O) 2.43 g
iv. Dilute to 1 liter with distilled water.
This solution is stable for several months at room temperature if kept well Stoppard.
2. Buffered sodium chloride working solution.i. Buffered sodium chloridestock solution 20 mLii. Distilled water 180 mL
3. Distilled water. 4. Erlenmeyer flask (250 mL) and glass beads (3 to 4 mm in diameter), if
defibrinatedwhole blood is used. 5. Pipets, 10, 5, and 0.05 mL.6. Test tubes 13 X 100 mm.7. Parafilm.8. Centrifuge.9. Spectrophotometer.
Specimen
Heparinized venous blood, or, 15 to 20 mL of defibrinated whole blood.The test should be set upwithin 2 hours of collection, or within 6 hours if the blood is refrigerated.
Principle
If red blood cells are placed in an isotonic solution (0.85% sodium chloride), fluid will neither enter nor leave the red blood cell.If red cells are placed in a hypotonic solution (e.g., 0.25% sodium chloride), however.fluid enters the red blood cell until the cell either ruptures or an equilibrium is reached. Aspherocyte, which is almost round, swells up in a hypotonic solution and ruptures much more quickly than a normal red blood cell or more quickly than cells having a large surface area per volume, such as target cells or sickle cells. The fragility of the red blood cell is said to be increased when the rate of hemolysis is increased. When the rate of hemolysis is decreased, the fragility of the red blood cells is considered decreased. In the osmotic fragility test, whole blood is added to varying concentrations of buffered sodium chloride solution and allowed to incubate at room temperature. The amount of hemolysis in each saline concentration is then determined by reading the supernatants on a spectrophotometer.
Procedure
1. Prepare dilutions of buffered sodium chloride and place in the appropriately labeled test tube (Table.).
2. Mix the preceding dilutions well, using Parafilm to cover each test tube whilemixing.
58

3. Transfer 5 mL of each dilution to a second set of test tubes labeled # 1 through #14. If defibrinated blood is to be used, procedas follows:
a. place 15 to 20 mL of whole blood into an Erlenmeyer flask containing 15glass beads.
b. Gently rotate the flask until the hum or noise of the beads on the glass can no longer be heard (about 10 minutes). 0
4. Add 0.05 mL of the patient's heparinized or defibrinated blood to each of the 14 test tubes. Repeat, adding the normal control blood to the setof 14 control testtubes.
5. Mix each test tube immediately by gentleinversion.6. Allow the test tubes to stand at roomtemperature for 30 minutes.7. Remix the test tubes gently and centrifuge at 1200 to 1500 g for 5 minutes.8. Carefully transfer the supernatants to cuvettes and read on a spectrophotometer at
a wavelength of 540 nm. Set the optical density at 0, using the supernatant in test tube #1, which represents the blank, or 0% hemolysis. Test tube #14 represents 100% hemolysis.
9. Calculate the percent hemolysis for each supernatant as follows:
Percent of hemolysis =O.D. of supernatant
x 100O.D. supernatant tube #14
10. The results of the test may then begraphed, with the percent hemolysis plotted on the ordinate (vertical axis) and the sodium chloride concentration on the abscissa (horizontal axis) as shown in Figure (shows normal range).
Test tube 1% buffered NaCl (mL)
D.W. (ml) Final conc. (%)
% Hemolysis
1 10.0 0.0 1.002 8.5 1.5 0.853 7.5 2.5 0.754 6.5 3.5 0.655 6.0 5.0 0.606 5.5 4.5 0.557 5.0 5.0 0.508 4.5 5.5 0.459 4.0 6.0 0.40
10 3.5 6.5 0.3511 3.0 7.0 0.3012 2.0 8.0 0.2013 1.0 9.0 0.1014 0.0 10.0 0.00
Normal valuesInitial Hemolysis begins 0.45%, complete Hemolysis 0.30 - 0.35%
Discussion
59

Interfering factors :
1. This test should be performed immediately because shape change and osmotic conditions change with time.
2. If the patient has a low hemoglobin level, wash the patent with isotonic saline and resuspend with equal volume of RBCs and saline. This will correct for anemia.
3. Completely fill the collection tube and invert it gently several times to mix the sample and anticoagulant thoroughly.
4. Handle the sample gently to prevent accidental hemolysis. 5. In some cases, RBCs don't hemolysis immediately; incubation in solution for
141 hours improves test sensitivity. 6. Presence of hemolytic organisms in the sample. 7. Severe anemia or other conditions with fewer RBCs available for testing .8. Recent blood transfusion.9. Old sample.10. The pH of the blood-saline mixture isimportant and should be 7.4.11. If anticoagulated blood is used for test, use only heparin as the anticoagulant,
in order to avoid adding more saltsto the blood such as Oxalate, EDTA, or citrate.
12. The exact amount of whole blood addedto each buffered saline dilution is not critical. The important point is that the same amount of whole blood be added to eachsaline dilution.
13. If hemolysis is present in the 0.85% sodium chloride tube, the test should be repeated using a new specimen. If the normal control also shows hemolysis at this concentration, or does not reflect a normal set of results, the buffered sodium chloride stock and working solutions should be discarded and re-prepared.
Automated Hematology Cell Counters
60

Current hematology analyzers use a combination of light scatter, electrical impedance, fluorescence, light absorption, and electrical conductivity methods to produce complete red blood cell, platelet, and leukocyte analyses. All the widely used automated instruments analyze cells in flow and are essentially highly specialized flow cytometers.
Principles
1. The Coulter PrincipleUsing this technology, cells are sized and counted by detecting and measuring changes in electrical resistance when a particle passes through a small aperture. This is called the electrical impedance principle of counting cells.
A blood sample is diluted in saline, a good conductor of electrical current, and the cells are pulled through an aperture by creating a vacuum. Two electrodes establish an electrical current. The external electrode is located in the blood cell suspension. The second electrode is the internal electrode and is located in the glass hollow tube, which contains the aperture. Low-frequency electrical current is applied to the external electrode and the internal electrode. DC current is applied between the two electrodes. Electrical resistance or impedance occurs as the cells pass through the aperture causing a change in voltage. This change in voltage generates a pulse (Fig. ). The number of pulses is proportional to the number of cells counted. The size of the voltage pulse is also directly proportional to the volume or size of the cell.
This was the principal parameter used in earlier analyzers for characterizing all cell types, but it is now used primarily for counting and sizing red blood cells and platelets.
61

2. Electrical Conductivity or RadiofrequencyRadiofrequency (RF) resistance is a high-voltage electromagnetic current flowing between the electrodes to detect the size of cells based on the cellular density. RF is a high-frequency pulsating sine wave. Conductivity or RF measurements provide information about the internal characteristics of the cell. The cell wall acts as a conductor when exposed to high-frequency current. As the current passes through the cell, measurable changes are detected. The cell interior density or nuclear volume is directly proportional to pulse size or a change in RF resistance. The nuclear to cytoplasmic ratio, nuclear density, and cytoplasmic granulation are determined. Itis used in some analyzers to identify granulocytes.
3. Optical ScatterA sample of blood is diluted with an isotonic diluent and then hydrodynamically focused through a quartz flow cell. Cells pass through a flow cell on which a beam of light is focused. The light source is a laser light that is light amplification by stimulated emission of radiation. Laser light or monochromatic light is emitted as a single wavelength. As the cell passes through the sensing zone, light is scattered in all directions. Photodetectors sense and collect the scattered rays at different angles. These data are then converted to an electric pulse. The number of pulses generated is directly proportional to the number of cells passing through the sensing zone.
Coulter principle of electric impedance.
62

The patterns of light are measured at various angles:
forward light scatter at 180 degrees and right angle scatter at 90 degrees. Cell counts, size, cell structure, shape, and reflectivity are determined by the analysis of the scatter light data.Simultaneous measurement of light scattered at different angles has allowed automated counters to produce a more accurate five-part leukocyte differential count.
Forward angle light scatter (0 degree)
is diffracted light which relates to volume.
Forward low angle light scatter (2 to 3 degrees)
relates to cell size or volume.
Forward high-angle scatter (5 to 15 degrees)
relates to the internal complexity or refractive index of cellular components.
Orthogonal light scatter (90 degrees) or side scatter (polarized or depolarized) PSS,DSS
is a combination of reflection and refraction and relates to internal components.
Orthogonal light scatter (90) determines cell lobularity; 90 depolarized (90D) is for the evaluation of cellular granularity.
Various combinations of these four angle measurements are used to differentiate the white cell populations.
1. Neutrophils and eosinophils are separated from mononuclear cells by plotting 90 light scatter data, which are on the y-axis, and wide-angle forward light scatter data, on the x-axis.
2. Eosinophils are separatedfrom the neutrophil population by the eosinophils’ ability to depolarize the polarized light scatter.
3. The lymphocyte, monocyte, and basophil populations can be separated by plotting low angle forward light scatter on the y-axis and wide-angle forward light scatter on the x-axis
63
Fig. : The sequential separation of nucleated cells using MAPSS analysis" NRBCs are identified using their size and fluoresce (FL3) characteristics(A).The remaining leukocytes are first separated into mononuclear and polymorphonuclear cells (B) using cornplexity and lobularity characteristics (7° and 90° light scatter). Neutrophils and eosinophils are separated based on the 90°/ 90 0D
characteristics (C). Lymphocytes and monocytes are separated based on cellular size (D) and basophil separation is achieved by consideration of bo and internal complexity. (Courtesy of Abbott Hematology, Santa Clara, CA.)
4. Light AbsorptionThe light absorption technique is used by some analyzers for peroxidase staining to assist in granulocyte classification, and by most for determination of hemoglobin concentration.
5. FluorescenceNewer analyzers use fluorescence to measure cellular RNA (reticulocytes, "reticulated" platelets), DNA (nucleated red blood cells), and even cell surface markers (e.g., CD61, CD4).
6. VCS Technology (Volume, Conductivity, and Scatter)A single-channel analysis method that uses three independent sources to probe approximately 8000 cells in their near-native state. Low-frequency current measures volume, while high frequency current measures changes in conductivity, and light from the laser bouncing off white cells characterizes the surface shape and reflectivity of each cell. This technology differentiates white cell characteristics.
64

7. Hydrodynamic FocusingThis is a technique that narrows the stream of cells to single file, eliminating data above and below the focus points. Hydrodynamic focusing allows greater accuracy and resolution of blood cells. Diluted cells are surrounded by a sheath fluid, which lines up the cells in a single file while passing through the detection aperture. After passing through the aperture, the cells are then directed away from the back of the aperture. This process eliminates the recirculation of cells and the counting of cells twice.
Use of Flow CellsFlow cells are composed of quartz rather than glass and provide a better atmosphere in which to measure cellular qualities. Light does not bend and UV light can pass through the flow cell. Cell characteristics are then measured. The flow cells measure cell volume, internal content, and cell surface, shape, and reflectivity.
Multiple-Angle Polarized Scatter Separation (MAPSS)Differentiation of the nucleated cells of peripheral blood is performed by a proprietary process Known as Multi-Angle Polarized Scatter Separation (MAPSS).This process uses the detection of scattered laser light measured at a variety of different angles in combination with use of different filter to separate cells in multiple dimensions. This permits counting of the leukocyte count and derivation of five-part leukocyte differential as well as detection of many different types of abnormal blood elements, without the use of additional stains or days. This basic process of MAPSS is universal to Abbott five-part differential analyzers.
65
InstrumentsThe newer analyzers include white cell differential counts, relative or percent and absolute number, and reticulocyte analysis. The differential may be a three-part differential that includes granulocytes, lymphocytes, and monocytes or a five-part differential that includes neutrophils, lymphocytes, monocytes, eosinophil's, and basophils. The new generation of analyzers now offers a sixth parameter, which is the enumeration of nucleated RBCs (nRBCs).
Automated full blood counters with a five-part or more differential counting capacity[*]
Instrument and manufacturer Technology used for differential count
Beckman-Coulter Instrumentation
(Coulter STKS, GEN-S, LH 700 series)
VCS Technology (Volume, Conductivity, and Scatter)
1. Impedance with low-frequency electromagnetic current2. Impedance with high-frequency electromagnetic current3. Laser light scattering
Sysmex Instrumentation(Roche Diagnostics Corporation)
(SE series, XE2100)
1. Impedance with low-frequency direct current2. Impedance with radiofrequency current3. Hydrodynamic Focusing
Cell Dyne Technology(Abbott Diagnostics Instrumentation)Cell-Dyn 1800
The Coulter Principle
Cell-Dyn 3500, 3700Multiple-Angle Polarized Scatter Separation (MAPSS)
1. Four light-scattering parameters: forward light scatter, orthogonal light scatter, narrow-angle light scatter, and depolarized orthogonal light scatter
2. Hydrodynamic Focusing3. Use of Flow Cells
Cell-DynRuby, Sapphire. 1. Multiple-Angle Polarized Scatter Separation (MAPSS)2. Hydrodynamic Focusing3. Use of Flow Cells4. Fluorescence
* In addition to the blood counters listed here, there are an increasing number of instruments on the market that are capable of providing full differential counts using various technologies.
66

Cell-Dyn 1800 Hematology Analyzer
Cell-Dyn 1800 Hematology AnalyzerThe Cell-Dyn 1800 Hematology Analyzer performs a Complete Blood Count (CBC),Platelet Count, and a Three-Part Differential.
Performance:Whole blood is aspirated, diluted, and thendivided into two samples. One sample is used to analyze the red blood cells and plateletswhile the second sample is used to analyze the white blood cells and hemoglobin.Electrical impedance is used to count the white blood cells, red blood cells, and plateletsas they pass through an aperture. As each cell is drawn through the aperture, a change inelectrical resistance occurs generating a voltage pulse. The number of pulses during acycle corresponds to the number of cells counted. The amplitude of each pulse is directlyproportional to the cell volume.
In the RBC chamber, both the RBCs and the platelets are counted and discriminated by electrical impedance Particles between 2 and 20 fL are counted as platelets, and those greater than 36 fL are counted as RBCs.
Lyse reagent is added to the diluted sample and used to count the white blood cells. The lysing reagent also cause WBC's membrane collapse around the nucleus, so the counter actually measuring the nuclear size.Afterthe white blood cells have been counted and sized, the remainder of the lysed dilution istransferred to the Hgb Flow Cell to measure Hemoglobin concentration.
67

Hemoglobin Measurement Using cyanide free Hb chemistry methods, rapid RBCs lysis followed by the formation of an imidazole-hemoglobin complex with an absorption peak at 540 nm.
The Cell-Dyn uses electronic sizing to determine a three part automated differential. Thepercentage and absolute counts are determined for lymphocytes, neutrophil, and mid-sizepopulation of monocytes, basophils, eosinophils, blasts, and other immature cells.
Results will be used to monitor patient’s cell counts and absolute neutrophil count and todetermine if further chemotherapy should be administered.
Specimen Requirements
1. Whole blood collected in an EDTA tube.2. Minimum sample volume is 0.5 mL using the Open Sample Mode. The instrument
aspirates 30 μL of patient sample.3. Samples are stable at room temperature for eight hours.
Overview of Analysis Modes● Whole blood modeThis is the mode of analyzing collected blood sample in the whole blood status. The tube cap is opened and the sample is aspirated through the sample probe one after another.● Pre-diluted modeThis mode is used in analyzing a minute amount of child’s blood, for instance, collected from the earlobe or fingertip. In this mode, blood sample diluted into 1:26 before analysis is used. The sample aspiration procedure is the same as in the whole blood mode.Note:In the pre-diluted mode, particle distribution curve and particle distribution analysis data are not output, and the output is confined to only the CBC 4 parameter (dependent parameter on MCV) but the remainder parameter multiply by dilution factor.
Sources of error
A. In cell count include:
1. Cold agglutinins - low red cell counts and high MCVs can be caused by a increased number of large red cells or red cell agglutinates. If agglutinated red cells are present, the automated hematocrits and MCHCs are also incorrect. Cold agglutinins cause agglutination of the red cells as the blood cools.
Cold agglutinins can be present in a number of disease states, including infectious mononucleosis and mycoplasma pneumonia infections.
68
If red cell agglutinates are seen on the peripheral smear, warm the sample in a 37°C heating block and mix and test the sample while it is warm. Strong cold agglutinins may not disperse and need to be redrawn in a pre-warmed tube and kept at body temperature.
2. Fragmented or very microcytic red cellsThese may cause red cell counts to be decreased and may flag the platelet count as the red cells become closer in size to the platelets and cause an abnormal platelet histogram. The population is visible at the left side of the red cell histogram and the right end of the platelet histogram.
3. Platelet clumps and platelet satellitosis: these cause falsely decreased platelet counts. Platelet clumps can be seen on the right side of the platelet histogram. Decreased platelet counts are confirmed by reviewing the peripheral smear. Always scan the edge of the smear when checking low platelet counts.
4. Giant platelets: these are platelets that approach or exceed the size of the red cells. They cause the right hand tail of the histogram to remain elevated and may be seen at the left of the red cell histogram.
5. Nucleated red blood cells: these interfere with the WBC on some instruments by being counted as white cells/lymphocytes .
B. In measuring hemoglobin include
Anything that will cause turbidity and interfere with a Spectrophotometry method.
Examples are a very high WBC or platelet count, lipemia and hemoglobin's that are resistant to lysis, such as hemoglobin's S and C.
Basic automated hematology analyzers provide an electronic measured 1. red cell count (RBC), 2. white cell count (WBC), 3. platelet count (Plt), 4. mean platelet volume (MPV), 5. hemoglobin concentration (Hb), 6. and the mean red cell volume (MCV).
69

From these measured quantities, the hematocrit (Hct), mean cell hemoglobin (MCH), mean cell hemoglobin concentration (MCHC), and the red cell distribution width (RDW) are calculated.
RED CELL INDICES1. Hematocrit calculation
Hematocrit (Hct) or (PCV) is the volume of the red cells as compared to the volume of the whole blood sample. Hematocrits on the automated systems are calculated.
The volume of each red cell is measured as it is counted and a mean cell volume is derived. The calculations are not precisely the same. But, they can be summarized as mean corpuscular red cell volume (MCV) multiplied by the red cell count (RBC(.Hematocrits are reported in L/L or the traditional %.
Sources of errors in Hct Hematocrits calculated by automated instruments depend on correct red cell
counts and red cell volumes to arrive at an accurate hematocrit. Hence, anything affecting the red cell count or volume measurement will affect
the hematocrit. This method is not as sensitive to the ratio of blood to EDTA as the centrifuged
hematocrit
Correlating Hemoglobin and Hematocrit Values The hemoglobin times three roughly equals the hematocrit in most patients.
Example: 14.8 x 3 = 44 (patient's hematocrit result is 45 L/L)11.0x 3 = 33 (patient's hematocrit result is 32 L/L)
The exception to this rule is in patients with hypochromic red cells. These patients will have hematocrits that are more than three times the hemoglobin
2. MCVThe counter provides us with MCV which is derived from the histogram (sum of pulse height / sum of pulse). Not: 1μL= 109fL
3. MCH is Mean Corpuscular Hemoglobin weight in picograms. This is the average weight of the hemoglobin in picograms in a red cell. It is a calculated value.Not: 1g = 1012pg, 1L = 10 dLMCH =hemoglobin in pg/L / red cell count in pilions/L
4. MCHCis Mean Corpuscular Hemoglobin Content. This indicates the average weight of hemoglobin as compared to the cell size. It is traditionally a calculated value.
MCHC = (Hemoglobin in g/dL / HCT) x 100
5. RDW:The RDW (red cell distribution width) is a measurement of the width of the bases of the RBC histogram the red cell size distribution and is expressed as the coefficient of variation percentage. The RDW is increased in treated iron deficiency, vitamin B12 deficiency, folic acid deficiency, post-transfusion.
6. MPV:The MPV is a measure of the average volume of platelets in a sample and is analogous to the erythrocytic MCV.
7. Pct:(plateletcrit) analogues to HCT for RBCs
70

How Data Are ReportedIn most automated systems, the complete blood count is numerically reported. The differential is numerically recorded and then graphically displayed.
Red Cells Histogram normal red cell histogram displays cells form (36- 360 ) fl
A. (24- 36 fl ) flag may be due1- RBCs fragments2- WBC's fragments 3- Giant plts4- Microcyte
B. Shift to right :- Leukemia- Macrocytic anemia- Megaloblastic anemia
C. Shift to left :- Microcytic anemia (IDA)
D. Bimodal- Cold agglutinin- IDA, Megaloblastic anemia with transfusion.-Sideroblastic anemia.
E. Trimodal- Anemia with transfusion
Plts histogramnormal platelet histogram displayscells from(2-20 fl).
A. (0-2)1. Air Babbles 2. Dust 3. Electronic and Electricalnoise
A. Over 20 fL1. Microcyte2. Scishtocyte3. WBC's fragments4. Giant Plts5. Clumped plts
LEUKOCYTE HISTOGRAM ANALYSISThe histogram is a representation of the sizing of the leukocytes. The differentiation is as follows:
71

Cell type Size range Cells that fall within this size rangeLymphocytes 35-90 fL lymphs and atypical lymphs
Mononuclear 90-160 fL Monos, promyelocytes, myelocytes, plasma cells and blasts
Granulocyte 160-450 fL segs, bands, metas, eos and basos
The following table lists the region (R) flags andthe abnormalities they may represent:
R Flag Region AbnormalityR1 Far left(<35fL) Erythrocyte precursors (NRBCs)
Nonlysed erythrocytesGiant and/or clumped plateletsHeinz bodyMalaria
R2 Between lymphs and monos BlastsBasophiliaEosinophiliaPlasma cellsAbnormal/variant lymphs
R3 Between mons and granulocytes Abnormal cell populationsEosinophiliaImmature granulocytes
R4 Far right(>450fL) Increased absolute granulocytesRM Multiple flags
NORMAL VALUES
REPORTING RESULTS
Parameter Normal Range1. WBC 4.8-10.8 x 10³/ Lμ2. RBC Male 4.7-6.1 x 10⁶/ Lμ
72

Female 4.2-5.4 x 10⁶/ Lμ3. Hemoglobin Male 14-18 g/dl
Female 12-16 g/dl4. Hematocrit Male 42-52%
Female 37-47%5. MCV Male 80-94 fl
Female 81-99 fl6. MCH 27-31 pg7. MCHC 32-36 g/dl or %8. RDW 11.5-14.5%9. Platelets 150,000 - 450,000/ Lμ10. MPV 7.4-10.4 fl
Critical ValuesCritical ValueParameter≤1.0 or ≥30.0WBC (K/mm3)≤6.5 or ≥19.0HGB (g/dL)≤20.0 or ≥60.0HCT (%)≤30.0 or ≥1000PLT (K/mm3)
Linearity
Parameter Manufacturer’s Linear Range1. WBC (K/ L)μ 1.0 – 99.92. RBC (M/ L)μ 1.0 – 7.003. HGB (g/dL) 2.5 – 24.04. MCV (fL) 50 – 2005. PLT (K/ L)μ 10 – 9996. MPV (fL) 5.0 – 20.0
INSTRUMENT CODESCode Cause Action indicated..... for a single parameter Incomplete computation Repeat..... for all parameters Partial aspiration Repeat_____ and no histogram Total voteout (2 out of 3
measurements do not agreeRepeat
73

+++++ Result exceeds printablerange
Dilute 1:2 and rerun. Continuefurther dilutions if necessaryuntil the result falls within thelinearity range (See “HandlingAbnormal Results)
H Result is higher than thelaboratory-set patient highaction limit
Review result
L Result is lower than thelaboratory-set patient lowaction limit
Review result
R next to Plt and MPV result
PDW > 20 or non-positivecurve detected, or
Review result
Plt< 20,000 or Review result and correlate plt with smear review
Total voteout of fittedcurve, or WBC isoverrange.
Review result and repeat
R next to RDW result Excessive asymmetry inRBC histogram or
Review result
WBC or MCV overrange RepeatR next to MCV; R next to RBC, Hct,MCH, MCHC, RDW, Plt, and MPV
MCV < 50 fL Repeat
R next to WBC Check of WBC lowerthreshold failed
Repeat, review smear
INTERFERENCES THAT MAY CAUSE ERRONEOUS RESULTSParameter Interfering agentWBC 1. Unusual RBC abnormalities that resist lysis
2. Nucleated RBCs3. Fragmented WBCs4. Unlysed particles greater than 35 fL
74
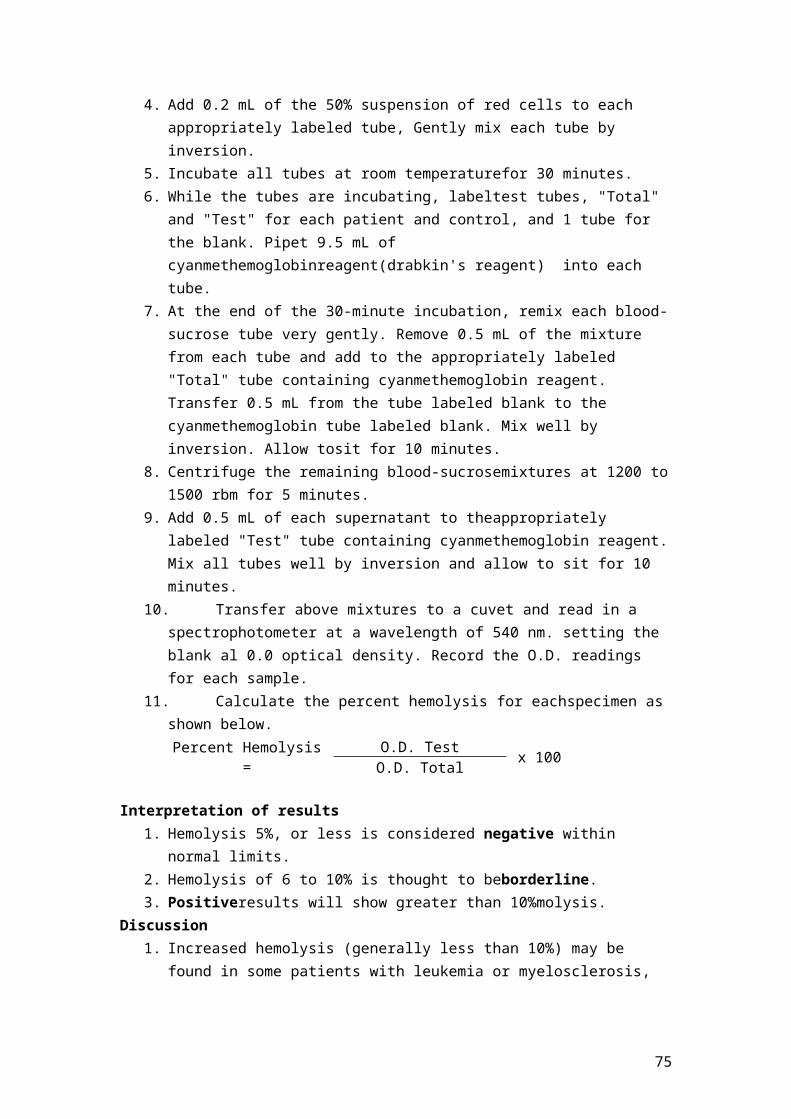
5. Very large or aggregated plts6. Specimens containing fibrin, cell fragments or other debris (esp pediatric/oncology
specimensRBC 1. Very high WBC (greater than 99.9)
2. High concentration of very large platelets3. Agglutinated RBCs, rouleaux will break up when Istoton is added4. RBCs smaller than 36 fL5. Specimens containing fibrin, cell fragments or other debris (esp
pediatric/oncology specimensHgb 1. Very high WBC count
2. Severe lipemia3. Heparin4. Certain unusual RBC abnormalities that resist lysing5. Anything that increases the turbidity of the sample such as elevated
levels of triglycerides6. High bilirubin
MCV 1. Very high WBC count2. High concentration of very large platelets3. Agglutinated RBCs4. RBC fragments that fall below the 36 fL threshold5. Rigid RBCs
RDW 1. Very high WBC2. High concentration of very large or clumped platelets3. RBCs below the 36 fL threshold4. Two distinct populations of RBCs5. RBC agglutinates6. Rigid RBCs
Plt 1. Very small red cells near the upper threshold2. Cell fragments3. Clumped platelets4. Cellular debris near the lower platelet threshold
MPV 1. Known factors that interfere with the platelet count and shape of the histogram2. Known effects of EDTA
Hct Known factors that interfere with the parameters used for computation, RBC and MCV
MCH Known factors that interfere with the parameters used for computation, Hgb and RBCMCHC Known factors that interfere with the parameters used for computation, Hgb, RBC
and MCVDiff parameters
Known factors that affect the WBC count as listed above, high triglycerides that affect lysing
HANDLING ABNORMAL RESULTSPlts< 40,000 Check the integrity of the specimen (look for clots, short draw, etc.)
Confirm count with smear review for clumps, RBC fragments, giant platelets, very small RBCs
75

WBC ++++ Dilute 1:2 with Isoton or further until count is within linearity (for final result, multiply diluted result by dilution factor); subtract final WBC from RBC; perform spun hct, calculate MCV from correct RBC &Hct (MCV = Hct/RBC x 10), do not report HGB, MCH, MCHC. Plt counts are not affected by high WBC. Add comment,“Unable to report Hgb, MCH, MCHC due to high WBC.”
Plt ++++ Check smear for RBC fragments or microcytes.1. If present, perform plt estimate. If they do not agree, perform manual plt count.2. If not present, dilute specimen 1:2 with Isoton or further until count is within linearity,
multiply diluted result by dilution factor.
RBC > 7.0 Dilute 1:2 with Isoton or further until count is within linearity, multiply dilution result by dilution factor; perform spun hct, review Hgb, recalculate MCH, MCHC
MCHC > 36.5 Perform manual Hct.1. If it stays the same, check plasma for lipemia, icteremia or other color interference. If
present, perform Isoton replacement. Pour 3 ml blood into 10x75 tube. Mark level of top of blood. Centrifuge at high speed for 10 minutes. Pipette off plasma being careful not to disturb red cells. Replace plasma with Isoton to mark. Mix well and rerun to obtain correct Hgb and MCH, MCHC. RBC should be within ± 0.2 of previous result. Add comment, “results corrected for lipemia”.
2. If it is significantly higher, check the specimen for cold agglutinin by looking for RBC clumping. If present, warm the specimen at 37C for 5 minutes, mix well and repeat. If results are acceptable, report. If cold agglutinin persists, report the spun hct and mark through the RBC, MCV, MCH, MCHC results. Add comment,“specimen warmed before running”.
3. If the above conditions are not found, check the smear for spherocytes or lyseresistant red cells. If present, ensure correct instrument operation by running controls and report result.
MCHC < 36.5 Perform spun hct. Verify proper instrument operation by running a previous patient.Decreased MCHC may be caused by swollen hyperglycemic red cells. Performisoton replacement or correct values using spun hct.
Low plts, “Giant plts” or EDTA clumpers
Confirm with smear review.1. If clumps are present, check with phlebotomist to see if the phlebotomy was difficult. If
not, recollect in blue top tube (Na citrate anticoagulant). If platelet clumps disappear and platelet count is acceptable, multiply plt result by 1.1 to account for the dilution factor.
2. If there are no clumps, but giant platelets are present, perform plt estimate from smear. Perform manual platelet count if smear estimate and instrument count do not agree.
76

Four Definable Reference Range SetsGraphic Reference Range Display
High and low Alerts
Optional manual Differential Grid
77

Normal Cell MaturationIntroductionRed blood cells are the most common type of blood cell and the vertebrate body's principal means of delivering oxygen from the lungs or gills to body tissues via the blood. Red blood cells are also known as RBCs, haematids or erythrocytes (from Greek
erythros for"red" and kytos for "hollow", with cyte nowadays translated as "cell"). "RBCs" should in factbe referred to as "corpuscles" rather than "cells". Indeed, a 'cell' contains a nuclear element, mature RBC's do not contain a nucleus in mammals.
Mammalian erythrocytes are biconcave disks: flattened and depressed in the center, with a dumbbell-shaped cross section. This shape (as well as the loss of organelles and nucleus)optimizes the cell for the exchange of oxygen with its surroundings.
Erythrocytes in mammals are a nucleate when mature; meaning that they lack a cell nucleusand thus have no DNA, also lose their other organelles.
As a result of the lack of nucleus and organelles, the cells cannot produce new structural or repair proteins orenzymes and their lifespan is limited.
Erythrocytes consist mainly of hemoglobin, and the color of erythrocytes is due to the heme group of hemoglobin.
The diameter of a typical human erythrocyte disk is 6–8 µm, much smaller than most otherhuman cells.
A typical erythrocyte contains about 270 million hemoglobin molecules, with each carrying four heme groups.
Adult humans have roughly 2–3 × 10¹³ red blood cells at any given time (women have about4 to 5 million erythrocytes per micro liter (cubic millimeter) of blood and men about 5 to 6million; people living at high altitudes with low oxygen tension will have more). Red bloodcells are thus much more common than the other blood particles.
Blood cells go through several stages of development; progression from one stage to the next is not abrupt, so frequently the cell being studied may be between stages (when this occurs the cell is generally given the name of the mature stage). As a cell transforms from the primitive blast stage to the mature form found in the blood, there are changes in the cytoplasm, nucleus, and cell size. Normally, all three of these changes occurs gradually and simultaneously. In some disease states, however, changes will take place at different rates. For example, the cytoplasm may mature more quickly than the nucleus. This occurrence is termed asynchronism.
Cytoplasmic Maturation
The immature cytoplasm usually stain a deep blue color (basophilic) because of the high content of RNA present as the cell matures, there is a gradual loss of cytoplasmic RNA and therefore a lessening of blue color. In some cells (for example, the myelogenouscells), granules appear in the cytoplasm as the cell matures. At first, these granules are few and nonspecific. As the cell matures further, these granules
78
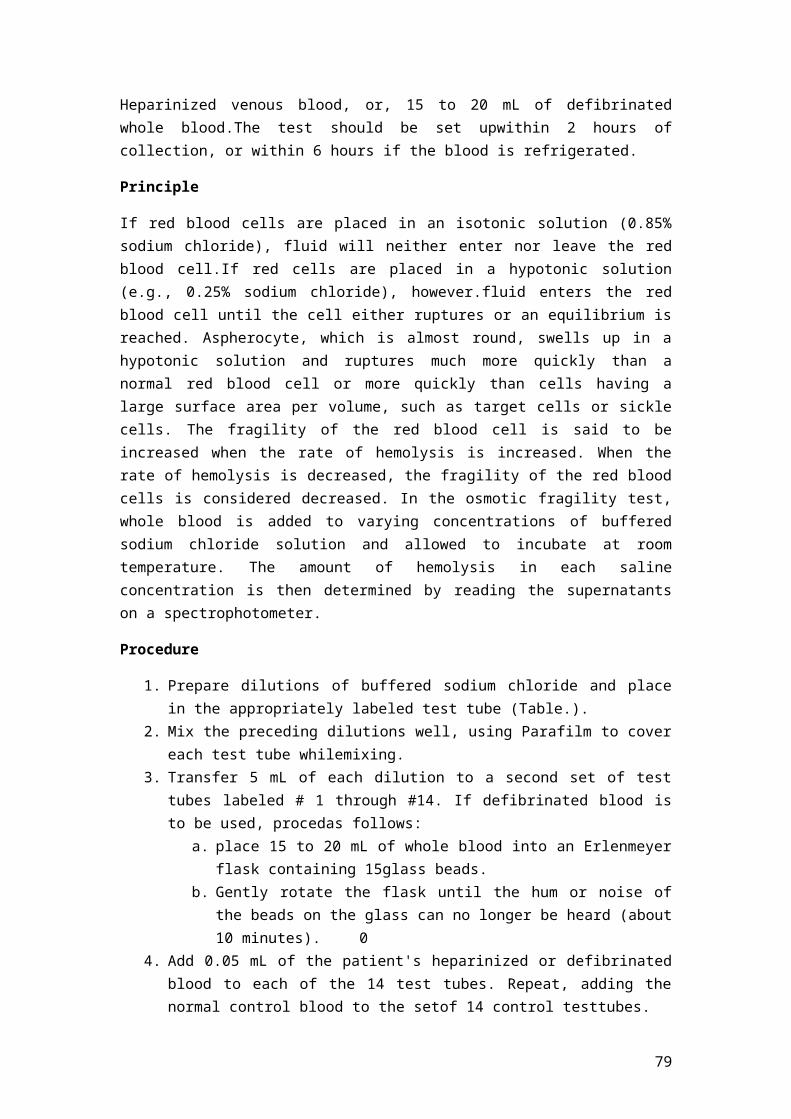
increase in number and take on specific characteristics and functions. The amount of cytoplasm in relationship to the rest of the cell usually increases as the cell matures.
Nuclear Maturation
The nucleus of the immature cell is round oval and is large in proportion to the rest of the cell. As the cell matures the nucleus decreases in relative size and may or may not take on various shapes (depending on the cell type). The nuclear chromatin transforms from a fine, delicate pattern to become more coarse and clumped on the mature form, and the staining properties change from a reddish purple to a bluish purple. Nucleoli present in early stages of cell development usually disappear gradually as the cell ages.
Cell Size As a cell matures, it usually becomes smaller in size. (for the new student, this change may be difficult to detect. The normal mature red blood cells or small lymphocytes are generally of relatively constant size and may be used as a guide for comparison) the student should know the relative size of each cell type.
Identification of cells In identifying a cell we should think of the following terms:
1. What is the size of the cell?I. Small
II. MediumIII. Large
2. What are the characteristics of the cytoplasm?I. Granular or nongranular; specific or nonspecific
granules II. Color (staining properties).
III. Relative amount.
3. What are the characteristics of the nucleus?I. Shape
II. Relative size. The size of the nucleus compared to the amount of cytoplasm is expressed as the nuclear to cytoplasmic ratio (N/C ratio)
III. Chromatin pattern: smooth or coarse; Parachromatin visible or not.IV. Presence of or absence of nucleoli; number and size.
79

ERYTHROCYTE MATURATION The overall trend in RBC maturation is large, pale nucleus to darker, smaller nucleus to loss of nucleus; increase in cytoplasm; gradual decrease in size; cytoplasm from intensely blue (full of RNA) to grayish (mixture of RNA and hemoglobin) to reddish (full of hemoglobin, no RNA). Identify the following cells.
1. Pronormobast (Rubriblast): (14-19 µm): Nucleus is large with fine chromatin and nucleoli; cytoplasm is scant and basophilic.
2. Basophilic Normoblast (Prorubriblast):(12-17 µm): Slightly smaller nucleus with slight chromatin condensation; increased cytoplasm and intensely blue (RNA abundance); no granules and no nucleoli present.
3. PolychromatophilicNormoblast (Rubricyte): (12-15 µm): Moderately condensed chromatin; lighter, grayish cytoplasm. The color of the cytoplasm is due to coloring by both acidic and basic components of the stain. Basophilia is from staining of ribosomes and acidophilia from hemoglobin. The nucleus is condensed and intensely basophilic with coarse heterochromatin granules giving a characteristic checkerboard appearance.
80
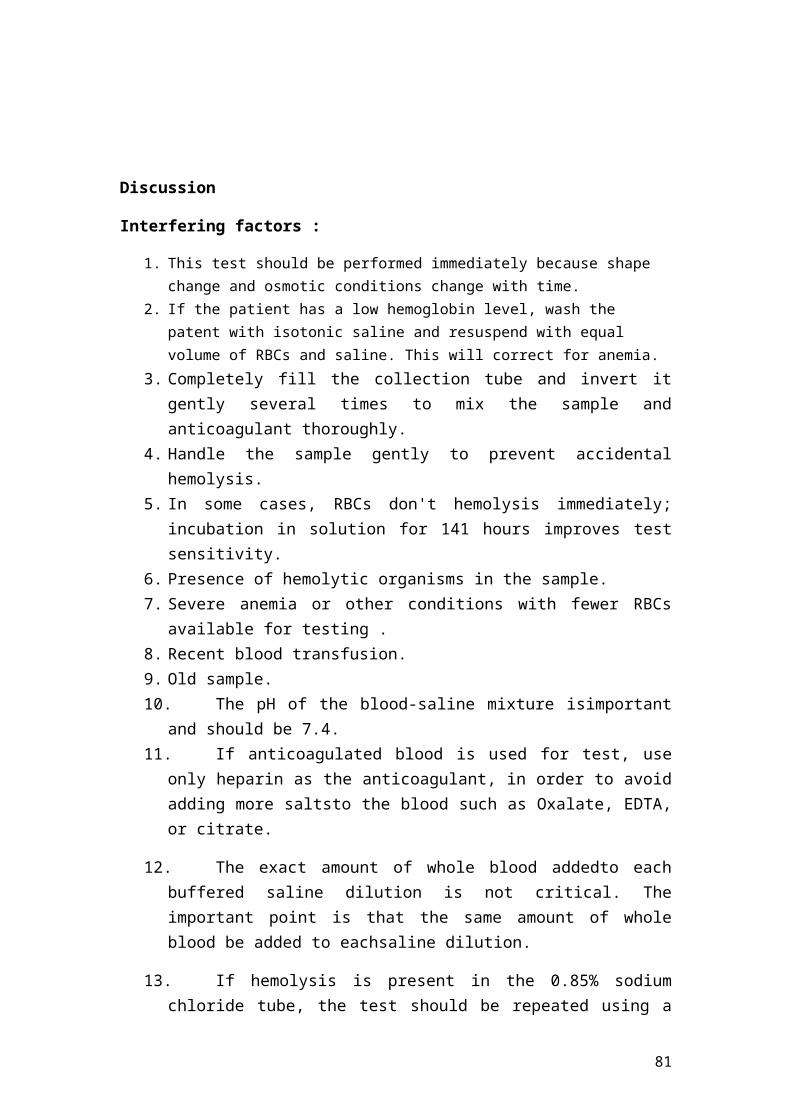
4. OrthochromatophilicNormoblast (Metarubricyte): (8-12 µm): Dark, opaque nucleus; gray-red cytoplasm (trace blue). The nucleus has become pyknotic (a homogenous blue-black mass with no structure) and there is abundant acidophilic hemoglobin. In some instances you can detect the nucleus in the process of extrusion.
5. Reticulocyte: (7-10 µm) [Not visible with this preparation. Refer to the laser disc to see an example.]: Nucleus has been extruded; cytoplasm is reddish-pale blue. RNA is still present.
6. Erythrocyte: (7-8 µm): No nucleus; orange-red cytoplasm; RNA is lost.
81
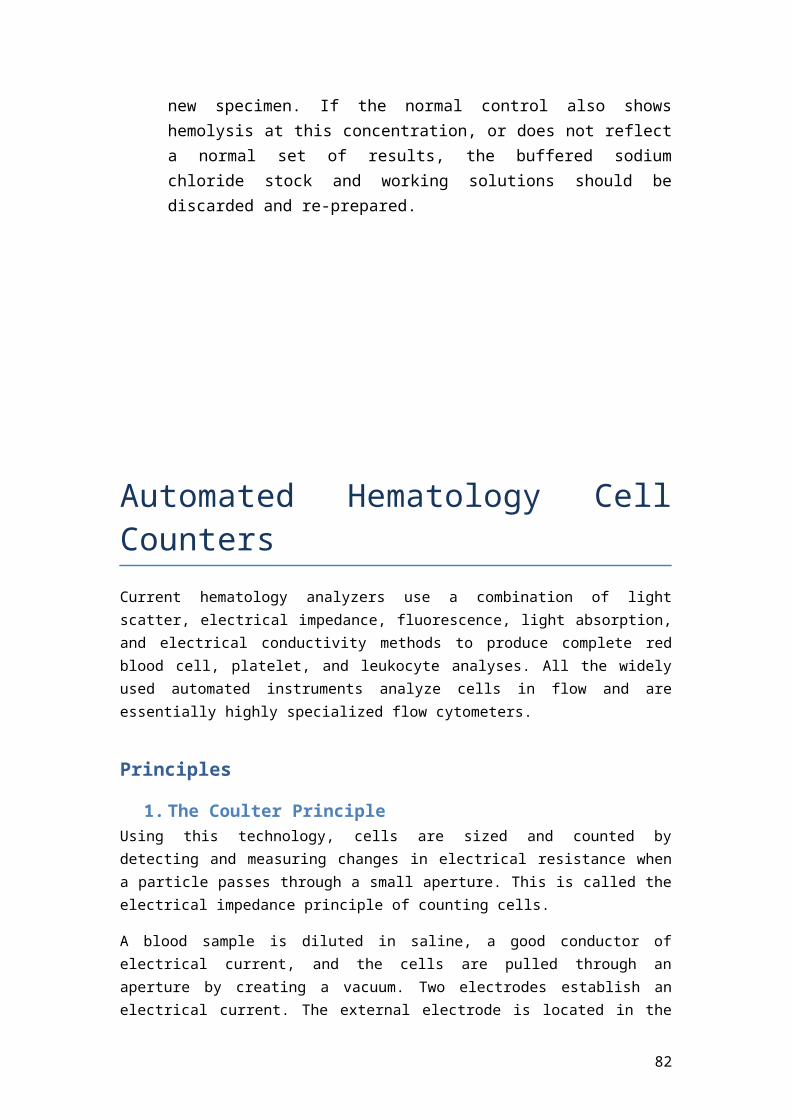
Special stainsCytochemical Stains
Cytochemical stains are very helpful in the diagnosis and classification of acute leukemias (Table1). These stains are usually performed on bone marrow smears but may also be done on peripheral smears. The special stains are used to identify enzymes or lipids within the blast
population of cells—hence, the reaction in mature cells is not of importance. The positive reactions that occur will be associated with a particular lineage, and with some of the stains (e.g., myeloperoxidase [MPO] and Sudan Black B [SBB]), the fine or coarse staining intensity is an indication of the lineage of blast cells.
All of the cytochemical stains described below are negative in lymphoid cells (with rare exceptions), so a positive result with any of these will most often rule out acute lymphoblastic leukemia.
Blasts IdentifiedCellular Element StainedCytochemical Reaction
Myeloblasts strong positive;monoblasts faint positive
Neutrophil primary granulesMyeloperoxidase (MPO)
Myeloblasts strong positive;monoblasts faint positive
PhospholipidsSudan Black B (SBB)
Myeloblasts strong positiveCellular enzymeSpecific esterase
Monoblasts strong positiveCellular enzymeNonspecific esterase (NSE)
Variable, coarse or block-like positivity often seen inlymphoblasts and pronormoblasts, myeloblasts usuallynegative although faint diffuse reaction mayoccasionally be seen
Glycogen and related substances
Periodic acid-Schiff
1. Leukocyte Alkaline phosphatase (LAP):Purpose: Distinguishing the cells of leukemoid reactions with increased activity from these of (CML) with decreased activity.Principle: Alkaline phosphatase Activity is present in varying degrees in the neutrophil and band form of the granulocytes / sometime in B lymphocytes
* Naphthol As-M or {naphthol AS-BI}
LAPHydrolsed Substrate
Fast blue insoluble precipitate at the site of enzyme activityAlkaline PH RR dye
Interpretation:
82

Count 100 neutrophiles and score them (0/+4), then calculate the final score by adding the total scores.
Grading:*(0) No stain*(+1) Faint stain *(+2) Moderate stain*(+3) Strong stain *(+4) Strong stain without cytoplasmic background Normal Range:30-185
LAP elevated in: LAP decreased in:1. Leukomoid reaction. 1. CML.2. Pregnancy 2. Paroxymal Nocturnal
Hemoglobinuria.3. Polycythemia vera. 3. Sickle cell anemia.4. Aplastic anemia. 4. Hypophosphatasia.5. Multiuple myeloma6. Obstructive juindice.7. Hodgkins` disease.
**The following diseases will not affect LAP result:1. Untreated hemolytic anemia.2. Lymphosarcoma.3. Viral hepatitis.4. Secodery polycythemia.
2. Peroxidase stain /Myeloperoxidase (MPO):Purpose: To differentiate a myelogenous or monocytic leukemia from acute lymphocytic leukemia.Principle: Peroxidase is present in the primary azurophilic granules of neutrophil, eosinophil and monocyte & activity increased with maturation, no activity is found in red cells or lymphocytes.
H2O2 +3-amino-9-ethylecarbazole Or (benzidinedihydrodase)
Peroxidase Insoluble red brown precipitate
Interpretation: Red – brown peroxidase found in:
Neutrophil and eosinophil {promyelocyte – Myelocyte – Metamyelocyte} Finely granular staining found in:
Monocyte Negative stain found in:
Early Myeloblast, lymphoblast, basophiles and plasma cell
Notes:
83

1. In acute leukemia, infection &myelodysplasia neutrophils show (-ve) stain 2. Increase in CML*3. Basophile May stain +ve in granulocytic leukemia4. Peroxidase stain show results similar to those of sudan Black B stain
3. Sudan Black B: Purpose: To distinguish acute myelogenous and monocytic leukemia from lymphocytic leukemia.Principle: Sudan black B dye is fat soluble, then it stains fat particles (Steroles, phospholipids and neutral fats) which present in the primary and secondery granules of myelocytic and monocytic cells.Interpretation:
Myelogenous cells show coarse staining granules with faint staining pattern for myelobast and increase staining with maturation.
Auer rods are +vely stained. * Monocytic cells show finely scatterd granules. -velymphoctic staining except Burkitt`s lymphoma cells, may show +ve staining
vacuoles.
4. Acid phosphtase( withtartarate resistance)Purpose: diagnosis of hairy cell leukemia.Principle: ACP enzyme present in myelocytic, lymphocytes, monocytic, plasma cell, and platelets in these cells ACP activity will inhibited in the presence of (L-tartarate) and give no color, while hairy cell ACP will not inhibited and give (+ve).
Naphthol AS-BI Phosphoric acid
ACPnaphthol
ParasolininRed precipitate
Acid PH
**ACP isoenzymes (0, 1, 2, 3a, 3b) inhibited (L+) (5) Not inhibited
5. Non Specific Esterase: {with fluoride inhibition}Purpose: Differentiate myelocytic and monocytic leukemia.Principle: WBCS contain esterases, a group of lysosomal enzymesα-naphthyl
acetate
Non specific esterase naphthyl compound
ParasolininRed ppt.
Interpretation: (+ve) brick – red staining which found in: Megakaryocyte and platelets, Histocyte, Macrophage, Monocyte & Lymphoblast of ALL (-ve) for granulocytes
**If fluoride added, only monocyte non specific esterase will be inhabited.
84

6. Periodic Acid – Schiff [PAS] Reaction:Purpose: -Diagnosis of some acute lymphocytic leukemia -subtypes of AML -M6
Principle: the stain indicates the presence of muccoproteins , glycoproteins and high molecular weight carbohydrates in blood cells.
Glycoprotein Periodic acid Aldehydes Schiff reagent Red ppt
Interpretation: Normally all blood cells are (+ve) but Erythroblasts (-ve)
o Diffused stain pattern (Granulocytes)o Granular stain (lymphocytes and monocytes) o Plts deeply stainedo nRBCs (-ve) stain
In diseases:o In CML, lymphosarcoma and Hodgkins` disease (+ve) staining granules will
increase.o nRBCs in M6, thalassemia and other types of anemia may give [+ve] reaction.
7. Specific esterase or chloroacetate
Principle:
Naphthol (AS-D) Chloroacetate naphthol Fast blue BB Blue precipitate / EsteraseInteretaion:
Myeloid cells (+ve) Monocyte and basophile (–ve) to weak (+ve) Other cells {lymph – plasma –megakaryocyte – NRBC } (-ve) Auer rods (+ve)
8. Iron stain (Prussian Blue Reaction):Principle:
Sidrotic granules are found in the cytoplasm of developing cells in [BM] in the form of Ferric [Fe+3].[Fe+3] + Brussian blue (Perls` reagent) blue colorPerls' reagent is formed of (Potassium Ferricyanide + HCL)** Sidrotic granules are found in nRBCs, some reticulocytes
85
Related Documents