IAEA-TECDOC-564 PRACTICAL ASPECTS OF OPERATING A NEUTRON ACTIVATION ANALYSIS LABORATORY A TECHNICAL DOCUMENT ISSUED BY THE INTERNATIONAL ATOMIC ENERGY AGENCY, VIENNA, 1990

Welcome message from author
This document is posted to help you gain knowledge. Please leave a comment to let me know what you think about it! Share it to your friends and learn new things together.
Transcript
IAEA-TECDOC-564
PRACTICAL ASPECTS OF OPERATINGA NEUTRON ACTIVATIONANALYSIS LABORATORY
A TECHNICAL DOCUMENT ISSUED BY THEINTERNATIONAL ATOMIC ENERGY AGENCY, VIENNA, 1990

PRACTICAL ASPECTS OF OPERATINGA NEUTRON ACTIVATION ANALYSIS LABORATORY
IAEA, VIENNA, 1990IAEA-TECDOC-564ISSN 1011-4289
Printed by the IAEA in AustriaJuly 1990

PLEASE BE AWARE THATALL OF THE MISSING PAGES IN THIS DOCUMENT
WERE ORIGINALLY BLANK

FOREWORD
This book is intended to advise in everyday practical problems related tooperating a neutron activation analysis (NAA) laboratory. It gives answersto questions like "what to use NAA for", "how to find relevant researchproblems", "how to find users for the technique", "how to estimate the costof the analysis and how to finance the work", "how to organize the work ina rational way" and "how to perform the quality control". It gives advicein choosing staff, equipment, and consumables and how to design facilitiesand procedures according to need and available resources.
The book is designed to discuss problems not dealt with in ordinary NAAtextbooks, but also, in order to prevent it from being too voluminous, toavoid duplication of material described in normal NAA text books.Therefore, the reader will find that some material of interest is missingfrom this book and it is recommended that one or two of the textbookslisted in chapter 11 be read in addition to this one.
The authors represent a wide range of experience with biological,environmental, geological, and industrial samples, in contexts from basicresearch to commercial analytical service. Their backgrounds also rangefrom university to governmental research institute and private enterprise.Their summed experience exceeds the time since Hevesy and Levy's firstpublication on activation analysis; nevertheless, other workers in thefield may not agree with all the statements made herein. It is their hopethat this publication will be of value, both in respect to practicalaspects of running a modern NAA laboratory, and in recommending relevantapplications in a time with abundant analytical techniques and arequirement for a well-founded cost/benefit ratio for all activities.

EDITORIAL NOTE
In preparing this material for the press, staff of the International Atomic Energy Agency havemounted and paginated the original manuscripts and given some attention to presentation.
The views expressed do not necessarily reflect those of the governments of the Member Statesor organizations under whose auspices the manuscripts were produced.
The use in this book of particular designations of countries or territories does not imply anyjudgement by the publisher, the IAEA, as to the legal status of such countries or territories, of theirauthorities and institutions or of the delimitation of their boundaries.
The mention of specific companies or of their products or brand names does not imply anyendorsement or recommendation on the part of the IAEA.

CONTENTS
1. INTRODUCTION ..................................................................................... 7
2. PRINCIPLES OF INSTRUMENTAL NEUTRON ACTIVATION ANALYSIS ............ 9
2.1. Historical background ............................................................................. 92.2. Characteristics of neutron activation analysis ................................................. 92.3. Sensitivities available with NAA .............................................................. 18
3. POTENTIAL APPLICATIONS OF ECONOMIC AND SOCIAL IMPORTANCE ....... 20
3.1. Major applications ................................................................................ 203.2. Other applications ................................................................................ 29
4. IRRADIATION FACILITIES ........................................................................ 33
4.1. Research reactor types ........................................................................... 334.2. Sample encapsulation ............................................................................ 374.3. Irradiation sites .................................................................................... 434.4. Irradiation in modified flux ..................................................................... 47
5. COUNTING AND DATA PROCESSING FACILITIES ....................................... 50
5.1. Typical counting systems ........................................................................ 505.2. Semiconductor detectors ......................................................................... 515.3. Basic electronics .................................................................................. 655.4. Multichannel pulse height analyzer (MCA) ................................................. 815.5. Data processing ................................................................................... 855.6. Automation ......................................................................................... 885.7. Choice of location ................................................................................ 93
6. RELATED TECHNIQUES ........................................................................... 96
6.1. Delayed neutron activation analysis ........................................................... 966.2. Prompt gamma neutron activation analysis .................................................. 996.3. Measurement of environmental radioactivity ................................................ 99
7. MAKING NAA AVAILABLE TO THE SCIENTIFIC ANDTECHNICAL COMMUNITY ....................................................................... 101
7.1. Identification of possible consumers .......................................................... 1017.2. Collecting background information and identification of applications .................. 1047.3. Consultation with potential consumers ....................................................... 1047.4. Modes of providing NAA services ........................................................... 1057.5 Cost analysis ...................................................................................... 108
8. ORGANIZATION OF WORK ....................................................................... 115
8.1. Staff ................................................................................................. 1158.2. Sample bookkeeping and coding .............................................................. 1168.3. Sample preparation ............................................................................... 1198.4. Standards ........................................................................................... 1268.5. Irradiation procedures ........................................................................... 1288.6. Decay ............................................................................................... 1368.7. Measurements ..................................................................................... 1388.8. Data processing ................................................................................... 1488.9. Reporting ........................................................................................... 150
9. QUALITY ASSURANCE ............................................................................. 156
9.1. Need for quality assurance ..................................................................... 1569.2. Methods for quality assurance ................................................................. 1569.3. Assignement of uncertainty ..................................................................... 1619.4. Location of sources of errors .................................................................. 163
10. RADIATION PROTECTION ........................................................................ 169
11. SUGGESTED READING ............................................................................. 172
REFERENCES ................................................................................................. 175
APPENDIX A. TABLES FOR NEUTRON ACTIVATION ANALYSIS ......................... 193
Introduction .............................................................................................. 193References to Introduction ............................................................................ 196Table I. Thermal neutron cross-sections and resonance integrals .......................... 197Table II. Cross-sections averaged in a 235U fission neutron spectrum ..................... 202Table III. Radioactive isotopes arranged by atomic number .................................. 203Table IV. Gamma rays arranged by energy (t,/2 < 1 day) ................................... 221Table V. Gamma rays arranged by energy (t1/2 > Iday) .................................... 228Table VI. Recommended gamma rays for analysis and their interferences
(t,/2 < 5 hours) ........................................................................... 238Table VII. Recommended gamma rays for analysis and their interferences
(5 hours < t1/2 < 7 days) .............................................................. 240Table VIII. Recommended gamma rays for analysis and their interferences
(t1/2 > 7 days) ............................................................................ 243References to tables .................................................................................... 248
CONTRIBUTORS TO DRAFTING AND REVIEW .................................................. 251
1. INTRODUCTION
Nuclear research reactors are commonly purchased by governments oruniversities to form the basis for multidisciplinary research institutes. Inmany countries there is only one research reactor and it is intended tosupport the scientific and technical development of the whole country. Aresearch reactor is a major investment and it is also expensive to run.Therefore it is important to use it efficiently.
Analytical chemistry is an essential part of science and technology. In mostcases an analytical chemistry laboratory is established and used in theinstitutes which use the results. Neutron activation analysis (NAA) is anexception to this. The expensive research reactor necessary to conduct NAAcannot be purchased by every analytical laboratory. Therefore NAA is commonlyonly performed at reactor laboratories although some laboratories withoutreactors simply buy the irradiations. When short-lived nuclides are usedclose access to the reactor is obligatory.
Although very sensitive and accurate non nuclear analytical techniques exist,NAA has several advantages which support its use as a complement to othertechniques, as has been clearly shown on several occasions [i]. Thereforeit is the duty of the institute running the reactor to make NAA available tousers in the whole country. This is, however, not successful in all countriesor reactor laboratories. Several NAA laboratories are run in a way that isfar from optimum as regards the needs of the country. One or several of thefollowing reasons can be identified.
- The NAA group has no motivation to make the technique available tooutside users. The work is academically oriented. The group developsanalytical methods to be published in scientific journals and only runsits own research projects.
- Co-operation with scientific institutions and industrial enterprises islimited. The NAA group is not aware of the needs of the country andthe possible counterpart has no knowledge about the possibilities ofusing NAA to solve their analytical problems.
There does not exist a mechanism that makes the NAA services avai Lab leto outside users. The increased use of NAA requires manpower andinstrumentation, the cost of which must somehow be covered.
The laboratory does not have the capability for large scale work.Delivery time of results is long and only a limited number of samplescan be analyzed annually, because of lack of skill, manpower,instrumentation or proper procedures. The cost of services may also behigh for this reason.
- The quality of the work is not good enough. The end users of theanalytical data cannot rely on the results and therefore do not use theNAA services.
NAA is applied to elements and samples for which the techniques are notoptimal compared to available non-nuclear analytical techniques.
The authors feel that the available articles and books on NAA do not deal withthe problems outlined here. In this book the emphasis is not on theory or newtechniques.
Radiochemical NAA is not dealt with because (1) radiochemical NAA, with theexception of some preirradiation applications, is not economically competitivewith non-nuclear techniques, and (2) description of the numerous chemicalseparation techniques and radiochemical laboratory practices would enlarge thebook too much.
This book addresses itself to scientists who are starting with NAA or who areestablishing new NAA laboratories. It is, however, foreseen that it will alsobe useful to scientists who have already been working a few years with NAA.
2. PRINCIPLES OF INSTRUMENTAL NEUTRON ACTIVATION ANALYSIS
2.1 HISTORICAL BACKGROUND
Neutron activation analysis (NAA) can be dated to the time of Hevesy and Levi[2], who published their first report of the method in 1936.
Following the development of nuclear reactors in the 1940s and sodium-iodidescintillation detectors in the early 1950s, the possibilities for applying NAAto trace element analysis of samples from many disciplines were recognized.Early development of NAA was rapid. The invention of high resolutionsolid-state Ge(Li) detectors in the 1960s and more recent advancements ofcomputers and automation during the 1970s aad 1080s have made possibleapplication of NAA to research studies involving very large numbers of samples.
2.2 CHARACTERISTICS OF NEUTRON ACTIVATION ANALYSIS
Neutron activation analysis has become a mainstay of geochemical andbiochemical trace element research because the technique possesses severalimportant advantages.
(a) Substantial freedom from systematic errors. The physical processesinvolved are well understood. Radioactive growth and decay arerigorously exponential. The number of energetically possible nuclearreactions from a given target nuclide is small, and all possiblereactions can be enumerated by inspection of a table of nuclides.High-resolution gamma-ray spectroscopy affords qualitativeidentification of the nuclides present as well as their quantitation.The density of known gamma-ray lines in energy space is small comparedwith the resolution of modern detectors, and not many analyticallyimportant decay gamma rays remain to be discovered. The presence ofpossible interferences may often be readily tested when multiple linesof either component are emitted.
(b) Complementarity to other methods. A different suite of elements ismeasurable by using nuclear rather than chemical reactions, and thedetection limits are quantitatively different. Equally important, thekinds of errors to which nuclear methods are subject are due todifferent physical phenomena and are therefore likely to give adifferent bias in the results.
(c) Freedom from analytical blank and other problems related todissolution. Except for pre-irradiation handling and packaging, thereis no reagent blank in the usual sense. Analytical methods whichrequire that the analyte be in solution call for chemical laboratoryskills far beyond simple weighing and packaging. With some matrices(rocks containing complex silicates like chromite or zircon; fattyanimal tissues), it is not easy to assure complete dissolution withoutusing extreme conditions or multistep chemistry.
(d) Quantitatively known precision. The random process of radioactivedecay gives an a priori estimate of the variation to be expectedbetween samples. A simple T test shows immediately whether countingstatistics is the limiting factor in precision. The accuracy can becomparable to the precision at levels well below 1%, even for adecaying source.
(e) Multi-element capability. Gamma-ray spectroscopy is inherently amulti.nuclide analytical process, the components of which add linearly.Radioactive decay adds the dimension of time, which can often act as aperfect separation chemist to resolve otherwise interfering componentssuch as Cr-51 and Ti-51.
(f) Sensitivity. Neutron activation analysis has been shown to beapplicable to the analysis of many elements at sub-picogram amounts.The option of chemical separation after irradiation is often availablefor the blank-free removal of interfering radioactivities.
(g) Results are independent of chemical state of elements. Neutronactivation analysis is based on physical phenomena which take place inthe nuclei of elements. As such, the chemical state as defined by theatomic binding, has no influence on the results. There are no chemicalmatrix effects as may occur in analytical techniques based on atomicproperties and changes therein.
These characteristics of nuclear methods have been widely exploited, parti-cularly in research into trace element analytical methodology. Fifty-sixpercent of all published analyses of NBS multielement SRMs have been performedby nuclear techniques, according to a recent survey [3]. Contemporary traceelement geochemistry, from lunar sample and meteorite analysis [4/s/e] tomineral exploration, relies heavily on neutron activation analysis. Because
10
of its freedom from blank, neutron activation is the most powerful techniqueavailable for the study of contamination in handling and sampling animaltissues [7/a].
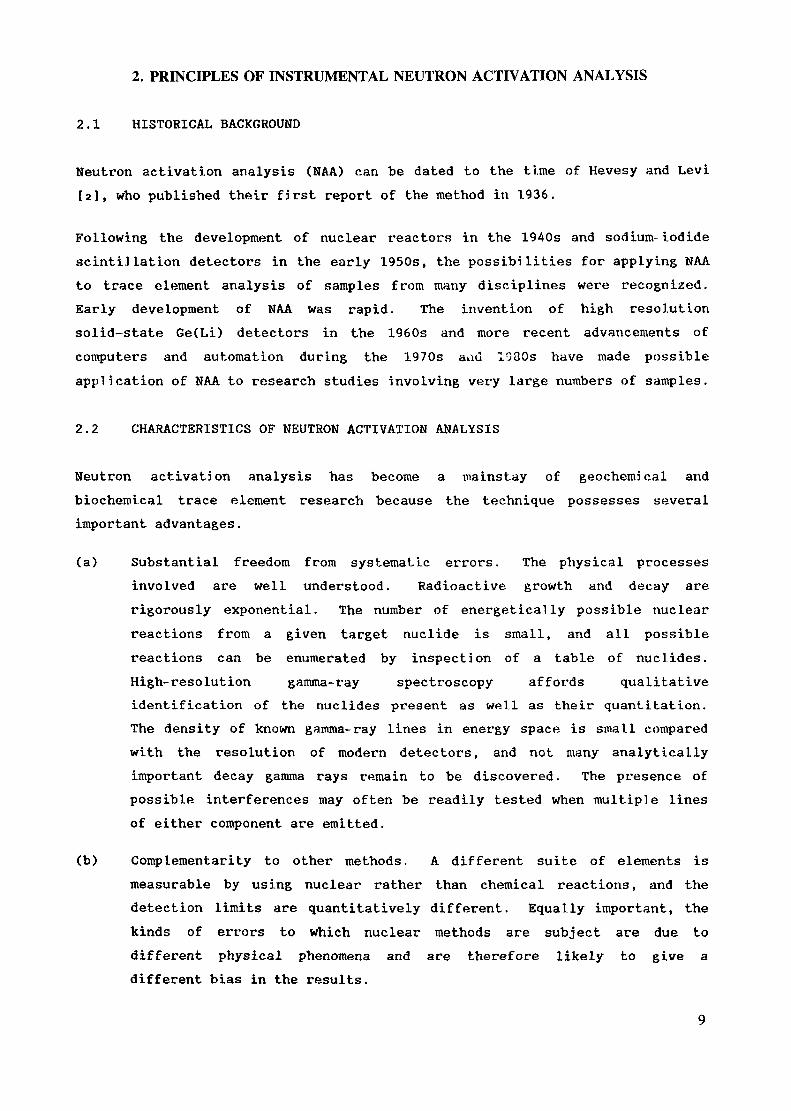
The physical phenomena upon which NAA are based are the properties of thenucleus, radioactivity, and the interaction of radiation with matter. Thesequence of events during a typical (n,y) reaction are illustrated inFigure 1.1. When a neutron interacts with a target nucleus by a non-elasticcollision, a compound nucleus is formed in a highly excited state. The highexcitation energy of the compound nucleus 8 MeV on the average, is due to thehigh binding energy of the neutron with the nucleus. The lifetime of thecompound nucleus is typically 10 to 10 s. This is long enoughthat no traces remain to identify the particular process of formation, butshort enough that the nucleus can undergo a rapid de excitation to a morestable configuration, in a number of different ways which usually involveemission of nuclear particles or prompt gamma rays. In most cases, the newnucleus is radioactive and will further de-excite by emitting decay gammarays. The NAA method relies on the measurement of either these characteristicprompt or decay gamma rays for identifying elements and determining theiramounts present in samples. About 70% of the elements have nuclidespossessing properties suitable for NAA.
'pPROMPT
GAMMA RAY
TARGETNUCLEUS
A
INCIDENTNEUTRON
COMPOUNDNUCLEUS
RADIOACTIVENUCLEUS
DECAYGAMMA RAY
f.
STABLENUCLEUS
Z-M
FIG. 1.1. Schematic diagram illustrating the sequence of events fora typical (n,7) reaction.
11
2.2.1 NEUTRONS AND NUCLEAR REACTIONS
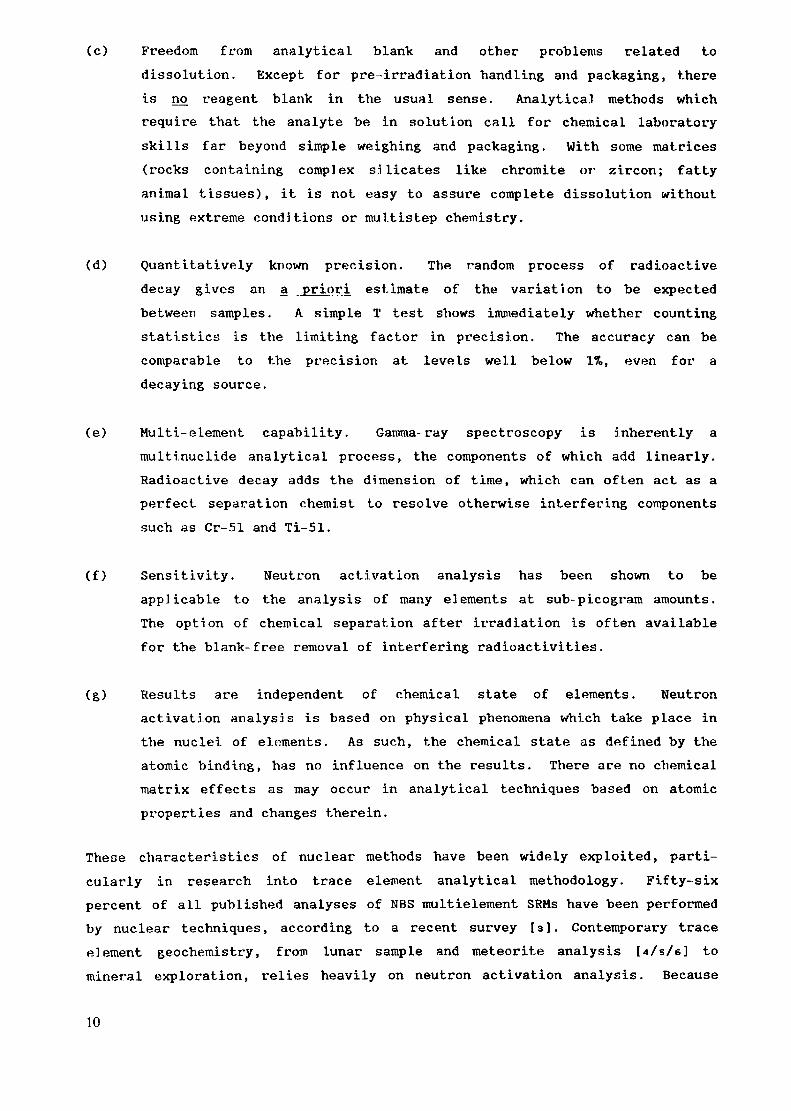
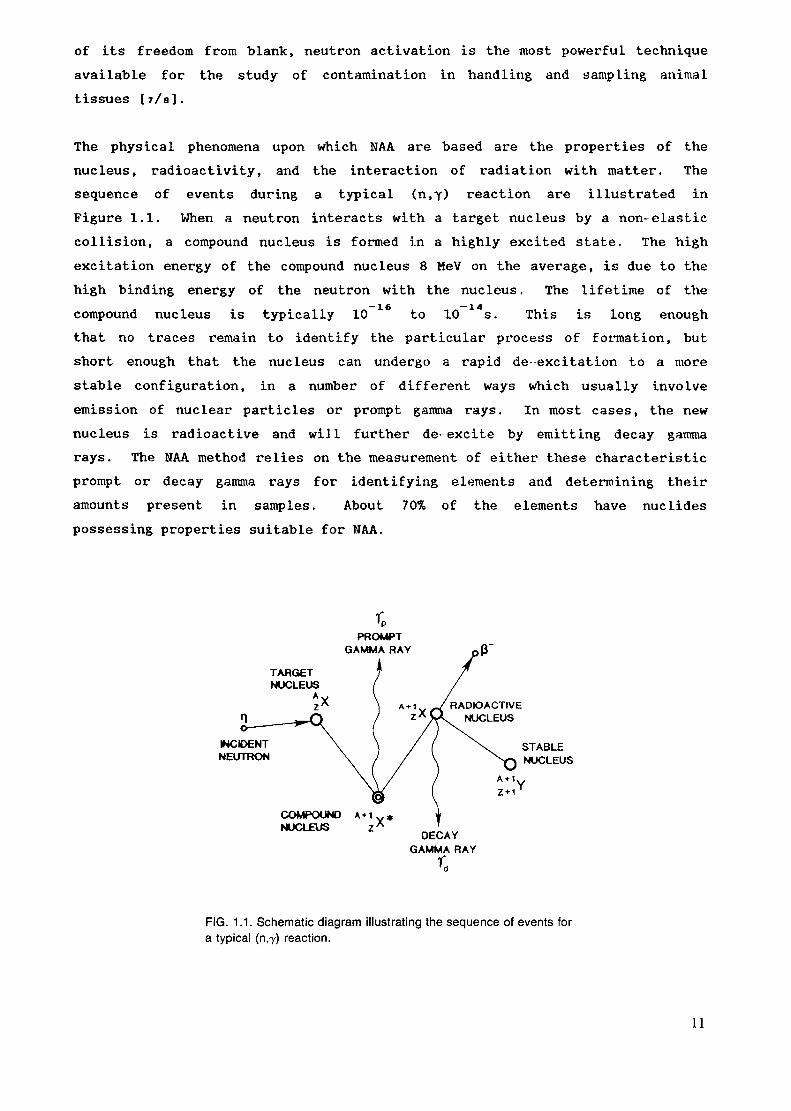
There are several types of neutron sources (reactors, accelerators andradioisotopic neutron emitters), but nuclear reactors with their high fluxesof neutrons from the fission of U give the most intense irradiationsand, hence, the highest available sensitivities for NAA. Fission-producedneutrons have energies ranging up to 15 MeV with an average energy of about 2MeV. Through elastic collisions with moderator nuclei the fission neutronsrapidly become thermalized creating a broad energy distribution consisting ofthree principal components (thermal, epithermal and fast) as shown in Figure1.2. The neutron energy distributions of different reactors vary considerablyin relation to the type of reactor and between irradiation positions within areactor.
co30)
_o<ucc
10
10 101 103 10s
Neutron Energy (eV)
10'
FIG. 1.2. A typical reactor neutron spectrum showing the variouscomponents used to describe neutron energy regions.
The thermal component consists of low-energy neutrons (below 0.5 eV) whichhave achieved thermal equilibrium with the atoms in the reactor moderator. Atroom temperature the energy spectrum of thermal neutrons can be described by aMaxwell-Boltzmann distribution with a mean energy of 0.025 eV and a mostprobable velocity of 2200 m/s. The flux of thermal neutrons, <p , isdefined as the product of the most probable velocity v and the number densityn of neutrons per unit volume. The upper energy limit is established by acadmium foil 1 mm thick, which as a filter passes only those neutrons havingenergies above 0.5 eV. A nonresonant capture reaction has a cross sectioninversely proportional to the neutron velocity (a "1/v" excitation function).
12
The rate of such a reaction is thus proportional to nv/v or the neutrondensity, the proportionality constant being conventionally taken as the crosssection at 2200 m/s. Measurements of thermal neutron flux are commonly
59 6Ocarried out with flux monitors of cobalt by the Co(ny) Coreaction, which has a well-established cross section of 37.1 barns (1 barn =
— 2<4 210 cm ). A typical thermal neutron flux in the core of a—13 —2 —1one-megawatt research reactor is about 10 ncm s
The epithermal neutrons are those neutrons which have been only partiallymoderated. Their distribution can be approximately described by a 1/E slopebeginning above the cadmium threshold and ranging up to about 1 MeV. Theepithermal flux in a typical research reactor is usually about 2 percent ofthe thermal flux.
A non-rigorous but commonly used description of the total reaction rate pertarget atom for (n,y) reactions induced by both thermal and epithermalneutrons is given by:
R = (p.. a.. + «> . I .,_.th th ^epi (1)
where= thermal neutron flux;j.1.tn
= average thermal neutron cross section; andto . = epithermal neutron flux;epithI = effective resonance integral or epithermal cross section.
Because the cross-section curves for many nuclides are characterized bynumerous resonance peaks in the opithermal neutron region, the effectiveresonance integral is defined by the expression:
CO
I = o (E) dE/E (2)0.5 eV
In general, the thermal and epithermal neutrons in a reactor are the mostwidely used for NAA because their fluxes are greatest and the cross sectionsfor (n,y) reactions are the largest. Thus, neutrons from these energyregions offer the greatest analytical sensitivity available for NAA.Although the epithermal neutrons represent only a small fraction of the totalreactor neutrons, they are sometimes useful in NAA for several elements (e.g.,
13
Br, Rb, Sr, Mo, Ba, Ta, and U) which have higher relative reaction rates forépi thermal neutrons than for thermal neutrons. The technique for takingadvantage of those (n,y) reactions with high resonance integrals byirradiating samples under a cadmium cover to shield out the thermal neutronsis commonly known as epithermal neutron activation analysis (ENAA). Thereaction rate per atom R for ENAA is given by the expression:
R . = (p . I (3)epi epi
In general, calculation of effective cross sections for epithermal neutrons ismade difficult by the large number of resonance peaks for most nuclides.
1_ 9 8However, the reaction Au(n,) Au which has only a single resonancepeak has been well investigated and its resonance integral is known to be 1550barns. Therefore, the activity ratio for an infinitely thin gold foil orgold-alloy wire irradiated with and without cadmium covers is a frequentlyused method for measuring epitherroal flux and as a calibration standard tomeasure the resonance integrals for other (n,y) reactions. The equationdescribing this cadmium ratio (CR) is:
vth öth + "épi1/ t \(4)
R . <p .1epi T
A tabulation of both thermal neutron cross sections and resonance integralsfor most (n,y) reactions can be found in Table I of the Appendix.
The remaining component of the neutron spectrum from 1 to 15 MeV consists ofthe primary fission (or fast) neutrons which still have much of their originalenergy following the fission reaction. At high neutron energies the crosssections for {n,y) reactions are very small and those nuclear reactionswhich result in ejecting one or more particles - (n,p), (n,y) and (n,2n)reactions - become important. All of these reactions are known as thresholdreactions because a minimum neutron energy, E , is necessary for thereaction to occur. Below E the cross section is zero and above thisthreshold the cross section is energy dependent. Because this energydependence is not easily described, an average cross section is commonly used
14
in calculations. The average cross section for a reaction induced by neutronsfrom a U fission neutron spectrum is defined by:
00
cr(E) <p(E) dEET
af = ____________ (5)
<p(E) dEaT
Using this average cross section the reaction rate for a fissionneutron-induced reaction is given by the expression:
R = ö (p (6)
where <p represents the average fission neutron flux.
Measurements of fast neutron fluxes and calibration of cross sections forthreshold reactions are most conveniently made by irradiation of a nickel fluxmonitor which has a cross section of 113 millibarns for the Ni(n,p) Coreaction. Table II of the Appendix contains a compilation of many thresholdreactions of interest in NAA.
2.2.2 ACTIVATION AND DECAY EQUATIONS
In NAA, the count rate, A, of decay gamma rays at the time of measurementbeing emitted by a particular radionuclide is dependent on the disintegrationrate, D, at the end of irradiation, which is in turn directly proportional tothe amount of target element present in the sample. The basic equations inNAA for the activation and decay of a radionuclide with a halflife oft . are as fol lows:1/2
D = (NWBVM) R [1 - exp(-XT.)] (7)
A = cTD exp(-XT ) (8)
15
whereN = Avogadro's number, 6.023 x 10 atoms /mole;W = weight of element irradiated in grams;F = fractional abundance of target isotope;M = atomic weight of element;R = nuclear reaction rate per nucleus of target isotope;X = decay constant (In2/t ) of the radioisotope;F = branching ratio of identifying gamma ray;e = detector photopeak efficiency;T. = length of irradiation; andT. = length of decay following irradiation.a
Under certain irradiation conditions equation (7) can be simplified. Forexample, saturation occurs when the value of T. » t , causing thefactor [1 - exp(-XT.)3 to approximate a value of 1. On the other hand, ifthe irradiation time is short compared to the half-life, then T. «t , and the factor [1 - exp(-XT,)] can be reduced to XT..1/2 i i
From equations (7) and (8), it is obvious that improved sensitivity can beachieved by increasing sample weight, detection efficiency, irradiation time,and nuclear reaction rate. Relative sensitivities are dependent on thenuclear properties of individual elements: (a) atomic weight, fractionalisotopic abundance, and neutron reaction cross-section for the stable isotopeof the element being irradiated; and (b) the half-life and decay scheme forthe radioisotope being measured.
Prompt gamma rays are also being used for NAA at reactors which have externalneutron beam facilities designed to permit simultaneous irradiation andcounting of samples. The method is useful for elements with extremely highcross-sections or which do not produce nuclides that are radioactive afterirradiation (e.g., H, B, Cd, Sm and Gd) . In prompt gamma neutron activationanalysis (PGNAA, section 6.2.), the activation equation (7) is continuously atsaturation so the count rates for prompt gamma rays are constant duringirradiation.
Among the tasks of anyone engaged in the application of NAA are theidentification and quantification of gamma-rays in a collected spectrum.Occasionally, there is a need to correct the desired gamma ray forcontributions from an interfering one. To facilitate these tasks a number oftables useful to gamma-ray spectroscopists have been included in the
16
Appendix. These tables include: Table Til - a listing of radioisotopes,production modes, half-lives, gamma- ray energies and gatrana-ray abundances;Tables IV and V - which list the gamma rays according to their increasingenergies for short and long-lived nuclides, respectively; Tables VI, Vli andVIII - present listings of gamma rays recommended for analysis and their mostcommon interferences.
2.2.3 INSTRUMENTAL NEUTRON ACTIVATION ANALYSIS
With the uso of automated sample handling, gamma-ray spectrum measurement withsolid-state detectors, and computerized data processing it is often possibleto measure more than thirty elements without chemical separations. Thisapplication of purely instrumental procedures for trace element analysis isfrequently called instrumental neutron activation analysis (INAA).
The concentrations of trace elements in a sample can be calculated withequations (7) and (8) provided the reaction rates, detector efficiency curve,halflives, and decay schemes of the radionuclides are known. The reactionrates can be determined by measuring the neutron fluxes with monitor elementssuch as Co, Au, or Ni which are co-irradiated with the samples. If thenuclear parameters are precisely known, then this so called "parametric" or"absolute" method of NAA can yield accurate concentrations for elements in thesample. In practice, however, uncertainties in the nuclear parameters caneasily affect the accuracy for determining the concentration of an element ofinterest.
In ideal cases where irradiation conditions do not change with time, avariation of the parametric method called the "semi-absolute" method may beused. Calibration coefficients are determined experimentally for all elementsof interest by irradiating elemental standards at one time. The analystrelies on the constancy of the determined coefficients for subsequentirradiations and analysis of samples. The accuracy of the method is onlylimited by the long-term stability of the reactor. However, there is nopositive control of individual irradiations and the accuracy of analyticalresults obtained by the semi-absolute method is difficult to establish.
The most common approach to NAA is the "comparator" method, which is generallyaccepted as the most accurate way to quantify element concentrations. In thismethod, samples are irradiated simultaneously with standards containing knownamounts of the element(s). After irradiation, both samples and standards are
17
measured under identical geometrical conditions with the same detector. Thisprocedure eliminates uncertainties in the nuclear parameters, detectorefficiencies, etc. and reduces the NAA equation for each element to itssimplest form:
W A exp(+XT )s s * Ds
W , A L expC+X-T .)st st r Dst
whereW = weight of element being sought in the sample;SW = weight of the element in the standard;stD = disintegration rate at the end of irradiation for radioisotope
measured ; andD = disintegration rate in the standard at the end of irradiation.
In the multi-elemental analysis of a sample, the comparator method requires alarge numher of individual elemental standards or use of a well-characterizedmulti-element standard. Preparation and irradiation of individual standardsfor each element are time-consuming and expensive; and the use of referencematerials is not always practical because of the limited accuracy for certainelements or the differences between sample and standard matrices. As aresult, the k -method of standardization [ 9, 10 ] has gained popularity inorecent years.
In the k -method, a composite nuclear constant is used, the k -factor,o owhich contains the nuclear parameters for the element of interest, ratioedwith the nuclear parameters for a single comparator element such as gold. Bymeasuring the activities of the radioisotopes in the sample, the activity ofthe gold comparator, detector efficiencies and neutron fluxes and applying thek -factors, the element concentrations for most elements can be calculatedowith reasonably good accuracy.
2.3 SENSITIVITIES AVAILABLE WITH NAA
The sensitivities for NAA are primarily dependent on the nuclear parametersand reactor neutron fluxes as mentioned earlier. Table 1.1 lists approximatesensitivities for determination of elements in interference free spectra byusing neutrons from a typical research reactor.
18
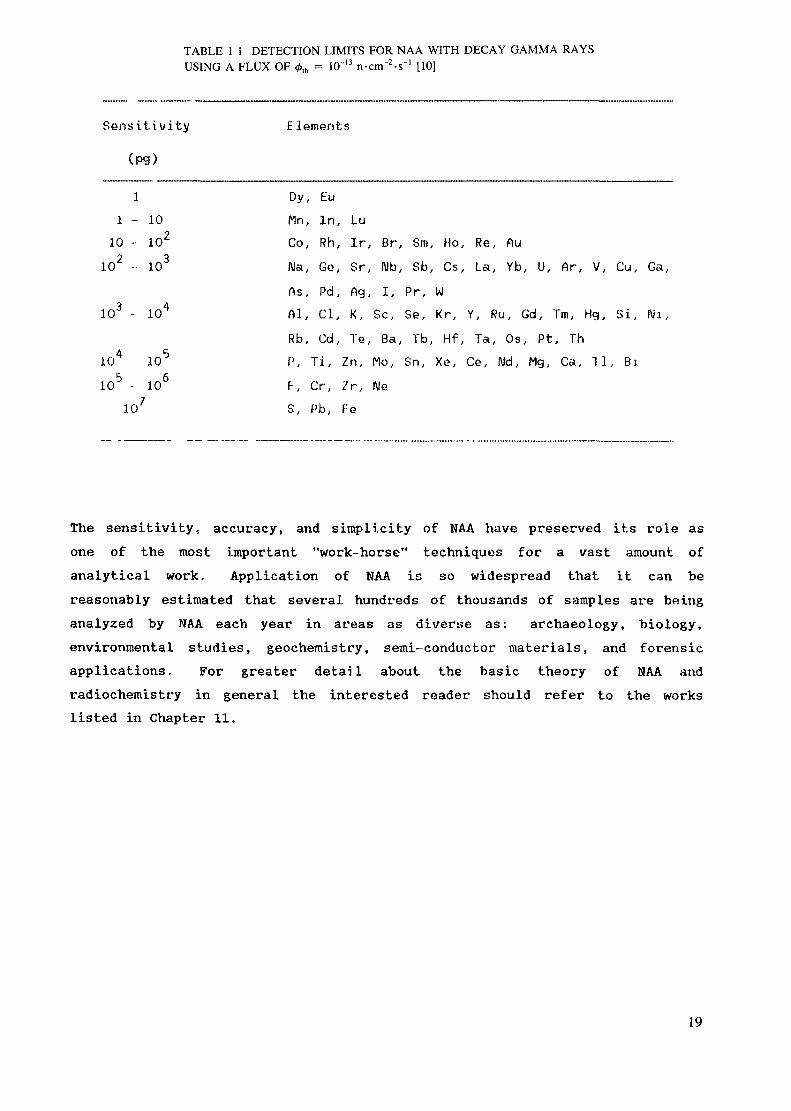
TABLE 1 1 DETECTION LIMITS FOR NAA WITH DECAY GAMMA RAYSUSING A FLUX OF 0lh = 1CT13 n-cm^-s'1 [10]
Sensitivity Elements
(pg)1 Dy, Eu
1 - 1 0 Mn, In, Lu10 - 102 Co, Rh, lr, Br, Sm, Ho, Re, flu
102 -- 103 Wa, Go, Sr, 1Mb, Sb, Cs, La, Yb, U, Ar, V, Cu, Ga,rts, Pd, Ag, I, Pr, WAl, Cl, K, Se, Se, KrRb, Cd, Te, Ba, Tb, Hf, Ta, Os, Pt, Th
103 - 104 Al, Cl, K, Se, Se, Kr, Y, Ru, Gd, Tm, Hg, Si, Ni,
104 105 P, Ti, Zn, Mo, Sn, Xe, Ce, l\)d, Mg, Ça, 11, Bi105 - 106 F-, Cr, Zr, l\le
107 S, Pb, Fe
The sensitivity, accuracy, and simplicity of NAA have preserved its role asone of the most important "work-horse" techniques for a vast amount ofanalytical work. Application of NAA is so widespread that it can bereasonably estimated that several hundreds of thousands of samples are beinganalyzed by NAA each year in areas as diverse as: archaeology, biology,environmental studies, geochemistry, semi-conductor materials, and forensicapplications. For greater detail about the basic theory of NAA andradiochemistry in general the interested reader should refer to the workslisted in Chapter 11.
19

3. POTENTIAL APPLICATIONS OF ECONOMIC AND SOCIAL IMPORTANCE
3.1. MAJOR APPLICATIONS
During the past decades, bi-annual review articles have been published[11/12/13/14/1S/16/] with new developments and applications of nucleartechniques, including activation analysis. In their article ,'Nuclear andRadiochemical Analysis lie], Ehmann and Yates give recent (1985-1987)references on application of INAA in:
Archaeology (bone, ceramics, pottery, glass, jewelry, coins, metalsculpture, paintings, raw materials, clays, soils);
Environmental science and related fields (animals, birds, insects,fish, atmosphere, dust, aerosols, food, crops, ground water, rain,melanins, plants, trees, seaweed, algae, tobacco);
Forensics (shooter identification, shotgun pellets);
Geology and geochemistry (fossil fuels, coal, coal products, petroleum,meteorites, minerals, ocean nodules, rocks, sediments, soils, glacialtill);
Industrial products and applications (electronic materials,fertilizers, fissile material detection, high purity materials,municipal waste, pharmaceutical products);
Medicine, human tissue, dental specimens (blood, bone, brain, colon,dental fillings, fetus, hair, liver, lung, mineral availability,muscle, nails, placenta, urinary stones, urine);
Also in the survey articles on the status of activation analysis in Europe andthe Americas [i7/ie] many examples of applications of INAA and correspondingreferences can be found.
INAA is not always the most appropriate technique for all these appliedfields. As an example, in particular in the medical and biological sciencestrace element concentrations might be so low that sometimes the ultimate is
20
asked of the technique with respect to sensitivity and control of sources oferrors. For these applications, often other analytical methods may bepreferred, like RNAA (Radiochemical Neutron Activation Analysis) or ICPMS(Inductively Coupled Plasma Emission Mass Spectroscopy).
In general, INAA may be the first choice for materials from the applied fields
which are difficult to convert into a solution for analysis, e.g., viaAAS or ICPMS; and/or
- of which only milligram quantities are available.
It has been one of our starting points that the the scientific and technicalcommunity of a country might benefit from a NAA laboratory when it appliesitself to problems which are of economical and social importance. Therefore,geochemistry and mineral exploration and environmental control have beenselected to be discussed in the next chapters as major applications for INAA.
3.1.1. GEOCHEMISTRY AND MINERAL EXPLORATION
One of the major applications of the INAA technique has been and will continueto be in the field of geochemistry. There are three major groups of "users"of the INAA technique within the geochemistry group, each with differentrequirements. These subgroups are university researchers, governmentgeological surveys and the mineral exploration industry. Each of these usershas different requirements of the INAA technique which can be basicallysubdivided into three categories, price, turnaround time and quality of data.A number of background books or review articles are available on theapplications of INAA to the geosciences [19/5/6/20/21].
A) UNIVERSITY
The university researcher generally wants the highest quality data but isstill concerned with price (because of limited research funds). Turn-aroundtime appears to be of the least importance. The research efforts of thisgroup are devoted to solving petrogenetic problems using trace elementgeochemistry. The major application is the analysis of rare earth elements byINAA [22/23/24] and subsequent plotting of chondrite normalized diagrams[25/6/26]. Other trace elements which are generally considered immobileunder geochemical alteration processes are also analyzed by INAA. Some of
21
these elements include Se, Hf, Ta, Th and Cs. The INAA techniques provide thereseacher with an analytical technique to detect these elements at backgroundlevels in most rock types.
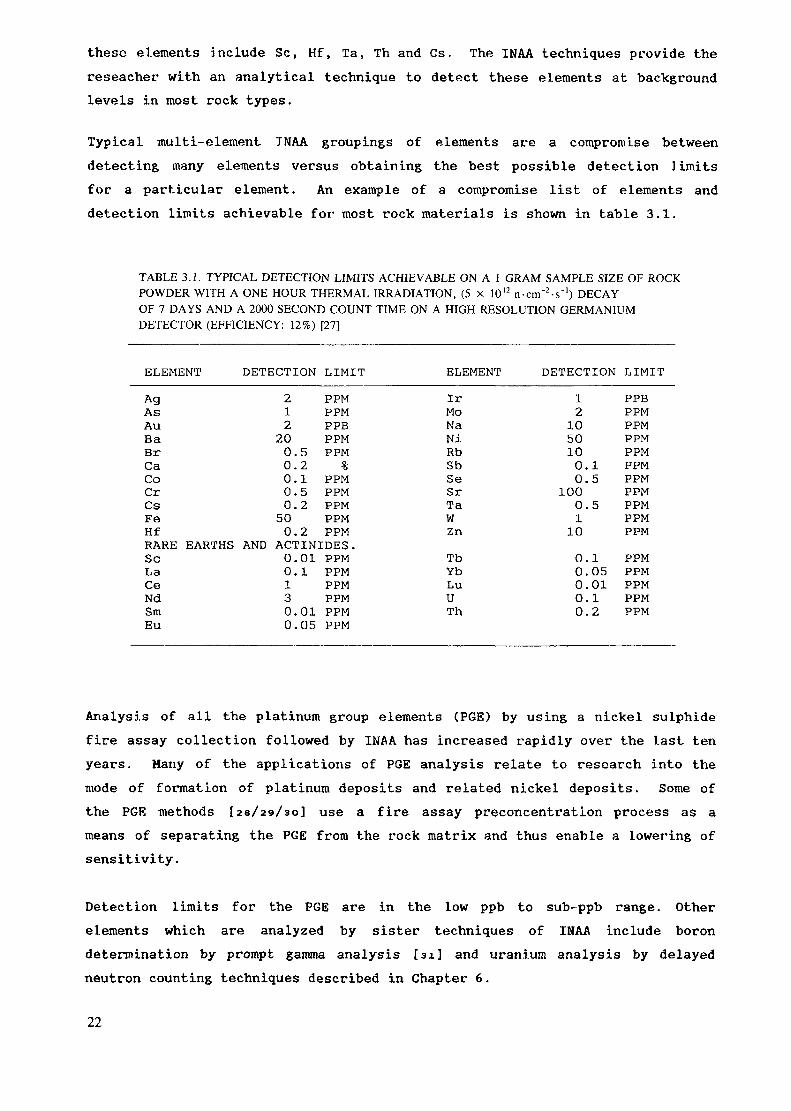
Typical multi-element TNAA groupings of elements are a compromise betweendetecting many elements versus obtaining the best possible detection limitsfor a particular element. An example of a compromise list of elements anddetection limits achievable for most rock materials is shown in table 3.1.
TABLE 3.1. TYPICAL DETECTION LIMITS ACHIEVABLE ON A 1 GRAM SAMPLE SIZE OF ROCKPOWDER WITH A ONE HOUR THERMAL IRRADIATION, (5 X 10'2 n-cnT2^-') DECAYOF 7 DAYS AND A 2000 SECOND COUNT TIME ON A HIGH RESOLUTION GERMANIUMDETECTOR (EFFICIENCY: 12%) [27]
ELEMENT DETECTION
AgAsAuBaBrCaCoCrCsFeHfRAREScLaCeNdSmEu
2122000000500
.5
.2
.1
.5
.2
.2
LIMITPPMPPMPPBPPMPPM%
PPMPPMPPMPPMPPM
ELEMENT
IrMoNaNiRbSbSeSrTaWZn
DETECTION
121050100.0.
1000.110
155
LIMIT
PPBPPMPPMPPMPPMPPMPPMPPMPPMPPMPPM
EARTHS AND ACTINIDES.001300
.01
.1
.01
.05
PPMPPMPPMPPMPPMPPM
TbYbLuUTh
0.0.0.0.0.
1050112
PPMPPMPPMPPMPPM
Analysis of all the platinum group elements (PGE) by using a nickel sulphidefire assay collection followed by INAA has increased rapidly over the last tenyears. Many of the applications of PGE analysis relate to research into themode of formation of platinum deposits and related nickel deposits. Some ofthe PGE methods [23/29/30] use a fire assay preconcentration process as ameans of separating the PGE from the rock matrix and thus enable a lowering ofsensitivity.
Detection limits for the PGE are in the low ppb to sub-ppb range. Otherelements which are analyzed by sister techniques of INAA include borondetermination by prompt gamma analysis [31] and uranium analysis by delayedneutron counting techniques described in Chapter 6.
22
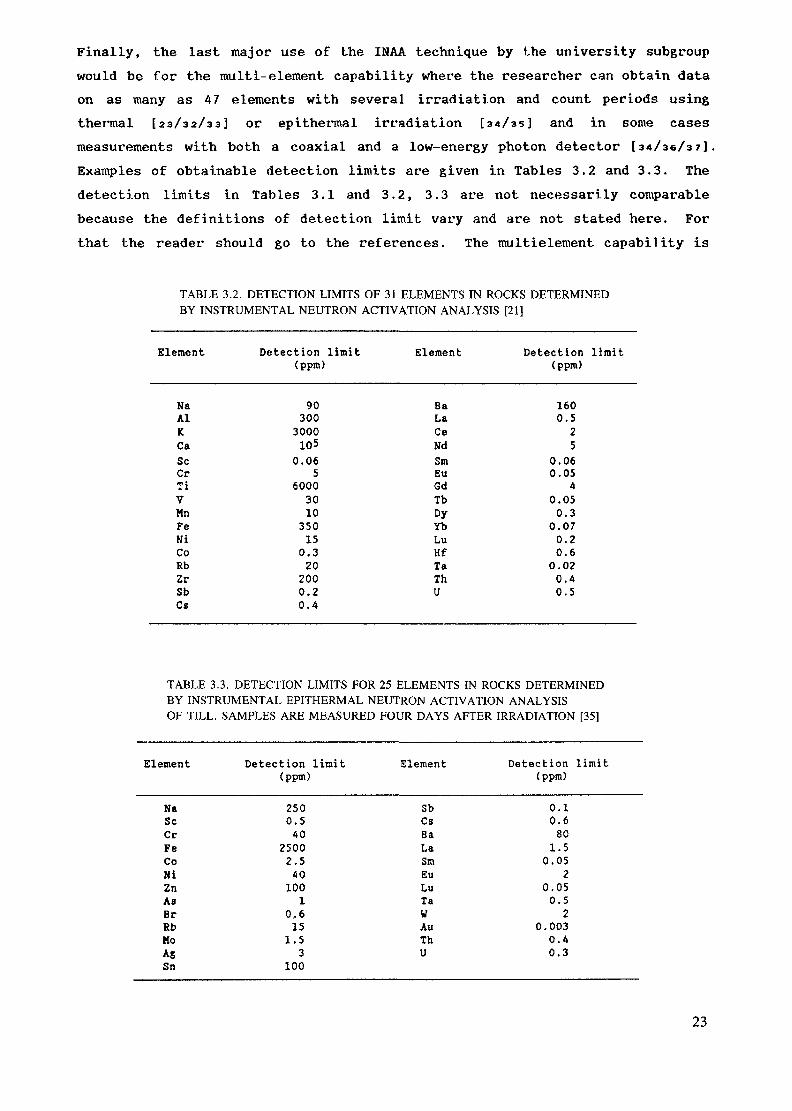
Finally, the last major use of the INAA technique by the university subgroupwould be for the multi-element capability where the researcher can obtain dataon as many as 47 elements with several irradiation and count periods usingthermal [23/32/33] or epithermal irradiation [34/35] and in some casesmeasurements with both a coaxial and a low-energy photon detector [34/36/37].Examples of obtainable detection limits are given in Tables 3.2 and 3.3. Thedetection limits in Tables 3.1 and 3.2, 3.3 are not necessarily comparablebecause the definitions of detection limit vary and are not stated here. Forthat the reader should go to the references. The multielement capability is
TABLE 3.2. DETECTION LIMITS OF 31 ELEMENTS IN ROCKS DETERMINEDBY INSTRUMENTAL NEUTRON ACTIVATION ANALYSIS [21]
Element Detection limit(ppm)
Element Detection limit(ppm)
NaAlKCaScCrTiVMnFeNiCoRbZrSbCs
903003000105
0.065
60003010350150.3202000.20.4
BaLaCeNdSmEuGdTbDyYbLuHfTaThU
1600.525
0.060.05
40.050.3
0.070.20.6
0.020.40.5
TABLE 3.3. DETECTION LIMITS FOR 25 ELEMENTS IN ROCKS DETERMINEDBY INSTRUMENTAL EPITHERMAL NEUTRON ACTIVATION ANALYSISOF TILL. SAMPLES ARE MEASURED FOUR DAYS AFTER IRRADIATION [35]
Element Detection limit(ppm)
Element Detection limit(ppm)
NaScCrFeCoNiZnASBrRbMoASSn
2500.540
25002.5401001
0,6151.53
100
SbCsBaLaSmEuLuTaWAuThU
0.10.6801.5
0.052
0.050.52
0.0030.40.3
23
very advantageous When the amount of sample material available (i.e., lunarsamples, meteorites or separated minerals) is limited. The INAA techniquesalso complement the XRF and 1CP techniques in the elements that can beobtained and the sensitivities required for geological purposes. Althoughthere are instances when it may be possible to obtain data on most of themajor elements by INAA it will be much cheaper to obtain the same data usingthe XRF or TCP techniques if available.
B) MINERAL EXPLORATION
The extent of usage of the INAA technique by the mineral industry is directlya function of what element or group of elements this group is exploring forand the sensitivity of that element to the TNAA technique. Of primaryimportance to this group is turn-around time or how quickly they can getanalytical results. The reason for requiring this fast turn-around is thatplanning of future exploration is frequently determined by analytical resultsand it becomes very expensive to have men and equipment sitting idle whilewaiting for results from the laboratory. To be successful in serving thismarket it is important to understand the concerns of the geologist and thegeochemical behaviour of the element being analyzed. At present 80% of allexploration effort worldwide is devoted to finding gold deposits. Goldfrequently occurs very inhomogeneously distributed in most geologicalmaterials. In rocks, for example, gold may occur as discrete native goldparticles. It is therefore important to take an adequately large analyticalsample for analysis to obtain a representative result [ss]. This couldrequire modification of irradiation facilities if possible. Samples as largeas 1 kilogram have been analyzed by TNAA for gold by commercial activationlaboratories but the largest samp]es analyzed recorded in literature are 500g[39]. In some kinds of sediment samples gold can be homogeneouslydistributed. The sensitivity of gold by INAA is generally unrivalled by otheranalytical techniques in many matrices. Sometimes however, a preconcentrationtechnique like fire assay [io/4i] may also be applied to separate theelement from its matrix which may cause interference.
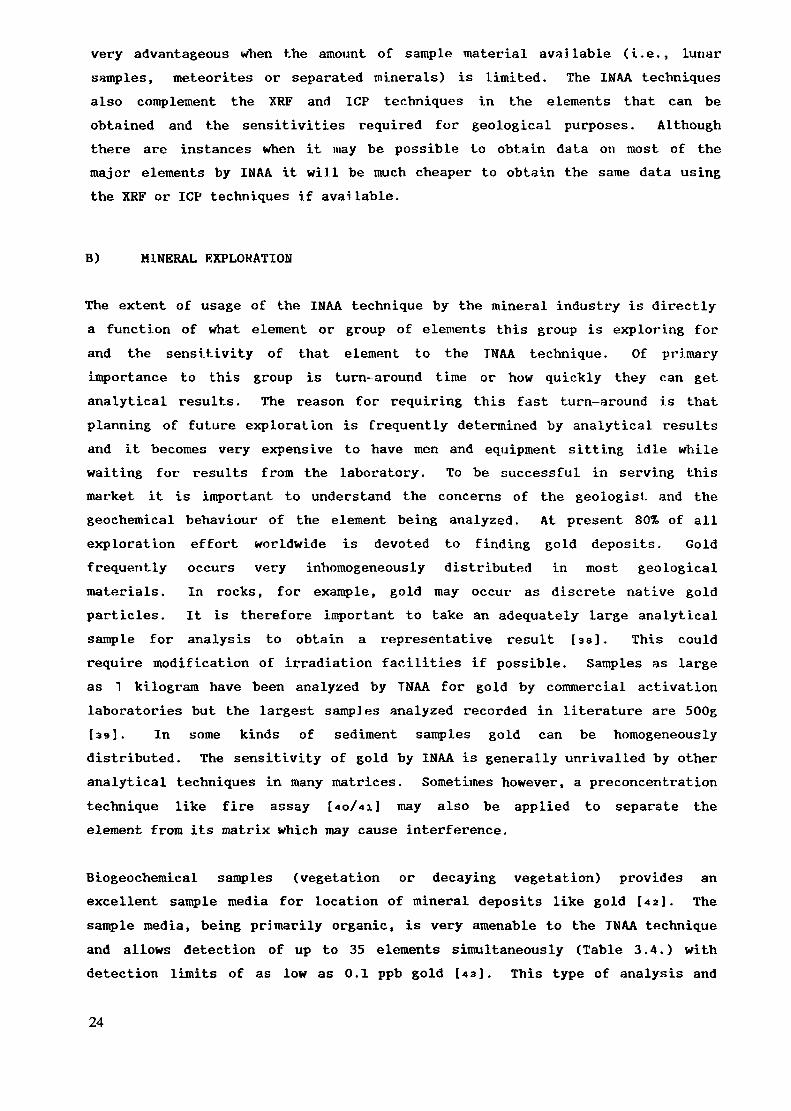
Biogeochemical samples (vegetation or decaying vegetation) provides anexcellent sample media for location of mineral deposits like gold [42]. Thesample media, being primarily organic, is very amenable to the TNAA techniqueand allows detection of up to 35 elements simultaneously (Table 3.4.) withdetection limits of as low as 0.1 ppb gold [43]. This type of analysis and
24
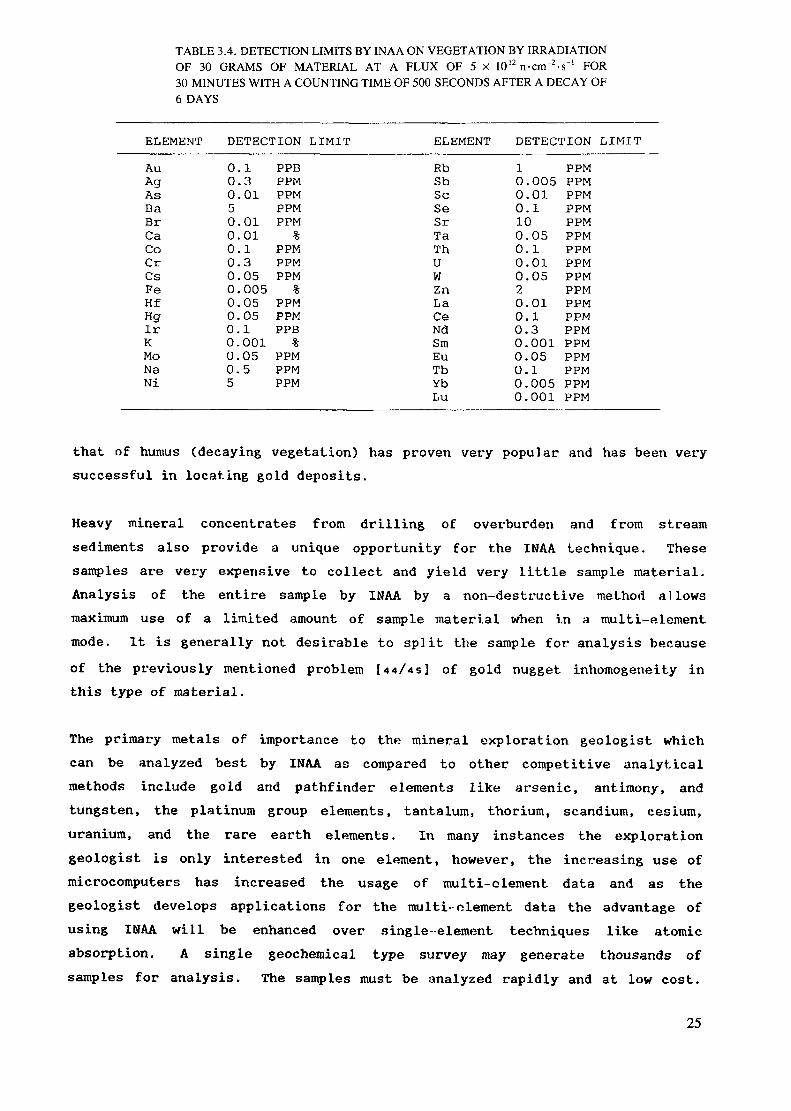
TABLE 3.4. DETECTION LIMITS BY INAA ON VEGETATION BY IRRADIATIONOF 30 GRAMS OF MATERIAL AT A FLUX OF 5 X 10¹² n-cm"2-s"' FOR30 MINUTES WITH A COUNTING TIME OF 500 SECONDS AFTER A DECAY OF6 DAYS
ELEMENT DETECTION LIMIT
AuAgAsBaBrCaCoCrCsFeHfHgIrKMoNaNi
0.0.0.50.0.0.0.0.0.0.0.0.0.0.0.5
13010101130500505051001055
PPBPPMPPMPPMPPM%
PPMPPMPPM%
PPMPPMPPB%
PPMPPMPPM
ELEMENT DETECTION LIMIT
RbSbScSeSrTaThUWZnLaCeNdSmEuTbYbLu
10.0050.010.1100.050.10.010.0520.010.10.30.0010.050.10.0050.001
PPMPPMPPMPPMPPMPPMPPMPPMPPMPPMPPMPPMPPMPPMPPMPPMPPMPPM
that of humus (decaying vegetation) has proven very popular and has been verysuccessful in locating gold deposits.
Heavy mineral concentrates from drilling of overburden and from streamsediments also provide a unique opportunity for the INAA technique. Thesesamples are very expensive to collect and yield very little sample material.Analysis of the entire sample by INAA by a non-destructive method allowsmaximum use of a limited amount of sample material when in a multi-elementmode. It is generally not desirable to split the sample for analysis becauseof the previously mentioned problem [44/45] of gold nugget inhomogeneity inthis type of material.
The primary metals of importance to the mineral exploration geologist whichcan be analyzed best by INAA as compared to other competitive analyticalmethods include gold and pathfinder elements like arsenic, antimony, andtungsten, the platinum group elements, tantalum, thorium, scandium, cesium,uranium, and the rare earth elements. In many instances the explorationgeologist is only interested in one element, however, the increasing use ofmicrocomputers has increased the usage of multi-clement data and as thegeologist develops applications for the multi-element data the advantage ofusing INAA will be enhanced over single-element techniques like atomicabsorption. A single geochemical type survey may generate thousands ofsamples for analysis. The samples must be analyzed rapidly and at low cost.
25
Accuracy and precision are not as important because the mining explorationcompanies are interested more in anomalies rather than absolute values. Insimple terms the mineral exploratlonist's main interest is not in whether thesample contains 2 or 3 ppb gold but whether it is 2, 20 or 200 ppb. Thisclass of lower precision analytical requirements are termed geochemicalanalyses (+30%) as opposed to the higher cost assay analyses (+-5% or better).
C) GOVERNMENT
This market sector is a hybrid of the university and mineral explorationgroups. In many instances, high quality assay analyses are required forelements like rare earths while in other circumstances large volume regionalsurvey goals are to obtain large amounts of multi-element data as cheaply aspossible [40]. Turnaround time with this group is not as critical as withthe mineral exploration sector. Many national geological surveys wiJi tend tohave their own analytical instrumentation and generally the best people totalk to are the end users, not the analyst.
3.1.2. ENVIRONMENTAL MEASUREMENTS
Instrumental neutron activation analysis (INAA) is very well suited forapplication in environmental research and monitoring. It has been discussedextensively in the literature [47/48/49/50/51/52] and at meetings such asthe IAEA symposium 'Measurement, Detection and Control of EnvironmentalPollutants' [sa] and the series of conferences on 'Nuclear Methods inEnvironmental and Energy Research1, organized by the American Nuclear Society.At one of these conferences Steinnes [54] stressed the importance of nuclearanalytical techniques in environmental research along with other techniquessuch as atomic absorption spectroscopy and emission spectroscopy. Tn thisrespect, INAA offers multi-element capability, a high sensitivity for manyrelevant elements and a high accuracy for many sample types.
The large number of elements determined simultaneously in an INAA procedure isbecoming increasingly important for many environmental applications. As it isoften unknown beforehand which elements are matter of environmental concern ina certain area, a 'broad spectrum' analysis covering a large part of theperiodic table is of major importance for environmental monitoring. Theelements determined include most of the relevant potentially toxic elementswhich actually determine if and to what extent an environmental problemoccurs. Exceptions are Be, Tl, Pb and, in some materials, Cd. Many other
26
elements are not directly of environmental interest, but may play an essentialrole in the identification of l.he nature and origin of the sources of thetoxic elements [ss]. A variety of statistical interpretation methods havebeen described [se/s //se/sa/eo/ei/ea/es/eo/es], which can be fruitfullyapplied in this.
The sensitivity of INAA is lower than achievable by radiochemical NAA and forcertain elements with other analytical techniques like the ones mentionedabove, but many toxic elements can be determined in the environment far belowdetrimental concentration levels. Increases of heavy metal concentrationlevels can therefore be observed, and the necessary measures be taken, longbefore they have developed into an acute environmental problem.
Another favourable characteristic of INAA is the low risk of contamination orelement loss. This is especially important as the concentrations of interestin environmental samples are mostly in the ppb to ppm-range. Equally importantis the lack of matrix effects for a large variety of sample types; it makes itpossible to obtain absolute and directly comparable concentration values forstrongly differing materials such as surface water, air particulate matter,human and animal tissues, plant materials and soils. Moreover, the absence ofa destruction step or chemical separation contributes favourably to thewell-established high degree of accuracy of TNAA.
Often large numbers of samples have to be analyzed, and the sample matrix mayvary strongly when focusing on different parts of an ecosystem. Here againthe non-destructive character of the technique favors the applicability, aslaborious dissolution steps, varying from one sample type to another, can beavoided.
Useful applications of INAA in the fields of environmental monitoring andresearch can be found in :
* Atmospheric Pollution tee]
Examples of these studies deal with long-distance transport [ej/ea/ea],precipitation, source identification [62/63/64/?o], impacts of industrialactivities [71/72/73]. Sample types involved vary from air particulatematter (sometimes even size-fractionated [74/75]) and wet or dry deposition[7e] to mosses [77/78] and lichens [es/79/63] used as biologicalindicators. In some of these studies also analyses of soils is included to
27

determine enrichment factors, and materials from known anthropogenic sourcesof pollution to determine inter-element relationships.
* Industrial Waste
The analysis of samples of industrial wastes usually is part of a broaderstudy of the impact of these wastes on an ecosystem. Examples are ashes fromrefuse incinerators [so], coal-burning plants (fly-ash) [si/sa/es/ai/ as],(heavy) metal works [se/s?], and smelters [as]. In this area ofapplication the non-destructive character of TNAA can fully be exploited.
* Soils and Sediments
The analysis of sewage sludge [89/90/91/92/93/94] has also to be consi-dered. These studies are not restricted to polluted areas. From trace-elementdata of -materials from 'unspoiled' areas [95/96], more insight is gained onthe degree or elevated concentrations in suspected polluted areas [97].
* Plants, Man, Animal
Almost all environmental studies deal with the impact of pollution on livingorganisms. Whereas plant material can relatively easily be sampled[98/99/100] ,for man and animal, biological indicators like hair[101/102/103/104], blood [los/ioe], nails [107], urine [ioa], andeventually tissues [109/110] have to be sampled. For these samples INAA isuseful to a large extent [in], but sometimes other techniques likeradiochemical NAA, have to be preferred because of sensitivity or interfer-ences [112] .
* Aquatic Envi ronment
INAA can be applied to a number of materials from the aquatic environment,such as aquatic water plants [113/114], fish, mollusc [iis/iie] andsediments [117/118/119]. For water analysis - although applications of INAAhave been reported [120/121/122], with or without preconcentrationtechniques [i23/i?4/i2s/i26/i27/i28/i29] - other analytical techniques mayoffer better characteristics, and, if accessible, have to be preferred [77].
One of the drawbacks of INAA, sometimes mentioned when considering its use ina monitoring program, is its relatively long turn-around time, when compared
28
to other analytical techniques. Indeed, sometimes a 3 or 4-week decay periodis required to obtain highest sensitivity. However, many elements can oftenbe determined with adequate sensitivity after shorter decay times. Moreover,INAA with short-half life nuclides may also provide a very rapid answer. Theother drawback of INAA, especially when environmental studies are involved, isits inadequacy of determining lead - often one of the prime elements ofinterest in pollution studies.
It is the expectation that because of its characteristics, INAA will remain amethod of choice for many types of environmental samples. As the types ofproblems are often complex, and sample matrices may be varying, moresatisfactory results and sensitivities can be expected when attacking theseproblems with INAA in combination with other analytical techniques [77/130].For almost all application areas reference materials are available, thusenabling adequate quality assesment of the analysis procedure.
3.2. OTHER APPLICATIONS
MEDICAL, NUTFt'i'lONAL AND OCCUPATIONAL HEALTH APPLICATIONS
The use of NAA for the analysis of biological samples is widespread, and iswell documented in review articles and books [131/132/133] and in conferenceproceedings [134/135/136], The excellent sensitivity of NAA for determiningmany biochemically important elements has made it an important contributor toresearch into the roles of inorganic elements in nutrition, physiology,pathology, and toxicology. Because INAA inherently free of analytical blank,it has been the technique of choice in studying the problems of sampling thisdifficult group of materials [s/ia?]. As many as thirty elements can bedetermined instrumentally in plants, animal tissue, or diet samples. In manycases the use of radiochemistry increases the number of measurable elementsand improves the detection limits of most by many orders of magnitude, but ata commensurate increase in the cost of analysis.
MATERIALS SCIENCE
The importance of trace analysis in characterizing high-technology materialslike semiconductors and ceramics is becoming appreciated. Electricalproperties of metals, semiconductors, and insulators, and the mechanical andthermal properties of graphite and ceramics are affected by many trace
29
impurities. Electronics encapsulants, catalytic substrates, crucibles,medical implants, and laboratory ware need to be free of contaminants that maycompromise their use. Materials of current interest include carbon, aluminum,silicon, germanium, alumina, silica, zirconia, silicon nitride, siliconcarbide, and carbon and silicon-based polymers.
Some of these materials are extremely difficult to dissolve, limiting theapplication of analytical techniques that rely on the sample being insolution. Some that are excellent insulators are difficult to study withelectron or ion-bombardment methods because of substrate charging. Thenondestructive nature of INAA is of advantage in the analysis of thesematerials. With no chemistry needed before irradiation, there is less concernwith contamination than with most chemical methods. Most of these materialsare made of elements which do not activate strongly with thermal neutrons orproduce only short-lived activity, so trace analysis can often be performeddown to very low concentrations. For example, the analysis of 'pure1 rhodiummetal is easy since the rhodium nuclides produced on irradiation decay quicklyto allow the measurement of the other platinum group elements in nanogramconcentrations.
NAA is used to monitor the level of electrically conducting impurities such asAu, Na, Cu, As, Ca and W in silicon ingots and wafers [139]. Many otherelements, both impurities and dopants have been analyzed in silicon and othermaterials used in semiconductor manufacturing [139/140/141].
FORENSIC APPLICATIONS
INAA and RNAA have been successfully applied to investigate samples fromforensic laboratories. In review articles [142/143/144] a variety ofexamples of such analyses and work is given. In most cases trace elementconcentration patterns are being used to establish whether there is a linkbetween a suspect and physical evidence found at the scene of a crime. Forinstance, it can be determined whether a suspect has fired a weapon recentlyby searching for Ba and Sb in gunshot residues on the hands. Lead bullets orshotshell pellets can be fingerprinted by their content of deliberately addedSb and their pattern of As, Cu, Ag and other trace elements. But the samplevariety may be much larger than gunshot residues: glass, paint, hair, metal,paper etc. Not only does each of these materials present its own difficultyand concern in analysis [143], but also it should be noted that sometimesonly very small amounts of material are available which also have to be kept
30
intact to serve as a court evidence. High demands are set to accuracy,precision and statistical interpretation of results.
Forensic application of INAA can be regarded as an interesting application;the laboratory may gain general respect and may demonstrate the social benefitof the technique. However, the number of samples to be analysed and theextent of work is usually limited and irregular, and this application cantherefore be regarded as an optional side-activity of the laboratory.
ART AND ARCHAEOLOGY
"Fingerprinting" by elemental composition patterns is a well-establishedtechnique for l.he identification of pottery, stone, and metal artifacts.Applications have been made to the authentication of works of art and studiesof material sources, manufacturing methods, and trading routes [its]. INAAis an important contributor to this work because it provides a useful set ofelements (twenty to thirty in mineral materials) and is well-suited to thenondestructive analysis of large numbers of small samples.
Another application is the determination of the silver content of silvercoins. Because of inhomogeneity and corrosion the analysis of the whole coinby INAA is often the only reliable way to do it [i4e]. The composition ofcopper and bronze objects can also conveniently be determined by NAA [147].
ACTIVABLE STABLE TRACERS
Activable stable tracers are used as alternatives to radiotracers where itwould be unacceptable to use radioactivity, i.e., in the environment, inhumans or in countries where legislative practices prevent it. The reason forusing a stable tracer can also be that no radioactive tracer of suitablehalf-life exist. The purpose of the stable tracer is to provide an easilyactivated material, which is not found in the material to be studied and whichis very sensitive to determination by NAA. Any suitable element may be usedas tracer, preferably one which produces nuclides with a short half-life (forrapid irradiation and counting) and with a high sensitivity for activation.Gilat has reviewed the industrial applications of activable tracers [i4s].
An example of the use of a stable tracer is to measure the effectiveness of aspraying machine in agricultural use for treating crops with pesticides. Asuitable element is dysprosium which is relatively rare in the environment,
31
has a radionuclide with a half-life of 1.6 min which can be detected down to10 ng. Stable tracers are also used in medical studies, for example to followthe absorption of iron through the human gut. In this case an enrichedisotope, Fe-58, is fed in the diet and then the Fe 58 collected in the faecesis activated for analysis. In the study of water flow in lakes or the sea,indium has been favourably used as an activable tracer. When long transportdistances over long time intervals need to be studied the use of a stabletracer is preferred over the use of a radioactive tracer, because of the highinitial activity of a long-lived radionuclide needed.
32
4. IRRADIATION FACILITIES
4.1 RESEAKCH REACTOR TYPES
The research reactor is the most widely used source of neutrons for TNAA,particularly with respect to the number of samples processed and the number ofelemental analyses performed.
Five general types of research reactors are described: Slowpoke, Argonaut,TR1GA, Pool, and Heavy Water. Within each group there are variations indesign and power level. Furthermore, the groups are not mutually exclusiveand overlap in some respect, e.g., TRIGA reactors are of the Pool type. Inthis publication, the research reactor types are categorized as follows:
1. Manufacturer's designations are used for the types of reactors forwhich large numbers were produced and the terminology widelyunderstood, i.e., Argonaut, TRIGA, Slowpoke.
2. Heavy water moderated research reactors are designated as Heavy Waterreactors. This class of reactors are usually heavy water reflected.The coolant may be either heavy or light water.
3. Pool reactors include a wide variety and variation of reactors. Thecharacteristics of this class of reactors as described below arelimited to plate type fueled reactors, light water cooled and moderatedand of the swimming pool type.
The data presented for each reactor type are average values or a range ofvalues as reported by different reactor owners [149]. These data should beviewed as only approximate values that would vary depending on the specificdesign of the reactor. Most research reactors are of the multipurpose typewhile others are designated for specific purposes such as fuel and materialstesting, radioisotope production, neutron beam research or INAA. Therefore,within any type of reactor, wide variations in performance parameters could bepossible. In addition, a research reactor converting from highly enricheduranium fuel to low enriched fuel with changes in core configuration will havea hardening of the neutron spectrum and a reduction in the maximum thermalflux of about 15%.
33
The following information on the different reactor types have been extractedfrom reports from reactor operators.
SLOWPOKE REACTOR
The Slowpoke is a low cost, low power reactor of the tank-in-pool type. It isberyllium reflected with a very low critical mass and provides neutron fluxeshigher than available from small accelerators or radioactive sources. MostSlowpokes are rated at a nominal 20 kW although operation at higher power forshorter durations is possible. A Chinese version of the Slowpoke, designatedthe Miniature Neutron Source Reactor (MNSR), is nominally rated at 27 kW withsimilar characteristics and performance.
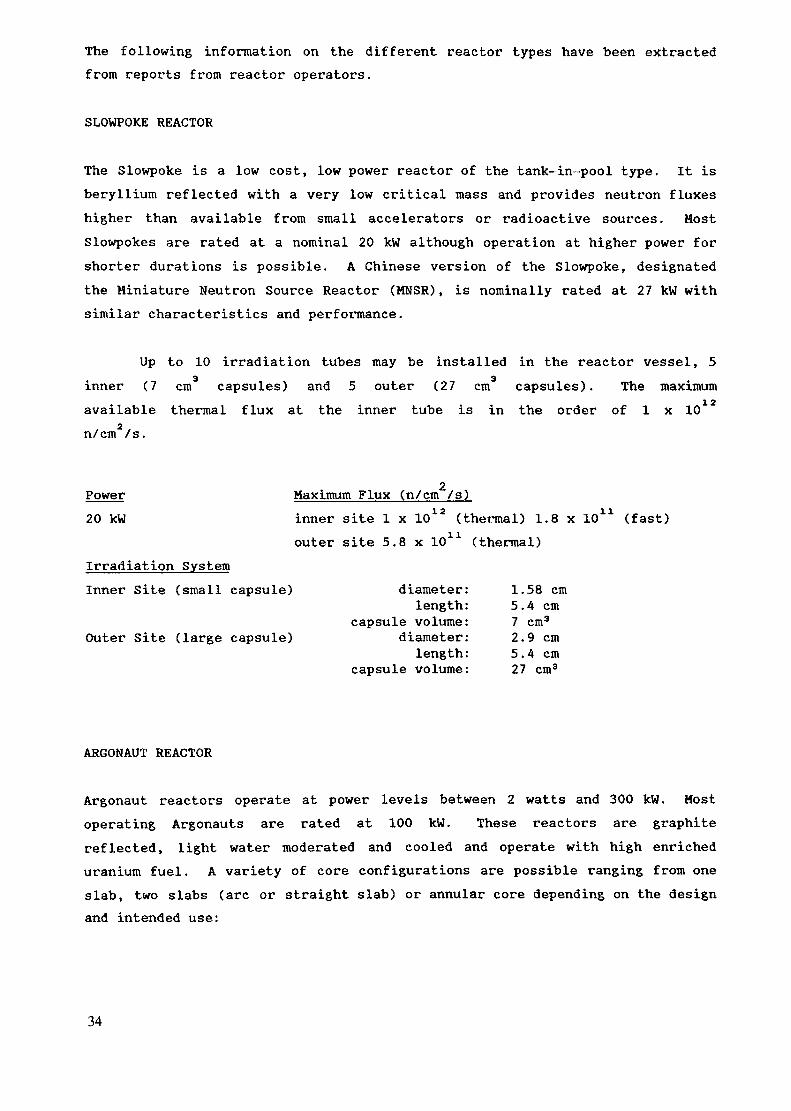
Up to 10 irradiation tubes may be installed in the reactor vessel, 53 3inner (7 cm capsules) and 5 outer (27 cm capsules). The maximum
available thermal flux at the inner tube is in the order of 1 x 10n/cm /s.
2Power Maximum Flux (n/cm /s)20 kW inner site 1 x 10¹² (thermal) 1.8 x 10¹¹ (fast)
outer site 5.8 x 10 (thermal)Irradiation SystemInner Site (small capsule) diameter: 1.58 cm
length: 5.4 cmcapsule volume: 7 cm3
Outer Site (large capsule) diameter: 2.9 cmlength: 5.4 cm
capsule volume: 27 cm3
ARGONAUT REACTOR
Argonaut reactors operate at power levels between 2 watts and 300 kW. Mostoperating Argonauts are rated at 100 kW. These reactors are graphitereflected, light water moderated and cooled and operate with high enricheduranium fuel. A variety of core configurations are possible ranging from oneslab, two slabs (arc or straight slab) or annular core depending on the designand intended use:
34
Power Maximum Flux (n/cm /s)100 kW 1.3 - 2 x 10¹² (thermal) 2.6 - 4.8 x 10¹² (fast)Research Facilities Neutron flux (thermal/fast) Gamma dose rate
(c/cm /s) rad/hrFace of Core 2 x 10⁹/2 x 107Beam Ports 1-2 x 10⁸/l-2 x 10? 104
12 11Pneumatic System 1-1.5 x 10 /0.4-2 x 10Thermal Column 2 x lO11/* x 108
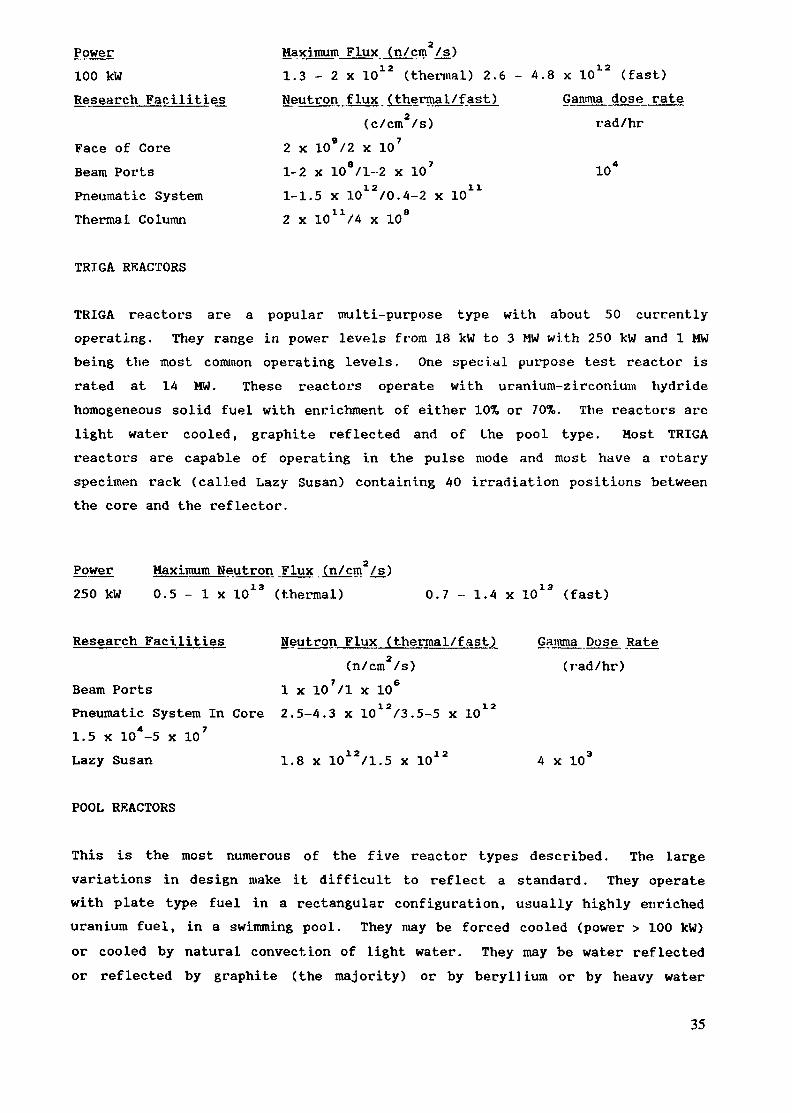
TRIGA RKACTORS
TRIGA reactors are a popular multi-purpose type with about 50 currentlyoperating. They range in power levels from 18 kW to 3 MW with 250 kW and 1 MWbeing the most common operating levels. One special purpose test reactor israted at 14 MW. These reactors operate with uranium-zirconium hydridehomogeneous solid fuel with enrichment of either 107» or 70%. The reactors arelight water cooled, graphite reflected and of the pool type. Most TRIGAreactors are capable of operating in the pulse mode and most have a rotaryspecimen rack (called Lazy Susan) containing 40 irradiation positions betweenthe core and the reflector.
Power Maximum Neutron Flux (n/cm2/s)250 kW 0.5 - 1 x 10¹³ (thermal) 0.7 - 1.4 x 10¹³ (fast)
Research Facilities Neutron Flux (thermal/fast) Gamma Dose Rate(n/cm /s) (rad/hr)
Beam Ports 1 x 10 /l x 10Pneumatic System In Core 2.5-4.3 x 10¹²/3.5-5 x 10121.5 x 104-5 x 10⁷Lazy Susan 1.8 x 10¹²/1.5 x 1012 4 x 10³
POOL RKACTORS
This is the most numerous of the five reactor types described. The largevariations in design make it difficult to reflect a standard. They operatewith plate type fuel in a rectangular configuration, usually highly enricheduranium fuel, in a swimming pool. They may be forced cooled (power > 100 kW)or cooled by natural convection of light water. They may be water reflectedor reflected by graphite (the majority) or by beryllium or by heavy water
35
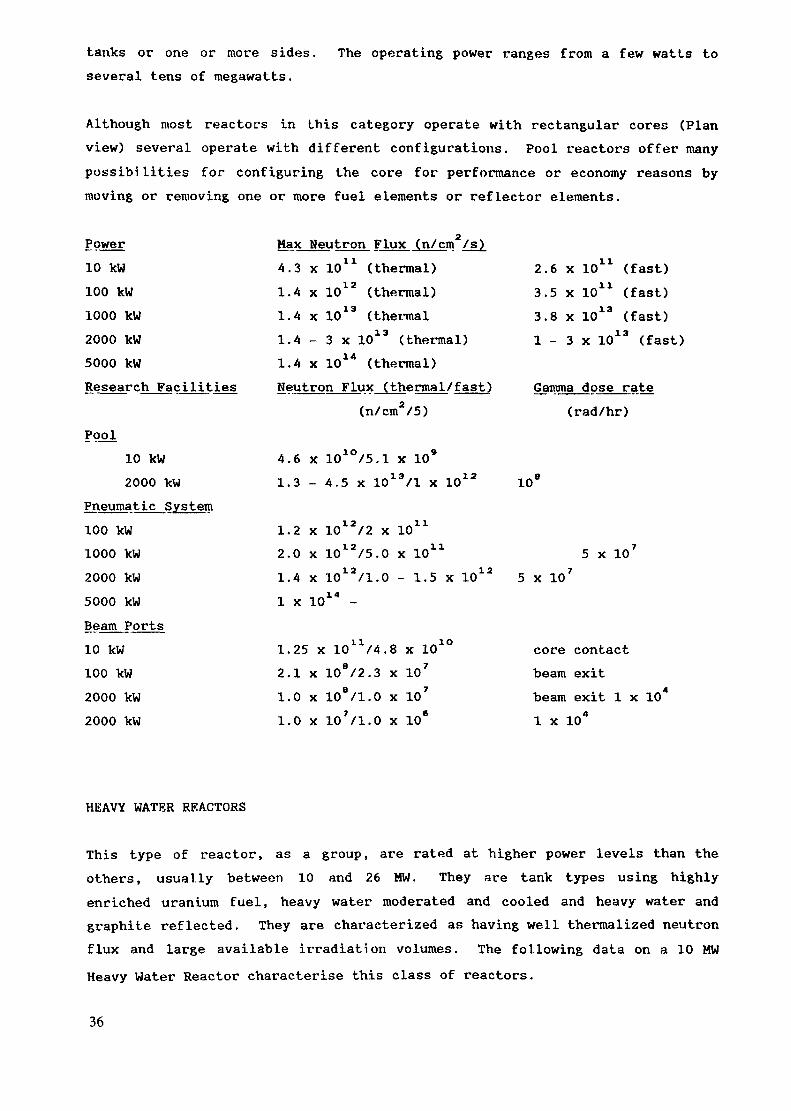
tanks or one or more sides. The operating power ranges from a few watts toseveral tens of megawatts.
Although most reactors in this category operate with rectangular cores (Planview) several operate with different configurations. Pool reactors offer manypossibilities for configuring the core for performance or economy reasons bymoving or removing one or more fuel elements or reflector elements.
Power10 kW100 kW1000 kW2000 kW5000 kWResearch Facilities
Pool10 kW2000 kW
Pneumatic System100 kW1000 kW2000 kW5000 kWBeam Ports10 kW100 kW2000 kW2000 kW
Max Neutron Flux (n/cm /s)4.3 x 1011 (thermal)1.4 x 10¹² (thermal)
.131.4 x 10 (thermal.131.4 - 3 x 10 (thermal)
1.4 x 10¹⁴ (thermal)Neutron Flux (thermal/fast}
(n/cm2/5)
4.6 x 10¹⁰/5.1 x 10*1.3 - 4.5 x 10¹³/1 x 1012
1.2 x 10¹²/2 x 10112.0 x 1012/5.0 x 10111.4 x 1012/1.0 - 1.5 x 10¹²
141 X 10
1.25 x 10ll/4.8 x 10102.1 x 108/2.3 x 1071.0 x 108/1.0 x 107
1.0 x lo'/l.O x 10*
112.6 x 10 (fast)3.5 x 10¹¹ (fast)
.13 (fast).13
3.8 x 101 - 3 x 10¹³ (fast)
Gamma dose rate(rad/hr)
10"
5 x 105 x 10
core contactbeam exitbeam exit 1 x 101 x 104
HEAVY WATER REACTORS
This type of reactor, as a group, are rated at higher power levels than theothers, usually between 10 and 26 MW. They are tank types using highlyenriched uranium fuel, heavy water moderated and cooled and heavy water andgraphite reflected. They are characterized as having well thermalized neutronflux and large available irradiation volumes. The following data on a 10 MWHeavy Water Reactor characterise this class of reactors.
36
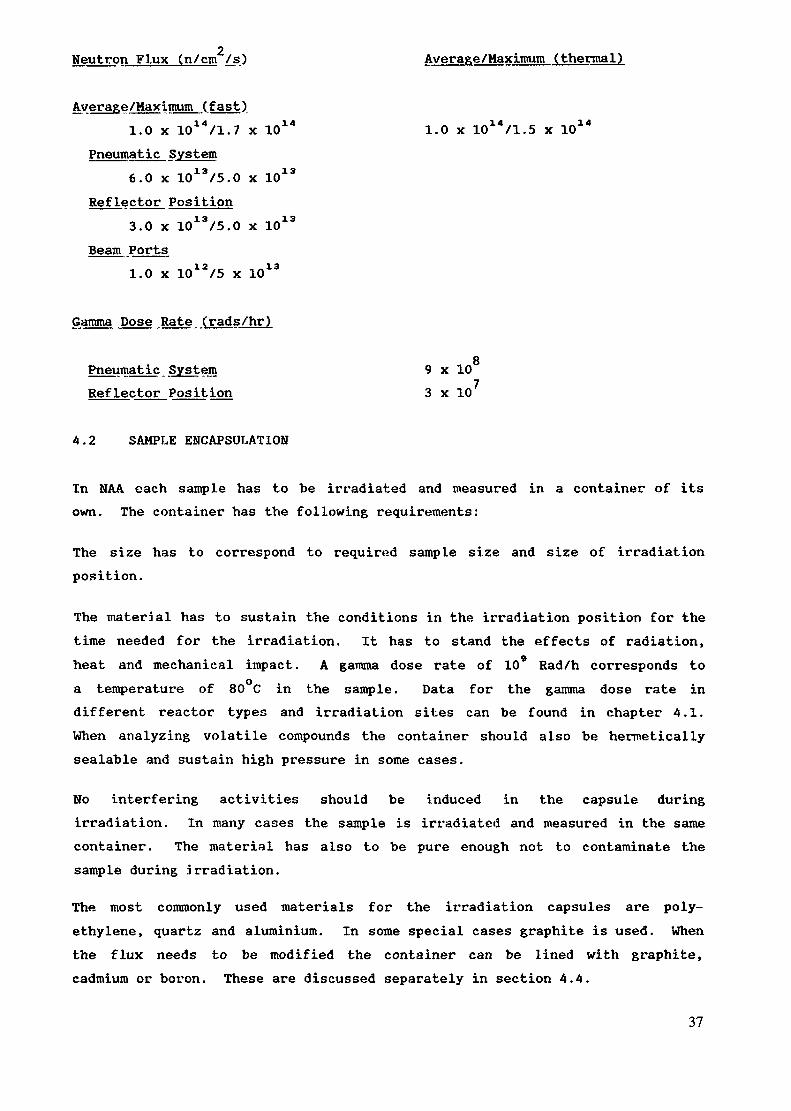
Neutron Flux (n/em /_s) Average/Maximum (thermal)
Average/Maximum (fast)1.0 x 10¹⁴/1.7 x 1014
Pneumatic System6.0 x 1013/5.0 x 1013
Reflector Position3.0 x 1013/5.0 x 1013
Beam Ports1.0 x 1012/5 x 1013
1.0 x 10¹⁴/1.5 x 1014
Gamma Dose Rate (rads/hr)
Pneumatic SystemReflector Position
9 x 103 x 10;
8
4.2 SAMPLE ENCAPSULATION
In NAA each sample has to be irradiated and measured in a container of itsown. The container has the following requirements:
The size has to correspond to required sample size and size of irradiationposition.
The -material has to sustain the conditions in the irradiation position for thetime needed for the irradiation. It has to stand the effects of radiation,heat and mechanical impact. A gamma dose rate of 10* Rad/h corresponds toa temperature of 80 C in the sample. Data for the gamma dose rate indifferent reactor types and irradiation sites can be found in chapter 4.1.When analyzing volatile compounds the container should also be hermeticallyscalable and sustain high pressure in some cases.
No interfering activities should be induced in the capsule duringirradiation. In many cases the sample is irradiated and measured in the samecontainer. The material has also to be pure enough not to contaminate thesample during irradiation.
The most commonly used materials for the irradiation capsules are poly-ethylene, quartz and aluminium. In some special cases graphite is used. Whenthe flux needs to be modified the container can be lined with graphite,cadmium or boron. These are discussed separately in section 4.4.
37
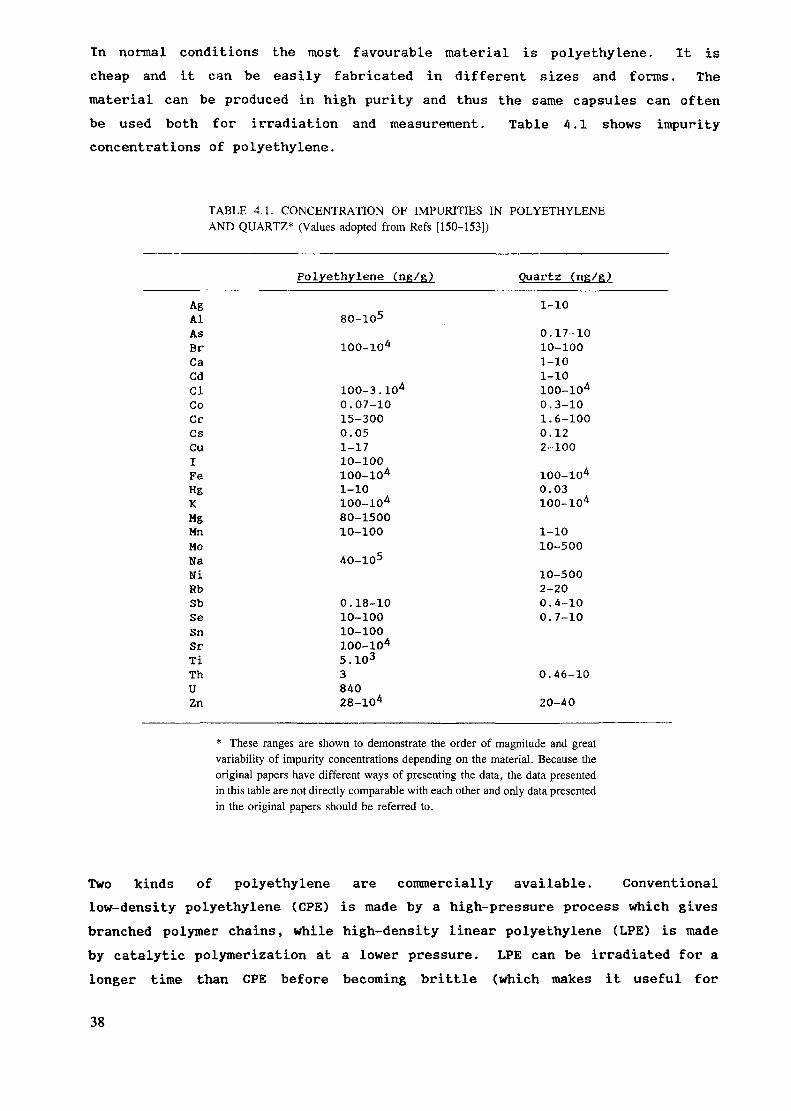
Tn normal conditions the most favourable material is polyethylene. It ischeap and it can be easily fabricated in different sizes and forms. Thematerial can be produced in high purity and thus the same capsules can oftenbe used both for irradiation and measurement. Table 4.1 shows impurityconcentrations of polyethylene.
TABLE 4.1. CONCENTRATION OF IMPURITIES IN POLYETHYLENEAND QUARTZ* (Values adopted from Refs [150-153])
ASAlAsBrCaCdClCoCrCsCuIFeHgKMgMnMONaNiRbSbSeSnSrTiThUZn
Polyethylene (HR/K)
80-105
100-104
100-3. 1040.07-1015-3000.051-1710-100100-1041-10100-10480-150010-100
40-105
0.18-1010-10010-100100-1045.103384028-104
Quartz (ng/g>1-10
0.17-1010-1001-101-10100-1040.3-101.6-1000.122-100
100-1040.03100-104
1-1010-500
10-5002-200.4-100.7-10
0.46-10
20-40
* These ranges are shown to demonstrate the order of magnitude and greatvariability of impurity concentrations depending on the material. Because theoriginal papers have different ways of presenting the data, the data presentedin this table are not directly comparable with each other and only data presentedin the original papers should be referred to.
Two kinds of polyethylene are commercially available. Conventionallow-density polyethylene (CPE) is made by a high-pressure process which givesbranched polymer chains, while high-density linear polyethylene (LPE) is madeby catalytic polymerization at a lower pressure. LPE can be irradiated for alonger time than CPE before becoming brittle (which makes it useful for
38
rabbits), but it may contain a tnicrogram of chromium or other catalyst pergram. For other elements as well, LPE is generally less clean than CPE, andpolypropylene contains more impurities than either. Polystyrene has excellentradiation resistance, and can also be very free of contaminants [i
Several kinds of commercially available polyethylene containers are useful forpackaging samples, and are made in large enough quantity to be inexpensive.Polyethylene bag stock is widely sold in the form of flattened tubing, inwidths (half the circumference) from 2.5 cm up and in wall thicknesses from 25to 150 microns . Containers are cut from the tubing and the ends made airtightwith a thermal impulse sealer. The inside can be efficiently cleaned byfilling with a small amount of 1:1 nitric acid (note nitric acid may containbromine). A 700-ra roll of 50-micron tubing will last most laboratories foryears. Surgical or food grade polyethylene tubing is available in severaldiameters up to 10 mm. Polyethylene screw- cap bottles are useful forcontaining large or numerous samples. Capsules cut from polyethylenemicrocentrifuge tubes will hold 100 mg of rock powder, and can be convenientlybundled into a rabbit.
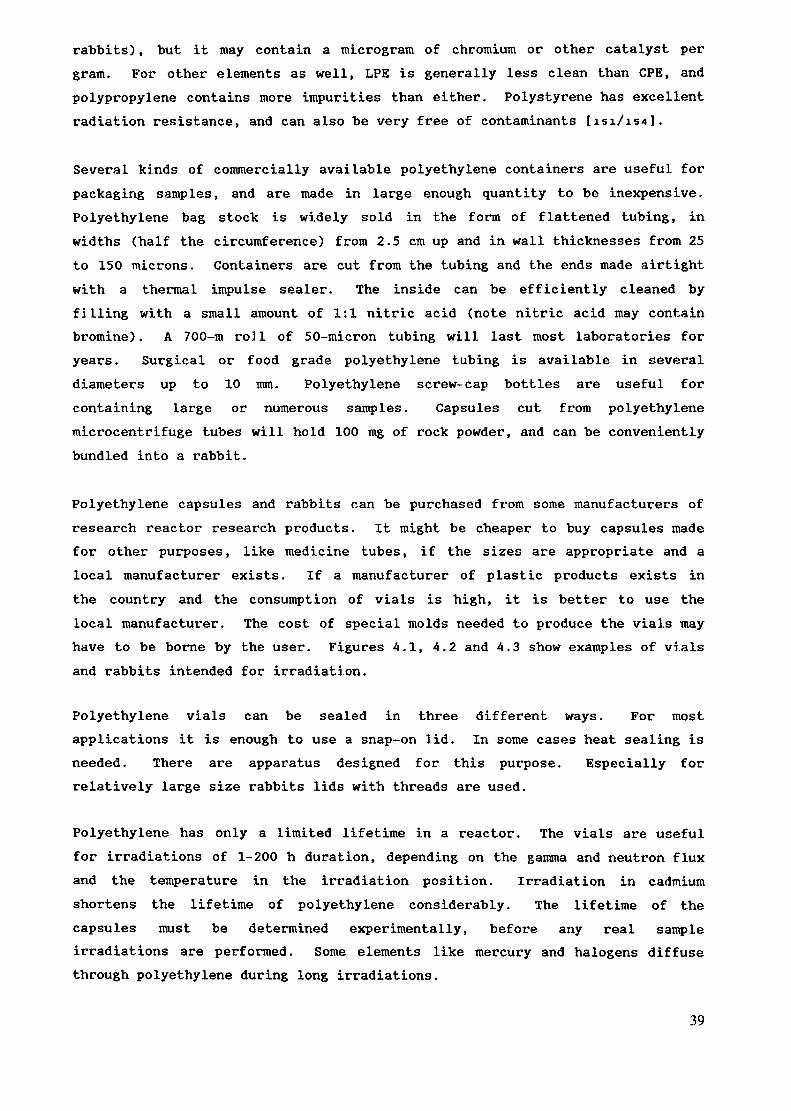
Polyethylene capsules and rabbits can be purchased from some manufacturers ofresearch reactor research products . It might be cheaper to buy capsules madefor other purposes, like medicine tubes, if the sizes are appropriate and alocal manufacturer exists. If a manufacturer of plastic products exists inthe country and the consumption of vials is high, it is better to use thelocal manufacturer. The cost of special molds needed to produce the vials mayhave to be borne by the user. Figures 4.1, 4.2 and 4.3 show examples of vialsand rabbits intended for irradiation.
Polyethylene vials can be sealed in three different ways. For mostapplications it is enough to use a snap-on lid. In some cases heat sealing isneeded. There are apparatus designed for this purpose. Especially forrelatively large size rabbits lids with threads are used.
Polyethylene has only a limited lifetime in a reactor. The vials are usefulfor irradiations of 1-200 h duration, depending on the gamma and neutron fluxand the temperature in the irradiation position. Irradiation in cadmiumshortens the lifetime of polyethylene considerably. The lifetime of thecapsules must be determined experimentally, before any real sampleirradiations are performed. Some elements like mercury and halogens diffusethrough polyethylene during long irradiations.
39
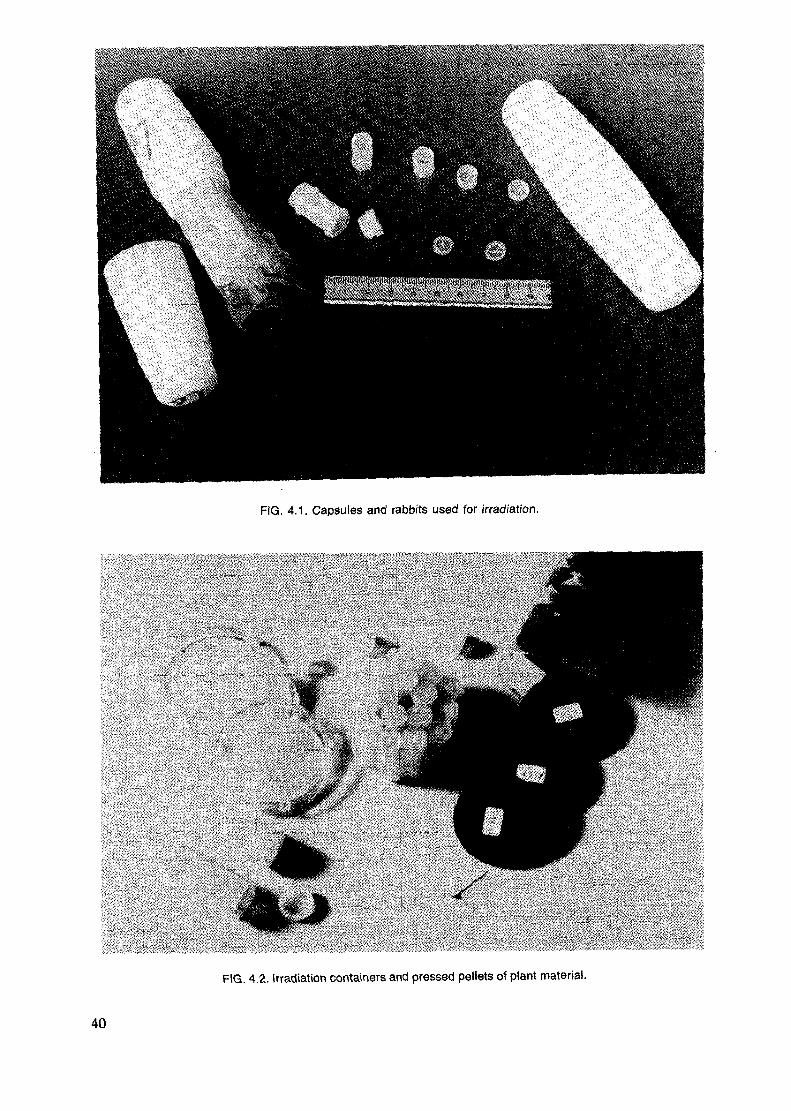
FIG. 4.1. Capsules and rabbits used for irradiation.
FIG. 4.2. Irradiation containers and pressed pellets of plant material.
40
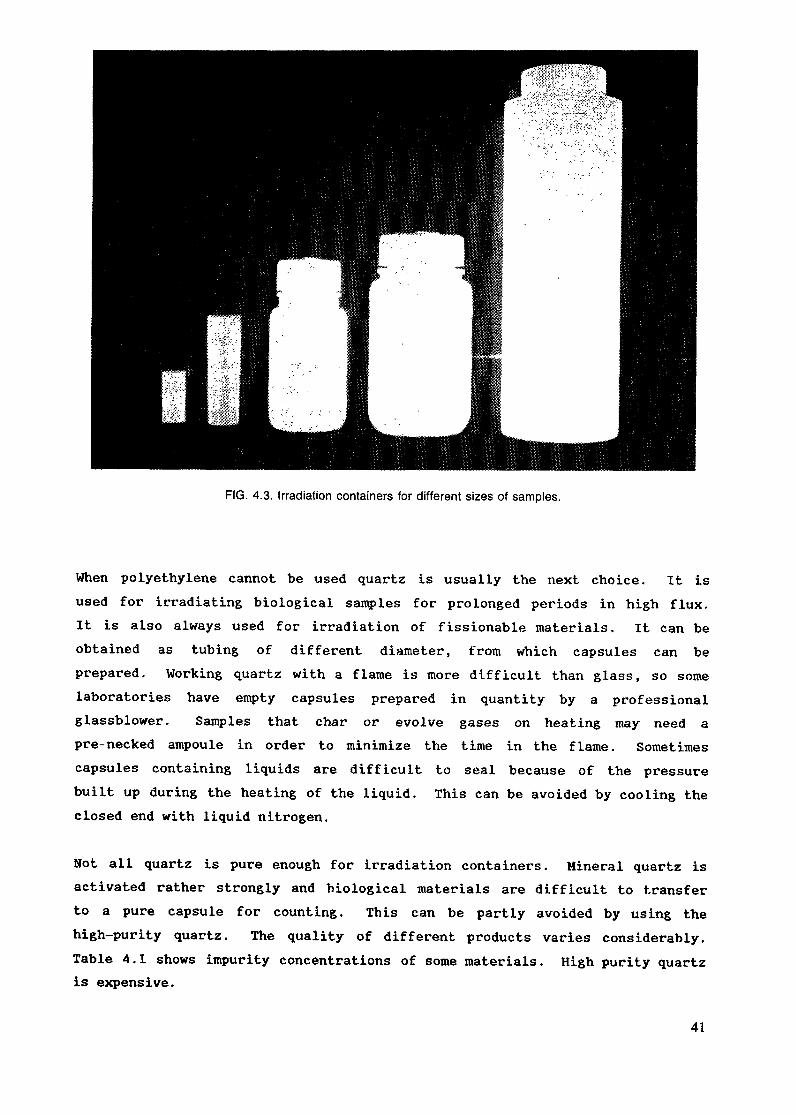
FIG. 4.3. Irradiation containers for different sizes of samples.
When polyethylene cannot be used quartz is usually the next choice. It isused for irradiating biological samples for prolonged periods in high flux.It is also always used for irradiation of fissionable materials. It can beobtained as tubing of different diameter, from which capsules can beprepared. Working quartz with a flame is more difficult than glass, so somelaboratories have empty capsules prepared in quantity by a professionalglassblower. Samples that char or evolve gases on heating may need apre-necked ampoule in order to minimize the time in the flame. Sometimescapsules containing liquids are difficult to seal because of the pressurebuilt up during the heating of the liquid. This can be avoided by cooling theclosed end with liquid nitrogen.
Not all quartz is pure enough for irradiation containers. Mineral quartz isactivated rather strongly and biological materials are difficult to transferto a pure capsule for counting. This can be partly avoided by using thehigh-purity quartz. The quality of different products varies considerably.Table 4.1 shows impurity concentrations of some materials. High purity quartzis expensive.
41
If the samples are to be counted in the vials, care should be taken to avoidcontamination during the sealing process. Some torch lighters generate sparksby creating copious quantities of small pyrophoric rare-earth metal particles;piezoelectric igniters or matches are preferable. When the quantity of analyteto be measured is very small, an all-quartz burner may be necessary to avoidcontamination from metal torch tips [a].
A careful distinction needs to be made between quartz and Vycor. The latteris a glass which is interchangeable with quartz in most of its properties, butcontains enough boron to cause problems during irradiation, both from neutronshielding and alpha particle heating.
High flux irradiation of many inorganic materials, like powdered rocks, can bemade in pure aluminium foils. These are much easier to handle than quartz andthe cost is lower. In this case the sample should not contain volatilecompounds. The samples are inserted in pure polyethylene capsules formeasurement, because the aluminium foil has always some Na activity,produced by the (n,alpha) reaction from aluminium. The presence or absence ofcontamination, when irradiating in aluminium foil, or other kind of materials,can be investigated by irradiating pure quartz or cotton powder and measuringthe induced activity after changing into a pure capsule.
When a pneumatic transfer system is used for irradiation in a very high flux,graphite rabbits are used. These can be obtained in high purity andresistance to strong mechanica] impact, but the price is rather high.Therefore they are used in only very special cases.
Depending on vial material and concentration of elements to be analyzed it issometimes necessary to clean the vials. The procedure is described inref [isi]. Normally a wash with acid followed by rinsing with demineralizedwater is used.
The vials have always to be marked in order to enable identification indifferent stages. Polyethylene vials and aluminium foils can be marked withwaterproof ink from a pen intended for overhead transparencies. Quartzampoules are permanently marked by an electrical engraving pen.
The sample vials have to be inserted in larger irradiation containers forinsertion into the irradiation positions. These can be made of polyethyleneor aluminium. The size depends on the size of the irradiation position which
42
is usually made to fit. In special cases these containers have a lining formodification of the neutron flux. These are discussed in chapter 4.4.
4.3 IRRADIATION SITES
The irradiation position is evaluated according to its size, accessibility andthe neutron flux, neutron energy distribution and homogeneity of the flux.The flux gradients both in respect to space and time are discussed in chapters4.1. and 8.5. Also the gamma flux and temperature is of importance in manycases. Usually the transport of the sample is only a matter of safety andconvenience, but when short-lived radionuclides are measured, other aspectslike speed and reproducibility of the timing, have to be accounted for.
The highest fluxes are obtained in the core, but there the fast flux is alsohigh. Commonly the irradiation positions are in the reflector or just outsideof it in order to obtain a rather high but, at the same time, well thermalizedflux. Radial and tangential beamports are used to extract a portion of themixed flux and a thermal column is used for obtaining a well thermalizedflux. These can be used for capture gamma analysis and also for insertion ofpneumatic transfer systems. But mostly these beamports are used for neutronphysical experiments or neutron or gamma radiography.
4.3.1 PNEUMATIC TRANSFER SYSTEMS
Sample containers with volumes from a fraction of a ml to a few hundreds of mlcan be transported by pneumatic means. The use of a pneumatic transfer systemallows short transfer times and convenient access to the irradiation position,especially if a reactor with a pressurized vessel is used. The only drawbackis that the sample vials have to sustain mechanical impact and thereforequartz vials have to be especially packed, when irradiated with a pneumatictransfer system.
Several commercial pneumatic transfer systems are available but it is alsoquite common that laboratories build their own ones, which can be designedaccording to need.
In most pneumatic transfer systems the rabbit is transported with pressurizedair. The system is simple and rather fast. A speed of 90 m/s can bereached. Figure 4.4 shows a rather complicated system with two irradiationand measurement positions [iss]. Similar systems with only one irradiation
43
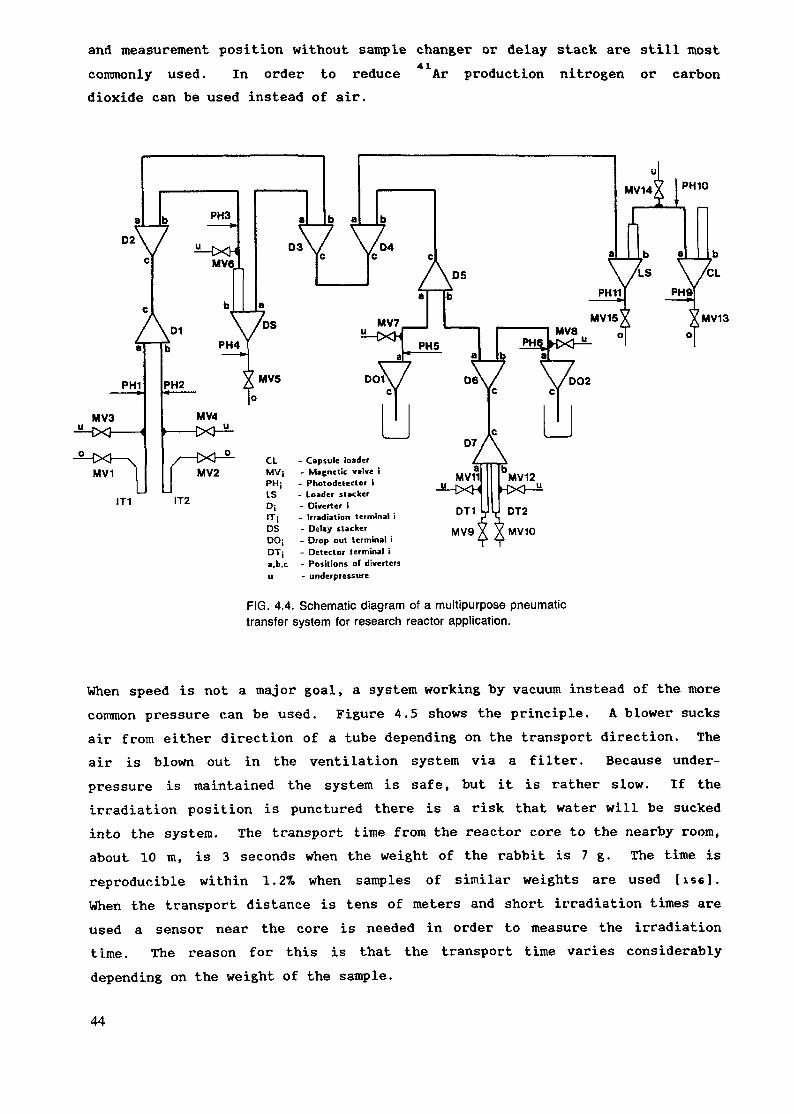
and measurement position without sample changer or delay stack are still mostcommonly used. In order to reduce Ar production nitrogen or carbondioxide can be used instead of air.
MV13
MV1 MV2
IT1 IT2
CLMVjPHjLS
DSDO;DTja.b.cu
- Capsule loader- Magnetic valve i- Photodetector i- Loader stacker- Diverter i- Irradiation terminal i- Delay slacker- Drop out terminal i- Detector terminal i- Positions of dlvcrtcrs- underpressure
MV11a b
DT1
MV9
MV12
DT2
MV10
FIG. 4.4. Schematic diagram of a multipurpose pneumatictransfer system for research reactor application.
When speed is not a major goal, a system working by vacuum instead of the morecommon pressure can be used. Figure 4.5 shows the principle. A blower sucksair from either direction of a tube depending on the transport direction. Theair is blown out in the ventilation system via a filter. Because under-pressure is maintained the system is safe, but it is rather slow. If theirradiation position is punctured there is a risk that water will be suckedinto the system. The transport time from the reactor core to the nearby room,about 10 m, is 3 seconds when the weight of the rabbit is 7 g. The time isreproducible within 1.2% when samples of similar weights are used Use].When the transport distance is tens of meters and short irradiation times areused a sensor near the core is needed in order to measure the irradiationtime. The reason for this is that the transport time varies considerablydepending on the weight of the sample.
44
FIG. 4.5. Pneumatic transfer system.
Especially in the last few years a number of very fast pneumatic transfersystems have been described using very short-lived isotopes in activationanalysis. The transportation from the irradiation position to the measurementstation is performed by pressurized air, nitrogen, or even helium and variesbetween 30 ms and 500 ms depending on the circumstances. These very fastsystems are only needed in very few applications.
4.3.2 ROTARY SPECIMEN RACK (LAZY SUSAN)
In the Triga reactors samples can be irradiated in the reflector, in the"rotary specimen rack" (Lazy Susan) (Fig. 4.3), in which there are 40locations which can hold capsules 3 cm in diameter and 25 cm long. This rackcan be rotated. In some laboratories the rack is rotated during irradiationin order to get a homogeneous flux for all samples. When samples with highabsorption cross sections, or cadmium capsules are inserted in some of the
45
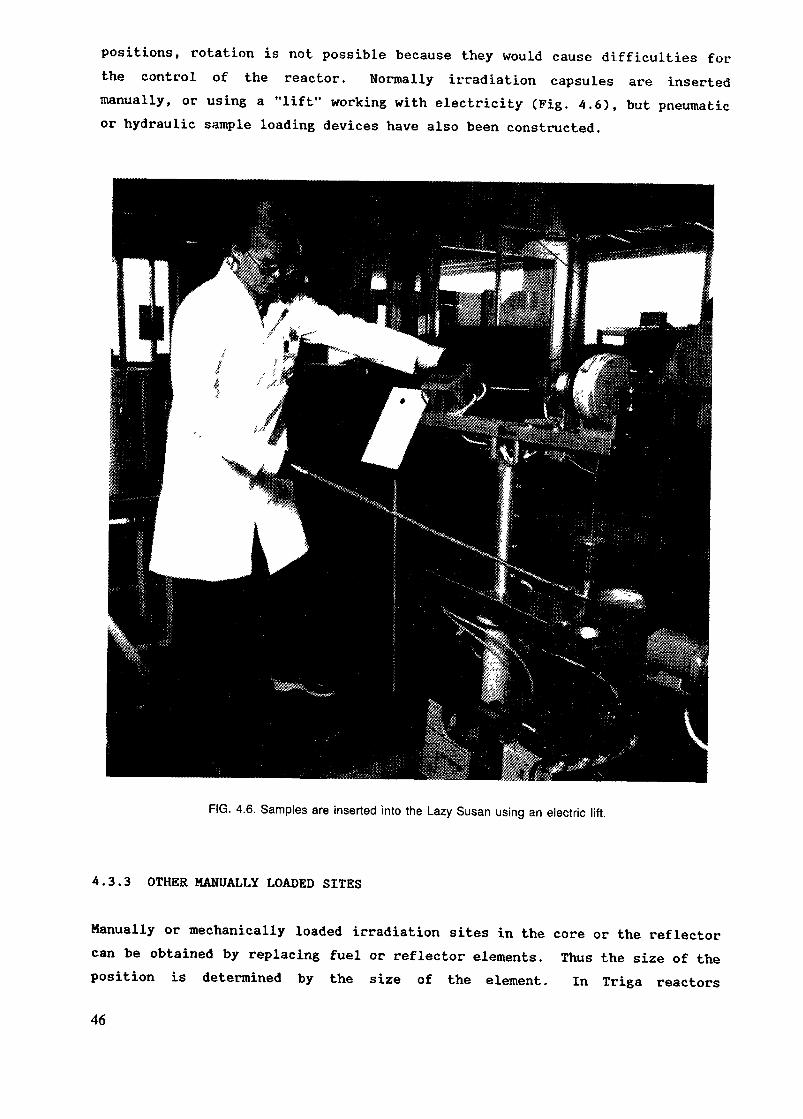
positions, rotation is not possible because they would cause difficulties forthe control of the reactor. Normally irradiation capsules are insertedmanually, or using a "lift" working with electricity (Fig. 4.6), but pneumaticor hydraulic sample loading devices have also been constructed.
FIG. 4.6. Samples are inserted into the Lazy Susan using an electric lift.
4.3.3 OTHER MANUALLY LOADED SITES
Manually or mechanically loaded irradiation sites in the core or the reflectorcan be obtained by replacing fuel or reflector elements. Thus the size of theposition is determined by the size of the element. In Triga reactors
46
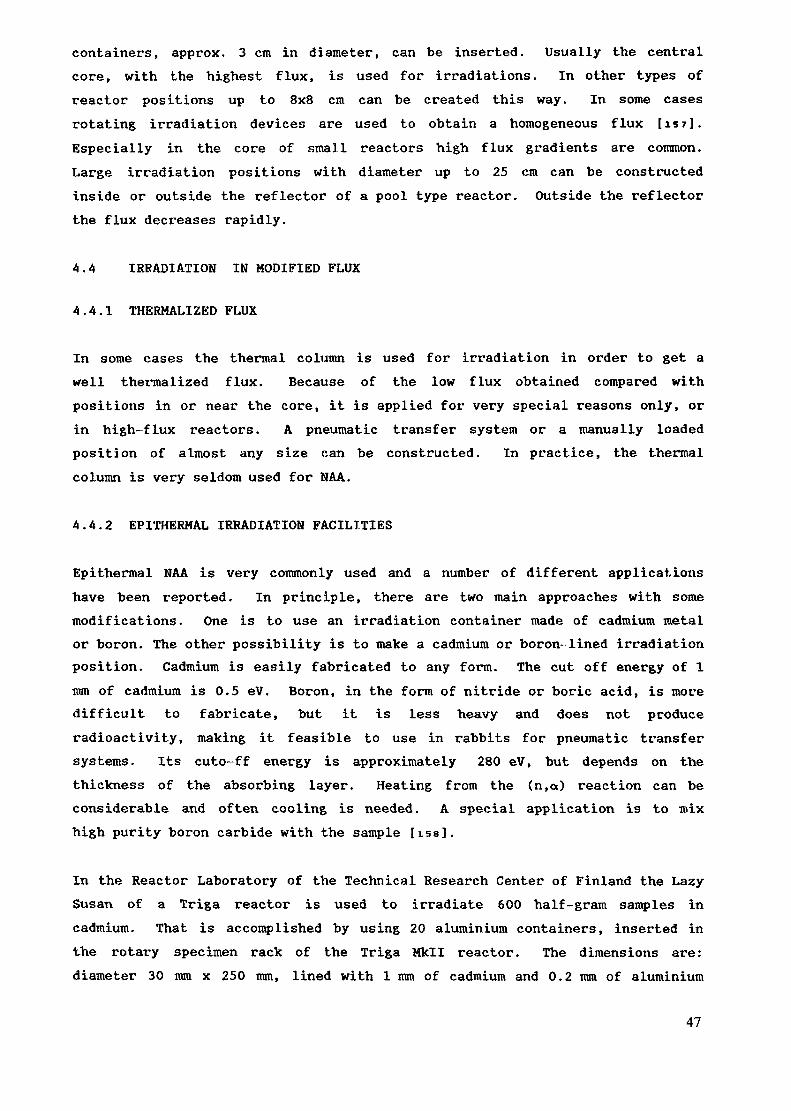
containers, approx. 3 cm in diameter, can be inserted. Usually the centralcore, with the highest flux, is used for irradiations. In other types ofreactor positions up to 8x8 cm can be created this way. In some casesrotating irradiation devices are used to obtain a homogeneous flux [is?].Especially in the core of small reactors high flux gradients are common.Large irradiation positions with diameter up to 25 cm can be constructedinside or outside the reflector of a pool type reactor. Outside the reflectorthe flux decreases rapidly.
4.4 IRRADIATION IN MODIFIED FLUX
4.4.1 THERMALIZED FLUX
In some cases the thermal column is used for irradiation in order to get awell thermalized flux. Because of the low flux obtained compared withpositions in or near the core, it is applied for very special reasons only, orin high-flux reactors. A pneumatic transfer system or a manually loadedposition of almost any size can be constructed. In practice, the thermalcolumn is very seldom used for NAA.
4.4.2 EPITHERMAL IRRADIATION FACILITIES
Epithermal NAA is very commonly used and a number of different applicationshave been reported. In principle, there are two main approaches with somemodifications. One is to use an irradiation container made of cadmium metalor boron. The other possibility is to make a cadmium or boron-lined irradiationposition. Cadmium is easily fabricated to any form. The cut off energy of 1mm of cadmium is 0.5 eV. Boron, in the form of nitride or boric acid, is moredifficult to fabricate, but it is less heavy and does not produceradioactivity, making it feasible to use in rabbits for pneumatic transfersystems. Its cuto-ff energy is approximately 280 eV, but depends on thethickness of the absorbing layer. Heating from the (n,a) reaction can beconsiderable and often cooling is needed. A special application is to mixhigh purity boron carbide with the sample [issj.
In the Reactor Laboratory of the Technical Research Center of Finland the LazySusan of a Triga reactor is used to irradiate 600 half-gram samples incadmium. That is accomplished by using 20 aluminium containers, inserted inthe rotary specimen rack of the Triga Mkll reactor. The dimensions are:diameter 30 mm x 250 mm, lined with 1 mm of cadmium and 0.2 mm of aluminium
47
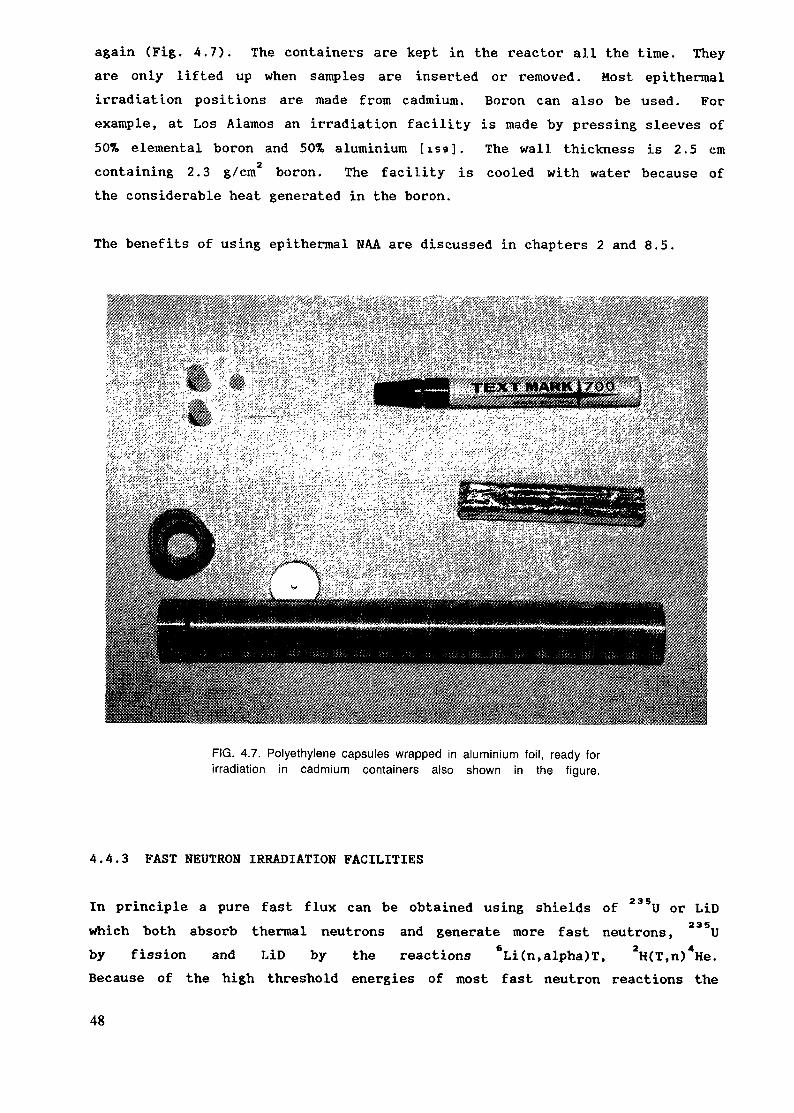
again (Fig. 4.7). The containers are kept in the reactor all the time. Theyare only lifted up when samples are inserted or removed. Most epithermalirradiation positions are made from cadmium. Boron can also be used. Forexample, at Los Alamos an irradiation facility is made by pressing sleeves of50% elemental boron and 50% aluminium [159]. The wall thickness is 2.5 cmcontaining 2.3 g/cm boron. The facility is cooled with water because ofthe considerable heat generated in the boron.
The benefits of using epithermal NAA are discussed in chapters 2 and 8.5.
FIG. 4.7. Polyethylene capsules wrapped in aluminium foil, ready forirradiation in cadmium containers also shown in the figure.
4.4.3 FAST NEUTRON IRRADIATION FACILITIES
In principle a pure fast flux can be obtained using shields of 235U or LiDwhich both absorb thermal neutrons and generate more fast neutrons, 23Suby fission and LiD by the reactions 6Li(n,alpha)T, 2R(T,n)4He.Because of the high threshold energies of most fast neutron reactions the
48

production of 14 MeV neutrons using LiD is more popular. Conversion ratesbetween 2.10 and 9.6.10 fast neutrons per thermal neutron havebeen reported tieo/iei]. The heat produced in the containers and the highproportion of epithermal neutrons restricts its usefulness and therefore ithas not found many applications.
49
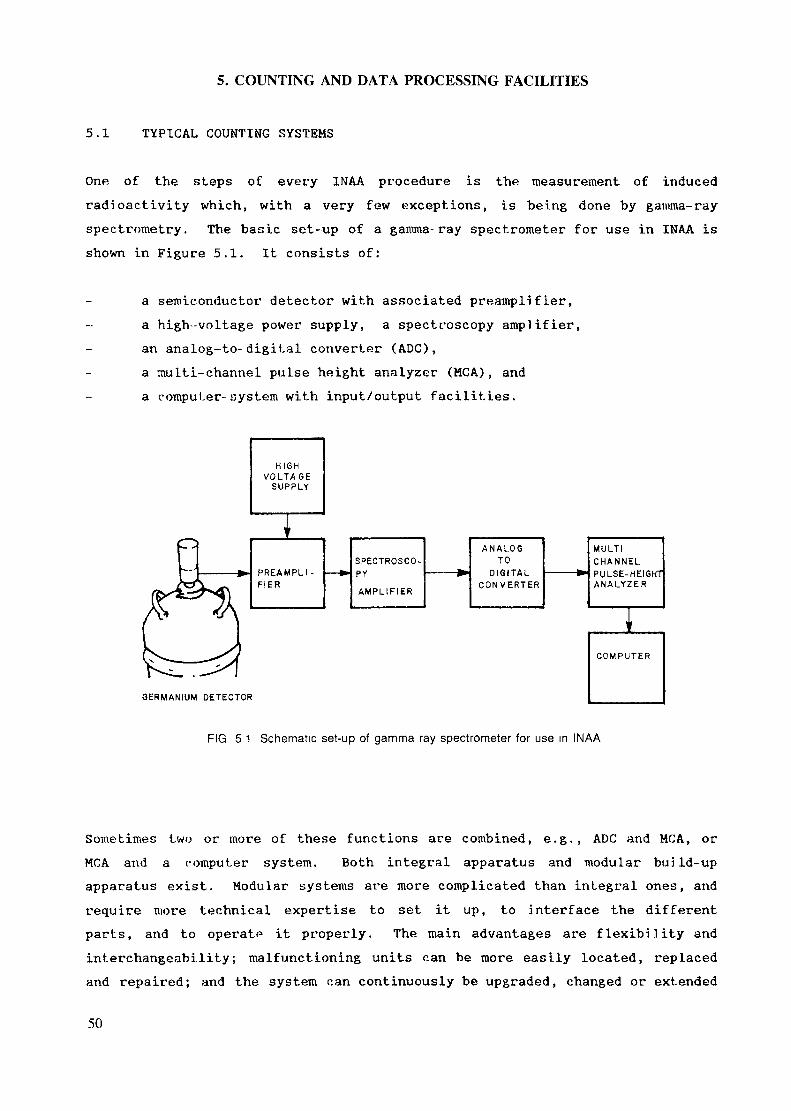
5. COUNTING AND DATA PROCESSING FACILITIES
5.1 TYPICAL COUNTING SYSTEMS
One of the steps of every INAA procedure is the measurement of inducedradioactivity which, with a very few exceptions, is being done by gamma-rayspectrometry. The basic set-up of a gamma-ray spectrometer for use in INAA isshown in Figure 5.1. It consists of:
a semiconductor detector with associated preamplifier,a high-voltage power supply, a spectroscopy amplifier,an analog-to-digital converter (ADC),a multi-channel pulse height analyzer (MCA), anda computer-system with input/output facilities.
A N A L O GTO
DIGITALCONVERTER
GERMANIUM DETECTOR
FIG 5 1 Schematic set-up of gamma ray spectrometer for use m INAA
Sometimes two or more of these functions are combined, e.g., ADC and MCA, orMCA and a computer system. Both integral apparatus and modular build-upapparatus exist. Modular systems are more complicated than integral ones, andrequire more technical expertise to set it up, to interface the differentparts, and to operate it properly. The main advantages are flexibility andinterchangeability; malfunctioning units can be more easily located, replacedand repaired; and the system can continuously be upgraded, changed or extended
50
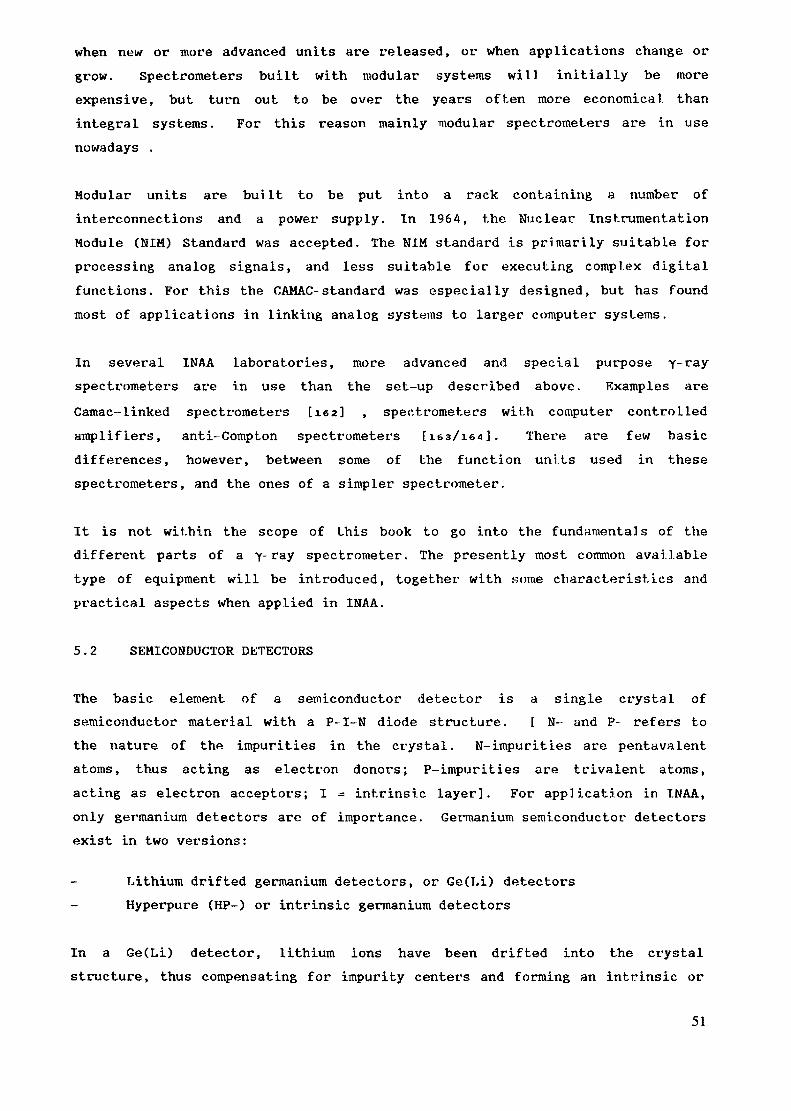
when new or more advanced units are released, or when applications change orgrow. Spectrometers built with modular systems will initially be moreexpensive, but turn out to be over the years often more economical thanintegral systems. For this reason mainly modular spectrometers are in usenowadays .
Modular units are built to be put into a rack containing a number ofinterconnections and a power supply. In 1964, the Nuclear InstrumentationModule (HIM) Standard was accepted. The NIM standard is primarily suitable forprocessing analog signals, and less suitable for executing complex digitalfunctions. For this the CAMAC-standard was especially designed, but has foundmost of applications in linking analog systems to larger computer systems.
In several INAA laboratories, more advanced and special purpose y-rayspectrometers are in use than the set-up described above. Examples areCamac-linked spectrometers [lea] , spectrometers with computer controlledamplifiers, anti-Compton spectrometers [les/iei]. There are few basicdifferences, however, between some of the function units used in thesespectrometers, and the ones of a simpler spectrometer.
It is not within the scope of this book to go into the fundamentals of thedifferent parts of a y-ray spectrometer. The presently most common availabletype of equipment will be introduced, together with some characteristics andpractical aspects when applied in INAA.
5.2 SEMICONDUCTOR DETECTORS
The basic element of a semiconductor detector is a single crystal ofsemiconductor material with a P-I-N diode structure. [ N- and P- refers tothe nature of the impurities in the crystal. N-impurities are pentavalentatoms, thus acting as electron donors; P-impurities are trivalent atoms,acting as electron acceptors; I = intrinsic layer]. For application in INAA,only germanium detectors are of importance. Germanium semiconductor detectorsexist in two versions:
Lithium drifted germanium detectors, or Ge(Li) detectorsHyperpure (HP-) or intrinsic germanium detectors
In a Ge(Li) detector, lithium ions have been drifted into the crystalstructure, thus compensating for impurity centers and forming an intrinsic or
51
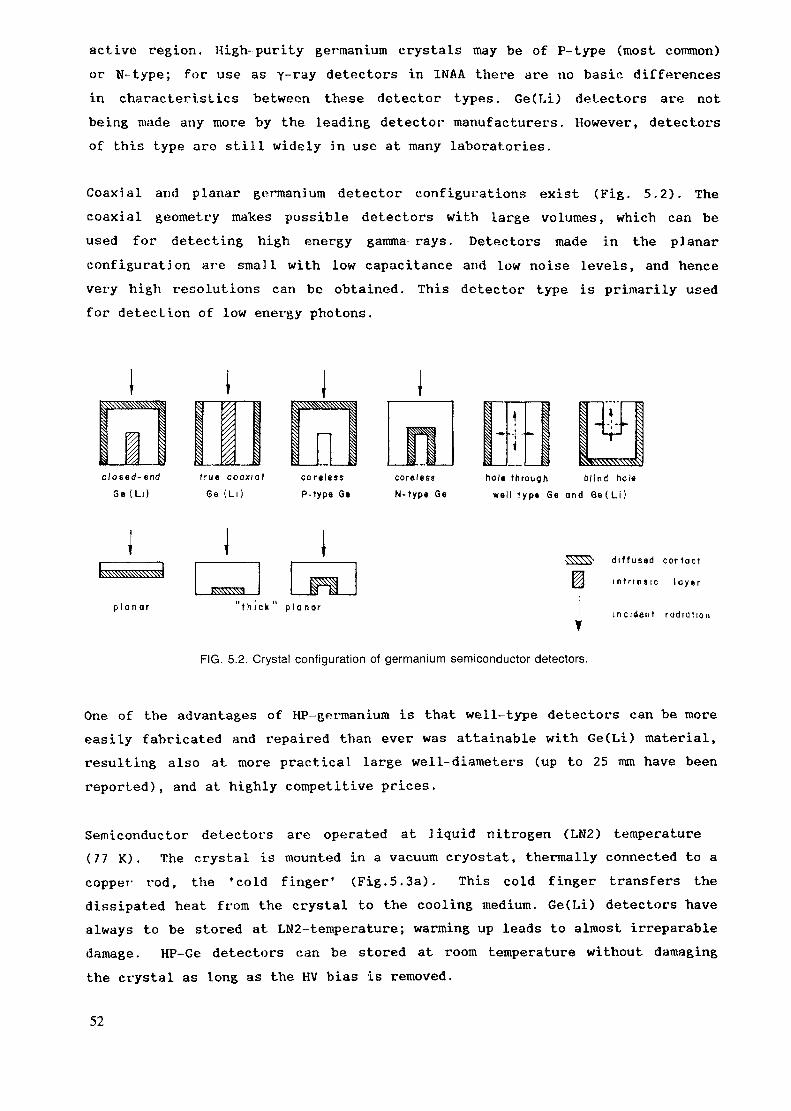
active région. High-purity germanium crystals may be of P-type (most common)or N-type; for use as y-ray detectors in INAA there are no basic differencesin characteristics between these detector types. Ge(Li) detectors are notbeing wade any more by the Leading detector manufacturers. However, detectorsof this type are still widely in use at many laboratories.
Coaxial and planar germanium detector configurations exist (Fig. 5.2). Thecoaxial geometry makes possible detectors with large volumes, which can beused for detecting high energy gamma rays. Detectors made in the pJanarconfiguration are small with low capacitance and low noise levels, and hencevery high resolutions can be obtained. This detector type is primarily usedfor detection of low energy photons.
p l a n a r
i ^s^^Ä^1^^
1 1§ ^yclosed-end
|
S>
1//,
1A
•^ j ^^^^
true coaxia l careless
;
; rü |j
a
*
|
\~ I
icoreless hole through
ï
\
'
Y//////
V/////,
\ i_
blind holeG e ( L i ) Ge (L i ) P-type G» N-typ« Ge wel l typ« G« and öe (L i )
t h i c k p la nor
d i f f used contact
i n t r ins le l o y e r
inc ident radiat ion
FIG. 5.2. Crystal configuration of germanium semiconductor detectors.
One of the advantages of HP-germanium is that well-type detectors can be moreeasily fabricated and repaired than ever was attainable with Ge(Li) material,resulting also at more practical large well-diameters (up to 25 mm have beenreported), and at highly competitive prices.
Semiconductor detectors are operated at liquid nitrogen (LN2) temperature(77 K). The crystal is mounted in a vacuum cryostat, thermally connected to acopper rod, the 'cold finger' (Fig.5.3a). This cold finger transfers thedissipated heat from the crystal to the cooling medium. Ge(Li) detectors havealways to be stored at LN2-temperature; warming up leads to almost irreparabledamage. HP-Ge detectors can be stored at room temperature without damagingthe crystal as long as the HV bias is removed.
52
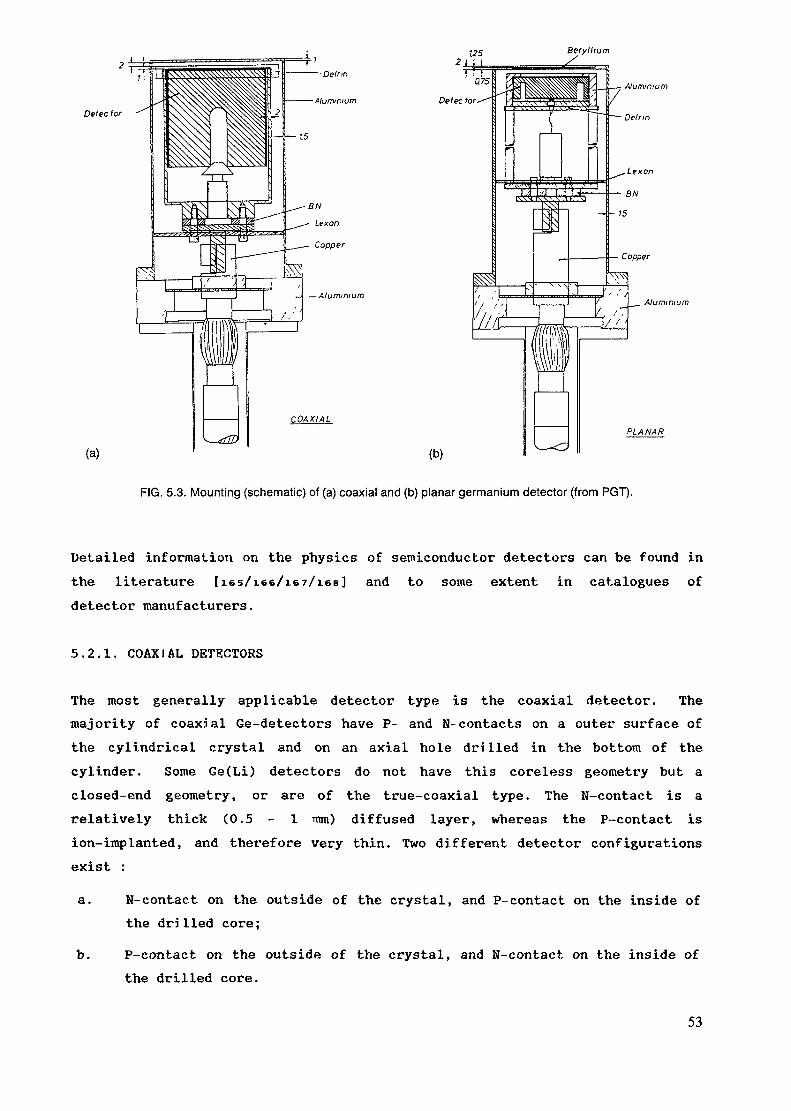
Of tec tor
(a)
Beryllium
Deiec lorAluminium
Delnn
AluminiumAluminium
(b)
FIG. 5.3. Mounting (schematic) of (a) coaxial and (b) planar germanium detector (from PGT).
Detailed information on the physics of semiconductor detectors can be found inthe literature [les/iee/iey/iee] and to some extent in catalogues ofdetector manufacturers.
5.2.1. COAXIAL DETECTORS
The most generally applicable detector type is the coaxial detector. Themajority of coaxial Ge-detectors have P- and N-contacts on a outer surface ofthe cylindrical crystal and on an axial hole drilled in the bottom of thecylinder. Some Ge(Li) detectors do not have this coreless geometry but aclosed-end geometry, or are of the true-coaxial type. The N-contact is arelatively thick (0.5 - 1 rcm) diffused layer, whereas the P-contact ision-implanted, and therefore very thin. Two different detector configurationsexist :
a. N-contact on the outside of the crystal, and P-contact on the inside ofthe drilled core;
b. P-contact on the outside of the crystal, and N-contact on the inside ofthe drilled core.
53
a. N-CONTACT ON THE OUTSIDE OF THE CRYSTAL
This is the detector geometry for Ge(Li) detectors, and at present themajority of the HP-Ge-detectors. As the thick N-contact is facing thecryostat's entrance window, and no electrical signals are produced byinteraction of the photons within the contact layers, low energy photons arestrongly absorbed before reaching the active region. In practice, thisdetector type can be applied in INAA for measurement of photons with energieshigher than 60 keV. For HP-detectors, the starting material is usually ofP-type.
b. P-CONTACT ON THE OUTSIDE OF THE CRYSTAL
The HP-Ge crystal is mounted in the vacuum cryostat with the very thin P-contact facing the entrance window. Because of the near absence of absorbingmaterial the detector can be used to measure photons with energies as low as10 or even 3 keV, depending on the type of window (aluminium or beryllium).The absence of absorbing layers also result in a flat and high efficiencycurve for photons with energies lower than 100 keV. Starting material usuallyis N-type germanium, though some manufacturers also use P-germanium crystalsfor such a geometry.
When considering an application of a semi-conductor detector in an anti-Compton spectrometer, there are no differences in timing properties betweenP-type and N-type Germanium detectors [i69]. Timing resolution gets poorerwith increasing size of the crystal. For capture gamma-ray spectroscopysystems, N-type crystals have the advantage of higher resistance againstneutron radiation.
5.2.2. PLANAR DETECTORS
In the planar configuration a germanium P-type crystal of small thickness isused. The crystal is mounted in the cryostat with the thin P-contact facingthe cryostat's beryllium entrance window (Fig. 5.3b.). Absorption of lowenergy photons is thus minimized, and a detector type is created withperformance optimized for X-rays and j-ray energies from 5 keV to 200 keV.Because of the small size, the capacitance of the diode is considerably lowerthan for a coaxial detector, resulting in a lower noise level and a higherresolution.
54
Some manufacturers also developed detector types in geometries which resembleboth planar and coaxial geometry using a thick slice of detector material.Being a compromise, a detector of this configuration might have a higherefficiency shared by a lower resolution than a true planar detector. Moreover,because of the enhanced efficiency to high energy radiation this detector typealso has a higher response to Compton scattered radiation.
At first sight, the coaxial detector-type with thin P-type entrance contact(referred to as 'extended-range coaxial') may seem more useful for applicationin INAA than the commonly used coaxial detector, because of its extendeddynamic range. However, a few practical aspects of extended range y-rayspectroscopy in INAA should not be overlooked :
a. There are only very limited analytical advantages in INAA of y-rayspectroscopy with photons of energies as low as 5 keV. For most applications,a lower energy cut-off at 40 or 50 keV is sufficient. Moreover, many spectrawill show a complex variety of X-ray peaks and y-ray peaks in the energyrange below 100 keV. To keep this part of the spectrum analyzable, highdemands are set to low-energy resolution of the detector, and to analysissoftware. Gain settings of 250 eV/channel or less may be required resulting in8192 or even 16384 channels for spectra covering the energy range up to 2000keV.
b. Coaxial detectors have a high efficiency for high energy y- rays. Inspectra of actual samples the peaks of X-rays and low energy y- rays will bemeasured at a high Compton background level of simultaneously interacting highenergy photons.
The only real advantage of extended range coaxial detectors when compared toother coaxial detectors for INAA is higher efficiency for 60 -• 100 keVphotons. The expected analytical merit of measuring peaks in this region hasto balance against the higher cost of these detectors.
The ideal approach for measurement of photons in the energy range from 5 -2000 keV would therefore be a twin detector spectrometer. Here the sample isfaced by simultaneously measuring planar and coaxial detectors (Fig. 5.4.),each having optimal performance for a specific energy range, in resolution andin efficiency.
55
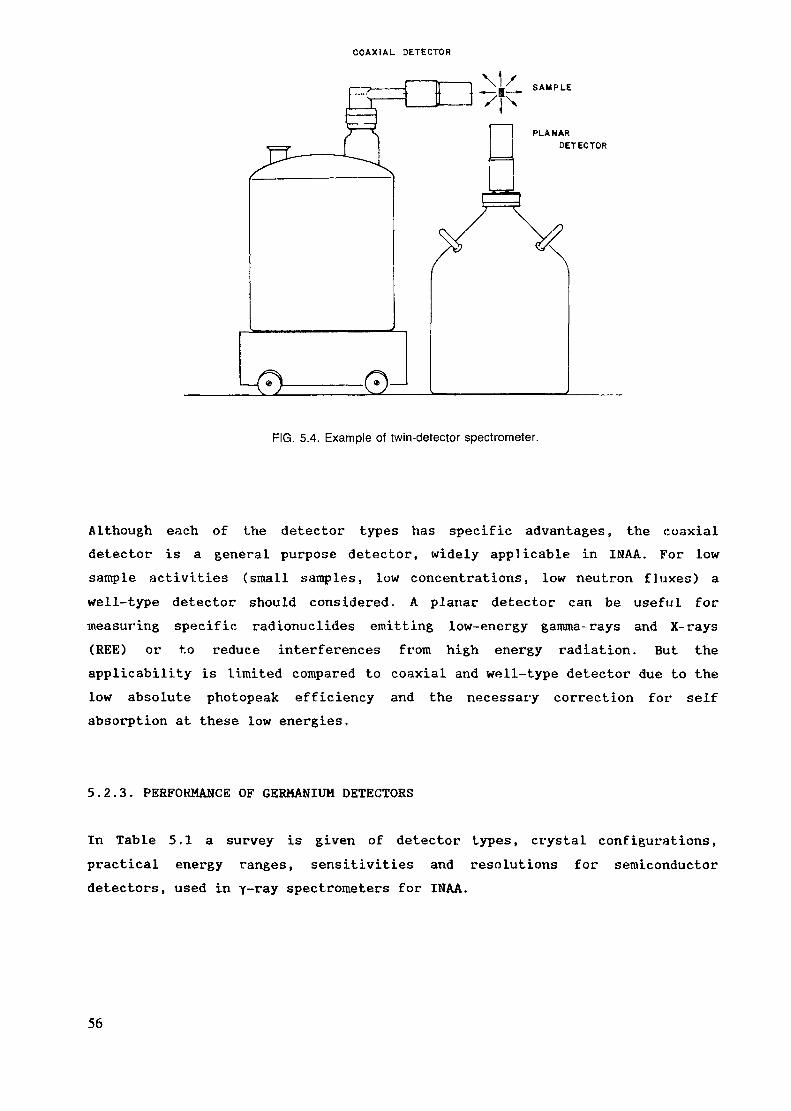
COAXIAL DETECTOR
SAMPLE
PLANARDETECTOR
FIG. 5.4. Example of twin-detector spectrometer.
Although each of the detector types has specific advantages, the coaxialdetector is a general purpose detector, widely applicable in INAA. For lowsample activities (small samples, low concentrations, low neutron fluxes) awell-type detector should considered. A planar detector can be useful formeasuring specific radionuclides emitting low-energy gamma-rays and X-rays(REE) or to reduce interferences from high energy radiation. But theapplicability is limited compared to coaxial and well-type detector due to thelow absolute photopeak efficiency and the necessary correction for selfabsorption at these low energies.
5.2.3. PERFORMANCE OF GERMANIUM DETECTORS
In Table 5.1 a survey is given of detector types, crystal configurations,practical energy ranges, sensitivities and resolutions for semiconductordetectors, used in y-ray spectrometers for INAA.
56
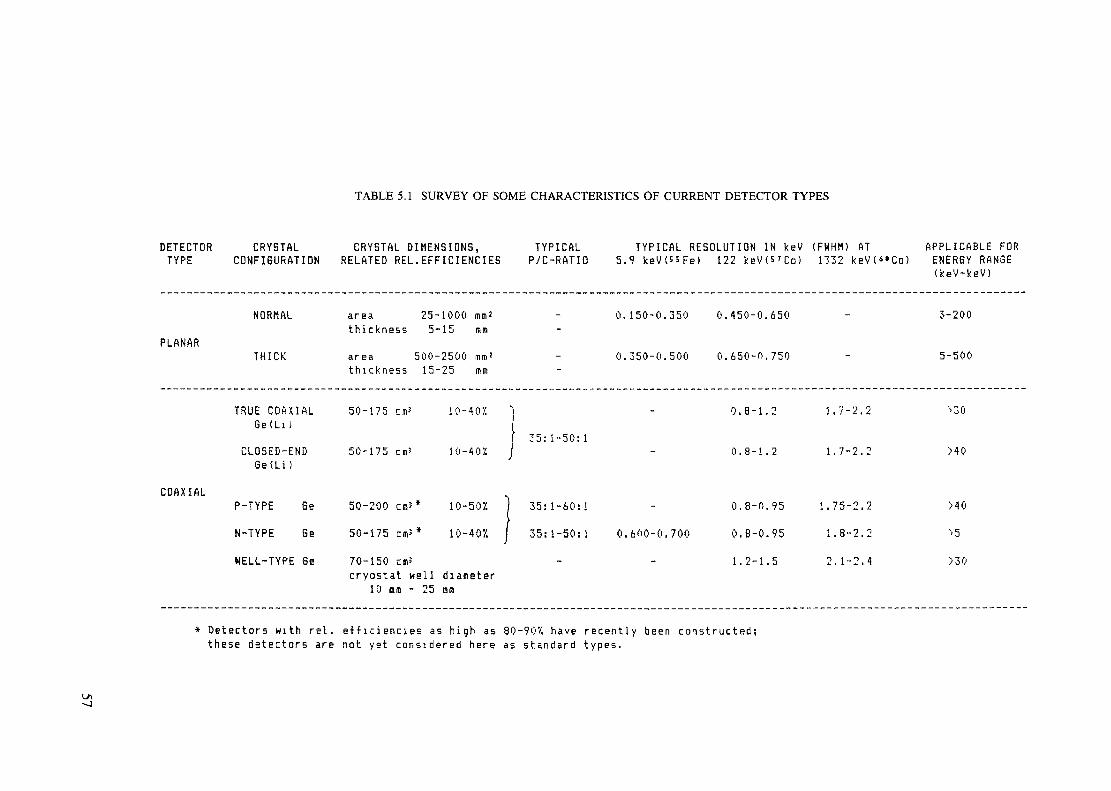
TABLE 5.1 SURVEY OF SOME CHARACTERISTICS OF CURRENT DETECTOR TYPES
DETECTOR C R Y S T A L CRYSTAL DIMENSIONS, TYPICAL TYPICAL RESOLUTION IN keV ( F W H M ) AT APPLICABLE FORTYPE CONFIGURATION RELATED REL.EFFICIENCIES P/C-RATIO 5.9 k e V ( s s F e ) 122 k e V ( S ' C o ) 1332 k e V C ' C o ) ENERGY RANGE
( k e V - k e V )
NORMAL
PLANARTHICK
TRUE COAXIALGetLi )
CLOSED-ENDGetLi !
COAXIALP-TYPE Ge
N-TYPE Se
«ELL-TYPE 6e
areathi cknessareathickness
50-175 cms
50-175 cm?
50-200 cm*
50-175 cup
70-150 CUPcryostat w
10 mm -
25-1000 mm' - 0,150-0.350 0.450-0.6505-15 mm
500-2500 mm' - 0.350-0.500 0.650-0.75015-25 mm
10-40'/. 1 - 0.8-1.2 1.7-2.2/| 35:1-50:1
10-407. J - 0.8-1.2 1.7-2.2
* 10-507. I 35:1-60:1 - 0.8-0.95 1.75-2.2
* 10-407. J 35:1-50:1 0.600-0.700 0.8-0.95 1.8-2.2
1.2-1.5 2.1-2.4ell diameter25 mm
3-200
5-500
*>30
>40
>40
">5>30
* Detectors with rel. efficiencies as h i g h as 80-907. have recently been constructed;these detectors are not yet considered here as standard types.
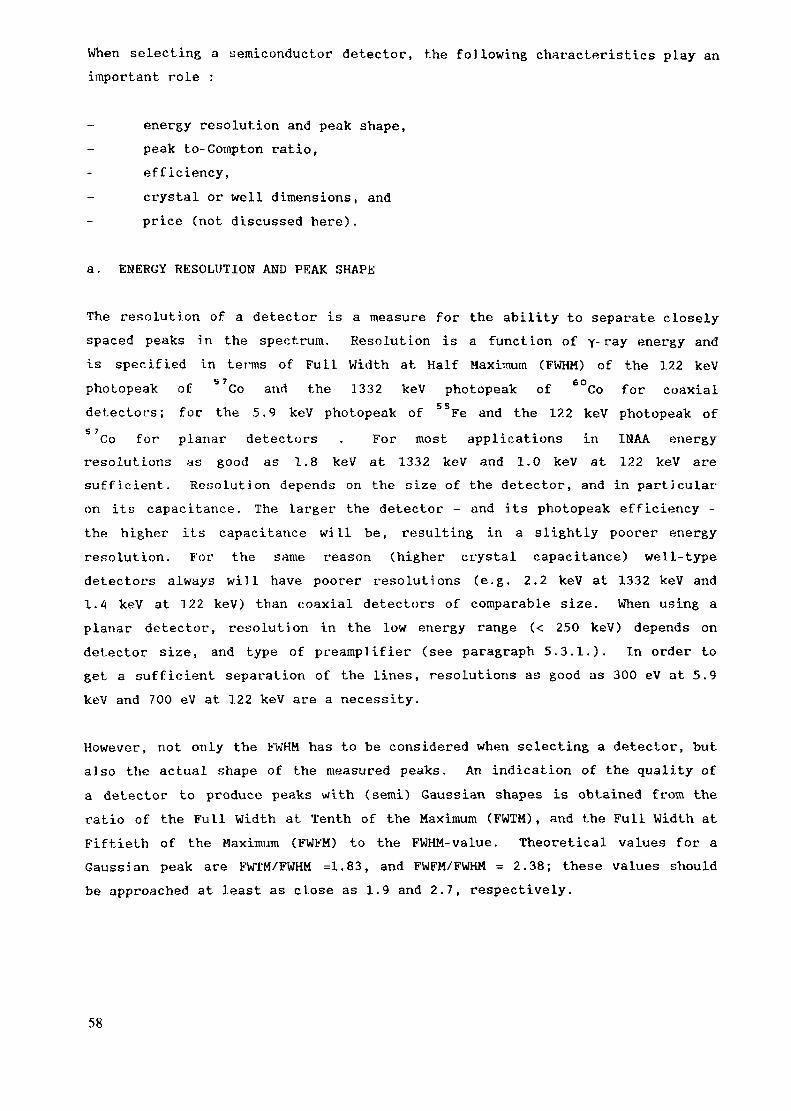
When selecting a semiconductor detector, the following characteristics play animportant role :
energy resolution and peak shape,peak to-Compton ratio,efficiency,crystal or well dimensions, andprice (not discussed here).
a. ENERGY RESOLUTION AND PEAK SHAPÜ
The resolution of a detector is a measure for the ability to separate closelyspaced peaks in the spectrum. Resolution is a function of 7-ray energy andis specified in terms of Full Width at Half Maximum (FWHM) of the 122 keVphotopeak of Co and the 3332 keV photopeak of 6°Co for coaxialdetectors; for the 5.9 keV photopeak of Fe and the 122 keV photopeak ofCo for planar detectors . For most applications in INAA energy
resolutions as good as 1.8 keV at 1332 keV and 1.0 keV at 122 keV aresufficient. Resolution depends on the size of the detector, and in particularon its capacitance. The larger the detector - and its photopeak efficiency -the higher its capacitance will be, resulting in a slightly poorer energyresolution. For the same reason (higher crystal capacitance) well-typedetectors always will have poorer resolutions (e.g. 2.2 keV at 1332 keV and1.4 keV at 122 keV) than coaxial detectors of comparable size. When using aplanar detector, resolution in the low energy range (< 250 keV) depends ondetector size, and type of preamplifier (see paragraph 5.3.1.). In order toget a sufficient separation of the lines, resolutions as good as 300 eV at 5.9keV and 700 eV at 122 keV are a necessity.
However, not only the FWHM has to be considered when selecting a detector, butalso the actual shape of the measured peaks. An indication of the quality ofa detector to produce peaks with (semi) Gaussian shapes is obtained from theratio of the Full Width at Tenth of the Maximum (FWTM), and the Full Width atFiftieth of the Maximum (FWFM) to the FWHM-value. Theoretical values for aGaussian peak are FWTM/FWHM =1.83, and FWFM/FWHM = 2.38; these values shouldbe approached at least as close as 1.9 and 2.7, respectively.
58
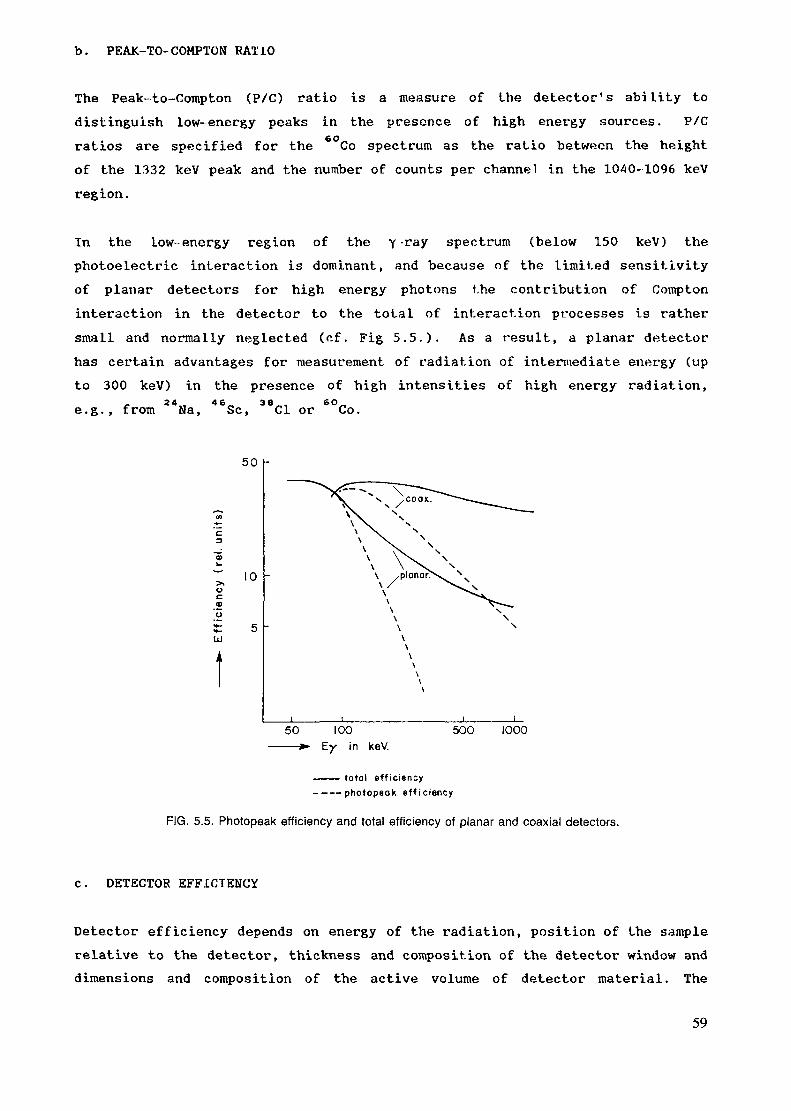
b. PEAK-TO-COMPTON RATIO
The Peak-to-Compton (P/C) ratio is a measure of the detector's ability todistinguish low-energy peaks in the presence of high energy sources. P/Cratios are specified for the Co spectrum as the ratio between the heightof the 1332 keV peak and the number of counts per channel in the 1040-1096 keVregion.
In the low-energy region of the y -ray spectrum (below 150 keV) thephotoelectric interaction is dominant, and because of the limited sensitivityof planar detectors for high energy photons the contribution of Comptoninteraction in the detector to the total of interaction processes is rathersmall and normally neglected (cf. Fig 5.5.). As a result, a planar detectorhas certain advantages for measurement of radiation of intermediate energy (upto 300 keV) in the presence of high intensities of high energy radiation,
_ 24 . 46„ 3B„ , 6O_e.g., from Na, Se, Cl or Co.
50
10oc0)
UJ
50 100——*- Ey in keV.
500 1000
total efficiency-——photopeok efficiency
FIG. 5.5. Photopeak efficiency and total efficiency of planar and coaxial detectors.
C. DETECTOR EFFICIENCY
Detector efficiency depends on energy of the radiation, position of the samplerelative to the detector, thickness and composition of the detector window anddimensions and composition of the active volume of detector material. The
59
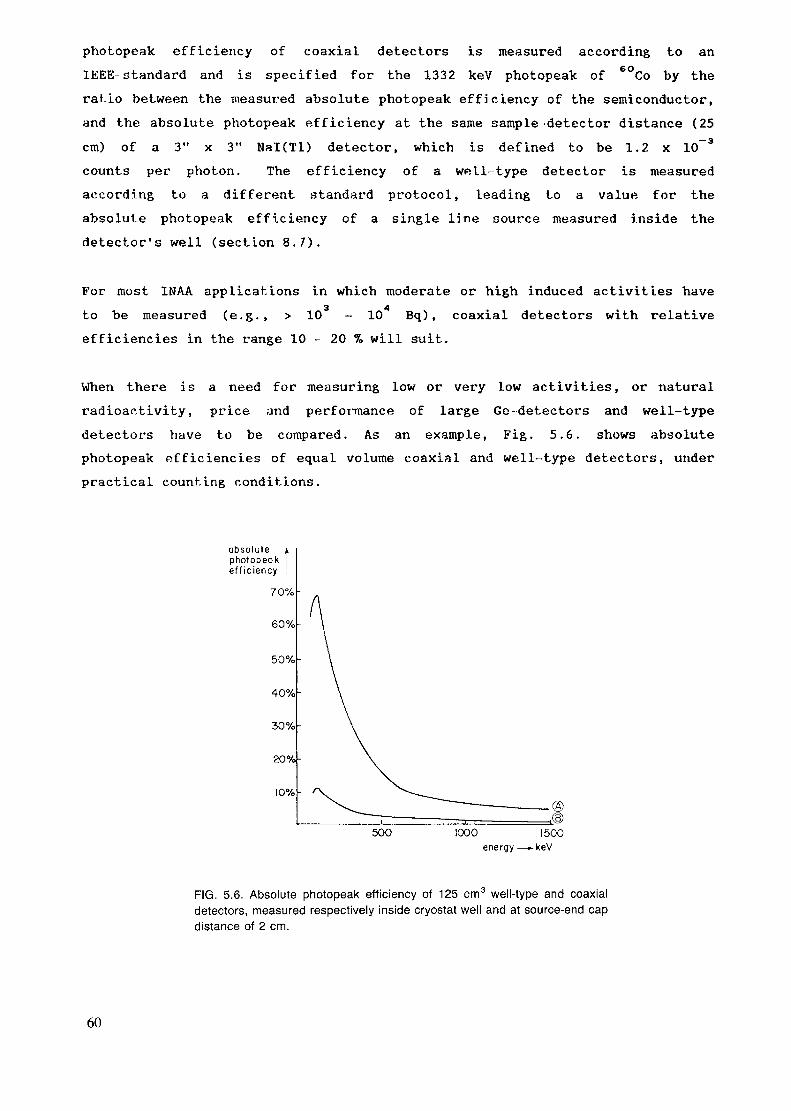
photopeak efficiency of coaxial detectors is measured according to anIEEE-standard and is specified for the 1332 keV photopeak of 6°Co by therat.io between the measured absolute photopeak efficiency of the semiconductor,and the absolute photopeak efficiency at the same sample-detector distance (25cm) of a 3" x 3" Nal(Tl) detector, which is defined to be 1.2 x 10~3counts per photon. The efficiency of a well-type detector is measuredaccording to a different standard protocol, leading to a value for theabsolute photopeak efficiency of a single line source measured inside thedetector's well (section 8.7).
For most 1NAA applications in which moderate or high induced activities haveto be measured (e.g., > 10 - 10 Bq), coaxial detectors with relativeefficiencies in the range 10 - 20 % will suit.
When there is a need for measuring low or very low activities, or naturalradioactivity, price and perfonnance of large Gc-detectors and well-typedetectors have to be compared. As an example, Fig. 5.6. shows absolutephotopeak efficiencies of equal volume coaxial and well-type detectors, underpractical counting conditions.
absolutephotopeokeff iciency |
500 1000energy -
1500-keV
FIG. 5.6. Absolute photopeak efficiency of 125 cm3 well-type and coaxialdetectors, measured respectively inside cryostat well and at source-end capdistance of 2 cm.
60
In the low energy part of the gatrana spectrum, detector efficiency is moredetermined by absorption cross-section than by total detector volume.Therefore, with planar detectors no efficiencies are specified; instead,sensitivity has to be derived from detector thickness and surface area. Achoice depends strongly on the energy range of interest, as the lower thephotons to be measured, the higher the resolution has to be. In reportedapplications of planar detectors in INAA [34/24/37/36/170/171/172] detectorsare used with areas varying from 50 mm to 500 mm and with thicknesses from 5to 10 mm.
d. CRYSTAL DIMENSIONS AND CKYSTAL WELL DIMENSIONS
From crystal dimensions an impression can be get about the relative efficiencyfor y-ray energies lower than 1332 keV [173]. Best performance for theenergy region below about 1 MeV is obtained when detectors have a crystaldiameter which exceeds their length.
Sensitivity increases roughly with the square of the distance between sampleand crystal. But as also geometric errors increase strongly when countingclose to the crystal, information on the precise position of the crystal inthe cryostat is important. Such distances may vary from a few -ram to about1 cm. It should be noted here that geometric errors are to a large extentabsent when measuring inside the well of a well-type detector [174].
For well-type detectors, usually only the dimensions of the 'room-temperaturewell', or cryostat well are given. The exact location of the crystal withrespect to the cryostat well should also be known. Blind-hole or hole-throughconfigurations exist (Fig. 5.2.); detectors with blind-hole, or single open-ended configuration generally will show somewhat poorer resolution, as thecomplex mounting of contacts and wires introduces enhanced noise levels. Theadvantage of the blind-hole configuration is that the active material at thebottom leads to a higher efficiency. This is especially of importance forlarge well configurations, in which for a hole-through type the solid-anglelosses would lead to a reduction in efficiency. The hole-through detectortype has the advantage of higher resolution; when the cryostat well iscompletely penetrating through the active volume large sample volumes can besurrounded by detector material.
61
f. CRYOSTATS AND DEWARS
Although for most INAA applications, detectors both vertical and horizontaldipstick cryostats are used, vertical dipstick configurations have theadditional advantage of placing samples on top of the end cap (e.g., Marinellibeakers). The development of streamlined cryostats with preamplifier mountedin a more or less extended end cap, and the availability of cryostats withextended 'necks' make possible to shield these types of detectors relativelyeasily.
In an alternative design the entire end cap assembly, including preamplifier,can be disconnected from the cold finger part, without disturbing the vacuum.By this approach the detector configuration can be altered from horizontalinto vertical dipstick, without the high cost of remounting the crystal. Forspecial purposes, e.g., very low level counting or measurement of naturalradioactivity, some manufacturers have detector cryostats in which allconstruction materials have been carefully selected for the absence of tracesof natural radioactivity.
Tn the cryostat a thermal insulation shield is often mounted around thecrystal. In a well-type configuration such a shield is absent betweencryostat well and crystal well. As a result, the cryostat well will alwayshave a lower temperature because of the large temperature gradient, andcondensation of moisture may occur. There are no rules of thumb on thelifetime of the molecular sieve inside the cryostat; the only practicalmeasure one has is the weekly LN2 consumption. Experience showed thatlifetimes as long as 10 years or more are very normal. Molecular sieves tendto vent gas when detectors are warmed-up to room temperature, which may leadto pressure build-up in the cryostat. In manuals of planar detectors andN-type detectors with Be-windows extensive attention is paid to how such awarm-up has to be carried out with a minimum of risk for explosion of thewindow. Although the sieve tends to restore vacuum when cooled down again,continuous storage at LN2-temperature is probably more safe. It should benoted that some detectors have always to be kept upright to keep the sieve inplace in the cryostat.
5.2.4. LIQUID NITROGEN SUPPLY
Because of the heat dissipation in the crystal, and the imperfect insulationof both cryostat and dewar, LN2 is consumed at a normal rate of 5 - 10 L/week,
62
depending on crystal size. Theoretical holding time for a 30 L dewar istherefore about 3 weeks under normal laboratory conditions. When consideringthe purchase of a Ge(Li) detector, one should be sure that LN2- supply isregular, at least on a weekly basis.
Safety precaution systems like LN2-level indicators, alarms, high-voltageshut-off systems, and automatic filling devices are available. However, thesesystems may go off during the night or in weekends or even may not work at allwhen needed. The proven safest way of maintaining a detector system is to setup a regular manual filling scheme. By filling a detector once a week (bypreference on a fixed day), there is never any doubt whether there is enoughLN2 in the Dewar. It is important to train as many employees in a group aspossible in this procedure, so that no situations may occur in which theperson-in-charge is absent and nobody knows what to do.
Filling LN2 dewars can be done with self-pressurized LN2 containers (volumes50 - 300 1), or using a spare 30 L Dewar as supply and pressurized nitrogengas. This has to be done at low overpressure (less than 1 atmosphere, 10 - 15psi). Also LN2-pumps are available. When applying the tubing between detectordewar and supply container, PVC-tubes, when cooled down and under mechanicaltension, may 'explode' into many very sharp pieces; better cryogenicresistance is shown by polyethylene or silicone tubing. Attention has also tobe paid to the gas-exhaust tube, which has to be led sufficiently far awayfrom the cryostat and preamplifer. During filling, check regularly that thereis no spilling of LN2 in the vicinity of the cryostat. Although LN2-dropsevaporate quickly, a regular spill may eventually lead to cracks in the vacuumseal rings of the cryostat.
Some detectors show excessive microphonics during the filling process. Insuch a case data accumulation can be interrupted for a few minutes to preventdistortion of the measured spectrum.
There are some developments going on in mechanical, electrical and He gascooling systems for semi-conductor detectors. Such detector systems certainlyhave advantages when working in remote areas, or in field laboratories. ForINAA laboratories, the use of such detectors should only be considered whenLN2 supply is highly irregular. Maintenance, like absorber change or vacuumrestoration has to be done about once or twice a year when the detector isused continuously. The resolution of such detector systems is worse than forLN2-cooled systems, and the price is considerably higher.
63
5.2.5. SELECTING A DETECTOR
Several questions have to be asked before a detector can be selected from acatalogue or a stock list. First, what is the type of work it will be usedfor? Do you expect to use it solely for measurements of moderate and highlyactive samples (i.e. > 10 - 10 Bq) , or can it be foreseen that inthe future also measurements have to be done of samples of somewhat loweractivity? This may help to choose between a 10 % or 20 % coaxial detector.But if only low or very low induced activities are expected, or measuringnatural activities is or will be one of your tasks, the purchase of a well-type detector should be considered.
Try to define which elements will be of importance, their relatedradionuclides, and y-ray energies. It may contribute to making a choicebetween a planar, an extended range coaxial or a normal coaxial detector.When type and size (efficiency) are known, the next thing is to try to find adetector with a peak-to-Compton ratio as high as you can afford. The P/Cratio ultimately defines sensitivity for many nuclides. Detectors with a highP/C ratio are of particular importance when the detector is needed formeasurements of short half-life nuclides, as in many cases sensitivity isinfluenced by the high Compton continuum from Al. Note that detectorsfrom different manufacturers, though of comparable size (efficiency) andresolution, may have different P/C ratios. You will also see that the higherthe P/C ratio, the better the resolution (and, usually, the higher the price).
It has been stated before that a resolution of 1.8 keV for Co issufficient for most applications. Remember that to exploit better resolution,you have to spread your 2 MeV spectrum over at least 8192 and maybe even 16384channels to get analyzable peaks (i.e., peaks which are spread-out over morethan 1 channel). Almost all manufacturers are capable now in specifying peakshapes in terms of FWHM, FWT(tenth or twentieth)!!, or FWF(fiftieth)M.
With well-type detectors there will always remain the limitation of the usablecryostat-well dimensions related to the sample containers you want to use. Askthe different manufacturers for accurate information on size and position ofthe crystal in the cryostat, and make scale drawings to get an idea how yoursample will be located in the cryostat well with respect to the active regionof the detector. It appears that for well-type detectors, most manufacturersare willing to make custom-made detectors.
64
When high humidity occurs in your counting room, or when high count rateexperiments are expected, it may be worthwhile to discuss this with themanufacturers; some have possibilities to treat the preamplifier for this.Choice of preamplifier is the next step. Check with the manuals of the otherspectrometer parts you already may have or which you selected whether the mainamplifier and ADC are able to process reset pulses.
Sometimes a stainless steel end cap may be preferred above the standard Al endcap (better rigidity and better resistance in corrosive atmospheres ); decidealso whether you really need a fragile, expensive Be-window, or if anAl-window will do. Horizontal cryostats have the advantage of easiershielding, especially if the detector comes with an offset-port Dewar; theadvantage of vertical cryostats is the possibility of placing the sample ontop of it (e.g., Marinelli beakers).
Finally, if you start negotiating with one or more manufacturers, never tellthem beforehand your budget. Select a detector which comes close to yourdemands and budget, and then start negotiating the price.
5.3 BASIC ELECTRONICS
In the following paragraphs the basic system parts of a y-ray spectrometerwill be briefly described, with the emphasis on the existing differencesrelated to application in INAA. Detailed information on specifications andconditions for use can be found in catalogues and manuals.
5.3.1. PREAMPLIFIERS
The preamplifier has the following functions :
impedance matchingconversion of an input charge pulse into an output voltage pulsesignal amplification
Several components of the preamplifier have been carefully selected to meetthe detector's electronic characteristics; to reduce noise, some circuits arebuilt into the cryostat (cooled input Field Effect Transistor or FET). Thisinput FET can easily be damaged by improper use or treatment. Both AC-orDC-coupled systems exist. With a very few exceptions, DC-coupling is standardas it offers better resolution, and less probability of FET breakdown.
65
Three different types of preamplifiers are of importance for detector systemsin INAA :
a. resistor feedback preamplifiersb. pulsed optical feedback preamplifiersc. transistor reset preamplifier
The resistor feedback preamplifier is the most commonly applied, and coaxialdetectors are usually so equipped. The pulsed optical feedback preamplifier(POFB) is used in systems where very high resolutions are required (e.g., withplanar detectors). The transistor reset preamplifier has advantages insystems where high energy, high count rates have to be processed withoutspectrum distortion. However, this goes at the cost of increased mainamplifier dead-time. It should be noted that the reset pulse in these systemsset requirements to the type of main amplifier or ADC (inhibit connections,high shaping times). Moreover the principles of the applied reset systemshould be studied carefully, as it has been shown that sometimes circuits havebeen incorrectly designed, leading to erroneous results [175/176/177/i?eJ.
The high-voltage loops in the preamplifier make necessary to protect themagainst moisture, e.g., condensation due to the LN2-vent. The best solutionis to lead the exhaust away from the preamplifier. In humid atmospheres itcan be necessary to cover the preamplifier with a bag filled with some silicagel. Repairing a damaged FET has to be done by the detector manufacturer tomatch the new Ft:T optimally with the detector's characteristics. Sometimes,when the FKT is not cooled, disconnecting the preamplifier may be consideredbecause of easier transportation. However, one should be aware that anysoldering at the cryostat's feedthrough has to be done with great care andmany precautions. Tf inevitable, soldering has to be done by preference atthe preamplifier end. Especially when the preamplifier has been repaired,instructions from the manufacturer are needed to prevent the new FET frombeing damaged again when soldering during remounting. The best solution tohave a preamplifier repaired is to send the entire detector assembly to themanufacturer. HP-germanium detectors have the advantage that they can bewarmed up for this; transportation of a Ge(Li) detector system always is moredifficult because of the LN2-requirements. If the damaged FET is in a cooledsection of a Ge(Li) detector, it should seriously be considered to purchase anew detector, as repair - if possible anyhow - presumably will be very costly.
66

5.3.2. NIM-BIN AND POWER SUPPLY
The NIM-bin is the supporting rack for 12 modules made in the HIM-standard;the power supply provides the necessary DC-voltages on the connectors in thebin. Most bins supply the standard DC-voltages +24 V, + and -12 V; takinginto account the power requirements of some newer N1M modules, it isrecommended to purchase only bins which also provide ±6 V. When all thepositions in the bin are expected to be used, it might be sensible to considera rack with higher output power, especially +6V, than the standard model.Most NIM-bins have front panel control, and indicator and monitoring positionsfor DC output. It is required to place the bin in such a way that a good aircirculation takes place through the module. Sometimes mounting feet areavailable when used as a tabletop rack. Large rubber stoppers make convenientfeet.
5.3.3. HIGH VOLTAGE POWER SUPPLY
NIM high voltage power supplies for semi-conductor detectors have typicaloutput characteristics of 3 - 5000 Volts, at low currents and with a low noiselevel. The increasing quality of semi-conductor detector elements have madeit possible to operate them at increasing maximum high voltage levels. Whenselecting a new high voltage power supply it might be considered to purchaseone with a higher maximum output voltage than necessary for the presentdetector in use, especially when this detector is relatively old and may bereplaced in forthcoming years. Most units have built-in dV/dt networks. Incase of an electricity failure, output voltage drops off slowly in time and isalso restored slowly to the preset value when the interruption is over. Inolder detector systems, abrupt changes of the high voltage may damage the FET.In modern detectors, often HV filters directly connected to preamplifier areapplied, with built-in HV time constants varying from 5 - 1 0 seconds.
Before applying high voltage, be sure the polarity is set correctly for thedetector.
5.3.4. SPECTROSCOPY AMPLIFIER
The spectroscopy or main amplifier is a key unit in the y-ray spectrometer.Its functions are :- linear amplification of the pulses from the preamplifier to levels
suitable for pulse height analysis ( 0 - 10 V);
67
improvement of signal-to-noise ratio by shaping of the signal pulses;
DC power supply to the preamplifier.
The performance of spectroscopy amplifiers is defined by energy resolution atlow count rate and by gain and resolution stability as function of count rate.There are no great differences in specifications of the top models ofdifferent manufacturers. In practice, some differences in performance mayoccur due to the combination with other parts of the spectrometer. A try-outof several models before purchasing is therefore very valuable. There is noreason in trying to save money by buying the second best spectroscopyamplifier from a series or when balancing between manufacturers. Pricedifferences are not large, and in fact almost negligible in the total cost ofthe spectrometer. For use in INAA where high performance, high stability andreliability over many years is a necessity, premium amplifiers offer bestvalue for money.
As the shape of pulses may affect the signal-to-noise ratio, energy resolutionand dead-time of an entire system, much attention has been paid to thesenetworks. The following methods of pulse shaping are being applied :
a. (Semi) Gaussian shaping,b. Triangular shaping,c. Gated integrated pulse shaping.
For a long time (semi) Gaussian shaping has been the only pulse shapingmethod, and is still the most common. On a theoretical basis it was knownthat a triangular shaping network would not only lead to an even bettersignal-to-noise ratio, but would also permit higher pulse processing rates.Only recently have amplifiers with such networks become available. Especiallyfor high count rate spectroscopy systems the gated integrated pulse shapingnetwork can be used. The advantage of this pulse shaping method lies inhigher system throughput; however, this goes at the cost of about 10-15% lossof energy resolution for high-resolution detectors (Fig. 5.7.).
All shaping networks have selectable time constants. Choosing a time constanthas to be done by experiment, observing the system resolution and the countrate effect of the setting. From the detector specification sheet, someindication can be observed on the time constant to be chosen; as a rule ofthumb, for Ge(Li) detectors 2-3 ys, HP-Ge detectors 3-6 ys and planardetectors 6-8 ys are nearly optimum settings for Gaussian shaping networks.
68
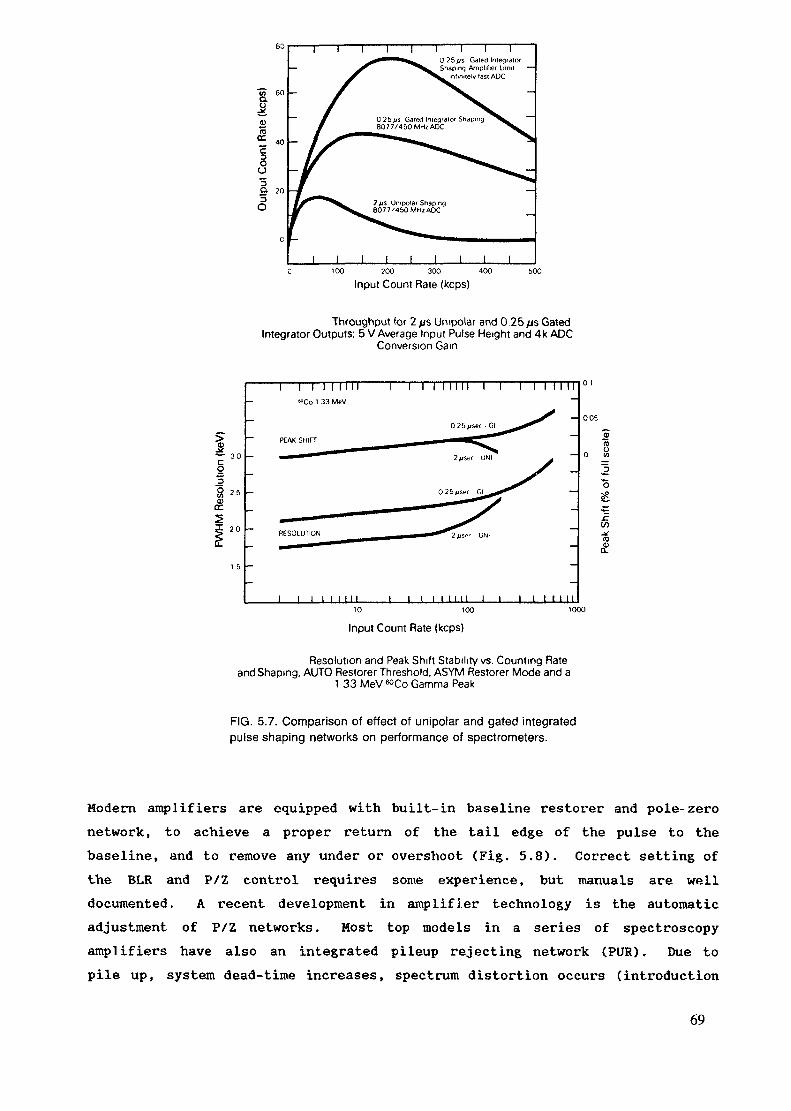
I I I I I I I I I100 200 300 400
Input Count Rate (kcps)bOO
Throughput for 2 ps Unipolar and 0.25 t*s GatedIntegrator Outputs: 5 V Average Input Pulse Height and 4k ADC
Conversion Gain
I— 30Cg
1 26
20
l l l M I I I I I I I I I I II I I I
I I I I I 11 I 1 I I I I I II
005
5rao «
3"o
.to£
10 10O
Input Count Rate (kcps)
Resolution and Peak Shift Stability vs. Counting Rateand Shaping. AUTO Restorer Threshold. ASYM Restorer Mode and a
1 33 MeV^Co Gamma Peak
FIG. 5.7. Comparison of effect of unipolar and gated integratedpulse shaping networks on performance of spectrometers.
Modern amplifiers are equipped with built-in baseline restorer and pole-zeronetwork, to achieve a proper return of the tail edge of the pulse to thebaseline, and to remove any under or overshoot (Fig. 5.8). Correct setting ofthe BLR and P/Z control requires some experience, but manuals are welldocumented. A recent development in amplifier technology is the automaticadjustment of P/Z networks. Most top models in a series of spectroscopyamplifiers have also an integrated pileup rejecting network (PUR). Due topile up, system dead-time increases, spectrum distortion occurs (introduction
69

unipolaroutputs i g n a l
(a) (b)
P/Z co r rec t l y set
symmet r i ca l peaks
P/Z overcompensated
peaks with high-energy tailing
P/Z undercompensated
peaks r f i th low energy ta i l i ng
FIG. 5.8. Effect on peak shape of (a) wrongly set pole-zero network and (b) pile-up.
of unwanted peaks, peak-shifts) and resolution degrades. The PUR network of anamplifier recognizes pulses subject to pileup, prevents their processing bygating off the ADC, and simultaneously controls the live-time correction whenthe ADC has been integrated with a MCA. The choice of making the PUR-networkactive strongly depends on the counting conditions, and has to be determinedby experiment. In this, also attention can be paid to the effects observedwhen using the pulser method for dead-time correction in combination with aPUR-active network in the amplifier [179].
The correct matching of DC output level of the amplifier and the DC inputlevel of the ADC is often overlooked. Some amplifiers provide control trim-potmeters for this. An incorrect setting leads to improper functioning ofBLR, and to count-rate dependent shifts of all peaks in the spectrum. Findingthe optimal setting of a spectroscopy amplifier is a matter of experiment. Itcan easily be carried out using a Co source of moderate strength at afixed position to the detector, and a more active 137Cs source which canbe placed at different distances to the detector in order to alter the totalcount rate. The position and width of the Co peaks is then observed asa function of changing count rates for different settings of time constant,BLR, threshold etc. (see also paragraph 5.3.7.). Also the degree of pile upand system throughput can be observed as function of time constant and count
70
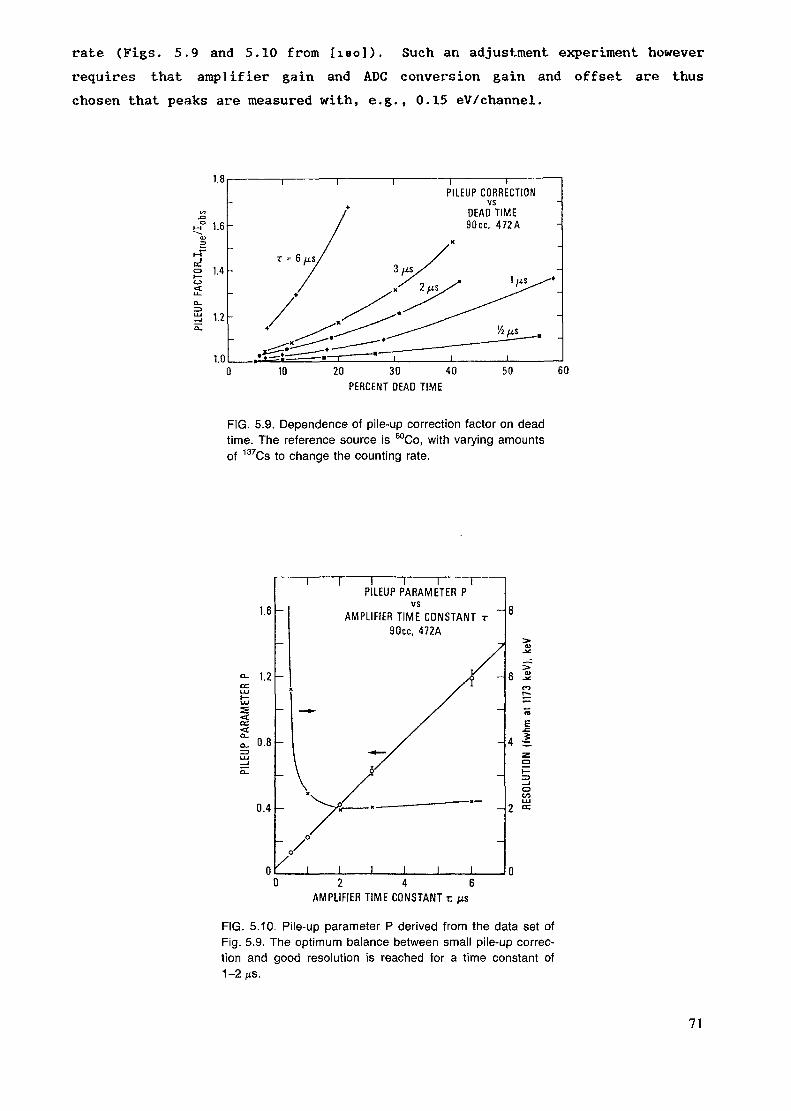
rate (Figs. 5.9 and 5.10 from [IBO]). Such an adjustment experiment howeverrequires that amplifier gain and ADC conversion gain and offset are thuschosen that peaks are measured with, e.g., 0.15 eV/channel.
i—————iPILEUP CORRECTION
vsDEAD TIME90cc. 472A
20 30 40PERCENT DEAD TIME
FIG. 5.9. Dependence of pile-up correction factor on deadtime. The reference source is 60Co, with varying amountsof 137Cs to change the counting rate.
1.6
1.2
CC<
0.8
0.4
I
I I I I iPILEUP PARAMETER P
vsAMPLIFIER TIME CONSTANT T
90cc. 472A
I I
E
4 I
=3
V>
0 2 4 6AMPLIFIER TIME CONSTANT r. pis
FIG. 5.10. Pile-up parameter P derived from the data set ofFig. 5.9. The optimum balance between small pile-up correc-tion and good resolution is reached for a time constant of1-2 us.
71
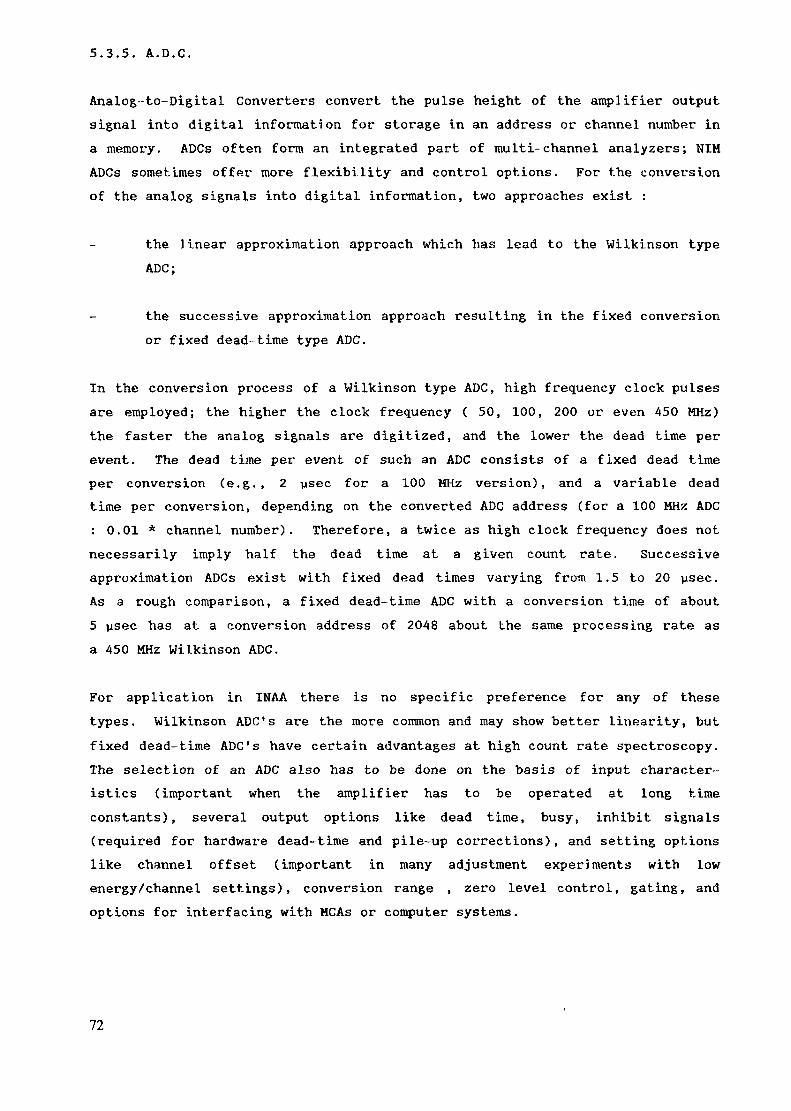
5,3.5. A.D.G.
Analog-to-Digital Converters convert the pulse height of the amplifier outputsignal into digital information for storage in an address or channel number ina memory. ADCs often form an integrated part of multi-channel analyzers; HIMADCs sometimes offer more flexibility and control options. For the conversionof the analog signals into digital information, two approaches exist :
the linear approximation approach which has lead to the Wilkinson typeADC;
the successive approximation approach resulting in the fixed conversionor fixed dead-time type ADC.
In the conversion process of a Wilkinson type ADC, high frequency clock pulsesare employed; the higher the clock frequency ( 50, 100, 200 or even 450 MHz)the faster the analog signals are digitized, and the lower the dead time perevent. The dead time per event of such an ADC consists of a fixed dead timeper conversion (e.g., 2 ysec for a 100 MHz version), and a variable deadtime per conversion, depending on the converted ADC address (for a 100 MHz ADC: 0.01 * channel number). Therefore, a twice as high clock frequency does notnecessarily imply half the dead time at a given count rate. Successiveapproximation ADCs exist with fixed dead times varying from 1.5 to 20 psec.As a rough comparison, a fixed dead-time ADC with a conversion time of about5 vsec has at a conversion address of 2048 about the same processing rate asa 450 MHz Wilkinson ADC.
For application in IHAA there is no specific preference for any of thesetypes. Wilkinson ADC1s are the more common and may show better linearity, butfixed dead-time ADC's have certain advantages at high count rate spectroscopy.The selection of an ADC also has to be done on the basis of input character-istics (important when the amplifier has to be operated at long timeconstants), several output options like dead time, busy, inhibit signals(required for hardware dead-time and pile-up corrections), and setting optionslike channel offset (important in many adjustment experiments with lowenergy/channel settings), conversion range , zero level control, gating, andoptions for interfacing with MCAs or computer systems.
72
5.3.6. AUXILIARY ELECTRONICS
a. PULSE GENERATORS
When during the measurement the count rate does not change due to decay, deadtime can be corrected for using the pulser method [iei/iB2]. Pulses from aconstant frequency tail pulse generator are fed into the test input of thepreamplifier. The pulses thus follow the same signal processing as thedetector signals, and are subject to the same total system dead time. In they-ray spectrum a peak will be observed, which area can be used to calculatethe live time. Of course, the amplitude of the pulser is thus chosen that thepeak shows up in the spectrum in a region whi ch is not crowded by -y- raylines (e.g., between 1900 and 2000 keV) .
It is important that the pulses from the pulse generator have shapes which arevery similar to the detector signals, in particular fall times have to matchto prevent large undershoots in the output signal of the main amplifier. Asan example, for coaxial detector systems, fall tunes as large as 1000 - 2000ysec are required. Many commercially available pulse generators providepulses with shorter maximum fall times. In some models this value cansometimes be enlarged somewhat by increasing the output capacitance in themodule. Pulses from a pulse generator will slightly degrade the total systemresolution; therefore any spectrometer setting or resolution check should bedone with the pulse generator disconnected.
Another advantage of applying pulses from a pulse generator to aspectrometer is that a small increase in system noise by electronicinterferences more easily be observable from an increase in the narrow pulserpeak width than from variations in the width of the y-ray lines.
b. SPECTRUM STABILIZERS
Digital spectrum stabilizers may be useful for applications in which highaccuracy measurements are required over long counting times (e.g. , as theyoccur when measuring natural radioactivity) . The stabilizer functions bymonitoring two naturally occurring peaks in the spectrum, by preference a lowand a high-energy peak. After the initial peak positions have been set, thestabilizer continuously will alter ADC conversion gain and zero level in orderto keep the two peaks at the preset positions, in order to correct any driftin the electronics. Application in INAA depends on stability requirements,
73
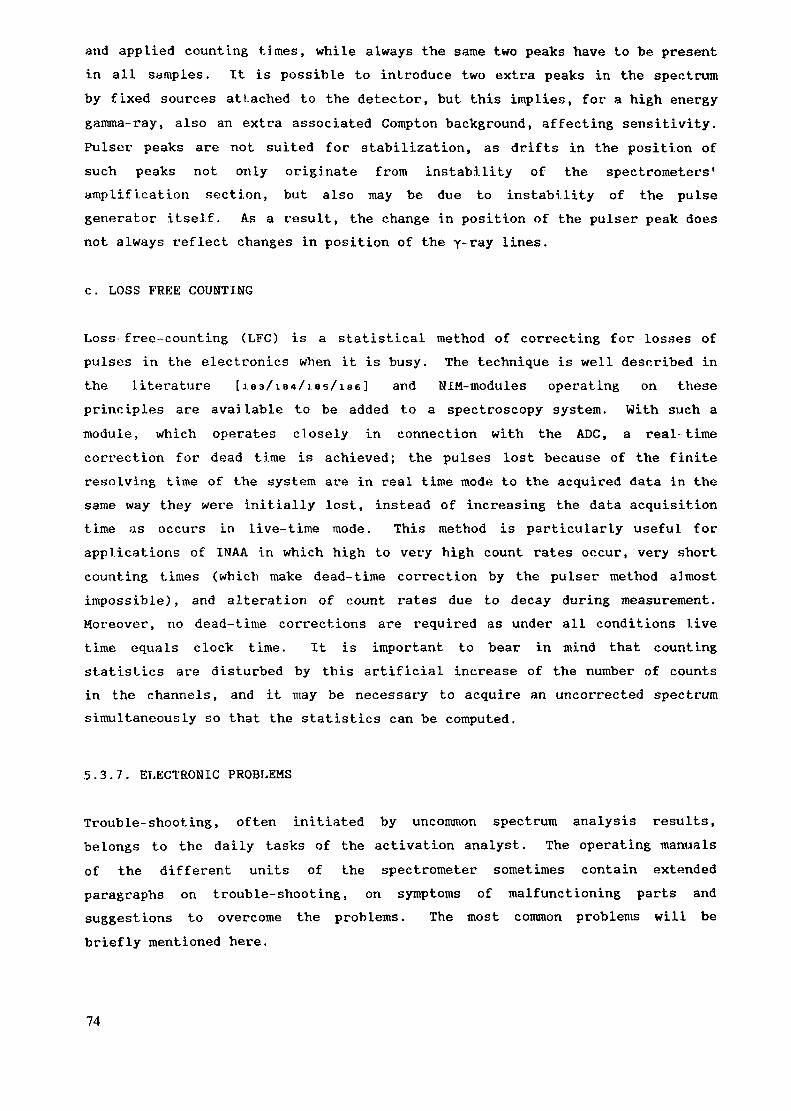
and applied counting times, while always the same two peaks have to be presentin all samples. It is possible to introduce two extra peaks in the spectrumby fixed sources attached to the detector, but this implies, for a high energygamma-ray, also an extra associated Compton background, affecting sensitivity.Pulser peaks are not suited for stabilization, as drifts in the position ofsuch peaks not only originate from instability of the spectrometers'amplification section, but also may be due to instability of the pulsegenerator itself. As a result, the change in position of the pulser peak doesnot always reflect changes in position of the y-ray lines.
c. LOSS FRKE COUNTING
Loss free-counting (LFC) is a statistical method of correcting for losses ofpulses in the electronics when it is busy. The technique is well described inthe literature [ les/is-j/ias/iae] and NIM-modules operating on theseprinciples are avaj table to be added to a spectroscopy system. With such amodule, which operates closely in connection with the A.DC, a real-timecorrection for dead time is achieved; the pulses lost because of the finiteresolving time of the system are in real time mode to the acquired data in thesame way they were initially lost, instead of increasing the data acquisitiontime as occurs in live-time mode. This method is particularly useful forapplications of INAA in which high to very high count rates occur, very shortcounting times (which make dead-time correction by the pulser method almostimpossible), and alteration of count rates due to decay during measurement.Moreover, no dead-time corrections are required as under all conditions livetime equals clock time. It is important to bear in mind that countingstatistics are disturbed by this artificial increase of the number of countsin the channels, and it may be necessary to acquire an uncorrected spectrumsimultaneously so that the statistics can be computed.
5.3.7. ELECTRONIC PROBLEMS
Trouble-shooting, often initiated by uncommon spectrum analysis results,belongs to the daily tasks of the activation analyst. The operating manualsof the different units of the spectrometer sometimes contain extendedparagraphs on trouble-shooting, on symptoms of malfunctioning parts andsuggestions to overcome the problems. The most common problems will bebriefly mentioned here.
74
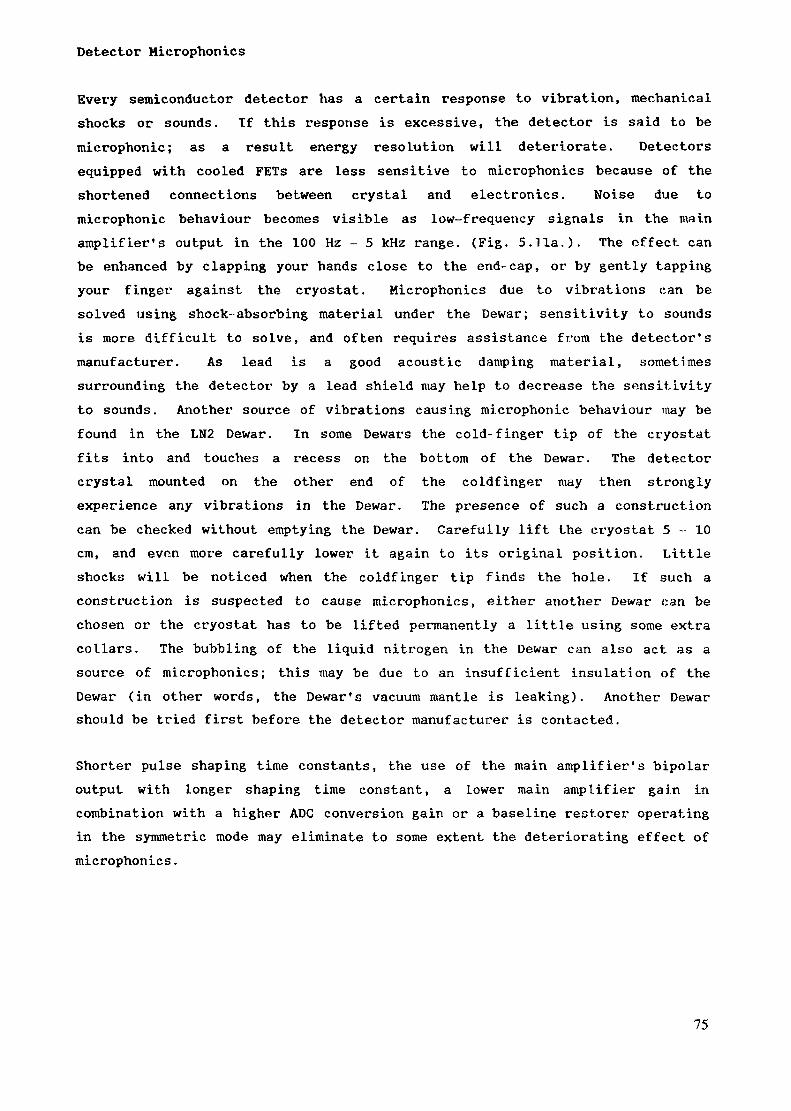
Detector Microphonics
Every semiconductor detector has a certain response to vibration, mechanicalshocks or sounds. Tf this response is excessive, the detector is said to bemicrophonic; as a result energy resolution will deteriorate. Detectorsequipped with cooled FETs are less sensitive to microphonics because of theshortened connections between crystal and electronics. Noise due tomicrophonic behaviour becomes visible as low-frequency signals in the mainamplifier's output in the 100 Hz - 5 kHz range. (Fig. 5.lia.). The effect canbe enhanced by clapping your hands close to the end-cap, or by gently tappingyour finger against the cryostat. Microphonics due to vibrations can besolved using shock-absorbing material under the Dewar; sensitivity to soundsis more difficult to solve, and often requires assistance from the detector'smanufacturer. As lead is a good acoustic damping material, sometimessurrounding the detector by a lead shield may help to decrease the sensitivityto sounds. Another source of vibrations causing microphonic behaviour may befound in the LN2 Dewar. In some Dewars the cold-finger tip of the cryostatfits into and touches a recess on the bottom of the Dewar. The detectorcrystal mounted on the other end of the coldfinger may then stronglyexperience any vibrations in the Dewar. The presence of such a constructioncan be checked without emptying the Dewar. Carefully lift the cryostat 5-10cm, and even more carefully lower it again to its original position. Littleshocks will be noticed when the coldfinger tip finds the hole. If such aconstruction is suspected to cause microphonics, either another Dewar can bechosen or the cryostat has to be lifted permanently a little using some extracollars. The bubbling of the liquid nitrogen in the Dewar can also act as asource of microphonics; this may be due to an insufficient insulation of theDewar (in other words, the Dewar's vacuum mantle is leaking). Another Dewarshould be tried first before the detector manufacturer is contacted.
Shorter pulse shaping time constants, the use of the main amplifier's bipolaroutput with longer shaping time constant, a lower main amplifier gain incombination with a higher ADC conversion gain or a baseline restorer operatingin the symmetric mode may eliminate to some extent the deteriorating effect ofmicrophonics.
75
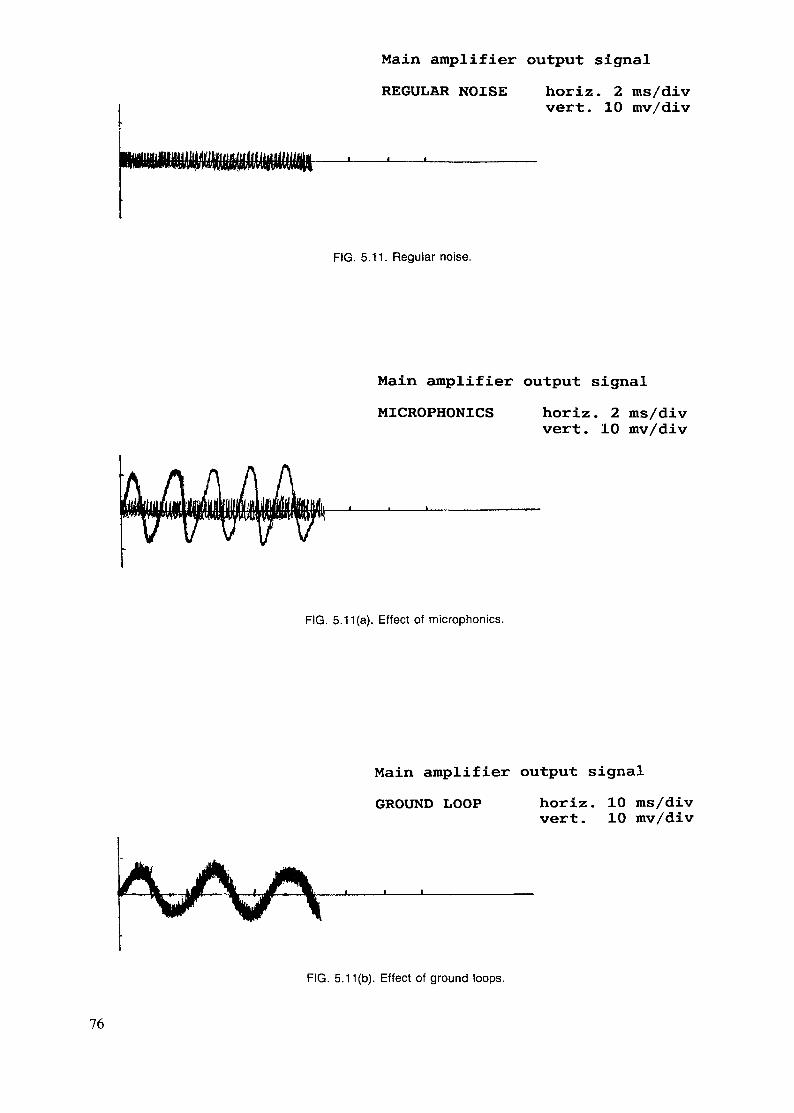
Main amplifier output signalREGULAR NOISE horiz. 2 ms/div
vert. 10 mv/div
FIG. 5.11. Regular noise.
Main amplifier output signalMICROPHONICS horiz. 2 ms/div
vert. 10 mv/div
FIG. 5.11 (a). Effect of microphonics.
Main amplifier output signalGROUND LOOP horiz. 10 ms/div
vert. 10 mv/div
FIG. 5.11(b). Effect of ground loops.
76
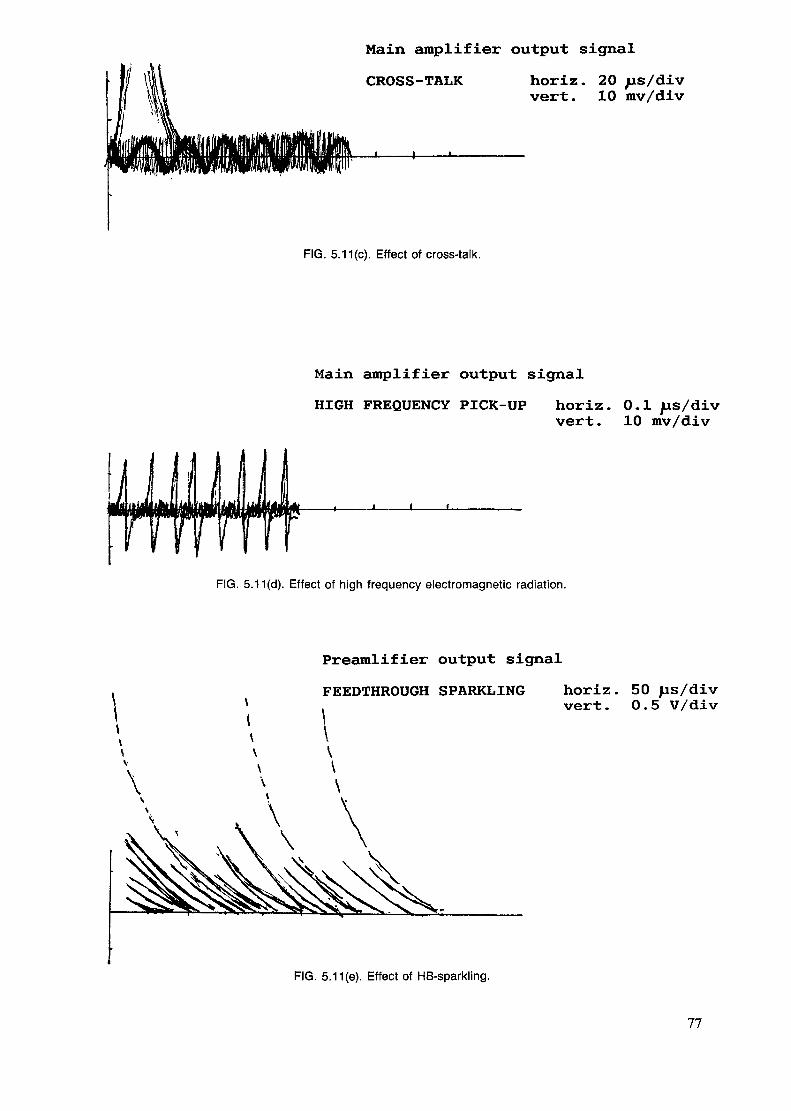
Main amplifier output signalCROSS-TALK horiz. 20 jis/div
vert. 10 mv/div
FIG. 5.11(c). Effect of cross-talk.
Main amplifier output signalHIGH FREQUENCY PICK-UP horiz. 0.1 /is/div
vert. 10 mv/div
FIG. 5.11(d). Effect of high frequency electromagnetic radiation.
Preamlifier output signalFEEDTHROUGH SPARKLING horiz. 50 /Us/div
vert. 0.5 V/div
FIG. 5.11(e). Effect of HB-sparkling.
77
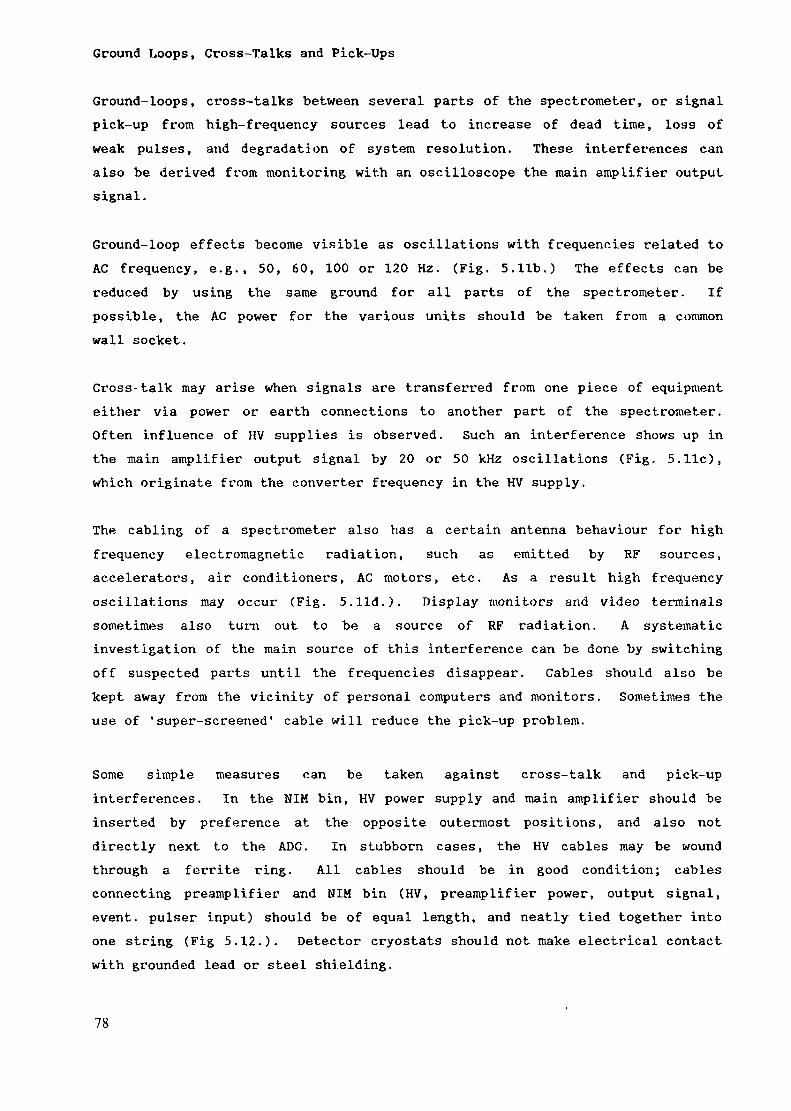
Ground Loops, Cross-Talks and Pick-Ups
Ground-loops, cross-talks between several parts of the spectrometer, or signalpick-up from high-frequency sources lead to increase of dead time, loss ofweak pulses, and degradation of system resolution. These interferences canalso be derived from monitoring with an oscilloscope the main amplifier outputsignal.
Ground-loop effects become visible as oscillations with frequencies related toAC frequency, e.g., 50, 60, 100 or 120 Hz. (Fig. 5.lib.) The effects can bereduced by using the same ground for all parts of the spectrometer. Ifpossible, the AC power for the various units should be taken from a commonwall socket.
Cross-talk may arise when signals are transferred from one piece of equipmenteither via power or earth connections to another part of the spectrometer.Often influence of HV supplies is observed. Such an interference shows up inthe main amplifier output signal by 20 or 50 kHz oscillations (Fig. 5.11e),which originate from the converter frequency in the HV supply.
The cabling of a spectrometer also has a certain antenna behaviour for highfrequency electromagnetic radiation, such as emitted by RF sources,accelerators, air conditioners, AC motors, etc. As a result high frequencyoscillations may occur (Fig. 5.lid.). Display monitors and video terminalssometimes also turn out to be a source of RF radiation. A systematicinvestigation of the main source of this interference can be done by switchingoff suspected parts until the frequencies disappear. Cables should also bekept away from the vicinity of personal computers and monitors. Sometimes theuse of 'super-screened1 cable will reduce the pick-up problem.
Some simple measures can be taken against cross-talk and pick-upinterferences. In the NIM bin, HV power supply and main amplifier should beinserted by preference at the opposite outermost positions, and also notdirectly next to the ADC. In stubborn cases, the HV cables may be woundthrough a ferrite ring. All cables should be in good condition; cablesconnecting preamplifier and NIM bin (HV, preamplifier power, output signal,event, pulser input) should be of equal length, and neatly tied together intoone string (Fig 5.12.). Detector cryostats should not make electrical contactwith grounded lead or steel shielding.
78
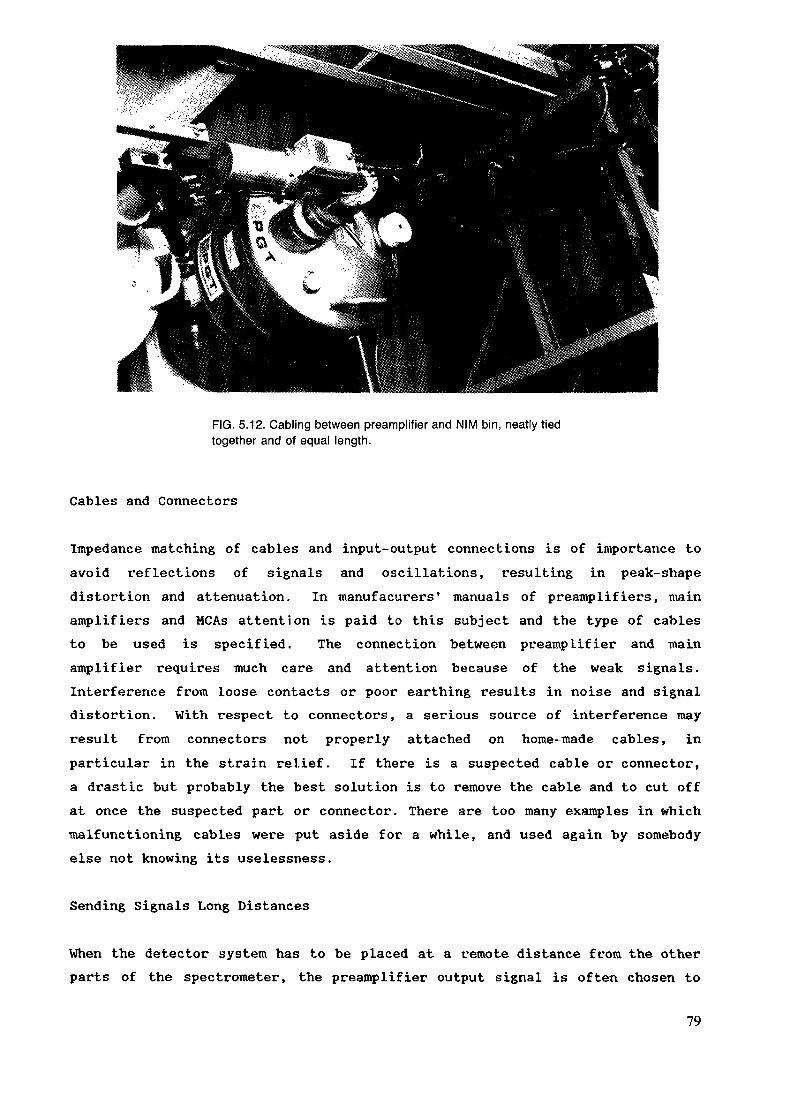
FIG. 5.12. Cabling between preamplifier and NIM bin, neatly tiedtogether and of equal length.
Cables and Connectors
Impedance matching of cables and input-output connections is of importance toavoid reflections of signals and oscillations, resulting in peak-shapedistortion and attenuation. In manufacurers' manuals of preamplifiers, mainamplifiers and MCAs attention is paid to this subject and the type of cablesto be used is specified. The connection between preamplifier and wainamplifier requires much care and attention because of the weak signals.Interference from loose contacts or poor earthing results in noise and signaldistortion. With respect to connectors, a serious source of interference mayresult from connectors not properly attached on home-made cables, inparticular in the strain relief. If there is a suspected cable or connector,a drastic but probably the best solution is to remove the cable and to cut offat once the suspected part or connector. There are too many examples in whichmalfunctioning cables were put aside for a while, and used again by somebodyelse not knowing its uselessness.
Sending Signals Long Distances
When the detector system has to be placed at a remote distance from the otherparts of the spectrometer, the preamplifier output signal is often chosen to
79
be transferred over long distances, because of the lack of space forinstalling a NIM-bin near the detector. Several preamplifiers are able totransfer the weak signals over distances as long as 150 m without significantloss of resolution. Attention has to be paid to termination of the connectionswith shunt resistors, to avoid reflections. The use of 'super-screened' cablewill reduce the problem of pick-up from outside interferences. Lessdifficulties may arise when transferring the main amplifier signal, but stilltermination of the connections might be necessary to avoid oscillations. Athigh counting rate the bipolar signal should be used to reduce peak drift.The digitized ADC signal can be transferred almost without any difficulty,although a booster module may be required for very long distances.
System Instability
Unstable electronics will result in either continuous or stepwise driftingpeaks. Careful observation of spectrum analysis results will indicate theoccurence of instability in time, before it becomes a big problem. Smallday-to-day shifts, peak broadening and uninterpretable peaks closely spaced toprominent peaks are the first indications.
* Gain Instability. Corrosion and dust in the spectrometer parts (mainamplifier, HV supply) cannot always be avoided. Sometimes it is sufficient toclean the contacts of switches, plugs and printed circuit boards. Cleaningcan best be done using pressurized air and a soft brush. 'Contact-cleanerspray' is useful for cleaning the moving parts of switches, but should not beused to clean electronic boards as sometimes an oily residue which remainsmay cause its own problems; methanol is a better choice. A typical weakcomponent in the main amplifier is the fine gain potentiometer. When in usefor a long time in the same setting, corrosion of the windings has beenobserved. Replacement by a new potentiometer or the use of a distinctdifferent combination of coarse gain and fine gain setting can help toovercome this problem.
* Temperature and Humidity Effects. Many laboratories do not have well-conditioned counting rooms or suffer from variations of temperature. Ashockwise change of a few degrees in ambient temperature may lead even forpremium amplifiers to measurable gain variations. The specifications asquoted by manufacturers with respect to temperature stability are given invery small numbers, thus giving a wrong impression on the practicalperformance. Note that a typical theoretical temperature stability
80
specification of, e.g. <0.0075%/ C still means that a one-degree change intemperature will shift a peak in channel number 4096 for 0.3 channel. If thetemperature cannot be kept sufficiently constant (+1 degree), the onlyworkable solution is to perform daily energy calibrations.
* Excessive humidity may cause difficulties at the detector side, inparticular at the preamplifier signal feedthroughs of the cryostat. This canbe checked by monitoring the main amplifier's output signal: HV sparking showsup as very large pulses on the baseline (Fig. 5.11e), which will decrease whenthe HV is lowered. Also the voltage level of the preamplifier's test jackwill show an unstable behaviour. Sometimes it will be necessary to clean thecryostats vacuum feedthrough. This is a tedious operation, and thepreamplifier's FET may easily be damaged. First switch off all power and waitfor at least 5 minutes to discharge all capacitors completely. Disconnect allcables from the preamplifier and remove the hood. It should be rememberedthat even through contact with skin acids the megohm resistors and highvoltage capacitors may be damaged. The feedthrough (glass or ceramic) can becleaned with methanol and tissue. Dry the feedthrough thoroughly with a hotair gun at moderate temperature, and be sure that no tissue threads are lefton the feedthrough. As mentioned before, covering of the preamplifier with aplastic bag with silica gel capsules may contribute to reducing condensation.Some manufacturers offer the possibility of extra treatment of thepreamplifier at the factory when it is known beforehand that the detector wi11be used in an atmosphere of relative high humidity.
In cold climate the air can be very dry in central heated houses. The lowhumidity may cause problems through static electricity. Sparks are easilycreated when touching the analyzer. These sparks may stop the microprocessorin the analyzer. Therefore humidifiers should be used in counting rooms. Indifficult cases electrically conducting carpets and tablecloths can be used todecrease the static electricity.
5.4 MULTICHANNEL PULSE HEIGHT ANALYZER (MCA)
5.4.1 PC-BASED SYSTEMS
For several years most of the functions required in a stand alone MCA havebeen realized through microprocessors incorporated into the MCA. It was soonrealized that instead of building separate systems, commercial microcomputers,
81
personal computers (PCs), could be used. This approach has several benefits:
Low cost because of mass production.
Reliability and good service almost everywhere because similarcomputers are used by many institutions in every country.
The same computer can be used for advanced data handling and also othercomputations while measuring.
Good availability of computer programs for gamma spectroscopy and otherpurposes. The reason for this is the standardization of PC operatingsystems.
The system thus comprises three parts: The ADC, a multichannel analyzer buffer(MCA buffer), and the computer. Depending on the manufacturer differentcombinations of these exist:
1. ADC+MCA buffer is one NIM-module;2. ADC4-MCA buffer is one card which can be inserted into the computer;3. ADC is a NIM module and the MCA buffer a computer card;4. ADC and MCA buffers are separate NTH modules.
Using a separate ADC has the advantage that the ADC can be chosen according tothe count rate requirements while the buffer is a standard device. All theMCA buffers include a microprocessor and memory, enabling an independentfunctioning of the MCA during acquisition.
The data memory available varies from 4K to 32K channels. The count perchannel capacity is always high, from 8.10 counts per channel upwards,usually more than what is needed in NAA. Both 100-450 MHz Wilkinson type and5-25 vis fixed time ADCs are used. Some systems support high count rateacquisition through real-time dead time and pulse pile up correction.Multiscaling units are also available. Normally four MCAs can be connected toone computer and through a mixer-router, up to four detectors to one ADC.
Data transfer to the computer is no problem when the MCA buffer is a computercard. Some of the NIM modules have a RS232C interface as standard, renderingthe data transfer unacceptably slow for many applications. In some analyzersan IEEE488 or similar interface is standard and in others optional. Thisenables a 8K spectrum to be transferred in 100 ms.
82
The MCA buffer microprocessor normally supports data acquisition and I/Ofunctions including display, controlled via the host computer. During dataacquisition the computer is free for control of other MCAs, analysis ofspectra on disc or for running any other program like word processing.
The standard software includes the MCA emulation program enabling control ofMCA and traditional operations like display, I/O, overlap, smooth, strip,transfer, energy calibration, ROI, and peak information, like centroid, FWHM,gross and net area within ROI. Optionally available are peak search, nuclideidentification, peak integration often with multiplet deconvolution. A fewNAA programs are available, but they are usually not very sophisticated.
Most of the MCAs are based on IBM XT, AT or System/2 compatible computers.Some manufacturers have also MCA:Buffers for DEC VAX computers.
When using a so-called IBM compatible computer it is important to assure thatthe degree of compatibility is high enough so that the combination reallyworks. This can be best assured by buying the whole system from one supplier.
Systems based on standard computers have the additional benefit of enablingeasy control of automated devices, like sample changers, and pneumatictransfer systems. Almost all standard software includes sample changercontrol. They also allow easy bookkeeping, data storage, reporting andconnection to networks of different kinds.
It is to be noted that the above is valid in 1988 when this text was writtenbut because of the fast technical development the information may be old in afew years.
5.4.2 MICROPROCESSOR-BASED MCAs
Conventional MCAs, where the counting functions are microprocessor-based, maytake one of three general forms, depending on where the data handling iscarried out: the 'stand-alone' analyser; the interfaceable system, where theMCA is connected to a separate computer for data processing; and the fullyintegrated system, where the MCA and computer are compatible in the analyseritself.
The stand-alone system, with its own central processor, can be a powerfulanalytical tool since it is designed specifically for spectroscopy. Thedisplay and acquitions system is tailor-made and the software is written to
83
operate on the particular system. However, the operating systems are notalways easily accessible so that it may be difficult to transfer informationin and out of the analyser. This means that it may be cumbersome to transferdata, such as weights from an electronic balance, from outside, into theanalyser. It also means that if NAA is to form part of a wider range ofanalytical facilities it may be difficult to integrate the stand-aloneanalyser into a laboratory processing system. On the other hand, thesestand-alone systems are designed specifically with the job of gamma-rayspectrometry and/or neutron activation analysis in mind. They can havemulti-user and multi-tasking facilities which support many ADCs and enablemore than one person to use the system at the same time, running a number ofjobs simultaneously. The result is a very powerful, self- contained analyser.
A computer-interfaceable system has the advantage that it can be used as anindependent multichannel analyser but may be connected to a separate computer,if required. This means that it is suitable for running small simple tasks,such as the routine analysis of one or two elements, but data can betransferred to a large computer for complicated spectral analysis. Inaddition all the standard software programmes for chemical data management canbe implemented and the NAA facility integrated into a wider analyticalfacility.
A compromise between the two types of MCAs described above is the integratedsystem, in which the data acquisition, storage, and computation are performedby a single hardware and software system which includes a standardminicomputer. The first generation of such systems, built around a singlepool of general memory for ADCs and computer, worked well but compromises inperformance and standardization have become less necessary as the price ofmemory and computers have decreased and as general-purpose operating systemshave become more capable. In more recent systems the ADCs collect data indedicated memory, which makes the MCA and computer functions independent. Theintegrated system is therefore as powerful as a stand-alone system in itsability to support multiple users simultaneously, with access to all thestatistical, database, and communications software. The advantage over theinterfaced system is that the spectral data can be viewed and manipulated likea stand-alone analyzer. An integrated system may be also the most suitable MCAfor the automated control of external devices such as pneumatic irradiationsystems and sample changers.
84
The choice of the MCA to use will depend on the nature of the NAA laboratory,how many people might wish to use it and what variety of analyses will becarried out. An important factor is how NAA is to be integrated into the workof NAA group and the reactor facility as a whole. Also important in thechoice of system and manufacturer is the degree of support which is availablefrom electronics engineers on site.
5.5 DATA PROCESSING
5.5.1. COMPUTERS AND INTERFACING
In NAA, gamma spectra are normally measured on 4096 or 8192 channels, although16384 channels are needed on occasion. The amount of data varies normallybetween a few counts and hundreds of thousands of counts per channel. Theamount of data makes manual interpretation time consuming. In additionseveral of the spectrum interpretation methods involve complicatedmathematics. Therefore computers are commonly used for storage andinterpretation of gamma spectrometric data.
There exists a multitude of computers of different size and performances andit is not within the scope of this book to give a comprehensive description ofwhat is available. Only a short discussion will be made and more detailedinformation should be sought in the relevant literature. The development ofcomputers has been extremely fast and today's microcomputer has the same orbetter performance than yesterday's minicomputers and last week's mainframecomputer.
Less than ten years ago most NAA calculations were performed on centralmainframe computers because computers, memory, and peripherals wereexpensive. With a few exceptions MCAs were not connected to mainframecomputers but the data was transferred via magnetic tape. The use of amainframe computer allows the use of large programmes and enough storagecapacity. There may be a problem in that the control of the programme islocated far from the measurement room. Some multichannel analyzers have beendesigned to work as terminals as well, enabling running the programmes fromthe analyzer itself.
In general, the use of a mainframe computer for spectrum analysis on largedata sets may be quite expensive, depending on the policy of the computercentre. It may be more cost effective for the NAA group to have its own
85
minicomputer. For most laboratories at present the economically attractivechoice is the use of a personal computer, particularly if the PC is part of alocal area network.
The kind of PC to choose is not very critical but some criteria should be keptin mind. The ultimate in performance is usually not needed, since real-timedata handling is performed by the MCA. Only after data accumulation has endedis the spectrum transfered to the computer memory, and usually to the harddisc as a data file. The spectrum analysis and NAA calculations are performedseparately from the data acquisition process.
The interfacing of old MCAs can be difficult and expensive. An expert hasalways to be consulted. All MCAs produced in the 1980s have commercialinterfaces and mostly commercial communication programmes for interfacing toone or several computer types. These should be used to ensure problem-freecommunication. The most common one is the RS232 bus which is cheap andreliable also over long distances. However, the slow transfer rate, maximum19,200 baud, corresponding to a transfer line of 30-80s per 4k spectrum,hampers its use in many instances. The IEEE 488 bus is very fast (350kBytes/s corresponding to a transfer time of about 50 ms for a 4k spectrum),but cannot be used over long distances. Therefore some local area networksystem, like Ethernet, has to be used if fast transfer over long distances isneeded. A drawback is high cost and complex software.
5.5.2 PROGRAMMES
Manufacturers of multichannel analyser systems usually provide fairlycomprehensive software for the operation of the system and microprocessor-based systems will have control and emulation software depending on the typeof MCA and the way it is integrated with the processor. The basic role of theMCA is to collect the counts into the appropriate channel addresses, recordthe live and dead times during the counting period, and present the data in asuitable form. All the additional software is designed for the calibration ofthe analyser and for the processing of the gamma ray spectra.
Calibration programmes include energy and efficiency calibrations. The energycalibration packages in commercial MCAs are based on counting referencesources and entering the data in the form of energy and corresponding channelnumber. The data, in the form of keV vs channel number, are stored as alinear or quadratic fit. Similarly the efficiency calibration is measured
86
using reference sources of known activity. In many systems, the informationthat is required for calibration with a reference source, such as half-Lifeand gamma-ray energies and intensities, are stored in a library provided bythe manufacturer. The user simply counts the sources and enters the activityon the date when the source was originally certified, together with themeasured count-rate. The system calculates the efficiency vs gamma-ray energyand stores the calibration constants, usually as a polynomial or spline fit.
The data is normally collected in the computer or MCA memory and transferredto storage disc at the end of the counting period for spectral analysis.However, simple print-out in the form of counts per channel or as regions ofinterest can be made from memory. Manipulation of the spectra can be quitesophisticated with options to expand regions and compare spectra, to smooth oradd and subtract spectra, to identify energy lines and to evaluate peakareas. In fact it is possible to carry out a full analysis of a spectrum inthe computer memory.
Any more complicated data handling, such as a peak search, is usually made onstored data. The peak search programme is one of the most important featuresof an analyser system and each manufacturer uses a different peak searchprogramme for location and evaluation of gamma-ray lines. Recently somecommercial peak search programmes have been modified for use on the PC-basedsystems; GeLiGam is now used in its new form of 'Minigam' on the EG & G Ortecsystem, Sampo has been converted by Aarnio [IB?] and is offered by Canberraas 'MicroSampo' and Nuclear Data has launched a micro-based system whichoperates with all their standard programmes from their large 'stand-alone'systems. A number of programs written for mainframes and minicomputers atuniversities and government laboratories are in use outside their originalhomes. Some examples are Gamanal [iss], Hypermet [199], and Teabags[190]. Only the latter of these include NAA functions. All these programsprovide adequate peak analysis for most NAA requirements and recentintercomparisons [191/192] of the programmes produced by the differentmanufacturers showed that they all gave very similar results.
Packages available in the commercial systems to compensate for losses in theelectronics of the counting system include dead time and pulse pile-upcorrections. In addition to these corrections there are interferencecorrections for the peak area evaluation similar to a spectrum strippingprogramme, where a clean peak is used to correct for an interference whichcannot be separated, knowing the ratio of the clean and interfering peak.
87
This type of correction can only be applied to peaks which are not resolved bythe peak search programme. If on occasions the programme is able to separatethe peaks, then the additional application of an interference correction willgive the wrong result. Neither can this correction be used where theinterference is due to a nuclear reaction producing the same nuclide.
Nuclide identification libraries are used to confirm the identity of the peaksby energy and intensity and in many cases the manufacturers providecomprehensive lists of gamma-ray energies. However, since the commercial MCAsystems are often designed with gamma-ray spectrometry, not NAA, in mind, somelists include fission products which are suited to the power station market.It is often more practical to build up one's own list of likely products.There are nuclide libraries available in the literature which are designed forneutron activation analysis, for example, the Tables included in the Appendix.
Most manufacturers now have a NAA package for quantitative analysis. Usuallythe NAA package uses the results of the peak search package, corrected fordecay and for weight, to compare counts in the sample with counts in astandard. NAA packages may lack the sophistication of the nuclideidentification programmes; for example, one commercial package averages theresults from all the standards for a particular element, a procedure which mayor may not be appropriate for a particular irradiation site. There areadditional refinements which are not available commercially, for example, fluxcorrection, a facility for flux monitor data, and for the use of comparators.
The manufacturers' software may require quite complex operations to givereliable data when analysis is carried out in an automated mode. Usually thesoftware allows a sequence of the commands to be entered via an editor and runas a job. The 'jobstreams' are adequate for most operations, if a littleinflexible when it comes to general applications.
5.6 AUTOMATION
5.6.1 NEED FOR AUTOMATION
If the NAA facility is to operate effectively it will almost certainly need tobe automated in some aspects of the procedure. The main reasons forautomation are speed, reliability, reproducibility, and saving in staff time.Aspects which are automated are most commonly the irradiation procedure andthe counting stage, although there are other possibilities such as the sample
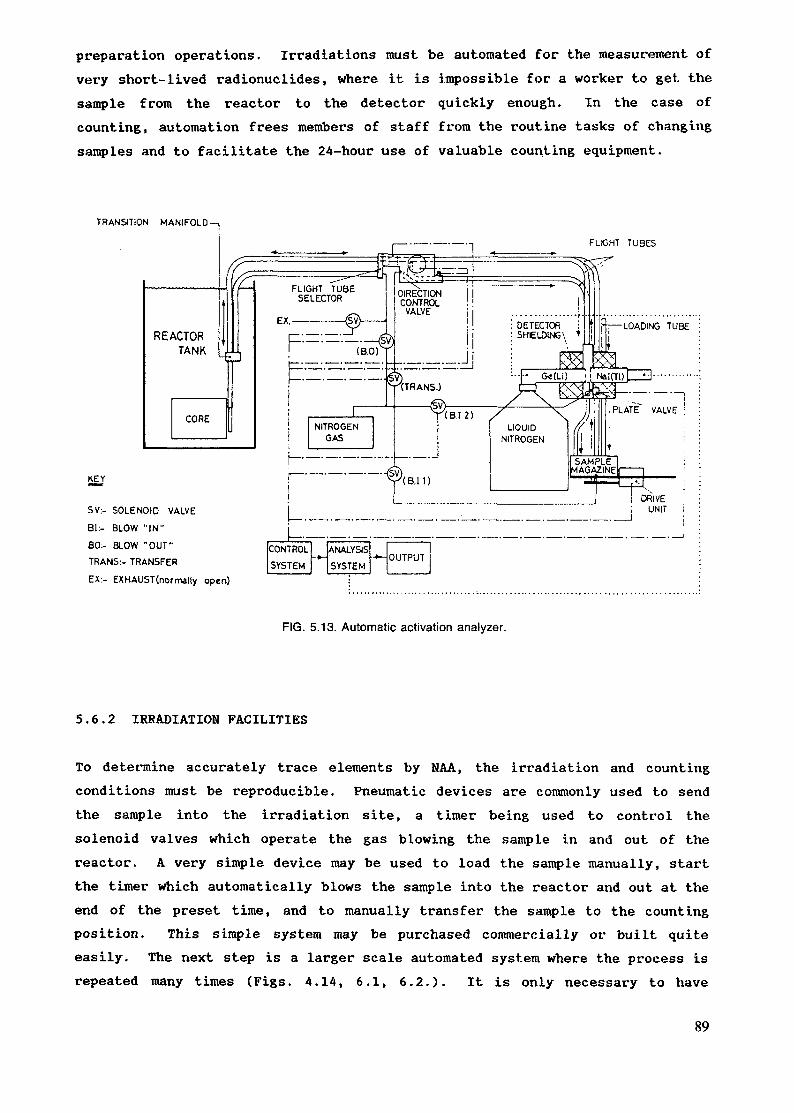
preparation operations. Irradiations must be automated for the measurement ofvery short-lived radionuclides, where it is impossible for a worker to get. thesample from the reactor to the detector quickly enough. In the case ofcounting, automation frees members of staff from the routine tasks of changingsamples and to facilitate the 24-hour use of valuable counting equipment.
TRAN3TION MANIFOLD
FLIGHT TUBES
REACTORTANK
CORE
(B.O)
1DETECTOR iSHIELDING \ *
\
Fjj — LOADING TUBE
KEY
SV:- SOLENOID VALVE
81 :- BLOW "IN"
80:- BLOW "OUT"
TRANS:- TRANSFER
EX:- EXHAUST(normally open)
FIG. 5.13. Automatic activation analyzer.
5.6.2 IRRADIATION FACILITIES
To determine accurately trace elements by NAA, the irradiation and countingconditions must be reproducible. Pneumatic devices are commonly used to sendthe sample into the irradiation site, a timer being used to control thesolenoid valves which operate the gas blowing the sample in and out of thereactor. A very simple device may be used to load the sample manually, startthe timer which automatically blows the sample into the reactor and out at theend of the preset time, and to manually transfer the sample to the countingposition. This simple system may be purchased commercially or built quiteeasily. The next step is a larger scale automated system where the process isrepeated many times (Figs. 4.14, 6.1, 6.2.). It is only necessary to have
89
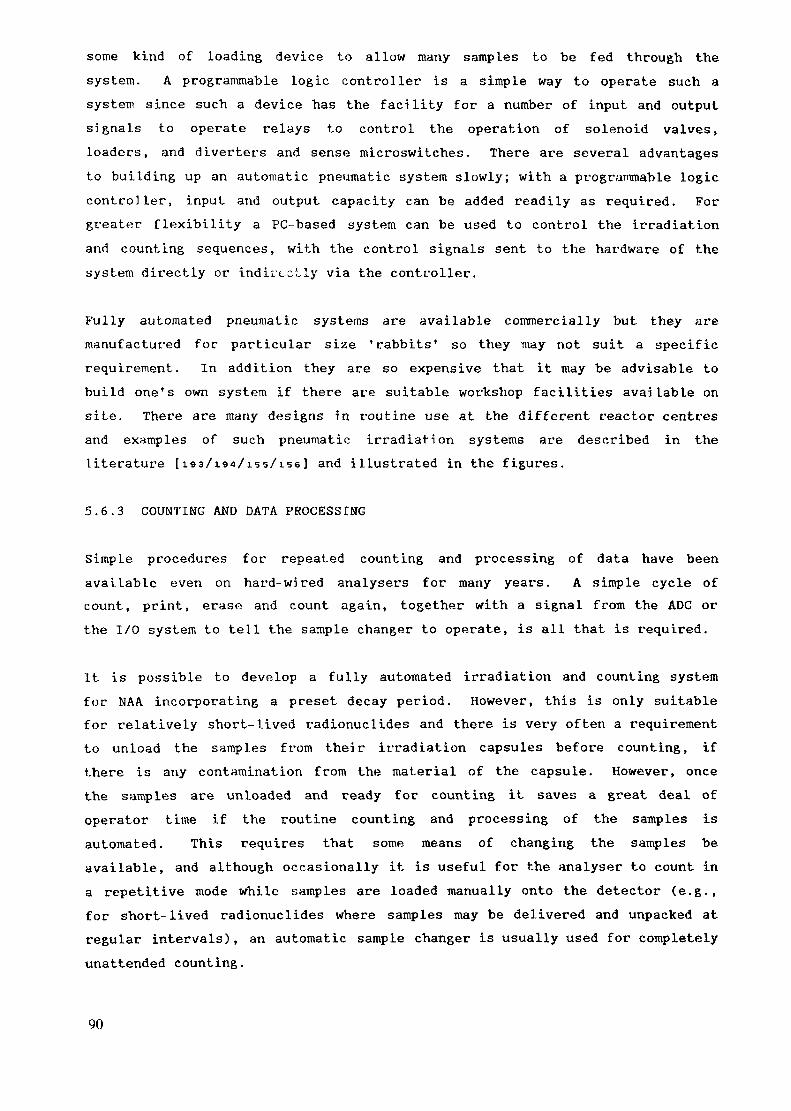
some kind of loading device to allow many samples to be fed through thesystem. A programmable logic controller is a simple way to operate such asystem since such a device has the facility for a number of input and outputsignals to operate relays to control the operation of solenoid valves,loaders, and diverters and sense microswitches . There are several advantagesto building up an automatic pneumatic system slowly; with a programmable logiccontroller, input and output capacity can be added readily as required. Forgreater flexibility a PC-based system can be used to control the irradiationand counting sequences, with the control signals sent to the hardware of thesystem directly or indirectly via the controller.
Fully automated pneumatic systems are available commercially but they aremanufactured for particular size 'rabbits' so they may not suit a specificrequirement. In addition they are so expensive that it may be advisable tobuild one's own system if there are suitable workshop facilities available onsite. There are many designs in routine use at the different reactor centresand examples of such pneumatic irradiation systems are described in theliterature [ les/ia-j/iss/ise] and illustrated in the figures.
5.6.3 COUNTING AND DATA PROCESSING
Simple procedures for repeated counting and processing of data have beenavailable even on hard-wired analysers for many years. A simple cycle ofcount, print, erase and count again, together with a signal from the ADC orthe I/O system to tell the sample changer to operate, is all that is required.
It is possible to develop a fully automated irradiation and counting systemfor NAA incorporating a preset decay period. However, this is only suitablefor relatively short-lived radionuclides and there is very often a requirementto unload the samples from their irradiation capsules before counting, ifthere is any contamination from the material of the capsule. However, oncethe samples are unloaded and ready for counting it saves a great deal ofoperator time if the routine counting and processing of the samples isautomated. This requires that some means of changing the samples beavailable, and although occasionally it is useful for the analyser to count ina repetitive mode while samples are loaded manually onto the detector (e.g.,for short-lived radionuclides where samples may be delivered and unpacked atregular intervals), an automatic sample changer is usually used for completelyunattended counting.
90
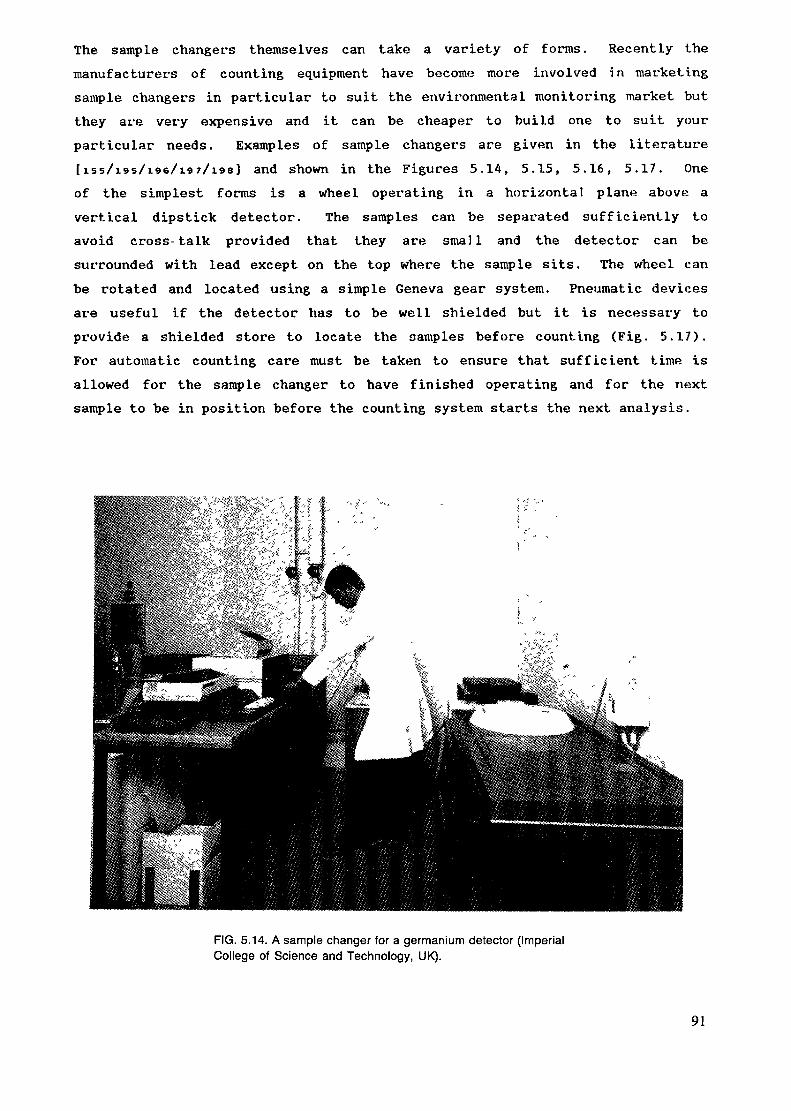
The sample changers themselves can take a variety of forms. Recently themanufacturers of counting equipment have become more involved in marketingsample changers in particular to suit the environmental monitoring market butthey are very expensive and it can be cheaper to build one to suit yourparticular needs. Examples of sample changers are given in the literature[iss/195/196/197/198] and shown in the Figures 5.14, 5.15, 5.16, 5.17. Oneof the simplest forms is a wheel operating in a horizontal plane above avertical dipstick detector. The samples can be separated sufficiently toavoid cross-talk provided that they are small and the detector can besurrounded with lead except on the top where the sample sits. The wheel canbe rotated and located using a simple Geneva gear system. Pneumatic devicesare useful if the detector has to be well shielded but it is necessary toprovide a shielded store to locate the samples before counting (Fig. 5.17).For automatic counting care must be taken to ensure that sufficient time isallowed for the sample changer to have finished operating and for the nextsample to be in position before the counting system starts the next analysis.
FIG. 5.14. A sample changer for a germanium detector (ImperialCollege of Science and Technology, UK).
91
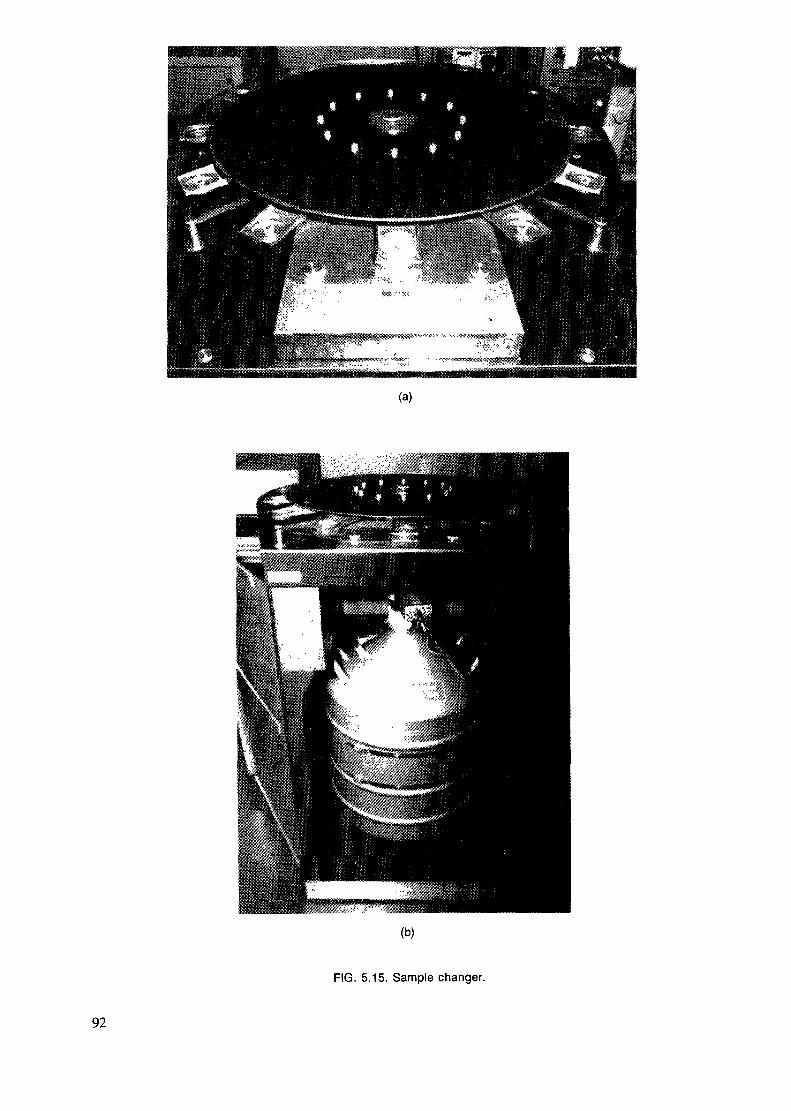
(a)
(b)
FIG. 5.15. Sample changer.
92
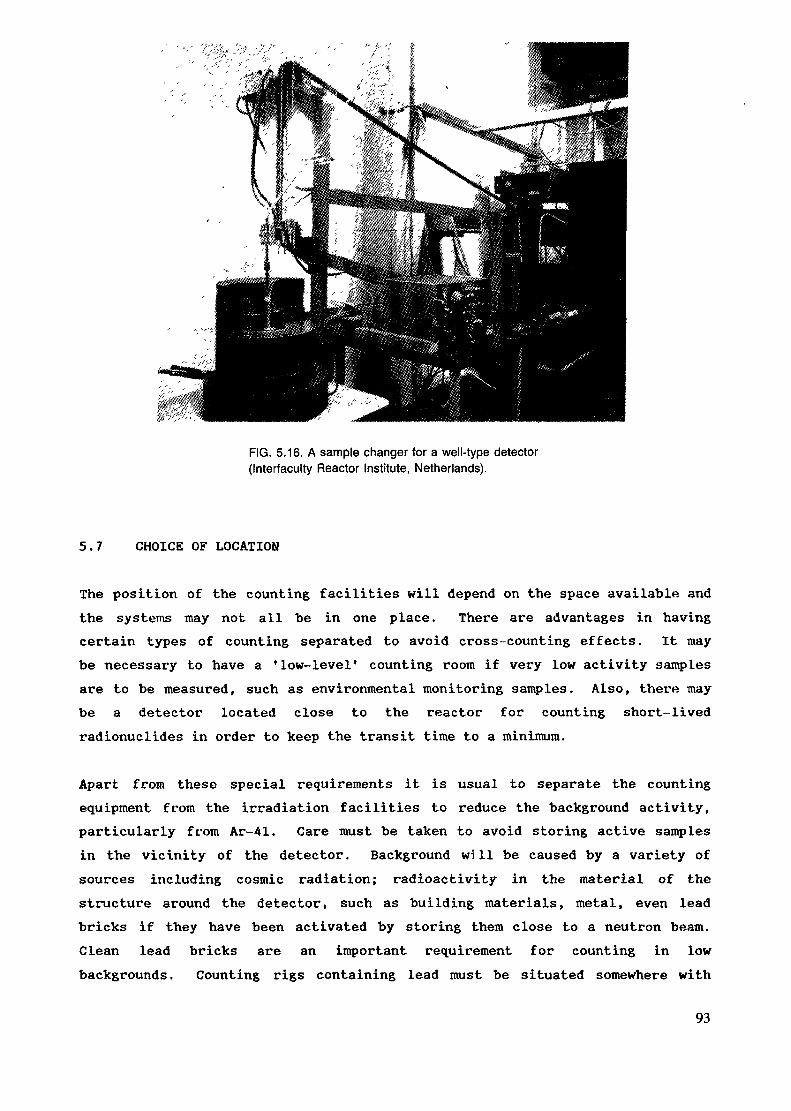
FIG. 5.16. A sample changer for a well-type detector(Interfaculty Reactor Institute, Netherlands).
5.7 CHOICE OF LOCATION
The position of the counting facilities will depend on the space available andthe systems may not all be in one place. There are advantages in havingcertain types of counting separated to avoid cross-counting effects. It maybe necessary to have a 'low-level* counting room if very low activity samplesare to be measured, such as environmental monitoring samples. Also, there maybe a detector located close to the reactor for counting short-livedradionuclides in order to keep the transit time to a minimum.
Apart from these special requirements it is usual to separate the countingequipment from the irradiation facilities to reduce the background activity,particularly from Ar-41. Care must be taken to avoid storing active samplesin the vicinity of the detector. Background will be caused by a variety ofsources including cosmic radiation; radioactivity in the material of thestructure around the detector, such as building materials, metal, even leadbricks if they have been activated by storing them close to a neutron beam.Clean lead bricks are an important requirement for counting in lowbackgrounds. Counting rigs containing lead must be situated somewhere with
93
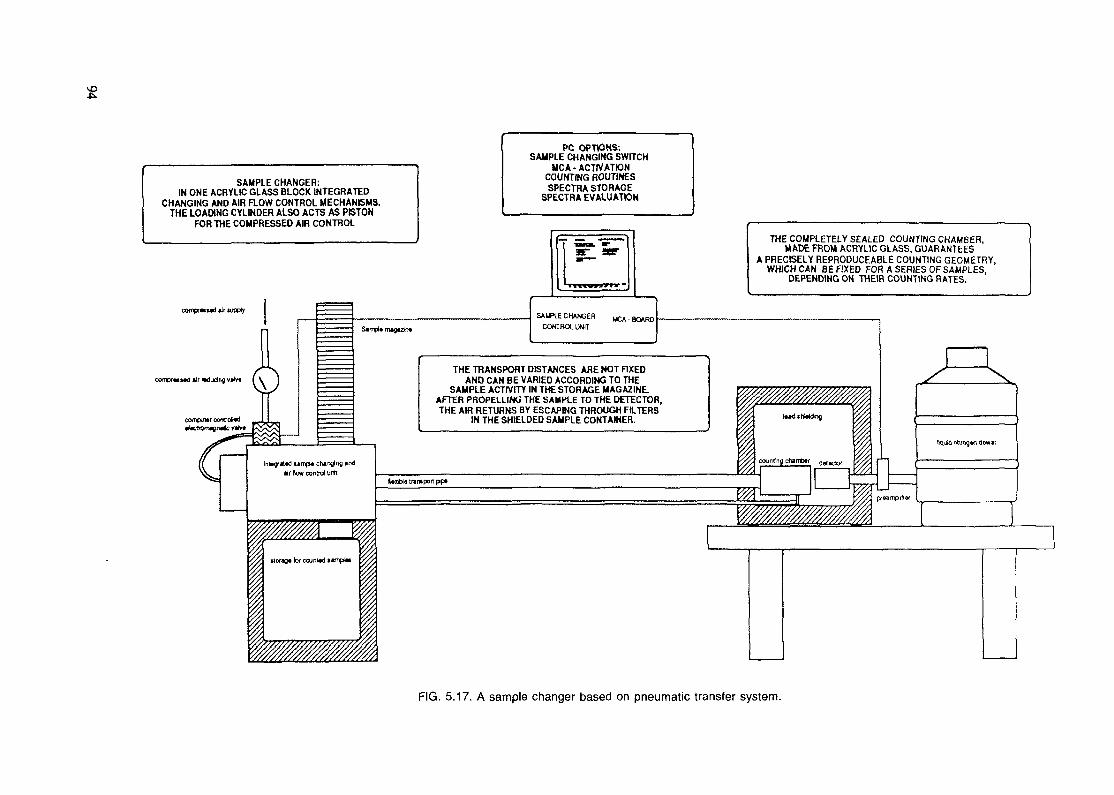
SAMPLE CHANGEH:IN ONE ACRYLIC GLASS BLOCK INTEGRATED
CHANGING AND AIR ROW CONTROL MECHANISMS.THE LOADING CYLINDER ALSO ACTS AS PISTON
FOR THE COMPRESSED AIR CONTROL
PC OPTIONS-.SAMPLE CHANGING SWITCH
MCA-ACTIVATIONCOUNTING ROUTINESSPECTRA STORAGE
SPECTRA EVALUATION
comprM»«d »It MJudng
Sarrçl* nuguin«SAIR.E CHANGER
CONTROL UNIT
THE TRANSPORT DISTANCES ARE NOT FIXEDAND CAN BE VARIED ACCORDING TO THE
SAMPLE ACTIVITY IN THE STORAGE MAGAZINE.AFTER PROPELLING THE SAMPLE TO THE DETECTOR,THE AIR RETURNS BY ESCAPING THROUGH FILTERS
IN THE SHIELDED SAMPLE CONTAINER.
« tnntport pp«
THE COMPLETELY SEALED COUNTING CHAMBER,MADE FROM ACRYLIC GLASS, GUARANTEES
A PRECISELY REPRODUCEABLE COUNTING GEOMETRY,WHICH CAN BE FIXED FOR A SERIES OF SAMPLES,
DEPENDING ON THEIR COUNTING RATES.
FIG. 5.17. A sample changer based on pneumatic transfer system.
strong floor supports and it is convenient to have the room on the groundfloor to make it easier to move the heavy equipment about. Care must be takento ensure that there is no danger of contamination of the counting systemitself with the samples that are being counted. It is sensible to have someprotecting material between the sample and the detector and usually this willbe incorporated into a spacer device to ensure reproducible sample to detectordistances. The sample holders should be manufactured from a material that iseasily cleaned, such as Perspex, and checked for contamination on a regularbasis.
Since liquid nitrogen is required for the operation of semiconductor detectorsit is useful to avoid transporting Dewars too far. As discussed in section5.3.7, it is often necessary to have air-conditioning to keep the equipment ata reasonable and constant temperature in an environment reasonably free ofdust and chemical fumes.
95
6. RELATED TECHNIQUES
6.1. DELAYED NEUTRON ACTIVATION ANALYSIS
Delayed neutron activation analysis (DNAA), can be used for the analysis ofoxygen and fissionable nuclides. The technique and the instrumentation neededhas been thoroughly described elsewhere [199/200/201/209/156] and will beonly briefly described here.
The method is based on a short irradiation followed by measurement of delayedneutrons, emitted with half-lives varying between 0.2 and 55's. Normally anirradiation time of 60's, decay time of 20's and measurement time of 60's areused. A pneumatic transfer system is used for irradiation and the delayedneutrons are counted in a device comprising several He or BFdetectors in a moderator of paraffin or polyethylene. Because of itssimplicity, the whole procedure is easy to automate and completely automaticanalyzers with sample changer, pneumatic transfer system, measurementelectronics and computer are described [ise/aos]. These analyzers bothirradiate, measure and calculate the results automatically (Figs. 6.1, 6.2).
The method is most commonly used for the analysis of uranium in geologicalsamples but also health physics applications are known. An example of acompetitive application is the use of delayed neutron counting for uraniumdetermination in urine. This can be favourably used as a routine monitoringtechnique because it is very rapid.
The method is specific to uranium when natural samples are irradiated withthermal neutrons. When a mixed reactor spectrum is used thorium interferessomewhat when in excess to uranium. Using a combination of thermal andepithermal activation both uranium and thorium can be analyzed, although thethorium analysis is not very sensitive or accurate [204/153]. For uranium,detection limits between a few ppb and 0.03 ppm have been reported.
The method is very much used because it is rapid and cheap. 300 samples perday can be easily analyzed.
96
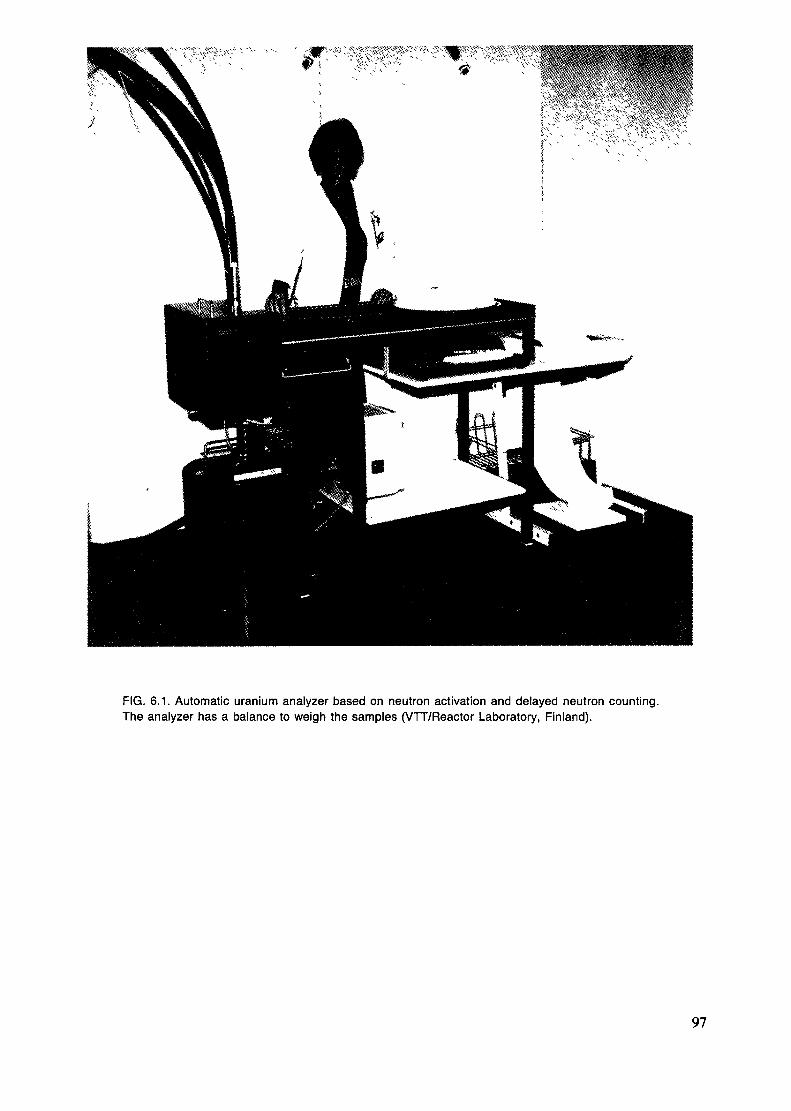
FIG. 6.1. Automatic uranium analyzer based on neutron activation and delayed neutron counting.The analyzer has a balance to weigh the samples (VTT/Reactor Laboratory, Finland).
97
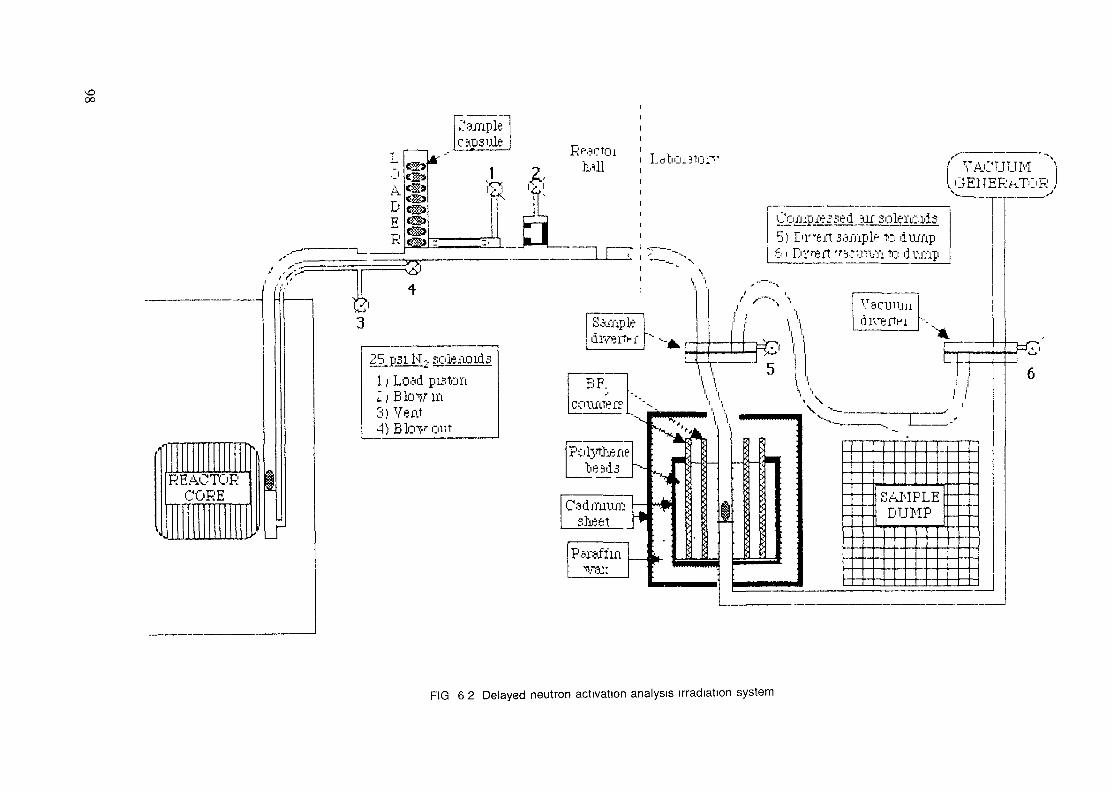
REACTORCORE
ACUUM
e; ged air solenoids5) E'r'ert s'ajnple to dump6 1 D i ' e r t a c u i v n to
25. pu H.2 so le f to id. 31 1 Load piston
3) Vent
BF._'
ccninter?
|_^ejid
Csdmivunsheet
Paraffinva::
\ \\ x:
SAMPLEDUMP
FIG 6 2 Delayed neutron activation analysis irradiation system
6.2. PROMPT-GAMMA NEUTRON ACTIVATION ANALYSIS
With the development of large high-resolution gamma-ray detectors with goodefficiency and peak/Compton ratios at high energy, the use of promptneutron-capture gamma rays as a method of elemental analysis has becomepractical as a complementary technique to T.NAA. Prompt gamma-ray neutronactivation analysis (PGNAA) is particularly useful for determining elementswhich absorb neutrons but do not produce radioactive products in doing so.Nuclear parameters and the abundances of the elements in common matrices aresuch that PGNAA finds its greatest applicability in the determination ofnonmetals that form the major and minor elements of common matrices (H, C, N,Si, P, S), or trace elements with high thermal capture cross-sections (B, Cd,Gd) that may be poorly determined by other techniques.
The application of PGNAA as a routine method of elemental analysis has beenpursued todate at only a few laboratories on a full-time basis (for recentreviews see [aos/aoe]), partly because of the need for continuing access toa reactor neutron beam. The sensitivity of the method (cps/mg) for mostelements is not so good as conventional neutron activation, limiting mostroutine applications to the determination of the few elements just mentioned.Irradiation times of several hours are required for most samples in which manyelements are to be measured, hence the throughput is low because only onesample can be irradiated and measured at a time. The low sensitivity of PGNAAis not due to a low neutron capture rate, but to a low detection efficiencyfor the analytical gamma rays due to the high energy of capture gammas, thecomplex spectra that result, the high counting rate from hydrogen in matricescontaining this element, and the necessary bulk of active and passiveshielding around the detector. Moving the detector closer to the sampleincreases the efficiency, but at the cost of higher background andnonlinearity due to high counting rate.
6.3. MEASUREMENT OF ENVIRONMENTAL RADIOACTIVITY
The availability of y-ray spectrometers in an INAA laboratory, and theexperience with interpretation of y-ray spectra facilitates implementationinto an environmental research program of monitoring programs on naturalradioactivity (e.g., from coal-burning plants, or mining activities), orradioactivity from fall-out, nuclear reactor waste and accidental releases.Although actually not belonging to INAA applications, it might be consideredwhen thinking of making a laboratory of more use for society. An example of
99

this is the situation after the Chernobyl accident. The sudden need formeasurement of radioisotopes in the environment and food saturated theavailable instruments of most environmental radioactivity groups in Europe.Therefore the NAA research groups took over a part, and in some countries thegreatest part, of the responsibility to measure food and other products.
100
7. MAKING NAA AVAILABLE TO THE SCIENTIFIC AND TECHNICAL COMMUNITY
7.1 IDENTIFICATION OF POSSIBLE CONSUMERS
In attempting to identify potential consumers of activation analysis servicesa variety of factors must be taken into account. These will include thenature of the reactor being used and the irradiation facilities available,counting facilities available for use, industrial base and importance of thatparticular industry to the country as well as political considerations.
The irradiation facilities and reactor fluxes available may be important ininfluencing which potential consumers should be approached. If the reactorhas the ability of irradiating large volumes of samples on a routine basis(i.e., the schedule of the reactor consistently provides irradiations at leastseveral days every two or three weeks) it may be possible to operate on aservice basis to industries like mineral exploration. If on the other hand,the reactor only has the capacity of irradiating small numbers of samplesirregularly, it would probably be a better idea to approach consumers withsmall volume demand, more on a research or co-operative effort.
The industrial base of the country can determine who are the potentialconsumers. For example, if there is no advanced electronics materialindustrial base there will not be any local consumers in that particularfield. If, however, agriculture is an important industry, this group is apotential consumer. Political considerations are also important. If thereactor is located at a university, it is obviously in the best interests ofthe university to support research at university departments. If fundingcomes from government departments, it would be advantageous to supportgovernment research as well. Generally it is useful to show that there areconsumers in all aspects of government, university and industry.
It is important when beginning to provide analytical services that oversellingof services or overstating the capabilities do not occur. This will tend toprovide the analytical technique and the laboratory with a bad reputation,which once achieved is difficult to overcome. The activation laboratory isessentially now acting as a commercial facility inasmuch as it is going toserve the needs of its clients. To do this, it is important to find out aboutthe competition. Competing analytical techniques like atomic absorption,
101
X-ray fluorescence and inductively coupled plasma emission (ICP) spectrometrymay be able to solve the customers' problem more easily or cheaply if they arereadily available. It will usually be advantageous if the person selling theanalytical service has a little knowledge of the advantages and disadvantagesof the INAA technique versus the other analytical techniques.
Potential consumers of analytical services can be found in many places:universities, government establishments, research institutions, industry, andmedical institutions. Tn many instances the consumer will have a problem andmay make the approach to have INAA solve their problem if he knows thisservice is available. In most other instances the activation lab may have togo out and find the consumer. If the latter is the case, you must decide inwhat field or fields you are interested in approaching. This may be based onyour interests, political considerations or national priorities. Regardlessof how the market segment of interest is chosen, background information on thetypes of analyses this market segment is interested in should be done.
Generally, when an approach is made to the potential consumer it is useful toknow what can be done on particular matrices. For an example, let us say thatwe have targeted the geochemical field for application of the INAA technique.Within this market segment there are three potential sources of consumer.These include government establishments like the geological survey, thegeology department at university, mineral exploration companies or mineralexploration or processing research institutes.
A useful beginning is a literature survey on some past applications of theINAA technique to the field of interest. This information can be obtainedfrom the bibliography section of the Journal of Radioanalytical Chemistry orthe biennial compilation of Analytical Chemistry. We must note however thatmost papers listed are papers dealing with techniques rather thanapplications. In the field of geochemistry for example the use of INAA is nowwidespread and papers in most applied journals such as the Journal ofGeochemical Exploration deal with interpretation of results and not analyticalmethod. Once selected, suitable sample material should be located to try someirradiation and counting schemes to familiarize the analyst with what can bedone on particular matrices of interest. Reference materials provide knowncomposition to begin tests on. The National Institute of Standards andTechnology Catalogue of Standard Reference Materials, or the IAEA catalogue ofreference materials, also provides a good clue as to the various fields whichactivation analysis can support by providing a list of all the materials
102

people are interested in. Generally reference material programs will onlyproduce reference material where a demand is foreseen. In effect, they aredoing some of the market research for you.
Consumers in our other major field of application - environmental control -can also be found in the above-described market segments. Examples ofgovernmental consumers are the ministries of environmental health, of publichealth, of general welfare, of agriculture and their related researchinstitutes, and comparable county and municipal authorities. Data on traceelements play an ever more important role in formulating legal pollutionstandards, to their enforcement, and in the prosecution of violators.
It is important to realize that governmental research institutes often mayhave access to one or more trace element analysis techniques. Theiracceptance of INAA as an alternative technique will be stimulated by thespecific advantages (non-destructive nature, sensitivity, multi-elementcapability, analysis cost). However this will be balanced against turnaroundtime and the inadequacy of determining the ever popular element lead. Butoften the generally known and accepted good accuracy of INAA and the qualityassurance incorporated in the procedure might convince the potential consumer.Within the university market segment, environmental science oriented groupscan be found in the chemistry and biology departments. But also in thephysics and civil engineering departments there might be some interest in INAAservice, e.g., for problems related to waste-water or sewage treatmentstudies. The mining department might be interested in the role of INAA instudies of environmental impact of residual waste of mining activities.University groups tend to select their analytical technique of choicegenerally by taking the most appropriate one. The missing of data on leadwill often be solved by determination of this element by another technique.Nor is a short turnaround time of vital importance, although sometimes studentprojects are very tight. Multielement capability, large throughput and lowcost are key elements; analysis costs may be reduced if the involved groupsare actively participating in the analysis (e.g., weighing-in and preparingsamples for analysis).
In the third market segment - industry and others - consumers' organizationsare found, which may be interested in and consulted for use of INAA service toget an answer to their studies and problems on environmental pollution.Examples of industrial consumers are companies which specialize in wastemanagement and treatment, industries with strongly polluting waste streams
103
(coal-burning plants, waste incinerators, metallurgical industry). Demandsfor trace element analyses may be related not only because of eventual impactof the industrial activities, but also for environmental health control of theemployees (e.g., by urine, hair and blood analysis). For these consumers, notalways will the ultimate be asked of accuracy and sensitivity but multi-element capability and turnaround time are of importance. Industry will oftenexperience INAA as an economical attractive technique.
7.2 COLLECTING BACKGROUND INFORMATION AND IDENTIFICATION OF APPLICATIONS
The previous section gave some indication of identification of possibleconsumers depending upon the application chosen. Market research into thisapplication is important. The obvious place to start is the library wherebasic information can be found quickly. The next most useful sources ofinformation are the universities or government departments. In setting upmeetings with these people one should have a basic understanding of thepotential applications to discuss as a starting point. Once discussions takeplace it may become apparent which specific applications may be mostsuitable. Through all of this, the person doing the market research andidentification of applications should have a good understanding of the INAAtechnique and its potential.
7.3 CONSULTATION WITH POTENTIAL CONSUMERS
Once you have identified an application it is important to locate the consumerfor that application. Let us again assume that geochemistry has been targetedas an application and some basic research has been done on why the geologistneeds trace element data and what sort of analyses can be done on rocks byINAA. This, however, is only background information. It is going to be verydifficult to approach a geologist and tell him he needs trace element databefore you know his problem or field of interest in geology. For universityor government departments employing geologists it would be useful to obtain alist of people and their specialties or current research programs to decidewhere the first approach will be made. An alternate method would be to offerto be a guest lecturer discussing the analytical technique in general and someof the potential applications, advantages and disadvantages of the technique.This latter approach wi 11 tend to be useful in having people discuss how theanalytical technique can be useful to them.
104
Once interest is shown in the technique and its applications, it is usually agood idea to obtain some material to test the application. The quality ofresults obtained and speed of analysis are important to show what potentialthe technique has. Generally samples should be analyzed rapidly and theresults discussed with the consumer to see if the accuracy and precision aresufficient. Frequently the consumer may not require the best precision orsensitivity possible to solve the problem at hand and compromises to supportthe consumers' needs could significantly reduce costs and perhaps turnaroundtime.
7.4 MODES OF PROVIDING NAA SERVICES
Operating an activation analysis laboratory requires personnel, equipment, andthe funds to keep them in operation. There may be several alternative ways ofobtaining these resources, depending on how the laboratory is operated. Somelaboratories encourage access by anyone who has need for NAA facilities whilesome, for security or other reasons, permit work to be done only by permanentstaff. Some require all funds for projects to come from outside theinstitution, while some at the other extreme forbid extramural work.
There may still exist laboratories in which direct funding of research issufficient to support all the activities that the staff wish to pursue, butmost need to justify their work and budget to government agencies, institutedirectors, university administrations, paying clients, or (most often) acombination of these. In all laboratories of which we are aware, asubstantial and often dominant fraction of the work is "counting otherpeople's atoms", in Lenihan's phrase [207]. Real costs must be covered, butthe cost of NAA to the consumer of the data must be competitive. It isundesirable to provide unlimited analytical services free of charge to allcomers, even from within the parent institution. If there is no price then acustomer has no incentive to select his samples and think through his datainterpretation before the measurements are made, and the analyst has noincentive to improve the quality of the data. The result will certainly belarge quantities of bad data and a deservedly poor reputation for thelaboratory.
7.4.1 SCIENTIFIC COLLABORATION
In institutions with a strong commitment to research, the workers in an NAAlaboratory may function essentially as faculty members; that is, as
105
independent scientists whose primary function is to pursue basic or appliedresearch using NAA as a tool. Financial support may come from the generalfunds of a parent institution or from national or international grantingfoundations.
When the NAA laboratory has a certain amount of base funding from a parentinstitution, extramural support can take the form of cooperative scientificprojects with outside groups which have problems that are readily solved byNAA. The "payment" from outside the institution takes the form of a divisionof labor and benefits, with no money changing hands. This mode of operationis a satisfying way to demonstrate to both analysts and users the usefulnessof NAA in a project. Particularly in the beginning stages of a collaboration,the outside institution may select and prepare samples while the bulk of theanalytical work is done by the NAA staff. As the project evolves, all theparticipants begin to learn each other's fields. An important part of thepayment is coauthorship of publications, which is a sign to the participantsand supervisors alike of the success of the work, and which may be expected tolead to further problem-solving projects in related fields of application. Alater stage of this relationship is to apply for external financing of theproject, divided between the participating institutions in relation to theirexpenses. This collaborative mode is unquestionably a drain on resources froman actuarial point of view, and can be followed to a large extent only ifanalysts are considered scientific professionals with responsibilities towardfurthering the state of the art.
7.4.2 PAYMENT IN KIND
The guest may provide a more tangible contribution by supplying equipment orsemi-permanent staff to the NAA laboratory for his program. Particularlyproductive relationships have been set up between analysts and manufacturersof counting and computer equipment. The laboratory may get the use of thebest new equipment, while the manufacturer obtains in return the advice ofskilled users of his products in real-life applications. Training of theguest's staff members in the host's standard procedures will be necessary inproportion as the laboratory work is taken over by the guest.
7.4.3 MULTI-USER CENTER
An approach to an efficient use of the potential of an NAA laboratory withoutexpanding the size of the permanent staff can be found by encouraging and
106
assisting scientists in other fields to apply NAA themselves in their researchprojects. The intent of a multi-user center is to make it easy for biologistsor geologists to use NAA to solve their own problems without becoming anexpert on all the details of the analytical process or setting up an off-siteNAA laboratory of their own. Maintenance and calibration of the irradiationand counting equipment, and the solution of day-to-day problems, generallyremains the responsibility of the permanent NAA staff. This concept has beenproven to work well when the necessary investment in setting up standardprocedures has been made
Some training must be provided in any institution that relies on temporary orpart-time workers, whether they are students or senior researchers fromoutside the field of NAA. For example, classroom training in the propertiesof ionizing radiation and the handling of radioactive materials is commonlyrequired for safety reasons. In a center with a rapidly shifting populationof researchers, the production of reliable results has to be assured with areasonably short training period. If the analytical procedures established inthe laboratory are well systematized, documented, and automated and simplifiedto the maximum possible extent, then the newcomers quickly become productiveon their own with a minimum of time and effort required from the permanentstaff.
Training of new users needs to cover the four phases of the analytical process:
a. Sample weighing, preparation and planning for irradiation and countingthrough scheduling of equipment, and setting up notebooks andprocedures ;
b. Data input procedures and the operation of MCAs, sample changers, andcomputer systems;
c. Handling of irradiated samples with regard to safety-, avoidingcontamination of equipment, and proper disposal;
d. Spectrum analysis, data interpretation, and quality control.
The last item on this list is of major concern. Despite highly developedcomputer procedures for qualitative and quantitative analyses, theinterpretation of spectra and the generation of reports with realisticuncertainty statements requires some judgment. In the first contacts with
107
potential users of NAA, the established precision and accuracy of routineanalysis will be used to emphasize the possibilities of the technique, but itmust be remembered that many years of experience by skilled specialists hasbeen required to establish this quality. Planning the experimentalmeasurements and the interpretation of results requires the involvement of anexperienced staff member as well, particularly in the early stages of aproject. Assuring that the center produces only reliable results is anessential function of the permanent staff. Careful attention must be paid toquality assurance procedures, since a reputation for quality carefully builtup over many years can be quickly lost by a few bad measurements.
7.4.4 FEE FOR SERVICES
Some activation analysis laboratories are operated purely as a commercialventure, much like clinical service laboratories. Even a collaborationundertaken for purely scientific reasons may lead with time to so much routineNAA work that another form of relationship, less scientific and morecommercial, may become more appropriate. As the relationship between analystand customer becomes more businesslike, accurate accounting for costs becomesmore important, and also more difficult. Assessing costs for analyses will bediscussed in more detail in the following section.
7.5 COST ANALYSIS
There are many acceptable ways to calculate the cost of performing activationanalysis. The following discussion is not likely to represent anyinstitution's actuarial practice in detail, but may serve as a guide to whichcategories need to be considered.
Activation analysis can be performed in a manner competitive with otheranalytical techniques. The equipment is no more expensive than that used insome "chemical" techniques. A system with detector, sample changer, MCA, andPC can be assembled for under US$50,000 (1988 price level). Given severalcounting systems and a well-developed routine, experience has shown that oneperson can analyze 10,000 samples of similar material per year.
108
7.5.1. HOW TO CALCULATE THE COST OF ACTIVATION ANALYSIS
In calculating the cost of an analysis we may distinguish the followingexpenses :
time for doing the analysis (labor), and supervising and maintenance;costs of consumables related to the analysis;costs related to the use of the reactor;costs related to measurement and data handling;miscellaneous costs.
a. The labor or working time for a specific analysis includes the time neededby personnel for a variety of tasks :
sample preparation and handling (weighing, pelletization, crushing,preconcentration, freeze drying, packing for irradiation, preparationof standards, unpacking after irradiation, and transfer from reactorsite to sample counting room);
administrative tasks (bookkeeping, filJing-in of forms, time needed forauthorization of irradiation and writing reports);
time needed during the measurement (changing samples or loading samplechangers).
It is not always easy to make in advance an estimate of the time needed for ananalysis. Factors affecting the working time are number of samples which canbe analysed together in one batch, the availability of counting equipment andequipment for sample preparation, the skill of the person doing the work, andthe other tasks of the personnel involved. A very straightforward but usefulway to get an estimate of the time required to do an analysis is to time witha stopwatch all procedures during the course of a complete analysis.
In general it is better to overestimate a little. Not only corrections haveto be applied for the time the personnel needs for leisure - lunch orrefreshment breaks, vacations, etc. - but later, after some practicalexperience the cost can be adjusted, and customers accept a reduction in pricemore easily than an increase.
109
Time needed for supervising and maintenance has to be estimated on an annualbasis, and then divided by the total number of samples that are being analyzedunder this supervision. Supervising includes answering telephone enquiries,control of reports and control of quality-control samples, invoicing,assistance in spectrum and data interpretation, planning special analysisprocedures, etc. If the NAA laboratory has to be fully self-supporting, thisitem also has to include the time spent on general research and development,necessary to keep the analytical performance up to date. Maintenance coverstime required for daily, weekly or monthly calibrations, equipment checks,maintenance and repair.
All these time-items (labor, supervising, and maintenance) have to bemultiplied by the appropriate direct and indirect costs. The direct costsinclude gross salaries and social security payments. It is obvious that theunit direct cost may be strongly different for labor carried out by atechnician, supervising when an academic is in charge, and maintenance done byan electronic engineer. The indirect costs may include electricity, water,maintenance, capital cost of the laboratory building, workshops, healthphysics personnel, reactor operators, and adminstration. In some institutesthe administration and cost calculation system is well developed givingmonthly reports on working hours and expenses, separately for each taskregardless in which section the involved persons belong in the lineorganization.
b. Costs of consumables directly related to the analysis can be easilycalculated. It covers mainly the costs required for irradiation containers,and reference materials and standards. Usually, this item is nearlyinsignificant unless it is necessary to use ultra-pure quartz tubes forirradiation.
c. It is difficult to generalize about costs related to the use of thereactor. Different organizations have different actuarial practices. In manycases the cost of the irradiation is not included at all, because argumentslike 'the reactor would be there anyway', 'it has so many users', etc. areused. None of these arguments is valid when a realistic estimate of analysiscost is required. Apart from this is the question whether this cost should beincluded in the charge for analysis service or not. That can be only decidedseparately in each laboratory.
110
An approach is to calculate the annual capital and running cost of the reactorand divide it with a number of produced neutrons. The obtained number, costper neutron, can now be used for estimating the cost of irradiations. In thisway the cost is directly related to irradiation time and flux. A more elegantand better way is to base the calculations on the total number of usedneutrons. The total cost will then be covered by the various activities atthe reactor. It is important to study closely the procedures followed in thedifferent irradiation sites. The integrated number of used numbers forirradiations in a pneumatic transfer facility can be easy calculated, but inother manual-loaded sites, also the time required for cooling the irradiatedsample still occupying the facility has to be incorporated.
A different approach is to include the capital and running costs in thegeneral overhead already mentioned above, when indirect costs related to timewas discussed. This system is easy but somewhat unfair because the cost isdivided between activities in a relation which is not proportional to theactual use. However, it has to be remembered that, especially when low powerreactors are used, the cost of keeping the reactor in running condition is ahigh proportion of the total cost, compared with the cost of actually runningthe reactor. This means that even if the isotope production group uses thereactor only one day per week, the cost of this service is much higher than1/5 of the cost of running the reactor five days a week.
It is also important to realize that there is practically no difference incost when one or ten irradiation positions are occupied. Therefore, it is notunfair to distribute the total costs per hour and use this as a basis for costcalculations. When the reactor is run for one group they pay 100 %; are theretwo groups involved, they each pay 50%, etc. It is too complicated to splitup such an approach for each hour; an annual average should be estimatedinstead.
If the reactor personnel is used for actually performing the irradiations(preparing irradiation containers, loading and unloading in the reactor),these costs have to be included separately, e.g., in the labor time entry.
d. Costs related to measuring equipment and data handling. In this entryprimarily the depreciation and maintenance costs of counting and computingequipment is involved. These costs can be easily calculated, and depreciationterms have to be chosen, which may be different for the different parts of aspectrometer, but also different in different laboratories. Computer costs
111
are not always easy to estimate. When analyses are carried out on multi-usercomputer, the computer manager may be able to estimate to what extent theNAA-group has used the machine. This exercise ends up with a valuerepresenting the total depreciation cost of the laboratories' countingequipment. If expensive laboratory equipment is used (balances, freeze-dryingequipment, etc.), also for these, a contribution to the depreciation cost hasto be included. Maintenance can be a major cost of equipment, as much as 15%of the purchase price per year for a full service contract from themanufacturer. Other expenses are costs of printing paper, liquid nitrogen,disks, crucibles, filter paper, tissue, disposable gloves, etc.
e. Miscellaneous Costs. Expenses may be included for costs of advertising,telephone, shipping, stationery and postage, rent, taxes and insurance,accounting charges, radioactive waste disposal, etc. It should be noted thatin many institutes several of these expenses are already buried under the term'overhead'. Some universities may add a percentage of 40 - 60% of your costas 'overhead' to be billed to your customer.
It is important to decide whether the commercial NAA service is part of ageneral NAA facility, in which the additional income will help to finance thefacility, or whether the main justification for the facility is as acommercial operation. Such a decision defines to what extent each of the fivedifferent entries which contribute to the analysis cost will be used in theprice to be charged and to what extent a profit margin will be added.
However, as mentioned in chapter 7.4, other factors may influence the finalprice to be charged. The charge has to be competitive with other analyticalmethods that can determine the elements of interest. The latter informationcan simply be obtained from competitors' price lists. It is too easy thoughto have prices that are competitive but do not cover the costs: the service islosing money then. It is better then to stop with this non-profitable work,and concentrate on other samples. Another outcome might be that it will benecessary to work with a minimum charge to ensure that very small batches arecost-effective. NAA is often used by the industry as a technique where allother methods have failed or as a referee analysis for an in-house standard.Consequently, samples are often received as batches of a few samples and it iseasy to lose money on these analyses.
112
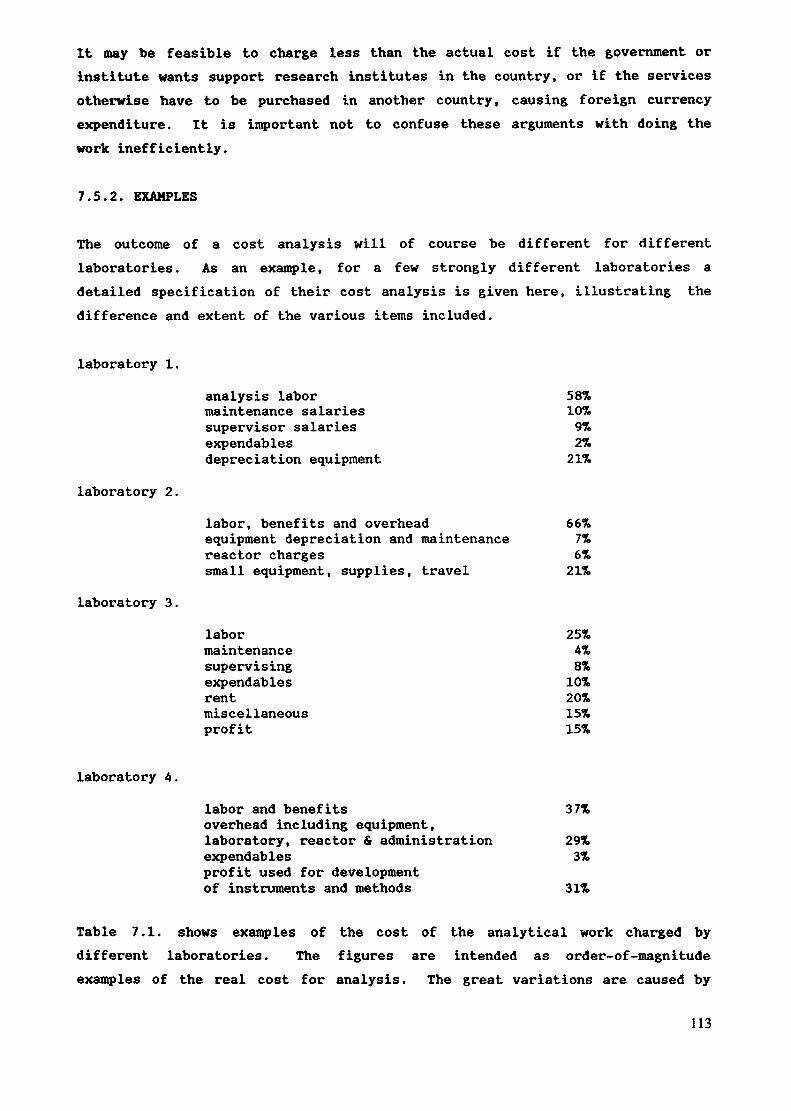
It may be feasible to charge less than the actual cost if the government orinstitute wants support research institutes in the country, or if the servicesotherwise have to be purchased in another country, causing foreign currencyexpenditure. It is important not to confuse these arguments with doing thework inefficiently.
7.5.2. EXAMPLES
The outcome of a cost analysis will of course be different for differentlaboratories. As an example, for a few strongly different laboratories adetailed specification of their cost analysis is given here, illustrating thedifference and extent of the various items included.
laboratory 1.
laboratory 2.
laboratory 3.
analysis labor 58%maintenance salaries 10%supervisor salaries 9%expendables 2%depreciation equipment 21%
labor, benefits and overhead 66%equipment depreciation and maintenance 7%reactor charges 6%small equipment, supplies, travel 21%
labor 25%maintenance 4%supervising 8%expendables 10%rent 20%miscellaneous 15%profit 15%
laboratory 4.labor and benefitsoverhead including equipment,laboratory, reactor & administrationexpendablesprofit used for developmentof instruments and methods
37%29%3%31%
Table 7.1. shows examples of the cost of the analytical work charged bydifferent laboratories. The figures are intended as order-of-magnitudeexamples of the real cost for analysis. The great variations are caused by
113
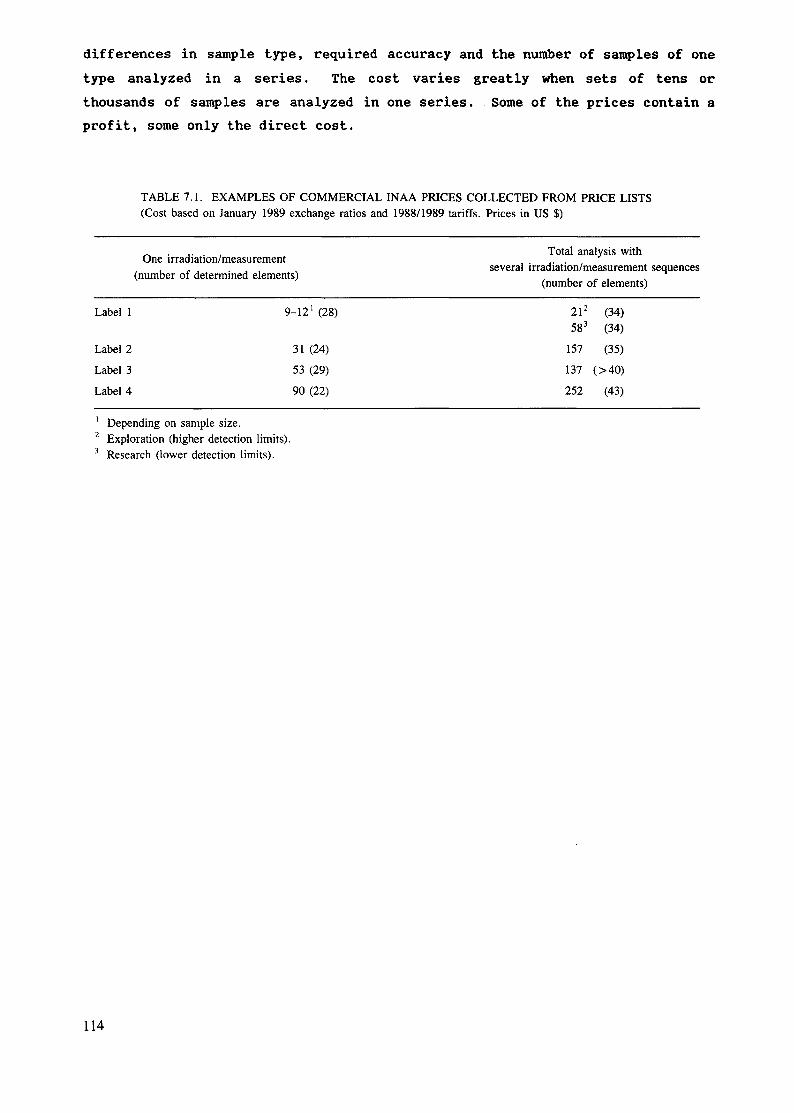
differences in sample type, required accuracy and the number of samples of onetype analyzed in a series. The cost varies greatly when sets of tens orthousands of samples are analyzed in one series. Some of the prices contain aprofit, some only the direct cost.
TABLE 7.1. EXAMPLES OF COMMERCIAL INAA PRICES COLLECTED FROM PRICE LISTS(Cost based on January 1989 exchange ratios and 1988/1989 tariffs. Prices in US $)
One irradiation/measurement(number of determined elements)
Total analysis withseveral irradiation/measurement sequences
(number of elements)
Label 1
Label 2Label 3Label 4
9-12 ' (28)
31 (24)53 (29)90 (22)
21 2 (34)58 3 (34)157 (35)137 (>40)252 (43)
1 Depending on sample size.2 Exploration (higher detection limits).3 Research (lower detection limits).
114
8. ORGANIZATION OF WORK
8.1 STAFF
It is essential to have a full-time member of the staff with responsibilityfor the NAA facility - in particular to maintain and support the countingequipment. This person should be trained in a scientific discipline such aschemistry or physics, although experience in other disciplines such asgeology, may be a real advantage. Essentially it is an analytical chemistthat is required and as such the person must be able to understand not onlythe basic principles of the technique but also be able to anticipate problemsand identify sources of error. He or she will also need to carry out somedevelopment to support new analytical work. The analyst must also be able tocommunicate with workers in other disciplines and collaborate in projectsusing the technique.
Although it is possible for one person with sufficient experience to fulfillall these requirements, the alternative is for a number of people to beavailable for consultation should the need arise. Technicians may be neededto prepare samples. At a reactor site it is likely that there will bephysicists using gamma-ray equipment and health physicists who can assist theactivation analyst with some aspects of the work. In addition there may be aradiochemist associated with the reactor operations who could assist with thechemistry of preparing standards and carrying out radiochemical separations.Such a multi-disciplinary team could cooperate to run the NAA system, but itis unlikely that the facility would be developed as a successfulself-financing operation without one person with full-time responsibility forthe day-to-day running of it.
Other support staff will be required in the case of a breakdown in theequipment or a desire to improve the existing facility. These includeelectronics and mechanical workshop staff. In the absence of suchspecialists, it may be necessary to 'buy in' expertise from manufacturers. Itmay also be desirable to have a computing expert on call, to support thecomputer-based counting equipment.
115
8.2 SAMPLE BOOKKEEPING AND CODING
From the first initiatives on analyses to be performed on certain samples, anadministrative procedure has to be started - recording, for example:
- sample--origin description, or customer's name; information on people-in-charge- order or contract number- date and number of sample received; promised date of reporting results- customer's identification code- sample description- your own identification number of the sample- fresh and dry weight of the samples in the irradiation containers- filling height of the irradiation container- similar information on corresponding standards and fluxmonitors- date, time, and duration of irradiation- irradiation position
To keep samples identifiable, code numbers can be applied. Such a code mayconsist of several alphanumeric characters, and a sample sequence number. Byimplementing the same code into a spectrum filename, measured and storedspectra can be identified and linked to the samples. Alphanumerics can serveas:
- customer identifier, e.g., A,B,C,....Z . Different batches from onecustomer can be identified with a second alphanumeric.
- spectrometer identifier, to distinguish spectra of the same sample, measuredat different spectrometers. When this label is added to the spectrumfile-name, accidental overwriting of data is prevented.
- geometry or measurement identifier, in case spectra of the same sample aremeasured several times with the same spectrometer, but at differentsample-detector distances.
As an example, a code may look like AB5F006; A and B being customer and batchidentifier, respectively, 5 = spectrometer identifier, F = geometryidentifier, and 006 = sample sequence number. Some spectrum storage systemsallow for even more labels in the filename. Part of the code, like customeridentifier(s) and sample sequence number (AB006) can be written or scratchedon the irradiation container [209], and attached to the reminders of the
116
original sample. After completion of the analysis, a copy of the reportedanalysis results is added to the relevant part of the bookkeeping system.
When analyzing a limited number of samples, bookkeeping is a simple manualadministrative procedure. But for a large throughput laboratory, much timeand manpower can be saved when this task is taken over by computer [209].In brief, the principles of this computerized bookkeeping system are :
* For each 'customer' a file is made containing for every batch basicinformation on codes (both customer's own code and laboratory code), weightsof samples, standards and flux monitors, capsule filling heights,irradiations, etc.
* This file can be called in every time the sample is analyzed, e.g., afterdifferent decay times, as the customer identifier label in the sample codelinks the recorded spectra and the information file.
0* The analysis results of a specific sample spectrum can be stored in aseparate file, still using the selected sample code. Every time a newanalysis has been performed on the same sample, this new information is addedto this result file; by also adding decay times all results remainrecognizable.
* At completion, the result file can be updated and corrected, andincorporated in the report.
Different series of samples are sometimes processed simultaneously ondifferent spectrometers, and irradiations and measurements of different seriesmay overlap. A status scheme gives direct information on the degree ofoccupation of irradiation positions and spectrometers, and on availableremaining time for rush orders without interfering with regular work. In sucha scheme batches of samples can be denoted by their customer - and batchidentifier labels. The laboratory can check quickly day by day whether allanalyses proceed as scheduled. Answers can be given on queries from impatientcustomers. A schematic example of such a status scheme using 'LEGO'-typebricks is given in Figure 8.1.
117
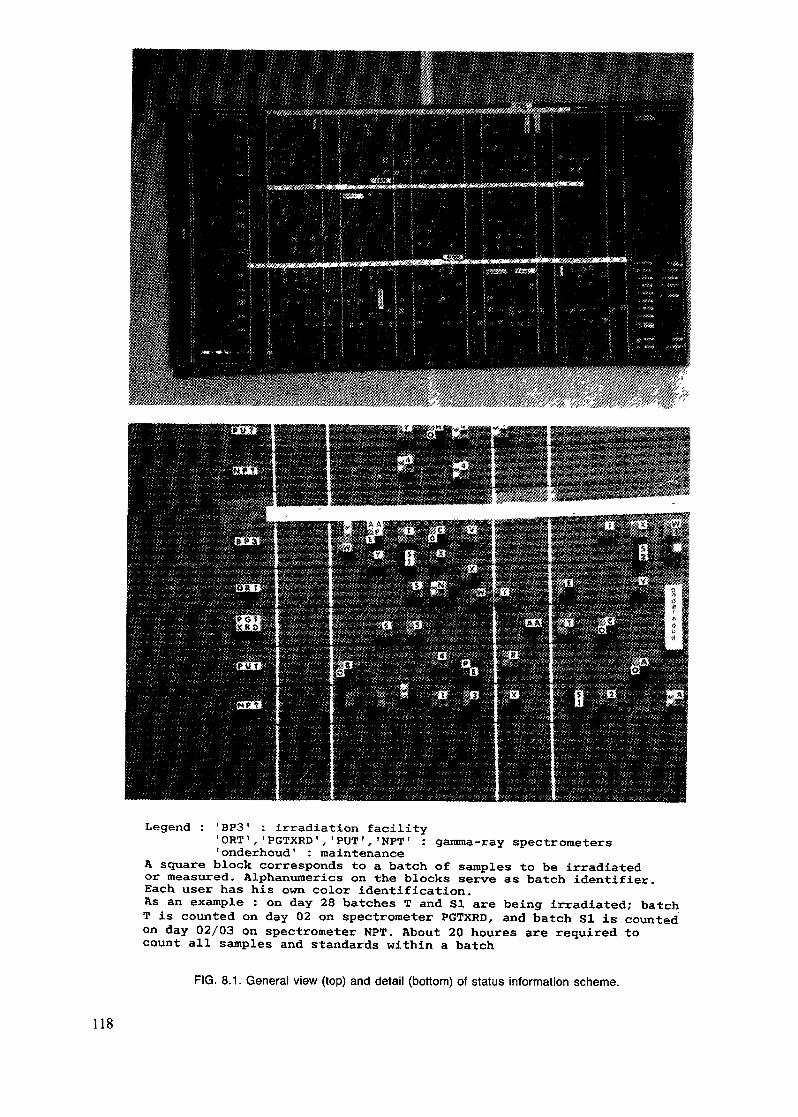
spectrometersLegend : 'BP3' : irradiation facility
'ORT','PGTXRD','PUT','NPT' : gamma-ray'onderhoud' : maintenance
A square block corresponds to a batch of samples to be irradiatedor measured. Alphanumerics on the blocks serve as batch identifier.Each user has his own color identification.As an example : on day 28 batches T and SI are being irradiated; batchT is counted on day 02 on spectrometer PGTXRD, and batch SI is countedon day 02/03 on spectrometer NPT. About 20 houres are required tocount all samples and standards within a batch
FIG. 8.1. General view (top) and detail (bottom) of status information scheme.
118
8.3 SAMPLE PREPARATION
Depending on the type of samples to be analyzed sample preparation proceduresand the preparation equipment required may be very different. Even within thefield of geochemistry, the sample preparation required for rocks is not thesame as for vegetation or soils.
Rocks will have to be crushed with an aliquot then ground into a fine powder.This is usually achieved using a combination of jaw crushers, cone crushersand ring or ball mill pulverisers to reduce the rocks to a powder usuallyfiner than -150 mesh size. Soils on the other hand may only require screeningto -80 mesh size. The aim of sample preparation is to reduce the sample sizeto allow a representative sample to be chosen for analysis. This aspect ofpreparing the sample for analysis is one which requires adequate space,equipment and know-how to prepare the sample properly. If the subsample isnot representative or if contaminated there is no point in providing anaccurate analysis (i.e., garbage in - garbage out). Various papers exist onsampling and sample size necessary for analysis [210/211/38].
In many circumstances the customer may have the ability of preparing thesamples for irradiation. To maintain control of contamination the consumermay prefer this. To encourage this a discount may be provided if the customerdoes the preparation and encapsulation. In the event the necessary equipmentis not available in the NAA laboratory, having the customer do the preparationmay be the only alternative. Generally the activation facility should providethe irradiation vials as the reactor will probably need a certain size andtype of vial to be acceptable for irradiation (Fig. 8.2). The activationanalyst should know what contaminants are present in the vials to determinetheir suitability for a particular set of samples.
Before analysis, samples may require washing, drying (oven drying or freezedrying), homogenization (with or without cryogenic techniques), fractionating,or pelletization (Fig. 8.3). Liquid samples may require preconcentration orabsorption. The primary concern of the activation analyst is to be acquaintedwith sources of contamination and losses of elements during these steps. Oneof the advantages of INAA compared to other analytical techniques is itsrelative freedom of contamination. In fact, the only steps wherecontamination may occur that influence the final result are sampling, sample
119
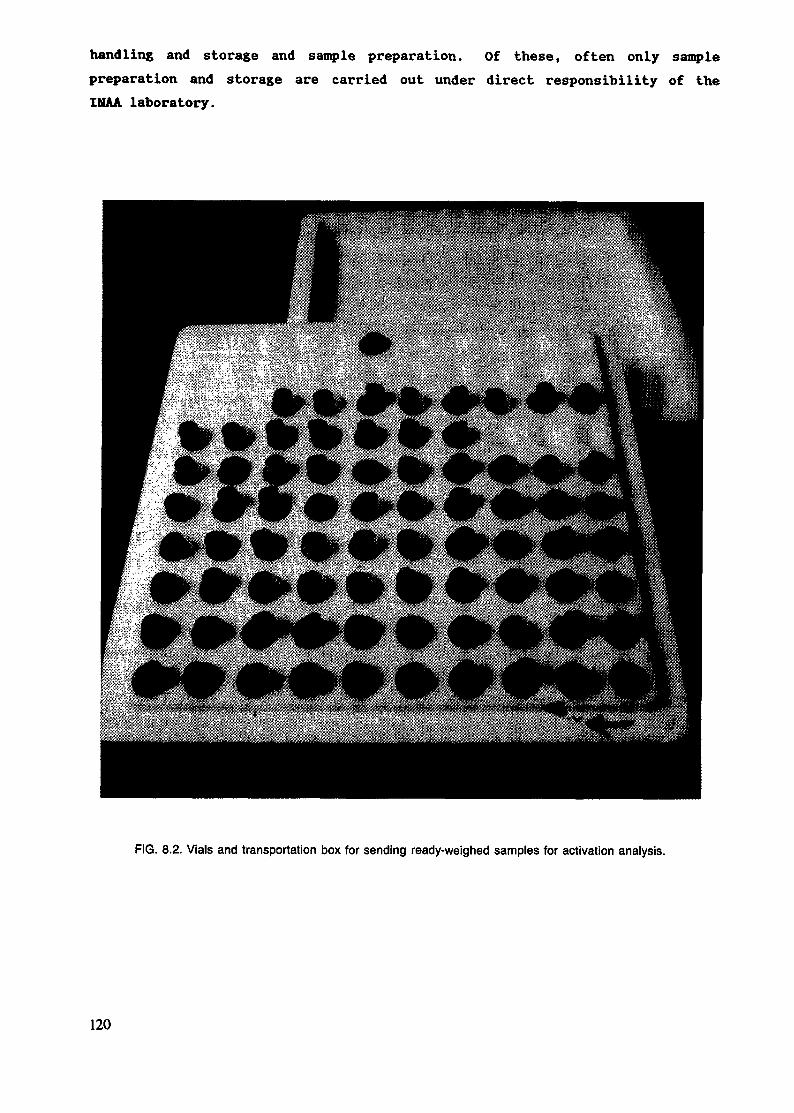
handling and storage and sample preparation. Of these, often only samplepreparation and storage are carried out under direct responsibility of theINAA laboratory.
FIG. 8.2. Vials and transportation box for sending ready-weighed samples for activation analysis.
120
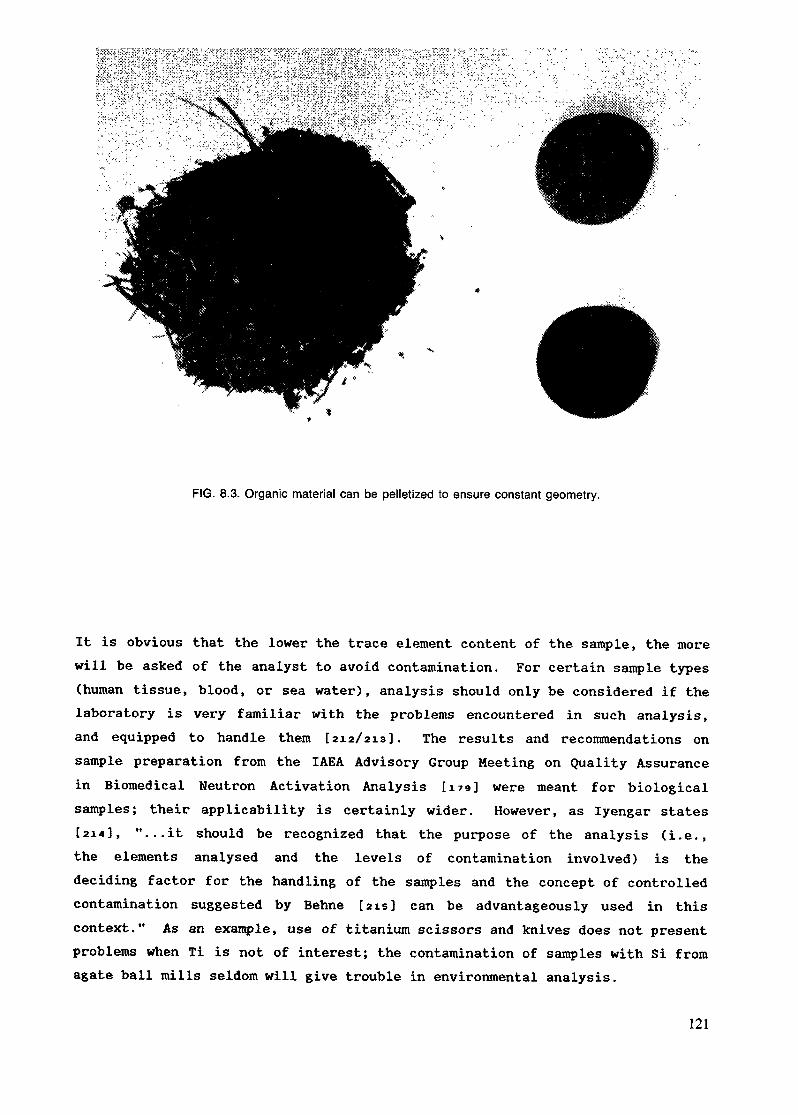
FIG. 8.3. Organic material can be pelletized to ensure constant geometry.
It is obvious that the lower the trace element content of the sample, the morewill be asked of the analyst to avoid contamination. For certain sample types(human tissue, blood, or sea water), analysis should only be considered if thelaboratory is very familiar with the problems encountered in such analysis,and equipped to handle them [212/213]. The results and recommendations onsample preparation from the IAEA Advisory Group Meeting on Quality Assurancein Biomédical Neutron Activation Analysis [179] were meant for biologicalsamples; their applicability is certainly wider. However, as lyengar states[214], "...it should be recognized that the purpose of the analysis (i.e.,the elements analysed and the levels of contamination involved) is thedeciding factor for the handling of the samples and the concept of controlledcontamination suggested by Behne [215] can be advantageously used in thiscontext." As an example, use of titanium scissors and knives does not presentproblems when Ti is not of interest; the contamination of samples with Si fromagate ball mills seldom will give trouble in environmental analysis.
121
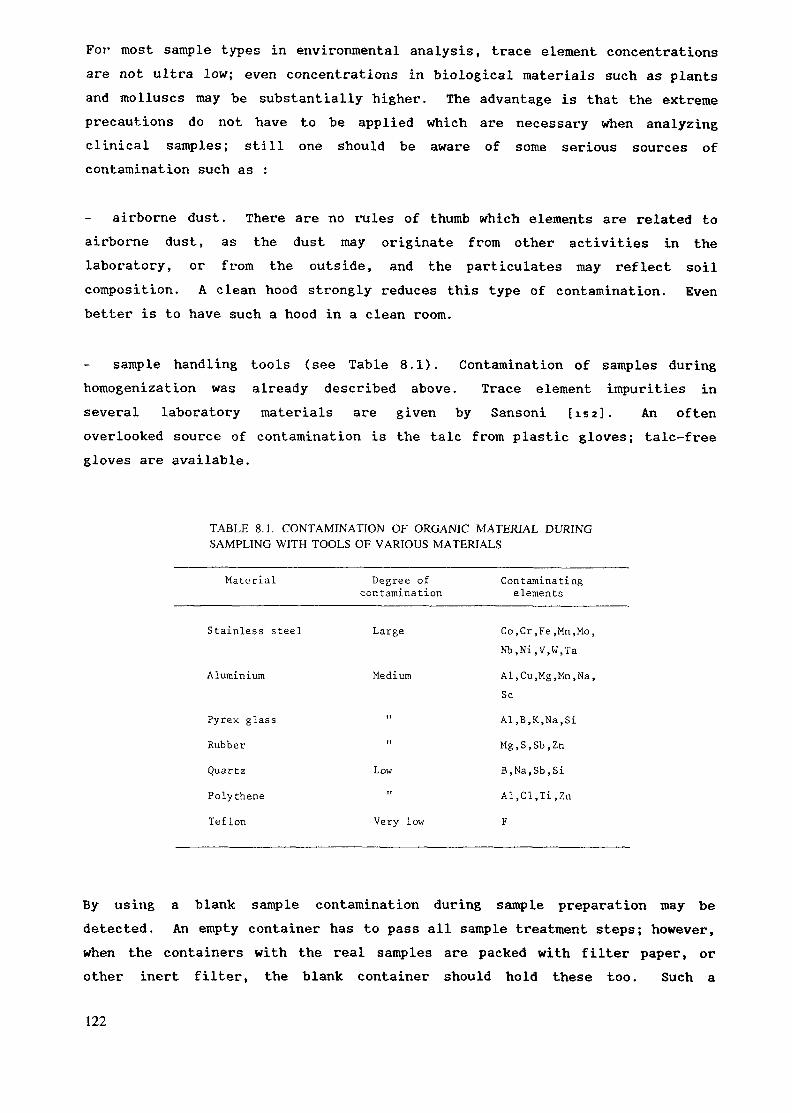
For most sample types in environmental analysis, trace element concentrationsare not ultra low; even concentrations in biological materials such as plantsand molluscs may be substantially higher. The advantage is that the extremeprecautions do not have to be applied which are necessary when analyzingclinical samples; still one should be aware of some serious sources ofcontamination such as :
airborne dust. There are no rules of thumb which elements are related toairborne dust, as the dust may originate from other activities in thelaboratory, or from the outside, and the particulates may reflect soilcomposition. A clean hood strongly reduces this type of contamination. Evenbetter is to have such a hood in a clean room.
sample handling tools (see Table 8.1). Contamination of samples duringhomogenization was already described above. Trace element impurities inseveral laboratory materials are given by Sansoni [isz]. An oftenoverlooked source of contamination is the talc from plastic gloves; talc-freegloves are available.
TABLE 8.1. CONTAMINATION OF ORGANIC MATERIAL DURINGSAMPLING WITH TOOLS OF VARIOUS MATERIALS
Material Degree of Contaminatingcontamination elements
Stainless steel Large Co,Cr,Fe,Mn,Mo,Nb,Ni,V,W,Ta
Aluminium Medium Al,Cu,Mg,Mn,Na,Sc
Pyrex glass
RubberQuartzPolythene
Teflon
II
II
Lown
Very low
Al,B,K,Na,Si
Mg,S,Sb,Zn
B,Na,Sb,Si
Al,Cl,Ti,Zn
F
By using a blank sample contamination during sample preparation may bedetected. An empty container has to pass all sample treatment steps; however,when the containers with the real samples are packed with filter paper, orother inert filter, the blank container should hold these too. Such a
122
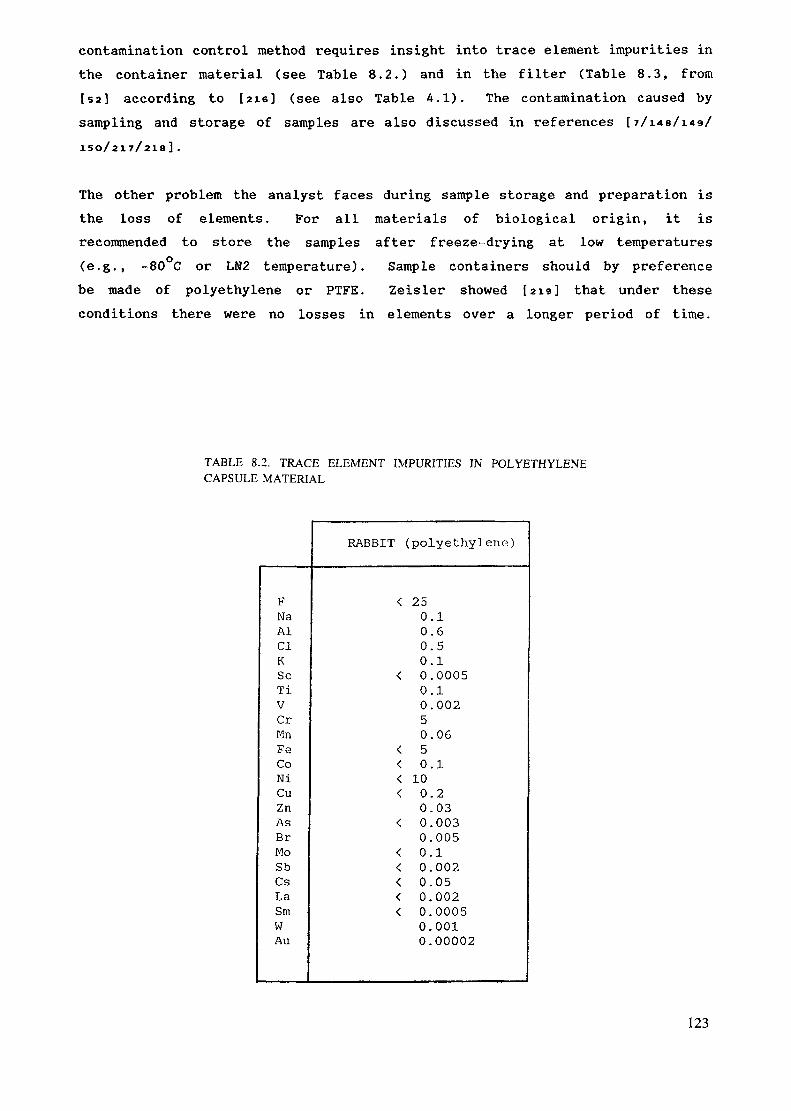
contamination control method requires insight into trace element impurities inthe container material (see Table 8.2.) and in the filter (Table 8.3, from[sa] according to [zie] (see also Table 4.1). The contamination caused bysampling and storage of samples are also discussed in references [?/i4B/i49/150/217/218].
The other problem the analyst faces during sample storage and preparation isthe loss of elements. For all materials of biological origin, it isrecommended to store the samples after freeze-drying at low temperatures(e.g., -80 C or LH2 temperature). Sample containers should by preferencebe made of polyethylene or PTFE. Zeisler showed 1219] that under theseconditions there were no losses in elements over a longer period of time.
TABLE 8.2. TRACE ELEMENT IMPURITIES IN POLYETHYLENECAPSULE MATERIAL
FNaAlClKSeTiVCrMnFeCoNiCuZnAsBrMoSbCsLaSmWAu
RABBIT (polyethylene)
< 250.10.60.50.1
< 0.00050.10.00250.06
< 5< 0.1< 10< 0.2
0.03< 0.003
0.005< 0.1< 0.002< 0.05< 0.002< 0.0005
0.0010.00002
123
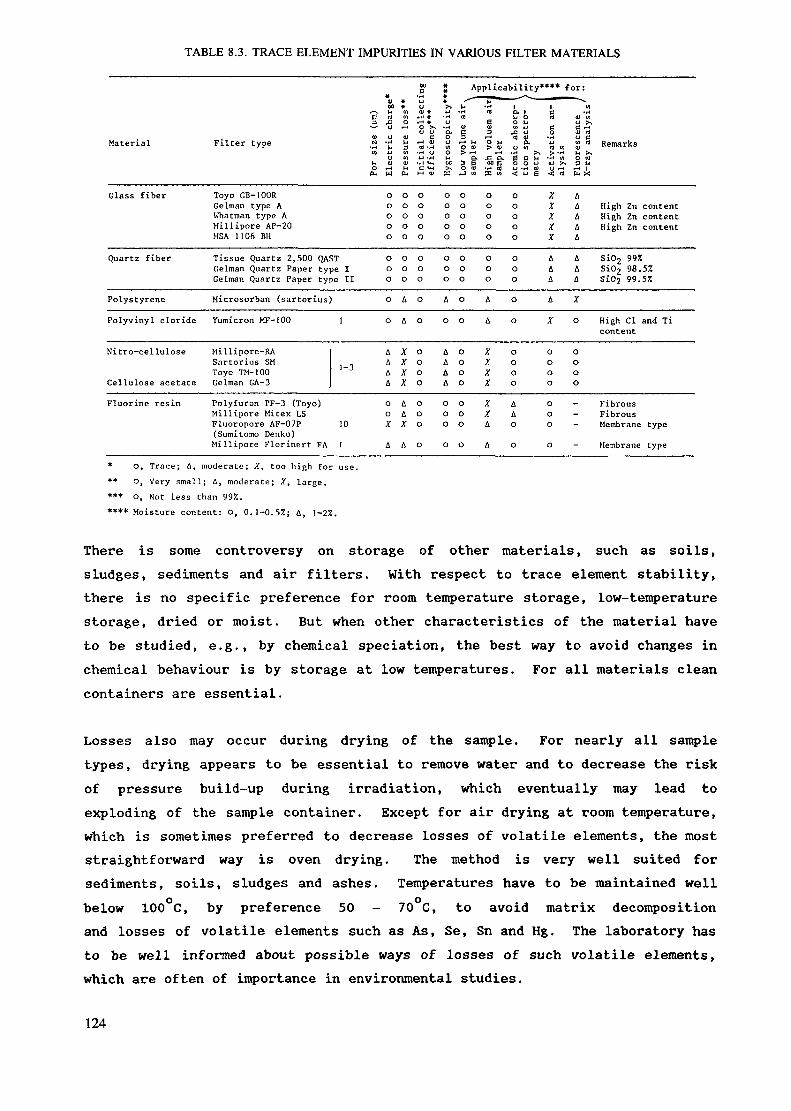
TABLE 8.3. TRACE ELEMENT IMPURITIES IN VARIOUS FILTER MATERIALS
Material
Glass fiber
Quartz fiber
Filter type
Toyo GB-IOORGelman type AWhatman type AMillipore AP-20USA 1 1 06 BH
*
'S td•3 o0) uN «Hu) U
UrJ VO H£4 W
0oooo
Tissue Quartz 2,500 QAST OGelman Quartz Paper type I oGelman Quartz Paper type II o
PolystyrenePolyvinyl cloride
Nitro-cellulose
Cellulose acetateFluorine resin
Microsorban {sartorius) OYumicron MF- 100
Millipore-RASnrtorius SMToyo TM-IOOGel man GA-3Polyfuron PF-3 (Toyo)Millipore Mitex LSFluoropore AF-07P(Sumitomo Denko)Millipore Florinert FA
1 0
A'-3 AA
A
0o
10 X
I A
*toOr-4
V
3WtuMPH
000oooo0
AA
XXXX
AAX
A
coll
ecti
ngcy
***
ef-t <Vcd -H-H 0U 'r*
C M O
000o0
oo0
o0
0ooo00oo
J Applicability**** for:>. 1- -r* 1 1 W4J «H Cd O. 1 C "HU E O l* U X•r« <1> 0) «*J C G •-*IX E 3 JD U O .11 cd0 3O i-l PM O u)O > t-<M p.oc 3 BX o coX J 1»
0 00 00 0o oO 0
0 00 O0 0
A 0
0 O
A 0A 0A 0A 0
o o0 00 0
o o
t-l0 h> v& exep BX S
0ooo0
0o0
AA
XXXX
XXà
A
co cuaU WB C Hw >H a)< u E
oo00oo0o0
o
oo00
AAo0
iJ« «> -H
kl ?-ly <, TO
/r*XXX
AAAA
X
0ooooooo
U £W rtM >^o cd
("X
AAAAA
AAA
X
0
0ooo----
Remarks
High ZnHigh ZnHigh Zn
contentcontentcontent
Si02 997.Si02 98.Si02 99.
High Clcontent
FibrousFibrousMembraneMembrane
57.57.
and Ti
typetype
* O, Trace; A, moderate; X, too high for use.** O, Very small; A, moderate; Xt large.*** o, Not less than 99%.**** Moisture content: o, 0.1-0.5%; A, 1-2%.
There is some controversy on storage of other materials, such as soils,sludges, sediments and air filters. With respect to trace element stability,there is no specific preference for room temperature storage, low-temperaturestorage, dried or moist. But when other characteristics of the material haveto be studied, e.g., by chemical speciation, the best way to avoid changes inchemical behaviour is by storage at low temperatures. For all materials cleancontainers are essential.
Losses also may occur during drying of the sample. For nearly all sampletypes, drying appears to be essential to remove water and to decrease the riskof pressure build-up during irradiation, which eventually may lead toexploding of the sample container. Except for air drying at room temperature,which is sometimes preferred to decrease losses of volatile elements, the moststraightforward way is oven drying. The method is very well suited forsediments, soils, sludges and ashes. Temperatures have to be maintained well
o obelow 100 C, by preference 50 - 70 C, to avoid matrix decompositionand losses of volatile elements such as As, Se, Sn and Hg. The laboratory hasto be well informed about possible ways of losses of such volatile elements,which are often of importance in environmental studies.
124
Certain types of samples like biological materials, coals, or potash mayabsorb water from the air on standing. Generally analyses are done on a dry-weight basis and the samples should be dried prior to weighing by a procedureappropriate for the material. The samples should be weighed immediately oncoming out of the oven so that moisture content does not get reabsorbed.
For samples of biological origin (plants, fish, mollusc, mosses, lichens,etc.) freeze drying, also known as lyophilization, is certainly the mostappropriate method. It is generally accepted that this process does not causelosses of any but the most volatile elements. The samples have to beprefrozen (e.g., at -30 C or lower) prior to placement in the freezedrier, and that vacuum pump must be able to obtain in short time an adequatevacuum. Generally any form of drying may invalidate the sample for otherexperiments in which the chemical state is of interest, such as organicextractable contents, nitrification rate, loss of enzymes, or change inmembranes.
It is hardly possible to give rules for the amount of sample to be weighed foranalysis. Too many variables play a role: total available amount of material,neutron flux, counting efficiency, size of the sample container, etc. Thesevariables are all related to the amount of radioactivity to be induced and tobe measured. Very small samples (e.g., <10 mg) may suffer from loss ofrepresentativity and homogeneity; for this reason, a minimum amount of 200 mgis recommended for many reference materials. Such a weight may then also bechosen for the corresponding samples. A large sample (e.g., >500mg) may givedifficulties in making accurate corrections for neutron self-shielding andgamma-ray self attenuation. A similar problem arises from the presence ofstrongly neutron absorbing elements such as boron. High amounts of B (e.g.,as in some borosilicate glass filters) may cause unacceptably high increasesin temperature during irradiation, eventually leading to melting of the samplecontainer.
Contamination during sample preparation may be a major problem for geologicalsamples [220]. Airborne dust during rock crushing and milling can create aserious problem without proper dust control. Contamination from elements likegold, which are very malleable and can plate out on grinding mills, is alsopossible. Samples may be contaminated during screening (from solder joints)even when using nylon screens. Contamination during weighing from uncleanspatulas or in some instances from rings worn by the person handling the vialsor weighing the sample is possible. The grinding equipment or homogenizing
125
equipment used is also important. Tungsten carbide drill bits used frequentlyfor archaeometry samples can add a high tungsten and cobalt content to thesamples and greatly increase the overall activity of the sample. Traceamounts of Hf and Ta are also added. Alumina grinding equipment can add largeamounts of Al contamination. Hardened steel will add Fe, Ni, and Cocontamination. Agate mills will add Si. From our experience agate forgeological matrices or plexiglass for biological samples is usually best. Thecheapest alternative is usually hardened steel. The list of possiblecontamination is endless. It is usually a good idea to include blanks (in thecase of rocks, put a silica sand sample through the whole sample preparationprocess) to detect contamination. In addition to the above, the reader isreferred to the survey on sampling and sample handling of environmentalsamples by Maienthal and Becker [221].
8.4 STANDARDS
Good standardization is the basis for the accuracy of the analyticalfacility. The approach to standardization varies from facility to facilityand it often depends on the background of the analyst involved. Physicistsmay prefer to irradiate flux monitors along with their samples and makecalculations based on nuclear data to determine the concentration of theelement present. A chemist may use standards prepared from chemical elementsor compounds. On the other hand a geologist may adopt geological referencematerials as standards in the analysis.
In-house comparator standards are in regular use in most laboratories forcalibration of the measurement process. For the ultimate accuracy there is nosubstitute for making one's own standards. Given an analytical balance andpure elements or pure compounds with well-known composition, standardlaboratory methods of gravimetric and volumetric analysis can producestandards whose concentration is known to 1% or better.
Careful attention to all possible errors in preparing standards, especiallymultielement standards, is important if accurate results are desired.Potential sources of error in preparing single element standards includeevaporative losses of solvent; pipette calibration and imprecision;contamination of the standard from reagents, equipment, the laboratoryenvironment, or final matrix; purity and stoichiometry and moisture content ofstarting material used to prepare the standard; instability of solutions(i.e., precipitation), and loss of volatile elements during dissolution and
126
irradiation. Additional sources of error in preparing multielement standardsinclude the stability of mixed multielement solutions, and cross-contaminationof one element by the addition of a second element. The latter is especiallyimportant for NAA where standards are often prepared with greatly differingamounts of the various elements. For example, if Fe and Sc are included inthe same standard, an Fe concentration ten thousand times greater than that ofSc might be desired to produce comparable peak areas. If the Fe usedcontained 0.01% Sc, the Sc content of the standard would be twice as great asexpected, unless this additional source of Sc is recognized.
In view of the many potential sources of error in preparing multielementalstandards for NAA, is it reasonable to expect that such standards can beproduced with an error of 1 per cent or less? In 1976- 1977 [222] a set offour synthetic multielement standards were produced for INAA. A great deal ofcare was taken in preparing these standards but heroic efforts to achieve theultimate accuracy were not made. For example, these standards were preparedby volumetric dilutions; significantly smaller errors could have been achievedif gravimetric methods had been used. All sources of error in preparing thesestandards, except for residual moisture content and non-stoichiometry ofcompounds, were evaluated, and the total error in each pipetted standard wascalculated to be slightly less than 1 per cent at the 95% confidence level.These standards have been used at NIST for the past nine years in the analysisof Standard Reference Materials. The results from numerous intercomparisonswith other NAA standards and with other techniques have indicated that the 1per cent error originally calculated is indeed reasonable [223].
Few reliable primary standards are available [227/225], Unless it isaccompanied by an explicit report of analysis, a material labeled "99.99%pure" may not truly be so pure. Rarely is a pure substance assayed for thenumber of moles of the desired component per gram. Stoichiometry is notalways as labeled; metal oxides may contain carbonate. Water ofcrystallization might be unknown. Usually only the most plausible impuritiesare searched for by the supplier: surface oxides and gases in metals aregenerally ignored. Commercial chemical zirconium invariably includes hafniumand vice versa. Labels may simply be wrong; we have found 3% Sb in "99.9%"lead and 1.4% Cs in RbCl specified to contain less than 10 ppm [222]. Theliterature on thermogravimetry is a useful guide to procedures for producinghydrates and oxides with well-defined composition [226], and comparingmultiple standards prepared from several sources will reveal the most seriousproblems of poor assay.
127
A number of publications have addressed the need for a working multielementcalibrant material which is homogeneous, similar in matrix composition to thesamples to be analyzed, and of well-known composition. If a liquid or colloidis uniformly doped and then solidified into storable form, a standard can beprepared whose homogeneity is guaranteed merely by the mode of preparation.Many laboratories have used fine silica slurried with solution standards. Animprovement on this is homogeneously precipitated doped silica gel[227/229]. Photographic grade gelatin [229], urea-formaldehyde polymer[230], and polyacrylamide gel [231] have been used as analogs of plant andanimal tissue, while clay [232] and mineral glasses [233] have been madeas geological materials. Pure aluminum has also been used [234]. Gelatinbased standards are commercially available [235]. Other syntheticmultielement standards are under active development in several laboratories.
'Natural* standards may be preferred on the basis that they represent, asclosely as possible, the sample that is to be analysed. It is a matter ofpersonal choice as to whether it is better to work with a clean, well-knownchemical standard with a simpler spectrum than the real sample or to use asimilar matrix with the same interference problems as the sample. Unless thematrices are identical the interference effects will be different. If anatural standard is used, it is important that it be well characterised - forthe elements of interest. Since it is expensive to use internationalreference materials as standards on a daily basis, it is necessary to have an'in-house' standard for each of the sample types to be analysed. These mustbe well analysed for the elements of interest and be homogeneous, and theremust be sufficient material available for the requirements of the work. Thein-house standard must be checked against a suitable primary standard(chapter 9).
8.5 IRRADIATION PROCEDURES
The purpose of the irradiation is to produce sufficient activity in thesample, taking into account the decay time, to measure the gamma-spectrum inideal circumstances. However, this principle may be partly overruled by theprinciple that the worker's exposure to radiation must be minimized (chapter10). The benefits of high activity are that the measurement can be made at alarge distance to the detector, minimizing the error caused by countinggeometry variations, and that short measurement times can be used. Thedrawback with high activity samples is radiation exposure during handling andheavy shielding during storage and sample changer operation. It has also to
128
be taken into account that high count rates cause pulse pile up problems. Therelative statistical error is inversely proportional to the square root of thenumber of counts in the photopeak. Thus a significant increase in the numberof counts is required for a moderate improvement in accuracy.
When short-lived isotopes are measured high count rates usually cannot beavoided.
The general principle is that the use of short-lived nuclides require shortirradiations and long-lived require long irradiations. What is really soughtis a certain total number of net counts. This can be varied according tolocal conditions. One can either use large samples with correspondinglyshorter irradiation times, or smaller samples with longer irradiation times.When limited irradition space is available short irradiations of large samplescan be preferable. This allows the use of automatic irradiation facilities.In some cases large samples have to be used because of homogeneity problems.This again may cause problems with neutron and gamma-ray absorption.
Another decision to make is the neutron spectrum. Most commonly the mixedreactor neutron flux is used but other applications are possible. A highlythermal flux or a fast flux can be used. The benefits of these are few andtherefore they are not discussed more in this context. Epithermal NAA,however, is commonly used and the benefits obtained are considerable for someelements through improved detection limits because of increased photopeak/background ratio. The reason is that the epithermal/thermal cross-sectionratio of the nuclides of interest is higher than the corresponding ratio forthe nuclides causing most of the background activity. The most importantbenefits of using epithermal irradiation for analysis of rock samples are upto 3 times lower detection limit for gold, decreased disturbance from fissionproducts and improved precision through decreased background for mostelements. The benefit of using epithermal neutrons for irradiation have beendiscussed by several authors. The most comprehensive investigation was madeby Steinnes [236]. He tabulated theoretical advantage factors for mostnuclides of interest in reactor neutron activation analysis. Parry tabulatedexperimental advantage factors for short-lived NAA of geological samples[237]. The largest improvements in detection limit were found to be afactor of 6. The cross sections are listed in Appendix A, Table I. Fromthese the improvement by using epithermal irradiation can be estimateddirectly when pairs of elements are compared. The true improvement depends onthe sample analyzed. Table 8.4 shows some improvement factors for rock
129
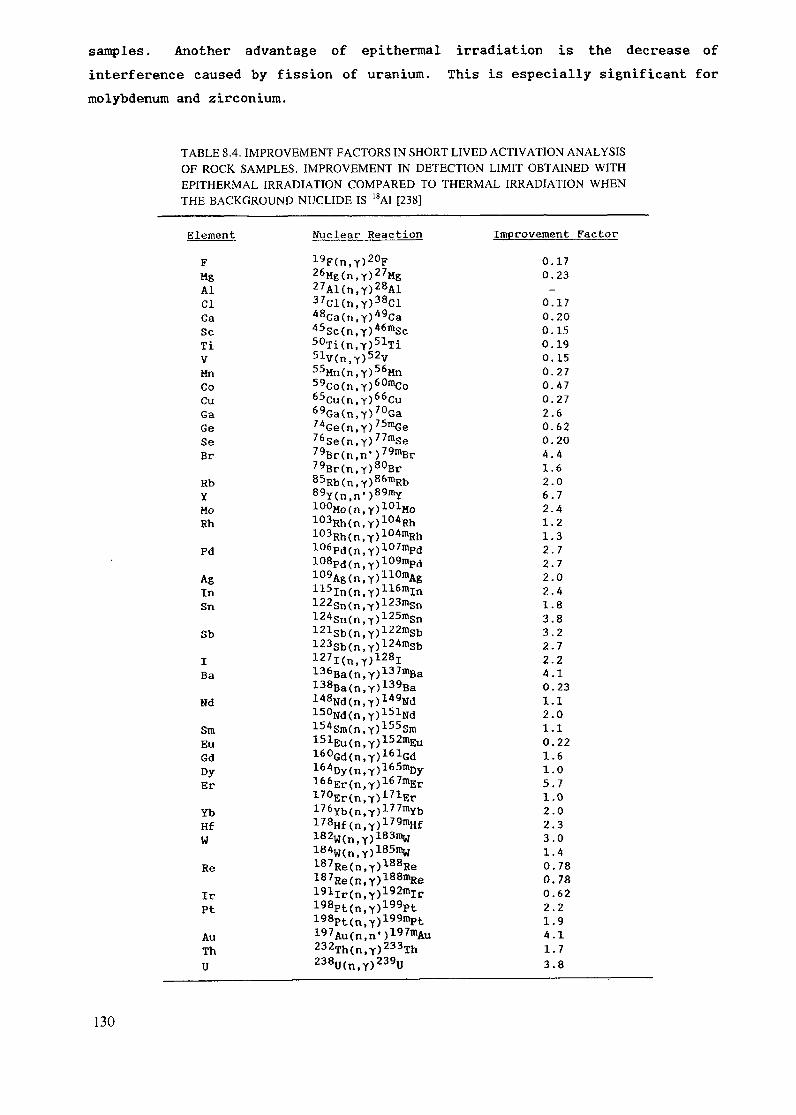
samples. Another advantage of epithermal irradiation is the decrease ofinterference caused by fission of uranium. This is especially significant for
molybdenum and zirconium.
TABLE 8.4. IMPROVEMENT FACTORS IN SHORT LIVED ACTIVATION ANALYSISOF ROCK SAMPLES. IMPROVEMENT IN DETECTION LIMIT OBTAINED WITHEPITHERMAL IRRADIATION COMPARED TO THERMAL IRRADIATION WHENTHE BACKGROUND NUCLIDE IS I8A1 [238]
Element
FMgAlClÇaSeTiVMnCoCuGaGeSeBrRbYMoRh
Pd
AgInSn
SbIBa
Nd
SmEuGdDyEr
YbHfW
Re
IrPt
AuThU
Nuclear Reaction19F(n,Y)2°F26Mg(n,Y)27Mg27Al(n,Y)28Al37Cl(n,Y)38Cl48Ca(n,Y)49Ca45Sc(n,Y)'*6n>Sc50Ti(n,Y)51Ti51V(n,Y)52VS5Mn(n,Y)56Mn59Co(n,Y)60mCo65Cu(n,Y)66Cu69Ga(n,Y)70Ga74Ge(n,Y)75in<3e76Se(n,Y)77mSe79Br(n,n')79lnBr79Br(n,Y)80Br85Rb(n,Y)86mRb89Y(n,n')89mY10°Mo(n,Y)101Mo103Rh(n,Y)10ARh103Rh(n,Y)104mRh106Pd(n,Y)107mPdl°8Pd(n,Y)109mPd109Ag(n,Y)110mAg115In(n,Y)116inIn122Sn(n,Y)123mSn124Sn(n,Y)125mSn121Sb(n,Y)122lnSb123Sb(n,Y)124mSb127I(n>T)128I136Ba(n,Y)137inBa!38Ba(n,Y)139Ba148Nd(n,Y)149Nd150Nd(n,Y)151Nd154Sm(n,Y)155Sm151Eu(n,Y)I52mEu160Gd(n,Y)161Gd164Dy(n,Y)165mDy166Er(n,Y)167mErl7°Er(n,Y)171Er176Yb(n,Y)177mïb178Hf(n,Y)179mHf182W(n,Y)183mW184W(n,Y)185mW187Re(n,Y)188Re187Re(n,Y)188mRei Q "1 . "1 Û Otn— iT'T* £ T\ Y J *.H1T *•»198Pt(n;Y)199Pt198Pt(n,Y)199lnPt197Au(n,n')197mAu232Th(n,Y)233Th238U(n.Y)239U
Improvement Factor0.170.23_
0.170.200.150.190.150.270.470.272.60.620.204.41.62.06.72.41.21.32.72.72.02.41.83.83.22.72.24.10.231.12.01.10.221.61.05.71.02.02.33.01.40.780.780.622.21.94.11.73.8
130
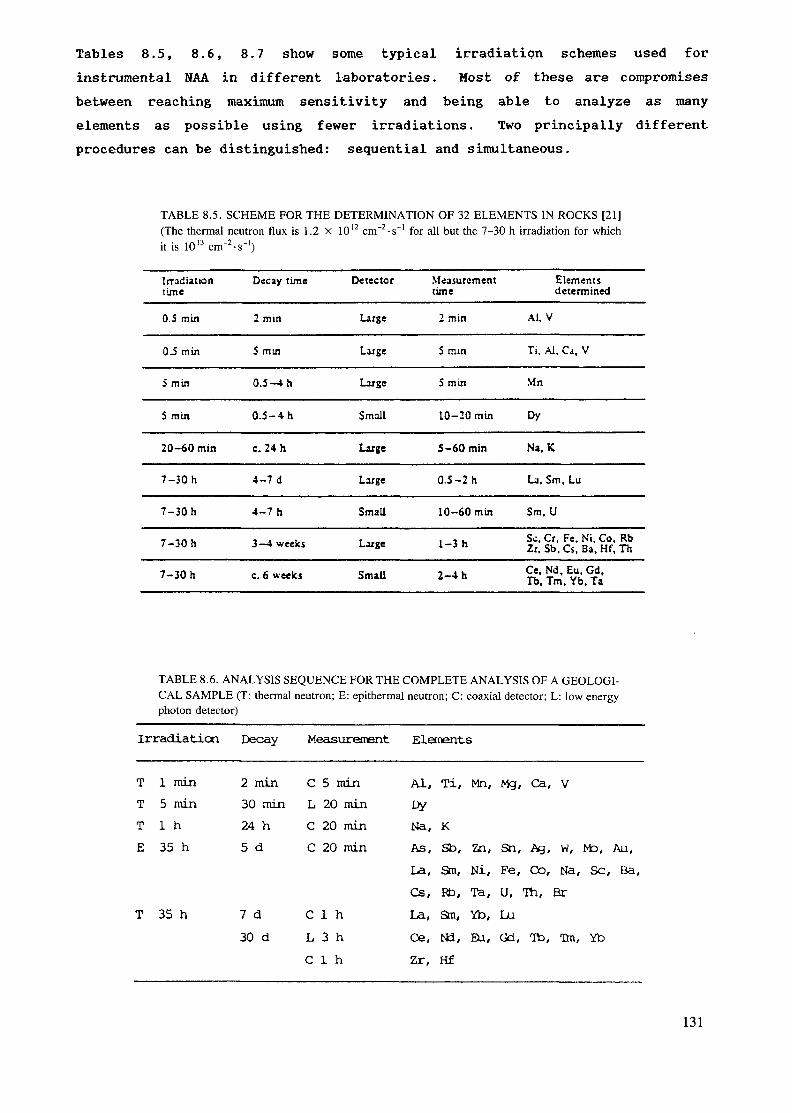
Tables 8.5, 8.6, 8.7 show some typical irradiation schemes used forinstrumental NAA in different laboratories. Most of these are compromisesbetween reaching maximum sensitivity and being able to analyze as manyelements as possible using fewer irradiations. Two principally differentprocedures can be distinguished: sequential and simultaneous.
TABLE 8.5. SCHEME FOR THE DETERMINATION OF 32 ELEMENTS IN ROCKS [21](The thermal neutron flux is 1.2 x 1012 cm~2-s~' for all but the 7-30 h irradiation for whichit is 1013 cm"2'S'1)
Irradiationt im«
0.5 min
0.5 min
5 min
5 min
20-60 min
7-30 h
7-30 h
7-30 h
7-30 h
Decay time
2 min
5 min
0.5 -4 h
0.5-4h
c. 24h
4-7 d
4-7 h
3-4 weeks
c. 6 weeks
Detector
Large
Large
Luge
Small
Large
Large
Small
Large
Small
Measurementtime
2 min
5 mm
5 min
10-20 min
5-60 min
0.5-2 h
10-60 min
1-3 h
2-4 h
Elementsdetermined
AI. V
Ti, Al, Ci, V
Mn
Dy
Na, K
La, Sm, Lu
Sm, U
Se, Cr, Fe. Ni, Co, RbZr, Sb. Cs, Ba, Hf, Th
Ce, Nd, Eu, Gd.Tb, Tm, Yb, Ta
TABLE 8.6. ANALYSIS SEQUENCE FOR THE COMPLETE ANALYSIS OF A GEOLOGI-CAL SAMPLE (T: thermal neutron; E: epithermal neutron; C: coaxial detector; L: low energyphoton detector)
Irradiation Decay Measurement Elements
T l min 2 min C 5 min Al, Ti, Mn, Mg, Ça, VT 5 min 30 min L 20 min DyT 1 h 24 h C 20 min Na, KE 35 h 5 d C 20 min As, Sb, Zn, Sn, Ag, W, Mo, Au,
La, an, Ni, Fe, Co, Na, Se, Ba,Cs, Rb, Ta, U, Th, Br
T 35 h 7 d C 1 h La, Sra, Yb, Lu30 d L 3 h Ce, Nd, Eu, Gd, Tb, Tin, Yb
C 1 h Zr, Hf
131
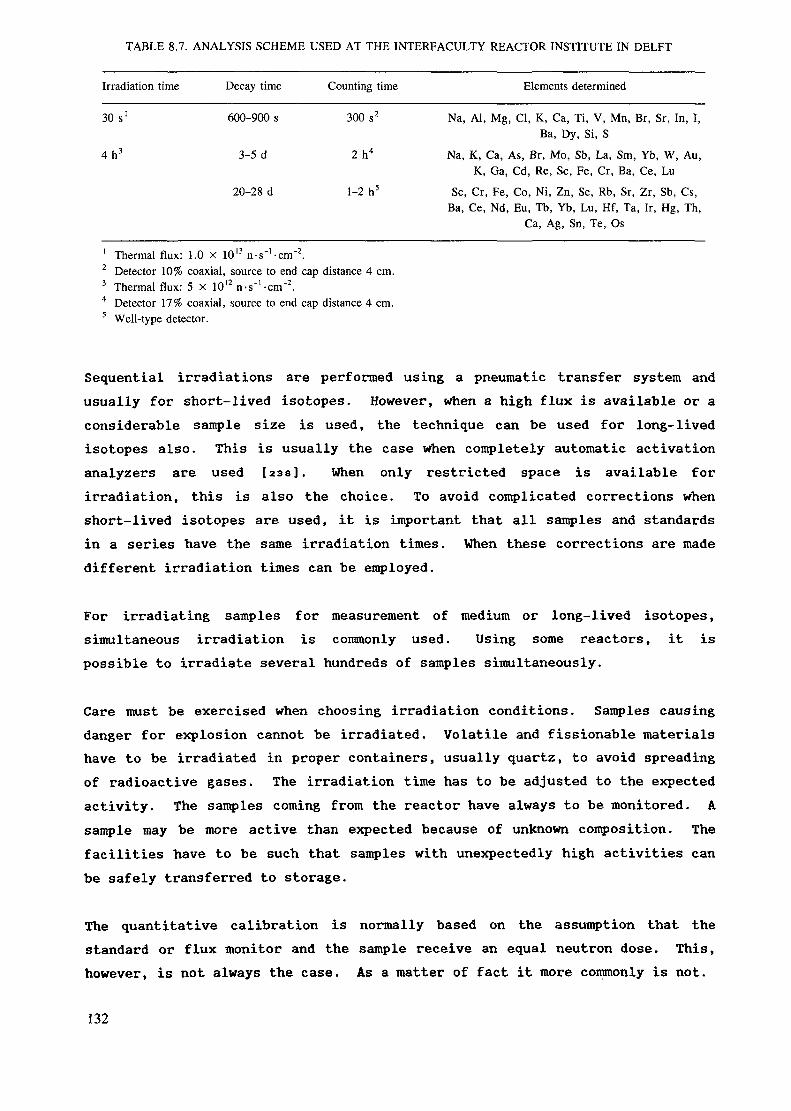
TABLE 8.7. ANALYSIS SCHEME USED AT THE INTERFACULTY REACTOR INSTITUTE IN DELFT
Irradiation time
30 s'
4 h 3
Decay time
600-900 s
3-5 d
20-28 d
Counting time
300s2
2 h 4
1-2 h5
Na,
Na,
Sc,Ba,
Al
KK
CrCe,
Mp
r»Ga
PfNd,
Elements determined
, Cl, K, Ca, Ti, V, Mn,Ba, Dy, Si, S
As, Br, Mo, Sb, La, SmCd, Re, Sc, Fe, Cr, Ba.Co, Ni, Zn, Se, Rb, Sr,
, Eu, Tb, Yb, Lu, Hf, TtÇa, Ag, Sn, Te, Os
Br,
Yb0
7,ri, Ir,
Sr, In, I,
, W, Au,, Lu
Sb, Cs,, Hg, Th,
1 Thermal flux: 1.0 x 10¹³ n-s'1-cm"2.2 Detector 10% coaxial, source to end cap distance 4 cm.3 Thermal flux: 5 X 10¹² n-s"1-cm"2 .4 Detector 17% coaxial, source to end cap distance 4 cm.5 Well-type detector.
Sequential irradiations are performed using a pneumatic transfer system andusually for short-lived isotopes. However, when a high flux is available or aconsiderable sample size is used, the technique can be used for long-livedisotopes also. This is usually the case when completely automatic activationanalyzers are used [aas]. When only restricted space is available forirradiation, this is also the choice. To avoid complicated corrections whenshort-lived isotopes are used, it is important that all samples and standardsin a series have the same irradiation times. When these corrections are madedifferent irradiation times can be employed.
For irradiating samples for measurement of medium or long-lived isotopes,simultaneous irradiation is commonly used. Using some reactors, it ispossible to irradiate several hundreds of samples simultaneously.
Care must be exercised when choosing irradiation conditions. Samples causingdanger for explosion cannot be irradiated. Volatile and fissionable materialshave to be irradiated in proper containers, usually quartz, to avoid spreadingof radioactive gases. The irradiation time has to be adjusted to the expectedactivity. The samples coming from the reactor have always to be monitored. Asample may be more active than expected because of unknown composition. Thefacilities have to be such that samples with unexpectedly high activities canbe safely transferred to storage.
The quantitative calibration is normally based on the assumption that thestandard or flux monitor and the sample receive an equal neutron dose. This,however, is not always the case. As a matter of fact it more commonly is not.
132
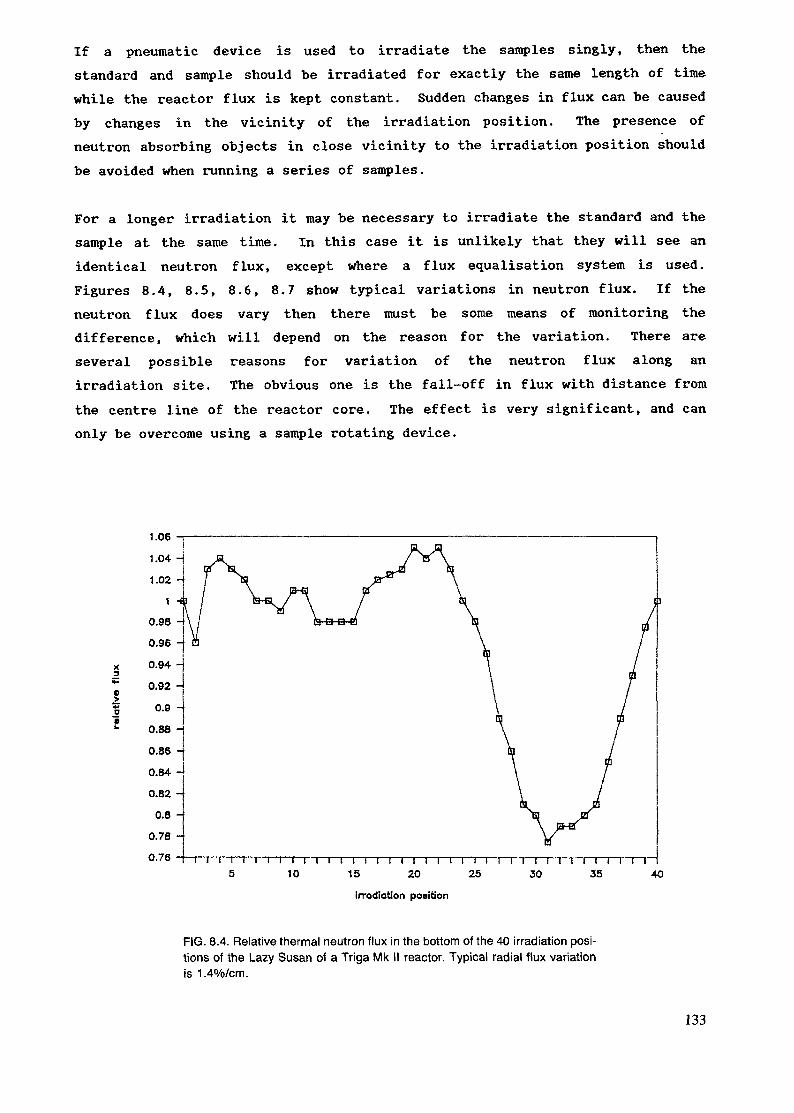
If a pneumatic device is used to irradiate the samples singly, then thestandard and sample should be irradiated for exactly the same length of timewhile the reactor flux is kept constant. Sudden changes in flux can be causedby changes in the vicinity of the irradiation position. The presence ofneutron absorbing objects in close vicinity to the irradiation position shouldbe avoided when running a series of samples.
For a longer irradiation it may be necessary to irradiate the standard and thesample at the same time. In this case it is unlikely that they will see anidentical neutron flux, except where a flux equalisation system is used.Figures 8.4, 8.5, 8.6, 8.7 show typical variations in neutron flux. If theneutron flux does vary then there must be some means of monitoring thedifference, which will depend on the reason for the variation. There areseveral possible reasons for variation of the neutron flux along anirradiation site. The obvious one is the fall-off in flux with distance fromthe centre line of the reactor core. The effect is very significant, and canonly be overcome using a sample rotating device.
irradiotion position
FIG. 8.4. Relative thermal neutron flux in the bottom of the 40 irradiation posi-tions of the Lazy Susan of a Triga Mk II reactor. Typical radial flux variationis 1.4%/cm.
133
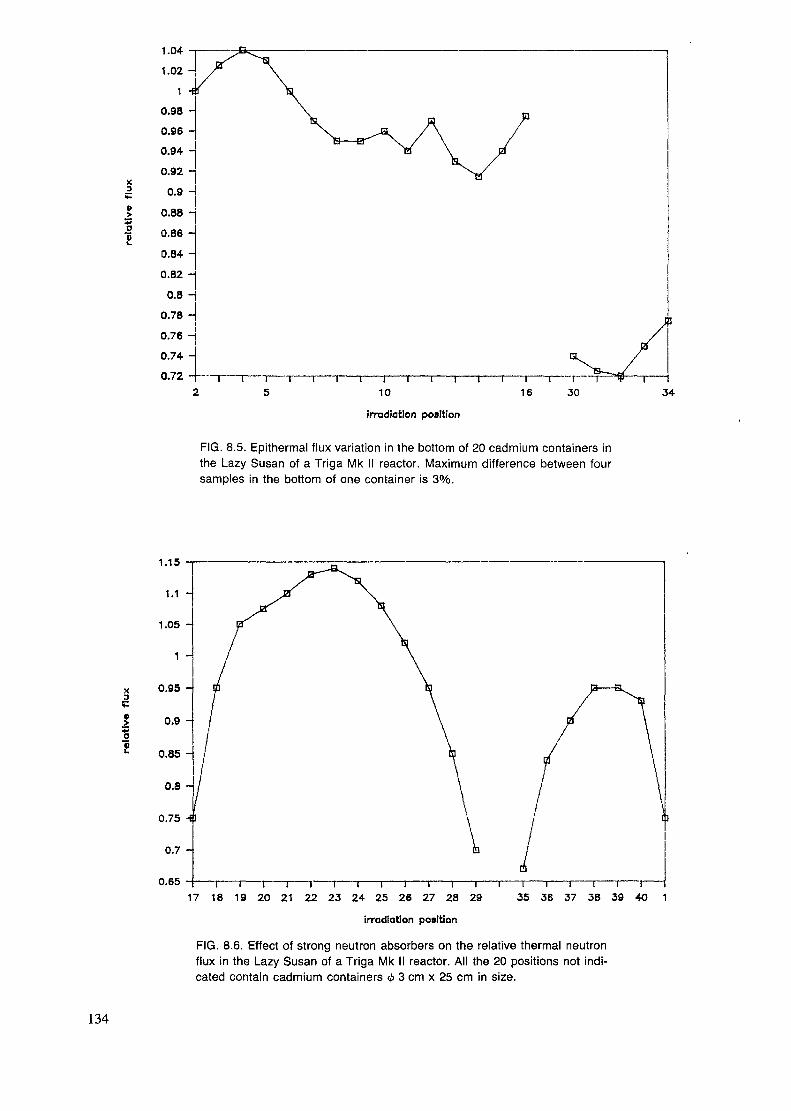
1.04
0.86 -
0.84 -
0.82 -
0.8 -
0.78 -
0.76 -
0.74 -
0.72 ——i——i——i——r~10
irradiation position
16
FIG. 8.5. Epithermal flux variation in the bottom of 20 cadmium containers inthe Lazy Susan of a Triga Mk II reactor. Maximum difference between foursamples in the bottom of one container is 3%.
1.15
17 18 19 20 21 22 23 24 25 26 27 28 29T——i——i——i——i——r
35 36 37 38 39 40 1
irradiation position
FIG. 8.6. Effect of strong neutron absorbers on the relative thermal neutronflux in the Lazy Susan of a Triga Mk II reactor. All the 20 positions not indi-cated contain cadmium containers <f> 3 cm x 25 cm in size.
134
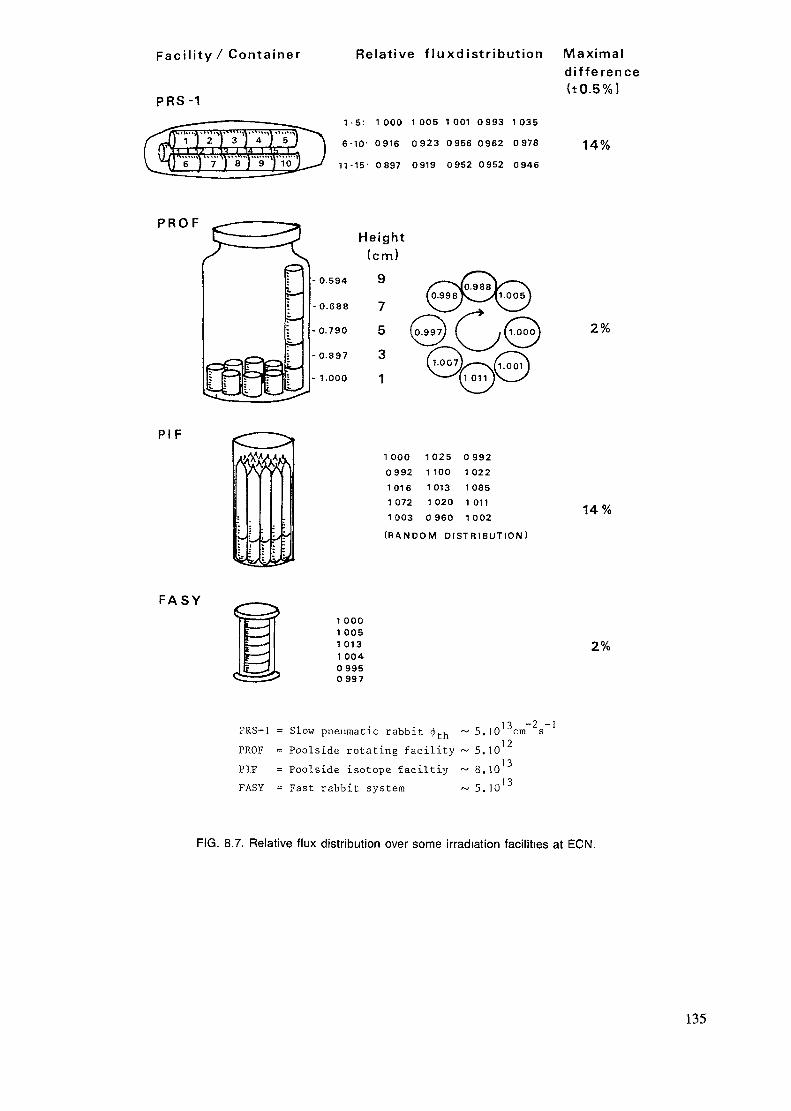
Facility / Container
PRS-1
Relative f luxdistr ibution Maximaldi f ference( tO .5%)
1 -5 : 1000 1005 1001 0993 1035
6-10- 0916 0923 0956 0962 0978 14%
11-15- 0897 0919 0952 0952 0946
P R O F
0.594
•0.688
0.790
• 0.897
1.000
Height(cm)97531
2%
PIF
F A S Y
^
(\
—
*fe
<
c =
f]'a
• 1 ™
————
Fr
L
•— -^.-*•••**.«>— *é
^
**p>
1 0001 0051 0131 0040 9950 997
1 000 1025 0 992
0992 1 100 1 022
1016 1013 10851 072 1 020 1 011
1 003 0 960 1 002
( R A N D O M D I S T R I B U T I O N )
14%
2%
PRS-1 = Slow pneumatic rabbit <!>tu ~ 5.1012PROF = Poolside rotating facility ~ 5.10
PIF = Poolside isotope faciltiyFASY = Fast rabbit system
8.10
5.10
FIG. 8.7. Relative flux distribution over some irradiation facilities at ECN.
135
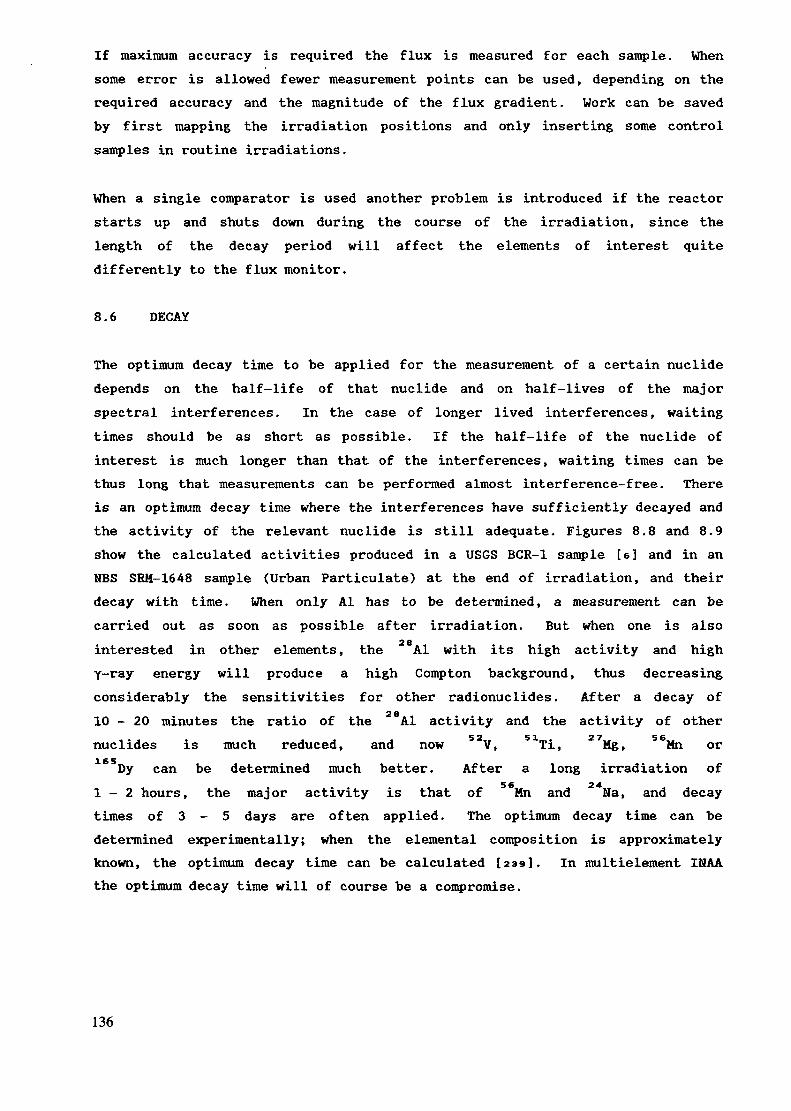
If maximum accuracy is required the flux is measured for each sample. Whensome error is allowed fewer measurement points can be used, depending on therequired accuracy and the magnitude of the flux gradient. Work can be savedby first mapping the irradiation positions and only inserting some controlsamples in routine irradiations.
When a single comparator is used another problem is introduced if the reactorstarts up and shuts down during the course of the irradiation, since thelength of the decay period will affect the elements of interest quitedifferently to the flux monitor.
8.6 DECAY
The optimum decay time to be applied for the measurement of a certain nuclidedepends on the half-life of that nuclide and on half-lives of the majorspectral interferences. In the case of longer lived interferences, waitingtimes should be as short as possible. If the half-life of the nuclide ofinterest is much longer than that of the interferences, waiting times can bethus long that measurements can be performed almost interference-free. Thereis an optimum decay time where the interferences have sufficiently decayed andthe activity of the relevant nuclide is still adequate. Figures 8.8 and 8.9show the calculated activities produced in a USGS BCR-1 sample [s] and in anNBS SRM-1648 sample (Urban Particulate) at the end of irradiation, and theirdecay with time. When only Al has to be determined, a measurement can becarried out as soon as possible after irradiation. But when one is alsointerested in other elements, the Al with its high activity and highy-ray energy will produce a high Compton background, thus decreasingconsiderably the sensitivities for other radionuclides. After a decay of10 - 20 minutes the ratio of the Al activity and the activity of othernuclides is much reduced, and now V, Ti, Mg, Mn or
Dy can be determined much better. After a long irradiation of1-2 hours, the major activity is that of Mn and Na, and decaytimes of 3 - 5 days are often applied. The optimum decay time can bedetermined experimentally; when the elemental composition is approximatelyknown, the optimum decay time can be calculated [239]. In multielement INAAthe optimum decay time will of course be a compromise.
136
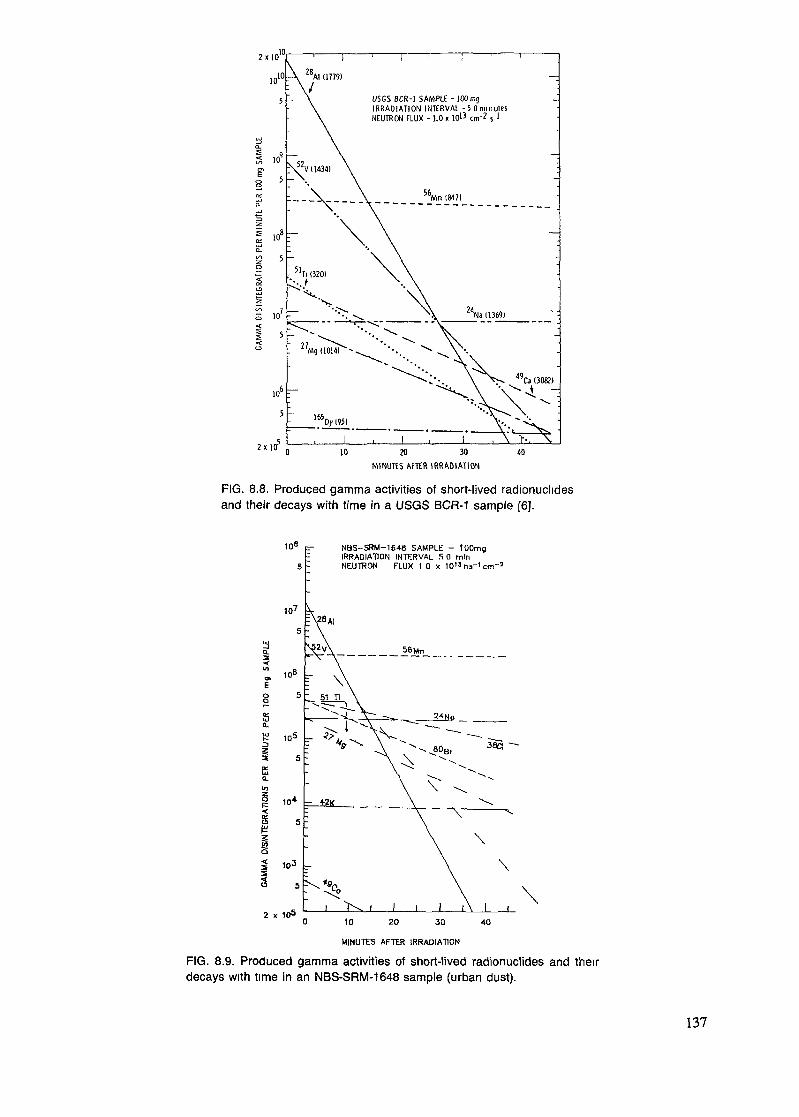
2x10
U5GS BCR-1 SAMPLE - 100mgIRRADIATION INTERVAL - 5 0 minules
20 30MINUTES AFTER IRRADIATION
10
FIG. 8.8, Produced gamma activities of short-lived radionuchdesand their decays with time in a USGS BCR-1 sample [6].
10s p- NBS-SRM-1648 SAMPLE - 100mgIRRADIATION INTERVAL 5 0 mlnNEUTRON FLUX 1 0 x 10"na-'cm-2
2 x 10s
4O10 20 30
MINUTES AFTER IRRADIATION
FIG. 8.9. Produced gamma activities of short-lived radionuclides and theirdecays with time in an NBS-SRM-1648 sample (urban dust).
137
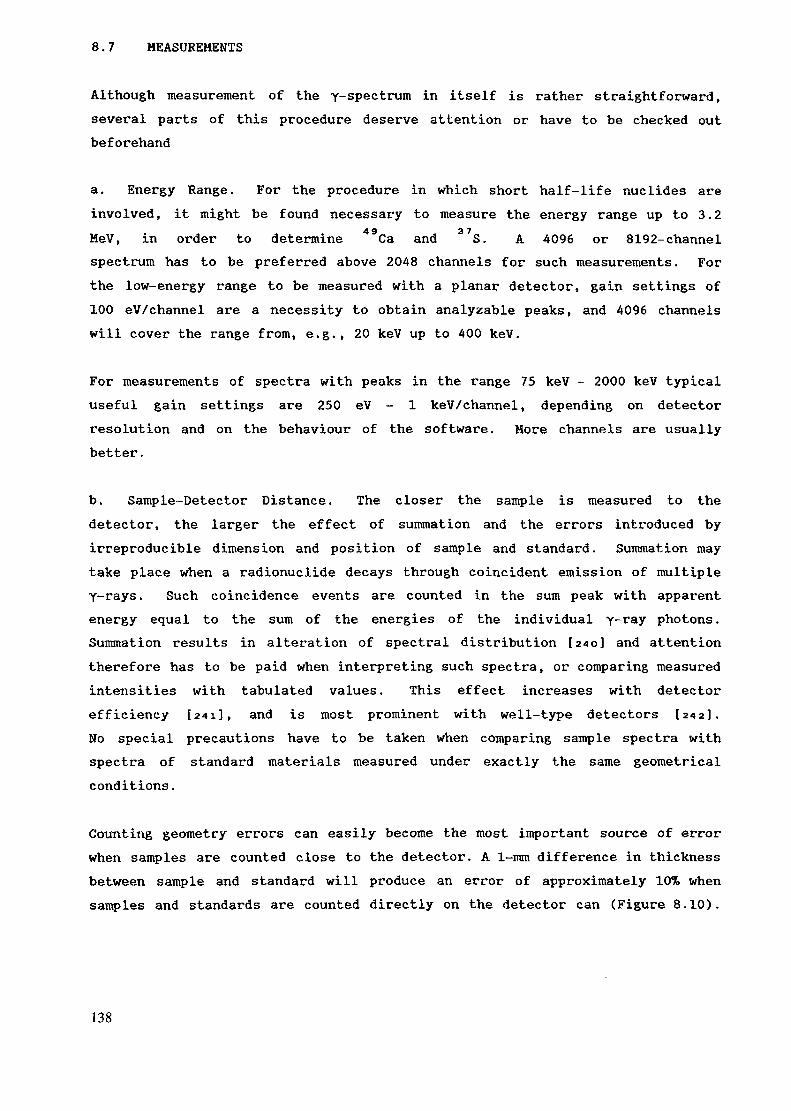
8.7 MEASUREMENTS
Although measurement of the y-spectrum in itself is rather straightforward,several parts of this procedure deserve attention or have to be checked outbeforehand
a. Energy Range. For the procedure in which short half-life nuclides areinvolved, it might be found necessary to measure the energy range up to 3.2MeV, in order to determine Ca and S. A 4096 or 8192-channelspectrum has to be preferred above 2048 channels for such measurements. Forthe low-energy range to be measured with a planar detector, gain settings of100 eV/channel are a necessity to obtain analyzable peaks, and 4096 channelswill cover the range from, e.g., 20 keV up to 400 keV.
For measurements of spectra with peaks in the range 75 keV - 2000 keV typicaluseful gain settings are 250 eV - 1 keV/channel, depending on detectorresolution and on the behaviour of the software. More channels are usuallybetter.
b. Sample-Detector Distance. The closer the sample is measured to thedetector, the larger the effect of summation and the errors introduced byirreproducible dimension and position of sample and standard. Summation maytake place when a radionuclide decays through coincident emission of multipleY-rays. Such coincidence events are counted in the sum peak with apparentenergy equal to the sum of the energies of the individual y-ray photons.Summation results in alteration of spectral distribution [2*0] and attentiontherefore has to be paid when interpreting such spectra, or comparing measuredintensities with tabulated values. This effect increases with detectorefficiency [241], and is most prominent with well-type detectors [242].No special precautions have to be taken when comparing sample spectra withspectra of standard materials measured under exactly the same geometricalconditions.
Counting geometry errors can easily become the most important source of errorwhen samples are counted close to the detector. A 1-mm difference in thicknessbetween sample and standard will produce an error of approximately 10% whensamples and standards are counted directly on the detector can (Figure 8.10).
138
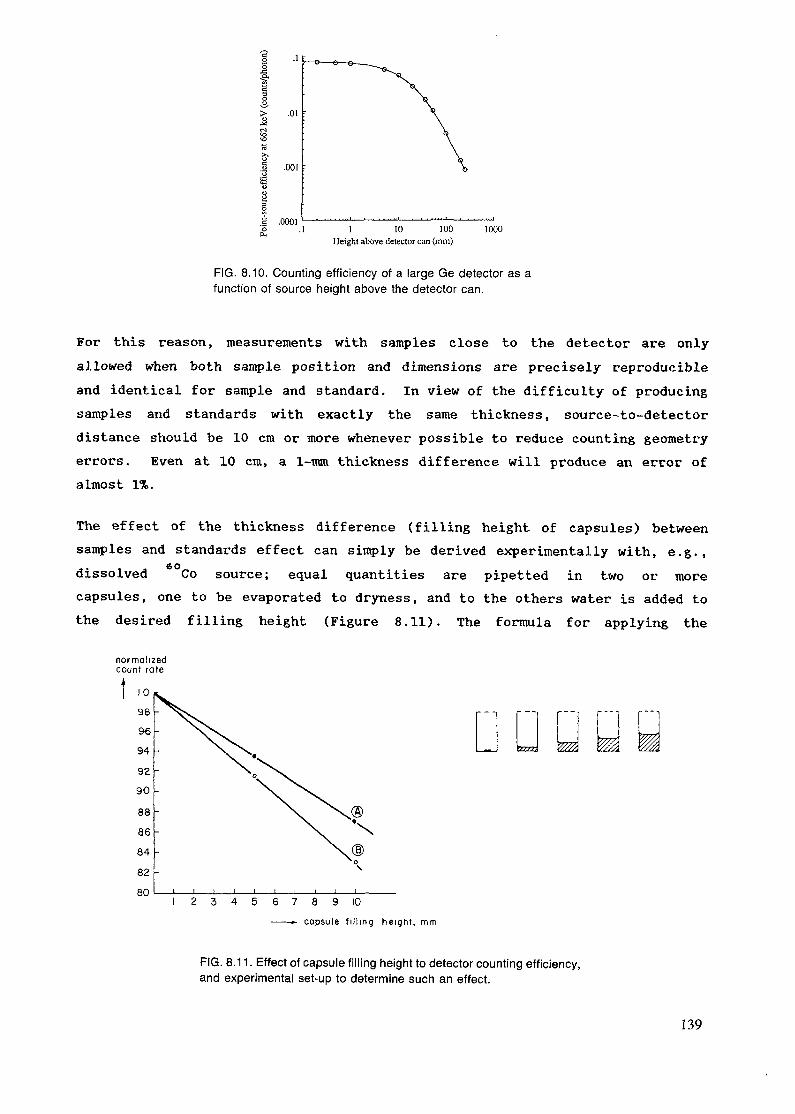
.0001l 10 100
Height above detector can (mm)1000
FIG. 8.10. Counting efficiency of a large Ge detector as afunction of source height above the detector can.
For this reason, measurements with samples close to the detector are onlyallowed when both sample position and dimensions are precisely reproducibleand identical for sample and standard. In view of the difficulty of producingsamples and standards with exactly the same thickness, source-to-detectordistance should be 10 cm or more whenever possible to reduce counting geometryerrors. Even at 10 cm, a 1-mm thickness difference will produce an error ofalmost 1%.
The effect of the thickness difference (filling height of capsules) betweensamples and standards effect can simply be derived experimentally with, e.g.,dissolved Co source; equal quantities are pipetted in two or morecapsules, one to be evaporated to dryness, and to the others water is added tothe desired filling height (Figure 8.11). The formula for applying the
normalizedcount rate
7 8 9 10» capsule filling height, mm
FIG. 8.11. Effect of capsule filling height to detector counting efficiency,and experimental set-up to determine such an effect.
139
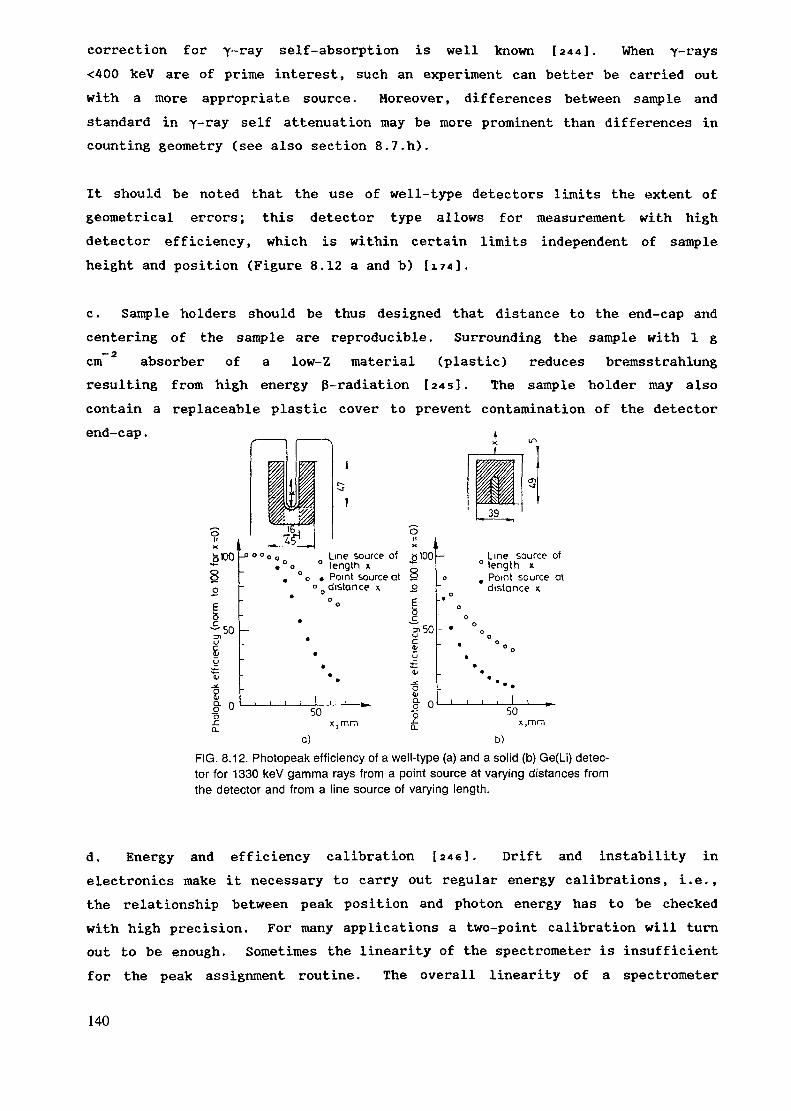
correction for y-ray self-absorption is well known [244]. When y-rays<400 keV are of prime interest, such an experiment can better be carried outwith a more appropriate source. Moreover, differences between sample andstandard in y-ray self attenuation may be more prominent than differences incounting geometry (see also section 8.7.h).
It should be noted that the use of well-type detectors limits the extent ofgeometrical errors; this detector type allows for measurement with highdetector efficiency, which is within certain limits independent of sampleheight and position (Figure 8.12 a and b) [174].
c. Sample holders should be thus designed that distance to the end-cap andcentering of the sample are reproducible. Surrounding the sample with l gcm absorber of a low-Z material (plastic) reduces bremsStrahlungresulting from high energy ß-radiation [245]. The sample holder may alsocontain a replaceable plastic cover to prevent contamination of the detectorend-cap. __ __ »
W ^
titHfsH0 J6J|(X
o^OO
8O
ÊO
"t,50U
£u£(L"
"Oai
«• — — — »i
x LT>t T
1
T
HUPjjjjj -,, 39
oIIx ,
-o o o o o Line source of fc 100,°o ° length x ~. °o • Point source at ö
o 0 distance x o
§e?50
* c* u
,C
i-• ^yr
OQj
i i i 1 1 ^ 0 - r ,
— Line source of0 length xo 9 Point source at
distance x
O
0
• °O
O• ° «
°0
*;1 i 1 1 1
% ° 50 - * " 50 'x,mm x,mrna) b)
FIG. 8.12. Photopeak efficiency of a well-type (a) and a solid (b) Ge(Li) detec-tor for 1330 keV gamma rays from a point source at varying distances fromthe detector and from a line source of varying length.
d. Energy and efficiency calibration [24s]. Drift and instability inelectronics make it necessary to carry out regular energy calibrations, i.e.,the relationship between peak position and photon energy has to be checkedwith high precision. For many applications a two-point calibration will turnout to be enough. Sometimes the linearity of the spectrometer is insufficientfor the peak assignment routine. The overall linearity of a spectrometer
140
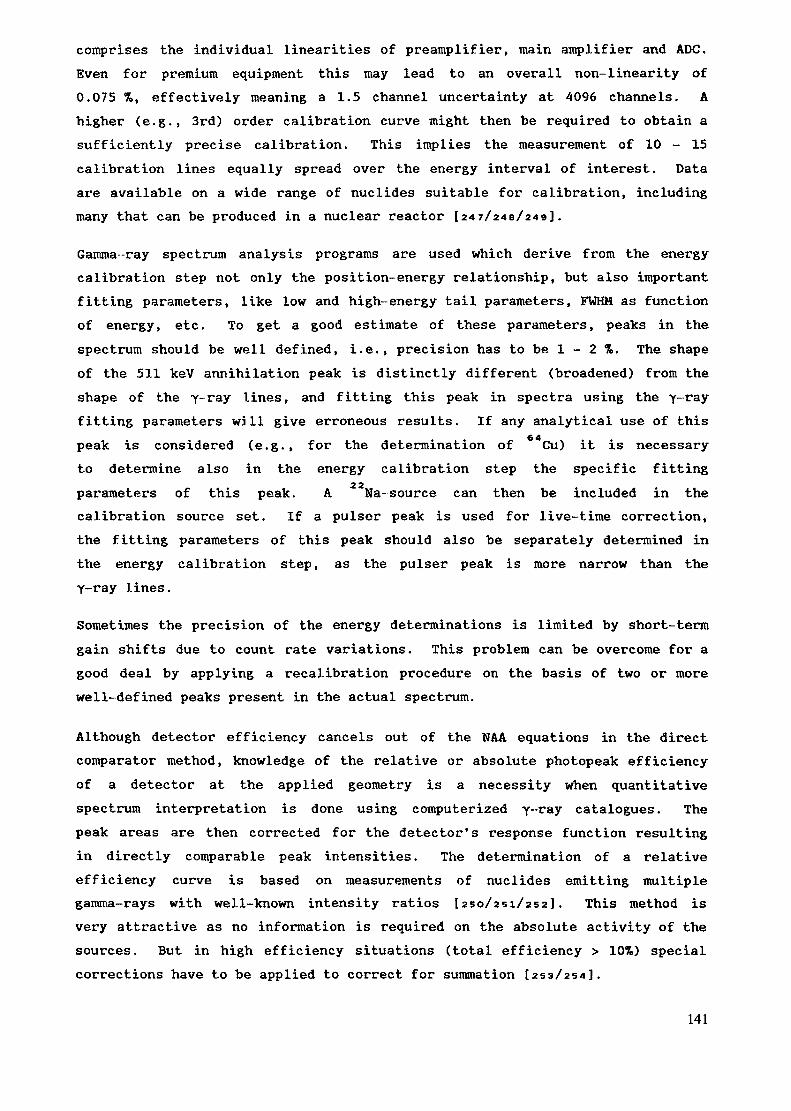
comprises the individual linearities of preamplifier, main amplifier and ADC.Even for premium equipment this may lead to an overall non-linearity of0.075 %, effectively meaning a 1.5 channel uncertainty at 4096 channels. Ahigher (e.g., 3rd) order calibration curve might then be required to obtain asufficiently precise calibration. This implies the measurement of 10 - 15calibration lines equally spread over the energy interval of interest. Dataare available on a wide range of nuclides suitable for calibration, includingmany that can be produced in a nuclear reactor [247/249/249].
Gamma-ray spectrum analysis programs are used which derive from the energycalibration step not only the position-energy relationship, but also importantfitting parameters, like low and high-energy tail parameters, FWHM as functionof energy, etc. To get a good estimate of these parameters, peaks in thespectrum should be well defined, i.e., precision has to be 1 - 2 %. The shapeof the 511 keV annihilation peak is distinctly different (broadened) from theshape of the y-ray lines, and fitting this peak in spectra using the y-rayfitting parameters will give erroneous results. If any analytical use of thispeak is considered (e.g., for the determination of Cu) it is necessaryto determine also in the energy calibration step the specific fittingparameters of this peak. A Na-source can then be included in thecalibration source set. If a pulser peak is used for live-time correction,the fitting parameters of this peak should also be separately determined inthe energy calibration step, as the pulser peak is more narrow than they-ray lines.
Sometimes the precision of the energy determinations is limited by short-termgain shifts due to count rate variations. This problem can be overcome for agood deal by applying a recalibration procedure on the basis of two or morewell-defined peaks present in the actual spectrum.
Although detector efficiency cancels out of the NAA equations in the directcomparator method, knowledge of the relative or absolute photopeak efficiencyof a detector at the applied geometry is a necessity when quantitativespectrum interpretation is done using computerized y-ray catalogues. Thepeak areas are then corrected for the detector's response function resultingin directly comparable peak intensities. The determination of a relativeefficiency curve is based on measurements of nuclides emitting multiplegamma-rays with well-known intensity ratios [250/251/252]. This method isvery attractive as no information is required on the absolute activity of thesources. But in high efficiency situations (total efficiency > 10%) specialcorrections have to be applied to correct for summation [253/254].
141
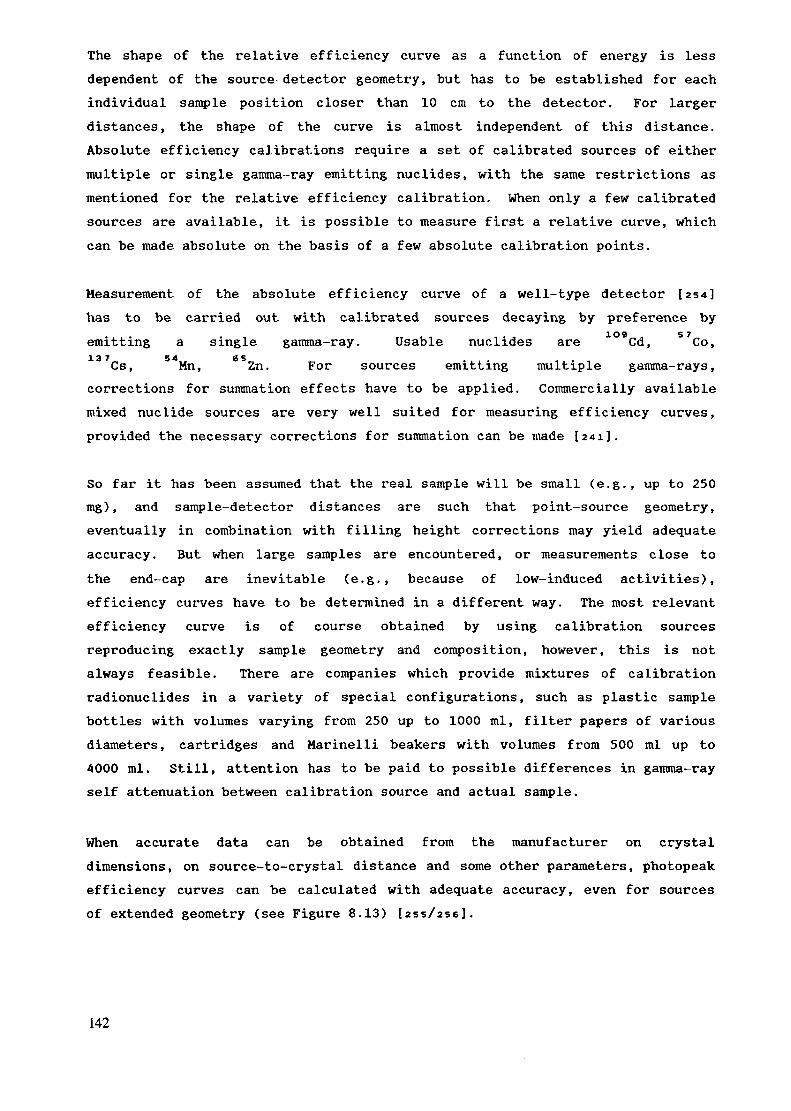
The shape of the relative efficiency curve as a function of energy is Lessdependent of the source-detector geometry, but has to be established for eachindividual sample position closer than 10 cm to the detector. For largerdistances, the shape of the curve is almost independent of this distance.Absolute efficiency calibrations require a set of calibrated sources of eithermultiple or single gamma-ray emitting nuclides, with the same restrictions asmentioned for the relative efficiency calibration. When only a few calibratedsources are available, it is possible to measure first a relative curve, whichcan be made absolute on the basis of a few absolute calibration points.
Measurement of the absolute efficiency curve of a well-type detector [254]has to be carried out with calibrated sources decaying by preference byemitting a single gamma-ray. Usable nuclides are Cd, Co,
Cs, Mn, Zn. For sources emitting multiple gamma-rays,corrections for summation effects have to be applied. Commercially availablemixed nuclide sources are very well suited for measuring efficiency curves,provided the necessary corrections for summation can be made [241].
So far it has been assumed that the real sample will be small (e.g., up to 250mg), and sample-detector distances are such that point-source geometry,eventually in combination with filling height corrections may yield adequateaccuracy. But when large samples are encountered, or measurements close tothe end-cap are inevitable (e.g., because of low-induced activities),efficiency curves have to be determined in a different way. The most relevantefficiency curve is of course obtained by using calibration sourcesreproducing exactly sample geometry and composition, however, this is notalways feasible. There are companies which provide mixtures of calibrationradionuclides in a variety of special configurations, such as plastic samplebottles with volumes varying from 250 up to 1000 ml, filter papers of variousdiameters, cartridges and Marinelli beakers with volumes from 500 ml up to4000 ml. Still, attention has to be paid to possible differences in gamma-rayself attenuation between calibration source and actual sample.
When accurate data can be obtained from the manufacturer on crystaldimensions, on source-to-crystal distance and some other parameters, photopeakefficiency curves can be calculated with adequate accuracy, even for sourcesof extended geometry (see Figure 8.13) [255/256].
142
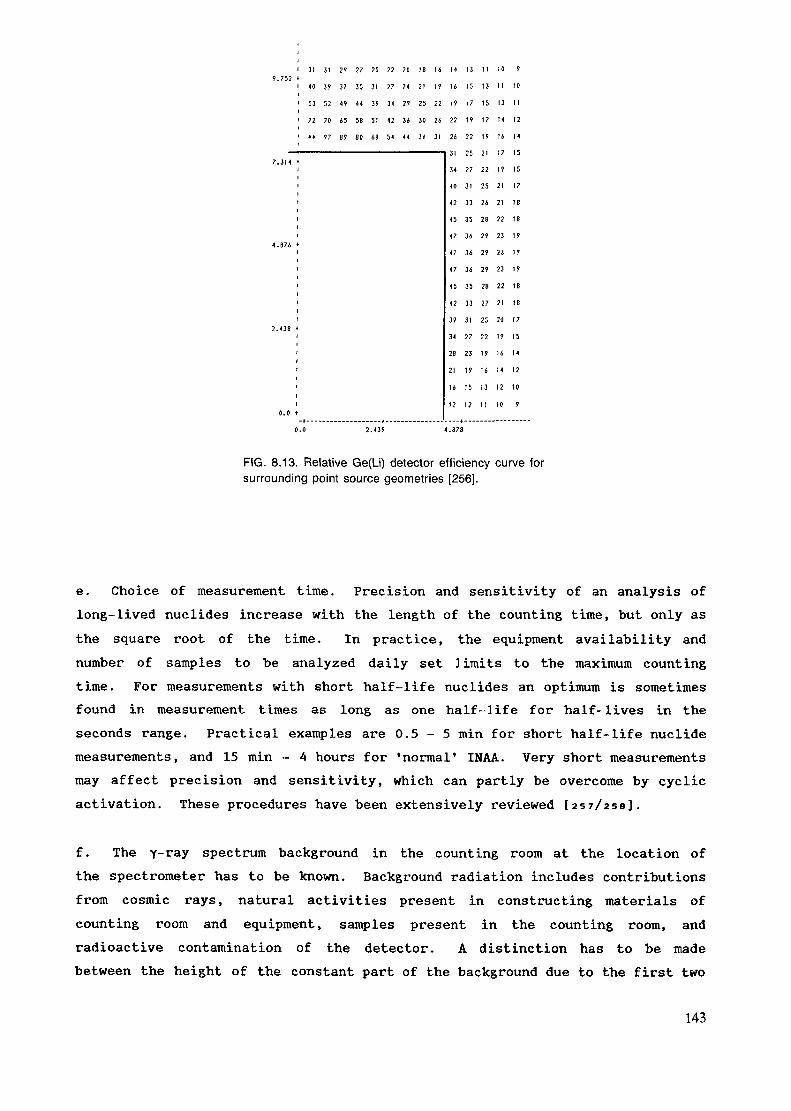
3l 3l 29 27 25 22 20 18 16 14 13 11 10 940 39 37 35 3l 27 24 21 19 16 15 13 II 10
53 52 49 44 39 34 29 25 22 i9 |7 15 13 II
72 70 65 58 5l 42 36 30 26 22 19 17 14 12*« 97 B9 80 68 54 44 36 3l 26 22 19 16 M
3l 25 21 17 1534 27 22 19 1540 3l 25 2l 1742 33 26 21 1845 35 28 22 1847 36 2? 23 1947 36 29 23 19
47 36 29 23 19
45 35 28 22 18
42 33 27 2l 1839 31 25 20 17
34 27 22 19 1528 23 19 16 142l 19 16 14 12
16 15 13 12 1012 12 II 10 9
2.439 4.B78
FIG. 8.13. Relative Ge(Li) detector efficiency curve forsurrounding point source geometries [256].
e. Choice of measurement time. Precision and sensitivity of an analysis oflong-lived nuclides increase with the length of the counting time, but only asthe square root of the time. In practice, the equipment availability andnumber of samples to be analyzed daily set limits to the maximum countingtime. For measurements with short half-life nuclides an optimum is sometimesfound in measurement times as long as one half-life for half-lives in theseconds range. Practical examples are 0.5-5 min for short half-life nuclidemeasurements, and 15 min - 4 hours for 'normal* INAA. Very short measurementsmay affect precision and sensitivity, which can partly be overcome by cyclicactivation. These procedures have been extensively reviewed [257/250].
f. The Y-ray spectrum background in the counting room at the location ofthe spectrometer has to be known. Background radiation includes contributionsfrom cosmic rays, natural activities present in constructing materials ofcounting room and equipment, samples present in the counting room, andradioactive contamination of the detector. A distinction has to be madebetween the height of the constant part of the background due to the first two
143
sources, and the variable part of the background. The following measurementsare suggested to be carried out :
a long measurement during 24 or 48 hours, with all sample sourcesremoved. This gives information on the constant part of the background.
- a similar measurement during the maximum counting time to be applied,but under realistic conditions, i.e., with sources in the counting roomand sample changers fully loaded gives an idea on the quality ofapplied shielding. This measurement has to be carried out regularly asthe contributions may vary strongly.
g. Of equal importance is to know the spectral distribution of a 'blank*irradiated sample capsule. Such measurements can be made during each batch ofsamples to be analyzed .
h. When measuring samples of finite size, part of the radiation will beabsorbed in the sample itself, and thus be prevented from reaching thedetector. When analyzing a 100-mg sample of low Z material such as biologicalspecimen or silicates, the effect of self-absorption can be neglected above100 keV. But for larger samples, high-Z matrices or when measuring low energyphotons, certain measures must be taken in order to avoid inaccuracies in theresults :
- use of sample and standards with identical dimensions, density andmatrix composition [as], or
calculation of sample self-absorption from the known sample dimensions,density, and composition [259], or
experimental determination of sample self-absorption from transmissionor backscatter measurements [260], or
- calculation of self-absorption from changes in actual sample spectra[244].
The first two methods require a priori knowledge of the sample composition.Application of the last two methods implies a complication of eithermeasurement or spectrum analysis procedure. If no such special measures aretaken, the sample size has to be so small [261/262} that errors due to
144
self-absorption stay within the limits set by the required analyticalprecision.
i. Corrections have to be applied for dead time due to finite time (10 - 100Vis) required for the ADC to digitize a detector pulse, and for randomcoincidence (pile-up) losses due to the finite resolving time of the amplifier[i79/i8o/263]. Depending on the speed of the ADC and the shaping time ofthe amplifier, each of these effects may cause errors of 10% or more atcounting rates less than 10000 c.p.s. The IAEA has conducted anintercomparison of the various methods of correcting rate-related countinglosses; several methods have shown to work well when correctly used [264].The most commonly used methods are:
use of the dead-time correction circuit in a multichannel analyzer.This corrects very well for ADC dead time but not at all for pile-up.
- a pile-up inspection circuit in the amplifier which generates an outputlogic pulse whenever two input pulses overlap in time too closely forthe amplifier to shape them properly. The logic pulse is used toreject the analog pulse at the linear gate of the ADC. This removessummed events from the high-energy end of the spectrum and improves theresolution of all peaks at moderately high counting rates. To obtainthe correct counting rate the live time must also be corrected for thetime required for this logic to be performed; not all combinations ofamplifier and ADC do this properly.
- correcting the live time for pile-up losses (with or without a pile-uprejection circuit) by calculation, using a factor of the form exp(- P*DT/LT), where DT is the dead time, LT is the live time and P, aconstant related to the resolving time of the amplifier [aes/ieo].
use of a reference peak in the spectrum, originating from a pulsegenerator connected to the spectrometer or from a fixed radioactivesource with very long half life. This method can give very accurateresults, but there may be a deterioration in the resolution from thepresence of a pulser and an increase in the Compton baseline if asource is used.
- use of advanced electronics to correct the counting rate in real timeby actively restoring lost pulses [ise].
145
Problems occur when measuring a mixture of radionuclides with stronglydifferent half-lives, which decay considerably during measurement. Thissituation normally occurs in INAA with short half-life radio-nuclides. Even when the overall correction for dead-time or pulsepile-up is correct, overcompensation may occur for nuclides with longhalf-life, and undercompensation for nuclides with short half-life.Proper correction requires the use of a dedicated electronic unit[266/267] or additional computer processing of the measured spectra[268/269]. Also loss-free counting circuits using compensating pulsestorage and a virtual pulser [ise] have been developed to solve thisproblem.
j. In applications of INAA where only one or a limited number of nuclidesis of interest, it can be considered not to read out and analyze theentire measured spectrum, but to use regions of interest (ROI) set onthe peaks of interest; most modern multichannel analyzers have thisoption. The advantage lies in speed and reduced storage space fordata; the disadvantage is the risk of disregarding other valuable data.
8.7.1. MANUAL OPERATIONS
Manual procedures have some distinct advantages above automatic procedures.It is probably the most sensible way to understand procedure and spectrometer,in particular when new materials have to be analyzed or when trouble isencountered. By doing all steps in an analysis by hand, the user meets themajority of possible difficulties and sources of errors. Moreover, it is abetter opportunity to observe the recorded y-ray spectrum. Spectrumdistortion is often more rapidly noticed in a manual procedure than in anautomatic one, in which direct observation of every individual recordedspectrum seldom occurs. The semi-logarithmic display of the y-ray spectrumis a valuable aid to the analyst to observe the occurence of count rateeffects, instability, drifts, peak shape alteration or high noise levels.Regular observation of spectra contributes to a better insight in thedifferent types of spectra that may occur, and to a better understanding ofthe results of spectrum analysis. Manual procedures are therefore ideal fortraining, and for test procedures, for determining sensitivity versussample-detector distance.
146
8.7.2. AUTOMATIC OPERATIONS
In automatic procedures the emphasis will often lie on throughput of samples.As a result, there is a realistic risk of getting sloppy. Processing manysamples a day implies that little opportunity remains to check whether in eachindividual measurement all conditions were fullfilled so that results reflectrealistic situations. Measurements in which something has gone wrong may bediscovered' sometimes many days later, when results are being interpreted.Several precautions should therefore be taken :
a. The position in the sample changer of the sample being measured shouldbe read-out, e.g., by printing on hard copy or by storage with spectrumdata. The most effective measure would of course be to read out thecode number on the sample container itself. Other feedbacks to hardcopy may include the confirmation that a sample has indeed been nearthe detector, the time of the day and the day of the year themeasurement was started and stopped, sample-detector distance, anddead-time.
b. Measurement of an unirradiated capsule gives information on bothcontamination of sample changer or sample holder, and on theeffectiveness of the shielding. Results of measurements betweenseveral batches of samples can be used to locate a leaking capsule. Itwill be obvious that such a precaution is only effective, when resultsare checked as quickly as possible after measurements have beencompleted.
c. Usually sample-detector distances are set on the basis of experiencefor certain types of activated material. Still sometimes a too activesample may occur in a batch; in automatic procedures seldom will thisbe noticed in time. To some extent it is a waste of time to carry outmeasurements of these samples as spectra may be strongly distorted.Measurement systems have been developed in which the total sample countrate is quickly monitored, in a few seconds, using a G.M. counterbefore measurement starts. At a too high count rate, either the sampleis skipped, and the procedure proceeds with the next sample, orsample-detector distance is automatically enlarged [270]. In thelatter solution a feedback signal to control has to be fired too.
147
d. Another nuisance of an unexpected too-active sample occurs when themeasurement is carried out with the analyzer in live-time mode. A highdead-time will then involve a longer real or clock-time than wasforeseen, and the entire measuring schedule may be disturbed. Real orclock-time setting of the analyzer has therefore always to bepreferred. When the automatic procedure is computer controlled, someof these precautions and checks can be included in the procedure. Asan example, a file can be stored on disk with 'normal' background dataor 'blank' spectral data. At completion of the analysis of the spectraof the blank and/or unirradiated vial of a batch, the computer mayquickly compare the new results with the stored data, and, ifnecessary, fire an alarm signal.
On entering the field of automated INAA procedures, it is important toevaluate the capabilities of the technical staff with respect toimmediate assistance when a sample changer or spectrometermalfunctions. Measuring schedules should not be so tight that there islittle time for maintenance.
8.8. DATA PROCESSING
Only a brief outline of data processing in activation analysis can be givenhere; textbooks and conference proceedings [271] should be consulted fordetails. The calculations of activation analysis have been discussed insection 2.2.3, and in the reference works listed in chapter 11.
Spectral data from the MCA are usually transferred to computer disk forarchiving and for complete qualitative and quantitative analysis. A number ofhardware manufacturers' programs do an adequate job of finding net peak areas[272/273], Only a few programs are commercially available which perform thecalculations specific to NAA: correcting for interferences, comparing sampleswith standards or with monitors, and averaging multiple gamma rays or multiplespectra. Mini and superminicomputer programs exist, but as yet there are nowell-tested program packages readily available for personal computers. Manyuniversity groups and other users have written programs for spectral analysisand NAA; some (for example, varieties of SAMPO [274/137], GAMANAL [ise/275], and TEABAGS [i»o]) are fairly widely distributed and are in use inseveral laboratories. Most of these are written for larger computers, thoughsome are being transported to personal computers.
148
Most activation analysts use the comparator method of analysis, using theratio of the counting rate of samples to that of one or more standardsirradiated and counted at the same time. A great advantage of this approachis that most sources of systematic error - flux gradients, detector efficiencyvariations, and count-rate related nonlinearities - can usually be made tocancel in the design of the measurement procedure. A disadvantage is that thepreparation, irradiation, and counting of standards for all elements to hemeasured requires time and lahor that could be used for sample analysis.Another disadvantage sometimes cited is that the experimental uncertainties inthe preparation and assay of the standards add to the uncertainty of thesample analysis, although it is preferable to consider that this additionalinformation is desirable in assessing the true uncertainty in the totalmeasurement process.
An attractive alternative to the comparator method is the so-called "absolute"method of activation analysis, in which the concentration of the elementssought for is computed from the observed activity (counting rate divided bydetector efficiency) of the sample, the activity of a flux monitor such as acobalt wire irradiated with the sample, and the cross sections for productionof the radionuclides observed. Experience (sometimes bitter) has shown thattabulated cross sections and gamma-ray yields are not sufficiently accuratefor reliable analysis, so that in practice it is necessary to measureexperimentally the ratios of the production rates of each element to that ofthe flux monitor for a particular irradiation facility. Particularly when asuite of many similar samples are to be analyzed, this modified method hasgiven reliable results.
A compromise between comparator and absolute activation analysis has beenshown to give reliable results once a modest amount of calibration work hasbeen carried out for a particular irradiation and detection system [276].This method employs dimensionless parameters k(0) and Q(0) to characterizethermal and epithermal reaction reaction rates so that many of theinaccuracies in the purely absolute method are made to cancel in thecalculation of elemental concentrations.
It is important to note that the method takes into account nuclear reactionsby thermal and epithermal neutrons - which are of the (n,y)-type, and forthis the data collected by the Ghent-group is very valuable (though for someimportant half-life nuclides still kO-values have to be acquired). For notfully thermalized facilities, where also (n,p), (n,a), etc. reactions withfast neutrons may occur, the user has to make his own additional calibrations.
149
A number of corrections must be taken into account in processing gamma-rayspectra into elemental concentrations. Spectral interferences may often betaken into account by correcting an interfered-with peak by measuring anaccompanying clean peak of the interfering nuclide. Most of the troublesomeinterferences are well characterized, and are tabulated in the Appendix(Tables VII and VIII). Samples containing uranium produce fission productswhich are also produced by neutron capture in La, Ce, Nd, Sm, Mo, Ba, andother elements. These fission corrections have been tabulated [277].Blanks (from sampling implements or irradiation containers) and background(from radioactivity in the counting room) are usually unimportant in NAA, butmust be evaluated individually.
8.9 REPORTING
8.9.1 WHAT INFORMATION SHOULD BE GIVEN
The most common situation is that the customer sends samples for analysisexpecting to get in return a report containing the sample codes andcorresponding elemental concentrations. However, a report containing onlythis information cannot be always considered complete. Commonly additionaldata is given to increase the information content of the report.
In general the customer should be made aware of the analytical procedure used,in the report, in oral discussions, or as a part of the price list distributedto all customers. The report itself contains sample and work identificationand the results of the analysis with errors indicated (see chapter 9.3). Theerror should be defined indicating if it is one or two sigma. The number ofdigits given should reflect the accuracy of the results. Thus, as a rule ofthumb, the last digit will have an error, the previous ones none. Sometimesit is not sensible to report results with errors greater than 30%. When theelements have not been detected, the detection limits, or upper values have tobe indicated. It is not enough to say "not detected", because the informationvalue of such a statement is very low. The report may also contain theresults of the control samples incorporated in the series containing theanalyzed samples. Some customers insist on these and some others find themonly disturbing. It is better to err by providing too much information ratherthan too litle.
150
8.9.2 FORMAT
There are several different formats in which the results can be given. Goodservice includes customer tailored reporting. The sample coding sometimescauses problems because the code of the customer may include much sampleinformation. Then its format is usually not logical and suitable for frequentrepeating or for sample changer operation. In such situations the samples canbe given a temporary code and in the final report the original code is againjoined to the elemental concentrations.
The results are usually presented in the form of a table of the elementalconcentrations and errors. The results should be given in units requested bythe customer. Figure 8.14 gives an example of such a table. If computertreatment is used there can be two different formats, one which is easilyunderstandable by people and another to be read by a computer. Figure 8.15shows a typical computer readable table.
The results can be further treated when required, for example, to presenttables containing concentrations of one specific element for all samples.Different kinds of graphic representations may be called for, such aschondritic ratio plots of rare earth elements or platinum metals (Figure8.16). Different kinds of frequency distributions or even geochemical mapsmay be included (Figure 8.17). In most cases the customers are prepared to dothese data presentations themselves, but in some cases the availability ofadvanced forms of presentations is requested. Again, results presented to thecustomer in his own terms are most useful to him and are the most likely tobring repeat business.
151
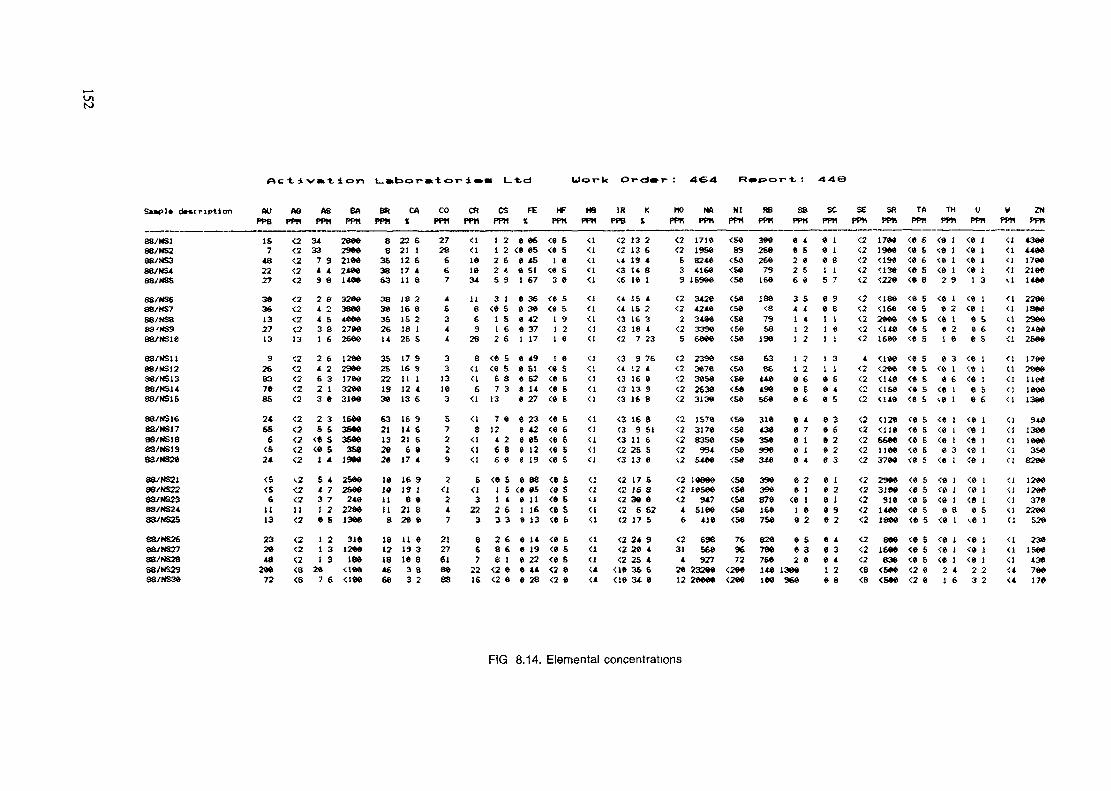
to
Ac -t i v»-t i on l_«.t>or-»t or- i •»• Ltd
S*»pl» dwuriptiun
88/MS188/NS23&/MS338/KS488/NSS
88/NS688/KS788/NS888 '«S3
88/MS1188/NS12S3/NS1388/NS148S/NS1B
88/MS1688/NS1788/NS1883/NS1988/HS26
38/NS2198/KS2238/NS2388/NS24S3JHS&
88/NS268&/NS7788/WS2888/MS2938/NS36
n AUPPBIS74822273636132713
9268376SS
24SS6<S2«<S<S6
111323264826672
ASPP«<2<2<2<2<2<2<2<2<213
<2<2<2<2<2
<2<2<2<2<2^2<2<211<2<2<2<2<3<8
ASPPM34337 94 49 8
2 84 24 53 81 6
2 64 26 32 13 6
2 35 6<6 5<6 51 4
S 44 73 71 26 E1 21 31 3267 6
BAPP«286629*6216624061466
32663866466627662666
12662966176632663166166636663S663S619662S66256624622661366
3161266186<166<166
BftPP«
883638633838352614
3525221936
6321132626
161611U8
1812184668
CA1
22 621 112 617 411 818 216 815 218 125 S
17 916 S11 112 413 6
16 9U 621 66 817 4
16 919 18 621 826 6
11 619 316 83 83 2
COPP«2728667
46344
3313163
572292<1247
2127618688
CRPPHa<1161634
1186928
8<1<16<'<!8
<1<1<]
E<j3223867
2216
esPPM1 21 22 62 4S 93 1<6 51 S1 62 6<« E<e B6 87 313
7 «124 26 86 6<e s1 E1 42 63 32 68 68 1<2 6<2 6
FEX
6 66<6 656 456 511 67
6 366 366 426 371 17
6 49« Sl6 62« 14« 27« 23« 42e 65e 12e 19e es<« 656 111 16« 13
0 146 196 226 446 28
tfPP«
<» 5<e s1 6
<« 53 6
<e s<« 51 91 21 6
1 6<« 5<« 5<« S<6 5
<6 6<0 6<6 B<6 5<6 5<6 5<6 S<6 5<6 £<6 E><6 6<8 5<e s<2 6<2 6
H8 1R KPP« PPB »<1 <2 13 2<1 <2 13 6<1 1.4 19 4<1 <3 U 8<1 <6 16 1
<1 <1 15 4<1 <4 15 2<l <3 16 3<1 <3 18 4<! <2 7 23
<1 <3 9 76<1 <t 12 4<1 <3 16 6<1 <3 13 9<1 <3 16 8
<1 <3 16 8<1 <3 9 51<1 <3 11 6<1 <2 26 S<1 <3 13 6
<1 <2 17 S<1 <2 16 8<1 <2 36 8<1 <2 6 62<1 <2 17 B
<1 <2 24 9<1 <2 26 4<1 <2 25 4<4 <16 35 6<4 <16 34 6
HOPPH
<2<2B39
<2<22<25
<2<2<2<2<2<2<2<2<2^2
<2<2<246
<23142612
NAPP«
171619568246416«1B966
34264246346633966666
23963076365626363136
1578317683 SO9945466
16866165669475166416
698568927
2326626666
NIPPH<5689<56<S6<56
<58<56<56<56<S6<S6<S8<66<S6<S6
<56<S6<56<58<S6
<S6<S6<S8<S6<&6
769672
<266<266
RBPPK
36626626679166186<87958196
S3es446496566
3164363S6996346
39639687616678«826706766146166
S8PPM6 4e s2 82 56 63 54 41 41 21 2
1 21 20 66 B6 6
8 48 76 16 16 4
6 20 1<6 11 68 26 S6 32 6
1366966
SCPPH8 18 16 8! 15 7
6 98 81 11 01 1
1 31 16 50 40 58 36 S6 26 26 3
0 16 20 10 90 2
0 40 36 41 26 8
SEPPM<2<2<2<2<2<2<2<2<2<2
4<2<2<2<2<2<2<2<2<2
<2<2<2<2<2<2<2<2<8<8
SßPPH17661966<196<136<226<188<1&62666<1461666
<166<266<146<!S6<146
020<110666611663766
296831669161466186686«1666836<S«6<S66
TAPPH
<6 S<6 5<0 6<0 5<6 8
<0 5<0 S<0 6<« 5<* S
<e s<» 5<6 S<« 5<e s<8 B<0 S<6 B<« S<« 5
<0 5<6 S<6 5<6 5<6 5
<6 5<6 B<8 B<2 6<2 0
THPPH
<8 1<e i<« i<6 12 9<6 18 2<» 1« 21 6
8 3<« 16 6
<0 1«.0 1
<« 1<6 1<6 16 3<e i<0 1<e i<6 10 8<0 1
<0 1<0 1<0 12 41 6
UPPH
<0 1<6 1<» 1<0 11 3
<0 1<0 16 S9 60 B
<e i<0 1<0 10 B0 6
<8 1<0 1<0 1<6 1<0 1
<e i<e i<e ie 5<.e i<e i<8 1<6 12 23 2
W ZNPP« PPH
<l 4366<1 4466<1 1766<1 2166U 1466
<1 2266<1 1866<1 2966<1 2466<1 2666
<1 1766<1 2666<1 116«<] 1666<1 1366
<1 946<1 1366<1 166«<1 3S6<1 8266
<1 1266<1 1266<1 376<1 2266<1 526<I 236<1 1566<1 136<4 766<4 176
FIG 8.14. Elemental concentrations
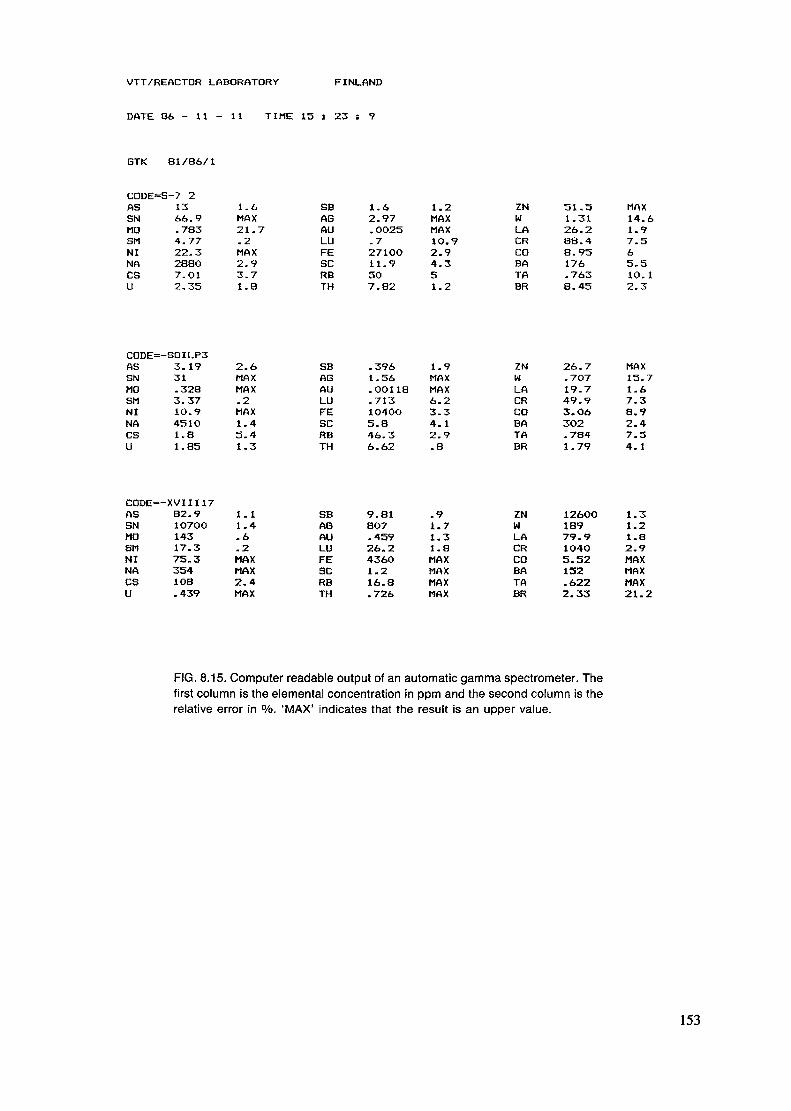
VTT/REACTOR LABORATORY FINLAND
DATE 86 - 11 - 11 TIME 15 : 23 : 9
GTK 81/86/1
CDDE=S-7 2ASSNMOSMNINAesU
1366.9.7834.7722.328BO7.012.35
1.6MAX21.7.2MAX2.93.71.8
SBAGAULUFEseRBTH
1.62.97.O025.7271OO11.9507.82
1.2MAXMAX10.92.94.351.2
ZNWLACRCOBATABR
51.51.3126.288.48.95176.7638.45
MAX14.61.97.565.510. 12.3
CODE=-SOILP3ASSNMOSMNINAesU
3.1931.3283.371O.945101.81.85
2.6MAXMAX.2MAX1.45.41.3
CODE=-XVIII17ASSNMOSMNINAesU
82. 91O70O14317.375.33541O8.439
1. 11.4.6.2MAXMAX2.4MAX
SBAGAULUFESCRBTH
.3961.56.OO118.7131O40O5.846.36.62
1.9MAXMAX6.23.34.12.9.8
SBAGAULUFESCRBTH
9.818O7.45926.2436O1.216.8.726
.91.71.31.8MAXMAXMAXMAX
ZNWLACRCOBATABR
26.7.70719.749.93.06302.7841.79
MAX15.71.67.38.92.47.54.1
ZNMLACRCOBATABR
126OO18979.91O4O5.52152.6222.33
1.31.21.82.9MAXMAXMAX21.2
FIG. 8.15. Computer readable output of an automatic gamma spectrometer. Thefirst column is the elemental concentration in ppm and the second column is therelative error in %. 'MAX' indicates that the result is an upper value.
153
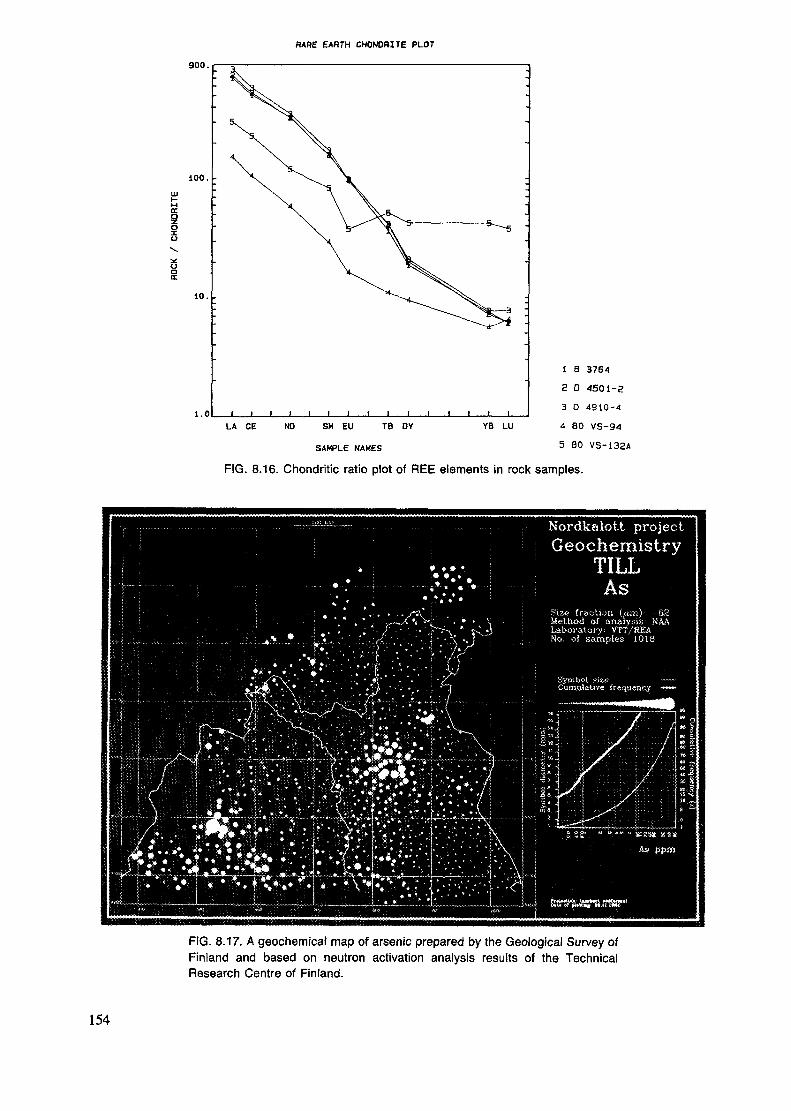
HARE EARTH CHONDBITE PLOT900.
100.uiK*-ttrio5
10.
1.0 I ILA CE NO YB LUSM EU TB DY
SAMPLE NAMES
FIG. 8.16. Chondritic ratio plot of REE elements in rock samples.
l B 3764
S O 4501-2
3 0 4910-4
4 80 VS-94
5 BO VS-132A
FIG. 8.17. A geochemical map of arsenic prepared by the Geological Survey ofFinland and based on neutron activation analysis results of the TechnicalResearch Centre of Finland.
154
8.9.3 DEVICE
When urgent, the results can be initially given by telephone. This shows goodservice. The method of reporting almost always used is by a hard copy. Whenmanually made, it may be convenient to have a special form prepared andreproduced by photocopying or printing. This way the standard informationneed not be repeated and the report has a standard form, easily readable byeverybody. It is increasingly common to produce the report by computer. If aseparate off-line word processor is used, compatibility should be ensured sothat the data can be transferred through a floppy disc or magnetic tape.
The hard copy can be sent to the customers by mail, telex or facsimile. It isalso possible to send the reports directly by telephone line to the customer'scomputer. Compatible magnetic tape, digital cassettes, and floppy discs areconvenient for transferring data. All the above devices can be sent by mail.Special boxes should be used.
155
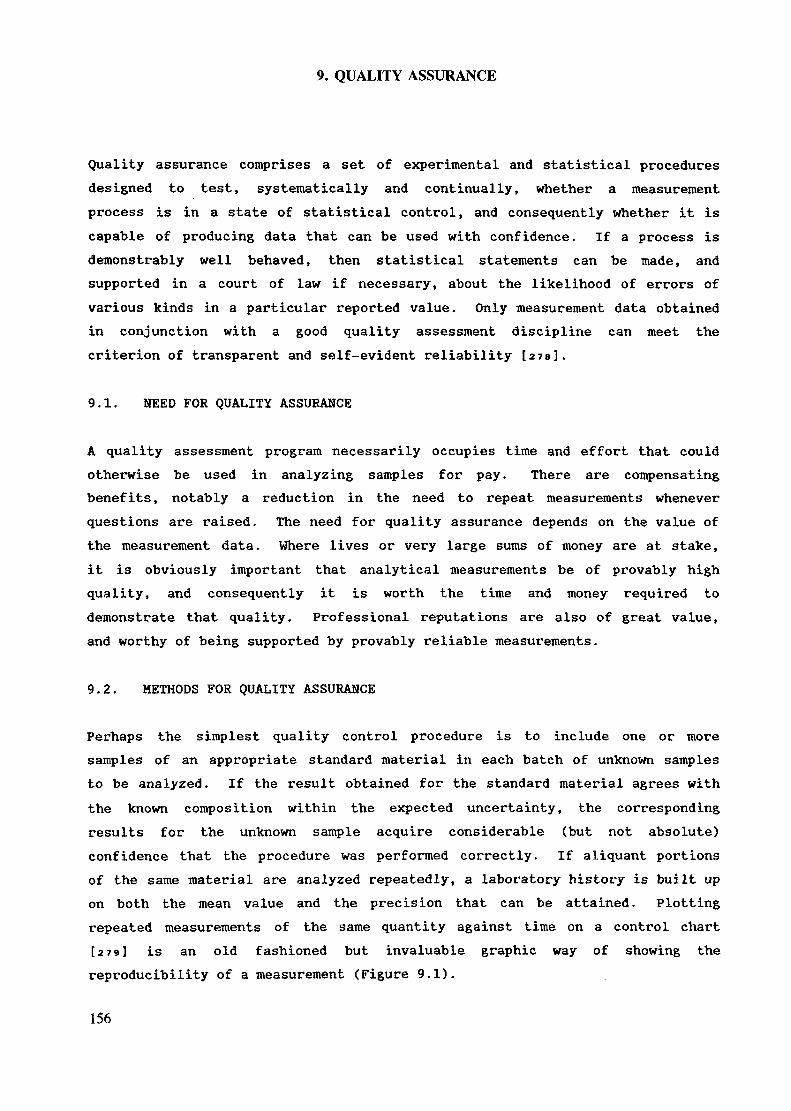
9. QUALITY ASSURANCE
Quality assurance comprises a set of experimental and statistical proceduresdesigned to test, systematically and continually, whether a measurementprocess is in a state of statistical control, and consequently whether it iscapable of producing data that can be used with confidence. If a process isdemonstrably well behaved, then statistical statements can be made, andsupported in a court of law if necessary, about the likelihood of errors ofvarious kinds in a particular reported value. Only measurement data obtainedin conjunction with a good quality assessment discipline can meet thecriterion of transparent and self-evident reliability [273].
9.1. NEED FOR QUALITY ASSURANCE
A quality assessment program necessarily occupies time and effort that couldotherwise be used in analyzing samples for pay. There are compensatingbenefits, notably a reduction in the need to repeat measurements wheneverquestions are raised. The need for quality assurance depends on the value ofthe measurement data. Where lives or very large sums of money are at stake,it is obviously important that analytical measurements be of provably highquality, and consequently it is worth the time and money required todemonstrate that quality. Professional reputations are also of great value,and worthy of being supported by provably reliable measurements.
9.2. METHODS FOR QUALITY ASSURANCE
Perhaps the simplest quality control procedure is to include one or moresamples of an appropriate standard material in each batch of unknown samplesto be analyzed. If the result obtained for the standard material agrees withthe known composition within the expected uncertainty, the correspondingresults for the unknown sample acquire considerable (but not absolute)confidence that the procedure was performed correctly. If aliquant portionsof the same material are analyzed repeatedly, a laboratory history is built upon both the mean value and the precision that can be attained. Plottingrepeated measurements of the same quantity against time on a control chart[279] is an old fashioned but invaluable graphic way of showing thereproducibility of a measurement (Figure 9.1).
156
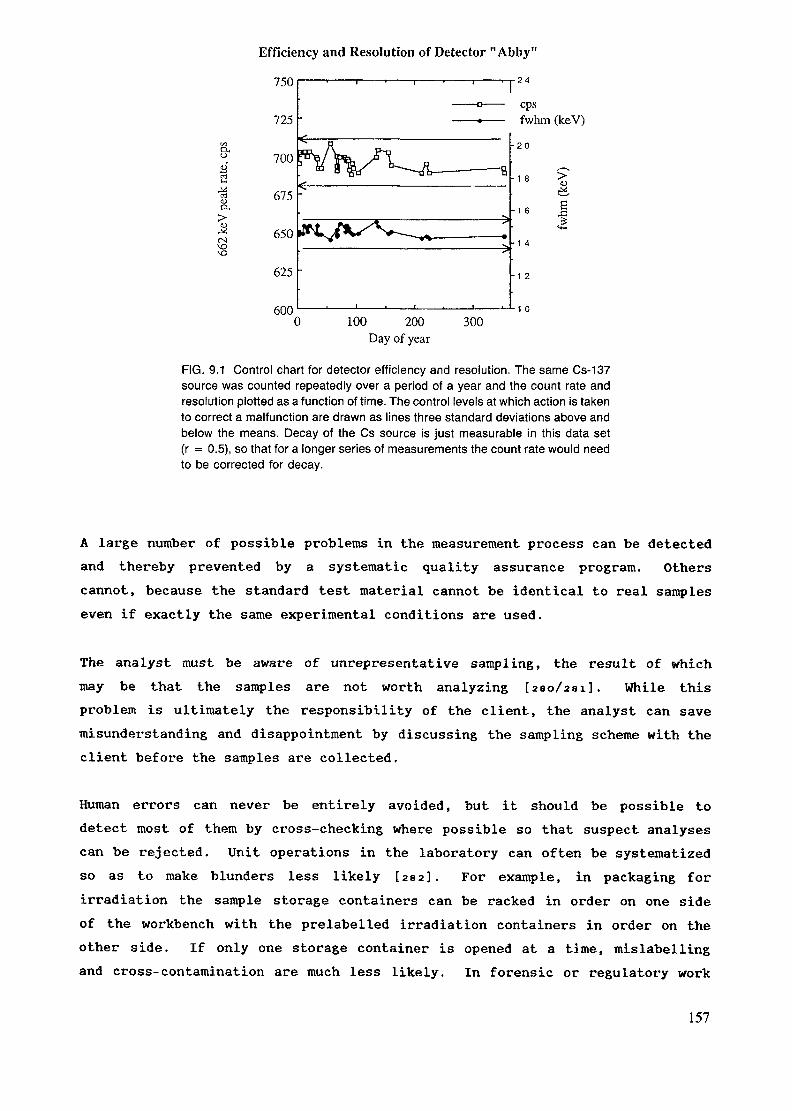
Efficiency and Resolution of Detector "Abby"
d,o
u
/JU
725
700
675
650
625
600
^y^^?^______^<§J ^L— ~T5
-
&L /KXVrfK-^ •%
-
1
fwhm
• 2 0
- 1 8
-1 6
•1 4
-1 2
-1 00 100 200 300
Day of year
(keV)
>AJ«+-i
FIG. 9.1 Control chart for detector efficiency and resolution. The same Cs-137source was counted repeatedly over a period of a year and the count rate andresolution plotted as a function of time. The control levels at which action is takento correct a malfunction are drawn as lines three standard deviations above andbelow the means. Decay of the Cs source is just measurable in this data set(r = 0.5), so that for a longer series of measurements the count rate would needto be corrected for decay.
A large number of possible problems in the measurement process can be detectedand thereby prevented by a systematic quality assurance program. Otherscannot, because the standard test material cannot be identical to real sampleseven if exactly the same experimental conditions are used.
The analyst must be aware of unrepresentative sampling, the result of whichmay be that the samples are not worth analyzing [290/281]. While thisproblem is ultimately the responsibility of the client, the analyst can savemisunderstanding and disappointment by discussing the sampling scheme with theclient before the samples are collected.
Human errors can never be entirely avoided, but it should be possible todetect most of them by cross-checking where possible so that suspect analysescan be rejected. Unit operations in the laboratory can often be systematizedso as to make blunders less likely [282]. For example, in packaging forirradiation the sample storage containers can be racked in order on one sideof the workbench with the prelabelled irradiation containers in order on theother side. If only one storage container is opened at a time, mislabellingand cross-contamination are much less likely. In forensic or regulatory work
157
with legal implications, rigorous recording and specimen handling proceduresare designed to ensure a verifiable, continuous chain of custody from samplingto reporting.
Transposition errors and other mistakes in recording data can be made lesslikely to occur by automating much of the data input through direct computerreading of balances and clocks and by manual data entry only once into presetforms on a computer screen. Fortunately, automation is most worthwhile inroutine high-volume work where occasional errors are least likely to bedetected by the eye of the analyst. Automatic sample changers maymalfunction, for instance by counting the same sample twice. This occurencemay be difficult to find after the fact, but checking the identifications ofthe sample containers against the counting log at the time the changer isunloaded is a simple test for trouble.
Computer software cannot always be trusted to produce correct results withoutsupervision, especially when a new material is being analyzed. Commercialprogram packages for gamma-ray spectroscopy and nuclide identification includesome of the functions of expert systems, but even authorities need to bequestioned. Since many of the programs in use in activation analysislaboratories have been written by analysts with little skill in computerprogramming, by numerical analysts with minimal knowledge of gamma-rayspectroscopy and analytical chemistry, or by students who are learning bothsets of skills for the first time, a data processing procedure in successfuluse in one laboratory cannot always be transferred to another laboratory withequal success. In an intercomparison of spectrum analysis software conductedby the IAEA [isi], the differences among the algorithms used in the programswere smaller than the differences in the manner in which they were used.Skilled users obtain more reproducible and accurate results, partly becausebetter values for the input parameters are supplied to the programs (energy,peak shape, and pile-up coefficients, and half-lives and other physicalconstants), and partly because of their ability to recognize when the resultsare likely to be unreliable. With time, if and when these skills aretranslated into algorithms and incorporated into computer procedures, thelikelihood of error will be decreased.
9.2.1 COMPARISONS
The precision of an analysis can often be improved by combining multiplegamma-rays, radionuclides, counts, and subsamples, provided that they agreewith each other within the expected uncertainties. If they do agree, then the
158
weighting factor to be used for each individual measurement is the reciprocalof its variance (the square of the standard deviation). Since in general theprecision of a mean improves proportionally to the square root of the numberof determinations, replicate measurements or multiple gamma rays cannotimprove random error more than a factor of two or three over the best singlepeak. However, analytical multiplicity can assure the analyst and the clientwith qualitative confidence that interfering gamma rays, sample inhomogeneity,or other errors are absent.
Analysis of duplicate samples of the same material is commonly used as a testof analytical precision within a sample set. The statistics of counting andother measurement errors are discussed in standard texts [283/234/154]. Asa rule of thumb, duplicate analyses should agree within two standarddeviations as estimated from counting statistics (two-sigma error boundsshould overlap) more than 99% of the time; if they do not, then themeasurement system contains non-Poisson sources of variation such as weighingerror, neutron flux gradient, counting efficiency differences, or materialinhomogeneity. If one material in each sample set is measured in duplicateover a series of runs, a estimate of the excess variability can be obtained,although obtaining a good numerical value is surprisingly difficult [295].
If one of a series of related samples is anomalous, it should be remeasured.If the anomaly is due to an error in the measurement process, repetition mayreveal the difficulty; if the anomaly is verified then stronger conclusionsabout the sample can be drawn.
Since radioactive decay follows Poisson statistics, the properties of thisdistribution are a powerful tool in quality assessment. If the observedvariation among replicate measurements (as judged by the T-test) is in excessof the Poisson precision, then other sources of random error are present[286/254]. On the other hand, if over the long term replicates agree betterthan expected, then the counting uncertainty is surely overestimated; somepeak integration programs have had this problem.
Once precision (reproducibility) has been demonstrated, accuracy (nearness tothe true value) can be assessed. Intra-laboratory comparisons betweenanalysts can help show independence of particular personal procedures, but asurer way of demonstrating accuracy is to repeat the analysis by a totallydifferent method with a different set of possible errors. If the firstmeasurement is made by instrumental neutron activation, it might be checked by
159
plasma emission spectrometry (ICP-AES), an atomic technique which requiresthat the sample be dissolved. If the measurements agree, then confidence inboth is strengthened. This is one method used by the U.S. National Instituteof Standards and Technology (formerly National Bureau of Standards) incertifying its Standard Reference Materials.
Interlaboratory comparisons are often done on a one-to-one basis by exchangingsamples, but in order for the analyses of rocks and pottery or clinical tissuespecimens to be truly intercomparable from one laboratory to another, eachcontributing laboratory must regularly analyze samples of a widely availablehomogeneous material. A common interlaboratory comparison reported in theliterature, particularly for the validation of new methods of analysis, is theanalysis of national and international reference materials.
9.2.2. STANDARDS AND REFERENCE MATERIALS
Two distinct uses are made of standards in the laboratory. In analyticalterms, they may be treated as knowns or unknowns; that is, they may be usedeither to calibrate the measurement procedure or to test the procedure afterits completion. These two uses carry corresponding requirements on theaccuracy with which the composition of the standard needs to be known.Because of error propagation, the composition of a calibrator must be known tobetter accuracy than the desired accuracy with which the unknown samples areto be determined. Available multielement reference materials are not so wellcharacterized as one might desire. These considerations have been discussedin section 8.4.
Definitions: A chemical "primary standard" has been defined as a commerciallyavailable substance of better than 99.98% purity [237]. A laboratory"working" standard, prepared from or referenced to a primary standard ifpossible, is used for regular instrument calibration. This may be prepared bythe analyst, purchased from a chemical supplier, or obtained from national orinternational standardizing organizations. A "reference material" (RM) isdefined as a widely distributed material intended to be used for calibratingapparatus or testing an analytical procedure [zsa], A "certified referencematerial" (CRM) is a reference material issued by a national or internationalorganization which certifies that its composition is known within statedlimits. Finally, a Standard Reference Material (SRM) is a CRM issued by theU.S. National Institute of Standards and Technology.
160
A quality assurance material is usually chosen to be a reasonably close matchto real everyday samples with regard to major elements (to equalize the totalactivity and thus self-shielding and rate-related effects) and important minorelements (particularly those that may have spectral interferences). Withinthese constraints, homogeneity and well-known composition are the mostdesirable characteristics for such a material.
Several national and international agencies produce reference materials of useto analysts. In some cases these organizations lend their authority tocertifying the composition of the RMs, and sometimes merely prepare anddistribute them and allow a consensus on the "best" composition to developamong the analytical community. The geological surveys and relatedorganizations in a number of countries distribute reference samples of manyrock types, the analyses of which are regularly reported [239]; recentcompilations of analyses have been published [290/291]. The U.S. NationalInstitute of Standards and Technology issues a wide variety of materials[292/293]. The Bureau of Reference (BCR) of the European Community, theInternational Standards Organisation [aes], the International Atomic EnergyAgency, and other international agencies provide reference materials in theirparticular fields of responsibility. A compilation of 100 availablebiological and environmental reference materials from 11 suppliers has beenprepared [294].
9.3 ASSIGNMENT OF UNCERTAINTY
Statements of uncertainty in reported numbers must be defined. Some readers,perhaps a majority, interpret a "±" statement as one standard deviation, andsome as a 95% confidence interval; there are also precedents for interpretingan error statement as the probable error (the range within which repeatedmeasurements should fall half the time), or even as the maximum possibleerror. When the reported value is the result of replicate measurements,either the uncertainty of a single measurement or of the mean may be statedand clearly identified; the latter is smaller by a factor of the square rootof the number of degrees of freedom.
As mentioned in section 7.2.1, one strength of activation analysis is that theanalytical precision may be estimated from a single measurement by applyingPoisson statistics. The overall uncertainty contains other sources of randomand systematic measurement error, which may be separately listed in theoverall error analysis or combined according to some defensible algorithm. A
161
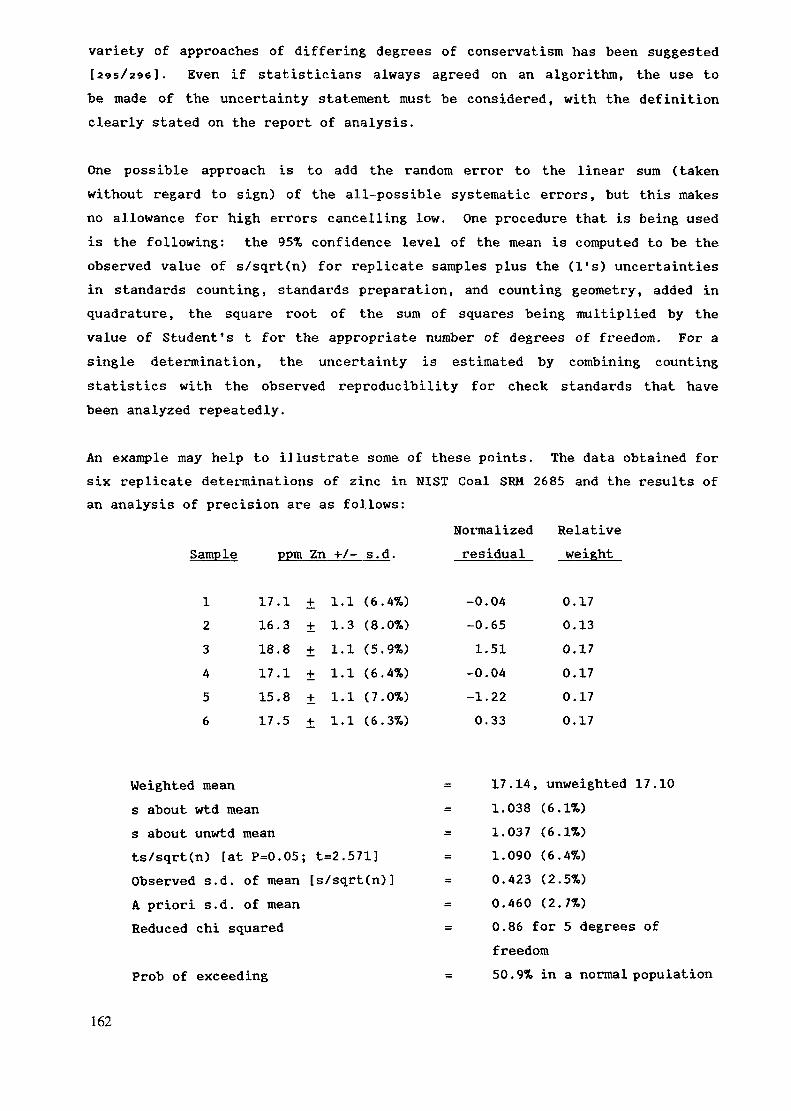
variety of approaches of differing degrees of conservatism has been suggested[295/296]. Even if statisticians always agreed on an algorithm, the use tobe made of the uncertainty statement must be considered, with the definitionclearly stated on the report of analysis.
One possible approach is to add the random error to the linear sum (takenwithout regard to sign) of the all-possible systematic errors, but this makesno allowance for high errors cancelling low. One procedure that is being usedis the following: the 9570 confidence level of the mean is computed to be theobserved value of s/sqrt(n) for replicate samples plus the (1's) uncertaintiesin standards counting, standards preparation, and counting geometry, added inquadrature, the square root of the sum of squares being multiplied by thevalue of Student's t for the appropriate number of degrees of freedom. For asingle determination, the uncertainty is estimated by combining countingstatistics with the observed reproducibility for check standards that havebeen analyzed repeatedly.
An example may help to illustrate some of these points. The data obtained forsix replicate determinations of zinc in NIST Coal SRM 2685 and the results ofan analysis of precision are as follows:
Normalized RelativeSample ppm Zn +/-^s.d. residual weight
1 17.1 ± 1.1 (6.4%)2 16.3 + 1.3 (8.0%)3 18.8 + 1.1 (5.9%)4 17.1 + 1.1 (6.4%)5 15.8 + 1.1 (7.0%)6 17.5 + 1.1 (6.3%)
-0.04
-0.65
1.51
-0.04
-1.22
0.33
0.17
0.13
0.17
0.17
0.17
0.17
weighted means about wtd means about unwtd meants/sqrt(n) [at P=0.05; t=2.571]Observed s.d. of mean [s/sqrt(n)]A priori s.d. of meanReduced chi squared
Prob of exceeding
17.14, unweighted 17.101.038 (6.1%)
1.037 (6.1%)1.090 (6.47.)
0.423 (2.5%)
0.460 (2.7%)
0.86 for 5 degrees offreedom50.9% in a normal population
162
The agreement between the observed and expected standard deviations is good;the value of chi-squared is near unity, as it should be. In this measurementthe additional uncertainty due to standard preparation and counting geometrycombined as the square root of the sum of squares is 0.7% (which is small inthis case, as the value of chi-squared confirms for the counting geometrycomponent). The total uncertainty is then calculated by adding an additional0.7% in quadrature to the a priori standard deviation of the mean andmultiplying by t(5) = 2.447. The final result reported is 17.1 + 1.2 ppm Zn,where the uncertainty is the 95% confidence level of the mean (n = 6).
9.4 LOCATION OF SOURCES OF ERRORS
The results of control sample analysis have to be checked by preference asquickly as possible. Systematic errors may have been introduced which affectnot only the analysis of the entire batch of samples but sometimes also allfollowing batches of samples. Sometimes immediate action to control and torestore such a source of errors can be undertaken without loss of too muchvaluable time.
Sources of errors can be located from the way and the extent the results ofanalysis of the control deviate from expected values, i.e., outside limits ofprecision. As an example, the following checks can be performed.
1. All significant gamma-ray lines should be identified qualitatively;
2. Identification should be reasonable for the decay time;
3. Corrections for dead time (and pulse pile-up) should be small;
4. Element concentrations should be consistent on all peaks emitted by theradionuclide of interest;
5. Element concentrations also should be consistent when more than oneradionuclide is used for determination.
These types of deviating results can be distinguished.
1. Only one, or a few element concentrations differ in a consistent wayfrom expected values;
163
2. All element concentrations differ in a consistent way from expectedvalues;
3. All element concentrations differ randomly from expected values.
[In the search for sources of errors, it is assumed that the analysisprocedure already has been calibrated ]
- Checks.
1. All significant gamma-ray lines in the spectrum should be identified. Ifprominent peaks are not assigned to nuclides, various sources of error mayoccur:
- the peak-position vs. gamma-ray energy relationship may be different inthe measurement of the sample from what was determined in the energycalibration step. This may be due to gain shifts. Also, especiallywhen high order calibration curves are used, erroneous data points mayhave been introduced.
- decay time may be fully wrong. Several analysis programs have optionsto exclude peak assignment to nuclides when the decay time exceedse.g., 12 half-lives of that nuclide. If an error of an order ofmagnitude has been made in decay time, it may certainly affect all peakassignments.
- instability of the spectrometer, in particular of the amplifiers, maycause peaks to become doublets. This can be observed from peak-widthsand reported goodness-of-fit. Sometimes only one of the peaks of sucha doublet or multiplet still can be assigned to a nuclide, while theother(s), closely spaced one(s) cannot.
a too high count rate or temperature changes may have caused a gaindrift so that peaks cannot be assigned anymore under the used energycalibration function.
2. Identification should be reasonable for the decay time. As previouslymentioned, most computer programs have options to exclude peak assignment whenthe decay correction exceeds a certain value. Still nuclide assignments after
164
decay times as long as 10 - 12 half lives should be interpreted with someskepticism. Especially in the case of measurements of short half-lifenuclides, this source of error should not be overlooked.
3. Corrections for dead time (and pulse pile-up) should be small. Again thisis of special importance when measuring short half-life nuclides, inparticular when measuring times are applied which are larger than thehalf -life of the nuclide of interest.
4 . Element concentration is different when determined on different y-lines from one nuclide.
In the quantitative step of the spectrum analysis, final elementconcentrations may be determined either by using the most usable or mostintense line, or, even better, after weighting the contributions of thevarious peaks of one nuclide (only a few elements are determined on a singlegamma-ray emitting nuclide) . It is important to compare not only this finalelement concentration but also to check, for nuclides emitting multiplegamma- rays, the individual results on the basis of the different peaks. Sucha check is valuable even when the final element concentration is correct.Deviations may result from:
the use of an incorrect efficiency curve in the chosen geometry;
- Sample self-absorption. A systematic gradual increase in elementconcentration will be observed at increasing gamma-ray energies. Insuch a case, either a self-absorption correction has to be applied, ora different type of control sample or a smaller amount has to be taken;
- Other sources of errors may be of instrumental origin and/or originatefrom computer analysis. Due to drift and instability or a too-highcount rate the spectum may thus be distorted that peaks have becomedoublets and become difficult to fit or are only partially assigned tospecific nuclides (see above). Also summation effects or interferencesfrom other nuclides by closely spaced y-ray lines have to be checked.
5. Element concentrations determined on multiple nuclides are different. Whenhalf-lives of the different radionuclides of a certain element are stronglydifferent, inconsistent results indicate erroneous decay corrections. Errors
165
may also been introduced by sample self-absorption or neutron shielding.Finally, the chemical compound in the calibration step should be altered, inorder to check if deviations occur from natural abundances. Such effects areknown to occur with sulphur [297], but also attention has to be paid inparticular to uranium; many chemical compounds tend to be depleted on Uwithout any notice on the labels. Such a depletion has a neglible effect on
239the determination of U on the basis of Np, but may lead to erroneousresults when determining U through fission products or by delayed neutroncounting.
Recount and reanalysis of the sample, or analysis of the selected materialwith samples of increasing size may help to determine the nature of theinconsistent results. Also analysis of reference or control materials has tobe done to verify results.
* Deviating results.
6. One or a few element concentrations differ consistantly. Check:
results on different gamma-ray lines or different nuclides, also ofthose elements which showed a correct value. The latter isparticularly important when the corresponding nuclides of the elementsfor which a deviating result is found emit only low-energy gammas, orsingle gamma-rays;
blank and background values. Even with heavily shielded detectors,contributions from samples present in the same counting room may beobservable when many of the samples have the same radionuclide as majorcomponent. This often applies to nuclides used as comparator or forflux monitor purposes;
- decay time of both sample and standard.
It is important to be familiar with the way your spectrum analysis programcalculates the decay time correction. Some programs use for the decay timethe time elapsed between the end of the irradiation and the beginning of themeasurement, with - or even without - corrections for decay during irradiationand measurement; others calculate the time between the end of the irradiationand the midpoint of the measurement, but also, programs exist in which thebeginning of irradiation has to be entered as t = 0 for decay correction.
166
Especially when measuring nuclides with half-lives in the order of severalseconds (77 Se, F), every second counts, in particular, as often theprecision of all timing sequences is in the order of 1 second.
- half-life of the relevant nuclides;
spectral interferences. Sources of error in gamma-ray spectroscopyrelated to the spectrum analysis and spectrum interpretation step, suchas impure peaks, additional peaks (annihilation and escape peaks etc.),and summation effects [179].
If most of the element concentrations determined are correct, and only a fewdiffer either consistently or in a random way, it is most likely notsufficient to check only these sources of error. A new measurement of thesame sample may be considered, e.g., at a different geometry or on a differentspectrometer.
7. All element concentrations differ consistently. Check :
- results from individual peaks;
- weight of sample and standard (don't rely on so-called consistentweights of sample capsules by not weighing them individually);
- measurement time of sample and standard, and applied dead-timecorrections (sometimes a loose contact may result in a temporary lossof pulse transfer to MCA, while time is still running-on);
measurement and irradiation geometry of sample and standard, andapplied corrections for dimensions (filling height) and self-absorption;
- possibility of difference in flux between sample and standard due todifferences in neutron absorption or neutron self-shielding.
8. All element concentrations differ randomly.
One of the most common causes of randomly varying results is confusion ofsamples and/or standards. A series of samples may have been inserted in thesample changer in reverse order. Check therefore first the code numbers on
167
the vials as they are found in the sample changer or in the sample storageroom. If mix-up of samples can be excluded, some of the checks mentionedabove (peak assignment, dead-time aspect, results from multiple gamma-raylines from one nuclide and results from multiple nuclides from one element)have to be performed. It may also be valuable to make sure there are noerrors in decay times, weights of sample and standard, whilst also thepossibility of contamination should not be overlooked. Sometimes amalfunctioning sample changer is capable of 'forgetting' to remove a samplefrom the detector side, and all new samples are measured on top of it. Inlarge throughput laboratories the effect of shielding is also sometimesunderestimated or temporarily a very active sample is transported through thecounting room.
Another possibility is that sample and standard have experienced a differentneutron spectrum during irradiation. A thermalisation of the epithermal andfast components of the spectrum in sample or standard may have taken place butalso a 'hardening' of the neutron spectrum (relative loss of thermal neutrons)may have occurred. Such effects may be due to extremely high concentrations ofhydrogen, boron, cadmium or gadolinium. Use of different sample weights, inparticular smaller amounts, may help to detect such a problem if the elementalcomposition is completely unknown (e.g., with respect to boron). It isimportant to check also what may have happened in other irradiation channelsin the vicinity of the one used for activation analysis work.
If all these do not give an indication for a source of error, a recount andreanalysis of the sample has to be done, if possible, also on a differentspectrometer and/or in a different geometry. Alternatively, other referencematerials should be tried. Sometimes typical results are caused by unstableor inhomogeneous materials, or even contaminated materials.
For more information on the topic of this chapter, the reader is referredespecially to the extended treatments in [293] (for general chemical andmanagement issues) and [179/154/299] (for activation analysis inparticular). These publications contain extensive bibliographies.
168
10. RADIATION PROTECTION
All possible measures have to be taken to keep the radiation dose of theworkers within the permissible limits, and in fact much lower. Practice hasshown that with appropriate procedures instrumental activation analysis can beperformed with very low radiation doses to the workers. An example of this isthe laboratory of one of the authors where a person annually analyzing 13000geological samples receives a whole body dose from this work of about ImSv perannum. The basis of radiation protection measures is a clear understandingabout radiation, radioisotopes and basic principles of radiation protection.
That means that only well trained personnel can be used for radiation work.This understanding will automatically result in good working procedures whichminimize the received doses but at the same time enables an efficientperformance of the tasks. There must always be a logical compromise betweenreceived radiation dose and the effectiveness of the work. Unnecessary dosesshould be avoided but if the work becomes too cumbersome there is often nomeaning in doing it at all.
It is outside the scope of this book to go into detail about radiationprotection and the reader is strongly recommended to read carefully thefollowing Agency publications before starting work with radioactive sources:IAEA Safety Series 1, "Safe Handling of Radionuclides". In addition, the IAEASafety Series no. 9, "Basic Safety Standards for Radiation Protection",No. 84, "Basic Principles for Occupational Radiation Monitoring", No. 14,"Basic Requirements for Personnel Monitoring", No. 48, "Manual on"Decontamination of Surfaces" and the Technical Reports Series No. 120,"Monitoring of Radioactive Contamination of Surfaces", are recommendedreadings.
The following measures are obligatory. The detailed procedures are describedin the above-referred books.
Continuous monitoring of whole body dose.
- Monitoring of hand dose periodically for routine tasks in order to getan understanding of the normal dose, and always when handlingabnormally active sources with the hands, which should be avoided whenpossible.
169
The activity of the samples should be monitored from the moment theyleave the reactor.
The radiation level of all rooms where radioactive sources are handledmust be monitored regularly and at least always when new samples aretaken into the room. When several people work in the same room it isnot always known what samples are brought to the room and therefore aregular check is necessary.
The possible contamination of all surfaces have to be measuredregularly, and always when work with unsealed sources or sealed sourceswhich may have surface contamination has been done. It is important toremember that containers and vials which have been in the reactorusually have surface contamination.
Protective clothing has to be used. Laboratory coats are alwaysnecessary. Rubber or plastic gloves should be used when handlingradioactive sources. Protective glasses are used when opening vialswhich may have built in pressure.
Whenever possible sources should be handled with forceps. Even one ofa few cm of length decreases the dose to hands considerably. Containerscoming from the reactor are handled with long forceps. However, it isimportant to understand the influence of both distance and time on thereceived dose. Thus it may be better to use hands (with gloves) insituations where the use of forceps would prolong the handling too much.
The sources should be shielded when possible. Here again it isimportant to note that if shielding during operation prolongs theoperation too much, the received dose might be smaller when notshielding at all. This has to be separately decided for each procedure.
Sources, like irradiated vials, which may emit radioactive gases ordust must be handled in a fume hood or in some cases in a glove box.
Clothes, hands and feet have to be monitored regularly forcontamination and always when leaving the active area.
170

Active sources have to be properly marked in order to allow easyidentification. All persons working in an area or using a storage forsources have to the aware of the activity level in that area or storage.
All sources have to be stored in a shielded place, like a lead castleor room with walls of concrete thick enough to absorb the radiation.If a storage room is used, individual shielding should be used in orderto avoid excessive doses to persons using the room.
Irradiated containers should not be opened before the samples areneeded. They are preferably stored in the reactor hall to avoidunnecessary transport and spread of the activity in the containeritself.
All transport of irradiated samples should be made in a tray, bucket orwagon, depending on the activity, and avoiding to spend too much timeon the transport.
In the laboratories and measurement rooms samples have to be handledand stored in a way to minimize radiation dose to the handler and otherpersons working in the area. It is especially important to avoidbackground irradiation in a measurement room with several gammaspectrometers, or from adjacent rooms.
All laboratories and measurement rooms including laboratory furniturehave to be appropriate and specially designed for work withradioactivity.
When samples are not needed anymore they have to be stored away frommeasurement rooms and areas where people work regularly.
171
11. SUGGESTED READING
ANALYTICAL CHEMISTRY: KKY TO PROGRESS ON NATIONAL PROBLEMS, N.B.S. SpecialPublication No. 351, WAYNB MEINKI, W., TAYLOR.J.K. (Eds) NBS, Washington D.C.(1972).
BAUMGARTNER, F., "Tabelle zur Neutronenaktivierung", Kerntechnik 3. (1961)356-369.
CLEANING OUR ENVIRONMENT: A CHEMICAL PERSPECTIVE. Report Committee onEnvironmental Improvement, American Chemical Society, Washington D.C. (1978).
ERDTMANN, G., "Neutron Activation Tables", Verlag Chemie Weinheim 1976.
HEYDORN, K., "Aspects of Precision and Accuracy in Neutron ActivationAnalysis", Thesis, Riso, Report RISO-R-419 (1980).
IAEA SUMMARY REPORT - CONSULTANTS MEETING ON TRAINING REQUIREMENTS IN MODERNASPECTS OF RADIOCHEMISTRY, Munich, FRG 1987, IAEA Vienna (1987).
KRATOCHVIL, B., TAYLOR, J.K., "Sampling for Chemical Analysis", Anal. Chem. 53(1981) 924A-938A.
KÜHN, W., "New Radiometrie and Radioanalytical Methods in AgriculturalResearch", At.Energ.Rev. 16 (1978) 619-655.
NON DESTRUCTIVE ACTIVATION ANALYSIS, AMIEL S. (Ed), Elsevier Series 'Studiesin Analytical Chemistry 3', Amsterdam (1981).
SAYRE E.V., "Activation Analysis in Art and Archaelogy, in: Advances inActivation Analysis", vol. 2 (LENIHAN, J.M.A., THOMSON, S.J., GU1NN, V.P.(Eds), Academic Press, London (1972) 155-184.
TABLE OF ISOTOPES (LEDERER MICHAEL C., SH1RLEY, V.S. (Eds), Wiley, New York(1978).
VEILLON, C., Trace Element Analysis of Biological Samples - Problems andPrecautions, Anal. Chem. 58 (1986) 851A-866A.
172
DE SOETE, D., GIJBELS, R., HOSTE, J., Neutron Activation Analysis, John Wiley,New York (1972).
FRIKDLANDEK, G., KENNEDY, J.W., MAC1AS, E.S., MILLER, J.M., Nuclear andRadiochemistry, John Wiley, New York (1981).
KRUGKR, P., Principles of Activation Analysis, John Wiley, New York (1971).
HEYUORN, K., Neutron Activation Analysis for Clinical Trace Element Research,Vol. l, CRC Press, Boca Raton, Fia. (1984).
KNOLL, G.F., Radiation Detection and Measurement, John Wiley, New York (1979).
DAMS, R., Environmental Samples, KOLTHOFF, I.M., ELV1NG, P.J., KK1VAN, V.(Eds), "Treatise on Analytical Chemistry", 2nd éd., part I, vol. 14,pp 665-684.
HJLLEBKAND' W.F., LUNDELL, G.E.F., BRIGHT, H.A., HUFFMAN, J.I., "AppliedInorganic Analysis", 2nd ed., Wiley, New York (1953).
ELVING, P.J., KKIVAN V. (Eds), "Treatise on Analytical Chemistry, Part I:Theory and Practice", 2nd ed., vol. 14, Wiley-lnterscience, New York (1986).
173
REFERENCES
[ 1] Comparison of Nuclear Analytical Methods with Competitive Methods. IAEA TECDOC435, Vienna (1987).
[ 2] HEVESY.G. & LEVI.H-, The Action of Neutrons on the Rare Earth Elements. Det.Kgl. Danske videnska- pernes selskab. Matematisk-fysiske meddelelser 14 (1936)5, p.3...34.
[ 3] GLADNEY.E.S., O'MALLEY.B.T., ROELAMDTS,I., GILLS,I.E., Standard ReferenceMaterials: Compilation of Elemental Concentration Data for NBS Clinical,Biological, Geological, and Environmental Standard Reference Materials," U.S.Mat. Bur. Stds. Spec. Publ. 260-111 (1987).
[ 4] LIPSCHUTZ,M.E., Anal. Chem. 58 969A (1986).
[ 5] BRUNFELT.A.O. & STEINNES (eds). Activation Analysis in Geochemistry andCosmochemistry (1971) published by Universitetforlaget, 339pp.
[ 6] LAUL.J.C., Neutron Activation Analysis of Geological Materials, At. Energ. Rev.17 no.3, (1979) 603-695.
[ 7] VERSIECK.J.M.J., SPEECKE,A.B.H., Contaminations Induced by Collection of LiverBiopsies and Human Blood, in Nuclear Activation Techniques in the LifeSciences, IAEA, Vienna (1972), 39.
[ 8] LUX, f, BEREZNAI,T., HAEBERLIN,S.T., Minimization of the Blank Values in theNeutron Activation Analysis of Biological Samples Considering the WholeProcedure, J. Radioanal. Nucl. Chem. 112 (1987), 11.
t 9] SIMONITS,A., MOENS.L., DE CORTE,F., DE WISPELAERE,A., ELEK.A., HOSTE.J., J.Radioanal. Chem. 60 (1980) 461.
[ 10] RAGAINI.R., RALSTON,R., GARVIS.D., Trace Element Analysis at the Livermore PoolType Reactor, Using Neutron Activation Analysis Techniques, Laurence LivermoreLaboratory, UCRL 51855 (June 1975) p.11.
C 11] LYON.U.L., ROSS,H.H, Nucleonics, Anal. Chem. 50 (1978) 80R-86R.
[ 12] LYON.W.L., ROSS.H.H, Nucleonics, Anal. Chem. 52 (1980) 69R-75R.
[ 13] LYON.W.L., ROSS,H.H, Nucleonics, Anal. Chem. 54 (1982) 227R-232R.
[ 14] LYON.W.L., ROSS,H.H. Nucleonics, Anal. Chem. 56 (1984) 83R.
[ 15] EHMANN.U.D., YATES.S.W., Nuclear and Radiochemical Analysis, Anal. Chem. 58(1986) 49R-65R.
[ 16] EHMANN,W.D., YATES,S.W., Nuclear and Radiochemical Analysis, Anal.Chem. 60(1988) 42R-62R.
[ 17] CORTE,F.,HOSTE,J., Activation analysis in Europe : Present and FuturePerspectives, Nuclear Methods in Environmental and Energy Research, (Proc. 5th.Intern. Conf. Mayaguez, Puerto Rico, 1984) 1 vol., (VOGT.J.R., Ed.), U.S.Dept.of Energy, Columbia, Mo., (1984) 2-22.
175
[ 18] GUINN.V.P., Activation analysis in the Americas: Present and FuturePerspectives, Nuclear Methods in Environmental and Energy Research, (Proc. 5thIntern. Conf., Hayaguez, Puerto Rico, 1984) 1 vol., (VOGT,J.R.,Ed), U.S.Dept.of Energy, Columbia, Mo., (1984) 23-42.
[ 19] MUECKEjG.K. (ed), Short Course in Neutron Activation in the Geosciences,Halifax (May 1980) published by the Hineralogical Association of Canada, 279pp.
[ 20] GIJBELS,R.H., HERTOGEN.J., Activation Analysis of Ores and Minerals, Pure &Appl. Chem. 49 (1977) 1555.
[ 21] ROSENBERG,R.J., Instrumental Neutron Activation Analysis as a Routine Methodfor Rock Analysis. Technical Research Centre of Finland, Electrical and NuclearTechnology, Publication 19, Espoo (1977).
C 22] COB6,J.C., Determination of Lanthanide Distribution in Rocks by NeutronActivation and Direct Gamma Counting. Anal. Chem.39, (1967) 127-131.
[ 23] GORDON,G.C., RÄNDLE,K., GOLES.G.G., CORLISS,J.B., BEESON.M.H. and OXLEY,S.S.,Instrumental Activation Analysis of Standard Rocks with High-ResolutionGamma-Ray Detectors. Geochim. Cosmochim. Acta 32 (1968) 369-396.
[ 24] ROSENBERG,R.J., WIIK,H.B., Instrumental Activation Analysis of 11 LanthanideElements in Apollo 12 Lunar Samples. Radiochem. Radioanal. Letters 6, (1971) 45.
[ 25] HASKIN.L.A., HELMKE.P.A., POSTER T.P., & ALLEN,R.O., Rare-Earths in Meteoritic,Terrestial and Lunar Matter, Activation Analysis in Geochemistry andCosmochemistry, Denmark, Universitetsförlaget (1971) 201.
[ 26] HANSON.G.N., Rare Earth Elements in Petrogenetic Studies of Igneous Systems,Ann. Rev. Earth Plant. Sei. 8 (1980) 371.
[ 27] HUFFMAN,E.L. unpublished results.
[ 28] HUFFMAN,E.L., NALDRETT,A.J., VAN LOON,U.C., HANCOCK, R.G.V. & MANSON,A. TheDetermination of all the Platinum Group Elements and Gold in Rocks and Ore byNeutron Activation Analysis after Preconcentration by a Nickel SulphideFire-assay Technique on Large Samples, Analytica Chemica Acta, 102 (1978) 157.
[ 29] PARRY,S.J., Simultaneous Determination of the Noble Metals in GeologicalMaterials by Radio- chemical Neutron Activation Analysis, L. Radioanal. Chem.105 (1980) 1157.
[ 30] BRUGMANN,G.E., GORTON,M.P. and HANCOCK,R.G.V., Simultaneous Determination ofNoble Metals, Re, Se, As, and Sb by Means of Radiochemical Neutron ActivationAnalysis, J. Geochem. EXPL (submitted 1988).
[ 31] FILEY,M.P., ANDERSON,D.L., ZOLLER,U.H., GORDON,G.E. and LINDSTROM, R.M.,Neutron Capture Prompt X-ray Activation Analysis for Multielement Determinationin Complex Samples, Anal. Chem. 51 (1979) 2209.
[ 32] LAMB,J.F., PRUSSIN.S.G., HARRIS,J.A. & HOLLANDER,J.M., Applications of LithiumDrifted Germanium Gamma-Ray Detectors to Neutron Activation Analysis.Nondestructive analysis of a Sulfide Ore. Anal. Chem. 38 (1966), p.813...818.
[ 33] PLANT,J., GOODE.G.C. and HERRINGTON J., J. Geochem. Exploration 6 (1976) 299.
176
[ 34] BAEDECKER,P.A., ROWE.J.J., STEINNES.E., Application of Epithermal NeutronActivation in Multi- element Analysis of Silicate Rocks Employing both CoaxialGe(Li) and Low Energy Photon Detector Systems, J. Radioanal. Chem. 40 (1977)115-146.
[ 35] ROSENBERG.R.J., KAISTILA.M. & ZILLIACUS.R., Instrumental Epithermal NeutronActivation Analysis of Solid Geochemical Samples. J. Radioanal. Chem 71 <1982),419-428.
[ 36] HERTOGEN.J., GIJBELS, R., Instrumental Neutron Activation Analysis of Rockswith a Low-Energy Photon Detector, Anal. Chim. Acta, 56 (1971) 61-82.
[ 37] ROSENBERG,R.J., Instrumental Activation Analysis of Lunar Samples. SuomenKemistilehti 45B. (1972) 399.
[ 38] CLIFTON,H.E., HUNTER,R.E., SWANSON.F.J. & PHILLIPS.R.L., Sample Size andMeaningful Gold Analysis. U.S.G.S. Professional Paper 625-C (1969).
[ 39] PLANT,J. and COLEMAN.R.F., Application of Neutron Activation Analysis to theEvaluation of Placer Gold Concentrations, Does Susan Know Journal, pp.373-381.
[ 40] BUGBY.E.E., A Textbook on Fire Assaying, 2nd edition, New York, Wiley (1933).
[ 41] BEAMISH,F.E. The Analytical Chemistry of Noble Metals, 1st edition , Toronto,Permagon (1966).
[ 42] HUFFMAN,E.L. & BROOKER.E.J., Biogeochemical Prospecting for Gold UsingInstrumental Neutron Activation Analysis with reference to Some Canadian GoldDeposits, Chapter 9 in "Mineral Exploration: Biological Systems and OrganicMatter", Carlisle,D., Berry,W.L., Kaplan, I.R. & Uatterson,J.R (eds) RubeyVolume V, Prentice-Hall, New Jersey (1986).
[ 43] COHEN.D.R., HUFFMAN,E.L. & NICHOL,!., Biogeochemistry: A Geochemical Method forGold Exploration in the Canadian Shield, Journal of Geochemical Exploration, 29(1987) 49.
[ 44] SAUERBRIE.J.A., PATTISON.E.F. & AVERILL.S.A., T i l l Sampling in the Casa BerardiGold Area, Quebec: A Case History in Orientation and Discovery, Journal ofGeochemical Exploration 28 (1987) 297.
[ 45] SHELP.G.S. and NICHOL,!., Distribution and Dispersion of Gold in Glacial T i l lAssociated with Gold Mineralization in the Canadian Shield, Journal ofGeochemical Exploration, 28, (1987) 315.
[ 46] BERGSTROM,J., BJORKLUND,A., BOLVIKEN.B., KONTI.M., LEHMUSPELTO,P., LINDHOLM,T.,MAGNUSSOM.J., OTTESEN.R.T., STEENFELT,A. & VOLDEN.T., Regional GeochemicalMapping in Northern Finland, Norway and Sweden, Journal of GeochemicalExploration 29 (1987) 383.
I 47] GREENBERG,R.R., FLEMING,R.F., ZEISLER,R, Envir.Intern. 10 (1984) 129-136.
[ 48] KEITH,L.H., CRUMMETT.W., DEEGAN.J., LIBBY.R.A., TAYLOR,J.H., WENTLER,G.,Principles of Environ- mental Analysis, Anal. Chem. 55 (1983) 2210-2218.
[ 49] ROBERTSON.D.E., CARPENTER,R., Nuclear Activation Techniques for the Measurementof Trace Metals in Environmental Samples, Rep. NAS-ns-2114 (1974).
[ 50] COLEMAN,R.F., Comparison of Analytical Techniques for Inorganic Pollutants,Anal. Chem. 46 (1974) 989A-996A.
177
[ 51] BUJDOSO.E., Environmental Radiochenistry and Radioactivity, A CurrentBibliography, J. Radioanal, ehem. 111 (1987) 487-502.
[ 52] DAS,H.A., FAANHOF.A., VAN DER SLOOT.H.A., Environmental Radioanalysis, Studiesin Environmental Science, vol.22 , Elsevier, Amsterdam (1983).
[ 53] Measurement, Detection and Control of Environmental Contamination (Proceed.Symp. Vienna 1976), 1 vol. IAEA, Vienna (1976 a).
[ 54] STEINNES.E. The Present Status of Neutron Activation Analysis in EnvironmentalResearch, in: Nuclear Methods in Environmental and Energy Research, (Proc. 5thIntern. Conf. Mayaguez, Puerto Rico (1984) 1 vol., (VOGT, J.R. Ed.)U.S. Dept.of Energy, Columbia, Mo. (1984) 135-140.
C 55] Guidelines for Data Acquisition and Data Quality Evaluation in EnvironmentalChemistry, ANAL. CHEM. 52 (1980) 2242-2249.
[ 56] RAHN.K.A., WINCHESTER,J.W., Sources of Trace Elements - An Approach to CleanAir. Techn. Rep. 089030-9-T, Univ. of Michigan, Ann Arbor (1971).
[ 57] MILLER,M.S., FRIEDLANDER,S.K., HIDDY,G.M., A Chemical Element Balance for thePasadena Aerosol, J. Colloid Interface Sc. 39 (1972) 165-176.
[ 58] KOUALCZYK.G.S., CHOQUETTE.C.E., GORDON,G.E., Chemical Element Balances andIdentification of Air Pollution Sources in Washington, D.C., Atmosph. Environm.12 (1978) 1143-1153.
[ 59] GASTRELL.G., FRIEDLANDER,S.K., Atmosph. Environm. 9 (1975) 279.
[ 60] STEVENS,R.K., PACE,T.G., Atmospheric Environment 18 (1984) 1499-1506.
[ 61] HOPKE,Ph.K., MARLIN.R.C., EVINS.M.A., The Interpretation of MultielementINAA-Data Using Pattern Recognition Methods, J. Radioanal. Chem. 112 1 (1987)215-222.
[ 62] ALPERT.D.J., HOPKE,Ph.K., A Quantitative Determination of the Sources in theBoston Urban Aerosol Atmosph. Environm. 14 (1980) 1137.
[ 63] DE BRUIN,M., UOLTERBEEK,H .Th ., Identification of Sources of Heavy Metals in theDutch Atmosphere Using Air Filter and Lichens Analysis, Nuclear Methods inEnvironmental and Energy Research, (Proc. 5th. Intern. Conf., Mayaguez, 1984),1 vol., (VOGT.J.R. Ed.), US. Dept.of Energy, Columbia, Mo. (1984) 266-276.
[ 64] HOPKEjPh.K., The Application of Factor Analysis to Urban Aereosol, AtmosphericAereosol, (MACIAS.E.S., HOPKE.Ph.K., Eds), ACS Monograph 167 (1981).
[ 65] VAN ESPEN,P., ADAMS,F., The Application of Principal Component and FactorAnalysis in Procedures to Data for Element Concentrations in Aerosols of aRemote Region, Anat. Chim. Acta. 150 (1983) 153-161.
[ 66] Chapter I, Comprehensive Investigation on the Comparison of Air Pollutants, andChapter II, Activation Analysis of Air Particulate Matter, in Measurement,Detection and Control of Environmental Contamination (Proceed. Symp. Vienna1976), 1 vol. IAEA, Vienna (1976 b).
[ 67] ZOLLER,W.H., GLADNEY.E.S., DUCE,R.A., Science 183 (1974) 198.
[ 68] DAMS,R., DE JONGE, J., Atmosph.Environm. 10 (1976) 1079.
178
[ 69] AMUNDSEN,C.E., HAUSSEN,J.E., RANBAEK,J.P., SEMB.A., STEINNES.E., Long RangeTransport of Trace Elements to Southern Norway by INAA of Air Filters, J.Radioanal. Chem. 114 (1987) 5-12.
[ 70] PRINGLE, T.C., JERVIS, R.E., Multielement Correlation for Airborne PaniculateSource Attribution, J. Radioanal. Chem. 110 (1987) 321-333.
[ 71] TOMRA.U., MAENHAUT.W., CAFHEYER,J., Trace Subst. Environm. Health, 16 (1982)105.
[ 72] WINCHESTER,J.W., DESAEDELEER.G.S., Application of Trace Element Analysis toStudies of the Atmospheric Environment, Ch. 3 in Non-Destructive ActivationAnalysis, (AHIEL.S., Ed.) Elsevier, Amsterdam 1981.
[ 73] ZOLLER,W.H., GORDON, G.E-, Instrumental Neutron Activation Analysis ofAtmospheric Pollutants with Ge(Li) Q-Ray Detectors, Anal. Chem. 42 (1970)257-265.
[ 74] JIN.Y.S., FANG,Q.Q., NAN.Y.Y., RU.C.B., Determination of Composition versusSize of Airborne Particulate Matter by INAA, J. Radioanal. Chem. 112 (1987).
[ 75] JERVIS,R.E., PACIGA.J.J, CHATTODAHYAY, A. .Character!'zation of Urban Aereosolsand their Hazard Assessment by Size Sampling combined with Inter-ElementRelationships, in Measurement, Detection and Control of EnvironmentalContamination, (Proceed. Symp. Vienna 1976), 1 vol. Vienna (1976), 125-148.
[ 76] HAMILTON,E.P., CHATT,A., Determination of Trace Elements in Atmospheric WetPrecipitation by Instrumental Neutron Activation Analysis, J. Radioanal. Chem.71 (1982) 29-45.
[ 77] STEINNES,E., Atmospheric Deposition of Heavy Metals in Norway Studied by theAnalysis of Moss Samples Using Neutron Activation Analysis and AtomicAbsorption Spectroscopy, J. Radioanal. Chem. 58 (1980) 387-391.
[ 78] RAMBAEK,J.P., STEINNES,E., Atmospheric Deposition of Heavy Metals Studied byAnalysis of Moss Samples Using INAA and AAS, Nuclear Methods in Environmentaland Energy Research, (Proc. 4th. Intern. Conf. Col., Mo. 1980), (VOGT,J.R.Ed.), U.S. Dept. of Energy, Columbia (1980) 175-180).
[ 79] PUCKETT,K.J., FINEGAN.E.J., Can. J. Botany, 58 (1980) 2073-2089.
[ 80] GREENBERG.R.R., GORDON,G.E., ZOLLER,W.H., Composition of Particles from theNicosia Municipal Incinerator, Environm. Sci.Techn. 12 (1978) 1329 -1332.
C 81] RAGAINI,R.C., ONDOV.J.M., Trace Element Emission from Western US Coal-FiredPower Plants, J. Radioanal. Chem. 37 (1977) 679-692.
[ 82] FILBY.R.H., SHAH,K.R., SAUTTER.C.A., A study of Trace Element Distribution inthe Solvent Refined Coal (SRC) Process Using Neutron Activation Analysis, J.Radioanal. Chem. 37 (1977) 693-704.
[ 83] ADRIANO.D.C., PAGE,A.C., ELSEEWI,A.A., CHAMG.A.C., STRAUGHAN,I., U t i l i z a t i o nand disposal of Fly- Ash and Other Coal Residues in Terrestial Eco-Systems : AReview, J. Environ. Quality 9 (1980) 333-34.
[ 84] ROWE.J.J., STEINNES.E., Determination of 30 Elements in Coal and Fly-Ash byThermal and Epithermal Neutron Activation Analysis, Talanta 24 (1979) 433-439.
179
C 85] BLOCK,C., DAHS,R., HOSTE, J., Chemical Composition of Coal and Fly-Ash inMeasurement, Detection and Control of Environmental Contamination, (Proceed.Symp. Vienna 1976), 1 vol. IAEA, Vienna (1976) 101-109.
[ 863 ZHANG.J., BILLIET.J., DAHS.R., Elemental Composition and Source Investigationof Particulates Suspended in the Air of an Iron Fouldry, The Science of theTotal Environment, 41 (1985) 13-28.
[ 87] VUCINA.J., SCEPANOVIC,V., DRASKOVIC.R., Determination of Some Trace Elements inthe Industrial Process of Al-Production, J. Radioanal. Chem. 44 (1978) 371-378.
[ 88] HUTCHINSON.T.C., AUFREITER,S., HANCOCK,R.G.V., Arsenic pollution at theYellowknife Area from Gold Smelter Activities, J. Radioanal. Chem. 71 (1982)59-74.
[ 89] DAMS,R., BUYSSE.A.M., HELSEN.M., Instrumental Neutron Activation Analysis ofSewage Sludge and Compost, J. Radioanal. Chem. 68 (1982) 219-231.
[ 90] NADKARNI.R.A., MORRISON, N.G.H., Environm. Lett. 64 (1974) 273.
[ 91] UISEMAN,B.F.H., BEDRI.G.M., A Neutron Activation Scheme for the Detection andDetermination of Pollutant Heavy Metals in Sewage Based Fertilizer, J.Radioanal. Chem., 24 (1975) 313-320.
[ 92] SIKORA.L.P., CHASMY,R.L., FRANKA.N.H., MURRAY,C.M., Metal Uptake by Crops GrownOver Entrenched Sewage Sludge, J. Agrig. Food Chem. (1980) 1281-1285.
[ 93] CAPAR,S.G.,TANNER,J.T., FREIDMAN,M.H., BORGER,K.U., Multielement Analysis ofAnimal Feed, Animal Uaste and Sewage Sludge, Environm. Sei. Techn. 12 (1978)785-790.
[ 94] EGAN.A., SPYROU.N.M., Determination of Heavy Metals in Sewage-Based FertilizerUsing Short-Lived Isotopes, J. Radioanal. Chem. 37 (1977) 775-784.
[ 95] EDELMAN,Th., DE BRUIN,M., Background Values of 32 Elements in Dutch Top-Soils,Determined with Non-Destructive Neutron Activation Analysis, Contaminated Soil(ASSINK,J.W., VAN DE BRINK,W.J., Eds.), M.Nijhoff Publ., Dordrecht 89-99.
[ 96] SCHUETZ.L., RAHN,K.A., Trace Element Concentration in Erodible Soils, Atmosph.Environm. (1981).
[ 97] CAPLAN.J-, LOBERSLI.E., NAEMANN.R., STEINNES.E., A nNutron Activation Study ofRace Contents in Plants Growing on Soils of Different Acidity, J. Radioanal.Chem. 114 (1987) 13-19.
[ 98] KAMIAS,G.D., PHILIANOS.S.M., Neutron Activation Analysis Study of Distributionof Certain Elements between Plant and Soil. J. Radioanal. Chem. 52 (1979)389-397.
[ 99] WOLTERBEEK.H.Th, VAN DIE, J., The Contents of Some Hitherto Not Reported TraceElements in Phloem Exudate from Yucca Fuccida Ham Determined by Non-DestructiveNeutron Activation Analysis, Acta. Bot. Neerl. 29 (1980) 307-309.
[100] TOUT.R.E., GILBOY.W.B.,SPYROU.N.M., Neutron Activation Studies of TraceElements in Tree Rings, J. Radioanal. Chem. 37 (1977) 705-717.
[101] EVANS,G.J.,J ERVIS,R.E., Hair as a Bio-Indicator: Limitations and Complicationsin the Interpret- ation of Results, J. Radioanal. Chem. 110 (1987) 613-627.
180
[102] TAKEUCHI.T., NAKANO,Y., AOKI.A., OHMORI.S., TSUKATANI ,T., Comparison ofElemental Concentrations in Hair of the Inhabitants of Heavy Metal PollutedAreas with those of Normal Japanese, J. Radio- anal. Chem. 112 (1987) 259-272.
[103] BHAT,K.R., ARUNACHALAN,J., YEGNASUBRAMANI AN,S., GAGADHARAN.S., Trace Elementsin Hair and Envi- ronmental Exposure, The Science of the Total Environment, 22(1982) 169-178.
[104] BOUEN,H.J.M., Determination of Trace Elements in Hair Samples from Normal andProtein-Deficient Children by Activation Analysis, The Science of the TotalEnvironment, 1 (1972) 75-79.
[105] WARD.N.E., STEPHENS,R.,RYAN,D.E., Comparison of Three Analytical Methods forthe Determination of Trace Elements in Whole Blood, Anal. Chim. Acta. 110(1979) 9-19.
[106] MAENHAUT.U., DE REU,L., TOMRA,U., DE ROOSE, J., Application of PIXE and INAA toBiological Material: Analysis of Serum and Serum Albumin, Nuclear Methods inEnvironmental and Energy Research, (Proc. 4th Intern. Conf., Columbia, Mo.1980) (VOGT,J.R. Ed.) U.S. Dept.of Energy, Columbia, 1980, 378-388.
[107] MORRIS,J.S., STAMPFER,M.J., WILLETT.W., Dietary Selenium in Humans: Toe-nailsas an Indicator, Biol. Trace Elem. Research, 5 (1983) 529-533.
[108] CORNEL IS,R., SPEECKE.A., HOSTE.J., NAA for Bulk and Trace Elements in Urine,Anal. Chim. Acta, 78 (1975) 317-327.
[109] BLOTCHKY,A.J.,SULLIVAN,J.F.,SHERMAN,M.S.,WOODUARD,G.P., VOORS.A.U.,JOHNSON,U.P., Selenium Levels in Liver and Kidney, Trace Subst. Environm.Health, 10 (1976) 97-103.
[110] LINEKIN.D.M., Multielement INAA of Biological Tissue Using a Single ComparatorStandard and Data Processing by Computer, Int. J. Appl. Rad. Isot. 24 (1973)343-351.
[111] HOFFMANN,P., LIESER,K.H., Determination of Metals in Biological andEnvironmental Samples, The Science of the Total Environment, 64 (1987) 1-12.
[112] IYENGAR.G.V., Concentrations of 15 Trace Elements in Some Selected Adult HumanTissues and Body Fluids of Clinical Interest from Several Countries: Resultsfrom a Pilot Study for the Establishment of Reference Values, ReportKFA-Juelich Jul-1974 (1985).
[113] GOODMAN, G.T., ROBERTS,T.M., Nature 231(1971) 287-292.
[114] KARBE.L., SCHNIER.Ch., SIEWER.H.O., Trace Elements in Mussel (mytilus eduli)from Coastal Areas of the North Sea and the Baltic. Multielement Analyses UsingINAA, J. Radioanal. Chem. 37 (1977) 927-945.
[115] LEBLANC,F., RAO.D.N., Soc. Bot. Fr., Coll. Bryologe, (1974) 237-255.
[116] DRABAEIC,!., EICHNER,P., RASMUSSEN, L., Concentrations of Rare Earth Elements inSediments, Mussels and Fish from a Danish Marine Environment, Lillebaelt, J.Radioanal. Chem. 112 (1987).
[117] ELLIS,K.M.. CHATTAPADHYAY.A., Multielement Determinations in EstuarineSuspended Particulate Matter by INAA, Anal. Chem. 57 (1979) 942-947.
181
[118] DE GROOT,A.J., ZSCHUPPE,K.M., DE BRUIN.M., HOUTMAN,J.P.W., AMIN SINGGIH,?.,Activation Analysis Applied to Sediments from Various River Deltas, Proceed.2nd. Intern. Vonf. Modern Trends in Activation Analysis, Gaithersburg (1968)62-71.
[119] GRIMANIS,A.P., VASSILAKIS-GRIMANI,H., GRIGG.G.B., Pollution Studies of TraceElements in Sediments from Upper Saronikos Gulf, Greece, J. Radioanal. Chem.,37 (1977) 761-774.
[120] KAHMARAN.N.I., OLHEZ,!., PAMUK.F., Identification of Inorganic Pollutants inStream Water, Measurement, Detection and Control of EnvironmentalContamination, (Proceed. Synp. Vienna 1976), 1 vol. Vienna (1976) 427-433.
[121] MERRITT, W.F., Trace Element Composition of Ground Water by INAA, in NuclearTechniques in Ground Water Research, Proceed. IAEA Adv. Group, Krakow 1976,IAEA Vienna (1980) 153-158.
[122] SALBU.B., STEINNES.E., PAPPAS.A.C., Multielement NAA of Fresh Water UsingGe(Li) Gamma-Ray Spectrometry, Anal. Chem. 47 (1975) 1011-1016.
[123] Nuclear Techniques in Ground Water Research, (Proc. IAEA Adv. Group, Krakow1976), IAEA Vienna (1980).
[124] SMITS.J., NELISSEN.J., VAN GRIEKEN.R., Comparison of PreconcentrationProcedures for Trace Elements in Natural Water, Anal. Chim. Acta., 111 (1979)215-226.
[125] VAN DER SLOOT.H.A., LUTEN,J.B., Two Applications of Neutron Activation forTrace Analysis of Water Samples, in Measurement, Detection and Control inEnvironmental Contamination (Proc. Symp. Vienna, 1976), 1 vol. Vienna (1976),435-448.
[126] GREENBERG,R.R, KINGSTON,H.M., Trace Element Analysis of Natural Water Samplesby Neutron Activation Analysis with Chelating Resins, Anal. Chem. 55 (1983)1160-1165.
[127] LIESER,K.H., NEITZERT,V., Determination of Trace Elements in Water byNon-Destructive NAA., J. Radioanal. Chem. 31 (1976) 397-405.
[128] NYARKU.S., CHATT,A., Removal of Sodium and Chlorine from Sea-Water prior to NAAfor Trace Elements, J. Radioanal. Chem. 71 (1982) 129-146.
[129] MILLEY.J.E., CHATT.A., Preconcentration and INAA of Acid Rain for TraceElements, J. Radioanal. Chem. 110 (1987) 345-365.
[130] DAMS.R., BILLIET.J., BLOCK,C., DEMUYNCK.M., JANSSEN.M., Atmosph. Environm. 9(1975) 1099.
[131] GUINN.V.P., HOSTE.J., Neutron Activation Analysis, in »Elemental Analysis ofBiological Materials," (Tech. Report 197), IAEA, Vienna (1980).
[132] HEYDORN,K., Neutron Activation Analysis for Clinical Trace Element Research (2vols), CRC Press, Boca Raton, FL (1984).
[133] CORNELIS.R., VERSIECK, J., Biological Materials, in Kolthoff,I.M., Elving.P.J.,Krivan.V. (Eds.), "Treatise on Analytical Chemistry," 2nd Ed., Part 1, Vol. 14,pp.665-684.
182
[134] Nuclear Activation Techniques in the Life Sciences, Proc. Symp. Amsterdam,IAEA, Vienna (1967).
[135] Nuclear Activation Techniques in the Life Sciences, Proc. Symp. Bled, IAEA,Vienna (1972).
[136] Nuclear Activation Techniques in the Life Sciences, Proc. Symp. Vienna, IAEA,Vienna (1979).
[137] ZEISLER.R., HARRISON,S.H., WISE,S.A., Trace elements in Human Livers UsingQuality Control in the Complete Analytical Process, Biol. Trace Element Res. 6(1984) 31.
[138] SHAFFNER,T. J., Techniques for the Characterization of Trace Impurities inSilicon, Analytical Chemistry in Semiconductor Manufacturing; Techniques, Roleof Nuclear Methods and Need for Quality Control, IAEA TECDOC (1989).
[139] HAOS, E.W., HOFFHAN,R., The Application of Radioanalytical Methods inSemiconductor Technology, Sol id-State Electronic 30 (1987) 329-337.
[140] LINDSTROM,R.M., Activation Analysis of Electronic Materials, ACS SymposiumSeries 295, p.294-307.
[141] Diagnostic Techniques for Semiconductor Materials and Devices, Proceedings ofthe Electro-Chemical Society, vol.88-20.
[142] GUINN.V.P., Application of Nuclear Science in Crime Investigation, Ann. Rev.Nucl. Sei. 24 (1974) 561-591.
[143] YELLIN.E., Forensic Applications in Non-Destructive Activation Analysis(S.Amiel, ed.), Eisevier Series Studies in Analytical Chemistry 3, Amsterdam1981, 281-302.
[144] GUINN,V.P., FIER.S.R., HEYE,C.L., JOURDAN.T.H., New Studies in Forensic NeutronActivation Analysis, J. Radioanal. Nucl. Chem., 114 (2), (1987), 265-273.
[145] CARTER,G.F. (ed). Archaeological Chemistry - II, Adv. in Chem. Ser. 171, Am.Chem. Soc., Washington (1978).
[146] ROSENBERG,R.J., The Determination of the Silver Content of Ancient SilverCoins. J. Radioanal. Chem. 92 (1985) 171-176.
[147] HOLTTA.P. & ROSENBERG,R.J., Determination of the Elemental Composition ofCopper and Bronze Objects by Neutron Activation Analysis, J. Radioanal. Nucl.Chem. 114 (1987) 403.
[148] GILATH.Ch., Industrial Applications of Nondestructive Activation Analysis,Nondestructive Activation Analysis, S.Amiel ed., Eisevier, Amsterdam (1981),303.
[149] NUCLEAR RESEARCH REACTORS IN THE WORLD, May 1988 Ed., IAEA, Vienna (May 1988).
[150] KOSTA.C.L., Contamination as a Limiting Parameter in Trace Analysis, Talanta 29(1982) 985-992.
[151] MOODY,J.R., LINDSTROM,R.M., Selection and Cleaning of Containers for Storage ofTrace Element Samples, Anal. Chem. 49 (1977), 2264.
183
[152] SANSONI,B., IYENGAR,G.V., Sampling of Biological Material for Trace ElementAnalysis, in: Elemental Analysis of Biological Materials: Current Problems andTechniques with Special Reference to Trace Elements, IAEA Technical Report 197Vienna (1980).
[153] LAKOMAA,E.L., unpublished results.
[154] HEYDORN.K., Neutron Activation Analysis for Clinical Trace Element Research (2vols), CRC Press, Boca Raton, FL, (1984).
[155] BICHLER.H., BÖCK.H., BUCHTELA.K. & HAMMER,J. Pneumatic Transfer Systems, AIAU88308 (1988), Atomic Institut der Osterr. Universitäten Internal Report.
[156] ROSENBERG,R.J., PITKäNEN.V., SORSA.A., An Automatic Uranium Analyser Based onDelayed Neutron Counting. J. Radioanal. Chem. 37 (1977), 169-179.
[157] ROSENBERG,R.J., ZILLIACUS.R., Improving Accuracy in Routine InstrumentalActivation Analysis. J. Radioanal. Chem. 39 (1977), 189-200.
[158] ROSENBERG,R.J., A Simple Method for the Determination of Uranium and Thorium byDelayed Neutron Counting. J. Radioanal. Chem. 62 (1981), 145-149.
[159] GLADNEY.E.S., PERRIN.D.R., BALOGNA.J.P. & WARNER,C.L., Anal. Chem. 52 (1980)2128.
[160] NAPIER,B.A. et al., Nuclear Instruments and Methods 138 (1976) 463.
[161] PAPAHICOLOPOULOS.C. & FINK.R.W., Ibid 151 (1978) 63.
[162] DE BRUIN,M., KORTHOVEN.P.J.M., Camac-Based Instrumentation for aNon-Destructive Neutron Activation Analysis System, J. Radioanal. Chem. 22(1974) 131-138.
[163] COOPER,J.A., PERKINS.R.U., A Versatile Ge(Li)-NaI(Tl)Coincidence-Anticoincidence Q-Ray Spectro- meter for Environmental andBiological Problems, Nucl. Instr. Meth. 99 (1972) 125-146.
[164] CAMP.D.C., GASTROUSIS.G., MAYNARD.L.A., Low Background Ge(Li) Detector Systemfor Radioenviron- mental Studies, Nucl. Instr. Meth. 117 (1974) 189-211.
[165] GOULDING.F.S., PEHL.R.E., Semiconductor Radiation Detectors.
[166] GOULDING.F.S., LANDIS,D.A., Semiconductor Spectrometer Electronics, in NuclearSpectroscopy and Reactions (LERNY.J., Ed.) Part A, Acad. Press, York (1974).
[167] TAIT,U.H., Radiation Detection, Buttersworth, London (1980).
[168] KNOLL,G.F.; Radiation Detection and Measurement, J. Wiley and Sons (1979) NewYork.
[169] PAULUS,T.J., RAUDORF,T.W., COYNE.B., TRAMMELL,R., Comparative TimingPerformance of Large Volume HPGe Germanium Detectors, IEEE Transact. Nucl. Sei.NS-28 (1981) 544-548.
[170] NAKANISHI.T, SANSONI.B., Low Energy Photon Spectrometry in Non-DestructiveNeutron Activation Analysis of Environmental Samples, J. Radioanal. Chem. 37(1977) 945-955.
184
[171] SCHMITT.B.F., SEGEBADE,C., Multielement Analysis of Soil of a Sewage Farm byPhoton and Neutron Activation Analysis Using Waste Incineration Ash asReference Material, Proceed. 4th. Intern. Conf. on Nuclear Methods in Energyand Environmental Research, Columbia, Mo. 1980 (VOGT, J.R. Ed.),U.S. Dept. ofEnergy, Columbia (1980) 159-168.
[172] MANTEL M., AMIEL,S., Simultaneous Determination of Uranium and Thorium by INAAand High Resolution X-Ray Spectrometry, Anal. Chem. 45 (1975) 2393-2399.
[173] HNATOWICZ,V., Dependence of Efficiency Curve for Ge(Li) Detectors on DetectorShape, Nucl. Instr. Meth. 142 (1977) 403-407.
[174] DE BRUIN,M., KORTHOVENP.J.M., The Well-Type Ge(Li) Detector as a Tool inRadiochemistry, Radio- ehem. Radioanal. Lett. 44 (1980) 139-150.
[175] LANDIS.D.A., MADDEN,N.U., GOULDING,F.S., Energy Dependent Losses inPulsed-Feedback Preamplifiers, IEEE Transact. Nucl. Science, NS-26 No.1 (1979)428-432.
[176] PESSARA.W., Amplitude Dependent Count Rate Losses in Pulsed Optical FeedbackPreamplifiers, Nucl. Instr. Meth., 173 (1980) 307-309.
[177] BODE,P., DE BRUIN,M., Preamplifiers with Pulsed Optical Feedback as a Source ofErrors in Instrumental Activation Analysis, Nucl. Instr. Meth. 216 (1983)529-530.
[178] FUNCK,E., Counting Losses from Pulsed Optical Feedback Preamplifiers Used withSemi-Conductor Detectors, Int. J. Appl. Radiât. Isot. 34 (1983) 1123-1131.
[179] Quality Assurance in Biomédical Neutron Activation Analysis, IAEA TECDOC 323,Vienna (1984).
[180] LINDSTROM,R.M., FLEMING,R.F., Accuracy in Activation Analysis: Count RateEffects, Nuclear Methods in Environmental and Energy Research, (Proc. 4th.Intern. Conf., Columbia, Mo. 1980, VOGT.J.R., Ed.) U.S. Dept. of Energy,Columbia (1980) 25-35.
[181] ANDERS,O.U., Experiences with the Ge(Li) Detector for High Resolution Gamma-RaySpectroscopy and a Practical Approach to the Pulse Pile-Up Problem, Nucl.Instr. Meth., 68 (1968) 205.
[182] STRAUSS,M.G., SIFTER,L.L., LENKIZUS,F.R., BREMER,R., Ultra Stable ReferencePulser for High Resolution Spectrometers, IEEE Transact. Nucl. Science, NS-15,(1968) 518-530.
[183] HARMS, J.P., Automatic Dead-Time Correction for Multichannel Pulse-HeightAnalyzers at Variable Count Rates, Nucl. Instr. Meth. 53 (1967) 192-196.
[184] WESTPHAL,G.P., Loss-Free Counting - A Concept for Real-Time Compensation ofDead-Time and Pile-Up Losses in Nuclear Pulse Spectroscopy, Nucl. Instr. Meth.146 (1977) 605-606.
[185] WESTPHAL.G.P., On the Performance of Loss-Free Counting - A Method forReal-Time Compensation of Dead Time and Pile-Up Losses in Nuclear PulseSpectroscopy, Nucl. Instr. Meth. 163 (1979) 189-196.
[186] UESTPHAL.G.P., Real-Time Correction of Counting Losses in Nuclear PulseSpectroscopy, J. Radio- anal. Chem. 70 (1982) 387-410.
185
[187] AARNIO,P.A., ROUTTI.J.T., SANDBERG, J .V., MicroSAMPO - Personal Computer-BasedAdvanced Gamma Spectrum Analysis System, J. Radioanal. Nucl. Chem. 124 (1988),457.
[188] GUNNINK.R. & NIDAY.J.B., Computerized Qauntitative Analysis by Gamma-RaySpectrometry. Vol. I. Description of the Gamanal Program, UCRL-51061, vol, 1(1972).
[189] PHILLIPS,G, MARLOW.K.U., Nucl. Instr. Methods, 137 (1976) 525.
[190] LINDSTROM,D.J. & KOROTOV,R.L., Teabags: Computer Programs for InstrumentalNeutron Activation Analysis 6th Modern Trends in Activation Analysis, (1981)Toronto, 197.
[191] PARR,R.M., HOUTERMANS,H., SCHAERF.K., The IAEA Intercomparison of Methods forProcessing Ge(Li) Gamma-Ray Spectra: A Preliminary Report in Computers inActivation Analysis (Proc. Conf. Mayaguez, 1978), Carpenter,B.S.,D'Agostino.M.D., Yule,H.P., eds. (CONF-780421) USDOE (1979), 544.
[192] BODE,P., DE BRUIN,M., KORTHOVEN.P.J.M., Increased utilization of ResearchReactor Facilities without Staff Personnel Expansion by a User-Friendly Systemfor Routine Instrumental Neutron Activation Analysis, IAEA TECDOC 409 ResearchReactor Activities in Support of National Nuclear Programmes »Vienna (1987).
[193] BURHOLT,G.D., CAESAR,E.A.Y., JONES,T.C., A Description of the Cyclic ActivationSystem (CAS) on the University of London Reactor, Nucl. Instr. Methods, 204(1982) 231.
[194] BODE,P., DE BRUIN,M., An Automated System for Activation Analysis with ShortHalf-Life Radionuclides Using a Carbonfiber Irradiation Facility, J. Radioanl.Nucl. Chem., 123(2) (1988) 365-376.
[195] GARFINKEL.S.B., MANN,U.B. & YOUDEN,W.J., Design and Statistical Procedures forthe Evaluation of an Automatic Gamma-Ray Point-Source Calibrator, J. ofResearch of NBS - C Engineering & Instrumentation, 70C (1966) 92-53 - 102-63.
[196] BERTOZZI,G., GIRARDI.F., GUZZI, G. & COLA, DI., Comparative Analysis ofDifferent Computer Handling Systems for Gamma-Spectrometric Data Developed atC.C.R. ISPRA. J. Radioanal. Chem. 15 (1973), p.637...646.
[197] VâNSKâ.L., ROSENBERG,R.J., & PITKâNEN,V., An Automatic Gamma Spectrometer forActivation Analysis. Nuclear Instruments and Methods 213 (1983), pp.343-347.
[198] DE BRUIN.M, KORTHOVEN.P.J.M., BODE,P., Evaluation of a System for RoutineInstrumental Neutron Activation Analysis, J. Radioanal. Chem. 70 (1982) 497-512.
[199] ECHO,M.W. & TURK,E.H., Quantitative Determination of 235 U by delayedneutron counting. PTR-143 (Jan. 28, 1957).
[200] AMIEL, S., Analytical Applications of Delayed Neutron Emission in FissionableElements. IA-621 (May 1961).
[201] DYER,F.F., EMERY,J.F. & LEDDICOTE.G.U., A Comprehensive Study of the NeutronActivation Analysis of Uranium by Delayed Neutron Counting. ORNL-3342 (Oct.1962).
[202] OSTLE,D., COLEMAN.R.F. & BALL.T.K., Uranium Prospecting Handbook, Proceedingsof a NATO-Sponsored Advanced Study Institute on Methods of Prospecting forUranium Minerals, London, 21 Sept. - 2 Oct. 1972, p.95.
186
[203] MINOR,M.H., HENSLEY.W.K., DENTON,M.M., GARCIA,U.R., J. Radioanal. Chem. 70(1982) 459.
[204] MILLARD,Jr.,H.T., Geol. Surv. Prof. Paper 840, p.61, unpublished reports.
[205] CHRIEN.R.E., Practical Uses of Neutron Capture Gamma-Ray Spectroscopy, in B.J.Allen, I. Berggvist, R.E. Chrien, and D. Gardner (eds) "Neutron RadiativeCapture" Oxford: Pergamon (1984), 187.
[206] LINDSTROM,R.M. & ANDERSON.D.L., Analytical Neutron-Capture Gamma-RaySpectroscopy: Status and Prospects, in S. Raman (ed) "Capture Gamma-RaySpectroscopy and Related Topics - 1984" New York: Am. Inst. Physics, (1985),810.
[207] LENIHAN.J.M.A., Talk Presented at 4th Internat. Conf. Nucl Methods in Envir.and Energy Res., Columbia, Mo. (1980).
[208] KELLER,H., Present Sample Identification Systems, J. Autom. Chem. 3 (1981)196-198.
[209] KORTHOVEN,P.Ü.M., DE BRUIN,M., Computer Aspects of Large-Scale RoutineInstrumental Neutron Activation Analysis, Computers in Activation Analysis andq-ray Spectroscopy, (Proceed. Intern. Conf. Mayaguez (1978) 639-651.
[210] INGAMELLS.C.O., SWITZER.P-, A Proposed Sampling Constant for Use in GeochemicalAnalysis, Talanta 20 (1973), 547.
[211] HILLEBRAND.W.F., LUNDELL.G.E.F., BRIGHT,H.A., HUFFMAN,J.I., Applied InorganicAnalysis (2nd Ed.), Uiley, New York (1953).
[212] VERSIECK.J., BARBIER,F., CORNELIS.R., HOSTE,J., Sample Contamination as aSource of Error in Trace-Element Analysis of Biological Samples, Talanta 29(1982) 973-984.
[213] CORNELIS.R., Sample Handling of Clinical Specimens for Ultra-Trace ElementAnalysis, J. Radioanal. Chem. 112 (1987) 141-150.
[214] IYENGAR,G.V., Preservation and Preparation of Biological Materials for TraceElement Analysis: Quality Assurance Considerations in: Quality Assurance inBiomédical Neutron Activation Analysis, Rep. Advis. Group Meeting Vienna, 1982,IAEA-TECDOC 323 Vienna (1984) 83-05.
[215] BEHNE.D., Problems of Sampling and Sample Preparation for Trace ElementAnalysis in the health Sciences, Trace Element Analytical Chemistry in Medicineand Biology, Bratter.P-, Schramel P. (eds.), de Gruyter (1980) 769-782.
[216] DIKAWA.K., Trace Analysis of Atmospheric Samples, Kodanska Ltd., Tokyo and J.Wiley and Sons, New York (1977); chapter 2, pp.5-59.
[217] LAKOMAA.E.L., Element Analysis of Small-Size Biological Samples, Kemia-Kemi, 8(1981) 378-380.
[218] LAKOMAA.E.L., MUSSALO-RAUHAMAA,H., SALMELA,S., Avoidance of Contamination inElemental Analysis of Serum Samples, submitted to J. of Trace Elements andElectrolytes in Health and Disease.
[219] ZEISLER.R., GREENBERG,R.R., STONE,S.F., SULLIVAN,T.M., Selenium Determinationin the Assessment of Sample Stability in Specimen Banking, Trans. AmericanNuclear Society Meeting, San Diego (1988) 153-154.
187
[220] BENEDETTI-PICHLER.A.A., Theory and Principles of Sampling for ChemicalAnalysis, 1956, in W.G. Bert (ed.) Physical Methods in Chemical Analysis VIII(1956) Academic Press, New York.
[221] MAIENTHAL,E.J., BECKER,D.A., A Survey of Current Literature on Sampling, SampleHandling and Long Term Storage for Environmental Materials, NBS Technical Note929 (1976).
[222] GREENBERG, R.R., Trace Element Characterization of the NBS Urban ParticulateMatter Standard Reference Material by Instrumental Neutron Activation Analysis,Anal. Chem. 51 (1979) 2004.
[223] GREENBERG, R.R., The Role of Neutron Activation Analysis in the Certificationof NBS Standard Reference Materials, J. Radioanal. Nucl. Chem. 113 (1987), 233.
[224] MOODY,J.R., GREENBERG,R.R., PRATT.K.W., RAINS,T.C., Recommended InorganicChemicals for Calibration, Anal. Chem. 60 (1988) 1203A-1218A.
[225] BECKER.D.A., Primary Standards in Activation Analysis, J. Radioanal. Chem. 113(1987), 5.
[226] DUVAL, C., Inorganic Thermogravimetric Analysis, Elsevier, New York (1953).
[227] DATE,A.R., Preparation of Trace Element Reference Materials by aCo-precipitated Gel Technique, Report No. 101, Institute of GeologicalSciences, London (March 1977).
[228] MITCHELL,J.W., BLITZER,L.D., KOMETANI,T.Y., GILLS,T., CLARK,Jr.,L.,Homogenuously Doped Silica Matrices for Trace Element Standards in NeutronActivation Analysis, J. Radioanal. Chem. 39 (1977) 335-342.
[229] ANDERSON.D.H., MURPHY,J.J., WHITE,W.W., Gelatin Mult i component Trace ElementReference Material, Anal. Chem. 48 (1976) 116.
[230] MOSULISHVILI,L.M., DUNDUA.V.Y., KHARABADZE,N.E., EFREMOVA.E.Y.,CHIKHLADZE,N.V., Synthetic Multielement Standard Samples for Serial NeutronActivation Analysis of Biological Materials, J. Radioanal. Nucl. Chem. 83(1984) 13.
[231] MATSUMOTO.K., SUZUKI,N., A New Trace Element Standard Reference Materials withPolyacrylamide Gel Matrix for Radioactivation Analysis, Radiochem. Radioanal.Letters 42 (1980) 99.
[232] PERLMAN,!., ASARO,F., Pottery Analysis by Neutron Activation, in "Science andArchaeology," (BRILL,R.H., Ed), MIT Press, Cambridge (1971), 182.
[233] MARINENKO.R.B., Preparation and Characterization of K-411 and K-412 MineralGlasses for Micro- analysis: SRM 470 (NBS Spec. Pub. 260-74), National Bureauof Standards, Washington, DC (1982).
[234] ROUCHAUD,J.C., DEBOVE,L., FEDOROFF,M., MOSULISHVILI,L.M., DUNDUA.V.Y.,KHARABADZE.N.E., SHONIA, N.I., EFREMOVA.E.Y., CHIKHLADZE.N.V., A Comparison ofSynthetic Irradiation-Resistant Multi- Element Standards for ActivationAnalysis, J. Radioanal. Nucl. Chem. 113 (1987) 209.
[235] Eastman Kodak Company, Rochester, NY 14650, USA.
188
[236] STEINNES.E. Epithermal Neutron Activation Analysis of Geological Material.Activation Analysis in Geochemistry and Cosmochemistry, Denmark,Universetetsforlaget (1971), 113-128.
[237] PARRY,S.J., Epithermal Neutron Activation Analysis of Short-Lived Neuclides inGeological Material, J. Radioanal. Chem. 72 (1982) 195-207.
[238] MINOR,M.M., HENSLEY.U.K., DENTON.M.M., GARCIA,J.R., J. Radioanal. Chem. 70(1982) 459.
[239] GUINN, V.P., LESLIE,J., NAKAZAUA,L., Performance of the Updated INAA AdvancePrediction Computer Program, J. Radioanal. Chem. 70 (1982) 513-525.
[240] DE BRUIN,M., KORTHOVEN,P.J.M., The Influence of Summation on the Determinationof Relative Counting Efficiencies, Radiochem. Radioanal. Lett. 19 (1975)153-156.
[241] ERTEN.H.N., AKSOYOGLU.S., GOKTURtC.H., Efficiency Calibration and SummationEffects in Gamma-Ray Spectrometry, J. Radioanal. Chem.125, no.1 (1988) 3-10.
[242] DE BRUIN,M., KORTHOVEN,P.J.M., BODE,P., Spectrum Interpretation Problems withWell-Type Ge(Li) Detectors due to Self-Absorption Variations, Nucl. Instr.Meth. 159 (1979) 301-303.
[244] BODE,P., DE BRUIN,M., KORTHOVEN,P.J.M., A method for the Correction ofSelf-Absorption of Low- Energy Photons for Use in Routine INAA, J. Radioanal.Chem. 64 (1981) 153-166.
[245] AMIEL.S., MANTEL,M., ALFASSI,Z.B., Development of a New Approach to TraceElement Analysis Using Neutron Activation Followed by High Resolution X-RaySpectrometry, J. Radioanal. Chem. 37 (1977) 189-193.
[246] MANN,W.8., LOWENTHAL.G.C., TAYLOR,J.C.V. (Eds), Applied Radionuclide Metrology,(Proceed Seminar Geel 1983), Int. J. Appl. Radiât. Isot. 34 (1983).
[247] ADAMS,F., DAMS,R., A Compilation of Precisely Determined Gamma-Ray TransitionEnergies of Radio_ nuclides Produced by Reactor Irradiation, J. Radioanal.Chem. 3 (1969) 99-125.
[248] HELMER,R.G., GREENWOOD, R.C., GEHRKE.R.J., Réévaluation of Precise Q-RayEnergies for Calibration of Ge(Li)-Spectrometers, Nucl. Instr. Meth. 155 (1978)189-201.
[249] HELMER,R.G., VAN DE ASSCHE.P.M.W., VAN DER LEUN.C., Atomic Data and NuclearData Tables, 24 (1979) 39-48.
[250] HELMER,R.G., Efficiency Calibration of a Ge-Detector for 30-2800 keV q-rays,Nucl. Instr. Meth. 199 (1982) 521-529.
[251] HELMER,R.G., Variation of Ge-Detector Efficiency with Source Diameter andRadial Source Position, Int. Journ. Appl. Radiât. Isotop. 34 (1983) 1105-1108.
[252] GEHRKE.R.J., HELMER,R.G., GREENWOOD,R.C., Precise Relative Q-Ray Intensitiesfor Calibration of Ge-Semiconductor Detectors, Nucl. Instr. Meth. 147 (1977)405-413.
[253] MICHAELIS, W., Experimental Gamma-Ray Response Characteristics of LithiumDrifted Germanium Detectors, Nucl. Instr. Meth. 70 (1969) 253-261.
189
[254] VERPLANCKE,J.C., Full Energy Peak Efficiency of a Well-Type Ge(Li) Gamma-RayDetector, Nucl. Instr. Heth. 96 (1971) 557-560.
[255] MOENS.L., HOSTE.J., Calculation of the Peak Efficiency of High-Purity GermaniumDetectors, Int. J. Appl. Rad. Isotop., 34 no.8 (1983) 1085-1096.
[256] LIPPERT.J., Detector-Efficiency Calculation based on Point-Source Measurement,Int. J. Appl. Rad. Isotop. 34 no.8 (1983) 1097-1104.
[257] SPYROU,N.M., Cyclic Activation Analysis: A Review, J. Radioanal. Chem. 61(1981) 211-242.
[258] SPYROU.N.M., OZEK.F., INGLE,K., Cyclic Activation in Trace Element Analysis ofEnvironmental Samples, Nuclear Methods in Environmental and Energy Research,(Proc. 2nd Intern. Conf. Nucl. Methods in Energy and Environmental Research,Columbia, Mo. (1974) 106.
[259] SEGEBADE,C., UEISE,H.P., Comparison of Sensitivity Estimates for Low EnergyPhoton and Classical Gamma-Ray Spectroscopy Applied to Photon ActivationAnalysis, J. Radioanal. Chem. 45 (1978) 209-220.
[260] ROWSON,J.U., HONTZEAS,S.A., Radioisotopic X-ray Analysis of Uranium Ores byK-shell Fluorescence, Nucl. Instr. Meth. 163 (1978) 555-568.
[261] HOZBECKER,J., RYAN,D.E., Determination of Trace Metals by Neutron ActivationAnalysis after Coprecipitat ion with Lead Phosphate, J. Radioanal. Chem. 74(1982) 25-30.
[262] SHENBERG.C.; GILAT.J., FINST.H.L., Use of X-Ray Spectrocmetry in ActivationAnalysis, Determination of Bromine, Anal. Chem. 39 (1967) 780-785.
[263] UIERNIK.M., Comparison of Several Methods Proposed for Correction of Dead-Timelosses in the Q-Ray Spectrometry of Very Short-Lived Isotopes, Nucl. Instr.Meth. 95 (1974) 13-18.
[264] HOUTERMANS.H., SCHAERF.K., REICHEL,R., DEBERTIN.K., International Comparison ofMethods to Test the Validity of Dead-Time and Pile-Up Corrections for HighPrecision Q-Ray Spectroscopy, Int. J. Appl. Rad. Isotop. 34 (1983) 487-489.
[265] WYTTENBACH,A., Coincidence Losses in Activation Analysis, J. Radioanal. Chem. 8(1971) 335-343.
[266] BARTOSEK.J., ADAMS,F., HOSTE,J., A Dead-Time Correction System for Gamma-RaySpectrometry of Short-Lived Isotopes, Nucl. Instr. Meth. 103 (1972) 45-47.
[267] DE BRUIN,M., THEN, S.S., BODE,P., KORTHOVEN, P.J.M., A simple DeadtimeStabilizer for Gamma-Ray Spectrometers, Nucl. Instr. Meth. 121 (1974) 611-613.
[268] STERLINSKI,S., HAMMER,U., Simple Methods for Dead-Time and Pile-Up Correctionsin Analytical Gamma-Ray Spectroscopy, J. Radioanal. Chem. 31 (1976) 235-237.
[269] STERLINSKI,S., HAMMER,U., UASEK.M., The Nature of Dead-Time in MultichannelPulse Height Analyzers at High Counting Rate and Related Problems, J.Radioanal. Chem. 114 (1987) 243-255.
[270] ANDEWEG,A.H., Automatic Setting of the Distance Between Sample and Detector inGamma-Ray Spectro- metry. National Institute of Mining (Randsburg, SouthAfrica) Report NIM-Report 2069 (1980).
190
[271] CARPENTER, B.S., 0'AGOSTINO,M.D., YULE,H.P. (Eds.), Computers in ActivationAnalysis and Gamma-Ray Spectroscopy (CONF-780421), U.S. Dept. of Energy,Springfield, Va. (1978).
[272] HEYDORN.K., CHRISTENSEN,L.H., Verification Testing of Commercially AvailableComputer Programs for Photopeak Area Evaluation, J. Radioanal. NucL. Chem. 124(1988), 467.
[273] SANDERSON,C.G., An Evaluation of Commercial IBM PC Software for the Analysis ofLow-Level Environmental Gamma-ray Spectra, Proc. Conf. Low-Level TechniquesGroup, Internat. Comm. Radionucl. Metrol., Uurlingen (1987).
[274] ROUTTI.J.R., PRUSSIN,S.G., Photopeak Method for the Computer Analysis ofGamma-Ray Spectra from Semiconductor Detectors, Nucl. Instr. Meth. 72 (1969)125.
[275] HENSLEY,W.K., LEPEL.E.A., YULY.M.E., ABEL,K.H., Adaptation and Implementationof the RAYGUN Gamma-Ray Analysis Code on the IBM PC, J. Radioanal. Nucl. Chem.124 (1988) 481.
[276] DE CORTE,F.,SIMONITS,A. DE WISPELAERE,A., HOSTE,J., Accuracy and Applicabilityof the k0 Standardization Method, J. Radioanal. Chem. 113 (1987) 145-161.
[277] LANDSBERGER.S. Spectral Interferences from Uranium Fission in NeutronActivation Analysis., Chem. Geol. 57 (1986) 415.
[278] DE BIEVRE.P-, Transferring Accuracy to the Trace Level and Then to the Field,J. Res. Nat. Bur. Stds. (U.S.) 93 (1988), 520.
[279] WILSON,E.B., Jr., An Introduction to Scientific Research, McGraw-Hill, New York(1952).
[280] KRATOCHVIL.B., TAYLOR,J.K., Sampling for Chemical Analysis, Anal. Chem. 53(1981), 924A.
[281] INGAMELLS.C.O., SWITZER.P., A Proposed Sampling Constant for Use in GeochemicalAnalysis, Talanta 20 (1973), 547.
[282] LIPPONEN,M. & ROSENBERG,R.J., Quality control in Routine InstrumentalEpithermal Neutron Activation Analysis of Geological Materials, J. Res. Nat.Bur. Stds. 93 (1988) 224.
[283] DE SOETE.D., GIJBELS,R., HOSTE.J., Neutron Activation Analysis,Wiley-Interscience, London (1972).
[284] FRIEDLANDER.G., KENNEDY,J.W., MACIAS.E.S., MILLER,J.M., Nuclear andRadiochemistry, 3rd ed., Wiley-Interscience, New York (1981).
[285] CURRIE,L.A., The Limit of Precision in Nuclear and Analytical Chemistry, Nucl.Inst. Methods 100 (1972), 387.
[286] HEYDORN.K., Detection of Systematic Errors by the Analysis of Precision, in"Accuracy in Trace Analysis: Sampling, Sample Handling, Analysis", LAFLEUR,P.D., ed., Nat. Bur. Stds. (U.S.) Spec. Pub. 422 (1976).
[287] Analytical Methods Committee, IUPAC, Sodium Carbonate as a Primary Standard inAcid-Base Titri- metry. Analyst 90 (1965), 251.
191
[288] Terms and Definitions Used in Connection with Reference Materials, ISO Guide30-1981 (E).
[289] Geostandards Newsletter (Paris), published semiannually.
[290] FLANAGAN,F.J., Reference Samples in Geology and Geochemistry, U.S. GeologicalSurvey Bulletin 1582 (1986) 70.
[291] ABBEY,S., Studies in "Standard Samples" for Use in the General Analysis ofSilicate Rocks and Minerals, Geostandards Newsletter (1980) 4, 163.
[292] ISO Catalog and Compilation of Standard Materials.
[292] SEwARD.R.W. (ed.), NBS Standard Reference Materials Catalog 1988-89, Nat. Bur.Stds. (U.S.) Spec. Pub. 260 (1988).
[293] TAYLOR,J.K., Handbook for SRM Users, Nat. Bur. Stds. (U.S.) Spec. Pub. 260-100(1985).
[294] MURAMATSU,Y., PARR.R.M., Survey of Currently Available Reference Materials forUse in Connection with the Determination of Trace Elements in Biological andEnvironmental Materials, Report IAEA/ RL/128 (1985).
[295] EISENHART,C.E., Expression of the Uncertainties of Final Results, Science 160(1968), 1201.
[296] KU.H.H., Notes on the Use of Propagation of Error Formulas, J. Res. Nat. Bur.Stds. (U.S.) 70C (1966), 263.
[297] FLEMING,R.F., LINDSTROM,R.M., Limitations on the Accuracy of SulphurDetermination by NAA, Transact. Amer. Nucl. Soc. 41 (1982) 223.
[298] GARFIELD,F.M., Quality Assurance Principles for Analytical Laboratories, AOAC,Arlington, Va. (1984).
[299] HEYDORN,K., Quality Assurance in Neutron Activation Analysis, in Proc. 5thInternat. Conf. Nucl. Methods Envir. Energy Res. (Mayaguez, 1984), VOGT, J.R.,ed., (CONF-840408) USDOE (1984) 620.
192
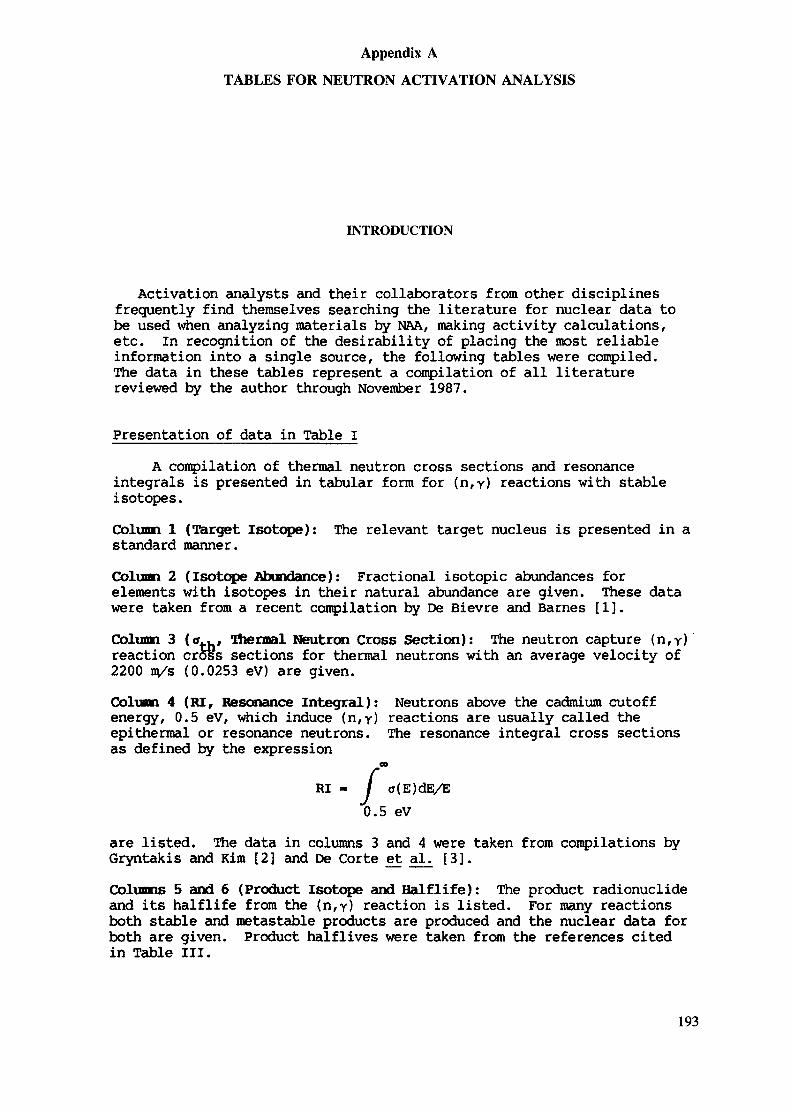
Appendix ATABLES FOR NEUTRON ACTIVATION ANALYSIS
INTRODUCTION
Activation analysts and their collaborators from other disciplinesfrequently find themselves searching the literature for nuclear data tobe used when analyzing materials by NAA, making activity calculations,etc. In recognition of the desirability of placing the most reliableinformation into a single source, the following tables were compiled.The data in these tables represent a compilation of all literaturereviewed by the author through November 1987.
Presentation of data in Table IA compilation of thermal neutron cross sections and resonance
integrals is presented in tabular form for (n,r) reactions with stableisotopes.Column 1 (Target Isotope): The relevant target nucleus is presented in astandard manner.Column 2 (Isotope Abundance): Fractional isotopic abundances forelements with isotopes in their natural abundance are given. These datawere taken from a recent compilation by De Bievre and Barnes [1],Column 3 (a^ Biennal Neutron Cross Section): The neutron capture (n,y)reaction cross sections for thermal neutrons with an average velocity of2200 m/s (0.0253 eV) are given.Column 4 (HI, Resonance Integral): Neutrons above the cadmium cutoffenergy, 0.5 eV, which induce (n,y) reactions are usually called theepithermal or resonance neutrons. The resonance integral cross sectionsas defined by the expression
RI - I <r(E)dE/E0.5 eV
are listed. The data in columns 3 and 4 were taken from compilations byGryntakis and Kim [2] and De Corte et al. [3].Columns 5 and 6 (Product Isotope and Halflife): The product radionuclideand its halflife from the (n,y) reaction is listed. For many reactionsboth stable and metastable products are produced and the nuclear data forboth are given. Product halflives were taken from the references citedin Table III.
193
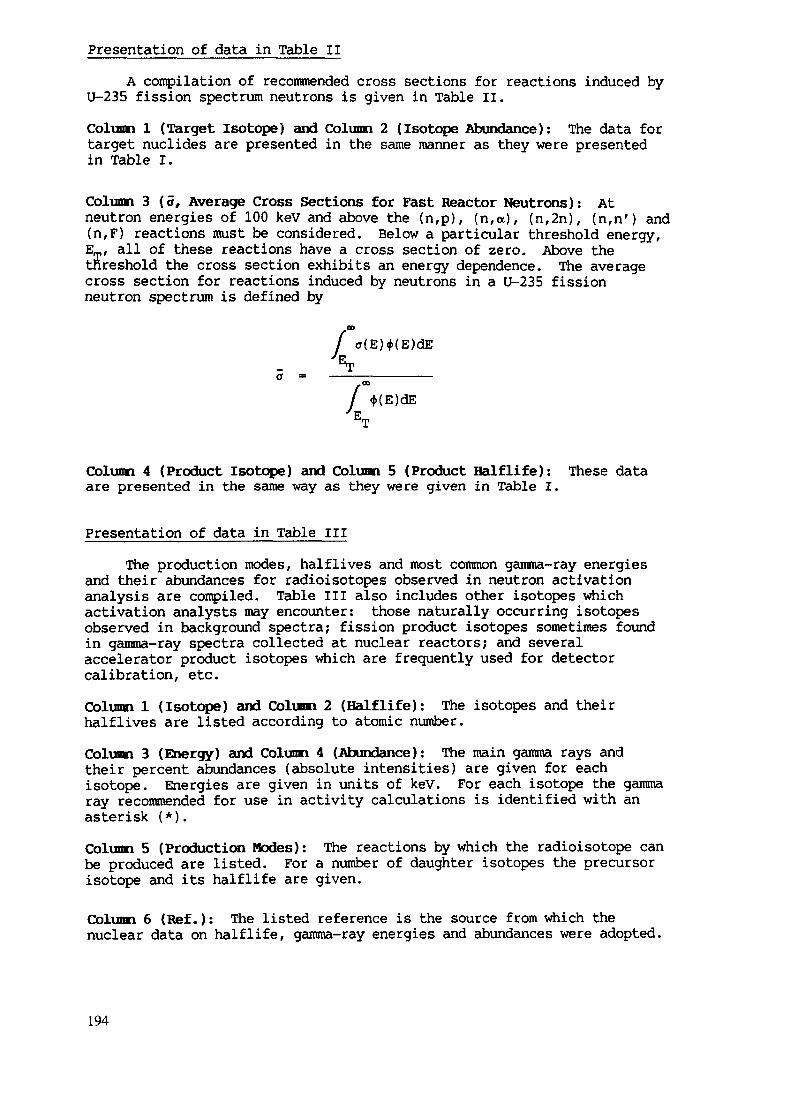
Presentation of data in Table IIA compilation of recommended cross sections for reactions induced by
U-235 fission spectrum neutrons is given in Table II.Column 1 (Target Isotope) and Column 2 (Isotope Abundance): The data fortarget nuclides are presented in the same manner as they were presentedin Table I.
Column 3 (a, Average Cross Sections for Fast Reactor Neutrons): Atneutron energies of 100 keV and above the (n,p), (n,a), (n,2n), (n,n') and(n,F) reactions must be considered. Below a particular threshold energy,E„, all of these reactions have a cross section of zero. Above thethreshold the cross section exhibits an energy dependence. The averagecross section for reactions induced by neutrons in a U-235 fissionneutron spectrum is defined by
<r(E)4>(E)dEET
<KE)dEET
Column 4 (Product Isotope) and Column 5 (Product Half life): These dataare presented in the same way as they were given in Table I.
Presentation of data in Table IIIThe production modes, halflives and most common gamma-ray energies
and their abundances for radioisotopes observed in neutron activationanalysis are compiled. Table III also includes other isotopes whichactivation analysts may encounter: those naturally occurring isotopesobserved in background spectra; fission product isotopes sometimes foundin gamma-ray spectra collected at nuclear reactors; and severalaccelerator product isotopes which are frequently used for detectorcalibration, etc.Column 1 (Isotope) and Column 2 (Halflife): The isotopes and theirhalflives are listed according to atomic number.Column 3 (Energy) and Column 4 (Abundance): The main gamma rays andtheir percent abundances (absolute intensities) are given for eachisotope. Energies are given in units of keV. For each isotope the gammaray recommended for use in activity calculations is identified with anasterisk (*).Column 5 (Production Nodes): The reactions by which the radioisotope canbe produced are listed. For a number of daughter isotopes the precursorisotope and its halflife are given.
Column 6 (Ref.): The listed reference is the source from which thenuclear data on halflife, gamma-ray energies and abundances were adopted.
194
Presentation of data in Tables IV and VThe gamma rays from Table III are arranged according to increasing
energy with their associated gamma rays. Table IV lists those isotopeswith halflives under 1 day and Table V lists those isotopes withhalflives greater than 1 day.Column 1 (Energyl): Energies are given in increasing order in units ofkeV.Column 2 (Isotope) and Column 3 (Halflife): The isotope in whoseradioactive decay the gamma ray is observed and isotope halflife arereported.Columns 4, 5 and 6 (Energy2, EnergyS and Energy4): Energies of the threemost intense gamma rays associated with the gamma ray of column 1 arelisted.Presentation of data in Tables VI, VII and VIII
Gamma rays recommended for analysis of elements and commoninterferences observed in NAA are compiled in these tables. The data areseparated into three groups according to halflives for the identifyingisotopes. Table VT lists isotopes with halflives less than 5 hours,Table VII includes isotopes with halflives between 5 hours and 7 days andTable VTII includes isotopes with halflives greater than 7 days.Column 1 (Element): The elements are listed alphabetically in each tablewhere an isotope useful for analysis exists.Column 2 (Isotope), Column 3 (Halflife) and Column 4 (Energy): Theisotope, halflife and energies of most useful gamma rays are listed.Column 5 (Interfering Isotope), Column 6 (Halflife) and Column 7(Interference Energy): The interfering isotope, halflife and energy arelisted. In general, the interference is considered serious when theenergies are less than 2 keV apart.Column 8 (Reference): The energy of a reference gamma ray in theinterfering isotope is given.Column 9 (Abund. Ratio): The abundance ratio of interfering gamma ray toreference gamma ray is computed.
ACKNOWLEDGEMENTS
The author is indebted to J.S. Morris, V.L. Spate, J.J. Carni andother members of the NAA group at the Research Reactor for their manycomments and encouragement during the generation of these tables. Mr.D.R. Provance is thanked for his assistance in proofreading. The authoraccepts responsibility for any remaining errors in the tables.
195

REFERENCES TO INTRODUCTION
[1] De Bievre, P., Barnes, I.L., Intern. J. Mass Spectrom. and IonProcesses 65 (1985) 211.
[2] Gryntakis, E.M., Kirn, J.I., J. Radioanal. Chem. 76 (1983) 341.[3] De Corte, F., Simonits, A., De Wispelaere, A., Koste, J., Moens,
L., DeMeter, A., INW/KFKI Intérim Report (Gent, June 1986).[4] Calaraand, A., in Handbook on Nuclear Activation Cross-Sections,
IAEA Techn. Repts. Ser. No. 156 (IAEA, Vienna 1974)
196
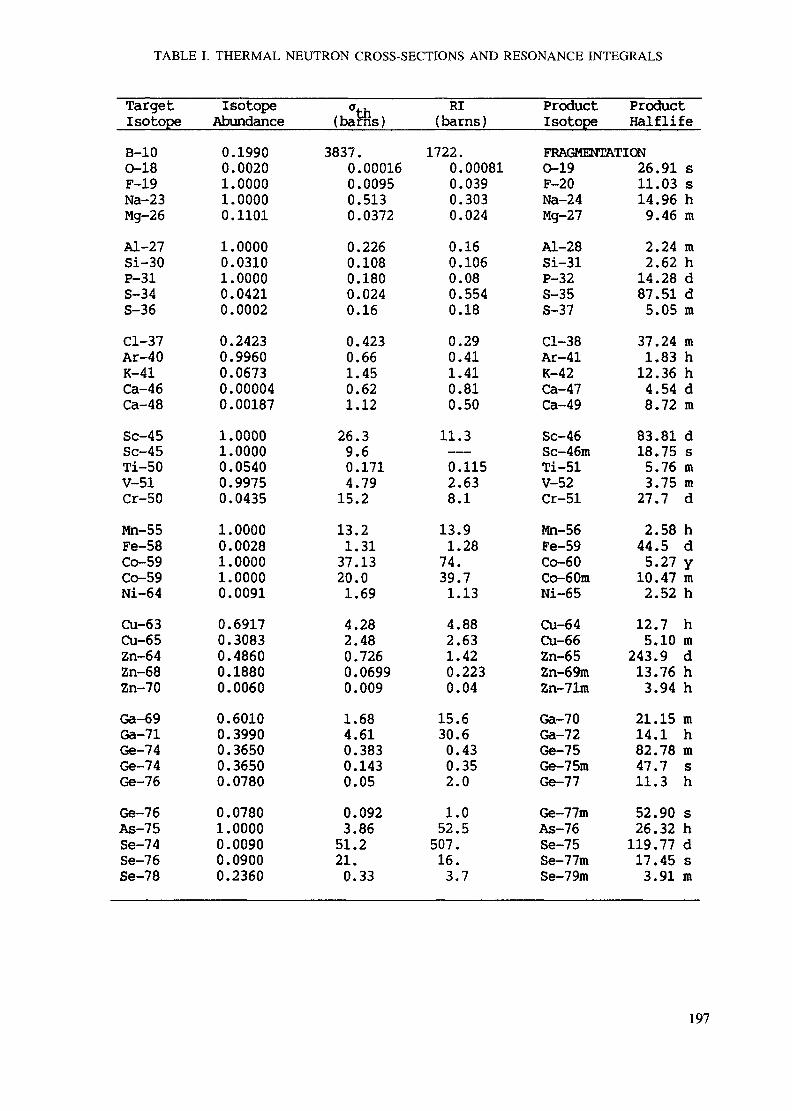
TABLE I. THERMAL NEUTRON CROSS-SECTIONS AND RESONANCE INTEGRALS
TargetIsotopeB-100-18F-19Na-23Mg-26Aï-27Si-30P-31S-34S-36Cl-37Ar-40K-41Ca-46Ca-48Sc-45Sc-45Ti-50V-51Cr-50Mn-55Fe-58Co-59Co-59Ni-64Cu-63Cu-65Zn-64Zn-68Zn-70Ga-69Ga-71Ge-74Ge-74Ge-76Ge-76As-75Se-74Se-76Se-78
isotopeAbundance0.19900.00201.00001.00000.11011.00000.03101.00000.04210.00020.24230.99600.06730.000040.001871.00001.00000.05400.99750.04351.00000.00281.00001.00000.00910.69170.30830.48600.18800.00600.60100.39900.36500.36500.07800.07801.00000.00900.09000.2360
(barils)3837.
0.000160.00950.5130.03720.2260.1080.1800.0240.160.4230.661.450.621.1226.39.60.1714.7915.213.21.3137.1320.01.694.282.480.7260.06990.0091.684.610.3830.1430.050.0923.8651.221.0.33
RI(barns)
1722.0.000810.0390.3030.0240.160.1060.080.5540.180.290.411.410.810.5011.30.1152.638.113.91.2874.39.71.134.882.631.420.2230.0415.630.60.430.352.01.052.5507.16.3.7
ProductIsotope
ProductHalflife
FRAGMENTATION0-19F-20Na-24Mg-27Aï-28Si-31P-32S-35S-37Cl-38Ar-41K-42Ca-47Ca-49Sc-46Sc-46mTi-51V-52Cr-51Mn-56Fe-59Co-60Co-60mNi-65Cu-64Cu-66Zn-65Zn-69mZn-71mGa-70Ga-72Ge-75Ge-75mGe-77Ge-77mAs-76Se-75Se-77mSe-79m
26.91 s11.03 s14.96 h9.46 m2.24 m2.62 h14.28 d87.51 d5.05 m37.24 m1.83 h12.36 h4.54 d8.72 m83.81 d18.75 s5.76 m3.75 m27.7 d2.58 h44.5 d5.27 y10.47 m2.52 h12.7 h5.10 m
243.9 d13.76 h3.94 h21.15 m14.1 h82.78 m47.7 s11.3 h52.90 s26.32 h119.77 d17.45 s3.91 m
197
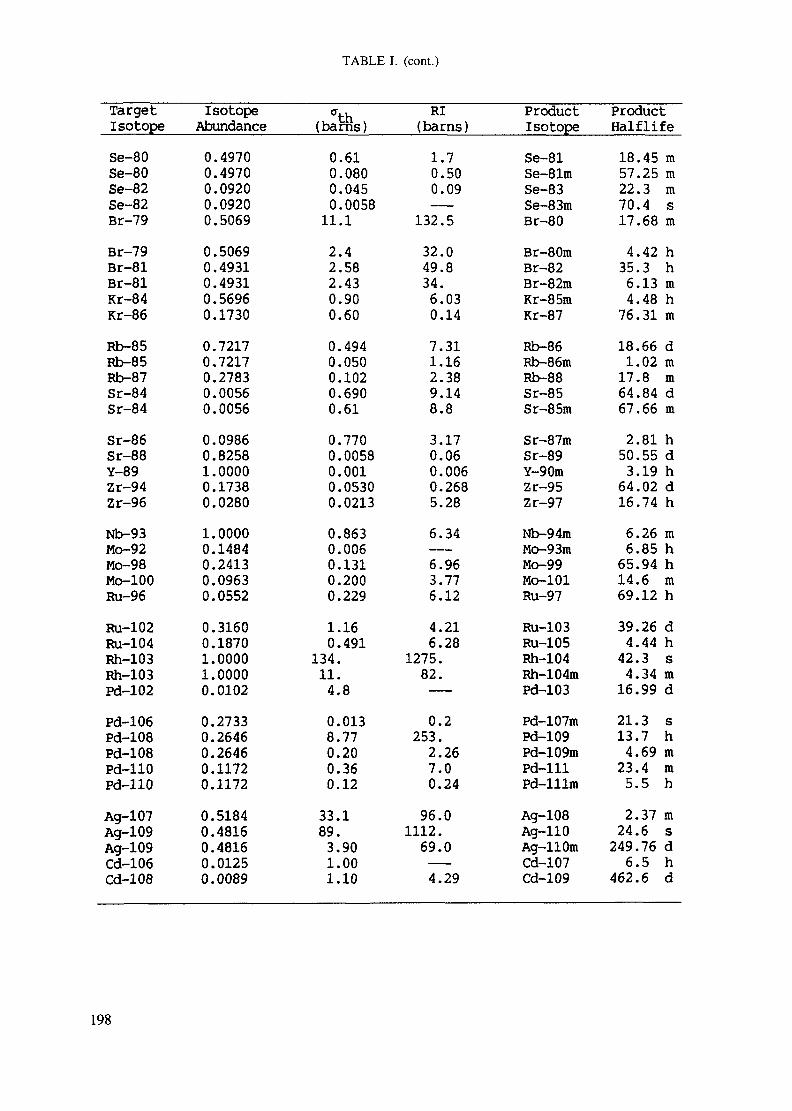
TABLE I. (cont.)
TargetIsotopeSe-80Se-80Se-82Se-82Br-79Br-79Br-81Br-81Kr-84Kr-86Rb-85Rb-85Rb-87Sr-84Sr-84Sr-86Sr-88Y-89Zr-94Zr-96Nb-93Mo-92Mo-98Mo-100Ru-96Ru-102Ru-104Rh-103Rh-103Pd-102Pd-106Pd-108Pd-108Pd-110Pd-110Ag-107Ag-109Ag-109Cd-106Cd-108
IsotopeAbundance0.49700.49700.09200.09200.50690.50690.49310.49310.56960.17300.72170.72170.27830.00560.00560.09860.82581.00000.17380.02801.00000.14840.24130.09630.05520.31600.18701.00001.00000.01020.27330.26460.26460.11720.11720.51840.48160.48160.01250.0089
(barns)0.610.0800.0450.005811.12.42.582.430.900.600.4940.0500.1020.6900.610.7700.00580.0010.05300.02130.8630.0060.1310.2000.2291.160.491
134.11.4.80.0138.770.200.360.1233.189.3.901.001.10
RI(barns)1.70.500.09
132.532.049.834.6.030.147.311.162.389.148.83.170.060.0060.2685.286.346.963.776.124.216.28
1275.82.
0.2253.2.267.00.2496.0
1112.69.0——4.29
ProductIsotopeSe-81Se-81mSe-83Se-83mBr-80Br-80mBr-82Br-82mKr-85mKr-87Rb-86Rb-86mRb-88Sr-85Sr-85raSr-87mSr-89Y-90mZr-95Zr-97Nb-94mMo-93mMo-99Mo-101Ru-97Ru-103Ru-105Rh-104Rh-104mPd-103Pd-107mPd-109Pd-109mPd-111Pd-lllraAg-108Ag-110Ag-110mCd-107Cd-109
ProductHalf life18.45 m57.25 m22.3 m70.4 s17.68 m4.42 h35.3 h6.13 m4.48 h76.31 m18.66 d1.02 m17.8 m64.84 d67.66 m2.81 h50.55 d3.19 h64.02 d16.74 h6.26 m6.85 h65.94 h14.6 m69.12 h39.26 d4.44 h42.3 s4.34 m16.99 d21.3 s13.7 h4.69 m23.4 m5.5 h2.37 m24.6 s249.76 d6.5 h
462.6 d
198
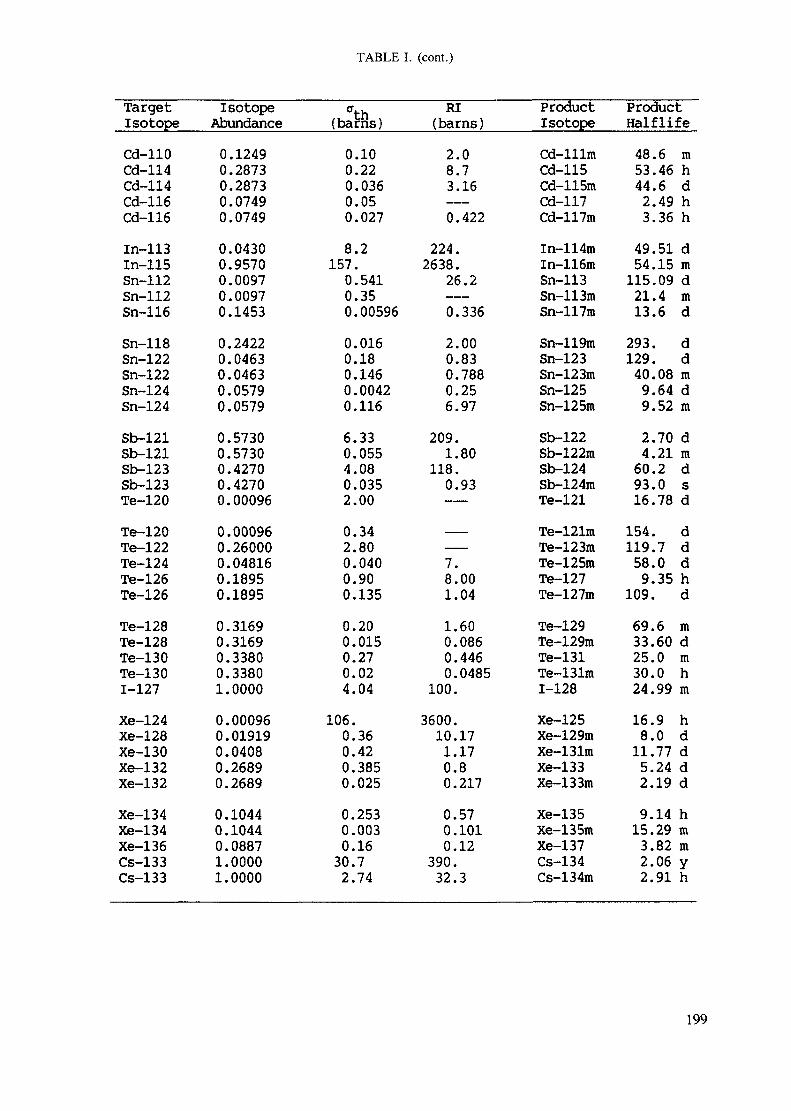
TABLE I. (cont.)
TargetIsotopeCd-110Cd-114Cd-114Cd-116Cd-116In-113In-115Sn-112Sn-112Sn-116Sn-118Sn-122Sn-122Sn-124Sn-124Sb-121Sb-121Sb-123Sb-123Te-120Te-120Te-122Te-124Te-126Te-126Te-128Te-128Te-130Te-1301-127Xe-124Xe-128Xe-130Xe-132Xe-132Xe-134Xe-134Xe-136Cs-133Cs-133
IsotopeAbundance0.12490.28730.28730.07490.07490.04300.95700.00970.00970.14530.24220.04630.04630.05790.05790.57300.57300.42700.42700.000960.000960.260000.048160.18950.18950.31690.31690.33800.33801.00000.000960.019190.04080.26890.26890.10440.10440.08871.00001.0000
(barns)0.100.220.0360.050.0278.2
157.0.5410.350.005960.0160.180.1460.00420.1166.330.0554.080.0352.000.342.800.0400.900.1350.200.0150.270.024.04
106.0.360.420.3850.0250.2530.0030.16
30.72.74
RI(barns)2.08.73.16——0.422
224.2638.
26.20.3362.000.830.7880.256.97
209.1.80
118.0.93——, ____
7.8.001.041.600.0860.4460.0485
100.3600.
10.171.170.80.2170.570.1010.12
390.32.3
ProductIsotopeCd-lllmCd-115Cd-115mCd-117Cd-117mIn-114mIn-116mSn-113Sn-113mSn-117raSn-119mSn-123Sn-123mSn-125Sn-125mSb-122Sb-122mSb-124Sb-124mTe-121Te-121mTe-123mTe-125mTe-127Te-127mTe-129Te-129mTe-131Te-131m1-128Xe-125Xe-129mXe-131mXe-133Xe-133mXe-135Xe-135mXe-137Cs-134Cs-134m
ProductHalflife48.6 m53.46 h44.6 d2.49 h3.36 h
49.51 d54.15 m115.09 d21.4 m13.6 d
293. d129. d40.08 m9.64 d9.52 m2.70 d4.21 m
60.2 d93.0 s16.78 d
154. d119.7 d58.0 d9.35 h
109. d69.6 m33.60 d25.0 m30.0 h24.99 m16.9 h8.0 d
11.77 d5.24 d2.19 d9.14 h
15.29 m3.82 m2.06 y2.91 h
199
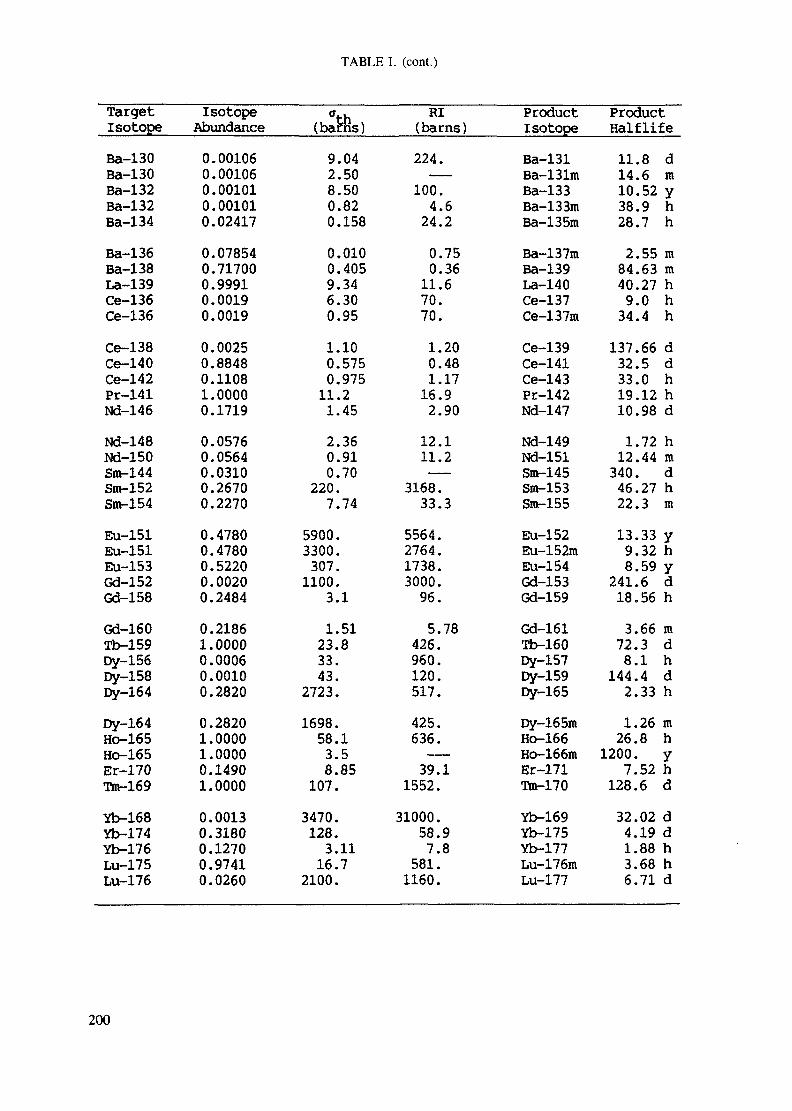
TABLE I. (cont.)
TargetIsotopeBa-130Ba-130Ba-132Ba-132Ba-134Ba-136Ba-138La-139Ce-136Ce-136Ce-138Ce-140Ce-142Pr-141Nd-146Nd-148Nd-150Sm-144Sm-152Sm-154Eu-151Eu-151Eu-153Gd-152Gd-158Gd-160Tb-159Dy-156Dy-158Dy-164Dy-164Ho-165Ho-165Er-170Tm-169Yb-168Yb-174Yb-176Lu-175Lu-176
IsotopeAbundance0.001060.001060.001010.001010.024170.078540.717000.99910.00190.00190.00250.88480.11081.00000.17190.05760.05640.03100.26700.22700.47800.47800.52200.00200.24840.21861.00000.00060.00100.28200.28201.00001.00000.14901.00000.00130.31800.12700.97410.0260
(bariis)9.042.508.500.820.1580.0100.4059.346.300.951.100.5750.97511.21.452.360.910.70
220.7.74
5900.3300.307.1100.
3.11.5123.833.43.
2723.1698.58.13.58.85
107.3470.128.3.1116.7
2100.
RI(barns)224.——100.4.624.20.750.3611.670.70.1.200.481.1716.92.9012.111.2
3168.33.3
5564.2764.1738.3000.96.5.78
426.960.120.517.425.636.——39.1
1552.31000.
58.97.8
581.1160.
ProductisotopeBa-131Ba-131mBa-133Ba-133mBa-135mBa-137mBa-139La-140Ce-137Ce-137mCe-139Ce-141Ce-143Pr-142Nd-147Nd-149Nd-151Sm-145Sm-153Sm-155Eu-152Eu-152mEu-154Gd-153Gd-159Gd-161Tb-160Dy-157Dy-159Dy-165Dy-165mHo-166Ho-166mEr-171lto-170Yb-169Yb-175Yb-177Lu-176mLu-177
ProductHalflife11.8 d14.6 m10.52 y38.9 h28.7 h2.55 m84.63 m40.27 h9.0 h34.4 h137.66 d32.5 d33.0 h19.12 h10.98 d1.72 h12.44 m340. d46.27 h22.3 m13.33 y9.32 h8.59 y
241.6 d18.56 h3.66 m72.3 d8.1 h
144.4 d2.33 h1.26 m26.8 h
1200. y7.52 h
128.6 d32.02 d4.19 d1.88 h3.68 h6.71 d
200
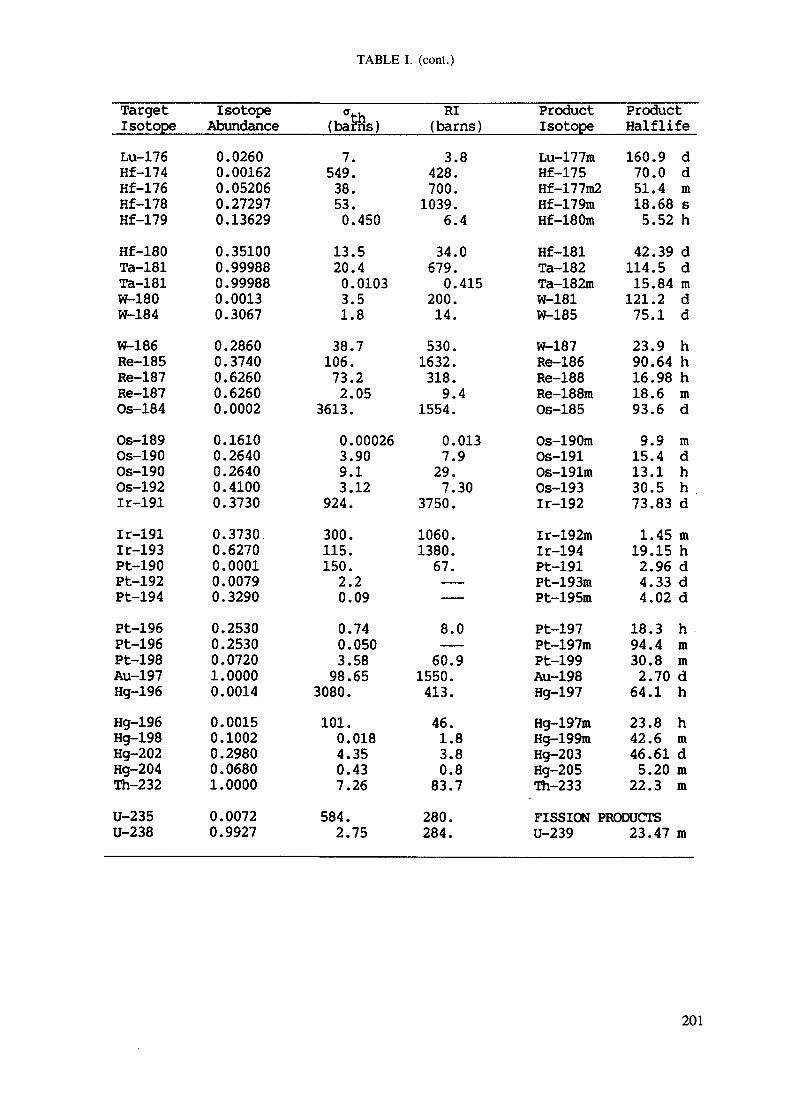
TABLE I. (cont.)
TargetIsotopeLu-176Hf-174Hf-176Hf-178Hf-179Hf-180Ta-181Ta-181W-180W-184W-186Re-185Re-187Re-187Os-184Os-189Os-190Os-190Os-192Ir-191Ir-191Ir-193Pt-190Pt-192Pt-194Pt-196n*- 1 QfiPt-198Au-197Hg-196Hg-196Hg-198Hg-202Hg-204Th-232U-235U-238
IsotopeAbundance0.02600.001620.052060.272970.136290.351000.999880.999880.00130.30670.28600.37400.62600.62600.00020.16100.26400.26400.41000.37300.37300.62700.00010.00790.32900.25300.25300.07201.00000.00140.00150.10020.29800.06801.00000.00720.9927
(barris)7.
549.38.53.0.450
13.520.40.01033.51.8
38.7106.73.22.05
3613.0.000263.909.13.12
924.300.115.150.2.20.090.740.0503.5898.65
3080.101.
0.0184.350.437.26
584.2.75
RI(barns)3.8
428.700.1039.
6.434.0
679.0.415
200.14.
530.1632.318.9.4
1554.0.0137.929.7.30
3750.1060.1380.67.——
8.060.9
1550.413.46.1.83.80.8
83.7280.284.
ProductIsotopeLu-177mHf-175Hf-177m2Hf-179mHf-180mHf-181Ta-182Ta-182mW-181W-185W-187Re-186Re-188Re-188raOs-185Os-1 90mOs-191Os-191mOs-193Ir-192Ir-192mIr-194Pt-191Pt-193mPt-195mPt-197Pt-197raPt-199Au-198Hg-197Hg-197mHg-199mHg-203Hg-205Th-233
ProductHalflife160.9 d70.0 d51.4 m18.68 s5.52 h42.39 d
114.5 d15.84 m
121.2 d75.1 d23.9 h90.64 h16.98 h18.6 m93.6 d9.9 m
15.4 d13.1 h30.5 h73.83 d1.45 m19.15 h2.96 d4.33 d4.02 d
18.3 h94.4 m30.8 m2.70 d
64.1 h23.8 h42.6 m46.61 d5.20 m
22.3 mFISSION PRODUCTSU-239 23.47 m
201
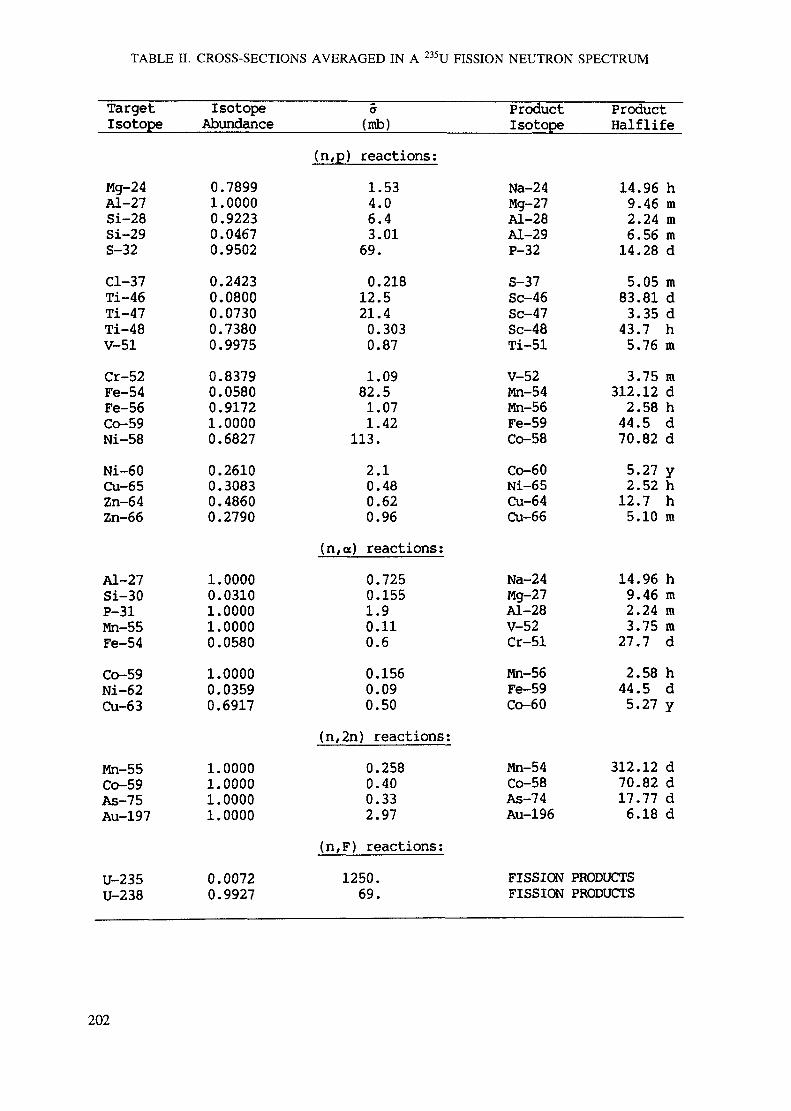
TABLE IL CROSS-SECTIONS AVERAGED IN A 235U FISSION NEUTRON SPECTRUM
TargetIsotope
Mg-24Aï-27Si-28Si-29S-32Cl-37Ti-46Ti-47Ti-48V-51Cr-52Fe-54Fe-56Co-59Ni-58Ni-60Cu-65Zn-64Zn-66
Aï-27Si-30P-31Mn-55Fe-54Co-59Ni-62Cu-63
Mn-55Co-59As-75Au-197
U-235U-238
IsotopeAbundance
0.78991.00000.92230.04670.95020.24230.08000.07300.73800.99750.83790.05800.91721.00000.68270.26100.30830.48600.2790
1.00000.03101.00001.00000.05801.00000.03590.6917
1.00001.00001.00001.0000
0.00720.9927
(mb)(n,p) reactions:
1.534.06.43.0169.0.218
12.521.40.3030.871.09
82.51.071.42
113.2.10.480.620.96
(n,a) reactions:0.7250.1551.90.110.60.1560.090.50
(n,2n) reactions:0.2580.400.332.97
(n,F) reactions:1250.69.
ProductIsotope
Na-24Mg-27Aï-28Aï-29P-32S-37Sc-46Sc-47Sc-48Ti-51V-52Mn-54Mn-56Fe-59Co-58Co-60Ni-65Cu-64Cu-66
Na-24Mg-27Aï-28V-52Cr-51Mn-56Fe-59Co-60
Mn-54Co-58As-74Au-196
FISSIONFISSION
ProductHalf life
14.96 h9.46 m2.24 m6.56 m
14.28 d5.05 m
83.81 d3.35 d
43.7 h5.76 m3.75 m
312.12 d2.58 h
44.5 d70.82 d5.27 y2.52 h
12.7 h5.10 m
14.96 h9.46 m2.24 m3.75 m
27.7 d2.58 h
44.5 d5.27 y
312.12 d70.82 d17.77 d6.18 d
PRODUCTSPRODUCTS
202
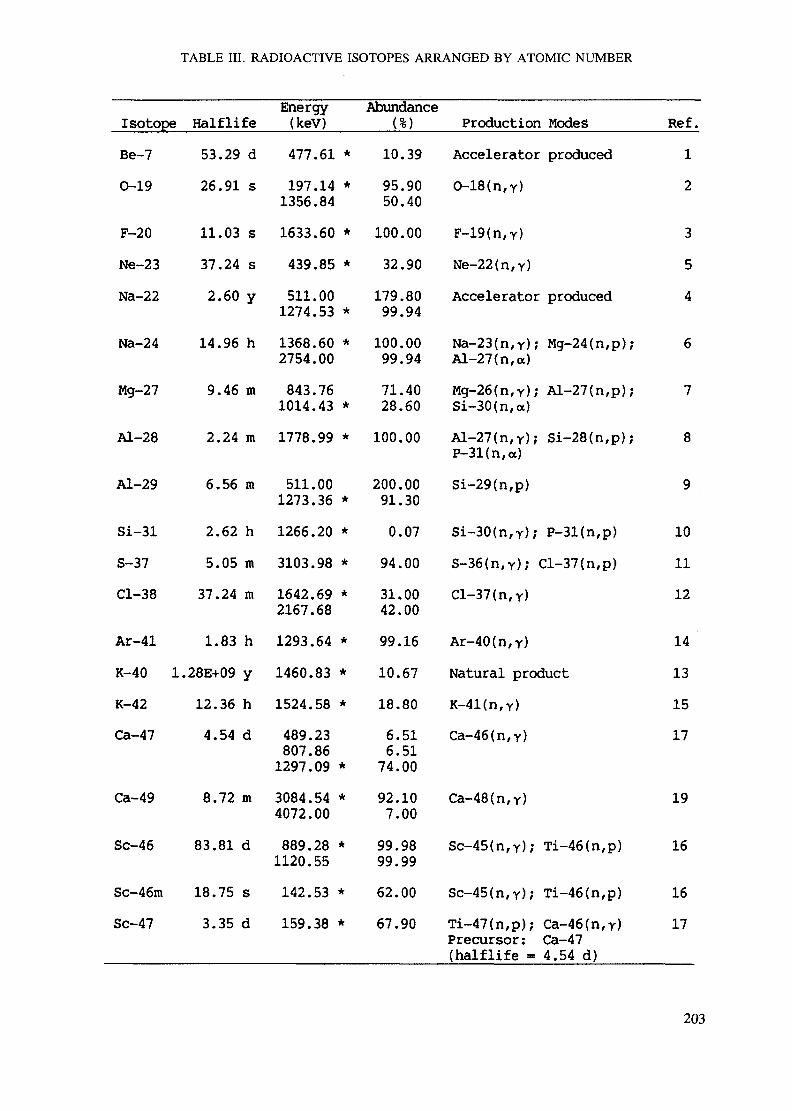
TABLE III. RADIOACTIVE ISOTOPES ARRANGED BY ATOMIC NUMBER
IsotopeBe-70-19
F-20Ne-23Na-22
Na-24
Mg-27
Al-28
Al-29
Si-31S-37Cl-38
Ar-41K-40 1K-42Ca-47
Ca-49
Sc-46
Sc-46mSc-47
Halflife53.29 d26.91 s
11.03 s37.24 s2.60 y
14.96 h
9.46 m
2.24 m
6.56 m
2.62 h5.05 m37.24 m
1.83 h.28E+09 y12.36 h4.54 d
8.72 m
83.81 d
18.75 s3.35 d
Energy(keV)477.61 *197.14 *1356.841633.60 *439.85 *511.001274.53 *1368.60 *2754.00843.761014.43 *1778.99 *
511.001273.36 *1266.20 *3103.98 *1642.69 *2167.681293.64 *1460.83 *1524.58 *489.23807.861297.09 *3084.54 *4072.00889.28 *1120.55142.53 *159.38 *
Abundance(%)
10.3995.9050.40100.0032.90179.8099.94100.0099.9471.4028.60100.00
200.0091.300.0794.0031.0042.0099.1610.6718.806.516.5174.0092.107.0099.9899.9962.0067.90
Production ModesAccelerator produced0-18(n,Y)
F-19(n,Y)Ne-22(n/Y)Accelerator produced
Na-23(n,Y); Mg-24(n,p);Aï-27 (n, a)Mg-26(n,Y); Aï-27 (n,p);Si-30(n,a)Al-27(n,Y); Si-28(n,p);P-31(n,a)Si-29(n,p)
Si-30(n,T); P-31(n,p)S-36(n,Y); Cl-37(n,p)Cl-37(n,Y)
Ar-40(n,Y)Natural productK-41(n,Y)Ca-46(n,Y)
Ca-48(n,Y)
Sc-45(n,Y); Ti-46(n,p)
Sc-45(n,Y); Ti-46(n,p)Ti-47(n,p); Ca-46(n,Y)Precursor: Ca-47(half life = 4.54 d)
Ref.12
354
6
7
8
9
101112
14131517
19
16
1617
203
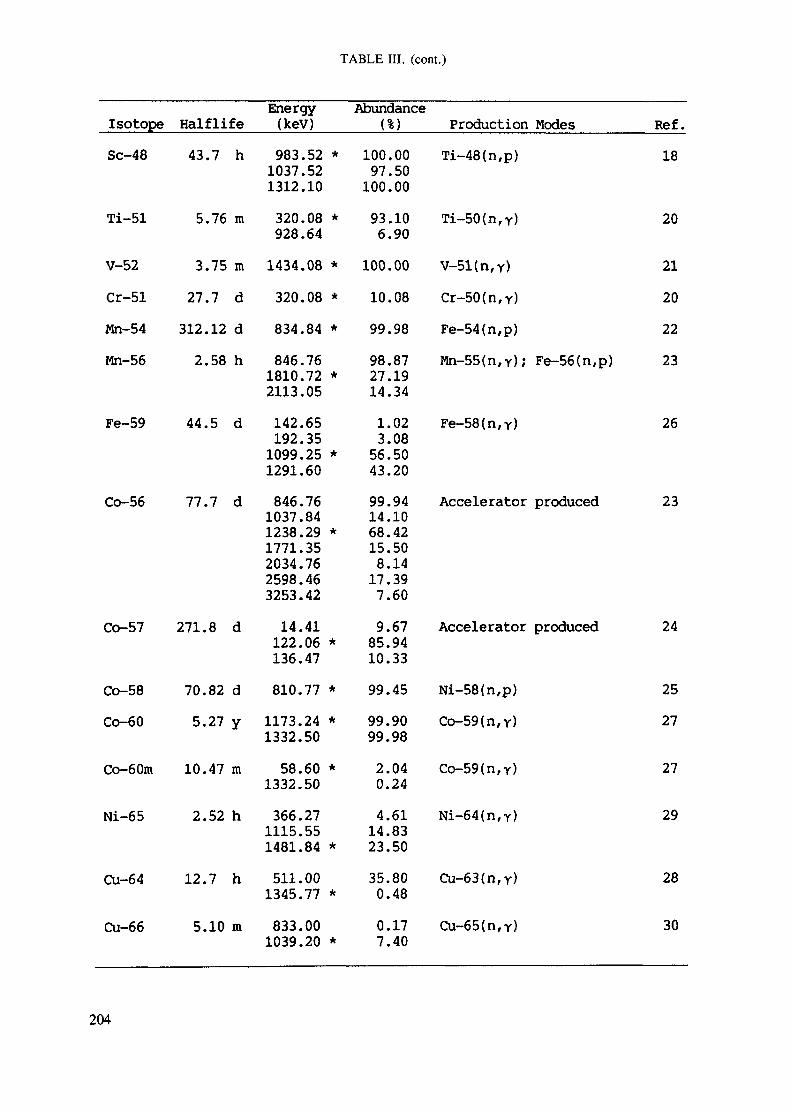
TABLE III. (cont.)
IsotopeSc-48
Ti-51
V-52Cr-51Mn-54Mn-56
Fe-59
Co-56
Co-57
Co-58Co-60
Co-60m
Ni-65
Cu-64
Cu-66
Halflife43.7 h
5.76 m
3.75 m27.7 d312.12 d2.58 h
44.5 d
77.7 d
271.8 d
70.82 d5.27 y
10.47 m
2.52 h
12.7 h
5.10 m
Energy(keV)983.52 *1037.521312.10320.08 *928.641434.08 *320.08 *834.84 *846.761810.72 *2113.05142.65192.351099.25 *1291.60846.761037.841238.29 *1771.352034.762598.463253.4214.41122.06 *136.47810.77 *1173.24 *1332.5058.60 *
1332.50366.271115.551481.84 *511.001345.77 *833.001039.20 *
Abundance(%)
100.0097.50100.0093.106.90
100.0010.0899.9898.8727.1914.341.023.0856.5043.2099.9414.1068.4215.508.1417.397.609.6785.9410.3399.4599.9099.982.040.244.61
14.8323.5035.800.480.177.40
Production ModesTi-48(n,p)
Ti-50(n,Y)
V-51(n,Y)Cr-50(n,Y)Fe-54(n,p)Mn-55(n,Y); Fe-56(n,p)
Fe-58(n,Y)
Accelerator produced
Accelerator produced
Ni-58(n,p)Co-59(n,Y)
Co-59(nfY)
Ni-64(n,y)
Cu-63(n/Y)
Cu-65(n,Y)
Ref.18
20
21202223
26
23
24
2527
27
29
28
30
204
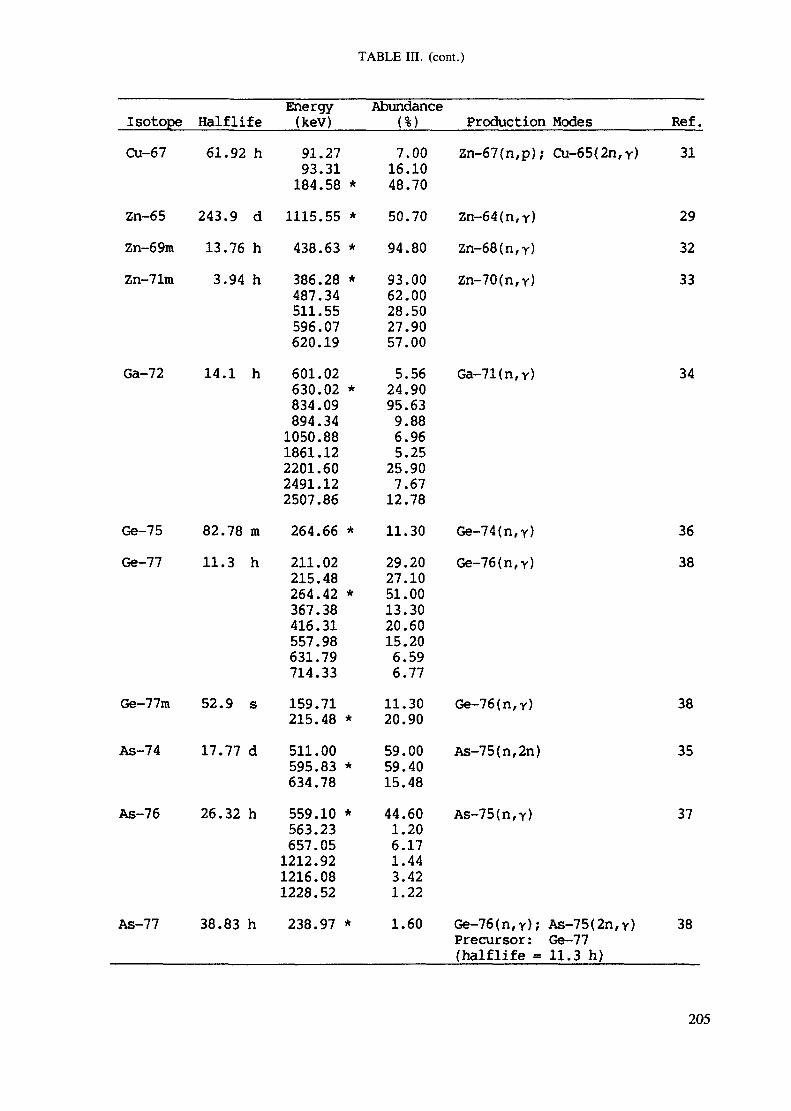
TABLE in. (cont.)
Isotope HalflifeCu-67 61.92 h
Zn-65 243.9 dZn-69m 13.76 hZn-71m 3.94 h
Ga-72 14.1 h
Ge-75 82.78 mGe-77 11.3 h
Ge-77m 52 . 9 s
As-74 17.77 d
As-76 26.32 h
As-77 38.83 h
Energy(kev)91.2793.31184.58 *1115.55 *438.63 *386.28 *487.34511.55596.07620.19601.02630.02 *834.09894.341050.881861.122201.602491.122507.86264.66 *211.02215.48264.42 *367.38416.31557.98631.79714.33159.71215.48 *511.00595.83 *634.78559.10 *563.23657.051212.921216.081228.52238.97 *
Abundance(%)7.0016.1048.7050.7094.8093.0062.0028.5027.9057.005.5624.9095.639.886.965.2525.907.6712.7811.3029.2027.1051.0013.3020.6015.206.596.7711.3020.9059.0059.4015.4844.601.206.171.443.421.221.60
Production ModesZn-67(n,p); Cu-65(2n,Y)
Zn-64(n,r)Zn-68(n,Y)Zn-70(n,Y)
Ga-71(n,Y)
Ge-74(n,Y)Ge-76(n,Y)
Ge-76(n/Y)
As-75(n,2n)
As-75(n,Y)
Ge-76(n,Y); As-75(2n,Y)Precursor : Ge-77(halflife « 11.3 h)
Réf.31
293233
34
3638
38
35
37
38
205
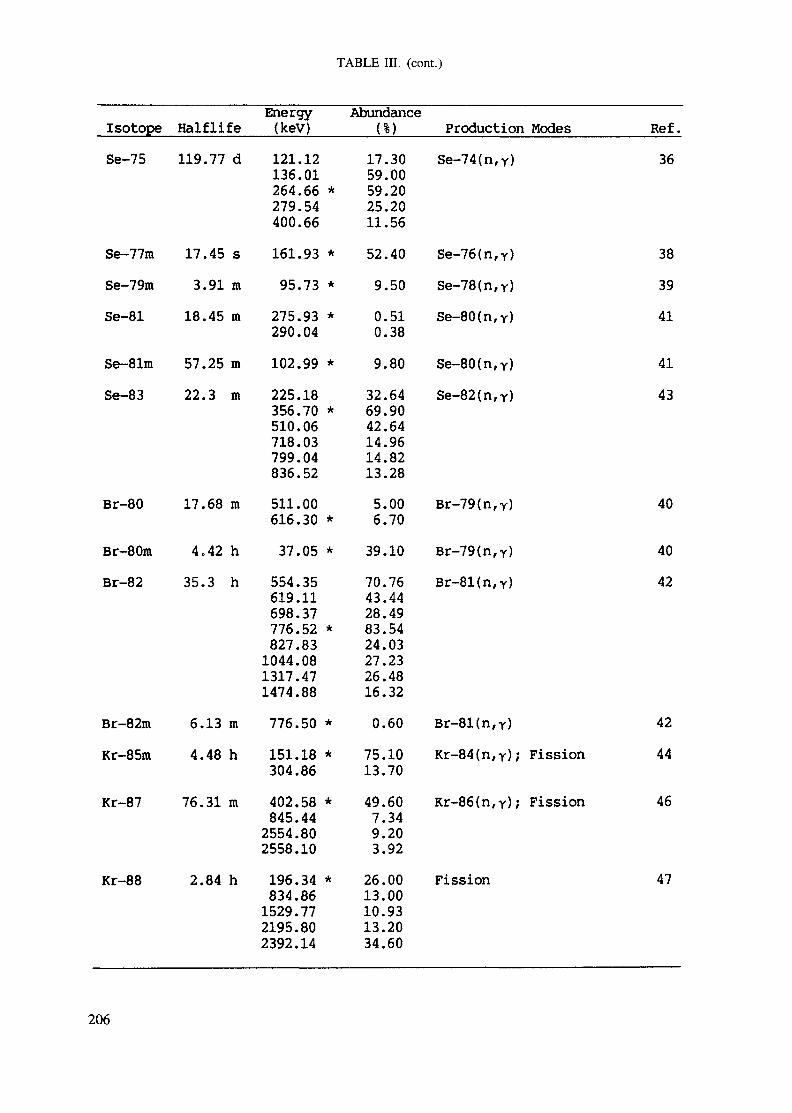
TABLE III. (cont.)
Isotope Half lifeSe-75 119.77 d
Se-77m 17.45 sSe-79m 3.91 mSe-81 18.45 m
Se-81m 57.25 mSe-83 22.3 m
Br-80 17.68 m
Br-80ra 4.42 hBr-82 35.3 h
Br-82m 6.13 mKr-85m 4.48 h
Kr-87 76.31 m
Kr-88 2.84 h
Energy(keV)121.12136.01264.66 *279.54400.66161.93 *95.73 *275.93 *290.04102.99 *225.18356.70 *510.06718.03799.04836.52511.00616.30 *37.05 *554.35619.11698.37776.52 *827.831044.081317.471474.88776.50 *151.18 *304.86402.58 *845.442554.802558.10196.34 *834.861529.772195.802392.14
Abundance(%)
17.3059.0059.2025.2011.5652.409.500.510.389.8032.6469.9042.6414.9614.8213.285.006.70
39.1070.7643.4428.4983.5424.0327.2326.4816.320.60
75.1013.7049.607.349.203.9226.0013.0010.9313.2034.60
Production ModesSe-74(n,Y)
Se-76(n,Y)Se-78(n,Y)Se-80(n,Y)
Se-80(n,Y)Se-82(n,Y)
Br-79(n,Y)
Br-79(n,Y)Br-81(n,Y)
Br-81(n,Y)Kr-84(n,Y); Fission
Kr-86(n,Y); Fission
Fission
Réf.36
383941
4143
40
4042
4244
46
47
206
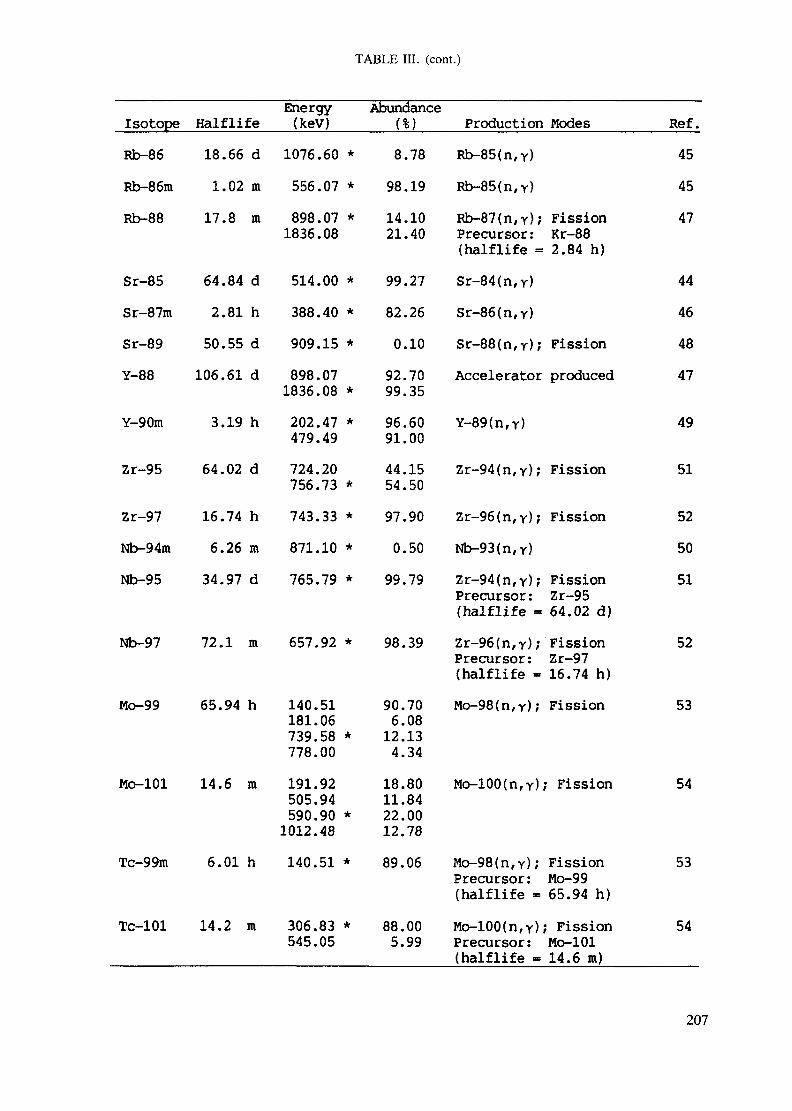
TABLE III. (cont.)
isotopeRb-86Rb-86mRb-88
Sr-85Sr-87mSr-89Y-88
Y-90m
Zr-95
2r-97Nb-94mNb-95
Nb-97
Mo-99
Mo-101
Tc-99m
Tc-101
Halflife18.66 d1.02 m17.8 m
64.84 d2.81 h50.55 d106.61 d
3.19 h
64.02 d
16.74 h6.26 m34.97 d
72.1 m
65.94 h
14.6 m
6.01 h
14.2 m
Energy(keV)1076.60 *556.07 *898.07 *1836.08
514.00 *388.40 *909.15 *898.071836.08 *202.47 *479.49724.20756.73 *743.33 *871.10 *765.79 *
657.92 *
140.51181.06739.58 *778.00191.92505.94590.90 *1012.48140.51 *
306.83 *545.05
Abundance(%)8.7898.1914.1021.40
99.2782.260.1092.7099.3596.6091.0044.1554.5097.900.5099.79
98.39
90.706.0812.134.3418.8011.8422.0012.7889.06
88.005.99
ProductionRb-85(n,Y)Rb-85(n,Y)Rb-87(n,Y);Precursor:(half life =Sr-84(n,Y)Sr-86(n,Y)Sr-88(n,Y);Accelerator
Y-89(n,Y)
Zr-94(n,Y);
Zr-96(n,Y);Nb-93(n,Y)zr-94(n,Y);Precursor :(half life -Zr-96(n,Y);Precursor:(half life =Mo-98(n,Y);
Mo-100(n,Y);
Mo-98(n,Y);Precursor:(half life -Mo-100 (n,Y);Precursor:(half life -
Modes
FissionKr-882.84 h)
Fissionproduced
Fission
Fission
FissionZr-9564.02 d)FissionZr-9716.74 h)Fission
Fission
FissionMo-9965.94 h)FissionMo-10114.6 m)
Ref.454547
44464847
49
51
525051
52
53
54
53
54
207
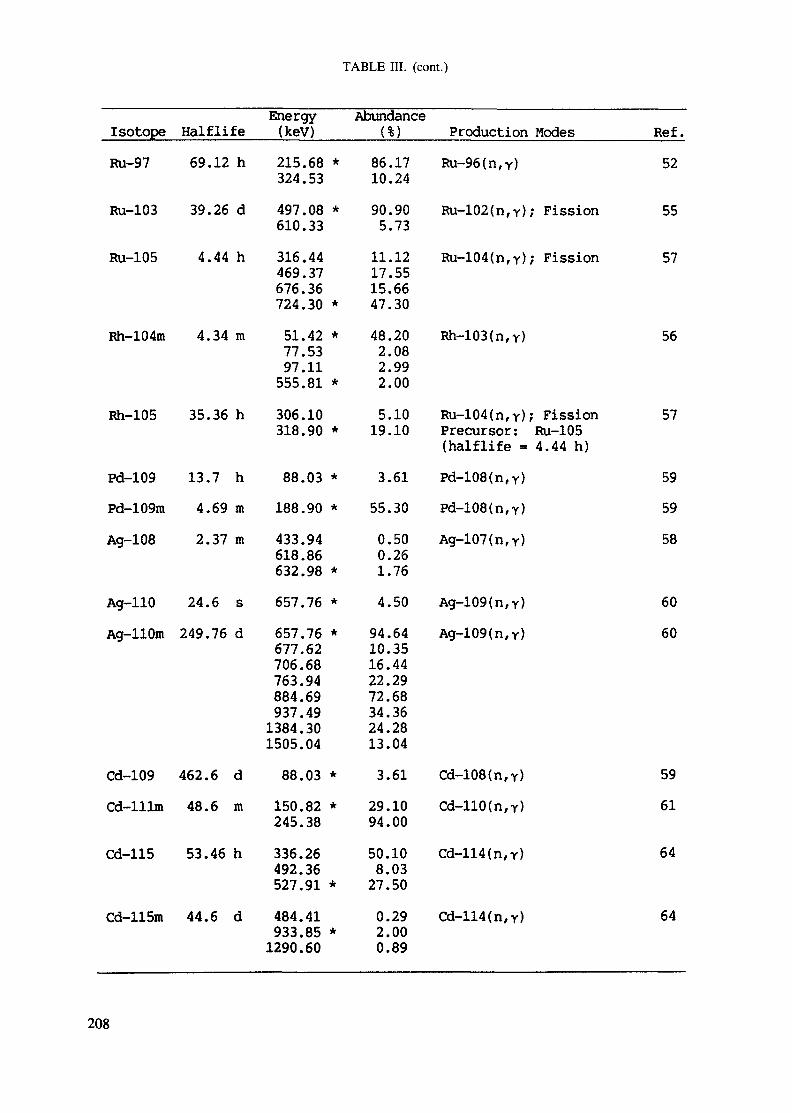
TABLE III. (cont.)
Isotope Half lifeRu-97 69.12 h
Ru-103 39.26 d
Ru-105 4.44 h
Rh-104m 4.34 m
Rh-105 35.36 h
Pd-109 13.7 hPd-109m 4.69 mAg-108 2.37 m
Ag-110 24.6 sAg-llOm 249.76 d
Cd-109 462.6 dCd-lllm 48.6 m
Cd-115 53.46 h
Cd-115m 44.6 d
Energy(kev)215.68 *324.53497.08 *610.33316.44469.37676.36724.30 *51.42 *77.5397.11555.81 *306.10318.90 *
88.03 *188.90 *433.94618.86632.98 *657.76 *657.76 *677.62706.68763.94884.69937.491384.301505.0488.03 *150.82 *245.38336.26492.36527.91 *484.41933.85 *1290.60
Abundance(%)
86.1710.2490.905.7311.1217.5515.6647.3048.202.082.992.005.1019.10
3.6155.300.500.261.764.5094.6410.3516.4422.2972.6834.3624.2813.043.61
29.1094.0050.108.0327.500.292.000.89
Production ModesRu-96 (n, Y)
Ru-102 (n, Y); Fission
Ru-104(n,Y); Fission
Rh-103(n,Y)
Ru-104(n,Y); FissionPrecursor: Ru-105(half life = 4.44 h)Pd-108(n,Y)Pd-108(n,Y)Ag-107(n,Y)
Ag-109(n,Y)Ag-109(n,Y)
Cd-108(n,Y)Cd-110(n,Y)
Cd-114(n,Y)
Cd-114(n,Y)
Réf.52
55
57
56
57
595958
6060
5961
64
64
208
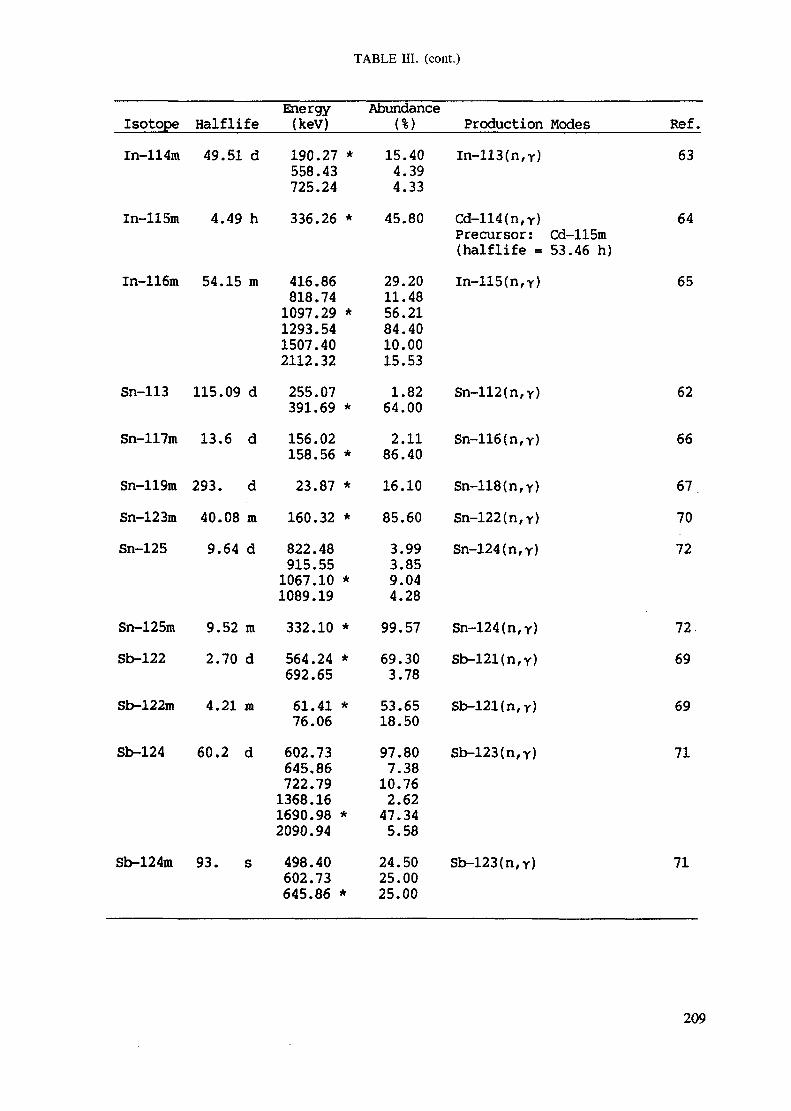
TABLE III. (cont.)
Isotope Half lifeln-114m 49.51 d
ln-115m 4.49 h
In-116m 54.15 m
Sn-113 115.09 d
Sn-117m 13.6 d
Sn-119m 293. dSn-123m 40.08 mSn-125 9.64 d
Sn-125m 9.52 raSb-122 2.70 d
Sb-122m 4.21 m
Sb-124 60.2 d
Sb-124m 93. s
Energy(keV)190.27 *558.43725.24336.26 *
416.86818.741097.29 *1293.541507.402112.32255.07391.69 *156.02158.56 *23.87 *160.32 *822.48915.551067.10 *1089.19332.10 *564.24 *692.6561.41 *76.06602.73645.86722.791368.161690.98 *2090.94498.40602.73645.86 *
Abundance(%)
15.404.394.3345.80
29.2011.4856.2184.4010.0015.531.8264.002.1186.4016.1085.603.993.859.044.2899.5769.303.7853.6518.5097.807.3810.762.6247.345.5824.5025.0025.00
Production ModesIn-113(n,Y)
Cd-114(n,Y)Precursor: Cd-115m(half life = 53.46 h)In-115(n,Y)
Sn-112(n,Y)
Sn-116(n,Y)
Sn-118(n,Y)Sn-122(n,Y)Sn-124(n,Y)
Sn-124(n,Y)Sb-121(n,Y)
Sb-121(n/Y)
Sb-123(n,Y)
Sb-123(n,Y)
Réf.63
64
65
62
66
677072
7269
69
71
71
209
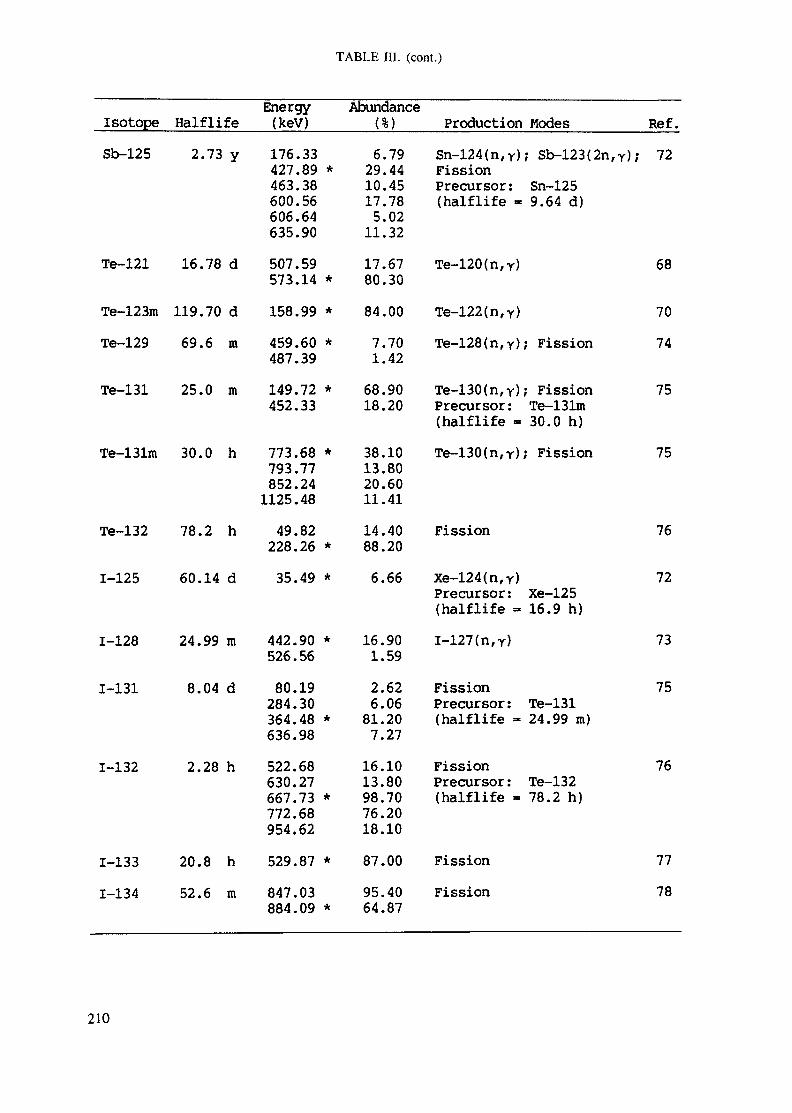
TABLE III. (cont.)
Isotope HalflifeSb-125 2.73 y
Te-121 16.78 d
Te-123m 119.70 dTe-129 69.6 m
Te-131 25.0 m
Te-131m 30.0 h
Te-132 78.2 h
1-125 60.14 d
1-128 24.99 m
1-131 8.04 d
1-132 2.28 h
1-133 20.8 h1-134 52.6 m
Energy(kev)176.33427.89 *463.38600.56606.64635.90507.59573.14 *158.99 *459.60 *487.39149.72 *452.33
773.68 *793.77852.241125.4849.82228.26 *35.49 *
442.90 *526.5680.19284.30364.48 *636.98522.68630.27667.73 *772.68954.62529.87 *847.03884.09 *
Abundance
6.7929.4410.4517.785.0211.3217.6780.3084.007.701.4268.9018.20
38.1013.8020.6011.4114.4088.206.66
16.901.592.626.0681.207.2716.1013.8098.7076.2018.1087.0095.4064.87
ProductionSn-124(n,Y);FissionPrecursor:(halflife -
Te-120(n,Y)
Te-122(n,Y)Te-128(n,Y);
Te-130(n,Y);Precursor:(halflife -Te-130(n,Y);
Fission
Xe-124(n,Y)Precursor :(halflife -I-127(n,Y)
FissionPrecursor:(halflife -
FissionPrecursor :(halflife -
FissionFission
ModesSb-123(2n,Y);Sn-1259.64 d)
Fission
FissionTe-131m30.0 h)Fission
Xe-12516.9 h)
Te-13124.99 m)
Te-13278.2 h)
Réf.72
68
7074
75
75
76
72
73
75
76
7778
210
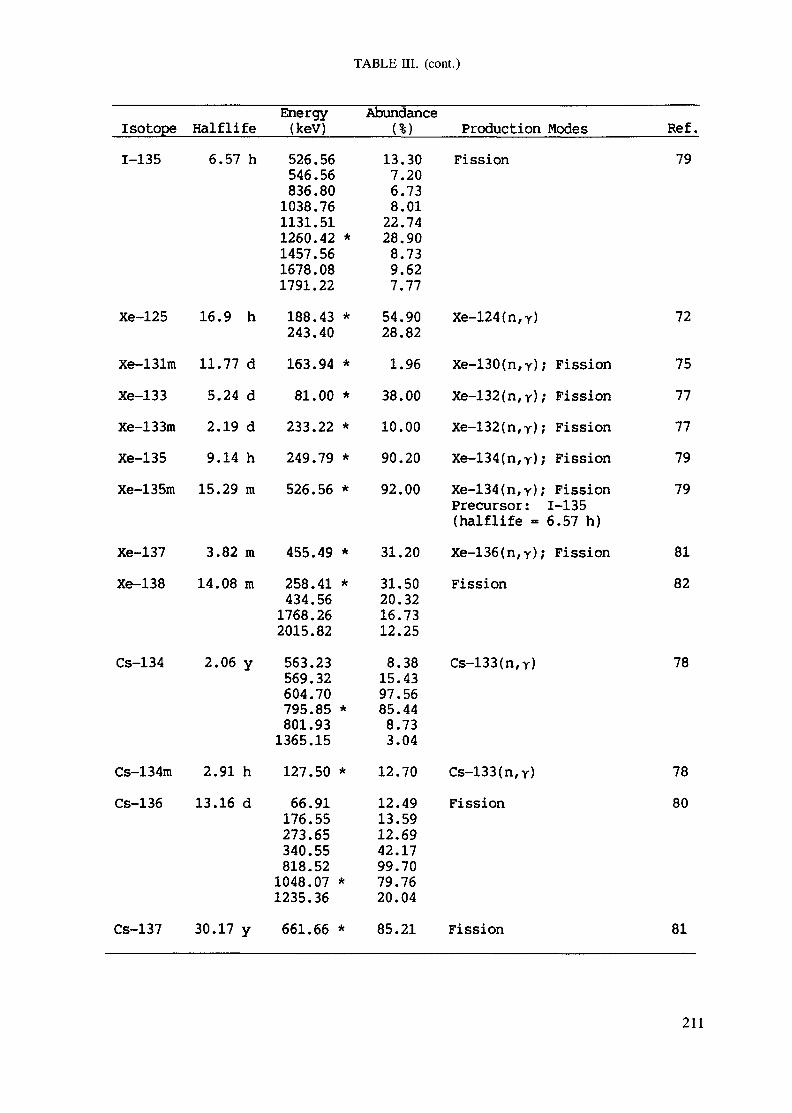
TABLE III. (cont.)
Isotope Half life1-135 6.57 h
Xe-125 16.9 h
Xe-131m 11.77 dXe-133 5.24 dXe-133m 2.19 dXe-135 9.14 hXe-135m 15.29 m
Xe-137 3.82 mXe-138 14.08 m
Cs-134 2.06 y
Cs-134m 2.91 hCs-136 13.16 d
Energy(keV)526.56546.56836.801038.761131.511260.42 *1457.561678.081791.22188.43 *243.40163.94 *81.00 *233.22 *249.79 *526.56 *
455.49 *258.41 *434.561768.262015.82563.23569.32604.70795.85 *801.931365.15127.50 *66.91176.55273.65340.55818.521048.07 *1235.36
Abundance(%)
13.307.206.738.0122.7428.908.739.627.7754.9028.821.9638.0010.0090.2092.00
31.2031.5020.3216.7312.258.3815.4397.5685.448.733.04
12.7012.4913.5912.6942.1799.7079.7620.04
Production ModesFission
Xe-124(n,Y)
Xe-130(n,r); FissionXe-132(n,y); FissionXe-132(n,r); FissionXe-134(n,y); FissionXe-134(n,r); FissionPrecursor: I-135(halflife - 6.57 h)Xe-136(n,r); FissionFission
Cs-133(n,Y)
Cs-133(n,Y)Fission
Réf.79
72
7577777979
8182
78
7880
Cs-137 30.17 y 661.66 * 85.21 Fission 81
211
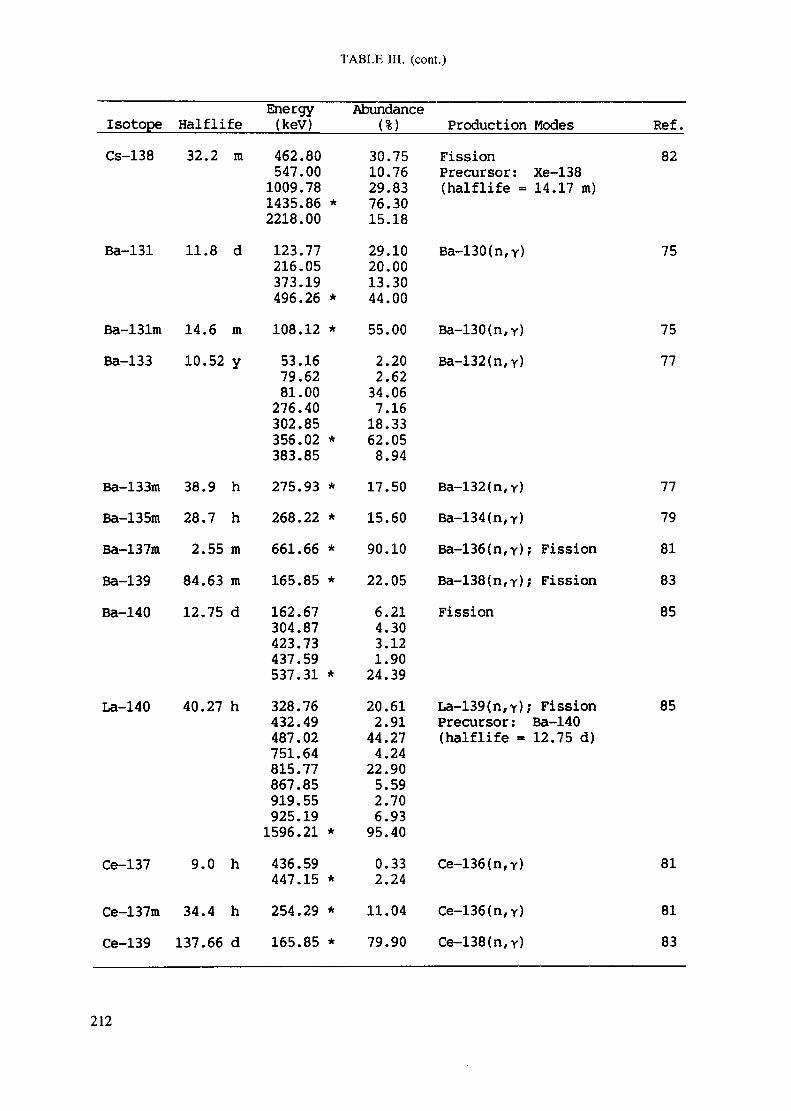
TABLE III. (cont.)
Isotope Half lifeCs-138 32.2 m
Ba-131 11.8 d
Ba-131m 14.6 mBa-133 10.52 y
Ba-133m 38.9 hBa-135m 28.7 hBa-137m 2.55 mBa-139 84.63 mBa-140 12.75 d
La-140 40.27 h
Ce-137 9.0 h
Ce-137m 34.4 hCe-139 137.66 d
Energy(keV)462.80547.001009.781435.86 *2218.00123.77216.05373.19496.26 *108.12 *53.1679.6281.00276.40302.85356.02 *383.85275.93 *268.22 *661.66 *165.85 *162.67304.87423.73437.59537.31 *328.76432.49487.02751.64815.77867.85919.55925.191596.21 *436.59447.15 *254.29 *165.85 *
Abundance(%)
30.7510.7629.8376.3015.1829.1020.0013.3044.0055.002.202.6234.067.16
18.3362.058.9417.5015.6090.1022.056.214.303.121.9024.3920.612.9144.274.2422.905.592.706.9395.400.332.24
11.0479.90
Production ModesFissionPrecursor: Xe-138(half life - 14.17 m)
Ba-130(n,r)
Ba-130(n,r)Ba-132(n,y)
Ba-132(n,r)Ba-134(n,Y)Ba-136(n,r); FissionBa-138(n,Y); FissionFission
La-139(n,r); FissionPrecursor: Ba-140(halflife - 12.75 d)
Ce-136(n,Y)
Ce-136(n,Y)Ce-138(n,Y)
Réf.82
75
7577
7779818385
85
81
8183
212
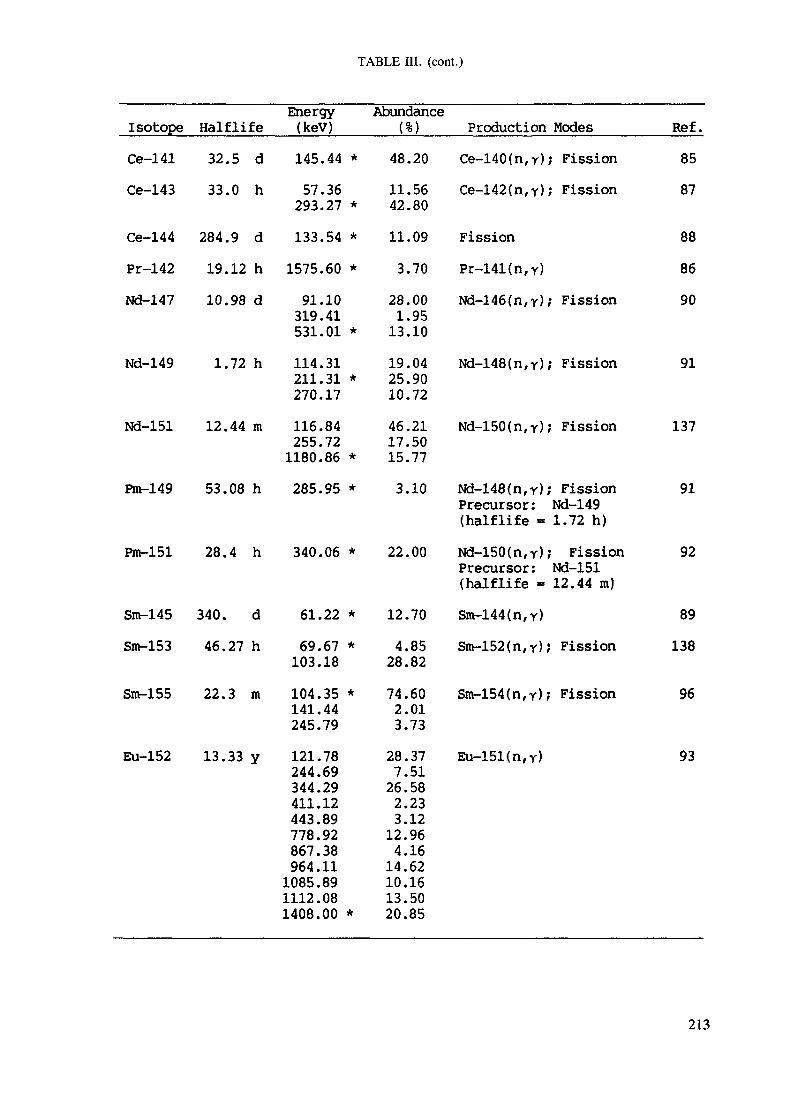
TABLE III. (cont.)
Isotope Half lifeCe-141 32.5 dCe-143 33.0 h
Ce-144 284.9 dPr-142 19.12 hNd-147 10.98 d
Nd-149 1.72 h
Nd-151 12.44 m
Pm-149 53.08 h
Pra-151 28.4 h
Sm-145 340. dSifr-153 46.27 h
Sra-155 22.3 m
Eu-152 13.33 y
Energy(keV)145.44 *57.36293.27 *133.54 *1575.60 *91.10319.41531.01 *114.31211.31 *270.17116.84255.721180.86 *285.95 *
340.06 *
61.22 *69.67 *103.18104.35 *141.44245.79121.78244.69344.29411.12443.89778.92867.38964.111085.891112.081408.00 *
Abundance(%)48.2011.5642.8011.093.7028.001.9513.1019.0425.9010.7246.2117.5015.773.10
22.00
12.704.8528.8274.602.013.7328.377.5126.582.233.1212.964.1614.6210.1613.5020.85
Production ModesCe-140(n,y); FissionCe-142(n,y); Fission
FissionPr-141(n,Y)Nd-146(n,r); Fission
Nd-148(n,Y); Fission
Nd-150(n,y); Fission
Nd-148(n,r); FissionPrecursor: Nd-149(halflife - 1.72 h)Nd-150(n,r); FissionPrecursor: Nd-151(halflife = 12.44 m)Sne-144(n,Y)Sm-152(n,r)f Fission
Sm-154(n,r); Fission
Eu-151(n,r)
Réf.8587
888690
91
137
91
92
89138
96
93
213
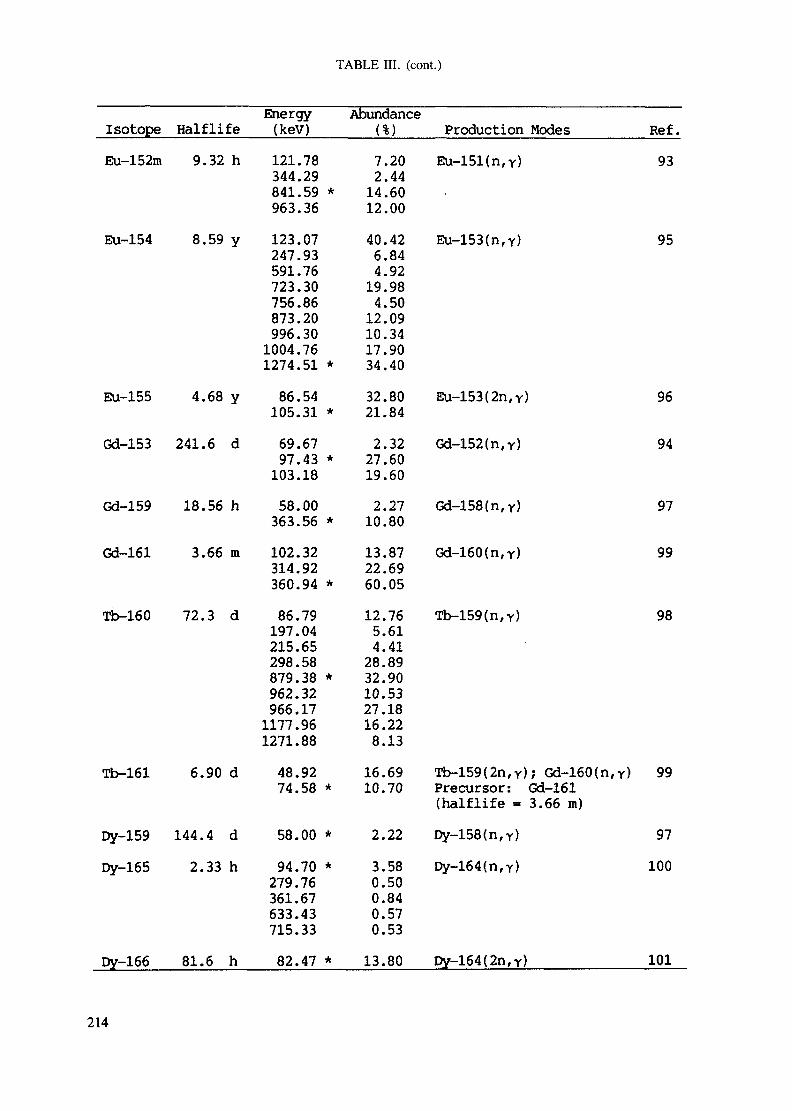
TABLE III. (cont.)
IsotopeEu-152m
Eu-154
Eu-155
Gd-153
Gd-159
Gd-161
Tb-160
Tb-161
Dy-159Dy-165
Dy-166
Halflife9.32 h
8.59 y
4.68 y
241.6 d
18.56 h
3.66 m
72.3 d
6.90 d
144.4 d2.33 h
81.6 h
Energy(kev)121.78344.29841.59 *963.36123.07247.93591.76723.30756.86873.20996.301004.761274.51 *86.54105.31 *69.6797.43 *103.1858.00363.56 *102.32314.92360.94 *86.79197.04215.65298.58879.38 *962.32966.171177.961271.8848.9274.58 *
58.00 *94.70 *279.76361.67633.43715.3382.47 *
Abundance(%)7.202.44
14.6012.0040.426.844.92
19.984.50
12.0910.3417.9034.4032.8021.842.3227.6019.602.2710.8013.8722.6960.0512.765.614.4128.8932.9010.5327.1816.228.13
16.6910.70
2.223.580.500.840.570.5313.80
Production ModesEu-151(n,r)
Eu-153(n,Y)
Eu-153(2n,Y)
Gd-152(n,Y)
Gd-158(n,Y)
Gd-160(n,Y)
Tb-159(n,Y)
Tb-159(2n,y); Gd-160(n,Y)Precursor: Gd-161(half life = 3.66 m)Dy-158(n,Y)Dy-164(n,Y)
Dy-164(2n,Y)
Réf.93
95
96
94
97
99
98
99
97100
101
214
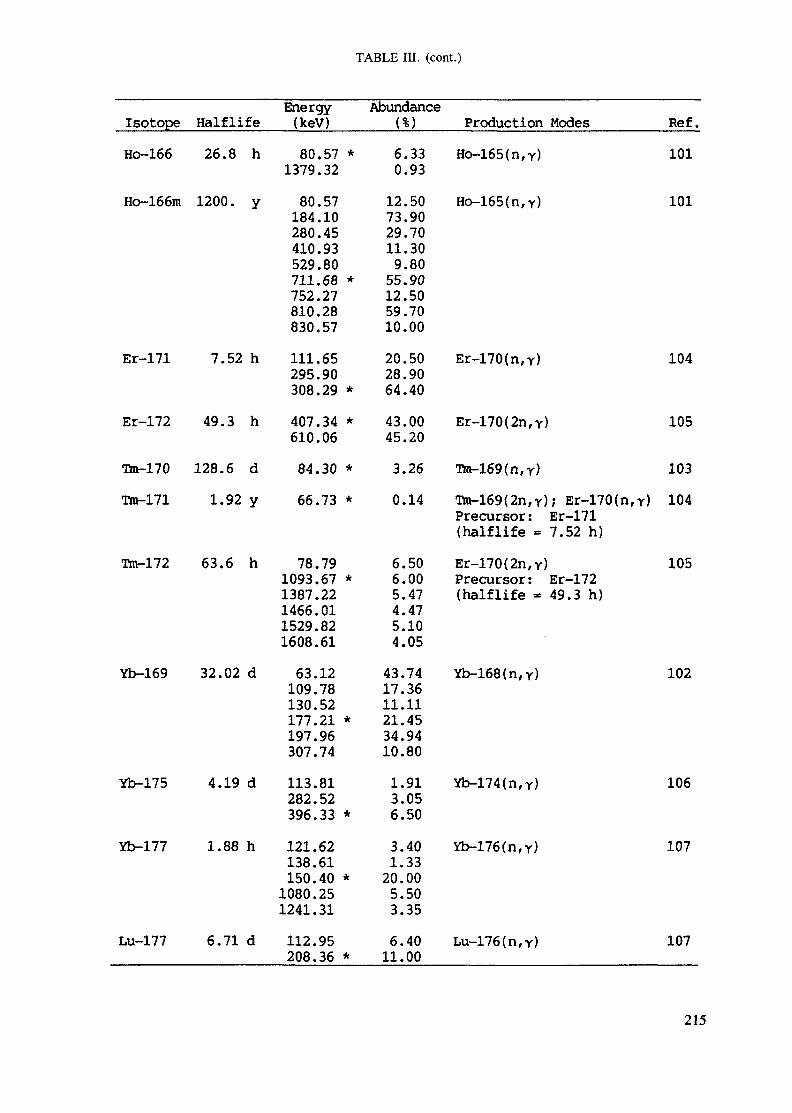
TABLE III. (cont.)
Isotope
Ho-166
Ho-166m
Er-171
Er-172
Tto-170
Tm-171
Ttn-172
Yb-169
Yb-175
Yb-177
Lu-177
Half life
26.8 h
1200. y
7.52 h
49.3 h
128.6 d
1.92 y
63.6 h
32.02 d
4.19 d
1.88 h
6.71 d
Energy(keV)
80.57 *1379.32
80.57184.10280.45410.93529.80711.68 *752.27810.28830.57
111.65295.90308.29 *
407.34 *610.06
84.30 *
66.73 *
78.791093.67 *1387.221466.011529.821608.61
63.12109.78130.52177.21 *197.96307.74
113.81282.52396.33 *
121.62138.61150.40 *
1080.251241.31
112.95208.36 *
Abundance( % )
6.330.93
12.5073.9029.7011.30
9.8055.9012.5059.7010.00
20.5028.9064.40
43.0045.20
3.26
0.14
6.506.005.474.475.104.05
43.7417.3611.1121.4534.9410.80
1.913.056.50
3.401.33
20.005.503.35
6.4011.00
Production Modes
Ho-165(n,Y)
Ho-165(n,Y)
Er-170(n/Y)
Er-170(2n,Y)
ïto-169(n,Y)
Tta-169(2n,Y); Er-170(n,Y)Precursor: Er-171(halflife = 7.52 h)
Er-170(2n,Y)Precursor: Er-172(halflife » 49.3 h)
Yb-168(n,Y)
Yb-174(n,Y)
Yb-176(n,Y)
Lu-176{n,Y)
Réf.
101
101
104
105
103
104
105
102
106
107
107
215
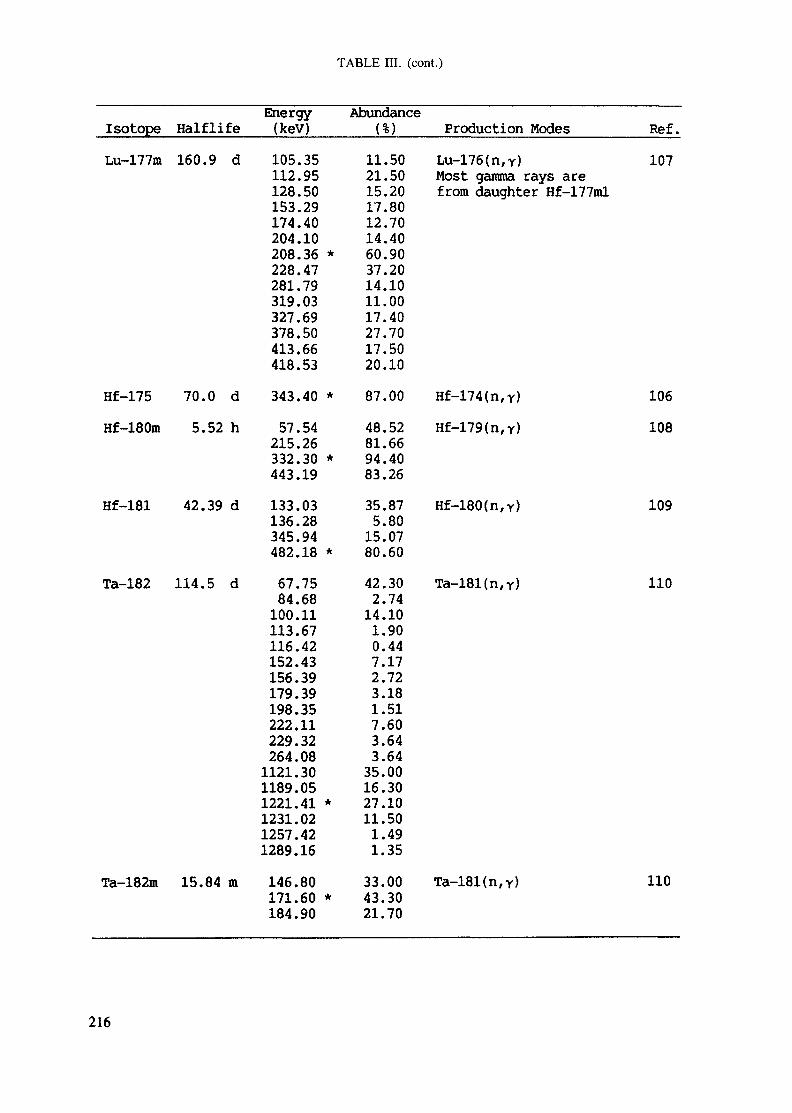
TABLE III. (cont.)
Isotope Half lifeLu-177m 160.9 d
Hf-175 70.0 dHf-180m 5.52 h
Hf-181 42.39 d
Ta-182 114.5 d
Ta-182m 15.84 m
Energy(kev)105.35112.95128.50153.29174.40204.10208.36 *228.47281.79319.03327.69378.50413.66418.53343.40 *57.54215.26332.30 *443.19133.03136.28345.94482.18 *67.7584.68100.11113.67116.42152.43156.39179.39198.35222.11229.32264.081121.301189.051221.41 *1231.021257.421289.16146.80171.60 *184.90
Abundance(%) Production Modes Réf.
11.50 Lu-176(n,Y) 10721.50 Most gamma rays are15.20 from daughter Hf-177ml17.8012.7014.4060.9037.2014.1011.0017.4027.7017.5020.1087.00 Hf-174(n,Y) 10648.52 Hf-179(n,Y) 10881.6694.4083.2635.87 Hf-180(n,Y) 1095.8015.0780.6042.30 Ta-181(n,Y) HO2.7414.101.900.447.172.723.181.517.603.643.6435.0016.3027.1011.501.491.3533.00 Ta-181(n,Y) 11043.3021.70
216
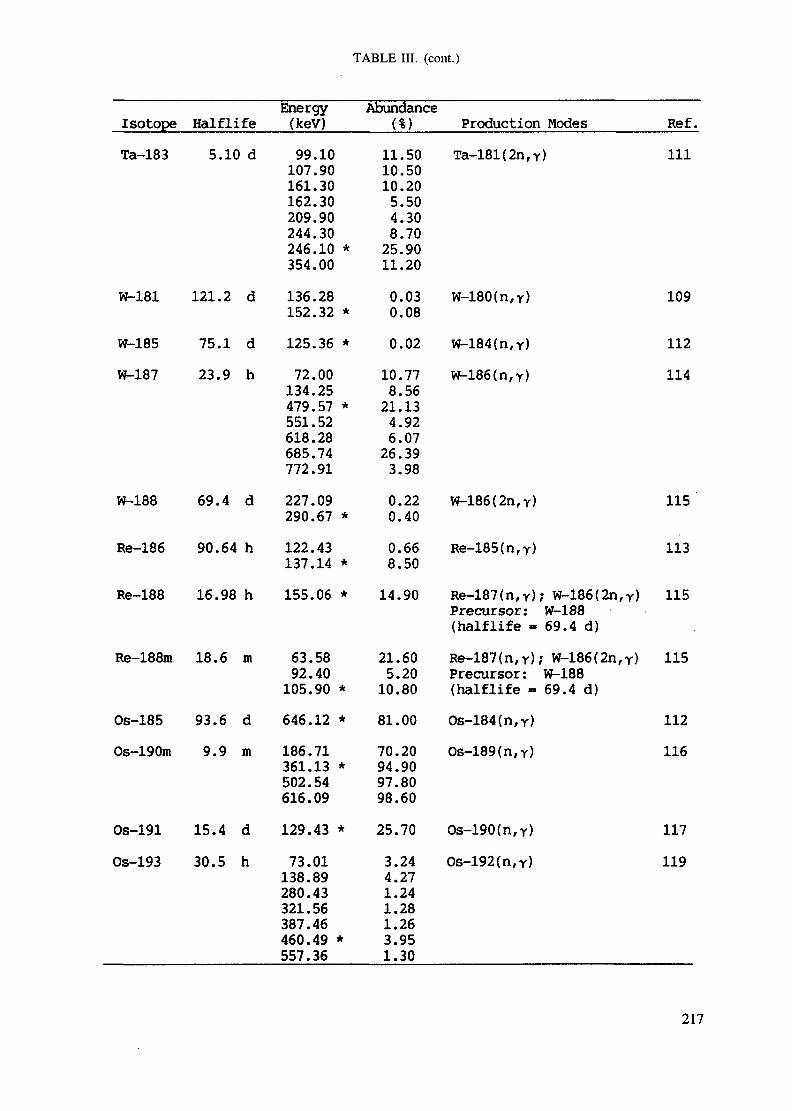
TABLE III. (cont.)
Isotope Half lifeTa-183 5.10 d
W-181 121.2 d
W-185 75.1 dW-187 23.9 h
W-188 69.4 d
Re-186 90.64 h
Re-188 16.98 h
Re-188m 18.6 m
Os-185 93.6 dOs-190m 9.9 m
Os-191 15.4 dOs-193 30.5 h
Energy(keV)99.10107.90161.30162.30209.90244.30246.10 *354.00136.28152.32 *125.36 *72.00134.25479.57 *551.52618.28685.74772.91227.09290.67 *122.43137.14 *155.06 *
63.5892.40105.90 *646.12 *186.71361.13 *502.54616.09129.43 *73.01138.89280.43321.56387.46460.49 *557.36
Abundance(%)
11.5010.5010.205.504.308.7025.9011.200.030.080.02
10.778.56
21.134.926.0726.393.980.220.400.668.50
14.90
21.605.20
10.8081.0070.2094.9097.8098.6025.703.244.271.241.281.263.951.30
Production ModesTa-181(2n,r)
W-180(n,Y)
W-184(n,Y)W-186(n,Y)
W-186(2n,Y)
Re-185(n,Y)
Re-187(n,Y); W-186(2n,r)Precursor: W-188(halflife - 69.4 d)Re-187(n,Y>; W-186(2n,Y)Precursor: W 188{halflife - 69.4 d)Os-184 (n, y)Os-189 (n, Y)
Os-190 (n, Y)Os-192 (n, Y)
Réf.111
109
112114
115
113
115
115
112116
117119
217
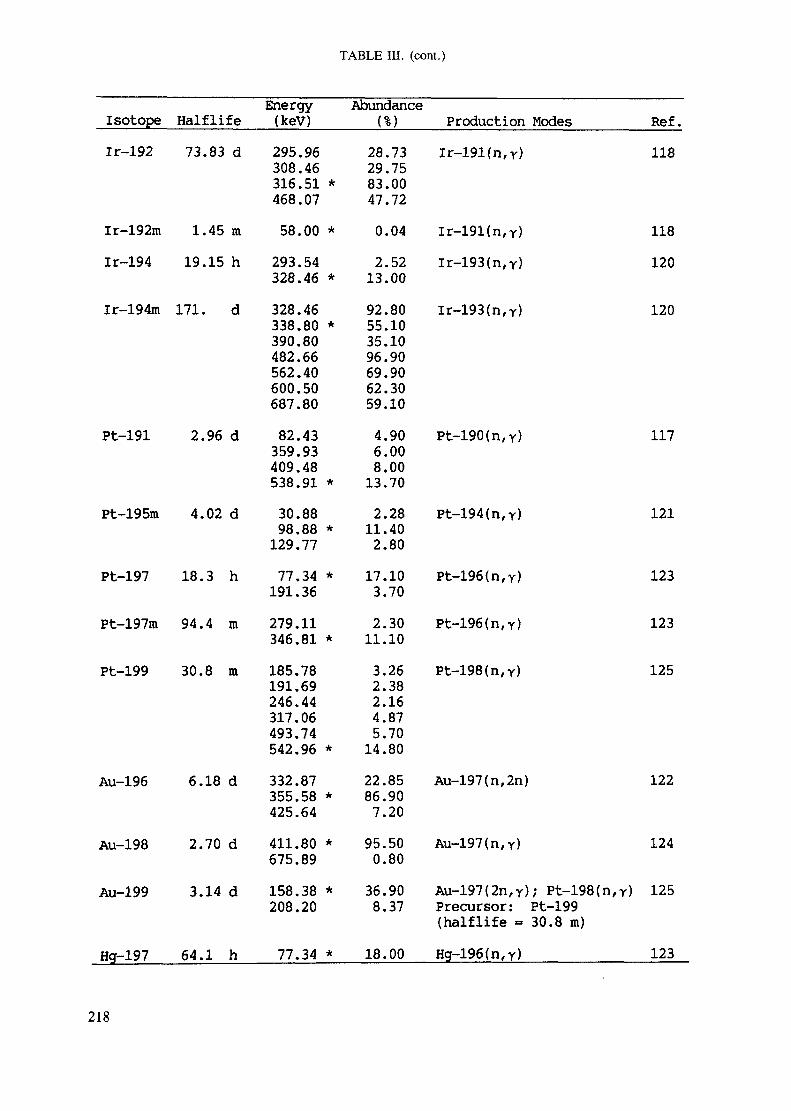
TABLE III. (cont.)
Isotope HalflifeIr-192 73.83 d
Ir-192m 1.45 mIr-194 19.15 h
lr-194m 171. d
Pt-191 2.96 d
Pt-195m 4.02 d
Pt-197 18.3 h
Pt-197m 94.4 m
Pt-199 30.8 m
Au-196 6.18 d
Au-198 2.70 d
Au-199 3.14 d
Hg-197 64.1 h
Energy(keV)295.96308.46316.51 *468.0758.00 *293.54328.46 *328.46338.80 *390.80482.66562.40600.50687.8082.43359.93409.48538.91 *30.8898.88 *129.7777.34 *191.36279.11346.81 *185.78191.69246.44317.06493.74542.96 *332.87355.58 *425.64411.80 *675.89158.38 *208.20
77.34 *
Abundance(%)
28.7329.7583.0047.720.042.5213.0092.8055.1035.1096.9069.9062.3059.104.906.008.0013.702.2811.402.8017.103.702.3011.103.262.382.164.875.7014.8022.8586.907.2095.500.8036.908.37
18.00
Production Modeslr-191(n,r)
Ir-191(n,Y)Ir-193(n,Y)
Ir-193(n,Y)
Pt-190(n,Y>
Pt-194(n,y)
Pt-196(n,Y)
Pt-196(n,Y)
Pt-198(n,y)
Au-197(n,2n)
Au-197(n,Y)
Au-197(2n,Y); Pt-198(n,Y)Precursor: Pt-199(half life - 30.8 m)Hg-196(n,Y)
Réf.118
118120
120
117
121
123
123
125
122
124
125
123
218
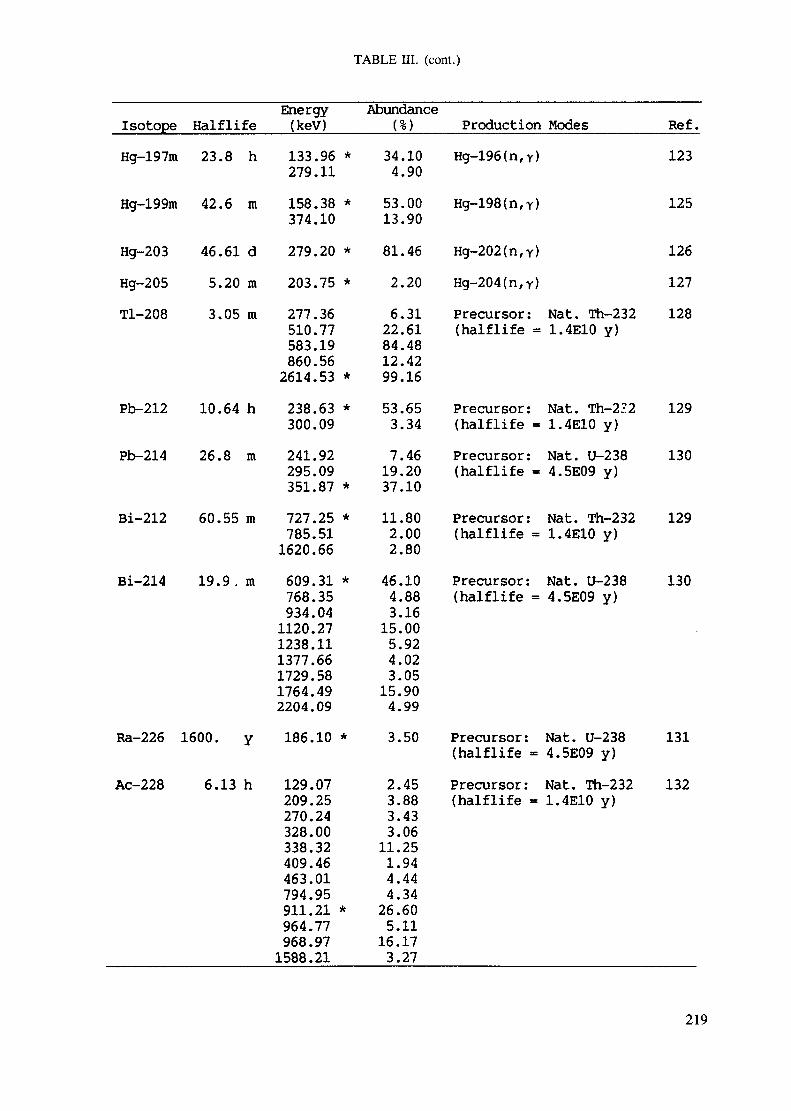
TABLE III. (cont.)
Isotope HalflifeHg-197m 23.8 h
Hg-199m 42.6 m
Hg-203 46.61 dHg-205 5.20 mTl-208 3.05 m
Pb-212 10.64 h
Pb-214 26.8 m
Bi-212 60.55 m
Bi-214 19.9. m
Ra-226 1600. y
Ac-228 6.13 h
Energy(keV)133.96 *279.11158.38 *374.10279.20 *203.75 *277.36510.77583.19860.562614.53 *238.63 *300.09241.92295.09351.87 *727.25 *785.511620.66609.31 *768.35934.041120.271238.111377.661729.581764.492204.09186.10 *
129.07209.25270.24328.00338.32409.46463.01794.95911.21 *964.77968.971588.21
Abundance
34.104.9053.0013.9081.462.206.31
22.6184.4812.4299.1653.653.347.46
19.2037.1011.802.002.80
46.104.883.16
15.005.924.023.05
15.904.993.50
2.453.883.433.06
11.251.944.444.3426.605.11
16.173.27
ProductionHg-196(n,Y)
Hg-198(n,y)
Hg-202(n,y)Hg-204(n,Y)Precursor :(halflife -
Precursor:(halflife =Precursor:(halflife =
Precursor:(halflife =
Precursor:(halflife -
Precursor:(halflife -Precursor:(halflife -
Modes Réf.123
125
126127
Nat. Th-232 1281.4E10 y)
Nat. Th-222 1291.4E10 y)Nat. U-238 1304.5E09 y)
Nat. Th-232 1291.4E10 y)
Nat. U-238 1304.5E09 y)
Nat. U-238 1314.5E09 y)Nat. Th-232 1321.4E10 y)
219
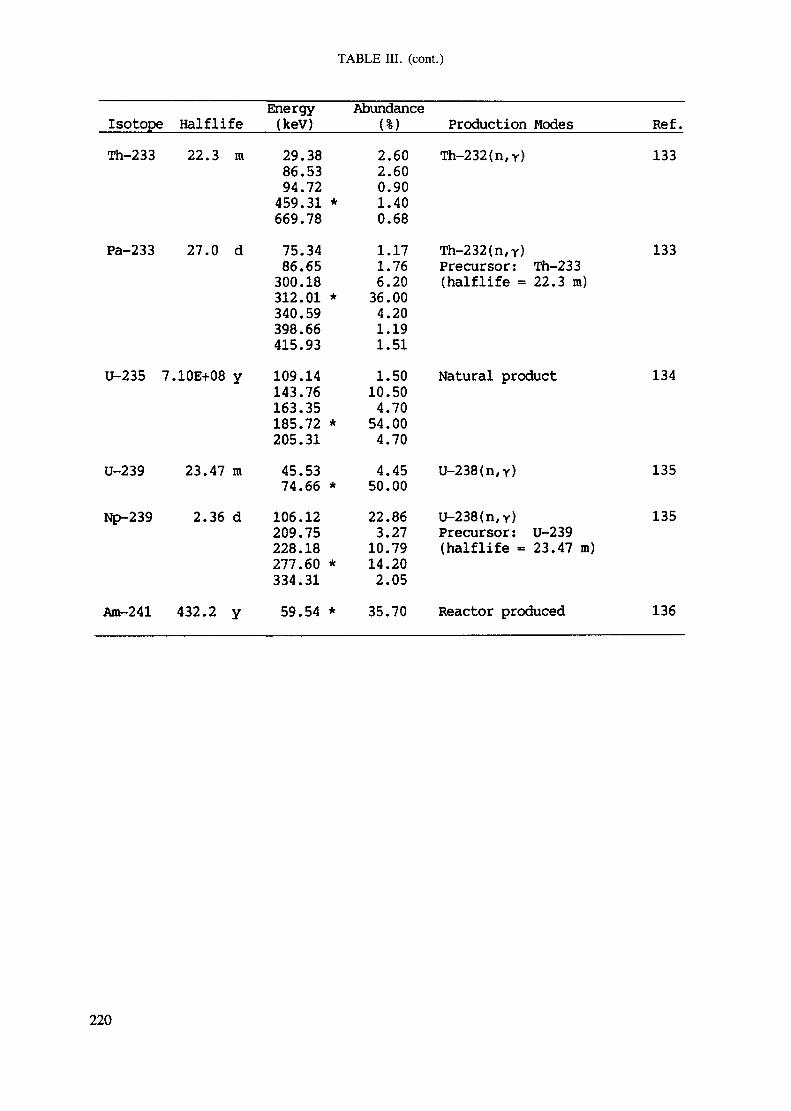
TABLE III. (cont.)
Isotope Half lifeTh-233 22.3 m
Pa-233 27.0 d
U-235 7.10E+08 y
U-239 23.47 m
Np-239 2.36 d
Am-241 432.2 y
Energy(keV)29.3886.5394.72459.31 *669.7875.3486.65300.18312.01 *340.59398.66415.93109.14143.76163.35185.72 *205.3145.5374.66 *106.12209.75228.18277.60 *334.3159.54 *
Abundance(%)2.602.600.901.400.681.171.766.2036.004.201.191.511.5010.504.7054.004.704.4550.0022.863.2710.7914.202.0535.70
Production Modes Réf.Th-232(n,Y) 133
Th-232(n,Y) 133Precursor: Th-233(half life = 22.3 m)
Natural product 134
U-238(n,Y) 135
U-238(n,Y) 135Precursor: U-239(half life - 23.47 m)
Reactor produced 136
220
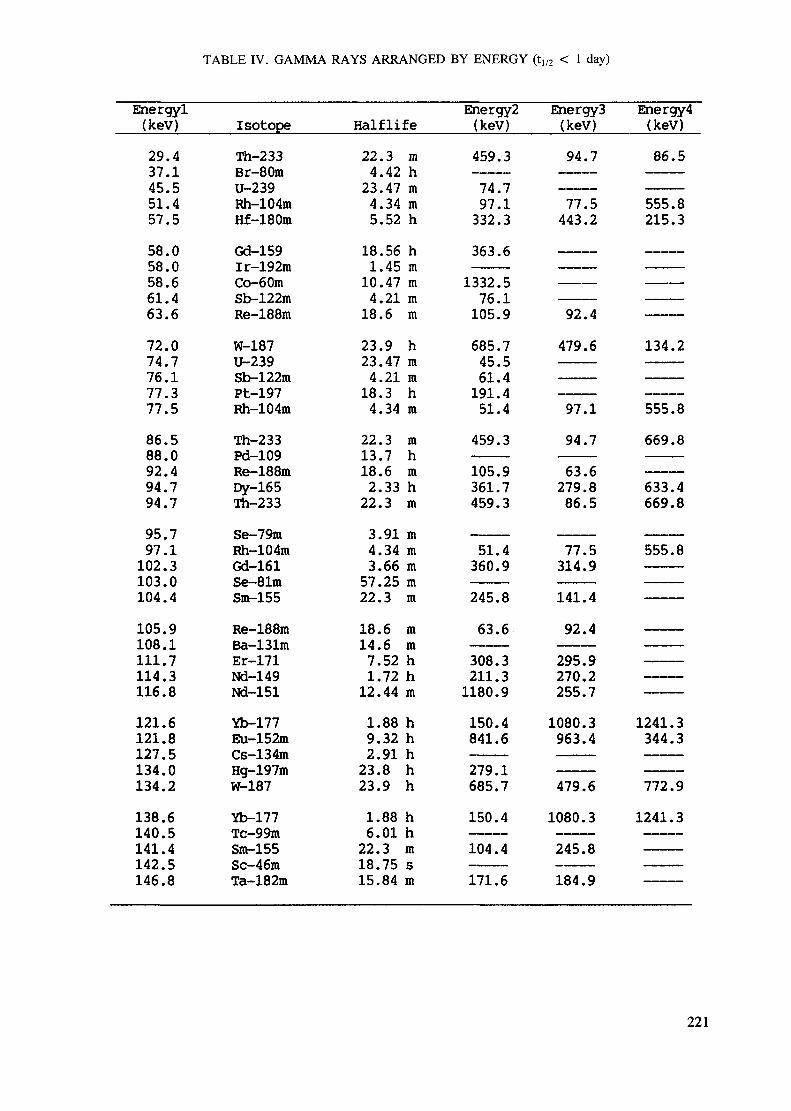
TABLE IV. GAMMA RAYS ARRANGED BY ENERGY (t]/2 < 1 day)
Energyl(kev)29.437.145.551.457.558.058.058.661.463.672.074.776.177.377.586.588.092.494.794.795.797.1
102.3103.0104.4105.9108.1111.7114.3116.8121.6121.8127.5134.0134.2138.6140.5141.4142.51/ifi n
IsotopeTh-233Br-80mU-239Rh-104mHf-180raGd-159Ir-192mCo-60mSb-122mRe-188raW-187U-239Sb-122raPt-197Rh-104mTh-233Pd-109Re-188mDy-165Th-233Se-79mRh-104mGd-161ft -~ Û 1 IT.Se— ölmSm-155Re-188mBa-131mEr-171Nd-149Nd-151Yb-177Eu-152mCs-134mHg-197mW-187Yb-177Tc-99mSnel55Sc-46mTa 1 fl"?m
Half life22.3 m4.42 h23.47 m4.34 m5.52 h18.56 h1.45 m10.47 m4.21 m
18.6 m23.9 h23.47 m4.21 m18.3 h4.34 m
22.3 m13.7 h18.6 m2.33 h22.3 m3.91 m4.34 m3.66 m57.25 m22.3 m18.6 m14.6 m7.52 h1.72 h
12.44 m1.88 h9.32 h2.91 h23.8 h23.9 h1.88 h6.01 h22.3 m18.75 sm RA m
Energy2(kev)459.374.797.1332.3363.61332.576.1105.9685.745.561.4191.451.4459.3105.9361.7459.3
51.4360.9245.863.6308.3211.31180.9150.4841.6279.1685.7150.4104.4171 fi
Energy 3(keV)94.7
77.5443.2
92.4479.6
97.194.763.6279.886.5
77.5314.9141.492.4295.9270.2255.71080.3963.4
479.61080.3245.8IRA Q
Energy 4(keV)86.5
555.8215.3
134.2
555.8669.8
633.4669.8
555.8
———
———
1241.3344.3
772.91241.3———
221
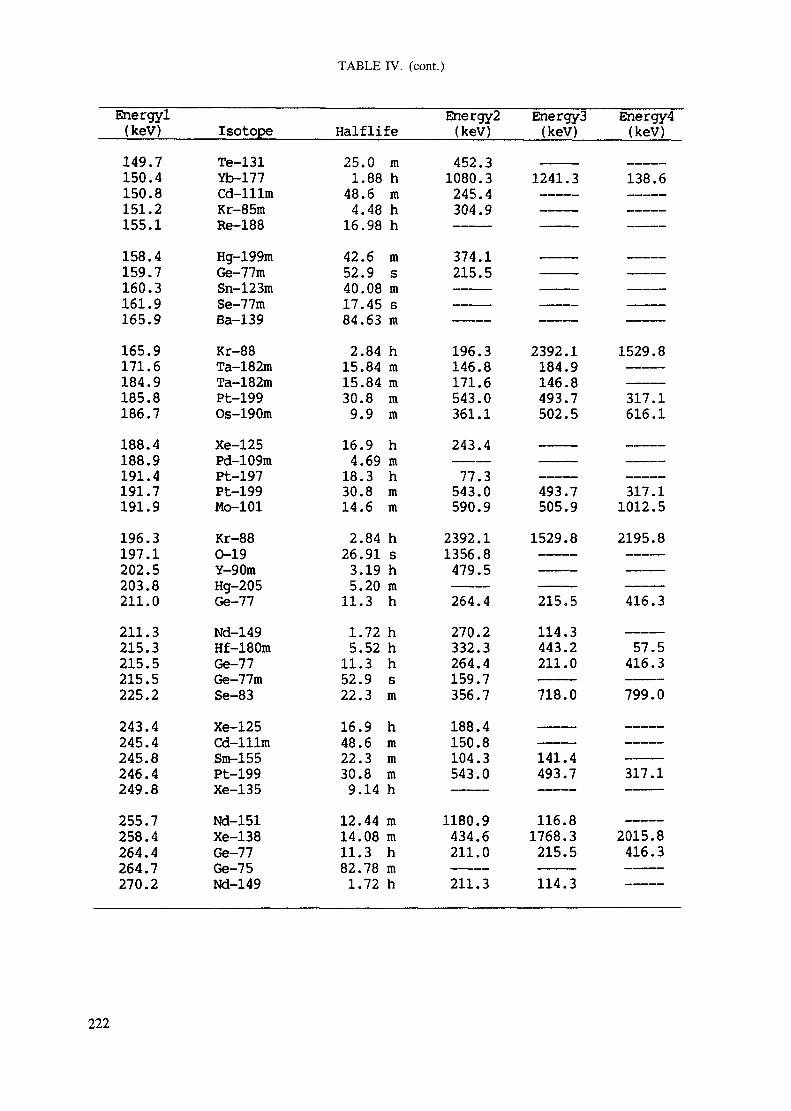
TABLE IV. (cont.)
Energyl(kev)149.7150.4150.8151.2155.1158.4159.7160.3161.9165.9165.9171.6184.9185.8186.7188.4188.9191.4191.7191.9196.3197.1202.5203.8211.0211.3215.3215.5215.5225.2243.4245.4245.8246.4249.8255.7258.4264.4264.7ïtn •>
IsotopeTe 131A w J. */ <!•
Yb-177Cd-lllmKr-85mRe-188Hg-199mGe-77mSn-123mSe-77mRa 1 "ÎQ
Kr-88Ta-182mTa-182mPt-199Os-190mXe-125Pd 109mPt-197Pt-199Mo-101Kr-880-19Y-90mHg-205Ge-77Nd-149Hf-180mGe-77Ge-77mSe-83Xe-125Cd-lllmSm-155Pt-199Xe-135Nd-151Xe-138Ge-77Gf 75*J& 1 -J
Mrt IdQ
Half life25.0 m1.88 h
48.6 m4.48 h16.98 h42.6 m52.9 s40.08 m17.45 s84.63 m2.84 h
15.84 m15.84 m30.8 m9.9 m
16.9 h4.69 m
18.3 h30.8 m14.6 m2.84 h
26.91 s3.19 h5.20 m
11.3 h1.72 h5.52 h
11.3 h52.9 s22.3 m16.9 h48.6 m22.3 m30.8 m9.14 h
12.44 m14.08 m11.3 h82.78 m1 T) h
Energy2(kev)452.31080.3245.4304.9
374.1215.5
196.3146.8171.6543.0361.1243.477.3543.0590.92392.11356.8479.5264.4270.2332.3264.4159.7356.7188.4150.8104.3543.0
1180.9434.6211.091 1 7
Energy3(kev)
1241.3
_
2392.1184.9146.8493.7502.5
493.7505.91529.8———
215.5114.3443.2211.0718.0
141.4493.7
116.81768.3215.5114 ^
Energy4(keV)
138.6
__^__»
1529.8
317.1616.1
317.11012.52195.8———
416.3
57.5416.3799.0
317.1
2015.8416.3
222
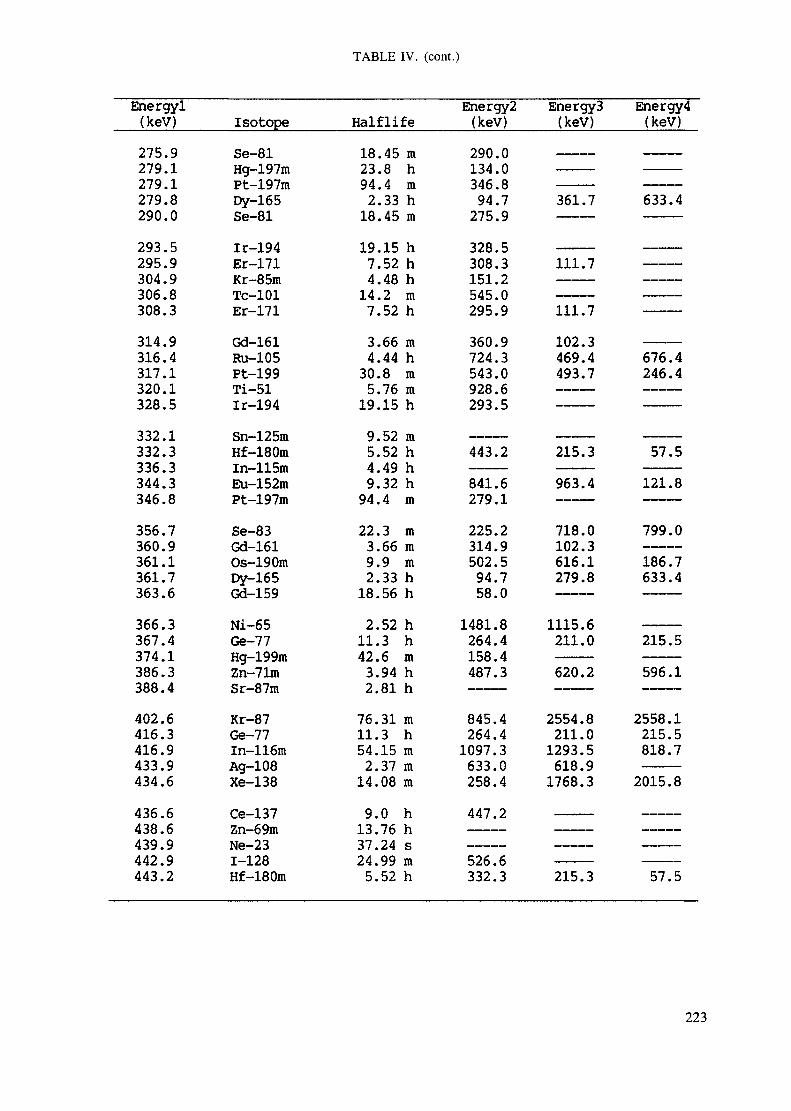
TABLE IV. (cont.)
Energyl(kev)275.9279.1279.1279.8290.0293.5295.9304.9306.8308.3314.9316.4317.1320.1328.5332.1332.3336.3344.3346.8356.7360.9361.1361.7363.6366.3367.4374.1386.3388.4402.6416.3416.9433.9434.6436.6438.6439.9442.9443.2
Isotopeo« O1Se— ölHg-197mPt-197raDy-165c»_ 01Se— 81Ir-194Pr 1 71&I. J. / iKr-85mTc-101Fr 1 "71
«j 1^1Gd-lolRu-105Pt-199Ti-51Ir-194Sn-125mHf-180mIn-115mEu-152mPt-197mSe-83Gd-161Os-190mDy-165Gd-159Ni-65Ge-77tlrr 1 QQm
Zn-71mC*v O*7mSr— 8 /mKr-87Ge-77In-116mAg-108Xe-138Ce-137Zn-69mNe-23I I 1Q
Hf-180m
Half life18.45 m23.8 h94.4 m2.33 h
18.45 m19.15 h7.52 h4.48 h
14.2 m7.52 h3.66 m4.44 h
30.8 m5.76 m
19.15 h9.52 m5.52 h4.49 h9.32 h
94.4 m22.3 m3.66 m9.9 m2.33 h
18.56 h2.52 h
11.3 h42.6 m3.94 h2.81 h
76.31 m11.3 h54.15 m2.37 m
14.08 m9.0 h
13.76 h37.24 s24.99 m5.52 h
Energy2(keV)290.0134.0346.894.7275.9328.5308.3151.2545.0295.9360.9724.3543.0928.6293.5
443.2841.6279.1225.2314.9502.594.758.0
1481.8264.4158.4487.3
845.4264.41097.3633.0258.4447.2
526.6332.3
Energy 3(keV)
361.7
111.7
111.7102.3469.4493.7
215.3963.4
718.0102.3616.1279.8
1115.6211.0620.2
2554.8211.01293.5618.91768.3
215.3
Energy 4(keV)
633.4
676.4246.4
57.5121.8
799.0186.7633.4
215.5596.1
2558.1215.5818.72015.8
57.5
223
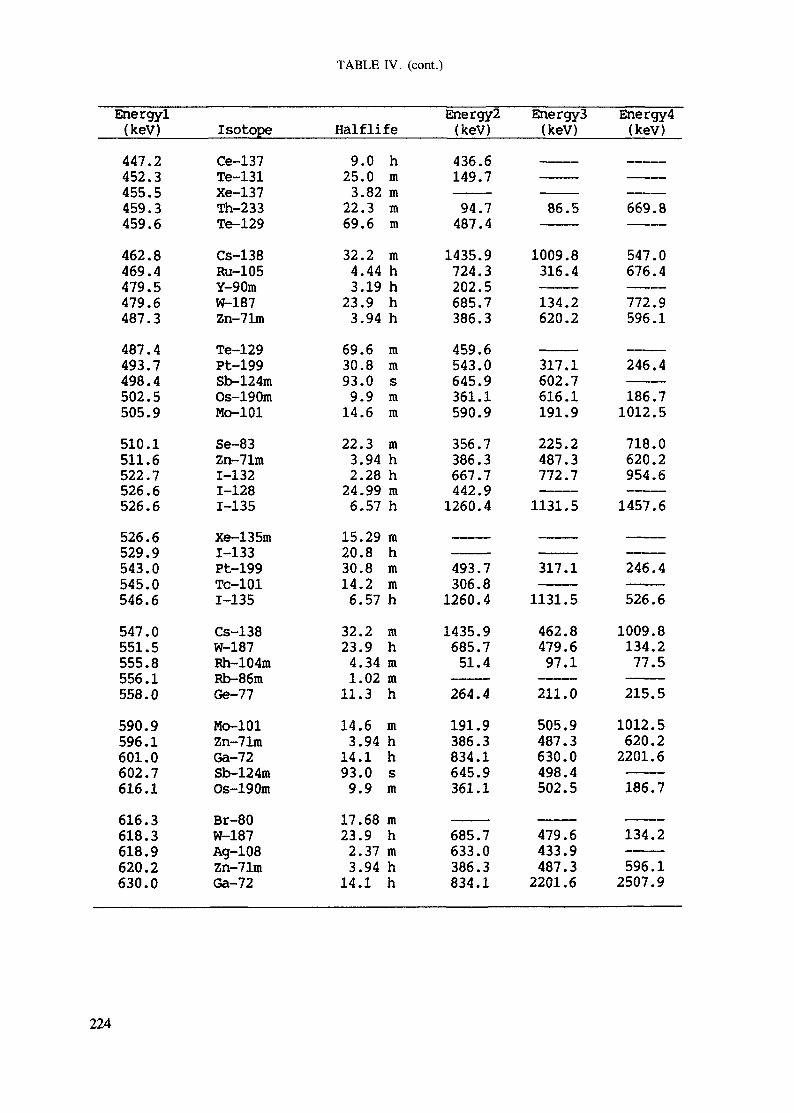
TABLE IV. (cont.)
Energyl(keV)
447.2452.3455.5459.3459.6
462.8469.4479.5479.6487.3
487.4493.7498.4502.5505.9
510.1511.6522.7526.6526.6
526.6529.9543.0545.0546.6
547.0551.5555.8556.1558.0
590.9596.1601.0602.7616.1
616.3618.3618.9620.2630.0
Isotope
Ce-137Te-131Xe-137Th-233Te-129
Cs-138Ru-105Y-90mW-187Zn-71m
Te-129Pt-199Sh>-124mOs-190mMo-101
Se-83Zn-71m1-1321-1281-135
Xe-135m1-133Pt-199Tc-1011-135
Cs-138W-187Rh-104mRb-86mGe-77
Mo-101Zn-71mGa-72Sb-124mOs-190m
Br-80W-187Ag-108Zn-71mGa-72
Halflife
9.0 h25.0 m
3.82 m22.3 m69.6 m
32.2 m4.44 h3.19 h
23.9 h3.94 h
69.6 m30.8 m93.0 s
9.9 m14.6 m
22.3 m3.94 h2.28 h
24.99 m6.57 h
15.29 m20.8 h30.8 m14.2 m
6.57 h
32.2 m23.9 h
4.34 m1.02 m
11.3 h
14.6 m3.94 h
14.1 h93.0 s
9.9 m
17.68 m23.9 h
2.37 m3.94 h
14.1 h
Energy2(keV)
436.6149.7
94.7487.4
1435.9724.3202.5685.7386.3
459.6543.0645.9361.1590.9
356.7386.3667.7442.9
1260.4
493.7306.8
1260.4
1435.9685.7
51.4
264.4
191.9386.3834.1645.9361.1
685.7633.0386.3834.1
Energy3(keV)
———
86.5
1009.8316.4
134.2620.2
317.1602.7616.1191.9
225.2487.3772.7———
1131.5
317.1
1131.5
462.8479.6
97.1
211.0
505.9487.3630.0498.4502.5
479.6433.9487.3
2201.6
Energy4(keV)
———
669.8
547.0676.4
772.9596.1
246.4
186.71012.5
718.0620.2954.6———
1457.6
246.4
526.6
1009.8134.2
77.5
215.5
1012.5620.2
2201.6_____186.7
134.2
596.12507.9
224
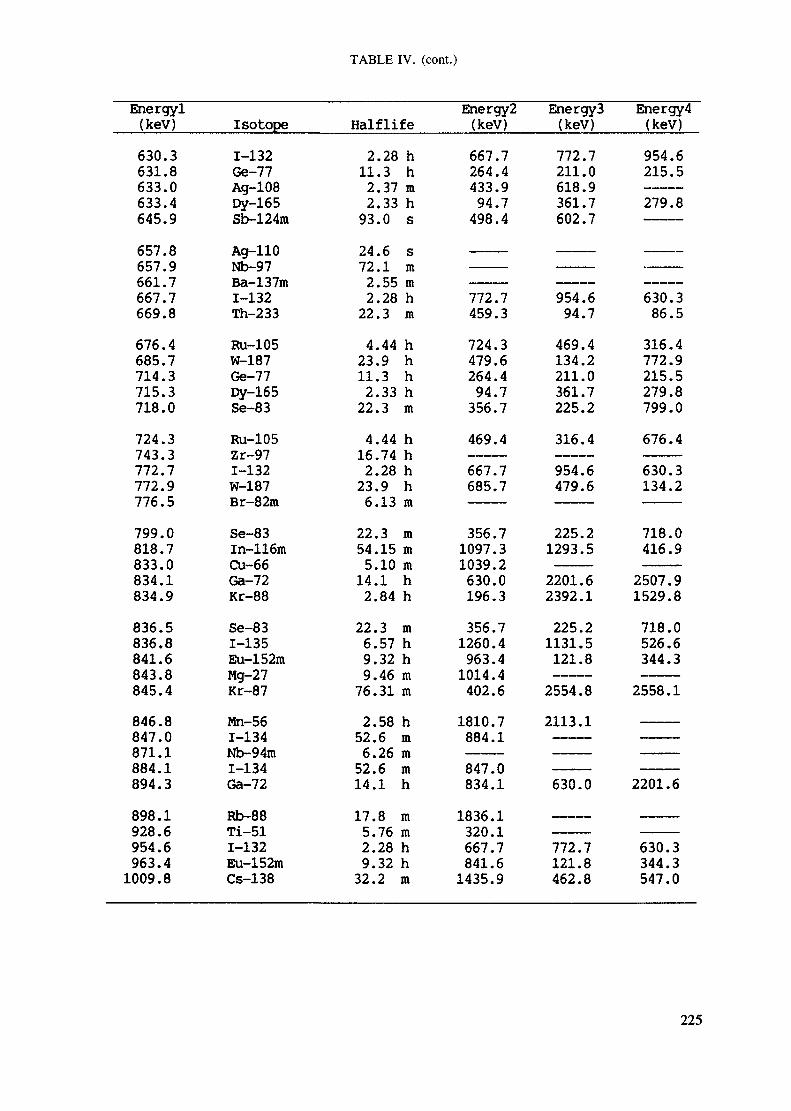
TABLE IV. (cont.)
Energyl(kev)630.3631.8633.0633.4645.9657.8657.9661.7667.7669.8676.4685.7714.3715.3718.0724.3743.3772.7772.9776.5799.0818.7833.0834.1834.9836.5836.8841.6843.8845.4846.8847.0871.1884.1894.3898.1928.6954.6963.41009.8
Isotope1-132Ge-77Ag-108Dy-165Sb-124mAg-110Nb-97Ba-137m1-132Th-233Ru-105W-187Ge-77Dy-165Se-83Ru-105Zr-971-132W-187Br-82mSe-83ln-116mCu-66Ga-72Kr-88Se-831-135Eu-152mMg-27Kr-87Mn-561-134Nb-94m1-134Ga-72Rb-88Ti-511-132Eu-152mCs-138
Half life2.28 h11.3 h2.37 m2.33 h93.0 s24.6 s72.1 m2.55 m2.28 h22.3 m4.44 h23.9 h11.3 h2.33 h22.3 m4.44 h16.74 h2.28 h23.9 h6.13 m22.3 m54.15 m5.10 m
14.1 h2.84 h22.3 m6.57 h9.32 h9.46 m76.31 m2.58 h52.6 m6.26 m52.6 m14.1 h17.8 m5.76 m2.28 h9.32 h32.2 m
Energy2(keV)667.7264.4433.994.7498.4
772.7459.3724.3479.6264.494.7356.7469.4667.7685.7
356.71097.31039.2630.0196.3356.71260.4963.41014.4402.61810.7884.1847.0834.11836.1320.1667.7841.61435.9
Energy 3(keV)772.7211.0618.9361.7602.7
954.694.7469.4134.2211.0361.7225.2316.4954.6479.6
225.21293.52201.62392.1225.21131.5121.82554.82113.1
630.0
772.7121.8462.8
Energy 4(keV)954.6215.5279.8
630.386.5316.4772.9215.5279.8799.0676.4630.3134.2
718.0416.92507.91529.8718.0526.6344.32558.1
2201.6
630.3344.3547.0
225
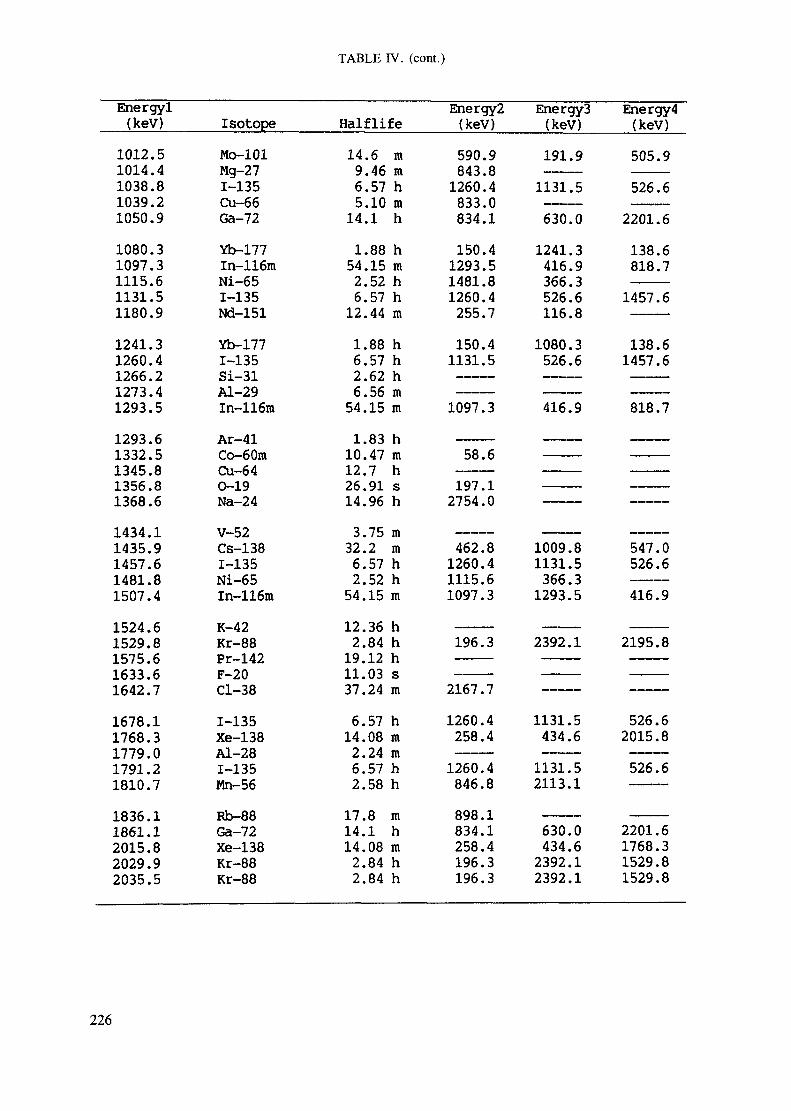
TABLE IV. (cont.)
Energyl(keV)
1012.51014.41038.81039.21050.91080.31097.31115.61131.51180.91241.31260.41266.21273.41293.51293.61332.51345.81356.81368.61434.11435.91457.61481.81507.41524.61529.81575.61633.61642.71678.11768.31779.01791.21810.71836.11861.12015.82029.92035.5
IsotopeMo-101M_. *) -7Mg-271-135Cu-66Ga-72Yb-177In-116mNi-651-135Nd-151Yb-1771-135Si-31Al ?Qrvi. 4+jIn-116mAr 41XIL ** J.
Co-60mCu-640-19IMCL £•**
V-52Cs-1381-135Ni-65In-116mK-49*tftKr-88Pr-142F ori— £\ia~3O— OÖ
1-135Xe-138Aï-281-135Mn-56Rb-88Ga-72Xe-138Kr-88Kr-88
Half life14.6 m9.46 m6.57 h5.10 m
14.1 h1.88 h54.15 m2.52 h6.57 h12.44 m1.88 h6.57 h2.62 h6.56 m54.15 m1.83 h10.47 m12.7 h26.91 s14.96 h3.75 m32.2 m6.57 h2.52 h54.15 m12.36 h2.84 h19.12 h11.03 s37.24 m6.57 h14.08 m2.24 m6.57 h2.58 h17.8 m14.1 h14.08 m2.84 h2.84 h
Energy2(keV)590.9843.81260.4833.0834.1150.41293.51481.81260.4255.7150.41131.5
1097.3
58.6197.12754.0
462.81260.41115.61097.3
196.3
2167.71260.4258.41260.4846.8898.1834.1258.4196.3196.3
Energy3(keV)191.91131.5630.01241.3416.9366.3526.6116.81080.3526.6
416.9
1009.81131.5366.31293.5
2392.1
1131.5434.61131.52113.1
630.0434.62392.12392.1
Energy4(keV)505.9526.62201.6138.6818.71457.6
138.61457.6
818.7
547.0526.6416.9
2195.8
526.62015.8526.6
2201.61768.31529.81529.8
226
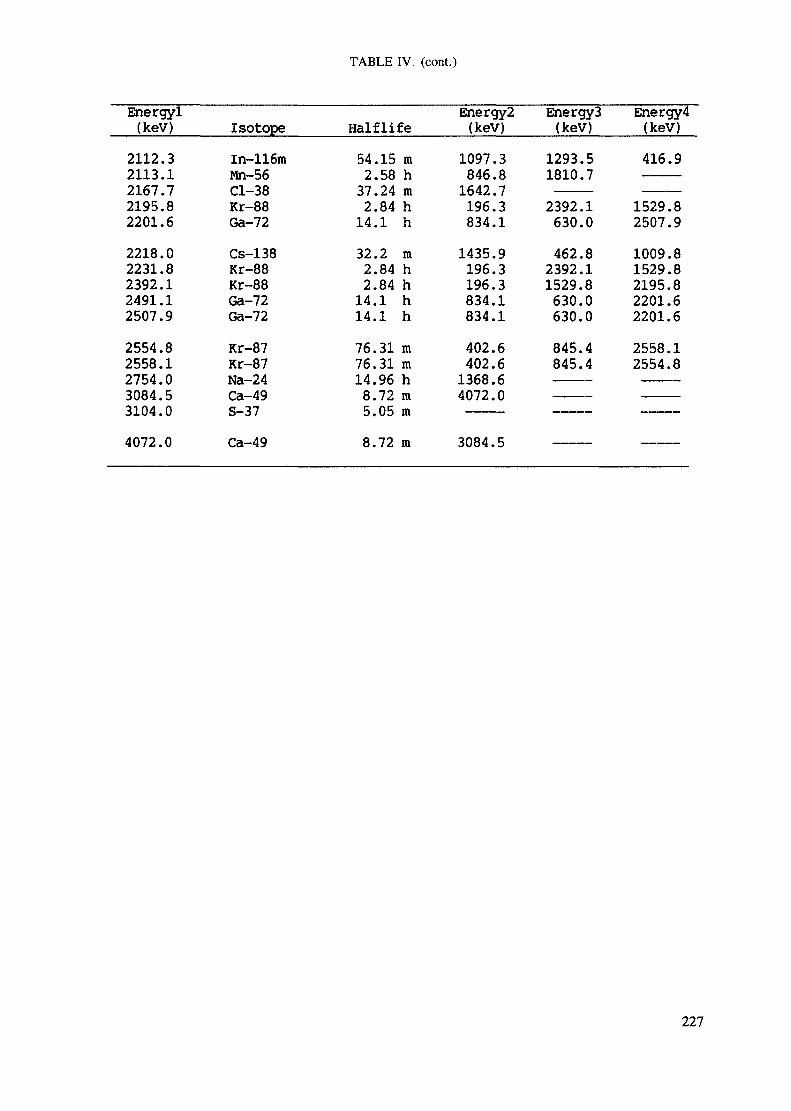
TABLE IV. (cont.)
Energyl(kev)
2112.32113.12167.72195.82201.62218.02231.82392.12491.12507.92554.82558.12754.03084.53ind n
IsotopeIn-116mMn-56Cl-38Kr-88Ga-72Cs-138Kr-88Kr-88Ga-72Ga-72Kr-87Kr-87Na-24Ca-49S 77
Halflife54.15 m2.58 h37.24 m2.84 h14.1 h32.2 m2.84 h2.84 h
14.1 h14.1 h76.31 m76.31 m14.96 h8.72 mc. n t; m
Energy2(keV)1097.3846.81642.7196.3834.11435.9196.3196.3834.1834.1402.6402.61368.64072.0
Energy 3(keV)1293.51810.72392.1630.0462.82392.11529.8630.0630.0845.4845.4
Energy4(keV)416.9———1529.82507.91009.81529.82195.82201.62201.62558.12554.8
4072.0 Ca-49 8.72 m 3084.5
227
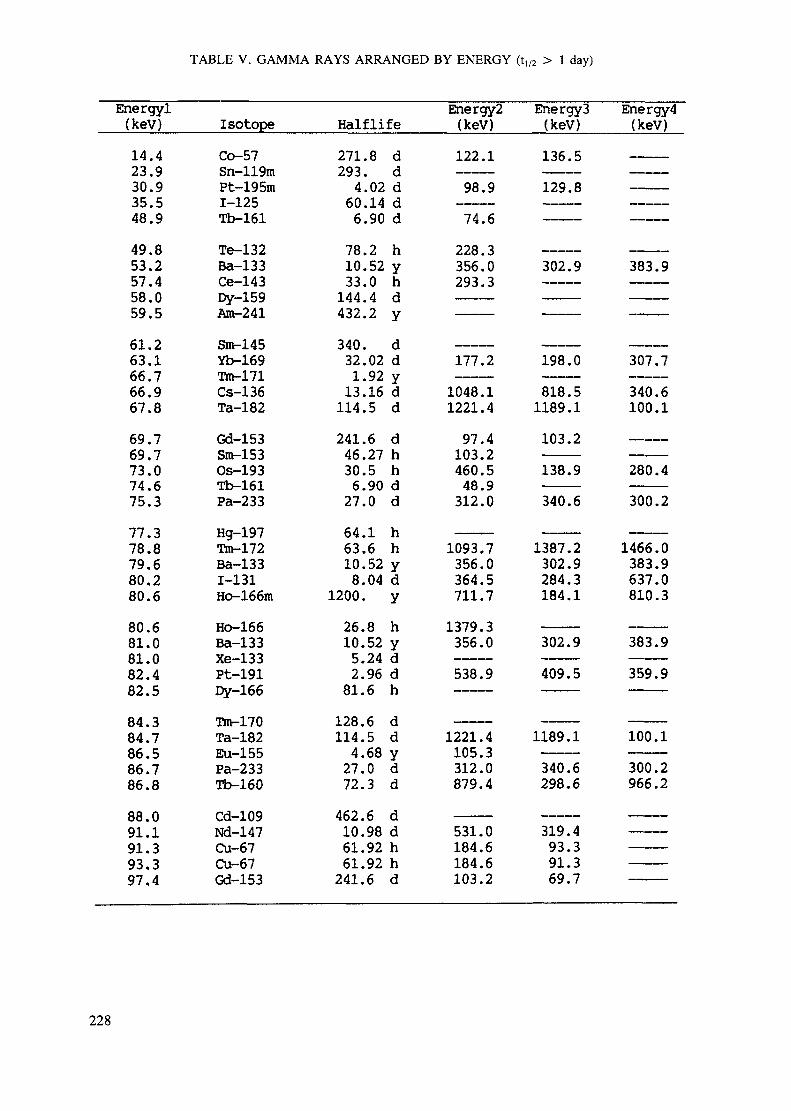
TABLE V. GAMMA RAYS ARRANGED BY ENERGY (t,/2 > 1 day)
Energyl(keV)14.423.930.935.548.949.853.257.458.059.561.263.166.766.967.869.769.773.074.675.377.378.879.680.280.680.681.081.082.482.584.384.786.586.786.888.091.191.393.3Q-J A
IsotopeCo-57Sn-119mPt-195mT 1 TC
Tb-161TP 1 3?Ba-133Ce-143Dy-159Am-241Sm-145Yb-169Tm-171Cs-136Ta-182Gd-153Sm-153Os-193Tb-161Pa-233Hg-197Tm-172Ba-1331-131Ho-166mHo-166Ba-133Xe-133Pt-191Dy-166Tm-170Ta-182Eu-155Pa-233Tb-160Cd-109MH 1 47IWwl X*i /Cu-67Cu-67nA 1 C3
Halflife271.8 d293. d4.02 d60.14 d6.90 d78.2 h10.52 y33.0 h144.4 d432.2 y340. d32.02 d1.92 y13.16 d114.5 d241.6 d46.27 h30.5 h6.90 d27.0 d64.1 h63.6 h10.52 y8.04 d
1200. y26.8 h10.52 y5.24 d2.96 d81.6 h128.6 d114.5 d4.68 y27.0 d72.3 d462.6 d10.98 d61.92 h61.92 h•5/11 a A
Energy2(keV)122.198.974.6228.3356.0293.3
177.21048.11221.497.4103.2460.548.9312.0
1093.7356.0364.5711.71379.3356.0538.9
1221.4105.3312.0879.4
531.0184.6184.6m3 •>
Energy 3(keV)136.5129.8_____
302.9
198.0818.51189.1103.2138.9340.6
1387.2302.9284.3184.1
302.9409.5
1189.1340.6298.6
319.493.391.3ÄQ 7
Energy4(keV)——————_____
383.9
307.7340.6100.1
280.4300.2
1466.0383.9637.0810.3
383.9359.9
100.1300.2966.2
228
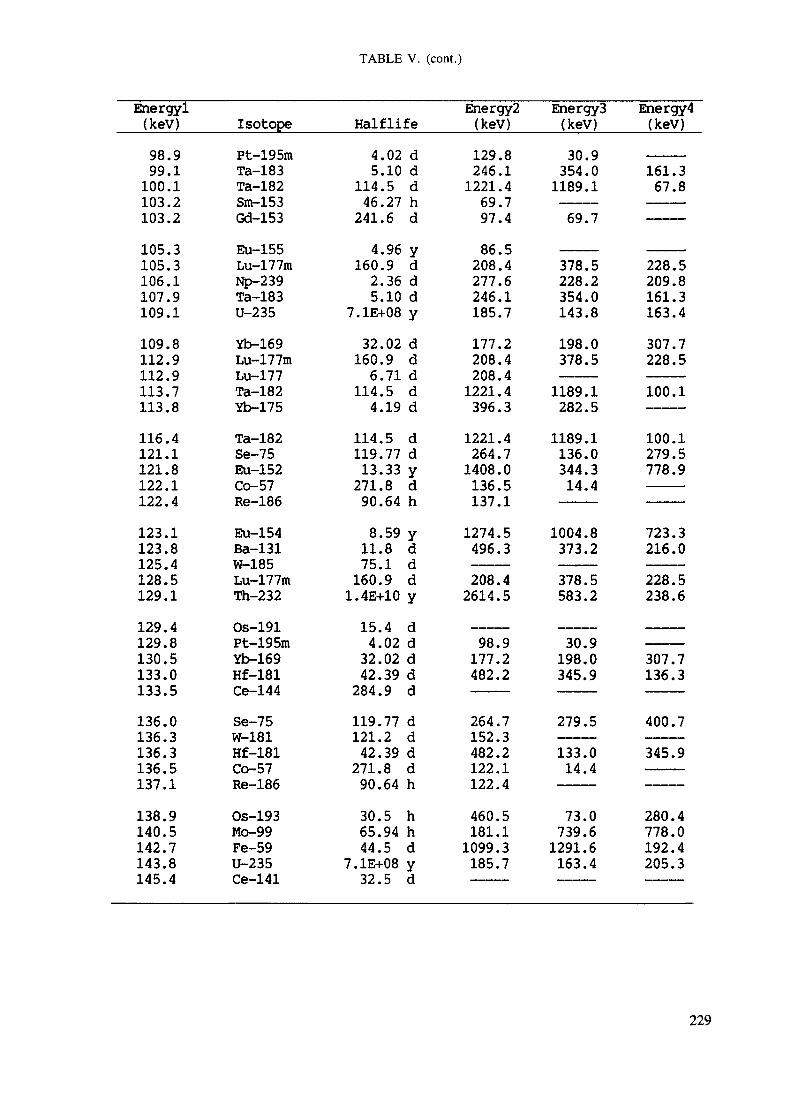
TABLE V. (cont.)
Energyl(kev)98.999.1100.1103.2103.2105.3105.3106.1107.9109.1109.8112.9112.9113.7113.8116.4121.1121.8122.1122.4123.1123.8125.4128.5129.1129.4129.8130.5133.0133.5136.0136.3136.3136.5137.1138.9140.5142.7143.81/1 e; A
Isotopep4- 1OCm
Ta-183Ta-182Sro-153Gd-153Eu 155Lu-177mNp-239Ta-183U-235Yb-169Lu-177mLu-177Ta-182Yb-175Ta-182Se-75Eu-152Co-57Re-186Eu-154Ba-131W-185Lu-177mTh-232Os-191Pt-195mYb-169Hf-181TP 144V*w J.1 •*
Se-75W-181Hf-181Co-57Re-186Os-193Mo-99Fe-59U-235r-o 1/11
Half life4.02 d5.10 d
114.5 d46.27 h241.6 d4.96 y
160.9 d2.36 d5.10 d
7.1E+08 y32.02 d160.9 d6.71 d
114.5 d4.19 d
114.5 d119.77 d13.33 y271.8 d90.64 h8.59 y11.8 d75.1 d160.9 d1.4E+10 y15.4 d4.02 d32.02 d42.39 d284.9 d119.77 d121.2 d42.39 d271.8 d90.64 h30.5 h65.94 h44.5 d
7.1E+08 y•?•? R A
Energy2(kev)129.8246.11221.469.797.486.5208.4277.6246.1185.7177.2208.4208.41221.4396.31221.4264.71408.0136.5137.11274.5496.3208.42614.5
98.9177.2482.2
264.7152.3482.2122.1122.4460.5181.11099.3185.7
Energy 3(keV)30.9354.01189.169.7
378.5228.2354.0143.8198.0378.51189.1282.51189.1136.0344.314.4
1004.8373.2378.5583.2
30.9198.0345.9
279.5133.014.4
73.0739.61291.6163.4
Energy 4(keV)
161.367.8———
228.5209.8161.3163.4307.7228.5100.1
100.1279.5778.9
723.3216.0228.5238.6
307.7136.3
400.7345.9
280.4778.0192.4205.3
229
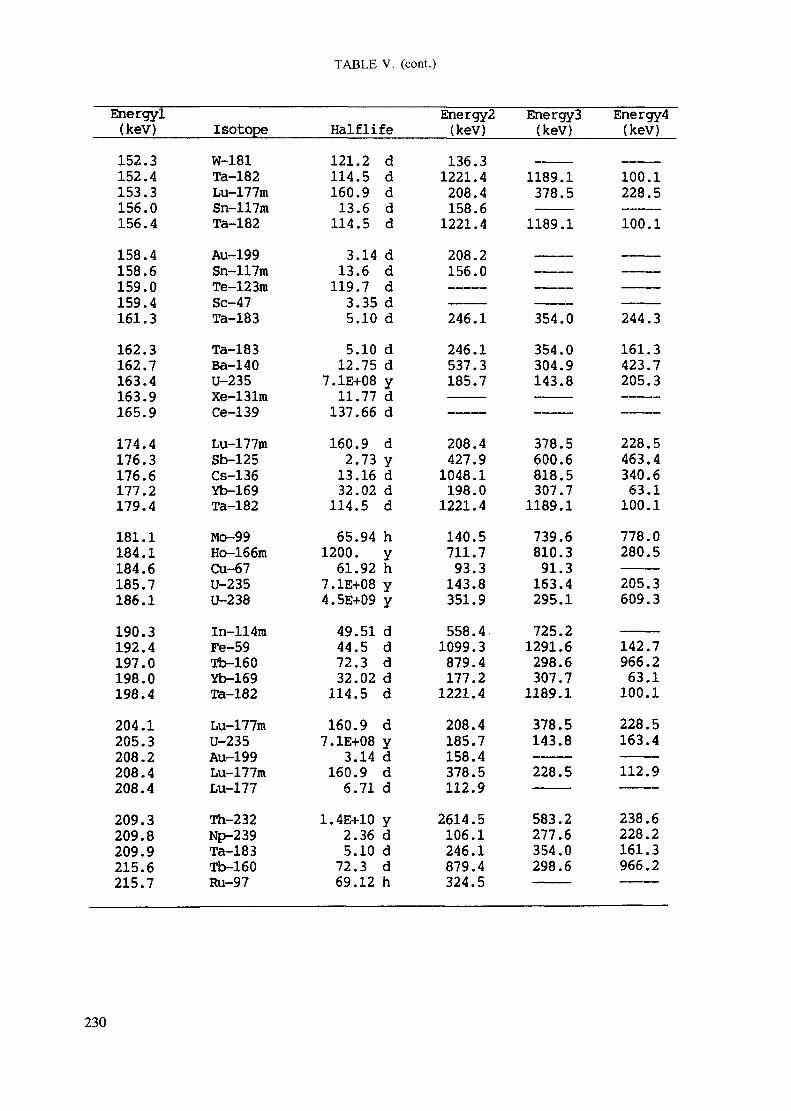
TABLE V. (cont.)
Energyl(keV)152.3152.4153.3156.0156.4158.4158.6159.01 RQ d±+jy • *»161.3162.3162.7163.4163.9165.9174.4176.3176.6177.2179.4181.1184.1184.6185.7186.1190.3192.4197.0198.0198.4204.1205.3208.2208.4208.4209.3209.8209.9215.6215.7
IsotopeW-181Ta-182Lu-177mSn-117mTa-182Au-199Sn-117mTe-123mSc-47Ta-183Ta-183Ba-140U-235Xe-131mCe-139Lu-177mSb-125Cs-136Yb-169Ta-182Mo-99Ho-166mCu-67U-235U-238In-114raFe-59Tb-160Yb-169Ta-182Lu-177mU-235Au-199Lu-177mLu-177Th-232Np-239Ta-183Tb-160Ru-97
Half life121.2 d114.5 d160.9 d13.6 d114.5 d3.14 d13.6 d119.7 d3.35 d5.10 d5.10 d12.75 d
7.1E+08 y11.77 d137.66 d160.9 d2.73 y13.16 d32.02 d114.5 d65.94 h
1200. y61.92 h
7.1E+08 y4.5E+09 y49.51 d44.5 d72.3 d32.02 d
114.5 d160.9 d7.1E+08 y
3.14 d160.9 d6.71 d
1.4E+10 y2.36 d5.10 d72.3 d69.12 h
Energy2(keV)136.31221.4208.41 CO £IDO.D1221.4208.2156.0
246.1246.1537.3185.7
208.4427.91048.1198.01221.4140.5711.793.3143.8351.9558.4.1099.3879.4177.21221.4208.4185.7158.4378.5112.92614.5106.1246.1879.4324.5
Energy 3(keV)
1189.1378.51189.1
354.0354.0304.9143.8
378.5600.6818.5307.71189.1739.6810.391.3163.4295.1725.21291.6298.6307.71189.1378.5143.8———228.5
583.2277.6354.0298.6———
Energy 4(keV)
100.1228.5100.1
244.3161.3423.7205.3
228.5463.4340.663.1100.1778.0280.5205.3609.3———142.7966.263.1100.1228.5163.4———112.9
238.6228.2161.3966.2———
230
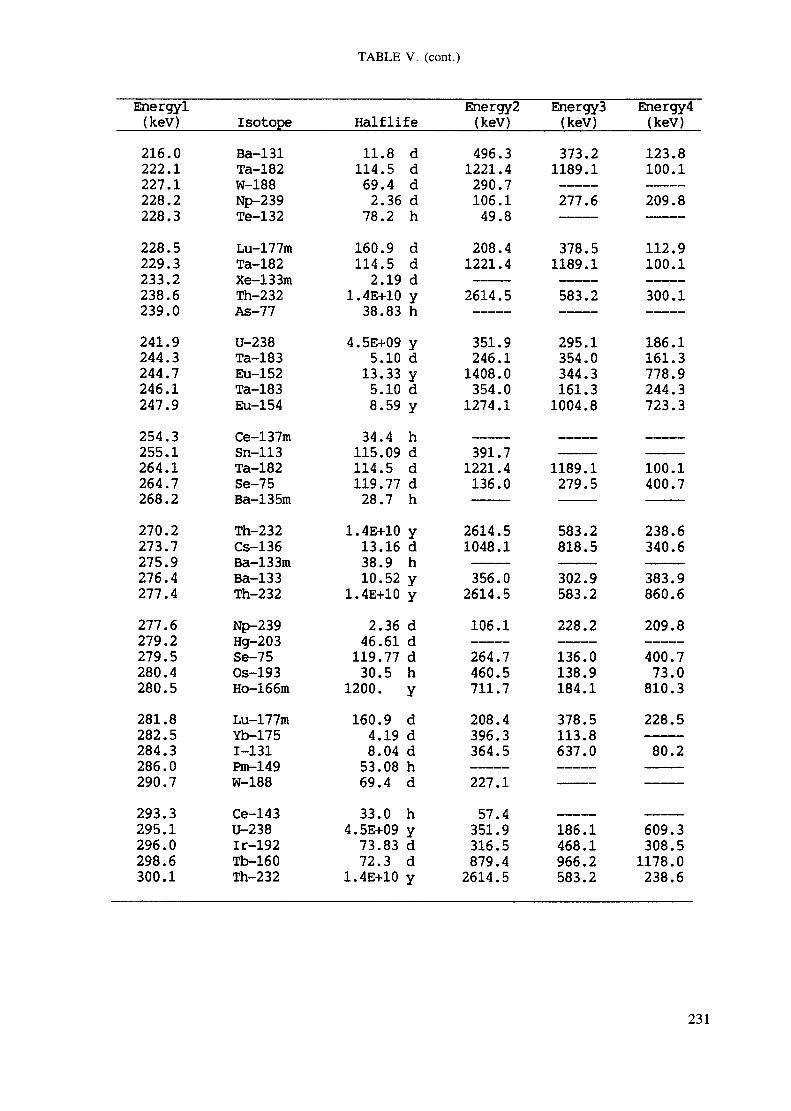
TABLE V. (cont.)
Energyl(kev)216.0222.1227.1228.2228.3228.5229.3233.2238.6239.0241.9244.3244.7246.1247.9254.3255.1264.1264.7268.2270.2273.7275.9276.4277.4277.6279.2279.5280.4280.5281.8282.5284.3286.0290.7293.3295.1296.0298.6300.1
IsotopeBa-131Ta-182W-188N£ 239Te-132Lu-177mTa-182Xe-133mTh-232A«; 77* \O / /
U-238Ta-183Eu-152Ta-183Eu-154Ce-137mSn-113Ta-182Se-75Ba-135mTh-232Cs-136Ba-133mBa-133Th-232Np-239Hg-203Se-75Os-193Ho-166mLu-177mYb-1751-131Pm-149W-188Ce-143U-238Ir-192Tb-160Th-232
Halflife11.8 d
114.5 d69.4 d2.36 d
78.2 h160.9 d114.5 d
2.19 d1.4E+10 y38.83 h
4.5E+09 y5.10 d
13.33 y5.10 d8.59 y
34.4 h115.09 d114.5 d119.77 d28.7 h
1.4E+10 y13.16 d38.9 h10.52 y
1.4E+10 y2.36 d
46.61 d119.77 d30.5 h
1200. y160.9 d
4.19 d8.04 d53.08 h69.4 d33.0 h
4.5E+09 y73.83 d72.3 d
1.4E+10 y
Energy 2(kev)496.31221.4290.7106.149.8208.41221.42614.5
351.9246.11408.0354.01274.1
391.71221.4136.0
2614.51048.1356.02614.5106.1264.7460.5711.7208.4396.3364.5227.157.4
351.9316.5879.42614.5
Energy 3(kev)373.21189.1277.6
378.51189.1583.2
295.1354.0344.3161.31004.8
1189.1279.5
583.2818.5302.9583.2228.2136.0138.9184.1378.5113.8637.0
186.1468.1966.2583.2
Energy 4(keV)123.8100.1209.8
112.9100.1300.1
186.1161.3778.9244.3723.3
100.1400.7
238.6340.6383.9860.6209.8400.773.0
810.3228.580.2
609.3308.51178.0238.6
231
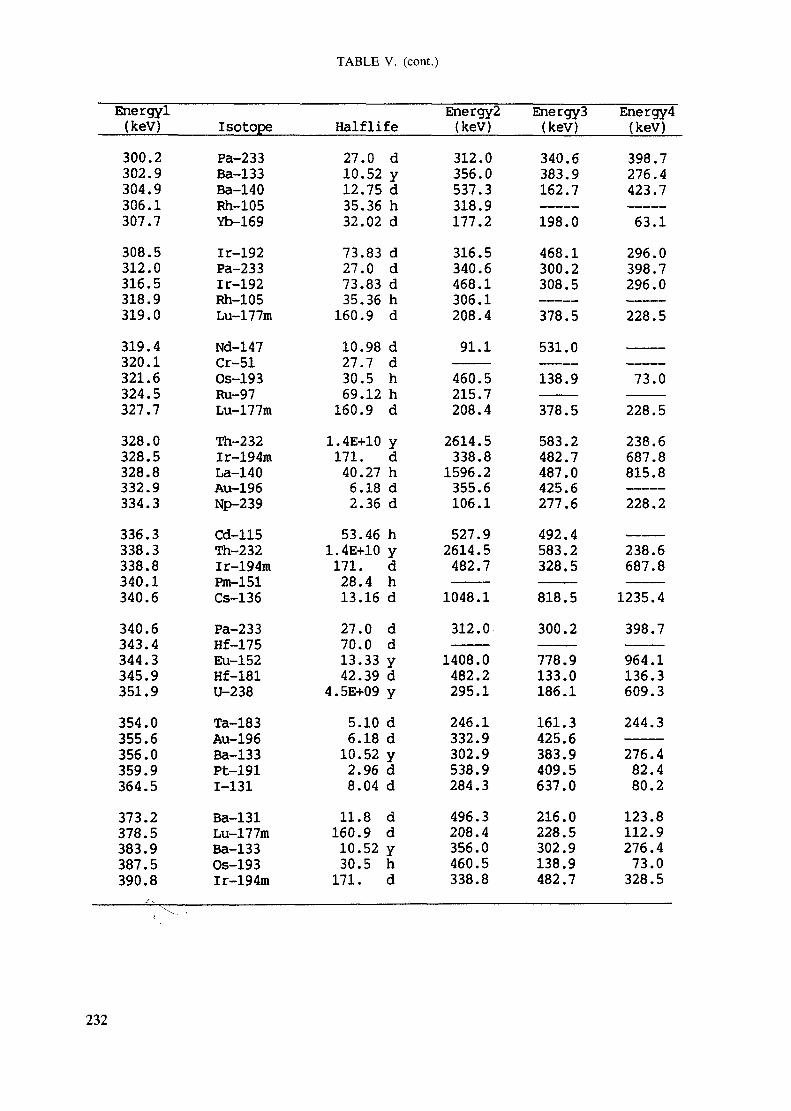
TABLE V. (cont.)
Energyl(keV)
300.2302.9304.9306.1307.7
308.5312.0316.5318.9319.0
319.4320.1321.6324.5327.7
328.0328.5328.8332.9334.3
336.3338.3338.8340.1340.6
340.6343.4344.3345.9351.9
354.0355.6356.0359.9364.5
373.2378.5383.9387.5390.8
Isotope
Pa-233Ba-133Ba-140Rh-105Yb-169
Ir-192Pa-233lr-192Rh 105Lu-177m
Nrî 1 47Cr-51Os-193Ru-97Lu-177m
Th-232Ir-194mLa-140Au-196Np-239
Cd-115Th-232Ir-194mPm-151Cs-136
Pa-233Hf 1 7^n L j. /oEu-152Hf-181U-238
Ta-183Au-196Ba-133Pt-1911-131
Ba-131Lu-177mBa-133Os-193Ir-194m
Halflife
27.0 d10.52 y12.75 d35.36 h32.02 d
73.83 d27.0 d73.83 d35.36 h
160.9 d
10.98 d27.7 d30.5 h69.12 h
160.9 d
1.4E+10 y171. d
40.27 h6.18 d2.36 d
53.46 h1.4E+10 y171. d28.4 h13.16 d
27.0 d70.0 d13.33 y42.39 d
4.5E+09 y
5.10 d6.18 d
10.52 y2.96 d8.04 d
11.8 d160.9 d10.52 y30.5 h
171. d
Energy2(keV)
312.0356.0537.3318.9177.2
316.5340.6468.1306.1208.4
91.1
460.5215.7208.4
2614.5338.8
1596.2355.6106.1
527.92614.5
482.7
1048.1
312.0
1408.0482.2295.1
246.1332.9302.9538.9284.3
496.3208.4356.0460.5338.8
EnergyS(keV)
340.6383.9162.7
198.0
468.1300.2308.5
378.5
531.0
138.9
378.5
583.2482.7487.0425.6277.6
492.4583.2328.5
818.5
300.2
778.9133.0186.1
161.3425.6383.9409.5637.0
216.0228.5302.9138.9482.7
Energy4(keV)
398.7276.4423.7
63.1
296.0398.7296.0
228.5
73.0
228.5
238.6687.8815.8
228.2
238.6687.8
1235.4
398.7
964.1136.3609.3
244.3
276.482.480.2
123.8112.9276.473.0
328.5
232
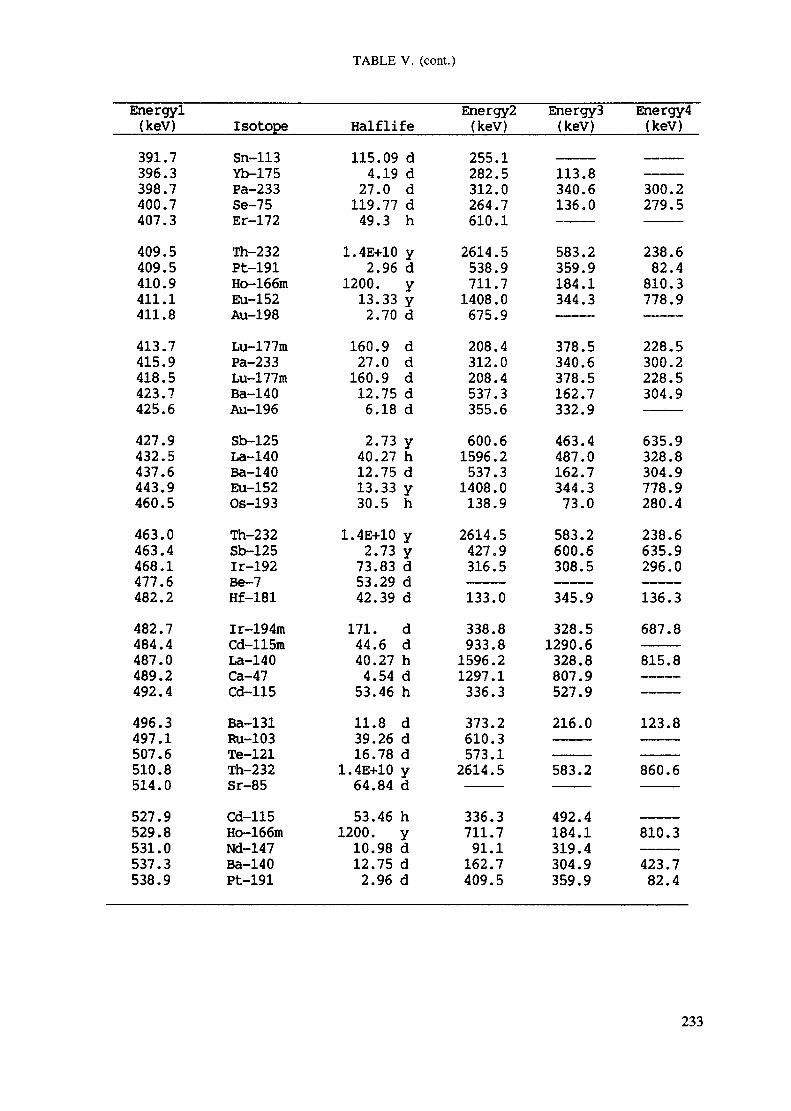
TABLE V. (cont.)
Energyl(keV)m 7« /396.3398.7400.7407.3409.5409.5410.9411.1411.8413.7415.9418.5423.7425.6427.9432.5437.6443.9460.5463.0463.4468.1477.6482.2482.7484.4487.0AOQ •}4o:7.<6492.4496.3497.1507.6510.8514.0527.9529.8531.0537.3538.9
IsotopeSn-113Yb-175Pa-233Se-75T?r- 1 T)CiL— J. /Z
Th-232Pt-191Ho-166mEu-152Au-198Lu-177mPa-233Lu-177raBa-140Au-196Sb-125La-140Ba-140Eu-152Os-193Th-232Sb-125Ir-192Be-7Hf-181lr-194mCd-115mLa-140fa A~ld ** tCd-115Ba-131Ru-103Te-121Th-232Or QCor— ÖD
Cd-115Ho-166mNd-147Ba-140Pt-191
Half life115.09 d
4.19 d27.0 d119.77 d49.3 h
1.4E+10 y2.96 d
1200. y13.33 y2.70 d
160.9 d27.0 d
160.9 d12.75 d6.18 d2.73 y40.27 h12.75 d13.33 y30.5 h
1.4E+10 y2.73 y73.83 d53.29 d42.39 d
171. d44.6 d40.27 h4 54 d•* • •*/** VI53.46 h11.8 d39.26 d16.78 d
1.4E+10 yfia 84 dVI * O1 U
53.46 h1200. y
1 n QQ Jlu.yö a12.75 d2.96 d
Energy2(keV)^RÇ 1£fJ-J • X
282.5312.0264.7610.12614.5538.9711.71408.0675.9208.4312.0208.4537.3355.6600.61596.2537.31408.0138.92614.5427.9316.5133.0338.8933.81596.21297.1336.3373.2610.3573.12614.5
336.3711.791 1JA • X
162.7409.5
Energy 3(keV)
113.8340.6136.0
583.2359.9184.1344.3
378.5340.6378.5162.7332.9463.4487.0162.7344.373.0583.2600.6308.5345.9328.51290.6328.8om ûou / .y527.9216.0———583.2
492.4184.131Q 4*JA7 • *i
304.9359.9
Energy4(keV)
300.2279.5
238.682.4
810.3778.9
228.5300.2228.5304.9
635.9328.8304.9778.9280.4238.6635.9296.0136.3687.8———815.8———123.8———860.6
810.3423.782.4
233
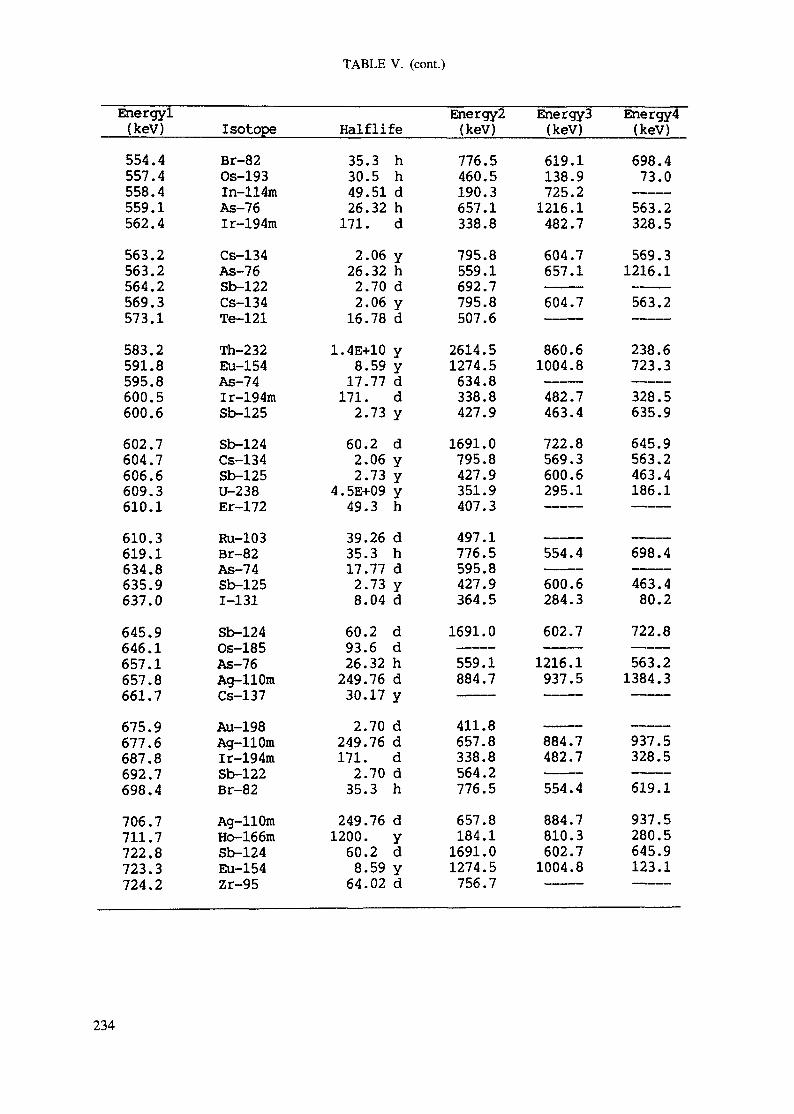
TABLE V. (cont.)
Energyl(keV)554.4557.4558.4559.1562.4563.2563.2564.2569.3573.1583.2591.8595.8600.5600.6602.7604.7606.6609.3610.1610.3619.1634.8635.9637.0645.9646.1657.1657.8661.7675.9677.6687.8692.7698.4706.7711.7722.8723.3724.2
IsotopeBr-82Os-193In-114mAs-76Ir-194mCs-134As-76Sb-122Cs-134Te-121Th-232Eu-154As-74Ir-194mSb-125Sb-124Cs-134Sb-125U-238Er-172Ru-103Br-82As-74Sb-1251-131Sb-124Os-185As-76Ag-110mCs-137Au-198Ag-110mlr-194raSb-122Br-82Ag-110mHo-166mSb-124Eu-154Zr-95
Halflife35.3 h30.5 h49.51 d26.32 h171. d2.06 y26.32 h2.70 d2.06 y16.78 d
1.4E+10 y8.59 y17.77 d171. d2.73 y60.2 d2.06 y2.73 y
4.5E+09 y49.3 h39.26 d35.3 h17.77 d2.73 y8.04 d60.2 d93.6 d26.32 h249.76 d30.17 y2.70 d
249.76 d171. d2.70 d
35.3 h249.76 d1200. y60.2 d8.59 y64.02 d
Energy2(keV)776.5460.5190.3657.1338.8795.8559.1692.7795.8507.62614.51274.5634.8338.8427.91691.0795.8427.9351.9407.3497.1776.5595.8427.9364.51691.0559.1884.7
411.8657.8338.8564.2776.5657.8184.11691.01274.5756.7
EnergyS(keV)619.1138.9725.21216.1482.7604.7657.1———604.7———860.61004.8482.7463.4722.8569.3600.6295.1
- ____ — —
554.4600.6284.3602.71216.1937.5
884.7482.7554.4884.7810.3602.71004.8———
Energy4(keV)698.473.0563.2328.5569.31216.1———563.2———238.6723.3328.5635.9645.9563.2463.4186.1
„___ __
698.4463.480.2722.8563.21384.3
937.5328.5619.1937.5280.5645.9123.1———
234
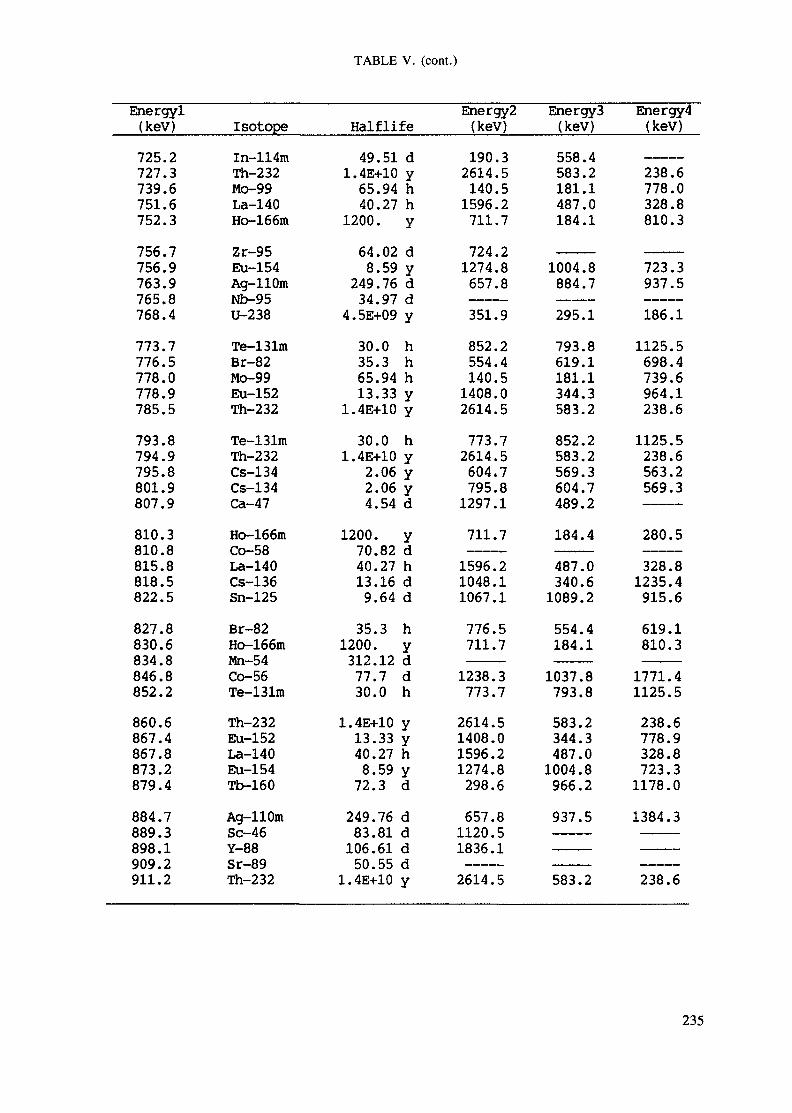
TABLE V. (cont.)
Energyl(keV)725.2727.3739.6751.6752.3756.7756.9763.9765.8768.4773.7776.5778.0778.9785.5793.8794.9795.8801.9807.9810.3810.8815.8818.5822.5827.8830.6834.8846.8852.2860.6867.4867.8873.2879.4884.7889.3OQQ 1O:7O.l909.2911.2
Isotopeln-114mTh-232Mo-99La-140Ho-166mZr-95Eu-154Ag-110mNb-95U-238Te-131mBr-82Mo-99Eu-152Th-232Te-131mTh-232Cs-134Cs-134Ca-47Ho-166mCo-58La-140Cs-136Sn-125Br-82Ho-166mMn-54Co-56Te-131mTh-232Eu-152La-140Eu-154Tb-160Ag-110mSc-46Y QO— OÖSr-89Th-232
Halflife49.51 d
1.4E+10 y65.94 h40.27 h
1200. y64.02 d8.59 y
249.76 d34.97 d
4.5E+09 y30.0 h35.3 h65.94 h13.33 y
1.4E+10 y30.0 h
1.4E+10 y2.06 y2.06 y4.54 d
1200. y70.82 d40.27 h13.16 d9.64 d35.3 h
1200. yO1 *} 1O «3312.12 a77.7 d30.0 h
1.4E+10 y13.33 y40.27 h8.59 y72.3 d249.76 d83.81 d106.61 d50.55 d
1.4E+10 y
Energy2(keV)190.32614.5140.51596.2711.7724.21274.8657.8351.9852.2554.4140.51408.02614.5773.72614.5604.7795.81297.1711.71596.21048.11067.1776.5711.71238.3773.72614.51408.01596.21274.8298.6657.81120.51 QIC. 11ÖJD. 1
2614.5
Energy 3(keV)558.4583.2181.1487.0184.1
1004.8884.7295.1793.8619.1181.1344.3583.2852.2583.2569.3604.7489.2184.4487.0340.61089.2554.4184.11037.8793.8583.2344.3487.01004.8966.2937.5
583.2
Energy 4(keV)
| ..._
238.6778.0328.8810.3
723.3937.5186.11125.5698.4739.6964.1238.61125.5238.6563.2569.3
280.5328.81235.4915.6619.1810.31771.41125.5238.6778.9328.8723.31178.01384.3
238.6
235
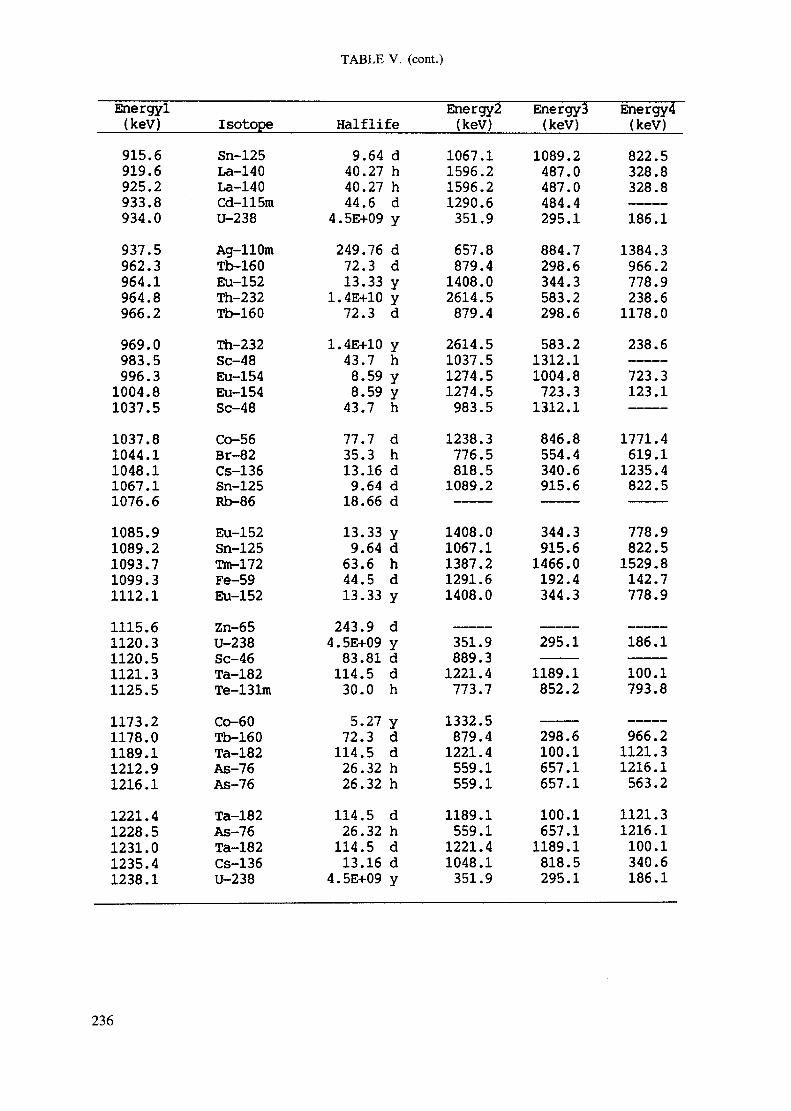
TABLE V. (cont.)
Energyl(kev)915.6919.6925.2Q"3"3 Qyjj ,o934.0937.5962.3964.1964.8966.2969.0983.5996.31004.81037.51037.81044.11048.11067.11076.61085.91089.21093.71099.31112.11115.61120.31120.51121.31125.51173.21178.01189.11212.91216.11221.41228.51231.01235.41238.1
IsotopeSn-125La-140La-140Cd-115mU-238Ag-110mTb-160Eu-152Th-232Tb-160Th-232Sc-48Eu-154Eu-154Sc-48Co-56Br-82Cs-136Sn-125Rb-86Eu-152Sn-125Tm-172Fe-59Eu-152Zn-65U-238Sc-46Ta-182Te-131mCo-60Tb-160Ta-182As-76As-76Ta-182As-76Ta-182Cs-136U-238
Halflife9.64 d40.27 h40.27 h44 fi r\t** » U U
4.5E+09 y249.76 d72.3 d13.33 y
1.4E+10 y72.3 d
1.4E+10 y43.7 h8.59 y8.59 y43.7 h77.7 d35.3 h13.16 d9.64 d18.66 d13.33 y9.64 d63.6 h44.5 d13.33 y243.9 d4.5E+09 y83.81 d114.5 d30.0 h5.27 y72.3 d114.5 d26.32 h26.32 h114.5 d26.32 h114.5 d13.16 d
4.5E+09 y
Energy2(keV)1067.11596.21596.21290.6351.9657.8879.41408.02614.5879.42614.51037.51274.51274.5983.51238.3776.5818.51089.2
1408.01067.11387.21291.61408.0
351.9889.31221.4773.71332.5879.41221.4559.1559.11189.1559.11221.41048.1351.9
Energy 3(keV)1089.2487.0487.0484 41U1 • 1
295.1884.7298.6344.3583.2298.6583.21312.11004.8723.31312.1846.8554.4340.6915.6
344.3915.61466.0192.4344.3
295.11189.1852.2
298.6100.1657.1657.1100.1657.11189.1818.5295.1
Energy 4(keV)822.5328.8328.8186.11384.3966.2778.9238.61178.0238.6723.3123.1
1771.4619.11235.4822.5
778.9822.51529.8142.7778.9
186.1100.1793.8
966.21121.31216.1563.21121.31216.1100.1340.6186.1
236
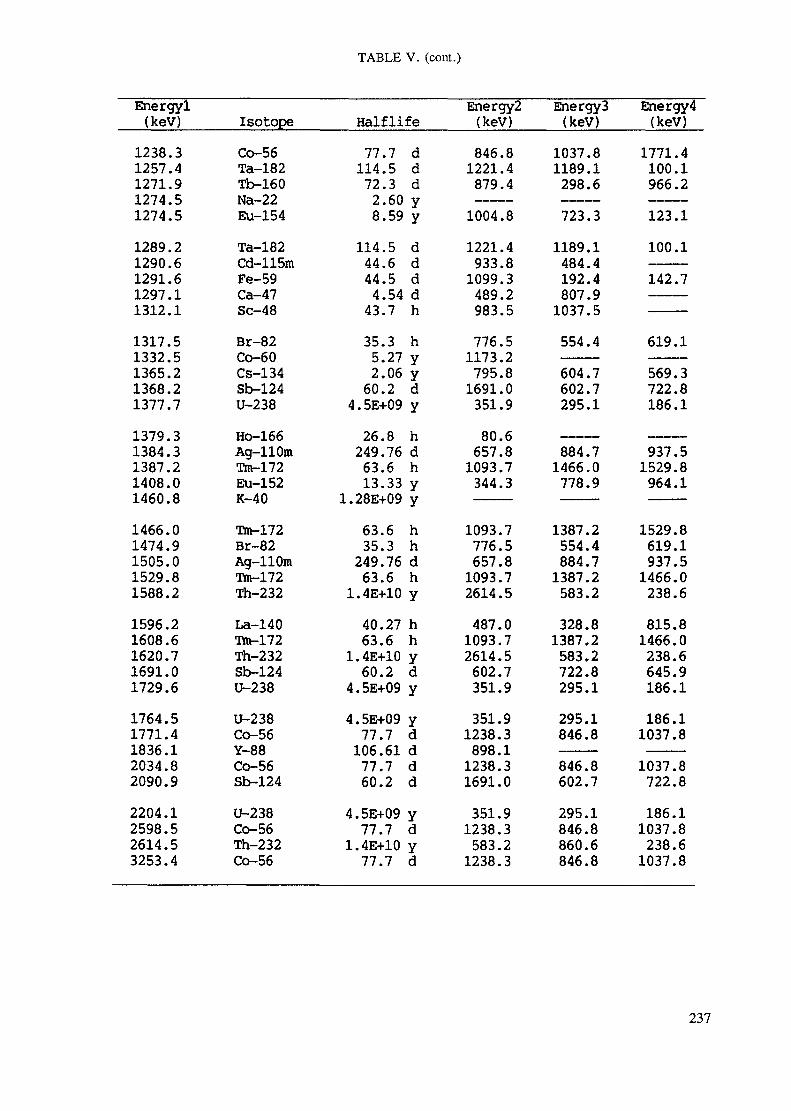
TABLE V. (cont.)
Energyl(keV)
1238.31257.41271.91274.51274.5
1289.21290.61291.61297.11312.1
1317.51332.51365.21368.21377.7
1379.31384.31387.21408.01460.8
1466.01474.91505.01529.81588.2
1596.21608.61620.71691.01729.6
1764.51771.41836.12034.82090.9
2204.12598.52614.53253.4
Isotope
Co-56Ta-182Tb-160Na-22Eu-154
Ta-182Cd-115mFe-59Ca-47Sc-48
Br-82Co-60Cs-134Sb-124U-238
Ho-166Ag-110mTm-172Eu-152K-40
Tro-172Br-82Ag-110raTm-172Th-232
La-140Tm-172Th-232Sb-124U-238
U-238Co-56Y-88Co-56Sb-124
U-238Co-56Th-232Co-56
Halflife
77.7 d114.5 d
72.3 d2.60 y8.59 y
114.5 d44.6 d44.5 d
4.54 d43.7 h
35.3 h5.27 y2.06 y
60.2 d4.5E+09 y
26.8 h249.76 d
63.6 h13.33 y
1.28E+09 y
63.6 h35.3 h
249.76 d63.6 h
1.4E+10 y
40.27 h63.6 h
1.4E+10 y60.2 d
4.5E+09 y
4.5E+09 y77.7 d
106.61 d77.7 d60.2 d
4.5E+09 y77.7 d
1.4E+10 y77.7 d
Energy2(keV)
846.81221.4879.4
1004.8
1221.4933.8
1099.3489.2983.5
776.51173.2795.8
1691.0351.9
80.6657.8
1093.7344.3
1093.7776.5657.8
1093.72614.5
487.01093.72614.5602.7351.9
351.91238.3898.1
1238.31691.0
351.91238.3583.2
1238.3
EnergyS(keV)
1037.81189.1298.6
723.3
1189.1484.4192.4807.9
1037.5
554.4
604.7602.7295.1
884.71466.0778.9
1387.2554.4884.7
1387.2583.2
328.81387.2583.2722.8295.1
295.1846.8———846.8602.7
295.1846.8860.6846.8
Energy 4(keV)
1771.4100.1966.2
123.1
100.1———142.7
———
619.1
569.3722.8186.1
937.51529.8
964.1
1529.8619.1937.5
1466.0238.6
815.81466.0238.6645.9186.1
186.11037.8
———1037.8722.8
186.11037.8238.6
1037.8
237
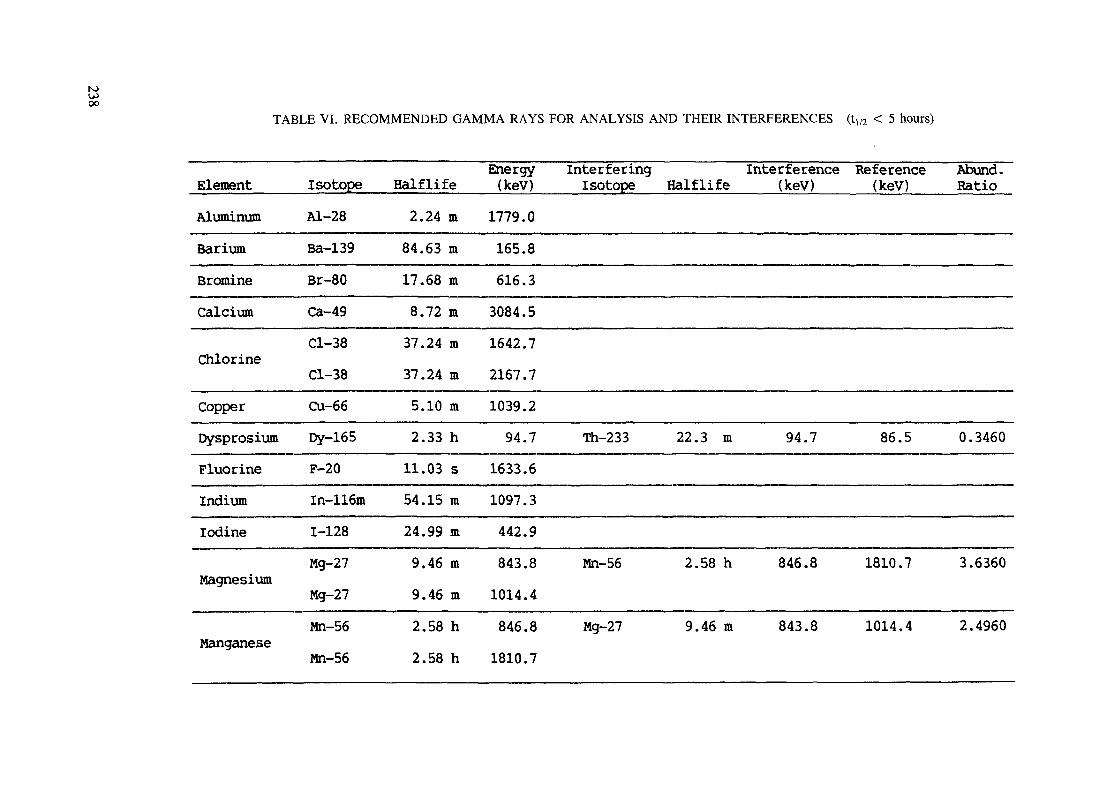
N»oo
TABLE VI. RECOMMENDED GAMMA RAYS FOR ANALYSIS AND THEIR INTERFERENCES (tU2 < 5 hours)
ElementAluminumBariumBromineCalcium
Chlorine
CopperDysprosiumFluorineIndiumIodine
Magnesium
Manganese
isotopeAl-28Ba-139Br-80Ca-49Cl-38Cl-38Cu-66Dy-165F-20In-116m1-128Mg-27Mg-27Mn-56Mn-56
Halflife2.24 m84.63 m17.68 m8.72 m37.24 m37.24 m5.10 m2.33 h
11.03 s54.15 m24.99 m9.46 m9.46 m2.58 h2.58 h
Energy Interfering Interference Reference(kev) Isotope Halflife (keV) (keV)1779.0165.8616.33084.51642.72167.71039.2
94.7 Th-233 22.3 m 94.7 86.51633.61097.3442.9843.8 Mn-56 2.58 h 846.8 1810.71014.4846.8 Mg-27 9.46 m 843.8 1014.41810.7
Abund.Ratio
0.3460
3.6360
2.4960
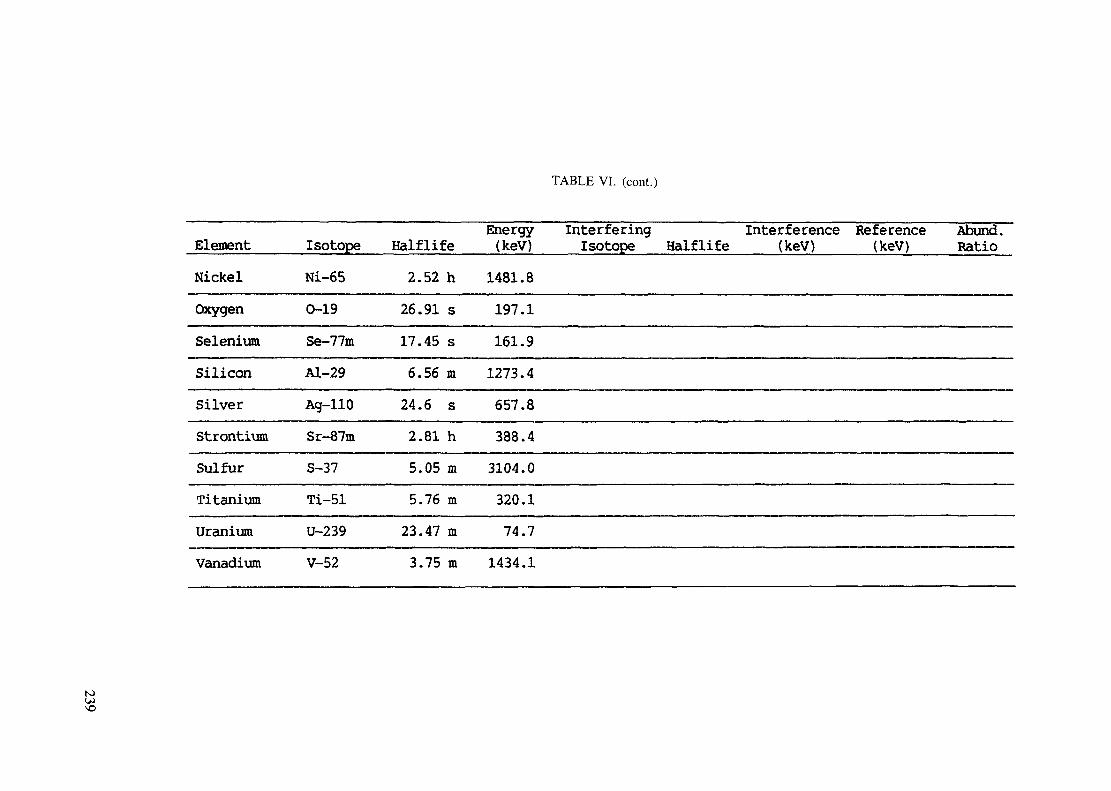
TABLE VI. (cont.)
ElementNickelOxygenSeleniumSiliconSilverStrontiumSulfurTitaniumuraniumVanadium
IsotopeNi-650-19Se-77mAl-29Ag-110Sr-87mS-37Ti-51U-239V-52
Halflife2.52 h26.91 s17.45 s6.56 m24.6 s2.81 h5.05 m5.76 m23.47 m3.75 m
Energy Interfering Interference Reference Abund.(keV) isotope Halflife (keV) (keV) Ratio1481.8197.1161.91273.4657.8388.43104.0320.174.7
1434.1
toOJ
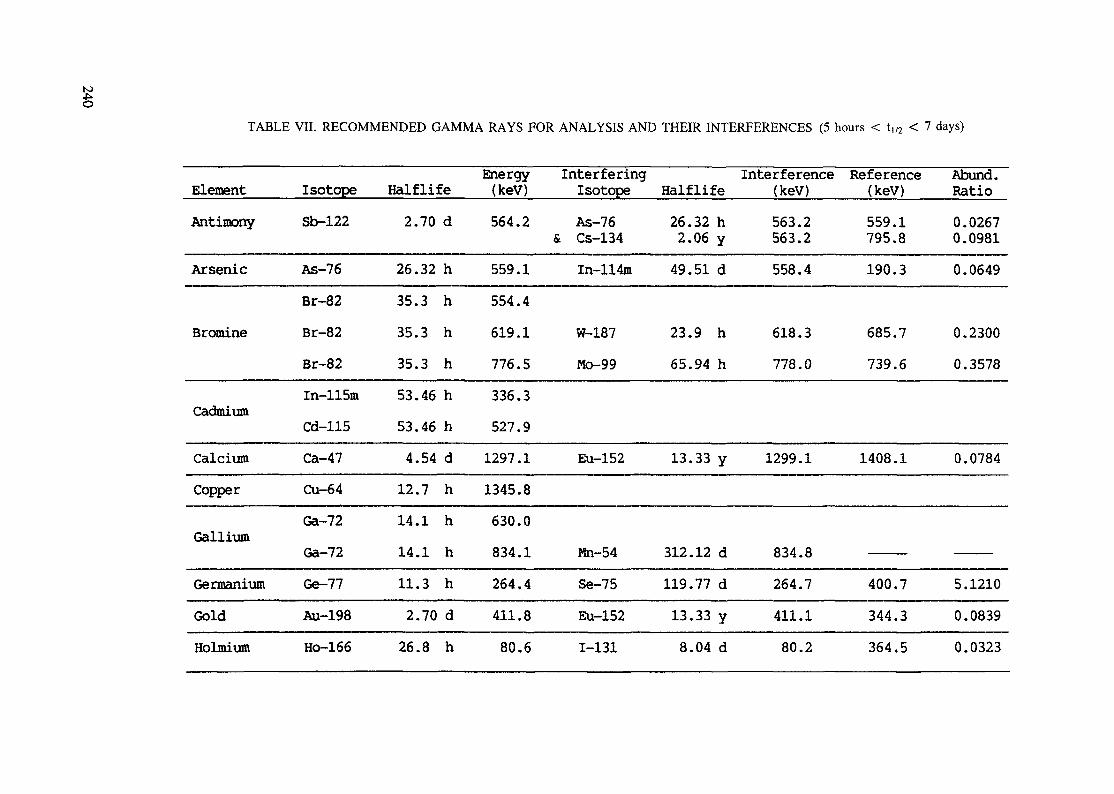
TABLE VII. RECOMMENDED GAMMA RAYS FOR ANALYSIS AND THEIR INTERFERENCES (5 hours < t,/2 < 7 days)
ElementAntimony
Arsenic
Bromine
Cadmium
CalciumCopper
Gallium
GermaniumGoldHolmium
IsotopeSb-122
As-76Br-82Br-82Br-82In-115mCd-115Ca-47Cu-64Ga-72Ga-72Ge-77Au-198Ho-166
Halflife2.70 d
26.32 h35.3 h35.3 h35.3 h53.46 h53.46 h4.54 d12.7 h14.1 h14.1 h11.3 h2.70 d
26.8 h
Energy(keV)564.2
559.1554.4619.1776.5336.3527.91297.11345.8630.0834.1264.4411.880.6
InterferingIsotopeAs-76
& Cs-134In-114m
W-187Mo-99
Eu-152
Mn-54Se-75Eu-1521-131
Halflife26.32 h2.06 y49.51 d
23.9 h65.94 h
13.33 y
312.12 d119.77 d13.33 y8.04 d
Interference(keV)563.2563.2558.4
618.3778.0
1299.1
834.8264.7411.180.2
Reference(keV)559.1795.8190.3
685.7739.6
1408.1
_^__»w_
400.7344.3364.5
Abund.Ratio0.02670.09810.0649
0.23000.3578
0.0784
5.12100.08390.0323
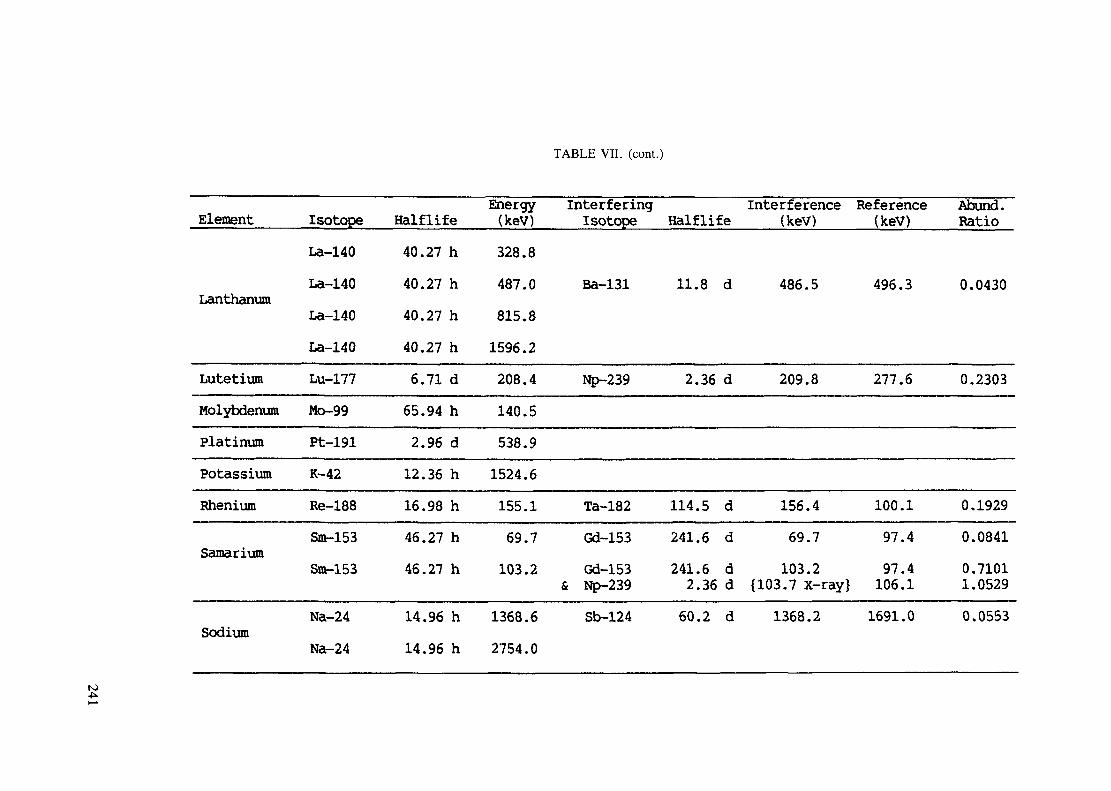
TABLE VII. (cont.)
Element
Lanthanum
LutetiumMolybdenumPlatinumPotassiumRhenium
Samarium
Sodium
IsotopeLa-140La-140La-140La-140Lu-177Mo-99Pt-191K-42Re-188Sm-153Sm-153
Na-24Na-24
Halflife40.27 h40.27 h40.27 h40.27 h6.71 d65.94 h2.96 d
12.36 h16.98 h46.27 h46.27 h
14.96 h14.96 h
Energy(kev)328.8487.0815.81596.2208.4140.5538.91524.6155.169.7
103.2
1368.62754.0
interferingIsotope
Ba-131
Np-239
Ta-182Gd-153Gd-153
& Np-239Sb-124
InterferenceHalflife (keV)
11.8 d 486.5
2.36 d 209.8
114.5 d 156.4241.6 d 69.7241.6 d 103.2
2.36 d {103.7 X-ray}60.2 d 1368.2
Reference(keV)
496.3
277.6
100.197.497.4106.11691.0
Abund.Ratio
0.0430
0.2303
0.19290.08410.71011.05290.0553
N)
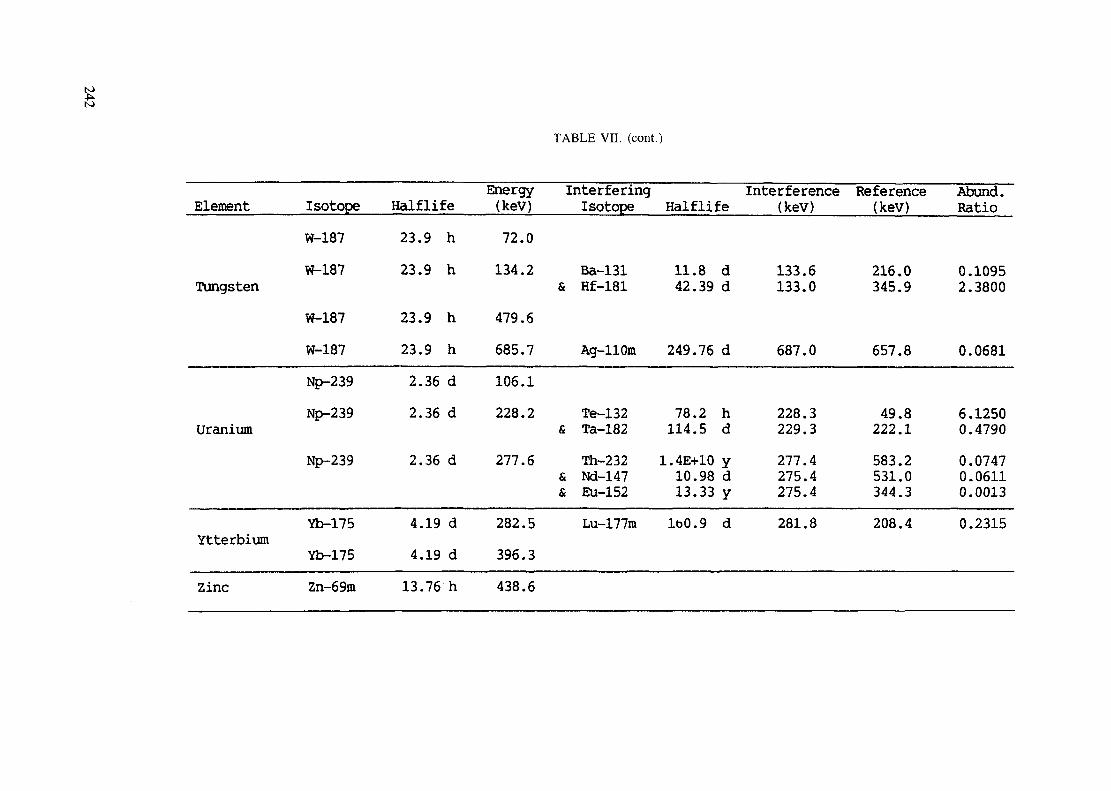
to
TABLE VII. (cont.)
Element
Tungsten
Uranium
Ytterbium
IsotopeW-187W-187
W-187W-187Np-239Np-239
Np-239
Yb-175Yb-175
Halflife23.9 h23.9 h
23.9 h23.9 h2.36 d2.36 d
2.36 d
4.19 d4.19 d
Energy(keV)72.0
134.2
479.6685.7106.1228.2
277.6
282.5396.3
Interfering InterferenceIsotope Halflife (keV)
Ba-131& Hf-181
Ag-110m
Te-132& Ta-182
Th-232& Nd-147& Eu-152
Lu-177m
11.8 d42.39 d
249.76 d
78.2 h114.5 d1.4E+10 y10.98 d13.33 yIo0.9 d
133.6133.0
687.0
228.3229.3277.4275.4275.4281.8
Reference(keV)
216.0345.9
657.8
49.8222.1583.2531.0344.3208.4
Abund.Ratio
0.10952.3800
0.0681
6.12500.47900.07470.06110.00130.2315
Zinc Zn-69m 13.76 h 438.6
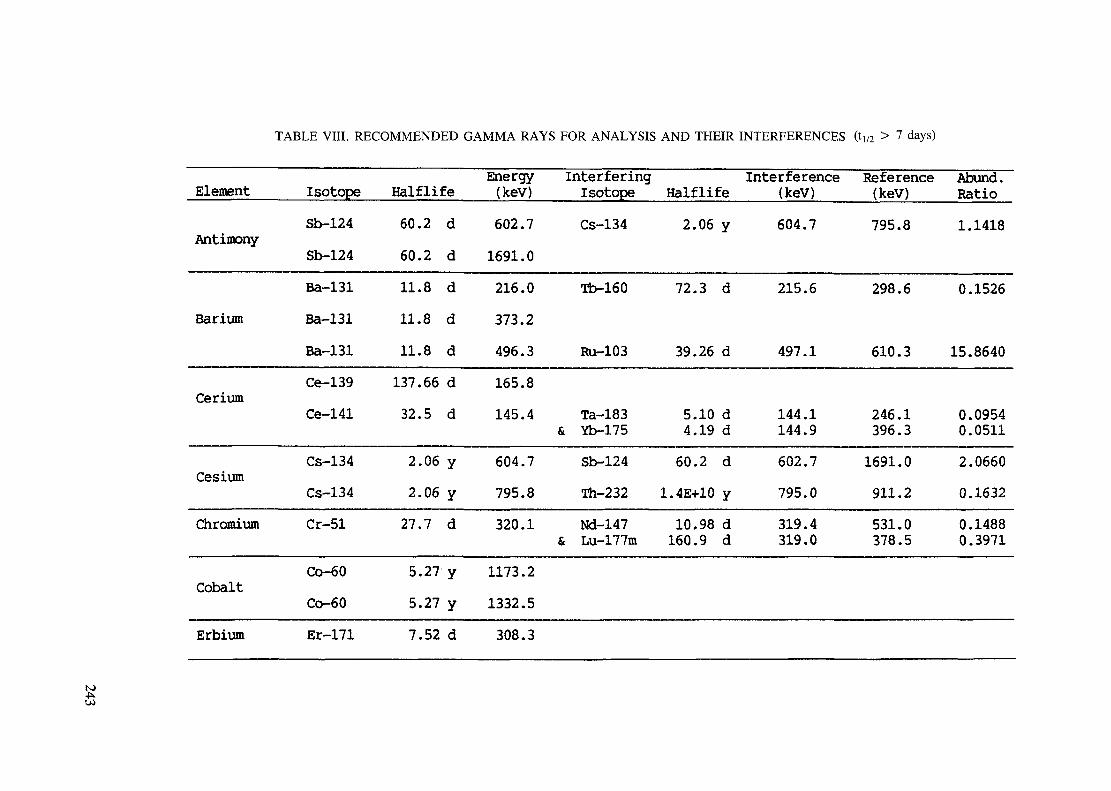
TABLE VIII. RECOMMENDED GAMMA RAYS FOR ANALYSIS AND THEIR INTERFERENCES (t,/2 > 7 days)
Element
Antimony
Barium
Cerium
Cesium
Chromium
Cobalt
IsotopeSb-124Sb-124Ba-131Ba-131Ba-131Ce-139Ce-141
Cs-134Cs-134Cr-51
Co-60Co-60
Halflife60.2 d60.2 d11.8 d11.8 d11.8 d137.66 d32.5 d
2.06 y2.06 y
27.7 d
5.27 y5.27 y
Energy(keV)602.71691.0216.0373.2496.3165.8145.4
604.7795.8320.1
1173.21332.5
Interfering Interferenceisotope Halflife (keV)Cs-134
Tb-160
Ru-103
Ta-183& Yb-175
Sb-124Th-232Nd-147
& Lu-177m
2.06 y
72.3 d
39.26 d
5.10 d4.19 d
60.2 d1.4E+10 y
10.98 d160.9 d
604.7
215.6
497.1
144.1144.9602.7795.0319.4319.0
Reference Abund.(keV) Ratio795.8
298.6
610.3
246.1396.31691.0911.2531.0378.5
1.1418
0.1526
15.8640
0.09540.05112.06600.16320.14880.3971
Erbium Er-171 7.52 d 308.3
K
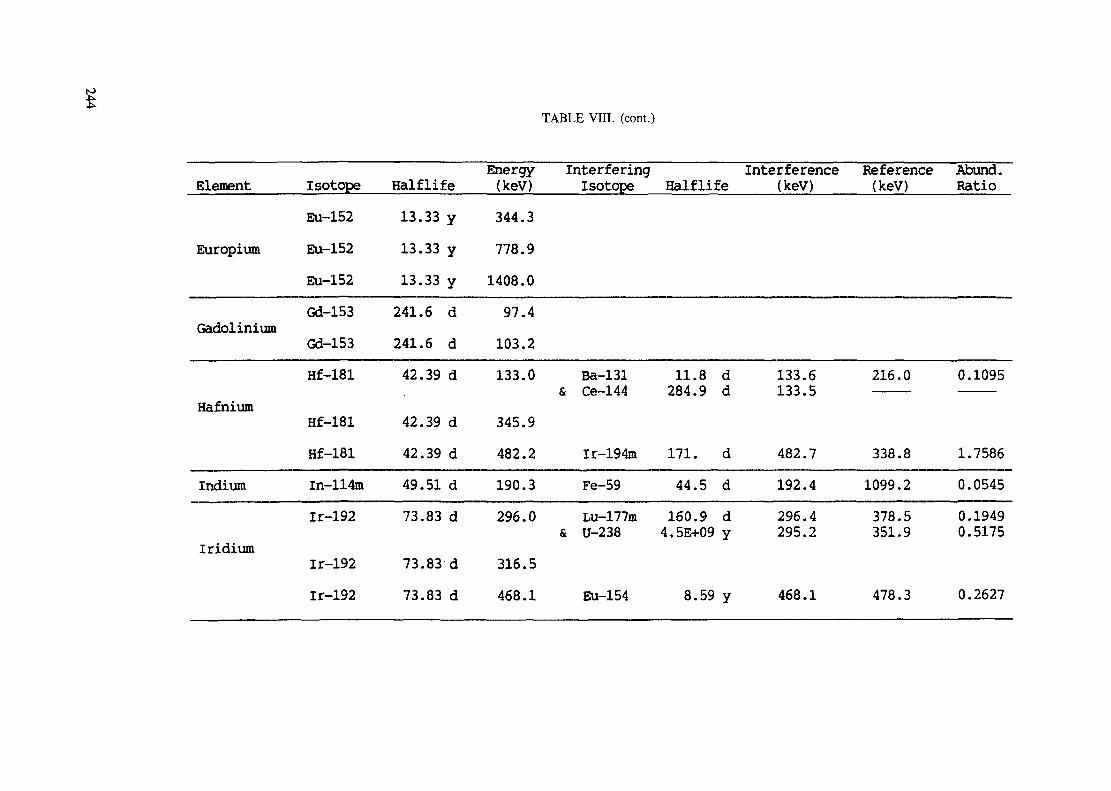
to
TABLE VIII. (cont.)
Element
Europium
Gadolinium
Hafnium
Indium
Iridium
IsotopeEu-152Eu-152Eu-152Gd-153Gd-153Hf-181
Hf-181Hf-181In-114mlr-192
lr-192lr-192
Halflife13.33 y13.33 y13.33 y241.6 d241.6 d42.39 d
42.39 d42.39 d49.51 d73.83 d
73.83 d73.83 d
Energy(keV)344.3778.91408.097.4103.2133.0
345.9482.2190.3296.0
316.5468.1
Interfering InterferenceIsotope Halflife (keV)
Ba-131& Ce-144
Ir-194mFe-59Lu-177m
& U-238
Eu-154
11.8 d284.9 d
171. d44.5 d160.9 d4.5E+09 y
8.59 y
133.6133.5
482.7192.4296.4295.2
468.1
Reference(keV)
216.0
338.81099.2378.5351.9
478.3
Abund.Ratio
0.1095
1.75860.05450.19490.5175
0.2627
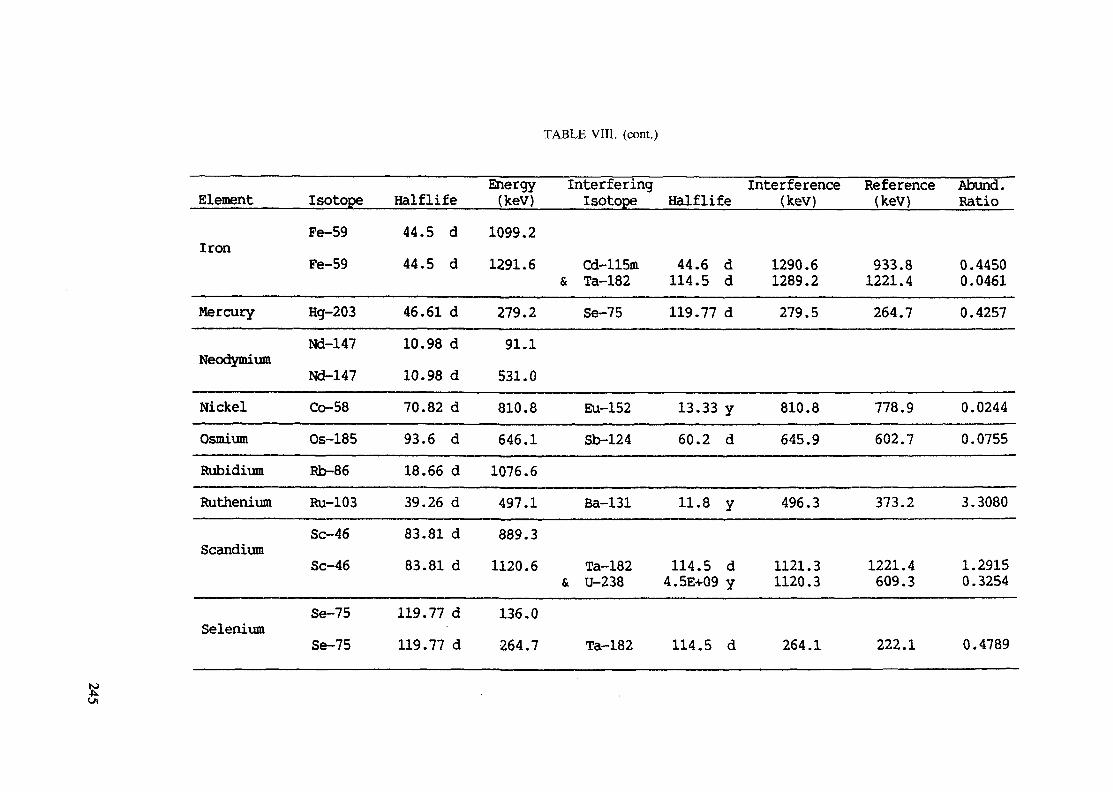
TABLE VIII. (cont.)
Element
Iron
Mercury
Neodymium
NickelOsmiumRubidiumRuthenium
Scandium
Selenium
IsotopePe-59Fe-59
Hg-203Nd-147Nd-147Co-58Os-185Rb-86Ru-103Sc-46Sc-46
Se-75Se-75
Halflife44.5 d44.5 d
46.61 d10.98 d10.98 d70.82 d93.6 d18.66 d39.26 d83.81 d83.81 d
119.77 d119.77 d
Energy(keV)1099.21291.6
279.291.1531.0810.8646.11076.6497.1889.31120.6
136.0264.7
Interfering Interferenceisotope Halflife (keV)
Cd-115m& Ta-182
Se-75
Eu-152Sb-124
Ba-131
Ta-182& U-238
Ta-182
44.6 d114.5 d119.77 d
13.33 y60.2 d
11.8 y
114.5 d4.5E+09 y
114.5 d
1290.61289.2279.5
810.8645.9
496.3
1121.31120.3
264.1
Reference(keV)
933.81221.4264.7
778.9602.7
373.2
1221.4609.3
222.1
Abund.Ratio
0.44500.04610.4257
0.02440.0755
3.3080
1.29150.3254
0.4789
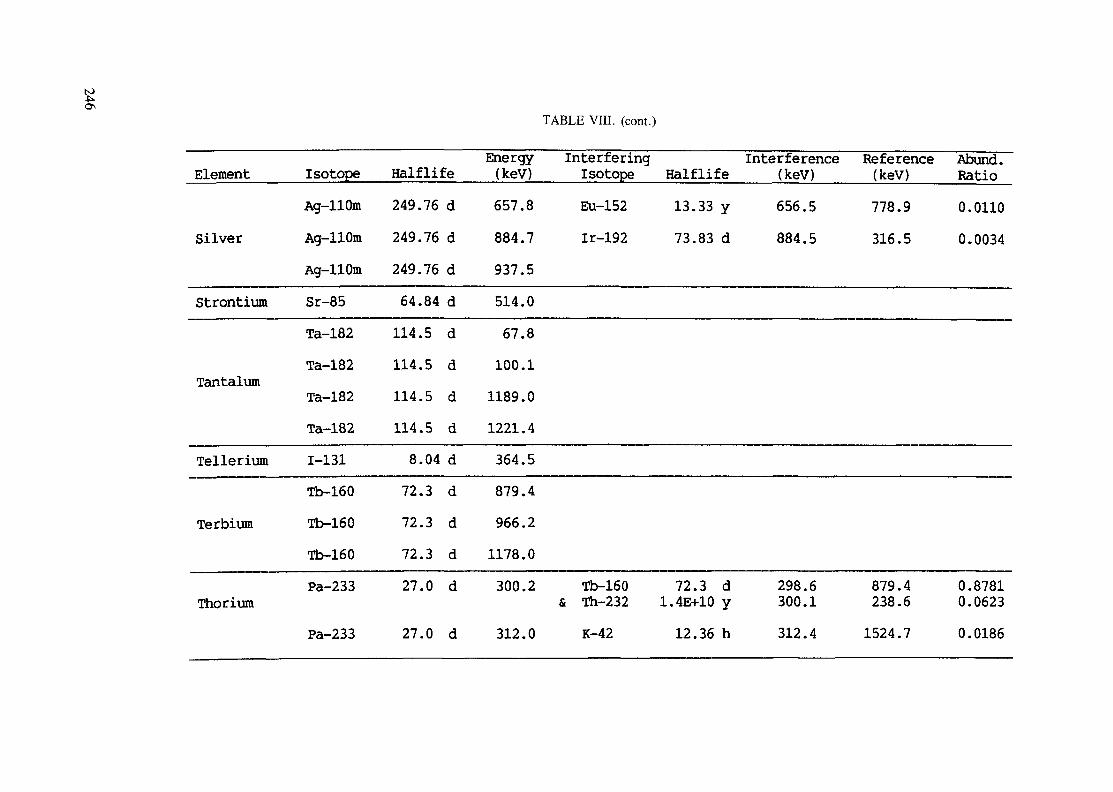
TABLE VIII. (cont.)
Element
Silver
Strontium
Tantalum
Tellerium
Terbium
Thorium
IsotopeAg-110mAg-110mAg-llOmSr-85Ta-182Ta-182Ta-182Ta-1821-131Tb-160Tb-160Tb-160Pa-233
Halflife249.76 d249.76 d249.76 d64.84 d114.5 d114.5 d114.5 d114.5 d8.04 d72.3 d72.3 d72.3 d27.0 d
Energy(keV)657.8884.7937.5514.067.8100.11189.01221.4364.5879.4966.21178.0300.2
Interfering Interference Reference Abund.isotope Halflife (keV) (keV) RatioEu-152 13.33 y 656.5 778.9 0.0110lr-192 73.83 d 884.5 316.5 0.0034
Tb-160 72.3 d 298.6 879.4 0.8781& Th-232 1.4E+10 y 300.1 238.6 0.0623
Pa-233 27.0 d 312.0 K-42 12.36 h 312.4 1524.7 0.0186
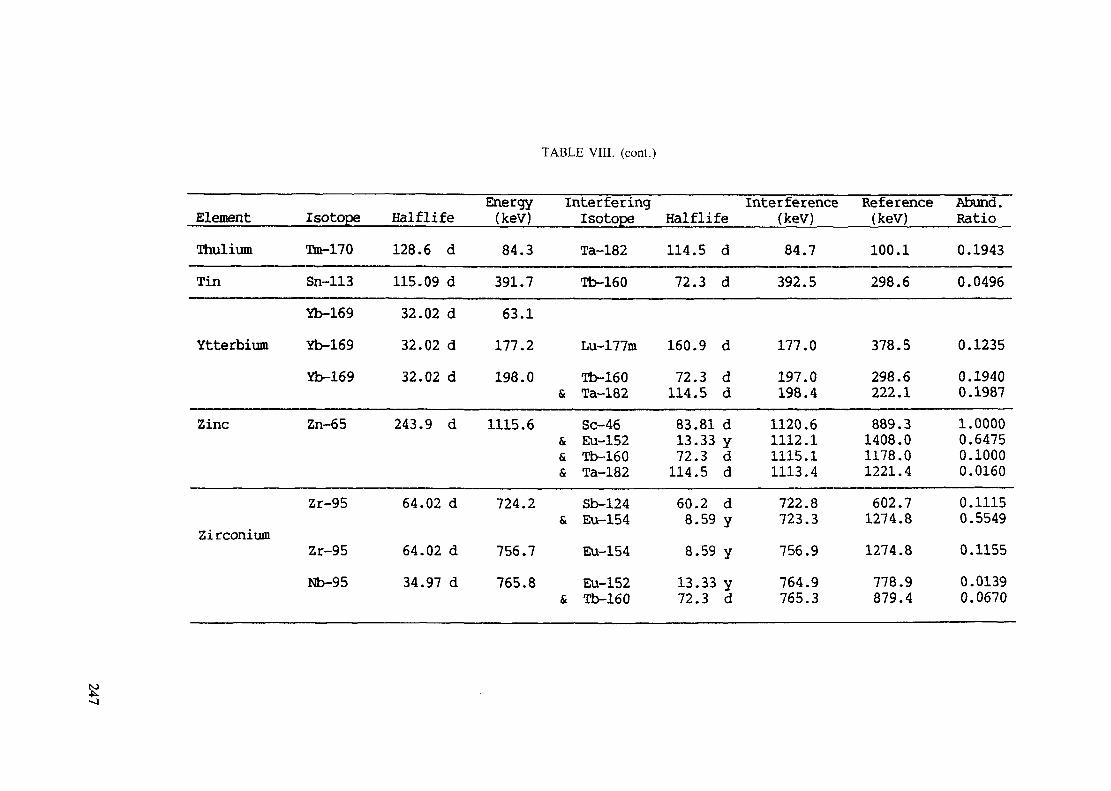
TABLE VIII. (cont.)
ElementThuliumTin
Ytterbium
Zinc
Zirconium
IsotopeTm-170Sn-113Yb-169Yb-169Yb-169
Zn-65
Zr-95
Zr-95Nb-95
Halflife128.6 d115.09 d32.02 d32.02 d32.02 d
243.9 d
64.02 d
64.02 d34.97 d
Energy(keV)84.3
391.763.1
177.2198.0
1115.6
724.2
756.7765.8
InterferingIsotopeTa-182Tb-160
Lu-177mTb-160
& Ta-182Sc-46
& Eu-152& Tb-160& Ta-182
Sb-124& Eu-154
Eu-154Eu-152
& Tb-160
InterferenceHalflife (keV)114.5 d
72.3 d
160.9 d72.3 d
114.5 d83.81 d13.33 y72.3 d
114.5 d60.2 d
8.59 y8.59 y
13.33 y72.3 d
84.7392.5
177.0197.0198.41120.61112.11115.11113.4722.8723.3756.9764.9765.3
Reference(keV)100.1298.6
378.5298.6222.1889.31408.01178.01221.4602.71274.81274.8778.9879.4
Abund.Ratio0.19430.0496
0.12350.19400.19871.00000.64750.10000.01600.11150.55490.11550.01390.0670
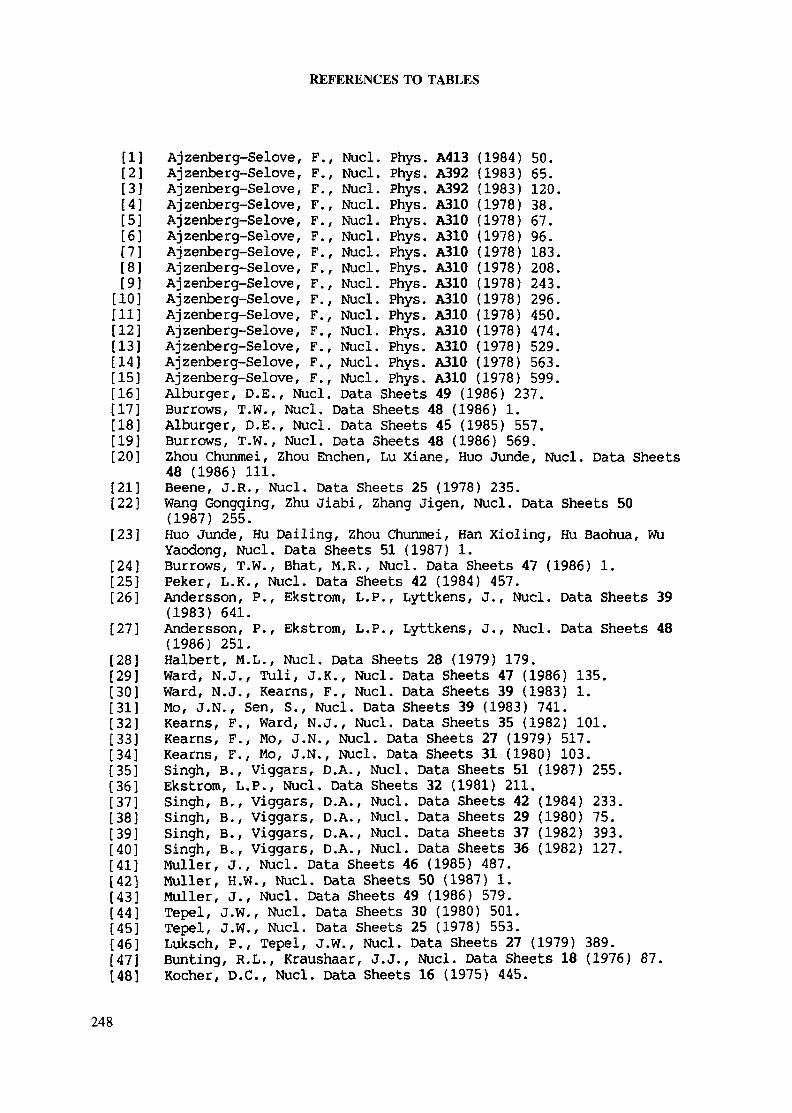
REFERENCES TO TABLES
[1][2][3][4][5][6][7][8][9][10][11][12][13][14][15][16][17][18][19][20][21][22][23][24][25][26][27][28][29][30][31][32][33][34][35][36][37][38][39][40][41][42][43][44][45][46][47][48]
Ajzenberg-Selove, F., Nucl. Phys. A413 (1984) 50.Ajzenberg-Selove, F., Nucl. Phys. A392 (1983) 65.
F., Nucl. Phys.F., Nucl. Phys.F., Nucl. Phys.F., Nucl. Phys,F., Nucl. Phys.F., Nucl. Phys.
A392 (1983) 120.A310 (1978) 38.A310 (1978) 67.A310 (1978) 96.A310 (1978) 183.A310 (1978) 208.A310 (1978) 243.A310 (1978) 296.A310 (1978) 450.A310 (1978) 474.A310 (1978) 529.
Aj zenberg-Selove,Aj zenberg-Selove,Ajzenberg-Selove,Aj zenberg-Selove,Aj zenbe rg-Selove,Aj zenberg-Selove,Ajzenberg-Selove, F., Nucl. Phys.Ajzenberg-Selove, F., Nucl. Phys.Aj zenbe rg-Selove, F., Nucl. Phys.Ajzenberg-Selove, F., Nucl. Phys.Ajzenberg-Selove, F., Nucl. Phys.Ajzenberg-Selove, F., Nucl. Phys. A310 (1978) 563.Ajzenberg-Selove, F., Nucl. Phys. A310 (1978) 599.Alburger, D.E., Nucl. Data Sheets 49 (1986) 237.Burrows, T.W., Nucl, Data Sheets 48 (1986) 1.Alburger, D.E., Nucl. Data Sheets 45 (1985) 557.Burrows, T.W., Nucl. Data Sheets 48 (1986) 569.Zhou Chunmei, Zhou Enchen, Lu Xiane, Huo Junde, Nucl. Data Sheets48 (1986) 111.Beene, J.R., Nucl. Data Sheets 25 (1978) 235.Wang Gongqing, Zhu Jiabi, Zhang Jigen, Nucl. Data Sheets 50(1987) 255.Huo Junde, Hu Dailing, Zhou Chunmei, Han Xioling, Hu Baohua, WuYaodong, Nucl. Data Sheets 51 (1987) 1.Burrows, T.W., Bhat, M.R., Nucl. Data Sheets 47 (1986) 1.Peker, L.K., Nucl. Data Sheets 42 (1984) 457.Andersson, P., Ekstrom, L.P., Lyttkens, J., Nucl. Data Sheets 39(1983) 641.Andersson, P., Ekstrom, L.P., Lyttkens, J., Nucl. Data Sheets 48(1986) 251.Haibert, M.L., Nucl. Data Sheets 28 (1979) 179.Ward, N.J., Tuli, J.K., Nucl. Data Sheets 47 (1986) 135.Ward, N.J., Kearns, F., Nucl. Data Sheets 39 (1983) 1.
, Sen, S., Nucl. Data Sheets 39 (1983) 741.F., Ward, N.J., Nucl. Data Sheets 35 (1982) 101.F., Mo, J.N., Nucl. Data Sheets 27 (1979) 517.
Kearns, F., Mo, J.N., Nucl. Data Sheets 31 (1980) 103.Singh, B., Viggars, D.A., Nucl. Data Sheets 51 (1987) 255.Ekstrom, L.P., Nucl. Data Sheets 32 (1981) 211.Singh, B., Viggars, D.A., Nucl. Data Sheets 42 (1984) 233.Singh, B., Viggars, D.A., Nucl. Data Sheets 29 (1980) 75.Singh, B., Viggars, D.A., Nucl. Data Sheets 37 (1982) 393.Singh, B., Viggars, D.A., Nucl. Data Sheets 36 (1982) 127.
Nucl. Data Sheets 46 (1985) 487., Nucl. Data Sheets 50 (1987) 1.
Mo, J.NKearns,Kearns,
J-,H.W.
MullerMullerMuller, J., Nucl. Data Sheets 49 (1986) 579.Tepel, J.W., Nucl. Data Sheets 30 (1980) 501.Tepel, J.W., Nucl. Data Sheets 25 (1978) 553.Luksch, P., Tepel, J.W., Nucl. Data Sheets 27 (1979) 389.Bunting, R.L., Kraushaar, J.J., Nucl. Data Sheets 18 (1976) 87.Kocher, D.C., Nucl. Data Sheets 16 (1975) 445.
248
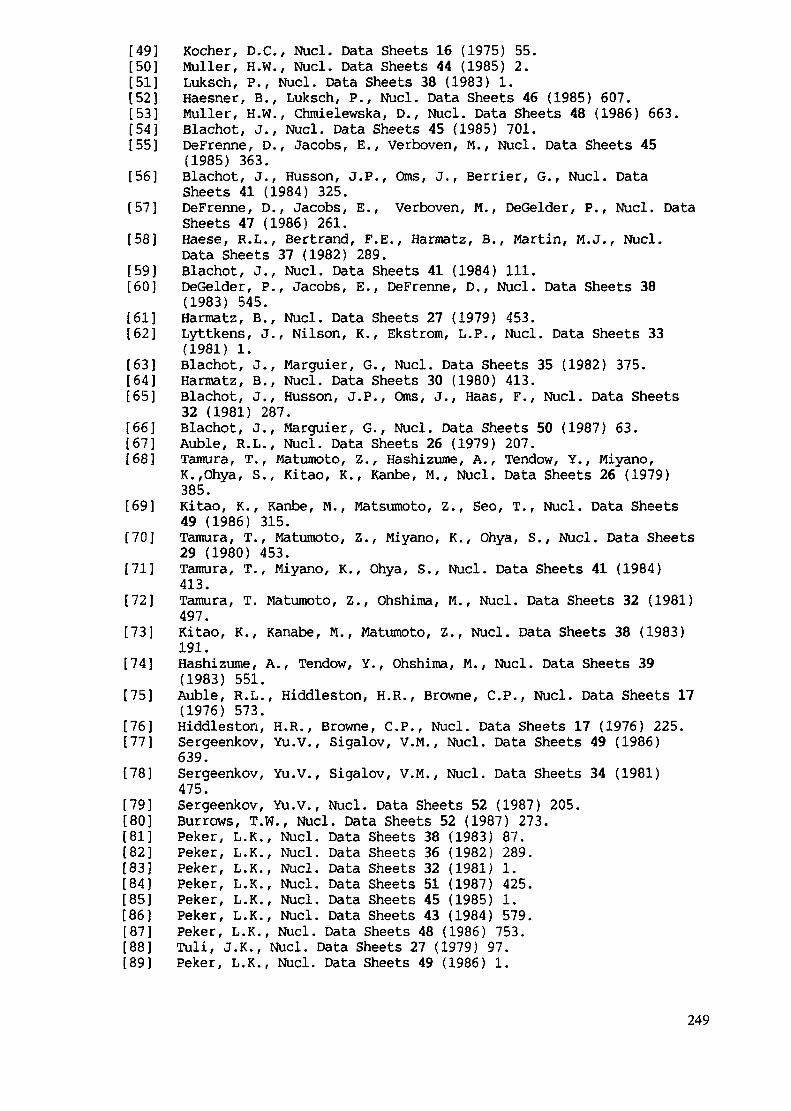
[49] Kocher, D.C., Nucl. Data Sheets 16 (1975) 55.[50] Muller, H.W., Nucl. Data Sheets 44 (1985) 2.[51] Luksch, P., Nucl. Data Sheets 38 (1983) 1.[52] Haesner, B., Luksch, P., Nucl. Data Sheets 46 (1985) 607.[53] Muller, H.W., Chmielewska, D., Nucl. Data Sheets 48 (1986) 663.[54] Blachot, J., Nucl. Data Sheets 45 (1985) 701.[55] DeFrenne, D., Jacobs, E., Verboven, M., Nucl. Data Sheets 45
(1985) 363.[56] Blachot, J., Husson, J.P., Oms, J., Berrier, G., Nucl. Data
Sheets 41 (1984) 325.[57] DeFrenne, D., Jacobs, E., Verboven, M., DeGelder, P., Nucl. Data
Sheets 47 (1986) 261.[58] Haese, R.L., Bertrand, F.E., Harmatz, B., Martin, M.J., Nucl.
Data Sheets 37 (1982) 289.[59] Blachot, J., Nucl. Data Sheets 41 (1984) 111.[60] DeGelder, P., Jacobs, E., DeFrenne, D., Nucl. Data Sheets 38
(1983) 545.[61] Harmatz, B., Nucl. Data Sheets 27 (1979) 453.[62] Lyttkens, J., Nilson, K., Ekstrom, L.P., Nucl. Data Sheets 33
(1981) 1.[63] Blachot, J., Marguier, G., Nucl. Data Sheets 35 (1982) 375.[64] Harmatz, B., Nucl. Data Sheets 30 (1980) 413.[65] Blachot, J., Husson, J.P., Oms, J., Haas, F., Nucl. Data Sheets
32 (1981) 287.[66] Blachot, J., Marguier, G., Nucl. Data Sheets 50 (1987) 63.[67] Auble, R.L., Nucl. Data Sheets 26 (1979) 207.[68] Tamura, T., Matumoto, Z., Hashizume, A., Tendow, Y., Miyano,
K.,0hya, S., Kitao, K., Kanbe, M., Nucl. Data Sheets 26 (1979)385.
[69] Kitao, K., Kanbe, M., Matsumoto, Z., Seo, T., Nucl. Data Sheets49 (1986) 315.
[70] Tamura, T., Matumoto, Z., Miyano, K., Ohya, S., Nucl. Data Sheets29 (1980) 453.
[71] Tamura, T., Miyano, K., Ohya, S., Nucl. Data Sheets 41 (1984)413.
[72] Tamura, T. Matumoto, Z., Ohshima, M., Nucl. Data Sheets 32 (1981)497.
[73] Kitao, K., Kanabe, M., Matumoto, Z., Nucl. Data Sheets 38 (1983)191.
[74] Hashizume, A., Tendow, Y., Ohshima, M., Nucl. Data Sheets 39(1983) 551.
[75] Auble, R.L., Hiddleston, H.R., Browne, C.P., Nucl. Data Sheets 17(1976) 573.
[76] Hiddleston, H.R., Browne, C.P., Nucl. Data Sheets 17 (1976) 225.[77] Sergeenkov, Yu.V., Sigalov, V.M., Nucl. Data Sheets 49 (1986)
639.[78] Sergeenkov, Yu.V., Sigalov, V.M., Nucl. Data Sheets 34 (1981)
475.[79] Sergeenkov, Yu.V., Nucl. Data Sheets 52 (1987) 205.[80] Burrows, T.W., Nucl. Data Sheets 52 (1987) 273.[81] Peker, L.K., Nucl. Data Sheets 38 (1983) 87.[82] Peker, L.K., Nucl. Data Sheets 36 (1982) 289.[83] Peker, L.K., Nucl. Data Sheets 32 (1981) 1.[84] Peker, L.K., Nucl. Data Sheets 51 (1987) 425.[85] Peker, L.K., Nucl. Data Sheets 45 (1985) 1.[86] Peker, L.K., Nucl. Data Sheets 43 (1984) 579.[87] Peker, L.K., Nucl. Data Sheets 48 (1986) 753.[88] Tuli, J.K., Nucl. Data Sheets 27 (1979) 97.[89] Peker, L.K., Nucl. Data Sheets 49 (1986) 1.
249
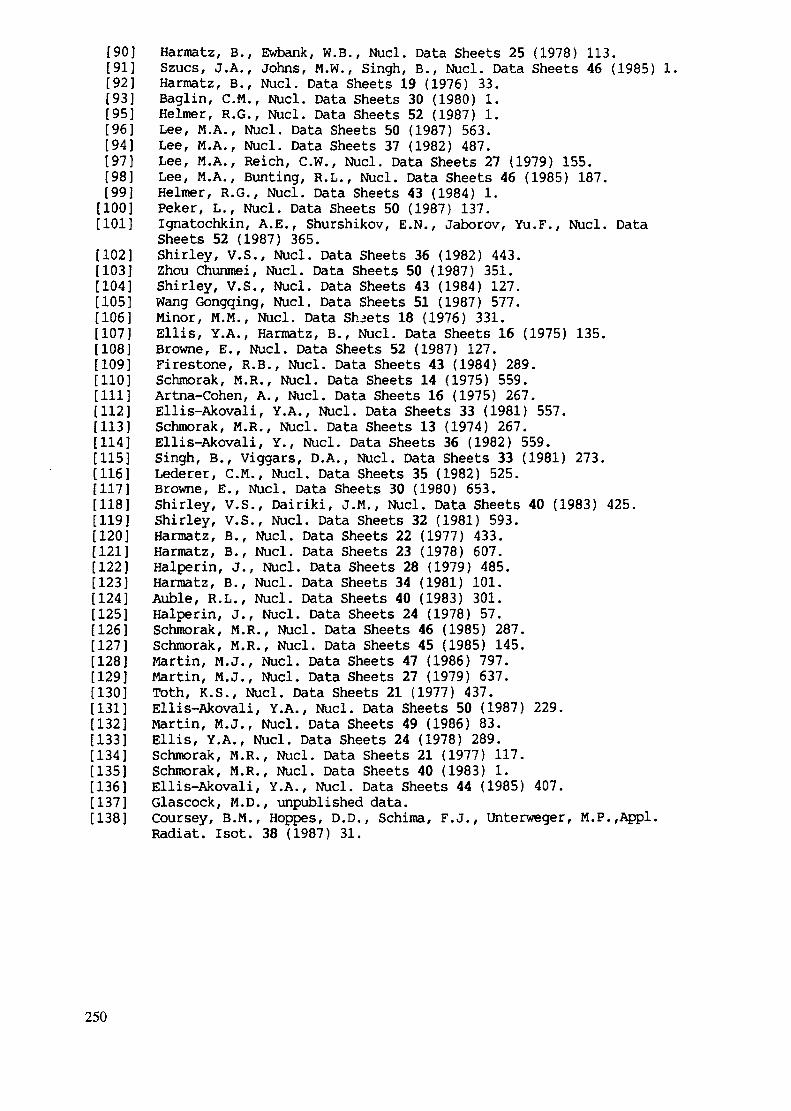
[90] Harmatz, B., Ewbank, W.B., Nucl. Data Sheets 25 (1978) 113.[91] Szucs, J.A., Johns, M.W., Singh, B., Nucl. Data Sheets 46 (1985) 1.[92] Harmatz, B., Nucl. Data Sheets 19 (1976) 33.[93] Baglin, C.M., Nucl. Data Sheets 30 (1980) 1.[95] Helmer, R.G., Nucl. Data Sheets 52 (1987) 1.[96] Lee, M.A., Nucl. Data Sheets 50 (1987) 563.[94] Lee, M.A., Nucl. Data Sheets 37 (1982) 487.[97] Lee, M.A., Reich, C.W., Nucl. Data Sheets 27 (1979) 155.[98] Lee, M.A., Bunting, R.L., Nucl. Data Sheets 46 (1985) 187.[99] Helmer, R.G., Nucl. Data Sheets 43 (1984) 1.
[100] Peker, L., Nucl. Data Sheets 50 (1987) 137.[101] Ignatochkin, A.E., Shurshikov, E.N., Jaborov, Yu.F., Nucl. Data
Sheets 52 (1987) 365.[102] Shirley, V.S., Nucl. Data Sheets 36 (1982) 443.[103] Zhou Chunmei, Nucl. Data Sheets 50 (1987) 351.[104] Shirley, V.S., Nucl. Data Sheets 43 (1984) 127.[105] Wang Gongqing, Nucl. Data Sheets 51 (1987) 577.[106] Minor, M.M., Nucl. Data Sheets 18 (1976) 331.[107] Ellis, Y.A., Harmatz, B., Nucl. Data Sheets 16 (1975) 135.[108] Browne, E., Nucl. Data Sheets 52 (1987) 127.[109] Firestone, R.B., Nucl. Data Sheets 43 (1984) 289.[110] Schmorak, M.R., Nucl. Data Sheets 14 (1975) 559.[Ill] Artna-Cohen, A., Nucl. Data Sheets 16 (1975) 267.[112] Ellis-Akovali, Y.A., Nucl. Data Sheets 33 (1981) 557.[113] Schmorak, M.R., Nucl. Data Sheets 13 (1974) 267.[114] Ellis-Akovali, Y., Nucl. Data Sheets 36 (1982) 559.[115] Singh, B., Viggars, D.A., Nucl. Data Sheets 33 (1981) 273.[116] Lederer, C.M., Nucl. Data Sheets 35 (1982) 525.[117] Browne, E., Nucl. Data Sheets 30 (1980) 653.[118] Shirley, V.S., Dairiki, J.M., Nucl. Data Sheets 40 (1983) 425.[119] Shirley, V.S., Nucl. Data Sheets 32 (1981) 593.[120] Harmatz, B., Nucl. Data Sheets 22 (1977) 433.[121] Harmatz, B., Nucl. Data Sheets 23 (1978) 607.[122] Halperin, J., Nucl. Data Sheets 28 (1979) 485.[123] Harmatz, B., Nucl. Data Sheets 34 (1981) 101.[124] Auble, R.L., Nucl. Data Sheets 40 (1983) 301.[125] Halperin, J., Nucl. Data Sheets 24 (1978) 57.[126] Schmorak, M.R., Nucl. Data Sheets 46 (1985) 287.[127] Schmorak, M.R., Nucl. Data Sheets 45 (1985) 145.[128] Martin, M.J., Nucl. Data Sheets 47 (1986) 797.[129] Martin, M.J., Nucl. Data Sheets 27 (1979) 637.[130] Toth, K.S., Nucl. Data Sheets 21 (1977) 437.[131] Ellis-Akovali, Y.A., Nucl. Data Sheets 50 (1987) 229.[132] Martin, M.J., Nucl. Data Sheets 49 (1986) 83.[133] Ellis, Y.A., Nucl. Data Sheets 24 (1978) 289.[134] Schmorak, M.R., Nucl. Data Sheets 21 (1977) 117.[135] Schmorak, M.R., Nucl. Data Sheets 40 (1983) 1.[136] Ellis-Akovali, Y.A., Nucl. Data Sheets 44 (1985) 407.[137] Glascock, M.D., unpublished data.[138] Coursey, B.M., Hoppes, D.D., Schima, F.J., Unterweger, M.P.,Appl.
Radiât. Isot. 38 (1987) 31.
250
CONTRIBUTORS TO DRAFTING AND REVIEW
Peter BodeTnlerfacuity Reactor Institute (IRI)Delft University of TechnologyMekolweg 152629 JB DelftThe Netherlands
Eric L. Hoffman1336 Sandhill DriveAneasterOntarioCanada L9G 4V5
Richard M. LindstromCenter for Analytical ChemistryNational Institute of Standards
and TechnologyGaithersburg, Maryland 20899U.S.A.
Susan J. ParryImperial College of Science andTechnology, Reactor Centre
Imperial College at Silwood ParkAscot, Berkshire SL5 7TEUnited Kingdom
and
Rolf J. RosenbergInternational Atomic Energy Agencyon leave fromTechnical Research Centre of FinlandReactor LaboratorySF-02150 EspooFinland
With contributions from:
Michael D. GlascockResearch Reactor FacilityUniversity of MissouriColumbia, MO 65211U.S.A.
Chapter 2 and Appendix A
Robert R. GreenbergCenter for Analytical ChemistryNational Institute of Standards
and TechnologyGaithersburg, Maryland 20899U.S.A.
Section 8.4, Chapter 9(together with R.M. Lindstrom)
Richard G. MuranakaInternational Atomic Energy AgencyP.O. Box 100A-1400 ViennaAustria
Chapter 4.1.
251
Related Documents