Practical Application of GPR to Supplement Data from FWD for Quick Pavement Performance Prediction Ludomir Uzarowski Michael Maher and Andrew Balasundaram, Golder Associates Ltd. Paper prepared for presentation at the ________________Session of the 2005 Annual Conference of the Transportation Association of Canada Calgary, Alberta

Welcome message from author
This document is posted to help you gain knowledge. Please leave a comment to let me know what you think about it! Share it to your friends and learn new things together.
Transcript
Practical Application of GPR to Supplement Data from FWD for Quick Pavement Performance Prediction
Ludomir Uzarowski Michael Maher and Andrew Balasundaram, Golder Associates Ltd. Paper prepared for presentation at the ________________Session of the 2005 Annual Conference of the Transportation Association of Canada Calgary, Alberta

-1-
ABSTRACT: Conventional geotechnical investigation and laboratory testing will provide material related information for pavement evaluation. A number of road agencies are using the Falling Weight Deflectometer (FWD) to supplement the data from the geotechnical investigation. The FWD load/deflection testing provides information on structural capacity of the entire pavement structure, as well as a basis to determine the condition of particular pavement layers. However, an extensive coring/drilling program is required to determine the existing pavement structure for pavement rehabilitation design. The Ground Penetrating Radar (GPR) is used to measure a continuous profile of pavement layers and identify areas of poor condition in the pavement structure. This information is also be used to improve the accuracy of FWD analysis. The GPR survey combined with the FWD testing and borehole and coring investigation form a comprehensive pavement condition/structure package. This package can be used for a quick pavement performance prediction at the rehabilitation design, repair or post construction stage.

-2-
1. INTRODUCTION In simple FWD testing analysis, where the measured deflection is converted to a static deflection and then compared to Benkelman beam testing, knowing the exact thickness of particular layers is not considered to be critical. However, for full utilization of the FWD test data to establish local variations in layer resilient moduli, accurate layer thickness data is imperative. This paper describes practical applications of GPR in combination with FWD on three projects carried out in Ontario: a municipal road upgrading project, a void detection and pavement repair project on a major highway, and a major highway widening project. The GPR survey was used to precisely determine the thickness of the asphalt concrete and granular layers at closely spaced intervals. This provided a continuous picture of the pavement structure longitudinally. In addition, readings along lines parallel to the centreline allowed variations across the width of the roadway to be detected. In one application, the GPR was used together with the FWD for void detection (location and severity) under composite and flexible pavements and to evaluate the effectiveness of their repair in terms of pavement predicted performance. 2. FALLING WEIGHT DEFLECTOMETER (FWD) Pavement surface deflections provide valuable information on the structural condition of pavement systems. As would be expected, stronger pavements, with thick layers of high quality materials, deflect less under a load pulse than weaker pavements with thin or deteriorated layers. The FWD is a nondestructive testing device that is the most widely accepted for the structural evaluation of pavements based on their deflection responses. The FWD is used for collecting pavement surface deflection data and providing information for mechanistic empirical pavement design and determining material properties. Layer stiffness and subgrade resilience can be backcalculated using the magnitude and shape of the FWD deflection basin. Deflection testing of existing pavements using the FWD is described in greater detail in references [1], [2] and [3]. In the last 15 years, the FWD has become an essential tool for the evaluation of the structural capacity and integrity of existing, rehabilitated and newly constructed pavements. The FWD applies a range of dynamic loads to a pavement surface, simulating the effect of a loaded wheel tire and electronically recording the deflection profile [4]. Although pavement deflections are sometimes used to determine the structural condition of the pavement (in a way similar to the Benkelman beam), the FWD load/deflection data is typically used in backcalculation analysis to determine the strength of the individual pavement layers. This allows the pavement engineer to evaluate the pavement structure in the same manner that other engineering structures are evaluated by using mechanistic-empirical design methods. In this approach, it is also possible to determine the remaining service life of the pavement structure and design the rehabilitation treatments necessary. The FWD is suitable for evaluating all pavement types, including airfield runways, taxiways and aprons, and both flexible and rigid pavement systems. The High Capacity Falling Weight Deflectometer (HWD) shown in Figure 1 can be used in an FWD mode for evaluation of conventional pavements (loads typically do not exceed 100 kN) and in an HWD mode (loads up to 240 kN) for airport pavements and heavy industrial pavements. Some FWD’s are equipped with a Global Positioning System (GPS) that provides sub-meter accuracy and, when combined with a high precision Distance Measuring Instrument (DMI), ensures that all test locations are accurately recorded.

-3-
Figure 1 – High Capacity Falling Weight Deflectometer (HWD) used in
pavement structural condition survey on the QEW. 3. GROUND PENETRATING RADAR (GPR) Ground Penetrating Radar (GPR) is an impulse system which sends an electromagnetic pulse through the antenna (Figure 2) into the ground and then records the reflected signals from the layer interfaces where contrasting dielectric properties are detected. A measure of the time difference between the reflected signals can be used in conjunction with the dielectric properties to determine layer thicknesses [4]. GPR is especially useful for locating the transition points and other variations in as-built conditions [5]. When combined with the FWD testing and a borehole and coring investigation, the GPR survey forms a comprehensive pavement condition/structure package. This is extremely useful on road sections where the pavement structure has been subjected to numerous resurfacings and/or widening operations. When the GPR equipment is towed by a vehicle, layer thickness profiles can be generated from the radar survey at highway speed. Accurate thickness information is often vital for pavement design engineers in determining variations in required milling depths before resurfacing or full depth reclamation in pavement rehabilitation [6, 7, 8, 9, and 10]. GPR technology is also extremely useful for pavement management, providing highway agencies with an efficient tool to quickly collect inventory data on all pavements under their jurisdiction. In Indiana, for instance, GPR surveys are typically conducted on their road network every 5 years. GPR data collection is also recommended at the project level and for special projects [7]. GPR does not replace the need for boreholes and cores, however, it allows some reduction in their number, and thus reduces impact on traffic operations. It also provides in-filling in areas that are inaccessible to a drill rig, such as road sections with numerous underground utilities or freeway lanes that are difficult to close to traffic.

-4-
Figure 2 – GPR two component system: the 500 MHz radar followed by the 1000 MHz radar.
Figure 3 shows a GPR profile from a composite (asphalt over concrete) section of interstate highway I-495 near New York City and compares it with a pavement core obtained in the area [Maser, K.R., 2001].
Figure 3 – Sample of GPR data from interstate highway I-495 near New York City [Maser, K.R., 2001]
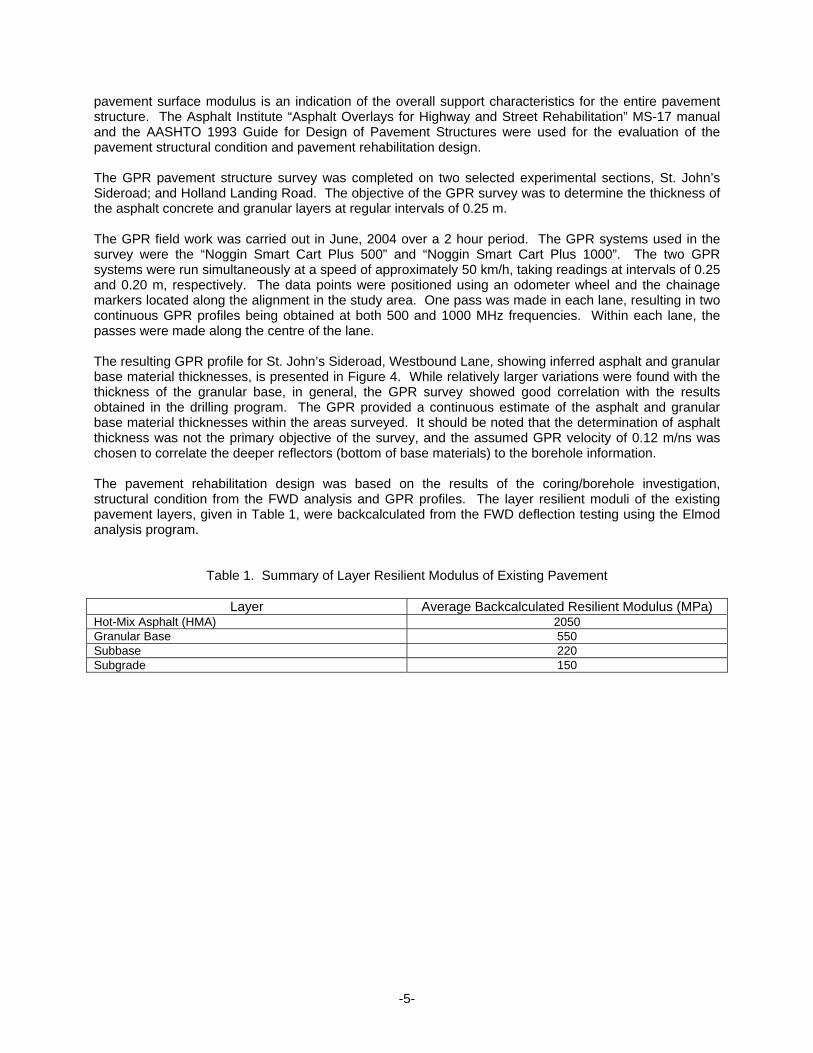
4. EXAMPLES OF USING GPR WITH FWD FOR PAVEMENT PERFORMANCE PREDICTION 4.1 Two Regional Roads in York Region, Ontario FWD load/deflection testing was undertaken in June and August, 2004, on 18 roads in York Region in Ontario, for a total length of 97 km, to evaluate the pavement structural condition. At each test location, three load levels were used to determine the deflection response of the pavement (about 40, 50 and 60 kN). The measured FWD dynamic deflections were then normalized to represent the equivalent deflection for a standard wheel load of 40 kN and asphalt concrete temperature of 21°C (70°F). The FWD testing was completed at 100 m intervals in each lane. Test locations were staggered by 50 m between lanes. In addition to the deflection analysis, the pavement surface modulus was also determined. The
-5-
pavement surface modulus is an indication of the overall support characteristics for the entire pavement structure. The Asphalt Institute “Asphalt Overlays for Highway and Street Rehabilitation” MS-17 manual and the AASHTO 1993 Guide for Design of Pavement Structures were used for the evaluation of the pavement structural condition and pavement rehabilitation design. The GPR pavement structure survey was completed on two selected experimental sections, St. John’s Sideroad; and Holland Landing Road. The objective of the GPR survey was to determine the thickness of the asphalt concrete and granular layers at regular intervals of 0.25 m. The GPR field work was carried out in June, 2004 over a 2 hour period. The GPR systems used in the survey were the “Noggin Smart Cart Plus 500” and “Noggin Smart Cart Plus 1000”. The two GPR systems were run simultaneously at a speed of approximately 50 km/h, taking readings at intervals of 0.25 and 0.20 m, respectively. The data points were positioned using an odometer wheel and the chainage markers located along the alignment in the study area. One pass was made in each lane, resulting in two continuous GPR profiles being obtained at both 500 and 1000 MHz frequencies. Within each lane, the passes were made along the centre of the lane. The resulting GPR profile for St. John’s Sideroad, Westbound Lane, showing inferred asphalt and granular base material thicknesses, is presented in Figure 4. While relatively larger variations were found with the thickness of the granular base, in general, the GPR survey showed good correlation with the results obtained in the drilling program. The GPR provided a continuous estimate of the asphalt and granular base material thicknesses within the areas surveyed. It should be noted that the determination of asphalt thickness was not the primary objective of the survey, and the assumed GPR velocity of 0.12 m/ns was chosen to correlate the deeper reflectors (bottom of base materials) to the borehole information. The pavement rehabilitation design was based on the results of the coring/borehole investigation, structural condition from the FWD analysis and GPR profiles. The layer resilient moduli of the existing pavement layers, given in Table 1, were backcalculated from the FWD deflection testing using the Elmod analysis program.
Table 1. Summary of Layer Resilient Modulus of Existing Pavement
Layer Average Backcalculated Resilient Modulus (MPa) Hot-Mix Asphalt (HMA) 2050 Granular Base 550 Subbase 220 Subgrade 150

-6-
Figure 4 – Example of GPR profiles and borehole/coring logs on St. John’s Sideroad, Westbound Lane
The pavement rehabilitation design for these road sections included foamed asphalt stabilization of the existing asphalt layers followed by placement of hot-mix asphalt (HMA) binder and surface courses. The GPR survey showed that the average thickness of granular base in the Westbound Lane is only about 200 mm, not 400 mm as indicated by the borehole investigation (see Figure 4). Therefore, the initial pavement rehabilitation design had to be revised to reflect the GPR survey data. In addition to the AASHTO 93 design, mechanistic-empirical models (Finn’s fatigue model and FHWA rutting model) were used to verify both pavement designs. The design traffic loading for a period of 20 years was 5.0 million Equivalent Single Axle Loads (ESAL's). A resilient modulus correction factor of 0.5 was used for the existing granular materials. A resilient modulus of 3,500 MPa was assumed for the new hot mix asphalt (HMA) surface and binder layers and 1,300 MPa for the foamed asphalt layer. The tensile strain at the bottom of asphalt layers (assumed to control the pavement life for fatigue) and the compressive strain at the top of subgrade (assumed to control the pavement life for rutting) were calculated using the BISAR analysis program. A comparison of the initial and revised pavement designs in terms of the layer thicknesses, structural number (SN) and predicted life is shown in Table 2. Both the AASHTO and mechanistic-empirical analysis indicate that if the incorrect thickness of granular base of 400 mm was used in the design, the actual life the pavement structure would be only about one third of the required design life of 5.0 million ESAL's 4.2 Void Detection under High Volume Road The presence of large voids under a very thick pavement structure was observed crossing a section of one of the major highways in Ontario. This portion of the highway consisted of three lanes of through traffic, a speed change lane and paved shoulders in each direction with a concrete barrier wall separating the two directions of travel. For identification purposes, the lanes in each direction are numbered starting with the inner most lane (far left lane). The pavement structure in Lanes 1 and 2 in both directions consisted of about 290 to 325 mm of HMA, 225 mm of Portland cement concrete and variable thicknesses of granular layer(s). In Lane 3 and the Speed Change Lanes, the pavement consisted of 260 to 290 mm of HMA over granular layers. Unshrinkable fill material was initially used to fill the voids under the asphalt pavement near the highway median. However, during this repair, large deep voids were observed under the adjacent thick composite pavement structure. In order to determine the extent and severity of the voids, a comprehensive field testing program was initiated. The field testing program consisted of conducting a coring investigation, FWD testing and a GPR survey in each wheel path of each lane in both directions of travel. The FWD testing was carried out at 1 m intervals 20 m on either side of the location were the voids were noted during the initial repairs. In

-7-
addition, testing was carried out in one wheel path over a length of 50 m on either side of the voids in order to establish reference data outside of the zone of influence of the voids. The GPR survey was carried out longitudinally and transversely in order to precisely determine the location of concrete base. Typical FWD deflections superimposed over GPR longitudinal profiles for an area repaired with unshrinkable fill are shown in Figure 5. Figures 6 and 7 show typical deflections and GPR profiles of composite and asphalt pavements before repair. The high deflection peaks recorded with the FWD clearly indicate the location of voids under the bound asphalt and concrete layers and correlate well with the void locations indicated by the GPR. The GPR survey was also used to determine the type and thicknesses of the pavement layers, presence of dowel bars and the length and width of the underlying concrete slabs.

- 8 -
Table 2. Comparison of Initial and Revised Pavement Designs for Two Regional Roads in York Region, Ontario
Initial Design Before GPR Survey Based on GPR Survey
Revised Design
AASHTO 93 Mechanistic –Empirical Analysis AASHTO 93 Mechanistic –
Empirical Analysis AASHTO 93 Mechanistic –Empirical Analysis
Predicted Life (Milliion ESAL’s)
Predicted Life (Million ESAL’s)
Predicted Life (Million ESAL’s)
Layer Type Thickness
(mm) SN (mm)
Million ESAL’s Fatigue Rutting
Thickness (mm) SN
(mm) Million ESAL’s Fatigue Rutting
Thickness (mm) SN
(mm) Milliion ESAL’s Fatigue Rutting
HMA 90 90 120 Foamed Asphalt 110 110 150
Granular Base 400 200 200
Subbase 500
- - - -
500
- - - -
500
- - - -
TOTAL 1,100 137 5.1 5.5 7.8 900 115 1.6 4.5 1.8 970 138 5.4 6.0 4.8

- 9 -
Figure 5 – Asphalt pavement FWD deflections and GPR profiles after repair with unshrinkable fill.
Figure 6 – Composite pavement FWD deflections and GPR profiles before repair. Note a high peak in the area where the presence of a void was confirmed by the GPR.

- 10 -
Figure 7 – FWD deflections and GPR profiles of asphalt pavement before grouting. Note a high peak in the area where the presence of a void was confirmed by the GPR.
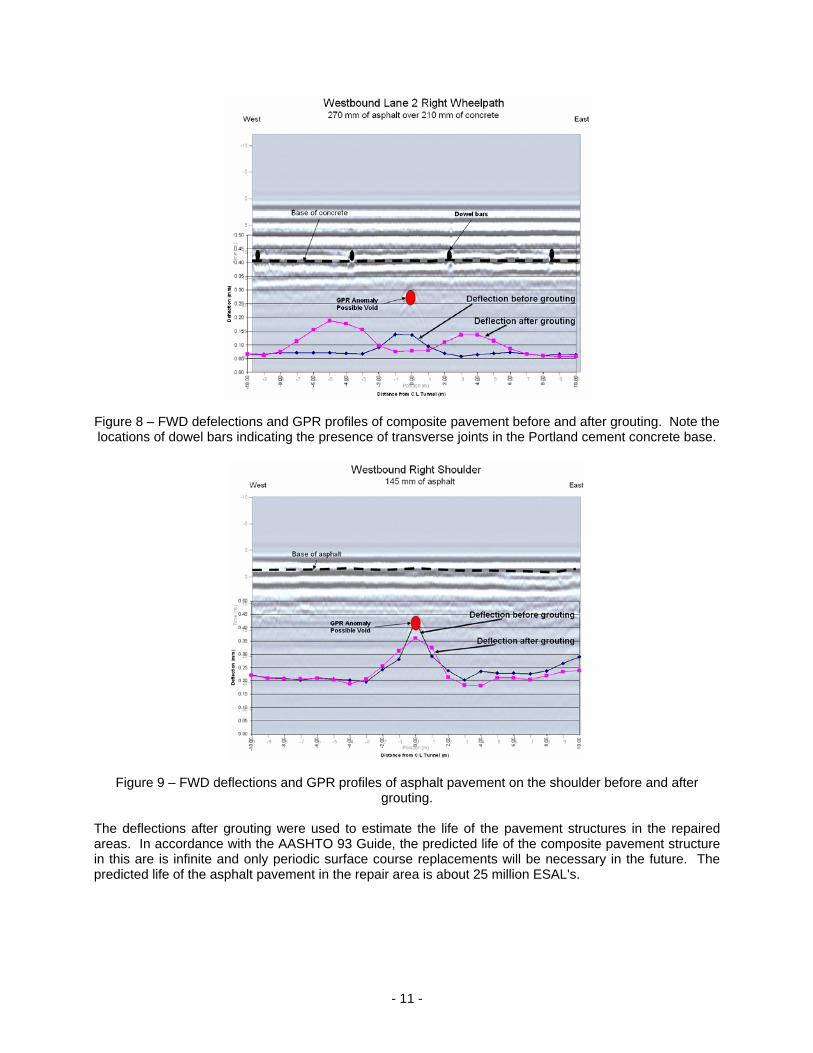
The voids identified during the investigation were subsequently filled with a high pressured grout. Additional FWD testing was carried out after the grouting operations in order to verify the effectiveness of this treatment. Figures 8 and 9 show the FWD deflections and GPR profiles before and after the grouting operation. The grouting treatment under the composite pavement structure effectively filled the void and improved the support as indicated by smaller deflections at the void location (Figure 8). However, the grout has also lifted the concrete slabs creating small gaps between the pavement and granular base and the deflections on either side of the voids have increased. Given the high traffic volume, the lifted pavement structure is expected to settle with time thereby eliminating the gaps created by the grouting operations. A small bump, about 5 to 8 mm in height, was also observed on the pavement surface. This bump was diamond ground following the grouting operations. The grout also effectively filled the voids under the asphalt pavement, although, in these locations,, the amount of lift was significantly greater (Figure 9). A 25 to 50 mm high bump was observed after grouting under the asphalt pavement. As with the composite pavement, the bump was ground with a diamond grinder. The reduction in the thickness of the asphalt layers due to grinding caused the deflections after grouting to be somewhat higher in this area. It is anticipated that the pavement structure in the repair areas will settle and the support capacity will improve.
- 11 -
Figure 8 – FWD defelections and GPR profiles of composite pavement before and after grouting. Note the locations of dowel bars indicating the presence of transverse joints in the Portland cement concrete base.
Figure 9 – FWD deflections and GPR profiles of asphalt pavement on the shoulder before and after grouting.
The deflections after grouting were used to estimate the life of the pavement structures in the repaired areas. In accordance with the AASHTO 93 Guide, the predicted life of the composite pavement structure in this are is infinite and only periodic surface course replacements will be necessary in the future. The predicted life of the asphalt pavement in the repair area is about 25 million ESAL's.

- 12 -
4.3 QEW Widening in Ontario The Queen Elizabeth Way (QEW), originally constructed in 1939 as a four-lane concrete highway with a divided grassed median, is the main freeway link between Toronto, Niagara Falls and the international crossing to Buffalo, New York. Since the original construction, the highway has been upgraded numerous times and at least one lane has been added throughout its length. A six kilometre section through the City of St. Catharines is the only remaining section of this freeway that is still only four lanes wide. The Ministry of Transportation Ontario’s plans for upgrading this section of the highway involve adding a through lane in each direction, providing fully paved shoulders, installing a concrete median barrier wall, as well as implementing numerous interchange improvements. A GPR survey, FWD testing and a coring and borehole investigation were carried out in May 2004 on this section of the QEW widening project. The objective was to identify the pavement structure, provide a continuous determination of asphalt and asphalt/concrete pavement thickness including granular layer thicknesses, and to identify, where possible, GPR anomalies that may be indicative of poor pavement conditions, such as a disintegrating concrete pavement underlying the various asphalt overlays, or voids beneath the concrete. As such, an assessment of the current condition of the original concrete and pavement structure was a key part of the investigation. The GPR equipment used in the survey included the “Noggin Smart Cart Plus 500” and the “Noggin Smart Cart Plus 1000”. These were 500 and 1000 MHz ground-launched, shielded, GPR systems. These two GPR systems were run simultaneously at a speed of approximately 30 km/h, taking readings at intervals of 0.125 and 0.100 m, respectively. The survey was positioned using an odometer wheel and the chainage markers located along the alignment in the study area. GPS position data was also acquired in real time along the alignment during the survey using a Trimble Pro XRB for reference purposes. Two passes were made in each of lane in both the Niagara and Toronto bound directions of the highway, resulting in eight continuous GPR profiles being obtained at both 500 and 1000 MHz frequencies. Within each lane, a pass was made with the GPR systems aligned both 0.75 m to the left and 0.75 m to the right of the centre of the lane (i.e. the typical wheel pass alignment for a vehicle). All GPR data was recorded digitally during the course of the survey. An example of a GPR plot is shown in Figure 9.
Figure 9 – Example of GPR survey plot from the QEW St. Catharines project in Ontario in 2004.

- 13 -
FWD testing was also carried out throughout the project limits in May, 2004 to determine the pavement structural condition, which included the deflection measurements and load transfer tests at selected potential reflective cracking areas above joints in the old concrete pavement. A JILS-20H-FWD Falling Weight Deflectometer was used to complete this testing. In the FWD testing, the pavement deflections under the applied load pulse are measured at predetermined intervals along the road. Loads were applied at a spacing of 50 m along the median lane, with the readings in the adjacent lane being staggered by 25 m. At each test location, three load levels were used to determine the deflection response of the pavement (40, 55 and 70 kN). The results of the FWD testing were analyzed using several procedures to determine the normalized dynamic deflection, modulus of subgrade reaction, the modulus of both the concrete and the asphalt layers, along with load transfer efficiency and loss of support diagnostics. The pavement deflections measured with the FWD at specific distances from the load plate were used to determine the structural properties of the pavement and subgrade through a process known as back calculation. Back calculation uses analytical pavement response models to predict deflections based on a set of subgrade and pavement layer moduli that produce deflections that are very similar to those measured in the field. After the moduli were back calculated, they were examined to determine if they were within the range normally expected for the materials under investigation. It should be noted that for a typical in service pavement that is several years old, the asphalt concrete moduli during the summer months are usually in a range between 1,500 and 3,500 MPa. By comparison, the moduli of a sound Portland cement concrete are expected to range between 20,000 and 35,000 MPa. The deflection testing results indicated that the material properties of the pavement vary in each lane and between lanes in the eastbound and westbound directions. The average subgrade modulus value was in the order of 230 MPa with a standard deviation of about 60 MPa. The elastic moduli values for the asphalt and concrete layers were quite variable as shown in Table 3. This type of variability is not considered uncommon when testing composite pavements. Sources of variability would include variations in asphalt mix types and asphalt cement contents
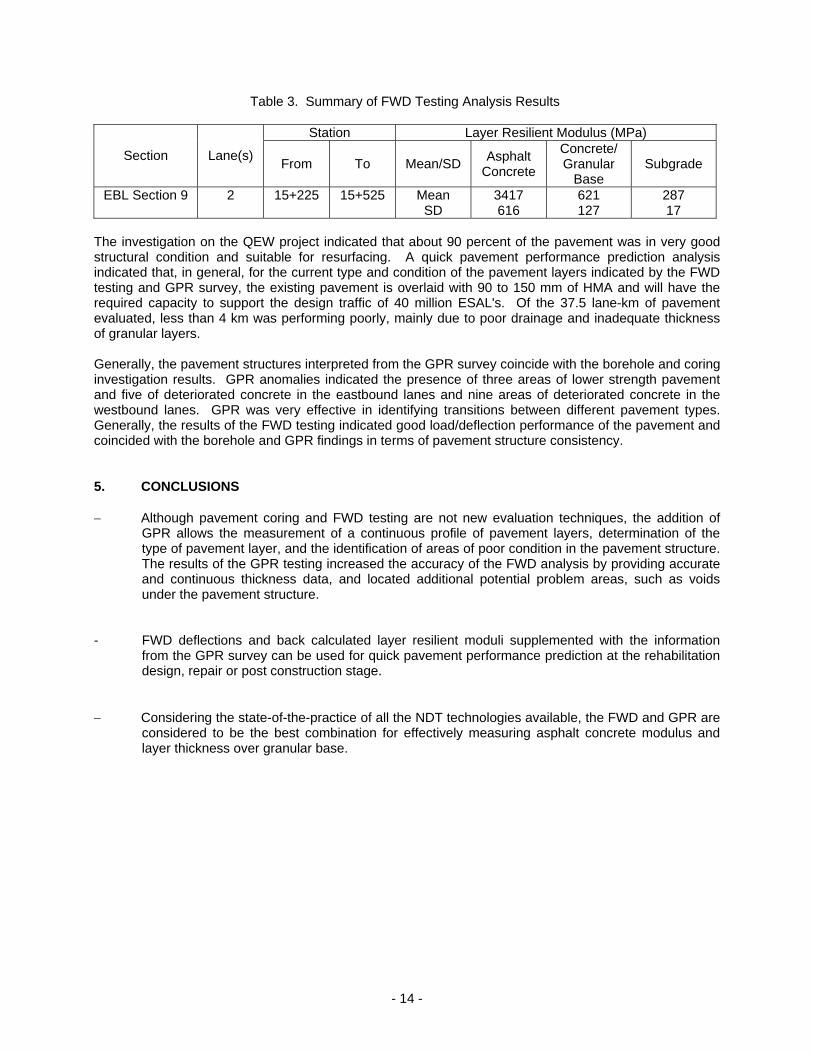
Table 3. Summary of FWD Testing Analysis Results
Station Layer Resilient Modulus (MPa)
Section Lane(s) From To Mean/SD Asphalt Concrete
Concrete/ Granular
Base Subgrade
EBL Section 1
1 and 2
18+225 10+000
19+775 10+150
Mean SD
3583 1414
4435 4789
228 108
EBL Section 2
1 and 2
10+350
11+240
Mean SD
3753 1419
325 174
171 83
EBL Section 3
1 and 2
11+240
12+625
Mean SD
3969 1224
10276 7526
201 49
EBL Section 4
1 and 2
12+625
13+350
Mean SD
3858 974
366 264
225 79
EBL Section 5
1 and 2
13+350
14+075
Mean SD
4208 1389
12922 7420
201 55
EBL Section 6
1 and 2
14+075
14+725
Mean SD
2840 505
305 176
137 66
EBL Section 7
1
14+725
15+525
Mean SD
3444 403
581 389
300 29
EBL Section 8
2
14+725
15+225
Mean SD
3533 691
9868 4124
312 43
- 14 -
Table 3. Summary of FWD Testing Analysis Results
Station Layer Resilient Modulus (MPa)
Section Lane(s) From To Mean/SD Asphalt Concrete
Concrete/ Granular
Base Subgrade
EBL Section 9
2
15+225
15+525
Mean SD
3417 616
621 127
287 17
The investigation on the QEW project indicated that about 90 percent of the pavement was in very good structural condition and suitable for resurfacing. A quick pavement performance prediction analysis indicated that, in general, for the current type and condition of the pavement layers indicated by the FWD testing and GPR survey, the existing pavement is overlaid with 90 to 150 mm of HMA and will have the required capacity to support the design traffic of 40 million ESAL's. Of the 37.5 lane-km of pavement evaluated, less than 4 km was performing poorly, mainly due to poor drainage and inadequate thickness of granular layers. Generally, the pavement structures interpreted from the GPR survey coincide with the borehole and coring investigation results. GPR anomalies indicated the presence of three areas of lower strength pavement and five of deteriorated concrete in the eastbound lanes and nine areas of deteriorated concrete in the westbound lanes. GPR was very effective in identifying transitions between different pavement types. Generally, the results of the FWD testing indicated good load/deflection performance of the pavement and coincided with the borehole and GPR findings in terms of pavement structure consistency. 5. CONCLUSIONS − Although pavement coring and FWD testing are not new evaluation techniques, the addition of
GPR allows the measurement of a continuous profile of pavement layers, determination of the type of pavement layer, and the identification of areas of poor condition in the pavement structure. The results of the GPR testing increased the accuracy of the FWD analysis by providing accurate and continuous thickness data, and located additional potential problem areas, such as voids under the pavement structure.
- FWD deflections and back calculated layer resilient moduli supplemented with the information
from the GPR survey can be used for quick pavement performance prediction at the rehabilitation design, repair or post construction stage.
− Considering the state-of-the-practice of all the NDT technologies available, the FWD and GPR are
considered to be the best combination for effectively measuring asphalt concrete modulus and layer thickness over granular base.

- 15 -
6. REFERENCES 1. AASHTO, American Association of State Highway and Transportation Officials, T256-77 (1999),
1977, Pavement Deflection Measurements, Washington DC. 2. ASTM International, ASTM D4694-96, 1996, Standard Test Method for Deflections with a Falling-
weight-type Impulse Load Device, West Conshohocken, Pennsylvania. 3. ASTM International, ASTM D5858, 1996, Standard Guide for Calculating In Situ Equivalent Elastic
Moduli of Pavement Materials Using Layered Elastic Theory. 4. Al-Qadi I. L., Clark T. M., Lee D. T., Lahouar S., and Loulizi A., 2003, “Combing Traditional and
Non-Traditional NDT Techniques to Evaluate Virginia’s Interstate 81”, Transportation Research Board, 82nd Annual Meeting, January.
5. Liu, L., January, 2003 “Ground-Penetrating Radar: What Can I Tell About the Moisture Content of
the Hot Mix Asphalt Pavement?”, Transportation Research Board, 82nd Annual Meeting. 6. Martinot, A. R. and Zhang, Z., January, 2002, “Evaluation of Data Collection Methods for
Pavement Layer Data”, Transportation Research Board, 81st Annual Meeting. 7. Noureldin, A. S., Zhu, K., Li, S., and Harris, D., January, 2003, “Network Pavement Evaluation
using Falling Weight Deflectometer and Ground Penetrating Radar”, Transportation Research Board, 82nd Annual Meeting
8. Saeed, A. and Hall, J. W., January, 2003, “Comparison of Non-destructive Testing Devices to
Determine In Situ Properties of Asphalt Concrete Pavement Layers”, Transportation Research Board, 82nd Annual Meeting
9. Smith, T. and Stephanos, P., January, 2003, “Utilizing Pavement Evaluation Data in Rehabilitation
Design in MDSHA” Transportation Research Board, 82nd Annual Meeting. 10. Wimsatt, A. J. and Scullion, T., January, 2003, “Selecting Rehabilitation Strategies for Flexible
Pavements in Texas”, Transportation Research Board, 82nd Annual Meeting.
Related Documents