Metabolic Effects of Interval Training Luke Baumgartner, MS, CSCS, CPT, FMS

ppt slideshow orangetheory fitness
Jul 16, 2015
Welcome message from author
This document is posted to help you gain knowledge. Please leave a comment to let me know what you think about it! Share it to your friends and learn new things together.
Transcript
Metabolic Effects of
Interval TrainingLuke Baumgartner, MS, CSCS, CPT, FMS

About Me - Education MS, Exercise Science (Biomechanics)
Footwear Research – Vibram, Dockers, Adidas
Lower limb mechanics – Injury Prevention - Knee OA, Shin Splints
Movement Optimization – Running, jumping, Weight Training
BA, Physical and Health Education

About Me - Work Metabolic Specialist & Clinical Innovation Leader
Master Trainer & Director of Biomechanics
Program Development
PE Lecturer/Instructor
Research
Teacher, Coach, Athletic Director

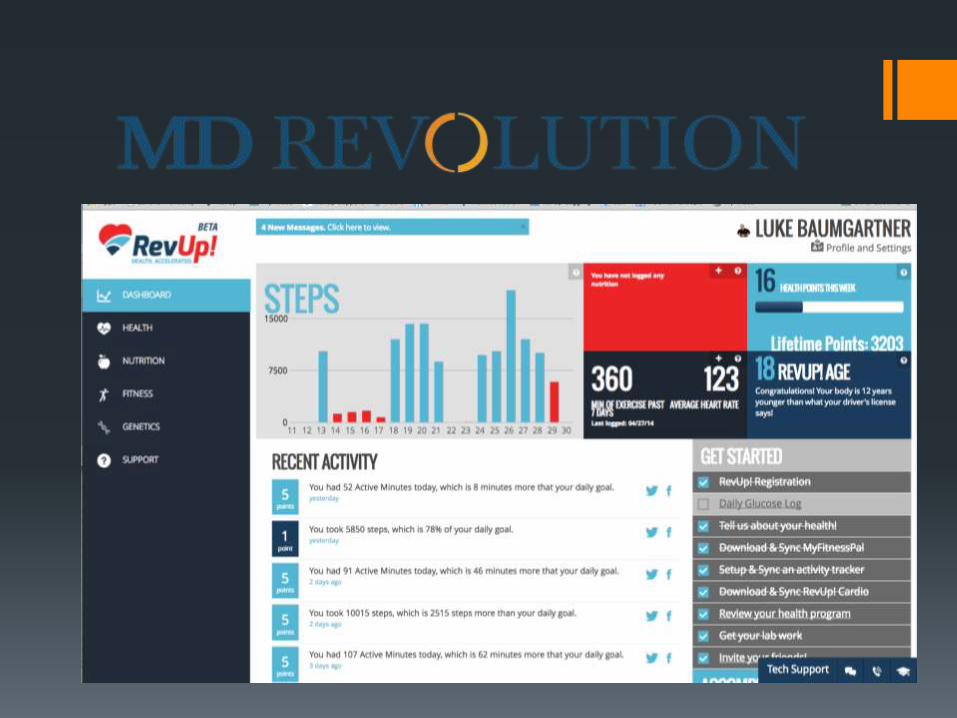
RevUp Team
Health – nurse Practitioner
Nutrition – Registered Dietician
Fitness – Metabolic Specialist
Using digital platforms to give you control
of your most valuable asset… your
HEALTH!

Team Approach
Design and implement an individualized plan
Assessments Health Data – Labs, Diagnoses, Medications, etc.
Biometrics
Metabolism
Guided behavior change

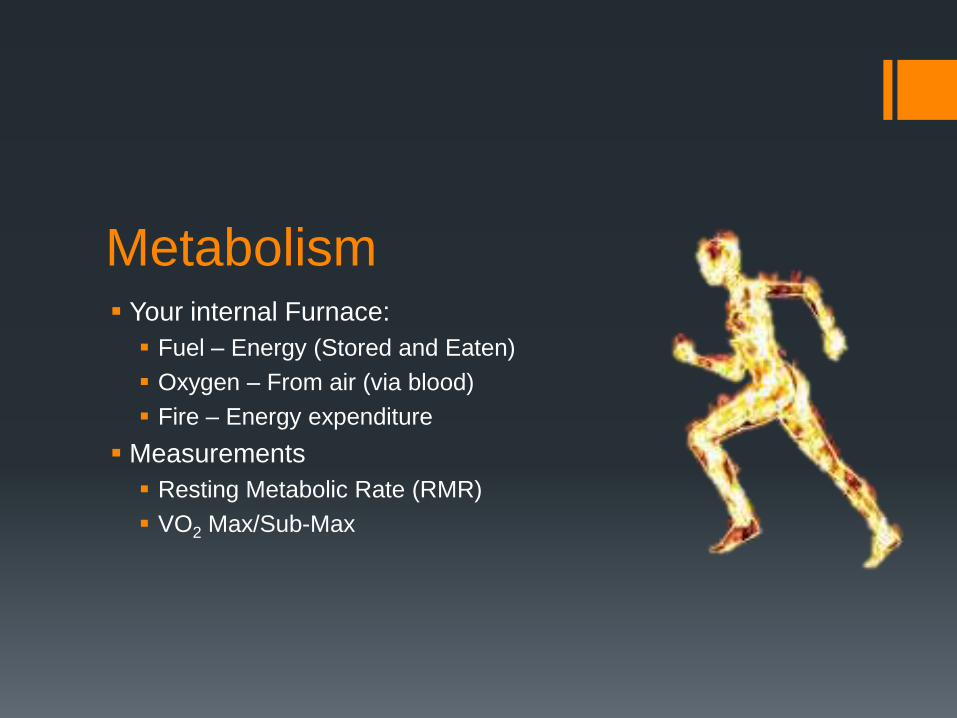
Metabolism Your internal Furnace:
Fuel – Energy (Stored and Eaten)
Oxygen – From air (via blood)
Fire – Energy expenditure
Measurements
Resting Metabolic Rate (RMR)
VO2 Max/Sub-Max
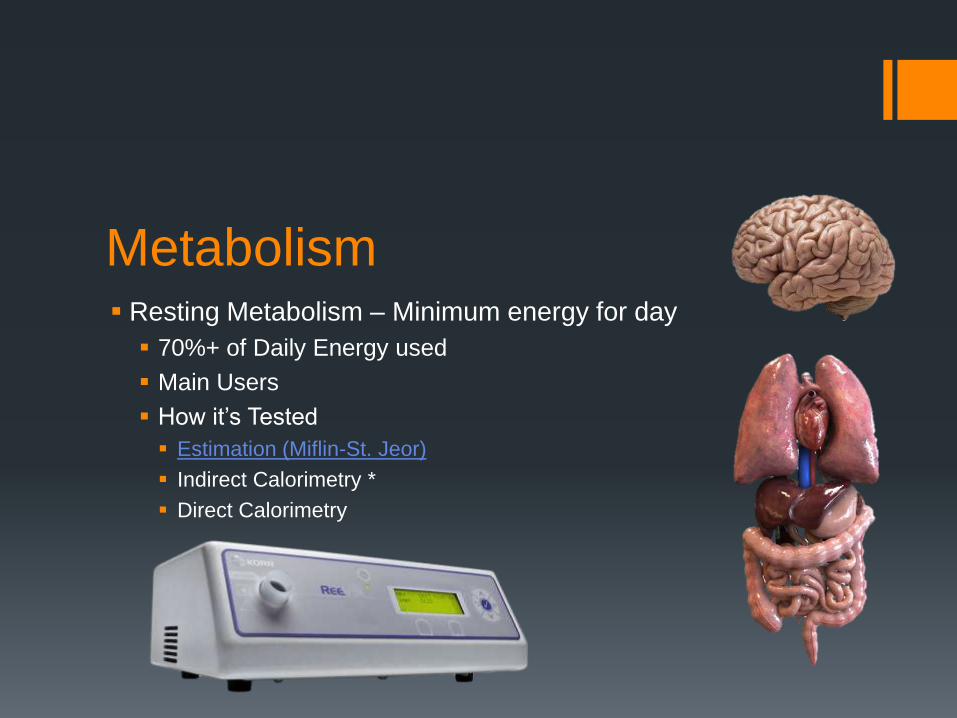
Metabolism Resting Metabolism – Minimum energy for day
70%+ of Daily Energy used
Main Users
How it’s Tested
Estimation (Miflin-St. Jeor)
Indirect Calorimetry *
Direct Calorimetry

Metabolism Resting Metabolism – Minimum energy for day
How long to change?
What affects it?
Eating Habits
Frequency
Quality
Sleeping Habits
VO2 Max

Metabolism VO2 Max – Max Energy Use
Main Users - Muscles
How it’s tested
Indirect Calorimetry
Maximum Work (estimation)
Can be improved!!
Metabolism VO2 Max – Max Energy Use
How long to change?
What affects it? Energy production/availability
Waste disposal
Fitness
How to change…

VO2 = mL/kg/min Calories = VO2 * Wt * 3.18
Metabolism – Units
Oxygen per weight per time
Compare person-to-person
Estimation of energy used
Resting Metabolism VO2 Max
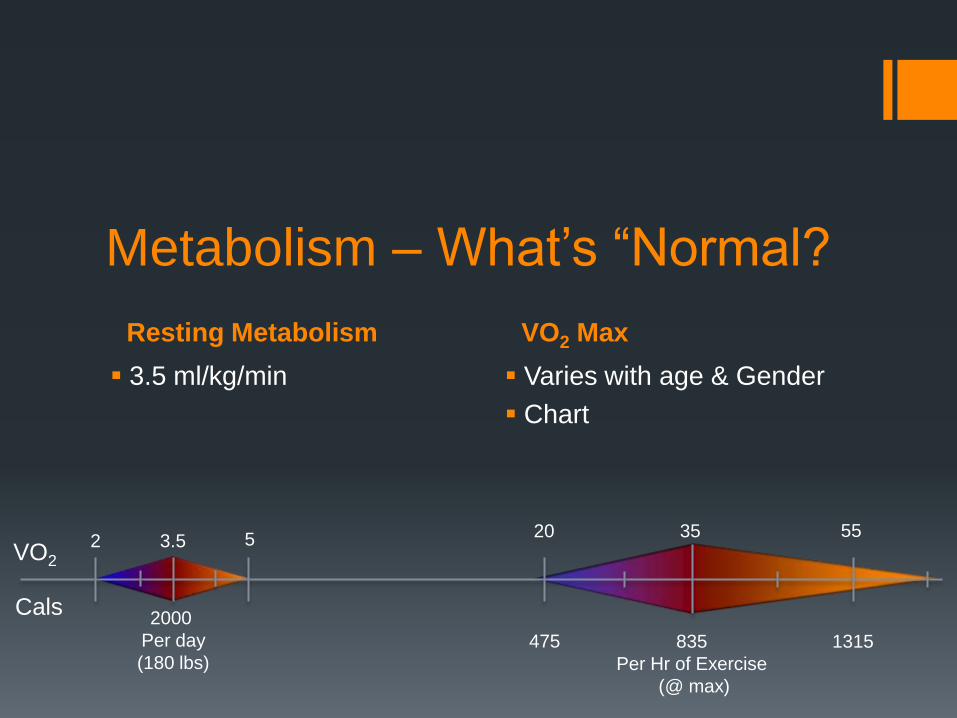
Metabolism – What’s “Normal?
3.5 ml/kg/min Varies with age & Gender
Chart
VO2
Cals
3.5
2000
Per day
(180 lbs)
35525520
835
Per Hr of Exercise
(@ max)
1315475
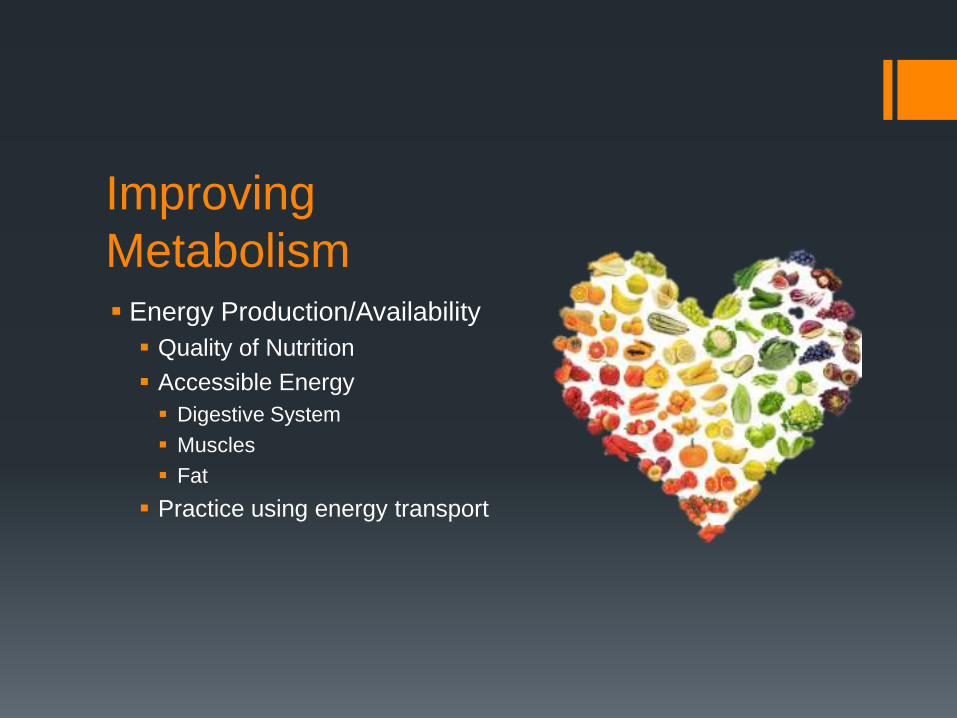
Improving
Metabolism Energy Production/Availability
Quality of Nutrition
Accessible Energy
Digestive System
Muscles
Fat
Practice using energy transport
Improving
Metabolism Waste Disposal
Exercise
Increases blood flow
Increases breakdown
Requires rebuilding
Deep Breaths
Focus on breathing out
Better exchange of gasses

Improving
Metabolism Fitness
“Cardio”
Overload Principle Improve to meet demands
Fatigue limits exercise
Weakest link in chain
breaks first
Change Exercises
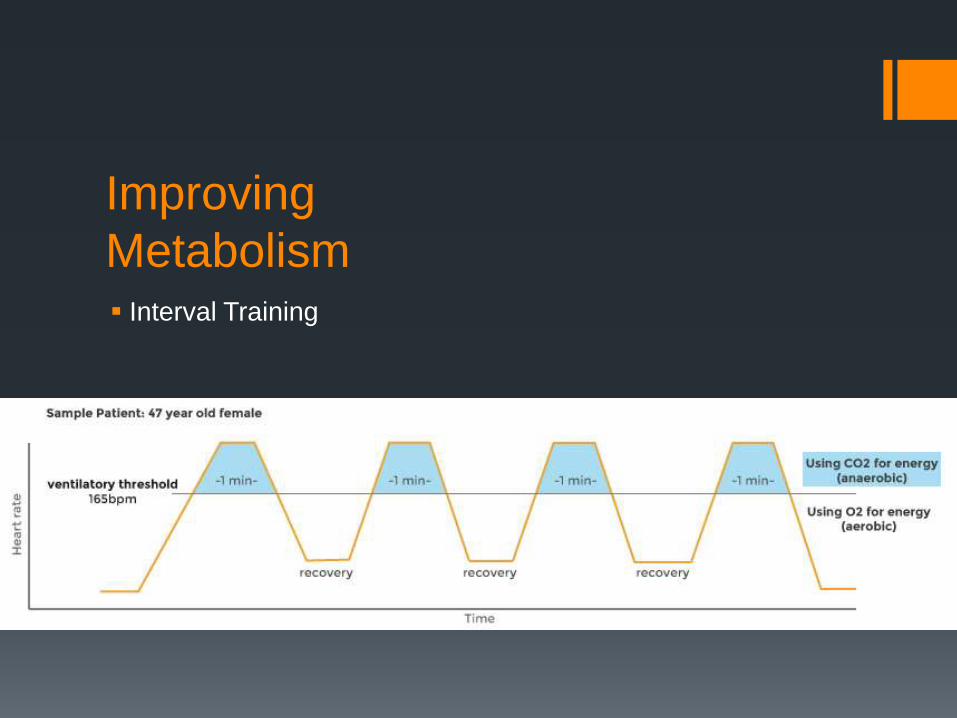
Improving
Metabolism Interval Training

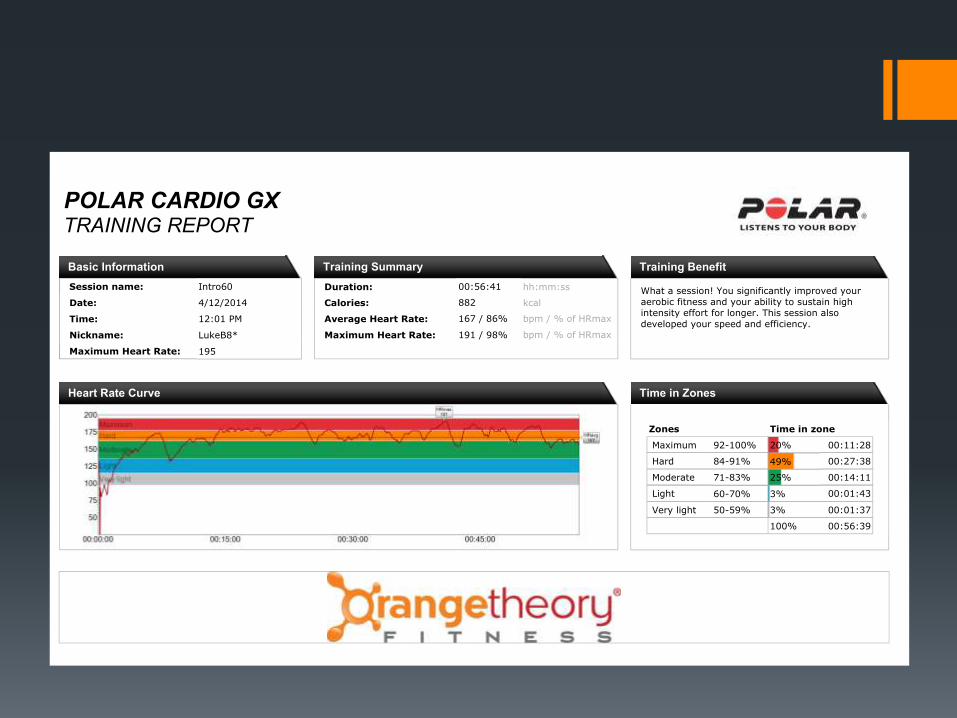
4/12/2014
12:01 PM
LukeB8*
195
00:56:41
882
167 / 86%
191 / 98%
What a session! You significantly improved your
aerobic fitness and your ability to sustain high intensity effort for longer. This session also
developed your speed and efficiency.
Intro60Session name:
Maximum Heart Rate:
Nickname:
Time:
Date: Calories:
Average Heart Rate:
Maximum Heart Rate:
Duration:
Time in zone
3%
25%
49%
20%
00:01:43
00:14:11
00:27:38
00:11:28
00:01:373%Very light 50-59%
92-100%
84-91%
71-83%
60-70%
Maximum
Hard
Moderate
Light
Zones
100% 00:56:39
POLAR CARDIO GXTRAINING REPORT
Heart Rate Curve Time in Zones
Training BenefitTraining SummaryBasic Information
hh:mm:ss
kcal
bpm / % of HRmax
bpm / % of HRmax
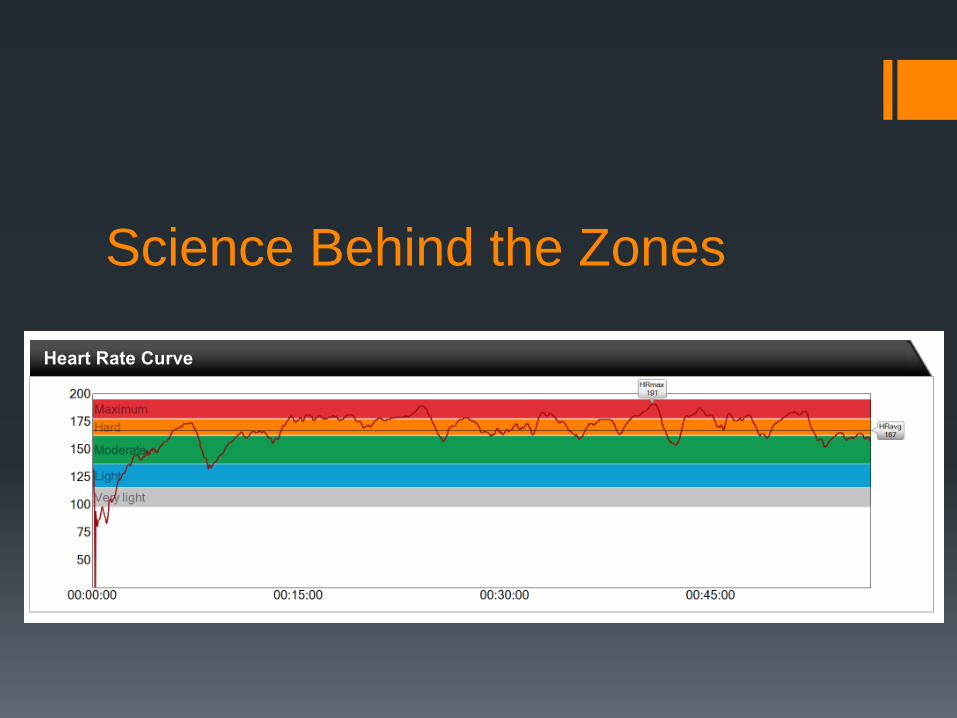
Science Behind the Zones Max Heart Rate
Estimation
Find during VO2
Max
Oxygen Threshold
Overload Energy
System
Fat Burning
4/12/2014
12:01 PM
LukeB8*
195
00:56:41
882
167 / 86%
191 / 98%
What a session! You significantly improved your
aerobic fitness and your ability to sustain high
intensity effort for longer. This session also
developed your speed and efficiency.
Intro60Session name:
Maximum Heart Rate:
Nickname:
Time:
Date: Calories:
Average Heart Rate:
Maximum Heart Rate:
Duration:
Time in zone
3%
25%
49%
20%
00:01:43
00:14:11
00:27:38
00:11:28
00:01:373%Very light 50-59%
92-100%
84-91%
71-83%
60-70%
Maximum
Hard
Moderate
Light
Zones
100% 00:56:39
POLAR CARDIO GXTRAINING REPORT
Heart Rate Curve Time in Zones
Training BenefitTraining SummaryBasic Information
hh:mm:ss
kcal
bpm / % of HRmax
bpm / % of HRmax

Energy Consumption (in workout) Local Energy
Stored within muscles
Increases with fitness
Foreign Energy
Mobilized from other areas
Stored Carbs
Stored Fat
4/12/2014
12:01 PM
LukeB8*
195
00:56:41
882
167 / 86%
191 / 98%
What a session! You significantly improved your
aerobic fitness and your ability to sustain high intensity effort for longer. This session also
developed your speed and efficiency.
Intro60Session name:
Maximum Heart Rate:
Nickname:
Time:
Date: Calories:
Average Heart Rate:
Maximum Heart Rate:
Duration:
Time in zone
3%
25%
49%
20%
00:01:43
00:14:11
00:27:38
00:11:28
00:01:373%Very light 50-59%
92-100%
84-91%
71-83%
60-70%
Maximum
Hard
Moderate
Light
Zones
100% 00:56:39
POLAR CARDIO GXTRAINING REPORT
Heart Rate Curve Time in Zones
Training BenefitTraining SummaryBasic Information
hh:mm:ss
kcal
bpm / % of HRmax
bpm / % of HRmax
Science Behind the Zones4/12/2014
12:01 PM
LukeB8*
195
00:56:41
882
167 / 86%
191 / 98%
What a session! You significantly improved your
aerobic fitness and your ability to sustain high intensity effort for longer. This session also
developed your speed and efficiency.
Intro60Session name:
Maximum Heart Rate:
Nickname:
Time:
Date: Calories:
Average Heart Rate:
Maximum Heart Rate:
Duration:
Time in zone
3%
25%
49%
20%
00:01:43
00:14:11
00:27:38
00:11:28
00:01:373%Very light 50-59%
92-100%
84-91%
71-83%
60-70%
Maximum
Hard
Moderate
Light
Zones
100% 00:56:39
POLAR CARDIO GXTRAINING REPORT
Heart Rate Curve Time in Zones
Training BenefitTraining SummaryBasic Information
hh:mm:ss
kcal
bpm / % of HRmax
bpm / % of HRmax

Energy Consumption (post-workout) Rebuilding/Renewing
Stored within muscles
Increases with fitness
EPOC:
“Excess Post-Exercise
Oxygen Consumption”
Afterburn
Mobilized from other areas
Stored Carbs
Stored Fat
vs.
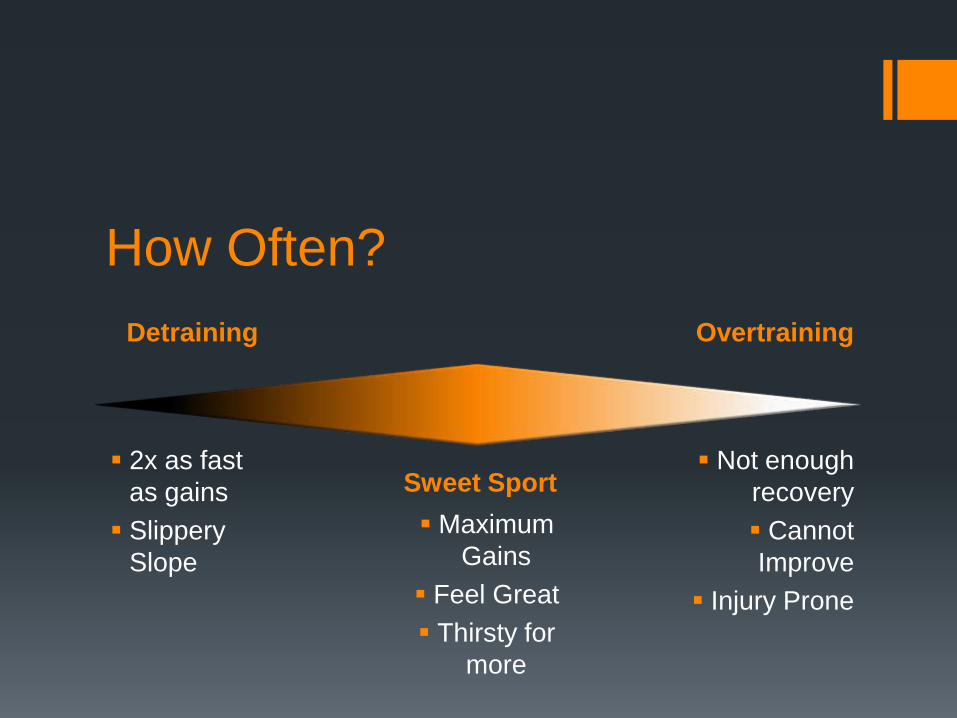
Detraining Overtraining
How Often?
2x as fast
as gains
Slippery
Slope
Not enough
recovery
Cannot
Improve
Injury Prone
Sweet Sport
Maximum
Gains
Feel Great
Thirsty for
more


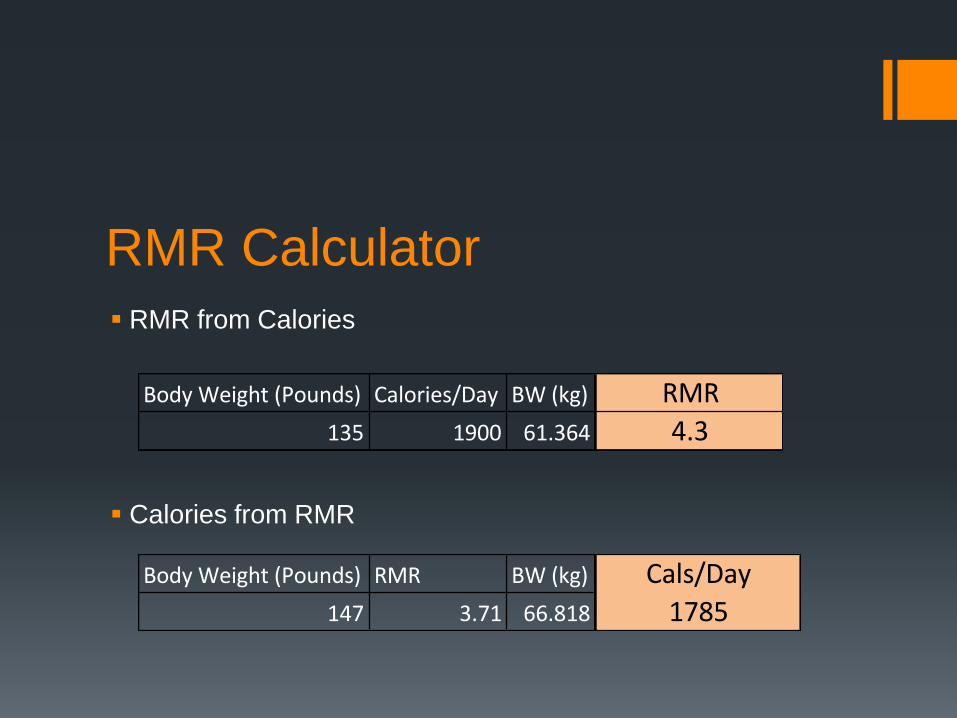
RMR Calculator
RMR from Calories
BodyWeight(Pounds) RMR BW(kg) Cals/Day
147 3.71 66.818 1785
Calories from RMR
BodyWeight(Pounds) Calories/Day BW(kg) RMR
135 1900 61.364 4.3

20f 37.8 30f 36.7 40f 34.5
50f 31.4 60f 28.8 70f 27.6

Related Documents