PPT 8-1 5 th Edition

Welcome message from author
This document is posted to help you gain knowledge. Please leave a comment to let me know what you think about it! Share it to your friends and learn new things together.
Transcript

PPT 8-1
5th Edition5th Edition
PPT 8-2McGraw-Hill/IrwinLevy/Weitz: Retailing Management, 5/e Copyright © 2004 by The McGraw-Hill Companies, Inc. All rights reserved.
Site LocationSite Location
Chapter 8Chapter 8

PPT 8-3
Retailing Strategy
Retail Locations Chapter 7
Site LocationsChapter 8
Human Resource Management
Chapter 9
Information and Distribution Systems Chapter 10
Customer Relationship Management Chapter 11
Retail Market and Financial Strategy
Chapter 5, 6

PPT 8-4
Location Chapters
• Chapter 7
– General Description of the Location Types
– Advantages and Disadvantages of Different Location
– Appendix – Terms and Condition Involved in Leasing Sites
• Chapter 8
– Considerations in Selecting Area for Locating Store
– Issues in Evaluating Specific Sites

PPT 8-5
Three Levels of Analysis
PPT 8-6
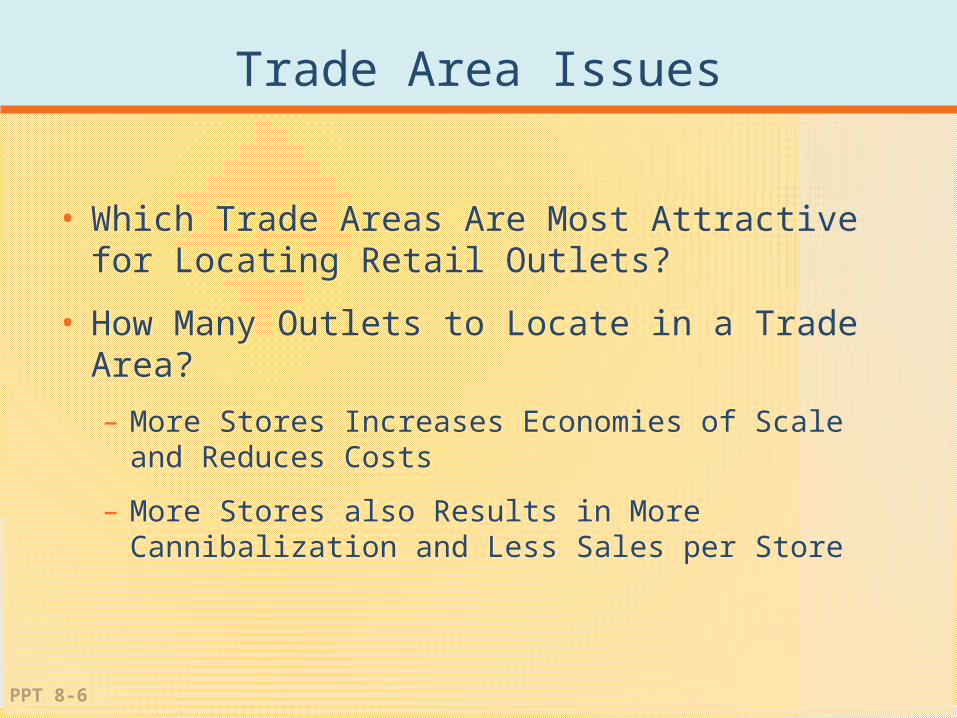
Trade Area Issues
• Which Trade Areas Are Most Attractive for Locating Retail Outlets?
• How Many Outlets to Locate in a Trade Area?
– More Stores Increases Economies of Scale and Reduces Costs
– More Stores also Results in More Cannibalization and Less Sales per Store

PPT 8-7
Factors Affecting Demand for a Region or Trade Area
PPT 8-8
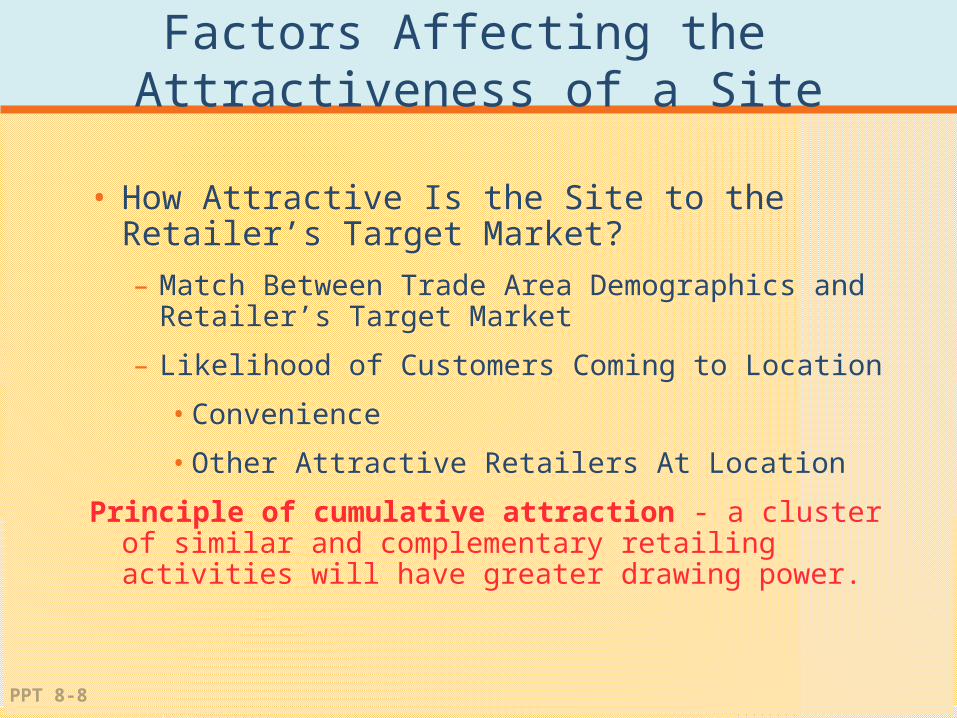
Factors Affecting the Attractiveness of a Site
• How Attractive Is the Site to the Retailer’s Target Market?
– Match Between Trade Area Demographics and Retailer’s Target Market
– Likelihood of Customers Coming to Location
• Convenience
• Other Attractive Retailers At Location
Principle of cumulative attraction - a cluster of similar and complementary retailing activities will have greater drawing power.
PPT 8-9
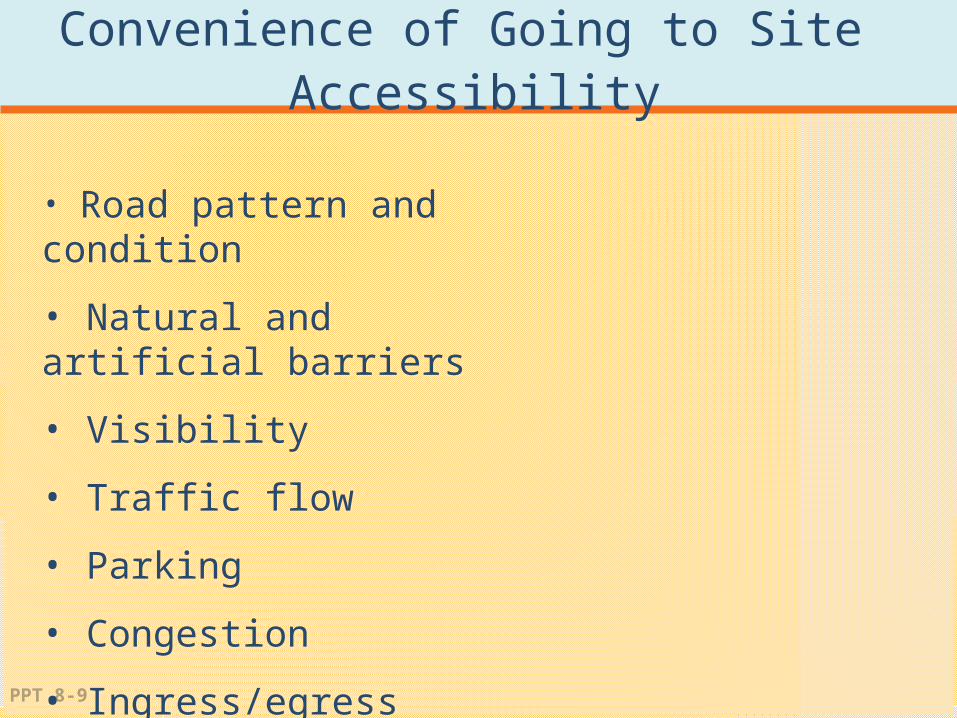
Convenience of Going to Site Accessibility
• Road pattern and condition
• Natural and artificial barriers
• Visibility
• Traffic flow
• Parking
• Congestion
• Ingress/egress
PPT 8-10
• In High Traffic Areas
•Near Anchor
•Center of Shopping Area
• Near Stores Selling Complementary Merchandise
•Clustering Specialty Stores Appealing to Teenagers
• Better locations cost more
Location Within a Center

PPT 8-11
Map of Dallas’ North Park Center

PPT 8-12
Estimating Demand for a New Location
• Definition of the Trade Area
– Primary, Secondary, Tertiary Zones
• Approaches for Estimating Demand
– Analog Approach
– Regression Approach
– Huff Gravity Model

PPT 8-13
Trade Area
Primary zone - 60 to 65 percent of its customers
Secondary zone - 20 percent of a store’s sales
Tertiary zone - customers who occasionally shop at the store or shopping center
PPT 8-14
Factors Defining Trade Areas
•Accessibility
•Natural & Physical Barriers
•Type of Shopping Area
•Type of Store
•Competition
•Parasite Stores

PPT 8-15
Oblong Trade Area Caused by Major Highways and Natural Boundaries
PPT 8-16
Sources of Information
• Customer Spotting
• Census Data
• Geodemographic Information Systems
– ACORN
• Information on Competition
– Yellow Pages

PPT 8-17
Customer Spotting
Purpose: to spot, or locate, the residences of customers for a store or shopping center.
How to obtain data:
• credit card or checks
• customer loyalty programs
• manually as part of the checkout process
• automobile license plates
PPT 8-18
Census Data of the U.S.
.
Only once in 10 years.
Each household in the country is counted to determine the number of persons per household, household relationships, sex, race age and marital status.
PPT 8-19
Geodemographic Information Systems
Demographic data vendors specialize in repackaging and updating census-type data.
Geographic Information System (GIS) is a computer system that enables analysts to visualize information about their customers’ demographics, buying behavior, and other data in a map format.
• GIS is a spatial database that stores the location and shape of information.
• Analysts can identify the boundaries of a trade area and isolate target customer groups

PPT 8-20
Indices for Assessing Sales Potential
• Market Potential Index (MPI)
– Number of Households Purchasing a Product or Service in a Trade Area
• Spending Potential Index (SPI)
– Average Amount Spent on a Product or Service by a Household in a Trade Area
PPT 8-21
Sources for Measuring Competition
• The Internet - lists current locations and future sites.
• Yellow Pages
• Other Sources: Directories published by trade associations, chambers of commerce, Chain Store Guide, International Council of Shopping Centers, Urban Land Institute, local newspaper advertising departments, municipal and county governments, specialized trade magazines, list brokers

PPT 8-22
Measuring Competition
• Calculate total square footage of retail space
devoted to a type of store per household
• Higher ratios will indicate higher levels of
competition

PPT 8-23
Competitive Analysis for Edward Breiner

PPT 8-24
Methods for Estimating Demand
Analog Approach
Multiple Regression Analysis
Huff’s Model

PPT 8-25
The Analog Approach
1. Current trade area is determined by using the customer spotting technique.
2. Based on the density of customers from the store, the primary, secondary and tertiary trade area zones are defined.
3. Match the characteristics of our current store with the potential new stores’ locations to determine the best site.
3 Steps:

PPT 8-26
Income Distribution of Three-Mile Ring Surrounding Edward Breiner Optical
PPT 8-27
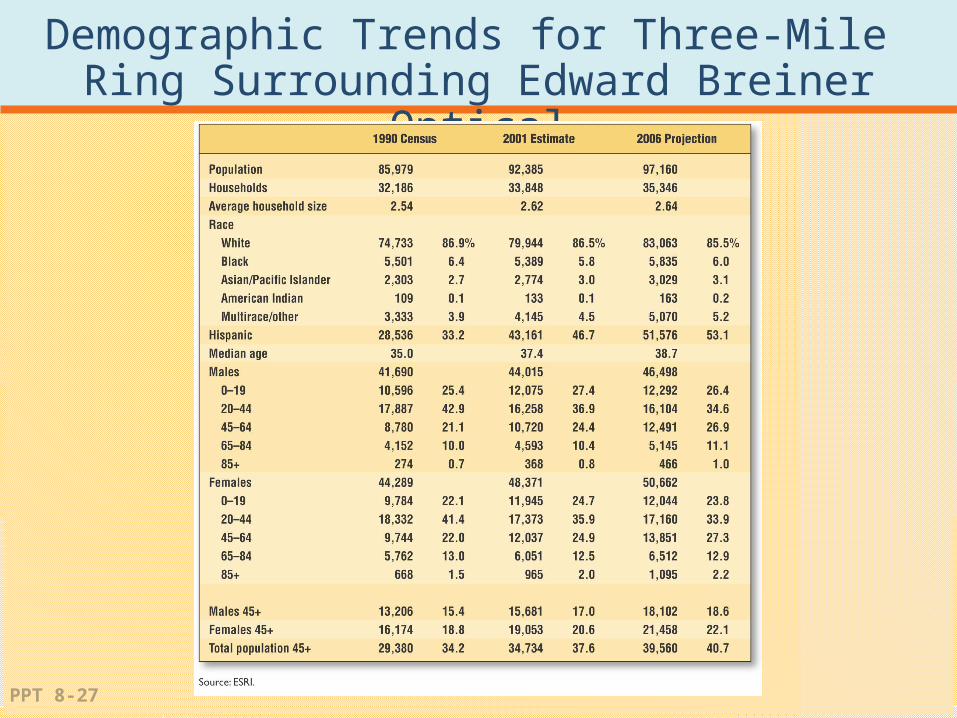
Demographic Trends for Three-Mile Ring Surrounding Edward Breiner Optical

PPT 8-28
ACORN Neighborhood Lifestyle Clusters for Three-Mile Ring
Breiner Optical

PPT 8-29
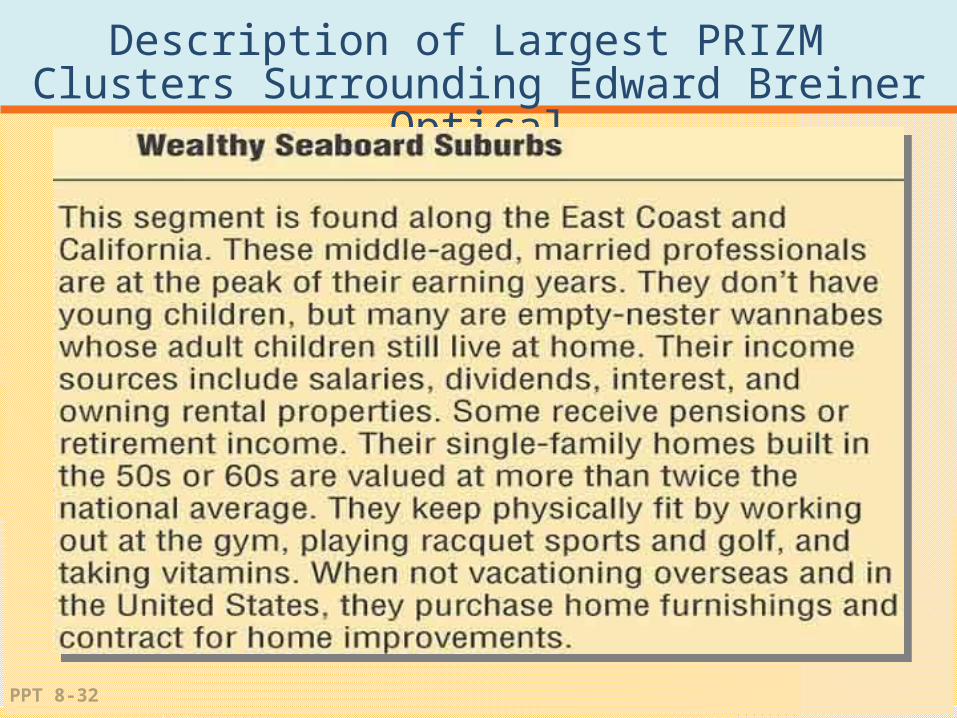
Descriptions of Largest PRIZM Clusters Surrounding Edward Breiner Optical

PPT 8-30
Description of Largest PRIZM Clusters Surrounding Edward Breiner Optical

PPT 8-31
Description of Largest PRIZM Clusters Surrounding Edward Breiner Optical
PPT 8-32
Description of Largest PRIZM Clusters Surrounding Edward Breiner Optical

PPT 8-33
Descriptions of Edward Breiner Optical and Four Potential Locations’ Trade Areas
PPT 8-34
Multiple Regression Analysis
• Need to define the retail trade area potential for retail chains with greater than 20 stores.
• Similar to the analog approach, it uses statistics rather than judgement to predict sales for a new store.

PPT 8-35
Multiple Regression Steps
• Current trade areas are determined by using the customer spotting technique
• Primary, secondary, and tertiary zones are determined by plotting customers on a map
• Select appropriate measures of performance, such as per capita sales or market share.
• Select a set of variables that may be useful in predicting performance.
• Solve the regression equation and use it to project performance for future sites.

PPT 8-36
Yearly Sales, Population, and Income for 10 Home Improvement Centers
PPT 8-37
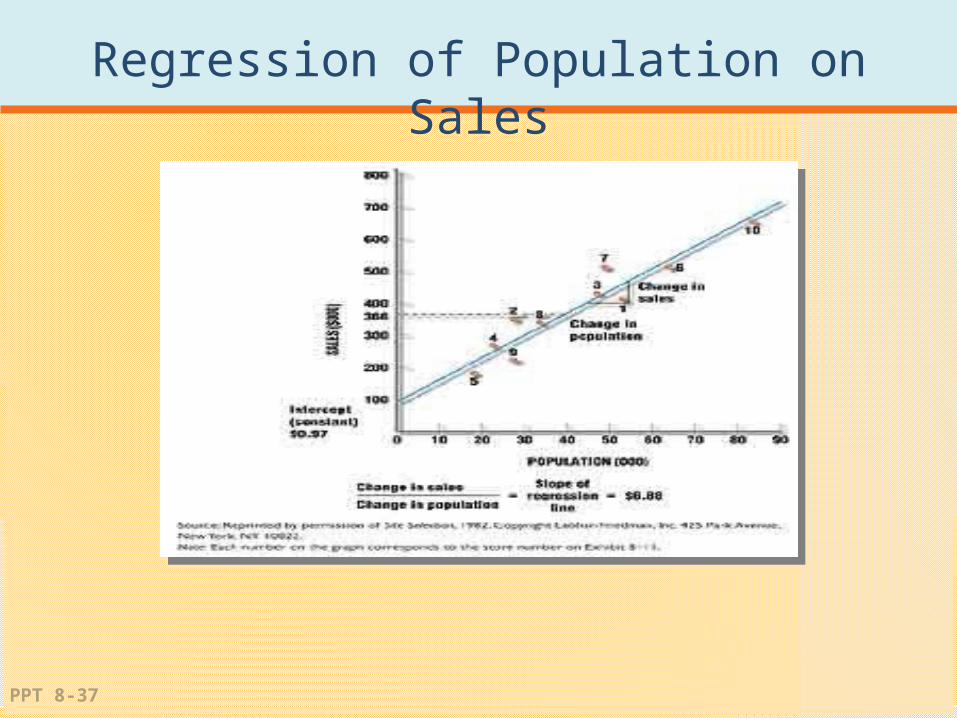
Regression of Population on Sales

PPT 8-38
Illustration of Regression Approach
1. Specify Regression Model – Identify Critical Predictors of Store Sales
Sales = B0 + B1 x X1 + B2 x X2
X1 = population in trade area
X2 = average household income in trade area
2. Estimate Weights - B0,B1, B2
3. Use Estimated Weights to Forecast sales
Sales = -144,146 + 6,937 x X1 + 10,132 x X2
Sales = -144,146 + 6,937 x 55,000 + 10,132 x 28,000 = $521,085

PPT 8-39
Huff’s Gravity Model
Based on the premise that the probability that a given customer will shop in a particular store
or shopping center becomes larger as the size of store or center grows and distance or
travel time from customer shrinks

PPT 8-40
Huff’s Model Formula
tripsshopping of kinds different on time travelofeffect thereflects that oexponent tAn
center shopping point to starting scustomer' from distanceor timeTravel
center shopping of Size
center shopping particular a to travelingorigin ofpoint given aat customer a ofy Probabilit
Where
ijT b
ijT
jj S
jiijP
n
1jb
ijTjS
bijTjS
ijP

PPT 8-41
University and Shopping Centers: Gravity Model Illustration

PPT 8-42
Huff’s Model: The Solution
Pij = 1000 32
(1000 32) + (500 52) + (100 12)
Probability = .48
.48 x 12,000 students = 5,760 customers
5,760 customers x $150 = $864,000
• Repeat steps 1 to 3 for the remaining areas and then sum them.
Related Documents