Escola Tècnica Superior d’Enginyeria Industrial de Barcelona Treball de Fi de Màster Máster Universitario en Logística, Transporte y Movilidad PPP on Toll Road in Indonesia MEMÒRIA & ANEXOS Autor: Tomás Herrero Diez Director: Alvar Garola Crespo Convocatòria: Septiembre 2015

Welcome message from author
This document is posted to help you gain knowledge. Please leave a comment to let me know what you think about it! Share it to your friends and learn new things together.
Transcript
Escola Tècnica Superior d’Enginyeria Industrial de Barcelona
Treball de Fi de Màster
Máster Universitario en Logística, Transporte y Movilidad
PPP on Toll Road in Indonesia
MEMÒRIA & ANEXOS
Autor: Tomás Herrero Diez Director: Alvar Garola Crespo Convocatòria: Septiembre 2015

2
PPP on Toll Road in Indonesia Tomás Herrero Diez
Build-Operate-Transfer (BOT)
The development of transport infrastructure is critical to boost the economic growth in
developing countries. However, transport infrastructure is capital-intensive and public funds
are limited. In this context, private sector participation should be encouraged to decrease the
burden of the governments in terms of financing.
Indonesia is the fourth most populated country in the world and its economy has been steadily
growing during the last decade. Nevertheless, the country faces several challenges due to the
underdeveloped and irregular distribution of transport infrastructure around the country.
The Master Plan for Acceleration and Expansion of Indonesia's Economic Development (MP3EI)
includes the construction of thousands of kilometers of roads. PPPs are expected to play an
important role in the implementation of this Plan. In this sense, the government holds a
proactive approach and as a result, a regulatory framework for PPPs has been established.
The main objective of this dissertation is to determine whether toll road projects are
economically and financially viable in Indonesia and, consistently define the most suitable
financing schemes to be adopted.
A Cost Benefit Analysis (CBA) has been conducted in order to assess the economic welfare
gain, as well as to conclude whether this projects would be commercially feasible. One of the
most attractive sections of the Trans Sumatra toll road, in terms of traffic forecast and initial
investment, has been analyzed for this purpose.
The relevant economic impacts have been identified, monetized, and discounted using a
certain social discount rate to determine the economic performance. Moreover, all the
financial outflows and inflows have been calculated and discounted using a certain financial
discount rate to establish the cash flow streams.
The economic and financial indicators obtained show that even toll roads socio-economically
desirable are financially unfeasible. Hence, mixed financing schemes have been proposed
including public incentives to attract private investors.
A Build-Operate-Transfer (BOT) agreement between public and private parties is considered
the more appropriate model to develop toll roads in Indonesia. It is essential to identify the
risks related to the project; paying special attention to which party – the public or the private
sector – will be mainly responsible for the planning and implementation of the mitigation
measures and the management of such risks. Several financing schemes with different initial
investment distributions, responsibilities, and risk allocations have been proposed.
The conclusion drawn is that major initial investment covered by the private or public party
implies greater financial profitability for the private party and smaller incurred cost for the
public party respectively. However, it should be considered that more responsibility and
financial risk will be assumed too.
Based on the proposed schemes, the development of toll roads in Indonesia would be
commercially viable under BOT financing schemes sharing the initial investment between
public and private parties and establishing shadow tolls. An agreement regarding the portion
of initial investment covered by each party and the shadow tolls compensation should be
clearly defined in the PPP contract.
ABSTRACT

3
PPP on Toll Road in Indonesia Tomás Herrero Diez

4
PPP on Toll Road in Indonesia Tomás Herrero Diez
El desarrollo de infraestructuras del transporte es crítico para impulsar el crecimiento económico de los países emergentes. Sin embargo, estas infraestructuras requieren grandes inversiones y los recursos públicos son limitados. En este marco, se debe fomentar la participación del sector para disminuir la carga financiera del gobierno.
Indonesia es el cuarto país más poblado del mundo, con una economía que ha crecido de forma sostenida en la última década. Sin embargo, el país se enfrente a varios retos derivados del subdesarrollo y la distribución irregular de sus infraestructuras del transporte.
El Master Plan for Acceleration and Expansion of Indonesia's Economic Development (MP3EI) incluye la construcción de miles de kilómetros de carreteras. Se espera que los PPP jueguen un destacado papel en la implementación de este plan. En este contexto, el gobierno mantiene un postura proactiva y como resultado se ha establecido un marco regulatoria para los PPP.
El principal objetivo de esta tesis es determinar si las carreteras de peaje son económica y financieramente viables en Indonesia y definir, en consecuencia, los esquemas de financiación más adecuados para ser adoptados.
Un Análisis Coste Beneficio (ACB) ha sido llevado a cabo para evaluar el bienestar económico generado, así como concluir si el proyecto sería comercialmente viable. Una de las secciones más atractivas de la carretera de peaje Trans Sumatra, en cuanto a previsión de tráfico e inversión inicial se refiere, ha sido analizada con este propósito.
Todos los impactos económicos relevantes han sido identificados, monetizados y descontados usando una cierta tasa de descuento social para determinar el rendimiento económico. Así mismo, todos los flujos financieros han sido calculados y descontados usando una cierta tasa de descuento financiera para evaluar los flujos de caja generados por el proyecto.
Los indicadores económicos y financieros obtenidos muestran que incluso las carreteras de peaje socio-económicamente deseables, son financieramente inviables. Por tanto, esquemas mixtos de financiación, incluyendo incentivos públicos, han sido propuestos para atraer inversores privados.
Los acuerdos del tipo Build-Operate-Transfer (BOT) entre los sectores público y privado se consideran los más apropiados para desarrollar carreteras de peaje en Indonesia. Es esencial identificar los riesgos relacionados con el proyecto, prestando especial atención a quién – el sector público o privado – será el responsable principal de la planificación e implementación de medidas de mitigación para la gestión de dichos riesgos. Varios esquemas financieros con diferente distribución de la inversión inicial, responsabilidades y riesgos han sido propuestos.
La conclusión extraída ha sido que en cuanto mayor sea la inversión inicial cubierta por cualquiera de las partes, mayor será la rentabilidad financiera para el sector privado y menor los costes totales incurridos por el sector púbico respectivamente. Sin embargo, se debe tener en cuenta, que también mayor responsabilidad y riesgo financiero serán asumidos.
Basándose en los esquemas propuestos, el desarrollo de carreteras de peajes en Indonesia sería comercialmente viable bajo un esquema BOT compartiendo la inversión inicial entre las partes públicas y privadas y estableciendo peajes sombra. El acuerdo alcanzado entre los actores respecto a la parte de la inversión inicial cubierta por cada uno y la cuantía de los peajes sombra deben quedar claramente definidos en el contrato del PPP.
RESUMEN

5
PPP on Toll Road in Indonesia Tomás Herrero Diez
6
PPP on Toll Road in Indonesia Tomás Herrero Diez
INDEX
1. INTRODUCTION & OBJETIVES ..................................................................................... 10
2. BACKGROUND ............................................................................................................ 12
2.1. Transport Infrastructures in Indonesia ........................................................................... 13
2.2. Toll Roads in Indonesia .................................................................................................... 14
2.3. Public Private Partnerships in Indonesia ......................................................................... 16
3. TRANS SUMATRA TOLL ROAD ..................................................................................... 18
3.1. Section Palembang - Indralaya ........................................................................................ 20
4. DATA COLLECTION ..................................................................................................... 22
4.1. Methodology ................................................................................................................... 22
4.1.1. Survey design ...................................................................................................... 22
4.1.2. Survey administration ......................................................................................... 23
4.1.3. Discussion of results ............................................................................................ 24
4.2. Adequacy of data ............................................................................................................ 24
5. TARIFF ESTIMATION ................................................................................................... 26
6. TRAFFIC STUDY .......................................................................................................... 30
7. COST BENEFIT ANALYSIS (CBA) .................................................................................... 34
7.0. Methodology .................................................................................................................. 34
7.1. Economic analysis ........................................................................................................... 35
7.1.1. Identification of impacts ..................................................................................... 35
7.1.2. Quantifiable impacts ........................................................................................... 36
7.1.3. Social Discount Rate (SDR) .................................................................................. 45
7.1.4. Economic Analysis Indicators .............................................................................. 46
7.2. Financial Analysis............................................................................................................. 49
7.2.1. Determining Outflows and Inflows ..................................................................... 49
7.2.2. Financial Discount Rate (FDR) ............................................................................. 50
7.2.3. Financial Analysis Indicators ................................................................................ 51
8. RISK ASSESSMENT ...................................................................................................... 54
8.1. Risk identification ............................................................................................................ 54
8.2. Risk allocation.................................................................................................................. 57
8.3. Risk mitigation ................................................................................................................. 58
9. FINANCING STRUCTURE .............................................................................................. 60

7
PPP on Toll Road in Indonesia Tomás Herrero Diez
9.1. Financing Scheme 1. ........................................................................................................ 62
9.2. Financing Scheme 2. ........................................................................................................ 64
9.3. Discussion of results ........................................................................................................ 66
10. SENSITIVITY ANALYSIS ................................................................................................ 68
10.1. Traffic growth .......................................................................................................... 68
10.2. Toll tariff .................................................................................................................. 68
11. CONCLUSION.............................................................................................................. 70
12. ACKNOWLEDGMENT .................................................................................................. 72
13. BIBLIOGRAPHY ........................................................................................................... 74
14. ANNEXES ................................................................................................................... 82
Annex A. SP Survey .................................................................................................................. 82
Annex B. Operation and Maintenance Cost ............................................................................ 85
Annex C. Passenger’s time savings .......................................................................................... 90
Annex D. Savings in Vehicle Operation Costs (VOC) ............................................................... 91
Annex E. Traffic accident reduction benefits .......................................................................... 92
Annex F. Cost and Benefits discounted and ENPV .................................................................. 93
Annex G. Toll Revenue. ........................................................................................................... 94
Annex H. Outflows and inflows discounted and FNPV ........................................................... 95
Annex I. Shadow Toll under Financing Scheme No 1 .............................................................. 96
Annex J. Cash flows under Financing Scheme 1 ..................................................................... 97
Annex K. Shadow Toll under Financing Scheme 2 .................................................................. 98
Annex L. Cash flows under Financing Scheme 2 .................................................................... 99
Annex M. Cash flows under Financing Scheme 2 (b) ........................................................... 100
Annex N. Public costs. ........................................................................................................... 101
Annex O. Sensitivity analysis of the traffic growth .............................................................. 102
Annex P. Sensitivity analysis of the tariff ............................................................................. 104

8
PPP on Toll Road in Indonesia Tomás Herrero Diez
[Table 2.1] Indonesia’s National Medium-Term Development Plan for
Toll Roads 2015-2019. 15
[Table 2.2] Jasa Marga’s key figures. 16
[Table 4.1] Speed, distance and travel time. Non-toll road vs. future toll road.
22
[Table 4.2] Value of the time (VOT) – South Sumatra. 23
[Table 5.1] Stata results (coefficients βFARE, βTIME and constant). 26
[Table 5.2] Comparison between toll tariffs in Indonesia and Spain. 28
[Table 6.1] Traffic data section Palembang – Indralaya (two ways). 30
[Table 6.2] Traffic forecast Palembang – Indralaya (two ways). 31
[Table 7.1] Value of travel time saved (constant prices). 40
[Table 7.2] Vehicle Operating Cost (IDR/Km). 40
[Table 7.3] Saving in vehicle operations costs (constant prices). 41
[Table 7.4] Evolution of traffic accidents in Indonesia. 41
[Table 7.5] Value for casualties in Indonesia. 42
[Table 7.6] Traffic accident reduction benefits (constant prices). 42
[Table 7.7] Economic Indicators. 47
[Table 7.8] Economic Indicators. 48
[Table 7.9] Economic Indicators. 49
[Table 7.10] Toll revenue evolution (constant prices). 50
[Table 7.11] Estimation of long-term annual financial rate of return. 51
[Table 7.12] Financial Indicators. 52
[Table 7.13] Financial Indicators. 53
[Table 8.1] Risks allocation. 58
[Table 9.1] Financing schemes. 61
[Table 9.2] Shadow toll evolution. 64
[Table 9.3] Financial indicators under Scheme One. 64
[Table 9.4] Shadow toll evolution. 66
[Table 9.5] Financial indicators under Scheme Two. 66
[Table 9.6] Comparison both schemes under private perspective. 67
[Table 9.7] Comparison both schemes under public perspective (IDR Billion).
67
[Table 10.1] Sensitivity analysis of traffic volume, present values 2018. 68
[Table 10.2] Sensitivity analysis of toll tariff, present values 2018. 69
INDEX OF TABLES

9
PPP on Toll Road in Indonesia Tomás Herrero Diez
[Chart 2.1] Population distribution in Indonesia. 12
[Chart 2.2] Roads development in Indonesia in the last ten years. 13
[Chart 2.3] Area, population, length of roads and number of vehicles in Indonesia by region.
14
[Chart 2.4] Number of PPP infrastructure project in Indonesia, by province.
17
[Chart 3.1] Trans Sumatra Toll Road project. 18
[Chart 3.2] Location of South Sumatra Province and Ogan Ilir Regency. 20
[Chart 3.3] Palembang – Indralaya Toll Road Route Plan. 21
[Chart 4.1] Sample choice-based SP questionnaire. 23
[Chart 6.1] Vehicles classes in Indonesia. 30
[Chart 7.1] Identification of relevant impacts for economic analysis. 36
[Chart 7.2] Initial Investment for Palembang – Indralaya toll road (constant 2018 prices).
37
[Chart 7.3] Trans Sumatra connectivity impacts. 43
[Chart 7.4] Economic benefits distribution.. 47
[Chart 7.5] Outflows and inflows for Palembang – Indralaya toll road. 50
[Chart 9.1] Financing Scheme Number 1. 63
[Chart 9.2] Financing Scheme Number 2. 65
INDEX OF CHARTS
10
PPP on Toll Road in Indonesia Tomás Herrero Diez
1. INTRODUCTION & OBJETIVES
The development of infrastructures is vital to boost the economic growth and fight poverty in
developing countries. Improving transport, energy, water, and telecommunication
infrastructures enables people to take advantage of economic opportunities and access
markets, jobs, information, and services as well (such as health, education, etc.).
However, since funds are limited, when it comes to infrastructure activities, it is critical to
evaluate the value for money effectively. The Investments in projects with greater socio-
economic benefit should be prioritized. Quality infrastructures will work as a multiplier
enabling further development.
The analysis of infrastructures in developing countries arises in this dissertation. The aim is to
determine whether a toll road, which will be essential to guaranty the connectivity of a
developing country, can be financed sharing public and private funds.
A Cost Benefit Analysis (CBA) will be conducted in order to evaluate whether the toll roads are
economically and financially feasible in Indonesia. One of the most attractive sections of the
Trans Sumatra (Palembang – Indralaya), in terms of traffic forecast and initial investment, will
be analyzed for this purpose. Several financing schemes will be proposed and discussed in
order to determine the most suitable collaboration agreement between public and private
stakeholders.
The main objectives of this dissertation are as follows:
To define the infrastructure frame and the structure of PPP operations in Indonesia.
To compare the tariff analysis results with the level of income and willingness to pay.
To apply the cost-benefit methods designed for developed countries to emerging
countries.
To identify, allocate and mitigate the main risks associated with toll roads projects in
Indonesia.
To analyze infrastructure financing schemes in developing countries.
To establish the most suitable Public Private Partnership (PPP) agreement in
developing countries to be used as started point in the draft of the contract prior to
launch the tender.

11
PPP on Toll Road in Indonesia Tomás Herrero Diez

12
PPP on Toll Road in Indonesia Tomás Herrero Diez
2. BACKGROUND
The Republic of Indonesia has a total population of approximately 250 million as of 20141,
which is the fourth largest in the world. The country has made remarkable progress over the
past decade in terms of macroeconomic and political stability. The economy in Indonesia has
been steadily growing at 5.8% in the last decade. The economic growth rate was 5.1% in 2014
and it is projected to be 5.2% in 20152.
Successful implementation of priority infrastructure projects will be essential for Indonesia to
emerge as a strong middle income country. To this end, the government’s program highlights
the need for investments to enhance efficiency and reduce spatial disparities in access to
infrastructures.
A remarkable characteristic of Indonesia is that the western part of the country has a
significantly larger contribution share to the nation's GDP growth. Java and Sumatra together
contribute more than 80% of Indonesia’s total GDP3. Java gathers around 60% of Indonesia’s
population (143 million in 20144) and contributes 58% of Indonesia’s GDP5. Sumatra has a
population of over 55 million as of 2015 (22% of Indonesia’s total population6) and contributes
24% of Indonesia’s GDP5.
Chart 2.1. Population distribution in Indonesia
Source: Encyclopedia Britannica Inc., “Indonesia: Population Density”, http://www.britannica.com/EBchecked/media/138387/Population-density-of-Indonesia, 2009.
1 The World Bank, “Indonesia. Country at glance”, http://www.worldbank.org/en/country/indonesia, 2013. 2 The World Bank “Indonesia to Grow by 5,2 Percent in 2015: World Bank report”, http://www.worldbank.org/en/news/press-release/2014/12/08/indonesia-to-grow-by-5-2-percent-in-2015-world-bank-report, December 9, 2014. 3 Indonesia Investment, “Indonesia's Most Populous Island Java Continues to Dominate the Economy”, http://www.indonesia-investments.com/news/todays-headlines/indonesias-most-populous-island-of-java-continues-to-dominate-the-economy/item972, August 3, 2013. 4 Kementerian Kesehatan Republik Indonesia, “Estimasi Penduduk Menurut Umur Tunggal Dan Jenis Kelamin”, http://www.depkes.go.id/resources/download/general/Penduduk%20Kab%20Kota%20Umur%20Tunggal%202014.pdf, January 27, 2014 5 Badan Pusat Statistik (Statistics Indonesia), “Percentage Distribution of Gross Regional Domestic Product at Current Market Prices by Provinces”, http://www.bps.go.id/linkTabelStatis/view/id/1625, 2000-2013. 6 Badan Pusat Statistik (Statistics Indonesia), “Population Projection by Province, 2010-2035”, http://www.bps.go.id/linkTabelStatis/view/id/1625, 2010.

13
PPP on Toll Road in Indonesia Tomás Herrero Diez
2.1. Transport Infrastructures in Indonesia
Road transport is the predominant transport mode in Indonesia, accounting for about 70% of
freight ton-km and 82% of passenger km7.
The total length of roads reached about 508,000 km in 2013; out of which, 38,570 km were
under the state responsibility, 53,642 km under provincial responsibility, and 415,788 km
under district responsibility8. Indonesia’s road network is growing at a healthy pace: 30% in
the last ten years.
Chart 2.2. Roads development in Indonesia in the last ten years
Source: Own elaboration using data from Badan Pusat Statistik (Statistics Bureau Indonesia).
Regarding road condition, 56.68% of the total length of the country is paved. The national
road network is in good condition with 95% paved and 81% in good and fair condition. The
provincial road network is also predominantly in good or fair condition. However, when it
comes to district rural and urban roads, only 50% of the network is in reasonable condition.
The number of motor vehicles registered by the State Police was around 27 million in 2003 and
104 million in 2013 (excluded East Timor). The motor vehicles’ composition in 2013 was the
following: 81.4% motorcycles, 11.0% passenger cars, 5.4% trucks, and 2.2% buses9.
Java and Sumatra, with 28% of Indonesia’s land area, account for 61% of the road network and
83% of the motor vehicles in the country. At the other end of the spectrum, Maluku and
Papua, with 25% of the land area, account for 6.3% of the network and 1% of the total motor
vehicles10.
7 The World Bank, “Transport in Indonesia”, http://web.worldbank.org/WBSITE/EXTERNAL/COUNTRIES/EASTASIAPACIFICEXT/EXTEAPREGTOPTRANSPORT/0,,contentMDK:20458729~menuPK:2066318~pagePK:34004173~piPK:34003707~theSitePK:574066,00.html. 8 Badan Pusat Statistik (Statistics Indonesia), “Length of Road By Level of Government Responsibility Indonesia, 1987-2013 (Km)” and “Length of Road by Type of Surface Indonesia, 1957-2013 (Km)”, http://www.bps.go.id/linkTableDinamis/view/id/808, http://www.bps.go.id/linkTableDinamis/view/id/820, 2015. 9Badan Pusat Statistik (Statistics Indonesia), “Number of Motor Vehicles by Types, Indonesia 1987-2013”, http://www.bps.go.id/linkTabelStatis/view/id/1413, 2015. 10 OECD, “Structural Policy Country Notes. Indonesia”, http://www.oecd.org/dev/asia-pacific/Indonesia.pdf ,2013
350
370
390
410
430
450
470
490
510
530
2003 2004 2005 2006 2007 2008 2009 2010 2011 2012 2013
kms
Tho
usa
nd
s

14
PPP on Toll Road in Indonesia Tomás Herrero Diez
Chart 2.3. Area, population, length of roads and number of vehicles in Indonesia by region.
Source: OCDE.
2.2. Toll Roads in Indonesia The history of toll roads in Indonesia dates back to the late 1970’s, when in 1978, the first toll
road was developed and opened in the country. Again in the early 1990’s, the focus turned
back to toll roads. However, this effort did not add significantly to the network density and,
after that, toll road development remained stagnated in the country for over a decade. Today,
in 2015, the total length of toll roads in operation is only slightly over 800 km, covering mainly
urban areas. According to the Indonesian Ministry of Public Works, the country’s toll road
network constitutes less than a third of the estimated needs of 2,400 km11.
Indonesia’s progress in toll road development has been extremely slow up to date. Some
projects have not reached financial closure after ten years and private investment has been
relatively small – around 30% of the toll road network has been developed by private
consortia12. More than 35 years have not sufficed to place the country at the level of other
neighbors in the region, such as Malaysia, Thailand, or the Philippines, which have larger
expressways densities11. Indonesia also lags far behind China, which began its toll road
development in the 1980’s and has already constructed over 65,000 km13.
Indonesia’s road network currently includes 820.2 km of toll roads, which represent less than
0.2% of the total road network13. Although toll roads are such a small portion of the total road
network in Indonesia, their utilization rate is 4%, considerably high when compared to one
third of the utilization rate of district roads, which represent 80% of the total network length11.
11 The World Bank, “Road Sector Public Expenditure Review 2012. Investing in Indonesia’s Roads: Improving Efficiency and Closing
the Financial Gap”,
http://www-
wds.worldbank.org/external/default/WDSContentServer/WDSP/IB/2012/10/19/000356161_20121019033252/Rendered/PDF/733
030WP0Indon00disclosed0100180120.pdf, June 2012. 12 The World Bank, “Transport in Indonesia”, http://web.worldbank.org/WBSITE/EXTERNAL/COUNTRIES/EASTASIAPACIFICEXT/EXTEAPREGTOPTRANSPORT/0,,contentMDK:20458729~menuPK:2066318~pagePK:34004173~piPK:34003707~theSitePK:574066,00.html. 13Australian Aid, Mamay Sukaesih for the Investor Daily, “Weekly Infrastructure News: Realising 1,000 km of Toll Roads”, http://indii.co.id/index.php/en/news-publication/weekly-infrastructure-news/realising-1-000-km-of-toll-roads, May 13-15, 2015.
0%
10%
20%
30%
40%
50%
60%
70%
Sumatra Java Bali and NusaTenggara
Kalimantan Sulawesi Papua-Maluku
Area Population Length of roads Number of vehicles
15
PPP on Toll Road in Indonesia Tomás Herrero Diez
Another upside is the good condition of toll roads as 96% of the Indonesian road toll network
is in good and fair condition, which contrasts with the proportion of roads in good and fair
condition at national level (86%, excluding toll roads), provincial level (63%), or district level
(43%)11.
Out of these 820 km, over 730 are in Java, accounting for around 90% of the total toll road
network14. Sumatra accounts for 5% with some 40 km and the remaining 5% is distributed
among Sulawesi (17 km) and Bali (10 km) 14. No toll road has yet been developed on the rest
of Indonesia’s islands – including Kalimantan, which comprises almost 40% of the country’s
land area and 5.5% of the population.
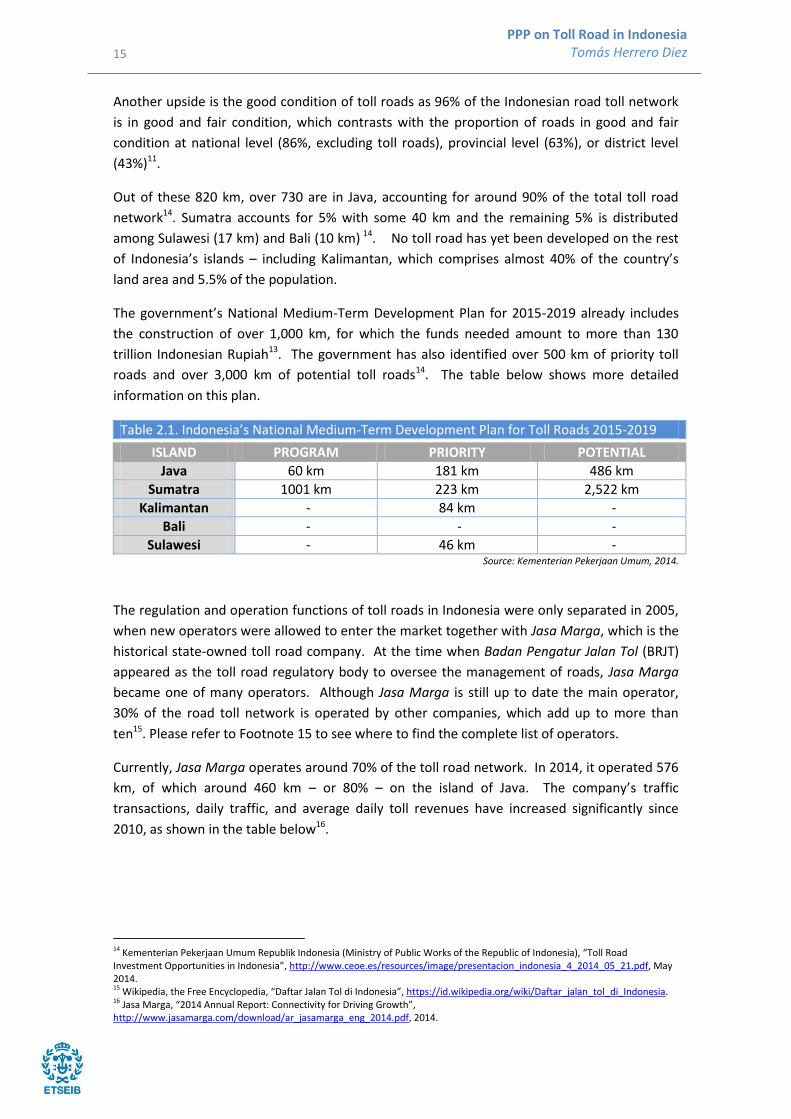
The government’s National Medium-Term Development Plan for 2015-2019 already includes
the construction of over 1,000 km, for which the funds needed amount to more than 130
trillion Indonesian Rupiah13. The government has also identified over 500 km of priority toll
roads and over 3,000 km of potential toll roads14. The table below shows more detailed
information on this plan.
Table 2.1. Indonesia’s National Medium-Term Development Plan for Toll Roads 2015-2019
ISLAND PROGRAM PRIORITY POTENTIAL
Java 60 km 181 km 486 km
Sumatra 1001 km 223 km 2,522 km
Kalimantan - 84 km -
Bali - - -
Sulawesi - 46 km - Source: Kementerian Pekerjaan Umum, 2014.
The regulation and operation functions of toll roads in Indonesia were only separated in 2005,
when new operators were allowed to enter the market together with Jasa Marga, which is the
historical state-owned toll road company. At the time when Badan Pengatur Jalan Tol (BRJT)
appeared as the toll road regulatory body to oversee the management of roads, Jasa Marga
became one of many operators. Although Jasa Marga is still up to date the main operator,
30% of the road toll network is operated by other companies, which add up to more than
ten15. Please refer to Footnote 15 to see where to find the complete list of operators.
Currently, Jasa Marga operates around 70% of the toll road network. In 2014, it operated 576
km, of which around 460 km – or 80% – on the island of Java. The company’s traffic
transactions, daily traffic, and average daily toll revenues have increased significantly since
2010, as shown in the table below16.
14 Kementerian Pekerjaan Umum Republik Indonesia (Ministry of Public Works of the Republic of Indonesia), “Toll Road Investment Opportunities in Indonesia”, http://www.ceoe.es/resources/image/presentacion_indonesia_4_2014_05_21.pdf, May 2014. 15 Wikipedia, the Free Encyclopedia, “Daftar Jalan Tol di Indonesia”, https://id.wikipedia.org/wiki/Daftar_jalan_tol_di_Indonesia. 16 Jasa Marga, “2014 Annual Report: Connectivity for Driving Growth”, http://www.jasamarga.com/download/ar_jasamarga_eng_2014.pdf, 2014.

16
PPP on Toll Road in Indonesia Tomás Herrero Diez
Table 2.2. Jasa Marga’s key figures
Year 2010 2014
Traffic (billion vehicles) 0.96 1.32
Employees 5,303 4,692
Daily traffic (million vehicles) 2.6 3.6
Average daily toll revenue (billion Indonesian rupiah)
11.8 18.2
Source: Jasa Marga, 2014 Annual Report: Connectivity for Driving Growth, 2014 .
Historically, toll road development has been restrained by the large financing required and
absence of an efficient toll roads viability gap funding mechanism, complex land acquisition
processes, and weak project preparation and selection. This has made the implementation of
PPP extremely difficult. In this context, recent reforms of the legislative and institutional
frameworks for toll roads seek to bring progress to the sector.
2.3. Public Private Partnerships in Indonesia PPPs or Kerjasama Pemerintah dan Swasta (KPS) were introduced in the country in the early
1990s for infrastructure development. Independent power producers (IPPs) were promoted
by the Government as well as the Kerja Sama Operasi (KSO) program for telecoms expansion,
and some toll roads on PPP basis. However, some of these early projects were awarded on
direct appointment basis and resulted in disputes and contracts renegotiation17.
The Global Competitiveness Report 2014-2015 states that the infrastructure remains largely
underdeveloped in the country. While Indonesia ranks 34th place for the Global
Competitiveness Index, it ranks 56th place for infrastructures18. This lack of infrastructure
creates bottlenecks, high transportation and logistics costs and lagged the economic growth.
The Mid-Term Development Plan (RPJMN) 2010-2014 encouraged private sector participation
in the provision of infrastructures. The above mentioned Plan stated a needed investment of
Rp. 1,429 trillion in infrastructure projects in which PPP was estimated to contribute for 41% of
the financing17.
Thus to support the target, the Government developed The Master Plan for Acceleration and
Expansion of Indonesia's Economic Development (MP3EI) in May 2011. The MP3EI aims to
propel Indonesia into the top ten worldwide economies and raise income per capita from US$ 3,000
to US$ 15,000 by 202519.
One of the main pillars of this Plan is strengthening the connectivity within Indonesia, the
ASEAN region and globally. Moreover, MP3EI aims to address regional disparities in
infrastructure and establish six economic corridors: Sumatra, Kalimantan, Java, Sulawesi, Bali
and Nusa Tenggara, and Papua-Maluku.
17 UK Foreign Commonwealth Office, “PPP (Public-Private Partnerships) in Indonesia: Opportunities from the Economic Master Plan”, http://www.strategic-asia.com/pdf/PPP%20(Public-Private%20Partnerships)%20in%20Indonesia%20Paper.pdf, June 2012. 18 Klaus Schwab, World Economic Forum, “The Global Competitiveness Report 2014–2015”, http://www3.weforum.org/docs/WEF_GlobalCompetitivenessReport_2014-15.pdf, 2014. 19 Ministry of National Development Planning/National Development Planning Agency (BAPPENAS), “Public-Private Partnership. Infrastructure Projects Plan in Indonesia”, http://www.bkpm.go.id/img/file/PPP%20BOOK%202013-compact.pdf, November 2013.

17
PPP on Toll Road in Indonesia Tomás Herrero Diez
PPPs are expected to play an important role in the implementation of the MP3EI: 32 out of 79
infrastructure projects in the Plan are listed using this scheme. The private sector involvement
in MP3EI is projected to contribute to 51% of the funding, or equivalent to Rp. 100 trillion per
year17.
The Government holds a proactive approach and as a result, a regulatory framework for PPPs
has been established. There have been three fundamental policy changes in Indonesia over
the past decade that has shaped the current PPP20:
Open playing field: The toll road business is no longer monopolized by PT Jasa Marga.
The government has established a regulatory body, the Badan Pengatur Jalan Tol
(BPJT), to conduct toll road tenders and recommends tariffs for approval by the
Minister of Transportation.
Competitive selection: Award of infrastructure projects based on direct appointment is
no longer permitted. Competitive tendering is required for all PPP projects.
Decentralization: The process started in 2001 and transferred both decision making
and financial resources for the provision of transport infrastructure to regional
governments. However, the lack of coordination between key stakeholders has
dogged the process and there is a huge gap between the projects funding through PPP
schemes in urban and rural areas as shown in the chart below.
Chart 2.4. Number of PPP infrastructure project in Indonesia, by province.
Source: OCDE (Ministry of National Development Planning and National Development Planning Agency, Republic of Indonesia).
While DKI Jakarta, West and Central Java accounts for 36% of all the PPPs projects performed
in Indonesia, other provinces such as Papua or Maluku have not developed any project under
that scheme.
20 Coordinating Ministry of Economic Affairs, “Public Private Partnership (PPP) Investor’s Guide”, http://www.bi.go.id/en/iru/presentation/other/Documents/6b3a71af6bbd481ca788477c2cc107a1PPPinvestorguide.pdf, April 2010.
0
1
2
3
4
5
6
7
8
9
10
11
12
13
14
15
16
17
18
2010 2011 2012

18
PPP on Toll Road in Indonesia Tomás Herrero Diez
3. TRANS SUMATRA TOLL ROAD
Sumatra is the second-largest Indonesian island and the world’s sixth-largest island. Compared
to other major Indonesian islands, it has the most strategic trading access as it is adjacent to
other countries such as Malaysia, Thailand, or Myanmar.
Sumatra is a vital asset to the economy of Indonesia since it is resource-rich. The island
possesses a complete set of natural resources such as agriculture, plantation, fishery, forestry
and mining. Based on this factor, Sumatera Economic Corridor, defined in the MP3EI, was
designated as a “Center for Production and Processing of Natural Resources and Energy
Reserves”. Therefore, the development of that Corridor is directed to several main economic
activities such as the production of palm oil, rubber, coal, tin, steel, liquefied natural gas (LNG),
or oil. Due to its economic value, it is important to enhance the infrastructures on Sumatra.
The Trans-Sumatra Highway or Jalan Raya Trans-Sumatera is a 2,732.2 kilometers-long toll
road connecting Banda Aceh in the north of Sumatra to Bandar Lampung in the south through
23 routes and ten provinces21. The corridor connects eight big cities (including Medan and
Palembang), eight airports and six international ports as shown in the chart below.
Chart 3.1. Trans Sumatra Toll Road project.
Source: Jakarta Greater (Kementerian PU and PT Hutama Karya).
21 Indonesia Investments, “Infrastructure Development Update Indonesia: Trans-Sumatra Highway”, http://www.indonesia-investments.com/doing-business/business-columns/infrastructure-development-update-indonesia-trans-sumatra-highway-project/item1779, 18 March 2014.

19
PPP on Toll Road in Indonesia Tomás Herrero Diez
The toll road is estimated to require a total investment of IDR 300 trillion (USD $23.1 billion)
and the construction should be finished by 2025. The land area that needs to be acquired is
about 218,976 million m² and is expected to cost around IDR 15 trillion (USD $1.3 billion) and
to need at least four years (2015-2019) for its expropation21.
The project has faced long delay in execution due basically to two matters:
Funding: The Central Government tendered some sections of the project to the
private sector in 2005 and 2008. However, the costly investment required in
combination with the low financial rate of return (FRR) didn’t attract private investors.
Land acquisition: Based on the experience of the Trans-Java Highway22, the Ministry of
Public Works issued new laws designed to speed up the process notably as it deals
with the revocation of land rights to serve public interest, puts time limits on each
procedural phase and ensures safeguards for land-right holders21.
Therefore, the government decided to re-tender some sections of the toll road but if the
private sector is not interested, the project will be financed through combined funds from the
Central Government, the Regional Government and the State-Owned Enterprises (SOEs).
Hutama Karya, one of the biggest Indonesian construction SOE, was appointed as the main
promotor for the development of the project following a Presidential Decree (Prepres) in
201423. Hutama Karya will be tasked to jointly commission the project with other three SOEs:
Jasa Marga, Waskita Karya and Wijaya Karya.
PT Hutama Karya is an Indonesian-based holding SOE active in the construction and
engineering field and founded in 1961. It is engaged in construction, EPC, and investment
fields. The company operates thorough four business areas: Civil & Infrastructures involves
roads, bridges, dams, airports, and marine facilities construction; Building Works is active in
the development of high-rise buildings, sky-scrapper, towers, and residential properties;
Energy involves the engineering, construction and procurement for power plants as well as oil
and gas plants; and Environmental Facilities in engaged in activities related to services in the
water treatment24.
The first stone for the groundbreaking ceremony for the Trans-Sumatra was laid by Indonesian
President Joko Widodo in Sabah Balau (Lampung) on April 201525. Hutama Karya will build the
first four sections: Medan – Binjai (16.8 kms), Pekanbaru – Dumai (135 kms), Palembang –
Indralaya (22 kms) and Lampung Bakauheni – Terbanggi Besar (150 kms).
Since the first approach suggested that the Trans Sumatra would be not financially viable,
Hutama Karya received a capital injection from the Ministry of Finance of Indonesia amounting
22 This Highway was seriously hampered by expensive land disputes over more than 20 years. 23 Presidential Decree No. 100/2014 on the Acceleration of Highway Development in Sumatra signed on September 17, 2014. 24 Hutama Karya, “Company profile”, http://www.hutamakarya.com/publics/5/pdf/investor-relation/HK%20Corporate%20Presentation%20Ver.%204.0.pdf 25 Ezra Sihite, Jakarta Globe, “Construction of Trans-Sumatra Toll Road Starts in Lampung”, http://thejakartaglobe.beritasatu.com/news/construction-trans-sumatra-toll-road-starts-lampung/, 30 April 2015.

20
PPP on Toll Road in Indonesia Tomás Herrero Diez
to IDR 3.6 trillion on January 2015 to support the development of the first sections: IDR 1
Trillion for Medan – Binjai and IDR 2.6 Trillion for Bakauheni-Terbanggi Besar section26.
The rest of the required investment will be financed through loans from commercial banks and
other financing corporations. For instance, Hutama Karya also got IDR 481 Billion of loans
from State infrastructure financing firm PT Sarana Multi Infrastruktur (SMI) on August 2015.
The most part of this loan will be used to finance the construction of Medan – Binjai
segment27.
3.1. Section Palembang - Indralaya
The section Palembang – Indralaya will be one of the most attractive section for investors due
to the estimated high traffic volume and relatively low required investment. The construction
of this section is included in the MP3EI to encourage regional development in Sumatra as well
as to support national economic growth.
The segment of 22 kms length is located in South Sumatra Province, in the regency of Ogan Ilir
(see map below). It will connect the capital of the province (Palembang) with Indralaya, an
educational city where the prestigious University of Sriwijaya is located.
The section has been split into three subsections for construction purposes:
Subsection 1: Palembang – Pemulutan.
Subsection 2: Pemulutan – Kota Terpadu Mandiri.
Subsection 3: Kota Terpadu Mandiri – Indralaya.
According to Hutama Karya, the implementation schedule for the whole section has been
estimated in 33 months.
Chart 3.2. Location of South Sumatra Province and Ogan Ilir Regency.
Source: Own elaboration.
26 The Jakarta Post, Nadya Natahadibrata, “Hutama Karya to get Rp 3.6t for highways”, http://www.thejakartapost.com/news/2015/01/21/hutama-karya-get-rp-36t-highways.html, January 21 2015 27 Dylan Amirio, The Jakarta Post, “Hutama Karya gets Rp 481b loans for Trans-Sumatra project”, http://www.thejakartapost.com/news/2015/08/14/hutama-karya-gets-rp-481b-loans-trans-sumatra-project.html, August 14 2015
South Sumatra
Ogan Ilir
21
PPP on Toll Road in Indonesia Tomás Herrero Diez
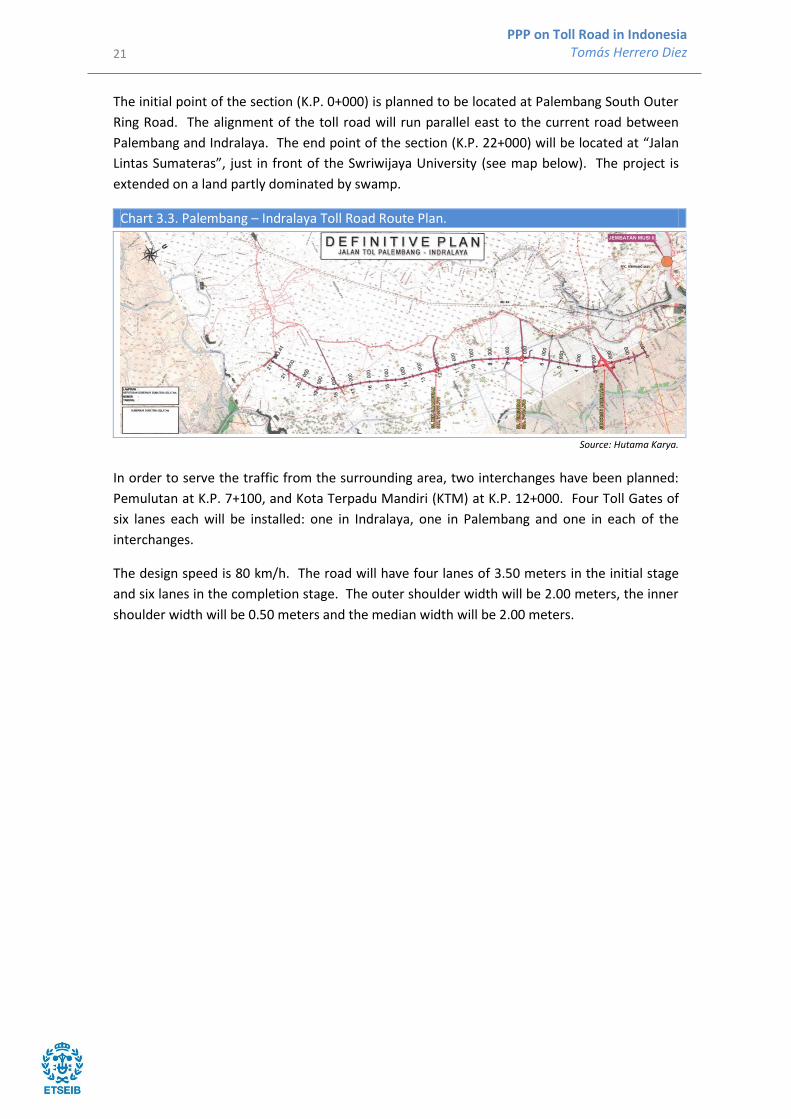
The initial point of the section (K.P. 0+000) is planned to be located at Palembang South Outer
Ring Road. The alignment of the toll road will run parallel east to the current road between
Palembang and Indralaya. The end point of the section (K.P. 22+000) will be located at “Jalan
Lintas Sumateras”, just in front of the Swriwijaya University (see map below). The project is
extended on a land partly dominated by swamp.
Chart 3.3. Palembang – Indralaya Toll Road Route Plan.
Source: Hutama Karya.
In order to serve the traffic from the surrounding area, two interchanges have been planned:
Pemulutan at K.P. 7+100, and Kota Terpadu Mandiri (KTM) at K.P. 12+000. Four Toll Gates of
six lanes each will be installed: one in Indralaya, one in Palembang and one in each of the
interchanges.
The design speed is 80 km/h. The road will have four lanes of 3.50 meters in the initial stage
and six lanes in the completion stage. The outer shoulder width will be 2.00 meters, the inner
shoulder width will be 0.50 meters and the median width will be 2.00 meters.

22
PPP on Toll Road in Indonesia Tomás Herrero Diez
4. DATA COLLECTION
The tariff estimation and traffic forecast required obtaining some traveler’s behavior data in
the regencies nearby the section where the Toll Road will be build. This data were collected
through a Stated Preference (SP) survey.
4.1. Methodology Stated Preference (SP) Techniques refer to a number of different approaches all of which use
peoples' statements of how they would respond to hypothetical situations28. The key steps for
the design of such a survey are: setting of alternatives, selection of measures for each
attribute, selection of number of levels for each attribute, and development of scenarios.
4.1.1. Survey design
The survey questionnaire was designed in Indonesian language keeping the questions short
and concise (see “Annex A. SP Survey”). This questionnaire contained three parts:
1. Socioeconomic profile:
1.1. Age
1.2. Sex
1.3. Education level or type or work
2. Transport routine:
2.1. Origin and Destination.
2.2. Transportation expenses/month.
2.3. Trip frequency/month.
2.4. Trip purpose.
2.5. Travel length (km and minutes).
3. Route choice (toll or non-toll) on trade-off variation between travel time and tariff.
This third part was designed using SP Technique and include nine hypothetical binary
questions in which respondents were asked to indicate their choice (see Annex A). Nine
scenarios were developed combining two attributes: travel time and tariff.
The current travel time from Palembang to Indralaya using the existing non-toll road is 82.76
minutes. However, this time could be reduced to 20.15 minutes driving through the Toll Road.
Table 4.1. Speed, distance and travel time - Non-toll road vs. future toll road.
Non-Toll Road Toll Road
Average speed (km/h) 20.3 65.5
Distance (km) 28 22
Travel time (min.) 82.76 20.15 Source: Own elaboration with data from Hutama Karya.
28 David Pearmain and John Swanson (Steer Gleave Davis), Eric Kroes and Mark Bradley (Hague Consulting Group), “Stated Preference Techniques”, http://www.bath.ac.uk/e-journals/jtep/pdf/Volume_XX11_No_1_11-25.pdf, 1991.
23
PPP on Toll Road in Indonesia Tomás Herrero Diez
The attributes’ levels used for the travel time in the SP experiments were 1hour and 20
minutes for the non-toll road alternative and 16, 20, and 24 minutes for the toll road
alternative.
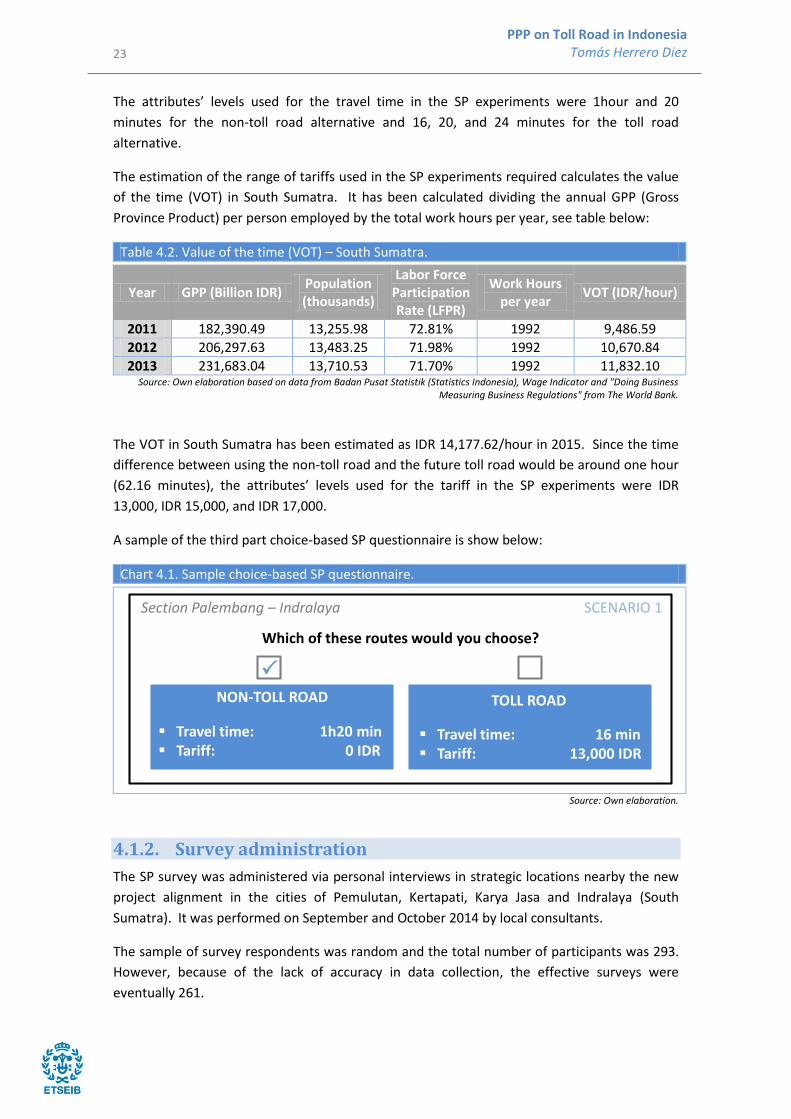
The estimation of the range of tariffs used in the SP experiments required calculates the value
of the time (VOT) in South Sumatra. It has been calculated dividing the annual GPP (Gross
Province Product) per person employed by the total work hours per year, see table below:
Table 4.2. Value of the time (VOT) – South Sumatra.
Year GPP (Billion IDR) Population (thousands)
Labor Force Participation Rate (LFPR)
Work Hours per year
VOT (IDR/hour)
2011 182,390.49 13,255.98 72.81% 1992 9,486.59
2012 206,297.63 13,483.25 71.98% 1992 10,670.84
2013 231,683.04 13,710.53 71.70% 1992 11,832.10 Source: Own elaboration based on data from Badan Pusat Statistik (Statistics Indonesia), Wage Indicator and "Doing Business
Measuring Business Regulations" from The World Bank.
The VOT in South Sumatra has been estimated as IDR 14,177.62/hour in 2015. Since the time
difference between using the non-toll road and the future toll road would be around one hour
(62.16 minutes), the attributes’ levels used for the tariff in the SP experiments were IDR
13,000, IDR 15,000, and IDR 17,000.
A sample of the third part choice-based SP questionnaire is show below:
Chart 4.1. Sample choice-based SP questionnaire.
Source: Own elaboration.
4.1.2. Survey administration
The SP survey was administered via personal interviews in strategic locations nearby the new
project alignment in the cities of Pemulutan, Kertapati, Karya Jasa and Indralaya (South
Sumatra). It was performed on September and October 2014 by local consultants.
The sample of survey respondents was random and the total number of participants was 293.
However, because of the lack of accuracy in data collection, the effective surveys were
eventually 261.
Section Palembang – Indralaya
Which of these routes would you choose?
SCENARIO 1
NON-TOLL ROAD TOLL ROAD
Travel time: 1h20 min Tariff: 0 IDR
Travel time: 16 min Tariff: 13,000 IDR
P

24
PPP on Toll Road in Indonesia Tomás Herrero Diez
4.1.3. Discussion of results
The resulting data is consistent with the socioeconomic characteristics of South Sumatra rural
cities. Age distribution was balanced with the Indonesian population pyramid29: 20.21% of the
respondents were between 18 and 24 years old, 59.34% were between 25 and 54 years,
11.66% were between 55 and 64 years, and 8.79% older than 65 years. In terms of gender,
53% of the sample was female being 50.12% the last data available (2013)30. For more
information regarding the survey’s results, please refer to Annex A.
4.2. Adequacy of data The universe of interest to carry out this research comprises the population of South Sumatra,
which are over 13 millions of people. The sample of the population interviewed was 293
people, with 261 effective surveys.
Since some population characteristics are estimated by measuring only a portion of the
population rather than the entire population, the sampling error arises. The sampling error of
an estimate is usually summarized as a combination of a confidence level and a confidence
interval. The confidence level is the percentage of times that drawing a sample of a particular
size from a certain population will result in having the actual (but unknown) parameter of
interest being within a certain confidence interval31.
The Central Limit Theorem states that estimates of the mean of a sample tend to become
normally distributed. The confidence interval for a given confidence level, is defined as this
mentioned mean value plus-minus the sampling error (see formula below).
Confidence Interval = Mean Estimated ± Sampling Error
Since the population is greater than 100,000 (over 13 million of inhabitants in South Sumatra),
it is considered infinite. Therefore, the sampling error doesn’t involved population size and it
could be calculated using the following formula:
√ ( )
Where:
SE is the Sampling Error.
z is the z-score. This value is obtained from the table of Normal Distribution. For a
chosen confidence level of 90%, it corresponds to a value of 1.65 times the standard
error.
is the prior judgment of the correct value of p. Since is a priori unknown, the
conservative assumption =0.50 will be assumed.
29 Central Intelligence Agency (CIA), “The World Factbook. Age Structure. Indonesia”, https://www.cia.gov/library/publications/the-world-factbook/fields/2010.html 30 Badan Pusat Statistik (Statistics Indonesia), “Population Percentage by Province and Gender, 2009-2013”, http://www.bps.go.id/linkTabelStatis/view/id/1601, 2014. 31 Transportation Research Board of the National Academies, “A Guidebook for Using American Community Survey Data for Transportation Planning. NCHRP Report 588”, http://onlinepubs.trb.org/onlinepubs/nchrp/nchrp_rpt_588.pdf, 2007.
(4.1.)
(4.2.)

25
PPP on Toll Road in Indonesia Tomás Herrero Diez
n is the sample size (261 effective surveys).
The sampling error obtained is ±5.11%. Therefore, the size of the sample, although it should
be increase to reduce this sampling error, is statistically representative of the universe of
South Sumatra.

26
PPP on Toll Road in Indonesia Tomás Herrero Diez
5. TARIFF ESTIMATION
Tariff setting in the toll road section between Palembang and Indralaya has been performed
based on the Willingness-to-Pay (WTP). The WTP is defined as the amount of money a person
is willing to spend to save one unit of time.
The estimation of the above mentioned WTP has been done using the Random Utility Model.
This model is based on the idea that people make choices by determining the desirability of
each alternative (its utility) and choosing the one that is most desirable32. The utility function
of alternative j (Uj) is described as a function of a deterministic part (Vj) and a stochastic
element (εj) as follows:
Uj = Vj + εj
Where the deterministic part is given by a linear function as follows:
∑
The deterministic part of the utility function for the toll road between Palembang and
Indralaya is shown below:
The unknown coefficients βFARE and βTIME describe the preferences of the people. A random
sample of values of the attributes xjFARE and xjTIME have been collected through the SP
Technique (please refer to section “4. Data Collection”).
The preferences from the chosen alternatives were elicited by use of a logit model based on
the utility function described above. If the stochastic element (εj) is independently and
identically distributed (i.i.d.) and follows the Gumbel distribution, the probability that
alternative “i” is selected (Pi) is calculated as:
∑
Multiple linear regression analysis has been performed in Stata software to calculate the
coefficients βFARE and βTIME, and the constant. The results are shown in the table below:
Table 5.1. Stata results (coefficients βFARE, βTIME and constant).
Coefficient Standard Error t statistics Pr(>|t|)
Constant 1.0619 0.0470 22.59 0.000
βFARE -6.40E-05 2.46E-06 -26.03 0.012
βTIME -0.0051 0.0009 -5.46 0.007
R2 0.5915 Source: Own elaboration.
32 Kenneth E. Train, “Discrete Choice Methods with Simulation”, http://eml.berkeley.edu/books/choice2.html, 2003.
(5.1.)
(5.2.)
(5.3.)
(5.4.)

27
PPP on Toll Road in Indonesia Tomás Herrero Diez
A p-value of 5% or less is generally accepted. The p-values obtained have been 1.2% and 0.7%
for the fare and the time respectively. Therefore, it could be considered that the results of
both coefficients attain statistical significance.
Since the utility function is linear, the WTP could be calculated dividing the time coefficient
value by the fare coefficient as it shows below33:
The WTP for the Toll Road section between Palembang and Indralaya has been estimated as
IDR 80.17/person/minute or IDR 4,810/person/hour. This value has been used as base for
tariff setting. However, other data should be considered:
Vehicle Occupancy (VO): According to the survey performed by Badan Pengatur Jalan
Tol (BPJT) of Indonesia in 2012, the occupancy rate of passenger vehicles in city toll
roads (urban agglomeration) is 2.5 person/vehicle.
Travel Time Saved (TTS): Due the toll road alignment will reduce the distance between
Palembang and Indralaya and will increase the flow speed, the travel time saved will
be about 1h03min (please refer to Table 4.1.).
Inflation Rate (IR): The average rate from April 2005 until April 2015 was 7.32%34.
The Palembang – Indralaya toll road fare has been estimated using the following formula:
The result is IDR 15,547.44/vehicle or IDR 706.70/km. Therefore, the proposed toll road tariff
in the first year of operation (2018) is IDR 750/km.
It should be noted that the value of the tariff per vehicle is only 8.8% above the VOT in South
Sumatra estimated above (IDR 14,177.62/hour).
A comparison between the estimated tariff for Palembang – Indralaya toll road and other toll
road tariffs set in other countries is carried out in order to evaluate the adequacy of the above
proposed tariff. A developed country has been chosen for this issue: Spain.
According to the report entitled ¿Cuál es la autopista más cara? (What is the most expensive
highway?) published by the European association Automovilistas Europeos Asociados (AEA),
the average toll tariff in Spain was set in € 0.16/km in 201535. Moreover, the average inflation
rate registered in the country in the last five years was 2.18 %36. Therefore, the Spanish
average toll tariff will reach € 0.17/km in 2018.
33 Hensher D., and L. Johnson. “Applied Discrete Choice Modeling”, 1981. 34 Source: Bank of Indonesia,”Inflation”, http://www.bi.go.id/en/moneter/inflasi/data/Default.aspx, 2015. 35 Automovilistas Europeos Asociados (AEA), ¿Cuál es la autopista más cara?, http://aeaclub.org/blog-aeapress/757-cual-es-la-autopista-mas-cara, 08 June 2015. 36 The World Bank, “Inflación, precios al consumidor (% anual)”, http://datos.bancomundial.org/indicador/FP.CPI.TOTL.ZG .
(5.6.)
(5.5.)

28
PPP on Toll Road in Indonesia Tomás Herrero Diez
The International Monetary Fund (IMF) estimates that the GDP per capita, current prices, will
reach USD 4,196.82 in Indonesia37 and USD 29,363.81 in Spain38 in 2018. The percentage
which represents the toll road tariff with regard the GDP per capita has been calculated for
both countries as it is shown in the table below:
Table 5.2. Comparison between toll tariffs in Indonesia and Spain
Indonesia Spain
GDP per capita (USD 2018) 4,196.82 29,363.81
Toll tariff (USD/km; 2018) 0.059539
0.201640
Percentage (toll tariff/GDP) 0.00142% 0.00069% Source: Own elaboration with date of the above mentioned sources.
Therefore, it is concluded that the toll road tariff proposed for Indonesia, even firstly it could
looks like very low; it is relatively high in regard with the local GDP. The ratio calculated by
dividing the toll tariff (USD/km) by the GDP per capita is 2.07 times greater in Indonesia than in
Spain. Hence, it is considered that increasing this tariff will drive to a significant drop in the
number of toll road users.
37 International Monetary Fund (IMF), World Economic Outlook Database. Indonesia, Gross domestic product per capita, current prices, https://www.imf.org/external/pubs/ft/weo/2015/01/weodata/weorept.aspx?sy=2013&ey=2020&scsm=1&ssd=1&sort=country&ds=.&br=1&pr1.x=70&pr1.y=6&c=536&s=NGDPDPC&grp=0&a=, April 2015. 38 International Monetary Fund (IMF), World Economic Outlook Database. Spain, Gross domestic product per capita, current prices, https://www.imf.org/external/pubs/ft/weo/2015/01/weodata/weorept.aspx?pr.x=54&pr.y=11&sy=2013&ey=2020&scsm=1&ssd=1&sort=country&ds=.&br=1&c=184&s=NGDPDPC&grp=0&a= , April 2015. 39 1 USD = 12,599.5 IDR (Average exchange rate 01 August 2014 - 01 August 2015. Source: http://www.oanda.com/) 40 1 EUR = 1.1813 USD (Average exchange rate 01 August 2014 - 01 August 2015. Source: http://www.oanda.com/)

29
PPP on Toll Road in Indonesia Tomás Herrero Diez

30
PPP on Toll Road in Indonesia Tomás Herrero Diez
6. TRAFFIC STUDY
The Ministry of Public Works of Indonesia, through The Directorate General of Highways (Bina
Marga), monitors the traffic countrywide. The coverage count data collection method is used
in the section Palembang – Indralaya. The traffic data is collected during 40 hours once per
year (generally on April or May). These data are used to estimate the Annual Average Daily
Traffic (AADT) as it is shown in the table below:
Table 6.1. Traffic data section Palembang – Indralaya (two ways)
Vehicle Classes 2010 2011 2012 2013 2014
Gol1 10,829 11,195 12,760 13,740 14,221
Gol2 6,854 7,086 6,586 7,823 7,568
Gol3 10,411 10,763 10,017 11,892 11,472
Gol4 8,129 8,404 7,831 9,278 8,956
Gol5A 6,444 6,662 7,438 6,030 7,194
Gol5B 1,272 1,315 703 1,876 1,501
Gol6A 11,975 12,380 12,830 11,185 13,381
Gol6B 4,454 4,604 4,638 5,074 4,568
Gol7A 2,411 2,493 2,370 2,610 2,752
Gol7B 697 720 844 577 813
Gol7C 4,348 4,495 4,868 4,225 4,849
AADT 30,425 31,455 32,519 33,313 34,680 Source: Own elaboration with data from Bina Marga - Local Office South Sumatra (Data survai traffic (ATC) berdasarkan kelas
kendaraan Bina Marga. Hasil konversi kelas kendaraan Amerika ke kelas Bina Marga).
The chart below shows the twelve different vehicles classes (golongan) according to the
Indonesian code:
Chart 6.1. Vehicles classes in Indonesia.
Source: Ministry of Public Works - Departemen Permukiman dan Prasarana Wilayah, “Pedoman, Konstruksi dan Bangunan. Survai Pencacahan Lalu Lintas dengan cara Manual”, https://anggadrumaholic.files.wordpress.com/2012/02/pd-t-19-2004-b-
survai-pencacahan-lalu-lintas-dengan-cara-manual.pdf, 2004

31
PPP on Toll Road in Indonesia Tomás Herrero Diez
The AADT’s average growth rate has been calculated using the AADT data of the last five years
(please refer to Table 6.1. above). The traffic flow in the section Palembang – Indralaya has
growth an average of 3.22% per year. The future AADT has been forecasted using the
mentioned average growth rate and it is shown in the table below.
Moreover, the results of the SP survey shows that 38.79% of the respondents would use the
toll road if the tariff would be IDR 15.000 or below. Therefore, the traffic flow through the toll
road can be estimated as shown in the table below:
Table 6.2. Traffic forecast Palembang – Indralaya (two ways).
Year AADT
Palembang- Indralaya
AADT Palembang – Indralaya
Toll Road
2018 41,733 16,188
2019 43,076 16,709
2020 44,462 17,247
2021 45,892 17,802
2022 47,369 18,374
2023 48,893 18,965
2024 50,466 19,576
2025 52,090 20,206
2026 53,765 20,856
2027 55,495 21,527
2028 57,281 22,219
2029 59,124 22,934
2030 61,026 23,672
2031 62,990 24,434
2032 65,016 25,220
2033 67,108 26,031
2034 69,267 26,869
2035 71,496 27,733
2036 73,796 28,626
2037 76,171 29,547
2038 78,621 30,497
2039 81,151 31,478
2040 83,762 32,491
2041 86,457 33,537
2042 89,239 34,616
2043 92,110 35,729
2044 95,074 36,879
2045 98,133 38,066
2046 101,290 39,290
2047 104,549 40,554
2048 107,913 41,859 Source: Own elaboration.
32
PPP on Toll Road in Indonesia Tomás Herrero Diez
The traffic volume of Palembang – Indralaya toll road in its first operational year (2018) would
be 16,188 vehicles/day and it will increase to 41,859 vehicles/day in 2048.
It should be noted that the traffic flows forecast has been performed simplistically based on an
extrapolation of past trends of the traffic that would have used the route in the absence of the
project. The traffic forecast which will flow into the new toll road has been estimated as a
diverted traffic from the current road using a percentage obtained from the SP survey.
However, it constitutes a conservative approach since the induced travels has been not
considered.
This induced traffic has not been included due to the uncertainty associated with its
calculation due to the lack of accurate date. Nevertheless, according to local officials from
regional office of Public Works (Balai Besar Pelaksanaan Jalan Nasional III) opinion, the
induced traffic would be a small percentage and therefore, its effect for the economic and
financial appraisals is likely to be low due to two reasons41:
The benefits which will accrue to the induced traffic will be significant smaller than the
benefits which will accrue to diverted traffic due to
The induced traffic will not impose relevant costs on the diverted traffic as for instance
a congestion or overcrowding cost.
41 Institute for Transport Studies (ITS), University of Leeds, “Treatment of Induced Traffic”, http://www.its.leeds.ac.uk/projects/WBToolkit/Note6.htm, 2003

33
PPP on Toll Road in Indonesia Tomás Herrero Diez
34
PPP on Toll Road in Indonesia Tomás Herrero Diez
7. COST BENEFIT ANALYSIS (CBA)
The purpose of the Cost Benefit Analysis is to evaluate whether the project is desirable from a
socio-economic point of view and whether it is financially feasible or further funding sources
are needed.
7.0. Methodology The cost-benefit analysis (CBA) provides support for informed judgement and decision making42
based on the efficient allocation of resources. This analysis is undertaken to gauge the net
social welfare. CBA seeks to provide a comprehensive assessment of the costs and benefits of
the projects that can be converted in comparable monetary units and incorporated in a
measure of project worth.
CBA has been carried out following the Asian Development Bank (ADB) Practical Guide for
Cost-Benefit Analysis for Development43, and the European Union (EU) Guide to Cost Benefit
Analysis of Investment Projects44. It has been considered interested to take into account Asian
and European perspective, since the project is located in Indonesia.
The main purpose of the CBA is to calculate the Economic Net Present Value (ENPV), the
Economic Rate of Return (ERR) and the Benefit – Cost Ratio (B/C) to determine whether the
project is economically feasible. For this issue, all the relevant costs and benefits shall be
identified, quantified, assigned a monetary value, and discounted using the Social Discount
Rate.
However, due to the divergence between private and social perspective, a financial analysis is
also required to evaluate whether the project is commercially viable. Financial appraisals of
projects are of particular importance because they reveal the adequacy of financial incentives
for project beneficiaries to participate in the project, and the degree to which financial
resources will be deployed over the project’s life span to ensure financial sustainability45.
The financial analysis is an assessment of the financial outflows and inflows to calculate the
project cash flow streams. For this issue the Discounted Cash Flow (DCF) methodology
proposed by the European Union46 has been followed.
After establishing the financial cash flows, two financial indicators shall be calculated: the
Financial Rate of Return (FRR), and the Financial Net Present Value (FNPV) to determine
whether the project is financially feasible.
42 European Union, “Guide to Cost Benefit Analysis of Investment Projects”, http://ec.europa.eu/regional_policy/sources/docgener/guides/cost/guide2008_en.pdf, July 2008. 43 ADB (Asian Development Bank), “Cost-Benefit Analysis for Development. A Practical Guide”, http://www.adb.org/sites/default/files/institutional-document/33788/files/cost-benefit-analysis-development.pdf, 2013. 44 European Union, “Guide to Cost Benefit Analysis of Investment Projects”, http://ec.europa.eu/regional_policy/sources/docgener/guides/cost/guide2008_en.pdf, July 2008. 45 ADB (Asian Development Bank), “Cost-Benefit Analysis for Development. A Practical Guide”, http://www.adb.org/sites/default/files/institutional-document/33788/files/cost-benefit-analysis-development.pdf, 2013. 46 European Union, “Guide to Cost Benefit Analysis of Investment Projects”, http://ec.europa.eu/regional_policy/sources/docgener/guides/cost/guide2008_en.pdf, July 2008.

35
PPP on Toll Road in Indonesia Tomás Herrero Diez
7.1. Economic analysis
The economic analysis appraises the Palembang – Indralaya toll road contribution to the
economic welfare of the regency of Ogan Ilir, the province of South Sumatra and the whole
Indonesia.
All the relevant project impacts have to be identified and catalogued in quantifiable and non-
quantifiable. The next step is the monetization and discount of quantifiable impacts. In some
cases, there may be some impacts for which market values are not available, such social or
environmental effects. Those effects do not monetarily affect the owners of the toll road, but
do influence the standard of living of society as a whole and thus, have to be including in the
analysis.
After establishing the economic cash flows an evaluation can be made of whether a project
will bring any welfare to the society using a set of economic performance indicators, such as
Economic Internal Rate of Return (ERR), Economic Net Present Value (ENPV), and B/C ratio.
7.1.1. Identification of impacts
It is worthy to notice that in order to consider something an impact, there must be a “cause-
and-effect relationship between some physical outcome of the project and the utility of human
beings”47.
Ideally the economic analysis should include all the impacts of the investment, no matter how
small they are48. However, due to the complexity of identify all the impacts, the number of
evaluated items for Palembang – Indralaya toll road is limited to the impacts on the developer
and toll road managers, users, and society (externalities).
It should be highlight that not all socio-economic impacts can be quantified and valued. Other
non-monetized costs and benefits related with the regional development should be taken into
account as additional qualitative factors.
The impacts have been identified and selected using the Asian Development Bank Practical
Guide for Cost-Benefit Analysis for Development49, the European Union Guide to Cost Benefit
Analysis of Investment Projects50, the Business Plan for the toll road between Palembang and
Indralaya51, and considerations of the author.
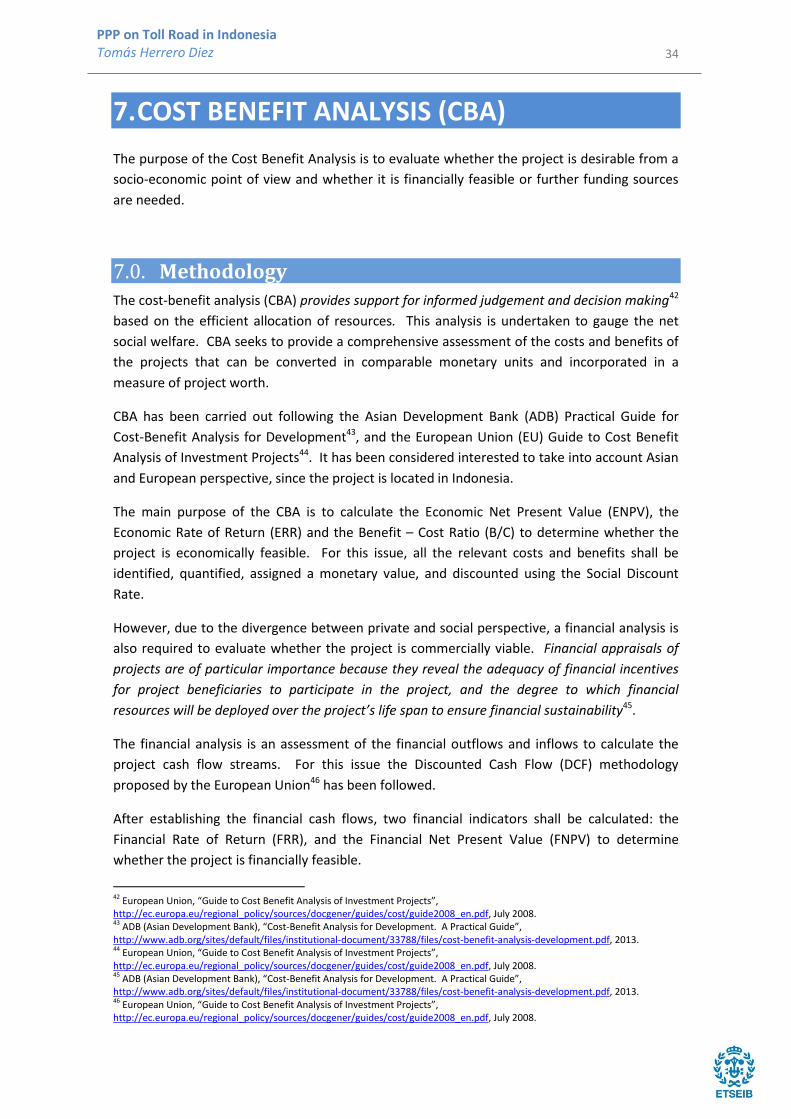
The chart ten below displays the CBA “balance sheet”, which summarizes all the impacts that
have been identified for this project:
47 Pearson Education Inc., Boardman, A.E., Greenberg, D.H., Vining, A.R., Weimer, D.L., “Cost-Benefit Analysis – Concepts and Practice”, 2011. 48 HEATCO (Developing Harmonised European Approaches for Transport Costing and Project Assessment), “Deliverabl e 5: Proposal for Harmonised Guidelines”, http://heatco.ier.uni-stuttgart.de/HEATCO_D5.pdf, 2006. 49 ADB (Asian Development Bank), “Cost-Benefit Analysis for Development. A Practical Guide”, http://www.adb.org/sites/default/files/institutional-document/33788/files/cost-benefit-analysis-development.pdf, 2013. 50 European Union, “Guide to Cost Benefit Analysis of Investment Projects”, http://ec.europa.eu/regional_policy/sources/docgener/guides/cost/guide2008_en.pdf, July 2008. 51 Hutama Karya, “Dokumenrencana Usaha. Ruas Palembang – Simpang Indralaya”, 2014.
36
PPP on Toll Road in Indonesia Tomás Herrero Diez
Chart 7.1. Identification of relevant impacts for economic analysis.
Source: Own elaboration.
7.1.2. Quantifiable impacts
In the following sections the relevance and content of each quantifiable impact is elaborate upon, measurement indicators are chosen, and a monetization value is estimated.
7.1.2.1. Costs The main expenditures take place during the construction stage of the project. The other costs
considered are: operation and maintenance (O&M) costs and financing costs. The latter
depends on the funding model proposed and hence will be further discussed in the section
below “Financing structure”.
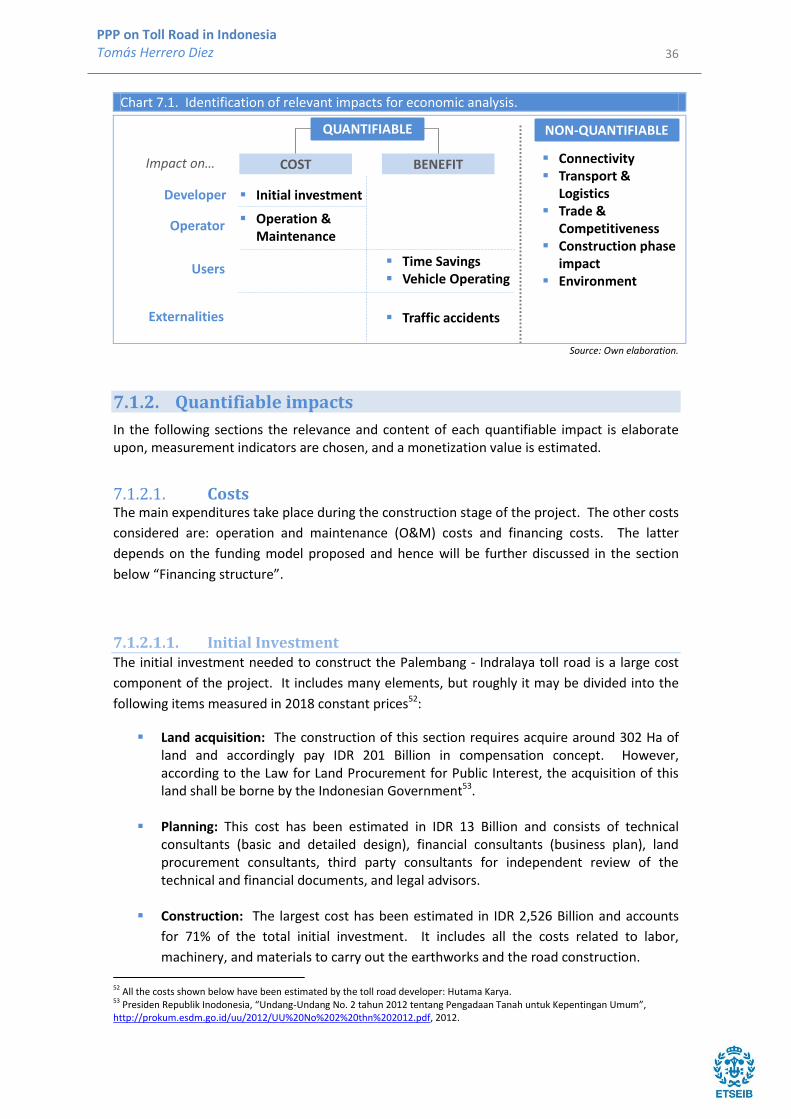
7.1.2.1.1. Initial Investment The initial investment needed to construct the Palembang - Indralaya toll road is a large cost
component of the project. It includes many elements, but roughly it may be divided into the
following items measured in 2018 constant prices52:
Land acquisition: The construction of this section requires acquire around 302 Ha of land and accordingly pay IDR 201 Billion in compensation concept. However, according to the Law for Land Procurement for Public Interest, the acquisition of this land shall be borne by the Indonesian Government53.
Planning: This cost has been estimated in IDR 13 Billion and consists of technical consultants (basic and detailed design), financial consultants (business plan), land procurement consultants, third party consultants for independent review of the technical and financial documents, and legal advisors.
Construction: The largest cost has been estimated in IDR 2,526 Billion and accounts
for 71% of the total initial investment. It includes all the costs related to labor,
machinery, and materials to carry out the earthworks and the road construction.
52 All the costs shown below have been estimated by the toll road developer: Hutama Karya. 53 Presiden Republik Inodonesia, “Undang-Undang No. 2 tahun 2012 tentang Pengadaan Tanah untuk Kepentingan Umum”, http://prokum.esdm.go.id/uu/2012/UU%20No%202%20thn%202012.pdf, 2012.
QUANTIFIABLE NON-QUANTIFIABLE
COST BENEFITImpact on…
Developer
Operator
Users
Externalities
Initial investment
Operation & Maintenance
Time Savings Vehicle Operating
Traffic accidents
Connectivity Transport &
Logistics Trade &
Competitiveness Construction phase
impact Environment

37
PPP on Toll Road in Indonesia Tomás Herrero Diez
Toll Road Equipment: Collection, traffic management, information, and
communication systems are required to perform the operation of the toll road. It is
planned to install a closed toll collection system with 24 substations along the road. Its
cost has been estimated in IDR 38 Billion.
Supervision: This cost has been estimated in IDR 25 Billion and includes the
remuneration of field inspectors, as well as field and laboratory testing activities which
shall be performed during the road construction.
Escalation: Due to the lead time between planning and construction, a provision in the
estimated costs for an increase in the cost of planning, construction, toll road
equipment, and supervision has been included. Escalation has been set based on the
inflation rate: 7.32% per year. Thus, the escalation cost has been calculated as IDR 381
Billion54.
Overhead: The ongoing expenses such as wages, allowances, office equipment, vehicle
purchase, or office rental spent from the preparation stage till the completion of the
toll road section has been calculated as IDR 79 Billion. All this costs are not directly
attributable to any specific unit of production.
The initial investment cost has been estimated in IDR 3,560 Billion and it is show in the table
below:
54 The value has been calculated assuming two years period between the estimation of the costs and the toll road construction.
Chart 7.2. Initial Investment for Palembang – Indralaya toll road (constant 2018 prices)
Items Cost (IDR Billion)
Land acquisition 201
Planning 12
Construction 2,526
Toll Road equipment
38
Supervision 25
Escalation 381
VAT (10%) 298
Overhead 79
TOTAL 3,560 Source: Own elaboration with data from Hutama Karya.
5,65%0,34%
70,96%
1,07%0,70%
10,70%
8,38%
2,21%Land acquisition
Planning
Construction
Toll Road equipment
Supervision
Escalation
VAT
Overhead

38
PPP on Toll Road in Indonesia Tomás Herrero Diez
7.1.2.1.2. Operation & Maintenance (O&M) The Operation and Maintenance (O&M) costs comprise all the disbursement foreseen which
are not of an investment nature since they are consumed within each year55. These costs are
divided into four groups measured in constant prices:
Toll Collection System: The toll collection operating costs has been defined as “the cost to collect tolls”, including staff and consumable for Manual Toll Collection, as well as the routine maintenance of toll system hardware, software, lane equipment, and communications. This cost has been estimated in IDR 10.26 Billion for the first year of operation (2018). The toll collection system will require perform regular inspections every three years and main inspections every four years for continuous vigilance. The costs of these activities have been calculated based on the number of toll points (24 as it was mentioned above). The Hutama Karya assumption is a cost of IDR 3.5 Million per regular inspection in 2019 Indonesian Rupiah and IDR 50.5 Million per main inspection in 2020 Indonesian Rupiah. Moreover, periodic rehabilitation and repair (R&R) is required to maintain the toll collection system. It is assumed a replacement frequency of five years for the most part of the equipment such as the central system hardware (back office computers running toll software) or the toll infrastructure (field hardware, such as antennas, gantries, data collectors, and toll rate signs). This cost has been estimated in IDR 49.86 Billion in 2022 Indonesian Rupiah.
Toll Road Users Services: The smooth operation of the toll road required performed some further services such as traffic management, customer service, incident response, and oversight. The expenses related with these services have been estimated in IDR 3.96 Billion for personnel, IDR 0.03 Billion for traffic management, and IDR 2.65 Billion for the rest of the services in the first year of operation (2018). The equipment to carry out these services also required periodic maintenance and R&R. This cost has been estimated in IDR 6.99 Billion (2020) every four years and IDR 6.78 Billion (2024) every eight years.
Road Maintenance: Proper road maintenance is essential to guaranty user safety and
provide efficient travel along the route. Road maintenance activities which shall carried out in Palembang – Indralaya toll road can be broken into two categories:
o Routine maintenance: It includes all the works that have to be undertaken each year such as verge cutting, culvert cleaning, or patching pot-holes. The cost of these works has been estimated in IDR 148.2 Million per km in base on previous experiences in Indonesia in 2018 Indonesia Rupiah.
o Periodic maintenance: It includes all activities performed at intervals of three, four, and six years to preserve the structural integrity of the road such as resurfacing, overlay, or pavement reconstruction. Its costs have been
55 European Union, “Guide to Cost Benefit Analysis of Investment Projects”, http://ec.europa.eu/regional_policy/sources/docgener/guides/cost/guide2008_en.pdf, July 2008.

39
PPP on Toll Road in Indonesia Tomás Herrero Diez
estimated in IDR 472.3 Million per km for the maintenance activities carried out every three years (2019 Indonesian Rupiah), IDR 144.5 Million per km every four years (2020 Indonesian Rupiah) and IDR 4,441.4 Million per km every six years (2022 Indonesian Rupiah).
o Special maintenance: It comprises the activities which cannot be planned with any certainty in advance such as emergency works. However a contingency allowance has been included and estimated in IDR 656.8 Million per km every five years (2021 Indonesian Rupiah).
Fixed Back Office Operations: These fixed costs include general and administrative staff, office space and equipment, other activities needed to operate the toll road, and the tax on land and buildings. It has been estimated in IDR 17.77 Billion (2018 Indonesian Rupiah).
For detailed cost breakdown and annual evolution please refer to the “Annex B. Operation &
Maintenance Cost”.
The average Operation and Maintenance cost per annum for this project is 5.02% of the initial
investment, this cost is considerable above to the World Bank proposed rates varying between
2% and 3%. This fact is due to the inclusion of several costs such as the maintenance and
operation of the toll collection system, toll road user’s services as well as the fixed back office
operations into the Operation and Maintenance cost. Taking into account exclusively the road
maintenance cost, the average cost per annum is 1.73 % which it is in line with the World Bank
values.
7.1.2.2. Benefits The project will generate social benefits for the toll road users derived from savings in the
travel time and vehicle operation costs. It should be noted that external impacts such as
safety shall be also monetized since influence the standard of living of society as a whole.
7.1.2.2.1. Passenger’s time savings Time savings is one of the most significant benefits which will arise from the construction of
the new toll road. The travel time saved refers to the difference in the total travel time
between taking the current road and the future toll road; this time difference has been already
estimated in 62.16 minutes (please refer to Table 4.1.).
The value of travel time saved (VTTS) depends of the value of the time (VOT), the travel time
and the average vehicle occupancy. The VOT in South Sumatra has been estimated in IDR
14,177.62 per hour in 2015, and vehicle occupancy in 2.5 pax/vehicle.
As it is shown in the table below, the value of travel time saved will increase every year due to
the expected traffic volume and economic growth. VTTS is expected to reach IDR 233.27
Billion in 2018 and IDR 1,158.70 Billion in 2048.
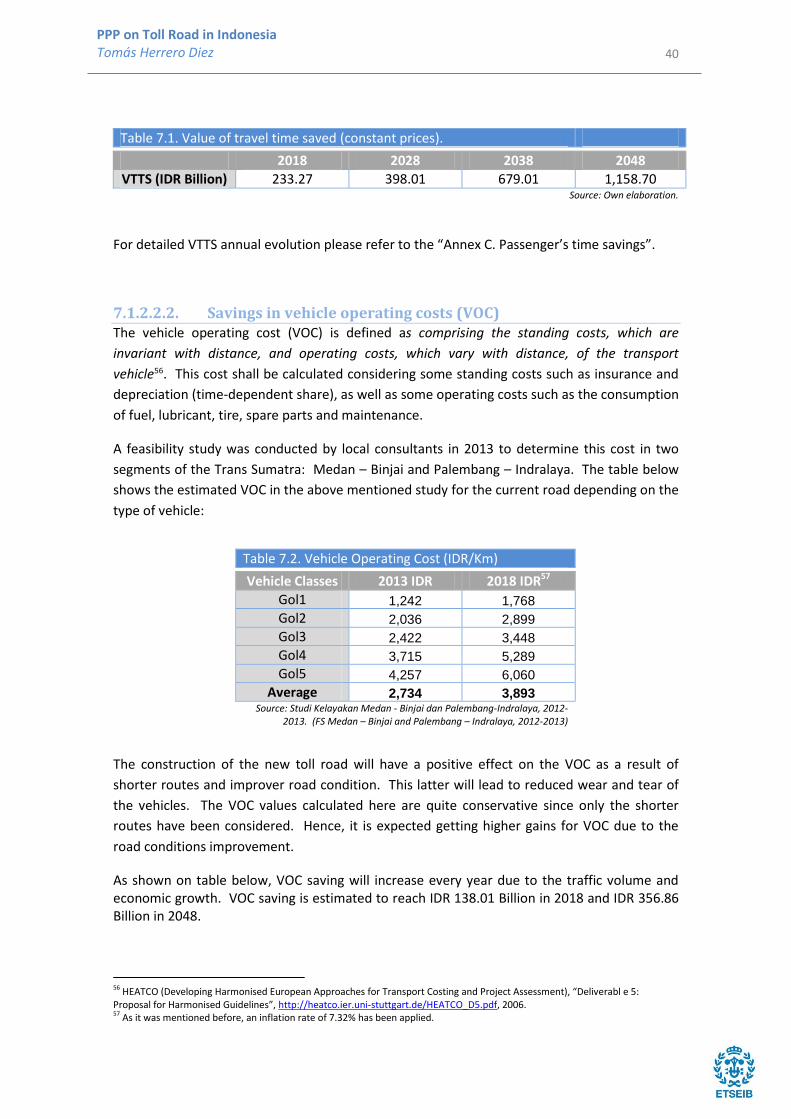
40
PPP on Toll Road in Indonesia Tomás Herrero Diez
Table 7.1. Value of travel time saved (constant prices).
2018 2028 2038 2048
VTTS (IDR Billion) 233.27 398.01 679.01 1,158.70 Source: Own elaboration.
For detailed VTTS annual evolution please refer to the “Annex C. Passenger’s time savings”.
7.1.2.2.2. Savings in vehicle operating costs (VOC) The vehicle operating cost (VOC) is defined as comprising the standing costs, which are
invariant with distance, and operating costs, which vary with distance, of the transport
vehicle56. This cost shall be calculated considering some standing costs such as insurance and
depreciation (time-dependent share), as well as some operating costs such as the consumption
of fuel, lubricant, tire, spare parts and maintenance.
A feasibility study was conducted by local consultants in 2013 to determine this cost in two
segments of the Trans Sumatra: Medan – Binjai and Palembang – Indralaya. The table below
shows the estimated VOC in the above mentioned study for the current road depending on the
type of vehicle:
Table 7.2. Vehicle Operating Cost (IDR/Km)
Vehicle Classes 2013 IDR 2018 IDR57
Gol1 1,242 1,768
Gol2 2,036 2,899
Gol3 2,422 3,448
Gol4 3,715 5,289
Gol5 4,257 6,060
Average 2,734 3,893 Source: Studi Kelayakan Medan - Binjai dan Palembang-Indralaya, 2012-
2013. (FS Medan – Binjai and Palembang – Indralaya, 2012-2013)
The construction of the new toll road will have a positive effect on the VOC as a result of
shorter routes and improver road condition. This latter will lead to reduced wear and tear of
the vehicles. The VOC values calculated here are quite conservative since only the shorter
routes have been considered. Hence, it is expected getting higher gains for VOC due to the
road conditions improvement.
As shown on table below, VOC saving will increase every year due to the traffic volume and economic growth. VOC saving is estimated to reach IDR 138.01 Billion in 2018 and IDR 356.86 Billion in 2048.
56 HEATCO (Developing Harmonised European Approaches for Transport Costing and Project Assessment), “Deliverabl e 5: Proposal for Harmonised Guidelines”, http://heatco.ier.uni-stuttgart.de/HEATCO_D5.pdf, 2006. 57 As it was mentioned before, an inflation rate of 7.32% has been applied.

41
PPP on Toll Road in Indonesia Tomás Herrero Diez
Table 7.3. Saving in vehicle operations costs (constant prices)
2018 2028 2038 2048
VOC Savings (IDR Billion)
138.01 189.43 260.00 356.86
Source: Own elaboration.
For detailed VOC savings annual evolution please refer to the “Annex D. Savings in vehicle
operations costs (VOC)”.
7.1.2.2.3. Traffic accident reduction Traffic accidents entail economic and social costs. The new toll road between Palembang and
Indralaya will lead to lower accident rates since the route will be shorter and the road
condition will be better.
The following traffic accident classification58 is applied in Indonesia:
Fatal accident: Death within 30 days of causes arising from accident.
Serious injury: Cases which require hospitalization, hospital treatment and results in
lasting injuries, but do not lead to death within 30 days.
Slight accident: Cases that do not require major hospital treatment, or if they do, the
effects of the injuries can be quickly overcome.
Damage-only: Accidents without casualties.
The number of accidents has increased by almost 600% in the last twenty years due to the
rapid and unplanned urbanization. The fatal and serious accidents have increased by about
300%, the slight accidents 900% and the material losses 2000% in the last two decades. The
table below shows Indonesian historical data of traffic accidents in the last years:
Table 7.4. Evolution of traffic accidents in Indonesia
Number of accidents
Fatal accident
Serious injury
Slight injury
Damage-only (IDR Million/Km)
1992 19,920 9,819 13,363 14,846 15,077
1997 17,101 12,308 9,913 12,699 20,848
2002 12,267 8,762 6,012 8,929 41,030
2007 49,553 16,955 20,181 46,827 103,289
2012 117,949 29,544 39,704 128,312 298,627
Average per 1,000 km
94.98 35.94 40.94 78.43 170,660
Source: Badan Pusat Statistik (Statistics Indonesia).
In order to include the traffic accident reduction in the Economical CBA, the value of the life
and injuries in Indonesia need to be monetized. A Ministry of Finance regulation establishes
the values to be applied in the case of traffic accidents: Menteri Keuangan, Republik of
58 Ministry of Infrastructure of the Republic of Serbia and Public Enterprise Roads of Serbia, “Manual Cost Benefit Analysis”, http://www.putevi-srbije.rs/strategijapdf/Manual_Cost_Benefit_Analysis.pdf, 2010

42
PPP on Toll Road in Indonesia Tomás Herrero Diez
Indonesia, Peraturan Menteri Keuangan Nomor 37/PMK.010/2008 tentang Besar Santunan
dan Iuran Wajib Dana Pertanggungan Wajib Kecelakaan Penumpang Alat Angkutan
Penumpang Umum Di Darat, Sungai/Danau, Ferry/Penyeberangan, Laut dan Udara, 26
Februari 2008. The established values in the above mentioned regulation are listed in the
table below:
Table 7.5. Value for casualties in Indonesia.
2008 IDR 2018 IDR59
Fatal accident 50,000,000 101,339,007
Serious injury 25,000,000 50,669,503
Slight injury 10,000,000 20,267,801 Source: 37/PMK.010/2008 tanggal 26 Februari 2008
As shown on table below, the benefit of the traffic accident reduction will reach IDR 44.86 Million in 2018 and IDR 373.48 Million in 2048. The benefit has been estimated based solely on the route shorten, about six Km. However, the better road condition has not been considered, hence, the traffic accident reduction benefit would be likely higher.
Table 7.6. Traffic accident reduction benefit (constant prices).
2018 2028 2038 2048
Accident reduction benefit
(IDR Million) 44.86 90.92 184.27 373.48
Source: Own elaboration.
For detailed VOC savings annual evolution please refer to the “Annex E. Traffic accident
reduction benefits”.
7.1.2.3. Non-quantifiable impacts The development of the Trans Sumatra toll road would also entail some impacts that are not
easily monetized. These would include an increase in connectivity within the region, allowing
its population to access a wider range of services and opportunities and thus implying an
increase in mobility and an acceleration of the region’s growth. In the mid-term this situation
would improve the region’s GDP per capita and would probably have an impact in surrounding
regions as well.
This section covers the most important non-quantifiable impacts, which are organized in five
main groups:
Connectivity Transport and Logistics Trade and Competitiveness Construction Phase Environment
59 As it was mentioned before, an inflation rate of 7.32% has been applied.
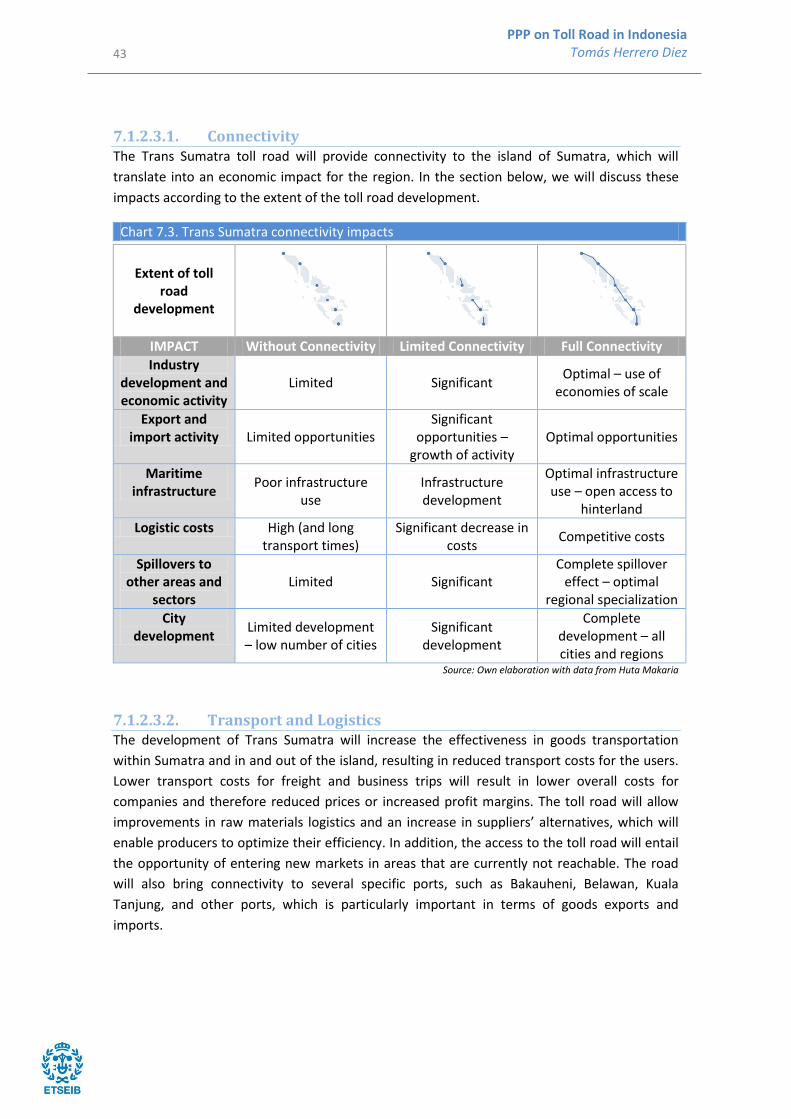
43
PPP on Toll Road in Indonesia Tomás Herrero Diez
7.1.2.3.1. Connectivity The Trans Sumatra toll road will provide connectivity to the island of Sumatra, which will
translate into an economic impact for the region. In the section below, we will discuss these
impacts according to the extent of the toll road development.
Chart 7.3. Trans Sumatra connectivity impacts
Extent of toll road
development
IMPACT Without Connectivity Limited Connectivity Full Connectivity
Industry development and economic activity
Limited Significant Optimal – use of
economies of scale
Export and import activity Limited opportunities
Significant opportunities –
growth of activity Optimal opportunities
Maritime infrastructure
Poor infrastructure use
Infrastructure development
Optimal infrastructure use – open access to
hinterland
Logistic costs High (and long transport times)
Significant decrease in costs
Competitive costs
Spillovers to other areas and
sectors Limited Significant
Complete spillover effect – optimal
regional specialization
City development
Limited development – low number of cities
Significant development
Complete development – all cities and regions
Source: Own elaboration with data from Huta Makaria
7.1.2.3.2. Transport and Logistics The development of Trans Sumatra will increase the effectiveness in goods transportation
within Sumatra and in and out of the island, resulting in reduced transport costs for the users.
Lower transport costs for freight and business trips will result in lower overall costs for
companies and therefore reduced prices or increased profit margins. The toll road will allow
improvements in raw materials logistics and an increase in suppliers’ alternatives, which will
enable producers to optimize their efficiency. In addition, the access to the toll road will entail
the opportunity of entering new markets in areas that are currently not reachable. The road
will also bring connectivity to several specific ports, such as Bakauheni, Belawan, Kuala
Tanjung, and other ports, which is particularly important in terms of goods exports and
imports.
44
PPP on Toll Road in Indonesia Tomás Herrero Diez
7.1.2.3.3. Trade and Competitiveness Trans Sumatra will also play an essential role in population mobility, especially regarding
manpower. The connectivity to previously inaccessible areas will create job opportunities in
these locations and the possibility for people to work further away from home by reducing
commuting times.
As a result of the investment in infrastructure, there will be both direct and indirect long-term
effects. Other than boosting goods and people mobility, the value of land will also see an
increase, there will be employment creation, and the industrial, commercial, and housing
sectors will be significantly developed.
7.1.2.3.4. Construction Phase The development of Trans Sumatra will have an important economic impact in the short-term,
particularly during the construction phase. The construction of this infrastructure will stimulate
economic activity resulting in an increase in the demand of raw materials (steel, cement,
asphalt, etc.), the equipment necessary for construction activities, skilled workers (consultant
firms and contractors), and unskilled labor. Indirectly, the construction of the toll road will also
stimulate Sumatra’s economy through accommodation demand and the workers’ daily needs.
However, the construction phase will also bring negative impacts to the region as the locals
and road users will be bothered by, among other, increased noises, increased dust particles in
the air, reduction of capacity on the road network, or in complete blocking of roads, as well as
increased risks of accidents.
7.1.2.3.5. Environment Transport infrastructure projects such as Trans Sumatra will have impacts on a wide range of
environmental issues, including:
Air pollution: Atmospheric pollution is considerably impacted by road transport,
affecting among other human health and leading to material damage, loss of crops and
losses caused by damages incurred on the ecosystem. These impacts depend on
parameters such as vehicle composition of traffic, vehicles’ age, speed, type of fuel,
etc. The Trans Sumatra toll road will create shorter links for transport and therefore
will result in lower emission costs and a more efficient transport.
Climate change: The impact of a transport infrastructure project on climate change is
usually evaluated through the variation of CO2 emissions, which depend largely on
traffic vehicle composition and vehicles’ characteristics.
Noise pollution: It is defined as an undesirable sound in terms of decibels or as a sound
that causes mental disturbances in people due to its duration, intensity, or other
characteristics. The impacts of such a sound vary depending on the time of the day,
the population density close to the source of the noise, the existing noise level, etc.

45
PPP on Toll Road in Indonesia Tomás Herrero Diez
Congestion: Costs of traffic jams on society include costs of vehicle maintenance and
operation, an increase in the price of time, an increase in fuel costs, the cost of lack of
transport service, etc.
Nature and landscape: The natural environment of South Sumatra province
corresponds to hot, humid, and tropical rainforest. However, the majority of the area
where the toll road will be build consists of palm oil plantation. It is due to the fact
that these forests are located very close to some major cities such as Palembang.
The environmental effects should be valued and included in the economic analysis, where
possible. Notable work has been performed on costing these effects in the European Union.
However, as indicated in the Asian Development Bank (ADB) Practical Guide for Cost-Benefit
Analysis for Development60 direct application of European values is considered inappropriate
because these national average values per unit of pollutant are country specific and also
depend on income levels. Hence, given the range of uncertainty in this form of environmental
valuation it is adequate only to attempt to quantify these effects for projects where this is a
major factor; for example, a mass transit rail link that will replace road traffic in congested
urban areas. Research is ongoing into ways of quantifying and valuing these impacts in
transport projects and can be applied in the Asian context.
7.1.3. Social Discount Rate (SDR)
Costs and benefits streams estimated for Palembang – Indralaya toll road take place at
different times and hence, it is necessary to calculate their present value by taking into
account the time value of money.
The social discount rate (SDR) is the rate most used in Impact Assessments, as these normally
consider costs and benefits together from the point of view of society as a whole (rather than
from the point of view of a single stakeholder group)61. This rate reflects the social view on
how future benefits and cost should be valued against current ones.
Choosing an appropriate social discount rate is crucial for the economic analysis. According
the Asian Development Bank (ADB), the SDR applied for developing countries should be
between 8% and 15%62. The World Bank suggests using benchmark social discount rate of 10%
for the projects in Indonesia and BKPM (Indonesian Investment Coordinating Board or Badan
Koordinasi Penanaman Modal) applied a social discount rate of 12% in its proposed investment
projects63.
60 ADB (Asian Development Bank), “Cost-Benefit Analysis for Development. A Practical Guide”, http://www.adb.org/sites/default/files/institutional-document/33788/files/cost-benefit-analysis-development.pdf, 2013. 61 European Commission, “Guidelines. Tool #54: The use of discount rates”, http://ec.europa.eu/smart-regulation/guidelines/tool_54_en.htm. 62 Asian Development Bank (ADB); Juzhong Zhuang, Zhihong Liang, Tun Lin, and Franklin De Guzman, “Theory and Practice in the Choice of Social Discount Rate for Cost-Benefit Analysis: A Survey”, http://adb.org/sites/default/files/pub/2007/WP094.pdf, May 2007. 63 BKPM, Badan Koordinasi Penanaman Modal, “Revitalization of Yogyakarta Rail Station and Pedestrianization of Malioboro, DI Yogyakarta”, http://www7.bkpm.go.id/mobile/content/p23.php?m=&l=1&i=10101, 2010

46
PPP on Toll Road in Indonesia Tomás Herrero Diez
After debate with some road transport experts from the World Bank branch office in Jakarta,
the social discount rate for the Economic CBA for the toll road between Palembang and
Indralaya has been set in 10%.
7.1.4. Economic Analysis Indicators
Once the costs and benefits have been assigned monetary values and the appropriate social
discount rate has been chosen, the project’s economic performance is calculated. The main
economic indicators used to assess the economic value of the new toll road between
Palembang and Indralaya are the Economic Net Present Value (ENPV), the Economic Rate of
Return (ERR), and the Cost/Benefit ratio (C/B).
7.1.4.1. Economic Net Present Value (ENPV) The Economic Net Present Value (ENPV) is a very reliable, concise, and simple performance
indicator which gives an estimation of the economic welfare gain from the project. It is
calculated as the sum of the discounted net economic flows (the difference between the
discounted total social benefits and costs) of the project during its life. It has been calculated
using the following formula:
∑ ( )
( )
( )
Where:
ENPV is the Economic Net Present Value.
Bt represents the social benefits in the year t.
Ct represents the cost in the year t.
r is the Social Discount Rate (SDR) = 10% (See section 7.1.3. above).
n is the horizon year (30 years).
In order terms, the ENPV could be expressed as the difference between the discounted total
social benefits and costs:
∑
( )
∑
( )
The benefits and costs estimated in the previous sections shall be discounted using a social
discount rate of 10% during 30 years to calculate the ENPV (please refer to “Annex F. Cost and
Benefits discounted and ENPV”).
The result has been an ENPV positive of IDR 1,305.82 Billion. Therefore, the overall benefits
generated by the project are higher that its cost for society and it can be concluded that the
Indralaya – Palembang toll road is desirable from a socio-economic point of view.
(7.1.)
(7.2.)

47
PPP on Toll Road in Indonesia Tomás Herrero Diez
The most part of the economic benefits generated by the new toll road are due to the
passenger’s time savings (68.20%) and the savings in vehicle operating costs (31.79%). Both
are closely related with the route shorter, more than one hour.
The third impact which have been quantified (the traffic accident reduction) constitutes the
0.02% of the benefits. This is the result of a conservative approach taking solely into account
the length of the route shorter, six km. However, the road condition improvement would lead
a greater traffic accident reduction and economic benefit.
The chart below shows the economic benefit distribution:
Chart 7.4. Economic benefits distribution.
Source: Own elaboration.
7.1.4.2. Economic Rate of Return (ERR) The internal rate of return is defined as the discount rate at which a stream of costs and
benefits has a net present value of zero 64. The Economic Rate of Return (ERR) is the internal
rate of return calculated using the social benefits and costs and expressing the socio-economic
profitability the project. It is, in other words, the interest rate at which the project’s discounted
benefits equal discounted costs, both valued from the entire society’s point of view.65
The formula to calculate de ERR is shown below:
64 European Union, “Guide to Cost Benefit Analysis of Investment Projects”, http://ec.europa.eu/regional_policy/sources/docgener/guides/cost/guide2008_en.pdf, July 2008. 65 European Investment Bank (EIB), “The Economic Appraisal of Investment Projects at the EIB”, http://www.eib.org/attachments/thematic/economic_appraisal_of_investment_projects_en.pdf, March 2013.
31.79%
68.20%
0.02%
VTTS
VOC
Accidents
Table 7.7. Economic Indicators
Value (IDR Billion)
ENPV 1,305.82 Source: Own elaboration.

48
PPP on Toll Road in Indonesia Tomás Herrero Diez
∑
( )
( )
( )
Where:
ERR is the Economic Rate of Return.
Bt represents the social benefits in the year t.
Ct represents the cost in the year t.
n is the horizon year (30 years).
The benefits and costs estimated in the previous sections during the 30 years concession
period, has been used to calculate de ERR (please refer to Annex F).
The ERR for the project is 13.52 %, a figure over the social discount rate set of 10%. Hence, the
Palembang – Indralaya toll road benefits would be larger than the costs for society.
7.1.4.3. Benefit - Cost Ratio (B/C) The benefit-cost ratio is an indicator which illustrates how much net benefit would be obtained
in return for each unit of cost.66 It is calculated as the present value of the benefits divided by
the present value of the costs:
( )
( )
Where:
B/C is the Benefit-Cost ratio.
B are the project benefits.
C are the project costs. PV is the Present Value.
The discounted benefits and costs estimated in the previous sections during the 30 years
concession period, has been used to calculate the B/C ratio (please refer to Annex F).
The B/C ratio for the project is 1.28. Therefore, the Indralaya – Palembang toll road will
generate a net benefit of about 1.28 units in return for each unit of cost incurred. It can be
concluded that the project is suitable since the benefits, measured by the present value of the
66 Ministry of Infrastructure of the Republic of Serbia and Public Enterprise Roads of Serbia, “Manual Cost Benefit Analysis”, http://www.putevi-srbije.rs/strategijapdf/Manual_Cost_Benefit_Analysis.pdf, 2010
Table 7.8. Economic Indicators
Value
ERR 13.52 % Source: Own elaboration.
(7.4.)
(7.3.)
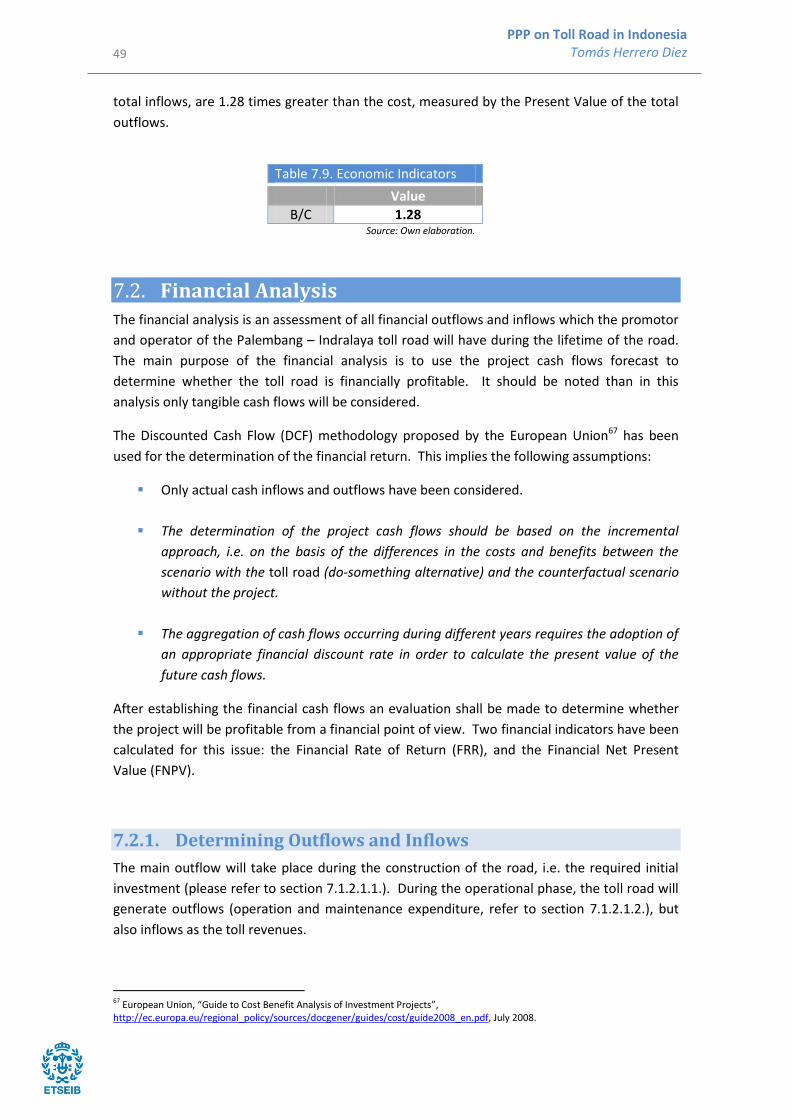
49
PPP on Toll Road in Indonesia Tomás Herrero Diez
total inflows, are 1.28 times greater than the cost, measured by the Present Value of the total
outflows.
7.2. Financial Analysis
The financial analysis is an assessment of all financial outflows and inflows which the promotor
and operator of the Palembang – Indralaya toll road will have during the lifetime of the road.
The main purpose of the financial analysis is to use the project cash flows forecast to
determine whether the toll road is financially profitable. It should be noted than in this
analysis only tangible cash flows will be considered.
The Discounted Cash Flow (DCF) methodology proposed by the European Union67 has been
used for the determination of the financial return. This implies the following assumptions:
Only actual cash inflows and outflows have been considered.
The determination of the project cash flows should be based on the incremental
approach, i.e. on the basis of the differences in the costs and benefits between the
scenario with the toll road (do-something alternative) and the counterfactual scenario
without the project.
The aggregation of cash flows occurring during different years requires the adoption of
an appropriate financial discount rate in order to calculate the present value of the
future cash flows.
After establishing the financial cash flows an evaluation shall be made to determine whether
the project will be profitable from a financial point of view. Two financial indicators have been
calculated for this issue: the Financial Rate of Return (FRR), and the Financial Net Present
Value (FNPV).
7.2.1. Determining Outflows and Inflows
The main outflow will take place during the construction of the road, i.e. the required initial
investment (please refer to section 7.1.2.1.1.). During the operational phase, the toll road will
generate outflows (operation and maintenance expenditure, refer to section 7.1.2.1.2.), but
also inflows as the toll revenues.
67 European Union, “Guide to Cost Benefit Analysis of Investment Projects”, http://ec.europa.eu/regional_policy/sources/docgener/guides/cost/guide2008_en.pdf, July 2008.
Table 7.9. Economic Indicators
Value
B/C 1.28 Source: Own elaboration.

50
PPP on Toll Road in Indonesia Tomás Herrero Diez
It is worthy to notice that in the financial analysis, intangible benefits such as passenger’s time
savings, vehicle operation costs savings, and traffic accidents reduction are not considered.
The chart below displays the “balance sheet” which summarizes the outflows and inflows that
have been considered:
Chart 7.5. Outflows and inflows for Palembang – Indralaya toll road.
Source: Own elaboration.
7.2.1.1.1. Toll revenue The toll road will generate yearly revenues to the owner of the infrastructure which should be
calculated. In order to quantify and monetize this inflow, the toll revenues shall be yearly
estimated based on the traffic forecast (please refer to section “6. Traffic Study”) and the toll
fare (please refer to section “5. Tariff Estimation”).
As shown on table below, toll revenue will increase every year due to the traffic volume and economic growth. This revenue is estimated to reach IDR 97.49 Billion in 2018 and IDR 252.10 Billion in 2048.
Table 7.10. Toll revenue evolution (constant prices).
2018 2028 2038 2048
Toll Revenue (IDR Billion)
97.49 133.82 183.67 252.10
Source: Own elaboration.
For detailed toll revenue annual evolution please refer to the “Annex G. Toll revenue”.
7.2.2. Financial Discount Rate (FDR)
The outflows and inflows calculated for Palembang – Indralaya toll road occur during different
times and hence, it is required the calculation of the present value of these future cash flows.
The financial discount rate (FDR) is defined as the opportunity cost of capital. Opportunity cost
means that when the capital is used in one project a return on another project is sacrificed.
FLOWS
OUTFLOWS INFLOWSImpact on…
Developer
Operator
Initial investment
Operation & Maintenance
Toll Revenue

51
PPP on Toll Road in Indonesia Tomás Herrero Diez
Thus, there is an implicit cost when capital is sunken into an investment project: the loss of
income from an alternative project68.
The estimation of the current cost of the capital is performed based on several long-term rates
of returns such as the Indonesian Government Bonds (10Y and 5Y), the BI Rate, and the
lending rate (see table below). The BI rate is defined as the policy rate reflecting the monetary
policy stance adopted by Bank Indonesia69. The BI rate and lending rate are fixed monthly by
Bank Indonesia in order to maintain macroeconomic stability.
It could be assume that the project proposers should be experienced investors, who are able
to obtain a rate of return marginally higher than the simple average shown above. Therefore,
a financial discount rate of 8.50% is applied for Palembang – Indralaya toll road.
7.2.3. Financial Analysis Indicators
Having calculated the financial cash flows, the financial profitability of the project has to be
evaluated. The financial indicators needed to estimate the financial performance of the new
toll road between Palembang and Indralaya are: the Financial Net Present Value (FNPV), and
the Financial Internal Rate of Return (FRR).
7.2.3.1. Financial Net Present Value (FNPV) The Financial Net Present Value (FNPV) is defined as the result when the expected investment
and operating costs of the project (suitably discounted) are deducted from the discounted value
of the expected revenues.70 It has been calculated using the following formula:
∑
( )
( )
Where:
FNPV is the Financial Net Present Value.
68 European Commission, “Guidelines. Tool #54: The use of discount rates”, http://ec.europa.eu/smart-regulation/guidelines/tool_54_en.htm. 69 Bank Indonesia, “Explanation of BI rate”, http://www.bi.go.id/en/moneter/bi-rate/penjelasan/Contents/Default.aspx. 70 European Union, “Guide to Cost Benefit Analysis of Investment Projects”, http://ec.europa.eu/regional_policy/sources/docgener/guides/cost/guide2008_en.pdf, July 2008.
Table 7.11. Estimation of long-term annual financial rate of return
Indicators Rate
Government Bond 10Y 8.46%
Government Bond 5Y 8.19%
Interest rate (BI Rate) 7.50%
Lending rate 8.00%
Simple average 8.04% Source: Own elaboration using data from Bank of Indonesia.
(7.5.)

52
PPP on Toll Road in Indonesia Tomás Herrero Diez
St represents the balance of cash flow (inflows – outflows) in the year t.
at represents the financial discount factor in the year t and it is defined as:
( )
i is the Financial Discount Rate (FDR) = 8.50% (See section 7.2.2. above).
n is the time horizon (30 years).
The outflows and inflows calculated in the previous sections shall be discounted using the
financial discount rate of 8.50% during 30 years to calculate the FNPV (please refer to “Annex
H. Outflows and inflows discounted and FNPV”).
The result has been a FNPV negative of IDR -3,413.45 Billion. This negative FNPV indicates that
the Indralaya – Palembang toll road will not generate enough revenues to cover the
investment and operating costs. Therefore, it can be concluded that the project is not
commercially viable and some financial assistance would be needed.
7.2.3.2. Financial Rate of Return (FRR) The financial discount rate of return (FRR) is defined as the discount rate which zeros out the
FNPV71. This rate is calculated taking the initial investment and operating costs as outflows
and the projected revenues as inflows. The FRR is compared with a benchmark in order to
measure the financial profitability of the project, as well as, its capacity to remunerate the
investment cost with the net revenues generated.
The formula to calculate de FRR is shown below:
∑
( )
( )
( )
Where:
FRR is the Financial Rate of Return.
FNPV is the Financial Net Present Value.
St represents the balance of cash flow (inflows – outflows) in the year t.
n is the time horizon (30 years).
The outflows and inflows calculated in the previous sections during the 30 years concession
period, has been used to calculate de FRR (please refer to Annex H).
71 European Union, “Guide to Cost Benefit Analysis of Investment Projects”, http://ec.europa.eu/regional_policy/sources/docgener/guides/cost/guide2008_en.pdf, July 2008.
Table 7.12. Financial Indicators
Value (IDR Billion)
FNPV -3,413.45 Source: Own elaboration.
(7.6.)

53
PPP on Toll Road in Indonesia Tomás Herrero Diez
The FRR obtained for the project is -6.28%. This negative FRR indicates that Indralaya –
Palembang toll road would be not profitable from the commercial point of view and it would
be not viable in the financial market.
Table 7.13. Financial Indicators
Value
FRR - 6.28% Source: Own elaboration.
The negative FRR suggests that public support is required to carry out this project since the
project itself is not capable to generate enough revenues to attract investors.

54
PPP on Toll Road in Indonesia Tomás Herrero Diez
8. RISK ASSESSMENT
Risks are often perceived as threats to the success of a project. However, identifying them
ahead of time and having reliable and accurate information during the different phases of a
project enables the parties involved to assess these risks and thus make decisions on the
allocation of capabilities and resources in order to manage the risks in the most efficient way.
In this sense, knowledge about risks enhances the chances of project success.
Especially in the case of large infrastructure investments, such as toll road concessions, one of
the major constraints to attract private investment is the risk uncertainty concerning the
management between investors and the government. Clear information on what investors
should expect and may face will raise their awareness concerning the risks and will enable
them to prepare the necessary plans to anticipate and mitigate such risks. In this regard, much
work is still needed in Indonesia in order to establish rules and regulations for risk
management and risk sharing with the government, in order to encourage participation of
private investors in the sector.
8.1. Risk identification Risks regarding toll road projects in Indonesia have not been extensively studied and the
references in the national and international literature are limited. However, the different
literature agrees that the risks that have to be addressed from the investor’s point of view are
the following72:
Pre-construction, including the selection of the corridor for the highway,
environmental issues, oppositions from some groups, legal issues, and arrangements
of project financing issues.
Uncertainty of traffic and demand for the toll road.
Investment/business risk, concerning revenues, expenses, interest rates, and inflation,
taxation, and regulatory risks.
Construction risks, such as cost over-runs, delays, specifications not met.
Operations risks (inefficiency and toll route competition with existing high quality non
toll road).
Maintenance and rehabilitation risk.
In 2005, the Ministry of Public Works of Indonesia identified 55 risks regarding toll road
projects, which it then classified into the following nine categories73:
Political and legislative.
Risks to toll way companies.
72 Sekolah Arsitektur, Perencanaan dan Pengembangan Kebijakan ITB, Karamullahu Wajhahu, “Formulating Public Private Partnership on Toll Road in Indonesia: A Case Study of Manado-Bitung Toll Road”, http://sappk.itb.ac.id/jpwk2/wp-content/uploads/2013/11/V1N2-Formulating-Public-Private-Partnership-on-Toll-Road-in-Indonesia.pdf, 2013. 73 Penerbit Universiti Sains Malaysia, Djoen San Santoso, Tri Basuki Joewono, Andreas Wibowo, Harlan P.A. Sinaga and Wimpy Santosa, “Public-Private Partnerships for Tollway Construction and Operation: Risk Assessment and Allocation from the Perspective of Investors”, http://web.usm.my/jcdc/vol17_2_2012/Art%203_jcdc17-2.pdf, 2012.

55
PPP on Toll Road in Indonesia Tomás Herrero Diez
Economic and monetary.
Design.
Land acquisition.
Construction.
Traffic.
Maintenance and operation.
Force majeure.
A different report identified 46 risks and organized them into four categories74:
Project performance risks, which include planning, construction, and operational risks.
Project credit risks, including market risks, counterpart default, exchange rate, interest
rate, and refinancing.
Demand risks, consisting of political risks, economic stability, laws and regulations, and
foreign exchange convertibility.
Force majeure, mainly covering natural disasters and political risks.
Another report about the Solo-Kertosono toll road identifies seven risks75:
Land acquisition, including land acquisition cost certainty and the availability of the
land.
Construction, including time and cost.
The cost of money, covering the amount of loan, interests, and loan payback period.
Operation and maintenance, which is related to construction quality.
Traffic volume.
Pricing policy.
Force majeure.
All in all, there are nine risks that systematically appear in all toll road projects in Indonesia and
thus have been ranked as the top risk events. In this sense, it is safe to assume that these risks
apply to the Trans Sumatra toll road stretch that is being studied in this paper and thus
information in order to manage these risks would be essential. These risks are the following:
Right-of-way risk: This risk is related to the potential unavailability of the land, to the
duration of time to acquire such land, which might incur in the land being unable to be
used at the required time, and to potential increases in the land price due to these
delays and/or to prolonged compensation payment transaction processes. Land
acquisition in Indonesia is the most problematic risk in these types of projects, mainly
because the time needed to finalize the whole land acquisition process cannot be
predicted. Despite the government recently establishing the land revolving fund
mechanism to minimize this risk, the effective implementation of this mechanisms is
still ongoing.
74 Journal of Traffic and Logistics Engineering Vol. 2, No. 1, “Risk Inclusion in the Reserve Price Estimation for Toll Road Concession Award”, http://www.jtle.net/uploadfile/2014/0414/20140414023947706.pdf, March 2014. 75 Journal of Traffic and Logistics Engineering Vol. 2, No. 1, “Risk Inclusion in the Reserve Price Estimation for Toll Road Concession Award”, http://www.jtle.net/uploadfile/2014/0414/20140414023947706.pdf, March 2014.

56
PPP on Toll Road in Indonesia Tomás Herrero Diez
Design risk: This risk is related to the use of less precise planning standards,
inaccuracies in data collection, and misinterpretation of the designer of the project’s
owner idea, which might lead to increases in costs when a change in design is
necessary.
Completion risk: This risk refers to the possible delays which may occur during the
construction phase due to unexpected difficulties such as utilities rearrangement,
complications due to geological or hydrological conditions...
Cost over-run risk: It is related with the possibility that the actual costs during the
construction phase could excess the estimated costs due to miscalculation for
undetailed engineering, material cost increases, or faults of contractor during the
project execution.
Financial risk: This risk is related to the financial viability aspects of the project, which
include, but are not limited to the following:
o Financing risk: The financing risk is related to the debt and the equity being
able to provide or not to finance the project.
o Financial parameter risk: This risk covers parameters such as the inflation rate,
loan interest rate, exchange rate, discount rate, market conditions… These are
particularly hard to predict in developing countries such as Indonesia and
often lead to cost escalation. This becomes a big issue in a project with a long-
period concession.
Operation & Maintenance risk: Indonesia’s roads are often overloaded mainly due to
poor enforcement of the traffic route for trucks and other heavy vehicles. This leads
to an increase in operation and maintenance costs and makes it difficult for the
investor to provide the contracted services. In addition, maintenance is often the
project stage where is easiest to cut costs, often leaving an infrastructure with the
minimum maintenance and in less than optimal conditions.
Revenue risk: This risk is responsible for the project being unable to meet the
expected level of financial viability. This is most commonly due to unexpected changes
in either the traffic demand or the agreed tariff, or the combination of both factors.
o Demand risk: This risk takes into account the possibility of the demand in
traffic for the service being unexpectedly lower than what was initially
projected, which directly affects the toll revenues. This risk is especially
important in developing countries as estimating traffic volumes becomes more
difficult due to policy enforcement being highly unpredictable.
o Toll tariff risk: This is the risk of the tariff being unexpectedly lower than
initially projected, which can be due to a miscalculation of the projected tariff.
Another important issue to take into account is the strong influence of politics
in the decision of tariff adjustment.

57
PPP on Toll Road in Indonesia Tomás Herrero Diez
Legal & Institutional Support risk: In Indonesia, like in other developing countries,
there may be a lack of legal support for investors. While laws and regulations have
been established, the lack of or the weak enforcement for their implementation often
makes investors incur into additional costs.
Force Majeure: This risk covers any extraordinary event or circumstance that cannot
be reasonably predicted and that is beyond the control of the parties involved in the
project. These include natural disasters (volcanic eruption, earthquakes…), political
instability (war, riots…), and crimes.
8.2. Risk allocation
These risks shall be allocated to the party that can better manage them to ensure a fair
distribution between both parties: public and private sector. The Ministry of Finance of
Indonesia issued a general regulation (Peraturan Menteri Keuangan Normor
38/PMK.Ol/200676) to define the risk allocation in infrastructure projects. This 10-page decree
only provides a general guideline for controlling and managing risks.
According to the above mentioned regulation the right-of-way, and force majeure risks shall be
control by public party. Whereas some risks such as design, over-run, and operation and
maintenance should be allocated to the private stakeholder. The rest of the risks will be
shared between both parties.
The majority of the completion risk will be assumed by the private company. However,
whether the delays are attributed to the public party due to difficulties with right-of-way or
regulatory issues, the public party should be responsible for this risk.
Even the most part of the financial risks shall be allocated to the private party, some of them
such as the inflation risk or market conditions should be taken by public stakeholders since
they depends on macroeconomic events which are beyond the control of private party.
The demand risk cannot be controlled by any of the parties, hence it shall be jointly assumed
by both. However, the toll tariff risk should be allocated in the public party, since the Ministry
of Public Works and Public Housing through the Indonesian Toll Road Authority is responsible
for setting the tariffs and it has a certain politic influence uncontrollable by the concessionaire.
Public and private parties may cooperate to enforce the implementation of Indonesian laws
regarding infrastructure investment, as well as, to obtain timely all the required consents from
government authorities.
76 Ministry of Finance of Indonesia, “Peraturan Menteri Keuangan Normor 38/PMK.Ol/2006 tengang petunjuk pelaksanaan pengendalian dan pengelolaan risiko atas penyediaan infrastruktur”, http://pkps.bappenas.go.id/dokumen/uu/Pengelolaan%20Resiko/5.%20Permenkeu%20Nomor%2038-06.pdf, 19 May 2006.
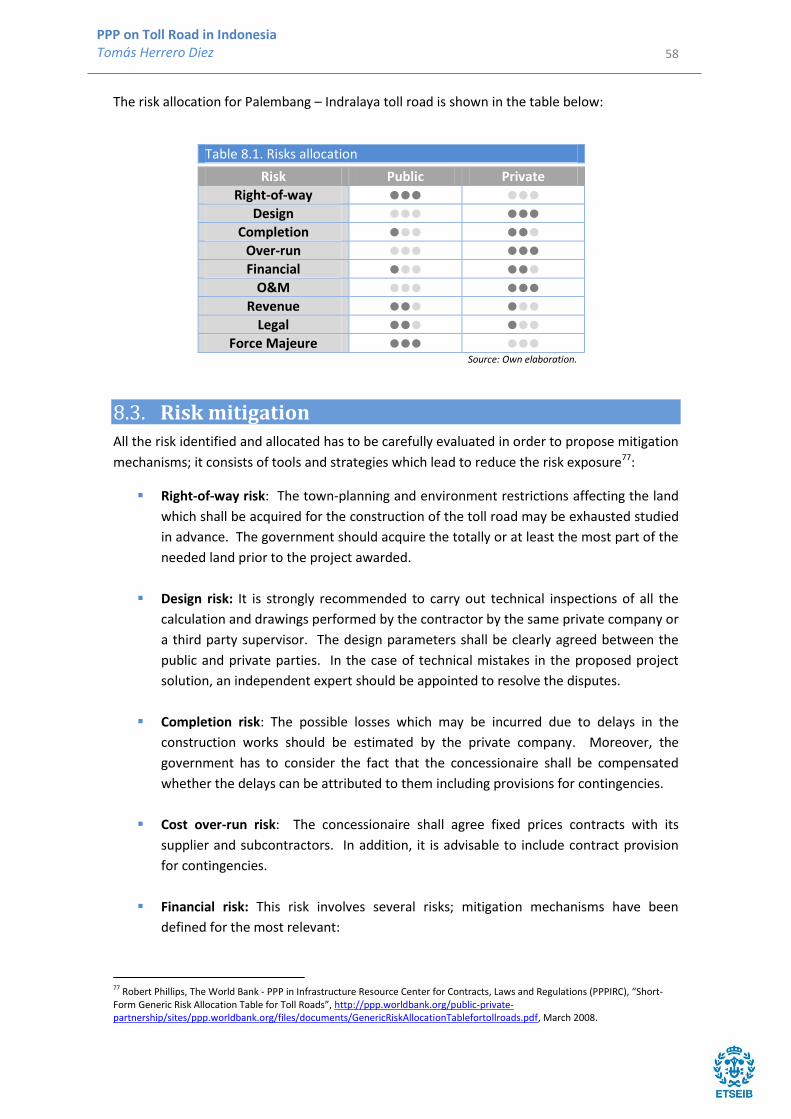
58
PPP on Toll Road in Indonesia Tomás Herrero Diez
The risk allocation for Palembang – Indralaya toll road is shown in the table below:
Table 8.1. Risks allocation
Risk Public Private
Right-of-way Design
Completion Over-run
Financial O&M
Revenue Legal
Force Majeure Source: Own elaboration.
8.3. Risk mitigation All the risk identified and allocated has to be carefully evaluated in order to propose mitigation
mechanisms; it consists of tools and strategies which lead to reduce the risk exposure77:
Right-of-way risk: The town-planning and environment restrictions affecting the land
which shall be acquired for the construction of the toll road may be exhausted studied
in advance. The government should acquire the totally or at least the most part of the
needed land prior to the project awarded.
Design risk: It is strongly recommended to carry out technical inspections of all the
calculation and drawings performed by the contractor by the same private company or
a third party supervisor. The design parameters shall be clearly agreed between the
public and private parties. In the case of technical mistakes in the proposed project
solution, an independent expert should be appointed to resolve the disputes.
Completion risk: The possible losses which may be incurred due to delays in the
construction works should be estimated by the private company. Moreover, the
government has to consider the fact that the concessionaire shall be compensated
whether the delays can be attributed to them including provisions for contingencies.
Cost over-run risk: The concessionaire shall agree fixed prices contracts with its
supplier and subcontractors. In addition, it is advisable to include contract provision
for contingencies.
Financial risk: This risk involves several risks; mitigation mechanisms have been
defined for the most relevant:
77 Robert Phillips, The World Bank - PPP in Infrastructure Resource Center for Contracts, Laws and Regulations (PPPIRC), “Short-Form Generic Risk Allocation Table for Toll Roads”, http://ppp.worldbank.org/public-private-partnership/sites/ppp.worldbank.org/files/documents/GenericRiskAllocationTablefortollroads.pdf, March 2008.
59
PPP on Toll Road in Indonesia Tomás Herrero Diez
o Inflation risk: Whether the actual inflation rate exceeds the estimated inflation
rate due adverse macroeconomic events, the public party has to carry out an
adjustment of toll tariff.
o Loan interest rate risk: This risk could be mitigating using fixed rate loans
which provide a foreseeable repayment scheme. If getting fixed rate debt is
not possible, hedging instruments could be implemented to manage this risk.
o Currency exchange risk: If the debt is denominated in foreign currencies and
the project revenues are to be earned in local currency, the revenues should
be adjusted to compensate for any relevant change in exchange rate. Hedging
arrangements or index-linked adjustment of costs (construction investment
and operating and maintenance costs) are advisable to manage properly this
risk.
Operation & Maintenance risk: The cost related with operation and maintenance
should be locked in, when possible, through hedging and future contracts. The costs
which are not hedged shall be limited. Frequent monitoring is highly advisable.
Revenue risk: In the case that the demand or the tariff may be less than projected, the
government should support and compensate the private party. Hence, previous
arrangements between both parties should be established.
Legal & Institutional Support risk: The private party should carry out an exhaustive
due diligence and legal scan to identify all the relevant regulation and required
consents during the feasibility phase. Project agreements with the government should
be defined in terms of compensation to be paid in the case of unilateral law
modification.
Force Majeure: The private party shall include dedicated financial reserves and
insurance of natural disaster risks covering the occurrence of unexpected events.
Moreover, a back-to-back agreement (as far as possible) should be include in the
contract to ensure appropriate government indemnities to the concessionaire in the
case of force majeure events.
Some of these risks are unavoidable; however, others could easily be reduced with the
implementation of laws and regulations and their proper enforcement. In this regard,
Indonesia has a long path forward to attract investors into the toll road sector

60
PPP on Toll Road in Indonesia Tomás Herrero Diez
9. FINANCING STRUCTURE
The CBA provides evidence that the project is desirable from a socio-economic point of view.
This is demonstrated by a positive ENPV of IDR 1,305.82 Billion, an ERR of 13.52 % (higher than
the social discount rate applied of 10%), and a B/C of 1.28. Therefore, undertaking the
Palembang - Indralaya toll road is expected to result in a welfare gain for South Sumatra
society.
However, the project has an unsatisfactory financial justification because of the negative
values of both, the FNPV (IDR -3,413.45 Billion) and the FRR (-6.28%). Since the revenues
generated by the new toll roads wouldn’t be enough to meet the required initial investment
and operating costs, another financing source should be necessary to make it commercially
feasible.
The main available sources of financing identified for toll roads in Indonesia are the following:
Indonesian Government financial participation:
o State Budget or Anggaran Pendapatan dan Belanja Negara (APBN).
o Local Budget or Anggaran Pendapatan, dan Belanja Daerah (APBD).
Private investors (Indonesian or foreigners).
Indonesian Government co-finance is required to make the project financially sustainable. A
project is financially sustainable when it does not incur the risk of running out of cash in the
future78. Moreover, some other incentives such as support for environmental assessment,
land acquisition, or legal assistance should be provided by the Indonesian Government to
attract private investors.
Several bilateral Memorandum of Understanding (MoU) has been already signed between
foreign companies and the government of Indonesia in order to indicate an intended common
line of action for developing toll road projects. The agreements signed have been79:
MoU between Posco Engineering & Construction (South Korea) and the government of
Indonesia signed on April 22, 2014 for the development of Manado – Bitung toll road.
MoU between West Nexco Ltd. and Jexway Ltd. (Japan) and the government of
Indonesia also signed on April 22, 2014 for the development of Cibitung – Cikaran toll
road.
MoU between CMS Int. (Malaysia) and the government of Indonesia also signed on
April 22, 2014 for the development of Cengkareng – Kunciran toll road.
78 European Union, “Guide to Cost Benefit Analysis of Investment Projects”, http://ec.europa.eu/regional_policy/sources/docgener/guides/cost/guide2008_en.pdf, July 2008. 79 Abdul Hadi Hs., Jasa Marga, “One day Seminar: Toll Road Business Opportunities in Indonesia”, May 21, 2014.
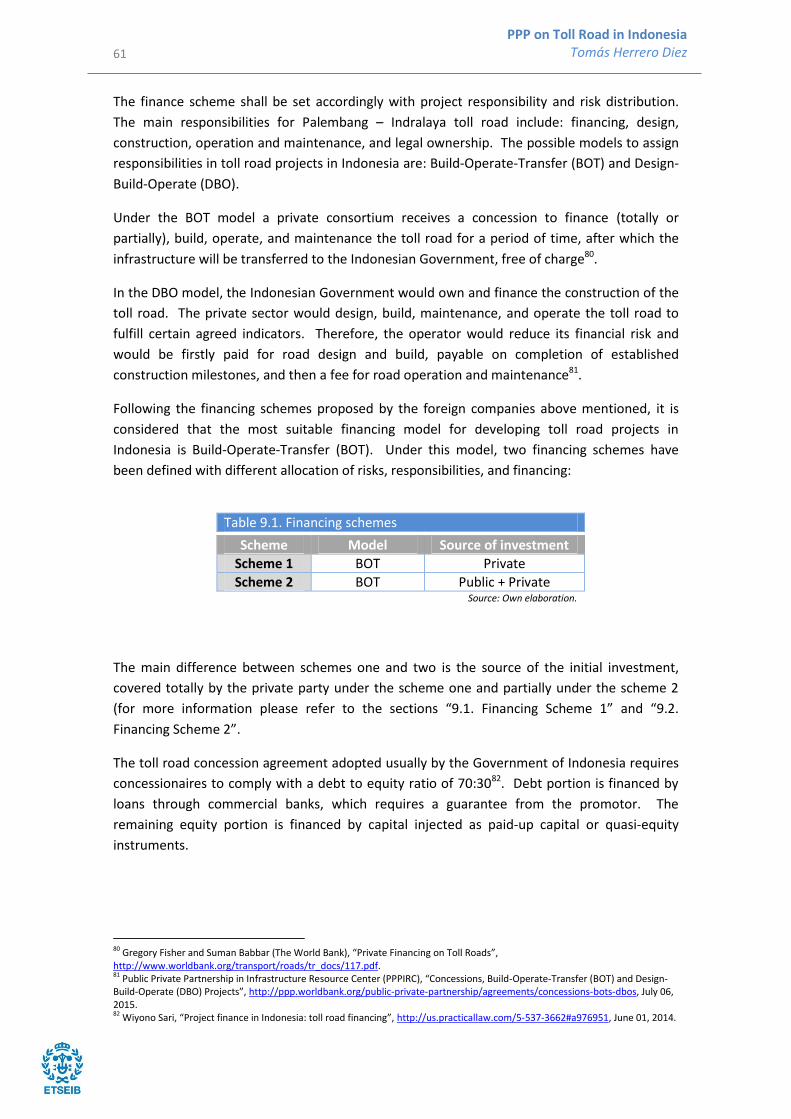
61
PPP on Toll Road in Indonesia Tomás Herrero Diez
The finance scheme shall be set accordingly with project responsibility and risk distribution.
The main responsibilities for Palembang – Indralaya toll road include: financing, design,
construction, operation and maintenance, and legal ownership. The possible models to assign
responsibilities in toll road projects in Indonesia are: Build-Operate-Transfer (BOT) and Design-
Build-Operate (DBO).
Under the BOT model a private consortium receives a concession to finance (totally or
partially), build, operate, and maintenance the toll road for a period of time, after which the
infrastructure will be transferred to the Indonesian Government, free of charge80.
In the DBO model, the Indonesian Government would own and finance the construction of the
toll road. The private sector would design, build, maintenance, and operate the toll road to
fulfill certain agreed indicators. Therefore, the operator would reduce its financial risk and
would be firstly paid for road design and build, payable on completion of established
construction milestones, and then a fee for road operation and maintenance81.
Following the financing schemes proposed by the foreign companies above mentioned, it is
considered that the most suitable financing model for developing toll road projects in
Indonesia is Build-Operate-Transfer (BOT). Under this model, two financing schemes have
been defined with different allocation of risks, responsibilities, and financing:
Table 9.1. Financing schemes
Scheme Model Source of investment
Scheme 1 BOT Private
Scheme 2 BOT Public + Private Source: Own elaboration.
The main difference between schemes one and two is the source of the initial investment,
covered totally by the private party under the scheme one and partially under the scheme 2
(for more information please refer to the sections “9.1. Financing Scheme 1” and “9.2.
Financing Scheme 2”.
The toll road concession agreement adopted usually by the Government of Indonesia requires
concessionaires to comply with a debt to equity ratio of 70:3082. Debt portion is financed by
loans through commercial banks, which requires a guarantee from the promotor. The
remaining equity portion is financed by capital injected as paid-up capital or quasi-equity
instruments.
80 Gregory Fisher and Suman Babbar (The World Bank), “Private Financing on Toll Roads”, http://www.worldbank.org/transport/roads/tr_docs/117.pdf. 81 Public Private Partnership in Infrastructure Resource Center (PPPIRC), “Concessions, Build-Operate-Transfer (BOT) and Design-Build-Operate (DBO) Projects”, http://ppp.worldbank.org/public-private-partnership/agreements/concessions-bots-dbos, July 06, 2015. 82 Wiyono Sari, “Project finance in Indonesia: toll road financing”, http://us.practicallaw.com/5-537-3662#a976951, June 01, 2014.
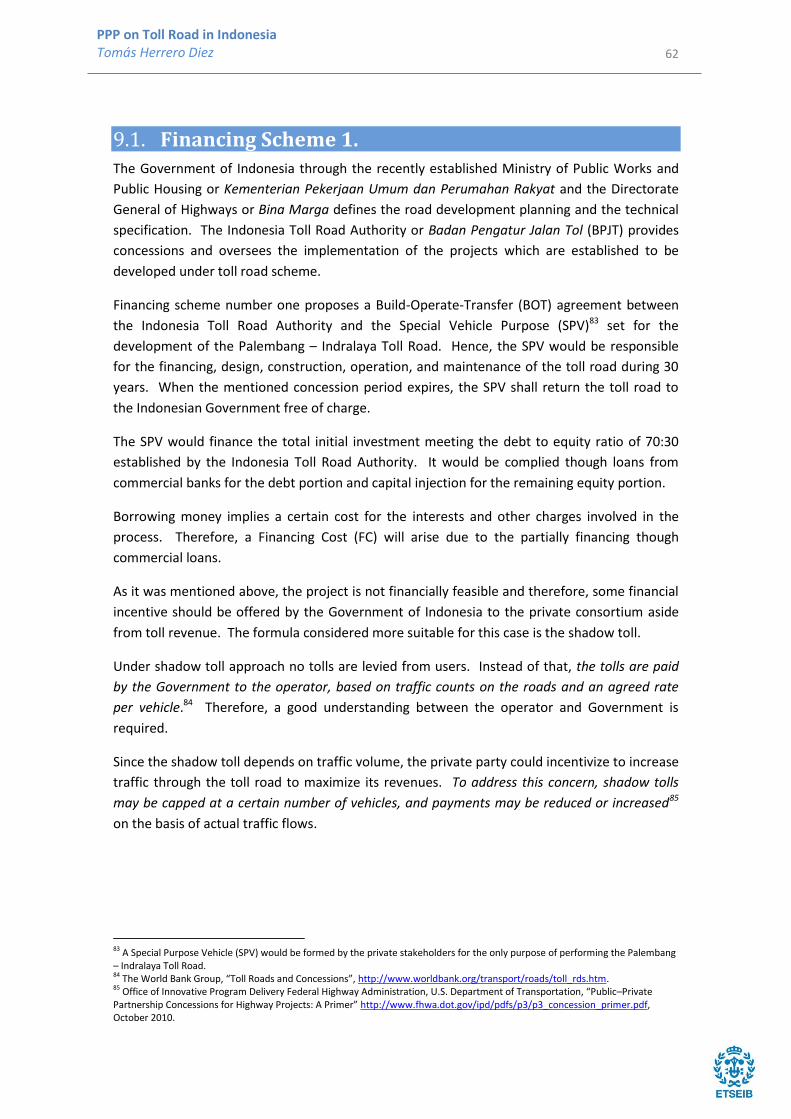
62
PPP on Toll Road in Indonesia Tomás Herrero Diez
9.1. Financing Scheme 1.
The Government of Indonesia through the recently established Ministry of Public Works and
Public Housing or Kementerian Pekerjaan Umum dan Perumahan Rakyat and the Directorate
General of Highways or Bina Marga defines the road development planning and the technical
specification. The Indonesia Toll Road Authority or Badan Pengatur Jalan Tol (BPJT) provides
concessions and oversees the implementation of the projects which are established to be
developed under toll road scheme.
Financing scheme number one proposes a Build-Operate-Transfer (BOT) agreement between
the Indonesia Toll Road Authority and the Special Vehicle Purpose (SPV)83 set for the
development of the Palembang – Indralaya Toll Road. Hence, the SPV would be responsible
for the financing, design, construction, operation, and maintenance of the toll road during 30
years. When the mentioned concession period expires, the SPV shall return the toll road to
the Indonesian Government free of charge.
The SPV would finance the total initial investment meeting the debt to equity ratio of 70:30
established by the Indonesia Toll Road Authority. It would be complied though loans from
commercial banks for the debt portion and capital injection for the remaining equity portion.
Borrowing money implies a certain cost for the interests and other charges involved in the
process. Therefore, a Financing Cost (FC) will arise due to the partially financing though
commercial loans.
As it was mentioned above, the project is not financially feasible and therefore, some financial
incentive should be offered by the Government of Indonesia to the private consortium aside
from toll revenue. The formula considered more suitable for this case is the shadow toll.
Under shadow toll approach no tolls are levied from users. Instead of that, the tolls are paid
by the Government to the operator, based on traffic counts on the roads and an agreed rate
per vehicle.84 Therefore, a good understanding between the operator and Government is
required.
Since the shadow toll depends on traffic volume, the private party could incentivize to increase
traffic through the toll road to maximize its revenues. To address this concern, shadow tolls
may be capped at a certain number of vehicles, and payments may be reduced or increased85
on the basis of actual traffic flows.
83 A Special Purpose Vehicle (SPV) would be formed by the private stakeholders for the only purpose of performing the Palembang – Indralaya Toll Road. 84 The World Bank Group, “Toll Roads and Concessions”, http://www.worldbank.org/transport/roads/toll_rds.htm. 85 Office of Innovative Program Delivery Federal Highway Administration, U.S. Department of Transportation, “Public–Private Partnership Concessions for Highway Projects: A Primer” http://www.fhwa.dot.gov/ipd/pdfs/p3/p3_concession_primer.pdf, October 2010.

63
PPP on Toll Road in Indonesia Tomás Herrero Diez
The chart below shows the Financing Scheme number one:
Chart 9.1. Financing Scheme Number 1.
Source: Own elaboration.
Under this financing scheme, a new outflow has been defined, the Financing Cost, as well as a
new inflow, the shadow toll. Hence, both flows shall be included to calculate the project cash
flows forecast and the financial indicators: FNPV and FRR.
The outflow which arises under this scheme is the Financing Cost. The debt portion would
consist of 70% of the total initial investment (IDR 2,492 Billion) and it would be meeting by
means of loans from commercial banks with an interest rate of 8% per annum and 10 years
repayment period86. The financing cost is calculated to reach IDR 18.27 Billion in 2019. For
detailed financing cost evolution please refer to the “Annex J. Cash flows under Financing
Scheme 1”.
The inflow introduced to make the toll road financially viable is a shadow toll estimated in
40.000 IDR/vehicle. As shown on table below, shadow toll will increase every year due to the
86 Financial conditions set by Bank Indonesia for loans in similar projects.
GOVERNMENT OF INDONESIA
Ministry of Public Works and Public
Housing
Indonesia Toll Road Authority
Directorate General of Highways
Palembang – IndralayaToll Road
SPV
ConcessionAgreement
Return back to the Gov. end of concessión period
BOT
PUBLIC PRIVATE
DEBT70%
EQUITY30%
TOLLSHADOW
TOLL
Toll fee Public Taxes LoansCapital injectionB
an
ks
Source of funds
FinancingDesign
ConstructionOperation
Available funds

64
PPP on Toll Road in Indonesia Tomás Herrero Diez
traffic volume. This inflow is calculated to reach IDR 236.35 Billion in 2018 and IDR 611.15
Billion in 2048.
Table 9.2. Shadow toll evolution.
2018 2028 2038 2048
Shadow Toll (IDR Billion)
236.35 324.40 445.26 611.15
Source: Own elaboration.
For detailed shadow toll annual evolution please refer to the “Annex I. Shadow Toll under
Financing Scheme 1”.
These new outflow and inflow shall be also discounted using the financial discount rate of
8.50% during 30 years to calculate the FNPV and FRR (please refer to Annex J).
The results have been a FNPV of IDR 268.89 Billion and a FRR of 9.27%. The positive FNPV and
the FRR higher than the financial discount rate, indicate that the project would be
commercially viable under the Financing Scheme Number One.
Table 9.3. Financial indicators under Scheme One.
FNPV (IDR Billion) FRR
Scheme 1 268.89 9.27% Source: Own elaboration.
9.2. Financing Scheme 2.
Financing scheme number two proposes also a Build-Operate-Transfer (BOT) agreement
between the Indonesia Toll Road Authority and the Special Vehicle Purpose (SPV) set for the
development of the Palembang – Indralaya Toll Road. Hence, the SPV would be responsible
for partially financing, design, construction, operation, and maintenance of the toll road during
30 years. When the mentioned concession period expires, the SPV shall return the toll road to
the Indonesian Government free of charge.
The main difference between Scheme 1 and 2 is that under the first one, the private
consortium would finance the total initial investment, while under the second one, the private
consortium will only source the 50% of the financing and the reaming 50% would be invested
by the Government of Indonesia through the State Budget (APBN) and Local Budget (APBD).
The SPV shall meet again the debt to equity ratio of 70:30 for the provided investment. It
would be complied though loans from commercial banks for the debt portion, consequently a
Financing Cost would arise, and capital injection for the remaining equity portion.
Shadow toll shall be also considered under Scheme 2 to make the project commercially viable.
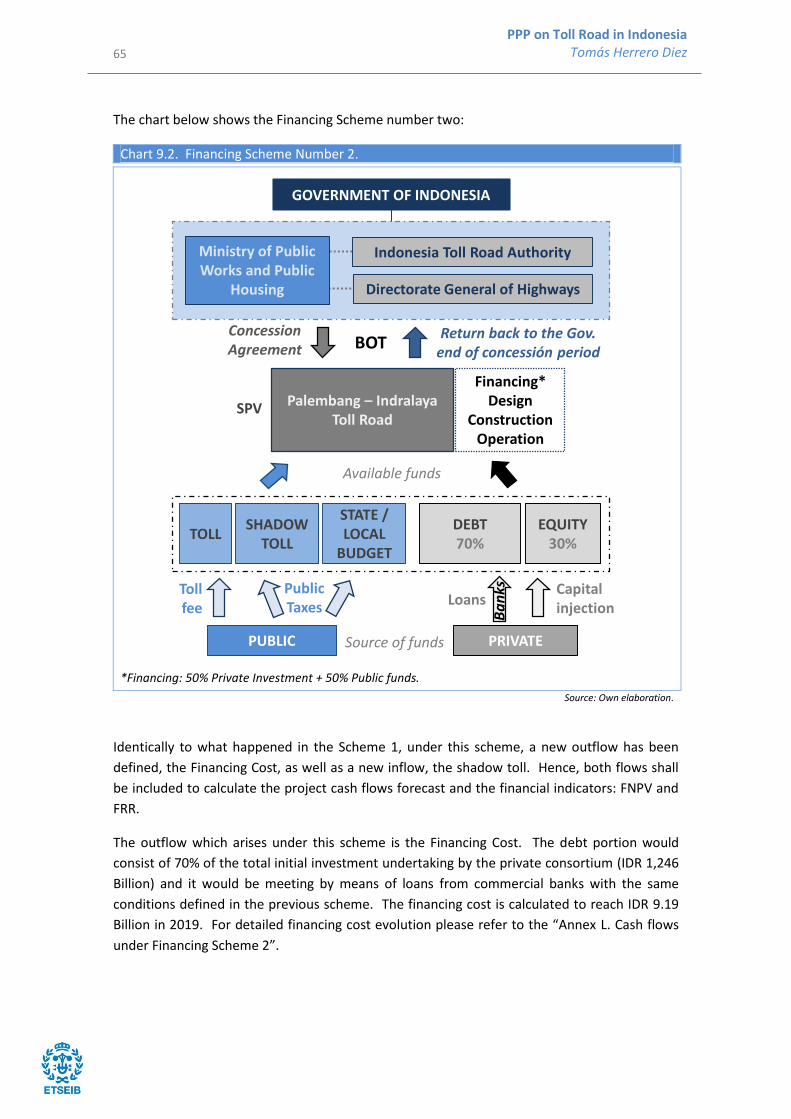
65
PPP on Toll Road in Indonesia Tomás Herrero Diez
The chart below shows the Financing Scheme number two:
Chart 9.2. Financing Scheme Number 2.
*Financing: 50% Private Investment + 50% Public funds.
Source: Own elaboration.
Identically to what happened in the Scheme 1, under this scheme, a new outflow has been
defined, the Financing Cost, as well as a new inflow, the shadow toll. Hence, both flows shall
be included to calculate the project cash flows forecast and the financial indicators: FNPV and
FRR.
The outflow which arises under this scheme is the Financing Cost. The debt portion would
consist of 70% of the total initial investment undertaking by the private consortium (IDR 1,246
Billion) and it would be meeting by means of loans from commercial banks with the same
conditions defined in the previous scheme. The financing cost is calculated to reach IDR 9.19
Billion in 2019. For detailed financing cost evolution please refer to the “Annex L. Cash flows
under Financing Scheme 2”.
GOVERNMENT OF INDONESIA
Ministry of Public Works and Public
Housing
Indonesia Toll Road Authority
Directorate General of Highways
Palembang – IndralayaToll Road
SPV
ConcessionAgreement
Return back to the Gov. end of concessión period
BOT
PUBLIC PRIVATE
DEBT70%
EQUITY30%
TOLLSHADOW
TOLL
Tollfee
PublicTaxes Loans
Capital injectionB
an
ks
Source of funds
Financing*Design
ConstructionOperation
Available funds
STATE / LOCAL
BUDGET
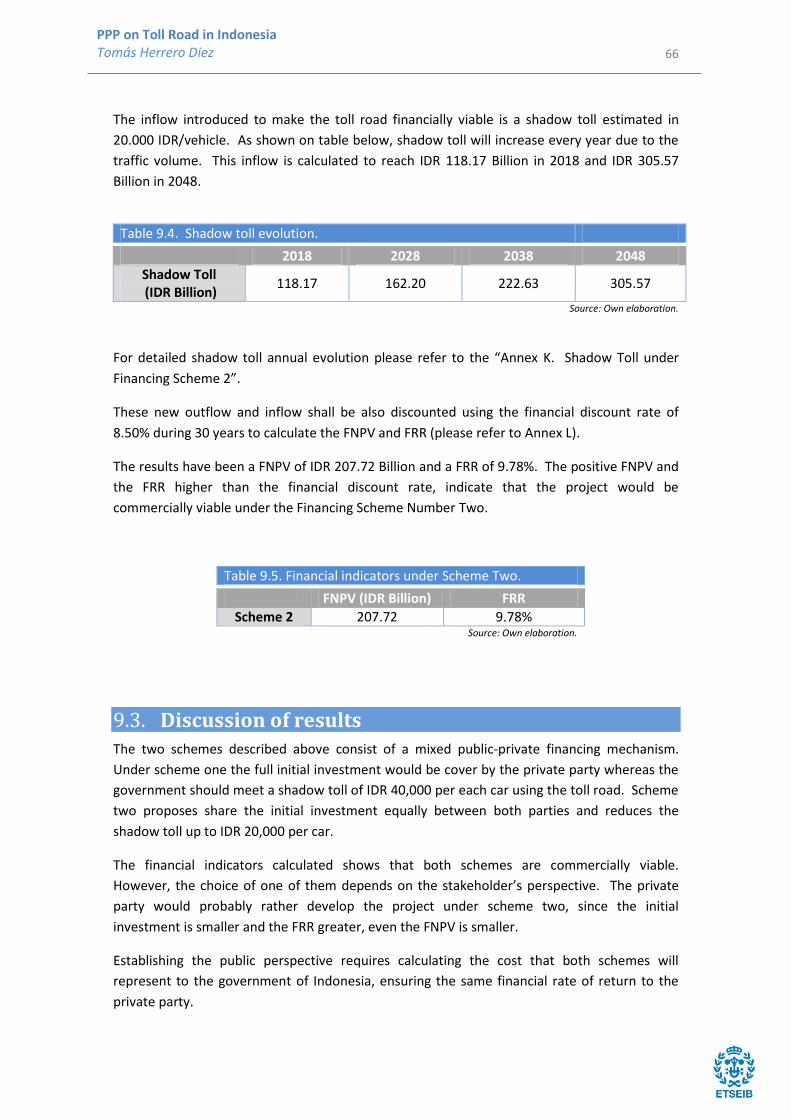
66
PPP on Toll Road in Indonesia Tomás Herrero Diez
The inflow introduced to make the toll road financially viable is a shadow toll estimated in
20.000 IDR/vehicle. As shown on table below, shadow toll will increase every year due to the
traffic volume. This inflow is calculated to reach IDR 118.17 Billion in 2018 and IDR 305.57
Billion in 2048.
Table 9.4. Shadow toll evolution.
2018 2028 2038 2048
Shadow Toll (IDR Billion)
118.17 162.20 222.63 305.57
Source: Own elaboration.
For detailed shadow toll annual evolution please refer to the “Annex K. Shadow Toll under
Financing Scheme 2”.
These new outflow and inflow shall be also discounted using the financial discount rate of
8.50% during 30 years to calculate the FNPV and FRR (please refer to Annex L).
The results have been a FNPV of IDR 207.72 Billion and a FRR of 9.78%. The positive FNPV and
the FRR higher than the financial discount rate, indicate that the project would be
commercially viable under the Financing Scheme Number Two.
Table 9.5. Financial indicators under Scheme Two.
FNPV (IDR Billion) FRR
Scheme 2 207.72 9.78% Source: Own elaboration.
9.3. Discussion of results The two schemes described above consist of a mixed public-private financing mechanism.
Under scheme one the full initial investment would be cover by the private party whereas the
government should meet a shadow toll of IDR 40,000 per each car using the toll road. Scheme
two proposes share the initial investment equally between both parties and reduces the
shadow toll up to IDR 20,000 per car.
The financial indicators calculated shows that both schemes are commercially viable.
However, the choice of one of them depends on the stakeholder’s perspective. The private
party would probably rather develop the project under scheme two, since the initial
investment is smaller and the FRR greater, even the FNPV is smaller.
Establishing the public perspective requires calculating the cost that both schemes will
represent to the government of Indonesia, ensuring the same financial rate of return to the
private party.

67
PPP on Toll Road in Indonesia Tomás Herrero Diez
The financial rate of return obtained under the scheme number one (9.27%) has been chosen
to compare the public cost incurred under both schemes. This value for the FRR is considered
to offer a reasonable financial profitability for the project since it is above of the Indonesia
Government Bond 5Y (8.19%).
Getting a FRR of 9.27% under scheme two, allows increasing the private contribution to the
initial investment up to 52.1%. However, the FNPV would be reducing to IDR 130.05 Billion.
Hence, under these conditions, the private party would prefer developing the project under
scheme one due to the fact that the FNPV will be more than twice greater than under scheme
two (for more information, please refer to “Annex M. Cash flows under Scheme 2 (b)”).
Table 9.6. Comparison both schemes under private perspective
Scheme 1 Scheme 2
FNPV (IDR Billion) 268.89 130.05
FRR 9.27% Source: Own elaboration.
From the public perspective, the costs incurred under scheme one are solely the generated by
fulfilling the shadow toll, whereas under scheme two theses costs includes not only the
shadow toll cost, but also a portion of the initial investment (47.9%). The net present value of
these costs under scheme one reach IDR 3,821.27 Billion and under scheme two IDR 3,615.88
Billion. Hence, scheme two would be rather by the government of Indonesia.
Table 9.7. Comparison both schemes under public perspective (IDR Billion).
Scheme 1 Scheme 2
Initial investment - 1,705.24
Shadow toll costs 3,821.27 1,910.64
NPV Total costs 3,821.27 3,615.88 Source: Own elaboration.
For detailed public costs annual evolution please refers to the “Annex N. Public costs”.
These findings should be applied to the detailed project preparation phase previous launching
the tender. Following the recommendation of the European Expertise PPP Centre, all the
relevant aspects of the PPP design (e.g. responsibilities, risk allocation, payment mechanism,
and expected financial profitability) shall be define in a progressive and iterative manner,
concluding with a full draft PPP contract87. Hence, it is advisable to establish a certain FRR (e.g.
9.27%) as starting point to negotiate the PPP arrangement with the private party.
87 European PPP Expertise Centre, “A Guide to Guidance. Sourcebook for PPPs”, February 2011
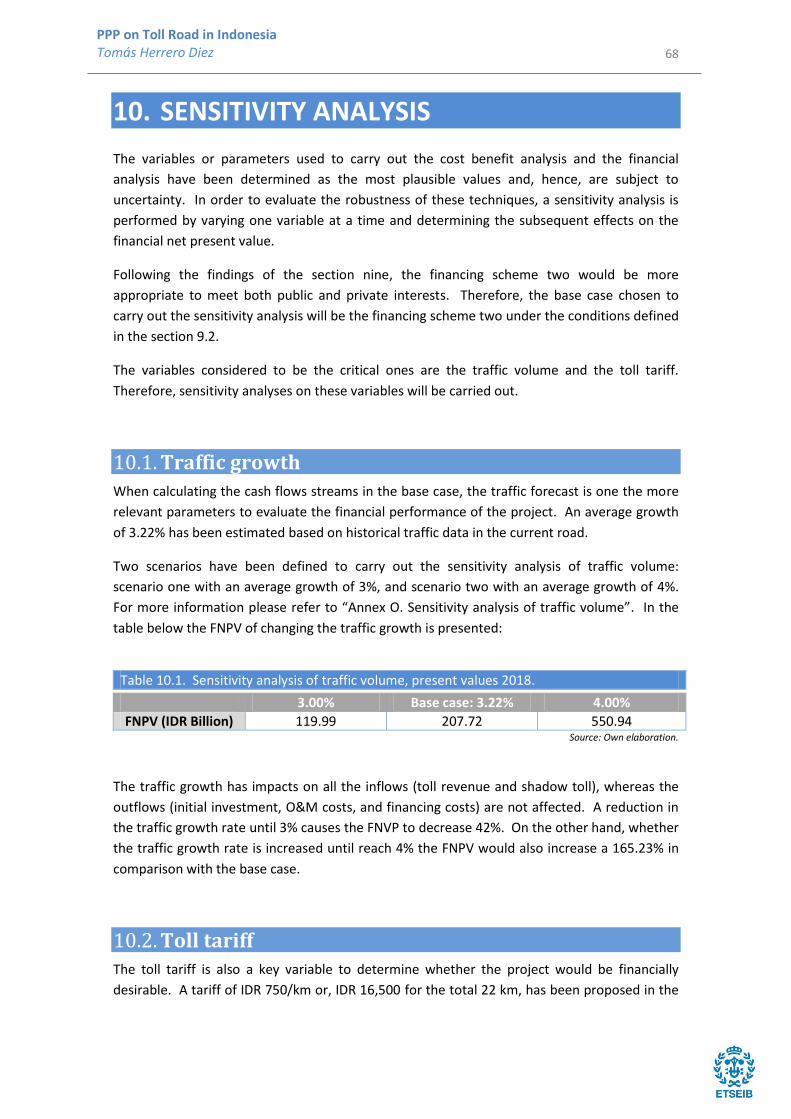
68
PPP on Toll Road in Indonesia Tomás Herrero Diez
10. SENSITIVITY ANALYSIS
The variables or parameters used to carry out the cost benefit analysis and the financial
analysis have been determined as the most plausible values and, hence, are subject to
uncertainty. In order to evaluate the robustness of these techniques, a sensitivity analysis is
performed by varying one variable at a time and determining the subsequent effects on the
financial net present value.
Following the findings of the section nine, the financing scheme two would be more
appropriate to meet both public and private interests. Therefore, the base case chosen to
carry out the sensitivity analysis will be the financing scheme two under the conditions defined
in the section 9.2.
The variables considered to be the critical ones are the traffic volume and the toll tariff.
Therefore, sensitivity analyses on these variables will be carried out.
10.1. Traffic growth When calculating the cash flows streams in the base case, the traffic forecast is one the more
relevant parameters to evaluate the financial performance of the project. An average growth
of 3.22% has been estimated based on historical traffic data in the current road.
Two scenarios have been defined to carry out the sensitivity analysis of traffic volume:
scenario one with an average growth of 3%, and scenario two with an average growth of 4%.
For more information please refer to “Annex O. Sensitivity analysis of traffic volume”. In the
table below the FNPV of changing the traffic growth is presented:
Table 10.1. Sensitivity analysis of traffic volume, present values 2018.
3.00% Base case: 3.22% 4.00%
FNPV (IDR Billion) 119.99 207.72 550.94 Source: Own elaboration.
The traffic growth has impacts on all the inflows (toll revenue and shadow toll), whereas the
outflows (initial investment, O&M costs, and financing costs) are not affected. A reduction in
the traffic growth rate until 3% causes the FNVP to decrease 42%. On the other hand, whether
the traffic growth rate is increased until reach 4% the FNPV would also increase a 165.23% in
comparison with the base case.
10.2. Toll tariff The toll tariff is also a key variable to determine whether the project would be financially
desirable. A tariff of IDR 750/km or, IDR 16,500 for the total 22 km, has been proposed in the

69
PPP on Toll Road in Indonesia Tomás Herrero Diez
first year of operation (2018) based on the Willingness-to-Pay (WTP) and the results of the SP
surveys.
As presented in the section five, the attributes’ levels used for the tariff in the SP experiments
were IDR 13,000, IDR 15,000, and IDR 17,000. Hence, two different values are considered to
perform the sensitive analysis of toll tariff: IDR 16,000 and IDR 17,000 for the total length of
the toll road. For more information please refer to “Annex P. Sensitivity analysis of toll tariff”.
In the table below the FNPV of changing the toll tariff is presented:
Table 10.2. Sensitivity analysis of toll tariff, present values 2018.
16,000 Base case: 16,500 17,000
FNPV (IDR Billion) 159.96 207.72 255.49 Source: Own elaboration.
The toll tariff has impact exclusively on toll revenue, whereas all the outflows (initial
investment, O&M costs, and financing costs), as well as the shadow tolls remain unchanged. A
reduction in the toll tariff to IDR 16,000 per vehicle causes the FNPV decreases 23%. On the
other hand, an increase in the toll tariff until IDR 17,000 per vehicle implies the FNPV also
increases 23% in comparison with the base case.
The changes in the traffic growth rate results in greater changes of the FNPV. This was an
expected situation due to the influence of the traffic growth in all the outflows, whereas the
toll tariff influence is limited to the toll revenue. It is worthy to point that none of the
sensitivity analyses would cause a negative FNPV.

70
PPP on Toll Road in Indonesia Tomás Herrero Diez
11. CONCLUSION
Involving the private sector in infrastructure development through public-private partnerships,
increase the efficiency of the projects and to decrease the burden of the governments in terms
of financing. Given the capital-intensive nature of toll roads, this type of partnerships is
urgently needed in the sector in Indonesia to meet accessibility and mobility demands.
The main objective of this dissertation was to define the most suitable financing schemes to
develop toll roads projects under PPP model in Indonesia. The results obtained from the
economic and financial analysis shows that toll roads are socio-economic desirable but
financially unfeasible. Hence, some co-finance from the Government such as shadow toll or
partial investment through State/Local budget, shall be required.
Two financing schemes have been proposed under a Build-Operate-Transfer (BOT) agreement
between the Indonesia Government and private company with different responsibility and risk
allocation. The main different between both schemes are that the initial investment
responsibility would be transferred totally (scheme one) and partially (scheme two) to the
private stakeholder; and the shadow toll satisfy by the government will be greater under
scheme one than two.
Setting a reasonable financial rate of return common to both schemes, the SPV cash flow
stream generated by the toll road would be larger under scheme one. However, it should be
considered that more responsibility and financial risk will be assumed by the private party
under this scheme.
From the public party perspective, the scheme two would be more desirable since the total
incurred cost will be smaller, even an initial investment was required. Meeting greater shadow
tolls, defined to compensate the private party under scheme one, will penalize the
government in the future during the concession period more than carried out a portion of the
initial investment.
Major assumed initial investment implies greater financial profitability for the private party
and smaller incurred cost for the public party. Hence, the recommended financing scheme for
toll road projects under PPP model in Indonesia in a BOT sharing initial investment between
public and private parties and establishing a shadow toll. An agreement regarding the portion
of initial investment covered by each party should be clearly defined. This scheme allows
reduce the initial investment to be carried out by the government, while ensuring a cash flows
stream which enables the SPV to be profitable.
Although this dissertation was limited to the perspective of investors in Indonesia, these
findings could be equally apply to define the financing schemes in other developing countries,
which have to set relatively low toll tariffs.

71
PPP on Toll Road in Indonesia Tomás Herrero Diez

72
PPP on Toll Road in Indonesia Tomás Herrero Diez
12. ACKNOWLEDGMENT
I would like to express my sincere gratitude to my advisor Prof. Alvar Garola Crespo from
Universitat Politècnica de Catalunya – Barcelona Tech (UPC), for his guidance, motivation and
helpful feedbacks.
The author is also very grateful to the Indonesian company PT. Hutama Karya, particularly to
the road and bridge department, for supporting the development of this dissertation providing
some crucial information.
I take this opportunity to express gratitude to my company, Centunion Española de
Coordinación Técnica y Financiera, for giving me the opportunity to work and live in Indonesia.
In particular, I am grateful to Pablo Acosta García for enlightening me the first glance of this
research.
I express my warm thanks to María José Sala Pelufo, transport consultant in The World Bank
office in Jakarta, for her stimulating discussions and precious advices.
Last but not the least, I would like to extend my thanks to my family and my friends for their
unceasing support and encouragement. Without them it would not be possible to conduct this
dissertation.

73
PPP on Toll Road in Indonesia Tomás Herrero Diez

74
PPP on Toll Road in Indonesia Tomás Herrero Diez
13. BIBLIOGRAPHY
[1] The World Bank. Indonesia. Country at glance. 2013 [http://www.worldbank.org/en/country/indonesia].
[2] The World Bank. Indonesia to Grow by 5,2 Percent in 2015: World Bank report. December 9, 2014. [http://www.worldbank.org/en/news/press-release/2014/12/08/indonesia-to-grow-by-5-2-percent-in-2015-world-bank-report].
[3] Indonesia Investment. Indonesia's Most Populous Island Java Continues to Dominate the Economy. August 3, 2013. [http://www.indonesia-investments.com/news/todays-headlines/indonesias-most-populous-island-of-java-continues-to-dominate-the-economy/item972].
[4] Kementerian Kesehatan Republik Indonesia. Estimasi Penduduk Menurut Umur Tunggal Dan Jenis Kelamin. January 27, 2014 [http://www.depkes.go.id/resources/download/general/Penduduk%20Kab%20Kota%20Umur%20Tunggal%202014.pdf].
[5] Badan Pusat Statistik (Statistics Indonesia). Percentage Distribution of Gross Regional Domestic Product at Current Market Prices by Provinces. 2000-2013. [http://www.bps.go.id/linkTabelStatis/view/id/1625].
[6] Badan Pusat Statistik (Statistics Indonesia). Population Projection by Province, 2010-2035. 2010. [http://www.bps.go.id/linkTabelStatis/view/id/1625].
[7] The World Bank. Transport in Indonesia. [http://web.worldbank.org/WBSITE/EXTERNAL/COUNTRIES/EASTASIAPACIFICEXT/EXTEAPREGTOPTRANSPORT/0,,contentMDK:20458729~menuPK:2066318~pagePK:34004173~piPK:34003707~theSitePK:574066,00.html].
[8] Badan Pusat Statistik (Statistics Indonesia). Length of Road By Level of Government Responsibility Indonesia, 1987-2013 (Km) and Length of Road by Type of Surface Indonesia, 1957-2013 (Km). 2015. [http://www.bps.go.id/linkTableDinamis/view/id/808, http://www.bps.go.id/linkTableDinamis/view/id/820].
[9] Badan Pusat Statistik (Statistics Indonesia). Number of Motor Vehicles by Types, Indonesia 1987-2013. 2015. [http://www.bps.go.id/linkTabelStatis/view/id/1413].
[10] OECD. Structural Policy Country Notes. Indonesia. 2013. [http://www.oecd.org/dev/asia-pacific/Indonesia.pdf].
http://www.depkes.go.id/resources/download/general/Penduduk%20Kab%20Kota%20Umur%20Tunggal%202014.pdf

75
PPP on Toll Road in Indonesia Tomás Herrero Diez
[11] The World Bank. Road Sector Public Expenditure Review 2012. Investing in Indonesia’s Roads: Improving Efficiency and Closing the Financial Gap. June 2012. [http://www-wds.worldbank.org/external/default/WDSContentServer/WDSP/IB/2012/10/19/000356161_20121019033252/Rendered/PDF/733030WP0Indon00disclosed0100180120.pdf].
[12] The World Bank. Transport in Indonesia. [http://web.worldbank.org/WBSITE/EXTERNAL/COUNTRIES/EASTASIAPACIFICEXT/EXTEAPREGTOPTRANSPORT/0,,contentMDK:20458729~menuPK:2066318~pagePK:34004173~piPK:34003707~theSitePK:574066,00.html].
[13] Australian Aid, Mamay Sukaesih for the Investor Daily. Weekly Infrastructure News: Realising 1,000 km of Toll Road. May 13-15, 2015. [http://indii.co.id/index.php/en/news-publication/weekly-infrastructure-news/realising-1-000-km-of-toll-roads].
[14] Kementerian Pekerjaan Umum Republik Indonesia (Ministry of Public Works of the Republic of Indonesia). Toll Road Investment Opportunities in Indonesia. May 2014 [http://www.ceoe.es/resources/image/presentacion_indonesia_4_2014_05_21.pdf].
[15] Wikipedia, the Free Encyclopedia. Daftar Jalan Tol di Indonesia. [https://id.wikipedia.org/wiki/Daftar_jalan_tol_di_Indonesia].
[16] Jasa Marga. 2014 Annual Report: Connectivity for Driving Growth. 2014. [http://www.jasamarga.com/download/ar_jasamarga_eng_2014.pdf].
[17] UK Foreign Commonwealth Office. PPP (Public-Private Partnerships) in Indonesia: Opportunities from the Economic Master Plan. June 2012. [http://www.strategic-asia.com/pdf/PPP%20(Public-Private%20Partnerships)%20in%20Indonesia%20Paper.pdf].
[18] Klaus Schwab, World Economic Forum. The Global Competitiveness Report 2014–2015. 2014. [http://www3.weforum.org/docs/WEF_GlobalCompetitivenessReport_2014-15.pdf].
[19] Ministry of National Development Planning/National Development Planning Agency (BAPPENAS). Public-Private Partnership. Infrastructure Projects Plan in Indonesia. November 2013. [http://www.bkpm.go.id/img/file/PPP%20BOOK%202013-compact.pdf].
[20] Ministry of Economic Affairs. Public Private Partnership (PPP) Investor’s Guide. April 2010. [http://www.bi.go.id/en/iru/presentation/other/Documents/6b3a71af6bbd481ca788477c2cc107a1PPPinvestorguide.pdf].
http://www.strategic-asia.com/pdf/PPP%20(Public-Private%20Partnerships)%20in%20Indonesia%20Paper.pdf
76
PPP on Toll Road in Indonesia Tomás Herrero Diez
[21] Indonesia Investments. Infrastructure Development Update Indonesia: Trans-Sumatra Highway. 18 March 2014. [http://www.indonesia-investments.com/doing-business/business-columns/infrastructure-development-update-indonesia-trans-sumatra-highway-project/item1779].
[23] Ministry of Economic Affairs. Presidential Decree No. 100/2014 on the Acceleration of Highway Development in Sumatra. September 17, 2014.
[24] Hutama Karya. Company profile. [http://www.hutamakarya.com/publics/5/pdf/investor-relation/HK%20Corporate%20Presentation%20Ver.%204.0.pdf].
[25] Ezra Sihite, Jakarta Globe. Construction of Trans-Sumatra Toll Road Starts in Lampung. 30 April 2015. [http://thejakartaglobe.beritasatu.com/news/construction-trans-sumatra-toll-road-starts-lampung/].
[26] Nadya Natahadibrata, The Jakarta Post. Hutama Karya to get Rp 3.6t for highways. January 21 2015. [http://www.thejakartapost.com/news/2015/01/21/hutama-karya-get-rp-36t-highways.html].
[27] Dylan Amirio, The Jakarta Post. Hutama Karya gets Rp 481b loans for Trans-Sumatra project. August 14 2015. [http://www.thejakartapost.com/news/2015/08/14/hutama-karya-gets-rp-481b-loans-trans-sumatra-project.html].
[28] David Pearmain and John Swanson (Steer Gleave Davis), Eric Kroes and Mark Bradley (Hague Consulting Group). Stated Preference Techniques. 1991. [http://www.bath.ac.uk/e-journals/jtep/pdf/Volume_XX11_No_1_11-25.pdf].
[29] Central Intelligence Agency (CIA). The World Factbook. Age Structure. Indonesia. [https://www.cia.gov/library/publications/the-world-factbook/fields/2010.html].
[30] Badan Pusat Statistik (Statistics Indonesia). Population Percentage by Province and Gender, 2009-2013. 2014 [http://www.bps.go.id/linkTabelStatis/view/id/1601].
[31] Transportation Research Board of the National Academies. A Guidebook for Using American Community Survey Data for Transportation Planning. NCHRP Report 588. 2007. [http://onlinepubs.trb.org/onlinepubs/nchrp/nchrp_rpt_588.pdf].
[32] Kenneth E. Train. Discrete Choice Methods with Simulation. 2003. [http://eml.berkeley.edu/books/choice2.html].
[33] Hensher D., and L. Johnson. Applied Discrete Choice Modeling. 1981.
[34] Bank of Indonesia. Inflation. 2015 [http://www.bi.go.id/en/moneter/inflasi/data/Default.aspx].
77
PPP on Toll Road in Indonesia Tomás Herrero Diez
[35] Automovilistas Europeos Asociados (AEA). ¿Cuál es la autopista más cara? 08 June 2015. [http://aeaclub.org/blog-aeapress/757-cual-es-la-autopista-mas-cara].
[36] The World Bank. Inflación, precios al consumidor (% anual). [http://datos.bancomundial.org/indicador/FP.CPI.TOTL.ZG].
[37] International Monetary Fund (IMF). World Economic Outlook Database. Indonesia, Gross domestic product per capita, current prices. April 2015. [https://www.imf.org/external/pubs/ft/weo/2015/01/weodata/weorept.aspx?sy=2013&ey=2020&scsm=1&ssd=1&sort=country&ds=.&br=1&pr1.x=70&pr1.y=6&c=536&s=NGDPDPC&grp=0&a=].
[38] International Monetary Fund (IMF), World Economic Outlook Database. Spain, Gross domestic product per capita, current prices. April 2015. [https://www.imf.org/external/pubs/ft/weo/2015/01/weodata/weorept.aspx?pr.x=54&pr.y=11&sy=2013&ey=2020&scsm=1&ssd=1&sort=country&ds=.&br=1&c=184&s=NGDPDPC&grp=0&a=].
[39] [http://www.oanda.com].
[40] [http://www.oanda.com].
[41] Institute for Transport Studies (ITS), University of Leeds. Treatment of Induced Traffic. 2003. [http://www.its.leeds.ac.uk/projects/WBToolkit/Note6.htm].
[42] European Union. Guide to Cost Benefit Analysis of Investment Projects. July 2008. [http://ec.europa.eu/regional_policy/sources/docgener/guides/cost/guide2008_en.pdf].
[43] ADB (Asian Development Bank). Cost-Benefit Analysis for Development. A Practical Guide. 2013. [http://www.adb.org/sites/default/files/institutional-document/33788/files/cost-benefit-analysis-development.pdf].
[44] European Union. Guide to Cost Benefit Analysis of Investment Projects. July 2008. [http://ec.europa.eu/regional_policy/sources/docgener/guides/cost/guide2008_en.pdf].
[45] ADB (Asian Development Bank). Cost-Benefit Analysis for Development. A Practical Guide. 2013. [http://www.adb.org/sites/default/files/institutional-document/33788/files/cost-benefit-analysis-development.pdf]..
[46] European Union. Guide to Cost Benefit Analysis of Investment Projects. July 2008. [http://ec.europa.eu/regional_policy/sources/docgener/guides/cost/guide2008_en.pdf].
[47] Pearson Education Inc., Boardman, A.E., Greenberg, D.H., Vining, A.R., Weimer, D.L., “Cost-Benefit Analysis – Concepts and Practice”, 2011.

78
PPP on Toll Road in Indonesia Tomás Herrero Diez
[48] HEATCO (Developing Harmonised European Approaches for Transport Costing and Project Assessment), “Deliverabl e 5: Proposal for Harmonised Guidelines”, [http://heatco.ier.uni-stuttgart.de/HEATCO_D5.pdf]. 2006.
[49] ADB (Asian Development Bank). Cost-Benefit Analysis for Development. A Practical Guide. 2013. [http://www.adb.org/sites/default/files/institutional-document/33788/files/cost-benefit-analysis-development.pdf].
[50] European Union. Guide to Cost Benefit Analysis of Investment Projects. July 2008. [http://ec.europa.eu/regional_policy/sources/docgener/guides/cost/guide2008_en.pdf].
[51] Hutama Karya, “Dokumenrencana Usaha. Ruas Palembang – Simpang Indralaya”, 2014.
[53] Presiden Republik Inodonesia, “Undang-Undang No. 2 tahun 2012 tentang Pengadaan Tanah untuk Kepentingan Umum”, [http://prokum.esdm.go.id/uu/2012/UU%20No%202%20thn%202012.pdf]. 2012.
[55] European Union. Guide to Cost Benefit Analysis of Investment Projects. July 2008. [http://ec.europa.eu/regional_policy/sources/docgener/guides/cost/guide2008_en.pdf].
[56] HEATCO (Developing Harmonised European Approaches for Transport Costing and Project Assessment). Deliverable 5: Proposal for Harmonised Guidelines. 2006. [http://heatco.ier.uni-stuttgart.de/HEATCO_D5.pdf].
[58] Ministry of Infrastructure of the Republic of Serbia and Public Enterprise Roads of Serbia. Manual Cost Benefit Analysis. 2010. [http://www.putevi-srbije.rs/strategijapdf/Manual_Cost_Benefit_Analysis.pdf].
[60] ADB (Asian Development Bank). Cost-Benefit Analysis for Development. A Practical Guide. 2013. [http://www.adb.org/sites/default/files/institutional-document/33788/files/cost-benefit-analysis-development.pdf].
[61] European Commission. Guidelines. Tool #54: The use of discount rates. [http://ec.europa.eu/smart-regulation/guidelines/tool_54_en.htm].
[62] Juzhong Zhuang, Zhihong Liang, Tun Lin, and Franklin De Guzman (Asian Development Bank (ADB)). Theory and Practice in the Choice of Social Discount Rate for Cost-Benefit Analysis: A Survey. May 2007. [http://adb.org/sites/default/files/pub/2007/WP094.pdf].
[63] BKPM, Badan Koordinasi Penanaman Modal. Revitalization of Yogyakarta Rail Station and Pedestrianization of Malioboro, DI Yogyakarta. 2010. [http://www7.bkpm.go.id/mobile/content/p23.php?m=&l=1&i=10101].

79
PPP on Toll Road in Indonesia Tomás Herrero Diez
[64] European Union. Guide to Cost Benefit Analysis of Investment Projects. July 2008. [http://ec.europa.eu/regional_policy/sources/docgener/guides/cost/guide2008_en.pdf].
[65] European Investment Bank (EIB). The Economic Appraisal of Investment Projects at the EIB. March 2013. [http://www.eib.org/attachments/thematic/economic_appraisal_of_investment_projects_en.pdf].
[66] Ministry of Infrastructure of the Republic of Serbia and Public Enterprise Roads of Serbia. Manual Cost Benefit Analysis. 2010. [http://www.putevi-srbije.rs/strategijapdf/Manual_Cost_Benefit_Analysis.pdf].
[67] European Union. Guide to Cost Benefit Analysis of Investment Projects. July 2008. [http://ec.europa.eu/regional_policy/sources/docgener/guides/cost/guide2008_en.pdf].
[68] European Commission. Guidelines. Tool #54: The use of discount rates. [http://ec.europa.eu/smart-regulation/guidelines/tool_54_en.htm].
[69] Bank Indonesia. Explanation of BI rate. [http://www.bi.go.id/en/moneter/bi-rate/penjelasan/Contents/Default.aspx].
[70] European Union. Guide to Cost Benefit Analysis of Investment Projects. July 2008. [http://ec.europa.eu/regional_policy/sources/docgener/guides/cost/guide2008_en.pdf].
[71] European Union. Guide to Cost Benefit Analysis of Investment Projects. July 2008. [http://ec.europa.eu/regional_policy/sources/docgener/guides/cost/guide2008_en.pdf].
[72] Karamullahu Wajhahu (Sekolah Arsitektur, Perencanaan dan Pengembangan Kebijakan ITB). Formulating Public Private Partnership on Toll Road in Indonesia: A Case Study of Manado-Bitung Toll Road. 2013. [http://sappk.itb.ac.id/jpwk2/wp-content/uploads/2013/11/V1N2-Formulating-Public-Private-Partnership-on-Toll-Road-in-Indonesia.pdf].
[73] Djoen San Santoso, Tri Basuki Joewono, Andreas Wibowo, Harlan P.A. Sinaga and Wimpy Santosa (Penerbit Universiti Sains Malaysia). Public-Private Partnerships for Tollway Construction and Operation: Risk Assessment and Allocation from the Perspective of Investors. 2012. [http://web.usm.my/jcdc/vol17_2_2012/Art%203_jcdc17-2.pdf].
[74] Journal of Traffic and Logistics Engineering. Risk Inclusion in the Reserve Price Estimation for Toll Road Concession Award. March 2014. [http://www.jtle.net/uploadfile/2014/0414/20140414023947706.pdf].

80
PPP on Toll Road in Indonesia Tomás Herrero Diez
[75] Journal of Traffic and Logistics Engineering. Risk Inclusion in the Reserve Price Estimation for Toll Road Concession Award. March 2014. [http://www.jtle.net/uploadfile/2014/0414/20140414023947706.pdf].
[76] Ministry of Finance of Indonesia. Peraturan Menteri Keuangan Normor 38/PMK.Ol/2006 tengang petunjuk pelaksanaan pengendalian dan pengelolaan risiko atas penyediaan infrastruktur. 19 May 2006. [http://pkps.bappenas.go.id/dokumen/uu/Pengelolaan%20Resiko/5.%20Permenkeu%20Nomor%2038-06.pdf].
[77] Robert Phillips, The World Bank - PPP in Infrastructure Resource Center for Contracts, Laws and Regulations (PPPIRC). Short-Form Generic Risk Allocation Table for Toll Roads. March 2008. [http://ppp.worldbank.org/public-private-partnership/sites/ppp.worldbank.org/files/documents/GenericRiskAllocationTablefortollroads.pdf].
[78] European Union. Guide to Cost Benefit Analysis of Investment Projects. July 2008. [http://ec.europa.eu/regional_policy/sources/docgener/guides/cost/guide2008_en.pdf].
[79] Abdul Hadi Hs. (Jasa Marga). One day Seminar: Toll Road Business Opportunities in Indonesia. May 21, 2014.
[80] Gregory Fisher and Suman Babbar (The World Bank). Private Financing on Toll Roads. [http://www.worldbank.org/transport/roads/tr_docs/117.pdf].
[81] Public Private Partnership in Infrastructure Resource Center (PPPIRC). Concessions, Build-Operate-Transfer (BOT) and Design-Build-Operate (DBO) Projects. July 06, 2015. [http://ppp.worldbank.org/public-private-partnership/agreements/concessions-bots-dbos].
[82] Wiyono Sari. Project finance in Indonesia: toll road financing. June 01, 2014. [http://us.practicallaw.com/5-537-3662#a976951].
[84] The World Bank Group. Toll Roads and Concessions. [http://www.worldbank.org/transport/roads/toll_rds.htm].
[85] Office of Innovative Program Delivery Federal Highway Administration, U.S. Department of Transportation. Public–Private Partnership Concessions for Highway Projects: A Primer. October 2010. [http://www.fhwa.dot.gov/ipd/pdfs/p3/p3_concession_primer.pdf].
[87] European PPP Expertise Centre. A Guide to Guidance. Sourcebook for PPPs. February 2011.

81
PPP on Toll Road in Indonesia Tomás Herrero Diez

82
PPP on Toll Road in Indonesia Tomás Herrero Diez
14. ANNEXES
Annex A. SP Survey
Penelitian SP
Bagian Palembang – IndralayaJalan RayaTrans-Sumatera
Bagian jalan tol Palembang – Indralaya akan menjadi bagian dari Jalan RayaTrans-Sumatra. Panjangnya 22 km, dengan kecepatan rata-rata 65.5 km/jamdan menghubungkan ibukota Sumatera Selatan (Palembang) dengan kotapendidikan Indralaya.
2.1. Asal dan Destinasi
2.2. Biaya transportasi/bulan
2.3. Frekuensi perjalanan/bulan
2.4. Tujuan perjalanan
2.5. Panjang perjalanan
1. Profil sosio-ekonomi
1.1. Umur
1.2. Jenis Kelamin
1.3. Tingkat pendidikan/jenis pekerjaan
2. Rutinitas transportasi
Penelitian SP (1/3) n Palembang - Indralaya

83
PPP on Toll Road in Indonesia Tomás Herrero Diez
Bagian Palembang – IndralayaJalan RayaTrans-Sumatera
3. Pilihan rute (toll atau bukan toll)
Penelitian SP (2/3) n Palembang - Indralaya
JALAN NON-TOLL JALAN TOLL
Lama Perjalanan: 1jam20menit Tarif: Rp. 0
Rute yang mana yang akan Anda pilih?
Lama Perjalanan: 16menit Tarif: Rp. 13.000
0
SKEN
AR
IO 1
JALAN NON-TOLL JALAN TOLL
Lama Perjalanan: 1jam20menit Tarif: Rp. 0
Lama Perjalanan: 16menit Tarif: Rp. 15.000
0
SKEN
AR
IO 2
JALAN NON-TOLL JALAN TOLL
Lama Perjalanan: 1jam20menit Tarif: Rp. 0
Lama Perjalanan: 16menit Tarif: Rp. 17.000
0
SKEN
AR
IO 3
JALAN NON-TOLL JALAN TOLL
Lama Perjalanan: 1jam20menit Tarif: Rp. 0
Lama Perjalanan: 20menit Tarif: Rp. 13.000
0
SKEN
AR
IO 4
JALAN NON-TOLL JALAN TOLL
Lama Perjalanan: 1jam20menit Tarif: Rp. 0
Lama Perjalanan: 20menit Tarif: Rp. 15.000
0
SKEN
AR
IO 5
JALAN NON-TOLL JALAN TOLL
Lama Perjalanan: 1jam20menit Tarif: Rp. 0
Lama Perjalanan: 20menit Tarif: Rp. 17.000
0
SKEN
AR
IO 6
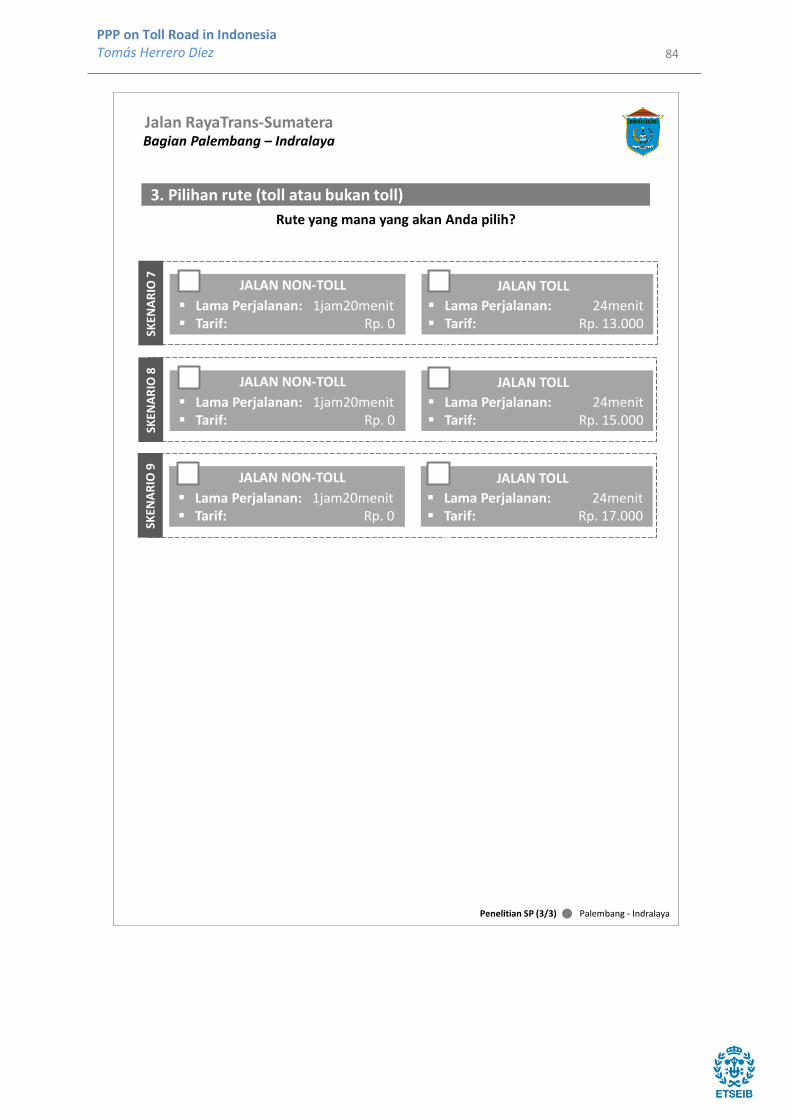
84
PPP on Toll Road in Indonesia Tomás Herrero Diez
Bagian Palembang – IndralayaJalan RayaTrans-Sumatera
3. Pilihan rute (toll atau bukan toll)
Penelitian SP (3/3) n Palembang - Indralaya
JALAN NON-TOLL JALAN TOLL
Lama Perjalanan: 1jam20menit Tarif: Rp. 0
Rute yang mana yang akan Anda pilih?
Lama Perjalanan: 24menit Tarif: Rp. 13.000
0
SKEN
AR
IO 7
JALAN NON-TOLL JALAN TOLL
Lama Perjalanan: 1jam20menit Tarif: Rp. 0
Lama Perjalanan: 24menit Tarif: Rp. 15.000
0
SKEN
AR
IO 8
JALAN NON-TOLL JALAN TOLL
Lama Perjalanan: 1jam20menit Tarif: Rp. 0
Lama Perjalanan: 24menit Tarif: Rp. 17.000
0
SKEN
AR
IO 9

85
PPP on Toll Road in Indonesia Tomás Herrero Diez
Annex B. Operation and Maintenance Cost
Table B.1. Cost O&M (1) – Toll Collection Systems (IDR Billion)
Year Personnel expenses
Non personnel expenses
Regular Inspection
Main Inspection
R&R Sub Total
(1)
2018 7.78 2.48 - - - 10.26
2019 8.25 2.62 0.08 - - 10.95
2020 8.74 2.78 - 1.21 - 12.73
2021 9.27 2.95 - - - 12.22
2022 9.82 3.13 0.10 - 49.86 62.90
2023 10.41 3.31 - - - 13.73
2024 11.04 3.51 - 1.52 - 16.08
2025 11.70 3.72 0.11 - - 15.54
2026 12.40 3.95 - - - 16.35
2027 13.15 4.18 - - - 17.33
2028 13.94 4.43 0.14 1.92 70.72 91.15
2029 14.77 4.70 - - - 19.47
2030 15.66 4.98 - - - 20.64
2031 16.60 5.28 0.16 - - 22.04
2032 17.59 5.60 - 2.43 - 25.62
2033 18.65 5.93 - - - 24.58
2034 19.77 6.29 0.19 - 100.32 126.57
2035 20.96 6.67 - - - 27.62
2036 22.21 7.07 - 3.07 - 32.35
2037 23.55 7.49 0.23 - - 31.27
2038 24.96 7.94 - - - 32.90
2039 26.46 8.42 - - - 34.87
2040 28.04 8.92 0.27 3.87 42.31 83.42
2041 29.73 9.46 - - - 39.18
2042 31.51 10.03 - - - 41.53
2043 33.40 10.63 0.33 - - 44.35
2044 35.40 11.26 - 4.69 - 51.56
2045 37.53 11.94 - - - 49.47
2046 39.78 12.66 0.39 - 201.87 254.69
2047 42.17 13.42 - - - 55.58
2048 44.70 14.22 - 6.17 - 65.09 Source: Own elaboration based on data from Hutama Karya.

86
PPP on Toll Road in Indonesia Tomás Herrero Diez
Table B.2. Cost O&M (2) – Toll Road Users Systems (IDR Billion)
Year Personnel expenses
Traffic management
Other services
Maintenance, R&R (4 years)
Maintenance, R&R (8 years)
Sub Total (2)
2018 3.96 0.03 2.65 - - 6.64
2019 4.19 0.03 2.81 - - 7.03
2020 4.44 0.03 2.98 6.99 - 14.44
2021 4.71 0.04 3.16 - - 7.90
2022 4.99 0.04 3.35 - - 8.38
2023 5.29 0.04 3.55 - - 8.88
2024 5.61 0.04 3.76 8.82 6.76 24.99
2025 5.95 0.04 3.98 - - 9.98
2026 6.30 5.00 4.22 - - 10.58
2027 6.68 0.05 4.48 - - 11.21
2028 7.08 0.05 4.75 11.13 - 13.02
2029 7.51 0.06 5.03 - - 12.60
2030 7.96 0.06 5.33 - - 13.35
2031 8.44 0.06 5.65 - - 14.15
2032 8.94 0.07 5.99 14.06 10.77 39.83
2033 9.48 0.07 6.35 - - 15.90
2034 10.05 0.08 6.73 - - 16.86
2035 10.65 0.08 7.14 - - 17.87
2036 11.29 0.08 7.56 17.75 - 36.68
2037 11.97 0.09 8.02 - - 20.08
2038 12.69 0.10 8.50 - - 21.28
2039 13.45 0.10 9.01 - - 22.56
2040 14.25 0.11 9.55 22.40 17.17 63.48
2041 15.11 0.11 10.12 - - 25.34
2042 16.02 0.12 10.73 - - 26.87
2043 16.98 0.13 11.37 - - 28.48
2044 17.99 0.14 12.06 28.28 - 58.47
2045 19.07 0.14 12.78 - - 32.00
2046 20.22 0.15 13.55 - - 33.92
2047 21.43 0.16 14.36 - - 35.95
2048 22.72 0.17 15.22 35.71 27.36 101.18 Source: Own elaboration based on data from Hutama Karya.

87
PPP on Toll Road in Indonesia Tomás Herrero Diez
Table B.3. Cost O&M (3) – Road Maintenance (IDR Billion)
Year Routine
maintenance Periodic Maintenance Special
maintenance Sub Total
(3) 3 years 4 years 6 years
2018 3.26 - - - - 3.26
2019 3.46 10.39 - - - 13.85
2020 3.67 - 3.18 - - 6.85
2021 3.89 - - - 14.45 18.33
2022 4.12 12.38 - 97.71 - 114.21
2023 4.37 - - - - 4.37
2024 4.63 - 4.01 - - 8.64
2025 4.91 14.74 - - - 19.64
2026 5.20 - - - 19.33 24.53
2027 5.51 - - - - 5.51
2028 5.84 17.55 5.07 138.61 - 167.07
2029 6.19 - - - - 6.19
2030 6.56 - - - - 6.56
2031 6.96 20.91 - - 25.87 53.74
2032 7.38 - 6.40 - - 13.77
2033 7.82 - - - - 7.82
2034 8.29 24.90 - 196.62 - 229.81
2035 8.78 - - - - 8.78
2036 9.31 - 8.08 - 34.62 52.01
2037 9.87 29.66 - - - 39.53
2038 10.46 - - - - 10.46
2039 11.09 - - - - 11.09
2040 11.76 35.32 10.20 278.91 - 336.19
2041 12.46 - - - 46.33 58.79
2042 13.21 - - - - 13.21
2043 14.00 42.07 - - - 56.07
2044 14.84 - 12.87 - - 27.72
2045 15.73 - - - - 15.73
2046 16.68 50.11 - 395.64 62.00 524.42
2047 17.68 - - - - 17.68
2048 18.74 - 16.25 - - 34.99 Source: Own elaboration based on data from Hutama Karya.
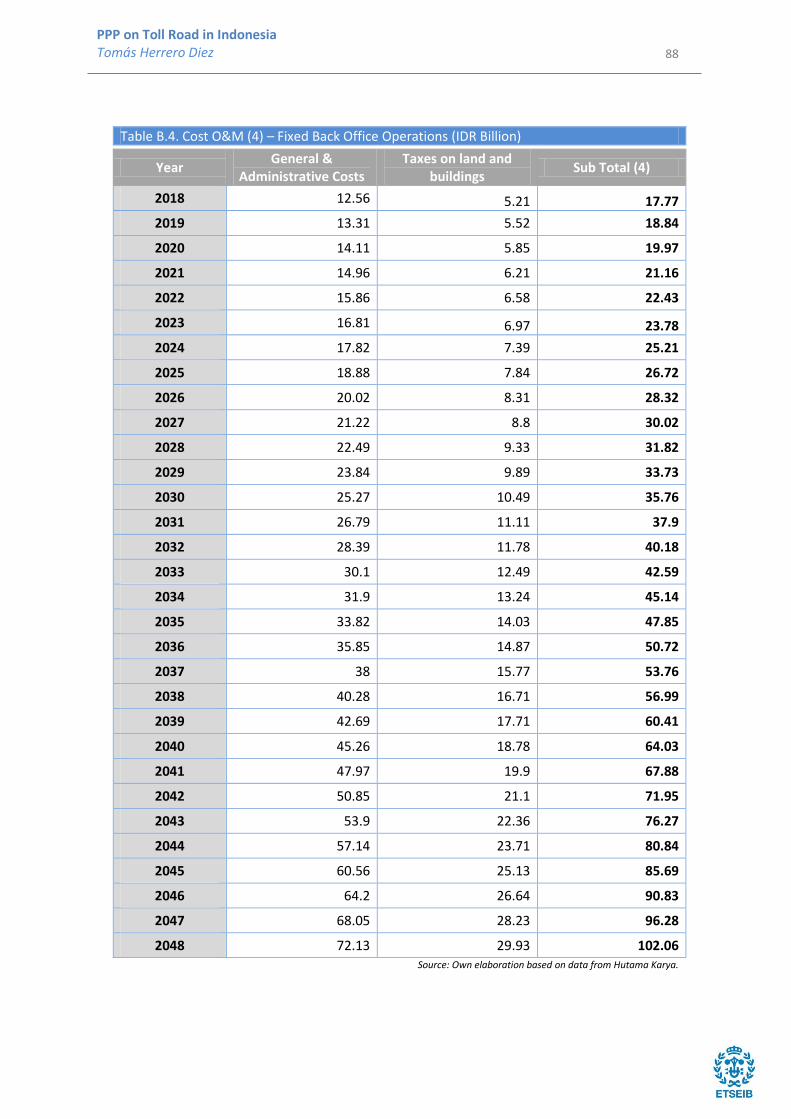
88
PPP on Toll Road in Indonesia Tomás Herrero Diez
Table B.4. Cost O&M (4) – Fixed Back Office Operations (IDR Billion)
Year General &
Administrative Costs Taxes on land and
buildings Sub Total (4)
2018 12.56 5.21 17.77
2019 13.31 5.52 18.84
2020 14.11 5.85 19.97
2021 14.96 6.21 21.16
2022 15.86 6.58 22.43
2023 16.81 6.97 23.78
2024 17.82 7.39 25.21
2025 18.88 7.84 26.72
2026 20.02 8.31 28.32
2027 21.22 8.8 30.02
2028 22.49 9.33 31.82
2029 23.84 9.89 33.73
2030 25.27 10.49 35.76
2031 26.79 11.11 37.9
2032 28.39 11.78 40.18
2033 30.1 12.49 42.59
2034 31.9 13.24 45.14
2035 33.82 14.03 47.85
2036 35.85 14.87 50.72
2037 38 15.77 53.76
2038 40.28 16.71 56.99
2039 42.69 17.71 60.41
2040 45.26 18.78 64.03
2041 47.97 19.9 67.88
2042 50.85 21.1 71.95
2043 53.9 22.36 76.27
2044 57.14 23.71 80.84
2045 60.56 25.13 85.69
2046 64.2 26.64 90.83
2047 68.05 28.23 96.28
2048 72.13 29.93 102.06 Source: Own elaboration based on data from Hutama Karya.

89
PPP on Toll Road in Indonesia Tomás Herrero Diez
Table B.5. Cost O&M – Total (IDR Billion)
Year Sub Total (1) Sub Total (2) Sub Total (3) Sub Total (4) Total
2018 10.26 6.64 3.26 17.77 37.93
2019 10.95 7.03 13.85 18.84 50.67
2020 12.73 14.44 6.85 19.97 53.99
2021 12.22 7.90 18.33 21.16 59.61
2022 62.90 8.38 114.21 22.43 207.92
2023 13.73 8.88 4.37 23.78 50.76
2024 16.08 24.99 8.64 25.21 74.92
2025 15.54 9.98 19.64 26.72 71.88
2026 16.35 10.58 24.53 28.32 79.78
2027 17.33 11.21 5.51 30.02 64.07
2028 91.15 13.02 167.07 31.82 303.06
2029 19.47 12.60 6.19 33.73 71.99
2030 20.64 13.35 6.56 35.76 76.31
2031 22.04 14.15 53.74 37.9 127.83
2032 25.62 39.83 13.77 40.18 119.4
2033 24.58 15.90 7.82 42.59 90.89
2034 126.57 16.86 229.81 45.14 418.38
2035 27.62 17.87 8.78 47.85 102.12
2036 32.35 36.68 52.01 50.72 171.76
2037 31.27 20.08 39.53 53.76 144.64
2038 32.90 21.28 10.46 56.99 121.63
2039 34.87 22.56 11.09 60.41 128.93
2040 83.42 63.48 336.19 64.03 547.12
2041 39.18 25.34 58.79 67.88 191.19
2042 41.53 26.87 13.21 71.95 153.56
2043 44.35 28.48 56.07 76.27 205.17
2044 51.56 58.47 27.72 80.84 218.59
2045 49.47 32.00 15.73 85.69 182.89
2046 254.69 33.92 524.42 90.83 903.86
2047 55.58 35.95 17.68 96.28 205.49
2048 65.09 101.18 34.99 102.06 303.32 Source: Own elaboration based on data from Hutama Karya.
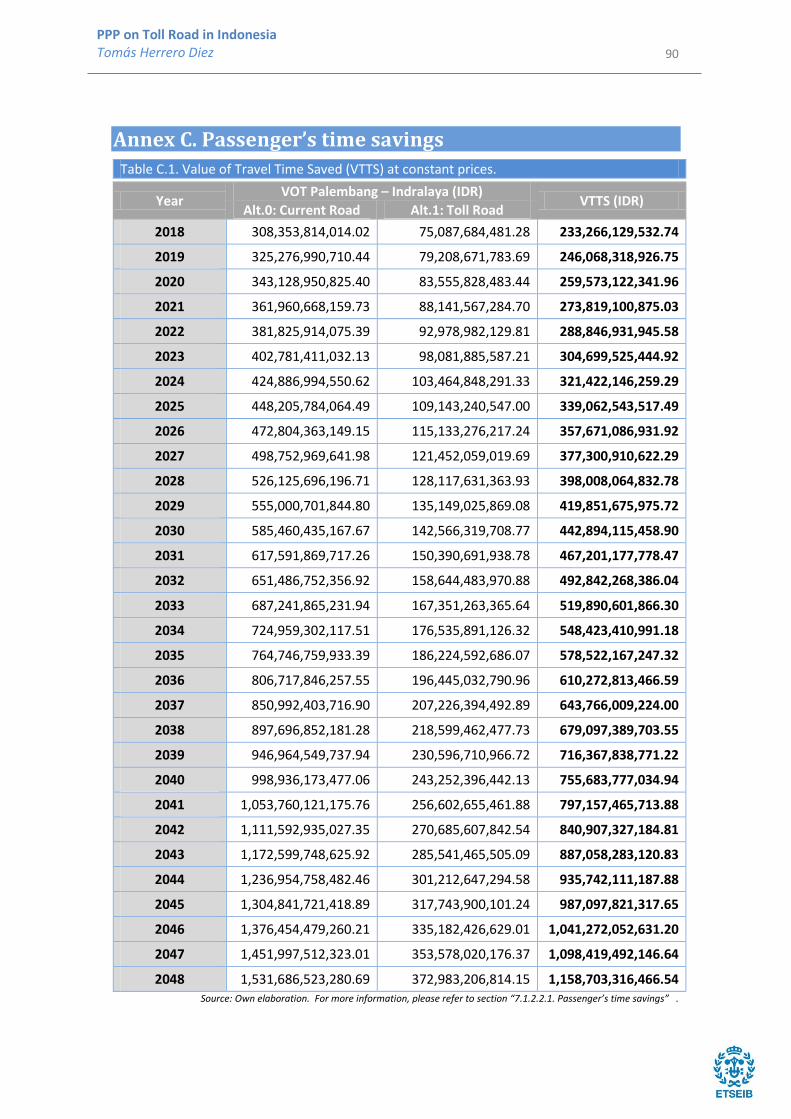
90
PPP on Toll Road in Indonesia Tomás Herrero Diez
Annex C. Passenger’s time savings
Table C.1. Value of Travel Time Saved (VTTS) at constant prices.
Year VOT Palembang – Indralaya (IDR)
VTTS (IDR) Alt.0: Current Road Alt.1: Toll Road
2018 308,353,814,014.02 75,087,684,481.28 233,266,129,532.74
2019 325,276,990,710.44 79,208,671,783.69 246,068,318,926.75
2020 343,128,950,825.40 83,555,828,483.44 259,573,122,341.96
2021 361,960,668,159.73 88,141,567,284.70 273,819,100,875.03
2022 381,825,914,075.39 92,978,982,129.81 288,846,931,945.58
2023 402,781,411,032.13 98,081,885,587.21 304,699,525,444.92
2024 424,886,994,550.62 103,464,848,291.33 321,422,146,259.29
2025 448,205,784,064.49 109,143,240,547.00 339,062,543,517.49
2026 472,804,363,149.15 115,133,276,217.24 357,671,086,931.92
2027 498,752,969,641.98 121,452,059,019.69 377,300,910,622.29
2028 526,125,696,196.71 128,117,631,363.93 398,008,064,832.78
2029 555,000,701,844.80 135,149,025,869.08 419,851,675,975.72
2030 585,460,435,167.67 142,566,319,708.77 442,894,115,458.90
2031 617,591,869,717.26 150,390,691,938.78 467,201,177,778.47
2032 651,486,752,356.92 158,644,483,970.88 492,842,268,386.04
2033 687,241,865,231.94 167,351,263,365.64 519,890,601,866.30
2034 724,959,302,117.51 176,535,891,126.32 548,423,410,991.18
2035 764,746,759,933.39 186,224,592,686.07 578,522,167,247.32
2036 806,717,846,257.55 196,445,032,790.96 610,272,813,466.59
2037 850,992,403,716.90 207,226,394,492.89 643,766,009,224.00
2038 897,696,852,181.28 218,599,462,477.73 679,097,389,703.55
2039 946,964,549,737.94 230,596,710,966.72 716,367,838,771.22
2040 998,936,173,477.06 243,252,396,442.13 755,683,777,034.94
2041 1,053,760,121,175.76 256,602,655,461.88 797,157,465,713.88
2042 1,111,592,935,027.35 270,685,607,842.54 840,907,327,184.81
2043 1,172,599,748,625.92 285,541,465,505.09 887,058,283,120.83
2044 1,236,954,758,482.46 301,212,647,294.58 935,742,111,187.88
2045 1,304,841,721,418.89 317,743,900,101.24 987,097,821,317.65
2046 1,376,454,479,260.21 335,182,426,629.01 1,041,272,052,631.20
2047 1,451,997,512,323.01 353,578,020,176.37 1,098,419,492,146.64
2048 1,531,686,523,280.69 372,983,206,814.15 1,158,703,316,466.54 Source: Own elaboration. For more information, please refer to section “7.1.2.2.1. Passenger’s time savings” .

91
PPP on Toll Road in Indonesia Tomás Herrero Diez
Annex D. Savings in Vehicle Operation Costs (VOC)
Table D.1. Savings in the Vehicle Operations Costs (VOC) at constant prices.
Year VOC Palembang – Indralaya (IDR)
Savings in VOC (IDR) Alt.0: Current Road Alt.1: Toll Road
2018 644,042,756,213.63 506,033,594,167.85 138,009,162,045.78
2019 664,764,506,079.85 522,314,969,062.74 142,449,537,017.11
2020 686,152,967,765.09 539,120,188,958.28 147,032,778,806.80
2021 708,229,592,384.83 556,466,108,302.37 151,763,484,082.46
2022 731,016,521,233.37 574,370,123,826.22 156,646,397,407.15
2023 754,536,607,989.92 592,850,191,992.08 161,686,415,997.84
2024 778,813,441,639.28 611,924,847,002.29 166,888,594,636.99
2025 803,871,370,129.90 631,613,219,387.78 172,258,150,742.12
2026 829,735,524,793.14 651,935,055,194.61 177,800,469,598.53
2027 856,431,845,548.24 672,910,735,787.91 183,521,109,760.34
2028 883,987,106,918.24 694,561,298,292.90 189,425,808,625.34
2029 912,428,944,882.87 716,908,456,693.69 195,520,488,189.19
2030 941,785,884,595.57 739,974,623,610.81 201,811,260,984.77
2031 972,087,368,992.14 763,782,932,779.54 208,304,436,212.60
2032 1,003,363,788,319.93 788,357,262,251.38 215,006,526,068.56
2033 1,035,646,510,617.17 813,722,258,342.06 221,924,252,275.11
2034 1,068,967,913,172.80 839,903,360,350.06 229,064,552,822.74
2035 1,103,361,414,998.69 866,926,826,070.40 236,434,588,928.29
2036 1,138,861,510,346.49 894,819,758,129.39 244,041,752,217.11
2037 1,175,503,803,302.96 923,610,131,166.61 251,893,672,136.35
2038 1,213,325,043,498.31 953,326,819,891.53 259,998,223,606.78
2039 1,252,363,162,963.56 983,999,628,042.80 268,363,534,920.76
2040 1,292,657,314,173.60 1,015,659,318,279.26 276,997,995,894.34
2041 1,334,247,909,314.40 1,048,337,643,032.74 285,910,266,281.66
2042 1,377,176,660,813.58 1,082,067,376,353.53 295,109,284,460.05
2043 1,421,486,623,175.01 1,116,882,346,780.37 304,604,276,394.65
2044 1,467,222,236,159.45 1,152,817,471,268.14 314,404,764,891.31
2045 1,514,429,369,354.45 1,189,908,790,207.07 324,520,579,147.38
2046 1,563,155,368,178.38 1,228,193,503,568.72 334,961,864,609.65
2047 1,613,449,101,364.45 1,267,710,008,214.93 345,739,093,149.53
2048 1,665,361,009,972.68 1,308,497,936,407.11 356,863,073,565.58 Source: Own elaboration. For more information, please refer to section “7.1.2.2.2. Savings in vehicle operation costs (VOC).

92
PPP on Toll Road in Indonesia Tomás Herrero Diez
Annex E. Traffic accident reduction benefits
Table E.1. Benefit from traffic accident reduction (IDR) at constant prices.
Year Fatal accident Serious injury Slight
accident Damage
only Total Benefit
(IDR)
2018 21,852,080.23 12,445,748.85 9,537,150.10 1,023,960.01 44,858,939.19
2019 23,451,652.50 13,356,777.67 10,235,269.49 1,098,913.88 48,142,613.54
2020 25,168,313.47 14,334,493.80 10,984,491.21 1,179,354.38 51,666,652.85
2021 27,010,634.01 15,383,778.74 11,788,555.97 1,265,683.12 55,448,651.84
2022 28,987,812.42 16,509,871.35 12,651,478.27 1,358,331.12 59,507,493.16
2023 31,109,720.29 17,718,393.93 13,577,566.48 1,457,760.96 63,863,441.65
2024 33,386,951.82 19,015,380.36 14,571,444.34 1,564,469.06 68,538,245.58
2025 35,830,876.69 20,407,306.21 15,638,074.07 1,678,988.20 73,555,245.16
2026 38,453,696.86 21,901,121.02 16,782,781.09 1,801,890.13 78,939,489.11
2027 41,268,507.47 23,504,283.08 18,011,280.67 1,933,788.49 84,717,859.71
2028 44,289,362.22 25,224,796.60 19,329,706.41 2,075,341.81 90,919,207.04
2029 47,531,343.53 27,071,251.71 20,744,640.92 2,227,256.83 97,574,492.99
2030 51,010,637.88 29,052,867.34 22,263,148.63 2,390,292.03 104,716,945.88
2031 54,744,616.57 31,179,537.23 23,892,811.11 2,565,261.41 112,382,226.32
2032 58,751,922.51 33,461,879.35 25,641,764.89 2,753,038.54 120,608,605.29
2033 63,052,563.23 35,911,288.92 27,518,742.08 2,954,560.96 129,437,155.19
2034 67,668,010.86 38,539,995.27 29,533,114.00 3,170,834.83 138,911,954.95
2035 72,621,309.26 41,361,122.92 31,694,937.94 3,402,939.93 149,080,310.06
2036 77,937,189.09 44,388,757.12 34,015,007.40 3,652,035.14 159,992,988.75
2037 83,642,191.34 47,638,014.14 36,504,905.94 3,919,364.11 171,704,475.53
2038 89,764,799.74 51,125,116.78 39,177,065.06 4,206,261.56 184,273,243.14
2039 96,335,583.08 54,867,475.33 42,044,826.22 4,514,159.91 197,762,044.54
2040 103,387,347.77 58,883,774.52 45,122,507.50 4,844,596.41 212,238,226.20
2041 110,955,301.62 63,194,066.81 48,425,475.05 5,199,220.87 227,774,064.35
2042 119,077,229.70 67,819,872.50 51,970,219.82 5,579,803.84 244,447,125.87
2043 127,793,682.91 72,784,287.17 55,774,439.91 5,988,245.48 262,340,655.48
2044 137,148,180.50 78,112,096.99 59,857,128.91 6,426,585.05 281,543,991.46
2045 147,187,427.32 83,829,902.49 64,238,670.75 6,897,011.08 302,153,011.63
2046 157,961,547.00 89,966,251.36 68,940,941.45 7,401,872.29 324,270,612.09
2047 169,524,332.24 96,551,780.96 73,987,418.36 7,943,689.34 348,007,220.89
2048 181,933,513.36 103,619,371.32 79,403,297.39 8,525,167.40 373,481,349.46 Source: Own elaboration. For more information, please refer to section “7.1.2.2.3.Traffic accident reduction”.
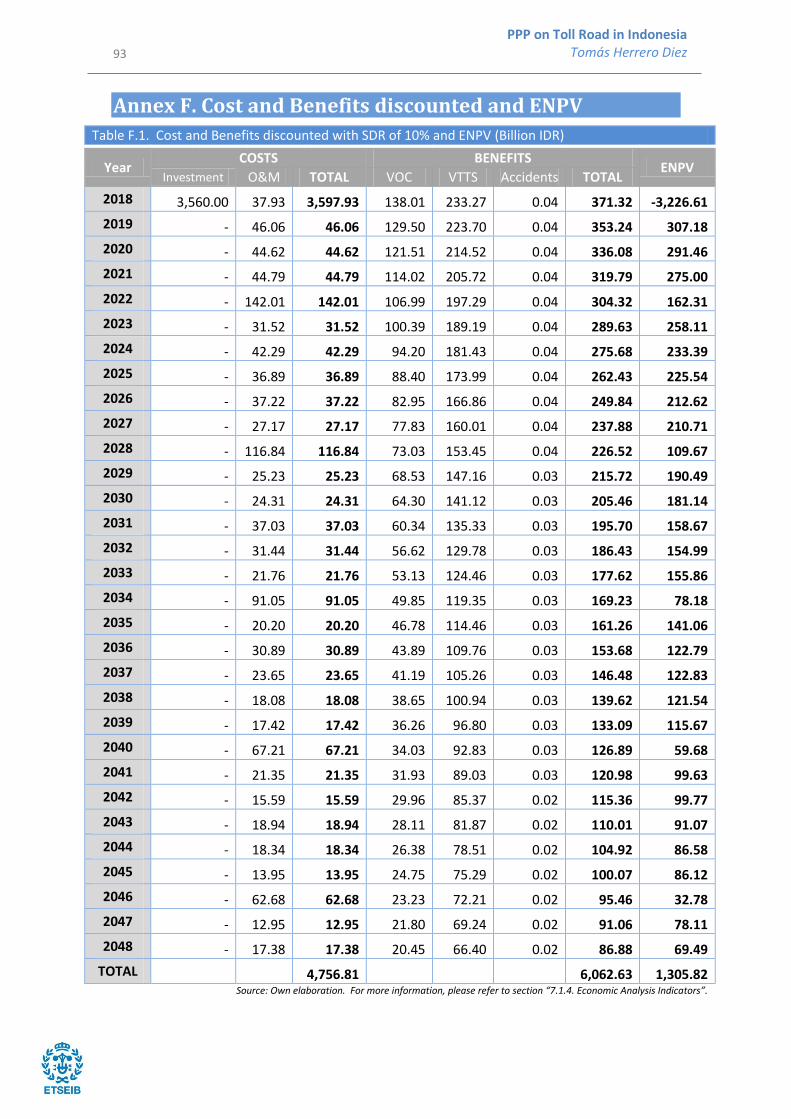
93
PPP on Toll Road in Indonesia Tomás Herrero Diez
Annex F. Cost and Benefits discounted and ENPV
Table F.1. Cost and Benefits discounted with SDR of 10% and ENPV (Billion IDR)
Year COSTS BENEFITS
ENPV Investment O&M TOTAL VOC VTTS Accidents TOTAL
2018 3,560.00 37.93 3,597.93 138.01 233.27 0.04 371.32 -3,226.61
2019 - 46.06 46.06 129.50 223.70 0.04 353.24 307.18
2020 - 44.62 44.62 121.51 214.52 0.04 336.08 291.46
2021 - 44.79 44.79 114.02 205.72 0.04 319.79 275.00
2022 - 142.01 142.01 106.99 197.29 0.04 304.32 162.31
2023 - 31.52 31.52 100.39 189.19 0.04 289.63 258.11
2024 - 42.29 42.29 94.20 181.43 0.04 275.68 233.39
2025 - 36.89 36.89 88.40 173.99 0.04 262.43 225.54
2026 - 37.22 37.22 82.95 166.86 0.04 249.84 212.62
2027 - 27.17 27.17 77.83 160.01 0.04 237.88 210.71
2028 - 116.84 116.84 73.03 153.45 0.04 226.52 109.67
2029 - 25.23 25.23 68.53 147.16 0.03 215.72 190.49
2030 - 24.31 24.31 64.30 141.12 0.03 205.46 181.14
2031 - 37.03 37.03 60.34 135.33 0.03 195.70 158.67
2032 - 31.44 31.44 56.62 129.78 0.03 186.43 154.99
2033 - 21.76 21.76 53.13 124.46 0.03 177.62 155.86
2034 - 91.05 91.05 49.85 119.35 0.03 169.23 78.18
2035 - 20.20 20.20 46.78 114.46 0.03 161.26 141.06
2036 - 30.89 30.89 43.89 109.76 0.03 153.68 122.79
2037 - 23.65 23.65 41.19 105.26 0.03 146.48 122.83
2038 - 18.08 18.08 38.65 100.94 0.03 139.62 121.54
2039 - 17.42 17.42 36.26 96.80 0.03 133.09 115.67
2040 - 67.21 67.21 34.03 92.83 0.03 126.89 59.68
2041 - 21.35 21.35 31.93 89.03 0.03 120.98 99.63
2042 - 15.59 15.59 29.96 85.37 0.02 115.36 99.77
2043 - 18.94 18.94 28.11 81.87 0.02 110.01 91.07
2044 - 18.34 18.34 26.38 78.51 0.02 104.92 86.58
2045 - 13.95 13.95 24.75 75.29 0.02 100.07 86.12
2046 - 62.68 62.68 23.23 72.21 0.02 95.46 32.78
2047 - 12.95 12.95 21.80 69.24 0.02 91.06 78.11
2048 - 17.38 17.38 20.45 66.40 0.02 86.88 69.49
TOTAL 4,756.81 6,062.63 1,305.82 Source: Own elaboration. For more information, please refer to section “7.1.4. Economic Analysis Indicators”.

94
PPP on Toll Road in Indonesia Tomás Herrero Diez
Annex G. Toll Revenue.
Table G.1. Toll Revenue (IDR)
Year Toll Revenue (IDR)
2018 97,493,406,984.15
2019 100,630,208,032.91
2020 103,867,934,068.52
2021 107,209,832,301.40
2022 110,659,254,419.29
2023 114,219,659,948.79
2024 117,894,619,725.03
2025 121,687,819,472.95
2026 125,603,063,503.81
2027 129,644,278,530.68
2028 133,815,517,606.63
2029 138,120,964,189.65
2030 142,564,936,338.41
2031 147,151,891,042.88
2032 151,886,428,694.48
2033 156,773,297,699.86
2034 161,817,399,243.27
2035 167,023,792,202.08
2036 172,397,698,220.47
2037 177,944,506,946.40
2038 183,669,781,437.01
2039 189,579,263,738.00
2040 195,678,880,642.46
2041 201,974,749,635.10
2042 208,473,185,027.55
2043 215,180,704,291.26
2044 222,104,034,594.01
2045 229,250,119,546.81
2046 236,626,126,167.83
2047 244,239,452,070.42
2048 252,097,732,882.43 Source: Own elaboration. For more information, please refer to section “7.2.1.1.1. Toll Revenue”.
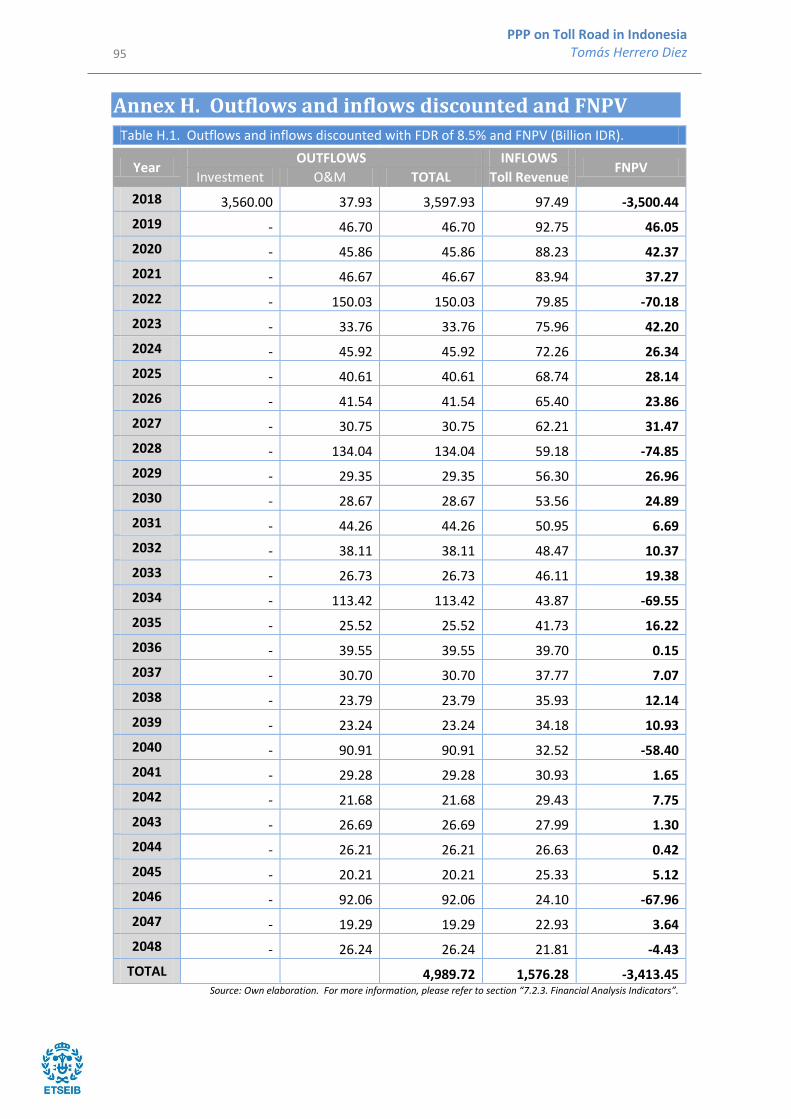
95
PPP on Toll Road in Indonesia Tomás Herrero Diez
Annex H. Outflows and inflows discounted and FNPV
Table H.1. Outflows and inflows discounted with FDR of 8.5% and FNPV (Billion IDR).
Year OUTFLOWS INFLOWS
FNPV Investment O&M TOTAL Toll Revenue
2018 3,560.00 37.93 3,597.93 97.49 -3,500.44
2019 - 46.70 46.70 92.75 46.05
2020 - 45.86 45.86 88.23 42.37
2021 - 46.67 46.67 83.94 37.27
2022 - 150.03 150.03 79.85 -70.18
2023 - 33.76 33.76 75.96 42.20
2024 - 45.92 45.92 72.26 26.34
2025 - 40.61 40.61 68.74 28.14
2026 - 41.54 41.54 65.40 23.86
2027 - 30.75 30.75 62.21 31.47
2028 - 134.04 134.04 59.18 -74.85
2029 - 29.35 29.35 56.30 26.96
2030 - 28.67 28.67 53.56 24.89
2031 - 44.26 44.26 50.95 6.69
2032 - 38.11 38.11 48.47 10.37
2033 - 26.73 26.73 46.11 19.38
2034 - 113.42 113.42 43.87 -69.55
2035 - 25.52 25.52 41.73 16.22
2036 - 39.55 39.55 39.70 0.15
2037 - 30.70 30.70 37.77 7.07
2038 - 23.79 23.79 35.93 12.14
2039 - 23.24 23.24 34.18 10.93
2040 - 90.91 90.91 32.52 -58.40
2041 - 29.28 29.28 30.93 1.65
2042 - 21.68 21.68 29.43 7.75
2043 - 26.69 26.69 27.99 1.30
2044 - 26.21 26.21 26.63 0.42
2045 - 20.21 20.21 25.33 5.12
2046 - 92.06 92.06 24.10 -67.96
2047 - 19.29 19.29 22.93 3.64
2048 - 26.24 26.24 21.81 -4.43
TOTAL 4,989.72 1,576.28 -3,413.45 Source: Own elaboration. For more information, please refer to section “7.2.3. Financial Analysis Indicators”.

96
PPP on Toll Road in Indonesia Tomás Herrero Diez
Annex I. Shadow Toll under Financing Scheme No 1
Table I.1. Shadow Toll (IDR)
Year Shadow Toll (IDR)
2018 236,347,653,294.92
2019 243,952,019,473.71
2020 251,801,052,287.33
2021 259,902,623,760.98
2022 268,264,859,198.28
2023 276,896,145,330.41
2024 285,805,138,727.35
2025 295,000,774,479.87
2026 304,492,275,160.75
2027 314,289,160,074.37
2028 324,401,254,803.94
2029 334,838,701,065.83
2030 345,611,966,880.98
2031 356,731,857,073.66
2032 368,209,524,107.83
2033 380,056,479,272.39
2034 392,284,604,226.11
2035 404,906,162,914.13
2036 417,933,813,867.81
2037 431,380,622,900.37
2038 445,260,076,210.94
2039 459,586,093,910.29
2040 474,373,043,981.73
2041 489,635,756,691.15
2042 505,389,539,460.73
2043 521,650,192,221.24
2044 538,434,023,258.21
2045 555,757,865,568.02
2046 573,639,093,740.18
2047 592,095,641,382.85
2048 611,146,019,108.93 Source: Own elaboration. For more information,
please refer to section “9.1. Financing Scheme 1”.

97
PPP on Toll Road in Indonesia Tomás Herrero Diez
Annex J. Cash flows under Financing Scheme 1
Table J.1. Outflows and inflows discounted with FDR of 8.5% and FNPV (Billion IDR).
Year
INFLOWS OUTFLOWS
FNPV Investment O&M FC TOTAL
Toll Revenues
Shadow Toll
TOTAL
2018 3,560.00 37.93 - 3,597.93 97.49 236.35 333.84 -3,264.09
2019 - 46.70 18.37 65.07 92.75 224.84 317.59 252.51
2020 - 45.86 16.93 62.80 88.23 213.89 302.12 239.33
2021 - 46.67 15.61 62.28 83.94 203.48 287.42 225.14
2022 - 150.03 14.39 164.42 79.85 193.57 273.42 109.01
2023 - 33.76 13.26 47.02 75.96 184.15 260.11 213.09
2024 - 45.92 12.22 58.14 72.26 175.18 247.45 189.30
2025 - 40.61 11.26 51.87 68.74 166.65 235.40 183.53
2026 - 41.54 10.38 51.92 65.40 158.54 223.94 172.02
2027 - 30.75 9.57 40.31 62.21 150.82 213.03 172.72
2028 - 134.04 8.82 142.86 59.18 143.48 202.66 59.81
2029 - 29.35 8.13 37.47 56.30 136.49 192.80 155.32
2030 - 28.67 - 28.67 53.56 129.85 183.41 154.74
2031 - 44.26 - 44.26 50.95 123.53 174.48 130.22
2032 - 38.11 - 38.11 48.47 117.51 165.98 127.88
2033 - 26.73 - 26.73 46.11 111.79 157.90 131.17
2034 - 113.42 - 113.42 43.87 106.35 150.22 36.79
2035 - 25.52 - 25.52 41.73 101.17 142.90 117.39
2036 - 39.55 - 39.55 39.70 96.24 135.94 96.39
2037 - 30.70 - 30.70 37.77 91.56 129.33 98.63
2038 - 23.79 - 23.79 35.93 87.10 123.03 99.24
2039 - 23.24 - 23.24 34.18 82.86 117.04 93.79
2040 - 90.91 - 90.91 32.52 78.83 111.34 20.43
2041 - 29.28 - 29.28 30.93 74.99 105.92 76.64
2042 - 21.68 - 21.68 29.43 71.34 100.76 79.09
2043 - 26.69 - 26.69 27.99 67.86 95.86 69.17
2044 - 26.21 - 26.21 26.63 64.56 91.19 64.98
2045 - 20.21 - 20.21 25.33 61.42 86.75 66.54
2046 - 92.06 - 92.06 24.10 58.43 82.53 -9.53
2047 - 19.29 - 19.29 22.93 55.58 78.51 59.22
2048 - 26.24 - 26.24 21.81 52.88 74.69 48.44
TOTAL 5,128.66 5,397.55 268.89 Source: Own elaboration. For more information, please refer to section “9.1. Financing Scheme 1”.

98
PPP on Toll Road in Indonesia Tomás Herrero Diez
Annex K. Shadow Toll under Financing Scheme 2
Table K.1. Shadow Toll (IDR)
Year Shadow Toll (IDR)
2018 118,173,826,647.46
2019 121,976,009,736.86
2020 125,900,526,143.66
2021 129,951,311,880.49
2022 134,132,429,599.14
2023 138,448,072,665.20
2024 142,902,569,363.68
2025 147,500,387,239.94
2026 152,246,137,580.37
2027 157,144,580,037.19
2028 162,200,627,401.97
2029 167,419,350,532.91
2030 172,805,983,440.49
2031 178,365,928,536.83
2032 184,104,762,053.92
2033 190,028,239,636.20
2034 196,142,302,113.06
2035 202,453,081,457.07
2036 208,966,906,933.91
2037 215,690,311,450.19
2038 222,630,038,105.47
2039 229,793,046,955.15
2040 237,186,521,990.87
2041 244,817,878,345.57
2042 252,694,769,730.36
2043 260,825,096,110.62
2044 269,217,011,629.10
2045 277,878,932,784.01
2046 286,819,546,870.09
2047 296,047,820,691.42
2048 305,573,009,554.46 Source: Own elaboration. For more information,
please refer to section “9.2. Financing Scheme 2”.

99
PPP on Toll Road in Indonesia Tomás Herrero Diez
Annex L. Cash flows under Financing Scheme 2
Table L.1. Outflows and inflows discounted with FDR of 8.5% and FNPV (Billion IDR).
Year
INFLOWS OUTFLOWS
FNPV Investment O&M FC TOTAL
Toll Revenues
Shadow Toll
TOTAL
2018 1,780.00 37.93 - 1,817.93 97.49 118.17 215.67 -1,602.26
2019 - 46.70 9.19 55.89 92.75 112.42 205.17 149.28
2020 - 45.86 8.47 54.33 88.23 106.95 195.18 140.85
2021 - 46.67 7.80 54.47 83.94 101.74 185.68 131.20
2022 - 150.03 7.19 157.22 79.85 96.79 176.64 19.41
2023 - 33.76 6.63 40.39 75.96 92.07 168.04 127.65
2024 - 45.92 6.11 52.03 72.26 87.59 159.85 107.82
2025 - 40.61 5.63 46.24 68.74 83.33 152.07 105.83
2026 - 41.54 5.19 46.73 65.40 79.27 144.67 97.94
2027 - 30.75 4.78 35.53 62.21 75.41 137.62 102.09
2028 - 134.04 4.41 138.45 59.18 71.74 130.92 -7.52
2029 - 29.35 4.06 33.41 56.30 68.25 124.55 91.14
2030 - 28.67 - 28.67 53.56 64.92 118.49 89.82
2031 - 44.26 - 44.26 50.95 61.76 112.72 68.45
2032 - 38.11 - 38.11 48.47 58.76 107.23 69.12
2033 - 26.73 - 26.73 46.11 55.89 102.01 75.27
2034 - 113.42 - 113.42 43.87 53.17 97.04 -16.38
2035 - 25.52 - 25.52 41.73 50.58 92.32 66.80
2036 - 39.55 - 39.55 39.70 48.12 87.82 48.27
2037 - 30.70 - 30.70 37.77 45.78 83.55 52.85
2038 - 23.79 - 23.79 35.93 43.55 79.48 55.69
2039 - 23.24 - 23.24 34.18 41.43 75.61 52.36
2040 - 90.91 - 90.91 32.52 39.41 71.93 -18.99
2041 - 29.28 - 29.28 30.93 37.49 68.43 39.15
2042 - 21.68 - 21.68 29.43 35.67 65.09 43.42
2043 - 26.69 - 26.69 27.99 33.93 61.93 35.23
2044 - 26.21 - 26.21 26.63 32.28 58.91 32.70
2045 - 20.21 - 20.21 25.33 30.71 56.04 35.83
2046 - 92.06 - 92.06 24.10 29.21 53.31 -38.75
2047 - 19.29 - 19.29 22.93 27.79 50.72 31.43
2048 - 26.24 - 26.24 21.81 26.44 48.25 22.01
TOTAL 3,279.19 3,486.91 207.72 Source: Own elaboration. For more information, please refer to section “9.2. Financing Scheme 2”.
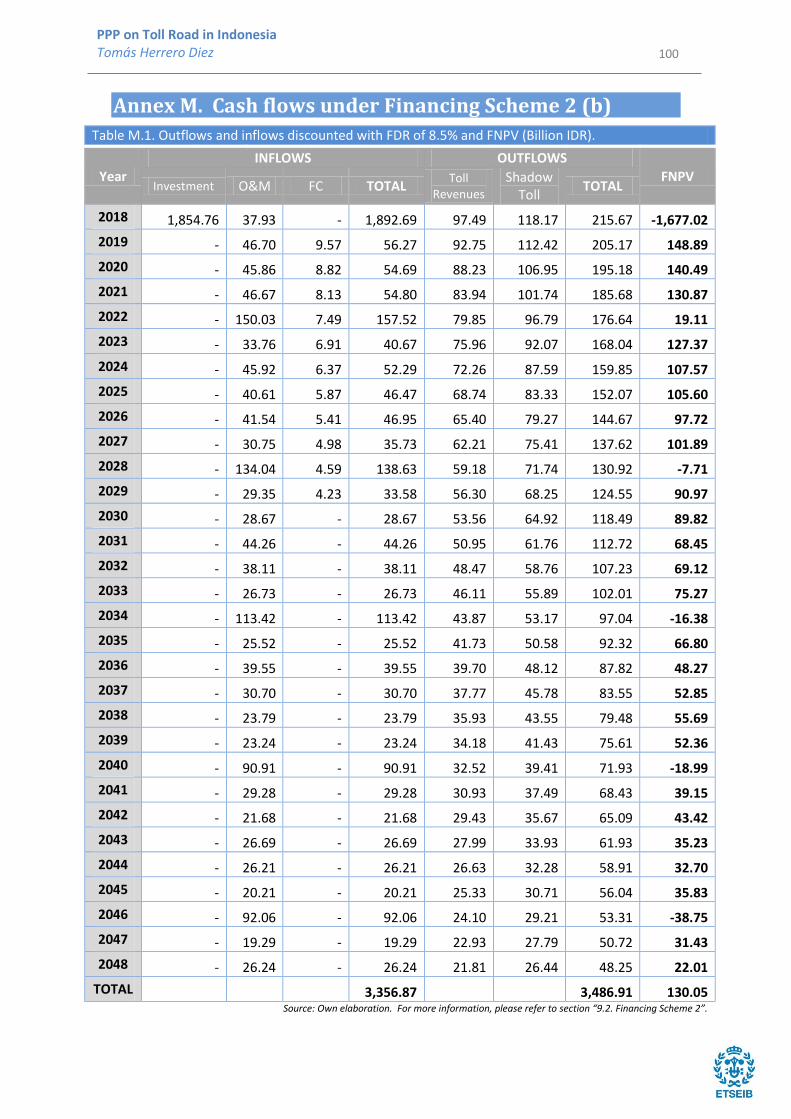
100
PPP on Toll Road in Indonesia Tomás Herrero Diez
Annex M. Cash flows under Financing Scheme 2 (b)
Table M.1. Outflows and inflows discounted with FDR of 8.5% and FNPV (Billion IDR).
Year
INFLOWS OUTFLOWS
FNPV Investment O&M FC TOTAL
Toll Revenues
Shadow Toll
TOTAL
2018 1,854.76 37.93 - 1,892.69 97.49 118.17 215.67 -1,677.02
2019 - 46.70 9.57 56.27 92.75 112.42 205.17 148.89
2020 - 45.86 8.82 54.69 88.23 106.95 195.18 140.49
2021 - 46.67 8.13 54.80 83.94 101.74 185.68 130.87
2022 - 150.03 7.49 157.52 79.85 96.79 176.64 19.11
2023 - 33.76 6.91 40.67 75.96 92.07 168.04 127.37
2024 - 45.92 6.37 52.29 72.26 87.59 159.85 107.57
2025 - 40.61 5.87 46.47 68.74 83.33 152.07 105.60
2026 - 41.54 5.41 46.95 65.40 79.27 144.67 97.72
2027 - 30.75 4.98 35.73 62.21 75.41 137.62 101.89
2028 - 134.04 4.59 138.63 59.18 71.74 130.92 -7.71
2029 - 29.35 4.23 33.58 56.30 68.25 124.55 90.97
2030 - 28.67 - 28.67 53.56 64.92 118.49 89.82
2031 - 44.26 - 44.26 50.95 61.76 112.72 68.45
2032 - 38.11 - 38.11 48.47 58.76 107.23 69.12
2033 - 26.73 - 26.73 46.11 55.89 102.01 75.27
2034 - 113.42 - 113.42 43.87 53.17 97.04 -16.38
2035 - 25.52 - 25.52 41.73 50.58 92.32 66.80
2036 - 39.55 - 39.55 39.70 48.12 87.82 48.27
2037 - 30.70 - 30.70 37.77 45.78 83.55 52.85
2038 - 23.79 - 23.79 35.93 43.55 79.48 55.69
2039 - 23.24 - 23.24 34.18 41.43 75.61 52.36
2040 - 90.91 - 90.91 32.52 39.41 71.93 -18.99
2041 - 29.28 - 29.28 30.93 37.49 68.43 39.15
2042 - 21.68 - 21.68 29.43 35.67 65.09 43.42
2043 - 26.69 - 26.69 27.99 33.93 61.93 35.23
2044 - 26.21 - 26.21 26.63 32.28 58.91 32.70
2045 - 20.21 - 20.21 25.33 30.71 56.04 35.83
2046 - 92.06 - 92.06 24.10 29.21 53.31 -38.75
2047 - 19.29 - 19.29 22.93 27.79 50.72 31.43
2048 - 26.24 - 26.24 21.81 26.44 48.25 22.01
TOTAL 3,356.87 3,486.91 130.05 Source: Own elaboration. For more information, please refer to section “9.2. Financing Scheme 2”.
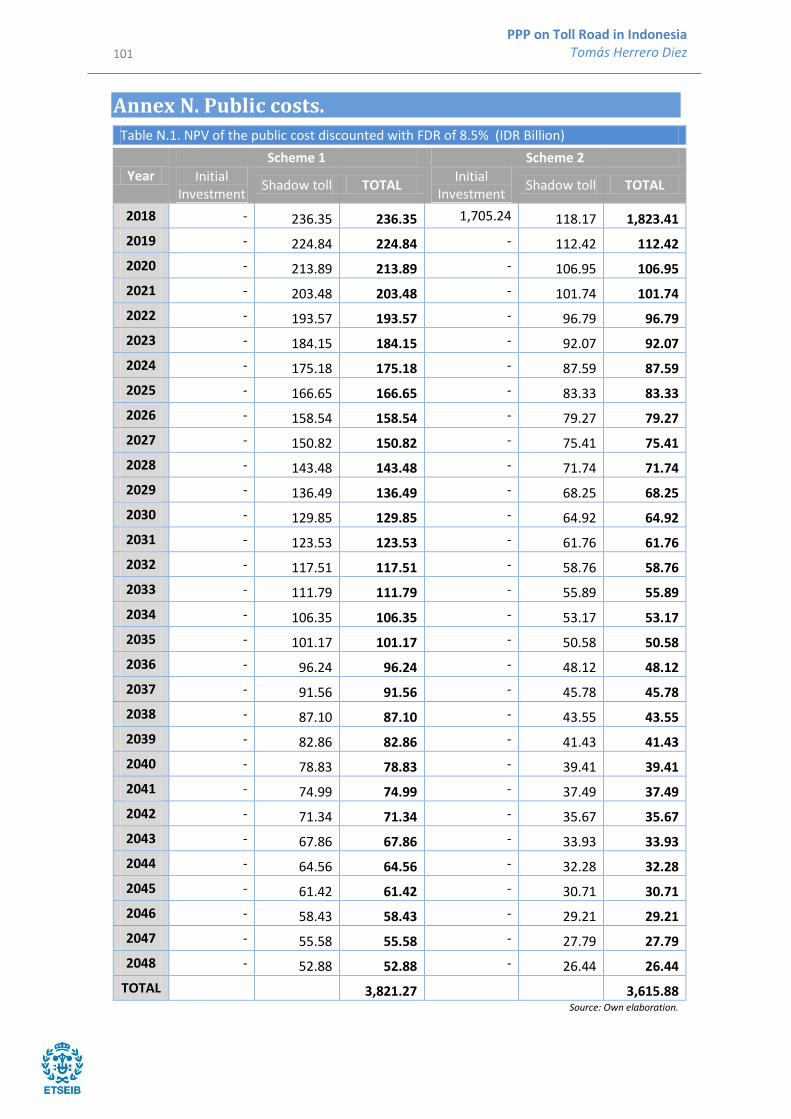
101
PPP on Toll Road in Indonesia Tomás Herrero Diez
Annex N. Public costs.
Table N.1. NPV of the public cost discounted with FDR of 8.5% (IDR Billion)
Year Scheme 1 Scheme 2
Initial Investment
Shadow toll TOTAL Initial
Investment Shadow toll TOTAL
2018 - 236.35 236.35 1,705.24 118.17 1,823.41
2019 - 224.84 224.84 - 112.42 112.42
2020 - 213.89 213.89 - 106.95 106.95
2021 - 203.48 203.48 - 101.74 101.74
2022 - 193.57 193.57 - 96.79 96.79
2023 - 184.15 184.15 - 92.07 92.07
2024 - 175.18 175.18 - 87.59 87.59
2025 - 166.65 166.65 - 83.33 83.33
2026 - 158.54 158.54 - 79.27 79.27
2027 - 150.82 150.82 - 75.41 75.41
2028 - 143.48 143.48 - 71.74 71.74
2029 - 136.49 136.49 - 68.25 68.25
2030 - 129.85 129.85 - 64.92 64.92
2031 - 123.53 123.53 - 61.76 61.76
2032 - 117.51 117.51 - 58.76 58.76
2033 - 111.79 111.79 - 55.89 55.89
2034 - 106.35 106.35 - 53.17 53.17
2035 - 101.17 101.17 - 50.58 50.58
2036 - 96.24 96.24 - 48.12 48.12
2037 - 91.56 91.56 - 45.78 45.78
2038 - 87.10 87.10 - 43.55 43.55
2039 - 82.86 82.86 - 41.43 41.43
2040 - 78.83 78.83 - 39.41 39.41
2041 - 74.99 74.99 - 37.49 37.49
2042 - 71.34 71.34 - 35.67 35.67
2043 - 67.86 67.86 - 33.93 33.93
2044 - 64.56 64.56 - 32.28 32.28
2045 - 61.42 61.42 - 30.71 30.71
2046 - 58.43 58.43 - 29.21 29.21
2047 - 55.58 55.58 - 27.79 27.79
2048 - 52.88 52.88 - 26.44 26.44
TOTAL 3,821.27 3,615.88 Source: Own elaboration.
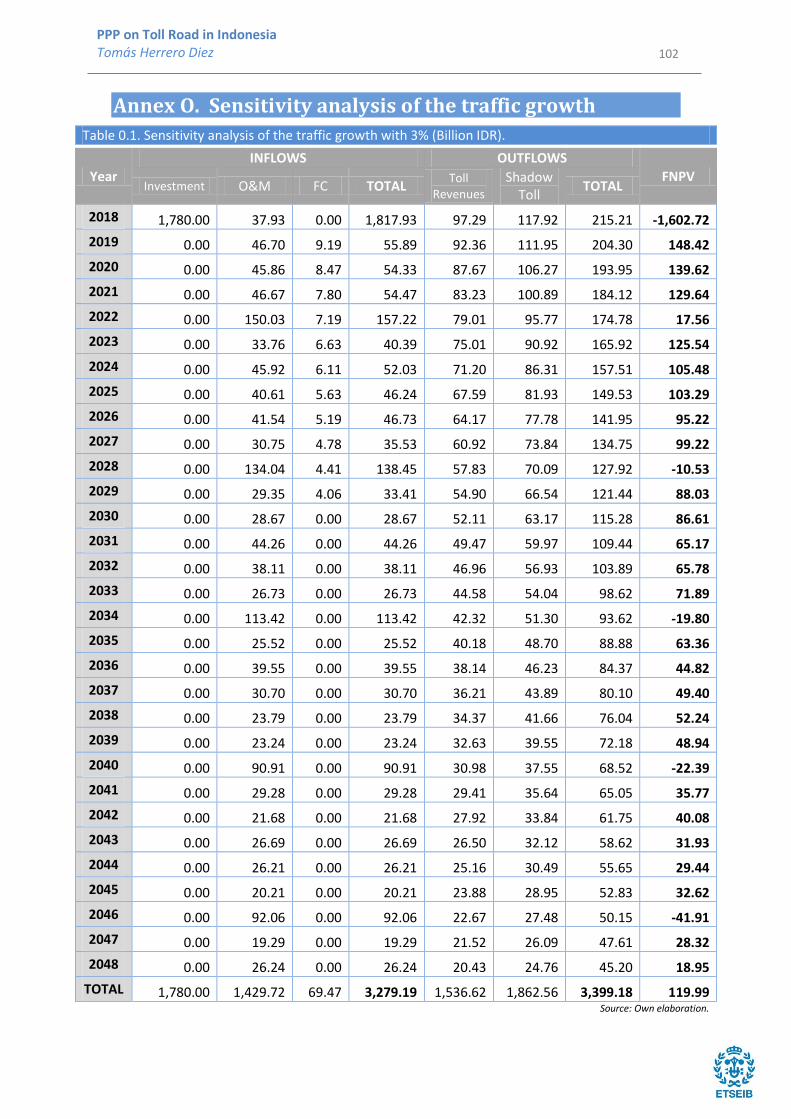
102
PPP on Toll Road in Indonesia Tomás Herrero Diez
Annex O. Sensitivity analysis of the traffic growth
Table 0.1. Sensitivity analysis of the traffic growth with 3% (Billion IDR).
Year
INFLOWS OUTFLOWS
FNPV Investment O&M FC TOTAL
Toll Revenues
Shadow Toll
TOTAL
2018 1,780.00 37.93 0.00 1,817.93 97.29 117.92 215.21 -1,602.72
2019 0.00 46.70 9.19 55.89 92.36 111.95 204.30 148.42
2020 0.00 45.86 8.47 54.33 87.67 106.27 193.95 139.62
2021 0.00 46.67 7.80 54.47 83.23 100.89 184.12 129.64
2022 0.00 150.03 7.19 157.22 79.01 95.77 174.78 17.56
2023 0.00 33.76 6.63 40.39 75.01 90.92 165.92 125.54
2024 0.00 45.92 6.11 52.03 71.20 86.31 157.51 105.48
2025 0.00 40.61 5.63 46.24 67.59 81.93 149.53 103.29
2026 0.00 41.54 5.19 46.73 64.17 77.78 141.95 95.22
2027 0.00 30.75 4.78 35.53 60.92 73.84 134.75 99.22
2028 0.00 134.04 4.41 138.45 57.83 70.09 127.92 -10.53
2029 0.00 29.35 4.06 33.41 54.90 66.54 121.44 88.03
2030 0.00 28.67 0.00 28.67 52.11 63.17 115.28 86.61
2031 0.00 44.26 0.00 44.26 49.47 59.97 109.44 65.17
2032 0.00 38.11 0.00 38.11 46.96 56.93 103.89 65.78
2033 0.00 26.73 0.00 26.73 44.58 54.04 98.62 71.89
2034 0.00 113.42 0.00 113.42 42.32 51.30 93.62 -19.80
2035 0.00 25.52 0.00 25.52 40.18 48.70 88.88 63.36
2036 0.00 39.55 0.00 39.55 38.14 46.23 84.37 44.82
2037 0.00 30.70 0.00 30.70 36.21 43.89 80.10 49.40
2038 0.00 23.79 0.00 23.79 34.37 41.66 76.04 52.24
2039 0.00 23.24 0.00 23.24 32.63 39.55 72.18 48.94
2040 0.00 90.91 0.00 90.91 30.98 37.55 68.52 -22.39
2041 0.00 29.28 0.00 29.28 29.41 35.64 65.05 35.77
2042 0.00 21.68 0.00 21.68 27.92 33.84 61.75 40.08
2043 0.00 26.69 0.00 26.69 26.50 32.12 58.62 31.93
2044 0.00 26.21 0.00 26.21 25.16 30.49 55.65 29.44
2045 0.00 20.21 0.00 20.21 23.88 28.95 52.83 32.62
2046 0.00 92.06 0.00 92.06 22.67 27.48 50.15 -41.91
2047 0.00 19.29 0.00 19.29 21.52 26.09 47.61 28.32
2048 0.00 26.24 0.00 26.24 20.43 24.76 45.20 18.95
TOTAL 1,780.00 1,429.72 69.47 3,279.19 1,536.62 1,862.56 3,399.18 119.99 Source: Own elaboration.

103
PPP on Toll Road in Indonesia Tomás Herrero Diez
Table 0.2. Sensitivity analysis of the traffic growth with 4% (Billion IDR).
Year
INFLOWS OUTFLOWS
FNPV Investment O&M FC TOTAL
Toll Revenues
Shadow Toll
TOTAL
2018 1,780.00 37.93 0.00 1,817.93 98.23 119.07 217.30 -1,600.63
2019 0.00 46.70 9.19 55.89 94.16 114.13 208.29 152.40
2020 0.00 45.86 8.47 54.33 90.25 109.40 199.65 145.32
2021 0.00 46.67 7.80 54.47 86.51 104.86 191.37 136.90
2022 0.00 150.03 7.19 157.22 82.92 100.51 183.43 26.21
2023 0.00 33.76 6.63 40.39 79.48 96.34 175.83 135.44
2024 0.00 45.92 6.11 52.03 76.19 92.35 168.53 116.50
2025 0.00 40.61 5.63 46.24 73.03 88.52 161.54 115.31
2026 0.00 41.54 5.19 46.73 70.00 84.85 154.84 108.11
2027 0.00 30.75 4.78 35.53 67.09 81.33 148.42 112.89
2028 0.00 134.04 4.41 138.45 64.31 77.95 142.27 3.82
2029 0.00 29.35 4.06 33.41 61.64 74.72 136.37 102.96
2030 0.00 28.67 0.00 28.67 59.09 71.62 130.71 102.04
2031 0.00 44.26 0.00 44.26 56.64 68.65 125.29 81.02
2032 0.00 38.11 0.00 38.11 54.29 65.80 120.09 81.99
2033 0.00 26.73 0.00 26.73 52.04 63.07 115.11 88.38
2034 0.00 113.42 0.00 113.42 49.88 60.46 110.34 -3.08
2035 0.00 25.52 0.00 25.52 47.81 57.95 105.76 80.25
2036 0.00 39.55 0.00 39.55 45.83 55.55 101.37 61.82
2037 0.00 30.70 0.00 30.70 43.93 53.24 97.17 66.47
2038 0.00 23.79 0.00 23.79 42.10 51.04 93.14 69.35
2039 0.00 23.24 0.00 23.24 40.36 48.92 89.28 66.03
2040 0.00 90.91 0.00 90.91 38.68 46.89 85.57 -5.34
2041 0.00 29.28 0.00 29.28 37.08 44.95 82.03 52.74
2042 0.00 21.68 0.00 21.68 35.54 43.08 78.62 56.95
2043 0.00 26.69 0.00 26.69 34.07 41.29 75.36 48.67
2044 0.00 26.21 0.00 26.21 32.65 39.58 72.24 46.03
2045 0.00 20.21 0.00 20.21 31.30 37.94 69.24 49.03
2046 0.00 92.06 0.00 92.06 30.00 36.37 66.37 -25.69
2047 0.00 19.29 0.00 19.29 28.76 34.86 63.62 44.33
2048 0.00 26.24 0.00 26.24 27.57 33.41 60.98 34.74
TOTAL 1,780.00 1,429.72 69.47 3,279.19 1,731.43 2,098.70 3,830.13 550.95 Source: Own elaboration.

104
PPP on Toll Road in Indonesia Tomás Herrero Diez
Annex P. Sensitivity analysis of the tariff
Table P.1. Sensitivity analysis of the tariff with IDR 16,000 (Billion IDR).
Year
INFLOWS OUTFLOWS
FNPV Investment O&M FC TOTAL
Toll Revenues
Shadow Toll
TOTAL
2018 1,780.00 37.93 0.00 1,817.93 94.54 118.17 212.71 -1,605.22
2019 0.00 46.70 9.19 55.89 89.94 112.42 202.36 146.47
2020 0.00 45.86 8.47 54.33 85.56 106.95 192.50 138.17
2021 0.00 46.67 7.80 54.47 81.39 101.74 183.13 128.66
2022 0.00 150.03 7.19 157.22 77.43 96.79 174.22 16.99
2023 0.00 33.76 6.63 40.39 73.66 92.07 165.73 125.35
2024 0.00 45.92 6.11 52.03 70.07 87.59 157.66 105.63
2025 0.00 40.61 5.63 46.24 66.66 83.33 149.99 103.75
2026 0.00 41.54 5.19 46.73 63.42 79.27 142.69 95.96
2027 0.00 30.75 4.78 35.53 60.33 75.41 135.74 100.21
2028 0.00 134.04 4.41 138.45 57.39 71.74 129.13 -9.32
2029 0.00 29.35 4.06 33.41 54.60 68.25 122.84 89.43
2030 0.00 28.67 0.00 28.67 51.94 64.92 116.86 88.19
2031 0.00 44.26 0.00 44.26 49.41 61.76 111.17 66.91
2032 0.00 38.11 0.00 38.11 47.00 58.76 105.76 67.65
2033 0.00 26.73 0.00 26.73 44.72 55.89 100.61 73.88
2034 0.00 113.42 0.00 113.42 42.54 53.17 95.71 -17.71
2035 0.00 25.52 0.00 25.52 40.47 50.58 91.05 65.54
2036 0.00 39.55 0.00 39.55 38.50 48.12 86.62 47.07
2037 0.00 30.70 0.00 30.70 36.62 45.78 82.40 51.70
2038 0.00 23.79 0.00 23.79 34.84 43.55 78.39 54.60
2039 0.00 23.24 0.00 23.24 33.14 41.43 74.57 51.33
2040 0.00 90.91 0.00 90.91 31.53 39.41 70.94 -19.97
2041 0.00 29.28 0.00 29.28 30.00 37.49 67.49 38.21
2042 0.00 21.68 0.00 21.68 28.53 35.67 64.20 42.53
2043 0.00 26.69 0.00 26.69 27.15 33.93 61.08 34.39
2044 0.00 26.21 0.00 26.21 25.82 32.28 58.10 31.89
2045 0.00 20.21 0.00 20.21 24.57 30.71 55.27 35.06
2046 0.00 92.06 0.00 92.06 23.37 29.21 52.58 -39.48
2047 0.00 19.29 0.00 19.29 22.23 27.79 50.02 30.73
2048 0.00 26.24 0.00 26.24 21.15 26.44 47.59 21.35
TOTAL 1,780.00 1,429.72 69.47 3,279.19 1,528.51 1,910.64 3,439.15 159.96 Source: Own elaboration.

105
PPP on Toll Road in Indonesia Tomás Herrero Diez
Table P.2. Sensitivity analysis of the tariff with IDR 17,000 (Billion IDR).
Year
INFLOWS OUTFLOWS
FNPV Investment O&M FC TOTAL
Toll Revenues
Shadow Toll
TOTAL
2018 1,780.00 37.93 0.00 1,817.93 100.45 118.17 218.62 -1,599.31
2019 0.00 46.70 9.19 55.89 95.56 112.42 207.98 152.09
2020 0.00 45.86 8.47 54.33 90.90 106.95 197.85 143.52
2021 0.00 46.67 7.80 54.47 86.48 101.74 188.22 133.75
2022 0.00 150.03 7.19 157.22 82.27 96.79 179.06 21.83
2023 0.00 33.76 6.63 40.39 78.26 92.07 170.34 129.95
2024 0.00 45.92 6.11 52.03 74.45 87.59 162.04 110.01
2025 0.00 40.61 5.63 46.24 70.83 83.33 154.15 107.92
2026 0.00 41.54 5.19 46.73 67.38 79.27 146.65 99.92
2027 0.00 30.75 4.78 35.53 64.10 75.41 139.51 103.98
2028 0.00 134.04 4.41 138.45 60.98 71.74 132.72 -5.73
2029 0.00 29.35 4.06 33.41 58.01 68.25 126.26 92.85
2030 0.00 28.67 0.00 28.67 55.18 64.92 120.11 91.44
2031 0.00 44.26 0.00 44.26 52.50 61.76 114.26 70.00
2032 0.00 38.11 0.00 38.11 49.94 58.76 108.70 70.59
2033 0.00 26.73 0.00 26.73 47.51 55.89 103.41 76.67
2034 0.00 113.42 0.00 113.42 45.20 53.17 98.37 -15.05
2035 0.00 25.52 0.00 25.52 43.00 50.58 93.58 68.07
2036 0.00 39.55 0.00 39.55 40.90 48.12 89.03 49.47
2037 0.00 30.70 0.00 30.70 38.91 45.78 84.69 53.99
2038 0.00 23.79 0.00 23.79 37.02 43.55 80.57 56.77
2039 0.00 23.24 0.00 23.24 35.22 41.43 76.65 53.40
2040 0.00 90.91 0.00 90.91 33.50 39.41 72.91 -18.00
2041 0.00 29.28 0.00 29.28 31.87 37.49 69.36 40.08
2042 0.00 21.68 0.00 21.68 30.32 35.67 65.99 44.31
2043 0.00 26.69 0.00 26.69 28.84 33.93 62.77 36.08
2044 0.00 26.21 0.00 26.21 27.44 32.28 59.72 33.51
2045 0.00 20.21 0.00 20.21 26.10 30.71 56.81 36.60
2046 0.00 92.06 0.00 92.06 24.83 29.21 54.04 -38.02
2047 0.00 19.29 0.00 19.29 23.62 27.79 51.41 32.12
2048 0.00 26.24 0.00 26.24 22.47 26.44 48.91 22.67
TOTAL 1,780.00 1,429.72 69.47 3,279.19 1,624.04 1,910.64 3,534.68 255.49 Source: Own elaboration.
Related Documents