University of Tennessee, Knoxville Trace: Tennessee Research and Creative Exchange Masters eses Graduate School 12-2010 Effects of pituitary pars intermedia dysfunction (PPID), season, and pasture diet on blood adrenocorticotropic hormone and metabolite concentrations in horses. Sarah Beth Ellio University of Tennessee - Knoxville, [email protected] is esis is brought to you for free and open access by the Graduate School at Trace: Tennessee Research and Creative Exchange. It has been accepted for inclusion in Masters eses by an authorized administrator of Trace: Tennessee Research and Creative Exchange. For more information, please contact [email protected]. Recommended Citation Ellio, Sarah Beth, "Effects of pituitary pars intermedia dysfunction (PPID), season, and pasture diet on blood adrenocorticotropic hormone and metabolite concentrations in horses.. " Master's esis, University of Tennessee, 2010. hps://trace.tennessee.edu/utk_gradthes/792

Welcome message from author
This document is posted to help you gain knowledge. Please leave a comment to let me know what you think about it! Share it to your friends and learn new things together.
Transcript

University of Tennessee, KnoxvilleTrace: Tennessee Research and CreativeExchange
Masters Theses Graduate School
12-2010
Effects of pituitary pars intermedia dysfunction(PPID), season, and pasture diet on bloodadrenocorticotropic hormone and metaboliteconcentrations in horses.Sarah Beth ElliottUniversity of Tennessee - Knoxville, [email protected]
This Thesis is brought to you for free and open access by the Graduate School at Trace: Tennessee Research and Creative Exchange. It has beenaccepted for inclusion in Masters Theses by an authorized administrator of Trace: Tennessee Research and Creative Exchange. For more information,please contact [email protected].
Recommended CitationElliott, Sarah Beth, "Effects of pituitary pars intermedia dysfunction (PPID), season, and pasture diet on blood adrenocorticotropichormone and metabolite concentrations in horses.. " Master's Thesis, University of Tennessee, 2010.https://trace.tennessee.edu/utk_gradthes/792
To the Graduate Council:
I am submitting herewith a thesis written by Sarah Beth Elliott entitled "Effects of pituitary parsintermedia dysfunction (PPID), season, and pasture diet on blood adrenocorticotropic hormone andmetabolite concentrations in horses.." I have examined the final electronic copy of this thesis for formand content and recommend that it be accepted in partial fulfillment of the requirements for the degreeof Master of Science, with a major in Comparative and Experimental Medicine.
Nicholas Frank, Major Professor
We have read this thesis and recommend its acceptance:
Claudia Kirk, Naima Moustaid-Moussa, Jonathan Wall
Accepted for the Council:Carolyn R. Hodges
Vice Provost and Dean of the Graduate School
(Original signatures are on file with official student records.)
To the Graduate Council:
I am submitting herewith a thesis written by Sarah Beth Elliott entitled ―Effects of pituitary pars intermedia dysfunction (PPID), season, and pasture diet on blood adrenocorticotropic hormone and metabolite concentrations in horses.‖ I have examined the final electronic copy of this thesis for form and content and recommend that it be accepted in partial fulfillment of the requirements for the degree of Master of Science, with a major in Comparative and Experimental Medicine.
Nicholas Frank, Major Professor
We have read this thesis and recommend its acceptance: Claudia Kirk Naima Moustaid-Moussa Jonathan Wall
Accepted for the Council:
Carolyn R. Hodges Vice Provost and Dean of the Graduate School
(Original signatures are on file with official student records.)

Effects of pituitary pars intermedia dysfunction
(PPID), season, and pasture diet on blood
adrenocorticotropic hormone and metabolite
concentrations in horses
A Thesis Presented for
the Masters of Science Degree
The University of Tennessee, Knoxville
Sarah B. Elliott
December 2010

ii
Copyright© 2010 by Sarah B. Elliott All Rights Reserved
iii
ABSTRACT
Studies described in this thesis were performed to investigate associations among
season, diet, pituitary pars intermedia dysfunction (PPID) and blood concentrations of
adrenocorticotropic hormone (ACTH), insulin, glucose, and leptin in horses. In the first study,
higher ACTH concentrations were detected in horses affected with PPID. A seasonal increase
in plasma ACTH concentration was detected in the late summer and early fall, but PPID did not
affect the timing or duration of this increase. Pasture grazing raised glucose and insulin
concentrations with a peak in September, at the same time that horses had higher ACTH
concentrations, and this convergence of risk factors may raise the risk of laminitis. All of the
horses included in this study were from the same farm. The second study was performed to
determine whether horses from different locations within the same region exhibited the same
seasonal increase in ACTH concentrations. Results of this study indicate that the seasonal
increase in plasma ACTH concentrations occurs in horses from different farms with varying
management practices. The third study investigated the effects of season on plasma leptin
concentrations in the horses from the first study. We hypothesized that higher leptin
concentrations would be detected in advance of the seasonal increase in plasma ACTH
concentrations. Results did not support our hypothesis because leptin concentrations increased
after ACTH concentrations peaked in September. Our findings suggest that the seasonal
increase in ACTH concentrations induced leptin resistance, which might facilitate weight gain in
the autumn. Alternatively, leptin concentrations increased as a result of weight gain or change
in body fat composition. In summary, season appears to signal upregulation of the
hypothalamic-pituitary-adrenal axis in horses, in an effort to prepare for winter. This
upregulation is retained in horses with PPID, a disorder associated with loss of dopaminergic

iv
inhibition to the pars intermedia of the pituitary. The seasonal rise in plasma ACTH
concentrations is followed by an increase in leptin concentrations, which suggests the
development of leptin resistance or an increase in adiposity.
Keywords: pituitary pars intermedia dysfunction, leptin, season, adrenocorticotropic hormone

v
ACKNOWLEDGMENTS
I would like to express my deepest gratitude to Dr. Nicholas Frank for his support and
guidance during my time in graduate school. His encouraging words led to my decision to
pursue graduate school, and also kept me going through the battles. He worked patiently and
meticulously with me to improve my scientific writing abilities, for which I highly appreciate. I
would like to thank Drs. Claudia Kirk, Niama Moustaid-Moussa, and Jonathan Wall for serving
on my thesis committee. My sincere thanks go to the faculty and staff of the University Of
Tennessee College Of Veterinary Medicine, Department of Large Animal Clinical Sciences for
their support of me while pursuing this degree.
Particularly thanks go to Drs. Ferenc Toth and Robin McClamroch for helping with
sample collection. I would also like to thank all the horse owners who allowed me to collect
samples from their horses, especially Ms. Sharon Bowie. With their help, the project went along
smoothly. I wish to thank the American College of Veterinary Internal Medicine, and the
University of Tennessee, Center for Equine Veterinary Research for their financial support of the
project.
Most importantly, I would like to thank my husband, Brad, for his continued love, support,
and encouragement while pursing this degree.

vi
TABLE OF CONTENTS
CHAPTER 1 .............................................................................................................................. 1 INTRODUCTION ....................................................................................................................... 1 1.1 Project Summary.................................................................................................................. 1 1.2 Normal Equine Hypothalamic-Pituitary-Adrenal (HPA) Axis ................................................. 2
1.2.1 Physiology of HPA axis .................................................................................................. 2 1.2.2 Hormones interacting with appetite and energy metabolism .......................................... 6
1.3 Effects of season on the endocrine system .........................................................................14 1.4 Normal glucose/insulin metabolism .....................................................................................15
1.4.1 Glucose ........................................................................................................................15 1.4.2 Insulin ...........................................................................................................................17
1.5 Pituitary Pars Intermedia Dysfunction (PPID) ......................................................................18 1.5.1 Effects of insulin resistance, PPID, diet, and season on resting glucose and insulin concentrations .......................................................................................................................20 1.5.2 Diagnosis of PPID ........................................................................................................22
1.6 Statement of the problem ....................................................................................................24 CHAPTER 2 .............................................................................................................................25 ASSOCIATION OF SEASON AND PASTURE GRAZING WITH BLOOD HORMONE AND METABOLITE CONCENTRATIONS IN HORSES WITH PRESUMED PITUITARY PARS INTERMEDIA DYSFUNCTION .................................................................................................25 2.1 Abstract ...............................................................................................................................25 2.2 Introduction .........................................................................................................................26 2.3 Materials and Methods ........................................................................................................27 2.4 Results ................................................................................................................................31 2.5 Discussion...........................................................................................................................42 CHAPTER 3 .............................................................................................................................48 EFFECTS OF SEASON ON ADRENOCORTICOTROPIN HORMONE (ACTH) CONCENTRATIONS IN HORSES WITH PITUITARY PARS INTERMEDIA DYSFUNCTION (PPID) FROM 15 DIFFERENT FARMS IN EAST TENNESSEE. ..............................................48 3.1 Abstract ...............................................................................................................................48 3.2 Introduction .........................................................................................................................49 3.3 Materials and Methods ........................................................................................................51 3.4 Results ................................................................................................................................53 3.5 Discussion...........................................................................................................................57 CHAPTER 4 .............................................................................................................................59 ASSOCIATION OF SEASON WITH PLASMA LEPTIN CONCENTRATIONS IN HORSES .....59 4.1 Abstract ...............................................................................................................................59 4.2 Introduction .........................................................................................................................60 4.3 Materials and Methods ........................................................................................................61
vii
4.4 Results ................................................................................................................................63 4.5 Discussion...........................................................................................................................67 CHAPTER 5 .............................................................................................................................70 GENERAL SUMMARY AND FUTURE DIRECTIONS ..............................................................70 REFERENCES .........................................................................................................................74 VITA .........................................................................................................................................88

viii
LIST OF FIGURES
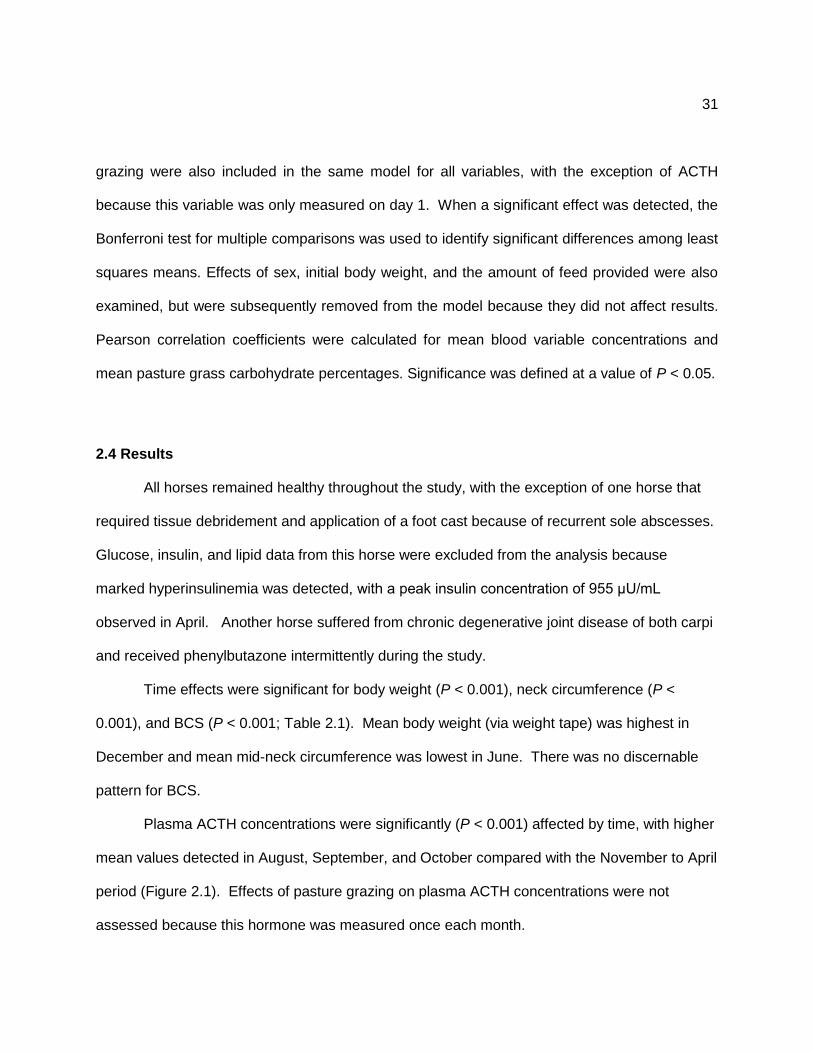
Figure 1.1 — The anatomical structure of the equine pituitary. The pars distalis (1), pars intermedia (2), pars nervosa (3), hypophyseal stalk (4), and recess of third ventricle (5). ......... 3 Figure 1.2 — Hypothalamus-pituitary-adrenal axis. Hypothalamic release of corticotrophin releasing hormone (CRH) stimulates release of ACTH from the pituitary. Adrenocorticotropic hormone acts on the adrenal cortex to secrete cortisol, a glucocorticoid which acts on the hypothalamus and pituitary to inhibit release of CRH and ACTH. .............................................. 5 Figure 1.3 — Proopiomelanocortin prohormone produced in the pars intermedia is cleaved by PC-1 to produce ACTH. Adrenocorticotropic hormone is cleaved by PC-2 to produce α-MSH and CLIP. .................................................................................................................................. 7 Figure 1.4 — Leptin’s action on the hypothalamus to suppress appetite. Leptin stimulates production of α-MSH, and suppresses secretion of NPY and AgRP. ....................................... 12 Figure 2.1 — Geometric mean (95% confidence interval) plasma adrenocorticotropin hormone (ACTH) concentrations collected after pasture grazing (day 1) for 17 horses across a 12-month sampling period. Data were log-transformed prior to statistical analysis and are displayed on a logarithmic scale. A significant effect of time (P < 0.001) was detected. Letters indicate significant differences among time points. ............................................................................... 35 Figure 2.2 — Mean ± SD plasma glucose concentrations for 16 horses across a 12-month sampling period. Blood samples were collected immediately after horses were brought in from pasture (dashed line; black diamonds) and then again the next morning after confinement in stalls overnight (solid line; white squares). Pasture (P < 0.001), time (P < 0.001), and pasture × time (P < 0.001) effects were detected, but the group × pasture × time interaction (P = 0.874) was not significant. Asterisk indicates that the mean glucose concentration in September on pasture was significantly higher than mean values for all other time points. ............................ 36 Figure 2.3 — Geometric mean (95% confidence interval) serum insulin concentrations for 16 horses across a 12-month sampling period. Data were log-transformed prior to statistical analysis and are displayed on a logarithmic scale. Blood samples were collected immediately after horses were brought in from pasture (dashed line; black diamonds) and then again the following morning after confinement in stalls overnight (solid line; white squares). Insulin data were log-transformed prior to statistical analysis. Pasture (P < 0.001), time (P < 0.001), and pasture × time (P < 0.001) effects were detected, but the group × pasture × time interaction (P = 0.962) was not significant. Ethanol-soluble carbohydrate (ESC) content of the pasture grass is also displayed as a grey line (y axis on the right); values represent percent dry matter content values for pooled grass samples collected every month. A positive correlation (r = 0.22; P = 0.002) was detected between log insulin concentrations and ESC. Asterisk indicates that the mean insulin concentration in September on pasture was significantly higher than mean values for all other time points. ........................................................................................................... 37
ix
Figure 2.4 — Geometric mean (95% confidence interval) plasma adrenocorticotropin hormone (ACTH) concentrations for 8 horses with presumptive pituitary pars intermedia dysfunction (PPID group; white circles) and 9 unaffected horses (control group; black triangles) across a 12-month sampling period. Data were log-transformed prior to statistical analysis and are displayed on a logarithmic scale. Group (P < 0.001) and time (P < 0.001) effects were detected, but the group × time interaction (P = 0.847) was not significant. Asterisk indicates a significant difference between groups at that time point. .......................................................................... 38 Figure 2.5 — Geometric mean (95% confidence interval) serum insulin concentrations for 9 unaffected horses (control group; Panel A) and 7 horses with presumptive pituitary pars intermedia dysfunction (PPID group; Panel B) after grazing on pasture (dotted line; black diamonds) or following overnight stall confinement (solid line; white squares). Data were log-transformed prior to statistical analysis and are displayed on a logarithmic scale. Group × time (P = 0.037) and pasture × time (P < 0.001) effects were detected, but the group × pasture × time interaction (P = 0.784) was not significant. Letters indicate significant differences among monthly mean values for samples collected after pasture grazing. Mean values after stall confinement did not differ significantly over time. .................................................................... 39 Figure 2.6 — Mean ± SD plasma non-esterified fatty acid (NEFA) concentrations for 9 unaffected horses (control group; Panel A) and 7 horses with presumptive pituitary pars intermedia dysfunction (PPID group; Panel B) after grazing on pasture (dotted line; black diamonds) or following overnight stall confinement (solid line; white squares). Pasture (P < 0.001), time (P < 0.001), pasture × time (P < 0.001), and group × pasture (P = 0.004) effects were detected, but the group × pasture × time interaction (P = 0.945) was not significant. Asterisk indicates a significant (P < 0.05) difference between means values for stall confinement and pasture conditions. ........................................................................................................... 41 Figure 3.1 — Illustration of a procedure used to measure neck circumference in horses, a = 0.25 of the distance from poll to withers, b = 0.50 of the distance from poll to withers, c = 0.75 of the distance from poll to withers. Reprinted with permission. .................................................. 55 Figure 3.2 — Mean ± SD plasma adrenocorticotropin hormone (ACTH) concentrations in 12 horses with pituitary pars intermedia dysfunction (PPID group; black triangles) and 6 healthy horses (control group; white circles) across a 12-month sampling period. Data were log-transformed prior to analysis. Group (P = 0.02) and time (P < 0.001) effects were detected, but the group × time interaction (P = 0.497) was not significant. For PPID and control groups combined, letters with different superscripts indicate significant differences among time points. ............................................................................................................................................... 56 Figure 4.1 — Geometric mean (95% confidence intervals) plasma leptin concentrations for 17 horses across a 12-month period. Blood was collected between 0900 and 1000 after horses were confined in stalls overnight. Grass hay was fed the night before, but no other feed was provided until after samples were collected. Data were log-transformed prior to statistical analysis and are displayed on a logarithmic scale. A significant time effect (P < .001) was detected. Letters indicate significant differences among time points. ..................................... 64
x
Figure 4.2 — Geometric mean (95% confidence intervals) plasma adrenocorticotropin hormone (ACTH; gray squares) and leptin (black diamonds) concentrations across a 12-month sampling period in 17 horses. Data were log-transformed prior to statistical analysis and are displayed on a logarithmic scale. ................................................................................................................. 65 Figure 4.3 — Geometric mean (95% confidence interval) plasma leptin concentrations for 9 unaffected horses (control group; black diamonds) and 8 horses with presumptive pituitary pars intermedia dysfunction (PPID group; grey squares) across a 12-month sampling period. Time (P < 0.001) effect was detected, but group (P = 0.948) and group × time (P = 0.770) effects were not significant. Data were log-transformed prior to statistical analysis and are displayed on a logarithmic scale. ................................................................................................................. 66 Figure 4.4 — Geometric mean (95% confidence interval) serum insulin concentrations (grey squares) and plasma leptin concentrations (black diamonds) in 17 horses across a 12-month sampling period. A positive correlation (rs = 0.52; P < 0.001) was detected between leptin and insulin concentrations. ............................................................................................................. 67
xi
LIST OF ABBREVATIONS
ACTH – adrenocorticotropic hormone AgRP – agouti-related protein AH – anterior hypothalamic nucleus ARC – arcuate nucleus ATP – adenosine triphosphate α-MSH – alpha-melanocyte stimulating hormone BCS – body condition score BDNF – brain-derived neuronal growth factor β-END – beta-endorphin β-MSH – beta-melanocyte stimulating hormone cAMP – cyclic adenosine monophosphate CCK – cholecystokinin CLIP – corticotrophin-like intermediate lobe peptide CRH – corticotrophin-releasing hormone DM – dorsomedial hypothalamic nucleus DST – dexamethasone suppression test ERK – extracellular signal-regulated kinase ESC – ethanol-soluble carbohydrate GC – glucocorticoid receptor GLUT4 – glucose transporter 4 HPA – hypothalamic-pituitary-adrenal axis IR – insulin resistance MB – mammillary nuclei MCR – melanocortin receptor NEFA – nonesterified fatty acid NPY – neuropeptide Y PC – prohormone convertase PI3K – phosphatidyl inositol 3 kinase PN – posterior nucleus POMC – proopiomelanocortin PPID – pituitary pars intermedia dysfunction PVN – paraventricular nucleus SCN – suprachiasmatic nucleus SI – small intestine Sim1 – single-minded gene-1 SO – supraoptic nucleus TRH – thyrotropin-releasing hormone VMN – ventromedial nucleus
1
CHAPTER 1
INTRODUCTION
1.1 Project Summary
Pituitary pars intermedia dysfunction (PPID), or equine Cushing’s disease, is becoming more
common as owners allow their horses to live longer. This disorder has often been diagnosed by
detecting high adrenocorticotropic hormone (ACTH) plasma concentrations or performing a
dexamethasone suppression test (DST). However, test results became harder to interpret after
Donaldson et al. [1] published data indicating that healthy horses exhibited positive
dexamethasone suppression test and high resting ACTH concentrations (>35 pg/ml) in
September. Since this observation, other research groups have corroborated these data,
demonstrating high ACTH plasma concentrations in healthy horses in August [2], and positive
thyrotropin releasing hormone response test in healthy horses [3] in late July.
Currently, no research has investigated the relationship of ACTH to other blood
metabolites, such as glucose, insulin, and leptin. These measures might provide clinicians with
an alternative method for diagnosing PPID. Season could also affect horses with PPID through
pasture grazing as it does in ponies with insulin resistance (IR) [4]. Exacerbation of insulin
resistance has been associated with the development of laminitis, a debilitating disease in
horses. Horses suffering from PPID had been shown to have decreased insulin sensitivity [5],
so the effects of pasture grazing should also be investigated in horses suffering from this
dysfunction. The possibility of a convergence of risk factors should be investigated to better
2
provide clinicians with adequate recommendations for horses affected with PPID to prevent the
onset of laminitis.
This literature review will begin with an overview of normal endocrine function, and then
PPID. Publications that are relevant to season, pasture grazing, ACTH, insulin, glucose, and
leptin will be reviewed.
1.2 Normal Equine Hypothalamic-Pituitary-Adrenal (HPA) Axis
1.2.1 Physiology of HPA axis
The hypothalamus lies between the thalamus and the pituitary at the base of the brain
[6]. Although it constitutes less than 1% of total brain weight, it is the most important control
area for homeostatic regulation of the body. The hypothalamus regulates reproduction, growth,
appetite, and thermoregulation [6]. There are three regions of the hypothalamus, each having
multiple nuclei. The anterior region houses the medial preoptic nucleus, supraoptic nucleus
(SO), paraventricular nucleus (PVN), anterior hypothalamic nucleus (AH), suprachiasmatic
nucleus (SCN), and lateral preoptic nucleus. The tuberal region contains the dorsomedial
hypothalamic nucleus (DM), the ventromedial nucleus (VMN), and arcuate nucleus (ARC).
Finally, the posterior region includes the mammillary nuclei (MB), and posterior nucleus (PN) [7].
The hypothalamus synthesizes and secretes neurohormones which travel through the
infundibulum (a stalk containing nerve fibers and blood vessels) to the pituitary gland to
stimulate or inhibit hormones produced there [6].
The pituitary gland is located at the base of the brain in close physical and functional
association with the hypothalamus [6]. It can be divided into two components based on
embryologic origin. The posterior pituitary, or neurohypophysis, grows downward from neural
tissue. It is structurally continuous with the hypothalamus of the brain, to which it remains
3
attached by the hypophyseal, or pituitary, stalk. The anterior and intermediate pituitary, or
adenohypophysis, originates embryologically from the oral cavity. The hypothalamus controls
almost all secretions of the pituitary. The posterior lobe is controlled by nerve fibers that
originate in hypothalamic neurons and the anterior lobe is controlled by releasing factors that
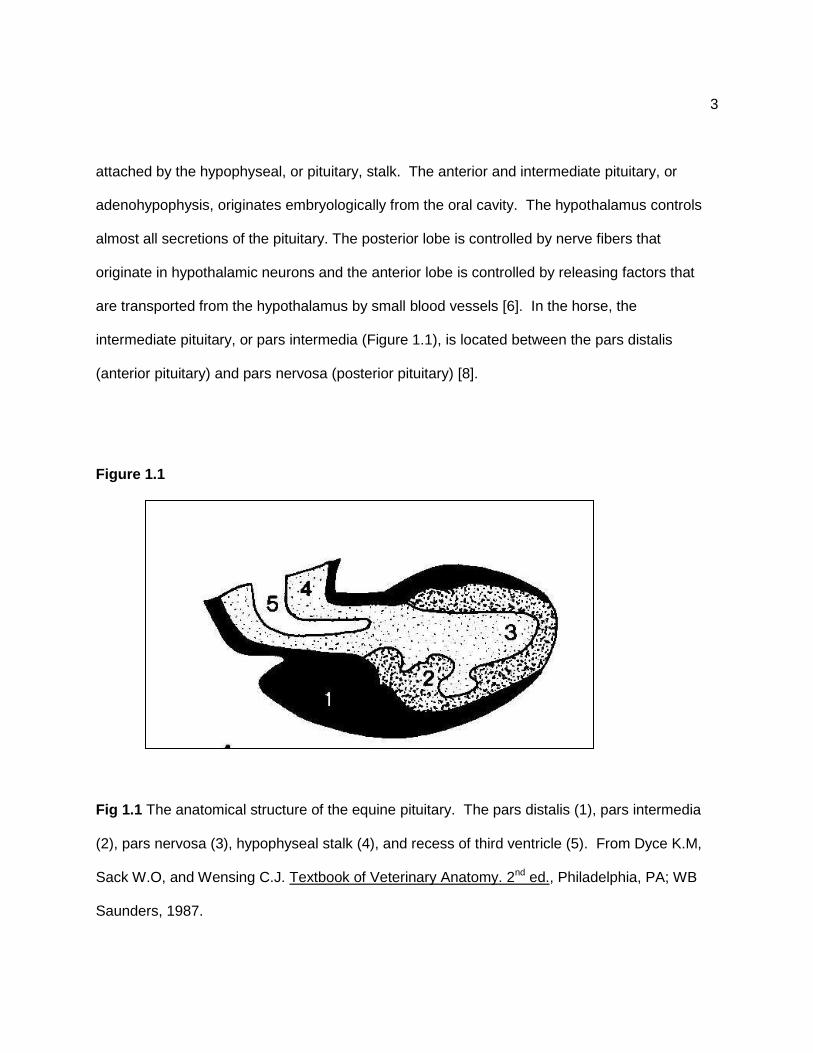
are transported from the hypothalamus by small blood vessels [6]. In the horse, the
intermediate pituitary, or pars intermedia (Figure 1.1), is located between the pars distalis
(anterior pituitary) and pars nervosa (posterior pituitary) [8].
Figure 1.1
Fig 1.1 The anatomical structure of the equine pituitary. The pars distalis (1), pars intermedia
(2), pars nervosa (3), hypophyseal stalk (4), and recess of third ventricle (5). From Dyce K.M,
Sack W.O, and Wensing C.J. Textbook of Veterinary Anatomy. 2nd ed., Philadelphia, PA; WB
Saunders, 1987.
4
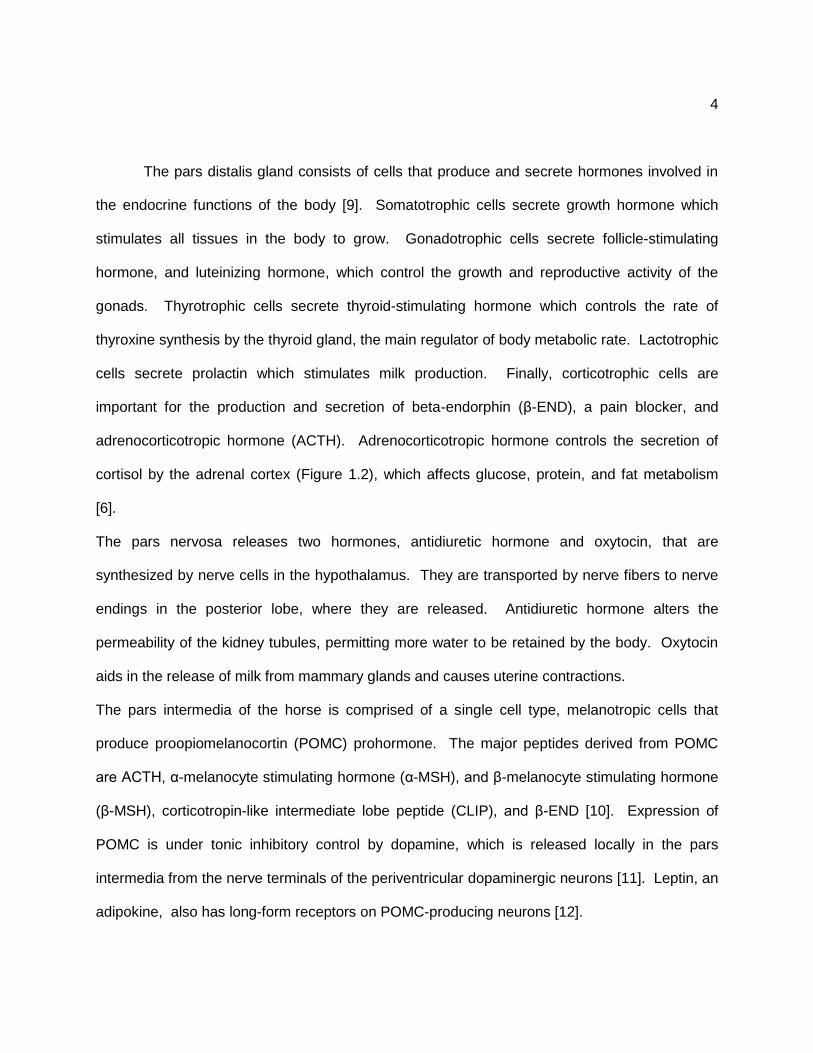
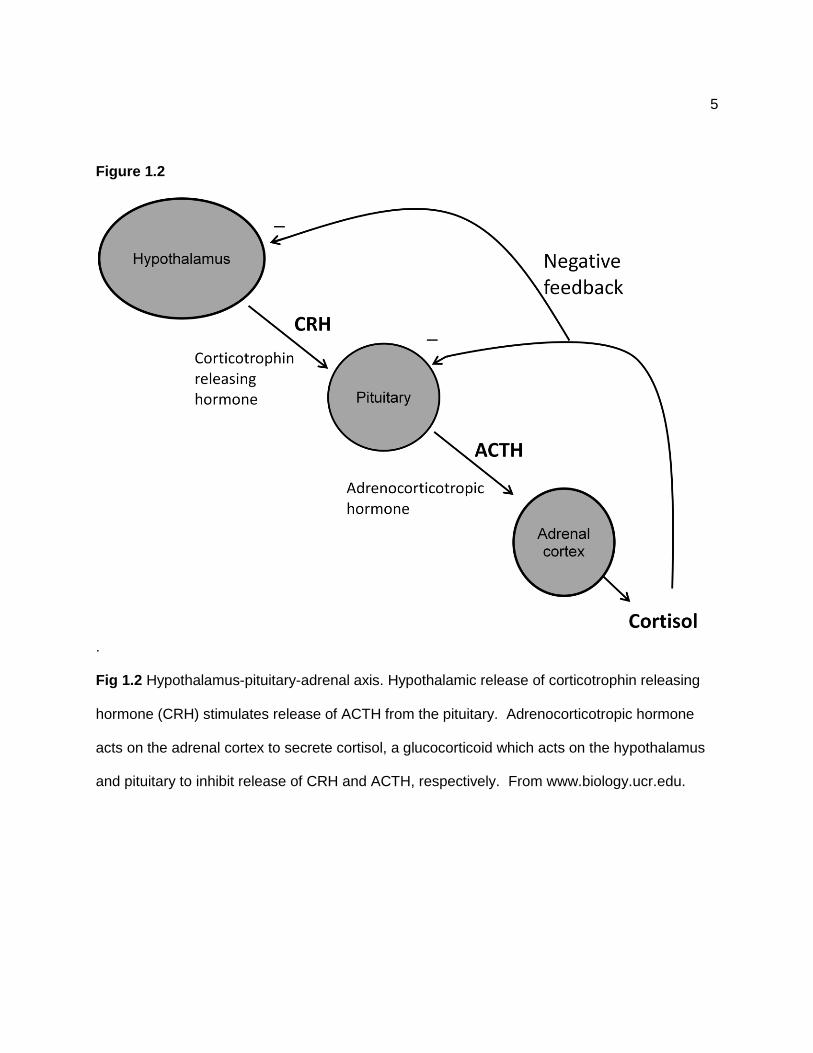
The pars distalis gland consists of cells that produce and secrete hormones involved in
the endocrine functions of the body [9]. Somatotrophic cells secrete growth hormone which
stimulates all tissues in the body to grow. Gonadotrophic cells secrete follicle-stimulating
hormone, and luteinizing hormone, which control the growth and reproductive activity of the
gonads. Thyrotrophic cells secrete thyroid-stimulating hormone which controls the rate of
thyroxine synthesis by the thyroid gland, the main regulator of body metabolic rate. Lactotrophic
cells secrete prolactin which stimulates milk production. Finally, corticotrophic cells are
important for the production and secretion of beta-endorphin (β-END), a pain blocker, and
adrenocorticotropic hormone (ACTH). Adrenocorticotropic hormone controls the secretion of
cortisol by the adrenal cortex (Figure 1.2), which affects glucose, protein, and fat metabolism
[6].
The pars nervosa releases two hormones, antidiuretic hormone and oxytocin, that are
synthesized by nerve cells in the hypothalamus. They are transported by nerve fibers to nerve
endings in the posterior lobe, where they are released. Antidiuretic hormone alters the
permeability of the kidney tubules, permitting more water to be retained by the body. Oxytocin
aids in the release of milk from mammary glands and causes uterine contractions.
The pars intermedia of the horse is comprised of a single cell type, melanotropic cells that
produce proopiomelanocortin (POMC) prohormone. The major peptides derived from POMC
are ACTH, α-melanocyte stimulating hormone (α-MSH), and β-melanocyte stimulating hormone
(β-MSH), corticotropin-like intermediate lobe peptide (CLIP), and β-END [10]. Expression of
POMC is under tonic inhibitory control by dopamine, which is released locally in the pars
intermedia from the nerve terminals of the periventricular dopaminergic neurons [11]. Leptin, an
adipokine, also has long-form receptors on POMC-producing neurons [12].
5
Figure 1.2
.
Fig 1.2 Hypothalamus-pituitary-adrenal axis. Hypothalamic release of corticotrophin releasing
hormone (CRH) stimulates release of ACTH from the pituitary. Adrenocorticotropic hormone
acts on the adrenal cortex to secrete cortisol, a glucocorticoid which acts on the hypothalamus
and pituitary to inhibit release of CRH and ACTH, respectively. From www.biology.ucr.edu.
6
The adrenal cortex produces 3 major types of steroid hormones: mineralocorticoids,
glucocorticoids, and androgens. Glomerulosa cells synthesize aldosterone, a hormone involved
in the regulation of sodium and potassium balance. Cortisol and the adrenal androgens are
derived from the fasciculata and reticularis cells, respectively. The important control mechanism
of cortisol secretion is via ACTH, which regulates adrenocortical growth, as well as the rate
steroid biosynthesis occurs [13]. High levels of cortisol in circulation can interfere with energy
homeostasis; increasing metabolism rates (see discussion to follow).
1.2.2 Hormones interacting with appetite and energy metabolism
Melanocortin peptides
Melanocortin peptides are produced in the arcuate nucleus of the hypothalamus,
neurons in the commissural nucleus of the solitary tract of the brainstem, and the anterior and
intermediate lobes of the pituitary, skin, and a wide range of peripheral tissues, including
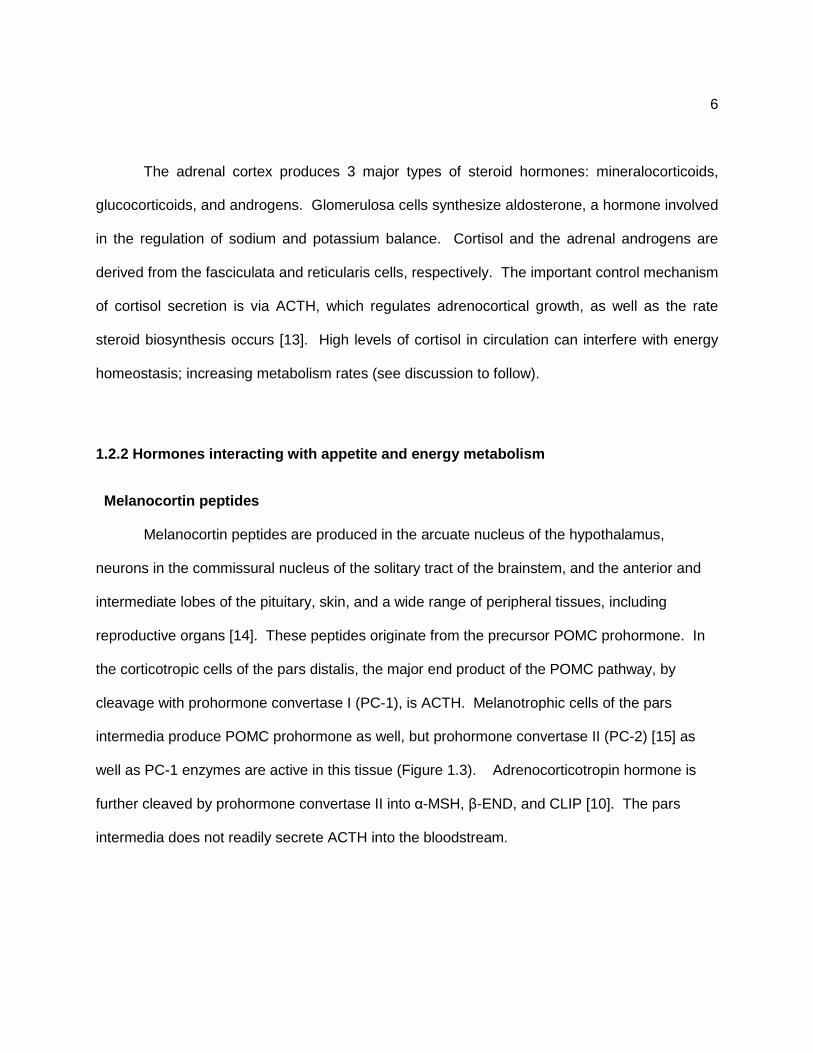
reproductive organs [14]. These peptides originate from the precursor POMC prohormone. In
the corticotropic cells of the pars distalis, the major end product of the POMC pathway, by
cleavage with prohormone convertase I (PC-1), is ACTH. Melanotrophic cells of the pars
intermedia produce POMC prohormone as well, but prohormone convertase II (PC-2) [15] as
well as PC-1 enzymes are active in this tissue (Figure 1.3). Adrenocorticotropin hormone is
further cleaved by prohormone convertase II into α-MSH, β-END, and CLIP [10]. The pars
intermedia does not readily secrete ACTH into the bloodstream.
7
Figure 1.3
Fig 1.3 Proopiomelanocortin prohormone produced in the pars intermedia is cleaved by PC-1 to
produce ACTH. Adrenocorticotropic hormone is cleaved by PC-2 to produce α-MSH and CLIP.
From www.themedicalbiochemistrypage.org.
Melanocortin receptors
Melanocortin peptides released from the hypothalamus or pituitary trigger cell responses
by binding melanocortin receptors, which are members of the G-protein-coupled receptor family
[16]. There are currently five melanocortin receptors identified, named MC1R to MC5R [14].
Melanocortin receptors 3 and 4 are the most widely studied in humans and mice due to their
role in obesity. Melanocortin 1R, MC2R, and MC5R knock-out/recessive subjects do not
develop obesity [14]. Melanocortin 1 receptor is involved in pigmentation and inflammation, and
MC5R stimulates exocrine function [16]. Agouti and agouti-related protein (AgRP) are
antagonists of all five melanocortin receptors. Only MC2R, MC3R, and MC4R will be discussed
in detail for this review.
8
Adrenocorticotropic hormone binds to the melanocortin-2 receptor and initiates cyclic
AMP (cAMP) production [17]. Cyclic AMP activates protein kinase A, which increases
phosphorylation in the cell, thus triggering cellular responses [6]. Melanocortin-2 receptors have
been detected in the adrenals of mice, adipose tissue of rats, and pulmonary artery of rabbits
[18-20]. In the adrenal glands, ACTH stimulates secretion of glucocorticoids, primarily cortisol
[16]. In adipose tissue, Oelofsen et al. [19] found that ACTH stimulated lipolysis, which was
closely correlated with binding of the MC2 receptor. When ACTH was administered to mice,
MC2R mRNA levels increased in adrenal tissues, but had no significant effect on adipose
tissues. In the same study, administration of dexamethasone decreased MC2R mRNA levels in
the adrenal tissues, but had no significant effect on adipose tissues [17]. This finding suggests
that different mechanisms exist for the action of ACTH on different tissues. The presence of
MC2R on adipose tissue in horses has not been investigated, but currently MC2R mRNA has
not been found in human adipose tissue [16]. The presence of MC2R in the skin cells indicates
that ACTH mediates DNA synthesis and cell proliferation of keratinocytes [16].
Melanocortin-3 receptor mRNA has been found in the hypothalamus, intestine, and
pancreas [14]. Receptors found in the ARC suggest that melanocortin 3 receptors play a role in
POMC synthesis, thus regulating energy homeostasis. These receptors also affect insulin
secretion from the pancreas. Alpha-MSH, β-MSH, and γ-MSH can all bind to MC3R and
stimulate cell activity. Binding of melanocortins to the MC3R activates phosphatidyl inositol 3
kinase (PI3K) through activation of the extracellular signal-regulated kinase 1/2 (ERK1/2)
pathway [21]. A role of MC3R in insulin secretion by the β-cells of the pancreas was shown in a
study where MC4R knockout mice and MC3R knockout mice were given a melanocortin
agonist. A significant reduction in hyperinsulinemia was seen in the MC4R knockout mice, but
no recovery was made in the MC3R knockout mice [22]. Mice lacking the MC3R show a

9
disturbance in the ability to anticipate feeding time. Also, MC3R mRNA is highly abundant in
the medial habenula nucleus, an additional site of melatonin synthesis [14]. Based on these
observations, melanocortin-3 receptor may be involved in circadian rhythms. Alternatively,
MC3R found on agouti-related protein neurons may provide negative feedback to inhibit further
production of POMC derived peptides [23].
An important receptor for appetite regulation, the MC4 receptor is found in the PVN and
possibly the amygdala [14]. When bound to the MC4 receptor, α-MSH induces satiety. Agouti-
related protein is a potent antagonist of the MC4 receptor, promoting hunger and food intake
[24]. The finding of MC4R mRNA in vagal afferent fibers suggests that cholecystokinin (CCK)
may be involved in satiety signals through POMC pathways. Other mediators of the MC4
receptor are single-minded gene-1 (Sim1), brain-derived neuronal growth factor (BDNF), and
oxytocin [14]. Sim1 knockout mice are obese and lack the suppression of appetite by α-MSH
[25]. Similarly, dominant agouti yellow obese mice normalize food intake with over expression of
Sim1 [25]. In Sim1 (+/-) mice, administration of oxytocin reduced food intake and weight gain
when compared to wild type mice [26]. Phenotypes seen in BDNF (+/-) mice include obesity,
hyperphagia, and insulin-resistance (IR). When BDNF(+/-) mice were restricted of their food
intake, BDNF levels increased to the level of the ad-libitum fed wild-type mice [27]. Expression
of BDNF is mostly found in the VMN, and administration of BDNF suppressed appetite in
MC4R-knockout mice. This indicates a role for appetite suppression by BDNF in the VMH after
MC4R stimulation in the PVN [28].
10
Hormone actions
Adrenocorticotropin hormone, α-MSH, and β-MSH inhibit food intake when administered
to the brain in rodents, and also when administered peripherally [14]. When injected
intravenously in sheep, ACTH increased appetite in August and decreased appetite in January
[29].
In humans, a defect in N-terminal acetylation of desacetyl-α-MSH is thought to contribute to the
development of obesity [14]. This acetylation reaction is regulated by leptin and dopamine, two
hormones involved in energy homeostasis [14]. Corticotropin-like intermediate lobe peptide
acts on the pancreatic β cells to stimulate insulin release [30]. This peptide is produced in
greater quantities in horses with PPID [31], but the importance of this observation has not been
investigated to date. Action of CLIP on pancreatic β cells warrants further investigation as
associations among PPID, season, and pasture grazing are examined in horses.
Agouti-related protein (AgRP) and neuropeptide Y (NPY) increase appetite [14]. Agouti-
related protein has been show to block MC3R and MC4R signaling, and also signals
endoplasmic reticulum endocytosis of MC3/4 receptors to decrease the number of receptors on
the cell surface [32], further contributing to increases in appetite. Neuropeptide Y is a
neuropeptide that increases food intake in mammals by acting on the paraventricular nucleus
[33].
Cortisol is the major glucocorticoid produced by the adrenal cortex, and is synthesized
from cholesterol [34]. Cortisol is released in response ACTH action on the adrenal tissue and
provides negative feedback to the hypothalamus and pars distalis, but not the pars intermedia.
Cortisol binds to glucocorticoid receptors (GC) that are found ubiquitously throughout the body
[35], signaling cell response. Glucocorticoids promote differentiation and proliferation of
adipocytes, and also redistribute adiposity to central depots in humans, as well as signaling
11
lipolysis and release of free fatty acids [36]. In a study in obese children with or without insulin
resistance, weight loss reduced cortisol levels and increase insulin sensitivity in the IR group,
but had no effect on the non-IR group. Overall, humans with visceral obesity show an
upregulation in the HPA axis [36]. Basal levels of cortisol stimulate gluconeogenesis and
lipolysis in a fasting state [6]. High circulating levels of cortisol stimulate increased protein
catabolism, gluconeogenesis, triglyceride breakdown, and decrease glucose uptake by muscle
and adipose cells [6].
In a study comparing rats that were treated with cortisone acetate injections or left untreated,
rats in the treated group lost weight indicating catabolic state in treated animals [37]. Increased
levels of cortisone lead to decreased glucose uptake by cells via insulin-mediated methods.
This occurs through a decrease in tyrosine phosphorylation of insulin receptors as well as a
decrease in IRS-1 phosphorylation [37]. The decreased ability of insulin to facilitate glucose
uptake leads to hyperglycemia, resulting in an increased response of the pancreas to release
more insulin. Chronic hyperinsulinemia worsens the insulin resistant state.
Leptin is an adipokine that plays a major role in the negative control of feeding [38]
(Figure 1.4). Leptin acts on the ARC and SCN of the hypothalamus and also the pituitary to
inhibit secretion of proteins that increase appetite, and promote synthesis and secretion of
proteins that suppress appetite [38]. Leptin is able to self-regulate, rodents that over express
leptin have a reduced number of receptors on the hypothalamus, and prolonged
hyperleptinemia over time will diminish its physiologic actions [39-40]. The neuropeptides
AgRP and NPY increase food intake and lower energy consumption, as previously described.
12
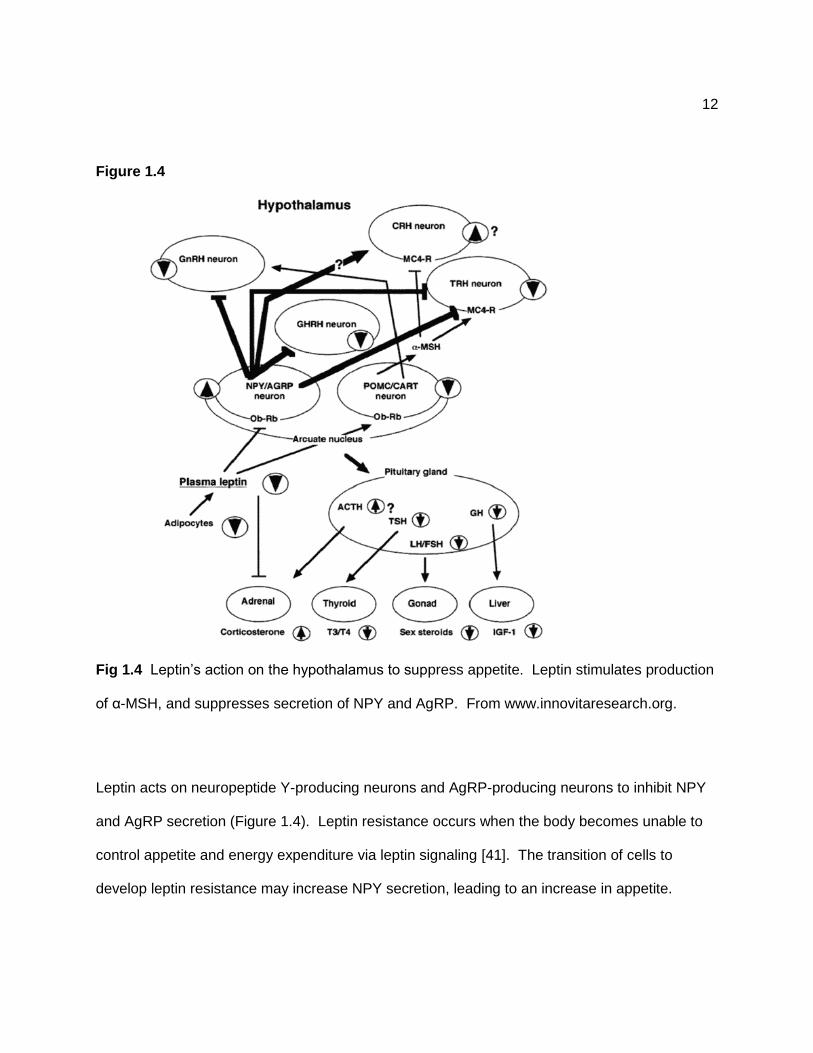
Figure 1.4
Fig 1.4 Leptin’s action on the hypothalamus to suppress appetite. Leptin stimulates production
of α-MSH, and suppresses secretion of NPY and AgRP. From www.innovitaresearch.org.
Leptin acts on neuropeptide Y-producing neurons and AgRP-producing neurons to inhibit NPY
and AgRP secretion (Figure 1.4). Leptin resistance occurs when the body becomes unable to
control appetite and energy expenditure via leptin signaling [41]. The transition of cells to
develop leptin resistance may increase NPY secretion, leading to an increase in appetite.
13
In humans, higher plasma leptin concentrations have been highly correlated to visceral
adiposity stores [42]. Hyperleptinemia has been associated with obesity in horses, and has also
been shown to predict the occurrence of laminitis in ponies [4]. Leptin can affect both the pars
distalis and the pars intermedia to regulate corticotrophin-releasing hormone (CRH), ACTH, and
α-MSH secretion [38]. Seasonal changes in leptin have been reported in many species, with
leptin resistance occurring in the autumn [38, 43-44]. Leptin resistance results from a reduction
in the density or activity of leptin receptors within the hypothalamus [45], and may explain why
horses gain weight in the late summer and autumn. In Siberian hamsters, leptin signaling on
the ARC was suppressed during long day photoperiods [46]. In sheep, melatonin secretion was
unaffected by leptin administration during long day photoperiods, but was stimulated during
short day secretions [47].
Leptin shows a circadian pattern in horses with the lowest levels seen in day time, and
peaking at night, and this rhythm was seen regardless of fed or fasted conditions [48].
However, Storer et al. [49] found that horses fed grass hay in a drylot had lower plasma insulin
and leptin concentrations than when they were housed on pasture. In older mares (>10 yrs
old), leptin fluctuated with season, with a peak in September, at the same time that body weight
peaked [50]. In the same study, younger mares (<10 yrs old) did not show an autumn peak in
leptin concentrations, but levels decreased in late winter [50]. Older mares gained more weight
than the younger mares, which may explain the difference in leptin concentrations.
When dexamethasone has been administered to geldings and mares, each group
exhibited an increase in leptin secretion [51]. In mares, the response to dexamethasone
injections was almost twice as large, even though baseline leptin concentrations did not differ
between the two groups [51]. Interestingly, the leptin response diminished when
dexamethasone injections were continued [51]. When given ACTH injections, the horses in the

14
previous study also showed an increase in leptin, but it was more modest as compared to
dexamethasone [51]. Glucose infusion failed to elicit a leptin response, possibly due to
insufficient insulin stimulation by the low dose of glucose infused [51].
1.3 Effects of season on the endocrine system
Melatonin, an amino acid derivative synthesized from serotonin, is produced by the
pineal gland. Secretion of melatonin is stimulated by sympathetic postganglionic neurons which
are primarily triggered by receptors in the eyes. Darkness stimulates melatonin production and
light inhibits it [6]. The circadian system regulates the pattern of melatonin secretion, and the
melatonin pattern serves as a signal to convey day length to the rest of the body [52]. Melatonin
secretion can also be signaled by CCK, a hormone released from neuroendocrine cells in the
mucosa of the small intestine [53]. Melatonin secretion regulates androgen secretion and is a
signal for reproduction [54].
Dopamine is a neurotransmitter derived from the amino acid tyrosine [55]. In sheep,
dopamine concentrations within tissues, as well as the bioactivity of tyrosine hydroxylase in the
median eminence are higher during long days when compared to short days [56]. Dopamine is
a precursor to epinephrine and norepinephrine [6]. Dopaminergic neurons begin in the
periventricular nucleus of the hypothalamus, pass through the infundibulum, and release
dopamine into the pars intermedia. When dopamine is released from these neurons it inhibits
the secretion of POMC-derived peptides [55]. Dopamine is also released into the pars nervosa
where it acts to inhibit secretion of prolactin. Dopamine can also be synthesized in the adrenals
and released into circulation in response to stress [6].

15
1.4 Normal glucose/insulin metabolism
1.4.1 Glucose
Glucose, a 6-carbon monosaccharide, is the major energy source for mammalian cells
as well as an important substrate for protein and lipid synthesis. Glucose is the body’s preferred
way to store adenosine triphosphate (ATP) for energy when needed. Hypoglycemia in
mammals can lead to alterations in neural activity, resulting in coma and ultimately death [34].
When ingested, carbohydrates are processed into monosaccharides such as glucose,
galactose, and fructose by hydrolytic enzymes bound to the brush border of enterocytes [57].
Mammalian cells take up monosaccharides, most importantly glucose, through two families of
structurally related glucose transporters. Passive transport is mediated by a family of facilitative
glucose transporters, whereas sodium-dependent glucose transport is mediated by Na+/glucose
co-transporters [57].
In the fed state, the major fates of glucose are energy storage as glycogen in liver and
skeletal muscle, or conversion to triacylglycerol, which is stored in adipose tissue [6]. Ingested
nutrients enter the blood from the gastrointestinal tract and are delivered to the liver, adipose
tissue, and muscle for processing. Glucose transporter 4 (GLUT4), a member of the facilitative
glucose transporters, translocates to the cell membrane in response to insulin during fed states
and rapidly increases glucose uptake across the plasma membrane. Therefore, the highest
expression of GLUT4 is found in insulin-sensitive tissues including brown and white adipose
tissue and skeletal and cardiac muscle [57]. In a study looking at meal type after exercise in
horses, GLUT4 gene expression in skeletal increased 4.3 times 4 hours following exercise, and
was still increased 2.6 times 24 hours post exercise compared to baseline. However, ingestion

16
of carbohydrates such as starch-rich meals did not enhance GLUT4 gene expression in muscle
as expected, compared with isocaloric fiber-rich meals or fasting conditions [58].
When the cells have high concentrations of ATP and NADH, isocitrate dehydrogenase
activity is inhibited in the Kreb’s cycle, thereby preventing breakdown of citrate and leading to
accumulation in the mitochondria. Accumulation of citrate signals the cell to promote glucose
storage, e.g., by facilitating fatty acid synthesis. Citrate leaves the mitochondria and enters fatty
acid synthesis, a cyclical reaction that generates palmitate and stearate. Esterification of
glycerol-3-phosphate and palmitate form triacylglycerol for storage in adipose tissues [34].
Another method citrate is involved in glucose storage is by the inhibition of
phosphofructokinase-1, preventing entry of fructose-6-phostate into glycolysis. Therefore,
glucose-6-phosphate enters glycogenesis, storing glucose as glycogen [34].
During fasting states, glycogen stores are catabolized to provide glucose for energy.
The average meal in humans requires approximately 4 hours for complete absorption [6]. In a
study with 6 horses and varying diets, gastric emptying based on 13C-octanoate breath tests had
an average half life of 2.7 hours [59]. After this, the body enters the post-absorptive state.
Glycogenolysis and lipolysis supply the liver, and kidneys, with glycerol, lactate, and pyruvate,
which are precursors for gluconeogenesis. When glucose from the blood enters the cell, it is
converted by glucokinase/hexokinase to glucose-6-phosphate, which can also be generated
from the breakdown of glycogen. Glucose-6-phosphate enters glycolysis, which generates
NADH and two pyruvate molecules that pass into the mitochondria and enter the Krebs cycle to
generate FADH2 and NADH. These molecules enter the respiratory chain or oxidative
phosphorylation and generate ATP for energy [34].
In adipose tissue, hormone-sensitive lipase breaks the glycerol backbone away from the
three attached fatty acid chains. The fatty acids enter beta-oxidation in the mitochondria, and

17
with each turn of the cycle, 2-carbon fragments of acetyl CoA are released that then enter the
Kreb’s cycle for oxidation. The glycerol backbone is phosphorylated in the liver by glycerol
kinase to form glycerol-3-phosphate, a precursor for gluconeogenesis.
1.4.2 Insulin
Insulin is a dipeptide hormone secreted by the β cells of the pancreatic islets of
Langerhans. Insulin is the driving force that regulates the storage of nutrients during fed states
so that there are energy sources for periods of fasting [60]. This hormone maintains normal
blood glucose levels by facilitating cellular glucose uptake, regulating carbohydrate, lipid and
protein metabolism, and promoting cell division and growth through its mitogenic effects [61-62].
During fed periods, insulin secretion is characteristically biphasic, with an initial rapid
phase of insulin secretion, followed by a less intense, but more sustained release of the
hormone [62]. Following secretion of insulin into the portal venous system, 50% is subsequently
removed by the liver, so portal vein insulin concentrations are almost three times higher than the
peripheral circulation [63]. Insulin in peripheral circulation binds to its receptor on the major
insulin responsive tissues of the body, namely skeletal muscle, liver, and adipose tissue, which
account for 60-70%, 30%, and 10% of the whole body insulin mediated uptake, respectively
[62], triggering GLUT4 translocation to the cell membrane. Insulin also deactivates cyclic AMP
(cAMP) through protein kinase B. Deactivation of cAMP prevents activation of protein kinase A,
preventing lipolysis [34].
Insulin is responsible for governing the tight control of glucose that is absorbed from the
intestine, produced by the liver, and taken up and metabolized by peripheral tissues [64]. Rising
blood glucose concentrations signal pancreatic beta cells to secrete insulin. After its release
from the pancreas, insulin causes a 30-fold increased rate of transport of glucose into
18
adipocytes [34]. Insulin also inhibits hepatic glucose production. This is accomplished through
coordinated regulation of enzyme synthesis and activity [64]. In muscle tissues, the presence
of insulin promotes glucose uptake. Glucose undergoes glycolysis, forming lactate. Lactate is
released into circulation, enters the liver, and is converted to glycogen or glucose there [34].
Circulating insulin concentrations decrease during fasting and this allows glycogenolysis,
lipolysis, and gluconeogenesis to occur. Pancreatic β cells only secrete 0.25 to 1.5 units insulin
per hour during fasting states in humans, which is sufficient to enable insulin-dependent glucose
entry into cells [62]. This level prevents uncontrolled hydrolysis of triacylglycerides and limits
gluconeogenesis, thereby maintaining fasting blood glucose concentrations within reference
ranges [62]. Glucagon is a hormone released by the pancreatic α-cells under fasting conditions
that acts to oppose the affects of insulin, i.e., it inhibits glycolysis in the liver by activating protein
kinase A through cAMP activation [34]. An excess of plasma glucagon relative to insulin can
cause hyperglycemia because of its action on the liver to activate glycogenolysis and
gluconeogenesis [65].
1.5 Pituitary Pars Intermedia Dysfunction (PPID)
Equine pituitary pars intermedia dysfunction (PPID) is a naturally occurring, clinically
progressive neuroendocrine disease that affects a large population of horses and ponies 15
years and older [66]. Clinical signs for PPID include hirsutism, muscle wasting, abnormal fat
distribution, glucose intolerance, lethargy, infertility, polydipsia and polyuria [67]. In one
epidemiological study [68], 30% of owners of aged horses (>20 years) who were surveyed
about the clinical condition of their animals reported haircoat changes highly suggestive of
PPID. In two recent studies, 33 to 40% of adult horses had pituitary pars intermedia
microadenoma or macroadenoma identified by routine histological examination [69-70].
19
The mechanism of pars intermedia hypertrophy, hyperplasia and adenoma formation in
PPID is unclear. It is possible that the lesion is a spontaneously occurring primary pituitary
tumor. Alternatively, pars intermedia enlargement may result from loss of hypothalamic
dopaminergic inhibition. McFarlane et al. [66] demonstrated that tyrosine hydroxylase, a
marker of dopaminergic neurons, was reduced by 20% in PPID horses as compared to controls.
This supports a loss of functional dopaminergic nerve terminals in diseased horses [66]. Orth et
al. [10] found that horses affected with PPID have a marked increase in circulating
concentration of POMC-derived peptides, including α-MSH, β-END, and CLIP.
Adrenocorticotropic hormone is also increased, although more modestly [10]. Alpha-MSH and
β-END potentiate the effects of corticotropin to cause adrenal dysfunction. However, only 10-
15% of horses with PPID develop hypertrophy and hyperplasia of the adrenal cortex, which
results in an increase in corticosteroid production and loss of the normal circadian pattern of
corticosteroid secretion [71].
Haritou et al. [72] reported seasonal changes in circadian peripheral plasma
concentrations of melatonin, serotonin, dopamine, and cortisol in aged horses with PPID. Six
horses and ponies with PPID were matched with six controls to test the hypothesis that aged
horse respond differently to changes in season because of deficiency in melatonin production.
They also examined the link between the presence or absence of the clinical signs of PPID and
peripheral plasma concentration of serotonin, dopamine, and cortisol. Results showed that the
24-h pattern of plasma melatonin concentrations during the four seasons of the year were
similar in both groups, indicating that impaired melatonin output is unlikely to play a role in
PPID. However, serotonin profiles were affected by season, with lower serotonin detected in
PPID horses in the summer and winter. The total amount of dopamine released was dependent
20
on season and markedly lower in PPID horses versus controls. These results implicate both
serotonin and dopamine in the pathogenesis of the disease [72].
1.5.1 Effects of insulin resistance, PPID, diet, and season on resting glucose and insulin
concentrations
Resting blood glucose concentrations are tightly controlled by insulin. In a healthy
animal, this relationship is functional and communication is free flowing. In an unhealthy animal,
however, this relationship can be hard to maintain. Insulin resistance (IR) is an endocrine
disorder associated with altered glucose and insulin concentrations. Impaired insulin signaling
alters normal cell functions in the liver, pancreas, and skeletal muscle [73-74].
Tissues are less responsive to insulin when IR develops [34]. Hyperinsulinemia
develops and IR results in abnormal glycemic and insulinemic responses to oral or IV glucose
and/or insulin challenges [73-74]. Insulin resistance is a major concern in horses because of its
link to laminitis [75]. It has also been shown to affect ponies in the UK where insulin sensitivity
varied with season [76]. In one study, ponies that were prone to laminitis had significantly
higher serum insulin concentrations in the summer months, when compared to the non-laminitis
prone group [76]. However, no differences were detected between the same groups during the
winter. Carter et al. [77] also found that blood insulin and leptin concentrations predicted the
occurrence of laminitis in ponies.
Pituitary pars intermedia dysfunction has been associated with altered blood glucose
and insulin concentrations in horses. Horses with PPID are frequently, but not always, insulin
resistant and have elevated serum glucose and insulin levels [78]. Interestingly, treatment for
PPID does not always return these values back to normal [79-80]. Insulin concentrations are
also affected by diet. In a group of ponies that were predisposed to laminitis, a significantly

21
higher median serum insulin concentration was detected on a pasture diet, and decreased when
only hay was fed [81].
Horses are hindgut fermenters that are evolutionarily adapted to graze continuously on
plants [82]. Plants contain carbohydrates in three forms: simple sugars (e.g., glucose, fructose,
sucrose), storage molecules (e.g., starch, fructans), and structural polysaccharides (e.g.,
hemicelluloses, cellulose) [83]. The simple sugars and storage molecules make up the
nonstructural carbohydrate (NSC) portion of the plant [83]. In the horse, carbohydrates are
digested either by hydrolysis to simple sugars in the small intestine (SI), or fermented by
bacteria to volatile fatty acids mostly in the hindgut, and slightly in the stomach [82].
Hydrolysable carbohydrates enter the small intestines and are hydrolyzed by enzymes, primarily
pancreatic α-amylase [82]. These carbohydrates include disaccharides, some oligosaccharides,
and starch. The end products of hydrolysis by enzymes are disaccharides and
oligosaccharides. These sugars are broken down further to simple sugars (glucose, galactose,
and fructose) by enzymes along the brush border of the SI tract and absorbed.
Fermentation of carbohydrates such as starches resistant to enzymatic hydrolysis,
hemicelluloses, cellulose, fibers, and some oligosaccharides, namely fructans and galactans,
occurs principally in the equine hind gut. Carbohydrates are fermented by bacteria to produce
volatile fatty acids (e.g., acetate propionate, butyrate, lactate, and valerate) [82]. Volatile fatty
acids are absorbed along a pH gradient by passive diffusion, usually in the form of free acids.
Propionate supplies the liver and muscle for glycogen storage, while acetate and butyrate
provide carbon for adipose synthesis [82].
The differential insulin response to pasture grazing or grains are of particular
importance. Over 80% of horses in the United States have some access to pasture, and more
than 90% of farms feed grain in addition to hay or pasture [84]. Insulin concentrations were

22
higher when horses were grazing on spring pasture grass, compared to the diet provided in
stalls [85]. Only one study has been performed to assess the effects of season on glucose and
insulin concentrations in horses [2]. Glucose concentrations did not change significantly
throughout the year and insulin concentrations changed significantly over time, but there was no
discernable pattern. Pasture samples were not collected, but carbohydrates may have been
responsible for these alterations over time.
1.5.2 Diagnosis of PPID
Diagnosis of PPID is problematic. Single-sample tests have been developed for
screening purposes and include resting ACTH, cortisol, insulin, and glucose concentrations [86].
Previously in horses, ACTH concentrations had been the most reliable test for diagnosing PPID.
Testing for ACTH is simple and can be obtained from a single blood sample. The reliability of
this test, however, is under review due to diurnal and seasonal changes of ACTH within each
horse [71, 87].
Resting ACTH concentrations are high in horses with PPID because POMC synthesis
increases with hyperplasia/neoplasia of the pars intermedia [88]. However, resting hormone
and metabolite concentrations are potentially affected by season, diet, and stress, and this
affects the accuracy of results. One important confounding factor is season and this was
revealed when high resting ACTH concentrations (consistent with PPID) were detected in
plasma samples collected in September from otherwise healthy horses [1]. In this study, 15
pony mares (all pregnant during the study), 14 pony stallions, and 10 non-pregnant horse mares
were evaluated at four time points over 12 months (September 2002, January, May, and
September 2003). Only one high (> 35 pg/mL) ACTH concentration was detected in January
and May, whereas the majority of results were high at the September sampling times; only 5%

23
and 8% of results were < 35 pg/mL in these healthy ponies and horses in September 2002 and
September 2003, respectively. This was the first observation that healthy horses and ponies
can exhibit quantitatively ―abnormal‖ ACTH concentrations during different seasons, indicating
that false-positive diagnosis of PPID may be made based on blood sampling in the late summer
and autumn seasons.
As an alternative, ―response tests‖ are often used to diagnose PPID, including the
dexamethasone suppression test (DST) and the thyrotropin-releasing hormone (TRH)
stimulation test [3, 89]. Donaldson et al. [1] also discovered seasonal variation in DST results
within normal horses. Healthy horses and ponies did not suppress as well in September,
compared with January. Beech et al. [3] also found an association between number of daylight
hours and TRH response test results for diagnosing PPID in a population of 48 horses There
was evidence of higher resting ACTH concentrations and abnormal results in healthy horses
during the late summer months [3]. Season therefore affects resting ACTH concentrations and
other diagnostic tests for PPID, so more research is needed to examine seasonal hormonal
changes in horses.
Alpha-MSH has only recently been implicated as a possible diagnostic hormone for
diagnosing PPID [90]. No difference was seen in the hormone at the two times (1200 and 1600
hours) during the day showing diurnal stability, but a distinct seasonal effect was found in
horses and ponies, with the ponies having a more profound increase in α-MSH in the fall when
compared to the horses. As a diagnostic test for PPID, α-MSH showed no more promise than
ACTH [88].
Cortisol concentrations should not be measured to diagnose PPID because cortisol in
horses has a circadian rhythm, fluctuations can be caused by stress, and the reference range
for resting cortisol concentrations is wide [8, 91]. In some species however, namely the feline,

24
cortisol has no circadian rhythm [92], making it useful to perform diagnostic test at any time of
the day. The circadian rhythm confounds the use of cortisol measurement as an indicator of
PPID in horses, even though horses affected with PPID have a diminished diurnal response to
cortisol [89]. Many studies report normal cortisol concentrations in horses affected with PPID
[10, 89].
1.6 Statement of the problem
Diagnostic testing for PPID relies upon resting hormone and metabolite concentrations,
yet potential confounding factors have not been evaluated across different months of the year.
The purpose of this project was therefore to further evaluate the effects of season and diet on
blood ACTH, insulin, glucose, and leptin concentrations in healthy horses and those affected by
PPID.
25
CHAPTER 2
Association of season and pasture grazing with blood hormone and
metabolite concentrations in horses with presumed pituitary pars
intermedia dysfunction
N. Frank, S. B. Elliott, K. A. Chameroy, F. Tόth, N. S. Chumbler, and R. McClamroch
From the Department of Large Animal Clinical Sciences, College of Veterinary Medicine,
University of Tennessee, Knoxville, TN 37996.
J Vet Intern Med 2010;24;1167-1175
2.1 Abstract
Background: Pituitary pars intermedia dysfunction (PPID) is a risk factor for pasture-associated
laminitis, which follows a seasonal pattern.
Hypothesis: Hormonal responses to season differ between PPID and unaffected horses.
Animals: Seventeen horses aged 8 to 30 years (14 horses ≥ 20 years of age).
Methods: Longitudinal observational study. Blood was collected monthly from August 2007
until July 2008, after pasture grazing and again after overnight stall confinement. Blood
hormone and metabolite concentrations were measured and pasture grass samples were
analyzed to determine carbohydrate content. Analysis of variance analyses for repeated
measures were performed.

26
Results: Mean ACTH concentrations varied significantly over time (P < 0.001) with higher
concentrations detected in August, September, and October, compared with November to April.
Pasture × time effects were detected for glucose and insulin concentrations, with peaks
observed in September. Horses were retrospectively allocated to PPID (n = 8) and control (n =
9) groups on the basis of plasma ACTH concentrations. Changes in insulin concentrations over
time differed in the PPID group, when compared to the control group. Insulin concentrations
were positively correlated with grass carbohydrate composition.
Conclusions and clinical importance: Pituitary pars intermedia dysfunction did not affect the
timing or duration of the seasonal increase in ACTH concentrations, but higher values were
detected in affected horses. Insulin concentrations differed between groups, but
hyperinsulinemia was rarely detected. Glucose and insulin concentrations peaked in September
when horses were grazing on pasture, which could be relevant to the seasonal pattern of
laminitis.
2.2 Introduction
Pituitary pars intermedia dysfunction (PPID), which is also known as Equine Cushing’s
Disease, has been associated with laminitis in horses [79, 93-95], but the mechanisms
responsible for this association have not been fully elucidated. One potential explanation for
this association is that horses with PPID are insulin resistant [96]. Insulin resistance (IR) is an
important predisposing factor for pasture-associated laminitis in ponies, cortisol antagonizes the
action of insulin within tissues [97-98], and some PPID-affected horses have reduced insulin
sensitivity [5, 78]. Hyperinsulinemia is detected in some, but not all, horses and ponies with
PPID and hyperglycemia occurs in a smaller number of animals [99-101].

27
The incidence of pasture-associated laminitis follows a seasonal pattern that might be
relevant to the association between PPID and laminitis. Laminitis develops between March and
May in ponies in Virginia [4, 97], and between September and May in a group of 40 horses that
included 28 animals with suspected PPID [93]. This increase in laminitis incidence in
September is of interest because it coincides with seasonal up-regulation of the hypothalamic-
pituitary-adrenal axis in equids [1, 3, 102]. Plasma concentrations of ACTH and alpha
melanocyte-stimulating hormone are higher in September, and false positive dexamethasone
suppression test results occur more frequently at this time of the year [1, 102].
Seasonal alterations in hormone concentrations warrant further examination because
they appear to coincide with a higher incidence of laminitis in the autumn [93]. Furthermore, it
must be determined whether these seasonal alterations are more profound in horses with PPID,
which could explain the association between this disorder and laminitis. We therefore
hypothesized that hormonal responses to season would differ between PPID and unaffected
horses. It was also hypothesized that changes in pasture grass composition would induce
seasonal alterations in glucose and insulin concentrations and PPID would affect these
responses. Blood hormone and metabolite concentrations and responses to pasture grazing
were therefore examined across a 12-month period.
2.3 Materials and Methods
Animals—Seventeen adult light breed horses (9 mares; 8 geldings) ranging in age from 8 to 30
years (14 horses aged > 20 years) were included in the study. None of the horses included in
this study were receiving medical treatment for PPID.
28
Experimental design—A longitudinal study was performed across a 12-month period
extending from August 2007 until July 2008. Horses from a facility located in Kingston,
Tennessee within the South-eastern region of the United States were included in the study.
Evaluations were performed during the first week of every month and consisted of visits to the
farm on two consecutive days. Blood samples were collected via jugular venipuncture between
0800 and 1000 on both days. On day 1, blood samples were collected from horses after they
were brought in from pasture and housed in stalls. Physical measurements and grass samples
were also obtained on day 1 after all blood samples had been collected. Horses were
subsequently returned to pasture until 1800 to 1900 when they were brought back to their stalls
for the night. Two flakes of hay were given to each horse, but no grain or additional hay was
provided until blood samples had been collected the following morning (day 2). The study
protocol was approved by the University of Tennessee Institutional Animal Care and Use
Committee.
Feeding and management practices – Horses were routinely housed on pasture, except for a
30-minute to 2-hour period between 0700 and 0900 when they were brought into stalls for
feeding. A 12% protein sweet feed or a complete pelleted feed for senior horses was fed in the
morning, with amounts varying according to the individual horse and time of year. Hay was fed
during the winter months. Feed amounts were recorded.
Physical measurements – Body weight was measured by weight tape and the body condition
score was assessed using the 1 to 9 scale described by Henneke et al [103]. Neck
measurements were obtained as previously described [104]. Any abnormalities of the haircoat,
including dullness, longer hair length, and curling of the hair, were recorded at this time. These
observations were subjective and made by different investigators throughout the year.
29
Blood variables – Blood was collected into tubes containing potassium EDTA, sodium heparin,
or no anticoagulant. Tubes were chilled on ice (plasma) and then placed in racks within coolers
containing ice packs or left at ambient temperature to clot for 1 hour (serum) before being
transferred to a cooler for transportation. Plasma and serum were harvested by low-speed
(1,000 × g) centrifugation within 2 hours of collection and then stored at –80 ºC for further
analysis.
Serum insulin concentrations were measured using a radioimmunoassay kit1 previously
validated for equine sera [105] and revalidated by our laboratory within 6 months of samples
being analyzed.
Plasma glucose, triglyceride, and cholesterol concentrations were measured using
colorimetric assays2,3 and an automated discrete analyzer.4 Nonesterified fatty acid (NEFA)
concentrations were measured by using an enzymatic colorimetric test kit3 and microtiter plate
reader.5 For all assays performed on site, measurements were performed in duplicate with all
samples analyzed on the same day, and intra-assay coefficients of variation of <5% were
required for acceptance of results, with the exception of insulin, which had a cut-off value of
10%.
Frozen plasma samples were packaged with ice packs and sent via overnight mail to the
Animal Health Diagnostic Center at Cornell University6 for measurement of plasma ACTH
1 Coat-A-Count insulin radioimmunoassay, Siemens Medical Solutions Diagnostics, Los Angeles, CA 2Glucose, Roche Diagnostic Systems Inc, Somerville, NJ 3 Wako Chemicals USA, Richmond, VA 4 Cobas Mira, Roche Diagnostic Systems Inc, Somerville, NJ 5 ELx800 Microplate Reader, Bio-Tek, Winooski, VT 6 Animal Health Diagnostic Center, Cornell University, Ithaca, NY
30
concentrations. A chemiluminescent ACTH immunoassay7 previously validated [95] for use with
equine plasma was used, with samples analyzed in duplicate. A reference range of 9 to 35
pg/mL was provided by the laboratory.
Pasture grass analysis – Wire exclusion cages were maintained on pastures. One grass
sample was collected from each pasture between 0900 and 1000 on day 1 using electric
shears, with the stems cut approximately 1 cm above the ground. Samples were placed in
plastic bags and then immediately transferred to a cooler that contained ice packs, which
remained closed at all other times. Samples were transported to the laboratory within 2 hours of
collection and stored at – 20 ºC. Carbohydrate analysis was performed by the Dairy One
Forage Laboratory.8 Carbohydrate composition was determined by wet chemistry analysis and
amounts of ethanol-soluble carbohydrates, water-soluble carbohydrates, and starches were
measured. Depending upon the pastures being used at different times, data from 2 to 7
samples were pooled for each month.
Statistical analysis – Normality was assessed by examining plotted results and performing
Shapiro-Wilk tests. Adrenocorticotropin hormone and insulin data required logarithmic
transformation to fit a normal distribution before statistical tests were performed. Geometric
mean values with 95% confidence intervals are displayed for these variables. Mean SD values
are reported for glucose and NEFA concentrations. Mixed-model ANOVA for repeated
measures was performed by use of statistical software9 to determine the effects of time (month),
and subsequently group (PPID versus control), on measured variables. Effects of pasture
7Immulite adrenocorticotropin hormone chemiluminescent assay, Siemens Medical Solutions Diagnostics, Los Angeles, CA 8 Dairy One Forage Laboratory, Ithaca, NY
9 PROC MIXED, SAS, version 9.1, SAS Institute Inc, Cary, NC
31
grazing were also included in the same model for all variables, with the exception of ACTH
because this variable was only measured on day 1. When a significant effect was detected, the
Bonferroni test for multiple comparisons was used to identify significant differences among least
squares means. Effects of sex, initial body weight, and the amount of feed provided were also
examined, but were subsequently removed from the model because they did not affect results.
Pearson correlation coefficients were calculated for mean blood variable concentrations and
mean pasture grass carbohydrate percentages. Significance was defined at a value of P < 0.05.
2.4 Results
All horses remained healthy throughout the study, with the exception of one horse that
required tissue debridement and application of a foot cast because of recurrent sole abscesses.
Glucose, insulin, and lipid data from this horse were excluded from the analysis because
marked hyperinsulinemia was detected, with a peak insulin concentration of 955 μU/mL
observed in April. Another horse suffered from chronic degenerative joint disease of both carpi
and received phenylbutazone intermittently during the study.
Time effects were significant for body weight (P < 0.001), neck circumference (P <
0.001), and BCS (P < 0.001; Table 2.1). Mean body weight (via weight tape) was highest in
December and mean mid-neck circumference was lowest in June. There was no discernable
pattern for BCS.
Plasma ACTH concentrations were significantly (P < 0.001) affected by time, with higher
mean values detected in August, September, and October compared with the November to April
period (Figure 2.1). Effects of pasture grazing on plasma ACTH concentrations were not
assessed because this hormone was measured once each month.

32
Time (P < 0.001), pasture (P < 0.001), and pasture × time (P < 0.001) effects were
significant for glucose concentrations, with a peak in September when horses were grazing on
pasture (Figure 2.2). Insulin concentrations also peaked in September when samples were
collected after grazing and time (P < 0.001), pasture (P < 0.001), and pasture × time (P < 0.001)
effects were significant for this variable (Figure 2.3). A positive correlation (r = 0.22; P = 0.002)
existed between mean ethanol-soluble carbohydrate content of the grass reported on a dry
matter basis and mean insulin concentrations measured in grazing horses. Monthly mean
ethanol-soluble carbohydrate, water-soluble carbohydrate, and starch content (dry matter basis)
within pasture grass ranged from 2.0 to 9.1%, 1.6 to 12.7%, and 1.0 to 2.0% across the 12-
month sampling period. Pasture, time, and pasture × time effects were also significant for
triglyceride and NEFA concentrations, with higher NEFA concentrations detected after stall
confinement. Total cholesterol concentrations were affected by pasture and time, but did not
follow a recognizable seasonal pattern.
Horses were subsequently allocated to PPID (n = 8) and control (n = 9) groups on the
basis of plasma ACTH results. A presumptive diagnosis of PPID was made when plasma
ACTH concentrations exceeded 35 pg/mL on ≥ 3 occasions between December and June. Five
of 8 horses in the PPID group had persistently elevated plasma ACTH concentrations
throughout this 7-month time period. Horses in the PPID group ranged in age from 18
(estimated) to 30 years (median; 28.5 years) compared with 8 to 26 years (median; 21 years)
for the control group. Both groups contained 7 horses that were > 20 years of age. Five mares
and 3 geldings were included in the PPID group and the control group contained 4 mares and 5
geldings. Breeds represented in the PPID group included Arabian (n = 1), Arabian/Quarter
Horse (1), Quarter Horse (2), Saddlebred (1), mixed breed (1), and Thoroughbred (1), whereas
the control group contained Appaloosa (1), Quarter Horse (3), Thoroughbred (4), and
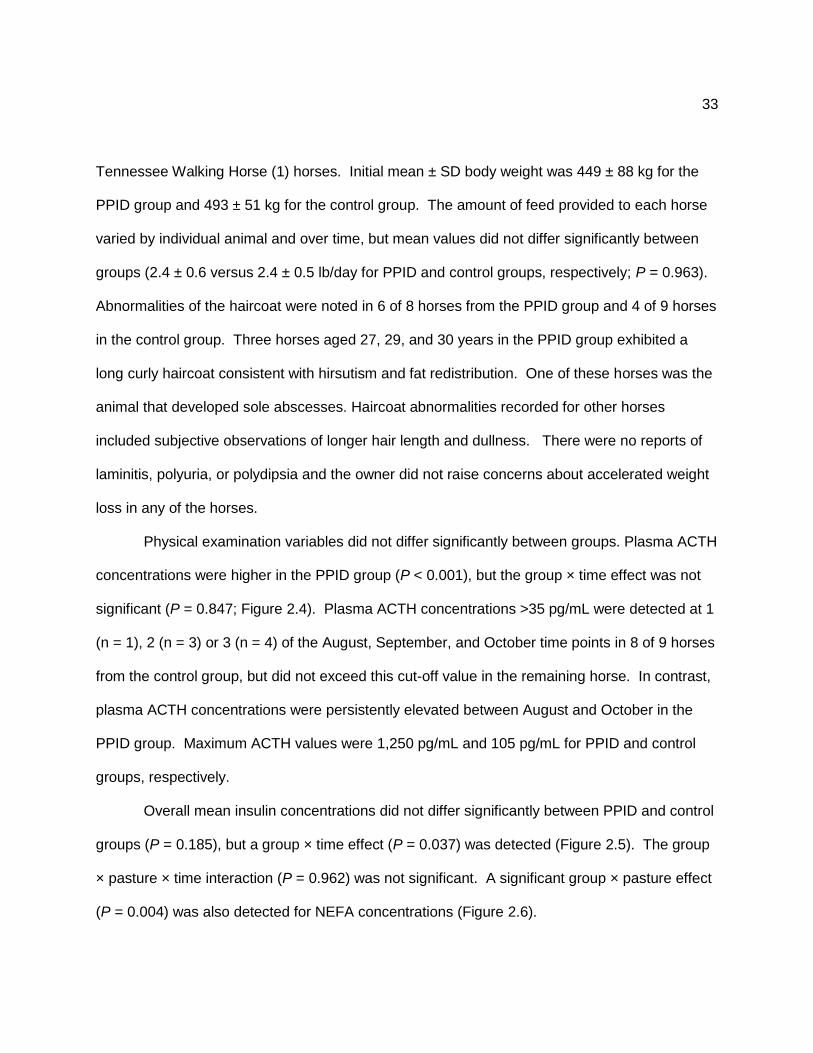
33
Tennessee Walking Horse (1) horses. Initial mean ± SD body weight was 449 ± 88 kg for the
PPID group and 493 ± 51 kg for the control group. The amount of feed provided to each horse
varied by individual animal and over time, but mean values did not differ significantly between
groups (2.4 ± 0.6 versus 2.4 ± 0.5 lb/day for PPID and control groups, respectively; P = 0.963).
Abnormalities of the haircoat were noted in 6 of 8 horses from the PPID group and 4 of 9 horses
in the control group. Three horses aged 27, 29, and 30 years in the PPID group exhibited a
long curly haircoat consistent with hirsutism and fat redistribution. One of these horses was the
animal that developed sole abscesses. Haircoat abnormalities recorded for other horses
included subjective observations of longer hair length and dullness. There were no reports of
laminitis, polyuria, or polydipsia and the owner did not raise concerns about accelerated weight
loss in any of the horses.
Physical examination variables did not differ significantly between groups. Plasma ACTH
concentrations were higher in the PPID group (P < 0.001), but the group × time effect was not
significant (P = 0.847; Figure 2.4). Plasma ACTH concentrations >35 pg/mL were detected at 1
(n = 1), 2 (n = 3) or 3 (n = 4) of the August, September, and October time points in 8 of 9 horses
from the control group, but did not exceed this cut-off value in the remaining horse. In contrast,
plasma ACTH concentrations were persistently elevated between August and October in the
PPID group. Maximum ACTH values were 1,250 pg/mL and 105 pg/mL for PPID and control
groups, respectively.
Overall mean insulin concentrations did not differ significantly between PPID and control
groups (P = 0.185), but a group × time effect (P = 0.037) was detected (Figure 2.5). The group
× pasture × time interaction (P = 0.962) was not significant. A significant group × pasture effect
(P = 0.004) was also detected for NEFA concentrations (Figure 2.6).

34
Table 2.1 Physical examination measurements for 17 horses across a 12-month sampling
period.
Month Mean ± SD (n = 17)
Body Weight
(kg)
BCS
Mid Neck
Circumference [50]
Aug 472 ± 72cd 5.5 ± 1.0bc 90.9 ± 8.7ab
Sept 481 ± 75abcd 6.0 ± 1.5ab 90.7 ± 7.6ab
Oct 488 ± 67ab 6.5 ± 1.5a 92.9 ± 7.6a
Nov 488 ± 60a 5.0 ± 1.5c 90.7 ± 6.7ab
Dec 493 ± 68a 6.5 ± 1.5ab 92.0 ± 8.0ab
Jan 484 ± 72abc 6.0 ± 1.5abc 92.6 ± 8.4ab
Feb 490 ± 68a 6.5 ± 1.5ab 89.4 ± 6.8ab
Mar 480 ± 68abcd 6.0 ± 1.5abc 89.3 ± 6.7b
Apr 480 ± 67abcd 6.0 ± 1.0abc 91.0 ± 6.9ab
May 479 ± 68abc 6.0 ± 1.5abc 90.9 ± 6.6ab
Jun 466 ± 64d 6.0 ± 1.5abc 85.6 ± 7.8c
Jul 472 ± 66bcd 6.0 ± 2.0abc 90.2 ± 7.9ab
Time effect P < 0.001 P < 0.001 P < 0.001
abcdWithin a column, values with different superscripts differ significantly (P < 0.05)
BCS = Body condition score
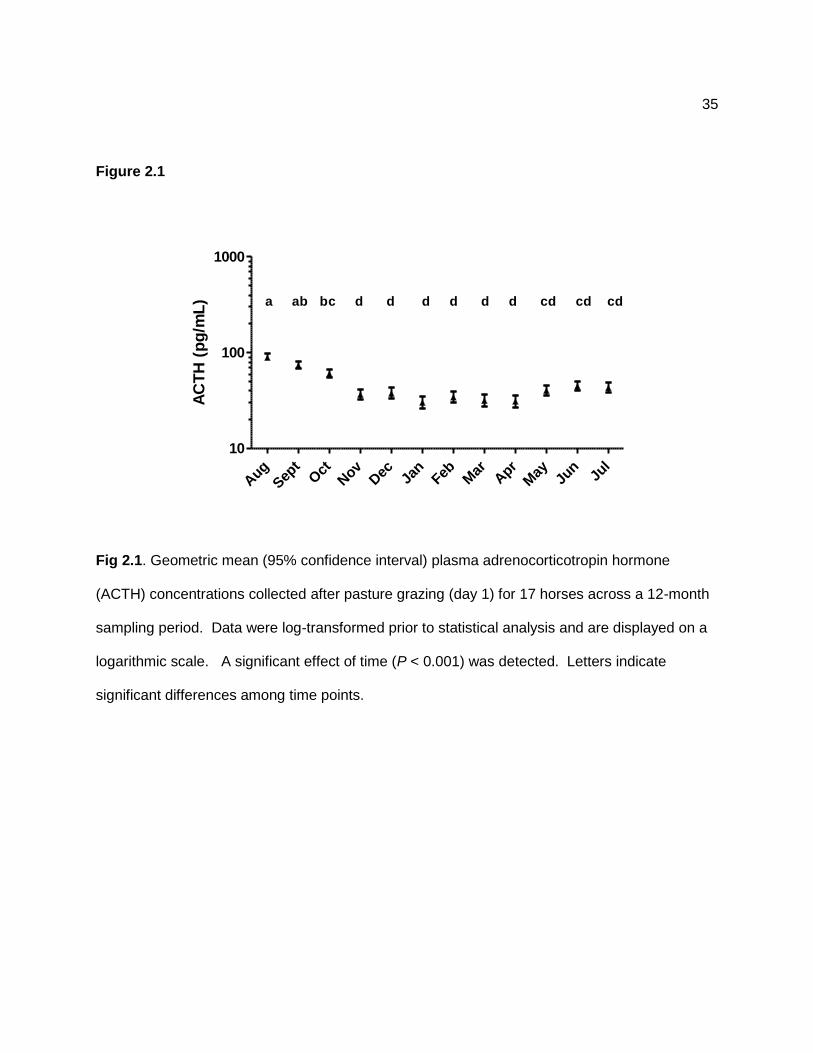
35
Figure 2.1
Aug
Sep
tOct
Nov
Dec Ja
nFeb M
arApr
May Ju
nJu
l10
100
1000
a ab bc d d d d d d cd cd cd
AC
TH
(p
g/m
L)
Fig 2.1. Geometric mean (95% confidence interval) plasma adrenocorticotropin hormone
(ACTH) concentrations collected after pasture grazing (day 1) for 17 horses across a 12-month
sampling period. Data were log-transformed prior to statistical analysis and are displayed on a
logarithmic scale. A significant effect of time (P < 0.001) was detected. Letters indicate
significant differences among time points.
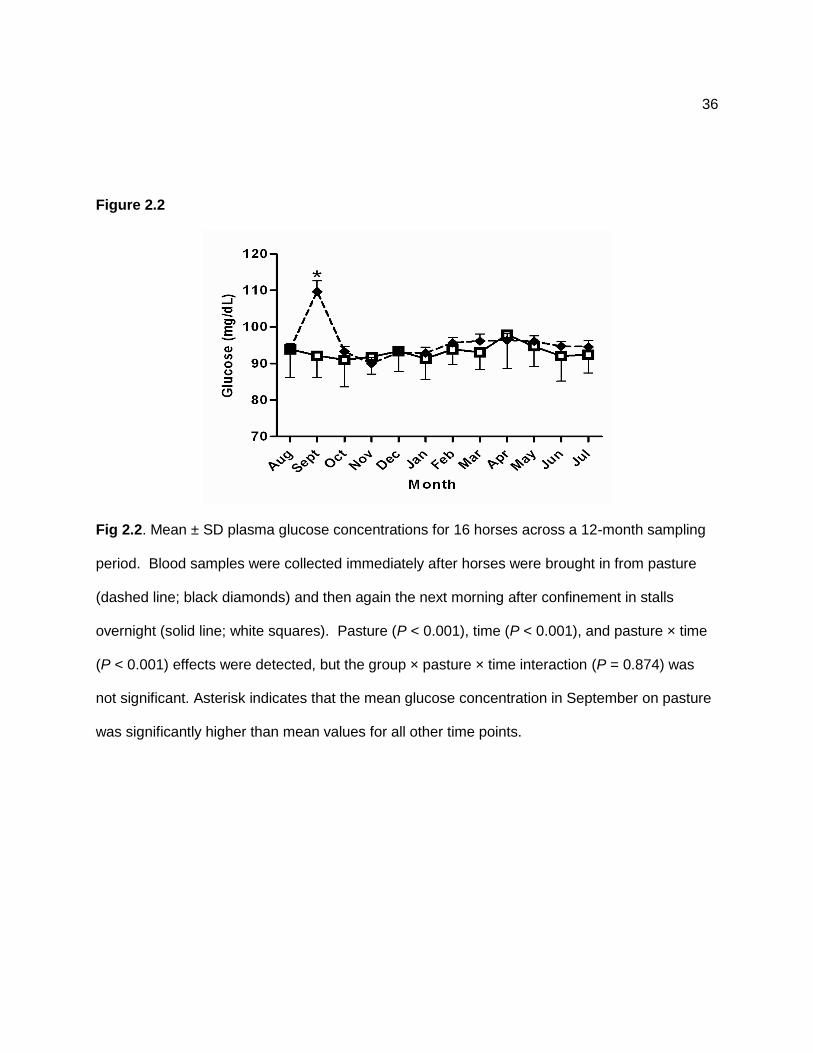
36
Figure 2.2
Fig 2.2. Mean ± SD plasma glucose concentrations for 16 horses across a 12-month sampling
period. Blood samples were collected immediately after horses were brought in from pasture
(dashed line; black diamonds) and then again the next morning after confinement in stalls
overnight (solid line; white squares). Pasture (P < 0.001), time (P < 0.001), and pasture × time
(P < 0.001) effects were detected, but the group × pasture × time interaction (P = 0.874) was
not significant. Asterisk indicates that the mean glucose concentration in September on pasture
was significantly higher than mean values for all other time points.
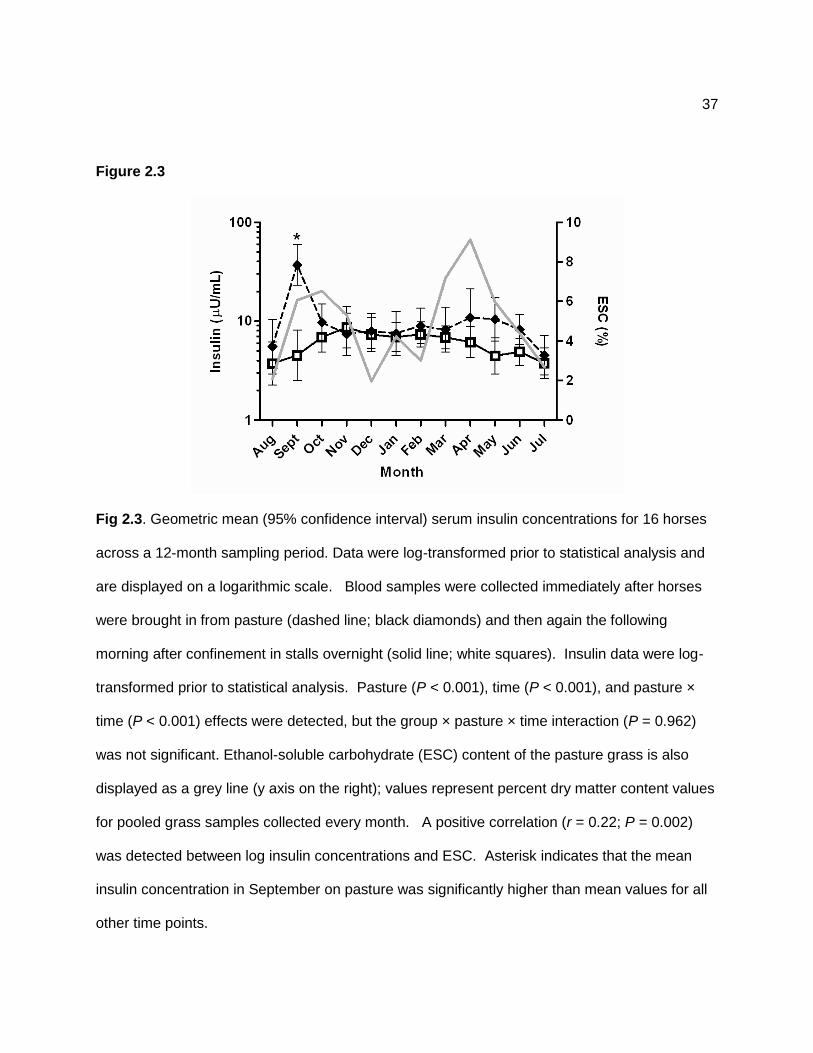
37
Figure 2.3
Fig 2.3. Geometric mean (95% confidence interval) serum insulin concentrations for 16 horses
across a 12-month sampling period. Data were log-transformed prior to statistical analysis and
are displayed on a logarithmic scale. Blood samples were collected immediately after horses
were brought in from pasture (dashed line; black diamonds) and then again the following
morning after confinement in stalls overnight (solid line; white squares). Insulin data were log-
transformed prior to statistical analysis. Pasture (P < 0.001), time (P < 0.001), and pasture ×
time (P < 0.001) effects were detected, but the group × pasture × time interaction (P = 0.962)
was not significant. Ethanol-soluble carbohydrate (ESC) content of the pasture grass is also
displayed as a grey line (y axis on the right); values represent percent dry matter content values
for pooled grass samples collected every month. A positive correlation (r = 0.22; P = 0.002)
was detected between log insulin concentrations and ESC. Asterisk indicates that the mean
insulin concentration in September on pasture was significantly higher than mean values for all
other time points.

38
Figure 2.4
Fig 2.4. Geometric mean (95% confidence interval) plasma adrenocorticotropin hormone
(ACTH) concentrations for 8 horses with presumptive pituitary pars intermedia dysfunction
(PPID group; white circles) and 9 unaffected horses (control group; black triangles) across a 12-
month sampling period. Data were log-transformed prior to statistical analysis and are
displayed on a logarithmic scale. Group (P < 0.001) and time (P < 0.001) effects were detected,
but the group × time interaction (P = 0.847) was not significant. Asterisk indicates a significant
difference between groups at that time point.
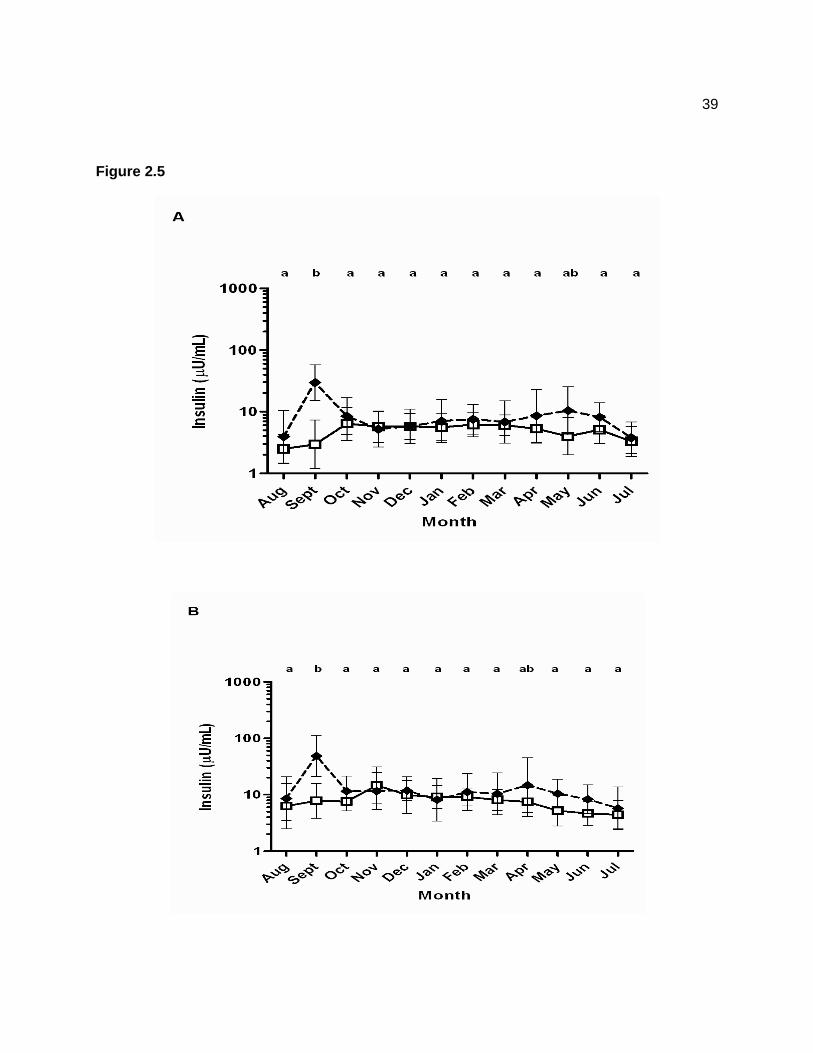
39
Figure 2.5
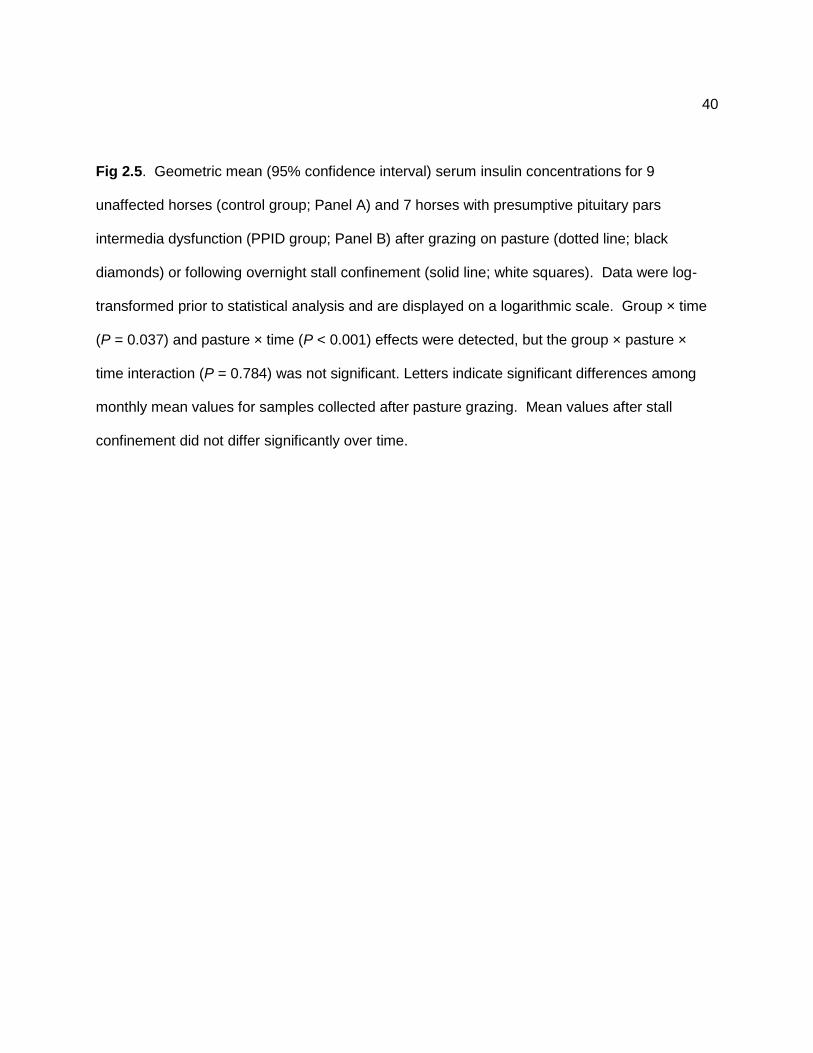
40
Fig 2.5. Geometric mean (95% confidence interval) serum insulin concentrations for 9
unaffected horses (control group; Panel A) and 7 horses with presumptive pituitary pars
intermedia dysfunction (PPID group; Panel B) after grazing on pasture (dotted line; black
diamonds) or following overnight stall confinement (solid line; white squares). Data were log-
transformed prior to statistical analysis and are displayed on a logarithmic scale. Group × time
(P = 0.037) and pasture × time (P < 0.001) effects were detected, but the group × pasture ×
time interaction (P = 0.784) was not significant. Letters indicate significant differences among
monthly mean values for samples collected after pasture grazing. Mean values after stall
confinement did not differ significantly over time.

41
Figure 2.6

42
Fig 2.6. Mean ± SD plasma non-esterified fatty acid (NEFA) concentrations for 9 unaffected
horses (control group; Panel A) and 7 horses with presumptive pituitary pars intermedia
dysfunction (PPID group; Panel B) after grazing on pasture (dotted line; black diamonds) or
following overnight stall confinement (solid line; white squares). Pasture (P < 0.001), time (P <
0.001), pasture × time (P < 0.001), and group × pasture (P = 0.004) effects were detected, but
the group × pasture × time interaction (P = 0.945) was not significant. Asterisk indicates a
significant (P < 0.05) difference between means values for stall confinement and pasture
conditions.
2.5 Discussion
Horses in this study exhibited up-regulation of the hypothalamic-pituitary-adrenal axis in the
late summer and autumn, as evidenced by significantly higher plasma ACTH concentrations.
Horses grazing on pasture had higher glucose and insulin concentrations in September and
insulin concentrations were positively correlated with carbohydrate composition when horses
were grazing on pasture. Pituitary pars intermedia dysfunction did not alter the timing or
duration of this seasonal change in ACTH concentrations, although higher concentrations were
detected in affected animals. Variation in insulin concentrations over time differed between
groups, but hyperinsulinemia was rarely detected when horses were sampled after stall
confinement.
A presumptive diagnosis of PPID was made in this study on the basis of plasma ACTH
concentrations exceeding 35 pg/mL on three or more occasions outside of the late summer and
autumn period. This method was selected because the owner would not permit other diagnostic
43
tests to be performed because of concerns about inducing laminitis. However, three horses in
the PPID group had clinical signs consistent with the disorder, including overt hirsutism and fat
redistribution. Other results from the haircoat examinations must be evaluated within the
context of the methods used because observations were subjective and some signs, such
dullness of the haircoat are nonspecific. Objective criteria for diagnosing haircoat abnormalities
attributable to PPID should be employed in future studies to address this deficiency. Hirsutism
has been used as a gold standard for PPID in one previous study [95], which supports the
allocation of three horses to the PPID group. However, all other horses in the PPID group were
allocated on the basis of ACTH concentrations alone, so results should be interpreted
accordingly.
Horses with presumed PPID did not differ with respect to the timing or duration of the
seasonal alterations in plasma ACTH concentrations, but higher concentrations were detected
in this group, and this was most apparent in August, September, and October. Diagnostic
testing has been avoided during this time period since Donaldson et al [1] published their finding
of elevated ACTH concentrations in September, but warrants re-evaluation in light of our
findings. In the future, it might be possible to test horses in the late summer/autumn season if
season-specific reference ranges for ACTH are established. Three of 8 horses in the PPID
group also had ACTH concentrations that were within reference range on one or more occasion
between December and July, which suggests that test accuracy could be improved by collecting
more than one blood sample throughout the year.
Adrenocorticotropin hormone was measured using a chemiluminescent immunoassay that
has previously been validated for the measurement of ACTH in equine plasma by Perkins et al
[95]. A cut-off value of 35 pg/mL has been adopted in previous studies [1, 3, 93], but upper limits
of 45 pg/mL [106-107], 50 pg/mL [79], or 70 pg/mL [101] have also been used for diagnosis of
44
PPID. A seasonal rise in plasma ACTH concentrations was detected in this study when values
from August, September, and October were compared with those from December to April,
consistent with previous reports [1, 3]. Resting ACTH concentrations were significantly higher in
horses during the autumn, compared with the winter and spring. Results of these previous
studies and the one reported here indicate that horses undergo up-regulation of the
hypothalamic-pituitary-adrenal axis during the late summer and autumn.
Seasonal alterations in ACTH concentrations are likely to be linked to changes in
photoperiod, with the reduction in daylight hours triggering alterations in the hypothalamic-
pituitary-adrenal axis. Melatonin is thought to play an important role in this process because it
has a circadian rhythm of low concentrations during the day followed by higher concentrations
at night, and this pattern changes with season as days get shorter [50, 72]. Horses also gain
body fat in response to decreasing photoperiod length, presumably in preparation for winter
[50]. Seasonal weight gain was observed in this study, although weight tape and neck
circumference measurements may have been confounded by the growth of winter haircoats.
Insulin concentrations differed between groups, but hyperinsulinemia (> 20 µU/mL;
reference range for laboratory) was rarely observed, except in response to pasture grazing.
There was little evidence of reduced insulin sensitivity in this study, but insulin concentrations
are affected by alterations in pancreatic output as well as tissue insulin sensitivity, so this
situation requires further investigation. Insulin and glucose data from one mare were excluded
from statistical analyses because of severe lameness and marked hyperinsulinemia.
Interestingly, this mare had a history of obesity, regional adiposity, and laminitis before losing
weight and developing hirsutism in recent years. This suggests that she suffered from equine
metabolic syndrome [108] prior to the development of PPID, and therefore makes it difficult to
determine the cause of hyperinsulinemia in this animal. Results of this study differ from those of
45
previous reports because PPID has previously been associated with hyperinsulinemia [78, 99,
101, 107]. It should be noted, however, that only horses were examined in the study reported
here, whereas PPID groups contained ponies in the previous studies. Blood samples were also
collected under fed conditions in the aforementioned studies. These points could be relevant
because ponies have lower insulin sensitivity when compared with horses [67, 109], and results
of this study indicate that insulin concentrations are affected by feeding conditions.
Higher glucose and insulin concentrations were detected in horses after pasture grazing
and were affected by changes in season, with peaks detected in September. Insulin
concentrations also increased again in April, but this peak was not statistically significant. A
weak correlation existed between mean insulin concentrations and mean ethanol-soluble
content of the pasture grass when post-grazing results were examined. Ethanol-soluble
carbohydrates include simple sugars [110], so higher glucose and insulin concentrations
appeared to correspond with increases in sugar intake on pasture. The ethanol-soluble
carbohydrate content of the pasture grass may also reflect its growth, so these may have been
times of the year when the grass was more abundant because of increased rainfall and sunlight
[111]. Unfortunately, grass intake could not be measured in this study.
There were several statistically significant alterations in blood lipid variables, but only
NEFA concentrations followed a recognizable pattern. Higher NEFA concentrations were
detected when blood samples were collected on day 2 after horses experienced a period of
fasting. This is a normal physiological response to reduced feed intake because negative
energy balance stimulates hormone-sensitive lipase and stored triglycerides are hydrolyzed to
yield glycerol and fatty acids, which are used for energy [112-113]. A significant group ×
pasture effect was also detected for this variable, with stall confinement having a greater effect
on NEFA concentrations in control horses. The lower response detected in the PPID group was

46
unexpected because hyperadrenocorticism and IR would be expected to increase hormone-
sensitive lipase activity [114]. One explanation for this finding may be that PPID-affected horses
remain calmer when deprived of feed, although no differences in demeanor were recognized in
this study.
Retrospective studies provide evidence of an association between PPID and laminitis in
horses and ponies [79, 93-95], with one report demonstrating that laminitis occurred more
commonly in September and May [93]. Laminitis was not detected in the study reported here,
but glucose and insulin concentrations peaked in September when plasma ACTH
concentrations were elevated. Although not statistically significant, a second insulin peak was
also observed in the spring when a higher incidence of pasture-associated laminitis has been
reported in ponies [4, 97]. Interestingly, the insulin peak detected in September was higher than
the one observed in April, despite similar increases in pasture grass ESC content. This
suggests that up-regulation of the hypothalamic-pituitary-adrenal axis accentuated the
insulinemic response, although further research is required to examine this relationship.
Differences in total grass intake might also explain this discrepancy.
In conclusion, our hypothesis that horses with PPID would respond differently to
changes in season was partially supported because changes in insulin concentrations over time
were more pronounced in affected horses. However, seasonal changes in ACTH
concentrations did not differ significantly in timing or duration between groups. Further studies
are required to establish season-specific reference ranges for ACTH and determine whether the
magnitude of the seasonal increase in hormone concentrations can serve as a diagnostic test
for PPID in horses. Our results also demonstrate that pasture grazing raises glucose and
insulin concentrations at specific times of the year in horses. Glucose and insulin

47
concentrations peaked in September at the same time that ACTH concentrations were elevated,
and this convergence of risk factors may be relevant to the development of laminitis.

48
CHAPTER 3
Effects of season on adrenocorticotropin hormone (ACTH)
concentrations in horses with pituitary pars intermedia dysfunction
(PPID) from 15 different farms in East Tennessee.
Sarah Beth Elliott, Nicholas Frank, Robin McClamroch, Kelly Ann Chameroy, Ferenc Toth, and
Eric Etheridge
From the Department of Large Animal Clinical Sciences, College of Veterinary Medicine,
University of Tennessee, Knoxville, TN 37996.
3.1 Abstract
Background: We have previously reported a seasonal increase in adrenocorticotropin hormone
(ACTH) concentrations in horses from a single farm in Tennessee, with significantly higher
concentrations detected in September and October. Since all of the horses included in our
previous study were from the same farm, this study was undertaken to determine whether
seasonal alterations in ACTH concentrations occur in horses from different farms in the area.
Hypothesis: Horses from different locations, with varying diets and husbandry practices, will
show the same seasonal changes in hormone concentrations.
Animals: Eighteen horses median aged 19.8 (8-45 years) from 15 different farms
Methods: Longitudinal prospective study. Blood was collected monthly from August 2007 until
July 2008. Blood hormone and metabolite concentrations were measured. Analysis of variance
analysis for repeated measures was performed.
49
Results: Horses ranging in age from 8 to 45 years (median; 19.8 years) were retrospectively
allocated to PPID (n=12) and healthy (n=6) groups based upon ACTH concentrations measured
in the spring. Plasma ACTH concentrations were significantly affected by season (time effect;
P< 0.001), with a significantly higher mean ± SD concentration (155.5 ± 292.6 pg/mL) detected
in August, compared with all other months. There was no effect of season on glucose or insulin
concentrations.
Conclusions and clinical importance: Plasma ACTH concentrations were significantly higher in
August in healthy aged horses and those with PPID. Disease status did not affect the timing or
magnitude of the seasonal peak in ACTH, suggesting that this function is not affected by PPID.
Differences among farms with respect to husbandry did not affect seasonal ACTH responses.
3.2 Introduction
Pituitary pars intermedia dysfunction (PPID) is a common disorder in older horses and
ponies [68]. This endocrine disorder is thought to develop when there is a loss of dopaminergic
inhibition, which leads to an increased rate of melanotrope proliferation [115]. Without
dopamine inhibition, more pro-opiomelanocortin (POMC)-derived peptides are synthesized and
released and this leads to the development of clinical signs. These peptides include α-
melanocyte stimulating hormone (α-MSH), β-endorphin, corticotrophin-like intermediate lobe
peptide (CLIP), and adrenocorticotropic hormone (ACTH) [14]. Clinical signs of PPID include
hirsutism, muscle wasting, abnormal fat distribution, glucose intolerance, lethargy, infertility,
polydipsia and polyuria [116]. Horses with PPID can also suffer from insulin resistance (IR)
[96].

50
Laminitis is a systemic disease that manifest in the foot [117]. According to USDA
surveys, laminitis is the second most common cause for a horse or pony to be presented for
veterinary care, second only to colic [118]. Horses and ponies with PPID show a greater
susceptibility to laminitis and may be at greater risk for developing laminitis if they currently
suffer from insulin resistance (IR) [75, 93]. Treiber et al. [97] found that insulin-resistant ponies
developed clinical laminitis in the spring after grazing on pasture, and IR predicted the
occurrence of laminitis when the same herd was reexamined by Carter et al. [4] two years later.
Donaldson et al. [93] reported that laminitis was more common in September and May which
suggests that season influences disease susceptibility.
The study of seasonal alterations in blood hormone and metabolite concentrations is
important because this knowledge will improve our understanding of equine physiology. It is
also important because testing for PPID is currently confusing with normal horses having
elevated ACTH concentrations in the autumn months [1].
This study is a continuation of an earlier study in which we discovered that PPID did not
affect the timing or duration of the seasonal increase in ACTH concentrations, but higher values
were detected in affected horses. These horses were all located on one farm in Kingston,
Tennessee.
The purpose of this study is to test the hypothesis that horses from different locations,
with varying diets and husbandry practices, will show the same seasonal changes in hormone
concentrations.

51
3.3 Materials and Methods
Animals—Eighteen adult horses (7 mares; 11 geldings) from fifteen different farms located in
East Tennessee were included in the study. Ages ranged from 8 to 45 years.
Experimental design—A prospective longitudinal study was performed across a 12-month
period beginning in August 2007 to July 2008. Horses were located on fifteen different farms
located in East Tennessee. Horses with previous histories of PPID were included, along with
control animals from the same farm, where available. Evaluations were performed the first
week of each month. Blood samples were collected via jugular venipuncture between 0800 and
1100 for all horses. Horses were brought in from pasture on the morning of each blood
sampling, with the feeding of concentrates delayed until after the sampling. Physical
measurements were also obtained after blood samples had been collected. The study protocol
was approved by the University of Tennessee Institutional Animal Care and Use Committee.
Feeding and management practices—Horses were managed differently among the fifteen
farms. Most horses had variations of pasture turnout during cooler times and stall confinement
during warmer times of the day or night. All horses received some amount of concentrate
during the day. Amounts of exercise also varied among farms. Therapies varied among farms.
Briefly, 10 of 18 horses were on levothyroxine treatment, 4 were on Pergolide®, and 2 were on
Smartpak™ therapy. Two of the 18 horses wore grazing muzzles when out on pasture, and 1
horse was kept in a dry lot with very limited access to pasture.
Physical measurements—Body weight was measured by weight tape and body condition
score assessed using the 1 to 9 scale described by Henneke et al [103]. Neck measurements
were taken with the horse being restrained so that the head and neck were in a normal upright
position. The distance from the poll to the cranial aspect of the withers was measured. Neck
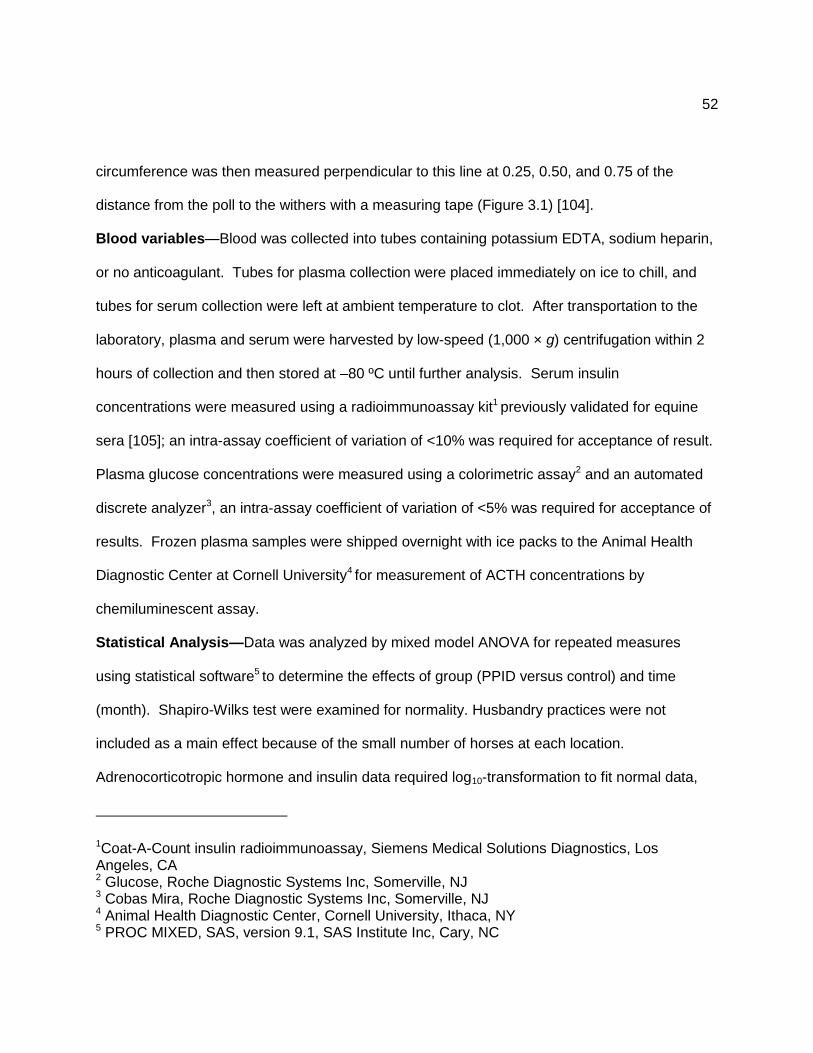
52
circumference was then measured perpendicular to this line at 0.25, 0.50, and 0.75 of the
distance from the poll to the withers with a measuring tape (Figure 3.1) [104].
Blood variables—Blood was collected into tubes containing potassium EDTA, sodium heparin,
or no anticoagulant. Tubes for plasma collection were placed immediately on ice to chill, and
tubes for serum collection were left at ambient temperature to clot. After transportation to the
laboratory, plasma and serum were harvested by low-speed (1,000 × g) centrifugation within 2
hours of collection and then stored at –80 ºC until further analysis. Serum insulin
concentrations were measured using a radioimmunoassay kit1 previously validated for equine
sera [105]; an intra-assay coefficient of variation of <10% was required for acceptance of result.
Plasma glucose concentrations were measured using a colorimetric assay2 and an automated
discrete analyzer3, an intra-assay coefficient of variation of <5% was required for acceptance of
results. Frozen plasma samples were shipped overnight with ice packs to the Animal Health
Diagnostic Center at Cornell University4 for measurement of ACTH concentrations by
chemiluminescent assay.
Statistical Analysis—Data was analyzed by mixed model ANOVA for repeated measures
using statistical software5 to determine the effects of group (PPID versus control) and time
(month). Shapiro-Wilks test were examined for normality. Husbandry practices were not
included as a main effect because of the small number of horses at each location.
Adrenocorticotropic hormone and insulin data required log10-transformation to fit normal data,
1Coat-A-Count insulin radioimmunoassay, Siemens Medical Solutions Diagnostics, Los Angeles, CA 2 Glucose, Roche Diagnostic Systems Inc, Somerville, NJ 3 Cobas Mira, Roche Diagnostic Systems Inc, Somerville, NJ 4 Animal Health Diagnostic Center, Cornell University, Ithaca, NY 5 PROC MIXED, SAS, version 9.1, SAS Institute Inc, Cary, NC
53
and mean ± SD values for untransformed data are reported. The Bonferroni test for multiple
comparisons was used to compare least squares means if the model was significant.
Significance was defined at a value of P < 0.05.
3.4 Results
Horses were retrospectively allocated to PPID (n=12) and control (n=6) groups on the
basis of ACTH concentrations measured in the spring. Of the 12 horses included in the PPID
group, 4 did not have normal ACTH concentrations (<35 pg/mL) throughout the study, 1 had
normal ACTH concentrations on one occasion, 2 had normal ACTH concentrations on 3
occasions, 2 had normal ACTH concentrations on 5 occasions, 2 had normal ACTH
concentrations on 6 occasions, and one horse had normal ACTH concentrations on 7
occasions. Horses in the PPID group ranged in age from 9 to 45 years (median=21 years), and
horses in the control group ranged in age from 8 to 27 (median=17.5 years). The PPID group
contained 4 mares and 8 geldings and the control group contained 3 mares and 3 geldings.
Breeds represented in the PPID group included Arabian (n=6), Morgan (2), Quarter Horse (1),
Tennessee Walking Horse (1), Arabian/Appaloosa (1), and mixed breed (1). Breeds
represented in the control group included Thoroughbred (n=2), Tennessee Walking Horse/Paso
Fino (1), Pony (1), Tennessee Walking Horse (1), and Percheron/Quarter Horse (1). Average
initial body weights for each group (mean ± SD) were PPID (442 ± 75 kg) and control (483 ± 41
kg). There was no effect of group on body weight (P = 0.240). A time effect (P = 0.013) was
detected for body weight with horses weighing the most in November (weight ± SEM , 467 ± 17
kg) and the least in June (444 ± 14 kg). None of the other physical measurements changed
significantly over time.

54
Most horses had access to pasture throughout the study. One horse in the PPID group
developed laminitis during the month of March and remained on stall confinement for the
duration of the study. There were no other health problems reported across the 12-month
period.
Effects of group (P = 0.020) and time (P < 0.001) were significant for plasma ACTH
concentrations, but PPID did not alter the timing or magnitude of these changes (group × time;
P = 0.497). Horses in the control group had mean plasma ACTH concentrations that exceeded
35 pg/mL in July, August, and September (Figure 3.2). Each control horse had a plasma ACTH
concentration >35 pg/mL detected on at least one occasion in July, August, September, or
October. Ten of eleven PPID horses had plasma ACTH concentrations >35 pg/mL detected
August, September, and November. Ten of twelve PPID horses had plasma ACTH
concentrations >35 pg/mL in December. A 12th horse was added to the study in December. In
January, 11 of 12 PPID horses still remained over the limit for normal ACTH values. Maximum
ACTH values reached were 1,250 pg/mL (upper limit of detection) and 89.6 pg/mL for PPID and
control groups, respectively. Effects of group (P = 0.907) and time (P = 0.874) were not
significant for serum insulin concentrations.
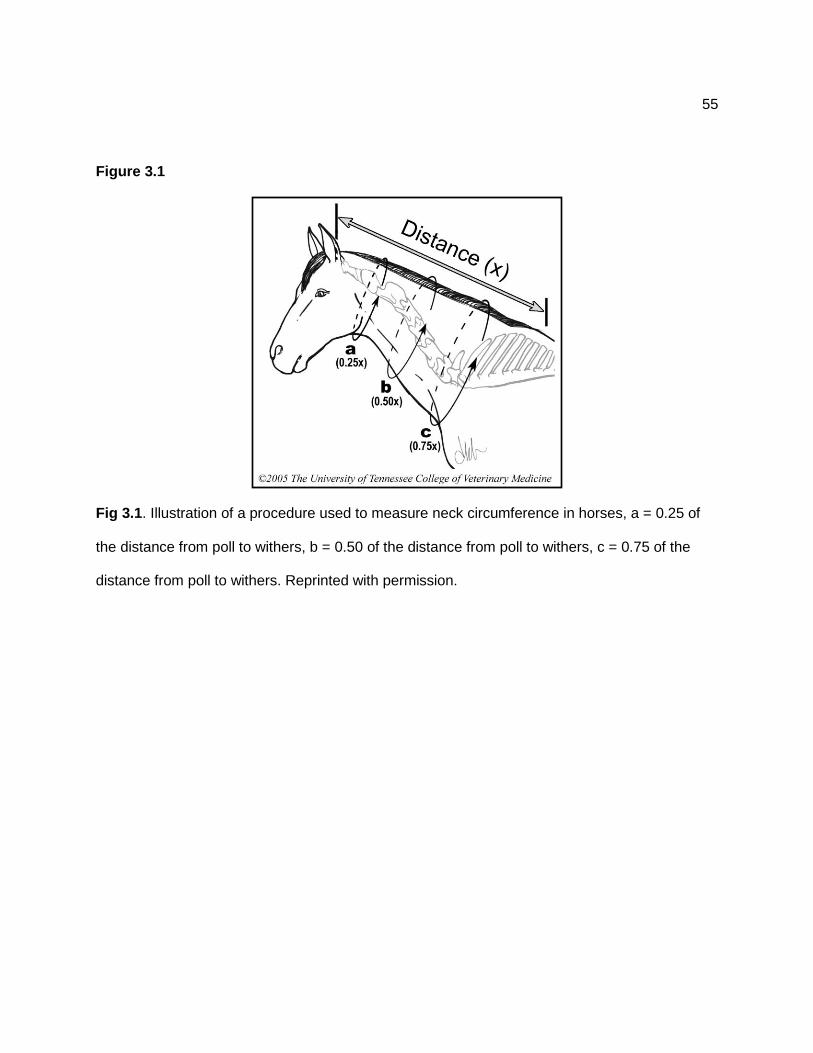
55
Figure 3.1
Fig 3.1. Illustration of a procedure used to measure neck circumference in horses, a = 0.25 of
the distance from poll to withers, b = 0.50 of the distance from poll to withers, c = 0.75 of the
distance from poll to withers. Reprinted with permission.
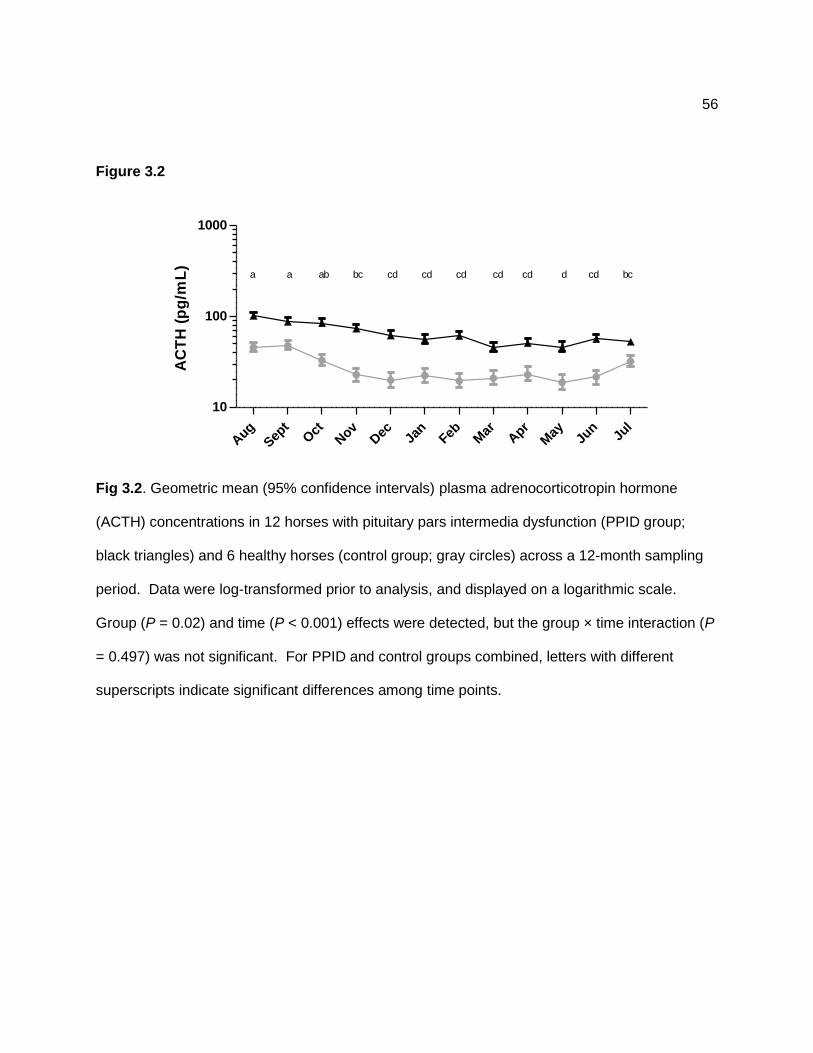
56
Figure 3.2
Aug
Sept
Oct
Nov
Dec Ja
nFeb M
arApr
May Ju
nJu
l
10
100
1000
a a ab bc cd cd cd cd cd d cd bc
AC
TH
(p
g/m
L)
Fig 3.2. Geometric mean (95% confidence intervals) plasma adrenocorticotropin hormone
(ACTH) concentrations in 12 horses with pituitary pars intermedia dysfunction (PPID group;
black triangles) and 6 healthy horses (control group; gray circles) across a 12-month sampling
period. Data were log-transformed prior to analysis, and displayed on a logarithmic scale.
Group (P = 0.02) and time (P < 0.001) effects were detected, but the group × time interaction (P
= 0.497) was not significant. For PPID and control groups combined, letters with different
superscripts indicate significant differences among time points.

57
3.5 Discussion
Results of this study support our previous findings that ACTH concentrations increase in
the late summer in both healthy and PPID affected horses. We also demonstrated that this
response occurs independently of location or husbandry practices.
Results of this study indicate that false positives results will be obtained if plasma ACTH
concentrations are measured in August to diagnose PPID. Beech et al. have investigated the
possibility of using α-MSH concentrations as an alternative test for PPID [88], but this hormone
has the same seasonal fluctuations as ACTH. It has been proposed that the seasonal increase
in ACTH and α-MSH results from the loss of hypothalamic dopaminergic inhibitory control [11].
Dopamine production is lower in horses with PPID, and this is the reason for increased ACTH
concentrations [119]. However, seasonal alterations in ACTH concentrations were still
observed in horses with PPID, suggesting dopamine is not the principal hormone regulating this
response [88].
Leptin is an adipokine that plays a major role in the negative control of feeding [38]. It
acts on both the pars distalis and the pars intermedia to regulate corticotrophin-releasing
hormone and ACTH secretion [38]. Adrenocorticotropic hormone, α-MSH, and β-MSH inhibit
food intake when administered to the brain in rodents [14]. In humans, a defect in N-terminal
acetylation of desacetyl-α-MSH could contribute to the development of obesity. This acetylation
reaction is regulated by leptin and dopamine, two hormones involved in energy homeostasis
[14]. Seasonal changes in leptin have been reported in many species [38, 43-44], with leptin
resistance occurring in the autumn. Leptin resistance results from a reduction in the density or
activity of leptin receptors within the hypothalamus [45] and may explain why horses gain weight
in the late summer and autumn. Higher ACTH concentrations in August might therefore be the
result of leptin resistance.
58
Insulin concentrations were not affected by season in this study. This finding is
consistent with other seasonal studies [2, 88], but differs from results of our previous study, in
which we detected higher fed insulin concentrations in the spring and fall. The most likely
possibility for this discrepancy is differences in owner care of each horse. Ten of the horses in
this study were on levothyroxine supplements. Treatment with levothyroxine has been shown to
increase insulin sensitivity [120], possibly explaining why we detected no effect of season on
insulin concentrations in this study. Some of the horses in this study wore grazing muzzles or
were kept on a dry lot; limited access to pasture grass would affect changes in insulin
concentrations. In our previous study, none of the horses were on therapies so insulin
concentrations were not being controlled.
In conclusion, this study confirms that healthy and PPID affected horses’ exhibit
seasonal changes in ACTH concentrations regardless of location, diet, or husbandry practices.
Further studies are required to determine whether leptin resistance plays a role in this process.
When testing for PPID, many considerations need to be taken, blood samples should be
collected outside of the July to October period, or season-specific reference ranges should be
established. Results of this study suggest that the reference range for ACTH should be
widened to 100pg/mL in the late summer and autumn.
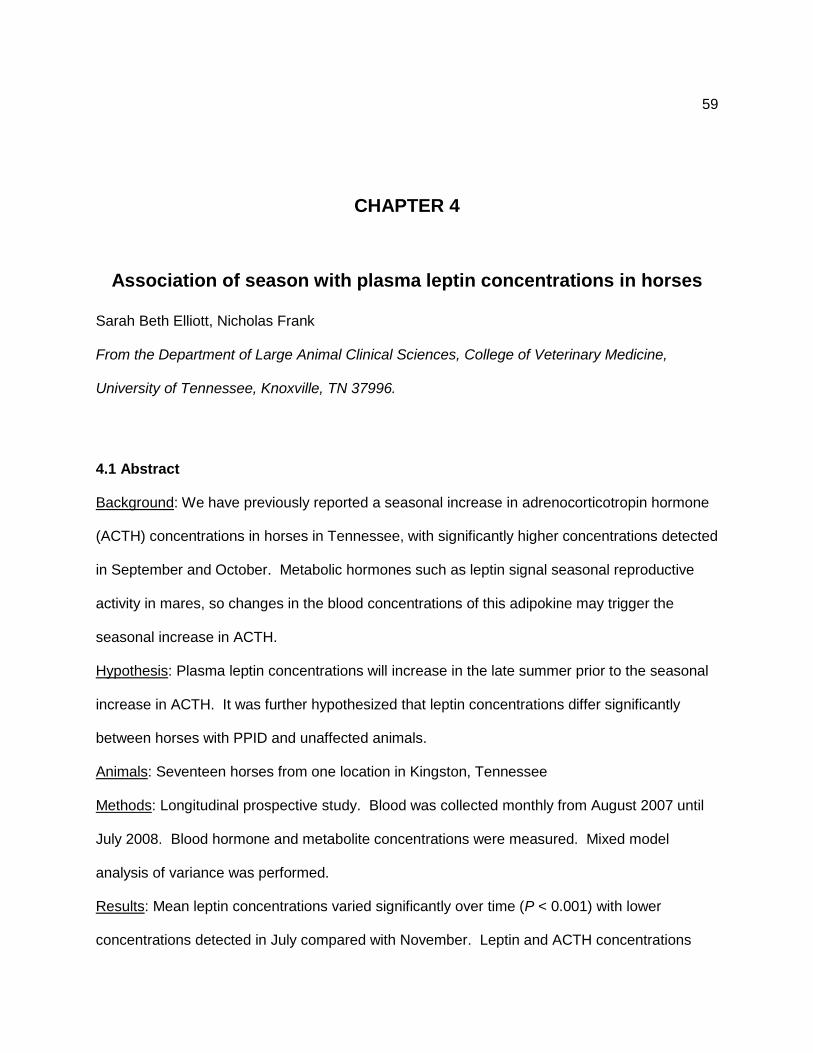
59
CHAPTER 4
Association of season with plasma leptin concentrations in horses
Sarah Beth Elliott, Nicholas Frank
From the Department of Large Animal Clinical Sciences, College of Veterinary Medicine,
University of Tennessee, Knoxville, TN 37996.
4.1 Abstract
Background: We have previously reported a seasonal increase in adrenocorticotropin hormone
(ACTH) concentrations in horses in Tennessee, with significantly higher concentrations detected
in September and October. Metabolic hormones such as leptin signal seasonal reproductive
activity in mares, so changes in the blood concentrations of this adipokine may trigger the
seasonal increase in ACTH.
Hypothesis: Plasma leptin concentrations will increase in the late summer prior to the seasonal
increase in ACTH. It was further hypothesized that leptin concentrations differ significantly
between horses with PPID and unaffected animals.
Animals: Seventeen horses from one location in Kingston, Tennessee
Methods: Longitudinal prospective study. Blood was collected monthly from August 2007 until
July 2008. Blood hormone and metabolite concentrations were measured. Mixed model
analysis of variance was performed.
Results: Mean leptin concentrations varied significantly over time (P < 0.001) with lower
concentrations detected in July compared with November. Leptin and ACTH concentrations

60
followed an opposite seasonal pattern. Leptin and insulin concentrations were positively
correlated. Horses were retrospectively allocated to PPID (n = 8) and control (n = 9) groups on
the basis of plasma ACTH concentrations, and group x time effects were not significant.
Conclusions and clinical importance: Leptin concentrations peaked after the seasonal increase
in plasma ACTH concentrations, so our hypothesis was not supported. There was also no effect
of PPID on leptin concentrations. Results suggest that ACTH suppresses leptin concentrations
in horses, but further studies are required to determine cause-and-effect relationships.
4.2 Introduction
Leptin is an adipokine released by adipocytes [74] that acts with dopamine to regulate
energy homeostasis via the acetylation of desacetyl-alpha melanocyte stimulating hormone to
active alpha melanocyte-stimulating hormone (α-MSH) within the pituitary [14]. Endogenous α-
MSH is critical for maintaining body weight in mice [14]. Leptin and α-MSH are anorexigenic
hormones that act at the hypothalamic level to reduce appetite [121]. In many animals,
including horses, body fat mass is positively correlated with circulating leptin concentrations [33,
46, 50, 122].
Leptin also signals reproductive cues in many species that follow seasonal breeding
cycle [47, 50]. It has also been noted that higher concentrations of leptin are associated with
continued reproductive activity throughout the winter in aged mares [50]. Leptin receptors are
found within the hypothalamus, pituitary and pineal gland in cattle [123] and this suggests that
leptin and melatonin coordinate appetite regulation and reproduction across different seasons.
Studies of seasonal breeding mammals have shown that leptin concentrations increase
with long photoperiods and decrease with short photoperiods [47, 50, 124]. It has also been
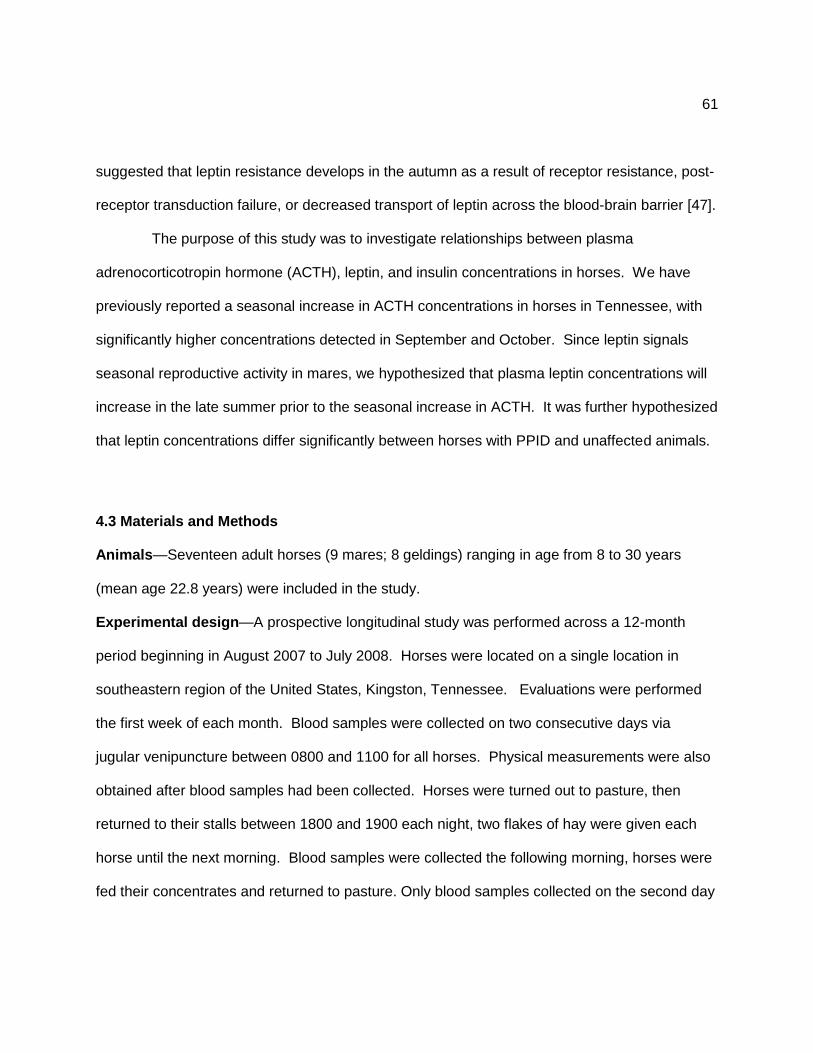
61
suggested that leptin resistance develops in the autumn as a result of receptor resistance, post-
receptor transduction failure, or decreased transport of leptin across the blood-brain barrier [47].
The purpose of this study was to investigate relationships between plasma
adrenocorticotropin hormone (ACTH), leptin, and insulin concentrations in horses. We have
previously reported a seasonal increase in ACTH concentrations in horses in Tennessee, with
significantly higher concentrations detected in September and October. Since leptin signals
seasonal reproductive activity in mares, we hypothesized that plasma leptin concentrations will
increase in the late summer prior to the seasonal increase in ACTH. It was further hypothesized
that leptin concentrations differ significantly between horses with PPID and unaffected animals.
4.3 Materials and Methods
Animals—Seventeen adult horses (9 mares; 8 geldings) ranging in age from 8 to 30 years
(mean age 22.8 years) were included in the study.
Experimental design—A prospective longitudinal study was performed across a 12-month
period beginning in August 2007 to July 2008. Horses were located on a single location in
southeastern region of the United States, Kingston, Tennessee. Evaluations were performed
the first week of each month. Blood samples were collected on two consecutive days via
jugular venipuncture between 0800 and 1100 for all horses. Physical measurements were also
obtained after blood samples had been collected. Horses were turned out to pasture, then
returned to their stalls between 1800 and 1900 each night, two flakes of hay were given each
horse until the next morning. Blood samples were collected the following morning, horses were
fed their concentrates and returned to pasture. Only blood samples collected on the second day
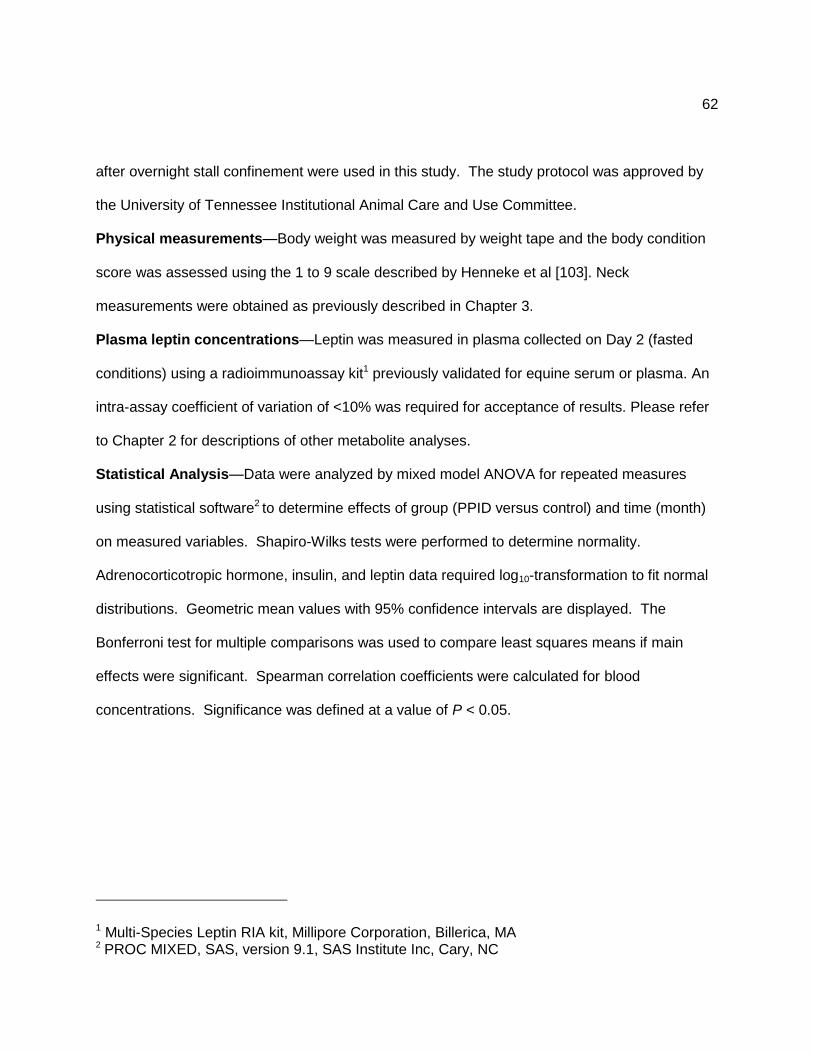
62
after overnight stall confinement were used in this study. The study protocol was approved by
the University of Tennessee Institutional Animal Care and Use Committee.
Physical measurements—Body weight was measured by weight tape and the body condition
score was assessed using the 1 to 9 scale described by Henneke et al [103]. Neck
measurements were obtained as previously described in Chapter 3.
Plasma leptin concentrations—Leptin was measured in plasma collected on Day 2 (fasted
conditions) using a radioimmunoassay kit1 previously validated for equine serum or plasma. An
intra-assay coefficient of variation of <10% was required for acceptance of results. Please refer
to Chapter 2 for descriptions of other metabolite analyses.
Statistical Analysis—Data were analyzed by mixed model ANOVA for repeated measures
using statistical software2 to determine effects of group (PPID versus control) and time (month)
on measured variables. Shapiro-Wilks tests were performed to determine normality.
Adrenocorticotropic hormone, insulin, and leptin data required log10-transformation to fit normal
distributions. Geometric mean values with 95% confidence intervals are displayed. The
Bonferroni test for multiple comparisons was used to compare least squares means if main
effects were significant. Spearman correlation coefficients were calculated for blood
concentrations. Significance was defined at a value of P < 0.05.
1 Multi-Species Leptin RIA kit, Millipore Corporation, Billerica, MA 2 PROC MIXED, SAS, version 9.1, SAS Institute Inc, Cary, NC
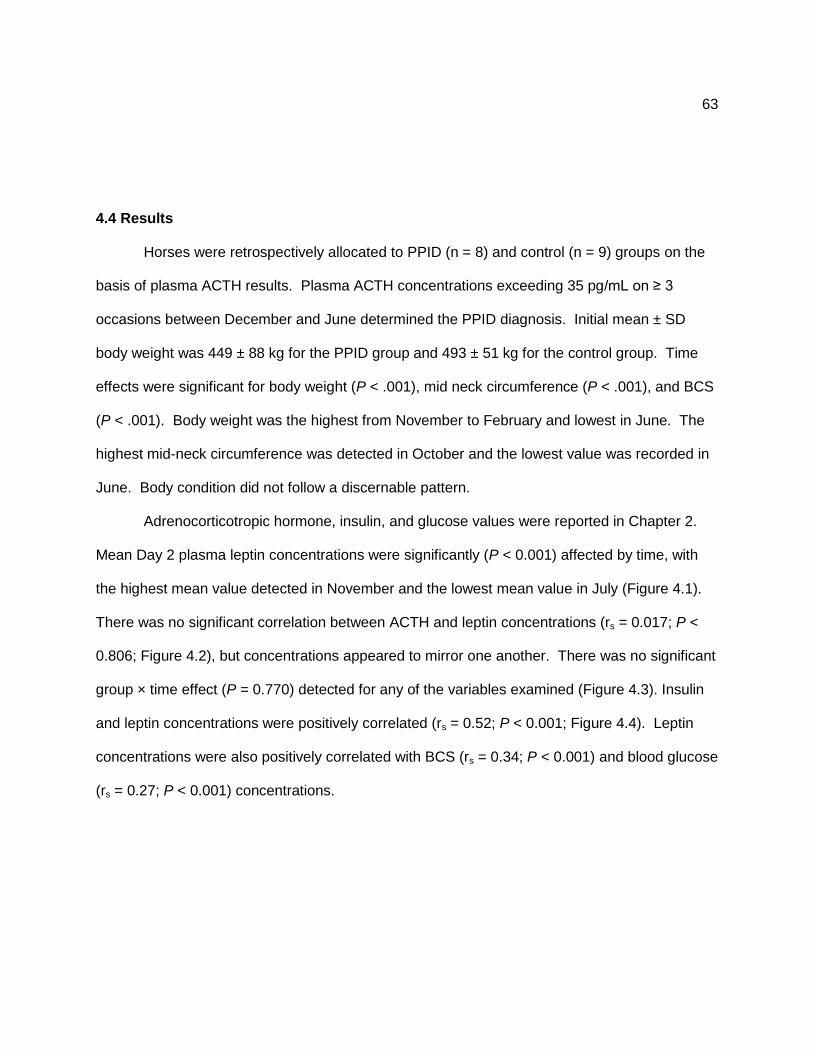
63
4.4 Results
Horses were retrospectively allocated to PPID (n = 8) and control (n = 9) groups on the
basis of plasma ACTH results. Plasma ACTH concentrations exceeding 35 pg/mL on ≥ 3
occasions between December and June determined the PPID diagnosis. Initial mean ± SD
body weight was 449 ± 88 kg for the PPID group and 493 ± 51 kg for the control group. Time
effects were significant for body weight (P < .001), mid neck circumference (P < .001), and BCS
(P < .001). Body weight was the highest from November to February and lowest in June. The
highest mid-neck circumference was detected in October and the lowest value was recorded in
June. Body condition did not follow a discernable pattern.
Adrenocorticotropic hormone, insulin, and glucose values were reported in Chapter 2.
Mean Day 2 plasma leptin concentrations were significantly (P < 0.001) affected by time, with
the highest mean value detected in November and the lowest mean value in July (Figure 4.1).
There was no significant correlation between ACTH and leptin concentrations (rs = 0.017; P <
0.806; Figure 4.2), but concentrations appeared to mirror one another. There was no significant
group × time effect (P = 0.770) detected for any of the variables examined (Figure 4.3). Insulin
and leptin concentrations were positively correlated (rs = 0.52; P < 0.001; Figure 4.4). Leptin
concentrations were also positively correlated with BCS (rs = 0.34; P < 0.001) and blood glucose
(rs = 0.27; P < 0.001) concentrations.
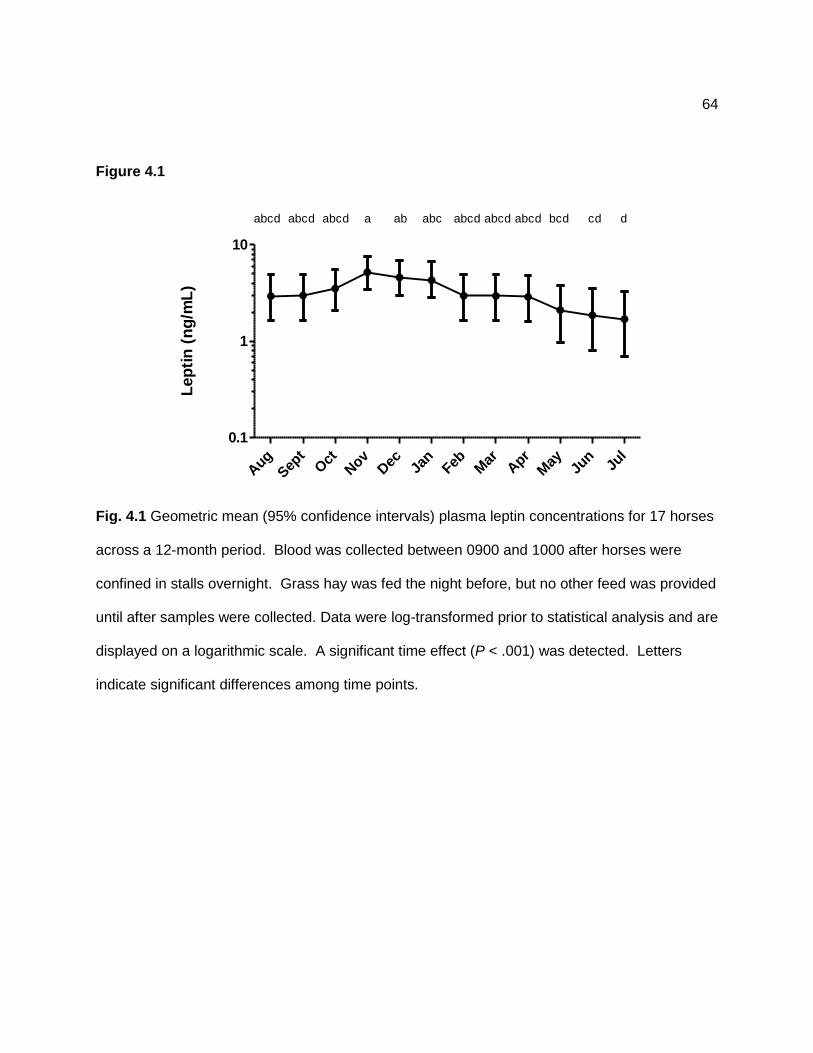
64
Figure 4.1
Aug
Sep
tOct
Nov
Dec Ja
nFeb M
arApr
May
Jun
Jul
0.1
1
10
abcd abcd abcd a ab abc abcd abcd abcd bcd cd d
Lep
tin
(n
g/m
L)
Fig. 4.1 Geometric mean (95% confidence intervals) plasma leptin concentrations for 17 horses
across a 12-month period. Blood was collected between 0900 and 1000 after horses were
confined in stalls overnight. Grass hay was fed the night before, but no other feed was provided
until after samples were collected. Data were log-transformed prior to statistical analysis and are
displayed on a logarithmic scale. A significant time effect (P < .001) was detected. Letters
indicate significant differences among time points.
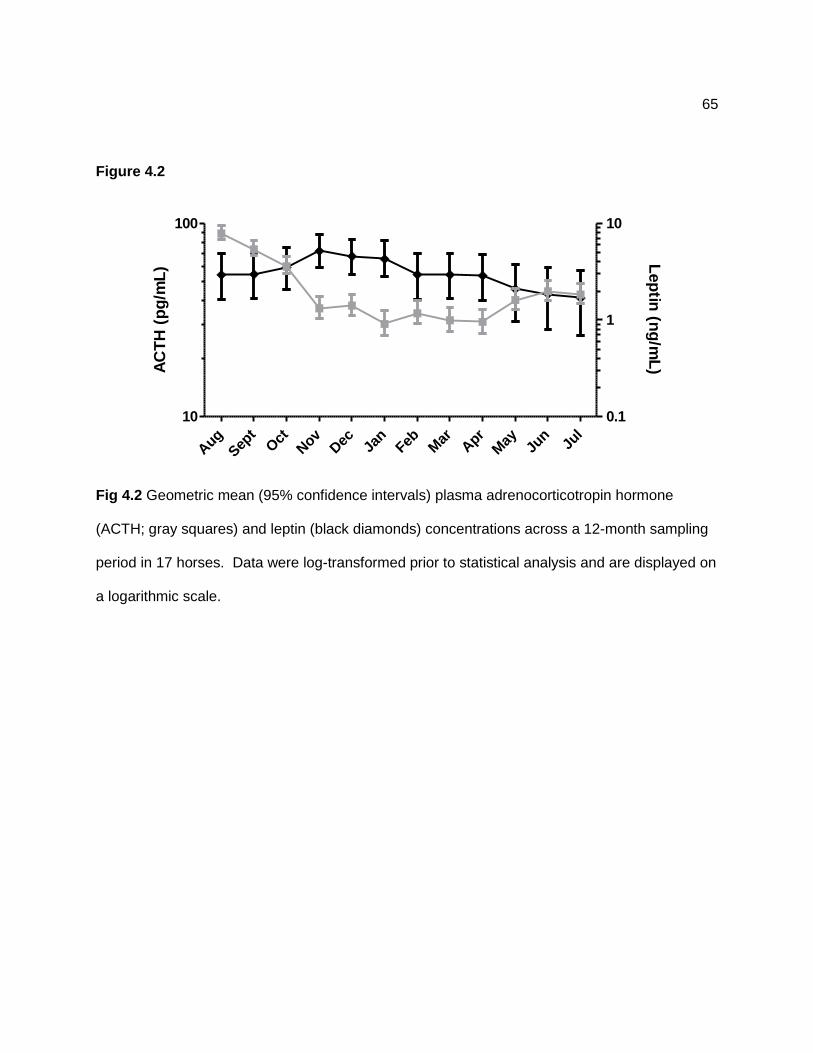
65
Figure 4.2
Aug
Sep
tOct
Nov
Dec Ja
nFeb M
arApr
May
Jun
Jul
10
100
0.1
1
10
AC
TH
(p
g/m
L)
Lep
tin (n
g/m
L)
Fig 4.2 Geometric mean (95% confidence intervals) plasma adrenocorticotropin hormone
(ACTH; gray squares) and leptin (black diamonds) concentrations across a 12-month sampling
period in 17 horses. Data were log-transformed prior to statistical analysis and are displayed on
a logarithmic scale.
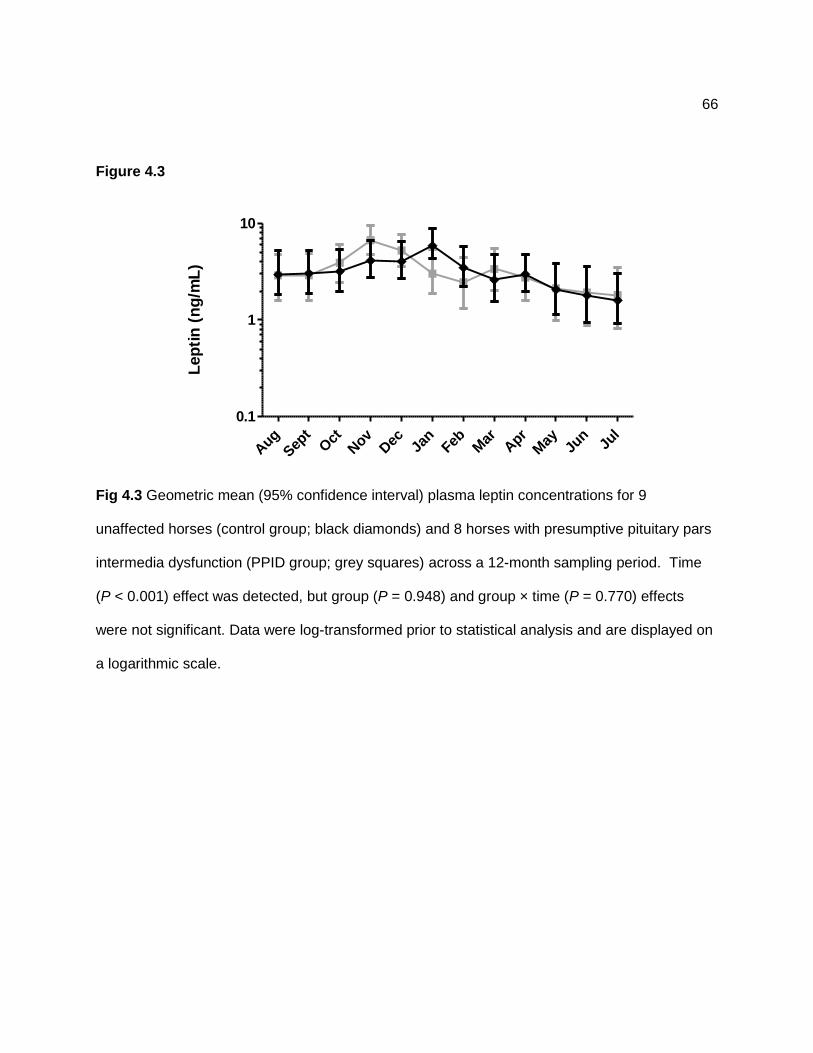
66
Figure 4.3
Aug
Sep
tOct
Nov
Dec Ja
nFeb M
arApr
May Ju
nJu
l0.1
1
10
Lep
tin
(n
g/m
L)
Fig 4.3 Geometric mean (95% confidence interval) plasma leptin concentrations for 9
unaffected horses (control group; black diamonds) and 8 horses with presumptive pituitary pars
intermedia dysfunction (PPID group; grey squares) across a 12-month sampling period. Time
(P < 0.001) effect was detected, but group (P = 0.948) and group × time (P = 0.770) effects
were not significant. Data were log-transformed prior to statistical analysis and are displayed on
a logarithmic scale.

67
Figure 4.4
Aug
Sep
tOct
Nov
Dec Ja
nFeb M
arApr
May
Jun
Jul
0.1
1
10
100
0.1
1
10
100
Lep
tin
(n
g/m
L)
Insu
lin (u
U/m
L)
Fig 4.4 Geometric mean (95% confidence interval) serum insulin concentrations (grey squares)
and plasma leptin concentrations (black diamonds) in 17 horses across a 12-month sampling
period. A positive correlation (rs = 0.52; P < 0.001) was detected between leptin and insulin
concentrations.
4.5 Discussion
Plasma ACTH and leptin concentrations appeared to mirror one another in this study.
Horses had lower leptin concentrations during long photoperiods and then higher concentrations
as photoperiod shortened, with the highest mean concentration in November. Leptin was
positively correlated with insulin, body condition score, and glucose concentrations. Mean neck
circumference was highest in October and lowest in June, and these time points both fall one
before the highest and lowest leptin concentrations were recorded, respectively.

68
Leptin concentrations increase in response to insulin in human adipocytes in vitro [125]
and in vivo [126]. High leptin concentrations have also been detected in horses with elevated
insulin concentrations in previous studies [51, 104]. A positive correlation between insulin and
leptin concentrations was detected in this study, which included horses with PPID. There was
no effect of PPID on resting leptin concentrations or responses over time. Leptin concentrations
were positively correlated with body condition score in this study, and this is consistent with
findings in other species [46, 127-128].
In humans, increased visceral fat deposition has been associated with higher plasma
leptin concentrations [42]. One interesting finding in the current study is that the highest and
lowest mid-neck circumference values were recorded one month prior to maximum and
minimum mean plasma leptin concentrations, respectively. However, one potential confounder
factor is the increased hair growth that occurs in the autumn, which would result in higher
circumference values. It has recently been shown that adipose tissue from the neck of horses is
more metabolically active than other fat depots [4], so additional studies are required to assess
this situation.
Leptin resistance has been observed in sheep, Siberian hamsters, and humans [12, 44-
45]. This process is thought to occur in the late summer as the hypothalamus-pituitary-adrenal
axis up-regulates in preparation for winter. Suppressed responses to leptin allow increased
feed intake and weight gain before the winter when food becomes scarce, and resistance is
accompanied by higher plasma leptin concentrations. There was no support for our hypothesis
that leptin resistance would develop before or during the seasonal ACTH increase in horses.
Leptin concentrations peaked in November, compared to September and October for ACTH.
Our results in older horses suggest ACTH is a key factor increasing appetite in preparation for
winter.
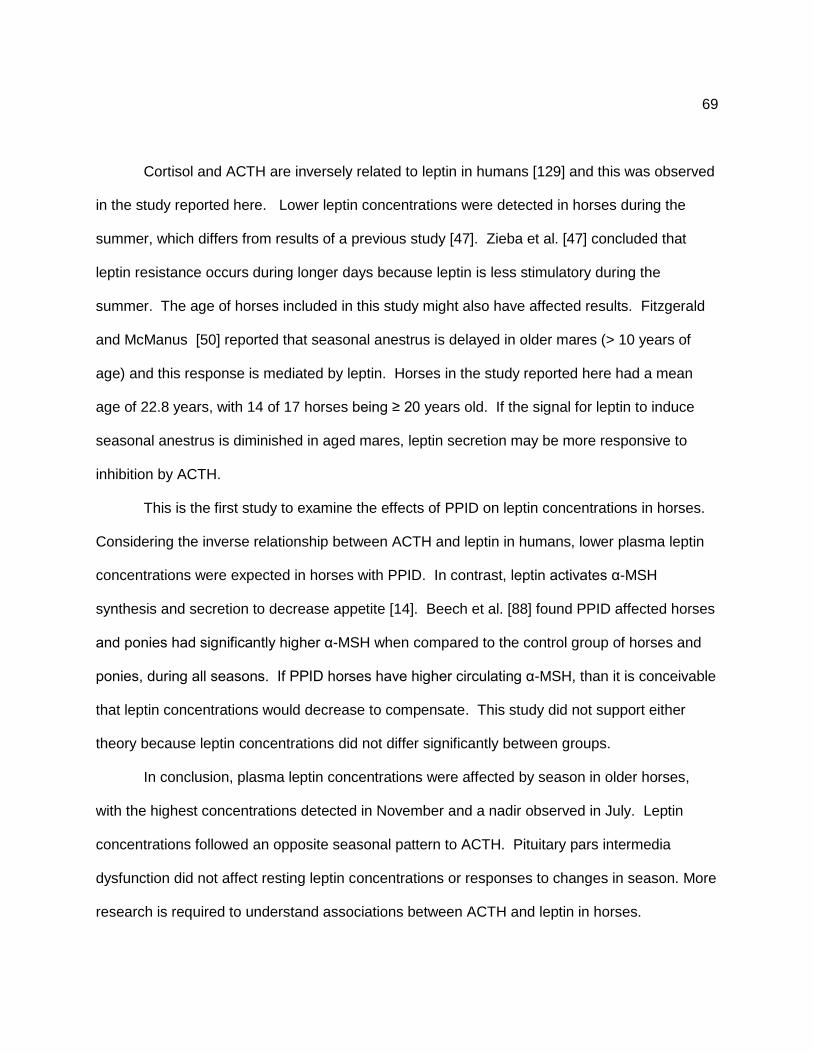
69
Cortisol and ACTH are inversely related to leptin in humans [129] and this was observed
in the study reported here. Lower leptin concentrations were detected in horses during the
summer, which differs from results of a previous study [47]. Zieba et al. [47] concluded that
leptin resistance occurs during longer days because leptin is less stimulatory during the
summer. The age of horses included in this study might also have affected results. Fitzgerald
and McManus [50] reported that seasonal anestrus is delayed in older mares (> 10 years of
age) and this response is mediated by leptin. Horses in the study reported here had a mean
age of 22.8 years, with 14 of 17 horses being ≥ 20 years old. If the signal for leptin to induce
seasonal anestrus is diminished in aged mares, leptin secretion may be more responsive to
inhibition by ACTH.
This is the first study to examine the effects of PPID on leptin concentrations in horses.
Considering the inverse relationship between ACTH and leptin in humans, lower plasma leptin
concentrations were expected in horses with PPID. In contrast, leptin activates α-MSH
synthesis and secretion to decrease appetite [14]. Beech et al. [88] found PPID affected horses
and ponies had significantly higher α-MSH when compared to the control group of horses and
ponies, during all seasons. If PPID horses have higher circulating α-MSH, than it is conceivable
that leptin concentrations would decrease to compensate. This study did not support either
theory because leptin concentrations did not differ significantly between groups.
In conclusion, plasma leptin concentrations were affected by season in older horses,
with the highest concentrations detected in November and a nadir observed in July. Leptin
concentrations followed an opposite seasonal pattern to ACTH. Pituitary pars intermedia
dysfunction did not affect resting leptin concentrations or responses to changes in season. More
research is required to understand associations between ACTH and leptin in horses.
70
CHAPTER 5
General Summary and Future Directions
Studies reported here focus upon associations among season, diet, and pituitary pars
intermedia dysfunction (PPID) and blood concentrations of adrenocorticotropic hormone
(ACTH), insulin, glucose, and leptin in horses. Testing horses for PPID is problematic due to
the seasonal variation in blood hormone concentrations and stimulation test responses.
Understanding associations between the animal and its environment might improve diagnostic
testing and increase our understanding of the disorder.
Our results provide evidence that horses affected with PPID elicit the same seasonal
upregulation of the hypothalamus-pituitary-adrenal axis as healthy horses, regardless of diet,
and husbandry habits. A total of 35 horses were included in this project, with 20 horses affected
by PPID. Results show that PPID had no effect on timing or duration of the ACTH peak
concentrations seen in the late summer and early fall. Horses with PPID did however, have
higher resting ACTH concentrations when compared to the healthy horses. This finding led to
the conclusion that horses could be tested during autumn months with the proper reference
range (> 100 pg/mL) used for diagnosis.
Pasture grazing had significant effects on serum glucose and insulin concentrations
across different seasons. This is the first study to investigate the specific effects of pasture
grazing and season on horses affect with PPID. In our first study, horses were housed on
pasture continuously, with no grazing restrictions or supplements administered. A positive
correlation was detected between serum insulin concentrations and the ethanol-soluble
71
carbohydrate content of pasture grass. Horses also displayed a seasonal response to diet, with
a peak in glucose and insulin concentrations observed in September. There was a second
lower peak in serum insulin concentrations observed in the spring when the ESC content of the
grass increased. This peak may have been lower than the one detected in September because
less grass was consumed. Unfortunately, we were unable to measure grass intake in our study.
In our second study, horses were located on many different farms and had varying
amounts of pasture turnout and exercise. Also, 10 of 18 horses were receiving levothyroxine, a
known therapy to improve insulin sensitivity [120]. Our horses from this study did not have a
significant seasonal increase in insulin concentrations when grazing on pasture, as seen in the
previous study. These findings indicate that an insulin response to grazing is less likely to occur
with turnout restrictions and levothyroxine treatment.
One important finding was that hyperinsulinemia was rarely detected in horses with
PPID, and only after pasture grazing. It has been previously reported that horses with PPID
have high resting insulin concentrations [78-79]. It can be hypothesized that diet-induced
hyperinsulinemia, exacerbated by pasture grass carbohydrates, combined with higher ACTH
concentrations seen in horses with PPID, increases the risk of laminitis. Our present study did
not support this hypothesis, because we did not see a significant difference in insulin responses
to pasture grazing and season between horses with PPID and unaffected animals. One
explanation for the difference is that horses with PPID in previous studies may have suffered
from equine metabolic syndrome prior to the development of PPID. A prospective study is
needed to support this theory.
Horses affected with PPID in our research studies had higher NEFA concentrations
compared to healthy horses. Melanocortin-2 receptors on adipose tissue allow circulating
ACTH to bind, thus triggering lipolysis [19]and the release of free fatty acids. Our findings of
72
higher NEFA concentrations in horses affected with PPID suggest that higher plasma ACTH
concentrations in these horses could be triggering lipolysis. This may be an area for further
investigation in the future.
In our third study, we hypothesized that horses would develop leptin resistance in the
late summer, triggering increased appetite due to the loss of negative feedback from leptin.
Higher plasma leptin concentrations were expected in the late summer. Our results showed
that leptin concentrations depressed in late summer, followed by a steady increase with a peak
in November. This peak could be attributed to increased body mass, and therefore increased
leptin production. Adrenocorticotropic hormone increased prior to the increase in leptin, and
may be the trigger to increase appetite in horses or alter body fat composition. Future studies
are needed to investigate the role of leptin and ACTH in the seasonal upregulation of appetite
and body fat mass in horses.
We also hypothesized that leptin concentrations would differ between healthy horses
and those affected by PPID. Adrenocorticotropic hormone inhibits leptin secretion from the
adipocytes, and horses with PPID have higher circulating ACTH concentrations. One would
therefore expect horses with PPID to have lower concentrations of leptin. Leptin concentrations
were statistically the same in the two groups, so this hypothesis was not supported. Both
groups also displayed the same seasonal pattern in leptin secretion.
One potential reason for us failing to detect differences between groups was the cut-off
value used to diagnosis PPID. Many studies have reported cut-off values of 35 pg/mL [1, 3, 93],
45 pg/mL [106-107], 50 pg/mL [79], and 70 pg/mL [101] . It is possible that allocating horses to
different groups on the basis of higher cut-off values may have revealed more differences.
In summary, preparation for winter appears cued by season in horses and involves
increased ACTH concentrations. This upregulation is retained in horses with PPID, a disorder
73
associated with loss of dopaminergic inhibition to the pars intermedia of the pituitary. The
seasonal rise in plasma ACTH concentrations is followed by an increase in leptin
concentrations, which suggests an increase in adiposity or the development of leptin resistance.

74
REFERENCES

75
References:
1. Donaldson, M.T., et al., Variation in Plasma Adrenocorticotropic Hormone Concentration and Dexamethasone Suppression Test Results with Season, Age, and Sex in Healthy Ponies and Horses. Journal of Veterinary Internal Medicine, 2005. 19(2): p. 217-222.
2. Place, N.J., et al., Seasonal variation in serum concentrations of selected metabolic hormones in horses. Journal of Veterinary Internal Medicine, 2010. 24(3): p. 650-654.
3. Beech, J., et al., Adrenocorticotropin concentration following administration of thyrotropin-releasing hormone in healthy horses and those with pituitary pars intermedia dysfunction and pituitary gland hyperplasia. Journal of the American Veterinary Medical Association, 2007. 231(3): p. 417-426.
4. Carter, R.A., et al., Prediction of incipient pasture-associated laminitis from hyperinsulinaemia, hyperleptinaemia and generalised and localised obesity in a cohort of ponies. Equine Veterinary Journal, 2009. 41(2): p. 171-178.
5. van der Kolk, J.H., et al., Laboratory diagnosis of equine pituitary pars intermedia adenoma. Domest Anim Endocrinol, 1995. 12(1): p. 35-9.
6. Vander, A., J. Sherman, and D. Luciano, Human Physiology: The Mechanisms of Body Function. Seventh ed, ed. K.T. Kane. 1998: James M. Smith. 818.
7. Fauci, A.S., et al., Harrison's Principles of Internal Medicine. 17th ed, ed. A. Fauci and D. Longo. 2008: McGraw Hill Companies.
8. McCue, P.M., Equine Cushing's disease. Veterinary Clinics of North America: Equine Practice, 2002. 18(3): p. 533-543.
9. Reece, W., Dukes' Physiology of Domestic Animals. 12th edition ed, ed. W. Reece. 2004: Cornell University Press.
10. Orth, D.N., et al., Equine Cushing's disease: plasma immunoreactive proopiolipomelanocortin peptide and cortisol levels basally and in response to diagnostic tests. Endocrinology, 1982. 110(4): p. 1430-1441.

76
11. McFarlane, D., Advantages and limitations of the equine disease, pituitary pars intermedia dysfunction as a model of spontaneous dopaminergic neurodegenerative disease. Ageing Research Reviews, 2007. 6(1): p. 54-63.
12. Sahu, A., Leptin signaling in the hypothalamus: emphasis on energy homeostasis and leptin resistance. . Front Neuroendocrinology, 2003. 24: p. 225-253.
13. Higgins, A.J., The Equine Manual, ed. I.M. Wright. 1995.
14. Mountjoy, K.G., Functions for pro-opiomelanocortin-derived peptides in obesity and diabetes. Biochemical Journal, 2010. 428(3): p. 305-324.
15. McFarlane, D. Role of the equine hypothalamic-pituitary pars intermedia axis in health and disease. in Proceedings of the 52nd Annual Convention of the American Association of Equine Practitioners, San Antonio, Texas, USA, 2-6 December, 2006. 2006.
16. Voisey, J., L. Carroll, and A. van Daal, Melanocortins and their Receptors and Antagonists. Current Drug Targets, 2003. 4(7): p. 586.
17. Kijima, H., et al., Effects of hypophysectomy and in vivo administration of ACTH or dexamethasone on the level of ACTH receptor mRNA in adrenal glands and adipose tissues of mice. Endocrine Regulations, 2004. 38(3): p. 87-95.
18. Lefkowitz, R.J., et al., ACTH receptor in the adrenal: specific binding of ACTH-125I and its relations to adenyl cyclase. Proceedings of the National Academy of Sciences, 1970. 65(3): p. 745-752.
19. Oelofsen, W. and J. Ramachandran, Studies of corticotropin receptors on rat adipocytes. Archives of Biochemistry and Biophysics, 1983. 225(2): p. 414-421.
20. Costa, M. and H. Majewski, Facilitation of noradrenaline release from sympathetic nerves through activation of ACTH receptors, beta-adrenoceptors and angiotensin II receptors. British Journal of Pharmacology, 1988. 95: p. 993-1001.
21. Chai, B., et al., Melanocortin-3 receptor activates MAP kinase via PI3 kinase. Regulatory Peptides, 2007. 139(1-3): p. 115-121.

77
22. Kumar, K.G., et al., Analysis of the therapeutic functions of novel melanocortin receptor agonists in MC3R- and MC4R-deficient C57BL/6J mice. Peptides, 2009. 30(10): p. 1892-1900.
23. Bagnol, D., et al., Anatomy of an Endogenous Antagonist: Relationship between Agouti-Related Protein and Proopiomelanocortin in Brain. J. Neurosci., 1999. 19(18): p. 26RC-.
24. SchiÖTh, H.B., et al., Functional Role, Structure, and Evolution of the Melanocortin-4 Receptor. Annals of the New York Academy of Sciences, 2003. 994(1): p. 74-83.
25. Kublaoui, B.M., et al., Sim1 Haploinsufficiency Impairs Melanocortin-Mediated Anorexia and Activation of Paraventricular Nucleus Neurons. Mol Endocrinol, 2006. 20(10): p. 2483-2492.
26. Kublaoui, B.M., et al., Oxytocin Deficiency Mediates Hyperphagic Obesity of Sim1 Haploinsufficient Mice. Mol Endocrinol, 2008. 22(7): p. 1723-1734.
27. Duan, W., et al., Reversal of Behavioral and Metabolic Abnormalities, and Insulin Resistance Syndrome, by Dietary Restriction in Mice Deficient in Brain-Derived Neurotrophic Factor. Endocrinology, 2003. 144(6): p. 2446-2453.
28. Nicholson, J.R., et al., Melanocortin-4 Receptor Activation Stimulates Hypothalamic Brain-Derived Neurotrophic Factor Release to Regulate Food Intake, Body Temperature and Cardiovascular Function. Journal of Neuroendocrinology, 2007. 19(12): p. 974-982.
29. Henry, B.A., et al., Altered "set-point" of the hypothalamus determines effects of cortisol on food intake, adiposity, and metabolic substrates in sheep. Domestic Animal Endocrinology, 2010. 38(1): p. 46-56.
30. Marshall, J.B., et al., Effect of corticotropin-like intermediate lobe peptide on pancreatic exocrine function in isolated rat pancreatic lobules. The Journal of Clinical Investigation, 1984. 74(5): p. 1886-1889.
31. Wilson, M.G., et al., Proopiolipomelanocortin peptides in normal pituitary, pituitary tumor, and plasma of normal and Cushing's horses. Endocrinology, 1982. 110(3): p. 941-954.

78
32. Breit, A., et al., The Natural Inverse Agonist Agouti-related Protein Induces Arrestin-mediated Endocytosis of Melanocortin-3 and -4 Receptors. Journal of Biological Chemistry, 2006. 281(49): p. 37447-37456.
33. Anukulkitch, C., et al., Influence of photoperiod and gonadal status on food intake, adiposity, and gene expression of hypothalamic appetite regulators in a seasonal mammal. Am J Physiol Regul Integr Comp Physiol, 2007. 292(1): p. R242-252.
34. Salway, J.G., Metabolism at a Glance. Third ed. 2004: Blackwell Publishing. 125.
35. Chrousos, G.P. and T. Kino, Glucocorticoid Signaling in the Cell. Annals of the New York Academy of Sciences, 2009. 1179(1): p. 153-166.
36. Anagnostis, P., et al., The Pathogenetic Role of Cortisol in the Metabolic Syndrome: A Hypothesis. J Clin Endocrinol Metab, 2009. 94(8): p. 2692-2701.
37. Giorgino, F., et al., Glucocorticoid regulation of insulin receptor and substrate IRS-1 tyrosine phosphorylation in rat skeletal muscle in vivo. The Journal of Clinical Investigation, 1993. 91(5): p. 2020-2030.
38. Malendowicz, L.K., et al., Leptin and the Regulation of the Hypothalamic-Pituitary-Adrenal Axis, in International Review of Cytology, W.J. Kwang, Editor. 2007, Academic Press. p. 63-102.
39. Martin, S.S., A. Qasim, and M.P. Reilly, Leptin Resistance: A Possible Interface of Inflammation and Metabolism in Obesity-Related Cardiovascular Disease. Journal of the American College of Cardiology, 2008. 52(15): p. 1201-1210.
40. Scarpace, P.J., et al., Leptin resistance exacerbates diet-induced obesity and is associated with diminished maximal leptin signalling capacity in rats. Diabetologia, 2005. 48(6): p. 1075-1083.
41. Shimizu, H., et al., Leptin Resistance and Obesity. Endocrine Journal, 2007. 54(1): p. 17-26.
42. Taksali, S.E., et al., High visceral and low abdominal subcutaneous fat stores in the obese adolescent. Diabetes, 2008. 57(2): p. 367-371.
79
43. Cebulj-Kadunc, N. and V. Cestnik, The influence of season and age on circulating melatonin and leptin concentrations in Lipizzan fillies. Acta Veterinaria (Beograd), 2008. 58(1): p. 25-31.
44. Zieba, D.A., et al., Seasonal effects of central leptin infusion on secretion of melatonin and prolactin and on SOCS-3 gene expression in ewes. J Endocrinol, 2008. 198(1): p. 147-155.
45. Houseknecht, K.L. and M.E. Spurlock, Leptin regulation of lipid homeostasis: dietary and metabolic implications. Nutrition Research Reviews, 2003. 16(01): p. 83-96.
46. Helwig, M., et al., Photoperiodic regulation of satiety mediating neuropeptides in the brainstem of the seasonal Siberian hamster (<i>Phodopus sungorus</i>). Journal of Comparative Physiology A: Neuroethology, Sensory, Neural, and Behavioral Physiology, 2009. 195(7): p. 631-642.
47. Zieba, D.A., et al., In vitro evidence that leptin suppresses melatonin secretion during long days and stimulates its secretion during short days in seasonal breeding ewes. Domestic Animal Endocrinology, 2007. 33(3): p. 358-365.
48. Piccione, G., et al., Influence of Fasting and Exercise on the Daily Rhythm of Serum Leptin in the Horse. Chronobiology International: The Journal of Biological & Medical Rhythm Research, 2004. 21(3): p. 405-417.
49. Storer, W.A., et al., Hormonal patterns in normal and hyperleptinemic mares in response to three common feeding-housing regimens. J. Anim Sci., 2007. 85(11): p. 2873-2881.
50. Fitzgerald, B.P. and C.J. McManus, Photoperiodic versus metabolic signals as determinants of seasonal anestrus in the mare. Biology of Reproduction, 2000. 63(1): p. 335-340.
51. Cartmill, J.A., et al., Endocrine responses in mares and geldings with high body condition scores grouped by high vs. low resting leptin concentrations. J. Anim Sci., 2003. 81(9): p. 2311-2321.
52. Goldman, B.D., Mammalian Photoperiodic System: Formal Properties and Neuroendocrine Mechanisms of Photoperiodic Time Measurement. Journal of Biological Rhythms, 2001. 16(4): p. 283-301.

80
53. Chandra, R. and R.A. Liddle, Neural and hormonal regulation of pancreatic secretion. Current Opinion in Gastroenterology, 2009. 25(5): p. 441-446 10.1097/MOG.0b013e32832e9c41.
54. García, A., et al., Seasonal changes in melatonin concentrations in female Iberian red deer (Cervus elaphus hispanicus). Journal of Pineal Research, 2003. 34(3): p. 161-166.
55. Cote, T.E., et al., Biochemical and physiological studies of the beta-adrenoceptor and the D-2 dopamine receptor in the intermediate lobe fo the rat pituitary gland: a review. Neuroendocrinology, 1982. 35(3): p. 217-224.
56. Viguié, C., et al., Blockade of Tyrosine Hydroxylase Activity in the Median Eminence Partially Reverses the Long Day-Induced Inhibition of Pulsatile LH Secretion in the Ewe. Journal of Neuroendocrinology, 1998. 10(7): p. 551-558.
57. Zhao, F.Q. and A.F. Keating, Functional Properties and Genomics of Glucose Transporters. Current Genomics, 2007. 8(2): p. 113-128.
58. Jose-Cunilleras, E., et al., Expression of equine glucose transporter type 4 in skeletal muscle after glycogen-depleting exercise. Am J Vet Res, 2005. 66(3): p. 379-85.
59. Lorenzo-Figueras, M., et al., Meal-induced gastric relaxation and emptying in horses after ingestion of high-fat versus high-carbohydrate diets. American Journal of Veterinary Research, 2005. 66(5): p. 897-906.
60. Schenk, S., M. Saberi, and J.M. Olefsky, Insulin sensitivity: modulation by nutrients and inflammation. The Journal of Clinical Investigation, 2008. 118(9): p. 2992-3002.
61. Lizcano, J.M. and D.R. Alessi, The insulin signalling pathway. 2002. 12(7): p. R236-R238.
62. Wilcox, G., Insulin and Insulin Resistance. The Clinical Biochemist Reviews, 2005. 26: p. 19-39.
63. Valera Mora, M.E., et al., Insulin clearance in obesity. J Am Coll Nutr, 2003. 22(6): p. 487-493.
81
64. Saltiel, A.R. and C.R. Kahn, Insulin signalling and the regulation of glucose and lipid metabolism. Nature, 2001. 414(6865): p. 799-806.
65. Quesada, I., et al., Physiology of the pancreatic {alpha}-cell and glucagon secretion: role in glucose homeostasis and diabetes. J Endocrinol, 2008. 199(1): p. 5-19.
66. McFarlane, D., et al., Nitration and Increased α-Synuclein Expression Associated With Dopaminergic Neurodegeneration In Equine Pituitary Pars Intermedia Dysfunction. Journal of Neuroendocrinology, 2005. 17(2): p. 73-80.
67. Rijnen, K.E.P.M. and J.H. van der Kolk, Determination of reference range values indicative of glucose metabolism and insulin resistance by use of glucose clamp techniques in horses and ponies. American Journal of Veterinary Research, 2003. 64(10): p. 1260-1264.
68. Brosnahan, M.M. and M.R. Paradis, Demographic and clinical characteristics of geriatric horses: 467 cases (1989-1999). Journal of the American Veterinary Medical Association, 2003. 223(1): p. 93-98.
69. Kolk, J.H.v.d., et al., Evaluation of pituitary gland anatomy and histopathologic findings in clinically normal horses and horses and ponies with pituitary pars intermedia adenoma. American Journal of Veterinary Research, 2004. 65(12): p. 1701-1707.
70. Frank, N., et al., Evaluation of the Combined Dexamethasone Suppression/Thyrotropin-Releasing Hormone Stimulation Test for Detection of Pars Intermedia Pituitary Adenomas in Horses. Journal of Veterinary Internal Medicine, 2006. 20(4): p. 987-993.
71. Dybdal, N., Current therapy in equine medicine. 4th ed, ed. N.E. Robinson. 1997: WB Saunders.
72. Haritou, S.J.A., et al., Seasonal Changes in Circadian Peripheral Plasma Concentrations of Melatonin, Serotonin, Dopamine and Cortisol in Aged Horses with Cushing’s Disease under Natural Photoperiod. Journal of Neuroendocrinology, 2008. 20(8): p. 988-996.
73. Frank, N., et al., Equine metabolic syndrome. Journal of Veterinary Internal Medicine, 2010. 24(3): p. 467-475.

82
74. Radin, M.J., L.C. Sharkey, and B.J. Holycross, Adipokines: a review of biological and analytical principles and an update in dogs, cats, and horses. Veterinary Clinical Pathology, 2009. 38(2): p. 136-156.
75. Treiber, K.H., D.S. Kronfeld, and R.J. Geor, Insulin resistance in equids: possible role in laminitis. J. Nutr., 2006. 136(7): p. 2094S-2098.
76. Bailey, S.R., et al., Hypertension and insulin resistance in a mixed-breed population of ponies predisposed to laminitis. American Journal of Veterinary Research, 2008. 69(1): p. 122-129.
77. Carter, R.A., et al., Effects of diet-induced weight gain on insulin sensitivity and plasma hormone and lipid concentrations in horses. American Journal of Veterinary Research, 2009. 70(10): p. 1250-1258.
78. Garcia, M.C. and J. Beech, Equine intravenous glucose tolerance test: glucose and insulin responses of healthy horses fed grain or hay and of horses with pituitary adenoma. Am J Vet Res, 1986. 47(3): p. 570-572.
79. Donaldson, M.T., et al., Treatment with Pergolide or Cyproheptadine of Pituitary Pars Intermedia Dysfunction (Equine Cushing's Disease). Journal of Veterinary Internal Medicine, 2002. 16(6): p. 742-746.
80. Beech, J., Equine Medicine and Surgery 4th ed. Diseases of the endocrine system. 1991: American Veterinary Publications.
81. Bailey, S.R., et al., Effect of dietary fructans and dexamethasone administration on the insulin response of ponies predisposed to laminitis. Journal of the American Veterinary Medical Association, 2007. 231(9): p. 1365-1373.
82. Hoffman, R.M., Recent advances in equine nutrition. Carbohydrate metabolism in horses, ed. S.L. Ralston. 2003, Ithaca, N.Y.: International Veterinary Information Service.
83. Harris, P. and R.J. Geor, Primer on dietary carbohydrates and utility of the glycemic index in equine nutrition. Vet Clin Equine, 2009. 25: p. 23-37.
83
84. USDA, Baseline Reference of Equine Health and Management, 2005, in National Animal Health Monotoring System. 2005, United States Department of Agriculture.
85. Staniar, W.B., et al., Glucose and insulin responses to different dietary energy sources in Thoroughbred broodmares grazing cool season pasture. Livestock Science, 2007. 111(1-2): p. 164-171.
86. Toribio, R.E., Editorial: Diagnosing equine pars intermedia dysfunction: are we there yet? Journal of Veterinary Internal Medicine, 2005. 19(2): p. 145-146.
87. Couetil, L., M.R. Paradis, and J. Knoll, Plasma adrenocorticotropin concentration in healthy horses and in horses with clinical signs of hyperadrenocorticism. Journal of Veterinary Internal Medicine, 1996. 10(1): p. 1-6.
88. Beech, J., et al., Evaluation of plasma ACTH, α-melanocyte–stimulating hormone, and insulin concentrations during various photoperiods in clinically normal horses and ponies and those with pituitary pars intermedia dysfunction. Journal of the American Veterinary Medical Association, 2009. 235(6): p. 715-722.
89. Dybdal, N.O., et al., Diagnostic testing for pituitary pars intermedia dysfunction in horses. Journal of the American Veterinary Medical Association, 1994. 204(4): p. 627-632.
90. McFarlane, D., et al., Effects of season and sample handling on measurement of plasma α-melanocyte-stimulating hormone concentrations in horses and ponies. American Journal of Veterinary Research, 2004. 65(11): p. 1463-1468.
91. Irvine, C.H.G. and S.L. Alexander, Factors affecting the circadian rhythm in plasma cortisol concentrations in the horse. Domestic Animal Endocrinology, 1994. 11(2): p. 227-238.
92. Johnston, S.D. and E.C. Mather, Feline plasma cortisol (hydrocortisone) measure by radioimmunoassay. Am J Vet Res, 1979. 40(2): p. 190-192.
93. Donaldson, M.T., A.J.R. Jorgensen, and J. Beech, Evaluation of suspected pituitary pars intermedia dysfunction in horses with laminitis. Journal of the American Veterinary Medical Association, 2004. 224(7): p. 1123-1127.
84
94. Hillyer, M.H., et al., Diagnosis of hyperadrenocorticism in the horse. Equine Vet Educ, 1992. 4: p. 131-134.
95. Perkins, G.A., et al., Plasma adrenocorticotropin (ACTH) concentrations and clinical response in horses treated for equine Cushing's disease with cyproheptadine or pergolide. Equine Vet J, 2002. 34(7): p. 679-85.
96. Johnson, P.J., et al., Glucocorticoids and laminitis in the horse. Veterinary Clinics of North America, Equine Practice, 2002. 18(2): p. 219-236.
97. Treiber, K.H., et al., Evaluation of genetic and metabolic predispositions and nutritional risk factors for pasture-associated laminitis in ponies. J Am Vet Med Assoc, 2006. 228(10): p. 1538-45.
98. Stulnig, T.M. and W. Waldhausl, 11beta-Hydroxysteroid dehydrogenase Type 1 in obesity and Type 2 diabetes. Diabetologia, 2004. 47(1): p. 1-11.
99. McGowan, C.M., et al., Serum insulin concentrations in horses with equine Cushing's syndrome: response to a cortisol inhibitor and prognostic value. Equine Vet J, 2004. 36(3): p. 295-8.
100. Reeves, H.J., R. Lees, and C.M. McGowan, Measurement of basal serum insulin concentration in the diagnosis of Cushing's disease in ponies. Vet Rec, 2001. 149(15): p. 449-52.
101. Walsh, D.M., et al., Correlation of plasma insulin concentration with laminitis score in a field study of equine Cushing's disease and equine metabolic syndrome. J Equine Vet Science, 2009. 29(2): p. 87-94.
102. McFarlane, D., et al., Effects of season and sample handling on measurement of plasma alpha-melanocyte-stimulating hormone concentrations in horses and ponies. Am J Vet Res, 2004. 65(11): p. 1463-8.
103. Henneke, D., et al., Relationship between condition score, physical measurements and body fat percentage in mares. Equine Veterinary Journal, 1983. 15(4): p. 371-372.
85
104. Frank, N., et al., Physical characteristics, blood hormone concentrations, and plasma lipid concentrations in obese horses with insulin resistance. Journal of the American Veterinary Medical Association, 2006. 228(9): p. 1383-1390.
105. Freestone, J.F., et al., Exercise induced hormonal and metabolic changes in Thoroughbred horses: effects of conditioning and acepromazine. Equine Vet J, 1991. 23(3): p. 219-23.
106. Schott, H.C., 2nd, Pituitary pars intermedia dysfunction: equine Cushing's disease. Vet Clin North Am Equine Pract, 2002. 18(2): p. 237-70.
107. Schott, H.C., et al., Diagnosis and treatment of pituitary pars intermedia dysfunction (classical Cushing's disease) and metabolic syndrome (peripheral Cushing's syndrome) in horses. Adv Vet Dermatol, 2005. 5: p. 159-169.
108. Frank, N., Equine Metabolic Syndrome. J Equine Vet Sci, 2009. 29(5): p. 259-265.
109. Jeffcott, L.B., et al., Glucose tolerance and insulin sensitivity in ponies and Standardbred horses. Equine Vet J, 1986. 18(2): p. 97-101.
110. Geor, R.J. and P. Harris, Dietary management of obesity and insulin resistance: countering risk for laminitis. Vet Clin North Am Equine Pract, 2009. 25(1): p. 51-65, vi.
111. Longland, A.C. and B.M. Byrd, Pasture nonstructural carbohydrates and equine laminitis. J Nutr, 2006. 136(7 Suppl): p. 2099S-2102S.
112. Watson, T.D., C.J. Packard, and J. Shepherd, Plasma lipid transport in the horse (Equus caballus). Comp Biochem Physiol B, 1993. 106(1): p. 27-34.
113. Frank, N., J.E. Sojka, and M.A. Latour, Effects of hypothyroidism and withholding of feed on plasma lipid concentrations, concentration and composition of very-low-density lipoprotein, and plasma lipase activity in horses. Am J Vet Res, 2003. 64(7): p. 823-8.
114. Watson, T.D., et al., Plasma lipids, lipoproteins and post-heparin lipases in ponies with hyperlipaemia. Equine Vet J, 1992. 24(5): p. 341-6.
86
115. Gary, K.A. and B.M. Chronwall, The onset of dopaminergic innervation during ontogeny decreases melanotrope proliferation in the intermediate lobe of the rat pituitary. International Journal of Developmental Neuroscience, 1992. 10(2): p. 131-142.
116. Love, S., Equine Cushing's disease. British Veterinary Journal, 1993. 149(2): p. 139-153.
117. Bailey, S.R., C.M. Marr, and J. Elliott, Current research and theories on the pathogenesis of acute laminitis in the horse. The Veterinary Journal, 2004. 167(2): p. 129-142.
118. Seitzinger, A.H., et al., Lameness and laminitis in US horses. 2000.
119. Millington, W.R., et al., Equine Cushing's disease: differential regulation of {beta}-endorphin processing in tumors of the intermediate pituitary. Endocrinology, 1988. 123(3): p. 1598-1604.
120. Frank, N., S.B. Elliott, and R.C. Boston, Effects of long-term oral administration of levothyroxine sodium on glucose dynamics in healthy adult horses. American Journal of Veterinary Research, 2008. 69(1): p. 76-81.
121. Shimizu, H., K. Inoue, and M. Mori, The leptin-dependent and -independent melanocortin signaling system: regulation of feeding and energy expenditure. J Endocrinol, 2007. 193(1): p. 1-9.
122. Gaspar-López, E., et al., Seasonal changes in plasma leptin concentration related to antler cycle in Iberian red deer stags. Journal of Comparative Physiology B: Biochemical, Systemic, and Environmental Physiology, 2009. 179(5): p. 617-622.
123. Chelikani, P.K., D.R. Glimm, and J.J. Kennelly, Short Communication: Tissue Distribution of Leptin and Leptin Receptor mRNA in the Bovine. Journal of Dairy Science, 2003. 86(7): p. 2369-2372.
124. Atcha, Z., et al., Leptin Acts on Metabolism in a Photoperiod-Dependent Manner, But Has No Effect on Reproductive Function in the Seasonally Breeding Siberian Hamster (Phodopus sungorus). Endocrinology, 2000. 141(11): p. 4128-4135.
125. Wabitsch, M., et al., Insulin and cortisol promote leptin production in cultured human fat cells. Diabetes, 1996. v45(n10): p. p1435(4).
87
126. Kolaczynski, J.W., et al., Responses of leptin to short-term fasting and refeeding in humans: a link with ketogenesis but not ketones themselves. Diabetes, 1996. 45(11): p. 1511-1515.
127. Jeusette, I.C., et al., Influence of obesity on plasma lipid and lipoprotein concentrations in dogs. American Journal of Veterinary Research, 2005. 66(1): p. 81-86.
128. Appleton, D.J., J.S. Rand, and G.D. Sunvold, Plasma leptin concentrations in cats: reference range, effect of weight gain and relationship with adiposity as measured by dual energy X-ray absorptiometry. Journal of Feline Medicine & Surgery, 2000. 2(4): p. 191-199.
129. Licinio, J., et al., Human leptin levels are pulsatile and inversely related to pituitary-adrenal function. Nature Medicine, 1997. 3(5): p. 575-579.
88
VITA
Sarah Beth Clark Elliott was born on the 4th of June, 1978 in Flowood, MS. She is the second of
four siblings born to the late Gary Seth Clark and Dana Beth Horton Clark. After earning her
high school diploma from Ridgeway High School, in Memphis, TN, Sarah continued her
education at The University of Tennessee in Knoxville, TN. She graduated with a Bachelor’s of
Science in Animal Science in December, 2000. In July, 2002 she married her husband, Brad
Anthony Elliott. Sarah began the pursuit of a master’s degree in January, 2007 at the University
of Tennessee in the field of comparative and experimental medicine. She had her first child,
Claire Beth Elliott, in May 2009.
Related Documents