CALIFORNIA’S WATER PPIC WATER POLICY CENTER CLIMATE CHANGE AND WATER PREPARING FOR FLOODS MANAGING DROUGHTS THE SACRAMENTO–SAN JOAQUIN DELTA PAYING FOR WATER STORING WATER WATER FOR CITIES WATER FOR THE ENVIRONMENT WATER FOR FARMS Item 7, PPIC Report

Welcome message from author
This document is posted to help you gain knowledge. Please leave a comment to let me know what you think about it! Share it to your friends and learn new things together.
Transcript

CALIFORNIA’S WATER
PPIC WATER POLICY CENTER
CLIMATE CHANGE AND WATER
PREPARING FOR FLOODS
MANAGING DROUGHTS
THE SACRAMENTO–SAN JOAQUIN DELTA
PAYING FOR WATER
STORING WATER
WATER FOR CITIES
WATER FOR THE ENVIRONMENT
WATER FOR FARMS
Item 7, PPIC Report

Climate Change and Water PPIC WATER POLICY CENTER
Climate Change Will affeCt California Water management in many WaysCalifornia’s climate is highly variable, with frequent droughts and floods. Climate models predict significant changes: warmer
temperatures and more variable precipitation, with short, concentrated wet periods and more frequent and intense droughts.
Some models also predict average precipitation will decline.
Warming is already a reality for California. Since the early 1980s, average temperatures have been significantly higher than they
were during the previous 50 years. The year 2014 was the warmest on record. Warming has complex and interrelated effects: it
reduces the share of precipitation that falls as snow, causes earlier snowpack melting with higher winter runoff and winter floods,
raises water temperatures, and amplifies the severity of droughts. Meanwhile, the sea level has been rising, which increases
pressure on coastal flood defenses. Sea level rise and larger freshwater floods threaten fragile levees in the Sacramento–San
Joaquin Delta, an important hub of the state’s water supply.
California has been a national leader in addressing greenhouse gas emissions that contribute to climate change. However, the
state is only in the early stages of developing water policies that help adapt to a changing climate in areas such as supply, flooding,
and ecosystem management. California’s water management systems were designed for the conditions of the past century.
Recon figuring them to respond to climate change—against a background of a growing population and rising demand for healthy
eco systems—is a grand challenge. Meeting this challenge will require a concerted public- and private-sector effort that involves all
levels of government.
California is getting warmer
62
58
56
55
54
60
61
59
57
1931 1940 1950 1960 1970 1980 1990 2000 2010 2014
Tem
pera
ture
(°F
)
Annual average
Historical average
SOURCE: National Oceanic and Atmospheric Administration.
NOTE: The figure reports average annual statewide temperatures starting in 1931; the number of measuring stations prior to this date makes long-term comparisons more difficult.
Water supply management must adapt to a Warmer, more variable ClimateCalifornia’s mountain snowpack has historically provided “free” seasonal storage for meeting summer irrigation needs. A smaller
spring snowpack, along with possible increases in California’s already high climate variability, will stress supply. Meanwhile, rising
temperatures are likely to raise demand for agricultural and urban irrigation water and to increase the volume of water used by
natural landscapes.
A p r i l 2 015
Item 7, PPIC Report
P P i C .o rg
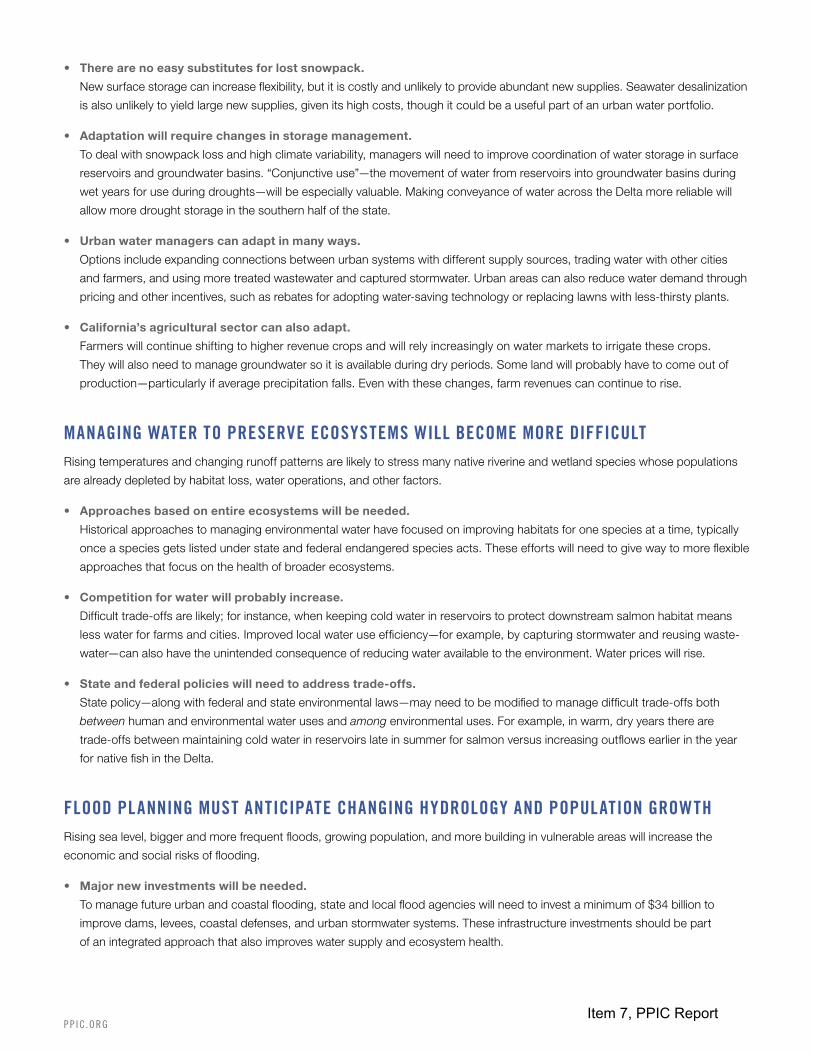
• Therearenoeasysubstitutesforlostsnowpack.
New surface storage can increase flexibility, but it is costly and unlikely to provide abundant new supplies. Seawater desalinization
is also unlikely to yield large new supplies, given its high costs, though it could be a useful part of an urban water portfolio.
• Adaptationwillrequirechangesinstoragemanagement.
To deal with snowpack loss and high climate variability, managers will need to improve coordination of water storage in surface
reservoirs and groundwater basins. “Conjunctive use”—the movement of water from reservoirs into groundwater basins during
wet years for use during droughts—will be especially valuable. Making conveyance of water across the Delta more reliable will
allow more drought storage in the southern half of the state.
• Urbanwatermanagerscanadaptinmanyways.
Options include expanding connections between urban systems with different supply sources, trading water with other cities
and farmers, and using more treated wastewater and captured stormwater. Urban areas can also reduce water demand through
pricing and other incentives, such as rebates for adopting water-saving technology or replacing lawns with less-thirsty plants.
• California’sagriculturalsectorcanalsoadapt.
Farmers will continue shifting to higher revenue crops and will rely increasingly on water markets to irrigate these crops.
They will also need to manage groundwater so it is available during dry periods. Some land will probably have to come out of
production—particularly if average precipitation falls. Even with these changes, farm revenues can continue to rise.
managing Water to preserve eCosystems Will beCome more diffiCultRising temperatures and changing runoff patterns are likely to stress many native riverine and wetland species whose populations
are already depleted by habitat loss, water operations, and other factors.
• Approachesbasedonentireecosystemswillbeneeded.
Historical approaches to managing environmental water have focused on improving habitats for one species at a time, typically
once a species gets listed under state and federal endangered species acts. These efforts will need to give way to more flexible
approaches that focus on the health of broader ecosystems.
• Competitionforwaterwillprobablyincrease.
Difficult trade-offs are likely; for instance, when keeping cold water in reservoirs to protect downstream salmon habitat means
less water for farms and cities. Improved local water use efficiency—for example, by capturing stormwater and reusing waste-
water—can also have the unintended consequence of reducing water available to the environment. Water prices will rise.
• Stateandfederalpolicieswillneedtoaddresstrade-offs.
State policy—along with federal and state environmental laws—may need to be modified to manage difficult trade-offs both
between human and environmental water uses and among environmental uses. For example, in warm, dry years there are
trade-offs between maintaining cold water in reservoirs late in summer for salmon versus increasing outflows earlier in the year
for native fish in the Delta.
flood planning must antiCipate Changing hydrology and population groWthRising sea level, bigger and more frequent floods, growing population, and more building in vulnerable areas will increase the
economic and social risks of flooding.
• Majornewinvestmentswillbeneeded.
To manage future urban and coastal flooding, state and local flood agencies will need to invest a minimum of $34 billion to
improve dams, levees, coastal defenses, and urban stormwater systems. These infrastructure investments should be part
of an integrated approach that also improves water supply and ecosystem health.
Item 7, PPIC Report

P P i C .o rg
• Regionalfloodmanagementtoolsmustbeupdated.
Regional flood management will require coordinated, forecast-based
reservoir operations. These can be carried out as part of conjunctive use
strategies to improve water supply. Modest investments to improve
forecasting—and better use of existing forecasting tools—will significantly
cut the costs of managing supply and responding to floods.
• Nonstructuralapproacheswillbecomemorevaluable.
California must do more than improve its flood protection infrastructure.
To reduce risk, managers should also emphasize land-use planning, flood
insurance, flood-proofing of buildings, and emergency preparation. The
state should require local hazard mitigation plans to include these non-
structural approaches.
Climate Change Will affeCt the Water-energy relationshipIn-state hydropower is a clean energy source that provides 10 to 15 percent
of California’s electricity. Snowpack changes will reduce the output of some
hydropower reservoirs. Warming will also boost energy demand, requiring
alternative sources.
• Warming’seffectsonenergyproductionwillvary.
The state’s large, multipurpose reservoirs have enough storage in most
years to adapt to changes in the timing of snowmelt runoff. The outlook
is different for California’s high-altitude hydropower reservoirs, which are
among the most important sources of peaking power during hot summers.
As temperatures rise, power availability from these reservoirs will shift to
late winter and spring. If the climate becomes drier, total hydropower
production will fall. In 2014—a critically dry year—production fell by half.
• Somewatermanagementchangescouldincreaseenergydemand.
Climate change is likely to make surface water scarcer, particularly in agricultural areas. Farmers may respond by using more
groundwater and switching to more efficient, pressurized irrigation systems. Both of these responses will increase farm energy
use. Meanwhile, in urban areas, increasing temperatures will likely boost demand for cooling. However, increased urban water
use efficiency and development of local sources can potentially offset these trends, reducing overall energy demand while
helping communities adapt to climate change.
looking aheadCalifornia needs to adopt water supply, flood control, and ecosystem management strategies that will prepare the state for a
changing climate and rising sea level.
Integrateclimatechangeintowatersupplymanagement. Strategies should increase flexibility by promoting conjunctive use,
more flexible reservoir operations, water trading, and improved conveyance. Conveyance investments are most critical to maintain
water supplies now drawn through the Delta, which could be disrupted by sea level rise, seasonal flooding, and earthquakes.
Conservation strategies will continue to be important, especially in urban areas.
Upgradeinformationsystems. Federal, state, and local agencies should upgrade information technology for water and
ecosystem management. One priority is enhancing decisionmakers’ ability to use existing information, such as weather forecasts.
In addition, strategic investments are needed in modeling of weather and water supply and demand.
sea level rise threatens Bay area Communities
N
PacificOcean
San Jose
San FranciscoBay
0 3 6 12miles
OaklandSan
Francisco
Inundation with 16-inch sea level rise
Inundation with 55-inch sea level rise
SOURCES: Map from San Francisco Bay Conserva-tion and Development Commission; inundation data from N. Knowles, “Potential Inundation Due to Rising Sea Levels in the San Francisco Bay Region” (California Climate Change Center, 2009).
NOTE: The map illustrates potential inundation with 16 inches and 55 inches of sea level rise, toward the upper end of the range expected by 2050 and 2100, respectively.
Item 7, PPIC Report

The PPIC Water Policy Center spurs innovative water management solutions that support a healthy economy, environment, and society—now and for future generations.
The Public Policy Institute of California is dedicated to informing and improving public policy in California through independent, objective, nonpartisan research. We are
a public charity. We do not take or support positions on any ballot measure or on any local, state, or federal legislation, nor do we endorse, support, or oppose any
political parties or candidates for public office. Research publications reflect the views of the authors and do not necessarily reflect the views of the staff, officers,
or Board of Directors of the Public Policy Institute of California.
Public Policy Institute of California
500 Washington Street, Suite 600
San Francisco, CA 94111
T 415 291 4400 F 415 291 4401
ppic.org/water
read more: Contact a PPiC expert:
Contact a research network expert:
This series is funded by the S. D. Bechtel, Jr. Foundation.
Climate Change and Water
PreParing for floods
managing droughts
the saCramento–san Joaquin delta
Paying for Water
storing Water
Water for Cities
Water for the environment
Water for farms
Daniel Cayan, [email protected]
Frank Davis, [email protected]
J. R. DeShazo, [email protected]
Richard Frank, [email protected]
Robert Wilkinson, [email protected]
Jeffrey [email protected]
Ellen [email protected]
PPIC Sacramento Center
Senator Office Building
1121 L Street, Suite 801
Sacramento, CA 95814
T 916 440 1120 F 916 440 1121
Incorporateclimateprojectionsinfloodplanning. To reduce flooding’s economic and social risks, state and local agencies
need to incorporate climate change projections into land-use planning decisions, flood insurance programs, and the design and
construction of new flood infrastructure. Legislation may be required to encourage adoption of important risk-reduction strategies
such as insurance.
Adoptariverineandwetlandbiodiversitystrategy. Such a strategy is needed to manage aquatic and wetland biodiversity
changes as the climate warms and becomes more variable. This strategy should inform water supply and flood management
decisions.
Considerenergyimplications. Given the links between water and energy use, it is important to consider how California’s water
strategies affect energy demand and costs. The state should start with a comprehensive assessment of the water system’s current
energy use.
Item 7, PPIC Report

Managing Droughts PPIC WATER POLICY CENTER
California Must keep iMproving its ability to weather DroughtsDroughts are a regular feature of California’s variable, semiarid climate. The laws that govern the allocation and use of water—as
well as the operation of reservoirs, groundwater basins, canals, and aqueducts—were created in part to manage water scarcity
during dry periods.
California has weathered many droughts, including four in the past four decades. These ranged from a short, severe drought from
1976–77 to a prolonged six-year drought in 1987–92. The latest drought began in 2012, and it includes the driest three-year stretch
in 120 years of recordkeeping. This drought has been more widespread than most, covering the entire state. The year 2014 was also
the hottest on record, which made conditions even drier.
It is difficult to specifically link the latest dry period—or any individual weather event—to climate change caused by human activity.
Nonetheless, climate change models project increases in the intensity and frequency of droughts. This poses major challenges in
how to manage water to support a growing population and economy, while promoting a healthy environment.
Droughts test California’s water management systems and expose their weaknesses. They also provide opportunities to improve
the state’s ability to weather future droughts. California needs to learn from the latest drought and begin preparing for the next one.
Droughts are a recurring feature of california’s climate
0
5
10
15
20
25
30
35
40
45
Inch
es o
f pr
ecip
itat
ion
1900 1910 1920 1930 1940 1950 1960 1970 1980 1990 2000 2010
Normal or wet years
Dry years
Source: Western regional climate center.
Note: Bars show california statewide average precipitation based on water year (october–September) since 1896. Dry years are those classified as critical or dry in the Sacramento Valley based on the california cooperative Snow Survey, which takes into account the previous year’s precipitation. For 1896–1905, dry years were estimated by comparing precipitation to the rest of the record. the three-year period between october 2011 and September 2014 was the driest on record.
urban anD rural areas have fareD Differently in the latest DroughtCalifornia’s diverse sectors and regions have responded very differently to the latest drought.
• Largeurbanareashavefaredreasonablywell.
Most large metropolitan utilities were better prepared to handle this drought than past ones, despite population increases.
Those that have performed well—mainly in Southern California and the San Francisco Bay Area—invested extensively to diversify
their water supply portfolios following the 1987–92 drought. Utilities carried out a variety of measures: they built interconnections
A p r i l 2 015
Item 7, PPIC Report

with neighboring systems that drew on different supply sources, reduced per capita water use, stored conserved water in new
reservoirs and groundwater storage facilities, and arranged water purchases from farmers.
• Somecommunitieswerevulnerable.
Several medium-size cities—including Folsom and Santa Cruz—faced extreme shortages in 2014, reflecting their high depen-
dence on a single source and lack of connections with other water utilities. Wells went dry in some small rural communities,
particularly in the Central Valley and Sierra foothills. The state provided emergency aid for replacement water.
• Agriculturefacedmajorproblems.
In 2014, deliveries of surface water to Central Valley farms declined by about a third from normal years. Farmers with the oldest
and highest-priority water rights got adequate supplies. But many served by the California State Water Project and the federal
Central Valley Project—two of California’s largest water delivery systems—received little or nothing. Farmers offset most of the
missing surface water by pumping additional groundwater. Some purchased water from other farmers to keep tree crops alive.
Nevertheless, they still had to fallow about 500,000 acres, or 5 percent of irrigated acreage, triggering losses of more than
$2 billion and 17,000 full- and part-time jobs. Strong commodity prices partially offset production losses; for instance, almonds
and tomatoes brought in record revenue. The state provided financial and food assistance to hard-hit farmworker communities.
• Thedroughtexposedweaknessesingroundwatermanagement.
Although farmers in most areas were able to pump more groundwater, decades of unsustainable pumping have made this
resource more costly and less reliable. High pumping volumes—both before and during the drought—have lowered ground water
tables. This has boosted pumping costs and caused land to sink, damaging aqueducts and other infrastructure. New legislation
enacted in 2014 requires local agencies with the most stressed basins to adopt sustainable groundwater management plans by
2020. These plans can improve drought resilience over the long term, but their implementation will stress some farm water
supplies in the near term.
unsustainable grounDwater pumping is Depleting reserves in the central valley
-140
-120
-100
-80
-60
-40
-20
0
20
Cum
ulat
ive
chan
ge in
gro
undw
ater
st
orag
e (m
illio
ns o
f ac
re-f
eet)
192
5
193
0
193
5
194
0
194
5
195
0
195
5
196
0
196
5
197
0
197
5
198
0
198
5
199
0
199
5
200
0
200
5
200
9
Dry yearsSacramento ValleySan Joaquin BasinTulare Basin
Source: the Nature conservancy, using california Department of Water resources data and models.
NoteS: Dry years are those classified as critical or dry in the Sacramento Valley based on the california cooperative Snow Survey.
the latest Drought has hit eCosysteMs harDWater and habitat management during droughts can have lasting impacts on migratory birds, fish, and other species.
• Wetlandandriverecosystemshavesuffered.
Rivers throughout California have experienced record-low flows and poor water quality. Many coastal and mountain streams
have dried up, harming salmon, steelhead, and other native fishes. Conditions have been poor for fish in rivers below many
p p i c .o rgItem 7, PPIC Report

Central Valley dams, and hatcheries have lacked adequate cold water. Water supplies in 2014 fell dramatically in wildlife refuges
in the Central Valley and Klamath Basin—key habitats for migratory birds and other species. This forced birds to gather in smaller
areas, increasing their vulnerability to disease outbreaks and predation.
• Regulatorshavebeenforcedtomaketrade-offsonthefly.
With little advance planning for managing fish and wildlife during severe droughts, regulators had to make difficult decisions
in 2014 based on limited knowledge and almost no scientific or public review. Environmental flow protections within the
Sacramento –San Joaquin Delta were reduced to send water to cities and farms. Fish and wildlife agencies carried out many
fish rescue efforts. In some cases, they had to make difficult choices between competing environmental needs, such as water
for salmon versus smelt, or for fish versus wildlife refuges. It is too soon to know the long-term effects of these decisions, but
history suggests they may be significant.
• Speciesdeclinesusuallyincreasefuturecosts.
The failure to manage native biodiversity well during drought can have long-term consequences. These can include increased
regulatory costs and water supply reductions for cities and farms in subsequent years, particularly if actions taken during a
drought cause some species to move into threatened or endangered status.
the Drought has testeD state water alloCation poliCies Water is a scarce resource in California even in normal years. The state government oversees water rights and must be prepared to
manage cutbacks during droughts to balance competing needs fairly. In 2014, California’s interagency drought task force managed
many aspects of the emergency in an effective and coordinated manner. But the drought also exposed weaknesses in the current
water allocation system.
• Thestatelacksacomprehensivepolicyonwaterallocationpriorities.
In addition to overseeing the water rights of urban and agricultural users, the state must consider the water needed to protect
public health and aquatic ecosystems. During the latest drought, the state did not have clear priorities in these two areas and
has been forced to make decisions in haste and without clear policy guidance.
• Droughtwaterallocationshavenotfullyconsideredtwoimportantlegaldoctrines.
The state constitutional “reasonable use” requirement mandates that all water uses must be reasonable under current hydrologic
conditions. The “public trust” doctrine requires the state to consider the effects of its water allocation decisions on aquatic
ecosystems and water quality and fisheries, and to protect such public uses to the extent feasible under the circumstances. The
state has not followed these doctrines sufficiently when allocating water, instead relying principally on the priority of water rights.
• Thestate’sinformationsystemsareinadequate.
Water use reporting has advanced in recent years. Still, state agencies lack sufficient information on flows and water use to
effectively manage droughts. As a result, recent cutback decisions have been based on rough estimates and may unfairly harm
some water users and the environment.
looking aheaD Now is the time to plan for the next drought, while experience gained in this latest drought is still fresh. Better preparation will also
help California get ready for an increasingly variable climate.
Continueprogressinurbandroughtmanagement. Some cities still need to diversify water supply sources and reach sharing
agreements with neighboring communities. Many utilities must improve their drought pricing policies to give customers incentives
to conserve, while generating adequate revenue to remain financially healthy when water sales decline.
Buildresilienceforsmall,ruralcommunities. Proposition 1—a bond approved by voters in November 2014—provides funds
to improve drinking water systems in communities now at risk. Where feasible, these communities should be connected to larger
systems.
p p i c .o rgItem 7, PPIC Report

The PPIC Water Policy Center spurs innovative water management solutions that support a healthy economy, environment, and society—now and for future generations.
The Public Policy Institute of California is dedicated to informing and improving public policy in California through independent, objective, nonpartisan research. We are
a public charity. We do not take or support positions on any ballot measure or on any local, state, or federal legislation, nor do we endorse, support, or oppose any
political parties or candidates for public office. Research publications reflect the views of the authors and do not necessarily reflect the views of the staff, officers,
or Board of Directors of the Public Policy Institute of California.
Public Policy Institute of California
500 Washington Street, Suite 600
San Francisco, CA 94111
T 415 291 4400 F 415 291 4401
ppic.org/water
read more: contact a ppic expert:
contact a research network expert:
This series is funded by the S. D. Bechtel, Jr. Foundation.
Climate Change and Water
PreParing for floods
managing droughts
the saCramento–san Joaquin delta
Paying for Water
storing Water
Water for Cities
Water for the environment
Water for farms
Jeffrey [email protected]
Ellen [email protected]
Richard Frank, [email protected]
Greg Gartrell, [email protected]
Brian Gray, [email protected]
Peter Moyle, [email protected]
Buzz Thompson, [email protected]
PPIC Sacramento Center
Senator Office Building
1121 L Street, Suite 801
Sacramento, CA 95814
T 916 440 1120 F 916 440 1121
Implementsustainablegroundwatermanagement. The new groundwater legislation should be implemented rapidly to
improve agriculture’s drought resilience. Proposition 1 provides $100 million to support local planning efforts in this area.
Modernizemanagementofcutbacks. The sources and uses of water should be tracked better, the reasonable use and public
trust doctrines should be applied in allocation decisions, and priorities for protecting environmental flows and public health should
be set explicitly.
Developanenvironmentalstewardshipstrategy. State leaders should commission an aquatic biodiversity task force to
develop recommendations for action—and related funding—for management of riverine and wetland areas during droughts.
Legislation may be needed to implement task force recommendations. Some ecosystem-oriented funds from Proposition 1 could
be directed toward protecting aquatic habitats from drought.
Conductperiodic“dryruns”fordroughtemergencies. California regularly assesses preparedness for floods, wildfires, earth-
quakes, and other emergencies. The state should also carry out simulations to test agency performance during drought emergencies.
Item 7, PPIC Report

Paying for Water PPIC WATER POLICY CENTER
SucceSSful Water management requireS adequate, reliable funding California’s water system performs vital functions. It supplies water to cities and farms; prevents pollution of lakes, rivers, and
coastlines; protects people and businesses from floods; and supports freshwater ecosystems. Numerous local, state, and federal
agencies oversee this system and raise revenues from a variety of sources. Identifying funding gaps—and finding the best ways to
fill them—are perennial concerns.
The funding source that has received the most public attention is state general obligation bonds—voter-approved debt reimbursed
with General Fund taxes. Six such bonds were approved between 2000 and 2006, providing roughly $15 billion for water projects.
In November 2014, voters approved Proposition 1, a $7.5 billion bond that extends this support.
State bonds are important, but they actually play a minor role in financing California water. Bonds provide at most $1 billion of the
more than $30 billion in annual water-related spending. Local revenue, from water and sewer bills to taxes, provides the lion’s share,
84 percent. The state contributes 12 percent and the federal government 4 percent.
California’s urban water and sewer systems face challenges, but overall they are in reasonably good fiscal health. In contrast, other
areas face critical gaps totaling $2–3 billion annually—a result of legal constraints on local funding, a shrinking federal contribution,
and unreliable state support. In California’s $2 trillion economy, this problem is manageable. But dealing with it requires a focused
effort. Looking beyond bonds to fill current and potential funding gaps should be a top priority.
LocaL utiLities raise most of the money spent on water in caLifornia
20
15
10
5
0
Bill
ions
of
201
2 $
per
yea
r
Water supply
Water quality
Flood management
Aquatic ecosystems
GO debt service
Federal (4%)
State (12%)
Local (84%)
$2.2
$10.1
$16.9
<$1 <$1
Annual water system spending (2008−2011)
SOURCE: Ellen Hanak et al., Paying for Water in California (PPIC, 2014).
NOTES: The figure reports average spending for 2008–2011. State and local expenditures are net of grants from higher levels of government. The water quality category includes management of wastewater and approximately $500 million for polluted stormwater and other runoff.
conStitutional changeS have harmed local Water finance Local finance is the lifeblood of California’s water system. But a series of constitutional amendments—Propositions 13 (1978),
218 (1996), and 26 (2010)—have made raising funds for local water services more difficult than ever.
• Thechangeshaveincreasedaccountability,butwithunintendedconsequences.
Proposition 218’s rate-setting reforms have improved transparency and public accountability. At the same time, voter-approved
measures have imposed overly simplistic cost-recovery requirements. These inhibit local agencies from investing in new supply,
such as recycled water and conservation, and pollution control, such as stormwater capture and treatment.
A p r i l 2 015
Item 7, PPIC Report

• Strictervoterrequirementsimpededeliveryofsomeessentialwaterservices.
For flood and stormwater management, a majority of landowners or a two-thirds majority of all local voters must now approve
new fees and assessments—previously, these were approved by elected governing boards. In addition, new local taxes for water
programs must now get two-thirds voter approval—a much higher hurdle than the simple majority required for local general
taxes or state ballot measures. The new state water bond—widely considered to have passed by a landslide with a 67.1 percent
approval vote—would barely have squeaked by under the rules governing local tax measures.
urban Water and SeWer SyStemS are Performing reaSonably WellUnlike flood and stormwater agencies, California’s water supply and sewer utilities are exempt from Proposition 218’s voting
requirement. They have generally been able to get the funds needed to replace aging infrastructure and comply with new treatment
requirements. Investments since the 1990s in conservation, water reuse, and local conveyance and storage were invaluable in
preparing cities for the latest drought.
• Utilitiesfaceloominglegaluncertainties.
Proposition 218’s cost-recovery requirement specifies that rates cannot exceed the cost of providing a service. Some courts
have interpreted this requirement very narrowly, jeopardizing the implementation of important programs, such as conservation-
oriented water rates and the development of recycled wastewater and other nontraditional sources of water.
• Keepingwateraffordableforlow-incomehouseholdswillbeachallenge.
Water and sewer bills have been rising to keep pace with investment needs. For most Californians, these charges are a small
share of income. For low-income households, however, affordability is a growing concern. Proposition 218 restricts the ability of
water utilities to provide “lifeline” discounts to low-income households. Such discounts have helped make energy and telephone
billing systems more equitable.
california’S Water SyStem haS multiPle fiScal orPhanSCalifornia is failing to adequately fund five services that protect public health and safety and the environment: safe drinking water
in small, disadvantaged communities; flood protection; control of stormwater and other polluted runoff; management of aquatic
ecosystems; and integrated water management.
• Safewaterisunaffordableinsomeruralcommunities.
Providing safe drinking water is a special challenge in small, disadvantaged rural communities, where costs per household
are high and local funding resources are scant.
• Federalfundingforfloodprojectshasbeeninadequate.
Federal policy authorizes matching grants of up to 65 percent of project costs for flood protection. But this authorization is
largely unfunded, leading to a large investment backlog. And federal contributions are shrinking because of budgetary restric-
tions. Voters in some communities have approved modest local cost shares, but it will be much harder to pass the larger
charges needed to fill the gap.
• Stormwateragencieshavebeenhithardestbyconstitutionalchanges.
Stormwater management once focused solely on draining streets after storms. Over the past two decades, mandates have
expanded to prevent pollution of rivers, lakes, and beaches by limiting discharges and cleaning runoff before it enters waterways.
It is especially hard to persuade local voters to approve funds for cleanup that mainly benefits downstream communities.
• Mostecosystemmanagementprogramslackareliablefundingbase.
Funding is usually straightforward for ecosystem investments that are a mandatory part of new projects. But most environmental
problems result from past water- and land-use practices, and financial responsibility for fixing them is frequently disputed. Some
communities have approved taxes to support their watersheds. However, this approach is limited by the requirement to have
special taxes approved by two-thirds of the voters.
p p i c .o rGItem 7, PPIC Report

• Integratedwatermanagementishardtofundlocally,despiteitsbenefits.
Integrated water management involves collaboration among agencies with different responsibilities to improve overall system
performance. Proposition 218’s cost-recovery requirements make it hard for water and wastewater agencies to share the costs
of activities that extend beyond their mandates, and financially weaker partners overseeing flood, stormwater, and ecosystem
programs have trouble coming up with their share.
• Statebondshavehelpedfillgaps,buttheyalsohavedrawbacks.
Since 2000, state bonds have helped fund all five gap areas, and Proposition 1 extends some of that support. But bonds are not
a reliable long-term funding source, and they generally don’t cover operating costs. In addition, bonds are repaid from the state
General Fund. During economic downturns, bond repayment can take funds from other important budget areas such as higher
education and health and human services.
• Otherfundingsourcesareneededtopayforfiscalorphans.
To close funding gaps, California needs a broader, more reliable mix of state and local funding sources, including new fees and
taxes. Examples include parcel taxes, small surcharges on water and chemical use, and small increments to the sales tax. Such
measures are already used in some California communities and in other states.
caLifornia needs to Go beyond bonds to cLose fundinG Gaps
Gap area Annual gap ($ millions)
Onetime infusion from Prop 1 ($ millions) Other long-term funding options
Safe drinking water in small rural systems $30–$160 $260* � Statewide surcharges on water,
chemical use
Flood protection $800–$1,000 $395
� Developer fees
� Property assessments
� Special state, local taxes
Stormwater management $500–$800 $200
� Developer fees
� Property assessments
� Special state, local taxes
� Surcharges on water, chemical, or road use
Aquatic ecosystem management $400–$700 $2,845** � Special state, local taxes
� Surcharges on water use, hydropower production
Integrated management $200–$300 $510 � Special state, local taxes
� Surcharges on water use
SOURCES: Ellen Hanak et al., Paying for Water in California (PPIC, 2014) and bill text for AB 1471, the Water Quality, Supply, and Infrastructure Improvement Act of 2014.
* These funds are available for communities of all sizes. Another $260 million is available for small community wastewater systems.
** This includes the $1.495 billion earmarked for ecosystem investments and $1.35 billion from water storage project matching funds set aside for ecosystem benefits.
looking aheadCalifornia must fill a critical $2–3 billion annual funding gap across a number of essential functions: ensuring clean drinking water for
all residents; protecting residents from flooding; keeping beaches, rivers, and lakes safe for recreation; safeguarding threatened
aquatic ecosystems; and fostering integrated water management. Action is also needed to avoid funding problems for urban water
and wastewater systems, given the uncertain legal status of financing these services.
Usenewbondfundstofillrealgaps. Proposition 1 will inject $7.5 billion into the water system. The legislature and state
agencies should make sure these state funds are not simply substituting for local funds.
p p i c .o rGItem 7, PPIC Report
The PPIC Water Policy Center spurs innovative water management solutions that support a healthy economy, environment, and society—now and for future generations.
The Public Policy Institute of California is dedicated to informing and improving public policy in California through independent, objective, nonpartisan research. We are
a public charity. We do not take or support positions on any ballot measure or on any local, state, or federal legislation, nor do we endorse, support, or oppose any
political parties or candidates for public office. Research publications reflect the views of the authors and do not necessarily reflect the views of the staff, officers,
or Board of Directors of the Public Policy Institute of California.
Public Policy Institute of California
500 Washington Street, Suite 600
San Francisco, CA 94111
T 415 291 4400 F 415 291 4401
ppic.org/water
read more: contact a ppic expert:
contact a research network expert:
This series is funded by the S. D. Bechtel, Jr. Foundation.
Climate Change and Water
PreParing for floods
managing droughts
the saCramento–san Joaquin delta
Paying for Water
storing Water
Water for Cities
Water for the environment
Water for farms
Caitrin [email protected]
Dean Misczynski [email protected]
Ellen [email protected]
Brian Gray, [email protected]
Katrina Jessoe, [email protected]
David Mitchell, mitchell@mcubedecon.com
PPIC Sacramento Center
Senator Office Building
1121 L Street, Suite 801
Sacramento, CA 95814
T 916 440 1120 F 916 440 1121
Lookbeyondbonds. One legislative priority should be to help local agencies raise needed funds. For example, the legislature
could expand local funding authority and provide guidance to the courts on how their interpretations of Proposition 218 may affect
water program financing. Another priority is to enact new state fees and taxes to boost funding for fiscal orphans.
Reducewatermanagementcosts. State and federal agencies need to coordinate their activities better to reduce regulatory
inefficiency. Obtaining permits represents a major time and cost drain for environmental programs that are already strapped for
funding. The legislature could ease the burden by authorizing regional permits in places where significant investments are needed.
Communicatewaterratedecisionsmoreeffectively. Utilities have been most successful when the public understands the
reasons for rate increases. This is a special challenge during droughts, when customers are often unprepared for the rate increases
needed to offset revenue losses from water shortages and water use restrictions. Utilities also must build strong administrative
records of rate decisions to meet potential Proposition 218 court challenges.
Considerconstitutionalreforms. To solidify local funding bases for water services, voters may need to approve several
constitutional changes that address the unintended consequences of previous amendments—while retaining transparency and
accountability requirements. These might include revising Proposition 218’s cost-recovery requirements, stipulating that flood
and storm water programs should be treated like water and wastewater programs, and lowering vote thresholds for special taxes
to a simple majority, the same as general taxes.
Item 7, PPIC Report

Preparing for Floods PPIC WATER POLICY CENTER
CaliFornia is Flood Prone Damaging floods are common throughout California. Over the past 60 years, every county has been declared a state or federal
flood disaster area multiple times. And since the early 1980s, Central Valley levees have failed on more than 70 occasions, including
more than 40 times in the Sacramento–San Joaquin Delta. More than seven million residents and hundreds of billions of dollars in
assets are vulnerable.
California flood management faces significant challenges. There is a large and growing gap between flood infrastructure needs and
rates of investment. Population growth and new development are increasing the threats to public safety and the economic risk from
flooding. The Paterno court decision in 2003 held the state liable for damages caused by failure of a locally maintained levee,
exposing taxpayers to billions of dollars in potential costs. The changing climate is likely to bring larger and more frequent floods,
increasing pressure on flood management systems that were designed for conditions in the early 20th century. Finally, a rising sea
level and extreme high tides are increasing flood risk in communities bordering the ocean, the San Francisco Bay, and the Delta.
Millions of residents and Many billions of dollars of property are vulnerable to floods
South Lahontan150,000
South Lahontan150,000
North Coast40,000
North Coast40,000
Population living in 500-year floodplainPopulation living in 500-year floodplain Value of structures in 500-year floodplainValue of structures in 500-year floodplain
Sacramento River930,000
Sacramento River930,000
Tulare Lake500,000
Tulare Lake500,000
Colorado River230,000
Colorado River230,000
South Coast3,410,000South Coast3,410,000
San Joaquin River540,000
San Joaquin River540,000
Central Coast430,000
Central Coast430,000
North Lahontan4,000
North Lahontan4,000
San Francisco Bay
1,040,000
San Francisco Bay
1,040,000
South Lahontan$10 billion
South Lahontan$10 billion
North Coast$4 billion
North Coast$4 billion
Sacramento River$70 billion
Sacramento River$70 billion
Tulare Lake $30 billionTulare Lake $30 billion
Colorado River$20 billion
Colorado River$20 billion
South Coast$230 billion South Coast$230 billion
San Joaquin River$40 billion
San Joaquin River$40 billion
Central Coast$40 billion
Central Coast$40 billion
North Lahontan$1 billion
North Lahontan$1 billion
San Francisco Bay
$130 billion
San Francisco Bay
$130 billion
SOURCE: California Department of Water Resources and U.S. Army Corps of Engineers, California’s Flood Future: Recommendations for Managing the State’s Flood Risk (2013).
NOTES: The figure shows population and structures in the 500-year floodplain—the area susceptible to floods so large that they have just a 0.2 percent chance of occurring in a given year. Levees protect much of this area from a “100-year flood,” which has a 1 percent chance of occurring in a given year. Population is adjusted to 2010 levels. Value of structures is based on the depreciated replacement value of structures and their contents in 2010 dollars.
Vulnerability to Floods is HigH and risingMost of California’s annual precipitation occurs during a few intense storms. One type of storm, called an atmospheric river, is
California’s version of a hurricane, with extreme rainfall, high winds, and coastal storm surges. When these storms occur, runoff
flows rapidly into valleys and coastal areas, potentially creating widespread, damaging floods. Exposure to both large and smaller
floods is already high and on the rise.
A p r i l 2 015
Item 7, PPIC Report

• Oneinfiveresidentslivesinaflood-pronearea.
Four percent of all Californians live in areas that flood frequently. Another 17 percent are protected by levees and other infra
structure against a “100year” flood—a flood with a 1 percent chance of occurring in any year. But these people remain vulnerable
to larger, less frequent floods. The 100year federal standard is generally considered insufficient for urban areas, where damages
from larger floods would be quite high. The replacement value of buildings vulnerable to floods exceeds $575 billion. Roads,
airports, and other public infrastructure are also exposed.
• Floodplains,coastalareas,andurbandrainageareofspecialconcern.
Cities and farms on floodplains, such as those in the Central Valley, rely on levees, and failure of these levees can cause exten
sive damage. In the San Francisco Bay Area and South Coast, extreme tides and storm surges threaten coastal communities
with floods. Inadequate drainage systems also make many cities vulnerable to localized flooding from storm runoff.
• MajorlosseswouldoccurfromadisasterliketheGreatFloodof1862.
The U.S. Geological Survey recently assessed the probable effects of a series of intense atmospheric river storms—similar
to those in late 1861 and early 1862. One in five California homes would be damaged or destroyed, and loss of life would be
extensive. More than 1.5 million people would require evacuation, and economic losses would approach $725 billion. Such
losses far exceed those from large earthquakes, which occur with similar frequency—on average, once every few centuries.
It is not economically feasible to protect California against all losses. Still, it is essential that the state prepare for these rare
events, developing evacuation and recovery plans and reducing impacts where possible.
• Thelikelihoodoflargeandsmallfloodsisgrowing.
Recent climate change simulations for California suggest that conditions that cause flooding, including atmospheric rivers and
a rising sea level, may increase in intensity and frequency. This would mean more large, dangerous floods and more “nuisance”
floods—which are smaller but more frequent and cause significant property damage. These changes, coupled with a growing
population, will require significant investments in flood protection infrastructure and innovative approaches to reducing risk.
eFFeCtiVe risk management requires a ComPreHensiVe toolkitReducing flood risk—the frequency and consequences of flooding—will require a combination of approaches. In particular, California
needs to make infrastructure investments to strengthen flood protection and to take nonstructural measures, such as better
landuse planning to keep people and buildings out of harm’s way. Of course, it is not possible to prevent all flooding. People living
in floodprone areas—particularly those behind levees—will always face some residual risk. This calls for additional tools, such as
insurance.
• California’sfloodinfrastructureisunderfunded.
A recent state study put the cost of upgrading levees and other defenses at more than $34 billion. PPIC found an annual funding
gap of $800 million to $1 billion for making these investments within a 25year time frame. Because federal and state funds are
limited, the funding burden will increasingly fall on localities. Local taxes and fees currently fund most maintenance but pay for
less than half of infrastructure investments. On average, filling the gap would require roughly doubling local spending. In the
floodprone Sacramento and San Joaquin River regions, the increases would need to be much larger.
• Betterland-useplanningcanreducerisk…
Landuse planning is widely seen as the most costeffective and sustainable way to reduce economic and social risks from
floods. This approach keeps new highvalue development away from vulnerable areas. Relocating vulnerable buildings and
roads may be desirable in some lowdensity areas—and may even be necessary as the climate changes—though it is often
politically unpopular and can be costly.
• …butfederalpoliciesdonotadequatelypreventfloodplaindevelopment.
To participate in the National Flood Insurance Program and to be eligible for federal disaster relief, communities must require
special, costly protections for new buildings that would be inundated by a 100year flood. Many California communities have
constructed levees and other flood infrastructure that protects entire neighborhoods to the 100year flood standard. This allows
p p i C .o rGItem 7, PPIC Report

them to develop these areas without special protections for individual buildings, thereby increasing the economic risk from
inevitable flooding. The state recently doubled the protection standard for urban areas in the Central Valley. The cost of meeting
this standard will probably discourage some development.
• FederalfloodinsuranceisundersubscribedinCalifornia.
Federal flood insurance reduces flooding’s economic costs by helping homeowners, businesses, and communities recover more
quickly. In 2005, only 30 percent of California households at highest risk of flooding carried insurance. Just 7 percent of those
with moderate risk carried insurance.
fillinG the flood fundinG Gap loCally would Cost Central valley residents Most
Dollars per capita per year
Current per capita local flood spending
Additional per capita cost of closing investment gap with local funding
North Coast
Bay Area
Central Coast
South Coast
Sacramento River
San Joaquin River
Tulare Lake
Lahontan
Colorado River
CALIFORNIA
$74
$38
$41
$26
$43
$22
$18
$1
$0
0 20 40 60 80 100 120 140 160
$29
$6
$21
$15
$14
$151
$85
$19
$6
$3
$29
SOURCE: Ellen Hanak et al., Paying for Water in California (PPIC, 2014)
NOTES: Per capita costs based on 2010 population data; current spending is for 2011. Counties are assigned to hydrologic regions where most of their population lives. Colorado River region estimates are for Imperial County only. Lahontan includes the North and South Lahontan hydrologic regions.
• Floodinfrastructurecanprovideenvironmentalandwatersupplybenefits.
Flood protection can be improved by setting levees back from rivers and allowing waters to spread out on undeveloped flood
plains. Such an approach also boosts habitat, as the Yolo Bypass near Sacramento shows. Better fire management in upstream
forests can diminish peak flood flows and mudslides. Retaining more urban stormwater—by using rain gardens, for example—
can reduce nuisance flooding, improve surface water quality, and recharge groundwater basins.
• Adaptingtoarisingsealevelwillrequirebalancinggoals.
Traditional infrastructure for protecting coastal communities, such as seawalls and levees, is costly, restricts public coastal
access, and harms the environment. To balance coastal management goals, California should consider where to protect existing
development by building new infrastructure and where to retain or restore more natural coastline features such as beaches and
marshes.
• Protectingfarminginfloodplainsmayrequirespecialpolicies.
Viable farms on floodplains reduce pressure to develop these lands. That helps to avoid the high economic, social, and environ
mental costs of a large flood protection infrastructure. But federal rules on new construction can make it very expensive to
maintain farms in the Central Valley’s deep floodplains.
p p i C .o rGItem 7, PPIC Report

The PPIC Water Policy Center spurs innovative water management solutions that support a healthy economy, environment, and society—now and for future generations.
The Public Policy Institute of California is dedicated to informing and improving public policy in California through independent, objective, nonpartisan research. We are
a public charity. We do not take or support positions on any ballot measure or on any local, state, or federal legislation, nor do we endorse, support, or oppose any
political parties or candidates for public office. Research publications reflect the views of the authors and do not necessarily reflect the views of the staff, officers,
or Board of Directors of the Public Policy Institute of California.
Public Policy Institute of California
500 Washington Street, Suite 600
San Francisco, CA 94111
T 415 291 4400 F 415 291 4401
ppic.org/water
read more: Contact a ppiC expert:
Contact a research network expert:
This series is funded by the S. D. Bechtel, Jr. Foundation.
Climate Change and Water
PreParing for floods
managing droughts
the saCramento–san Joaquin delta
Paying for Water
storing Water
Water for Cities
Water for the environment
Water for farms
Ellen [email protected]
Jeffrey [email protected]
Matt Kondolf, [email protected]
Carolyn Kousky, [email protected]
Nicholas Pinter, [email protected]
Brett Sanders, [email protected]
PPIC Sacramento Center
Senator Office Building
1121 L Street, Suite 801
Sacramento, CA 95814
T 916 440 1120 F 916 440 1121
looking aHeadIt is hard to draw attention to flood management during a drought. Nevertheless, this is precisely the time to act to reduce future
flood risk.
Expandlocalfundingtools. Local flood management agencies need more ways to raise funds. Since 1996, constitutional
restrictions have required voter or property owner approval for any increases in flood or stormwaterrelated charges, a hurdle that
makes it very difficult to fund needed investments. The funding gap could be reduced by treating flood agencies like water and
sewer utilities—that is, by requiring transparent accounting but allowing elected governing boards to raise fees.
Increaseincentivestocarryfloodinsurance. To help manage risk, California should expand flood insurance use. One novel
approach would give local or regional flood management agencies authority to buy insurance for the community. Pooling resources
this way would increase coverage and cut costs. The legislature could encourage this by creating mechanisms to recover costs
through assessments or fees.
BuildonCentralValleyreforms. In 2007, California enacted a package of flood management reforms for the Central Valley,
including higher protection standards, greater riskreduction responsibility for communities, new planning tools, and incorporation
of ecosystem objectives and climate change. Many of these reforms should be adopted in other floodprone regions of the state.
Prioritizestatefunding. Since 2006, the state has used bonds to finance flood projects. Proposition 1, approved in November
2014, earmarks an additional $595 million for flood and stormwater management. It is critical that the state set investment priorities
with its limited resources. State funding is especially useful to support projects that take integrated approaches to water manage
ment, benefiting water supply, water quality, ecosystems, and open space—in addition to flood protection.
Item 7, PPIC Report

The Sacramento– San Joaquin Delta PPIC WATER POLICY CENTER
The DelTa iS California’S greaTeST waTer managemenT ChallengeThe Sacramento–San Joaquin Delta is a network of engineered channels and agricultural lowlands at the confluence of the
Sacramento and San Joaquin Rivers. Together with the San Francisco Bay, the Delta forms the largest estuary on the U.S. Pacific
Coast. It is the terminus of California’s largest watershed and a major hub for the state’s water supply. The California State Water
Project and the federal Central Valley Project export water from the southern Delta to more than 25 million people and 3 million
acres of irrigated farmland in the Bay Area, the San Joaquin Valley, and Southern California. The reliability of this supply is declining.
Levees needed to protect Delta farmland and keep salt water at bay are at risk from a rising sea level, winter floods, sinking
farmland, and earthquakes. Changes in the ecosystem are harming native species, including salmon and smelt, which are now
threatened with extinction. Efforts to protect these species are putting pressure on water supplies. The local Delta economy is also
vulnerable to levee failure and declining water quality.
The 2009 Delta Reform Act requires the state to manage the Delta for the “co-equal goals” of providing a more reliable water
supply for California and improving the health of the Delta ecosystem, while also protecting the Delta as a unique and evolving
cultural, recreational, natural, and agricultural place. Implementing this law is difficult and controversial, but the economic, social,
and environmental costs of failure would be high.
farming has radically changed delta habitat
Water
Freshwater emergent wetland (tule marsh)
Willow thicket
Willow riparian scrub or shrub
Valley foothill riparian
Wet meadow and seasonal wetland
Vernal pool complex
Sacramento−San Joaquin Delta habitat types
Alkali seasonal wetland complex
Stabilized interior dune vegetation
Oak woodland or savanna
Agriculture/Non-native
Modern Delta only
Urban/Barren
Managed wetland
Grassland
Historic habitat(early 1800s)
Current habitat(early 2000s)
Area shown
SOURCE: A. Whipple et al., Sacramento–San Joaquin Delta Historical Ecology Investigation: Exploring Pattern and Process (San Francisco Estuary Institute–Aquatic Science Center, 2012).
A p r i l 2 015
Item 7, PPIC Report

The DelTa iS ChangingToday’s Delta is dramatically different from the Delta that existed before its lands, waterways, and upstream watersheds were
developed. This distinctive landscape and ecosystem are still changing in ways that make achieving the Delta Reform Act’s
goals difficult.
• LandreclamationforfarmingtransformedtheDeltalandscape.
In the late 19th and early 20th centuries, some 1,100 miles of levees were built to convert 700,000 acres of tidal marsh into
farmland. “Islands” of farmland were created by surrounding levees. Farming caused peat-rich soils to oxidize and land to sink.
Today, some islands are more than 15 feet below sea level. Sinking land causes drainage problems and increases pressure on
levees—making flooding more likely.
• WatersupplyforfarmsandcitieshasreducedDeltaoutflows.
The Sacramento–San Joaquin River watershed is California’s largest source of water for farms and urban areas. Roughly a third
of the water that would flow into the Delta in an average year is consumed upstream, and approximately one-fifth is exported.
Water flowing out of the Delta into San Francisco Bay supports aquatic species and repels seawater so that water in the Delta
remains fresh enough for farming and urban uses. This outflow averaged just two-fifths of total Delta flows in the 2000s. Water
management has also sharply altered seasonal flow patterns.
delta outflows have declined as farms and cities have increased their water use
80
40
20
10
0
70
60
50
30
1923 1930 1940 1950 1960 1970 1980 1990 2000 2009
Mill
ions
of
acre
-fee
t
Outflow
Upstream diversions
Local Delta diversions
Exports
SOURCE: Updated from Delta Blue Ribbon Task Force, Our Vision for the California Delta, Figure 7b (2007).
• Ecosystemchangeshaveharmednativespecies.
More than 35 native plants and animals that live in or pass through the Delta are now listed under state and federal endangered
species acts. The declines of native fishes, such as delta smelt, longfin smelt, Chinook salmon, and green sturgeon, are due to
many factors: loss of habitat, changes in the volume and timing of flows, changes in water quality, and unfavorable hatchery
and fishing practices. In addition, many alien species have invaded the estuary, often altering the environment and competing
with or preying on native species.
• WaterexportsandtheDeltaeconomyarealsothreatened.
The reliability of water exports is falling as the risk of levee failures increases and conflicts intensify over flows required to protect
endangered species. Levee instability also threatens Delta farming and infrastructure. Invasive aquatic plants such as water
hyacinth interfere with boating, a key part of the Delta’s recreation economy.
P P i c .o rgItem 7, PPIC Report

• Thechangingclimatewillmakeithardertoachieveallmanagementgoals.
Competition between human and environmental uses of water is likely to intensify. Higher temperatures and increasing climate
variability will change the timing and magnitude of flows into the Delta, raising levee failure risks and reducing the reliability of
water exports. A rising sea level will put more pressure on levees and require larger outflows to keep Delta waters fresh. Warming,
increasing salinity, continued invasions of alien species, and flow changes will compound the threats to native fishes. Meanwhile,
population growth will raise the demand for reliable water supplies.
BalanCing waTer Supply anD eCoSySTem goalS iS a maJor ChallengeCalifornia has struggled for decades to find a balance between diverting Delta water for economic purposes and allowing it to flow
through the Delta to support the ecosystem. Federal, state, and local agencies that use Delta exports are seeking a 50-year permit
from fish and wildlife regulators to construct facilities that improve water supply reliability while reducing stress on the ecosystem.
Major decisions in this effort—called the Bay Delta Conservation Plan (BDCP)—are expected in 2015.
• TheBayDeltaConservationPlanisambitious…
Most Delta exports are now drawn through the Delta’s channels from the Sacramento River to large pumps in the southern
Delta. The BDCP would build two tunnels to transport some of that water to these pumps. The plan also foresees extensive
restoration of tidal marsh and floodplain habitat as well as new water operations to help endangered species.
• …andithasmanyuncertainties.
The BDCP is likely to improve water supply reliability. But it is uncertain how future climatic, ecosystem, and regulatory condi-
tions will affect this and other goals. For example, it is unknown whether the proposed ecosystem improvements will substantial-
ly benefit native fish populations. To succeed, the BDCP will require ongoing flexibility, experimentation, and refinement.
• Costsarehigh,withnoclearfundingfortheecosystem.
Tunnel construction costs of approximately $17 billion are to be paid by urban and farm customers who use Delta exports rather
than by taxpayers. However, there is no clear mechanism for funding most ecosystem improvements and related science and
monitoring, which are expected to cost roughly $8 billion. Proposition 1—the state bond approved by voters in November 2014—
provides less than $140 million for the Delta ecosystem.
improving DelTa leveeS iS anoTher Big ChallengeThe Delta’s 1,100 miles of levees support the local economy and the current system of water exports. High costs to upgrade levees
as well as low land values and limited state and federal funding create tough choices on how to invest.
• Economicjustification—andfunds—toimproveallDeltaleveesareinsufficient.
According to recent state estimates, more than $12 billion in flood investments are needed in the five Delta counties. This
includes levees in the inner Delta, where few people live, and urban areas such as West Sacramento and Stockton, where large
populations are vulnerable. The entire region faces a large funding gap. Furthermore, costs of upgrading many of the Delta’s
agricultural levees exceed the economic value of the land they protect, and only some Delta levees are needed to keep Delta
waters fresh.
• Limitedstatefundsneedtobeprioritized.
State bonds approved in 2006 dedicated nearly $600 million to Delta levees. Proposition 1 earmarks another $295 million. The
Delta Stewardship Council is now setting priorities for using these funds.
looking aheaDIf Californians put off difficult decisions about the Delta, then the Delta’s growing population, changing climate, and deteriorating
ecosystem will make it even harder to find solutions. Five areas need immediate attention.
P P i c .o rgItem 7, PPIC Report

The PPIC Water Policy Center spurs innovative water management solutions that support a healthy economy, environment, and society—now and for future generations.
The Public Policy Institute of California is dedicated to informing and improving public policy in California through independent, objective, nonpartisan research. We are
a public charity. We do not take or support positions on any ballot measure or on any local, state, or federal legislation, nor do we endorse, support, or oppose any
political parties or candidates for public office. Research publications reflect the views of the authors and do not necessarily reflect the views of the staff, officers,
or Board of Directors of the Public Policy Institute of California.
Public Policy Institute of California
500 Washington Street, Suite 600
San Francisco, CA 94111
T 415 291 4400 F 415 291 4401
ppic.org/water
read more: contact a PPic expert:
contact a research network expert:
This series is funded by the S. D. Bechtel, Jr. Foundation.
Climate Change and Water
PreParing for floods
managing droughts
the saCramento–san Joaquin delta
Paying for Water
storing Water
Water for Cities
Water for the environment
Water for farms
Ellen [email protected]
Jeffrey [email protected]
James Cloern, [email protected]
William Fleenor, [email protected]
Brian Gray, [email protected]
Wim Kimmerer, [email protected]
Peter Moyle, [email protected]
PPIC Sacramento Center
Senator Office Building
1121 L Street, Suite 801
Sacramento, CA 95814
T 916 440 1120 F 916 440 1121
Makeastrategicdecisiononwatersupply. In taking action to ensure future water supplies, the state must decide whether to
move forward with the BDCP, modify the plan to reduce its costs and impacts, or prepare for large permanent reductions in Delta
water exports. The last alternative would reduce farming in the southern Central Valley and force cities in the Bay Area and Southern
California to turn to more expensive sources of water.
Ensurerobustscientificsupport. Scientific and technical support for managing the Delta has been underfunded and poorly
organized. To improve decisionmaking and reduce controversy and litigation, the state and federal governments should make sub-
stantial, sustained investments in more integrated scientific work, as outlined in the new Delta Science Plan.
Reversethedeclineofnativefishes. California has compelling social and economic reasons to reverse the decline of Delta fish
populations, including avoiding regulatory costs. Because the science is uncertain, bold experiments are needed in habitat resto-
ration, flow changes, and management of fisheries and invasive species. Agencies will need to adjust flow management and take
other actions as scientific understanding improves. This work requires reliable funding.
Setprioritiesforstateleveefunding. California needs a transparent and effective plan for investing limited state funds in Delta
levees. Priority should go to investments that provide broad social, economic, and environmental benefits for the Delta region.
Some funds should be set aside to support economic transitions in places where levees cannot be sustained.
Incorporatelong-termchangeintoallaspectsofplanning. The state should consistently take into account the significant
effects on the Delta of climate change, rising sea level, shrinking sediment supply, introductions of new species, and other long-
term changes. Adaptation strategies are needed for improving water supply, managing ecosystems and species, and prioritizing
levee maintenance.
Item 7, PPIC Report

Storing Water PPIC WATER POLICY CENTER
Storage iS eSSential for managing California’S WaterWater stored during the wet winter and spring months provides supplies for California’s dry summers and frequent droughts.
Stored water is also used for recreation, hydropower, and to mitigate harmful effects of dams on river and wetland ecosystems.
During large storms, storage reduces peak flood flows and downstream damage.
Water storage in California takes many forms. Some 1,400 surface reservoirs can store up to 42 million acre-feet—equivalent to a
year’s supply for the state’s farms and cities. The state’s 515 groundwater basins hold at least three times as much usable water
as the surface reservoirs. The mountain snowpack is another source, releasing water gradually during the spring when irrigation
demands increase. Finally, water is stored in soils, which supports plant growth and helps regulate storm runoff.
California faces numerous challenges in managing water storage: balancing competing goals, such as flood protection versus
water supply; reducing environmental harm caused by dams; addressing the long-term deterioration of groundwater resources
from excess pumping and pollution; and adapting to a smaller snowpack as the climate warms. Important advances were made
in 2014. The legislature passed the Sustainable Groundwater Management Act, which will strengthen local groundwater manage-
ment. Voters approved Proposition 1, which allocates $2.7 billion in bond funds to support the public benefits of new storage
projects—including environmental restoration, flood protection, and recreation—and additional funds for groundwater management
and cleanup.
Rising tempeRatuRes will shRink the sieRRa nevada snowpack
Area shown
2090 SWE: 48%2030 SWE: 95% 2060 SWE: 64%
100 20 30 40 50 60 70 80 90 100
Percentage
SOURCE: N. Knowles and D. R. Cayan, “Potential Effects of Global Warming on the Sacramento/San Joaquin Watershed and the San Francisco Estuary,” Geophysical Research Letters 29, no. 18 (2002).
NOTES: SWE is snow water equivalent. These scenarios are based on projected temperature increases: 0.6˚C (2020–2039), 1.6˚C (2050–2069), and 2.1˚C (2080–2099), expressed as a percentage of estimated present conditions (1995–2005). These are modest increases relative to some model projections. With higher temperature increases, the snowpack would be commensurately smaller.
groundWater iS California’S moSt important drought reServeGroundwater is California’s largest source of storage. On average, groundwater supplies about a third of the water used annually
by cities and farms, and more in some regions. During droughts groundwater can supply half of statewide water use.
A p r i l 2 015
Item 7, PPIC Report

• Unregulatedpumpingcausesmultipleproblems.
Until recently, the state has only loosely regulated groundwater use. Many basins have experienced overdraft—excess pumping
that causes long-term water table declines. Lower water tables increase energy costs of pumping, reduce groundwater quality,
cause land to sink, damage roads and other infrastructure, and drain water from river and wetland ecosystems. In addition, less
water is available during droughts when groundwater is most needed.
• Manyurbanareasnowhavewell-developedgroundwaterprograms.
In the early-to-mid 20th century, many Southern California cities and the San Jose area faced problems from unregulated
pumping. They now have tightly managed basins—operating under special legislative or court authority—that regulate and
charge for pumping. Local management agencies replenish basins from local rainfall, distant rivers, and, increasingly, recycled
wastewater and stormwater. Recharge methods include permeable ponds and water injection into wells. To capture and store
stormwater runoff, cities are installing permeable pavement and rain gardens.
• Groundwateroversightinagriculturalareasisstilllimited.
Groundwater overdraft in agricultural regions—mostly in the southern
Central Valley and Central Coast—averages about two million acre-
feet annually, 10 percent of net farm water use statewide. Many farms
are shifting to permanent crops such as orchards and vineyards,
which cannot be fallowed and often rely on groundwater to survive
droughts. Meanwhile, irrigation drainage—the primary recharge
resource in many farming areas—is declining as farmers adopt more
efficient irrigation technology.
• Poorgroundwaterqualityisalsoaproblem.
In Southern California and the Sacramento area, industrial pollutants
limit groundwater use for drinking and prevent some basins from
being replenished. In many farming regions, groundwater contains
high nitrate concentrations from chemical fertilizers and manure. This
contaminates drinking water for many rural households. On the coast,
many aquifers are becoming salty where overdrafting draws in sea-
water. Treatment is an option for large urban systems, but it is usually
too costly for small communities and farms. Recharging basins with
clean water can often improve quality.
• Thenewgroundwaterlawholdspromise.
The act requires water users in the most stressed basins to develop
sustainable groundwater management plans by 2020 and reach sus-
tainability by 2040. The law gives local agencies authority to imple-
ment these plans, including the ability to measure use and charge fees
for pumping. The State Water Resources Control Board can intervene
if it deems local efforts inadequate.
SurfaCe reServoirS provide California’S moSt flexible Storage The state’s surface reservoirs, mostly constructed between the 1930s and 1970s, serve many purposes. They are a flexible form
of storage that can be filled and emptied quickly.
• Surfacestoragehaslimitedvalueduringlongdroughts.
Reservoirs store water for seasonal uses and reserve some water for dry years. During extended droughts, these reserves are
depleted. In 2014, many reservoirs were at or near record lows.
p p i c .o Rg
the sustainable gRoundwateR management act applies to basins acRoss califoRnia
Priority basins for sustainability plans
High
Medium
SOURCE: Department of Water Resources, California Statewide Groundwater Elevation Monitoring Program.
NOTE: Under the act, groundwater users in high- and medium- priority basins must adopt sustainability plans (by 2020 for basins in critical overdraft, and by 2022 for other basins) and attain sustainable management within 20 years. Priority reflects reliance on groundwater; current and projected population and irrigated acreage in the basin; and documented impacts, including overdraft, subsidence, and water quality degradation. In all, 127 basins were categorized as high and medium priority, accounting for 96 percent of annual groundwater pumping.
Item 7, PPIC Report

• Floodstoragecompeteswithwatersupplystorage.
Many large, multipurpose reservoirs release water in the fall and winter to free up space for winter flood flows. Under U.S. Army
Corps of Engineers rules, this flood reserve cannot be refilled until late winter and spring, when the flood season has passed.
If the winter is dry, reservoirs won’t fill up. So early releases can reduce water supply for the year ahead.
• Damsdisruptriverecosystems.
Most California reservoirs lie behind dams that block rivers. Dams limit access to fish spawning habitat and alter downstream
flows in ways that harm native fish, plants, and animals. Reservoir releases can sometimes mitigate these impacts—for example,
by storing and releasing cold water for salmon or maintaining water quality for delta smelt. Some small and midsize dams are
being removed to improve ecosystems, especially when silt buildup or other factors have made the reservoirs less valuable.
• Climatechangewillcomplicatereservoiroperations.
Most climate models predict rising temperatures, increasing climate variability, and more precipitation falling as rain than snow.
A shrinking snowpack and smaller spring runoff will increase the tension of managing reservoirs for flood control, water supply,
and summer hydropower. Rising temperatures will also make it harder to manage cold water for fish.
• Newsurfacestoragemaybecostlyrelativetoitswatersupplybenefits.
New storage could improve water system flexibility. But the average volume of new water from these facilities is small, and costs
are high. Five proposed projects—costing roughly $9 billion—would expand statewide reservoir capacity by about four million
acre-feet. However, these projects would raise annual average supplies by 410,000 acre-feet, or just 1 percent of annual farm
and city use.
managing California’S Storage reSourCeS aS a SyStem Can booSt benefitSCalifornia has a vast interconnected surface and groundwater storage network, linked to water demand centers by rivers, canals,
and aqueducts. Operating this network as a unitary system can boost usable supplies, improve quality, and help mitigate the
impacts of climate change.
• Groundwaterandsurfacestorageworkbettertogether.
During wet periods, water can be moved from storm runoff and surface reservoirs to groundwater basins where it can be saved
for dry periods. This practice—known as conjunctive use—captures additional water and frees up surface reservoir space for
more runoff. Sometimes this can also improve groundwater quality. Conjunctive use is practiced in some places, but great un-
tapped potential exists.
• Conveyanceisoftenabiggerbottleneckthanstoragecapacity.
Significantly expanding groundwater storage in the southern half of California—where basins are most depleted—will be hard
without investments to improve the reliability of water conveyance across the Sacramento–San Joaquin Delta. Some conjunctive
use projects also need local conveyance investments.
• Institutionalbottlenecksarealsoanissue.
More flexibility in reservoir operations would increase benefits from conjunctive use, but this requires federal and state agency
approvals. Better local aquifer management is also needed. And state law regulating groundwater recharge may be too restrictive.
• Betterfloodmanagementcanhelp…
Making more room on floodplains by setting back levees can improve flood protection and create temporary storage of flood-
waters. This practice can also recharge local aquifers, improve habitat, and preserve open space for farming and recreation.
• …andsocanbetterwatershedmanagement.
Forest management in upper watersheds can increase available streamflow by as much as 10 percent by reducing losses from
plant growth and augmenting water retained in snowpack and soils. However, implementing these changes on millions of mountain
acres is a challenge.
p p i c .o RgItem 7, PPIC Report

The PPIC Water Policy Center spurs innovative water management solutions that support a healthy economy, environment, and society—now and for future generations.
The Public Policy Institute of California is dedicated to informing and improving public policy in California through independent, objective, nonpartisan research. We are
a public charity. We do not take or support positions on any ballot measure or on any local, state, or federal legislation, nor do we endorse, support, or oppose any
political parties or candidates for public office. Research publications reflect the views of the authors and do not necessarily reflect the views of the staff, officers,
or Board of Directors of the Public Policy Institute of California.
Public Policy Institute of California
500 Washington Street, Suite 600
San Francisco, CA 94111
T 415 291 4400 F 415 291 4401
ppic.org/water
Read more: contact a ppic expert:
contact a research network expert:
This series is funded by the S. D. Bechtel, Jr. Foundation.
Climate Change and Water
PreParing for floods
managing droughts
the saCramento–san Joaquin delta
Paying for Water
storing Water
Water for Cities
Water for the environment
Water for farms
Sarge Green, [email protected]
Jason Gurdak, [email protected]
Thomas Harter, [email protected]
Josué Medellín-Azuara, [email protected]
Samuel Sandoval, [email protected]
Buzz Thompson, [email protected]
Joshua Viers, [email protected]
Jeffrey [email protected]
Ellen [email protected]
PPIC Sacramento Center
Senator Office Building
1121 L Street, Suite 801
Sacramento, CA 95814
T 916 440 1120 F 916 440 1121
looking aheadIn 2014, Californians took important steps to address water storage. But much important work lies ahead.
Developgroundwatersustainabilityplans. Delay will encourage more overdrafting and make future choices harder. Proposi-
tion 1 provides $100 million for local planning efforts. Additional legislation may be needed to help agencies allocate pumping rights
more quickly and clarify groundwater storage rights.
Protectandrestoregroundwaterquality. Controlling new sources of pollution and cleaning up contaminated basins can
improve groundwater storage. Meanwhile, safe drinking water in rural, groundwater-dependent communities is urgently needed.
New bond funds are available for both purposes.
Promoteflexibilityandintegrateoperations. The state and its federal partners should establish more flexibility in reservoir
operation rules to allow more efficient use of storage. Modern forecasting technology and better system coordination can help
improve the timing and uses of reservoir releases.
Prioritizebondinvestmentsinstorage. The state should carefully evaluate the environmental and other public benefits of new
storage projects, seeking maximum flexibility and the highest return on public dollars. This may make new surface reservoirs a lower
priority, instead favoring improvements in groundwater storage and conveyance facilities that connect surface and groundwater.
Item 7, PPIC Report

Water for Cities PPIC WATER POLICY CENTER
Despite progress, California’s Cities faCe Water management ChallengesThe water system that supplies California’s households, businesses, and industries is vast and complex. Nearly 400 large utilities—
each serving more than 10,000 people—supply more than 90 percent of the state. Thousands of smaller utilities provide water to
rural communities. Most utilities are public agencies with locally elected governing boards. Privately owned utilities serve about
16 percent of Californians.
Large utilities enjoy many advantages. They can spread fixed infrastructure costs over a wide customer base. They often have
several water sources and extensive technical expertise. In recent decades, they have expanded connections with neighboring
utilities, which allows water sharing during shortages. By contrast, smaller utilities are often geographically isolated and face high
costs per customer for new investments. They usually rely on local groundwater and have limited in-house resources.
Despite the addition of more than eight million new residents, the state’s large urban systems were better prepared for the latest
severe drought than for the last one (1987–92). This improvement reflects significant investments in conservation, storage, new
supplies, and interconnections. Some small systems have not fared as well.
Both large and small utilities face water supply and quality challenges. Many large utilities import water from the Sacramento–
San Joaquin Delta from other distant locations. Infrastructure weaknesses and claims on water for the environment are making
these sources increasingly vulnerable. Many utilities that rely on groundwater must contend with contamination. Utilities also need
to prepare for a growing population and the likelihood that climate change will bring more frequent and sustained droughts.
Per caPita urban water use has been falling since the mid-1990s
Inland
Inland (without the Colorado River)
California
Coastal
400
200
100
50
0
350
300
250
150
1960 1967 1972 1980 1985 1990 1995 2000 2005 2010
App
lied
wat
er u
se (
gallo
ns p
er c
apit
a pe
r da
y)
SOURCE: Author calculations using data from California Water Plan Update (California Department of Water Resources, various years).
NOTES: The figure shows applied water use—the amount delivered to homes and businesses—and excludes energy use, conveyance losses, and active groundwater recharge. Outdoor water use is much higher in inland areas because of hotter temperatures and larger lot sizes. The low-desert Colorado River region, including areas such as Palm Springs, has especially high per capita use, in part because of golf-based tourism.
A p r i l 2 015
Item 7, PPIC Report

Water use in Cities is ChangingFollowing decades of increases, total urban water use began to flatten in the mid-1990s, reflecting declines in per-capita use.
Cities now consume about 10 percent of California’s available water compared with 40 percent for farms. The remaining half is
categorized as environmental, such as flows on wild and scenic rivers in the North Coast.
• Percapitawateruseisfalling…
In 2010, average urban daily water use was 178 gallons per capita, down from 232 in 1995. More recent estimates suggest con-
tinued declines. The adoption of low-flow plumbing fixtures and appliances has been a major factor. Low-flow toilets and shower-
heads have been required in new construction since the early 1990s and encouraged in older buildings by rebate programs.
• …whilethevalueofwaterintheurbaneconomyisrising.
California’s urban economy depends less and less on water-intensive activities, such as computer chip manufacturing. Industry
now uses only 6 percent of urban water, down from 8 percent in 1990. Businesses in other sectors have been reducing water
use while continuing to grow. In 2010, water used by cities generated roughly 2.4 times more economic value per gallon than it
did in 1967, measured by output of goods and services in inflation-adjusted dollars.
• Landscapeirrigationisthelargesturbanwateruse.
Outdoor watering accounts for roughly half of statewide urban use and more in inland areas, where summers are hotter and lots
tend to be larger. Despite recent progress, outdoor use remains an important frontier for conservation. Savings can come from
installing more efficient irrigation systems and replacing thirsty lawns with more drought-tolerant plants.
• Demandismoreresponsivetolocalconditionsthantostatewidemandates.
In January 2014, Governor Jerry Brown called on Californians to reduce water use by 20 percent. In July, the State Water
Resources Control Board issued restrictions on outdoor water use. Communities that faced near-term shortages—including
Santa Cruz and the Folsom area—achieved large reductions. In many areas, though, the cuts were smaller—often reflecting
less urgent local conditions. Some utilities prefer not to carry out major short-term conservation efforts unless conditions are
dire, in part because large drops in water sales can slash revenue.
landscaPing accounts for roughly half of total urban water use
Commercial and institutional, outdoors
16%
Commercial and institutional, indoors
9%
Industrial6%
Energy production2%
Residential, indoors34%
Residential, outdoors
33%
Urban water use, 2006–20108.5 million acre-feet (maf)
SOURCE: California Department of Water Resources.
NOTES: The figure shows the average applied urban water use, excluding water used to recharge groundwater basins (5%) and conveyance losses (2%). Net water use—i.e., the volume consumed by people or plants, embodied in manufactured goods, evaporated, or discharged to saline waters—is lower (5.9 maf). Commercial and institutional outdoor use includes official estimates for “large landscapes” (parks, golf courses, cemeteries, etc.) and one-third of the total estimate for commercial and institutional demand, which includes other outdoor water use.
P P i c .o rgItem 7, PPIC Report
Cities neeD to manage for reliability, Cost, anD finanCial stabilityUtilities are pursuing a range of strategies to manage demand and diversify water sources. These investments are mainly funded
by revenues from local water sales.
• Pricingisimportantformanagingdemandandrevenue.
Many utilities use regulations and rebates to encourage conservation. But water prices provide fundamental incentives. Many
agencies now use tiered rates, with higher prices per gallon for higher levels of water use. Such rate structures—especially
those that give customers a baseline water budget reflecting household and lot size—can be very effective. To avoid financial
problems, rate structures need to be designed to recover costs when water sales fall or when supply costs increase.
• Toincreaseresilience,manyutilitiesaredevelopinglocalsupplies.
Investments in local supply include a range of actions. Some are relatively low-cost, such as recharging local groundwater basins
with recycled wastewater and stormwater. Others are more costly, such as building new surface storage facilities or seawater
desalination plants. Some local sources require agencies to work together in new ways. For instance, several water utilities may
share the cost of new interconnections or a desalination plant. Expanding recycled water use or stormwater capture usually
requires water utilities to work with other agencies that have traditionally operated separately.
• Importedsuppliesremaincriticalformanycities.
Bay Area and Southern California cities get more than half their water supplies from other regions. Some of this water—
notably imports from the Delta—will require major new investments to remain reliable. In developing their water portfolios, cities
must weigh the relative cost and reliability of imported versus local supplies, while keeping in mind the value of diversifying
water sources.
• Watertradingisagrowingsupplysource.
In several regions, cities are reaching long-term agreements to lease water from farmers and store water in rural groundwater
basins. Leases and exchanges with neighboring cities are also taking place—and have proven very valuable during the latest
drought.
• Proposition218poseschallengesforwatermanagement.
This constitutional change, adopted by voters in 1996, specifies that certain rates and fees cannot exceed the cost of providing
a service. Narrow court interpretations of this strict cost-recovery requirement have put in question the legitimacy of tiered
water rates and the use of water sales revenue to fund recycled water programs. Proposition 218 also restricts the use of water
rates to fund lifeline programs, which energy utilities use to help low-income customers. In addition, the proposition limits the
ability of larger communities to share the cost of annexing smaller systems—a promising solution for ensuring safe drinking
water in some rural communities.
looking aheaDAlthough local agencies bear most frontline responsibility for providing safe and reliable water supplies, state action is also
important to shape the regulatory environment and provide financial incentives. The following areas warrant near-term state
and local attention.
Guidethecourtsonwatermanagementpriorities. Legislation can guide the courts in interpreting Proposition 218’s cost-
recovery requirements. The legislature should emphasize the importance of supply diversification and conservation as strategies
for responding to growing water scarcity.
Usenewbondfundsforcutting-edgeactions. Urban agencies are eligible for more than $2.3 billion in state bond funds for
regional water supply and water quality projects under Proposition 1, approved by voters in November 2014. The state should
ensure that these funds go primarily to innovative projects—especially those that require new types of investment and collabora-
tion—rather than simply substituting for money that urban utilities can raise from water bills.
P P i c .o rgItem 7, PPIC Report

The PPIC Water Policy Center spurs innovative water management solutions that support a healthy economy, environment, and society—now and for future generations.
The Public Policy Institute of California is dedicated to informing and improving public policy in California through independent, objective, nonpartisan research. We are
a public charity. We do not take or support positions on any ballot measure or on any local, state, or federal legislation, nor do we endorse, support, or oppose any
political parties or candidates for public office. Research publications reflect the views of the authors and do not necessarily reflect the views of the staff, officers,
or Board of Directors of the Public Policy Institute of California.
Public Policy Institute of California
500 Washington Street, Suite 600
San Francisco, CA 94111
T 415 291 4400 F 415 291 4401
ppic.org/water
read more: contact a PPic expert:
contact a research network expert:
This series is funded by the S. D. Bechtel, Jr. Foundation.
Climate Change and Water
PreParing for floods
managing droughts
the saCramento–san Joaquin delta
Paying for Water
storing Water
Water for Cities
Water for the environment
Water for farms
Newsha Ajami, [email protected]
Ken Baerenklau, [email protected]
J. R. DeShazo, [email protected]
Jean-Daniel Saphores, [email protected]
Kurt Schwabe, [email protected]
David Sedlak, [email protected]
Ellen [email protected]
PPIC Sacramento Center
Senator Office Building
1121 L Street, Suite 801
Sacramento, CA 95814
T 916 440 1120 F 916 440 1121
Considerlocalsolutionswithinaregionalcontext. As utilities develop local sources such as recycled water and stormwater
capture, they should consider the regional impacts. By reducing discharges, these local projects can reduce streamflows that now
provide important environmental benefits or supply water to communities downstream.
Developflexibleandresilientwaterpricing. Utilities need to hone their rate structures to provide incentives to conserve while
maintaining financial stability. They must anticipate how to remain financially healthy during droughts while encouraging conserva-
tion; for instance, by charging higher prices per gallon during droughts.
Encouragemoreoutdoorconservation. Although indoor water conservation efforts are still desirable, the low-hanging fruit
in residential use has moved outdoors. The shift to low-water landscaping has great potential. Rebate programs—such as the
turf-replacement program now common in Southern California—set important examples but cost too much for widespread use.
A combination of price incentives and changes in attitude is needed to make significant progress.
Stepuppubliceducation. Public concern about water has been very high during the latest drought, but it will probably wane
once the drought abates. Wide-reaching education programs are needed to encourage Californians to use water more sustainably.
Information on the safety of highly treated recycled water is critical, and campaigns to encourage households and businesses to
use less water in landscapes and gardens can be useful.
Keepaneyeoncosts. Utilities must weigh the relative costs and reliability of different supply options. And, when setting prices,
they need to consider water affordability for lower-income households.
Item 7, PPIC Report

Water for the Environment PPIC WATER POLICY CENTER
WatEr is vital for California’s divErsE and troublEd ECosystEmsWith its diverse landscape and climate, California is a biodiversity hot spot—home to more endemic plants and animals than any
other state. California is also an important stop on the Pacific Flyway, providing a winter home for more than four million migratory
ducks and shorebirds. The state’s rivers, lakes, wetlands, and estuaries support this biodiversity.
Dramatic changes in water and land use since statehood in 1850 have transformed California’s freshwater landscape. Today, more
than 1,400 dams block fish migration, cutting off most historical salmon and steelhead spawning habitat. Roughly 95 percent of the
native vegetation along Central Valley rivers and creeks has been lost, including the extensive wetlands that once hosted migratory
waterfowl. Farms and cities use about half of the state’s available water, while discharging chemicals and other pollutants into
waterways. Changes in the volume, timing, and quality of water flows often harm native species and favor invasive species.
Four decades after the enactment of major state and federal environmental laws, California’s freshwater biodiversity is at risk.
Native freshwater fishes—indicators of the health of aquatic ecosystems—have been hit hardest. A quarter of these species are
listed as threatened or endangered under state and federal endangered species acts, and many more are headed toward listing.
For both economic and social reasons, California must improve its stewardship of freshwater ecosystems. Striking a balance
between improving ecosystem health while providing water supply, flood control, and hydropower—with a changing climate and a
growing population—is one of California’s great challenges.
California’s native freshwater fishes are in trouble
100
50
20
10
0
90
70
80
60
30
40
1975 1989 1995 2010 2100 (predicted)
Per
cent
age
Least vulnerable
Extinct
Highly vulnerable
Less vulnerable
3 7 7 7
44
9
1418
31
63
32
5053
69
183
56 44 38 22
SOURCES: R. M. Quinones and P. B. Moyle, “California’s Freshwater Fishes: Status and Management,” FiSHMED Fishes in Mediterranean Environments (2015). P. B. Moyle, J. D. Kiernan, P. K. Crain, and R. M. Quinones, “Climate Change Vulnerability of Native and Alien Freshwater Fishes of California: A Systematic Assessment Approach,” PLoS One (May 22, 2013), doi:10.1371/journal.pone.0063883.
NOTES: The figure shows freshwater native fish status based on field surveys. Bars display the number of fish species for which adequate information for evaluation was available in the specified time period. Predicted status in 2100 assumes continuation of current trends, with added stress from climate change. Extinct means no longer found in California; highly vulnerable means highly vulnerable to extinction by 2100; less vulnerable means less vulnerable to extinction than the previous group; least vulnerable means very low vulnerability to extinction.
A p r i l 2 015
Item 7, PPIC Report
EnvironmEntal WatEr usE is not WEll undErstoodWater counted as “environmental” in state statistics serves a variety of purposes. Although much of this water is not in direct
competition with other uses, a growing volume of water is being allocated to protect endangered species or water quality in some
regions. Because these increases—typically associated with court or regulatory decisions—can reduce water available for other
uses, they often create controversy. A better understanding of environmental water use can help inform future decisions about
water management.
• Waterthatstaysinrivers,streams,andwetlandsisassignedtotheenvironment.
There are four broad types of environmental water: water that flows in rivers protected as “wild and scenic” under federal and
state laws, water needed to maintain habitat within streams, water that supports wetlands for migratory birds, and water needed
to maintain water quality. Water categorized as environmental accounts for half of state use, while farms (40%) and cities (10%)
make up the other half.
• Mostenvironmentalwaterusedoesnotaffectotheruses.
More than half of environmental water is in the wild and scenic rivers of California’s sparsely populated North Coast, where there
are few alternative uses. In the rest of California, where water is shared by all three sectors, environmental use is not dominant,
at 33 percent (versus 53% for farms and 14% for cities). In these regions, new allocations of water for the environment may
reduce water available for other uses.
• Environmentalwateroftendoesdoubleduty.
In the Central Valley, most flows in wild and scenic rivers are captured by reservoirs and reused downstream by farms and cities.
In many systems, minimum flow standards that help fish and other species are set to maintain water quality for drinking water
and irrigation. For instance, in the Sacramento–San Joaquin Delta, freshwater outflows (viewed by some as water “wasted to
the sea”) also keep Delta water fresh enough for local farms and water exports to the Bay Area and the southern half of the
state. In addition, environmental water that goes to wetlands and floodplains recharges groundwater basins.
• Droughtsheightenconflictsoverenvironmentalwaterallocations.
Droughts put pressure on regulators to relax environmental standards in order to boost supplies to farms and cities. In 2014,
the state approved requests to reduce environmental flows and relax salinity standards in the Delta so that water exports for
farms and cities could be increased. During past droughts, low environmental flows caused long-term harm to native species
populations, which ultimately led to higher regulatory costs. It is too soon to know whether recent drought management
practices will have similar effects.
California nEEds to makE EnvironmEntal WatEr usE morE EffECtivEAlthough more freshwater flows will likely be required to improve ecosystem conditions in some regions, new approaches to
ecosystem management are also needed.
• Reducedflowsarenottheonlysourceofecosystemstress.
Habitat loss, water pollution, invasive species, and fishery and wildlife management practices also need to be addressed.
It is not possible to undo all the ecological changes that have occurred over decades of human water and land use. Environ-
mental managers and regulators need to find strategies that are adapted to changed conditions and benefit California’s
ecosystems as well as its economy.
• Environmentalwatercangetmore“popperdrop.”
Often, flow volume is not the most important benchmark for achieving environmental benefits. Significant results can come from
managing water in ways that mimic natural flow variability, even with smaller flow volumes. This often requires changing the
timing of water diversions and releases from reservoirs.
• Restoringhabitatrequireswaterandland.
Riparian zones, floodplains, and wetlands require periodic flooding to provide high-quality habitat. Such beneficial flooding can
be accomplished by removing or setting back levees. Selective removal of dams can also restore fish access to high-quality
P P i C .o rGItem 7, PPIC Report
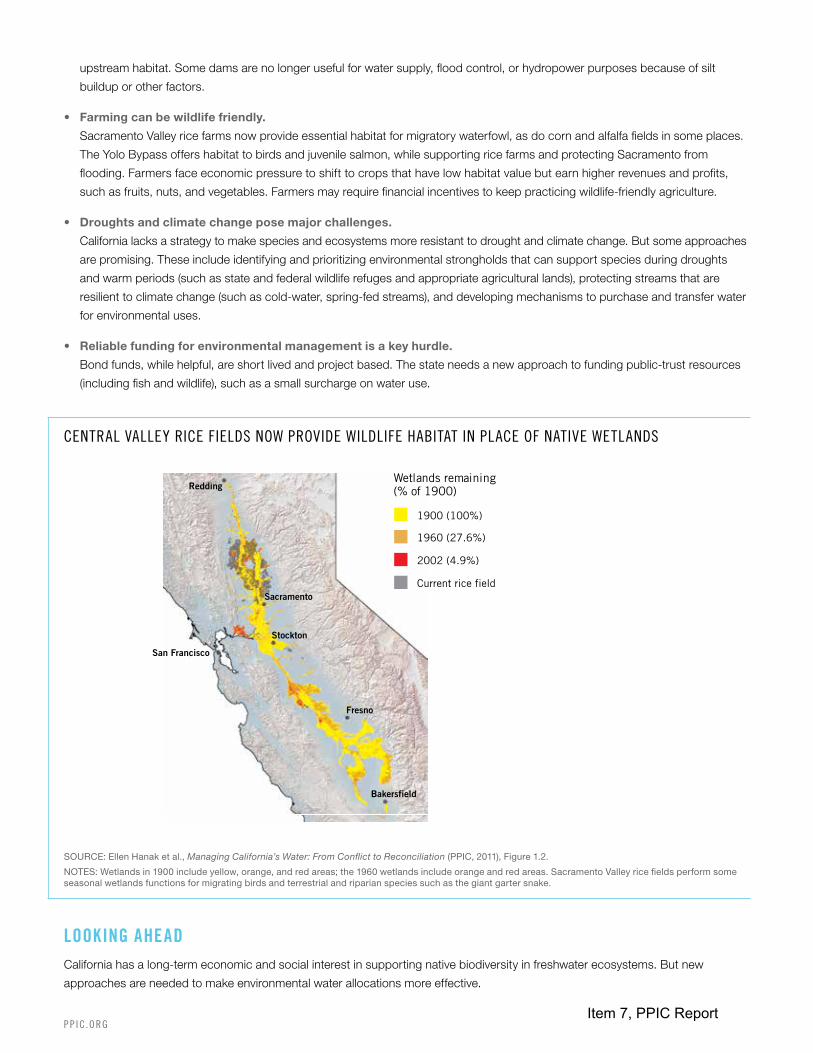
upstream habitat. Some dams are no longer useful for water supply, flood control, or hydropower purposes because of silt
buildup or other factors.
• Farmingcanbewildlifefriendly.
Sacramento Valley rice farms now provide essential habitat for migratory waterfowl, as do corn and alfalfa fields in some places.
The Yolo Bypass offers habitat to birds and juvenile salmon, while supporting rice farms and protecting Sacramento from
flooding. Farmers face economic pressure to shift to crops that have low habitat value but earn higher revenues and profits,
such as fruits, nuts, and vegetables. Farmers may require financial incentives to keep practicing wildlife-friendly agriculture.
• Droughtsandclimatechangeposemajorchallenges.
California lacks a strategy to make species and ecosystems more resistant to drought and climate change. But some approaches
are promising. These include identifying and prioritizing environmental strongholds that can support species during droughts
and warm periods (such as state and federal wildlife refuges and appropriate agricultural lands), protecting streams that are
resilient to climate change (such as cold-water, spring-fed streams), and developing mechanisms to purchase and transfer water
for environmental uses.
• Reliablefundingforenvironmentalmanagementisakeyhurdle.
Bond funds, while helpful, are short lived and project based. The state needs a new approach to funding public-trust resources
(including fish and wildlife), such as a small surcharge on water use.
Central valley riCe fields now Provide wildlife habitat in PlaCe of native wetlands
Redding
Sacramento
Stockton
Fresno
Bakersfield
San Francisco
2002 (4.9%)
1960 (27.6%)
Current rice field
Wetlands remaining (% of 1900)
1900 (100%)
SOURCE: Ellen Hanak et al., Managing California’s Water: From Conflict to Reconciliation (PPIC, 2011), Figure 1.2.
NOTES: Wetlands in 1900 include yellow, orange, and red areas; the 1960 wetlands include orange and red areas. Sacramento Valley rice fields perform some seasonal wetlands functions for migrating birds and terrestrial and riparian species such as the giant garter snake.
looking ahEadCalifornia has a long-term economic and social interest in supporting native biodiversity in freshwater ecosystems. But new
approaches are needed to make environmental water allocations more effective.
P P i C .o rGItem 7, PPIC Report

The PPIC Water Policy Center spurs innovative water management solutions that support a healthy economy, environment, and society—now and for future generations.
The Public Policy Institute of California is dedicated to informing and improving public policy in California through independent, objective, nonpartisan research. We are
a public charity. We do not take or support positions on any ballot measure or on any local, state, or federal legislation, nor do we endorse, support, or oppose any
political parties or candidates for public office. Research publications reflect the views of the authors and do not necessarily reflect the views of the staff, officers,
or Board of Directors of the Public Policy Institute of California.
Public Policy Institute of California
500 Washington Street, Suite 600
San Francisco, CA 94111
T 415 291 4400 F 415 291 4401
ppic.org/water
read more: Contact a PPiC expert:
Contact a research network expert:
This series is funded by the S. D. Bechtel, Jr. Foundation.
Climate Change and Water
PreParing for floods
managing droughts
the saCramento–san Joaquin delta
Paying for Water
storing Water
Water for Cities
Water for the environment
Water for farms
John Eadie, [email protected]
Brian Gray, [email protected]
Peter Moyle, [email protected]
Nathaniel Seavy, [email protected]
Leon Szeptycki, [email protected]
Joshua Viers, [email protected]
Jeffrey [email protected]
Ellen [email protected]
PPIC Sacramento Center
Senator Office Building
1121 L Street, Suite 801
Sacramento, CA 95814
T 916 440 1120 F 916 440 1121
Preparefordroughts. Drawing on recent experience, California should update its strategy for managing native biodiversity during
droughts. The state should improve water trading to support environmental flows, define public trust and other priorities, restore
habitats that build drought resilience, and put in place measures to conserve fish and wildlife during emergencies.
Acquireenvironmentalwaterrights. Today, government regulations determine most environmental flows, rather than water
rights specially created for the environment. To provide greater management flexibility, the state should purchase water rights or
provide other incentives to acquire them for the environment from other water users. Proposition 1, the water bond approved in
November 2014, makes available up to $200 million for this purpose, a helpful start. The legislature should also authorize environ-
mental water managers to sell or lease water to raise funds for other restoration projects. Such practices are working well in
Australia, which faces water management challenges similar to those of California.
Reformenvironmentalpermitting. Environmental water is most effective when paired with habitat restoration. However,
obtaining permits for restoration is unnecessarily difficult because of multiple, often conflicting, agency reviews. The 2014 Habitat
Restoration and Enhancement Act, which reduces permitting hurdles for private land owners seeking to improve habitat, is a model
worth expanding. Regional, streamlined permitting for state and federal restoration projects can stretch environmental dollars and
accelerate benefits.
Developnewpartnershipswithagriculture. Wildlife-friendly farming can support ecosystems while maintaining the economic
viability of farms. Habitat exchanges—which provide cash payments to farmers who make their land wildlife friendly—are promising.
Proposition 1 authorizes the use of bond funds for this purpose.
Item 7, PPIC Report

Water for Farms PPIC WATER POLICY CENTER
CaliFornia’s Farms FaCe groWing Water management ChallengesCalifornia is an agricultural powerhouse—the nation’s largest farm state and a world market leader, with 2012 sales of $48 billion.
California’s dry summers make irrigation essential. To irrigate more than nine million acres of crops, farmers use about 40 percent
of California’s available water, compared with 10 percent used in cities. The remaining half is categorized as environmental water.
Farmers have steadily improved productivity and shifted to crops like fruits, nuts, and vegetables that generate more revenue and
profit per unit of water. Adjusted for inflation, the value of farm output has more than doubled since the late 1960s despite little change
in acreage or irrigation water used. But California’s nonfarm sectors have grown faster, so agriculture is now less than 2 percent of
the state economy. Because California dominates the national market for many fruits, nuts, and vegetables, prices of these crops
can rise as irrigation water becomes scarcer.
Water is a perennial concern. Many farmers get surface water from federal, state, and local projects. Many also pump groundwater.
In some regions, overused groundwater reserves have been shrinking for decades. Since the 1980s, environmental regulations
have limited—and sometimes cut—the surface water supply, thereby encouraging more groundwater pumping.
The latest drought has exposed farming’s growing vulnerability to water shortages, particularly where groundwater reserves are
inadequate. Climate change is expected to make severe droughts more likely. New groundwater legislation, local initiatives, and
Proposition 1—the state water bond approved in November 2014—provide opportunities to strengthen water management.
The value of farm waTer is rising, buT farming is declining as a share of The economy
250
50
0
200
150
100
1967 1972 1980 1985 1990 1995 2000 20102005
Farm water use
Irrigated crop acreage
Farm GDP (crops and animal products)
Farm GDP as % of total GDP
Per
cent
cha
nge
(19
67
= 1
00)
SOURCE: Author calculations using data from the U.S. Bureau of Economic Analysis (GDP) and the California Department of Water Resources (water and land use).
NOTES: GDP is California’s gross domestic product, adjusted for inflation. Irrigated crop acreage includes land used for multiple crops within a year. Farm water use is the amount applied to fields. Net water use—the volume consumed by plants, evaporated, or discharged to saline waters—is lower, but reliable long-term estimates are unavailable. Pre-2000 water use estimates are adjusted to levels that would have been used in a year of normal rainfall. Estimates from 2000 onward are for actual use in years with near-normal precipitation. Estimates omit conveyance losses and active groundwater recharge.
A p r i l 2 015
Item 7, PPIC Report

Farm Water use is ChangingCalifornia farmers respond continually to changing market and technological opportunities. These adaptations have boosted
earnings and raised the value of scarce farm water supplies. But they have also brought new challenges.
• Acreageisshiftingtowardhigher-revenue—butlessflexible—crops.
California farmers have shifted markedly to fruits, nuts, vegetables, and nursery crops, which made up roughly 47 percent of
irrigated crop acreage, 38 percent of farm water use, and 86 percent of crop revenue in 2012. By comparison, forage crops,
such as alfalfa and corn silage—inputs for the important dairy and cattle industries—generate less revenue per unit of water.
In the water-limited San Joaquin Valley, orchards grew from 34 percent to 40 percent of irrigated cropland between 2000 and
2010. The rise in fruit and especially nut orchards—which must be watered every year—has reduced farmers’ ability to withstand
intermittent water shortages.
• Waterdeliveryandfieldirrigationefficienciesarerising.
Many irrigation districts have been upgrading delivery systems to provide more flexible service and minimize canal spills and
seepage. Farmers have been switching from flood irrigation to drip and sprinkler systems, which improve crop yields and quality
and reduce the application of harmful chemicals. However, in some regions—especially the San Joaquin Valley—these water
management upgrades, including canal lining, have the unintended consequence of lowering groundwater levels. That is
because irrigation water not consumed by crops is a major source of groundwater recharge.
• Groundwaterisbecomingmoreimportant...andmorethreatened.
San Joaquin Valley farmers have been pumping more groundwater to replace surface water previously shipped through the
Sacramento–San Joaquin Delta or diverted from the San Joaquin River, as both sources have decreased to support endangered
fish habitats. Groundwater is also being used to establish new orchards in previously unirrigated areas that lack surface water.
High returns on orchard crops have made it profitable for farmers to invest in deeper wells, aggravating groundwater depletion.
Groundwater quality is also falling in many areas, threatening crop yields and drinking water.
california has a diverse crop mix, wiTh wide variaTions in revenue and waTer use
Revenues
Irrigated pasture
1%
Rice2%
Corn2%
Alfalfa4%
Cotton1% Other
field crops4%
Fruits and nuts
45%
Truck farming and nurseries
42%
Net water use
Corn7%
Other field crops
14%
Fruits and nuts
34%
Truck farming and nurseries
4%
Irrigated pasture
11%
Rice8%
Alfalfa18%
Cotton4%
SOURCE: Author calculations using data from the California Department of Water Resources (2010 water use) and the National Agricultural Statistics Service (2012 crop prices). Revenues are estimated using the Statewide Agricultural Production (SWAP) model.
NOTES: Total 2010 net water use for crops was 20.2 million acre-feet (maf), versus 29 maf applied to fields. Total 2012 crop revenues were $36.4 billion; dairy cattle and milk brought in $6.9 billion and other animal production brought in $2 billion.
p p i c .o rgItem 7, PPIC Report

CaliFornia needs to manage Farm Water For the long termCalifornia will continue to be an agricultural leader, but it must continue to adapt and focus on sustainably managing both water
quantity and quality.
• Thelatestdroughthasexposedstrengthsandvulnerabilities.
During the critically dry year of 2014, surface water deliveries to Central Valley farmers fell by a third, with reductions varying
hugely depending on location. The drought caused hardship in some farm communities. About half a million acres were fallowed,
some $2 billion was lost, and 17,000 full- and part-time jobs disappeared. But the economic losses would have been far greater
if farmers had been unable to pump much more groundwater than usual or buy water from other farmers. (Groundwater pumping
replaced roughly 75% of the lost surface water.)
• Bettergroundwatermanagementisatoppriority.
Groundwater is California agriculture’s largest dry-year water reserve. But long-term declines in groundwater levels will limit its
availability in many farming areas. The Sustainable Groundwater Management Act of 2014 authorizes local water users to create
basin-level management agencies with the ability to monitor, manage, and charge for groundwater pumping and recharge. The
legislation authorizes the state to step in if local water users fail to put in place sustainable management plans. Implementation—
which can include increasing recharge and/or reducing pumping—will likely require the measurement of pumping and the
allocation of pumping rights to groundwater users. In contrast, today’s rules generally allow landowners to pump without quantity
restrictions.
• Betterintegrationofsurfacewaterandgroundwatermanagementiskey.
Many irrigation districts already manage surface and groundwater resources jointly to encourage groundwater basin replenish-
ment in wet years. These local efforts need to increase. For instance, basins can be recharged with recycled wastewater from
neighboring urban areas or by allowing floodwaters to spread on fields normally watered by drip irrigation. State actions also
matter, given the importance of imported surface water in many regions. By shifting the timing of reservoir releases, agencies
can increase the availability of surface water for underground storage. Investments in new storage and conveyance can increase
system flexibility and boost water supplies.
• Watermarketsprovideessentialflexibility.
California farmers have been active participants in the state’s water market for more than two decades. This market has
supported productive farming areas that lack reliable supplies of their own, and it has helped to keep orchards alive during the
latest drought. Markets also make water available for the environment and growing urban areas, while providing revenue to
farmers who sell water. Localized trading of groundwater pumping rights can help basins implement the new groundwater law
by allowing farmers who need more water for their orchards to compensate other farmers for reducing use.
• Agriculturalstewardshipcandomoretosupporttheenvironment.
Further improvements in the management of agricultural chemicals and drainage will reduce harmful discharges. Beneficial
on-farm practices that provide habitat for California’s fish and wildlife—already common in some areas—also merit expansion.
Programs may be warranted to compensate farmers for providing habitat services on these lands.
looking aheadFarmers and irrigation districts are the frontline stewards of agriculture’s future, but the state and federal governments can provide
technical, regulatory, and financial support to help California agriculture adapt to changing conditions.
Supportlocalgroundwatermanagementefforts. Proposition 1 provides $100 million to help implement the new groundwater
law. Additional legislation may be needed to support allocation of pumping rights. These rights should be tied to recharge sources.
All landowners should share the recharge from natural precipitation, while irrigation districts should retain rights to water they bring
into the basin. Local plans will also need to reduce pumping rights when farmers make efficiency upgrades to keep these invest-
ments from reducing long-term supplies.
p p i c .o rgItem 7, PPIC Report

The PPIC Water Policy Center spurs innovative water management solutions that support a healthy economy, environment, and society—now and for future generations.
The Public Policy Institute of California is dedicated to informing and improving public policy in California through independent, objective, nonpartisan research. We are
a public charity. We do not take or support positions on any ballot measure or on any local, state, or federal legislation, nor do we endorse, support, or oppose any
political parties or candidates for public office. Research publications reflect the views of the authors and do not necessarily reflect the views of the staff, officers,
or Board of Directors of the Public Policy Institute of California.
Public Policy Institute of California
500 Washington Street, Suite 600
San Francisco, CA 94111
T 415 291 4400 F 415 291 4401
ppic.org/water
read more: contact a ppic expert:
contact a research network expert:
This series is funded by the S. D. Bechtel, Jr. Foundation.
Climate Change and Water
PreParing for floods
managing droughts
the saCramento–san Joaquin delta
Paying for Water
storing Water
Water for Cities
Water for the environment
Water for farms
Charles Burt, [email protected]
Richard Howitt, [email protected]
Josué Medellín-Azuara, [email protected]
Doug Parker, [email protected]
Daniel Sumner, [email protected]
David Zoldoske, [email protected]
Ellen [email protected]
PPIC Sacramento Center
Senator Office Building
1121 L Street, Suite 801
Sacramento, CA 95814
T 916 440 1120 F 916 440 1121
Improveinformationflows. Data on groundwater use and other key information about agricultural water management are still
fragmented—and in some areas rudimentary. California also lags behind some other western states in using advanced technology,
such as remote sensing, that can support or replace sometimes-costly on-the-ground data collection.
Strengthenandstreamlinewatermarkets. State and federal agencies have expedited water transfers during the latest
drought. However, California would benefit greatly from clarifying the conditions under which water transfers can be carried out
without causing harm to the environment or other water users, and from simplifying the approval process.
Developfundingsourcestoimprovewaterreliability. Proposition 1 will provide up to $2.7 billion to fund the public benefits of
new surface and groundwater storage, including ecosystem, recreation, and flood protection improvements. Water tunnels beneath
the Delta are another key infrastructure project under consideration. Tunnels would be expensive, but for some farmers and urban
residents, the greater reliability and quality improvement of water supplies this project would bring may make it worth their money.
Supporttransitionsforfarmworkercommunities. Proposition 1 and some federal programs can help fund safe drinking water
for rural communities where groundwater is contaminated by nitrate from fertilizer and manure applied to fields. Many of these
communities are also losing jobs as farm technology becomes more mechanized—for example, with nut and tomato crops. The
state has provided emergency financial and food assistance to farmworker communities during the latest drought. Beyond that,
the state should support workforce development to ease the long-term economic shift in farm communities.
Item 7, PPIC Report

Public Policy Institute of California
500 Washington Street, Suite 600
San Francisco, CA 94111
T 415.291.4400 F 415.291.4401
PPIC Sacramento Center
1121 L Street, Suite 801
Sacramento, CA 95814
T 916.440.1120 F 916.440.1121
ppic.org/water
This publication is printed on post-consumer recycled paper.
Item 7, PPIC Report
Related Documents