PPF Long-Term Funding Strategy Update October 2013

Welcome message from author
This document is posted to help you gain knowledge. Please leave a comment to let me know what you think about it! Share it to your friends and learn new things together.
Transcript

PPF Long-Term Funding Strategy Update
October 2013

1 Contents
The sections of this document are: Section 2 Foreword Section 3 Summary of the year’s events Section 4 Review of the funding objective Section 5 Updated assumptions Section 6 Modelling output – base case Section 7 Sensitivity of base case to assumptions Section 8 Scenario testing Annex A1 Further detail on modelling

3
2 Foreword
At the time of our last funding strategy update, published in October 2012, we estimated that we had a 84 per cent probability of achieving our 2030 self-sufficiency target, a level which our Board was comfortable with. But we did warn against complacency, not least because of the impact of record low levels of bond yields that inflated the value of pension scheme liabilities and the levels of underfunding among the approximately 6,000 schemes in our universe increasing to historical levels.
We were right not to be complacent as, during 2012/13, we saw claims of £1.0 billion. Also, although equity markets performed well over the twelve months to 31 March 2013, bond yields generally fell. This has meant that pension scheme funding, as measured by our 7800 Index, did not improve over the year to 31 March 2013 which has left us with similar fears of further high claims in the future.
Against this backdrop of uncertainty about our future finances, it is vital that we continue to monitor our progress towards our target of achieving self-sufficiency by 2030. And, while we report an increase in the probability of success from 84 per cent at 31 March 2012 to 87 per cent at 31 March 2013, we need to keep our funding targets under close and constant scrutiny. We also monitor our downside risk which is a measure of how poorly funded we might become.
But, we must stress, no models are infallible and we cannot guarantee the outcomes that we predict which is why we carry out multiple runs of the model to test how sensitive the output is to a range of changes in key assumptions.
We recognise that, as the after effects of the global financial crisis continue to be felt, we remain in uncharted territory so we need to anticipate the emergence of assumptions which are based on what we have called the ‘new normal’. To that end, we have constructed stresses – which are both pessimistic and slightly more optimistic - to test our resilience based on this new normality.
All that said, we believe that our funding strategy continues to be appropriate and we are making good progress to meeting its aims and objectives. However, as I have already made clear, we live in uncertain and economically unprecedented times so keeping a close watch on our financial position remains critical to our future success.
Martin Clarke Executive Director of Financial Risk October 2013

4
3 Summary of the year’s events
New statutory objective for the Pensions Regulator
In the March 2013 budget the Chancellor announced a new statutory objective for the Pensions Regulator. The objective was described as being “to support scheme funding arrangements that are compatible with sustainable growth for a sponsoring employer and fully consistent with the 2004 funding legislation”.
The impact on the PPF is unknown but may lead to employers contributing less to their pension schemes in the short term and thus increasing the level of underfunding risk of eligible schemes. Conceivably this might be offset by an improvement in employer solvency. The final wording of the objective is not known at present: it is expected to be enacted in parliament later this year. We are working closely with the Pensions Regulator to understand if and how the new objective will be balanced against its existing objective to minimise risk to the PPF.
At this stage we believe it would be premature to make adjustments to our modelling to reflect any future change in scheme funding.
Solvency II for pensions
In recent years there has been discussion of a possible ‘Solvency II for pension schemes’, with the European Commission considering whether to standardise pension scheme funding across Europe through an amendment to the IORP Directive. In May 2013 the European Commissioner confirmed that it would not enact such legislation in relation to funding in the immediate future but focus instead on the governance and transparency of pension provision.
It seems however that the proposal to amend funding rules may have been postponed rather than abandoned, with the Commissioner stating that further research would be carried out on the proposal. Also EIOPA, which advises the European Commission, is reportedly keen for the changes to go through.
Should scheme funding plans be affected by changes to the IORP Directive we would have to consider the implications for our funding objective and our assumptions concerning scheme deficits and
This section summarises the events affecting the risks to the PPF over the year.

5
3 Summary of the year’s events
recovery plans. It should be noted that the original proposals concentrated solely on determining the level of scheme funding with no discussion on how any deficit should be made up (or over what period). At this stage, however, we consider it premature to anticipate any future legislative change.
Defined Ambition
The government is keen to reinvigorate the provision of workplace arrangements that offer greater security to the member than traditional Defined Contribution schemes. We will be fully engaged in assessing and evaluating any impacts upon our long-term funding, claims expectations and levy collections from possible outcomes of the Defined Ambition process.
How has the PPF universe fared in the recent economic turmoil?
We recently carried out analysis of around 700 employers representing 60% of the pension deficit of PPF-eligible schemes. Using publicly available information and making approximate adjustments to allow for off balance sheet items we looked at the performance since the 2008 crisis. The main conclusions we drew are:
Although there has been a recovery to assets and sales since 2009, these remain below pre-crisis levels. Similarly, profits recovered in 2010 and 2011 following the dramatic falls of the previous two years. Euro area recessions hit company profits in 2012 owing to strong export linkages.
Following the crisis, capital investment fell and companies carried large amounts of cash. Since 2011, however, many companies appear to have responded to low interest rates by increasing their financial leverage and, owing to weak profit margins, debt coverage ratios deteriorated.
Insolvency rates have remained fairly steady over the period due to banks’ reluctance to crystallise losses on their accounts and so letting weakened companies survive.
Companies with PPF-eligible schemes have fared better since the crisis than their peers in the UK, mainly because of their larger size, better capitalised balance sheets and more diversified business models. They have enjoyed higher returns on their assets, profit growth and have maintained significantly lower debt multiples.
Looking forward there are various financial challenges to employers, not least of which is the possibility that a rise in interest rates has

6
3 Summary of the year’s events
the potential to squeeze companies with high leverage and weak profit margins when it comes to refinancing loans. However, so far we have not seen a significant pick-up in insolvency rates leading to claims on the PPF.
No change to the calculation of inflation
The Office for National Statistics consulted last year on the methodology underlying the calculation of inflation as well as certain changes to the measurement of clothes prices. However, in January the National Statistician announced that the calculation of the two measures would not be changed.
As described in section 5, we have decided to amend our long-term assumption for the gap between RPI and CPI.
Change to the PPF Compensation Cap
The current Pensions Bill contains a proposal to amend the PPF Compensation Cap for long-serving members of DB pension schemes (i.e. those members with over 20 years of service). This will have the effect of increasing the PPF’s liabilities for members who are currently in the PPF as well as the risk posed by the 6,000 or so pension schemes eligible for PPF protection.
As described in section 5, we have made an adjustment to our modelling to anticipate this change to legislation.
Central clearance of OTC derivatives
The PPF makes extensive use of swap contracts to protect itself against unexpected changes in interest rates and inflation. Such derivative instruments will be affected by the European Market Infrastructure Regulation (EMIR).
Under EMIR the aim is that any new Over-The-Counter (OTC) derivative trades will need to be passed through a central clearing house, which will require assets to be deposited as margin. Initially five asset classes are being considered for central clearing - interest rate derivatives, credit derivatives, equity derivatives, foreign exchange derivatives and commodity derivatives – with phasing in of other classes. The proposal limits the classes of assets that can be deposited as margin and this potentially obliges parties with swap contracts to invest a greater amount in cash and/or government bonds, which may impact upon expected investment performance.
The details of the legislation will be set out in a technical standard that is currently under consultation. The proposals potentially have

7
3 Summary of the year’s events
serious consequences for the PPF and we are currently reviewing our investment strategy to reflect the likely impacts that OTC clearing will have on us. When that strategy has been finalised we will reflect it in our funding strategy.
Markets and their impact on scheme funding
Global equity markets rose over the year to 31 March 2013, reaching the levels prior to the financial crash in 2008. This helped to boost scheme assets by 10 per cent over the year. However, pension scheme liabilities increased by a similar amount as a result of a decline in bond yields. The net effect is that the funding level of the PPF 7800 Index stood at 83 per cent at 31 March 2013, the same level as a year before.
Claims on the PPF
By ‘claims’ we mean the pension deficits that are brought into the PPF when scheme sponsors suffer insolvency thus causing their schemes to enter the PPF.
In the year to 31 March 2013 we saw a high total amount of claims, although the number of schemes resulting in a claim was not unusual. This disparity is explained by a handful of schemes with large deficits coming into the Fund in the year.
The following chart shows our current view of the claims made on the PPF taking into account recoveries, as well as levy payments received, since our inception.
Chart 3.1: History of claims and levy

8
3 Summary of the year’s events
PPF Levy
The Board’s strategy for setting levy is to keep the parameters constant throughout the levy triennium unless there is a significant change in risk or one of the following limits is expected to be breached:
The Levy Ceiling as set out in legislation (currently £0.9 bn) A 25% year-on-year increase in the levy A 25% year-on-year decrease in the levy
The Board decided to reduce the levy parameters for the year commencing 1 April 2013 as the increase in risk would have pushed the levy beyond the permitted limits. For the following year the Board decided to keep the levy parameters the same.
9
4 Review of the funding objective
Our long-term aim is to be self-sufficient by holding enough assets to pay PPF compensation without having to take excessive risks with our investments or rely upon the PPF Levy to recoup a deficit. Our long-term funding strategy helps us navigate to such a state. Under this framework we consider when our endgame will be, what level of assets we need at that point, and where we stand currently on the path to self-sufficiency.
Financial risks faced by the PPF
We face many of the same financial risks as providers of traditional deferred and immediate annuities as well as the funding risks familiar to the trustees of defined benefit pension schemes. On top of that, we face insolvency risk from the sponsors of defined benefit pension schemes.
These are some of the key variables to which we are sensitive:
Interest rates, since the yield on gilts determines the value of schemes’ PPF liabilities
Financial markets, with schemes continuing to invest significant amounts in return-seeking investments
Insolvency rates, as a scheme will only claim on the PPF following insolvency
Mortality rates. In recent years there has been a definite trend towards improved longevity.
It is clear that these risks are not independent. For example, as described further in the appendix, we model a positive correlation between conditions in equity markets and the rate of insolvency. Furthermore the impact on scheme funding of changes in interest rates is partially mitigated to the extent that schemes invest in bonds or liability-driven investment strategies.
One distinction between an insurance company and the PPF is that we have no choice over our customers: we are obliged to cover all 6,000 UK defined benefit pension schemes for the duration of their existence. Given the size of some UK defined benefit pension schemes – with around a dozen carrying deficits of over £1bn – there
This section considers whether our funding objective remains appropriate in light of recent developments.
10
4 Review of the funding objective
is the possibility of significant claims on the PPF if a few large schemes come our way.
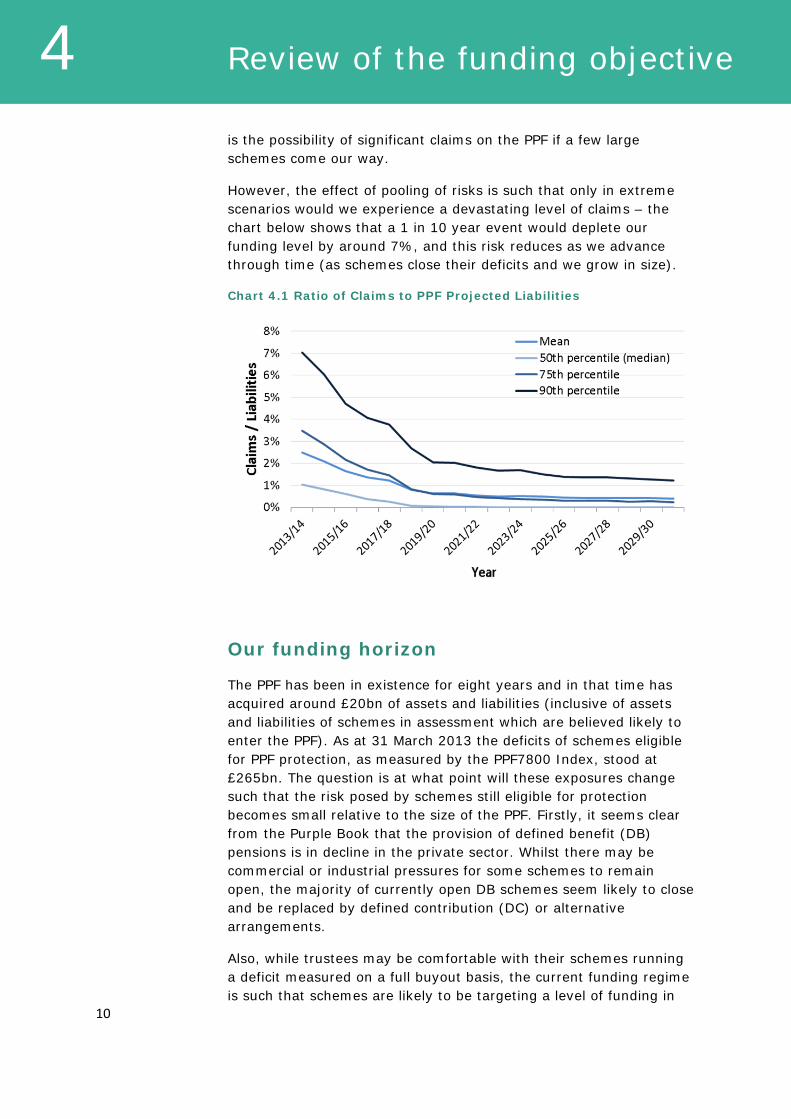
However, the effect of pooling of risks is such that only in extreme scenarios would we experience a devastating level of claims – the chart below shows that a 1 in 10 year event would deplete our funding level by around 7%, and this risk reduces as we advance through time (as schemes close their deficits and we grow in size).
Chart 4.1 Ratio of Claims to PPF Projected Liabilities
Our funding horizon
The PPF has been in existence for eight years and in that time has acquired around £20bn of assets and liabilities (inclusive of assets and liabilities of schemes in assessment which are believed likely to enter the PPF). As at 31 March 2013 the deficits of schemes eligible for PPF protection, as measured by the PPF7800 Index, stood at £265bn. The question is at what point will these exposures change such that the risk posed by schemes still eligible for protection becomes small relative to the size of the PPF. Firstly, it seems clear from the Purple Book that the provision of defined benefit (DB) pensions is in decline in the private sector. Whilst there may be commercial or industrial pressures for some schemes to remain open, the majority of currently open DB schemes seem likely to close and be replaced by defined contribution (DC) or alternative arrangements.
Also, while trustees may be comfortable with their schemes running a deficit measured on a full buyout basis, the current funding regime is such that schemes are likely to be targeting a level of funding in

11
4 Review of the funding objective
excess of their PPF liabilities. If these funding plans succeed, the outstanding risk to the PPF posed by eligible schemes should reduce considerably.
Taking all the factors into account, our modelling suggests that in the next two decades we will change from being a compensation fund that is storing up assets for future distribution into being in the winding-down phase. For this reason we have chosen 2030 as our funding horizon: the time at which we measure self-sufficiency under our funding framework.
Some of the topics discussed in section 3 may in due course lead to a refinement to our funding horizon should the evidence prove compelling. For example, if Defined Ambition pension schemes were to be introduced widely, we might see a resurgence of pension schemes eligible for PPF protection, in which case we may need to fundamentally revise our funding strategy. On the other hand, we might need to consider a reduction in that time horizon in the event that sponsors materially increased their deficit contributions as a result of changes to the IORP Directive.
What is self-sufficiency?
If at our funding horizon our assets were exactly equal to our liabilities then we would only have a fifty per cent chance of being able to meet compensation payments in full. However, a fifty per cent chance of being able to meet compensation is low, so we have added a margin to protect ourselves against the risks to which we would be exposed.
The target for self-sufficiency is currently a 10 per cent margin over the liabilities, this being held to cover the risk of unexpected longevity improvements and any future claims (beyond the year 2030) in excess of PPF levies. It was calculated such that in the year 2030 it would be sufficient in 90 per cent of modelled scenarios to cover uncertainty in longevity and claims risk in excess of levy. It was the Board’s view that ninety per cent struck an appropriate balance between the security of members and the costs to levy payers. As a point of reference, had it chosen a 99 per cent confidence level, the funding margin would have been 30 per cent.

12
4 Review of the funding objective
How do we measure progress against our funding objective?
We use two statistics to monitor progress against our funding objective - the ‘probability of success’ and the ‘downside risk’. The probability of success measures our chances of being self-sufficient in the year 2030 if we continue on our current course with no change to our investment strategy or to the PPF Levy formula. The downside risk is a measure of how poorly funded we might become. It is calculated such that in 10 per cent of modelled scenarios our deficit reaches at least that level at some point before 2030.
To measure these statistics we have developed an internal model that projects the level of PPF assets and PPF liabilities in future years. It generates an extensive range of asset returns, insolvency and longevity scenarios and then projects a range of PPF balance sheet outcomes.
The process of using a large number of modelled scenarios to derive a distribution of outcomes is termed stochastic analysis, or Monte Carlo analysis. It is widely used in the financial services industry and its primary advantage over deterministic or ‘single point’ forecasts is that having a distribution of outcomes allows us to assess not just our best estimate of the future but also the likelihood of specific variations from that outcome.
As with any financial model, it is important to exercise an appropriate degree of caution when analysing output. Models are not infallible; there is no guarantee that future outcomes will conform to dynamics observed in present and past data. To help assess the level of model and parameter risk we carry out multiple runs to test the sensitivity of the output to changes in key assumptions (see section 7).
As well as testing the sensitivity to changes in individual assumptions we carry out more fundamental stresses to the model by changing various assumptions all at once. One such pessimistic stress test is described in section 8 together with, for balance, a stress that is more optimistic than the current base case.

13
5 Updated assumptions
The main modelling assumptions are described in Annex A1. Some of these have been updated since the previous update of our funding strategy in October 2012, and these are described below.
Gap between RPI and CPI
Last year we reduced our assumption for the long-term gap between RPI and CPI from 1.1 per cent to 0.8 per cent. This was in anticipation of a change to the way that clothes prices were measured (as described in section 3). In response to the National Statistician’s consultation on inflation we have now reversed this assumption. Our assumption for the gap is now back at 1.1 per cent per annum.
Higher probability of negative real yields
We have increased the number of scenarios in which our model projects negative yields on index-linked government bonds. When our model was originally set up it was considered unlikely that yields on bonds would become negative since investors would be losing money in real terms. In fact the experience since late 2011 has been that demand for inflation-linked investments has exceeded the supply to the extent that real yields have become negative. Partly as a result of this we have changed our view of how likely such scenarios will be in future.
Number of schemes adopting CPI for increases
From 2011 the government has adopted CPI as the inflationary index for statutory increases to private sector DB schemes. This however does not mean that all pension schemes are indexed to CPI since scheme rules might have explicitly mentioned RPI or sponsors and trustees might have decided to continue using RPI.
When the change was first announced we made the assumption that 10 per cent of schemes would move to the CPI measure for post-retirement increases and 25 per cent would for pre-retirement increases. This was informed by a survey of trustees made at that time. Data collected recently via the scheme return suggests that
This section discusses the model assumptions that we have updated over the year.

14
5 Updated assumptions
these figures were under-estimates and so we have increased the assumptions to 30 and 80 per cent respectively.
Impact of PPF compensation cap
As discussed in section 3 the PPF compensation cap will be increasing for members with long service. Previously we assumed the cap would reduce compensation by 2 per cent on average. We have revised this figure to 1.5 per cent.
PPF expenses and GMP equalisation
For the valuation included in the Annual Report and Accounts (published alongside this document) we have refined our assumptions for expenses and for the impact of equalising compensation for GMP. These updates have also been reflected in our long-term funding assessment.
Impact
As discussed in section 6 the net impact of these changes on our funding outputs is slightly positive.
15
6 Modelling output – base case
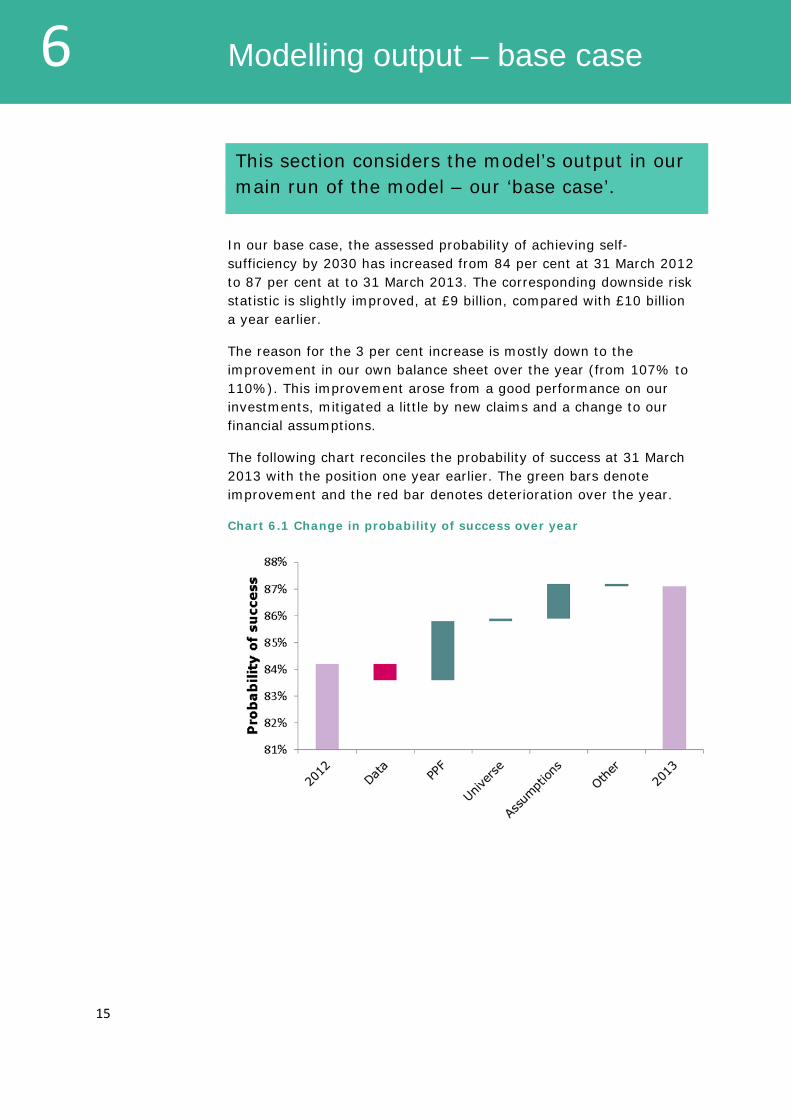
In our base case, the assessed probability of achieving self-sufficiency by 2030 has increased from 84 per cent at 31 March 2012 to 87 per cent at to 31 March 2013. The corresponding downside risk statistic is slightly improved, at £9 billion, compared with £10 billion a year earlier.
The reason for the 3 per cent increase is mostly down to the improvement in our own balance sheet over the year (from 107% to 110%). This improvement arose from a good performance on our investments, mitigated a little by new claims and a change to our financial assumptions.
The following chart reconciles the probability of success at 31 March 2013 with the position one year earlier. The green bars denote improvement and the red bar denotes deterioration over the year.
Chart 6.1 Change in probability of success over year
This section considers the model’s output in our main run of the model – our ‘base case’.

16
6 Modelling output – base case
The following table explains what the bars represent.
Bar Explanation
2012 This is the probability of success at 31 March 2012, which was 84 per cent.
Data This allows for the change in data over the year, including scheme’s valuations, recovery plans and employer credit ratings.
PPF This allows for the improvement in the PPF’s funding level over the year, from 101% at 31 March 2012 to 106% at 31 March 2013 (including schemes that are virtually certain to come into an assessment period in the near future). The funding levels excluding the near-certain insolvencies were 107% at 31 March 2012 and 110% at 31 March 2013.
Universe This is the effect of scheme funding changing slightly over the year. In aggregate there was no change, but it varied for individual schemes.
Assumptions This is the net effect of the various assumption changes discussed in section 5.
Other This includes improvements to the modelling, and all other factors not accounted for above.
2013 This is the probability of success at 31 March 2013, which is 87 per cent.
Are we happy with an 87 per cent chance of success?
It should first be noted that the figure of 87 per cent is calculated on the assumption that no adjustment is made either to our investment strategy or to the levy parameters other than where required by legislation. In other words we assume that the PPF does not respond to changing circumstances.
A third lever available to the Board is to ask government to reduce the level of PPF compensation payable, either by increasing the level of cutback or by restricting indexation on pensions. However, this is considered an option of last resort.
It might also be appropriate to review our funding framework in an unfavourable environment. For example if as we approached the year 2030 we found that the level of risk posed to the PPF by eligible

17
6 Modelling output – base case
schemes was still high relative to the size of the PPF, we would push our funding horizon further out beyond 2030.
Ultimately we would like the probability of success to converge towards 100 per cent in by 2030. However, to achieve this level of comfort today we would need to charge a levy running into billions of pounds a year. This would not be in the best interest of levy payers, or indeed be possible under the limits set by legislation.
The Board regularly monitors the probability of success and the downside risk in quarterly updates of the modelling. To do this it has devised a Red-Amber-Green framework where a green rating indicates that the Board should be comfortable, an amber rating indicates that it should consider pulling on one of its strategic levers and a red rating indicates that it should almost certainly be planning to pull one of its strategic levers.
Projections of our funding level
At 31 March 2013 our funding level stood at 110 per cent ignoring the ‘imminent insolvencies’ mentioned above. The fact that we are 110 per cent funded does not mean that we have achieved our funding objective of being self-sufficient as self-sufficiency is measured in 2030 and there is a material chance that our funding level could decline before that time.
The following fan chart shows the history of our funding level as well as a projection beyond 2013. As mentioned above, it assumes no change to levy or investment strategy in scenarios where the funding level is high or low. This is because the model is used to inform current strategy rather than predict future strategy.

18
6 Modelling output – base case
Chart 6.2 History and projection of PPF’s funding level
Projections of claims
One of the main factors that could lead to a decline in funding, which is largely outside of our control, is the level of claims being made on the PPF in future years. The following fan chart, taken from our base case, shows the cumulative deficit of schemes that make a claim on the PPF, measured at the point at which they enter the PPF.
Chart 6.3: Cumulative deficits of schemes entering the PPF from 31 March 2013

19
6 Modelling output – base case
The projected size of pension scheme deficits and the underlying trend within our base case that deficits will decrease during our funding period to 2030 is a key determinant in the future PPF claims experience. It is therefore important to assess alternatives to these base case assumptions and test the robustness of the PPF’s funding to adverse economic outcomes. To assess this, we have carried out various stress tests in which we adjust the assumptions from our base case to reflect different possible views of the future. We describe two such stress tests in section 8.
Projections of levy
PPF levies are for the most part risk-based, in the sense that they depend explicitly on the size of schemes’ deficits and the strength of sponsoring employers. We would therefore expect that as schemes repair their funding deficits the PPF levy will reduce both in absolute terms and as a percentage of their liabilities.
The following chart shows how the levy is projected to change as a percentage of protected schemes’ PPF liabilities in future years.
Chart 6.4: Levy as proportion of scheme liabilities
In our model we assume that the formula underlying the levy calculation is unchanged over time, other than in circumstances where legislative limits would be breached. Therefore the shape of the above chart is a function of:
in the long term, schemes repairing their deficits and thereby reducing their levies (and, in some cases, buying out and leaving the eligible universe) and
20
6 Modelling output – base case
in the short term the fact that the levy is calculated using a “five year average” deficit, whereas the PPF liabilities are calculated on prevailing yields. When a “good” year falls out of the calculation and is replaced by a worse year, the levy rises proportionately. For example we are expecting interest rates to rise in the short to medium term, which will cause liabilities to fall. The averaging means this will impact levies less quickly than PPF liabilities, which has the effect of pushing up the ratio during the rise period.

21
7 Sensitivity of base case
The modelling output has been tested for sensitivity to an extensive range of modelling assumptions. A selection of the more significant sensitivity tests is shown below. These sensitivities are broadly unchanged from their 31 March 2012 levels as described in the October 2012 Funding Strategy document.
Table 7.1: results of sensitivity tests
Assumption Probability of meeting funding objective
Downside risk
Base case 87% £10 bn
Scheme funding levels 10% lower -4% +£5 bn
Recovery plans 5 years longer -1% +£1 bn
Reduction in asset returns of 0.25% pa (excluding cash and government bonds)
-2% +£1 bn
No market in CPI instruments emerges. -3% +£3 bn
PPF levies lower by 10% -1% +£1 bn
Initial PPF funding reduced by 10 percentage points
-4% +£2 bn
Sponsor insolvency probabilities increased by 20%
-2% +£3 bn
Scheme Technical Provisions reduced by 10% (relative to S179 basis)
-3% +£3 bn
No risk margin in our funding target (i.e. we aim for 100% funding rather than 110%)
+6% No change
Schemes do not close to new accruals -1% +£0 bn
Higher rate of active withdrawal – 10 per cent of members leave the employer’s service every year rather than 5%.
+1% -£0 bn
This section considers how the model’s output changes in response to changes in certain key assumptions.

22
7 Sensitivity of base case
The fifth run in the above table, no emergence of CPI, has the following impacts:
- we have a mismatch between liabilities (CPI-linked) and our investment hedge (RPI-linked) leading to volatility in our funding
- we reflect the above mismatch by having a higher threshold for ‘success’ (111% instead of 110%)
- the assumptions used for assessing entry to the PPF is stronger (as insurance companies price CPI-linked annuities higher) which leads to more claims on the PPF.
As described in section 6 there are two strategic levers – our investment policy and our levy – that we could pull should any of these sensitivities become our base case. For example, in the scenario where we reduced expectation of asset returns by 0.25% pa, with a 2% reduction in our probability of success, one option available to the Board would be to adopt a more risky investment strategy to make up the lost (expected) returns. This would come at the cost of a higher downside risk.

23
8 Scenario testing
We have adopted a system of stress tests that help explore the possible outcomes should further evidence challenge our view as to the appropriate base case assumptions.
By looking at stresses to these assumptions we can explore the extent to which our funding strategy is sensitive to a change in the Board’s best view of the future. It also reveals how resilient the PPF is to different economic shocks.
We consider that last year’s stress scenarios are still appropriate. Therefore for this update we applied stresses of the same magnitude to the current base case.
Modelling methodology
We describe below the two stresses we have looked at, a pessimistic one (labelled “Return to recession”) and an optimistic one (labelled “Accelerated recovery”).
For our stresses we have retained the stochastic nature of our model and simply adjusted the statistical distributions. We have done this in quite a simplistic way by adjusting the distributions downwards (or upwards as appropriate) in the short term and then reverting to the base case distributions once the stress period is over. Other more sophisticated treatments are possible, such as changing the correlations between the various economic variables, and adjusting the distributions of outcomes in the longer term once the stress period has finished.
Return to recession
This scenario contains two elements which have roughly equal weight: a return to recession in the short term, but recovery thereafter, and an assumed short-term spike in claims on the PPF. Higher unemployment leads to weaker consumer spending. However, it is assumed that the crisis is resolved and the economy recovers within the decade.
In this scenario the average short term returns fall by up to 30 per cent per annum depending on the asset. Bond yields also fall, which
This section considers how our results differ under two scenario tests – one more pessimistic and one more optimistic than our base case.

24
8 Scenario testing
pushes up pension scheme liabilities. Insolvency probabilities are higher although the effect is relatively small owing to the low interest rate environment.
Accelerated recovery
This scenario assumes that there is strong growth in UK exports arising from a fall in Sterling. In addition, there is a rapid recovery in investment spending, a marked drop in oil prices from current levels, which boosts household spending, while it is assumed that the economy is able to operate at a lower level of unemployment without triggering inflation. There is a long run improvement in the UK’s economic performance which leads to strong equity market performance. Sustained lower oil prices also boosts global growth and overseas equity returns.
Funding metrics
The following table gives the probability of success and downside risk under these two scenarios.
Table 8.1: result of stresses compared with base case
Assumption Probability of meeting funding objective
Downside risk
Base case 87% £9 bn
Accelerated recovery 96% £1 bn
Return to recession 79% £20 bn
There are two main reasons for the lower probability of success in the pessimistic scenario. One is a sudden influx of claims on the PPF arising from employers that cannot in the short term cope with the recession. The other is an exacerbation of claim sizes arising from a sharp fall in scheme assets and an increase in schemes’ PPF liabilities. This latter effect is somewhat dampened by a rallying in scheme funding from around 2017 as gilt yields improve and risky assets start to deliver returns in excess of liabilities.
It is perhaps reassuring to note, from the figures set out above, a reduced probability of success of 79 per cent in the pessimistic scenario. Whilst this is below the threshold for comfort, it is still in the Amber zone as defined in the PPF Board’s RAG warning system, and were the Board to adopt these assumptions as its base case, it

25
8 Scenario testing
would also know that it could aim to restore comfort through an increase in the amount of investment risk taken and/or an increase in the levy.
The optimistic scenario has a higher probability of success than our base case. The purpose of investigating such scenarios is to test the circumstances in which the PPF runs the risk of building up excessive surplus. The Board has a balance to strike between the interests of levy payers and security for members, and were this particular stress to be adopted as the base case then the Board might consider reducing the PPF levy, or else moving to risk-free investment strategy sooner than currently anticipated.
While we have quoted two stress tests in this paper, it should not be inferred that we believe these are particularly likely to occur, and nor have we based any strategic decisions on the basis of these outputs. They serve as a comfort check on the robustness of our funding.
26
A1 Further detail on modelling
1 Overview of our model
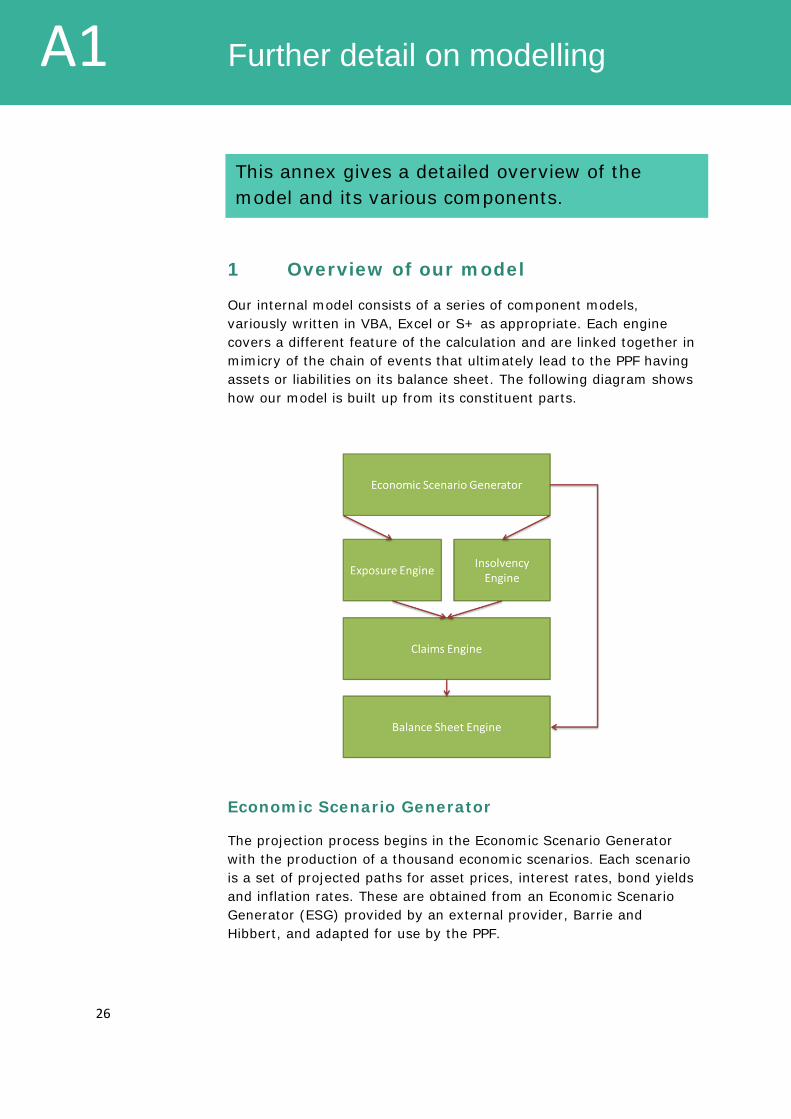
Our internal model consists of a series of component models, variously written in VBA, Excel or S+ as appropriate. Each engine covers a different feature of the calculation and are linked together in mimicry of the chain of events that ultimately lead to the PPF having assets or liabilities on its balance sheet. The following diagram shows how our model is built up from its constituent parts.
Economic Scenario Generator
The projection process begins in the Economic Scenario Generator with the production of a thousand economic scenarios. Each scenario is a set of projected paths for asset prices, interest rates, bond yields and inflation rates. These are obtained from an Economic Scenario Generator (ESG) provided by an external provider, Barrie and Hibbert, and adapted for use by the PPF.
This annex gives a detailed overview of the model and its various components.

27
A1 Further detail on modelling
Insolvency Engine
Insolvencies are modelled in the Insolvency Engine by assigning a credit rating to each company and using transition probabilities to model credit ratings changing over time. We have five hundred scenarios for credit risk, with the transition rates varying in each. Each such scenario is mapped to each of the economic scenarios (providing 500,000 scenarios in all).
Exposure Engine
Scheme funding is modelled in the Exposure Engine, which captures how assets move in response to asset returns and sponsor contributions and how schemes’ PPF liabilities move in response to changes in nominal and real interest rates. We model benefits paid out to pensioners, and an allowance is made for accruals of new benefit and contributions both from employees and the sponsor.
Claims Engine
The output of the Insolvency Engine and Exposure Engine feed through into the Claims Engine which produces the distribution of claims on the Fund and projected levy from eligible schemes.
Balance Sheet Engine
These aggregate deficits then feed through into the Balance Sheet engine which projects the returns on the PPF’s investments and investment hedge, and models levy collections, PPF expenses and the payment of PPF compensation. The result is a distribution of PPF balance sheet outcomes over a chosen horizon that takes account of all primary funding risks.
It is this last engine from which our key risk metrics – the probability of success and the downside risk – are derived. The former is the proportion of the 500,000 scenarios that lead to a PPF funding level of 110% or more in the year 2030. The latter is the greatest deficit which is experienced in the period to 2030 measured at the 10th percentile of all scenarios.
2 PPF Characteristics
Our funding horizon of 2030 rests on assumptions about the rate of scheme closure and the strength of recovery plans. Other things being equal, the slower the rate of scheme closure or the lower the deficit contributions, the later our funding horizon should be.
Initial PPF liabilities are calculated according to the PPF valuation basis. For a description of this basis, see the PPF Annual Report and

28
A1 Further detail on modelling
Accounts 2012/13 which is being published alongside this report. As described in section 5 below, we include on our starting balance sheet (for long-term funding purposes) those schemes which we consider virtually certain to enter an assessment period in the near future.
We make the assumption that a market in CPI-linked investments will develop over the next decade and settle at a level where the market-implied rate of CPI is around 0.9 percentage points a year lower than the market-implied rate of RPI. This assumption affects the yields used in the projected PPF valuation and S143 bases from 2018.
The market-implied rate of inflation is the difference between yields on fixed interest investments and equivalent index-linked investments. The difference between market-implied RPI and CPI (of 0.9 percentage points) is slightly lower than our assumption for the real world gap between RPI and CPI because we assume market participants are willing to pay a larger ‘inflation risk premium’ for CPI than RPI.
The PPF investment allocation is modelled as set out in the Statement of Investment Principles. We make no adjustment for any de-risking that might be expected in practice, other than an implicit assumption in our valuation basis that by the year 2030 we will have a completely matched investment strategy with no expectation that we will outperform our liability benchmark.
Schemes’ PPF levy payments are modelled taking into account the main features of the New Levy Framework. For this purpose we assume that the failure score used to calculate a scheme’s levy rate will evolve in a manner consistent with the evolution of the sponsor’s credit rating as described in section 5 below.
3 Economics and investment returns
The Economic Scenario Generator creates 1,000 scenarios for every relevant asset class. The main statistics of the distributions – the mean, the standard deviation, and the correlation with other asset classes – are taken from the standard calibration of the ESG (Barrie & Hibbert) and adjusted where the Board has a different view to B&H’s central one. This does not mean that the Board believes B&H’s views are incorrect, and indeed B&H are keen to stress that the standard calibration of their tool is not the most appropriate for all purposes.

29
A1 Further detail on modelling
The following table shows the adjustments the Board makes.
Assumption Adjustment
Term Premium The term premium is the additional return that an investor receives over and above a short-dated asset, required for investors to hold assets with a longer period to maturity. In this context we consider short-dated cash holdings to be the short-dated asset.
The standard calibration of the B&H ESG gives an excess return on government bonds, over the return on cash, that is different from that which we wish to use. We therefore adjust the ESG to give us a term premium of around 0.3 per cent.
It does not have a significant impact on our results.
Scenarios of Consumer Prices Indexation
We take our scenarios of RPI inflation from the standard B&H calibration. However, we construct our own scenarios for CPI inflation, based on the projections of property returns, interest rates and RPI.
As described above, we assume that a market in CPI-linked investments develops over the next 10 years. We construct scenarios for the real yield on CPI-linked investments by making adjustments to the RPI-linked real yield taken from the standard B&H calibration.
The adjustment is based on the current and assumed long term gap between RPI and CPI and an assumed risk premium to reflect investors’ preferences for CPI and RPI linked instruments.
Alternative assets
We derive our own projections for hedge funds, commodities, private equity and unlisted infrastructure. We use standard statistical techniques to arrive at projections for these asset classes that have the desirable statistical properties (i.e. mean return, standard deviation and correlation with other asset classes).
The interest rate projections are calibrated to bond yields observed in the market at the start of the projection. We use standard stochastic models of interest rates – the extended 2-Factor Black-Karasinski model for nominal interest rates, and the 2-Factor Vasicek model for real interest rates.
Both of these models assume mean reversion. In other words, while there is a random movement in interest rates over time and across the 1,000 scenarios, the assumption is that there is a tendency for the rates to move in the direction of a long-term average value. This is to be contrasted with our asset modelling, where we do not assume that markets revert to a long-term average.

30
A1 Further detail on modelling
Projections of RPI inflation are calibrated to the difference between the yields on short-dated fixed interest and index-linked bonds at the start of the projection. As described in the table above, we calculate CPI based on RPI, with the long-term difference between the two measures being around 1.1 per cent.
The volume of insolvencies is assumed to exhibit a degree of correlation with equity market conditions. When equity markets deteriorate, sponsor insolvency rates generally move upward, and vice versa. So scheme deficits will tend to rise at the same time as the rate of insolvency. Increasing the correlation between equity returns and credit risk substantially increases the risk of very large claims.
As described above, the economic scenarios form a set of projected paths for asset prices, bond yields, inflation and risk-free rates. In accordance with good practice, the PPF carries out stress testing. A stress test is similar to a sensitivity test (as described in section 7 of the main report) but one in which more than one of the parameters – or indeed all of the parameters – are varied from their base case levels. We illustrate two tests that we have investigated recently in section 8 of the main report.
4 Scheme and sponsor characteristics
For reporting purposes initial funding is taken for each scheme as its average between 1 April 2012 and 31 March 2013. We use a smoothed funding level to reduce the volatility of the funding metrics as reported each quarter. Since this might mask the true risk following a sharp rise or drop in funding, we also check that the figure does not deviate too far from an unsmoothed measure.
Schemes’ contributions are determined by their recovery plans which target full funding on a statutory funding basis over a period of (currently) 9 years on average. We take this information from the Pensions Regulator based upon the most recently submitted funding plans. The statutory funding basis results in higher liabilities than the scheme’s PPF liabilities – currently around 10 per cent higher on average – largely because PPF compensation is provided at a lower level than full scheme benefits.
We assume that schemes’ current funding plans will weaken slightly at the next valuation (this has been the trend in recent years) but will then remain in place over the longer term, with any new emerging deficit being re-spread. This means that in a scenario without any significant adverse experience, deficits are entirely
31
A1 Further detail on modelling
removed before 2030, with half of schemes completing their recovery plans within a decade.
Schemes are assumed to reduce the risk associated with their investment strategies over time. The proportion of scheme assets assumed to be invested in long-maturity bonds gradually rises from an initial 40 per cent to around 80 per cent in the long term.
As at the date of the most recent Purple book, 31 March 2012, only 18 per cent of schemes were open to new members, down from 35 per cent in 2006. Our base case assumption is that schemes close to new accruals of benefit over the next decade which, for simplicity of modelling, we treat as sudden closure in five years’ time. This is not a particularly significant simplification in our view.
The rate of active member withdrawal is set at a constant 5 per cent a year. This is a simplification of reality in which members closer to retirement typically withdraw from service at a lower rate. We assume (for schemes open to new accrual) that there is a constant age profile over time.
We assume that no new DB schemes are set up that are eligible for PPF protection. We also explicitly model schemes as winding up if they have no active members and reach a given level of funding.
5 Sponsor solvency
For the large schemes we assess the initial creditworthiness of the sponsor(s) by looking up current credit ratings. For the smaller schemes we use the failure scores provided for levy purposes and map these to a hypothetical credit rating. We model credit ratings as changing over time, the probabilities of transition being provided by Barrie & Hibbert and reviewed within the PPF.
A large proportion of our universe of employers operates in already mature manufacturing sectors. It is likely that over the long term these companies will employ fewer staff and that for a growing number of them the size of the pension schemes they sponsor will be disproportionately high compared with the size of their operational balance sheet, making the sponsor covenant weak. This likely trend is not expressly captured in our modelling work.
For schemes that we consider are virtually certain to enter the PPF in the very near future but have not yet experienced an insolvency event we bring them onto the PPF balance sheet with immediate effect for the assessment of the long-term funding strategy position, if not for the Annual Report and Accounts which is more of a

32
A1 Further detail on modelling
snapshot. For the March 2013 modelling we have allowed for the insolvency of a few large schemes (for whom insolvency has now occurred) as well as a handful of other schemes some of which have not yet happened.
6 Assurance and future development
Our internal model is subject to continual refinement and audit. KPMG carried out a review of the model in May 2012 based upon the information that we provided to them. The conclusion was that the model is fit for purpose although there are various developments and improvements that we are intending to make over the coming years.
There is a committee within the PPF that is responsible for ensuring that the model is kept up to date and monitors the implementation of model improvements. At the time of writing there is a list of over twenty improvements that we intend to make over the coming years. Over the year we implemented half a dozen, the most significant of which was to model the PPF’s interest and inflation rate hedging programme including explicit modelling of the cash flow swaps that we use to hedge our risk.

33
Related Documents