Revised 8/22 TMD047 PowerQuant ® System Instructions for Use of Products PQ5002 and PQ5008 TECHNICAL MANUAL Revised 8/22 TMD047

Welcome message from author
This document is posted to help you gain knowledge. Please leave a comment to let me know what you think about it! Share it to your friends and learn new things together.
Transcript

Revised 8/22 TMD047
PowerQuant® SystemInstructions for Use of ProductsPQ5002 and PQ5008
T E C H N I C A L M A N U A L
Revised 8/22 TMD047

Promega Corporation · 2800 Woods Hollow Road · Madison, WI 53711-5399 USA · Toll Free in USA 800-356-9526 · 608-274-4330 · Fax 608-277-2516www.promega.com TMD047 · Revised 8/22
1
All technical literature is available at: www.promega.com/protocols/ Visit the web site to verify that you are using the most current version of this Technical Manual.
E-mail Promega Technical Services if you have questions on use of this system: [email protected]
PowerQuant® System
1. Description ............................................................................................................................................3
2. Product Components and Storage Conditions ..............................................................................................5
3. General Considerations ............................................................................................................................6
4. Instrument Calibration ............................................................................................................................64.A. Calibration Plate Setup ...................................................................................................................74.B. Applied Biosystems® 7500 Real-Time PCR System Calibration Protocol for
Applied Biosystems® 7500 Software, Version 2.0.6 .............................................................................84.C. Applied Biosystems® 7500 Real-Time PCR System Calibration Protocol for
HID Real-Time PCR Analysis Software, Version 1.1 or 1.2................................................................... 124.D. QuantStudio™ 5 Real-Time PCR System Calibration Protocol ............................................................... 17
5. Reaction Plate Setup ............................................................................................................................. 185.A. Serial Dilution of the PowerQuant® Male gDNA Standard .................................................................... 185.B. Reaction Setup ............................................................................................................................ 20
6. Run Setup and Thermal Cycling Using the Applied Biosystems® 7500 Real-Time PCR System and Applied Biosystems® 7500 Software, Version 2.0.6 .................................................................................... 216.A. Creating a Run Template ............................................................................................................... 226.B. Starting a Run ............................................................................................................................. 306.C. Evaluating Standard Curves Using the Applied Biosystems® 7500 Software, Version 2.0.6 ....................... 316.D. Exporting Analyzed Data from the Applied Biosystems® 7500 Software, Version 2.0.6 ............................ 32
7. Run Setup and Thermal Cycling Using the Applied Biosystems® 7500 Real-Time PCR System for Human Identification and HID Real-Time PCR Analysis Software, Version 1.1 or 1.2 .................................................. 337.A. Creating a Run Template ............................................................................................................... 337.B. Starting a Run ............................................................................................................................. 417.C. Evaluating Standard Curves Using the HID Real-Time PCR Analysis Software, Version 1.1 or 1.2 .............. 427.D. Exporting Analyzed Data from the HID Real-Time PCR Analysis Software, Version 1.1 or 1.2 .................... 43
8. Run Setup and Thermal Cycling Using the QuantStudio™ 5 Real-Time PCR System .......................................... 448.A. Setting up the QuantStudio™ Design and Analysis Desktop Software..................................................... 448.B. Creating a Run Template ............................................................................................................... 458.C. Starting a Run ............................................................................................................................. 588.D. Evaluating Standard Curves Using the QuantStudio™ Design and Analysis Software ................................ 628.E. Exporting Analyzed Data from QuantStudio™ Design and Analysis Software ........................................... 65

2 Promega Corporation · 2800 Woods Hollow Road · Madison, WI 53711-5399 USA · Toll Free in USA 800-356-9526 · 608-274-4330 · Fax 608-277-2516TMD047 · Revised 8/22 www.promega.com
9. PowerQuant® Analysis Software .............................................................................................................. 669.A. Overview .................................................................................................................................... 669.B. Downloading the PowerQuant® Analysis Software.............................................................................. 679.C. Installing the PowerQuant® Analysis Software .................................................................................. 679.D. Removing the PowerQuant® Analysis Software .................................................................................. 689.E. The Main Menu ............................................................................................................................ 689.F. User Accounts ............................................................................................................................. 719.G. Getting Started ............................................................................................................................ 749.H. Designing a Plate Map .................................................................................................................. 859.I. Importing the PowerQuant® Results Excel® File ................................................................................. 929.J. The PowerQuant® Analysis Software Report .................................................................................... 949.K. Print and Save the PowerQuant® Analysis Software Report ............................................................... 1099.L. Analysis with a Virtual Standard Curve .......................................................................................... 110
10. Interpretation of PowerQuant® Data ....................................................................................................... 11610.A. Internal PCR Control ................................................................................................................... 11610.B. [Auto]/[Y] Ratio .......................................................................................................................... 11710.C. [Auto]/[Deg] Ratio ....................................................................................................................... 117
11. Troubleshooting ................................................................................................................................. 11811.A. The PowerQuant® System ............................................................................................................ 11811.B. The PowerQuant® Analysis Software ............................................................................................. 120
12. Appendix ........................................................................................................................................... 12312.A. References ............................................................................................................................... 12312.B. Spectral Calibration Results ......................................................................................................... 12312.C. Preparation of Alternative Standard Curves .................................................................................... 12412.D. Using the PowerQuant® Analysis Tool ............................................................................................ 12612.E. Interpretation of PowerQuant® Data Using the PowerQuant® Analysis Tool ........................................... 14012.F. Changing the Password in the PowerQuant® Analysis Tool ................................................................ 14212.G. Related Products........................................................................................................................ 14312.H. Summary of Changes .................................................................................................................. 143

Promega Corporation · 2800 Woods Hollow Road · Madison, WI 53711-5399 USA · Toll Free in USA 800-356-9526 · 608-274-4330 · Fax 608-277-2516www.promega.com TMD047 · Revised 8/22
3
1. Description
The PowerQuant® System(a–d) is a five-dye, four-target hydrolysis probe-based qPCR multiplex that amplifies multicopy targets to quantify the total human and human male DNA present in a sample (1). The system also amplifies an additional multicopy target to assess the degree of DNA degradation. Additionally, the PowerQuant® System includes an internal PCR control (IPC) to detect inhibitors in an amplification reaction. The PowerQuant® System achieves levels of sensitivity and inhibitor tolerance comparable to those of newer STR systems (e.g., PowerPlex® Fusion and PowerPlex® Y23 Systems). This Technical Manual describes the PowerQuant® System and provides instructions for use with the Applied Biosystems® 7500 Real-Time PCR System (Applied Biosystems® 7500 Software, Version 2.0.6), Applied Biosystems® 7500 Real-Time PCR System for Human Identification (HID Real-Time PCR Analysis Software, Version 1.1 or 1.2) or the QuantStudio™ 5 Real-Time PCR System.
Data generated using the PowerQuant® System can help determine whether an unknown DNA sample is suitable for short tandem repeat (STR) analysis, what is the appropriate STR system to use (e.g., autosomal or Y-STR) and whether the DNA is degraded or PCR inhibitors are present. This information may be used to guide decisions regarding sample repurification, dilution of DNA samples that are inhibited to help ensure accurate quantification and the optimal template volume to add to an autosomal or Y-chromosomal STR amplification.
A standard curve is required to determine the DNA concentration of unknown DNA samples. This standard curve is generated using the amplification results from a dilution series of a male DNA standard of known concentration.
PowerQuant® 20X Primer/Probe/IPC MixThe PowerQuant® 20X Primer/Probe/IPC Mix includes all primers and probes, the Internal PCR Control and a passive reference dye:• Primers and probe for the autosomal DNA target: The FAM dye-labeled probe of the PowerQuant® System detects a
multicopy human autosomal DNA target. The primers are used to amplify an 84-base-pair amplicon. Data from this reaction quantify the total amount of human DNA in a sample. The autosomal target is short, robust to inhibitors and less likely to be affected by degradation events than the longer degradation target.
• Primers and probes for the Y-chromosomal target: The CAL Fluor® Gold 540 dye-labeled probes of the PowerQuant® System detect the presence of Y chromosomal DNA. The primers are used to amplify two multicopy loci (amplicons of 81bp and 136bp). The use of two multicopy loci minimizes the effect that variation in copy number of any given marker can have on [Auto]/[Y] ratios and increases sensitivity for male DNA.
• Primers and probe for the degradation target: The Quasar® 670 dye-labeled probe of the PowerQuant® System detects the presence of a longer amplicon (294bp) derived from a different region of the same locus as the autosomal target. Due to its greater length, the degradation amplicon is more susceptible to degradation and the presence of inhibitors. The ratio of DNA concentrations determined with the autosomal and degradation targets ([Auto]/[Deg] ratio) can be used to evaluate the degree of degradation (2).
• Primers, probe and template for the Internal PCR Control: The TMR dye-labeled probe of the PowerQuant® System detects the Internal PCR Control, a novel DNA template that is included in every amplification reaction. The primers produce an amplified product that is 435bp. Amplification performance of the IPC is used to detect inhibitors in the sample. This is the longest target in the PowerQuant® System, making the IPC more susceptible to inhibitors than the other targets in the multiplex.
• Passive reference dye: The CXR dye of the PowerQuant® System is used as a passive reference. The CXR dye is included in each amplification reaction. Data from the other dye channels are normalized to this signal.

4 Promega Corporation · 2800 Woods Hollow Road · Madison, WI 53711-5399 USA · Toll Free in USA 800-356-9526 · 608-274-4330 · Fax 608-277-2516TMD047 · Revised 8/22 www.promega.com
PowerQuant® 2X Master Mix
The PowerQuant® 2X Master Mix yields performance (e.g., sensitivity and inhibitor tolerance) comparable to that of newer STR systems and uses hot-start PCR chemistry. The reaction setup should be performed at room temperature and is amenable to automation. Amplification is complete in 1 hour.
PowerQuant® Male gDNA Standard
The PowerQuant® Male gDNA Standard is supplied with the PowerQuant® System. This DNA consists of pooled human male DNA supplied at 50ng/µl. Serial dilutions of this DNA standard are amplified in the same plate as the unknown samples, and the results are used to generate a standard curve for the autosomal, Y and degradation targets. These standard curves are used to determine the DNA concentration for each target. The recommended protocol for the PowerQuant® System uses a four-point standard curve. We recommend performing duplicate amplification reactions with each dilution of the DNA standard and using a dedicated set of pipettes to increase run-to-run consistency. Use the same pipettes to dispense the DNA standard and unknown samples to minimize variability. We do not recommend using other DNA (e.g., DNA isolated from a cell line) as the DNA standard.
PowerQuant® Dilution Buffer
The PowerQuant® Dilution Buffer is supplied as the diluent for serial dilution of the PowerQuant® Male gDNA Standard to create the standard curve.
Instrumentation
The PowerQuant® System is designed and optimized for use with the Applied Biosystems® 7500 Real-Time PCR System (Applied Biosystems® 7500 Software, Version 2.0.6), Applied Biosystems® 7500 Real-Time PCR System for Human Identification (HID Real-Time PCR Analysis Software, Version 1.1 or 1.2) or the QuantStudio™ 5 Real-Time PCR System. Calibration with custom dyes is required prior to DNA quantification (see Section 4).
PowerQuant® Analysis Software
The PowerQuant® Analysis Software is available for download to assist with data analysis, data review and DNA normalization prior to STR amplification.
The PowerQuant® Analysis Software is available at: www.promega.com/resources/software-firmware/

Promega Corporation · 2800 Woods Hollow Road · Madison, WI 53711-5399 USA · Toll Free in USA 800-356-9526 · 608-274-4330 · Fax 608-277-2516www.promega.com TMD047 · Revised 8/22
5
2. Product Components and Storage Conditions
P R O D U C T S I Z E C AT. #
PowerQuant® System 200 reactions PQ5002
Not For Medical Diagnostic Use. This system contains sufficient reagents for 200 reactions. Includes:
• 2 × 1.1ml PowerQuant® 2X Master Mix• 1 × 220µl PowerQuant® 20X Primer/Probe/IPC Mix• 1 × 150µl PowerQuant® Male gDNA Standard• 2 × 1.25ml Water, Amplification Grade• 2 × 1.5ml PowerQuant® Dilution Buffer
P R O D U C T S I Z E C AT. #
PowerQuant® System 800 reactions PQ5008
Not For Medical Diagnostic Use. This system contains sufficient reagents for 800 reactions. Includes:
• 8 × 1.1ml PowerQuant® 2X Master Mix• 4 × 220µl PowerQuant® 20X Primer/Probe/IPC Mix• 3 × 150µl PowerQuant® Male gDNA Standard• 5 × 1.25ml Water, Amplification Grade• 8 × 1.5ml PowerQuant® Dilution Buffer
Storage Conditions: Store the PowerQuant® System at –30°C to –10°C in a nonfrost-free freezer. Store the PowerQuant® Male gDNA Standard overnight at 4°C prior to the first use; do not refreeze. For short-term storage (less that 1 week), store the other components at +2°C to +10°C. Minimize the number of freeze-thaw cycles. The PowerQuant® 20X Primer/Probe/IPC Mix is light-sensitive and must be stored in the dark. Dilutions of the PowerQuant® Male gDNA Standard in PowerQuant® Dilution Buffer can be stored at 4°C for up to 1 week.
Available SeparatelyP R O D U C T S I Z E C AT. #
PowerQuant® Calibration Kit 1 each DS1221
Not for Medical Diagnostic Use. Includes:
• 60µl PowerQuant® Calibration Standard, FAM• 60µl PowerQuant® Calibration Standard, CFG540• 60µl PowerQuant® Calibration Standard, TMR• 60µl PowerQuant® Calibration Standard, Q670• 60µl PowerQuant® Calibration Standard, CXR• 30ml PowerQuant® Calibration Buffer
Storage Conditions: Store the PowerQuant® System Calibration Kit at –30°C to –10°C in a nonfrost-free freezer. For short-term storage (less than 1 week), the kit can be stored at +2°C to +10°C. Minimize the number of freeze-thaw cycles. The PowerQuant® Calibration Kit is light-sensitive and must be stored in the dark.

6 Promega Corporation · 2800 Woods Hollow Road · Madison, WI 53711-5399 USA · Toll Free in USA 800-356-9526 · 608-274-4330 · Fax 608-277-2516TMD047 · Revised 8/22 www.promega.com
3. General Considerations
The PowerQuant® System is extremely sensitive; take precautions to minimize contamination. We recommend storing the PowerQuant® reagents separately from DNA samples. We also recommend using clean designated work areas and separate pipettes for pre- and post-amplification steps to minimize the potential for cross-contamination between DNA samples and prevent carryover of nucleic acid from one run to the next. Wear a lab coat and protective eyewear. Wear gloves, and change them often. Prevent contamination by using aerosol-resistant pipette tips. Always include a no-template control (NTC) reaction to detect contamination. We recommend performing NTC reactions in duplicate.
Do not unseal reaction plates after amplification is complete. Unsealing the plates increases the risk of contaminating subsequent reactions with amplified product.
Always check to ensure that the instrument software’s analysis settings are set correctly (see Sections 6, 7 and 8).
4. Instrument Calibration
Before using the PowerQuant® System, you must calibrate the instrument for FAM, CAL Fluor® Gold 540, TMR, Quasar® 670 and CXR dyes. To distinguish these dyes from dyes with the same name already calibrated on your instrument, we recommend appending dye names with the prefix “PQ” for the PowerQuant® System: PQ_FAM (for the FAM dye), PQ_CFG540 (for CAL Fluor® Gold 540), PQ_TMR (for TMR), PQ_Q670 (for Quasar® 670) and PQ_CXR (for CXR).
The dyes in the PowerQuant® System Calibration Kit are supplied at 100X. The PowerQuant® Calibration Buffer is supplied as a diluent when preparing a spectral calibration plate for each dye.
Prior to performing PowerQuant® System dye calibration with the Applied Biosystems® 7500 Real-Time PCR System, we recommend performing the Regions of Interest (ROI) calibration, background calibration and optical calibration as described in the Applied Biosystems 7500/7500 Fast Real-Time PCR Systems Maintenance Guide.
Prior to performing PowerQuant® System dye calibration with the QuantStudio™ 5 Real-Time PCR System, we recommend verifying the factory installed calibrations have been performed and are current with your laboratory instrument maintenance schedule. Refer to the QuantStudio™ 5 Real-Time PCR Instrument User Guide for Human Identification for additional information.
Materials to Be Supplied by the User• PowerQuant® Calibration Kit (Cat.# DS1221)• Applied Biosystems® 7500 Real-Time PCR System, Applied Biosystems® 7500 Real-Time PCR System for Human
Identification or QuantStudio™ 5 Real-Time PCR System• Applied Biosystems® instrument-related consumables (e.g., MicroAmp® optical 96-well reaction plate and MicroAmp®
optical adhesive film)• sterile, aerosol-resistant pipette tips• tubes (5ml or larger) for diluting the PowerQuant® Calibration Standards

Promega Corporation · 2800 Woods Hollow Road · Madison, WI 53711-5399 USA · Toll Free in USA 800-356-9526 · 608-274-4330 · Fax 608-277-2516www.promega.com TMD047 · Revised 8/22
7
4.A. Calibration Plate Setup
1. ThawthefivePowerQuant®CalibrationStandards(FAM,CFG540,TMR,Q670andCXR)andPowerQuant®CalibrationBuffer.
2. VortexeachPowerQuant®CalibrationStandardandPowerQuant®CalibrationBufferfor10 secondstomix.DonotcentrifugethePowerQuant®CalibrationStandardsaftermixing.
3. DiluteeachPowerQuant®CalibrationStandard100-foldinPowerQuant®CalibrationBufferinaseparatetubeasdescribedbelow.
Reagent FAM CFG540 TMR Q670 CXR
PowerQuant®CalibrationStandard,FAM 22µl – – – –
PowerQuant®CalibrationStandard,CFG540 – 22µl – – –
PowerQuant®CalibrationStandard,TMR – – 22µl – –
PowerQuant®CalibrationStandard,Q670 – – – 22µl –
PowerQuant®CalibrationStandard,CXR – – – – 22µl
PowerQuant®CalibrationBuffer 2,178µl 2,178µl 2,178µl 2,178µl 2,178µl
Total volume 2,200µl 2,200µl 2,200µl 2,200µl 2,200µl
4. VortexeachdilutedPowerQuant®CalibrationStandardfor10 secondstomix.Do notcentrifugethedilutedstandardsaftermixing.
5. ReserveaseparateMicroAmp®optical96-wellreactionplateforeachPowerQuant®CalibrationStandard.Recordthebarcodenumberorlabelthesideoftheplateskirttoindicatethecalibrationstandardintheplate.
Note:Wearglovesatalltimeswhenhandlingtheplate,andtakecaretoavoidtouchingtheplatewellsandMicroAmp® opticaladhesivefilmunnecessarily.Handletheplatebytheedges,andavoidtouchingthebottomoftheplate.
6. Dispense20µlofdilutedPowerQuant®CalibrationStandard,FAM,intoall96 wellsoftheplatereservedfortheFAMdye.RepeatthisstepforeachoftheotherPowerQuant®CalibrationStandardsbyadding20µlofthedilutedcalibrationstandardtoeachwelloftheappropriatedye-specificplate.
7. SealeachplatewithMicroAmp®opticaladhesivefilm.Protecttheplatesfromexposuretolight.
8. Centrifugeplatesbriefly.Tocompletethecalibration,proceedtoSection 4.BfortheAppliedBiosystems®7500Software,Version 2.0.6,Section 4.CfortheHIDReal-TimePCRAnalysisSoftware,Version 1.1or1.2.orSection4.DfortheQuantStudio™5.
Note:Aftercalibration,storethecalibrationplatesprotectedfromlightat–20°Cforupto4 months.Reusetheplateswhenre-analysisisnecessary.

8 Promega Corporation · 2800 Woods Hollow Road · Madison, WI 53711-5399 USA · Toll Free in USA 800-356-9526 · 608-274-4330 · Fax 608-277-2516TMD047 · Revised 8/22 www.promega.com
4.B. Applied Biosystems® 7500 Real-Time PCR System Calibration Protocol for Applied Biosystems® 7500 Software, Version 2.0.6
The following instructions are for the Applied Biosystems® 7500 Real-Time PCR System instrument using the Applied Biosystems® 7500 Software, Version 2.0.6. This instrument is also compatible with HID Real-Time PCR Analysis Software, Version 1.1 or 1.2; to use this software, see the instructions provided in Section 4.C.
1. Turn on the computer associated with the Applied Biosystems® 7500 Real-Time PCR System.
2. Turn on the Applied Biosystems® 7500 Real-Time PCR System.
3. Open the Applied Biosystems® 7500 Software, Version 2.0.6.
4. From the Instrument menu at the top of the screen, select Instrument Maintenance Manager.
5. Select the Dye section from the left panel.
6. Choose “Custom Dye Calibration”, and select Start Calibration (Figure 1).
1285
9TA
Figure 1. The Custom Dye Calibration option and Start Calibration button.

Promega Corporation · 2800 Woods Hollow Road · Madison, WI 53711-5399 USA · Toll Free in USA 800-356-9526 · 608-274-4330 · Fax 608-277-2516www.promega.com TMD047 · Revised 8/22
9
7. In the ‘Dye Calibration’ window that appears, select the New Dye button (Figure 2).
1283
1TA
Figure 2. Calibrating a new dye.

10 Promega Corporation · 2800 Woods Hollow Road · Madison, WI 53711-5399 USA · Toll Free in USA 800-356-9526 · 608-274-4330 · Fax 608-277-2516TMD047 · Revised 8/22 www.promega.com
4.B. Applied Biosystems® 7500 Real-Time PCR System Calibration Protocol for Applied Biosystems® 7500 Software, Version 2.0.6 (continued)
8. In the ‘Dye Library’ window that appears, select the New button (Figure 3).
F
1283
2TA
igure 3. The New button in the ‘Dye Library’ window.
9. Enter “PQ_FAM” as the new dye name, select the Reporter radio button under “Type” and then select OK (Figure 4). Repeat this process to define the CFG540 (define as PQ_CFG540), TMR (define as PQ_TMR), Q670 (define as PQ_Q670) and CXR (define as PQ_CXR) dyes.
1283
3TA
Figure 4. Naming the new dye.

Promega Corporation · 2800 Woods Hollow Road · Madison, WI 53711-5399 USA · Toll Free in USA 800-356-9526 · 608-274-4330 · Fax 608-277-2516www.promega.com TMD047 · Revised 8/22
11
10. In the Custom Dye Calibration Setup window, select PQ_FAM from the ‘Dye Name’ drop-down list (Figure 5).
1286
0TA
Figure 5. Selecting the dye name from the drop-down list.
11. Load the plate prepared in Section 4.A for the PowerQuant® Calibration Standard, FAM, into the instrument.
12. Check the box labeled “The custom dye plate is loaded into the instrument” (Figure 5).
13. Select Next, then Start Run.
14. Once the calibration run is complete, select Next in the bottom right corner of the window. The software will display the spectra and indicate whether the spectra are acceptable (i.e., which spectra passed) under Status.
15. Select Finish, and repeat Steps 10 through 13 with each plate of PowerQuant® Calibration Standards to calibrate the other dyes: CFG540 (PQ_CFG540), TMR (PQ_TMR), Q670 (PQ_Q670) and CXR (PQ_CXR).
Notes: 1. FAM should give highest signal in Filter 1, CFG540 should give highest signal in Filter 2, TMR should give highest
signal in Filter 3, Q670 should give highest signal in Filter 5 and CXR should give highest signal in Filter 4. Figure 1 shows an example of a dye calibration spectrum (PQ_FAM) across all five filters. Representative images of dye calibration spectra for all the five dyes are shown in Appendix 12.B.
2. After calibration, store the calibration plates protected from light at –20°C for up to 4 months. Reuse the plates when re-analysis is necessary.

12 Promega Corporation · 2800 Woods Hollow Road · Madison, WI 53711-5399 USA · Toll Free in USA 800-356-9526 · 608-274-4330 · Fax 608-277-2516TMD047 · Revised 8/22 www.promega.com
4.C. Applied Biosystems® 7500 Real-Time PCR System Calibration Protocol for HID Real-Time PCR Analysis Software, Version 1.1 or 1.2
The following instructions are for the Applied Biosystems® 7500 Real-Time PCR System instrument using the HID Real-Time PCR Analysis Software, Version 1.1 or 1.2.
1. Turn on the computer associated with the Applied Biosystems® 7500 Real-Time PCR System for Human Identification.
2. Turn on the Applied Biosystems® 7500 Real-Time PCR System for Human Identification.
3. Open the HID Real-Time PCR Analysis Software, Version 1.1 or 1.2.
4. From the Instrument menu at the top of the screen, select Instrument Maintenance Manager.
5. Select the Dye section from the left panel.
6. Choose “Custom Dye Calibration”, and select Start Calibration (Figure 6).
1283
4TA
Figure 6. The Custom Dye Calibration option and Start Calibration button.

Promega Corporation · 2800 Woods Hollow Road · Madison, WI 53711-5399 USA · Toll Free in USA 800-356-9526 · 608-274-4330 · Fax 608-277-2516www.promega.com TMD047 · Revised 8/22
13
7. In the ‘Dye Calibration’ window that appears, select the New Dye button (Figure 7).
1283
5TA
Figure 7. Calibrating a new dye.
8. In the ‘Dye Library’ window that appears, select the New button (Figure 8).
1283
6TA
Figure 8. The New button in the ‘Dye Library’ window.

14 Promega Corporation · 2800 Woods Hollow Road · Madison, WI 53711-5399 USA · Toll Free in USA 800-356-9526 · 608-274-4330 · Fax 608-277-2516TMD047 · Revised 8/22 www.promega.com
4.C. Applied Biosystems® 7500 Real-Time PCR System Calibration Protocol for Applied Biosystems® HID Real-Time PCR Analysis Software, Version 1.1 or 1.2 (continued)
9. Enter “PQ_FAM” as the new dye name, select the Reporter radio button under Type and then select OK (Figure 9). Repeat this process to define the CFG540 (define as PQ_CFG540), TMR (define as PQ_TMR) and Q670 (define as PQ_Q670) dyes.
F
1283
7TA
igure 9. Naming the new dye.
10. In the Custom Dye Calibration Setup window, select PQ_FAM from the ‘Dye Name’ drop-down list (Figure 10).
1283
8TA
Figure 10. Selecting the dye name from the drop-down list.

Promega Corporation · 2800 Woods Hollow Road · Madison, WI 53711-5399 USA · Toll Free in USA 800-356-9526 · 608-274-4330 · Fax 608-277-2516www.promega.com TMD047 · Revised 8/22
15
11. LoadtheplatepreparedinSection 4.AforthePowerQuant®CalibrationStandard,FAM,intotheinstrument.
12. Checktheboxlabeled“Thecustomdyeplateisloadedintotheinstrument”(Figure 10).
13. Select Next, then Start Run.
14. Oncethecalibrationruniscomplete,selectNextinthebottomrightcornerofthewindow.Thesoftwarewilldisplaythespectraandindicatewhetherthespectraareacceptable(i.e., whichspectrapassed)underStatus.
15. Select Finish,andrepeatSteps 10through13witheachplateofPowerQuant®CalibrationStandardstocalibratetheotherdyes:CFG540(PQ_CFG540),TMR(PQ_TMR)andQ670(PQ_Q670).
Notes: 1. FAMshouldgivehighestsignalinFilter 1,CFG540shouldgivehighestsignalinFilter 2,TMRshouldgivehighest
signalinFilter 3andQ670shouldgivehighestsignalinFilter 5.Figure 6showsanexampleofadyecalibrationspectrum(PQ_FAM)acrossallfivefilters.SeeAppendix12.Bforrepresentativespectralimagesofallfivedyes.
2. Aftercalibration,storethecalibrationplatesprotectedfromlightat–20°Cforupto4 months.Reusetheplateswhenre-analysisisnecessary.
16. TocalibrateCXR,intheDye screen select“SystemDyeCalibration”,andselecttheStart Calibrationbutton(Figure 11).
1283
9TA
Figure 11. Selecting “System Dye Calibration” and the Start Calibration button.

16 Promega Corporation · 2800 Woods Hollow Road · Madison, WI 53711-5399 USA · Toll Free in USA 800-356-9526 · 608-274-4330 · Fax 608-277-2516TMD047 · Revised 8/22 www.promega.com
4.C. Applied Biosystems® 7500 Real-Time PCR System Calibration Protocol for Applied Biosystems® HID Real-Time PCR Analysis Software, Version 1.1 or 1.2 (continued)
17. The Overview window opens. Select Next.
18. The Materials Required window opens. Check only the box for “ROX”, and select Next (Figure 12).
F
1284
0TA
igure 12. Choosing the dye to calibrate.
19. The ‘Preparing the Plate’ window opens. Select Next.
20. The ‘Loading the Plate’ window opens. Select Next. Load the plate with the PowerQuant® Calibration Standard, CXR, into the instrument.
21. Select Start Run.
22. Once the calibration run is complete, select Next in the bottom right corner of the window. The software will display the spectrum and indicate whether the spectrum is acceptable (i.e., spectrum passed) under Status.
23. Select Next.
24. Select Finish Calibrating ROX.

Promega Corporation · 2800 Woods Hollow Road · Madison, WI 53711-5399 USA · Toll Free in USA 800-356-9526 · 608-274-4330 · Fax 608-277-2516www.promega.com TMD047 · Revised 8/22
17
4.D. QuantStudio™ 5 Real-Time PCR System Calibration Protocol
1. Enter the Settings menu on the QuantStudio™ 5 home screen. Select the Maintenance and Service option on the subsequent screen.
2. Select Calibrations>Custom>Custom Dye.
3. Select Add Custom Dye.
4. Enter and save the following dye names: “PQ_FAM”, “PQ_CFG540”, “PQ_TMR”, “PQ_Q670” and “PQ_CXR”.
5. Confirmthat“Reporter”isselectedastheTypeforeachdye.
6. Load the appropriate dye calibration plate onto the instrument. You can open and close the tray door by touching the Eject icon on the home screen.
7. Select the corresponding dye you wish to calibrate in the Custom Dye menu. Enter “60°C” for the calibration temperature.
8. Select the Start button. Each dye calibration will require approximately 3 minutes to complete.
9. “Calibration Complete” and “View Results” will display at the end of each calibration run. Refer to the next section for information on reviewing and evaluating the dye calibration results. Unload the plate and repeat the calibration process for each of the PowerQuant® calibration standard dye plates.
Evaluating the PowerQuant® Dye Calibration Spectra
1. Select View Results>Details. Note: The calibration spectra will be displayed on the QuantStudio™ 5 instrument screen.
2. Review the dye spectrum plot for each calibration run. Examples of passing calibration spectra for each of the PowerQuant® dyes are provided in Appendix 12.B.
3. Select Accept Resultstoconfirmthatthecalibrationresultisacceptable.Asecondconfirmationwillappearinwhich you will have to Accept Results again. This action will save the calibration data in the instrument.
You can select Reject Results if the results are unacceptable. Note: You can test the calibration plate again. For further calibration troubleshooting please refer to the Troubleshoot
Calibration Failure section in Appendix A of the QuantStudio™ 5 Real-Time PCR Instrument User Guide for Human Identification.

18 Promega Corporation · 2800 Woods Hollow Road · Madison, WI 53711-5399 USA · Toll Free in USA 800-356-9526 · 608-274-4330 · Fax 608-277-2516TMD047 · Revised 8/22 www.promega.com
5. Reaction Plate Setup
When using the PowerQuant® System for the first time, we recommend completing the steps in Section 6, 7 or 8 prior to assembling the reactions. Once you are familiar with instrument setup, the instrument can be programmed after reaction setup.
Materials to Be Supplied By the User• sterile, aerosol-resistant pipette tips• pipettes dedicated to pre-amplification work• Applied Biosystems® instrument-related consumables (e.g., MicroAmp® optical 96-well reaction plate and MicroAmp®
optical adhesive film)• PowerQuant® Dilution Buffer or TE–4 buffer (pH 8.0)• tubes to prepare the DNA standard dilution series
This protocol uses 2µl of template DNA per reaction. The template volume can be increased as long as the final reaction volume remains constant. The template DNA volume and final reaction volume must be the same for both the DNA standards and unknown DNA samples. This allows the DNA standards to be considered as a concentration (in ng/µl) instead of input amount in ng (concentration in ng/µl × volume). We recommend performing duplicate amplifications of each DNA standard and each unknown DNA sample. Performing duplicate analysis of each sample DNA and averaging the quantification results can reduce variability.
The four-point serial dilutions prepared in this section include DNA standards in the range of 3.2pg/µl to 50ng/µl. These values can be modified if desired. Section 12.C describes alternative serial dilutions of the PowerQuant® Male gDNA Standard to prepare five-, six- and seven-point standard curves.
When diluting the PowerQuant® Male gDNA Standard or unknown DNA samples, use the PowerQuant® Dilution Buffer or TE–4 buffer (pH 8.0); do not use water as a diluent.Note: We recommend changing gloves often, especially after handling high-concentration DNA.
5.A. Serial Dilution of the PowerQuant® Male gDNA Standard
Multiple freeze-thaw cycles of the PowerQuant® Male gDNA Standard can increase variability in the standard curve. Store the PowerQuant® Male gDNA Standard at 4°C overnight before the first use, and vortex thoroughly prior to each use. We recommend long-term storage at 4°C.
Perform serial 25-fold dilutions of the PowerQuant® Male gDNA Standard, and then amplify these dilutions to create four-point standard curves to determine the concentration of autosomal, Y and degradation targets in the unknown DNA samples. Accurate serial dilution of the PowerQuant® Male gDNA Standard is essential to accurately quantify unknown DNA samples; carefully mix and pipet each DNA standard dilution.

Promega Corporation · 2800 Woods Hollow Road · Madison, WI 53711-5399 USA · Toll Free in USA 800-356-9526 · 608-274-4330 · Fax 608-277-2516www.promega.com TMD047 · Revised 8/22
19
The PowerQuant® Dilution Buffer or TE–4 buffer (pH 8.0) can be used as the diluent for the PowerQuant® Male gDNA Standard. Serial dilutions of the PowerQuant® Male gDNA Standard prepared with PowerQuant® Dilution Buffer can be stored for up to 1 week at 4°C. Serial dilutions prepared with TE–4 buffer (pH 8.0) should be prepared fresh daily.
1. Ensure that the PowerQuant® Male gDNA Standard was stored at 4°C overnight. If necessary, thaw the PowerQuant® Dilution Buffer completely. Vortex the PowerQuant® Male gDNA Standard three times at high speed for 10 seconds each time.
Note: After the initial thaw, store the PowerQuant® Male gDNA Standard and PowerQuant® Dilution Buffer at 4°C.
2. Label three tubes with the following concentrations: 2ng/µl, 0.08ng/µl and 0.0032ng/µl.
3. Prepare fresh serial dilutions of the PowerQuant® Male gDNA Standard as indicated in Table 1. Vortex each dilution for 10 seconds prior to removing an aliquot for the next dilution. Change pipette tips between dilutions.
Table 1. Serial Dilution of the PowerQuant® Male gDNA Standard (25-Fold Dilutions).
DNA ConcentrationVolume of PowerQuant®
Male gDNA StandardVolume of PowerQuant®
Dilution Buffer
50ng/µl Use undiluted PowerQuant® Male gDNA Standard 0µl
2ng/µl 4µl of undiluted PowerQuant® Male gDNA Standard 96µl
0.08ng/µl 4µl of 2ng/µl dilution 96µl
0.0032ng/µl 4µl of 0.08ng/µl dilution 96µl Notes: 1. We recommend performing duplicate amplifications of each DNA standard. 2. Change gloves after handling high-concentration DNA such as the PowerQuant® Male gDNA Standard. 3. Serial dilutions of PowerQuant® Male gDNA Standard prepared with the PowerQuant® Dilution Buffer can be
stored for up to 1 week at 4°C. Do not store dilutions prepared with TE–4 buffer (pH 8.0).

20 Promega Corporation · 2800 Woods Hollow Road · Madison, WI 53711-5399 USA · Toll Free in USA 800-356-9526 · 608-274-4330 · Fax 608-277-2516TMD047 · Revised 8/22 www.promega.com
5.B. Reaction Setup
Include a no-template control reaction for each set of reactions. Add 2µl of TE–4 buffer (pH 8.0) or Water, Amplification Grade, to these reactions instead of template DNA. No amplification product (i.e., DNA concentration <1.0pg per 2µl input volume) should be detected in the NTC reaction. A DNA concentration of >1.0pg per 2µl input volume for the NTC reaction indicates the presence of contaminating DNA.
Sample DNA may be diluted in TE–4 buffer (pH 8.0) if desired.Note: The PowerQuant® System is extremely sensitive. The NTC reaction may yield amplification products in the subpicogram range. We recommend that you perform duplicate amplifications of the NTC reaction.
1. Thaw the PowerQuant® 2X Master Mix, PowerQuant® 20X Primer/Probe/IPC Mix and Water, Amplification Grade, completely at room temperature.
2. Vortex the PowerQuant® 2X Master Mix and PowerQuant® 20X Primer/Probe/IPC Mix for 10 seconds to mix. Do not centrifuge after mixing as this may cause the primers and probes to be concentrated at the bottom of the tube.
3. Determine the number of reactions to be set up, including NTC reactions. Increase this number by 10–15% to compensate for pipetting error and reagent loss on sides of pipette tips. While this approach requires using a small amount of extra reagent, it ensures that enough reaction mix is prepared for all amplifications. Amplification of the unknown DNA samples and DNA standards using the same reaction mix is critical.
4. Use Table 2 to calculate the volume of each component required to prepare sufficient reaction mix for the number of reactions determined in Step 3.
Table 2. Preparation of Reaction Mix for DNA Quantification Using the PowerQuant® System.
ComponentVolume Per
Reaction×
Number of Reactions
=Final
Volume
Water, Amplification Grade1 7µl × =
PowerQuant® 2X Master Mix 10µl × =
PowerQuant® 20X Primer/Probe/IPC Mix 1µl × =
Final volume 18µl1The volume of water given here assumes 2µl of template per 20µl reaction. If the volume of template is different, adjust the volume of water accordingly.
5. Prepare the reaction mix by combining the volumes of Water, Amplification Grade, PowerQuant® 2X Master Mix and PowerQuant® 20X Primer/Probe/IPC Mix calculated in Step 4.
6. Vortex for 10 seconds to mix. Do not centrifuge after mixing.
7. Add 18µl of reaction mix to the reaction wells of a MicroAmp® optical 96-well reaction plate. Note: Wear gloves at all times when handling the plate, and take care to avoid touching the plate wells and MicroAmp®
optical adhesive film unnecessarily. Handle the plate by the edges, and avoid touching the bottom of the plate.

Promega Corporation · 2800 Woods Hollow Road · Madison, WI 53711-5399 USA · Toll Free in USA 800-356-9526 · 608-274-4330 · Fax 608-277-2516www.promega.com TMD047 · Revised 8/22
21
8. Add 2µl of the PowerQuant® Male gDNA Standards prepared in Section 5.A or unknown DNA sample to the wells as shown in Figure 13.
1 2 3 4 5 6 7 8 9 10 11 12
A 50ng/µl Unknown Unknown Unknown Unknown Unknown Unknown Unknown Unknown Unknown Unknown Unknown
B 50ng/µl Unknown Unknown Unknown Unknown Unknown Unknown Unknown Unknown Unknown Unknown Unknown
C 2ng/µl Unknown Unknown Unknown Unknown Unknown Unknown Unknown Unknown Unknown Unknown Unknown
D 2ng/µl Unknown Unknown Unknown Unknown Unknown Unknown Unknown Unknown Unknown Unknown Unknown
E 0.08ng/µl Unknown Unknown Unknown Unknown Unknown Unknown Unknown Unknown Unknown Unknown Unknown
F 0.08ng/µl Unknown Unknown Unknown Unknown Unknown Unknown Unknown Unknown Unknown Unknown Unknown
G 0.0032ng/µl Unknown Unknown Unknown Unknown Unknown Unknown Unknown Unknown Unknown Unknown NTC
H 0.0032ng/µl Unknown Unknown Unknown Unknown Unknown Unknown Unknown Unknown Unknown Unknown NTC
Figure 13. An example of a 96-well plate that shows locations of the DNA standards (yellow), NTC reactions (blue) and unknown samples.
9. Add 2µl of TE–4 buffer (pH 8.0) or Water, Amplification Grade, to the NTC reactions.
10. Seal the plate with MicroAmp® optical adhesive film. Note: Ensure that all wells are adequately sealed to prevent evaporation during thermal cycling.
11. Centrifuge the plate briefly to collect the contents of each well at the bottom. The plate is ready for thermal cycling. Protect the plate from extended light exposure or elevated temperatures prior to thermal cycling.
Note: Artifacts may occur if the time between amplification setup and the start of thermal cycling exceeds 2 hours.
6. Run Setup and Thermal Cycling Using the Applied Biosystems® 7500 Real-Time PCR System and Applied Biosystems® 7500 Software, Version 2.0.6
The following instructions are for the Applied Biosystems® 7500 Real-Time PCR System instrument using the Applied Biosystems® 7500 Software, Version 2.0.6. This instrument is also compatible with HID Real-Time PCR Analysis Software, Version 1.1 or 1.2; to use this software, use the instructions provided in Section 7.
A template file (.edt file) can be used to store the dye information, target names and tasks; well locations and DNA concentrations for the DNA standards; run method and analysis settings. A plate setup import file may be used to add sample names, well position and standard information to a run template. See Section 9.H for instructions on creating a plate setup import file with the PowerQuant® Analysis Software.
Amplification is complete in 1 hour.
!

22 Promega Corporation · 2800 Woods Hollow Road · Madison, WI 53711-5399 USA · Toll Free in USA 800-356-9526 · 608-274-4330 · Fax 608-277-2516TMD047 · Revised 8/22 www.promega.com
6.A. Creating a Run Template
1. Turn on the computer associated with the Applied Biosystems® 7500 Real-Time PCR System.
2. Turn on the Applied Biosystems® 7500 Real-Time PCR System.
3. Open the Applied Biosystems® 7500 Software, Version 2.0.6.
4. Before using the PowerQuant® System, check that the instrument was calibrated using the PowerQuant® Calibration Kit (Section 4).
5. On the ‘Home’ screen under Set-Up, select the Advanced Setup icon. Alternatively, select the New Experiment button, and choose “Advanced Setup” from the drop-down menu.
6. In the Experiment Properties form (Figure 14), specify the following parameters:• Enter a name for the template in the Experiment Name field.• Select the instrument you are using to run the experiment by selecting 7500 (96 Wells).• Select the type of experiment you want to set up by selecting Quantitation-Standard Curve.• Select the reagents you want to use to detect the target sequence by selecting TaqMan® Reagents.• Select the ramp speed you want to use in the instrument run by selecting Standard (~2 hours to complete run).

Promega Corporation · 2800 Woods Hollow Road · Madison, WI 53711-5399 USA · Toll Free in USA 800-356-9526 · 608-274-4330 · Fax 608-277-2516www.promega.com TMD047 · Revised 8/22
23
1284
2TA
Figure 14. The Experiment Properties screen.

24 Promega Corporation · 2800 Woods Hollow Road · Madison, WI 53711-5399 USA · Toll Free in USA 800-356-9526 · 608-274-4330 · Fax 608-277-2516TMD047 · Revised 8/22 www.promega.com
6.A. Creating a Run Template (continued)
7. Select “Plate Setup” from the Setup menu in the left panel. Select the ‘Define Targets and Samples’ tab. Select Add New Target (Figure 15) three additional times, and enter the following information to specify the targets:
Target Name Reporter Quencher
Autosomal PQ_FAM NFQ-MGB
Y PQ_CFG540 NFQ-MGB
Degradation PQ_Q670 NFQ-MGB
IPC PQ_TMR NFQ-MGB
Note: Target name identifiers are necessary for the PowerQuant® Analysis Software to recognize these targets.
1284
3TA
Figure 15. The Plate Setup Screen.

Promega Corporation · 2800 Woods Hollow Road · Madison, WI 53711-5399 USA · Toll Free in USA 800-356-9526 · 608-274-4330 · Fax 608-277-2516www.promega.com TMD047 · Revised 8/22
25
8. Select the ‘Assign Targets and Samples’ tab (Figure 16), and highlight the wells in use on the ‘View Plate Layout’ tab by dragging the pointer over the plate wells. Assign all four targets to the selected wells by selecting the boxes under “Assign”.
1284
4TA
Figure 16. Assigning targets to wells.

26 Promega Corporation · 2800 Woods Hollow Road · Madison, WI 53711-5399 USA · Toll Free in USA 800-356-9526 · 608-274-4330 · Fax 608-277-2516TMD047 · Revised 8/22 www.promega.com
6.A. Creating a Run Template (continued)
9. Highlight the wells containing the DNA standards on the ‘View Plate Layout’ tab, and select S as the Task for the autosomal, Y and degradation targets (Figure 17).
Note: The Task for the IPC should be “U”.
1286
1TA
Figure 17. Assigning DNA concentrations to wells with DNA standards.
10. Enter the concentration for each DNA standard in the Quantity field without the unit of measure (i.e., enter 50 for 50ng/µl).
Notes: 1. Multiple wells with DNA standards at the same DNA concentration can be highlighted at the same time so that
values need to be entered only once. 2. The Define and Setup Standards tool will not work for assigning a standard curve to multiple targets in the same
sample.

Promega Corporation · 2800 Woods Hollow Road · Madison, WI 53711-5399 USA · Toll Free in USA 800-356-9526 · 608-274-4330 · Fax 608-277-2516www.promega.com TMD047 · Revised 8/22
27
11. Select PQ_CXR from the drop-down menu labeled “Select the dye to use as the passive reference” (Figure 18).
1286
2TA
Figure 18. The Assign Targets and Samples screen. Select PQ_CXR as the passive reference.

28 Promega Corporation · 2800 Woods Hollow Road · Madison, WI 53711-5399 USA · Toll Free in USA 800-356-9526 · 608-274-4330 · Fax 608-277-2516TMD047 · Revised 8/22 www.promega.com
6.A. Creating a Run Template (continued)
12. From the Analysis menu at the top of the screen, select Analysis Settings.
13. On the ‘CT Settings’ tab (Figure 19) in the Select a Target panel, select the Autosomal target.
14. In the CT Settings for Autosomal section, uncheck the “Use Default Settings” box and uncheck the “Automatic Threshold” box. Enter “0.2” for the threshold. Leave the “Automatic Baseline” box checked.
15. Repeat this process for each target listed in the Select a Target panel using the following threshold values:• Autosomal: 0.2• Degradation: 0.2• IPC: 0.03• Y: 0.2
Select Apply Analysis Settings.
1284
5TA
Figure 19. The ‘Analysis Settings’ window.

Promega Corporation · 2800 Woods Hollow Road · Madison, WI 53711-5399 USA · Toll Free in USA 800-356-9526 · 608-274-4330 · Fax 608-277-2516www.promega.com TMD047 · Revised 8/22
29
16. Select Run Method under Setup in the left panel. Modify the default run method as directed below:• Enter “20” for “Reaction Volume per Well”.• Select the first Holding Stage, and click with the right button on the computer’s mouse to bring up a menu.
Select Delete Selected to delete this stage.• Change the second Holding Stage to 2 minutes at 98°C.• Enter “39” for “Number of Cycles” under Cycling Stage.• Change Step 1 to 98°C for 15 seconds and Step 2 to 62°C for 35 seconds.• Ensure that the Data Collection On icon is active for Step 2 of the Cycling Stage. Note: The Data Collection On icon is shown in the legend at the bottom of the screen.
The completed PowerQuant® System run method is shown in Figure 20.
1284
6TA
Figure 20. The completed PowerQuant® System run method.

30 Promega Corporation · 2800 Woods Hollow Road · Madison, WI 53711-5399 USA · Toll Free in USA 800-356-9526 · 608-274-4330 · Fax 608-277-2516TMD047 · Revised 8/22 www.promega.com
6.A. Creating a Run Template (continued)
17. From the File menu at the top of the screen, select Save as Template, and choose a location to save the file. The instrument setup and thermal cycling program can be saved as a template for future use. Use this .edt file as a template to create the experiment document as described in Section 6.B.
Note: The template is saved as an .edt file.
6.B. Starting a Run
1. To create the experiment document, open the template file created in Section 6.A by selecting Open from the File menu at the top of the screen. Navigate to the .edt file, and select Open.
Note: If the template file was just created, the .edt file will still be open.
2. Save the .edt template as a .eds file by selecting Save As… from the File menu at the top of the screen. Choose a location to save the file.
3. Highlight the unused wells, and deselect all of the targets.
4. To add sample names, select Plate Setup from the Setup menu in the left panel, and select the ‘Define Targets and Samples’ tab (Figure 15). Select Add New Sample, and enter the sample name in the section provided. Repeat for all samples.
5. When all sample names are entered, navigate to the ‘Assign Targets and Samples’ tab (Figure 16). Highlight the well or wells that contain replicates of the same sample, and check the Assign box adjacent to the corresponding sample name in the “Assign sample(s) to the selected wells” section of the ‘Assign Targets and Samples’ tab. Repeat until all samples are assigned.
Note: Alternatively, you can use a plate setup import file by selecting Import from the File menu at the top of the screen. Navigate to the .txt file, select the file and select Start Import. Select Yes and continue with the import when prompted. See Section 9.H for instructions on creating a plate setup import file with the PowerQuant® Analysis Software.
6. If a sample was assigned to the incorrect well, select the well and uncheck the sample under “Assign sample(s) to the selected wells”, and then assign the correct sample name.
7. Check that “PQ_CXR” is selected as the passive reference.
8. Save the .eds file.
9. Press the tray door.
10. Place the plate prepared in Section 5.B in the open tray door, and ensure that the plate sits correctly in the plate holder, with well A1 in the top left corner. Push the tray door to close, and immediately select Start Run. Run time is 1 hour.

Promega Corporation · 2800 Woods Hollow Road · Madison, WI 53711-5399 USA · Toll Free in USA 800-356-9526 · 608-274-4330 · Fax 608-277-2516www.promega.com TMD047 · Revised 8/22
31
6.C. Evaluating Standard Curves Using the Applied Biosystems® 7500 Software, Version 2.0.6
1. Select Analysis in the left side panel, and ensure that all wells to be analyzed are highlighted on the ‘View Plate Layout’ tab and that no targets are selected for unused wells.
2. Select Analyze.
3. To display standard curves, select Standard Curve from the Analysis menu in the left side panel. Display the standard curve for each target by selecting that target from the ‘Target’ drop-down menu (Figure 21). The standard curve parameters are located below the standard curve plot.
Note: For more information about how the slope and R2 values can be used to evaluate the standard curve, see Section 10.
1284
7TA
Figure 21. Displaying the standard curve for the autosomal target.

32 Promega Corporation · 2800 Woods Hollow Road · Madison, WI 53711-5399 USA · Toll Free in USA 800-356-9526 · 608-274-4330 · Fax 608-277-2516TMD047 · Revised 8/22 www.promega.com
6.D. Exporting Analyzed Data from the Applied Biosystems® 7500 Software, Version 2.0.6
1. Ensure that all wells with data for export are highlighted in the plate map. Select Export from the toolbar.
2. On the ‘Export Properties’ tab of the ‘Export Data’ window (Figure 22), select the following Export Properties:• Select Results in the “Select data to export” section.• Select One File from the “Select one file or separate files” drop-down menu.• Select .xls as the File Type.• Specify the appropriate export file name.• Use the Browse button to select the file location.Select Start Export.
1284
8TA
Figure 22. The ‘Export Data’ window.
3. In the ‘Export Completed’ window that appears, select Close Export Tool.

Promega Corporation · 2800 Woods Hollow Road · Madison, WI 53711-5399 USA · Toll Free in USA 800-356-9526 · 608-274-4330 · Fax 608-277-2516www.promega.com TMD047 · Revised 8/22
33
7. Run Setup and Thermal Cycling Using the Applied Biosystems® 7500 Real-Time PCR System for Human Identification and HID Real-Time PCR Analysis Software, Version 1.1 or 1.2
The following instructions are for the Applied Biosystems® 7500 Real-Time PCR System for Human Identification with HID Real-Time PCR Analysis Software, Version 1.1 or 1.2.
A template file (.edt file) can be used to store the dye information, target names and tasks; well locations and concentrations for the DNA standards; run method and analysis settings. A plate setup import file may be used to add sample names, well position and standard information to a run template. See Section 9.H for instructions on creating a plate setup import file with the PowerQuant® Analysis Software.
Amplification is complete in 1 hour.
7.A. Creating a Run Template
1. Turn on the computer associated with the Applied Biosystems® 7500 Real-Time PCR System for Human Identification.
2. Turn on the Applied Biosystems® 7500 Real-Time PCR System for Human Identification.
3. Open the HID Real-Time PCR Analysis Software, Version 1.1 or 1.2.
4. Before using the PowerQuant® System, check that the instrument was calibrated with the PowerQuant® Calibration Kit (Section 4).
5. On the ‘Home’ screen, select the Custom Assays button, or from the Assays menu select Custom Assays.
6. Select New Experiment from the toolbar. Select “Advanced Setup” from the drop-down menu.
7. In the Experiment Properties form, specify the following parameters (Figure 23):• Enter a name for the template in the Experiment Name field.• Select the instrument you are using to run the experiment by selecting 7500 (96 Wells).• Select the type of experiment you want to set up by selecting Quantitation-Standard Curve.• Select the reagents you want to use to detect the target sequence by selecting TaqMan® Reagents.• Select the ramp speed you want to use in the instrument run by selecting Standard (~2 hours to complete run).

34 Promega Corporation · 2800 Woods Hollow Road · Madison, WI 53711-5399 USA · Toll Free in USA 800-356-9526 · 608-274-4330 · Fax 608-277-2516TMD047 · Revised 8/22 www.promega.com
7.A. Creating a Run Template (continued)
Figure 23. The Experiment Properties screen.
8. Select Plate Setup from the Setup menu in the left panel. Select the ‘Define Targets and Samples’ tab. Select Add New Target (Figure 24) three additional times, and enter the following information to specify the targets:
Target Name Reporter Quencher
Autosomal PQ_FAM NFQ-MGB
Y PQ_CFG540 NFQ-MGB
Degradation PQ_Q670 NFQ-MGB
IPC PQ_TMR NFQ-MGB
Note: Target name identifiers are necessary for the PowerQuant® Analysis Software to recognize these targets.
1284
9TA

Promega Corporation · 2800 Woods Hollow Road · Madison, WI 53711-5399 USA · Toll Free in USA 800-356-9526 · 608-274-4330 · Fax 608-277-2516www.promega.com TMD047 · Revised 8/22
35
1285
0TA
Figure 24. The Plate Setup screen.

36 Promega Corporation · 2800 Woods Hollow Road · Madison, WI 53711-5399 USA · Toll Free in USA 800-356-9526 · 608-274-4330 · Fax 608-277-2516TMD047 · Revised 8/22 www.promega.com
7.A. Creating a Run Template (continued)
9. Select the ‘Assign Targets and Samples’ tab (Figure 25), and highlight the wells in use on the ‘View Plate Layout’ tab by dragging the pointer over the plate wells. Assign all four targets to the selected wells by selecting the boxes under “Assign”.
1285
1TA
Figure 25. Assigning targets to wells.

Promega Corporation · 2800 Woods Hollow Road · Madison, WI 53711-5399 USA · Toll Free in USA 800-356-9526 · 608-274-4330 · Fax 608-277-2516www.promega.com TMD047 · Revised 8/22
37
10. Highlight the wells containing the DNA standards on the ‘View Plate Layout’ tab, and select S as the Task for the autosomal, Y and degradation targets (Figure 26).
Note: The Task for the IPC should be “U”.
1285
2TA
Figure 26. Assigning DNA concentrations to wells with DNA standards.
11. Enter the DNA concentration for each DNA standard in the Quantity field without the unit of measure (i.e., enter 50 for 50ng/µl).
Notes: 1. Multiple wells with DNA standards at the same DNA concentration can be highlighted at the same time so that
values need to be entered only once. 2. The Define and Setup Standards tool will not work for assigning a standard curve to multiple targets in the same
sample.

38 Promega Corporation · 2800 Woods Hollow Road · Madison, WI 53711-5399 USA · Toll Free in USA 800-356-9526 · 608-274-4330 · Fax 608-277-2516TMD047 · Revised 8/22 www.promega.com
7.A. Creating a Run Template (continued)
12. Select ROX from the “Select the Dye to use as the passive reference” drop-down menu (Figure 27).
1285
3TA
Figure 27. The ‘Assign Targets and Samples’ screen. Select ROX as the passive reference.

Promega Corporation · 2800 Woods Hollow Road · Madison, WI 53711-5399 USA · Toll Free in USA 800-356-9526 · 608-274-4330 · Fax 608-277-2516www.promega.com TMD047 · Revised 8/22
39
13. From the Analysis menu at the top of the screen, select Analysis Settings.
14. On the ‘CT Settings’ tab (Figure 28) in the Select a Target panel, select the Autosomal target.
15. In the CT Settings for Autosomal section, uncheck the “Use Default Settings” box, and uncheck the “Automatic Threshold” box. Enter “0.2” for the threshold. Leave the “Automatic Baseline” box checked.
16. Repeat this process for each of the targets listed in the Select a Target panel using the following threshold values:• Autosomal: 0.2• Degradation: 0.2• IPC: 0.03• Y: 0.2
Select Apply Analysis Settings.
1285
4TA
Figure 28. The ‘Analysis Settings’ window.

40 Promega Corporation · 2800 Woods Hollow Road · Madison, WI 53711-5399 USA · Toll Free in USA 800-356-9526 · 608-274-4330 · Fax 608-277-2516TMD047 · Revised 8/22 www.promega.com
7.A. Creating a Run Template (continued)
17. Select Run Method under Setup from the left panel. Modify the default run method as directed below:• Enter “20” for “Reaction Volume per Well”.• Select the first Holding Stage, and click with the right button on the computer’s mouse to bring up a menu.
Select Delete Selected to delete this stage.• Change the second Holding Stage to 2 minutes at 98°C.• Enter “39” for “Number of Cycles” under Cycling Stage.• Change Step 1 to 98°C for 15 seconds and Step 2 to 62°C for 35 seconds.• Ensure that the Data Collection On icon is active for Step 2 of the Cycling Stage. Note: The Data Collection On icon is shown in the legend at the bottom of the screen.
The completed PowerQuant® System run method is shown in Figure 29.
1285
5TA
Figure 29. The completed PowerQuant® System run method.
18. From the File menu at the top of the screen, select Save as Template, and choose a location to save the file. The instrument setup and thermal cycling program can be saved as a template for future use. Use this .edt file as a template to create the experiment document as described in Section 7.B.
Note: The template will be saved as an .edt file.

Promega Corporation · 2800 Woods Hollow Road · Madison, WI 53711-5399 USA · Toll Free in USA 800-356-9526 · 608-274-4330 · Fax 608-277-2516www.promega.com TMD047 · Revised 8/22
41
7.B. Starting a Run
1. On the Home screen select the Custom Assays button, or from the Assays menu at the top of the screen select Custom Assays.
2. Tocreatetheexperimentdocument,openthetemplatefilecreatedinSection 7.AbyselectingOpen from the File menuatthetopofthescreen.Navigatetothe.edtfile,andselectOpen.
Note:Ifthetemplatefilewasjustcreated,the.edtfilewillstillbeopen.
3. Savethe.edttemplateasan.edsfilebyselectingSave As… from the File menu at the top of the screen. Choose a locationtosavethefile.
4. Highlighttheunusedwells,anddeselectallofthetargets.
5. To add sample names, select Plate SetupfromtheSetupmenuintheleftpanel,andselectthe‘DefineTargetsandSamples’tab(Figure 24).SelectAdd New Sample, and enter the sample name in the section provided. Repeat for all samples.
6. Whenallsamplenamesareentered,navigatetothe‘AssignTargetsandSamples’tab(Figure 25).Highlightthewellorwellsthatcontainreplicatesofthesamesample,andchecktheAssignboxadjacenttothecorrespondingsamplenameinthe“Assignsample(s)totheselectedwells”sectionofthe‘AssignTargetsandSamples’tab.Repeatuntilallsamplesareassigned.
Note:Alternatively,youcanuseaplatesetupimportfilebyselectingImport from the File menu at the top of the screen.Navigatetothe.txtfile,selectthefileandselectStart Import.SelectYesandcontinuewiththeimportwhenprompted.SeeSection9.HforinstructionsoncreatingaplatesetupimportfilewiththePowerQuant® Analysis Software.
7. Ifasamplewasassignedtotheincorrectwell,selectthewellanduncheckthesampleunder“AssignSamples”,andthenassignthecorrectsamplename.
8. Checkthat“ROX”isselectedasthepassivereference.
9. Savethe.edsfile.
10. Pressthetraydoor.
11. PlacetheplatepreparedinSection 5.Bintotheopentraydoor,andensurethattheplatesitscorrectlyintheplateholder,withwell A1inthetopleftcorner.Pushthetraydoortoclose,andimmediatelyselectStart Run. Run time is 1 hour.

42 Promega Corporation · 2800 Woods Hollow Road · Madison, WI 53711-5399 USA · Toll Free in USA 800-356-9526 · 608-274-4330 · Fax 608-277-2516TMD047 · Revised 8/22 www.promega.com
7.C. Evaluating Standard Curves Using the HID Real-Time PCR Analysis Software, Version 1.1 or 1.2
1. Select Analysis in the left side panel, and ensure that all wells to be analyzed are highlighted on the ‘View Plate Layout’ tab and that no targets are selected for unused wells.
2. Select Analyze.
3. To display standard curves, select Standard Curve from the Analysis menu in the left side panel. Display the standard curves for all targets by selecting “All” from the ‘Target’ drop-down menu (Figure 30). The standard curve parameters are located below the standard curve plot.
Note: For more information about how the slope and R2 values can be used to evaluate the standard curve, see Section 10.
1286
3TA
Figure 30. Displaying standard curves for all targets.

Promega Corporation · 2800 Woods Hollow Road · Madison, WI 53711-5399 USA · Toll Free in USA 800-356-9526 · 608-274-4330 · Fax 608-277-2516www.promega.com TMD047 · Revised 8/22
43
7.D. Exporting Analyzed Data from the HID Real-Time PCR Analysis Software, Version 1.1 or 1.2
1. Ensure that all wells with data for export are highlighted in the plate map. Select Export from the toolbar.
2. On the ‘Export Properties’ tab of the ‘Export Data’ window (Figure 31), select the following Export Properties:• Select Results in the “Select data to export” section.• Select One File from the “Select one file or separate files” drop-down menu.• Select .xls as the File Type.• Specify the appropriate export file name.• Use the Browse button to select the file location.Select Start Export.
1285
6TA
Figure 31. The ‘Export Data’ window.
3. In the ‘Export Completed’ window that appears, select Close Export Tool.

44 Promega Corporation · 2800 Woods Hollow Road · Madison, WI 53711-5399 USA · Toll Free in USA 800-356-9526 · 608-274-4330 · Fax 608-277-2516TMD047 · Revised 8/22 www.promega.com
8. Run Setup and Thermal Cycling Using the QuantStudio™ 5 Real-Time PCR System
The following instructions are for the QuantStudio™ 5 Real-Time PCR System.
A Test Document Template file (.edt file) can be used to store the dye information, target names and tasks, well locations and concentrations for the DNA standards, run method and analysis settings. A plate setup import file may be used to add sample names, well position and standard information to a run template. See Section 9.H for instructions on creating a plate setup import file with the PowerQuant® Analysis Software.
Amplification is complete in 1 hour.
8.A. Setting up the QuantStudio™ Design and Analysis Desktop Software
The following instructions are for use with the PowerQuant® System and the QuantStudio™ Design and Analysis Desktop Software, Version 1.5 and 1.5.1.
Adding the PowerQuant® Dyes
1. Select Tools from the toolbar. Select Dye Library from the drop-down menu (Figure 32).
Figure 32. The QuantStudio™ Design and Analysis Software Tools menu.
2. Add the five PowerQuant® custom dye names by selecting the New button (Figure 33).
3. Enter and save the following dye names: “PQ_FAM”, “PQ_CFG540”, “PQ_TMR”, “PQ_Q670” and “PQ_CXR”.
1527
1MA

Promega Corporation · 2800 Woods Hollow Road · Madison, WI 53711-5399 USA · Toll Free in USA 800-356-9526 · 608-274-4330 · Fax 608-277-2516www.promega.com TMD047 · Revised 8/22
45
4. Confirmthat“Reporter”isselectedastheTypeforeachdye(Figure33). Note: ThedyenamesmustmatchthoseenteredintheCustomDyesectionwhenthedyecalibrationswere
performedinSection4.D.
Figure 33. Adding a new custom dye to the Dye Library.
8.B. Creating a Run Template
1. OpentheQuantStudio™DesignandAnalysisSoftwareandselecttheCreate New Experimenticononthehomescreen(Figure34).
Figure 34. The Create New Experiment icon on the ‘Home’ screen.
1527
2MA
1527
3MA

46 Promega Corporation · 2800 Woods Hollow Road · Madison, WI 53711-5399 USA · Toll Free in USA 800-356-9526 · 608-274-4330 · Fax 608-277-2516TMD047 · Revised 8/22 www.promega.com
8.B. Creating a Run Template (continued)
2. Specify the following parameters in the Experiment Properties form (Figure 35):
• Enter a name for the template in the Name field.
• Select the instrument you are using to run the experiment by selecting QuantStudioTM 5 System.
• Select the block type by selecting 96-Well 0.2-mL Block.
• Select the type of experiment you want to set up by selecting Standard Curve.
• Select the chemistry you want to use to detect the target sequence by selecting TaqMan® Reagents.
• Select the run mode you want to use by selecting Standard.
Figure 35. The ‘Experiment Properties’ screen.
1527
4MA

Promega Corporation · 2800 Woods Hollow Road · Madison, WI 53711-5399 USA · Toll Free in USA 800-356-9526 · 608-274-4330 · Fax 608-277-2516www.promega.com TMD047 · Revised 8/22
47
3. Select Next.
4. Select the ‘Experiment Method’ tab and modify the default run method as directed below:
• Enter “20” in the “Volume” box.
• Select the first Holding stage and select the [-] icon to delete it.
• Change the remaining Hold Stage to 98°C for 2 minutes.
• Change Step 1 of the PCR Stage to 98°C for 15 seconds.
• Change Step 2 of the PCR Stage to 62°C for 35 seconds.
• Ensure that the Data Collection On icon is active for Step 2 of the PCR Stage. Note: The icon legends are shown at the bottom of the screen.
• Enter “39” for the number of cycles in the box below the PCR Stage.
• Change the ramp rates for all three steps to “2.44°C/s”.
Select Next.
The completed PowerQuant® System run method is shown in Figure 36.
Figure 36. The completed PowerQuant® System run method.
1527
6MA

48 Promega Corporation · 2800 Woods Hollow Road · Madison, WI 53711-5399 USA · Toll Free in USA 800-356-9526 · 608-274-4330 · Fax 608-277-2516TMD047 · Revised 8/22 www.promega.com
8.B. Creating a Run Template (continued)
5. Enter the PowerQuant® targets in the Targets section of the ‘Advanced Setup’ tab in the Assign Targets and Samples section (Figure 37). Select [+] Add three additional times and enter the following target-specific information:
Target Name Reporter Quencher
Autosomal PQ_FAM NFQ-MGB
Y PQ_CFG540 NFQ-MGB
Degradation PQ_Q670 NFQ-MGB
IPC PQ_TMR NFQ-MGB
Note: Target name identifiers are necessary for the PowerQuant® Analysis Software to recognize these targets.
Figure 37. The ‘Assign Targets and Samples’ tab. 15
277M
A

Promega Corporation · 2800 Woods Hollow Road · Madison, WI 53711-5399 USA · Toll Free in USA 800-356-9526 · 608-274-4330 · Fax 608-277-2516www.promega.com TMD047 · Revised 8/22
49
6. Highlight all wells in the plate map by dragging the pointer over the plate wells. Assign all four targets to all wells by selecting the box next to each target name (Figure 38).
Figure 38. Assigning targets to wells.
1527
8MA

50 Promega Corporation · 2800 Woods Hollow Road · Madison, WI 53711-5399 USA · Toll Free in USA 800-356-9526 · 608-274-4330 · Fax 608-277-2516TMD047 · Revised 8/22 www.promega.com
8.B. Creating a Run Template (continued)
7. Highlight the wells containing DNA standards and select S as the Task for the autosomal, Y and degradation targets (Figure 39).
Note: The Task for the IPC target should be “U”.
Figure 39. Designating the Task for each target in wells containing DNA standards.
1527
9MA

Promega Corporation · 2800 Woods Hollow Road · Madison, WI 53711-5399 USA · Toll Free in USA 800-356-9526 · 608-274-4330 · Fax 608-277-2516www.promega.com TMD047 · Revised 8/22
51
8. EntertheconcentrationofeachDNAstandardintheQuantityfieldwithoutaunitofmeasure(Figure40). Example:Enter“50”for50ng/µl,“2”for2ng/µl,“0.08”for0.08ng/µland“0.0032”for0.0032ng/µl.Highlightwells
withDNAstandardsofthesameconcentrationsimultaneously,thenenterthevalue.RepeatforeachDNAstandardconcentration.
Figure 40. Assigning DNA concentrations to wells with DNA standards.
1528
0MA

52 Promega Corporation · 2800 Woods Hollow Road · Madison, WI 53711-5399 USA · Toll Free in USA 800-356-9526 · 608-274-4330 · Fax 608-277-2516TMD047 · Revised 8/22 www.promega.com
8.B. Creating a Run Template (continued)
9. In the Samples section of the ‘Advanced Setup’ tab, select [+] Add three times and enter a sample name for each concentration of the DNA standards (one name for each concentration; Figure 41).
Figure 41. Entering sample names for the DNA standards.15
281M
A

Promega Corporation · 2800 Woods Hollow Road · Madison, WI 53711-5399 USA · Toll Free in USA 800-356-9526 · 608-274-4330 · Fax 608-277-2516www.promega.com TMD047 · Revised 8/22
53
10. Highlight all wells with DNA standards of the same name. Assign the DNA standard name to the selected wells by selecting the box adjacent to the corresponding DNA standard name. Repeat for each DNA standard concentration (Figure 42).
Figure 42. Assigning sample names for the DNA standards.
1528
2MA

54 Promega Corporation · 2800 Woods Hollow Road · Madison, WI 53711-5399 USA · Toll Free in USA 800-356-9526 · 608-274-4330 · Fax 608-277-2516TMD047 · Revised 8/22 www.promega.com
8.B. Creating a Run Template (continued)
11. Select the ‘Quick Setup’ tab. In the Plate Attributes section, select PQ_CXR as the Passive Reference (Figure 43).
Figure 43. The ‘Quick Setup’ tab. Select PQ_CXR as the passive reference.
1528
3MA

Promega Corporation · 2800 Woods Hollow Road · Madison, WI 53711-5399 USA · Toll Free in USA 800-356-9526 · 608-274-4330 · Fax 608-277-2516www.promega.com TMD047 · Revised 8/22
55
12. Select Analysis Settings from the ‘Analysis’ drop-down menu.
13. On the ‘CT Settings’ tab (Figure 44), select the Autosomal Target.
14. In the CT Settings for Autosomal section, uncheck the “Default Settings” box and uncheck the “Automatic Threshold” box. Enter “0.2” for the threshold. The “Automatic Baseline” box should be selected.
15. Repeat this process for each of the targets using the following threshold values:
• Autosomal: 0.2• Degradation: 0.2• IPC: 0.03• Y: 0.2
Select Apply.
Figure 44. The ‘CT Settings’ tab.
1528
5MA

56 Promega Corporation · 2800 Woods Hollow Road · Madison, WI 53711-5399 USA · Toll Free in USA 800-356-9526 · 608-274-4330 · Fax 608-277-2516TMD047 · Revised 8/22 www.promega.com
8.B. Creating a Run Template (continued)
16. Select the ‘Export’ tab. Review the following parameters and adjust as needed (Figure 45).
• Set the File Type to “QuantStudio” and “.xls”.
• The “Open exported files when complete” box should be selected.
• The “Results” box should be selected in the Content section. Deselect the “Sample Setup” and “Amplification Data” boxes.
• “Unify the above content into one file” should be selected under the Options section.
• Select the Customize button and confirm that the following options shown in the Select Content list of the ‘Customize’ screen (Figure 46) are deselected: Well, Omit, Y-Intercept, R2, Slope, Efficiency, Amp Status, Cq Conf, Rn (last cycle) and Delta Rn (last cycle).
• The boxes for “Skip Empty Wells” and “Skip Omitted Wells” at the top of the ‘Customize’ screen should remain selected if your software version displays them.
Figure 45. The ‘Export’ tab. 15
286M
A
⁕⁕

Promega Corporation · 2800 Woods Hollow Road · Madison, WI 53711-5399 USA · Toll Free in USA 800-356-9526 · 608-274-4330 · Fax 608-277-2516www.promega.com TMD047 · Revised 8/22
57
F
1528
7MA
igure 46. The ‘Customize’ screen and Select Content list.17. From the File menu at the top of the screen, select Save As. Choose a location to save the template file as an .edt
file (Figure 47). The template file can now be used to create future PowerQuant® experiment documents for the QuantStudio™ 5 Real-Time PCR System.

58 Promega Corporation · 2800 Woods Hollow Road · Madison, WI 53711-5399 USA · Toll Free in USA 800-356-9526 · 608-274-4330 · Fax 608-277-2516TMD047 · Revised 8/22 www.promega.com
8.B. Creating a Run Template (continued)
Figure 47. Saving a Test Document Template (.edt) file.
8.C. Starting a Run
1. Open the QuantStudio™ Design and Analysis Software and select the Open Existing Experiment icon from the home screen (Figure 48).
Figure 48. The QuantStudio™ Design and Analysis Software, Open Existing Experiment icon.
1528
9MA
1528
8MA

Promega Corporation · 2800 Woods Hollow Road · Madison, WI 53711-5399 USA · Toll Free in USA 800-356-9526 · 608-274-4330 · Fax 608-277-2516www.promega.com TMD047 · Revised 8/22
59
2. Open the template file (.edt) created in Section 8.B and navigate to the ‘Plate’ tab.
3. Enter the names of the DNA samples in the Samples section of the ‘Advanced Setup’ tab (Figure 49) by selecting [+] Add until the appropriate number of sample name lines are present. Type the name of each sample only once.
Figure 49. The ‘Advanced Setup’ tab in the ‘Assign Targets and Samples’ screen.
1529
1MA

60 Promega Corporation · 2800 Woods Hollow Road · Madison, WI 53711-5399 USA · Toll Free in USA 800-356-9526 · 608-274-4330 · Fax 608-277-2516TMD047 · Revised 8/22 www.promega.com
8.C. Starting a Run (continued)
4. Highlight the well or well(s) on the plate map that contain replicates of the same sample and select the box adjacent to the corresponding sample name from the Samples list. Repeat until all sample names have been assigned to a well on the plate map.
Notes: 1. If a sample name is inadvertently assigned to the wrong well, reselect that well and deselect the box next to the
wrong sample name. Locate and assign the correct sample name. 2. Alternatively,youcanuseaplatesetupimportfilebyselectingFile>Import Plate Setup (Figure 50). Browse
tothelocationwhereyourplate.txtfileisstored.SelectthefileandselecttheApply button. Select Yes and continue with the import when prompted. The software will display an “Import Successful” box. Select OK to moveforwardwithstartingtherun.SeeSection9.Hforinstructionsoncreatingaplatesetupimportfilewiththe PowerQuant® Analysis Software.
3. If the QuantStudio™ Real-Time PCR System is being operated as a standalone instrument without a laptop or desktop,thenthesamplenamesmustbesavedandimportedaspartofthepreviouslycreated.edttemplatefile.
F
1529
2MA
igure 50. The Import Plate Setup option in the File menu.

Promega Corporation · 2800 Woods Hollow Road · Madison, WI 53711-5399 USA · Toll Free in USA 800-356-9526 · 608-274-4330 · Fax 608-277-2516www.promega.com TMD047 · Revised 8/22
61
5. Highlight all unused wells on the plate map and deselect all targets by unchecking the boxes next to the target names.
6. Open the instrument tray door by selecting the Eject icon on the home screen.
7. Place the plate prepared in Section 5.B in the open tray door, and ensure that the plate sits correctly in the plate holder, with well A1 in the top left corner. Select the Eject icon again to close.
8. Navigate to the ‘Run’ tab. Select Start Run (Figure 51). The software will prompt you to save your experiment as an .eds file. Run time is approximately 1 hour.
9. Following completion of the run, the instrument screen will ask you to select a destination for your completed .eds file. Select Transfer File to navigate to your chosen file location (USB, network, instrument folder), then select OK.
Note: All completed .eds files can be found in the Run History folder under instrument Settings at any time.
Figure 51. The ‘Run’ tab.
1529
4MA

62 Promega Corporation · 2800 Woods Hollow Road · Madison, WI 53711-5399 USA · Toll Free in USA 800-356-9526 · 608-274-4330 · Fax 608-277-2516TMD047 · Revised 8/22 www.promega.com
8.D. Evaluating Standard Curves Using the QuantStudio™ Design and Analysis Software
1. Select the ‘Results’ tab. Ensure that all wells to be analyzed are highlighted in the ‘View’ tab and that no targets are selected for unused wells. Select Analyze.
Figure 52. The Amplification Plot and plate map on the ‘Results’ tab.
1529
5MA

Promega Corporation · 2800 Woods Hollow Road · Madison, WI 53711-5399 USA · Toll Free in USA 800-356-9526 · 608-274-4330 · Fax 608-277-2516www.promega.com TMD047 · Revised 8/22
63
2. To display all standard curves, select Standard Curve from the drop-down menu located above the Amplification Plot section (Figure 53).
Figure 53. Displaying the standard curves for all targets. 15
296M
A

64 Promega Corporation · 2800 Woods Hollow Road · Madison, WI 53711-5399 USA · Toll Free in USA 800-356-9526 · 608-274-4330 · Fax 608-277-2516TMD047 · Revised 8/22 www.promega.com
8.D. Evaluating Standard Curves Using the QuantStudio™ Design and Analysis Software (continued)
3. Display the standard curve for each individual target by selecting the Eye icon (Figure 54). The standard curve for each target may be viewed by choosing the appropriate target from the ‘All Target’ drop-down menu (Figure 54). The standard curve parameters are located below the standard curve plot.
Note: For more information on how the slope and R² values can be used to evaluate the standard curve, see Section 10.
Figure 54. Displaying the standard curve for the autosomal target.
4. Save any changes made to the .eds file.
1529
7MA

Promega Corporation · 2800 Woods Hollow Road · Madison, WI 53711-5399 USA · Toll Free in USA 800-356-9526 · 608-274-4330 · Fax 608-277-2516www.promega.com TMD047 · Revised 8/22
65
8.E. Exporting Analyzed Data from QuantStudio™ Design and Analysis Software
1. Confirm that all wells containing data for export are highlighted in the plate map and select the ‘Export’ tab.
2. Specify an appropriate export file name. Select Browse and choose a file location. Select Export (Figure 55).
Figure 55. Exporting Results from the QuantStudio™ Design and Analysis Software.
1529
8MA

66 Promega Corporation · 2800 Woods Hollow Road · Madison, WI 53711-5399 USA · Toll Free in USA 800-356-9526 · 608-274-4330 · Fax 608-277-2516TMD047 · Revised 8/22 www.promega.com
9. PowerQuant® Analysis Software
9.A. Overview
The two main functions of the PowerQuant® Analysis Software are creating sample sheets for import into the Applied Biosystems® 7500, 7500 HID or QuantStudio™ 5 Real-Time PCR System, and analyzing data exported from these instruments. The PowerQuant® Analysis Software performs calculations and evaluations on data exported from the 7500 and QuantStudio instruments for the following parameters:
• Standard curve generation and quality (acceptable R2, slope and Y-intercept values)
• Sample quality (possible inhibition, mixture or degradation)
• DNA normalization for autosomal or Y-STR amplification based on DNA target mass, pipetting volumes and diluent volumes
• Analysis with a virtual standard curve
The PowerQuant® Analysis Software Plate Designer can be used to input sample names in the qPCR instrument software through the creation of a .txt import file and to calculate the volumes of PowerQuant® reaction components.
Once the Results Excel® file is exported from the instrument software and imported into the PowerQuant® Analysis Software, the PowerQuant® Analysis Software calculates standard curves for each of the three targets (autosomal, Y and degradation). The sample quantity is calculated for all unknown samples using the standard curves, as well as ratios between the autosomal and Y targets ([Auto]/[Y]), and the autosomal and degradation targets ([Auto]/[Deg]). The software calculates the difference in Cq values for the IPC in an unknown sample and the IPC in the closest DNA standard of the standard curve (to monitor PCR inhibition). In addition, this software performs calculations for normalizing the input amounts of DNA based on the autosomal or Y target quantification values.
The PowerQuant® Analysis Software is compatible with data exported from the Applied Biosystems® 7500, 7500 HID or QuantStudio™ 5 Real-Time PCR System. For questions regarding instrument compatibility, contact Promega Technical Services for more information. E-mail: [email protected]:
1. Cq value (quantification cycle) is used rather than CT (cycle threshold) per MIQE guidelines (3).2. Worksheets generated by this software have been locked to prevent editing of the formulas, linked cells and named
ranges in the worksheets. 3. For assessment of possible male/female DNA mixtures, DNA degradation and PCR inhibition, individual laboratories
should determine and validate acceptable threshold values relevant to the success of downstream applications. The diversity of sample types, purifications and potential PCR inhibitors does not allow for specific threshold value recommendations. Default threshold settings in the PowerQuant® Analysis Software are values intended to be customized by the user.

Promega Corporation · 2800 Woods Hollow Road · Madison, WI 53711-5399 USA · Toll Free in USA 800-356-9526 · 608-274-4330 · Fax 608-277-2516www.promega.com TMD047 · Revised 8/22
67
9.B. Downloading the PowerQuant® Analysis Software
The PowerQuant® Analysis Software can be downloaded from the Promega web site www.promega.com/resources/software-firmware/. There is no cost for this download, but registration is required. The PowerQuant® Analysis Software part number is 7002673. A single file downloads: the PowerQuant Assays Installer.exe application.
System Requirements• Operating system: Microsoft Windows 7, 8.1 Pro, 10 (x86 and x64)• Installed memory: 2GB RAM• External resource: Microsoft .NET Framework 4.8 (available at no charge from www.microsoft.com)• Processor requirement: dual-core processor
9.C. Installing the PowerQuant® Analysis Software
The software installs in the Promega\PowerQuant folder automatically. You cannot change the install location. The installation must be performed with administrator permissions on the computer.
1. Double-click the PowerQuant Assays Installer.exe application.
2. The software installer displays the ‘License Agreement’ window. Read the agreement and select the radio button labeled “I accept the agreement”, and select Next to continue with the installation.
3. The software installer displays the ‘Information’ (Folder Permissions) window. Select Next to continue.
4. The software installer displays the ‘Database Installation’ window. Select Yes, Replace (Overwrite) The Existing Database or No, Keep The Existing Database. Select Next to continue.
Note: For the first installation of the PowerQuant® Analysis Software, either database option can be used.
5. The software installer displays the ‘Ready to Install’ window. Select Install to continue.
6. The ‘Unconfirmed Set Permissions Success’ window is displayed. Select OK.
7. After installation, the software displays the ‘Completing the PowerQuant Assays Setup Wizard’ window. Select Finish.
Notes:
The PowerQuant® Analysis Software is configurable for several user-access models. The software installer creates a directory in the Program Files folder or the Program Files (x86) folder containing all required files to run the program. This directory allows all users of the computer to access the same program and data. However, by copying the contents of the application folder to other locations, different methods of access can be achieved.
Single-User (Private) Deployment
If several individuals use the same computer and each user requires an individual database, copy the contents of the Promega\PowerQuant folder to another folder and create a shortcut to this folder on the desktop. If the folder is copied to an individual user’s C:\Users\UserName folder, then only that user can access these data. This deployment requires each user to log into the computer and perform this step.
Multi-User/Multi-Computer Deployment
If several users need to access a common database, copy the contents of the Promega\PowerQuant Analysis Software folder to a shared drive on the network. The software automatically defaults to the shared network location.

68 Promega Corporation · 2800 Woods Hollow Road · Madison, WI 53711-5399 USA · Toll Free in USA 800-356-9526 · 608-274-4330 · Fax 608-277-2516TMD047 · Revised 8/22 www.promega.com
9.D. Removing the PowerQuant® Analysis Software
1. InthePromega\PowerQuantAnalysisSoftwarefolder,double-clicktheunins000.exefile.
2. The “PowerQuant Assays Uninstall” dialog box is displayed. Select Yes to remove the software.
3. The software is uninstalled. The ‘PowerQuant Assays Uninstall’ window displays the message “PowerQuant Assays was successfully uninstalled from your computer”. Select the OK button.
If you subsequently need to reinstall the software, follow the installation instructions in Section 9.C.
9.E. The Main Menu
Installation of the PowerQuant® Analysis Software automatically places a shortcut to the software on the desktop. Select the PowerQuant Assays icon on the desktop to launch the software. Launching the PowerQuant® Analysis Software grants Standard user access. To access the Admin functions, users must log in as an administrator with a password. (See Section 9.F for information about User Accounts).
Themainmenuislocatedatthetopofthesoftwarewindow,comprisingfivetabs:
• The ‘Import’ Tab
• The‘ConfigurationTools’Tab
• The ‘Edit’ Tab
• The ‘Print’ Tab
• The ‘Help’ Tab
‘Import’ Tab
On the Importtab,selectionsaremadeforthedatafilesource,sampleassessmentsettings,standardcurveassessmentsettings, normalization settings and plate map (Figure 56). Once selections are complete, the user selects a PowerQuant® Results Excel®fileforanalysis.AnalyzeddataaredisplayedandcanbesavedasanExcel®or.pdffile.SeeSection9.Iforadditional information about the ‘Import’ tab.
F
1549
0CA
igure 56. The ‘Import’ tab.

Promega Corporation · 2800 Woods Hollow Road · Madison, WI 53711-5399 USA · Toll Free in USA 800-356-9526 · 608-274-4330 · Fax 608-277-2516www.promega.com TMD047 · Revised 8/22
69
‘Configuration Tools’ Tab
The ‘Configuration Tools’ tab provides access to the ‘PowerQuant Administrative Tools’ window and the ‘Promega PowerQuant Plate Designer’ window (Figure 57).
The Configuration Settings icon opens the ‘PowerQuant Administrative Tools’ window. The PowerQuant Administrative Tools allow the user to:
• Set default parameters used in the report
• Set values for the PowerQuant® dye names
• Set values for standard curve and sample assessment
• Set values used for normalization
• Manage user accounts
The software includes default settings for most parameters based on the results of testing during product development. These values are intended to be customized by the user based on the results of your laboratory’s internal validation. Additional information about these settings is provided in Section 9.G.
The Design Plate Map icon opens the ‘Promega PowerQuant Plate Designer’ window. The Promega PowerQuant Plate Designer is used to create and edit plate maps. Additional information about plate maps is provided in Section 9.H.
Figure 57. The ‘Configuration Tools’ tab.
‘Edit’ Tab
The ‘Edit’ tab contains the basic functions for editing cells (Figure 58).
Figure 58. The ‘Edit’ tab.
1549
1TA
1549
2TA

70 Promega Corporation · 2800 Woods Hollow Road · Madison, WI 53711-5399 USA · Toll Free in USA 800-356-9526 · 608-274-4330 · Fax 608-277-2516TMD047 · Revised 8/22 www.promega.com
9.E. The Main Menu (continued)
‘Print’ Tab
The ‘Print’ tab contains print functions, including print preview and printer selection options (Figure 59).
Figure 59. The ‘Print’ tab.
‘Help’ Tab
Videos providing information on software features and functions are located in the ‘Help’ tab (Figure 60).
The Import video describes how to import a PowerQuant® Results Excel® file into the PowerQuant® Analysis Software.
The Configuration Settings video demonstrates how to create or modify values for configuration settings, dye names, standard curve assessment, sample assessment and normalization.
The Design Plate Map video describes how to create a plate map.
Note: The videos found on the ‘Help’ tab include sound. Check sound and volume settings in Microsoft® Windows and the video player.
The Technical Manual icon opens a link to the PowerQuant® System Technical Manual #TMD047.
The Zoom icon opens a window with instructions on how to zoom in or out in the spreadsheet.
The Read Me icon opens a window containing information about the software.
Figure 60. The ‘Help’ tab.
1549
3TA
1549
4TA

Promega Corporation · 2800 Woods Hollow Road · Madison, WI 53711-5399 USA · Toll Free in USA 800-356-9526 · 608-274-4330 · Fax 608-277-2516www.promega.com TMD047 · Revised 8/22
71
9.F. User Accounts
A Standard user can:
• View configuration settings, dye names, standard curve, sample assessment and normalization settings created by an Admin user
• Create, edit and delete plate maps
• Use the ‘Import’ tab to analyze data
An Admin user can:
• Edit configuration settings
• Create, edit and delete calibrator assessment, standard curve, sample assessment and normalization settings
• Create, edit and delete dye set names
• Create, edit and delete plate maps
• Use the ‘Import’ tab to analyze data
• Perform user-managements tasks (create, edit and delete new users)
Initial Login and User Management
1. Select the ‘Configuration Tools’ tab from the main menu and select the Configuration Settings icon (Figure 57).
2. The ‘Administrator Login’ window opens (Figure 61).
Figure 61. The ‘Administrator Login’ window.
1549
5TA

72 Promega Corporation · 2800 Woods Hollow Road · Madison, WI 53711-5399 USA · Toll Free in USA 800-356-9526 · 608-274-4330 · Fax 608-277-2516TMD047 · Revised 8/22 www.promega.com
9.F. User Accounts (continued)
3. To log in as an Administrator for the first time, enter the following information:
User Name: PQAdmin
Default Password: Promega
Notes:
1. The User Name field is not case-sensitive. The Password field is case-sensitive.
2. The default User Name appearing in the ‘Administrator Login’ window is the Microsoft® Windows user name.
4. Select the OK button.
Adding a New Admin User
1. To create a new Admin user, select the ‘Login Manager’ tab in the ‘PowerQuant Administrative Tools’ window (Figure 62).
Figure 62. The ‘Login Manager’ tab.
2. Enter a new user name in the User Name field.
3. Type a new password in the Password field. Note: The new password does not have complexity requirements and characters are not restricted.
4. Retype the password in the Retype Password field. The password entries must be identical.
5. Select the Save/Update button.
6. Select the OK button in the “User Role Created” dialog box.
1549
6TA

Promega Corporation · 2800 Woods Hollow Road · Madison, WI 53711-5399 USA · Toll Free in USA 800-356-9526 · 608-274-4330 · Fax 608-277-2516www.promega.com TMD047 · Revised 8/22
73
Deleting an Admin User
1. To delete an Admin user, select the ‘Login Manager’ tab.
2. Select a user from the ‘User Name’ drop-down menu.
3. Select the Delete button to remove the user.
4. Select Yes to confirm deletion.
5. Select the OK button in the ‘User Role Deleted’ dialog box.
Notes:
1. Incorrectly entered passwords result in a Standard user login. The ‘Administrator Login’ window closes and a “ReadOnly Access Granted” dialog box opens (Figure 63). To attempt the login again, close the ‘Administrative Tools’ window. Select the Configuration Settings icon and follow the instructions for an Admin user login.
2. Information stored in the software database is independent of the computer’s Microsoft® Windows login. Therefore, any user can see all database entries. See Section 9.C for more information about multi-user installation.
Figure 63. Non Admin Login notification.
1549
7TA

74 Promega Corporation · 2800 Woods Hollow Road · Madison, WI 53711-5399 USA · Toll Free in USA 800-356-9526 · 608-274-4330 · Fax 608-277-2516TMD047 · Revised 8/22 www.promega.com
9.G. Getting Started
Before data analysis, settings for analysis and reporting must be defined. These settings include: default units for DNA concentration; well-naming convention; calibrator assessment (for use with virtual standard curves); selection of worksheets to omit from the final report; definitions for the PowerQuant® System dye names; standard curve assessment settings; sample assessment settings; and normalization settings for STR analysis. The Admin user defines these parameters in the ‘PowerQuant Administrative Tools’ window, accessed by opening the Configuration Settings in the ‘Configuration Tools’ tab (Figure 57).
Set Configuration Defaults
Selections made in the ‘Configuration’ tab of the ‘Promega PowerQuant Administrative Tools’ window are the settings used in the analysis and the final report (Figure 64). The ‘Configuration’ tab is used to set units for DNA concentration, well-naming convention (A1, A2, A3. . . or A01, A02, A03. . .), calibrator assessment values (for use with a virtual standard curve only, see Section 9.L) and selection of worksheets to omit from the final report.
1. Select the ‘Configuration Tools’ tab in the main menu and press the Configuration Settings icon (Figure 57). The ‘PowerQuant Administrative Tools’ window opens along with the ‘Administrator Login’ window.
2. Enter a valid Admin User Name and password (Figure 61). See Section 9.F for additional information about user accounts. (Default Admin User Name: PQAdmin; Default Password: Promega).
Note: An Administrator login is required to save configuration settings.
3. Select the ‘Configuration’ tab (Figure 64).
Figure 64. The ‘Configuration’ tab.
1549
8TA

Promega Corporation · 2800 Woods Hollow Road · Madison, WI 53711-5399 USA · Toll Free in USA 800-356-9526 · 608-274-4330 · Fax 608-277-2516www.promega.com TMD047 · Revised 8/22
75
4. Set definitions for the following:
Concentration Units: Select the Default units for concentration from the ‘Units’ drop-down menu and select the Save icon. See the drop-down menu in the software to view options for concentration units and well-naming.
Well-Naming Convention: Select the well-naming convention from the two radio button options and select the Save icon.
Calibrator Assessment: Calibrator assessment definitions are required for use with a virtual standard curve. Definitions for a minimum and maximum concentration are required for assessment. These definitions are expressed as a ratio. See Section 9.L for additional information about virtual standard curves.
Sheets to Hide: The PowerQuant® Analysis Software generates multiple worksheets for a final report. This section allows the user to select worksheets that will not be viewable in the final report. Select the sheets to hide from the list and select the Save icon. See Section 9.J for more information about the contents of each of the worksheets.
Create or Retrieve Dye Set Names
Selections made in the ‘Dye Set Names’ tab of the ‘PowerQuant Administrative Tools’ window are used to create a sample plate map for import into the real-time qPCR instrument software. Dye sets can be created, retrieved, edited and deleted.
1. Select the ‘Dye Set Names’ tab (Figure 65).
Figure 65. The ‘Dye Set Names’ tab.
1549
9TA

76 Promega Corporation · 2800 Woods Hollow Road · Madison, WI 53711-5399 USA · Toll Free in USA 800-356-9526 · 608-274-4330 · Fax 608-277-2516TMD047 · Revised 8/22 www.promega.com
9.G. Getting Started (continued)
Creating a New Dye Set
1. Select the New icon.
2. Select Yes in the ‘Confirm Data Delete’ dialog box to clear the form.
3. Enter a name for the dye set in the drop-down menu field.
4. Enter the dye names in the fields provided for Dye associated with target Name and select the Save icon (Figure 66). Note: The dye names must match those used for instrument calibration (see Section 4). A preloaded dye set
containing PowerQuant dyes is available as a default option. For the Applied Biosystems® 7500 Real-Time PCR System for Human Identification and HID Real-Time PCR Analysis Software, Version 1.1 or 1.2, enter “ROX” in the Passive Reference field.
5. Ensure “sds7500” is entered in the Instrument Type field. Note: Plate map import using the default entry “sds7500” is compatible with current versions of Applied Biosystems®
7500, 7500 HID and QuantStudio™ 5 Real-Time PCR System software (Figure 66).
Figure 66. The ‘Dye Set Names’ tab with the default dye names for each target.
6. Select the Save icon.
7. Select Yes in the ‘Save Confirm’ dialog box. Note: The dye set name appears in the dialog box. Confirm it is the correct dye set.
8. Select OK in the ‘Save Complete’ dialog box.
9. The newly created dye set is available for selection in the drop-down menu indicating addition to the database.
1550
0TA

Promega Corporation · 2800 Woods Hollow Road · Madison, WI 53711-5399 USA · Toll Free in USA 800-356-9526 · 608-274-4330 · Fax 608-277-2516www.promega.com TMD047 · Revised 8/22
77
Viewing or Editing an Existing Dye Set
1. Select a dye set from the drop-down menu and select the Retrieve icon.
2. The stored dye names for the dye set appear in the Dye fields associated with each target name.
3. Edit the dye names in the Dye fields or Instrument Type field as needed.
4. Select the Save icon.
5. Select No in the ‘Set Already Exists’ dialog box and enter a new name in the dye set drop-down menu field; or
6. Select Yes in the ‘Set Already Exists’ dialog box to overwrite the existing dye set. Note: The dye set name appears in the dialog box. Confirm it is the correct dye set.
7. Select OK in the ‘Save Complete’ dialog box.
Deleting a Dye Set
1. Select a dye set from the drop-down menu and select the Delete icon.
2. A ‘Delete Confirm’ dialog box appears. Note: The dye set name appears in the dialog box. Confirm it is the correct dye set.3. Select No to cancel the deletion; or
4. Select Yes to confirm the deletion. Select OK in the ‘Delete Complete’ dialog box. Note: The dye set is removed from the drop-down menu.
Create/Save Standard Curve Assessment Settings
Selections made on the ‘Standard Curve Assessment’ tab of the ‘PowerQuant Administrative Tools’ window provide the software with criteria used to evaluate the standard curve.
Creating a New Standard Curve Assessment
1. Select the ‘Standard Curve Assessment’ tab and select the New icon (Figure 67).
2. Select Yes in the ‘Confirm Data Delete’ dialog box to clear the form.
3. Enter the values for Minimum Acceptable R-Squared (R²) and Minimum and Maximum Acceptable Slope. (See Section 10 for additional information about interpretation of PowerQuant® System data). Additionally, Minimum and Maximum Acceptable values for the Y-intercept may be entered; selections for Y-intercept values are optional and not required for analysis with the PowerQuant® Analysis Software. All entries in this form must be numeric.
a. Specify the minimum passing R-Squared (R²) value that is acceptable to your laboratory for the standard curve for each quantification target (autosomal, Y and degradation). The software flags a standard curve with an R² value that falls below the minimum passing value.
b. Specify the upper and lower limits that are acceptable for the slope of the standard curve for each quantification target. The software flags a standard curve with slope values outside the upper and lower limits.
c. Specify the upper and lower numerical values that are acceptable for the Y-intercept of the standard curve for each quantification target. The software flags a standard curve with Y-intercept values outside the upper and lower limits.
Note: Specifying values for upper and lower limits are optional for the Y-intercept.

78 Promega Corporation · 2800 Woods Hollow Road · Madison, WI 53711-5399 USA · Toll Free in USA 800-356-9526 · 608-274-4330 · Fax 608-277-2516TMD047 · Revised 8/22 www.promega.com
9.G. Getting Started (continued)
4. To save the entries, enter a name for the standard curve assessment settings in the drop-down menu field and select the Save icon. A ‘Save Complete’ message box appears when the standard curve assessment settings have been saved.
Note: The standard curve settings name appears in the dialog box. Confirm it is the correct name.
5. Select OK in the ‘Save Complete’ dialog box.
6. The newly created standard curve assessment settings are available for selection in the drop-down menu indicating addition to the database.
Figure 67. The ‘Standard Curve Assessment’ tab.
Note: The standard curve assessment values displayed in the image above are default values. Default values should be customized to reflect results from internal validation studies conducted by individual laboratories.
1550
1TA

Promega Corporation · 2800 Woods Hollow Road · Madison, WI 53711-5399 USA · Toll Free in USA 800-356-9526 · 608-274-4330 · Fax 608-277-2516www.promega.com TMD047 · Revised 8/22
79
Viewing or Editing an Existing Standard Curve Assessment
1. Select a standard curve assessment from the drop-down menu and select the Retrieve icon.
2. The stored standard curve assessment values for each parameter and target appear.
3. Edit the parameters as needed.
4. Select the Save icon.
5. Select No in the ‘Set Already Exists’ dialog box and enter a new name in the standard curve assessment drop-down menu field; or
6. Select Yes in the ‘Set Already Exists’ dialog box to overwrite the existing standard curve assessment. Note: The standard curve assessment name appears in the dialog box. Confirm it is the correct name.
7. Select OK in the ‘Save Complete’ dialog box.
Deleting an Existing Standard Curve Assessment
1. Select a standard curve assessment from the drop-down menu and select the Delete icon.
2. A ‘Confirm Delete’ dialog box appears. Note: The standard curve assessment name appears in the dialog box. Confirm it is the correct name.
3. Select No to cancel the deletion; or
4. Select Yes to confirm the deletion. Select OK in the ‘Delete Complete’ dialog box. Note: The standard curve assessment is removed from the drop-down menu.
Create/Save Sample Assessment Settings
Creating a New Sample Assessment Setting
1. Select the ‘Sample Assessment’ tab and select the New icon (Figure 68).
2. A ‘Confirm Data Delete’ dialog box appears. Select Yes to clear the form.
3. Enter Threshold Values and Sample Assessment Messages. The threshold values should be customized to reflect results from internal validation studies conducted by individual laboratories (See Section 10 for additional information about interpretation of PowerQuant® System data).
a. In the Inhibitor threshold value field, specify the minimum IPC shift value at which you may expect to encounter inhibition with amplification of STRs. The IPC shift is the calculated difference in Cq values for the IPC in an unknown sample and the IPC of the closest DNA concentration in the standard curve.
b. In the Male/Female threshold value field, specify the minimum [Auto]/[Y] ratio indicative of a potential male/female mixture.
c. In the Degradation threshold value field, specify the minimum [Auto]/[Deg] ratio indicative of a potentially degraded DNA sample.

80 Promega Corporation · 2800 Woods Hollow Road · Madison, WI 53711-5399 USA · Toll Free in USA 800-356-9526 · 608-274-4330 · Fax 608-277-2516TMD047 · Revised 8/22 www.promega.com
9.G. Getting Started (continued)
4. To save the entries, type a name into the drop-down menu and select the Save icon. A ‘Save Complete’ dialog box appears when the sample assessment settings have been saved.
Note: The sample assessment settings name appears in the dialog box. Confirm it is the correct name.
5. Select OK in the ‘Save Complete’ dialog box.
6. The newly created sample assessment settings are available for selection in the drop-down menu indicating addition to the database.
Figure 68. The ‘Sample Assessment’ tab.
Notes:
1. The sample assessment settings displayed in the image above are the default values. These values should be customized to reflect results from internal validation studies.
2. For assessment of possible male/female DNA mixtures, DNA degradation and PCR inhibition, individual laboratories should determine and validate acceptable threshold values relevant to the success of downstream applications. The diversity of sample types, purifications and potential PCR inhibitors does not allow for specific threshold value recommendations. Default threshold settings in the PowerQuant® Analysis Software are values intended to be customized by the user based on results from their own internal validation studies.
1550
2TA
Promega Corporation · 2800 Woods Hollow Road · Madison, WI 53711-5399 USA · Toll Free in USA 800-356-9526 · 608-274-4330 · Fax 608-277-2516www.promega.com TMD047 · Revised 8/22
81
Viewing or Editing an Existing Sample Assessment
1. Select a sample assessment from the drop-down menu and select Retrieve.
2. The sample assessment values appear in the form. Edit the sample assessment settings as desired and select the Save icon.
3. Select No in the ‘Set Already Exists’ dialog box and enter a new name in the sample assessment drop-down menu field; or
4. Select Yes in the ‘Set Already Exists’ dialog box to overwrite the existing sample assessment. Note: The sample assessment settings name appears in the dialog box. Confirm it is the correct name.
5. Select OK in the ‘Save Complete’ dialog box.
Deleting an Existing Sample Assessment
1. Select a sample assessment name from the drop-down menu and select the Delete icon.
2. A ‘Confirm Delete’ dialog box appears. Note: The sample assessment settings name appears in the dialog box. Confirm it is the correct name.
3. Select No to cancel; or
4. Select Yes to confirm. Select OK in ‘Delete Complete’ dialog box. Note: The sample assessment is removed from the drop-down menu.
Create/Save Normalization Settings
Parameters defined in the ‘Normalization’ tab of the ‘PowerQuant Administrative Tools’ window are used in calculations for normalizing the DNA target mass for autosomal or Y-STR amplification, as well as pipetting volumes and diluent volumes. Additionally, user-defined message fields are used to flag samples that may need additional attention based on the normalization parameters. See Section 9.J for additional information about the autosomal and Y-STR normalization worksheets.
Creating a New Normalization Setting
1. Select the ‘Normalization’ tab and select the New icon (Figure 69).
2. A ‘Confirm Data Delete’ dialog box appears. Select Yes to clear the form.
3. Enter Normalization values.

82 Promega Corporation · 2800 Woods Hollow Road · Madison, WI 53711-5399 USA · Toll Free in USA 800-356-9526 · 608-274-4330 · Fax 608-277-2516TMD047 · Revised 8/22 www.promega.com
9.G. Getting Started (continued)
Figure 69. The ‘Normalization’ tab.
Normalization In the field for Max Dilution Volume (µl), specify the largest allowable volume of diluent to add to a concentrated DNA
sample to try and achieve the desired final DNA concentration (e.g., the maximum tube volume or maximum well volume on a 96-well plate).
In the field for Above Max Dilution Volume Message, enter text used to indicate that a volume greater than the specified Max Dilution Volume is required to dilute the DNA sample to the desired final DNA concentration.
In the field for Below DNA Target Mass Message, enter text used to indicate that the DNA concentration determined using the autosomal or Y target (for the Autosomal or Y Normalization worksheets) is too low to achieve the specified target DNA mass (the units displayed for DNA mass are based on the default selection made in the ‘Configuration’ tab), even when using the maximum volume of DNA sample.
1550
3TA

Promega Corporation · 2800 Woods Hollow Road · Madison, WI 53711-5399 USA · Toll Free in USA 800-356-9526 · 608-274-4330 · Fax 608-277-2516www.promega.com TMD047 · Revised 8/22
83
Normalization for Automated Transfer of Template Inthissection,theusercandefineadditionalvolumetoensureadequatevolumeforliquiddetectionandautomated
transferofnormalizedsamples.Forexample,ifaliquidhandlerrequiresaminimumvolumeof16.5µlforliquiddetection,thenenter“1.5µl”fora15µlMaximumSampleVolume(µl).ExtrapipettingvolumeisnotnecessaryforautomatedprotocolsdevelopedbyPromega.
Formanualsampletransfer,entertherequiredextravolumeneededfortransfer.Enter“0µl”ifnoadditionalvolumeisneeded.
Normalization for Autosomal STR ThePowerQuant®AnalysisSoftwareusesthevaluesdefinedinthissectionandtheautosomalDNAconcentration
ofaDNAsampletodeterminethevolumeofundilutedDNArequiredtoachievethetargetmassinanautosomalSTRamplificationreaction.IfaDNAsampleistooconcentrated,theuser-definedvaluesareusedtocalculatethesampledilutionneededtoachievethetargetmassofDNA.ThesoftwareflagsanysamplethatdoesnotreachthetargetmassofDNAbasedonthemaximumsamplevolume.
SpecifytheminimumvolumeofDNAsamplethatcanbepipettedintheMinimumSamplePipetteVolume(µl) field.ThevolumeofaDNAsampleusedintheAutoNormalizationworksheetisnotlowerthanthisspecifiedvalueforpreparationofthenormalizeddilution.
IntheMaximumSampleVolume(µl)field,specifythemaximumvolumeofDNAsampleorthenormalizeddilutionthatcanbeaddedtotheautosomalSTRamplificationreaction.
IntheTemplateDNAquantityperreactionfield,specifythedesiredmassofDNAtobeamplified.(TheunitsforDNAmassarebasedontheconcentrationunitsselectedinthe ‘Configuration’ tab.)
Normalization for Y-STR ThePowerQuant®AnalysisSoftwareusesthevaluesdefinedinthissectionandthemaleDNAconcentration
(Ytarget)ofaDNAsampletodeterminethevolumeofundilutedDNArequiredtoachievethetargetmassinaY-STRamplificationreaction.IfaDNAsampleistooconcentrated,theuser-definedvaluesareusedtocalculatethesampledilutionneededtoachievethetargetmassofDNA.ThesoftwareflagsanysamplethatdoesnotreachthetargetmassofDNAbasedonthemaximumsamplevolume.
SpecifytheminimumvolumeofDNAsamplethatcanbepipettedintheMinimumSamplePipetteVolume(µl)field.ThevolumeofaDNAsampleusedintheYNormalization worksheetisnotbelowthisspecifiedvalueforpreparationofthenormalizeddilution.
IntheMaximumSampleVolume(µl)field,specifythemaximumvolumeofDNAsampleorthenormalizeddilutionthatcanbeaddedtotheY-STRamplificationreaction.
IntheTemplateDNAquantityperreactionfield,specifythedesiredmassofDNAtobeamplified.(TheunitsforDNAmassarebasedontheconcentrationunitsselectedinthe‘Configuration’tab.)
4. Tosavetheentries,typeanameintothedrop-downmenuandselecttheSaveicon.A‘SaveComplete’dialogboxappearswhenthenormalizationsettingshavebeensaved.
Note: Thenormalizationsettingsnameappearsinthedialogbox.Confirmitisthecorrectname.
5. SelectOKinthe‘SaveComplete’dialogbox.
6. Thenewlycreatedsamplesettingsareavailableforselectioninthedrop-downmenuindicatingadditiontothedatabase.

84 Promega Corporation · 2800 Woods Hollow Road · Madison, WI 53711-5399 USA · Toll Free in USA 800-356-9526 · 608-274-4330 · Fax 608-277-2516TMD047 · Revised 8/22 www.promega.com
9.G. Getting Started (continued)
Viewing or Editing Normalization Settings
1. Select a normalization settings name from the drop-down menu and select the Retrieve icon.
2. The normalization settings values appear in the form. Edit the settings as desired and select the Save icon.
3. A ‘Set Already Exists’ dialog box prompts you to confirm the save action. Note: The normalization settings name appears in the dialog box. Confirm it is the correct name.4. Select No in the ‘Set Already Exists’ dialog box and enter a new name in the normalization drop-down menu field; or
5. Select Yes to overwrite the normalization settings.
6. Select OK in the ‘Save Complete’ dialog box.
Deleting Normalization Settings
1. Select a normalization settings name from the drop-down menu and select Delete.
2. A ‘Confirm Delete’ dialog box appears. Note: The normalization settings name appears in the dialog box. Confirm it is the correct name.
3. Select No to cancel; or
4. Select Yes to confirm. Select OK in ‘Delete Complete’ dialog box. Note: The normalization settings name is removed from the drop-down menu.

Promega Corporation · 2800 Woods Hollow Road · Madison, WI 53711-5399 USA · Toll Free in USA 800-356-9526 · 608-274-4330 · Fax 608-277-2516www.promega.com TMD047 · Revised 8/22
85
9.H. Designing a Plate Map
The PowerQuant® Analysis Software uses the plate map to identify wells containing standards, unknowns, negatives and calibrators. The software uses the concentrations of the DNA standards defined in the plate map to generate the standard curve. The PowerQuant® Analysis Software Plate Designer also includes features for creation of an import file for the instrument software and calculations for the individual components for the PowerQuant® amplification reaction setup.
General Considerations on Creating a Plate Map
• Plate maps are required for analysis of data exported from the Applied Biosystems® 7500, 7500 HID or QuantStudio™ 5 Real-Time PCR System to be compatible with the PowerQuant® Analysis Software.
• Sample names entered in a plate map are used to create a .txt file for import in the Applied Biosystems® 7500, 7500 HID or QuantStudio™ 5 Real-Time PCR System software; sample names are not stored as part of a plate map in the PowerQuant® Analysis Software database.
• Any user can create or save a plate map.
• Wells can be assigned either Standard, Negative, Unknown and Calibrator (Calibrator assignments are available for use with virtual standard curves only. See Section 9.L for additional information about virtual standard curves).
Standard: Data from sample wells designated as standards are used to generate the standard curve and determine the DNA concentration for all remaining sample types. No sample assessments are made for this sample type.
Negative: Results from sample wells designated as negatives are compared to the sample assessment settings entered in the Sample Assessment Settings (see Section 9.G). No additional assessment is performed on negatives.
Unknown: Results from sample wells designated as unknowns are compared to the sample assessment settings entered in the Sample Assessment Settings (see Section 9.G).
Calibrator: Results from sample wells designated as calibrators are compared to the Sample Assessment Settings and the Calibrator Assessment Settings (for use with virtual standard curves only). See Section 9.L for additional information about virtual standard curves.
• The PowerQuant® Analysis Software uses the plate map to identify wells containing standards when importing a PowerQuant® Results Excel® file. With the positions of the standards defined, the software then analyzes the Results file to generate the standard curve and determine sample concentration.
• A number of user-defined fields are available to record information (e.g., user, date, instrument ID). Information entered in these fields are not stored as part of a plate map in the PowerQuant® Analysis Software database.
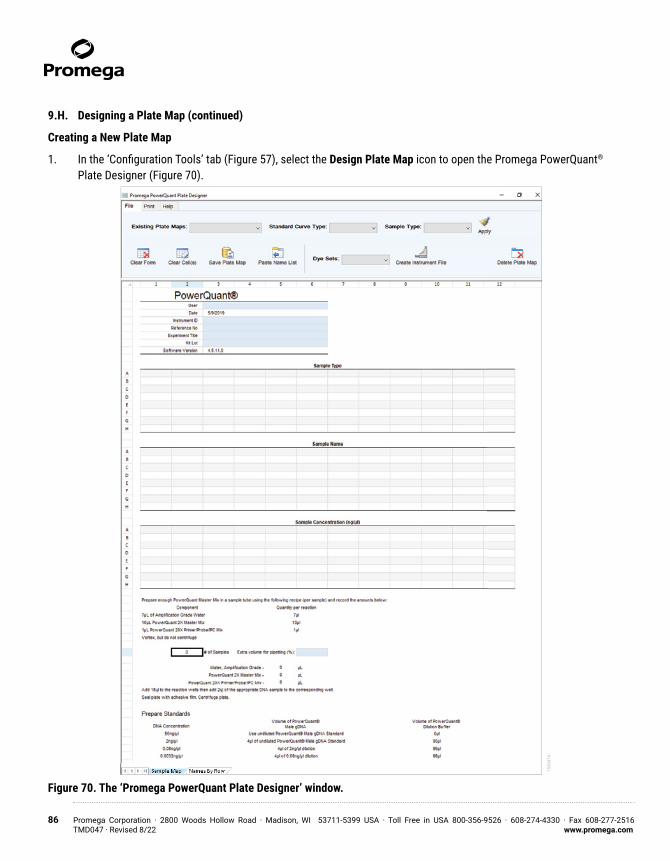
86 Promega Corporation · 2800 Woods Hollow Road · Madison, WI 53711-5399 USA · Toll Free in USA 800-356-9526 · 608-274-4330 · Fax 608-277-2516TMD047 · Revised 8/22 www.promega.com
9.H. Designing a Plate Map (continued)
Creating a New Plate Map
1. In the ‘Configuration Tools’ tab (Figure 57), select the Design Plate Map icon to open the Promega PowerQuant® Plate Designer (Figure 70).
Figure 70. The ‘Promega PowerQuant Plate Designer’ window.
1550
4TA

Promega Corporation · 2800 Woods Hollow Road · Madison, WI 53711-5399 USA · Toll Free in USA 800-356-9526 · 608-274-4330 · Fax 608-277-2516www.promega.com TMD047 · Revised 8/22
87
2. Select a standard curve type from the ‘Standard Curve Type’ drop-down menu. Select Yes in the ‘New Standard Curve Origin’ dialog box to clear the form.
The Imported Standard Type selection indicates data for a standard curve will be imported into the PowerQuant® Analysis Software from the Results Excel® file exported from the Applied Biosystems® 7500, 7500 HID or QuantStudio™ 5 Real-Time PCR System software.
The Virtual Standard Type selection indicates data for a standard curve are stored from a previous run in the PowerQuant® Analysis Software and not contained in the file exported from the instrument software. See Section 9.L for additional information about virtual standard curves.
3. Select Yes in the ‘New Standard Curve Origin’ dialog box.
4. In the Sample Type plate map, highlight the wells of interest and select the sample type from the ‘Sample Type’ drop-down menu and select the Apply icon. The plate map displays the assigned sample type.
a. Select the Standard sample type for sample wells containing the PowerQuant® Male gDNA standard dilutions used to generate the standard curve.
Notes: 1. Standard wells must be defined when standard curve data are included in the imported file for analysis.
2. Standard is not a sample type option when a virtual standard curve is used for analysis. See Section 9.L for additional information about virtual standard curves.
b. Select Unknown for wells containing unknown samples.
c. Select Negative or Unknown for wells containing negative controls. Note: The negative designation is for use inside the PowerQuant® Analysis Software only and will not be
transferred to the .txt files for import into the real-time PCR instrument software.
d. Select Calibrator for wells containing calibrator samples of known concentration (for use with virtual standard curves only, see Section 9.L for additional information).
Notes: 1. Calibrator is not a sample type option when an imported standard curve is used for analysis. 2. The calibrator designation is for use inside the PowerQuant® Analysis Software only and will not be
transferred to the .txt files for import into the real-time PCR instrument software. e. Select Unknown for all remaining wells in the 96-well plate (Figure 74).
5. In the Sample Concentration plate map, enter the concentrations for wells containing standards. This is required for any wells designated as standards in the Sample Type plate map. The concentration units displayed reflect the default selected on the ‘Configuration’ tab (see Section 9.G). Only numerical values are accepted in this plate map.
6. To store the locations of the Sample Types and the Sample Concentrations of the DNA standards, select the Save Plate Map icon.
Note: The Save function does not apply to the Sample Names portion of the plate map; sample name information is not stored in the plate map database. Sample Names are used to create .txt files for import into the real-time PCR instrument software.

88 Promega Corporation · 2800 Woods Hollow Road · Madison, WI 53711-5399 USA · Toll Free in USA 800-356-9526 · 608-274-4330 · Fax 608-277-2516TMD047 · Revised 8/22 www.promega.com
9.H. Designing a Plate Map (continued)
7. Enter a name for the plate map in the ‘Plate Map Name’ dialog box and select the OK button (Figure 71).
Figure 71. ‘Plate Map Name’ dialog box.
8. The newly created plate map is now available for selection in the ‘Existing Plate Maps’ drop-down menu indicating addition to the database (Figure 72).
Editing an Existing Plate Map
1. Select a plate map from the ‘Existing Plate Maps’ drop-down menu (Figure 70).
2. An “Apply Plate Map” message appears.
3. Select No to cancel clearing the form and importing the template; or
4. Select Yes to clear the form and fill it with the selected template information.
5. In the Sample Type plate map, highlight the wells of interest and select the sample type from the drop-down menu and select the Apply icon. The plate map displays the assigned sample type.
6. To clear wells in any of the plate maps, highlight the cells and select the Clear Cell(s) icon.
7. To store the locations of the Sample Types and the Sample Concentrations of the DNA standards, select the Save Plate Map icon.
Note: The Save function does not apply to the Sample Names portion of the plate map; sample name information is not stored in the plate map database. Sample Names are used to create .txt files for import into the real-time PCR instrument software.
1550
5TA

Promega Corporation · 2800 Woods Hollow Road · Madison, WI 53711-5399 USA · Toll Free in USA 800-356-9526 · 608-274-4330 · Fax 608-277-2516www.promega.com TMD047 · Revised 8/22
89
1550
6TA
Figure 72. ‘Plate Map Name’ dialog box with a previously saved plate map.
8. Either enter a new name for the plate map in the ‘Plate Map Name’ dialog box and select the OK button; or
9. Select the existing template name from the list in the ‘Plate Map Name’ dialog box (Figure 72).
a. A ‘Plate Map Already Exists’ dialog box appears with the existing plate name.
b. Select No to cancel overwriting the template; or
c. Select Yes to overwrite the template. Select the OK button.
Deleting a Plate Map
1. Select a plate map from the “Existing Plate Maps” drop-down menu.
2. Select the Delete icon.
3. A‘ConfirmDelete’dialogboxappearswiththeplatename.
a. Select No to cancel deleting the plate map; or
b. Select Yes to delete the plate map.
4. Select the OKbuttoninthe‘DeleteComplete’dialogbox. Note: The plate map is removed from the drop-down menu.
Creating a .txt file for Import into the Real-Time PCR Instrument
1. To create a .txt for import in the Applied Biosystems®7500,7500HIDorQuantStudio™5Real-TimePCRSystemsoftware, follow the instructions in “Creating a Plate Map or Editing an Existing Plate Map”.
2. Selectadyesetfromthe‘DyeSets’drop-downmenuofthe‘PromegaPowerQuantPlateDesigner’window(Figure 70).

90 Promega Corporation · 2800 Woods Hollow Road · Madison, WI 53711-5399 USA · Toll Free in USA 800-356-9526 · 608-274-4330 · Fax 608-277-2516TMD047 · Revised 8/22 www.promega.com
9.H. Designing a Plate Map (continued)
3. Enter sample names in the Sample Name plate map. Note: Some symbols are not compatible with .txt file import. Limit the use of symbols in sample names.
a. Sample names can be entered manually on the ‘Sample Map’ tab or copied and pasted into the plate map in a 96-well format (Figure 70).
b. Alternatively, the ‘Names by Row’ tab (located at the bottom of the screen) can be used to arrange sample names and well positions listed by row. Use the Paste Name List icon to transfer the sample name information entered on this tab to the ‘Sample Map’ tab (Figure 73).
Note: Using the ‘Names by Row’ tab to add sample names to the plate map will overwrite any entries made to the plate map on the ‘Sample Map’ tab.
Figure 73. The ‘Names by Row’ tab in the Promega PowerQuant Plate Designer.
1550
7TA

Promega Corporation · 2800 Woods Hollow Road · Madison, WI 53711-5399 USA · Toll Free in USA 800-356-9526 · 608-274-4330 · Fax 608-277-2516www.promega.com TMD047 · Revised 8/22
91
Figure 74. The ‘Sample Map’ tab in the ‘Promega PowerQuant Plate Designer File’ window with Sample Type, Sample Names and Standard Sample Concentration.
1550
8CA
1550
8TA
1550
8CA

92 Promega Corporation · 2800 Woods Hollow Road · Madison, WI 53711-5399 USA · Toll Free in USA 800-356-9526 · 608-274-4330 · Fax 608-277-2516TMD047 · Revised 8/22 www.promega.com
9.H. Designing a Plate Map (continued)
4. In the Sample Type plate map, highlight all unused wells and select the Clear Cells button.
5. Select the Create Instrument File icon to create the file.
6. The ‘Excel Data Bucket’ window opens. Select the Save Instrument File button (Image not shown).
7. A file explorer opens.
8. Navigate to the location of interest, enter a file name and select Save.
9. Select the Return button to close the ‘Excel Data Bucket’ window.
10. Use the Import function in the instrument software to add the information in the plate setup import file to a previously created run template. See Sections 6.B, 7.B or 8.C for additional information.
Note: Confirm that the CT Settings are set correctly in the instrument software. See Sections 6.A, 7.A or 8.B for additional information.
Preparation of PowerQuant® Amplification Reaction Mix
1. The number of sample names entered in the Sample Name plate map on the ‘Sample Map’ tab of the Promega PowerQuant Plate Designer determines the number of reactions used to calculate the preparation of PowerQuant® Amplification Reaction Mix (Figure 74). (See Section 5.B for information on reaction setup.)
2. Use the ‘Extra Volume for pipetting (%)’ field to compensate for pipetting error and reagent loss on sides of pipette tips (an extra 10–15% extra volume is recommended; see Section 5.B). Enter the percentage converted to a decimal value (e.g., enter “0.10” for 10%).
9.I. Importing the PowerQuant® Results Excel® File
The ‘Import’ tab of the PowerQuant® Analysis Software is used to process qPCR data generated with the PowerQuant® System (Figure 75).
The PowerQuant® Analysis Software does not store analyzed data. Analyzed data must be saved as an Excel® workbook or as a .pdf file.Note: Successful analysis requires the inclusion of sample names in the PowerQuant® Results Excel® file exported from the instrument software, as well as the designation of a Sample Type for all used sample positions in the PowerQuant® Analysis Software Plate Map (see Section 9.H).
1. Use the drop-down menus to make the following selections: data file source; sample assessment, standard curve assessment and normalization settings; plate map; and virtual curve (for use with virtual standard curves only; see Section 9.L for additional information on virtual standard curves) (Figure 75). See Section 9.G for information about settings and Section 9.H for information about plate maps.
Note: Selecting the correct plate map from the menu is critical for analysis with the PowerQuant® Analysis Software. Failure to do so may lead to incomplete or erroneous results.
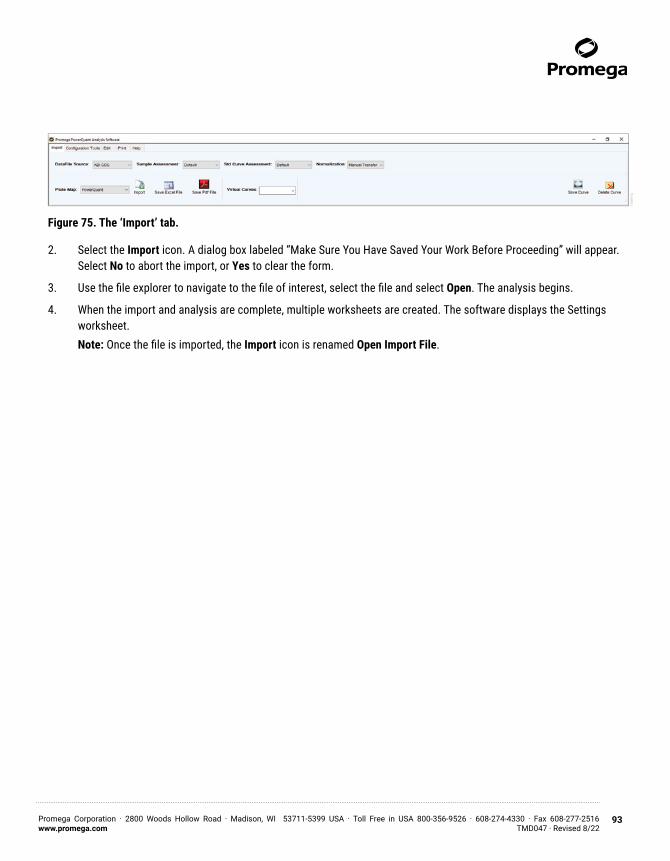
Promega Corporation · 2800 Woods Hollow Road · Madison, WI 53711-5399 USA · Toll Free in USA 800-356-9526 · 608-274-4330 · Fax 608-277-2516www.promega.com TMD047 · Revised 8/22
93
Figure 75. The ‘Import’ tab.
2. Select the Import icon. A dialog box labeled “Make Sure You Have Saved Your Work Before Proceeding” will appear. Select No to abort the import, or Yes to clear the form.
3. Use the file explorer to navigate to the file of interest, select the file and select Open. The analysis begins.
4. When the import and analysis are complete, multiple worksheets are created. The software displays the Settings worksheet.
Note: Once the file is imported, the Import icon is renamed Open Import File.
1550
9TA

94 Promega Corporation · 2800 Woods Hollow Road · Madison, WI 53711-5399 USA · Toll Free in USA 800-356-9526 · 608-274-4330 · Fax 608-277-2516TMD047 · Revised 8/22 www.promega.com
9.J. The PowerQuant® Analysis Software Report
Worksheets General Information
The following worksheets are created by the PowerQuant® Analysis Software after analysis is complete. These worksheets are locked to prevent editing of the formulas, linked cells and named ranges.
Review the following worksheets created in Section 9.I in the PowerQuant® Analysis Software.
Settings Worksheet
The Settings worksheet displays general information about the analysis, standard curve and standard curve assessment settings, sample assessment settings and normalization settings (Figure 76). See Section 9.G for additional information about these settings. See Section 9.L for information about the Settings worksheet when a virtual standard curve is used.
a. In the PowerQuant® header section on the Settings worksheet, there are fields shaded white or light blue. i. The white cells display information populated by the PowerQuant® Analysis Software that cannot be modified:
• The Date field is populated with the date the PowerQuant® Analysis Software analysis was completed.
• The Data File Source field is populated with the source of the imported data file (i.e., ABI 7500 SDS).
• The Plate Map Name field is populated with the name of the plate map selected in section 9.I.
• The Imported File Name field is populated with the name of the imported PowerQuant® Results Excel® file.
• The Software Version field is populated with the version of the PowerQuant® Analysis Software used for analysis.
ii. The following light blue cells can be defined by the user:
• The User field is automatically populated with the Microsoft® Windows user name. Note: Although, this field is automatically populated, it is editable.
• Instrument ID
• Reference Number
• Experiment Title
• Kit Lot Note: The information displayed and entered in the header on the Settings worksheet is displayed on all
PowerQuant® Analysis Software generated worksheets.

Promega Corporation · 2800 Woods Hollow Road · Madison, WI 53711-5399 USA · Toll Free in USA 800-356-9526 · 608-274-4330 · Fax 608-277-2516www.promega.com TMD047 · Revised 8/22
95
Figure 76. The Settings worksheet.
1551
0TA

96 Promega Corporation · 2800 Woods Hollow Road · Madison, WI 53711-5399 USA · Toll Free in USA 800-356-9526 · 608-274-4330 · Fax 608-277-2516TMD047 · Revised 8/22 www.promega.com
9.J. The PowerQuant® Analysis Software Report (continued)
Std Curve Worksheet
The Std Curve (Standard Curve) worksheet displays a table of the Cq values for each of the standard samples (Figure 77). It also displays the calculated R2, Slope, Y-Intercept and Amplification Efficiency for each target, along with a comparison to the R2 thresholds, slope limits, and Y-intercept thresholds. The R2 thresholds, slope limits and Y-intercept thresholds used are displayed on the Settings worksheet.
Figure 77. The Std Curve worksheet.
1551
1CA

Promega Corporation · 2800 Woods Hollow Road · Madison, WI 53711-5399 USA · Toll Free in USA 800-356-9526 · 608-274-4330 · Fax 608-277-2516www.promega.com TMD047 · Revised 8/22
97
Table Results Worksheet
The Table Results worksheet displays data output sorted by well position (Figure 78). The DNA concentration and Cq value for each target are displayed in respective columns.
The IPC Cq value for the DNA standard with the closest DNA concentration is displayed for each sample in the Closest IPC column. The difference in Cq values for the IPC of the closest DNA standard and the IPC of the DNA sample is displayed in the IPC Shift column. The IPC Threshold Result column displays the message defined in the Sample Assessment Message fields based on the IPC Shift value for the sample and the IPC Shift threshold value.
The ratio of autosomal DNA concentration and male DNA concentration is calculated and displayed in the [Auto]/[Y] column. The [Auto]/[Y] Threshold column displays the message defined in the Sample Assessment Message fields based on the [Auto]/[Y] value for the sample and the [Auto]/[Y] threshold value.
The ratio of autosomal DNA concentration and degradation target DNA concentration is calculated and displayed in the [Auto]/[Deg] column. The [Auto]/[Deg] Threshold column displays the message defined in the Sample Assessment Message fields based on the [Auto]/[Deg] Value for the sample and the [Auto]/[Deg] threshold value.
Standard curve data and comparisons to the thresholds and slope limits, defined in the Configuration Settings and selected for analysis, are provided in a table. Thresholds and messages selected for the Sample Assessment settings are also displayed in a table.
The worksheet does not display calculated sample concentrations or sample assessments for samples designated with the Standard sample type.Note: Filter and sort functions are provided in the Table Results. These functions allow a user to select, exclude and sort data within the table. The filter and sort functions are accessed by selecting the arrow button in the column header. Use the Text Filter function to select data (checked) or exclude data (unchecked). Use the Sort function to reorder data smallest to largest or largest to smallest. Application of these functions may take a few minutes to complete while the software updates data links to other pages in the workbook.

98 Promega Corporation · 2800 Woods Hollow Road · Madison, WI 53711-5399 USA · Toll Free in USA 800-356-9526 · 608-274-4330 · Fax 608-277-2516TMD047 · Revised 8/22 www.promega.com
9.J. The PowerQuant® Analysis Software Report (continued)
Figure 78. The Table Results worksheet.
Averages Table
The Averages Table worksheet contains output results sorted alphabetically by sample name, with averages calculated for replicate samples (i.e., samples with the same sample name) (Figure 79). The DNA concentration and Cq value for each target are displayed in respective columns.
Data for the standard samples are not displayed.
The IPC Cqvalue for the sample is displayed. The difference in Cq values for the IPC of the closest DNA standard and the IPC of the DNA sample is displayed in the IPC Shift column. The IPC Threshold column displays the message defined in the Sample Assessment Message fields based on the IPC Shift value for the sample and the IPC Shift threshold value.
The IPC Cq value for the DNA standard with the closest DNA concentration is displayed for each sample in the Closest IPC column. The difference in Cq values for the IPC of the closest DNA standard and the IPC of the DNA sample is displayed in the IPC Shift column. The IPC Threshold Result column displays the message defined in the Sample Assessment Message fields based on the IPC Shift value for the sample and the IPC Shift threshold value.
1551
2CA

Promega Corporation · 2800 Woods Hollow Road · Madison, WI 53711-5399 USA · Toll Free in USA 800-356-9526 · 608-274-4330 · Fax 608-277-2516www.promega.com TMD047 · Revised 8/22
99
The ratio of autosomal DNA concentration and male DNA concentration is calculated and displayed in the [Auto]/[Y] column. The [Auto]/[Y] Threshold column displays the message defined in the Sample Assessment Message fields based on the [Auto]/[Y] value for the sample and the [Auto]/[Y] threshold value. For samples with no Cq value detected for the Y target, the [Auto]/[Y] column displays “No Y Cq”. For samples with no Cq value detected for the autosomal target, the column displays “No Auto Cq”.
The ratio of autosomal DNA concentration and degradation target DNA concentration is calculated and displayed in the [Auto]/[Deg] column. For samples with no Cq value detected for the Deg target, the [Auto]/[Deg] column displays “No Deg Cq”. For samples with no Cq value detected for the autosomal target, the column displays “No Auto Cq”. The [Auto]/[Deg] Threshold column displays the message defined in the Sample Assessment Message fields based on the [Auto]/[Deg] value for the sample and the [Auto]/[Deg] threshold value.
All values for individual wells displayed on the Averages Table worksheet are identical to those on the Table Results worksheet.Note: Filter and sort functions are provided in the Averages Table. These functions allow a user to select, exclude and sort data within the table. The filter and sort functions are accessed by selecting the arrow button in the column header. Use the Text Filter function to select data (checked) or exclude data (unchecked). Use the Sort function to reorder data smallest to largest or largest to smallest. Application of these functions may take a few minutes to complete while the software updates data links to other pages in the workbook.
1551
3CAFigure 79. The Averages Table worksheet.

100 Promega Corporation · 2800 Woods Hollow Road · Madison, WI 53711-5399 USA · Toll Free in USA 800-356-9526 · 608-274-4330 · Fax 608-277-2516TMD047 · Revised 8/22 www.promega.com
9.J. The PowerQuant® Analysis Software Report (continued)
Autosomal Normalization Worksheets
The autosomal normalization worksheets contain the output normalization values for each DNA sample based on the DNA concentration determined using the autosomal target for that sample and the autosomal normalization parameters set on ‘Normalization’ tab of the Configuration Settings (See Section 9.G for more information about Configuration Settings). The Normalization parameters are displayed at the top each normalization worksheet (Figure 80).Worksheets for DNA template normalization based on the autosomal target are provided in four different formats:
• Samples sorted by sample name (Auto Normalization);• Samples arranged by row (Auto Norm by Row); • Samples arranged by column (Auto Norm by Col); and• Samples arranged in a 96-well format (Auto Norm Plate)
All normalization worksheets display the well position for the DNA sample used in the qPCR amplification plate.
The Auto Normalization worksheet, the Auto Norm by Row worksheet and the Auto Norm by Col worksheet display the following columns of values:
Sample Name: Displays the sample name assigned to the well position.
Sample Concentration: Displays the concentration in the units defined on the ‘Configuration’ tab of the Configura-tion Settings based on the quantification results from the autosomal target.
Template Volume (µl): If the DNA template requires dilution, the value displayed in this column is the volume of template DNA to add to the diluent to achieve the desired target DNA mass. If the DNA template does not require dilution, the value displayed is the volume of undiluted DNA to add directly to the autosomal STR amplification reaction. This volume will not be less than the Minimum Sample Pipette Volume (µl) nor greater than the Maximum Sample Volume (µl).
Diluent to Add (µl): Displays the volume of diluent required to normalize the sample DNA concentration to the target concentration. This volume is the difference between the value entered for the Template Volume (µl) and the value displayed in the Volume of Normalization (µl) column.
Volume of Normalization (µl): Displays the total volume of the normalized dilution.
Volume for Rxn (µl): Displays the volume of undiluted template or normalized template to add to the amplification reaction.
DNA Template: Displays the target mass of DNA for the autosomal STR amplification reaction based on the volumes and dilution steps.
Note: The units displayed for the DNA template mass reflect the units selected for DNA concentration in the ‘Configuration’ tab of the Configuration Settings (see Section 9.G).
Message: Displays messages to indicate either a volume greater than the specified Max Dilution Volume (µl) is required to dilute the specified volume of DNA sample to the desired final concentration or that the DNA concentration determined using the autosomal target is too low to achieve the specified target DNA mass with the Maximum Sample Volume (µl).
Note: If multiple DNA quantification results are available for a sample, these values are displayed for individual replicates and for the average autosomal quantification result for each set of replicates in the Auto Normalization worksheet.

Promega Corporation · 2800 Woods Hollow Road · Madison, WI 53711-5399 USA · Toll Free in USA 800-356-9526 · 608-274-4330 · Fax 608-277-2516www.promega.com TMD047 · Revised 8/22
101
The Auto Norm by Plate worksheet simply displays the normalization values in three 96-well plates: Diluent Required (µl), Template to Add (µl) and Total Volume (µl). Note: Filter and sort functions are provided in the Auto Normalization worksheet, the Auto Norm by Row worksheet,
and the Auto Norm by Col worksheet. These functions allow a user to select, exclude and sort data within the table. The filter and sort functions are accessed by selecting the arrow button in the column header. Use the Text Filter function to select data (checked) or exclude data (unchecked). Use the Sort function to reorder data smallest to largest or largest to smallest. Application of these functions may take a few minutes to complete while the software updates data links to other pages in the workbook.
Figure 80. The Auto Normalization worksheet.
1551
4CA

102 Promega Corporation · 2800 Woods Hollow Road · Madison, WI 53711-5399 USA · Toll Free in USA 800-356-9526 · 608-274-4330 · Fax 608-277-2516TMD047 · Revised 8/22 www.promega.com
9.J. The PowerQuant® Analysis Software Report (continued)
Y-STR Normalization Worksheets
The Y-STR normalization worksheets contain the output normalization values for each DNA sample based on the DNA concentration determined using the Y target for that sample and the Y-STR normalization parameters set on the ‘Normalization’ tab of the Configuration Settings (See Section 9.G for more information about Configuration Settings). The Normalization parameters are displayed at the top each normalization worksheet (Figure 81).Worksheets for DNA template normalization based on the Y target are provided in four different formats:
• Samples sorted by sample name (Y Normalization);• Samples arranged by row (Y Norm by Row); • Samples arranged by column (Y Norm by Col); and• Samples arranged in a 96-well format (Y Norm Plate)
All normalization worksheets display the well position for the DNA sample used in the qPCR amplification plate.
The Y Normalization worksheet, the Y Norm by Row worksheet and the Y Norm by Col worksheet display the following columns of values:
Sample Name: Displays the sample name assigned to the well position.
Sample Concentration: Displays the concentration in the units defined on the ‘Configuration’ tab of the Configuration Settings based on the quantification results from the Y target.
Template Volume (µl): If the DNA template requires dilution, the value displayed in this column is the volume of template DNA to add to the diluent to achieve the desired target DNA mass. If the DNA template does not require dilution, the value displayed is the volume of undiluted DNA to add directly to the Y-STR amplification reaction. This volume will not be less than the Minimum Sample Pipette Volume (µl) nor greater than the Maximum Sample Volume (µl).
Diluent to Add (µl): Displays the volume of diluent required to normalize the sample DNA concentration to the target concentration. This volume is the difference between the value entered for the Template Volume (µl) and the value displayed in the Volume of Normalization (µl) column.
Volume of Normalization (µl): Displays the total volume of the normalized dilution.
Volume for Rxn (µl): Displays the volume of undiluted template or normalized template to add to the amplification reaction.
DNA Template: Displays the target mass of DNA for the Y-STR amplification reaction based on the volumes and dilution steps.
Note: The units displayed for the DNA template mass reflect the units selected for DNA concentration in the ‘Configuration’ tab of the Configuration Settings (see Section 9.G).
Message: Displays messages to indicate either a volume greater than the specified Max Dilution Volume (µl) is required to dilute the specified volume of DNA sample to the desired final concentration or that the DNA concentration determined using the Y target is too low to achieve the specified target DNA mass with the Maximum Sample Volume (µl).
Note: If multiple DNA quantification results are available for a sample, these values are displayed for individual replicates and for the average Y quantification result for each set of replicates in the Y Normalization worksheet.

Promega Corporation · 2800 Woods Hollow Road · Madison, WI 53711-5399 USA · Toll Free in USA 800-356-9526 · 608-274-4330 · Fax 608-277-2516www.promega.com TMD047 · Revised 8/22
103
The Y Norm by Plate worksheet simply displays the normalization values in three 96-well plates: Diluent Required (µl), Template to Add (µl) and Total Volume (µl). Note: Filter and sort functions are provided in the Y Normalization worksheet, the Y Norm by Row worksheet and
the Y Norm by Col worksheet. These functions allow a user to select, exclude and sort data within the table. The filter and sort functions are accessed by selecting the arrow button in the column header. Use the Text Filter function to select data (checked) or exclude data (unchecked). Use the Sort function to reorder data smallest to largest or largest to smallest. Application of these functions may take a few minutes to complete while the software updates data links to other pages in the workbook.
Figure 81. The Y Normalization worksheet.
1551
5CA

104 Promega Corporation · 2800 Woods Hollow Road · Madison, WI 53711-5399 USA · Toll Free in USA 800-356-9526 · 608-274-4330 · Fax 608-277-2516TMD047 · Revised 8/22 www.promega.com
9.J. The PowerQuant® Analysis Software Report (continued)
Sample Name Map Worksheet
The Sample Name Map worksheet displays the sample type and sample name in a 96-well plate layout (Figure 82).
Figure 82. The Sample Name Map worksheet.
1551
6CA

Promega Corporation · 2800 Woods Hollow Road · Madison, WI 53711-5399 USA · Toll Free in USA 800-356-9526 · 608-274-4330 · Fax 608-277-2516www.promega.com TMD047 · Revised 8/22
105
Quantity Map Worksheet
The Quantity Map worksheet displays DNA concentrations calculated for all targets by the PowerQuant® Analysis Software for all samples in a 96-well plate layout format (Figure 83).
Figure 83. The Quantity Map worksheet.15
517C
A

106 Promega Corporation · 2800 Woods Hollow Road · Madison, WI 53711-5399 USA · Toll Free in USA 800-356-9526 · 608-274-4330 · Fax 608-277-2516TMD047 · Revised 8/22 www.promega.com
9.J. The PowerQuant® Analysis Software Report (continued)
Cq Map Worksheet
The Cq Map worksheet displays the Cq values for all targets detected for each well position (Figure 84).
Figure 84. The Cq Map worksheet.
1551
8CA

Promega Corporation · 2800 Woods Hollow Road · Madison, WI 53711-5399 USA · Toll Free in USA 800-356-9526 · 608-274-4330 · Fax 608-277-2516www.promega.com TMD047 · Revised 8/22
107
Ratio Map Worksheet
The Ratio Map worksheet displays the [Auto]/[Deg] ratios, the [Auto]/[Y] ratios and IPC sample assessment messages by well position (Figure 85). Additionally, well positions with values exceeding threshold values set for the Male/Female and Degradation sample assessments are flagged.
Figure 85. The Ratio Map worksheet.15
519C
A

108 Promega Corporation · 2800 Woods Hollow Road · Madison, WI 53711-5399 USA · Toll Free in USA 800-356-9526 · 608-274-4330 · Fax 608-277-2516TMD047 · Revised 8/22 www.promega.com
9.J. The PowerQuant® Analysis Software Report (continued)
IPC Map Worksheet
The IPC Map worksheet displays the IPC shift and the IPC shift message by well position (Figure 86).
Figure 86. The IPC Map worksheet.
Imported Data Worksheet
The Imported Data worksheet displays the imported raw data spreadsheet (image not shown).
1552
0CA

Promega Corporation · 2800 Woods Hollow Road · Madison, WI 53711-5399 USA · Toll Free in USA 800-356-9526 · 608-274-4330 · Fax 608-277-2516www.promega.com TMD047 · Revised 8/22
109
9.K. Print and Save the PowerQuant® Analysis Software Report
After data review in the PowerQuant® Analysis Software, the report worksheets can be printed or saved. Note: These data are not stored in the PowerQuant® Analysis Software database.
Printing and saving the report are performed in the ‘Import’ tab.
Printing a Report
1. To preview pages for a printed report, select the Print Preview icon in the ‘Print’ tab (Figure 87).
Figure 87. Printing options in the Print tab.
a. A ‘Select Sheet(s) to Preview’ dialog box appears.
b. Highlight the worksheets to preview. Note: Use the Ctrl or Shift keys on the keyboard to select multiple sheets for preview.
c. Select OK to view the first Print Preview worksheet.
d. To print previewed pages, select the Print icon in the toolbar.
e. Select the Close button to close the Print Preview worksheet and display the next preview. Note: The generation of each Print Preview worksheet may take a few seconds.
2. Print pages using the print functions on the ‘Print’ tab. Select Print to choose the sheets to print.
a. A ‘Select Sheet(s) to Print’ dialog box appears (Figure 88).
Figure 88. The ‘Select Sheet(s) to Print’ dialog box.
1567
4CA
1567
5CA

110 Promega Corporation · 2800 Woods Hollow Road · Madison, WI 53711-5399 USA · Toll Free in USA 800-356-9526 · 608-274-4330 · Fax 608-277-2516TMD047 · Revised 8/22 www.promega.com
9.K. Print and Save the PowerQuant® Analysis Software Report (continued)
b. Highlight the worksheets to print. Note: Use the Ctrl or Shift keys on the keyboard to select and print multiple sheets.
c. Select OK to send the print job to the default printer. Note: Once a file is saved and closed, these print options are no longer available within the PowerQuant® Analysis
Software.
Saving a Report
1. To save the file as an Excel® workbook, select the Save Excel File icon on the ‘Import’ tab (Figure 75). a. A file explorer opens. b. Navigate to the location of interest, enter a file name and select Save.
2. To save the file as a .pdf, select the Save Pdf File icon on the ‘Import’ tab. a. A file explorer opens. b. Navigate to the location of interest, enter a file name and select Save. c. A “PDF Save Complete” message appears when the save is complete.
3. If finished, close the PowerQuant® Analysis Software.
9.L. Analysis with a Virtual Standard Curve
This section describes how to analyze PowerQuant® System data using a virtual standard curve to determine sample concentration. The virtual curve comprises standard curve data stored in the PowerQuant® Analysis Software from a previous analysis. When a virtual standard curve is used, the stored standard curve data is accessed by the software and used to calculate the sample concentration for all unknown samples. When a virtual standard curve is used, calibrators with known sample concentration act as positive controls for qPCR with the PowerQuant® System.
Individual laboratories should validate the acceptable use of virtual standard curves and calibrators relevant to the success of downstream applications. Default threshold settings in the PowerQuant® Analysis Software are values intended to be customized by the user.Note: The IPC Cq shift will not be calculated when virtual standard curves are used for qualitative and quantitative assessment of samples. Labs should perform a detailed internal validation to determine downstream paths for samples containing possible inhibitors.
Creating a Virtual Curve
The first step in performing analysis with a virtual standard curve is adding standard curve data to the PowerQuant® Analysis Software database.
1. Follow the steps in Section 9.I, Importing the PowerQuant® Results Excel® File. Note: To create the virtual curve, be sure to select a plate map with Imported as the Standard Type selection.
2. Review standard curve data and evaluate whether the standard curves for each target meet acceptance criteria. Once standard curve data are determined to be acceptable, enter a name for the standard curve in the ‘Virtual Curves’ drop-down menu (Figure 89).

Promega Corporation · 2800 Woods Hollow Road · Madison, WI 53711-5399 USA · Toll Free in USA 800-356-9526 · 608-274-4330 · Fax 608-277-2516www.promega.com TMD047 · Revised 8/22
111
1552
4TA
Figure 89. Naming a virtual curve.
3. Select the Save Curve icon.
4. Select Yes in the ‘Save Confirmation’ dialog box to store standard curve data.
Setting Calibrator Assessment Parameters
Calibrators are used with the PowerQuant® System as positive controls for amplification when DNA standards are not included on the amplification plate. Numerical values are defined to evaluate the DNA concentrations detected for the calibrators.
1. On the ‘Configuration Tools’ tab, select the Configuration Settings icon to open the ‘PowerQuant® Administrative Tools’ window (Figure 57).
Note: The Calibrator Assessment limits are set using an Admin user account (see Section 9.F. for more information about user accounts).
2. On the ‘Configuration’ tab, in the Calibrator Assessment section, select Default from the drop-down menu. See Section 9.G for additional information on the ‘Configuration’ tab (Figure 64).
3. Enter values for the “Acceptable Min of Concentration” and the “Acceptable Max of Concentration” (Figure 90).These values are expressed as a ratio and must be numerical (e.g., set “0.90” as Acceptable Min of Concentration and “1.10” as the Acceptable Max of Concentration).
Figure 90. Setting Calibrator Assessment values on the ‘Configuration’ tab.
4. Enter a name for the calibrator assessment in the ‘Calibrator Assessment’ drop-down menu.
5. Select the Save button in the Calibrator Assessment section.
1552
2TA

112 Promega Corporation · 2800 Woods Hollow Road · Madison, WI 53711-5399 USA · Toll Free in USA 800-356-9526 · 608-274-4330 · Fax 608-277-2516TMD047 · Revised 8/22 www.promega.com
9.L. Analysis with a Virtual Standard Curve (continued)
Creating a Plate Map for Use with a Virtual Curve
Successful analysis with the PowerQuant® Analysis Software requires a plate map with the virtual curve format.
1. In the ‘Configuration Tools’ tab (Figure 57), select the Design Plate Map icon to open the ‘Promega PowerQuant Plate Designer’ window (Figure 91).
2. From the ‘Standard Curve Type’ drop-down menu, select Virtual.
3. Select Yes in the ‘New Standard Curve Origin’ dialog box.
4. Select Default in the ‘Calibrator Flags’ drop-down menu.
Figure 91. Plate Designer menu options for a virtual standard curve.
1552
3TA

Promega Corporation · 2800 Woods Hollow Road · Madison, WI 53711-5399 USA · Toll Free in USA 800-356-9526 · 608-274-4330 · Fax 608-277-2516www.promega.com TMD047 · Revised 8/22
113
5. In the Sample Type plate map, highlight the wells of interest and select the sample type from the ‘Sample Type’ drop-down menu and select the Apply icon. The plate map displays the assigned sample type.
a. Select the Calibrator sample type for sample wells containing samples with known concentration run concurrently with unknown samples.
Notes:1. Calibrator wells must be selected when a virtual standard curve is used.2. The software limits the number of wells designated as a Calibrator to four.3. Standard is not a sample type option when a virtual standard curve is used for analysis. See Section 9.H for
additional information about standard curves included in the imported data file.
b. Select Unknown for wells containing unknown samples. c. Select Negative or Unknown for wells containing negative controls. Note: The negative designation is for use inside the PowerQuant® Analysis Software only and will not be
transferred to the .txt files for import into the real-time PCR instrument software.
6. In the Sample Concentration plate map, enter the concentrations for wells containing calibrators. The concentration units displayed reflect the default selected in the ‘Configuration’ tab (see Section 9.G).
7. To store the locations of the Sample Types and the Sample Concentrations of the DNA standards, select the Save Plate Map icon.
Note: The Save function does not apply the Sample Names portion of the plate map; sample name information is not stored in the plate map database.
8. Enter a name for the plate map in the ‘Plate Map Name’ dialog box and select the OK button.

114 Promega Corporation · 2800 Woods Hollow Road · Madison, WI 53711-5399 USA · Toll Free in USA 800-356-9526 · 608-274-4330 · Fax 608-277-2516TMD047 · Revised 8/22 www.promega.com
9.L. Analysis with a Virtual Standard Curve (continued)
Importing the PowerQuant® Results Excel® File for Analysis with a Virtual Standard Curve
The ‘Import’ tab of the PowerQuant® Analysis Software is used to process qPCR data generated with the PowerQuant® System (See Section 9.I for additional information about importing the PowerQuant® Results® Excel file).
The PowerQuant® Analysis Software does not store analyzed sample data. Analyzed data must be saved as an Excel® workbook or as a .pdf file.
Successful analysis requires the inclusion of sample names in the PowerQuant® Results Excel® file exported from the instrument software, as well as the designation of a Sample Type for all used sample positions in the PowerQuant® Analysis Software Plate Map (see Section 9.H).
1. Use the drop-down menus to make the following selections: data file source; sample assessment, standard curve assessment and normalization settings; and plate map (Figure 92). See Section 9.G for information about settings and Section 9.H for information about plate maps.
Note: Select the plate map saved in Step 8 of “Creating a Plate Map for Use with a Virtual Standard Curve”.
Figure 92. Menu options for a virtual standard curve on the ‘Import’ tab.
2. Select the Import icon. A dialog box labeled “Make Sure You Have Saved Your Work Before Proceeding” will appear. Select No to abort the import, or Yes to clear the form.
3. Use the file explorer to navigate to the file of interest, select the file and select Open.
4. When the import is complete, multiple worksheets are created. The software displays the Settings worksheet.
5. After file import, select a virtual standard curve from the ‘Virtual Curves’ drop-down menu.
6. Select the Apply Curve icon (Figure 93). Note: Analysis is not complete until the virtual standard curve is applied. Once the file is imported, the Import icon
is renamed Open Import File.
Figure 93. The Apply Curve icon in the ‘Import’ tab.
1552
4TA
1567
6CA

Promega Corporation · 2800 Woods Hollow Road · Madison, WI 53711-5399 USA · Toll Free in USA 800-356-9526 · 608-274-4330 · Fax 608-277-2516www.promega.com TMD047 · Revised 8/22
115
7. Select Yes in the ‘Apply Confirmation’ dialog box.
8. The report worksheets are populated with data from calculations performed with the virtual standard curve.
9. See Section 9.I for additional information about saving and/or printing the analysis worksheets.
PowerQuant® Software Export File
When a virtual standard curve is used to calculate sample concentration, the PowerQuant® Analysis Software creates the same worksheets described in Section 9.J.
The Settings worksheet displays the minimum and maximum acceptable concentration values of the calibrators when a virtual standard curve is used (Figure 94).
Figure 94. Calibrator assessment settings on the Settings worksheet.
The Std Curve, Table Results and Averages Table worksheets display some additional information when a virtual standard curve is used to determine sample concentration. The standard curve source selected during data import is displayed above the standard curve parameters. The Calibrator Data and Analysis section displays the concentration of the calibrators entered on the plate map, the Cq values, the calculated concentration and comparison to the acceptable min and max concentration (Figure 95).
These values should be determined experimentally as part of internal validation studies and should be evaluated in accordance with a laboratory’s standard operating procedures.
Figure 95. The Calibrator Data and Analysis Section of the Std Curve worksheet.
When analysis is performed with a virtual standard curve, no values are displayed in the columns for Closest IPC, IPC Shift and IPC Threshold Result on the Table Results worksheet and the Averages Table worksheet.
1571
4CA
1571
5CA

116 Promega Corporation · 2800 Woods Hollow Road · Madison, WI 53711-5399 USA · Toll Free in USA 800-356-9526 · 608-274-4330 · Fax 608-277-2516TMD047 · Revised 8/22 www.promega.com
10. Interpretation of PowerQuant® Data
In addition to the concentrations of autosomal and male DNA used to normalize DNA samples for STR amplification, the PowerQuant® System yields information that can be used to evaluate amplification performance, detect PCR inhibitors in the amplification reaction, detect the presence of male and female DNA mixtures and evaluate the degree of DNA degradation.Note: [Auto]/[Y] and [Auto]/[Deg] ratios may not be reliable in samples with low DNA concentrations (i.e., less than 1pg/µl) due to stochastic effects.
The 7500 Applied Biosystems® Real-Time PCR System Software, QuantStudio® Design and Analysis Software (see Section 6.C, 7.C and 8.D) and the PowerQuant® Analysis Software (see Section 9) perform a linear regression to the standard dilution series data and calculate the equation for the line of best fit (the standard curve). The equation is in the form of y = mx + b, where x = log concentration and y = Cq. The R2 value is a measure of the fit of the data points to the regressed line. The slope (m in the equation) is an indication of the PCR efficiency. A slope of –3.3 indicates 100% PCR efficiency (i.e., the number of copies of amplification product is doubled at each cycle). The Y-intercept (b in the equation) is defined as the y value (Cq) when x (log concentration) equals 0. Therefore, b corresponds to the Cq value for a sample with a concentration of 1ng/μl [log10(1) = 0].
In general, the standard curve for each target (autosomal, Y and degradation) has an average slope (m) in the range of –3.1 to –3.6 and an R² value >0.990. See Section 11 for more information about troubleshooting standard curves that fall out of these ranges. We recommend tracking and evaluating Y-intercept values for any significant changes from run to run.
10.A. Internal PCR Control
Amplification performance for the IPC can be used to evaluate overall performance of a PowerQuant® amplification reaction or detect PCR inhibitors in the DNA sample. IPC data analyzed using the PowerQuant® Analysis Software can be interpreted as follows:
• If a sample yields no detectable amplification for the autosomal, Y and degradation targets but has an IPC amplification curve that crossed the amplification threshold without an IPC shift greater than that specified in the ‘Sample Assessment’ tab, then the absence of a quantification result is not likely due to PCR inhibition, but rather insufficient amplifiable human DNA.
• If a sample has an IPC Shift value greater than the value specified in the Sample Assessment tab, or if the Cq value for the IPC is undetermined (regardless of detectable amplification for the autosomal, Y and degradation quantification targets), then this indicates that a PCR inhibitor may be present in the amplification reaction. Repeat the DNA purification if necessary.
• If a sample has an IPC Shift value greater than the value specified in the ‘Sample Assessment’ tab and the [Auto]/[Deg] ratio is less than the ratio specified on the ‘Sample Assessment’ tab, then the sample likely contains a PCR inhibitor but the DNA is not likely to be degraded. Repeat the DNA purification if necessary.
• If a sample has an IPC Shift value greater than the value specified in the ‘Sample Assessment’ tab and the [Auto]/[Deg] ratio is greater than the ratio specified on the ‘Sample Assessment’ tab, then the sample likely contains a PCR inhibitor and the DNA is possibly degraded. Repeat the DNA purification if necessary.
Note: The IPC is the longest target in the PowerQuant® System and therefore is more susceptible to inhibition relative to the shorter autosomal and Y targets. The degradation target is long, and amplification performance also may be affected by inhibitors.

Promega Corporation · 2800 Woods Hollow Road · Madison, WI 53711-5399 USA · Toll Free in USA 800-356-9526 · 608-274-4330 · Fax 608-277-2516www.promega.com TMD047 · Revised 8/22
117
10.B. [Auto]/[Y] Ratio
The [Auto]/[Y] ratio can be used to evaluate whether a sample includes a male/female DNA mixture. The results from the [Auto]/[Y] calculations performed by the PowerQuant® Analysis Software may be interpreted as follows:
• If the message “No Y Cq” is displayed for a sample, then no male DNA was detected.
• If a sample has an [Auto]/[Y] ratio less than the value specified in the ‘Sample Assessment’ tab, then the sample may contain male DNA only or low levels of female DNA.
• If a sample has an [Auto]/[Y] ratio greater than the value specified in the ‘Sample Assessment’ tab, then the sample contains a possible mixture of male and female DNA.
10.C. [Auto]/[Deg] Ratio
The [Auto]/[Deg] ratio can be used to evaluate whether a DNA sample was degraded. The results from the [Auto]/[Deg] calculations performed by the PowerQuant® Analysis Software may be interpreted as follows:
• If a sample has an [Auto]/[Deg] ratio less than the value specified in the ‘Sample Assessment’ tab, then the DNA in the sample is not likely degraded, regardless of the value in the IPC Shift column.
• If a sample has an [Auto]/[Deg] ratio greater than the value specified in the ‘Sample Assessment’ tab and the value for the IPC Shift is less than the value specified in the ‘Sample Assessment’ tab, then the DNA in the sample is likely degraded but the sample does not contain PCR inhibitors.
• If a sample has an [Auto]/[Deg] ratio and IPC Shift value greater than the values specified in the ‘Sample Assessment’ tab, then this sample is likely to contain PCR inhibitors and may or may not contain degraded DNA.
• If the message “No Deg Cq” is displayed for a sample and the IPC Shift value is less than the value specified in the ‘Sample Assessment’ tab, then the DNA in the sample is likely severely degraded but the sample does not contain PCR inhibitors.
• If the message “No Deg Cq” is displayed for a sample and the IPC Shift value is greater than the value specified in the ‘Sample Assessment’ tab, then the sample likely contains PCR inhibitors and the DNA may be degraded.

118 Promega Corporation · 2800 Woods Hollow Road · Madison, WI 53711-5399 USA · Toll Free in USA 800-356-9526 · 608-274-4330 · Fax 608-277-2516TMD047 · Revised 8/22 www.promega.com
11. Troubleshooting
For questions not addressed here, please contact your local Promega Branch Office or Distributor. Contact information available at: www.promega.com E-mail: [email protected]
11.A. The PowerQuant® System
Symptoms Causes and CommentsCustom dye calibration failed Prepare new standard calibration plate(s), and recalibrate as
described in Section 4.Flat amplification curves and no Cq values An amplification inhibitor was present in the DNA template. detected for any of the targets, including the Dilute the template DNA, and requantify using 2µl of the diluted IPC, for a subset of samples in the 96-well plate template. Repeat the DNA purification if necessary. Verify that reaction mix was added to the failed amplification
reactions. Examine the volume of liquid in each well of the reaction plate to
verify that evaporation did not occur during cycling. Ensure that all wells were adequately sealed to prevent evaporation during thermal cycling.
Flat amplification curves and no Cq values detected for Verify that the thermal cycler was programmed correctly (see any of the targets, including the IPC, for all samples Section 6, 7 or 8). in the 96-well plate
The PowerQuant® 2X Master Mix lost activity, or the PowerQuant® 20X Primer/Probe/IPC mix was degraded. Minimize the number of freeze-thaw cycles. Store the PowerQuant® 20X Primer/Probe/IPC Mix protected from light. From the Experiment menu in the Applied Biosystems® 7500
software, select the Analysis section, and then select the Multicomponent Plot to determine if fluorescence was detected for any of the system dyes, including the passive reference dye. If no fluorescence was detected, check to be sure that the PowerQuant® 20X Primer/Probe/IPC Mix was added to the amplification reactions.
Nonlinear standard curve (R2 values less than 0.98) Be sure that the PowerQuant® Male gDNA Standard was thawed or slope outside of the specified range completely and well mixed prior to use. Store the DNA standard at
4°C overnight prior to use to improve sampling consistency. Be sure that each dilution of the PowerQuant® Male gDNA
Standard was well mixed before removing an aliquot for the next serial dilution. Use the same pipette to dispense each aliquot. Change the pipette tip between each dilution step. Change the pipette tip between each addition of DNA standard to the 96-well plate.

Promega Corporation · 2800 Woods Hollow Road · Madison, WI 53711-5399 USA · Toll Free in USA 800-356-9526 · 608-274-4330 · Fax 608-277-2516www.promega.com TMD047 · Revised 8/22
119
Symptoms Causes and Comments
Nonlinear standard curve (R2 values less than 0.98) Calibrate pipettes to minimize variability when pipetting. or slope outside of specified range (continued) Amplify each DNA standard in duplicate to minimize the effects
of variation on the standard curve.
An error was made during dilution of the PowerQuant® Male gDNA Standard. Verify all calculations, and repeat the dilution.
Avoid pipetting volumes less than 1µl.
Incorrect DNA concentrations were entered into the Applied Biosystems® 7500 Real-Time PCR System Software or the QuantStudio™ Design and Analysis Software. Verify that all DNA standard concentrations were entered correctly.
Ensure that the correct passive reference was selected (e.g., CXR or ROX™ dye).
Examine the volume of liquid in each well of the reaction plate to verify that evaporation did not occur during cycling. Ensure that all wells were adequately sealed to prevent evaporation during thermal cycling.
Analysis settings in the Applied Biosystems® 7500 Real-Time PCR System Software or the QuantStudio™ Design and Analysis Software were not set correctly. Verify that the analysis settings were set as described in Section 6, 7 or 8.
Discrepancy in the well location of standards between the plate and sample map. Verify that the standard wells were identified correctly in the sample map.
Inconsistency between replicates of Examine the volume of liquid in each well of the reaction plate to the same DNA sample verify that evaporation did not occur during cycling. Evaporation of
the reaction mix affects amplification of the degradation and IPC targets (late Cq values).
DNA concentration was low. Differences in amplification results for replicate samples with low levels of DNA template can be due to stochastic effects.
DNA detected in no-template controls Detection of >1.0pg per 2µl input volume DNA in the no-template controls can indicate the presence of contaminating DNA. Refer to Section 3 for guidelines to prevent DNA contamination.
ΔRn of amplification plots (ΔRn vs Cycle) not Ensure that a passive reference is selected (e.g., CXR or ROX™ normalized (greater than 1,000) with poor dye). standard curves
Noisy amplification plots with no distinct Wells with no reaction mix were analyzed. Be sure that only wells amplification curve and no IPC amplification that contain amplification reactions are highlighted and analyzed plots detected in Section 6, 7 or 8.

120 Promega Corporation · 2800 Woods Hollow Road · Madison, WI 53711-5399 USA · Toll Free in USA 800-356-9526 · 608-274-4330 · Fax 608-277-2516TMD047 · Revised 8/22 www.promega.com
11.B. The PowerQuant® Analysis Software
Symptoms Causes and CommentsInstallation
Software download hangs, is terminated before Slow internet connection or internet service interruption. Attempt finishing, or is corrupted a new download. If the problem persists, contact Promega
Technical Services.“Access restricted” warning during installation Local computer permission not granted. Contact your IT/IS
department to grant administrator access to the user profile in which you are attempting to install the software.
Problem installing MS .NET framework 4.8 Contact your IT/IS department for support, or see: https://support.microsoft.com/en-us
Selecting Promega PowerQuant® Assays in the Start Installation completed by a non-administrator user. Contact your Menu results in operating system looking for the IT/IS department to install the software with an administrator software installer, or software fails to launch account.Functionality
Wrong threshold comparisons made Incorrect selections made in the plate map in the Promega PowerQuant Plate Designer or in the ‘Import’ tab. • Confirm that the Sample Type is set correctly in the plate map. • Confirm that the correct Plate Map is selected during import. • Confirm selections made for the thresholds in the ‘PowerQuant Administrative Tools’ window.
User AccessMissing or forgotten password Incorrect user permissions. Log in as PQAdmin and replace the
original user’s password or delete and recreate the user profile. Contact Promega Technical Services for additional assistance.
Read-only access granted Incorrect user permissions. To attempt the login again, close the ‘PowerQuant Administrative Tools’ window. Select the ‘Configuration Tools’ tab, then select the Configuration Settings icon and low the instructions for an Admin user login.
Incorrect password entered. To attempt the login again, close the ‘PowerQuant Administrative Tools’ window. Select the ‘Configuration Tools’ tab, then select the Configuration Settings icon and follow the instructions for an Admin user login.
Design Parameters will not launch Promega.Administrator.Toolz.exe was removed from the Promega\PowerQuant install folder. Uninstall and reinstall the
PowerQuant® Analysis Software (see Section 9.D and 9.C).
Plate Designer will not launch PowerQuant.Plate.Designer.exe was removed from the Promega\PowerQuant install folder. Uninstall and reinstall PowerQuant® Analysis Software.

Promega Corporation · 2800 Woods Hollow Road · Madison, WI 53711-5399 USA · Toll Free in USA 800-356-9526 · 608-274-4330 · Fax 608-277-2516www.promega.com TMD047 · Revised 8/22
121
Symptoms Causes and CommentsDesign Parameters
Unable to create, edit or save Configuration Incorrect user permissions. Close the ‘PowerQuant Administrative Settings Tools’ window and log in with an administrator account.
Error message occurs on attempted save of PowerQuant® Analysis Software database missing or Configuration Settings or a plate map in the corrupted. Contact Promega Technical Services. Promega PowerQuant Plate Designer
Save/Delete/New icons grayed out or disabled Read-only access permission granted to user. Close the in the tabs of the ‘PowerQuant Administrative ‘PowerQuant Administrative Tools’ window and log in with an Tools’ window administrator account.
Dye set name does not appear in the ‘Dye Sets’ Confirm that the dye set was saved in ‘Dye Set Names’ tab of the drop-down menu in the Promega PowerQuant ‘PowerQuant Administrative Tools’ window. Close the ‘Promega Plate Designer PowerQuant Plate Designer’ window and log in with an
administrator account.
Drop-down menus are empty in the ‘Configuration Read-only access permission granted to user. Close the Design Settings’ tab Parameters window and log in with an administrator account.
Drop-down menus are empty in the Import tab of the Missing or corrupted database. Contact Promega Technical software and/or the PowerQuant Plate Designer Services.
Unexpected results from the Standard Curve samples Error in setting up the Plate. • Confirm the correct Sample Type is selected for all used wells in the plate map using the Promega PowerQuant Plate Designer. • Confirm that the correct values were entered for Sample Concentration section of the PowerQuant Plate Designer. • Confirm that the CT Settings are set correctly in the instrument software. See Sections 6.A, 7.A or 8.B for additional information. • Confirm the plate map has the correct Standard Curve Type selected in the Promega PowerQuant Plate Designer. • Confirm that the correct Plate Map is selected during import. • If a virtual standard curve is used, confirm that the curve is applied to the completed analysis.
Help Tab
Help videos will not launch Missing software components. • Confirm that Windows Media Player is installed on the computer. • DesigningHelp.wmv, ImportingHelp.wmv or PlateMapsHelps.wmv was removed from the Promega\PowerQuant install folder. Uninstall and reinstall the PowerQuant® Analysis Software.
Technical Manual will not open from software button No internet connection. The PowerQuant® System Technical Manual #TMD047 is available online at: www.promega.com

122 Promega Corporation · 2800 Woods Hollow Road · Madison, WI 53711-5399 USA · Toll Free in USA 800-356-9526 · 608-274-4330 · Fax 608-277-2516TMD047 · Revised 8/22 www.promega.com
11.B. The PowerQuant® Analysis Software (continued)Symptoms Causes and CommentsSystem Errors
Message: “Could Not Find a Base Path” The database is missing from the Promega\PowerQuant folder. Contact Promega Technical Services. E-mail: [email protected] Error: System.IO.FileNotFoundException One or more required files for the PowerQuant® Analysis Software are missing. • Uninstall and reinstall the PowerQuant® Analysis Software. • Contact Promega Technical Services. E-mail: [email protected]
ImportException Error: Error opening file File in use by another program. Confirm that the file to be
imported is not open in another program. Inside the error message, the text will include “because it is being used by another process”.
Message: “Unrecognized File Extension” or Wrong or unexpected file type. “File Retrieve Abandoned” • Confirm that the correct export file type is selected in the qPCR software (.txt, .csv, .xls, .xlsx) when exporting the qPCR results file. • Confirm that the correct column export options are chosen from the qPCR software. • Confirm that the correct DataFile Source is selected in the ‘Import’ tab.
File does not import Wrong or unexpected file type. • Confirm that the correct export file type is selected in the qPCR software (.txt, .csv, .xls, .xlsx) when exporting the qPCR results file. • Confirm that the correct column export options are chosen from the qPCR software. • Confirm that the correct DataFile Source is selected in the ‘Import’ tab.
No sample concentration is calculated Error in sample type or plate map parameters. • Confirm that the correct Sample Type is selected in the plate map using the Promega PowerQuant Plate Designer. • Confirm that the plate map has the correct Standard Curve Type selected in the Promega PowerQuant Plate Designer. • Confirm that the correct Plate Map is selected during import. • If a virtual standard curve is used, confirm that the curve is applied to the completed analysis.For support of other instruments with similar fluorescent dye capabilities, contact Promega Technical Services for more information. E-mail: [email protected]

Promega Corporation · 2800 Woods Hollow Road · Madison, WI 53711-5399 USA · Toll Free in USA 800-356-9526 · 608-274-4330 · Fax 608-277-2516www.promega.com TMD047 · Revised 8/22
123
12. Appendix
12.A. References1. Holland, P.M. et al. (1991) Detection of specific polymerase chain reaction product by utilizing the 5´→3´ exonuclease
activity of Thermus aquaticus DNA polymerase. Proc. Natl. Acad. Sci. USA 88, 7276–80.2. Hudlow, W.R. et al. (2008) A quadruplex real-time qPCR assay for the simultaneous assessment of total human
DNA, human male DNA, DNA degradation and the presence of PCR inhibitors in forensic samples: A diagnostic tool for STR typing. Forensic Sci. Int. Genet. 2, 108–25.
3. Bustin, S.A. et al. (2009) The MIQE guidelines: Minimum information for publication of quantitative real-time PCR experiments. Clin. Chem. 55, 611–22.
12.B. Spectral Calibration Results
Figure 96. Example dye calibration results for the PowerQuant® System on the Applied Biosystems® 7500 Real-Time PCR System. See Sections 4.B and 4.C for instrument calibration instructions.
1568
5CA
Nor
mal
ized
Flu
ores
cenc
e
Filter
Nor
mal
ized
Flu
ores
cenc
e
Filter
Nor
mal
ized
Flu
ores
cenc
e
Filter
Nor
mal
ized
Flu
ores
cenc
e
Filter
Nor
mal
ized
Flu
ores
cenc
e
Filter
Analysis Data Analysis Data
Analysis Data Analysis Data Analysis Data

124 Promega Corporation · 2800 Woods Hollow Road · Madison, WI 53711-5399 USA · Toll Free in USA 800-356-9526 · 608-274-4330 · Fax 608-277-2516TMD047 · Revised 8/22 www.promega.com
12.B. Spectral Calibration Results (continued)
Figure 97. Example dye calibration results for the PowerQuant® System on the QuantStudio™ 5 Real-Time PCR System. See Section 4.D for instrument calibration instructions.
12.C. Preparation of Alternative Standard Curves
Although we recommend performing a four-point standard curve, you also can prepare standard curves with additional points. See Tables 3–5 for the recommended dilution schemes for the PowerQuant® Male gDNA Standard to prepare five-point, six-point and seven-point standard curves.
Table 3. Preparation of a 5-Point Standard Curve (Tenfold Dilutions).
DNA Concentration Volume of PowerQuant® Male gDNA StandardVolume of PowerQuant® Dilution
Buffer
50ng/µl Use undiluted PowerQuant® Male gDNA Standard 0µl
5ng/µl 10µl of undiluted PowerQuant® Male gDNA Standard 90µl
0.5ng/µl 10µl of 5ng/µl dilution 90µl
0.05ng/µl 10µl of 0.5ng/µl dilution 90ul
0.005ng/µl 10µl of 0.05ng/µl dilution 90µl
1568
6CA
Filter
Dye PQ CXR
No
rma
liz
ed
Flu
ore
sc
en
ce
x5-m6x5-m5x4-m6x4-m5x4-m4x3-m6x3-m5x3-m4x3-m3x2-m6x2-m5x2-m4x2-m3x2-m2x1-m6x1-m5x1-m4x1-m3x1-m2x1-m1 x6-m6
1.0
0.8
0.6
0.4
0.2
0.0
Filter
Dye PQ Q670
No
rma
liz
ed
Flu
ore
sc
en
ce
x5-m6x5-m5x4-m6x4-m5x4-m4x3-m6x3-m5x3-m4x3-m3x2-m6x2-m5x2-m4x2-m3x2-m2x1-m6x1-m5x1-m4x1-m3x1-m2x1-m1 x6-m6
1.0
0.8
0.6
0.4
0.2
0.0
Filter
Dye PQ TMR
No
rma
liz
ed
Flu
ore
sc
en
ce
x5-m6x5-m5x4-m6x4-m5x4-m4x3-m6x3-m5x3-m4x3-m3x2-m6x2-m5x2-m4x2-m3x2-m2x1-m6x1-m5x1-m4x1-m3x1-m2x1-m1 x6-m6
1.0
0.8
0.6
0.4
0.2
0.0
Filter
Dye PQ CFG540
No
rma
liz
ed
Flu
ore
sc
en
ce
x5-m6x5-m5x4-m6x4-m5x4-m4x3-m6x3-m5x3-m4x3-m3x2-m6x2-m5x2-m4x2-m3x2-m2x1-m6x1-m5x1-m4x1-m3x1-m2x1-m1 x6-m6
1.0
0.8
0.6
0.4
0.2
0.0
Filter
Dye PQ FAM
No
rma
liz
ed
Flu
ore
sc
en
ce
x5-m6x5-m5x4-m6x4-m5x4-m4x3-m6x3-m5x3-m4x3-m3x2-m6x2-m5x2-m4x2-m3x2-m2x1-m6x1-m5x1-m4x1-m3x1-m2x1-m1 x6-m6
1.0
0.8
0.6
0.4
0.2
0.0

Promega Corporation · 2800 Woods Hollow Road · Madison, WI 53711-5399 USA · Toll Free in USA 800-356-9526 · 608-274-4330 · Fax 608-277-2516www.promega.com TMD047 · Revised 8/22
125
Table 4. Preparation of a 6-Point Standard Curve (Eightfold Dilutions).
DNA Concentration Volume of PowerQuant® Male gDNA StandardVolume of PowerQuant® Dilution
Buffer
50ng/µl Use undiluted PowerQuant® Male gDNA Standard 0µl
6.25ng/µl 10µl of undiluted PowerQuant® Male gDNA Standard 70µl
0.781ng/µl 10µl of 6.25ng/µl dilution 70µl
0.0977ng/µl 10µl of 0.781ng/µl dilution 70µl
0.0122ng/µl 10µl of 0.0977ng/µl dilution 70µl
0.0015ng/µl 10µl of 0.0122ng/µl dilution 70µl
Table 5. Preparation of a 7-Point Standard Curve (Fivefold Dilutions).
DNA Concentration Volume of PowerQuant® Male gDNA StandardVolume of PowerQuant® Dilution
Buffer
50ng/µl Use undiluted PowerQuant® Male gDNA Standard 0µl
10ng/µl 10µl of undiluted PowerQuant® Male gDNA Standard 40µl
2ng/µl 10µl of 10ng/µl dilution 40µl
0.4ng/µl 10µl of 2ng/µl dilution 40µl
0.08ng/µl 10µl of 0.4ng/µl dilution 40µl
0.016ng/µl 10µl of 0.08ng/µl dilution 40µl
0.0032ng/µl 10µl of 0.016ng/µl dilution 40µl

126 Promega Corporation · 2800 Woods Hollow Road · Madison, WI 53711-5399 USA · Toll Free in USA 800-356-9526 · 608-274-4330 · Fax 608-277-2516TMD047 · Revised 8/22 www.promega.com
12.D. Using the PowerQuant® Analysis Tool
The PowerQuant® Analysis Tool is a Microsoft Excel® macro-enabled template. The template initially contains two visible worksheet tabs: Home and Admin Settings. The Home worksheet includes the version number and directions to save the template. The Admin Settings worksheet includes sections to define parameters used in calculations by the PowerQuant® Analysis Tool and sections to define values for evaluating or calculating the following:
• standard curves (acceptable R² and slope values)
• sample quality (possible inhibition, mixture or degradation)
• DNA normalization for autosomal or Y-STR amplification based on DNA target mass, pipetting volumes and diluent volumes
• samples that may need additional attention based on the user-defined normalization parameters
Once the Results Excel® file is exported from the Applied Biosystems® 7500 Software (Version 2.0.6 or HID Version 1.1 or 1.2) and imported into the PowerQuant® Analysis Tool, the tool calculates the [Auto]/[Y] and [Auto]/[Deg] ratios along with the difference in Cq values (ΔCq) for the IPC in an unknown sample and the IPC in the closest DNA standard of the standard curve (to monitor PCR inhibition). In addition, this tool performs calculations for normalizing the input amounts of DNA based on the autosomal or Y target quantification values.Notes:1. Cq value (quantification cycle) is used rather than CT (cycle threshold) as per MIQE guidelines (3).2. The PowerQuant® Analysis Tool requires the inclusion of sample names in the Results Excel® file exported from the
Applied Biosystems® 7500 Software for these calculations.3. Use of the PowerQuant® Analysis Software rather than the PowerQuant® Analysis Tool is recommended for data files
exported from the QuantStudio™ Design and Analysis Software.4. In this section, references are made to both [Auto]/[Deg] and [Auto]/[D]. [Auto]/[D] is used in reference to the names
of the column headers in the analysis tool.
The PowerQuant® Analysis Tool can be downloaded free of charge from the Promega web site at: www.promega.com/resources/tools/powerquant-analysis-tool/
All worksheets, except for the Results worksheet, are locked and password-protected. The Results worksheet is unlocked and sortable.
A password is required to change values within the Admin Settings worksheet. The default password is “Admin”. For instructions to change the password, see Section 12.E.Note: You may print data from each worksheet.
1. Navigate to the downloaded PowerQuant® Analysis Tool, and select the icon. Note: Opening the Microsoft Excel® software first then opening the PowerQuant® Analysis Tool allows the
PowerQuant® Analysis Tool template to be modified and overwritten. If this occurs inadvertently, download a new copy of the PowerQuant® Analysis Tool from the Promega web site. The template will not be overwritten if the PowerQuant® Analysis Tool is opened directly without first opening the Excel® software.

Promega Corporation · 2800 Woods Hollow Road · Madison, WI 53711-5399 USA · Toll Free in USA 800-356-9526 · 608-274-4330 · Fax 608-277-2516www.promega.com TMD047 · Revised 8/22
127
2. Depending on the computer’s security settings, a “Security Warning Macros have been disabled” message may appear the first time the PowerQuant® Analysis Tool is opened on the computer. If this message appears, select the Enable Content button at the top of the screen to enable macros.
3. If the question “Do you want to make this a trusted document?” appears, select Yes.
4. The Home worksheet will appear (Figure 98). Select the Admin Settings worksheet at the bottom of the screen.
Figure 98. The Home worksheet.
1286
4TA

128 Promega Corporation · 2800 Woods Hollow Road · Madison, WI 53711-5399 USA · Toll Free in USA 800-356-9526 · 608-274-4330 · Fax 608-277-2516TMD047 · Revised 8/22 www.promega.com
12.D. Using the PowerQuant® Analysis Tool (continued)
5. The Admin Settings worksheet will appear (Figure 99). The default value for each parameter is shown. These values are based on the results of testing during product development. You may need to change these values based on the results of your laboratory’s internal validation.
A password is required to change values within the Admin Settings worksheet. To change a parameter, double-click on the cell. You will be prompted to enter the password (Figure 100). Notes: 1. See Step 7 for a description of each parameter. 2. For instructions to change the password, see Section 12.E.
Figure 99. The Admin Settings worksheet.
1286
5TA
1285
7TA

Promega Corporation · 2800 Woods Hollow Road · Madison, WI 53711-5399 USA · Toll Free in USA 800-356-9526 · 608-274-4330 · Fax 608-277-2516www.promega.com TMD047 · Revised 8/22
129
12.D. Using the PowerQuant® Analysis Tool (continued)
5. The Admin Settings worksheet will appear (Figure 99). The default value for each parameter is shown. These values are based on the results of testing during product development. You may need to change these values based on the results of your laboratory’s internal validation.
A password is required to change values within the Admin Settings worksheet. To change a parameter, double-click on the cell. You will be prompted to enter the password (Figure 100). Notes: 1. See Step 7 for a description of each parameter. 2. For instructions to change the password, see Section 12.E.
Figure 99. The Admin Settings worksheet.
1286
5TA
1285
7TA
Figure 100. The Admin Settings password window. 6. Enter the appropriate password, and select OK. Note: The default password is “Admin”.
7. Type the new value for that cell. To change other parameters in the Admin Settings worksheet, highlight the appropriate cell and type the new value. You can define values for parameters in each of the following sections:
Target Name: In the Target Name column, enter the target name for each of the amplification targets in the Applied Biosystems® 7500 Real-Time PCR System software (see Section 6.A or 7.A). This name must be identical to the name of the amplification target in the Excel® file exported from the Applied Biosystems® 7500 Real-Time PCR System. If the target names in the export file and the Admin Settings worksheet do not match, no data will appear for that amplification target in the PowerQuant® Analysis Tool.
Standard Curve Assessment: Specify the minimum passing R² value that is acceptable to your laboratory for the standard curve for each quantification target (autosomal, Y and degradation). The software will flag a standard curve with an R² value that falls below the minimum passing value. Specify the upper and lower limits that are acceptable for the slope of the standard curve for each quantification target. The PowerQuant® Analysis Tool will flag any standard curve with slope values outside of the upper and lower limits.
Sample Assessment: In the Possible inhibitor field, specify the minimum IPC shift value at which you may expect to encounter PCR inhibition. The IPC shift is the calculated difference in Cq values for the IPC in an unknown sample and the IPC of the closest DNA concentration in the standard curve.
In the Possible Male/Female Mixture and Possible degraded sample fields, specify the minimum [Auto]/[Y] and [Auto]/[Deg] ratios that are indicative of a potential male/female mixture or degraded DNA sample, respectively.
These values should be determined experimentally as part of internal validation studies. The PowerQuant® Analysis Tool will flag any DNA sample that has values that exceed the values entered for these parameters.

130 Promega Corporation · 2800 Woods Hollow Road · Madison, WI 53711-5399 USA · Toll Free in USA 800-356-9526 · 608-274-4330 · Fax 608-277-2516TMD047 · Revised 8/22 www.promega.com
12.D. Using the PowerQuant® Analysis Tool (continued)
Normalization: In the Max Dilution Volume (µl) field, specify the largest volume of diluent that you can add to a concentrated DNA sample to try to achieve the desired final DNA concentration (e.g., the maximum tube volume or maximum well volume on a 96-well plate).
The PowerQuant® Analysis Tool will flag DNA samples that require additional attention for normalization based on the normalization parameters defined in the Admin Settings worksheet. Choose a character (e.g., !,^,*) to be used as a flag for each of the parameters listed below, and enter that character in the appropriate symbol field.
This flag will indicate that the sample exceeds the indicated specifications.
• The Above Max Dilution Volume Symbol indicates that a volume greater than the specified Max Dilution Volume is required to dilute the specified volume of DNA sample to the desired final DNA concentration.
• The Below Min Volume Symbol indicates that the DNA sample volume is less than the minimum volume to pipet based on the specified dilution volume. This symbol also indicates that the volume of diluent you need to add is less than the Min Pipetting Volume (µl) specified on the Admin sheet.
• The Below DNA Target Mass Symbol indicates that the DNA concentration determined using the autosomal or Y target (for the Autosomal or Y Normalization worksheets, respectively) is too low to achieve the specified target DNA mass (in ng), even when using the maximum volume of DNA sample.
Normalization for Autosomal STR: The PowerQuant® Analysis Tool uses the values defined in this section and the autosomal DNA concentration for a DNA sample to determine the volume of undiluted DNA required to achieve the target mass in an autosomal STR amplification reaction. If a DNA sample is too concentrated, the user-defined values are used to calculate the sample dilution needed to achieve the target mass of DNA. The software will flag any sample that does not reach the target mass of DNA based on the maximum sample volume.
In the Min Pipetting Volume (µl) field, specify the minimum volume of undiluted DNA sample that can be added to the autosomal STR amplification reaction. This field also indicates the minimum volume of diluent that you can use before the Below Min Volume Symbol appears. This volume is used to determine the volume of sample to add to the reaction after dilution if a dilution step is necessary to reach the desired target mass of DNA to be amplified.
In the Max Sample Volume (µl) field, specify the maximum volume of undiluted DNA sample that can be added to the autosomal STR amplification reaction. This volume is used to calculate Diluent to Add to Reaction (µl) for a DNA sample that does not require dilution prior to autosomal STR amplification reaction assembly as well as Filler Diluent to Add to Reaction (µl) for a sample that does require dilution.
In the DNA per reaction (ng) field, specify the desired mass (in ng) of DNA to be amplified.

Promega Corporation · 2800 Woods Hollow Road · Madison, WI 53711-5399 USA · Toll Free in USA 800-356-9526 · 608-274-4330 · Fax 608-277-2516www.promega.com TMD047 · Revised 8/22
131
Normalization for Y-STR: The PowerQuant® Analysis Tool uses the values defined in this section and the male DNA concentration (Y target) for a DNA sample to determine the volume of undiluted DNA required to achieve the target mass in a Y-STR amplification reaction. If a DNA sample is too concentrated, the user-defined values are used to calculate the sample dilution needed to achieve the target mass of DNA. The software will flag any sample that does not reach the target mass of DNA based on the maximum sample volume.
In the Min Pipetting Volume (µl) field, specify the minimum volume of undiluted DNA sample that can be added to the Y-STR amplification reaction. This field also indicates the minimum volume of diluent that you can use before the Below Min Volume Symbol appears. This volume is used to determine the volume of sample to add to the reaction after dilution if a dilution is necessary to reach the desired target mass of DNA to be amplified.
In the Max Sample Volume (µl) field, specify the maximum volume of undiluted DNA sample that can be added to the Y-STR amplification reaction. This volume also is used to calculate Diluent to Add to Reaction (µl) for a DNA sample that does not require dilution prior to Y-STR amplification reaction assembly as well as Filler Diluent to Add to Reaction (µl) for a sample that does require dilution.
In the DNA per reaction (ng) field, specify the desired mass (in ng) of DNA to be amplified. Note: To save any changes made to the Admin Settings parameters, save a copy of the PowerQuant® Analysis Tool
as an Excel® macro-enabled template (.xltm file). This template can be saved as a read only file to prevent others from making changes to the template.
8. Return to the Home worksheet, and select the Import Data button.
9. Browse to the .xls file exported from the Applied Biosystems® 7500 Real-Time PCR System software in Section 6.D or 7.D, highlight the file and select OK.
The following new worksheets are created, with tabs for each worksheet at the bottom of the template.
Standards: The Standards worksheet displays the standard curve results for each target (e.g., R2 value, slope, Y-intercept and efficiency) and indicates whether the R2 value and slope meet the criteria defined on the Admin Settings worksheet. If the R2 value is at or above the R2 threshold set on the Admin Settings worksheet, the PowerQuant® Analysis Tool displays “At or Above”. If the R2 value falls below the R2 threshold, the PowerQuant® Analysis Tool displays “Below”. If the slope is within the range set on the Admin Settings worksheet, the PowerQuant® Analysis Tool displays “Within”. If the slope is outside of this range, the PowerQuant® Analysis Tool displays “Outside”. The R2 value and slope values also are displayed. This worksheet includes a table with the observed Cq value for each target at each DNA standard concentration on the standard curve (Figure 101). This worksheet also includes the Threshold set from Admin sheet table. For more information about how the slope and R2 value can be used to evaluate the standard curve, see Section 10.

132 Promega Corporation · 2800 Woods Hollow Road · Madison, WI 53711-5399 USA · Toll Free in USA 800-356-9526 · 608-274-4330 · Fax 608-277-2516TMD047 · Revised 8/22 www.promega.com
12.D. Using the PowerQuant® Analysis Tool (continued)
Figure 101. The Standards worksheet.
1286
6TA

Promega Corporation · 2800 Woods Hollow Road · Madison, WI 53711-5399 USA · Toll Free in USA 800-356-9526 · 608-274-4330 · Fax 608-277-2516www.promega.com TMD047 · Revised 8/22
133
Standard Curves: The Standard Curves worksheet displays a plot of Cq value versus DNA concentration (ng/µl) for each quantification target and the equation for the line of best fit (Figure 102).
Figure 102. The Standard Curves worksheet.Results: The Results worksheet (Figure 103) displays the data output sorted by well position. The Instrument Target Name and Sample Assessment settings from the Admin Settings worksheet are displayed at the top of page. The DNA concentration and Cq value for each target are displayed in individual columns. The DNA concentrations and Cq values are imported from the Applied Biosystems® 7500 software.The IPC Cqvalue for the DNA standard with the closest DNA concentration is displayed for each sample in the Closest IPC column. The difference in Cqvalues for the IPC of the closest DNA standard and the IPC of the DNA sample is displayed in the IPC Shift column. The IPC Threshold column displays either “At or Above” or “Below” based on the IPC Shift value for the sample and the IPC Shift value set in the Sample Assessment section of the Admin Settings worksheet (Figure 99).The ratio of autosomal DNA concentration and male DNA concentration is calculated and displayed in the [Auto]/[Y] column. The [Auto]/[Y] Threshold column displays either “At or Above” or “Below” based on the [Auto]/[Y] ratio for the sample and the [Auto]/[Y] ratio set for the Possible Male/Female Mixture field in the Sample Assessment section of the Admin Settings worksheet.
1286
7TA

134 Promega Corporation · 2800 Woods Hollow Road · Madison, WI 53711-5399 USA · Toll Free in USA 800-356-9526 · 608-274-4330 · Fax 608-277-2516TMD047 · Revised 8/22 www.promega.com
12.D. Using the PowerQuant® Analysis Tool (continued) The ratio of autosomal DNA concentration and degradation target DNA concentration is calculated and displayed in the [Auto]/[D] column. If no value is displayed in the [Deg] column for a sample, then the [Auto]/[D] column will display “Undetermined”. The [Auto]/[D] Threshold column displays either “At or Above” or “Below” based on the [Auto]/[Deg] ratio for the sample and the [Auto]/[Deg] ratio set for the Possible degraded sample field in the Sample Assessment section of the Admin Settings worksheet. The Results worksheet is not locked and is sortable by column.
Figure 103. The Results worksheet.
Results with Averages: The Results with Averages worksheet (Figure 104) contains output results sorted alphabetically by sample name, with averages calculated for replicate samples (i.e., samples with the same sample name). Data for the standards are not displayed. The Instrument Target Name and Sample Assessment settings from the Admin Settings worksheet are displayed at the top of page. The DNA concentration for each target is displayed in an individual column.
The IPC Cq value for the sample is displayed. The difference in Cq values for the IPC of the closest DNA standard and the IPC of the DNA sample is displayed in the IPC Shift column. The IPC Threshold column displays either “At or Above” or “Below” based on the IPC Shift value for the sample and the IPC Shift value set in the Sample Assess-ment section of the Admin Settings worksheet.
1286
8TA

Promega Corporation · 2800 Woods Hollow Road · Madison, WI 53711-5399 USA · Toll Free in USA 800-356-9526 · 608-274-4330 · Fax 608-277-2516www.promega.com TMD047 · Revised 8/22
135
The ratio of autosomal DNA concentration and male DNA concentration is calculated and displayed in the [Auto]/[Y] column. The [Auto]/[Y] Threshold column displays either “At or Above” or “Below” based on the [Auto]/[Y] ratio for the sample and the [Auto]/[Y] ratio set for the Possible Male/Female Mixture field in the Sample Assessment section of the Admin Settings worksheet.
Figure 104. The Results with Averages worksheet.
The ratio of autosomal DNA concentration and degradation target DNA concentration is calculated and displayed in the [Auto]/[D] column. If no value is displayed in the [Deg] column for a sample, then the [Auto]/[D] column will display “Undetermined”. The [Auto]/[D] Threshold column displays either “At or Above” or “Below” based on the [Auto]/[Deg] ratio for the sample and the [Auto]/[Deg] ratio set for the Possible degraded sample field in the Sample Assessment section of the Admin Settings worksheet. The Results with Averages worksheet is locked and is not sortable.
All values for individual wells displayed on the Results with Averages worksheet are identical to those on the Results worksheet.
1286
9TA

136 Promega Corporation · 2800 Woods Hollow Road · Madison, WI 53711-5399 USA · Toll Free in USA 800-356-9526 · 608-274-4330 · Fax 608-277-2516TMD047 · Revised 8/22 www.promega.com
12.D. Using the PowerQuant® Analysis Tool (continued)
Autosomal Normalization: The Autosomal Normalization worksheet (Figure 105) contains the output normalization parameters for each DNA sample based on the DNA concentration determined using the autosomal target for that sample and the autosomal normalization parameters set in the Admin Settings worksheet. If multiple DNA quantification results are available for a sample, these values are displayed for individual replicates and for the average autosomal quantification result for each set of replicates. The Normalization for Autosomal STR and Normalization settings from the Admin Settings worksheet are displayed at the top of page.
The Autosomal Normalization worksheet displays the sample name and well position of the DNA sample in the quantification plate. The Sample Concentration (ng/µl) column displays the DNA concentration of the sample based on the quantification results from the autosomal target.
The next two columns apply to samples that do not require dilution prior to STR amplification reaction assembly. These columns will be blank for samples that require dilution prior to autosomal STR amplification reaction assembly.
• The Sample to Add to Reaction (µl) column displays the volume of undiluted DNA to be added directly to the autosomal STR amplification reaction to achieve the desired target DNA mass (in ng).
• The Diluent to Add to Reaction (µl) column displays the difference in volume between the Max Sample Volume (µl) and the Sample to Add to Reaction (µl) volume. This value represents the volume of diluent to add to the reaction.
The next four columns apply to samples that require dilution prior to autosomal STR amplification reaction assembly. These columns will be blank for samples that do not require dilution prior to reaction assembly. Using the volumes indicated in this section, dilute the high-concentration DNA samples in a separate tube or plate so that the desired target DNA mass (in ng) can be added to the autosomal STR amplification reaction.
• The name of the column to the right of the Diluent to Add to Reaction (µl) column is based on the value entered as the Min Pipetting Volume (µl) on the Admin Settings worksheet. For example, if the Min Pipetting Volume (µl) value was set to 1.0, the name of the column is Diluent to Add per 1.0 µl Sample (µl). This column displays the volume of diluent to add to the minimum volume (e.g., 1.0µl) of DNA sample when diluting these DNA samples.
• The Max/Min Dilution Volume Warning column displays the appropriate character entered on the Admin Settings worksheet if the diluent volume required to dilute the specified volume of DNA sample to the desired final DNA concentration exceeds the specified Max Dilution Volume or if the diluent volume is less than the Min Pipetting Volume.
• The Diluted Sample to Add to Reaction (µl) column displays the volume of diluted DNA to add to the autosomal STR amplification reaction. This value is the Min Pipetting Volume (µl) set on the Admin Settings worksheet.
• The Filler Diluent to Add to Reaction (µl) column displays the difference in volume between the Max Sample Volume (µl) and the Diluted Sample to Add to Reaction (µl) volume. This value represents the volume of diluent to add to the reaction.
The DNA template (ng) column displays the target mass of DNA for the autosomal STR amplification reaction based on the volumes and dilution steps specified in the Autosomal Normalization worksheet for that sample.

Promega Corporation · 2800 Woods Hollow Road · Madison, WI 53711-5399 USA · Toll Free in USA 800-356-9526 · 608-274-4330 · Fax 608-277-2516www.promega.com TMD047 · Revised 8/22
137
The Below DNA Target Mass Warning column displays the character entered on the Admin Settings worksheet to indicate that the DNA concentration determined using the autosomal target is too low to meet the specified target mass of DNA (in ng), even when using the maximum volume of DNA sample.
Figure 105. The Autosomal Normalization worksheet.
1287
0TA

138 Promega Corporation · 2800 Woods Hollow Road · Madison, WI 53711-5399 USA · Toll Free in USA 800-356-9526 · 608-274-4330 · Fax 608-277-2516TMD047 · Revised 8/22 www.promega.com
12.D. Using the PowerQuant® Analysis Tool (continued)
Y Normalization: The Y Normalization worksheet (Figure 106) contains the output normalization parameters for each DNA sample based on the male DNA concentration determined using the Y target for that sample and the Y normalization parameters set in the Admin Settings worksheet. If multiple quantification results are available for a sample, these values are displayed for individual replicates and for the average male quantification result for each set of replicates. The Normalization for Y-STR and Normalization settings from the Admin Settings worksheet are displayed at the top of page.
The Y Normalization worksheet displays the sample name and well position of the DNA sample in the quantification plate. The Sample Concentration (ng/µl) column displays the DNA concentration of the sample based on the quantification results from the Y target.
The next two columns apply to samples that do not require dilution prior to STR amplification reaction assembly. These columns will be blank for samples that require dilution prior to Y-STR amplification reaction assembly.
• The Sample to Add to Reaction (µl) column displays the volume of undiluted DNA to be added directly to the Y-STR amplification reaction to achieve the desired target DNA mass (in ng).
• The Diluent to Add to Reaction (µl) column displays the difference in volume between the Max Sample Volume (µl) and the Sample to Add to Reaction (µl) volume. This value represents the volume of diluent to add to the Y-STR reaction.
The next four columns apply to samples that require dilution prior to Y-STR amplification reaction assembly. These columns will be blank for samples that do not require dilution prior to reaction assembly. Using the volumes indicated in this section, dilute the high-concentration DNA samples in a separate tube or plate so that the desired target DNA mass (in ng) can be added to the Y-STR amplification reaction.
• The name of the column to the right of the Diluent to Add to Reaction (µl) column is based on the value entered as the Min Pipetting Volume (µl) on the Admin Settings worksheet. For example, if the Min Pipetting Volume (µl) value was set to 1.0, the name of the column is Diluent to Add per 1.0 µl Sample (µl). This column displays the volume of diluent to add to the minimum volume (e.g., 1.0µl) of DNA sample when diluting these DNA samples.
• The Max/Min Dilution Volume Warning column displays the appropriate character entered on the Admin Settings worksheet if the diluent volume required to dilute the specified volume of DNA sample to the desired final DNA concentration exceeds the specified Max Dilution Volume or if the diluent volume is less than the Min Pipetting Volume.
• The Diluted Sample to Add to Reaction (µl) column displays the volume of diluted DNA to add to the Y-STR amplification reaction. This value is the Min Pipetting Volume (µl) set on the Admin Settings worksheet.
• The Filler Diluent to Add to Reaction (µl) column displays the difference in volume between the Max Sample Volume (µl) and the Diluted Sample to Add to Reaction (µl) volume. This value represents the volume of diluent to add to the reaction.
The DNA template (ng) column displays the target mass of DNA for the Y-STR amplification reaction based on the volumes and dilution steps specified in the Y Normalization worksheet for that sample.
The Below DNA Target Mass Warning column displays the character entered on the Admin Settings worksheet to indicate that the DNA concentration determined using the Y target is too low to meet the specified target mass of DNA (in ng), even when using the maximum DNA sample volume.

Promega Corporation · 2800 Woods Hollow Road · Madison, WI 53711-5399 USA · Toll Free in USA 800-356-9526 · 608-274-4330 · Fax 608-277-2516www.promega.com TMD047 · Revised 8/22
139
Figure 106. The Y Normalization worksheet.
Raw Data: The Raw Data worksheet contains the imported raw data spreadsheet (image not shown).
1. SavethefilebyselectingSave AsfromtheFilemenu.Savethefileasan.xlsxfiletoaknownlocationonyourcomputer.
2. ThewindowshowninFigure107willappear.SelectYes.
Figure 107. Saving the file as a macro-free workbook.
1287
1TA
1285
8TA

140 Promega Corporation · 2800 Woods Hollow Road · Madison, WI 53711-5399 USA · Toll Free in USA 800-356-9526 · 608-274-4330 · Fax 608-277-2516TMD047 · Revised 8/22 www.promega.com
12.E. Interpretation of PowerQuant® Data Using the PowerQuant® Analysis Tool
In addition to the concentrations of autosomal and male DNA used to normalize DNA samples for STR amplification, the PowerQuant® System yields information that can be used to evaluate amplification performance, detect PCR inhibitors in the amplification reaction, detect the presence of male and female DNA mixtures and evaluate the degree of DNA degradation.Note: [Auto]/[Y] and [Auto]/[D] ratios may not be reliable in samples with low DNA concentrations (e.g., less than 1pg/µl) due to stochastic effects.
Both the 7500 Applied Biosystems® Real-Time PCR System Software (see Section 6.C or 7.C) and the PowerQuant® Analysis Tool (see Section 12.D) perform a linear regression to the standard dilution series data and calculate the equation for the line of best fit (the standard curve). The equation is in the form of y = mx + b, where x = log concentration and y = Cq. The R2 value is a measure of the fit of the data points to the regressed line. The slope (m in the equation) is an indication of the PCR efficiency. A slope of –3.3 indicates 100% PCR efficiency (i.e., the number of copies of amplification product is doubled at each cycle). The Y-intercept (b in the equation) is defined as the y value (Cq) when x (log concentration) equals 0. Therefore, b corresponds to the Cq value for a sample with a concentration of 1ng/µl [log10(1) = 1].
In general, the standard curve for each target (autosomal, Y and degradation) has an average slope (m) in the range of –3.1 to –3.6 and an R2 value >0.990. See Section 11 for more information about troubleshooting standard curves that fall out of these ranges. We recommend tracking and evaluating Y-intercept values for any significant changes from run to run.
Internal PCR Control
Amplification performance for the IPC can be used to evaluate overall performance of a PowerQuant® amplification reaction or detect PCR inhibitors in the DNA sample. IPC data analyzed using the PowerQuant® Analysis Tool can be interpreted as follows:
• If a sample yields no detectable amplification for the autosomal, Y and degradation targets but has an IPC amplification curve that crossed the amplification threshold without an IPC shift greater than that specified on the Admin Settings worksheet, then insufficient DNA template was added to the PowerQuant® amplification reaction.
• If a sample has an IPC Shift value greater than the value specified in the Admin Settings worksheet or if the Cq value for the IPC is undetermined (regardless of detectable amplification for the autosomal, Y and degradation quantification targets), then this indicates that a PCR inhibitor may be present in the amplification reaction. Repeat the DNA purification if necessary.
• If a sample has an IPC Shift value greater than the value specified in the Admin Settings worksheet and the [Auto]/[D] ratio is less than the ratio specified on the Admin Settings worksheet, then the sample likely contains a PCR inhibitor but the DNA is not likely degraded. Repeat the DNA purification if necessary.
• If a sample has an IPC Shift value greater than the value specified in the Admin Settings worksheet and the [Auto]/[D] ratio is greater than the ratio specified on the Admin Settings worksheet, then the sample likely contains a PCR inhibitor and the DNA is possibly degraded. Repeat the DNA purification if necessary.Note: The IPC is the longest target in the PowerQuant® System and therefore is more susceptible to inhibition relative to the shorter autosomal and Y targets. The degradation target is long, and amplification performance also may be affected by inhibitors.

Promega Corporation · 2800 Woods Hollow Road · Madison, WI 53711-5399 USA · Toll Free in USA 800-356-9526 · 608-274-4330 · Fax 608-277-2516www.promega.com TMD047 · Revised 8/22
141
[Auto]/[Y] Ratio
The [Auto]/[Y] ratio can be used to evaluate whether a sample includes a male/female DNA mixture. The results from the [Auto]/[Y] calculations performed by the PowerQuant® Analysis Tool may be interpreted as follows:
• If a sample has no value for the [Auto]/[Y] ratio, then no male DNA was detected.
• If a sample has an [Auto]/[Y] ratio less than the value specified in the Admin Settings worksheet, then the sample may contain male DNA only or low levels of female DNA.
• If a sample has an [Auto]/[Y] ratio greater than the value specified in the Admin Settings worksheet, then the sample contains a possible mixture of male and female DNA.
[Auto]/[D] Ratio
The [Auto]/[D] ratio can be used to evaluate whether a sample was degraded. The results from the [Auto]/[D] calculations performed by the PowerQuant® Analysis Tool may be interpreted as follows:
• If a sample has an [Auto]/[D] ratio less than the value specified in the Admin Settings worksheet, then the DNA in the sample is not likely degraded, regardless of the value in the IPC Shift column.
• If a sample has an [Auto]/[D] ratio greater than the value specified in the Admin Settings worksheet and the value for the IPC Shift is less than the value specified in the Admin Settings worksheet, then the DNA in the sample is likely degraded but the sample does not contain PCR inhibitors.
• If a sample has an [Auto]/[D] ratio and IPC Shift value greater than the values specified in the Admin Settings worksheet then this sample likely contains PCR inhibitors and may or may not contain degraded DNA.
• If a sample has an [Auto]/[D] ratio of “Undetermined” and the IPC Shift value is less than the value specified in the Admin Settings worksheet, then the DNA in the sample is likely severely degraded but the sample does not contain PCR inhibitors.
• If a sample has an [Auto]/[D] ratio of “Undetermined” and the IPC Shift value is greater than the value specified in the Admin Settings worksheet, then the sample likely contains PCR inhibitors and the DNA may be degraded.

142 Promega Corporation · 2800 Woods Hollow Road · Madison, WI 53711-5399 USA · Toll Free in USA 800-356-9526 · 608-274-4330 · Fax 608-277-2516TMD047 · Revised 8/22 www.promega.com
12.F. Changing the Password in the PowerQuant® Analysis Tool
Settings on the Admin Settings worksheet of the PowerQuant® Analysis Tool are protected. The default password is “Admin”. Instructions to change the password are provided below.
1. Navigate to the Admin Settings worksheet in the PowerQuant® Analysis Tool.
2. Unprotect the Admin Settings worksheet.a. Select Review in the toolbar.b. Select Unprotect Sheet in the toolbar.c. The ‘Unprotect Sheet’ dialog box appears.d. Enter “Admin Admin” for the password.
3. Select Review from the toolbar.
4. Select Allow Users to Edit Ranges. a. In the ‘Allow Users to Edit Ranges’ window that appears, ensure “AdminCells” is highlighted, and select Modify. b. Select Password. c. Enter the desired password.
5. Select OK for all dialog boxes until you are returned to the Admin Settings worksheet.
6. Reprotect the Admin Settings worksheet.a. Select Review in the toolbar.b. Select Protect Sheet in the toolbar.c. The ‘Protect Sheet’ dialog box appears. Ensure that the “Protect worksheet and contents of locked cells” box is
checked. Under “Allow all users of this worksheet to:” ensure that the boxes for “Select locked cells” and “Select unlocked cells” are checked.
d. Select OK.

Promega Corporation · 2800 Woods Hollow Road · Madison, WI 53711-5399 USA · Toll Free in USA 800-356-9526 · 608-274-4330 · Fax 608-277-2516www.promega.com TMD047 · Revised 8/22
143
12.G. Related Products
STR Systems
Product Size Cat.#PowerPlex® Fusion 6C System 50 (or 100 direct-amp) reactions DC2705 200 (or 400 direct-amp) reactions DC2720 800 (1,600 direct-amp) reactions DC2780PowerPlex® Fusion System 200 reactions DC2402 800 reactions DC2408PowerPlex® Y23 System 50 reactions DC2305 200 reactions DC2320PowerPlex® 21 System 200 reactions DC8902 4 × 200 reactions DC8942PowerPlex® 18D System 200 reactions DC1802 800 reactions DC1808PowerPlex® ESX 16 Fast System 100 reactions DC1611 400 reactions DC1610PowerPlex® ESX 17 Fast System 100 reactions DC1711 400 reactions DC1710PowerPlex® ESI 16 Fast System 100 reactions DC1621 400 reactions DC1620PowerPlex® ESI 17 Fast System 100 reactions DC1721 400 reactions DC1720PowerPlex® 16 HS System 100 reactions DC2101 400 reactions DC2100PowerPlex® CS7 System 100 reactions DC6613Not for Medical Diagnostic Use.
12.H. Summary of Changes
The following changes were made to the 8/22 revision of this document.
1. Corrected System Requirements in Section 9.B.
2. Revised Installation information in Section 11.B.
3. Updated cover image and document font.
4. Made general formatting updates.

144 Promega Corporation · 2800 Woods Hollow Road · Madison, WI 53711-5399 USA · Toll Free in USA 800-356-9526 · 608-274-4330 · Fax 608-277-2516TMD047 · Revised 8/22 www.promega.com
(a)Dye compounds in this product are sold under license from Biosearch Technologies, Inc., and protected by U.S. and worldwide patents either issued or in application. The license does not include rights for human IVD use.
(b)U.S. Pat. No. 6,242,235, Australian Pat. No. 761757, Canadian Pat. No. 2,335,153, Chinese Pat. No. ZL99808861.7, Hong Kong Pat. No. HK 1040262, Japanese Pat. No. 3673175, European Pat. No. 1088060 and other patents pending.
© 2015–2022 Promega Corporation. All Rights Reserved.
PowerPlex and PowerQuant are registered trademarks of Promega Corporation.
Applied Biosystems and MicroAmp are registered trademarks of Applied Biosystems. CAL Fluor and Quasar are registered trademarks of Biosearch Technologies, Inc. Excel and Microsoft are registered trademarks of Microsoft Corporation. ROX is a trademark of Applera Corporation. TaqMan is a registered trademark of Roche Molecular Systems, Inc.
Products may be covered by pending or issued patents or may have certain limitations. Please visit our Web site for more information.
All prices and specifications are subject to change without prior notice.
Product claims are subject to change. Please contact Promega Technical Services or access the Promega online catalog for the most up-to-date information on Promega products.
Related Documents