Investor Presentation September 2015 happy moments

Welcome message from author
This document is posted to help you gain knowledge. Please leave a comment to let me know what you think about it! Share it to your friends and learn new things together.
Transcript
Investor Presentation
September 2015
happy moments
2
1. Ülker: Ülker In Brief
2. Organic Growth Drivers
3. Inorganic Growth Opportunities & Godiva
4. Operational Performance
5. Financials
6. Appendix
3
8
13
18
24
29
3 Leading Name In Turkish Confectionery
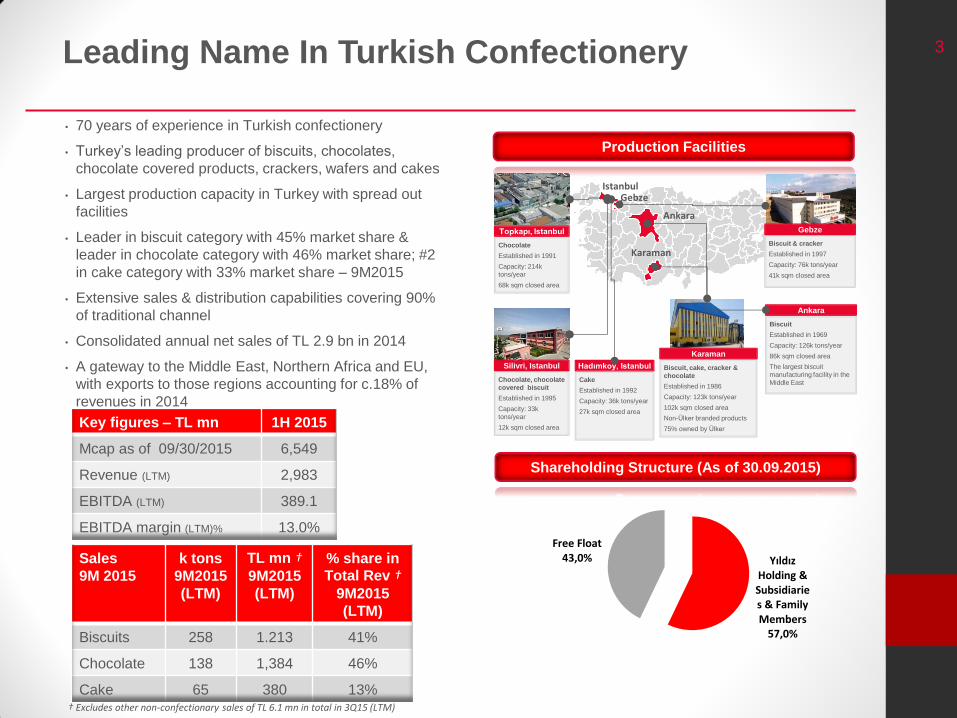
• 70 years of experience in Turkish confectionery
• Turkey’s leading producer of biscuits, chocolates,
chocolate covered products, crackers, wafers and cakes
• Largest production capacity in Turkey with spread out
facilities
• Leader in biscuit category with 45% market share &
leader in chocolate category with 46% market share; #2
in cake category with 33% market share – 9M2015
• Extensive sales & distribution capabilities covering 90%
of traditional channel
• Consolidated annual net sales of TL 2.9 bn in 2014
• A gateway to the Middle East, Northern Africa and EU,
with exports to those regions accounting for c.18% of
revenues in 2014
Key figures – TL mn 1H 2015
Mcap as of 09/30/2015 6,549
Revenue (LTM) 2,983
EBITDA (LTM) 389.1
EBITDA margin (LTM)% 13.0%
† Excludes other non-confectionary sales of TL 26 mn
Production Facilities
Chocolate
Established in 1991
Capacity: 214k
tons/year
68k sqm closed area
Topkapı, Istanbul
Istanbul
Chocolate, chocolate
covered biscuit
Established in 1995
Capacity: 33k
tons/year
12k sqm closed area
Silivri, Istanbul Biscuit, cake, cracker &
chocolate
Established in 1986
Capacity: 123k tons/year
102k sqm closed area
Non-Ülker branded products
75% owned by Ülker
Karaman
Cake
Established in 1992
Capacity: 36k tons/year
27k sqm closed area
Hadımkoy, Istanbul
Biscuit
Established in 1969
Capacity: 126k tons/year
86k sqm closed area
The largest biscuit
manufacturing facility in the
Middle East
Ankara
Biscuit & cracker
Established in 1997
Capacity: 76k tons/year
41k sqm closed area
Gebze
Gebze
Ankara
Karaman
Sales
9M 2015
k tons
9M2015
(LTM)
TL mn † 9M2015
(LTM)
% share in
Total Rev † 9M2015
(LTM)
Biscuits 258 1.213 41%
Chocolate 138 1,384 46%
Cake 65 380 13%
Shareholding Structure (As of 30.09.2015)
Yıldız Holding & Subsidiaries & Family Members
57,0%
Free Float 43,0%
† Excludes other non-confectionary sales of TL 6.1 mn in total in 3Q15 (LTM)
4
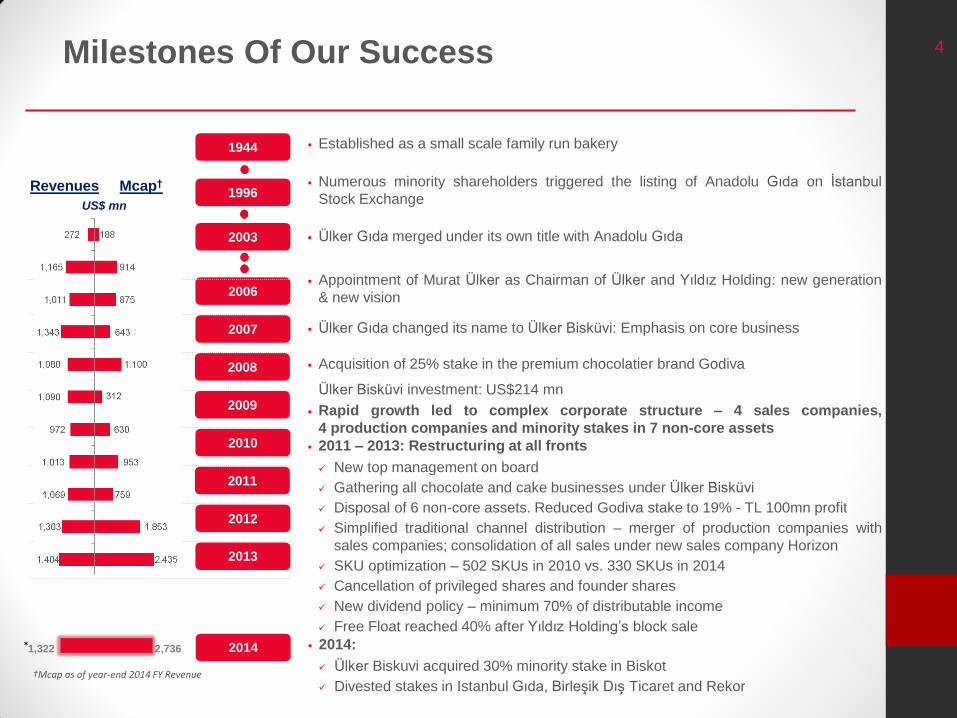
1996
Milestones Of Our Success
1944
2003
2006
2007
2008
2009
2010
2011
2012
2013
Established as a small scale family run bakery
Ülker Gıda merged under its own title with Anadolu Gıda
Ülker Gıda changed its name to Ülker Bisküvi: Emphasis on core business
Acquisition of 25% stake in the premium chocolatier brand Godiva
Ülker Bisküvi investment: US$214 mn
2011 – 2013: Restructuring at all fronts
New top management on board
Gathering all chocolate and cake businesses under Ülker Bisküvi
Disposal of 6 non-core assets. Reduced Godiva stake to 19% - TL 100mn profit
Simplified traditional channel distribution – merger of production companies with
sales companies; consolidation of all sales under new sales company Horizon
SKU optimization – 502 SKUs in 2010 vs. 330 SKUs in 2014
Cancellation of privileged shares and founder shares
New dividend policy – minimum 70% of distributable income
Free Float reached 40% after Yıldız Holding’s block sale
†Mcap as of year-end 2014 FY Revenue
Revenues Mcap†
US$ mn
Appointment of Murat Ülker as Chairman of Ülker and Yıldız Holding: new generation
& new vision
Numerous minority shareholders triggered the listing of Anadolu Gıda on İstanbul
Stock Exchange
Rapid growth led to complex corporate structure – 4 sales companies,
4 production companies and minority stakes in 7 non-core assets
2014 2014:
Ülker Biskuvi acquired 30% minority stake in Biskot
Divested stakes in Istanbul Gıda, Birleşik Dış Ticaret and Rekor
1,322 2,736 *
5
Advocacy
Familiarness
Recognition
Like
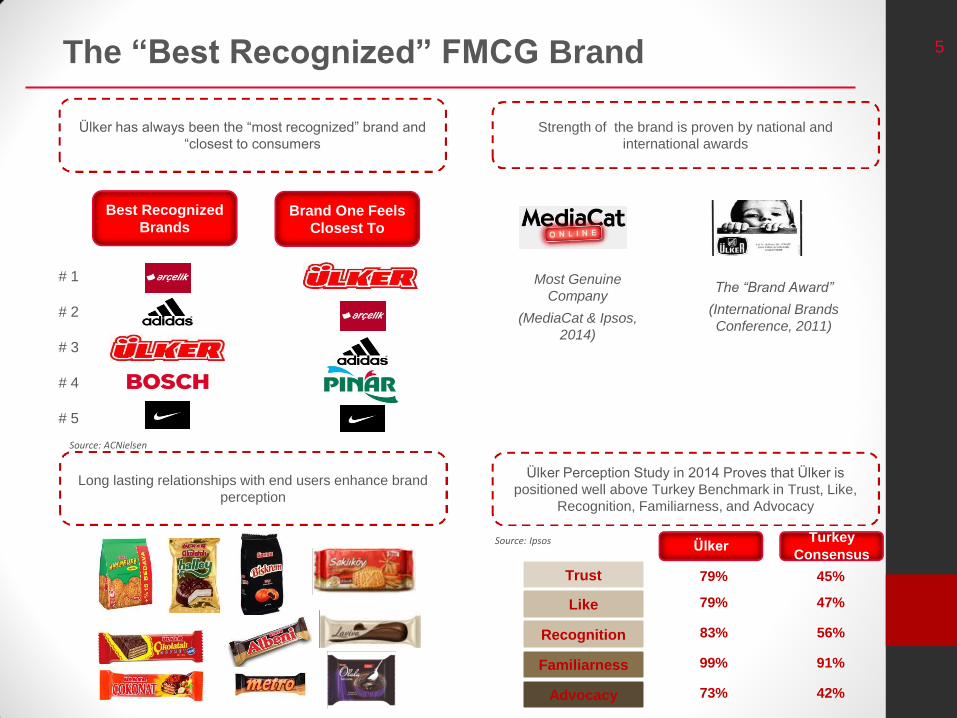
The “Best Recognized” FMCG Brand
Most Genuine
Company
(MediaCat & Ipsos,
2014)
The “Brand Award”
(International Brands
Conference, 2011)
# 1
# 2
# 3
# 4
# 5
Source: Ipsos
Ülker has always been the “most recognized” brand and
“closest to consumers
Best Recognized
Brands Brand One Feels
Closest To
Long lasting relationships with end users enhance brand
perception
Ülker Perception Study in 2014 Proves that Ülker is
positioned well above Turkey Benchmark in Trust, Like,
Recognition, Familiarness, and Advocacy
Strength of the brand is proven by national and
international awards
Trust
Source: ACNielsen
Ülker Turkey
Consensus
79% 45%
79% 47%
83% 56%
99% 91%
73% 42%
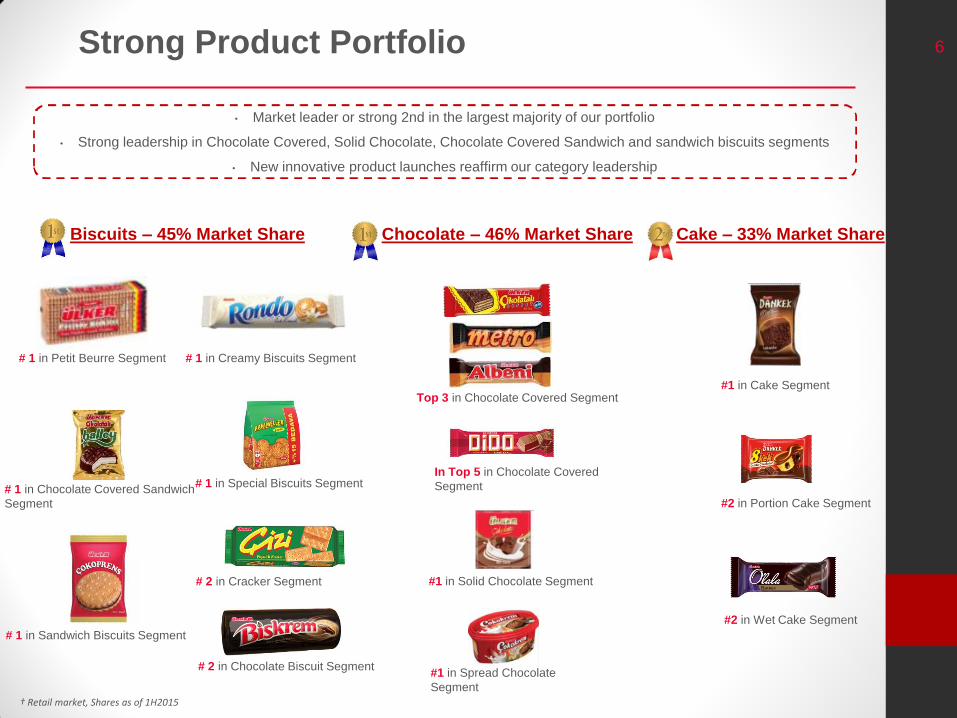
6 Strong Product Portfolio
Biscuits – 45% Market Share Chocolate – 46% Market Share
† Retail market, Shares as of 1H2015
# 1 in Petit Beurre Segment
Cake – 33% Market Share
# 1 in Sandwich Biscuits Segment
# 1 in Creamy Biscuits Segment
# 1 in Special Biscuits Segment # 1 in Chocolate Covered Sandwich
Segment
Top 3 in Chocolate Covered Segment
#1 in Solid Chocolate Segment
#1 in Spread Chocolate
Segment
#1 in Cake Segment
# 2 in Cracker Segment
# 2 in Chocolate Biscuit Segment
In Top 5 in Chocolate Covered
Segment
#2 in Portion Cake Segment
#2 in Wet Cake Segment
• Market leader or strong 2nd in the largest majority of our portfolio
• Strong leadership in Chocolate Covered, Solid Chocolate, Chocolate Covered Sandwich and sandwich biscuits segments
• New innovative product launches reaffirm our category leadership
7
1. Ülker: Ulker In Brief
2. Organic Growth Drivers
3. Inorganic Growth Opportunities & Godiva
4. Operational Performance
5. Financials
6. Appendix
3
8
13
18
24
29

8
16%
12%
14%
15%
14%
12%
17%
25%
17%
17%
14%
11%
8%
7%
0-14
15-24
25-34
35-44
45-54
55-64
65+
EU-27 Turkey
59%
41%59%
41%
1.7%
1.4%
1.3%
1.2%
0.9%
0.7%
0.5%
0.5%
0.5%
0.3%
0.2%
0.2%
0.2%
-0.1%
Malaysia
Turkey
Indonesia
S.Africa
Brazil
UK
France
Italy
Netherlands
Czech Rep.
Poland
Russia
Greece
Germany
Turkey has one
of the youngest
and fastest
growing
populations
Attractive target
consumer group
Source: World Bank, Turkstat
Sizeable market with a growing population Youngest population in Europe
Favorable Demographics & Young Target
Population
Total population in millions
63
29
78
247
51
199
66
61
17
11
39
144
11
82
European median
41 yrs
Turkey median
31 yrs
CAGR 2007-
2014
Population
Source: Turkstat, Eurostat
9
Kg Per Capita
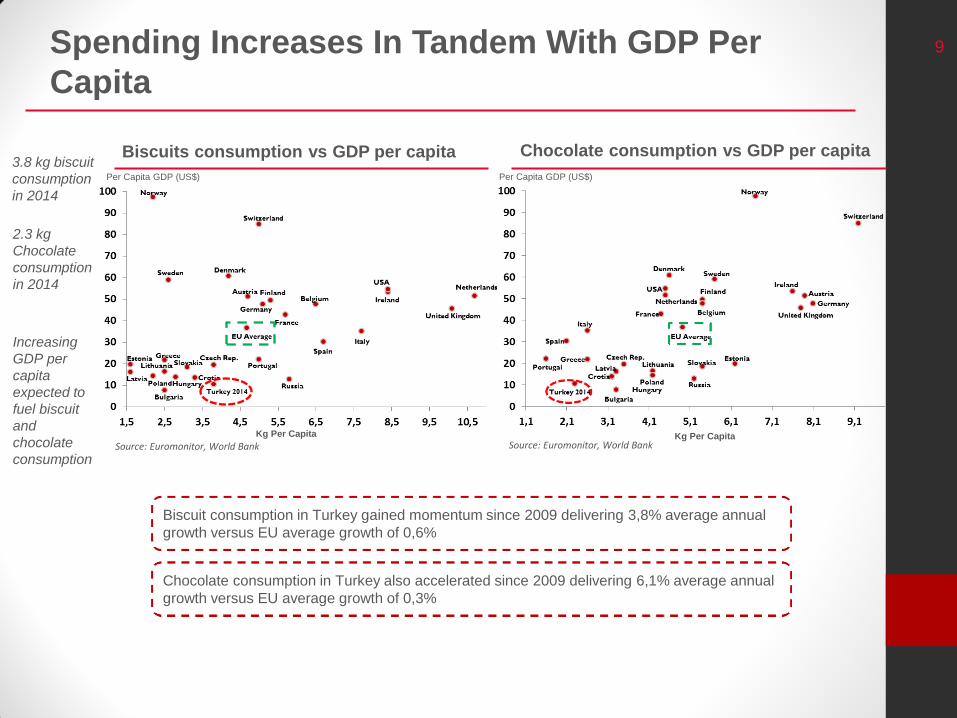
Chocolate consumption in Turkey also accelerated since 2009 delivering 6,1% average annual
growth versus EU average growth of 0,3%
Biscuits consumption vs GDP per capita Chocolate consumption vs GDP per capita 3.8 kg biscuit
consumption
in 2014
Per Capita GDP (US$)
Biscuit consumption in Turkey gained momentum since 2009 delivering 3,8% average annual
growth versus EU average growth of 0,6%
Spending Increases In Tandem With GDP Per
Capita
Source: Euromonitor, World Bank Source: Euromonitor, World Bank
2.3 kg
Chocolate
consumption
in 2014
Increasing
GDP per
capita
expected to
fuel biscuit
and
chocolate
consumption
Kg Per Capita
Per Capita GDP (US$)
10
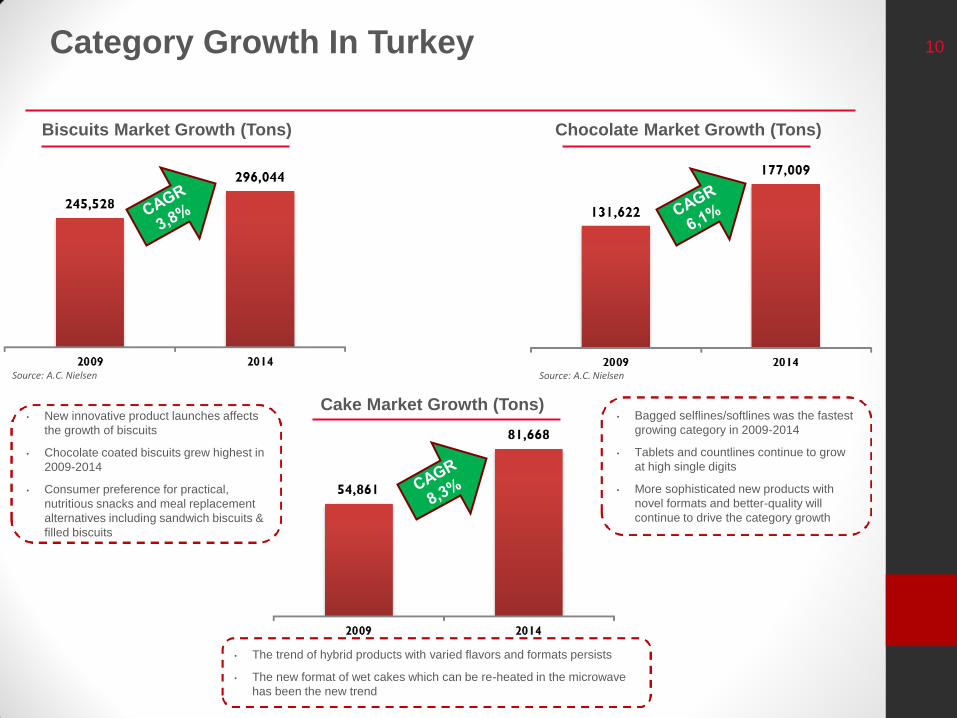
Biscuits Market Growth (Tons)
Category Growth In Turkey
• New innovative product launches affects
the growth of biscuits
• Chocolate coated biscuits grew highest in
2009-2014
• Consumer preference for practical,
nutritious snacks and meal replacement
alternatives including sandwich biscuits &
filled biscuits
Chocolate Market Growth (Tons)
Cake Market Growth (Tons)
Source: A.C. Nielsen Source: A.C. Nielsen
• Bagged selflines/softlines was the fastest
growing category in 2009-2014
• Tablets and countlines continue to grow
at high single digits
• More sophisticated new products with
novel formats and better-quality will
continue to drive the category growth
• The trend of hybrid products with varied flavors and formats persists
• The new format of wet cakes which can be re-heated in the microwave
has been the new trend
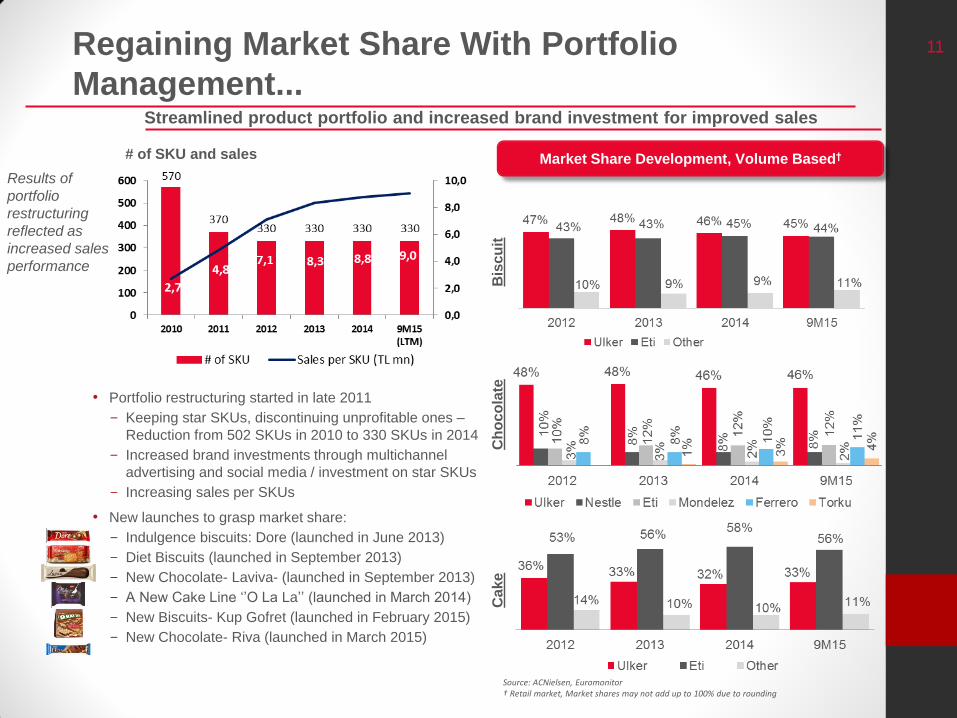
11
• Portfolio restructuring started in late 2011
- Keeping star SKUs, discontinuing unprofitable ones –
Reduction from 502 SKUs in 2010 to 330 SKUs in 2014
- Increased brand investments through multichannel
advertising and social media / investment on star SKUs
- Increasing sales per SKUs
• New launches to grasp market share:
- Indulgence biscuits: Dore (launched in June 2013)
- Diet Biscuits (launched in September 2013)
- New Chocolate- Laviva- (launched in September 2013)
- A New Cake Line ‘’O La La’’ (launched in March 2014)
- New Biscuits- Kup Gofret (launched in February 2015)
- New Chocolate- Riva (launched in March 2015)
Regaining Market Share With Portfolio
Management...
# of SKU and sales
Streamlined product portfolio and increased brand investment for improved sales
Market Share Development, Volume Based†
Bis
cu
it
Ch
oc
ola
te
Ca
ke
Results of
portfolio
restructuring
reflected as
increased sales
performance
Source: ACNielsen, Euromonitor † Retail market, Market shares may not add up to 100% due to rounding

12
1. Ülker: Ulker In Brief
2. Organic Growth Drivers
3. Inorganic Growth Opportunities & Godiva
4. Operational Performance
5. Financials
6. Appendix
3
8
13
18
24
29
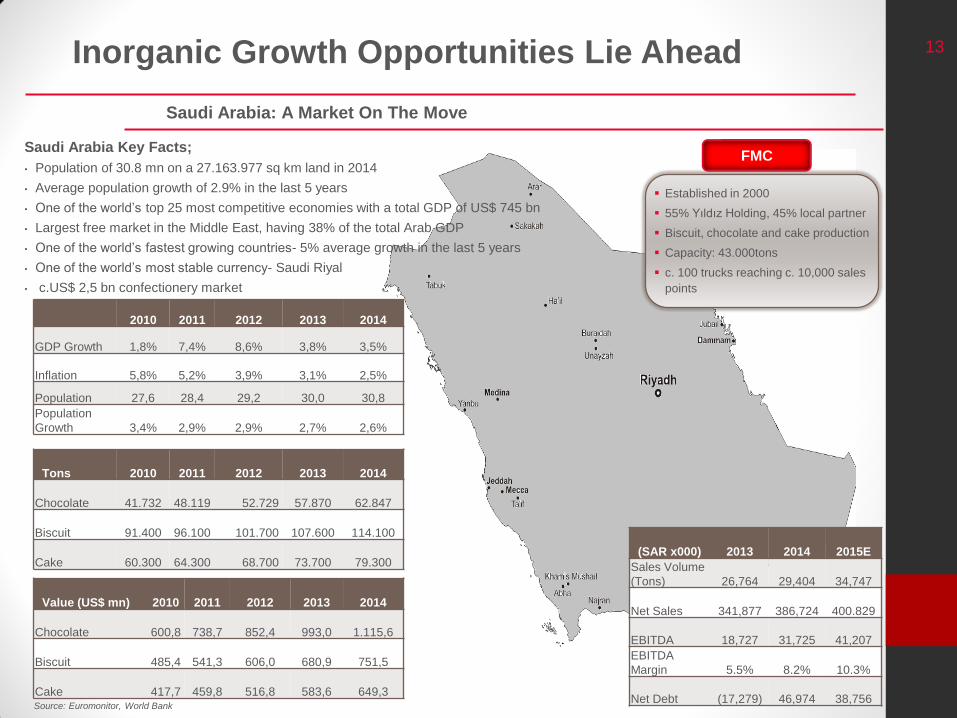
13
Established in 2000
55% Yıldız Holding, 45% local partner
Biscuit, chocolate and cake production
Capacity: 43.000tons
c. 100 trucks reaching c. 10,000 sales
points
Saudi Arabia: A Market On The Move
Saudi Arabia Key Facts;
• Population of 30.8 mn on a 27.163.977 sq km land in 2014
• Average population growth of 2.9% in the last 5 years
• One of the world’s top 25 most competitive economies with a total GDP of US$ 745 bn
• Largest free market in the Middle East, having 38% of the total Arab GDP
• One of the world’s fastest growing countries- 5% average growth in the last 5 years
• One of the world’s most stable currency- Saudi Riyal
• c.US$ 2,5 bn confectionery market
2010 2011 2012 2013 2014
GDP Growth 1,8% 7,4% 8,6% 3,8% 3,5%
Inflation 5,8% 5,2% 3,9% 3,1% 2,5%
Population 27,6 28,4 29,2 30,0 30,8
Population
Growth 3,4% 2,9% 2,9% 2,7% 2,6%
Inorganic Growth Opportunities Lie Ahead
Source: Euromonitor, World Bank
Tons 2010 2011 2012 2013 2014
Chocolate
41.732
48.119 52.729
57.870
62.847
Biscuit
91.400
96.100 101.700
107.600
114.100
Cake
60.300
64.300 68.700
73.700
79.300
Value (US$ mn) 2010 2011 2012 2013 2014
Chocolate
600,8
738,7
852,4
993,0
1.115,6
Biscuit
485,4
541,3
606,0
680,9
751,5
Cake
417,7
459,8
516,8
583,6
649,3
FMC
(SAR x000) 2013 2014 2015E
Sales Volume
(Tons) 26,764
29,404
34,747
Net Sales
341,877
386,724 400.829
EBITDA 18,727 31,725 41,207
EBITDA
Margin 5.5% 8.2% 10.3%
Net Debt (17,279) 46,974 38,756

14
Established in 2007
46% Yıldız Holding, 54% - 2 Local
partners
Biscuit, production
Capacity: 30,000 tons
Egypt: Presenting Various Opportunities In A Sophisticated Market
Egypt Key Facts;
• Population of 83,4 mn on a 1,001,450 sq km land in 2014
• Average population growth of 1.7% in the last 5 years
• %50 of the population is under the age of 24
• Second largest economy in the Arab world with a GDP of US$
286,5 bn
• c.US$ 1,8 bn confectionery market
• Traditional channel is still dominant with c 80%
2010 2011 2012 2013 2014
GDP Growth 2,1% 1,9% 1,5% 2,0% 2,1%
Inflation 10,0% 12,0% 12,0% 9,0% 11,0%
Population 78,1 79,4 80,7 82,1 83,4
Population
Growth 1,7% 1,7% 1,7% 1,7% 1,6%
Inorganic Growth Opportunities (cont)
Source: Euromonitor, World Bank
Tons 2010 2011 2012 2013 2014
Chocolate
26.000
26.979 28.671
29.888
31.779
Biscuit
192.400
204.500 217.700
231.800
246.700
Cake
50.100
52.800 56.000
59.600
63.700
Value (US$ mn) 2010 2011 2012 2013 2014
Chocolate
266,8
289,1
324,3
327,4
362,7
Biscuit
804,9
865,4
956,8
961,1
1.022,1
Cake
286,8
317,8
346,5
343,3
374,9
Hi Food
(EGP x000) 2013 2014 2015E
Sales Volume
(Tons)
21,943
21,948 26,020
Net Sales
289,332 304,630 390,372
EBITDA 44,883 40,728 44,643
EBITDA
Margin 15,4% 13,4% 11.4%
Net Debt 42,053 81,548 73,911
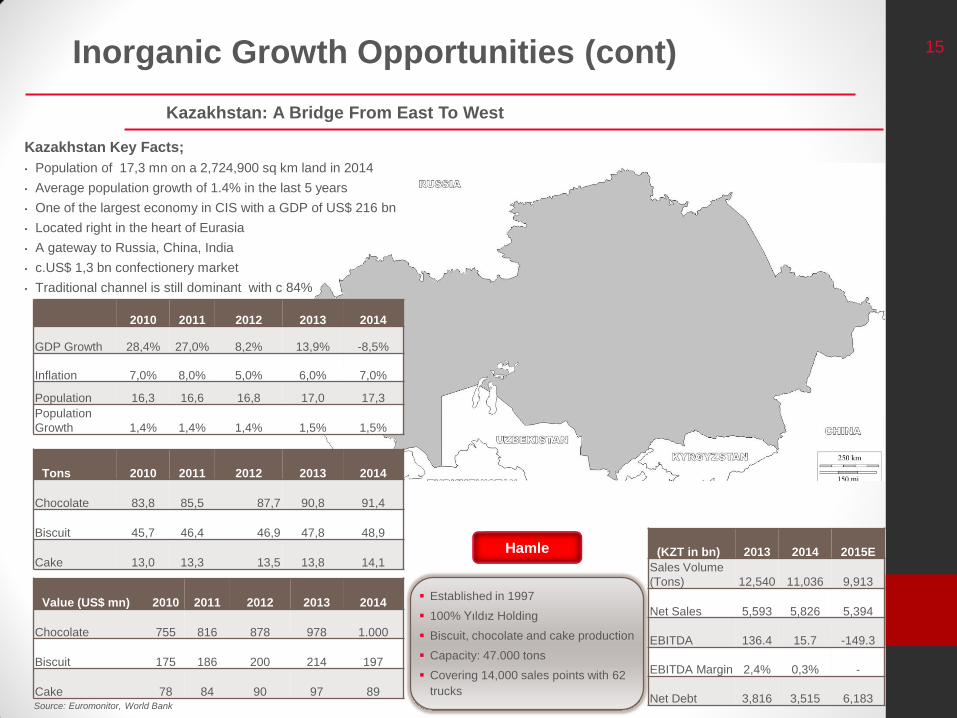
15
Established in 1997
100% Yıldız Holding
Biscuit, chocolate and cake production
Capacity: 47.000 tons
Covering 14,000 sales points with 62
trucks
Kazakhstan: A Bridge From East To West
Kazakhstan Key Facts;
• Population of 17,3 mn on a 2,724,900 sq km land in 2014
• Average population growth of 1.4% in the last 5 years
• One of the largest economy in CIS with a GDP of US$ 216 bn
• Located right in the heart of Eurasia
• A gateway to Russia, China, India
• c.US$ 1,3 bn confectionery market
• Traditional channel is still dominant with c 84%
2010 2011 2012 2013 2014
GDP Growth 28,4% 27,0% 8,2% 13,9% -8,5%
Inflation 7,0% 8,0% 5,0% 6,0% 7,0%
Population 16,3 16,6 16,8 17,0 17,3
Population
Growth 1,4% 1,4% 1,4% 1,5% 1,5%
Inorganic Growth Opportunities (cont)
Source: Euromonitor, World Bank
Tons 2010 2011 2012 2013 2014
Chocolate
83,8
85,5 87,7
90,8
91,4
Biscuit
45,7
46,4 46,9
47,8
48,9
Cake
13,0
13,3 13,5
13,8
14,1
Value (US$ mn) 2010 2011 2012 2013 2014
Chocolate
755
816
878
978
1.000
Biscuit
175
186
200
214
197
Cake
78
84
90
97
89
Hamle
(KZT in bn) 2013 2014 2015E
Sales Volume
(Tons)
12,540
11,036 9,913
Net Sales
5,593 5,826 5,394
EBITDA 136.4 15.7 -149.3
EBITDA Margin 2,4% 0,3% -
Net Debt 3,816 3,515 6,183
16
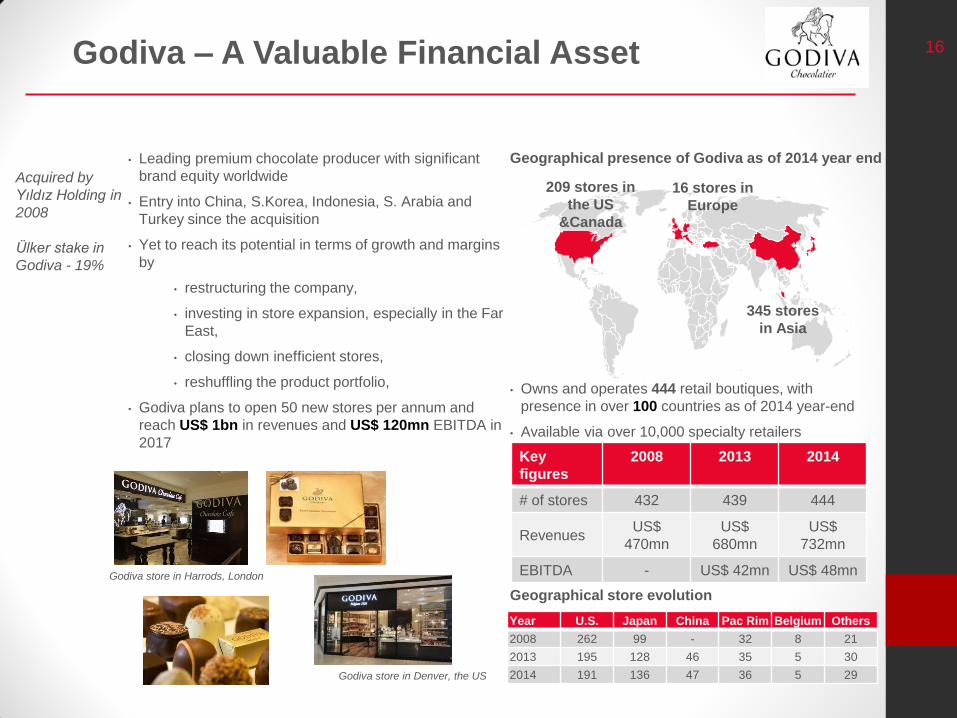
• Leading premium chocolate producer with significant
brand equity worldwide
• Entry into China, S.Korea, Indonesia, S. Arabia and
Turkey since the acquisition
• Yet to reach its potential in terms of growth and margins
by
• restructuring the company,
• investing in store expansion, especially in the Far
East,
• closing down inefficient stores,
• reshuffling the product portfolio,
• Godiva plans to open 50 new stores per annum and
reach US$ 1bn in revenues and US$ 120mn EBITDA in
2017
Godiva – A Valuable Financial Asset
Key
figures
2008 2013 2014
# of stores 432 439 444
Revenues US$
470mn
US$
680mn
US$
732mn
EBITDA - US$ 42mn US$ 48mn
• Owns and operates 444 retail boutiques, with
presence in over 100 countries as of 2014 year-end
• Available via over 10,000 specialty retailers
Geographical presence of Godiva as of 2014 year end
209 stores in
the US
&Canada
16 stores in
Europe
345 stores
in Asia
Godiva store in Harrods, London
Godiva store in Denver, the US
Year U.S. Japan China Pac Rim Belgium Others
2008 262 99 - 32 8 21
2013 195 128 46 35 5 30
2014 191 136 47 36 5 29
Geographical store evolution
Acquired by
Yıldız Holding in
2008
Ülker stake in
Godiva - 19%
17
1. Ülker: Ulker In Brief
2. Organic Growth Drivers
3. Inorganic Growth Opportunities & Godiva
4. Operational Performance
5. Financials
6. Appendix
3
8
13
18
24
29
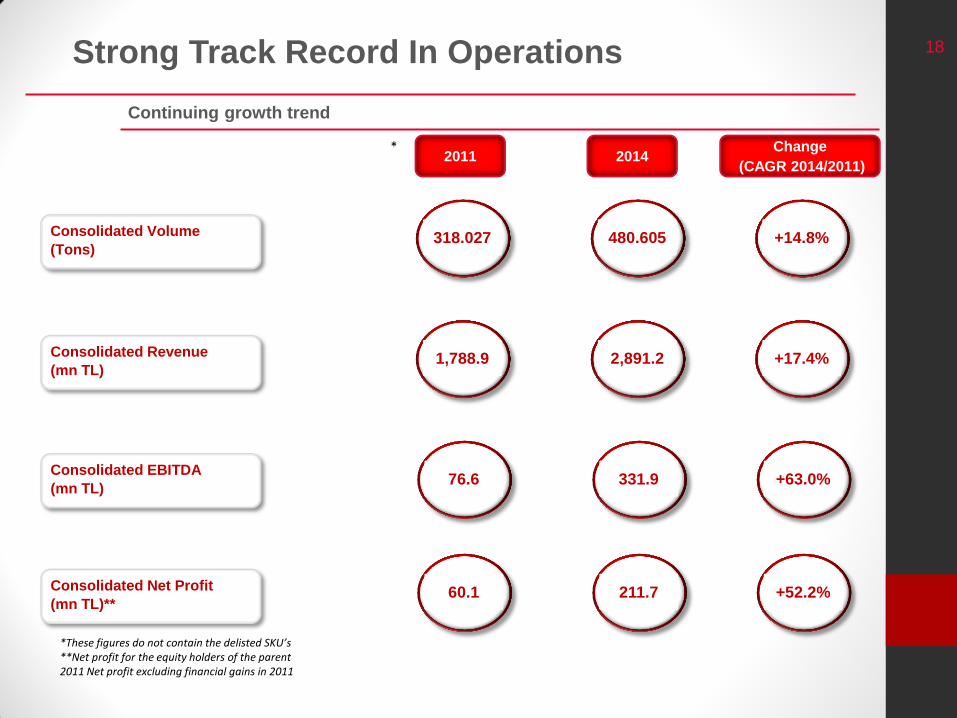
18 Strong Track Record In Operations
Continuing growth trend
Consolidated Volume
(Tons)
Consolidated Revenue
(mn TL)
Consolidated EBITDA
(mn TL)
Consolidated Net Profit
(mn TL)**
318.027 480.605 +14.8%
1,788.9 2,891.2 +17.4%
76.6 331.9 +63.0%
60.1 211.7 +52.2%
*These figures do not contain the delisted SKU’s **Net profit for the equity holders of the parent 2011 Net profit excluding financial gains in 2011
2011 2014 Change
(CAGR 2014/2011)
*
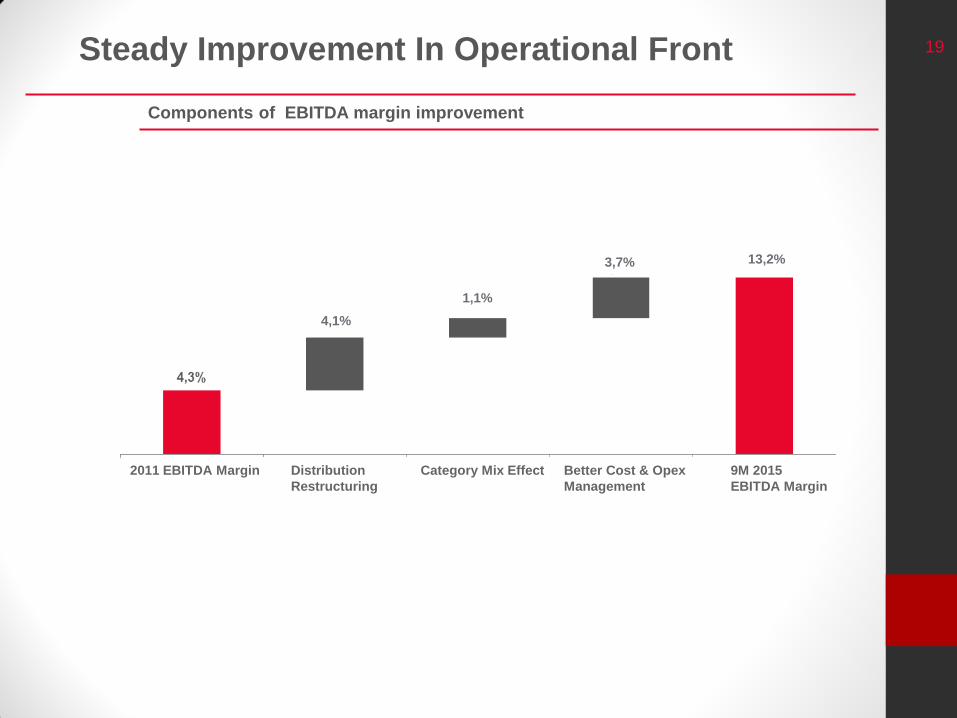
19 Steady Improvement In Operational Front
Components of EBITDA margin improvement
4,1%
1,1%
3,7% 13,2%
9M 2015
EBITDA Margin
Better Cost & Opex
Management
Category Mix Effect Distribution
Restructuring
2011 EBITDA Margin
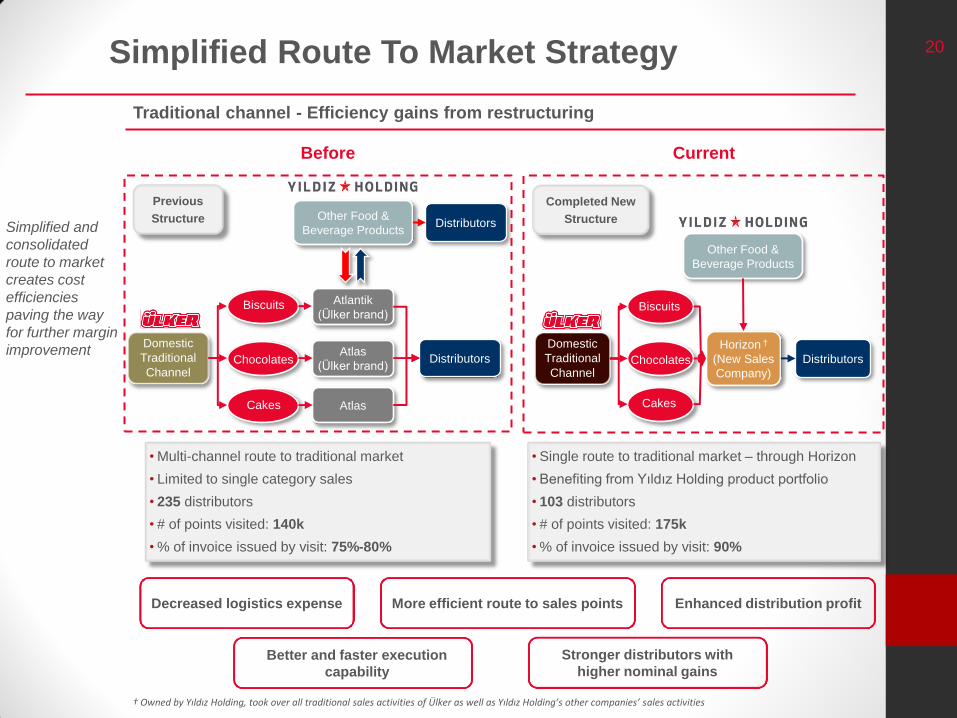
20 Simplified Route To Market Strategy
Simplified and
consolidated
route to market
creates cost
efficiencies
paving the way
for further margin
improvement
• Multi-channel route to traditional market
• Limited to single category sales
• 235 distributors
• # of points visited: 140k
• % of invoice issued by visit: 75%-80%
• Single route to traditional market – through Horizon
• Benefiting from Yıldız Holding product portfolio
• 103 distributors
• # of points visited: 175k
• % of invoice issued by visit: 90%
Other Food &
Beverage Products
Domestic
Traditional
Channel
Biscuits
Chocolates
Cakes
Horizon †
(New Sales
Company)
Distributors
Completed New
Structure
Before Current
Other Food &
Beverage Products Distributors
Domestic
Traditional
Channel
Biscuits
Chocolates
Cakes
Atlas
(Ülker brand) Distributors
Atlantik
(Ülker brand)
Atlas
Previous
Structure
† Owned by Yıldız Holding, took over all traditional sales activities of Ülker as well as Yıldız Holding’s other companies’ sales activities
Traditional channel - Efficiency gains from restructuring
Decreased logistics expense More efficient route to sales points Enhanced distribution profit
Stronger distributors with
higher nominal gains
Better and faster execution
capability
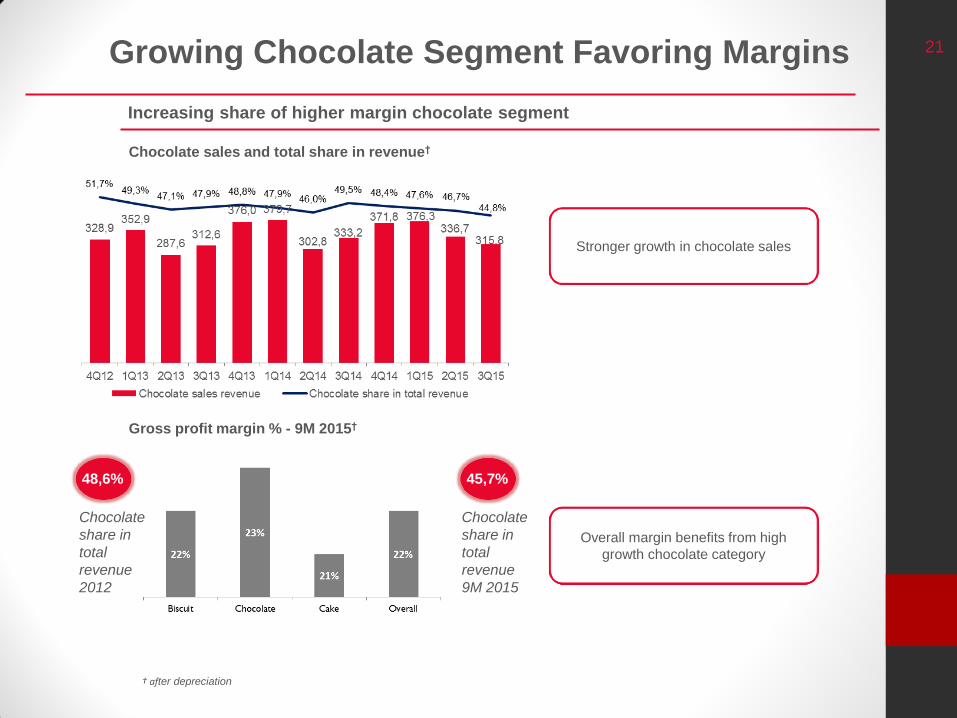
21 Growing Chocolate Segment Favoring Margins
Gross profit margin % - 9M 2015†
48,6% 45,7%
Chocolate
share in
total
revenue
2012
Chocolate
share in
total
revenue
9M 2015
Increasing share of higher margin chocolate segment
† after depreciation
Overall margin benefits from high
growth chocolate category
Chocolate sales and total share in revenue†
Stronger growth in chocolate sales
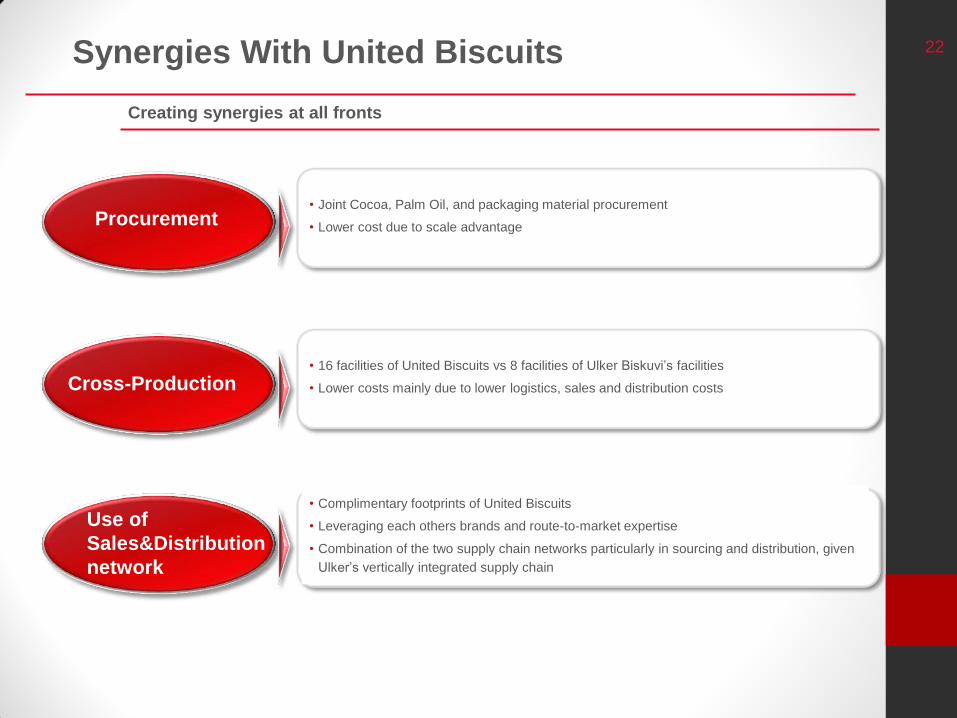
22 Synergies With United Biscuits
Creating synergies at all fronts
• Joint Cocoa, Palm Oil, and packaging material procurement
• Lower cost due to scale advantage Procurement
Cross-Production
Use of
Sales&Distribution
network
• 16 facilities of United Biscuits vs 8 facilities of Ulker Biskuvi’s facilities
• Lower costs mainly due to lower logistics, sales and distribution costs
• Complimentary footprints of United Biscuits
• Leveraging each others brands and route-to-market expertise
• Combination of the two supply chain networks particularly in sourcing and distribution, given
Ulker’s vertically integrated supply chain

23
1. Ülker: Ülker In Brief
2. Organic Growth Drivers
3. Inorganic Growth Opportunities & Godiva
4. Operational Performance
5. Financials
6. Appendix
3
8
13
18
24
29
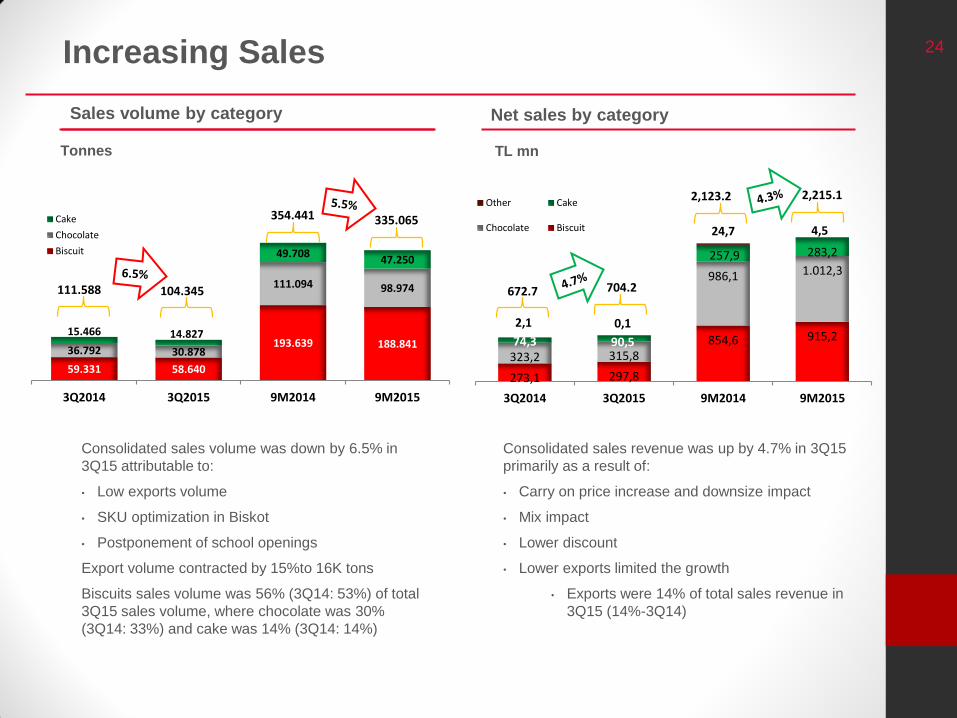
24
273,1 297,8
854,6 915,2
323,2 315,8
986,1 1.012,3
74,3 90,5
257,9 283,2
2,1 0,1
24,7 4,5
3Q2014 3Q2015 9M2014 9M2015
Other Cake
Chocolate Biscuit
Consolidated sales revenue was up by 4.7% in 3Q15
primarily as a result of:
• Carry on price increase and downsize impact
• Mix impact
• Lower discount
• Lower exports limited the growth
• Exports were 14% of total sales revenue in
3Q15 (14%-3Q14)
Increasing Sales
Sales volume by category Net sales by category
Consolidated sales volume was down by 6.5% in
3Q15 attributable to:
• Low exports volume
• SKU optimization in Biskot
• Postponement of school openings
Export volume contracted by 15%to 16K tons
Biscuits sales volume was 56% (3Q14: 53%) of total
3Q15 sales volume, where chocolate was 30%
(3Q14: 33%) and cake was 14% (3Q14: 14%)
Tonnes TL mn
59.331 58.640
193.639 188.841 36.792 30.878
111.094 98.974
15.466 14.827
49.708 47.250
3Q2014 3Q2015 9M2014 9M2015
Cake
Chocolate
Biscuit
111.588
354.441
104.345
335.065
672.7
2,123.2
704.2
2,215.1
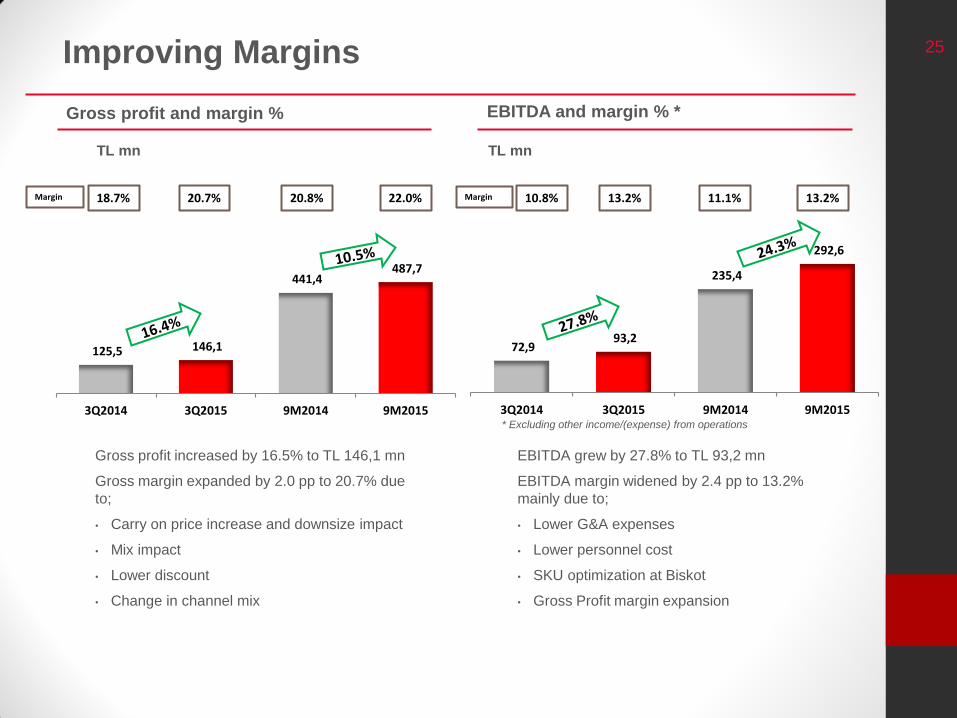
25
72,9 93,2
235,4
292,6
3Q2014 3Q2015 9M2014 9M2015
Improving Margins
Gross profit and margin % EBITDA and margin % *
TL mn TL mn
Gross profit increased by 16.5% to TL 146,1 mn
Gross margin expanded by 2.0 pp to 20.7% due
to;
• Carry on price increase and downsize impact
• Mix impact
• Lower discount
• Change in channel mix
* Excluding other income/(expense) from operations
EBITDA grew by 27.8% to TL 93,2 mn
EBITDA margin widened by 2.4 pp to 13.2%
mainly due to;
• Lower G&A expenses
• Lower personnel cost
• SKU optimization at Biskot
• Gross Profit margin expansion
18.7% 20.8% Margin 10.8% 11.1% Margin 20.7% 22.0% 13.2% 13.2%
125,5 146,1
441,4 487,7
3Q2014 3Q2015 9M2014 9M2015

26 Working Capital & Net Debt
Average working capital days Net debt
• Net debt as of Sept. 30, 2015: TL 395 mn (US$ 130 mn)
• Net debt to EBITDA (LTM) is 1.0x
• Financial debt
- US$ denominated due to company strategy
- Maturity breakdown as of Sept. 30, 2015:
- Short term 7.3%
- Long term 92.7%
Cash & cash equivalents breakdown based on currency
- TL: 13,7 mn
- US$: 1.383,2 mn†
- Euro: - mn†
• Net working capital was TL 466 mn as of 9M15
and TL 305 mn at the end of 2014
• Working capital requirement over sales ratio was
21.0% in 9M2015 vs 23.0% in 9M2014
• FX short position of
TL 377 mn (US$ 124 mn)
† Amounts expressed in Turkish Lira “TL”
Average WC days
2011 2012 2013 2014 9M14 9M15
Trade receivables
87 84 76 72 77 71
Inventory 38 34 33 32 36 35
Trade payables 79 81 77 74 68 67
WC - days 46 37 32 30 45 39
Net debt - TL mn 2012 2013 2014 9M15
Financial debt 1.501 1.260 1.335 1.796
Short term financial debt 614 1.250 91 131
Long term financial debt 887 10 1.244 1.665
Non-trade receivables from related parties
131 3 0 4
Cash and cash equivalents 1.268 1.164 1.034 1.397
Net debt 102 92 301 395
55 102 96
301
395
2011 2012 2013 2014 9M15
Net Debt (TL mn)
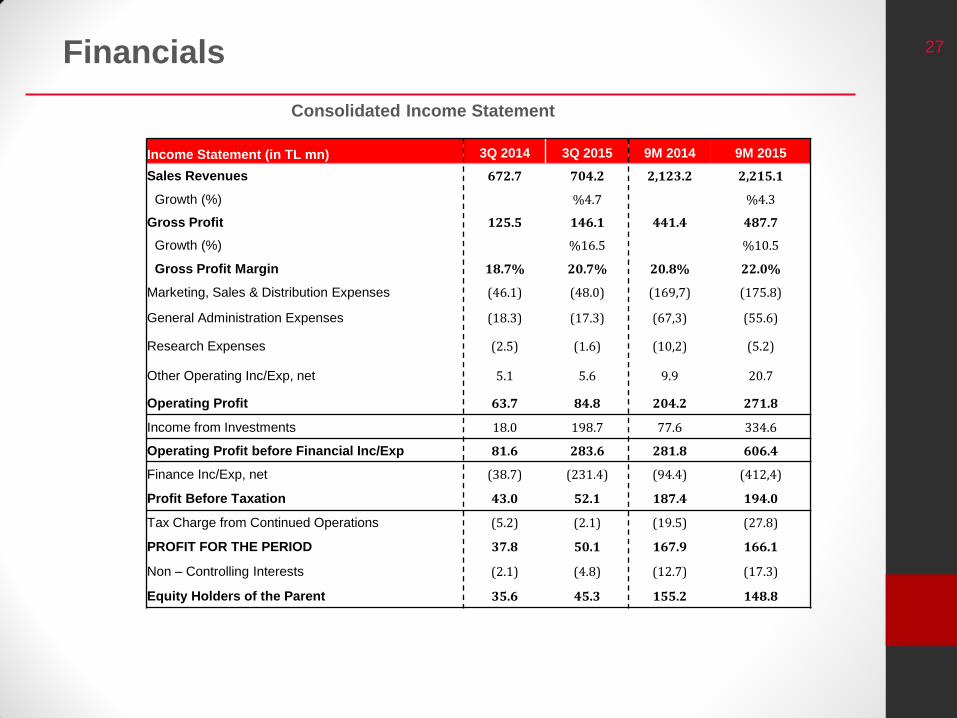
27 Financials
Consolidated Income Statement
Income Statement (in TL mn) 3Q 2014 3Q 2015 9M 2014 9M 2015
Sales Revenues 672.7 704.2 2,123.2 2,215.1
Growth (%) %4.7 %4.3
Gross Profit 125.5 146.1 441.4 487.7
Growth (%) %16.5 %10.5
Gross Profit Margin 18.7% 20.7% 20.8% 22.0%
Marketing, Sales & Distribution Expenses (46.1) (48.0) (169,7) (175.8)
General Administration Expenses (18.3) (17.3) (67,3) (55.6)
Research Expenses (2.5) (1.6) (10,2) (5.2)
Other Operating Inc/Exp, net 5.1 5.6 9.9 20.7
Operating Profit 63.7 84.8 204.2 271.8
Income from Investments 18.0 198.7 77.6 334.6
Operating Profit before Financial Inc/Exp 81.6 283.6 281.8 606.4
Finance Inc/Exp, net (38.7) (231.4) (94.4) (412,4)
Profit Before Taxation 43.0 52.1 187.4 194.0
Tax Charge from Continued Operations (5.2) (2.1) (19.5) (27.8)
PROFIT FOR THE PERIOD 37.8 50.1 167.9 166.1
Non – Controlling Interests (2.1) (4.8) (12.7) (17.3)
Equity Holders of the Parent 35.6 45.3 155.2 148.8

28
1. Ülker: Ülker In Brief
2. Organic Growth Drivers
3. Inorganic Growth Opportunities & Godiva
4. Operational Performance
5. Financials
6. Appendix
3
8
13
18
24
29
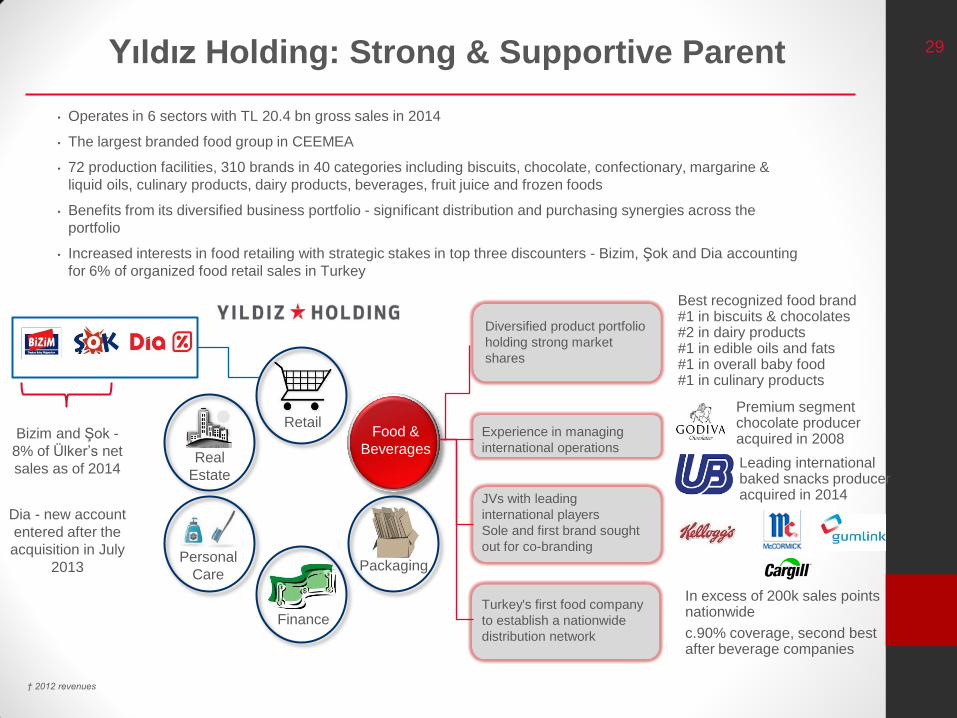
29
Experience in managing
international operations
• Operates in 6 sectors with TL 20.4 bn gross sales in 2014
• The largest branded food group in CEEMEA
• 72 production facilities, 310 brands in 40 categories including biscuits, chocolate, confectionary, margarine &
liquid oils, culinary products, dairy products, beverages, fruit juice and frozen foods
• Benefits from its diversified business portfolio - significant distribution and purchasing synergies across the
portfolio
• Increased interests in food retailing with strategic stakes in top three discounters - Bizim, Şok and Dia accounting
for 6% of organized food retail sales in Turkey
Yıldız Holding: Strong & Supportive Parent
Food &
Beverages
Packaging
Finance
Retail
Real
Estate
Personal
Care
Best recognized food brand #1 in biscuits & chocolates #2 in dairy products #1 in edible oils and fats #1 in overall baby food #1 in culinary products
Premium segment chocolate producer acquired in 2008
In excess of 200k sales points nationwide
c.90% coverage, second best after beverage companies
Diversified product portfolio
holding strong market
shares
JVs with leading
international players
Sole and first brand sought
out for co-branding
Turkey's first food company
to establish a nationwide
distribution network
Bizim and Şok -
8% of Ülker’s net
sales as of 2014
Dia - new account
entered after the
acquisition in July
2013
† 2012 revenues
Leading international baked snacks producer acquired in 2014
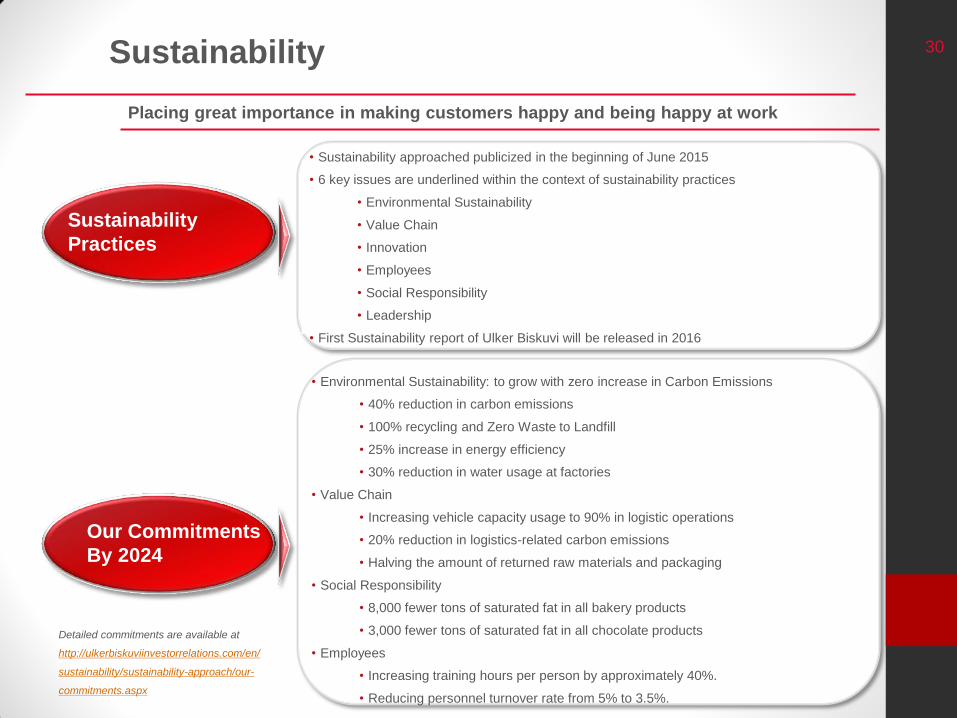
30 Sustainability
Placing great importance in making customers happy and being happy at work
Sustainability
Practices
Our Commitments
By 2024
• Sustainability approached publicized in the beginning of June 2015
• 6 key issues are underlined within the context of sustainability practices
• Environmental Sustainability
• Value Chain
• Innovation
• Employees
• Social Responsibility
• Leadership
• First Sustainability report of Ulker Biskuvi will be released in 2016
• Environmental Sustainability: to grow with zero increase in Carbon Emissions
• 40% reduction in carbon emissions
• 100% recycling and Zero Waste to Landfill
• 25% increase in energy efficiency
• 30% reduction in water usage at factories
• Value Chain
• Increasing vehicle capacity usage to 90% in logistic operations
• 20% reduction in logistics-related carbon emissions
• Halving the amount of returned raw materials and packaging
• Social Responsibility
• 8,000 fewer tons of saturated fat in all bakery products
• 3,000 fewer tons of saturated fat in all chocolate products
• Employees
• Increasing training hours per person by approximately 40%.
• Reducing personnel turnover rate from 5% to 3.5%.
Detailed commitments are available at
http://ulkerbiskuviinvestorrelations.com/en/
sustainability/sustainability-approach/our-
commitments.aspx
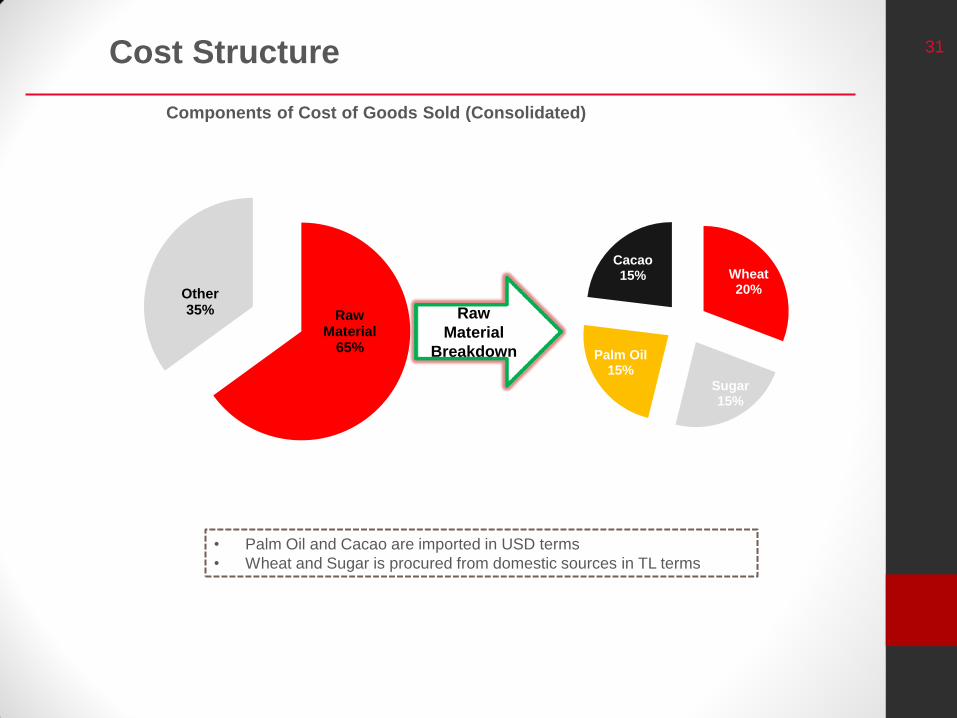
31 Cost Structure
Components of Cost of Goods Sold (Consolidated)
Raw Material
65%
Other 35% Raw
Material
Breakdown
Wheat 20%
Sugar 15%
Palm Oil 15%
Cacao 15%
• Palm Oil and Cacao are imported in USD terms
• Wheat and Sugar is procured from domestic sources in TL terms
32 Disclaimer
• This presentation contains information and analysis on financial statements and is prepared for the sole purpose
of providing information relating to Ülker Bisküvi Sanayi A.Ş. (“Ülker”)
• This presentation contains forward-looking statements which are based on certain expectations and
assumptions at the time of publication of this presentation and are subject to risks and uncertainties that could
cause actual results to differ materially from those expressed in these materials. Many of these risks and
uncertainties relate to factors that are beyond Ülker’s ability to control or estimate precisely, such as future
market and economic conditions, the behavior of other market participants, the ability to successfully integrate
acquired businesses and achieve anticipated cost savings and productivity gains as well as the actions of
government regulators
• Readers are cautioned not to place undue reliance on these forward-looking statements, which apply only as of
the date of this presentation. Ülker does not undertake any obligation to publicly release any revisions to these
forward-looking statements to reflect events or circumstances after the date of these materials
• This presentation merely serves the purpose of providing information. It neither represents an offer for sale nor
for subscription of securities in any country, including Turkey. This presentation does not include an official offer
of shares; an offering circular will not be published
• This presentation is not allowed to be reproduced, distributed or published without permission or agreement of
Ülker
• The figures in this presentation are rounded to provide a better overview. The calculation of deviations is based
on figures including fractions. Therefore rounding differences may occur
• Neither Ülker nor any of its managers or employees nor any other person shall have any liability whatsoever for
any loss arising from the use of this presentation
Related Documents