18-9-2013 Challenge the future Delft University of Technology CIE4491 Lecture. How to quantify stormwater flow – urban rainfall data and resolution Marie-claire ten Veldhuis

Welcome message from author
This document is posted to help you gain knowledge. Please leave a comment to let me know what you think about it! Share it to your friends and learn new things together.
Transcript

18-9-2013
Challenge the future
Delft University of Technology
CIE4491 Lecture. How to quantify stormwater flow – urban rainfall data and resolution Marie-claire ten Veldhuis
Thomas
Typewritten Text
Source: news.bbc.co.uk

3 CIE4491 Lecture Urban rainfall data and resolution
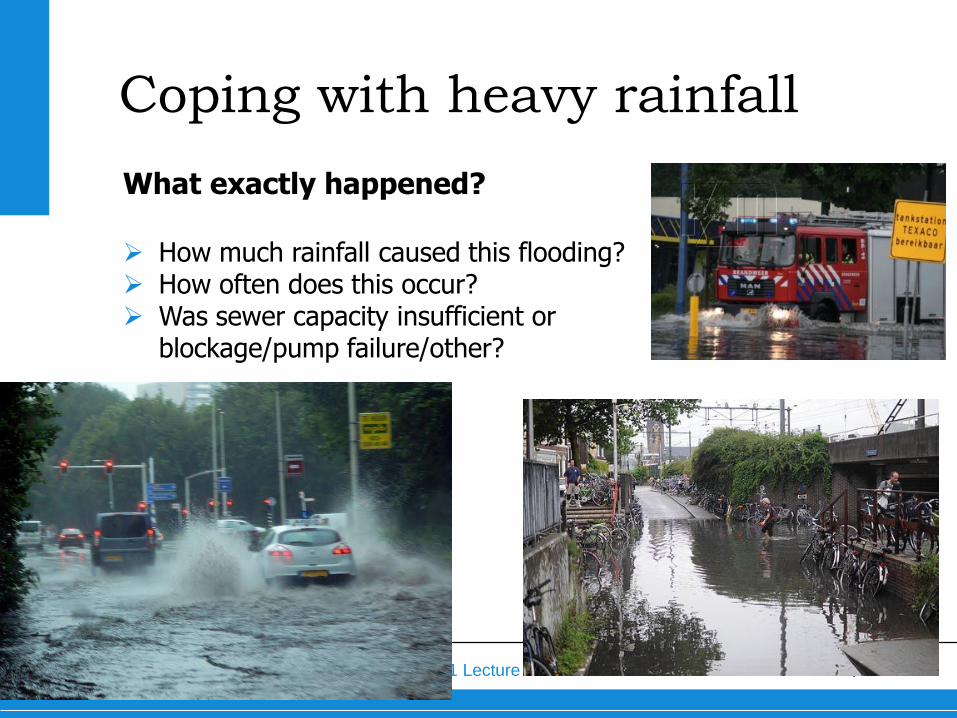
Coping with heavy rainfall
- 1st challenge: rainfall data
4 CIE4491 Lecture Urban rainfall data and resolution
Coping with heavy rainfall
What exactly happened? How much rainfall caused this flooding? How often does this occur? Was sewer capacity insufficient or
blockage/pump failure/other?

5 CIE4491 Lecture Urban rainfall data and resolution
Pmax
0.000
0.200
0.400
0.600
0.800
1.000
1.200
0 2 4 6 8 10 12 14 16
A [L2]
rain
fall [
L/T
]
Area effect Max precipitation
Area size
Average rainfall area A1
Average rainfall area A2
We need representative, local
rainfall data for analysis

6 CIE4491 Lecture Urban rainfall data and resolution
How do we measure
rainfall in cities?

7 CIE4491 Lecture Urban rainfall data and resolution
Nearest rain gauge: Rotterdam Airport NB: for 10 min time step

8 CIE4491 Lecture Urban rainfall data and resolution

9 CIE4491 Lecture Urban rainfall data and resolution
Typical set-up rain gauge
Why not in cities?
Courtesy: kees floor.nl
Distance to nearest
obstacle:
2-4x height obstacle
above rain gauge
No wind influence
(KNMI, 2000)

10 CIE4491 Lecture Urban rainfall data and resolution

11 CIE4491 Lecture Urban rainfall data and resolution
Gemeentewerf (Hoogvliet, werf Gadering)
Basisschool (Lansingerland, BS de Poort)
Rioolgemaal (Bolnes, gemaal)

12 CIE4491 Lecture Urban rainfall data and resolution
Hoe meten we neerslag …
radar

13 Titel van de presentatie | xx
Rainfall radar

14 CIE4491 Lecture Urban rainfall data and resolution
KNMI radars: 2 locations: de Bilt, Den Helder C-Band 4-8 GHz Spatial density (pixel size): 1 km2
Radar: spatial rainfall monitoring
Locations of weather radars in De Bilt and Den Helder and their 200-km range (circles)
(Courtesy KNMI) KNMI weather radar in De Bilt (Courtesy KNMI)

15 CIE4491 Lecture Urban rainfall data and resolution
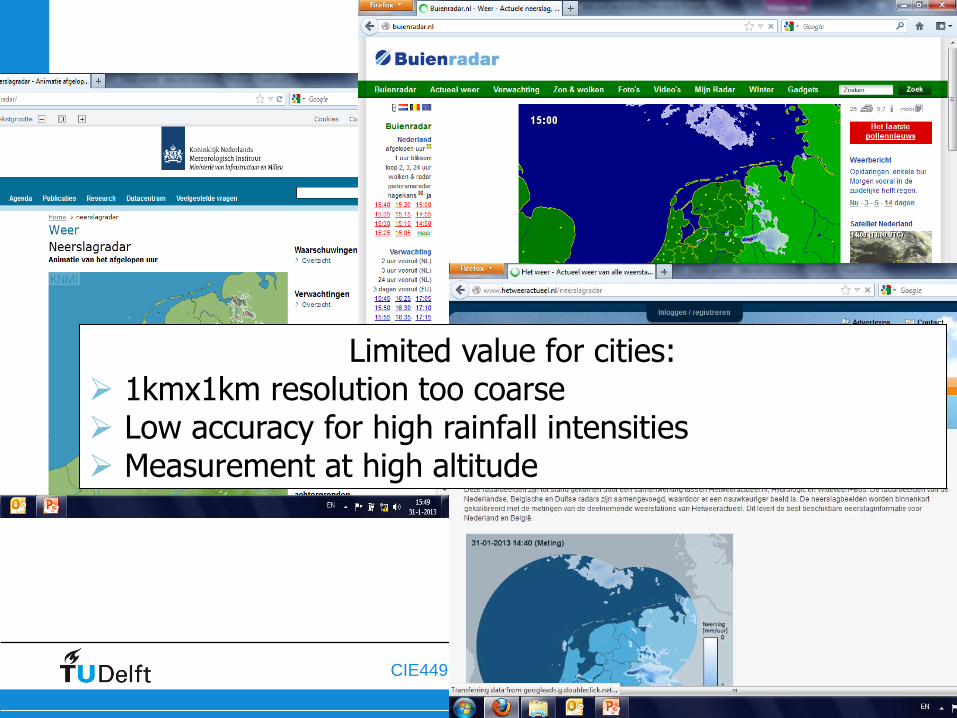
16 CIE4491 Lecture Urban rainfall data and resolution
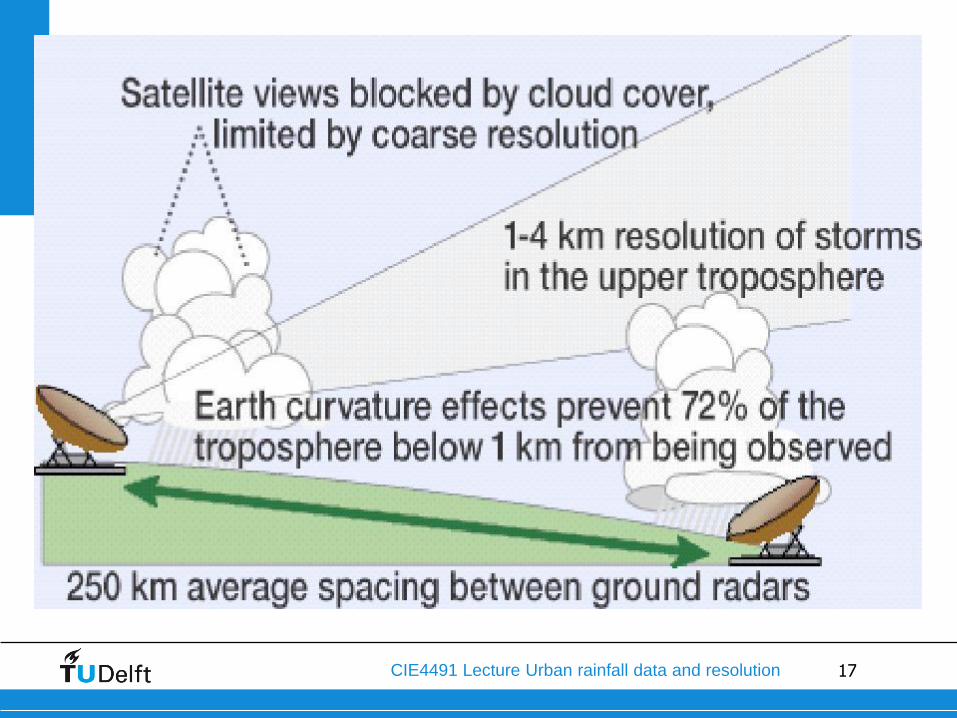
Limited value for cities: 1kmx1km resolution too coarse Low accuracy for high rainfall intensities Measurement at high altitude
17 CIE4491 Lecture Urban rainfall data and resolution

18 CIE4491 Lecture Urban rainfall data and resolution
Drainage area Oranjepolder: 4.9 km2
Data resolution for urban hydrology
High degree of imperviousness fast runoff processes High spatial variability of urban functions
Need for high resolution data: in time and in space
0
2
4
6
8
10
12
14
16
18
200
0,1
0,2
0,3
0,4
0,5
0,6
0,7
0,8
00:00 00:15 00:30 00:45 01:00 01:15 01:30 01:45 02:00 02:16
mm
/5
min
Flo
w [
m3
/s]
Time [hh:mm]
Response times urban catchments: order of minutes

19 CIE4491 Lecture Urban rainfall data and resolution
Data resolution for urban hydrology

20 CIE4491 Lecture Urban rainfall data and resolution
RAINGAIN :
high resolution rainfall data
for urban flood prediction EU-project: 4 countries (B, F, NL, UK), 13 partners Case studies: Leuven, London, Paris, Rotterdam Rotterdam: Dual polarimetry, Doppler X-band radar Network of rain gaugees on the grond
Telegraaf, 11 mei 2013
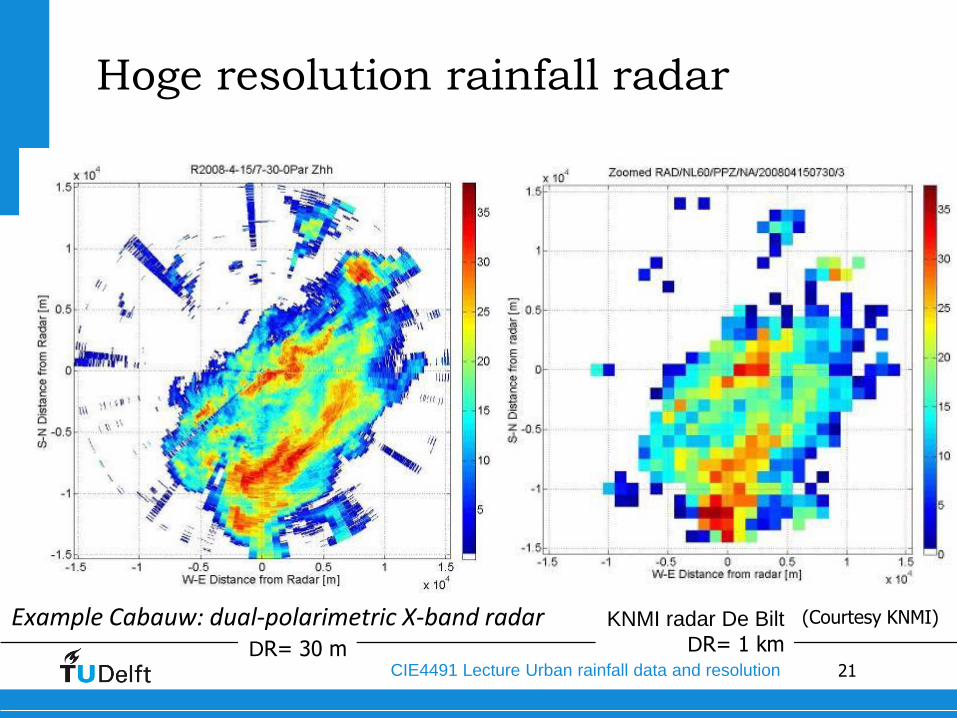
21 CIE4491 Lecture Urban rainfall data and resolution
Example Cabauw: dual-polarimetric X-band radar KNMI radar De Bilt
DR= 1 km
(Courtesy KNMI)
Hoge resolution rainfall radar
DR= 30 m
22 CIE4491 Lecture Urban rainfall data and resolution
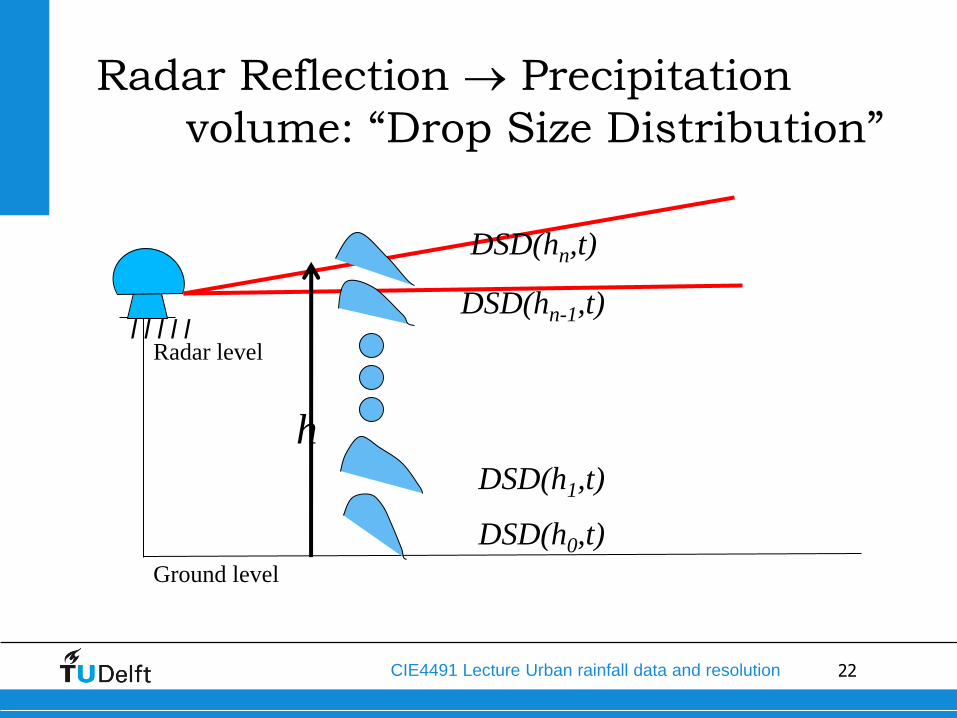
l l l l l
h
DSD(h0,t)
DSD(h1,t)
DSD(hn-1,t)
DSD(hn,t)
Ground level
Radar level
Radar Reflection Precipitation
volume: “Drop Size Distribution”
23 CIE4491 Lecture Urban rainfall data and resolution
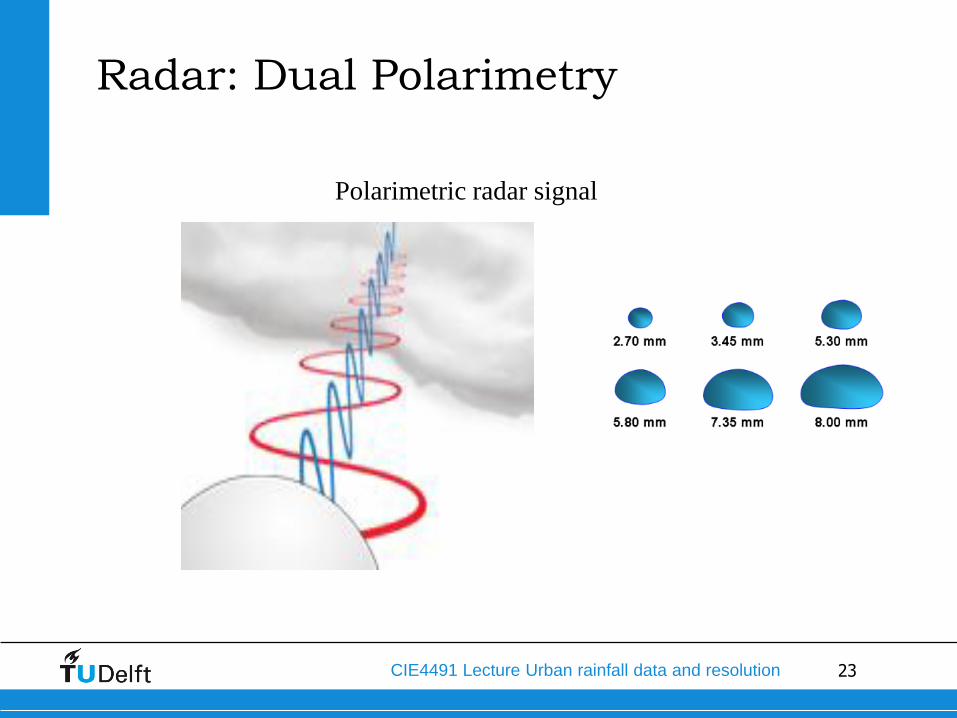
Radar: Dual Polarimetry
Polarimetric radar signal
24 CIE4491 Lecture Urban rainfall data and resolution
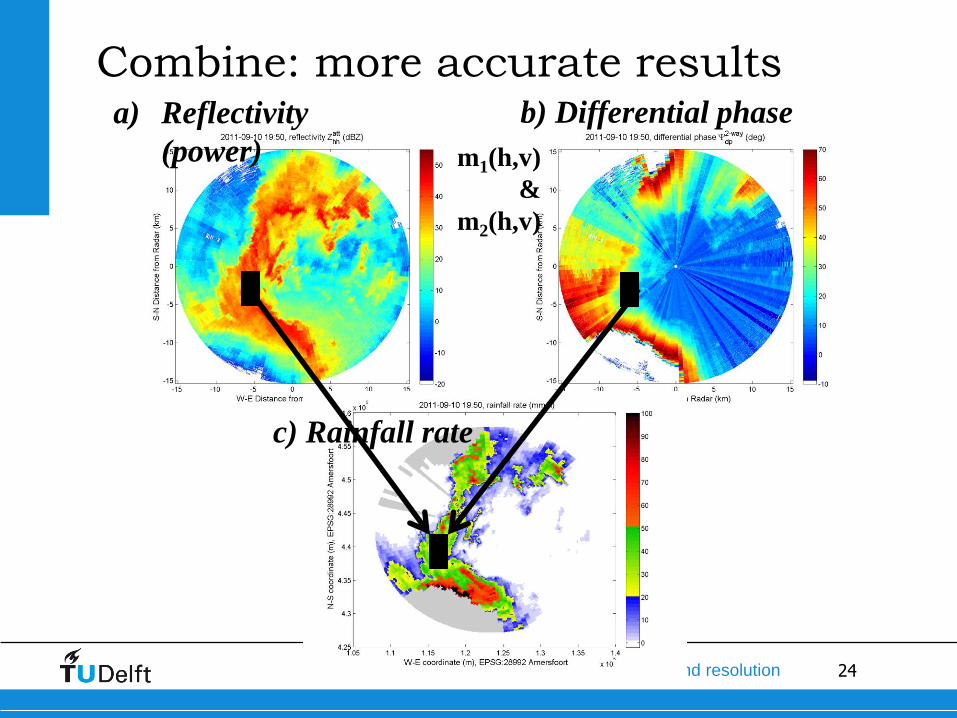
a) Reflectivity
(power)
b) Differential phase
c) Rainfall rate
m1(h,v)
&
m2(h,v)
Combine: more accurate results

25 CIE4491 Lecture Urban rainfall data and resolution
What happens between 150 m height and the ground? How to compare: rain gauge 0.2 m2 vs radar pixel 30mx30m
Radar height: 150 m
“ground truthing”: rain gauges
l l l l l
h
DSD(h0,t) DSD(h1,t)
DSD(hn-1,t) DSD(hn,t)
Ground
level
Radar
level

26 CIE4491 Lecture Urban rainfall data and resolution
Rainfall- maximum intensity map
X-band radar 100 m X-band radar 500 m
Spatial resolution comparison

27 Titel van de presentatie | xx
Rainfall spatial and temporal
resolution

28 CIE4491 Lecture Urban rainfall data and resolution
333 m
5 min
2.5 min
1.25 min
1 km
111 m
Principle of spatio-temporal downscaling
Effect of spatial and temporal
resolution on variability

29 CIE4491 Lecture Urban rainfall data and resolution
0 0 1 0 5 1 0 2 0 1 0 0
0 0 2 0 2 0 2 5 1 0 2 0
2 2 5 15 10 30 10 5 2 5 0 1
1 2 15 10 20 60 30 20 10 2 5 0
1 1 20 30 50 20 10 30 5 0 0 1
0 1 30 60 50 90 50 30 10 5 0 1
0 40 60 90 70 10 60 10 2 1 0 0
10 10 30 40 10 30 15 5 0 0 1 2
0 10 5 20 20 10 2 0 2 1 0 1
5 3 1 5 10 2 0 1 0 0 2 0
0 0 0 5 2 0 0 0 2 1 0 0
0 2 0 0 2 1 0 0 0 0 0 0
Rainfall radar measurement [mm/h] 50mx50m resolution Calculate: 100mx100m values 500mx500m values
Effect of spatial and temporal
resolution on variability
Example: effect of spatial upscaling/averaging: “area effect”

30 CIE4491 Lecture Urban rainfall data and resolution
0 0.8 2 2.3 0.5 0.5
1.8 11 30 16 4.8 1.5
0.8 35 53 30 5 0.5
15 55 30 23 0.8 0.8
4.5 9 11 0.8 0.8 0.8
0.5 1.3 1.3 0 0.8 0
Rainfall radar measurement [mm/h] 100mx100m resolution
Effect of spatial and temporal
resolution on variability
Example: effect of spatial upscaling/averaging: “area effect”

31 CIE4491 Lecture Urban rainfall data and resolution
13.6
0
Rainfall radar measurement [mm/h] 500mx500m resolution
Effect of spatial and temporal
resolution on variability
Example: effect of spatial upscaling/averaging: “area effect”

32 CIE4491 Lecture Urban rainfall data and resolution
0 0,75 0,75 1,75 2 0,75 2,25 2 0,5 0,75 0,5 0
1 2,25 5,5 6,75 10,5 10,5 5,5 3,25 2 1,75 0,75 0,5
1,75 6 11,25 13,75 30 32,5 16,25 9,25 4,75 3 1,5 0,5
1,25 9,5 18,75 27,5 37,5 30 22,5 16,25 4,25 1,75 1,5 0,5
0,75 13 35 47,5 52,5 42,5 30 18,75 5 1,25 0,5 1
10,25 32,75 60 67,5 55 52,5 37,5 13 4,5 1,5 0,25 0,5
15 35 55 52,5 30 28,75 22,5 4,25 0,75 0,5 0,75 1
7,5 13,75 23,75 22,5 17,5 14,25 5,5 1,75 0,75 0,5 1 1,5
4,5 4,75 7,75 13,75 10,5 3,5 0,75 0,75 0,75 0,75 0,75 0,5
2 1 2,75 5,5 3,5 0,5 0,25 0,75 0,75 0,75 0,5 0
0,5 0,5 1,25 2,25 1,25 0,25 0 0,5 0,75 0,25 0 0
1 1 0 1 1,5 0,5 0 0 0 0 0 0
Rainfall radar measurement [mm/h] 100mx100m resolution Max: 67.5 mm/h
Effect of spatial and temporal
resolution on variability
Example: effect of spatial upscaling/averaging: “area effect”

33 CIE4491 Lecture Urban rainfall data and resolution
0 0,75 0,75 1,75 2 0,75 2,25 2 0,5 0,75 0,5 0
1 2,25 5,5 6,75 10,5 10,5 5,5 3,25 2 1,75 0,75 0,5
1,75 6 11,25 13,75 30 32,5 16,25 9,25 4,75 3 1,5 0,5
1,25 9,5 18,75 27,5 37,5 30 22,5 16,25 4,25 1,75 1,5 0,5
0,75 13 35 47,5 52,5 42,5 30 18,75 5 1,25 0,5 1
10,25 32,75 60 67,5 55 52,5 37,5 13 4,5 1,5 0,25 0,5
15 35 55 52,5 30 28,75 22,5 4,25 0,75 0,5 0,75 1
7,5 13,75 23,75 22,5 17,5 14,25 5,5 1,75 0,75 0,5 1 1,5
4,5 4,75 7,75 13,75 10,5 3,5 0,75 0,75 0,75 0,75 0,75 0,5
2 1 2,75 5,5 3,5 0,5 0,25 0,75 0,75 0,75 0,5 0
0,5 0,5 1,25 2,25 1,25 0,25 0 0,5 0,75 0,25 0 0
1 1 0 1 1,5 0,5 0 0 0 0 0 0
Rainfall radar measurement [mm/h] 100mx100m resolution Max: 67.5 mm/h
Effect of spatial and temporal
resolution on variability
Example: effect of spatial upscaling/averaging: “area effect”
34 CIE4491 Lecture Urban rainfall data and resolution
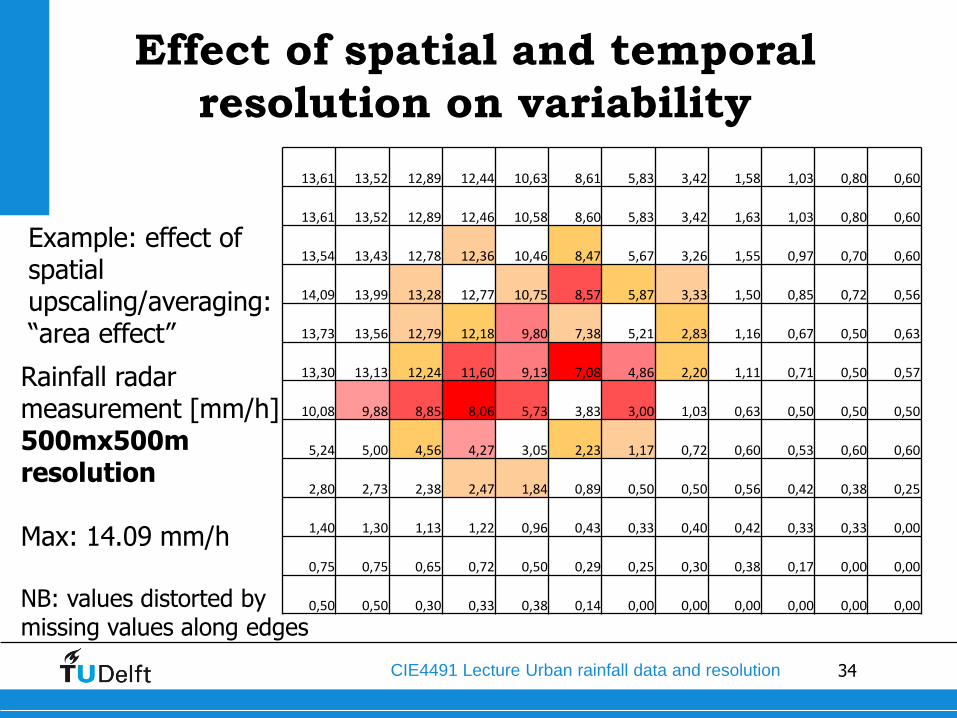
13,61 13,52 12,89 12,44 10,63 8,61 5,83 3,42 1,58 1,03 0,80 0,60
13,61 13,52 12,89 12,46 10,58 8,60 5,83 3,42 1,63 1,03 0,80 0,60
13,54 13,43 12,78 12,36 10,46 8,47 5,67 3,26 1,55 0,97 0,70 0,60
14,09 13,99 13,28 12,77 10,75 8,57 5,87 3,33 1,50 0,85 0,72 0,56
13,73 13,56 12,79 12,18 9,80 7,38 5,21 2,83 1,16 0,67 0,50 0,63
13,30 13,13 12,24 11,60 9,13 7,08 4,86 2,20 1,11 0,71 0,50 0,57
10,08 9,88 8,85 8,06 5,73 3,83 3,00 1,03 0,63 0,50 0,50 0,50
5,24 5,00 4,56 4,27 3,05 2,23 1,17 0,72 0,60 0,53 0,60 0,60
2,80 2,73 2,38 2,47 1,84 0,89 0,50 0,50 0,56 0,42 0,38 0,25
1,40 1,30 1,13 1,22 0,96 0,43 0,33 0,40 0,42 0,33 0,33 0,00
0,75 0,75 0,65 0,72 0,50 0,29 0,25 0,30 0,38 0,17 0,00 0,00
0,50 0,50 0,30 0,33 0,38 0,14 0,00 0,00 0,00 0,00 0,00 0,00
Rainfall radar measurement [mm/h] 500mx500m resolution Max: 14.09 mm/h NB: values distorted by missing values along edges
Effect of spatial and temporal
resolution on variability
Example: effect of spatial upscaling/averaging: “area effect”

35 CIE4491 Lecture Urban rainfall data and resolution
NB1: values distorted by missing values along edges NB2: rain gauge collector area 0.02-0.04 m2 << radar pixel size
Effect of spatial and temporal
resolution on variability
Example: effect of spatial upscaling/averaging: “area effect”
Resolution Max value Mean STD
50mx50m 90 9.7 17.7
100mx100m 67.5 9.6 15.0
500x500m 14.1 4.2 4.9
36 CIE4491 Lecture Urban rainfall data and resolution
Rainfall data in cities - summary
Especially in urban areas: high temporal and spatial resolutions
essential
Available rainfall measurement techniques:
Point measurements:
Funnel: manual reading
Rain gauge: tipping bucket, electronic rain gauge, optical rain gauge
Disdrometers: measure drop size distribution
Spatial measurements:
Ground-based radar: varying spatial resolutions and accuracies

37 CIE4491 Lecture Urban rainfall data and resolution
Rainfall data in cities - summary
Available rainfall data, current practice:
1 rain gauge nearby (e.g. Delft: KNMI station R’dam Airport)
Radar images 1kmx1km (merged images De Bilt/Den Helder radars)
Available temporal resolution:
KNMI stations: 5 minutes, 33 stations in NL; 24 hours, 325 stations
other stations: local projects, weather amateurs: variable resolution
KNMI Radar (=buienradar and others): 5 minutes
Rainfall record duration:
KNMI stations: 10s of years
other stations: months or a few years
KNMI radar 1kmx1km since 2008
38 CIE4491 Lecture Urban rainfall data and resolution
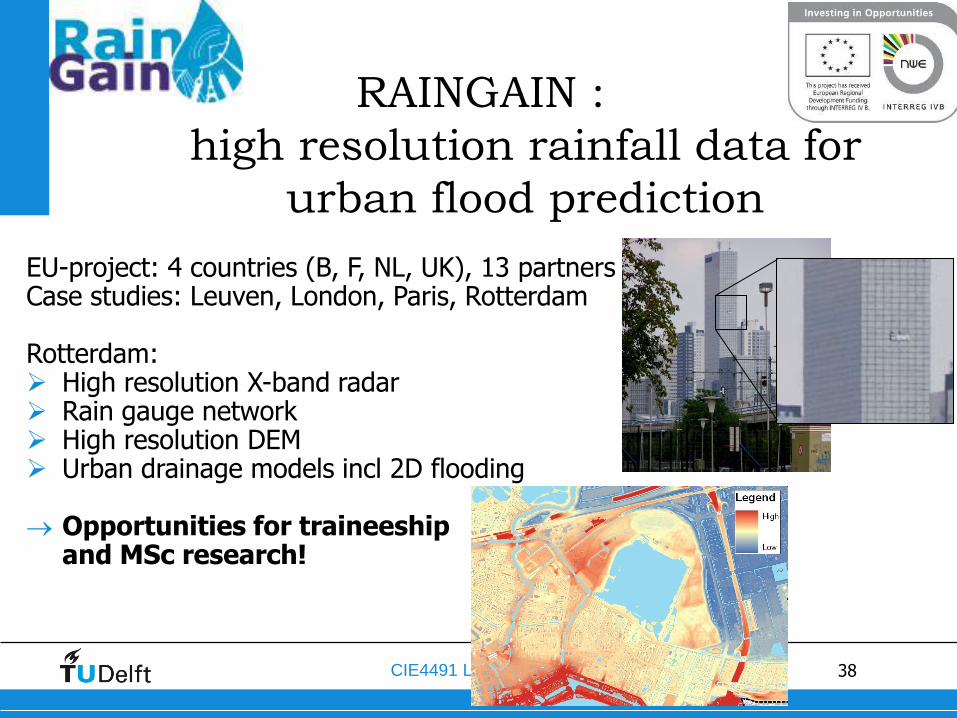
RAINGAIN :
high resolution rainfall data for
urban flood prediction
EU-project: 4 countries (B, F, NL, UK), 13 partners Case studies: Leuven, London, Paris, Rotterdam Rotterdam: High resolution X-band radar Rain gauge network High resolution DEM Urban drainage models incl 2D flooding Opportunities for traineeship
and MSc research!
Related Documents