Welcome message from author
This document is posted to help you gain knowledge. Please leave a comment to let me know what you think about it! Share it to your friends and learn new things together.
Transcript
PowerPoint® 2007Graphics & Animation
Made EASY

This page intentionally left blank
Made Easy/PowerPoint 2007 Graphics & Animation/Slack/0071600760/FM
S. E. Slack
Michelle I. Zavala
New York Chicago San Francisco
Lisbon London Madrid Mexico City
Milan New Delhi San Juan
Seoul Singapore Sydney Toronto
PowerPoint® 2007Graphics & Animation
Made EASY
Copyright © 2009 by The McGraw-Hill Companies. All rights reserved. Except as permitted under the United States Copyright Act of 1976, no part of this publica-tion may be reproduced or distributed in any form or by any means, or stored in a database or retrieval system, without the prior written permission of the publisher.
ISBN: 978-0-07-160077-4
MHID: 0-07-160077-9
The material in this eBook also appears in the print version of this title: ISBN: 978-0-07-160076-7, MHID: 0-07-160076-0.
All trademarks are trademarks of their respective owners. Rather than put a trademark symbol after every occurrence of a trademarked name, we use names in an edi-torial fashion only, and to the benefit of the trademark owner, with no intention of infringement of the trademark. Where such designations appear in this book, theyhave been printed with initial caps.
McGraw-Hill eBooks are available at special quantity discounts to use as premiums and sales promotions, or for use in corporate training programs. To contact a rep-resentative please visit the Contact Us page at www.mhprofessional.com.
TERMS OF USE
This is a copyrighted work and The McGraw-Hill Companies, Inc. (“McGraw-Hill”) and its licensors reserve all rights in and to the work. Use of this work is subjectto these terms. Except as permitted under the Copyright Act of 1976 and the right to store and retrieve one copy of the work, you may not decompile, disassemble,reverse engineer, reproduce, modify, create derivative works based upon, transmit, distribute, disseminate, sell, publish or sublicense the work or any part of it without McGraw-Hill’s prior consent. You may use the work for your own noncommercial and personal use; any other use of the work is strictly prohibited. Your rightto use the work may be terminated if you fail to comply with these terms.
THE WORK IS PROVIDED “AS IS.” McGRAW-HILL AND ITS LICENSORS MAKE NO GUARANTEES OR WARRANTIES AS TO THE ACCURACY, ADE-QUACY OR COMPLETENESS OF OR RESULTS TO BE OBTAINED FROM USING THE WORK, INCLUDING ANY INFORMATION THAT CAN BEACCESSED THROUGH THE WORK VIA HYPERLINK OR OTHERWISE, AND EXPRESSLY DISCLAIM ANY WARRANTY, EXPRESS OR IMPLIED,INCLUDING BUT NOT LIMITED TO IMPLIED WARRANTIES OF MERCHANTABILITY OR FITNESS FOR A PARTICULAR PURPOSE. McGraw-Hill andits licensors do not warrant or guarantee that the functions contained in the work will meet your requirements or that its operation will be uninterrupted or error free.Neither McGraw-Hill nor its licensors shall be liable to you or anyone else for any inaccuracy, error or omission, regardless of cause, in the work or for any damagesresulting therefrom. McGraw-Hill has no responsibility for the content of any information accessed through the work. Under no circumstances shall McGraw-Hilland/or its licensors be liable for any indirect, incidental, special, punitive, consequential or similar damages that result from the use of or inability to use the work,even if any of them has been advised of the possibility of such damages. This limitation of liability shall apply to any claim or cause whatsoever whether such claimor cause arises in contract, tort or otherwise.
Contents at a Glance
For my Tink, who animates my life in many joyful ways.
—S. E. Slack
For my family. Thank you for your unending love and encouragement.
—Michelle I. Zavala
Made Easy/PowerPoint 2007 Graphics & Animation/Slack/0071600760/FM
About the Authors
S. E. Slack is a lifestyle and technology writer and author with more than 17 years of experience in business writing. Since the early 1990s, she has been a fan of PowerPoint. She has used it extensively in both professional and personal settings and has trained others on how to use its various features. As a communications professional, she is skilled at using graphics and animations to support a point without detracting from the message at hand. She uses PowerPoint 2007 regularly and has created more than 50 online training clips on the topic.
As a writer with more than 25 years of experience, Michelle I. Zavala is proficient in creating PowerPoint presentations in the business environment. She enjoys telling client stories in dynamic, interesting ways and credits PowerPoint 2007 for adding more punch to even the simplest presentations. She has developed PowerPoint presentations for a variety of audiences including customers, corporate executives, and stakeholders.
Made Easy/PowerPoint 2007 Graphics & Animation/Slack/0071600760/FM
vii
Contents at a Glance
Chapter 1 Creating Slide Layouts That Pop 1
Chapter 2 Creating Custom Layouts 17
Chapter 3 Illustrating with Pictures 27
Chapter 4 Creating a Photo Album 47
Chapter 5 Working with Clip Art 61
Chapter 6 Working with Tables 77
Chapter 7 Using WordArt to Make Your Point 89
Chapter 8 Creating Effective Shapes 107
Chapter 9 Comparing and Illustrating Content with SmartArt 121
Chapter 10 Adding a Movie to Your Presentation 139
Chapter 11 Adding Sound to Your Presentation 149
Chapter 12 Creating and Using Animation 163
Chapter 13 Importing Excel Content into PowerPoint 2007 181
Chapter 14 Moving Graphics Between Word and PowerPoint 189
Chapter 15 Working with Charts as Design Elements 197

viii
Made Easy/PowerPoint 2007 Graphics & Animation/Slack/0071600760/FM
Acknowledgments
There are many people behind the scenes who work tirelessly to bring a book from concept to the bookshelf. First and foremost, I’d like to thank Roger Stewart at McGraw-Hill for giving me the opportunity to share my experiences with other PowerPoint users through this book. Without his vision and guidance, this book would never have been written.
Carly Stapleton at McGraw-Hill is always a joy to work with; many thanks to her for gently prodding me along! Thanks to Jennifer Kettell for her techni-cal review. From a production standpoint, kudos go to LeeAnn Pickrell for all the work she did to make me look and sound good in print. LeeAnn is a copy editor extraordinaire with the patience to match. And a big thank you to everyone behind the scenes who helped with graphics and other editing details. Your expertise is greatly appreciated.
I cannot write these acknowledgments without mentioning Neil Salkind and Studio B. Neil, you are a continuing inspiration to me, and I thank you from the bottom of my heart for all you do for me. You are heads and shoulders above all other agents; you have my undying trust and loyalty. Studio B, too, is forever in my heart. I couldn’t do what I do without each and every one of you at Studio B who ensure I can continue to do what I love best.
Finally, thanks to Greg and Alia for lighting up my life with daily animation.
—S. E. Slack
ix
Contents at a Glance
Made Easy/PowerPoint 2007 Graphics & Animation/Slack/0071600760/FM
Sally, thank you for believing in me. Your expertise, guidance, and humor made this a fun, rewarding experience.
My thanks to Roger Stewart at McGraw-Hill for taking a chance on me and to Carly Stapleton at McGraw-Hill for coordinating the content seamlessly. Thank you also to Lee Ann Pickrell for paying attention to the details while making my words “gel” consistently across the pages and to Jennifer Kettell for dealing with the particulars involved in the technical edit.
Many thanks to the behind-the-scenes folks who made the hard work look easy on the graphics and editing side of things. And thank yous would not be complete without a shout-out to Neil Salkind, agent extraordinaire, and to Studio B.
Last but not least, a heartfelt thank you to my family for bringing love and laughter into my life, and to God for loving me as only He can and blessing me as only He does.
—Michelle I. Zavala
x
Made Easy/PowerPoint 2007 Graphics & Animation/Slack/0071600760/FM
You know the basics of PowerPoint 2007; now it’s time to create imaginative graphics and animations that capture your audience’s attention. As long-time users of PowerPoint, we’ve designed this book to help you understand and use graphics and animations as easily as possible so you, too, can create professional, polished presentations with ease. In this book, you’ll discover how to create and effectively apply SmartArt, WordArt, charts, tables, shapes, and custom animations. You’ll also learn how to work with photos, clip art, movies, and sounds to give your presentations a distinctive and professional look.
Along with information on designing general layouts using PowerPoint 2007’s built-in features, this book also explains each of PowerPoint’s ten basic graphic and animation types. The final part of the book will discuss how to use PowerPoint graphics with Excel and Word, as well as how to rehearse your presentation to verify your graphics and animations are working perfectly.
Throughout the book, you’ll find
Step-by-step instructions and practical advice π
One-of-a-kind tips for creating and applying PowerPoint 2007 graphics π
and animations
Screen captures, photos, and art wherever it is needed so you can π
visualize and understand the topic under discussion
Introduction
xi
Briefings, which are short, nontechnical backgrounders on relevant π
people, companies, and technologies or topics of interest
Memos, which are marginal notes, tips, and reminders that offer π
useful advice or warn you about potential hazards
The Easy Way, handy tips that provide information about the best way π
to use features so you can accomplish tasks more easily
As you read each chapter, keep an eye out for these helpful elements.

This page intentionally left blank
11Creating Slide Layouts That PopPowerPoint 2007 is a terrific tool to help others understand and remember condensed information in a memorable way. Typically, PowerPoint presentations consist of slides that rely on a combination of words (text) and images (graphics and/or animations) to drive home a point. The way you combine these elements creates the design (layout) of the slide. Layouts are crucial to making a slide understandable and unforgettable.
By combining text and visual objects on a slide, you can reach nearly every member of an audience with your message. The trick to using PowerPoint graphics and animations effectively, however, is to place the objects on the slide in a pleasing manner. Too many objects on a single slide, for example, and the audience can lose the entire point you’re attempting to make. But a single object used properly will successfully capture an audience’s attention and drive home the information.
In this chapter, we’ll take a look at some basic design concepts to help you lay out your text, graphics, and animations as effectively as possible. Understanding typography, design principles, and the basics of designing a layout set the foundation for creating powerful presentations using PowerPoint 2007.
PowerPoint 2007 Graphics and Animation Made Easy
2
Made Easy/PowerPoint 2007 Graphics & Animation/Slack/0071600760/Chapter 1
2
Understanding TypographyIn its most basic form, typography is the art and technique of type design, characters, and arrangement. When we say type, we mean the text on your slide—type is how text on a page has been referred to for hundreds of years. The text should be set on the page to produce a readable, articulate, and visually satisfying whole object that makes it easy for readers to find what they want to read on a page.
In the old days, setting typography was a very specialized occupation. Creating the text, designing the pages, and setting them for printing took special skill and knowledge. Text wasn’t just thrown onto a page; it was carefully set to emphasize certain stories or illustrations. That emphasis was thoughtfully designed to bring readers quickly to main points on a page and then to lead them to other information on the same page. The goal, of course,
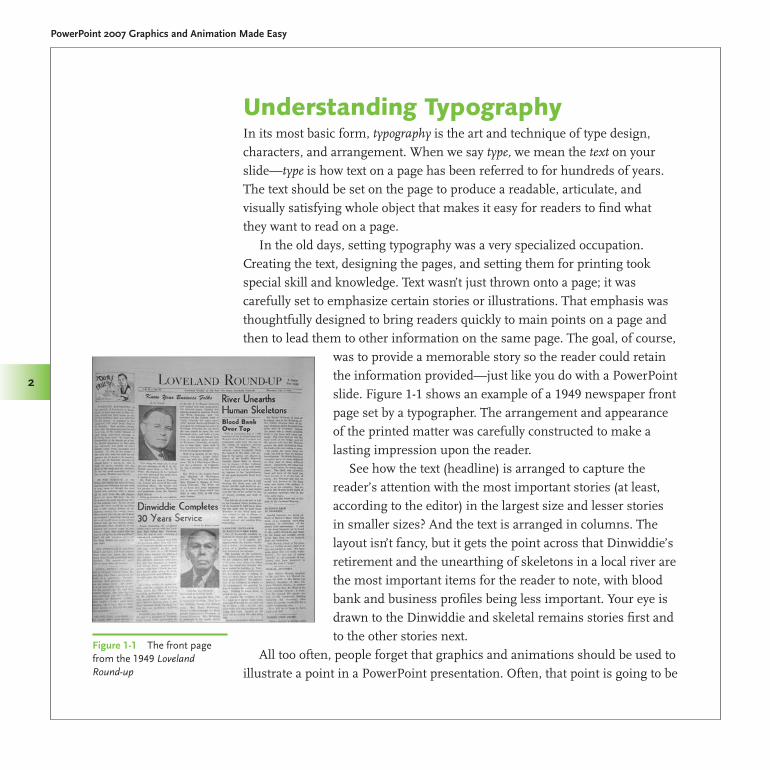
was to provide a memorable story so the reader could retain the information provided—just like you do with a PowerPoint slide. Figure 1-1 shows an example of a 1949 newspaper front page set by a typographer. The arrangement and appearance of the printed matter was carefully constructed to make a lasting impression upon the reader.
See how the text (headline) is arranged to capture the reader’s attention with the most important stories (at least, according to the editor) in the largest size and lesser stories in smaller sizes? And the text is arranged in columns. The layout isn’t fancy, but it gets the point across that Dinwiddie’s retirement and the unearthing of skeletons in a local river are the most important items for the reader to note, with blood bank and business profiles being less important. Your eye is drawn to the Dinwiddie and skeletal remains stories first and to the other stories next.
All too often, people forget that graphics and animations should be used to illustrate a point in a PowerPoint presentation. Often, that point is going to be
Figure 1-1 The front page from the 1949 Loveland Round-up
Made Easy/PowerPoint 2007 Graphics & Animation/Slack/0071600760/Chapter 1
Chapter 1 Creating Slide Layouts That Pop
3
presented in a text format. So understanding how to set up text on a slide so it is attractive and aids readers in following your messages is important. The graphics and animations you use should support those messages—they should never detract from them.
Figures 1-2 through 1-4 show examples of what we mean.
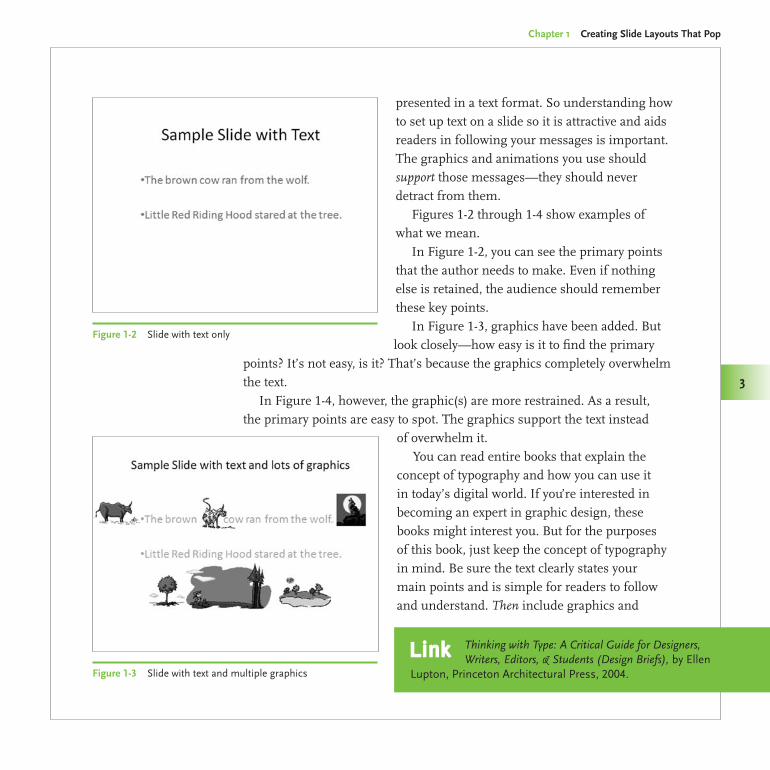
In Figure 1-2, you can see the primary points that the author needs to make. Even if nothing else is retained, the audience should remember these key points.
In Figure 1-3, graphics have been added. But look closely—how easy is it to find the primary
points? It’s not easy, is it? That’s because the graphics completely overwhelm the text.
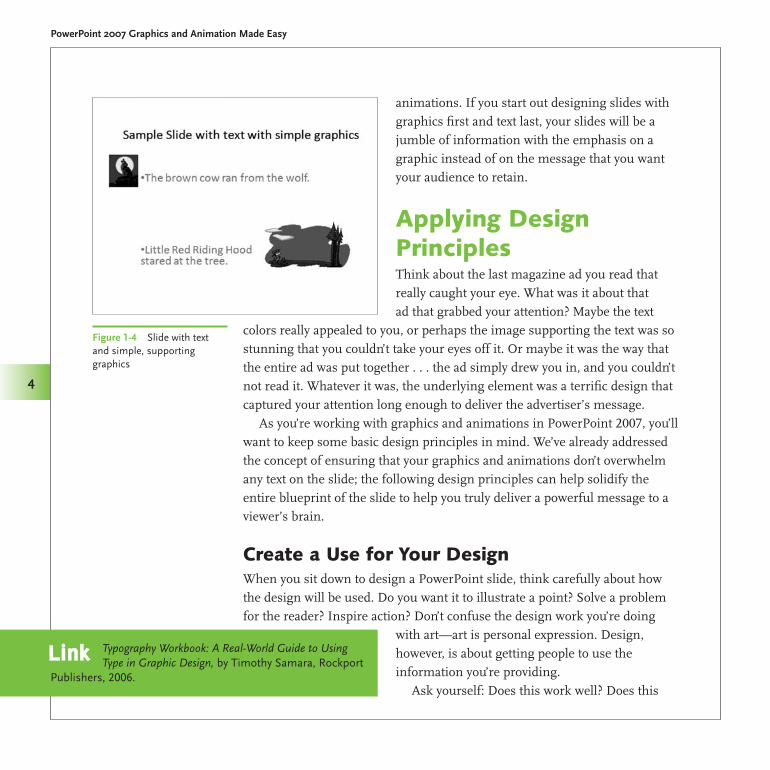
In Figure 1-4, however, the graphic(s) are more restrained. As a result, the primary points are easy to spot. The graphics support the text instead
of overwhelm it.You can read entire books that explain the
concept of typography and how you can use it in today’s digital world. If you’re interested in becoming an expert in graphic design, these books might interest you. But for the purposes of this book, just keep the concept of typography in mind. Be sure the text clearly states your main points and is simple for readers to follow and understand. Then include graphics and
Figure 1-2 Slide with text only
Figure 1-3 Slide with text and multiple graphics
Thinking with Type: A Critical Guide for Designers, Writers, Editors, & Students (Design Briefs), by Ellen
Lupton, Princeton Architectural Press, 2004.
Link
PowerPoint 2007 Graphics and Animation Made Easy
4
Made Easy/PowerPoint 2007 Graphics & Animation/Slack/0071600760/Chapter 1
4
animations. If you start out designing slides with graphics first and text last, your slides will be a jumble of information with the emphasis on a graphic instead of on the message that you want your audience to retain.
Applying Design PrinciplesThink about the last magazine ad you read that really caught your eye. What was it about that ad that grabbed your attention? Maybe the text
colors really appealed to you, or perhaps the image supporting the text was so stunning that you couldn’t take your eyes off it. Or maybe it was the way that the entire ad was put together . . . the ad simply drew you in, and you couldn’t not read it. Whatever it was, the underlying element was a terrific design that captured your attention long enough to deliver the advertiser’s message.
As you’re working with graphics and animations in PowerPoint 2007, you’ll want to keep some basic design principles in mind. We’ve already addressed the concept of ensuring that your graphics and animations don’t overwhelm any text on the slide; the following design principles can help solidify the entire blueprint of the slide to help you truly deliver a powerful message to a viewer’s brain.
Create a Use for Your DesignWhen you sit down to design a PowerPoint slide, think carefully about how the design will be used. Do you want it to illustrate a point? Solve a problem for the reader? Inspire action? Don’t confuse the design work you’re doing
with art—art is personal expression. Design, however, is about getting people to use the information you’re providing.
Ask yourself: Does this work well? Does this
Figure 1-4 Slide with text and simple, supporting graphics
Typography Workbook: A Real-World Guide to Using Type in Graphic Design, by Timothy Samara, Rockport
Publishers, 2006.
Link
Made Easy/PowerPoint 2007 Graphics & Animation/Slack/0071600760/Chapter 1
Chapter 1 Creating Slide Layouts That Pop
5
design do what I want it to do? If the answer is, “Well, it sure looks good!” then the design is probably not a good one for a PowerPoint presentation. If the answer, on the other hand, is something like, “It inspires me to want to take action” (or meets another goal you have in mind), then your design works well.
Keep the Design InvisibleWhen a design works well, the work you put into it is pretty much invisible to the viewer. Take the automobile, for example. It doesn’t matter which auto you think of; they are all extremely sophisticated and intricately designed. Yet most people rarely consider the years of work involved in the detailed design. They simply get in and drive, expecting the auto to work without any thought on their part. The reality of the design is invisible; the final product is used successfully to solve a problem (get people from point A to point B).
If your slides are too overwrought with design concepts—if you try to cram too much onto a slide or illustrate too many points at once—your design
There is a graphic design trend afoot that arose from the work of architect Ludwig Mies van der Rohe: Less is more. Mies, as he was referred to by most, is considered a modern architectural pioneer. He worked with intense clarity and minimalism in the post World War I era, using contemporary materials such as plate glass and industrial steel to define interior spaces. His revolutionary idea was that architecture needed just a minimal structural framework alongside free-flowing open space in order to provide balance and clarity. Why clutter the architecture with lots of unnecessary details when the primary point of the structure was to connect people and activities?
In graphic design, the less-is-more concept works in much the same way. Restraint, order, balance,
harmony, and simplicity go a long way toward helping a reader recognize and retain the message you’re sending. John Maeda’s book, The Laws of Simplicity (MIT Press), is a terrific read that teaches people how to need less and get more in business, technology, design, and life.
To Maeda, simplicity and complexity will always need each other—and the more complexity there is in the world, the more something simple will stand out. The same idea can be applied to PowerPoint slides. As readers are constantly bombarded with increasingly complex items such as cell phones with 100-page instruction books, a refreshingly straightforward slide can drive home a point simply because it is so unlike the complex surroundings we live in.
Graphic desiGn trends
PowerPoint 2007 Graphics and Animation Made Easy
6
Made Easy/PowerPoint 2007 Graphics & Animation/Slack/0071600760/Chapter 1
6
will be awkward to follow, difficult to understand, and too complex for most people to keep viewing.
Think in Simple TermsOften, the simplest design is the one that works best. Think of the wheel, for instance: a simple circle, improved upon with different types of materials for different types of requirements, but at the core, always a simple circle.
You don’t always need to break down your slide designs into the simplest common denominator, but you should take a look at your design and ask, “What can I remove without losing effectiveness?”
As you design your slides, thoughtfully consider what should be kept—and what can be tossed. If you’re always watching for those elements that distract from the audience experience, your designs will always be simple and easy for the audience to understand and retain.
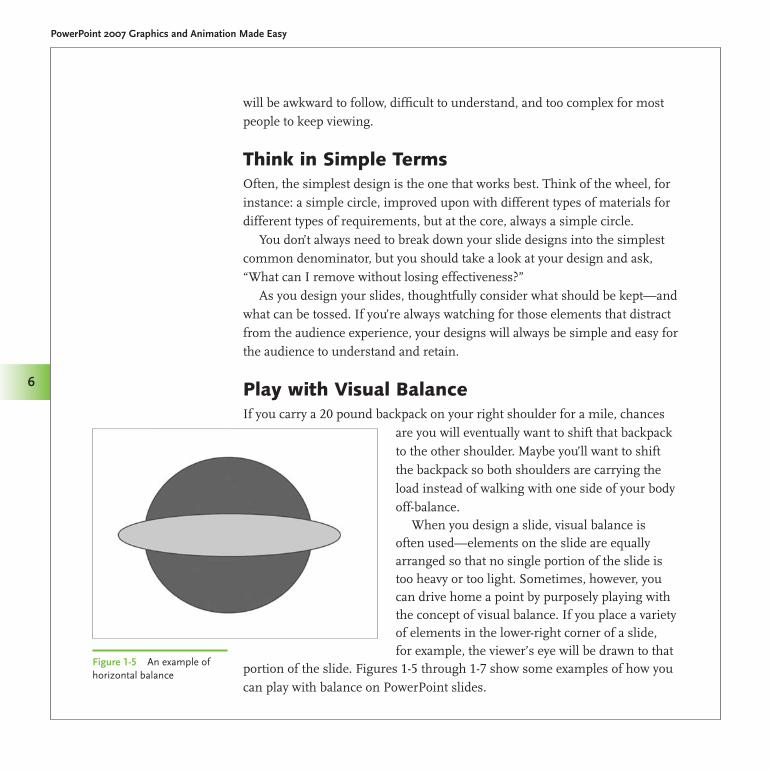
Play with Visual BalanceIf you carry a 20 pound backpack on your right shoulder for a mile, chances
are you will eventually want to shift that backpack to the other shoulder. Maybe you’ll want to shift the backpack so both shoulders are carrying the load instead of walking with one side of your body off-balance.
When you design a slide, visual balance is often used—elements on the slide are equally arranged so that no single portion of the slide is too heavy or too light. Sometimes, however, you can drive home a point by purposely playing with the concept of visual balance. If you place a variety of elements in the lower-right corner of a slide, for example, the viewer’s eye will be drawn to that
portion of the slide. Figures 1-5 through 1-7 show some examples of how you can play with balance on PowerPoint slides.
Figure 1-5 An example of horizontal balance
Made Easy/PowerPoint 2007 Graphics & Animation/Slack/0071600760/Chapter 1
Chapter 1 Creating Slide Layouts That Pop
7
The point here is to allow yourself some leeway in your design. Try not to trap yourself into using the same visual balance on every slide—your audience will be intrigued even by minor variations from slide to slide. Using the same exact visual balance on every slide can cause boredom and create wandering eyes.
Use White Space, Don’t Ignore ItWhen you’re designing layouts, any blank space on the slide is called white space. Don’t confuse white space with any colors you might have on the slide; white space is the term that refers only to empty space … not a particular color.
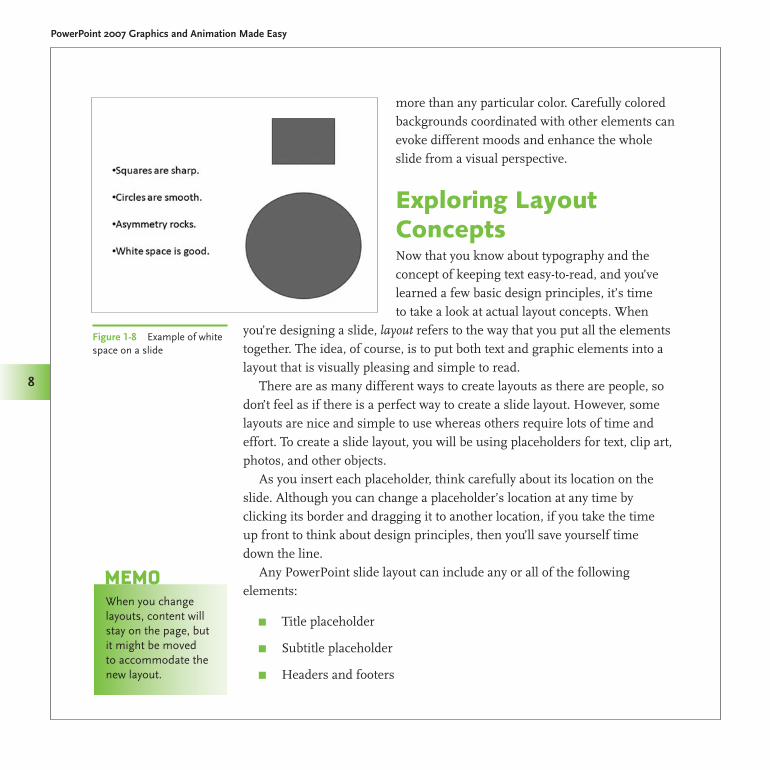
Although white space makes some people nervous, it’s actually a good thing because it provides the reader’s eye with a bit of a break as she views the slide. If you’re the type of person who thinks every square inch on a slide needs to be filled, take a deep breath and remind yourself that white space is okay. Resist the urge to fill in every spot on the slide, and your readers will thank you for it. In Figure 1-8, there is white space between each line of text and plenty of white space surrounding the graphics as well. White space, by the way, isn’t always colored white. It can be any color; the term is used to denote blank space
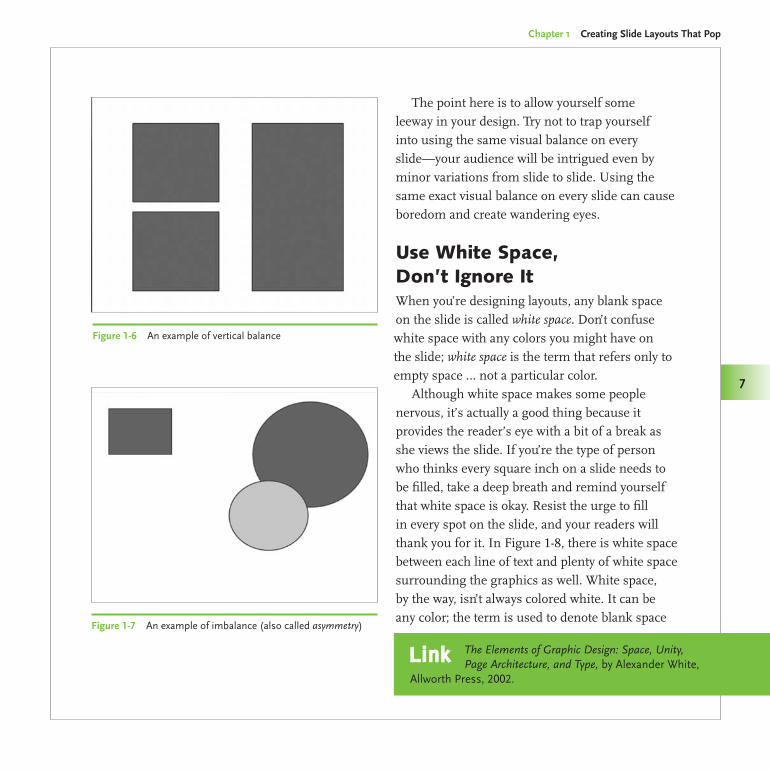
Figure 1-6 An example of vertical balance
Figure 1-7 An example of imbalance (also called asymmetry)
The Elements of Graphic Design: Space, Unity, Page Architecture, and Type, by Alexander White,
Allworth Press, 2002.
Link
PowerPoint 2007 Graphics and Animation Made Easy
8
Made Easy/PowerPoint 2007 Graphics & Animation/Slack/0071600760/Chapter 1
8
more than any particular color. Carefully colored backgrounds coordinated with other elements can evoke different moods and enhance the whole slide from a visual perspective.
Exploring Layout ConceptsNow that you know about typography and the concept of keeping text easy-to-read, and you’ve learned a few basic design principles, it’s time to take a look at actual layout concepts. When
you’re designing a slide, layout refers to the way that you put all the elements together. The idea, of course, is to put both text and graphic elements into a layout that is visually pleasing and simple to read.
There are as many different ways to create layouts as there are people, so don’t feel as if there is a perfect way to create a slide layout. However, some layouts are nice and simple to use whereas others require lots of time and effort. To create a slide layout, you will be using placeholders for text, clip art, photos, and other objects.
As you insert each placeholder, think carefully about its location on the slide. Although you can change a placeholder’s location at any time by clicking its border and dragging it to another location, if you take the time up front to think about design principles, then you’ll save yourself time down the line.
Any PowerPoint slide layout can include any or all of the following elements:
Title placeholder π
Subtitle placeholder π
Headers and footers π
Figure 1-8 Example of white space on a slide
When you change layouts, content will stay on the page, but it might be moved to accommodate the new layout.
MeMo
Made Easy/PowerPoint 2007 Graphics & Animation/Slack/0071600760/Chapter 1
Chapter 1 Creating Slide Layouts That Pop
9
Body placeholder, which can be a text box, chart, picture, or graph π
Background objects π
Background fill (color or picture) π
Placeholder formatting, such as bullets π
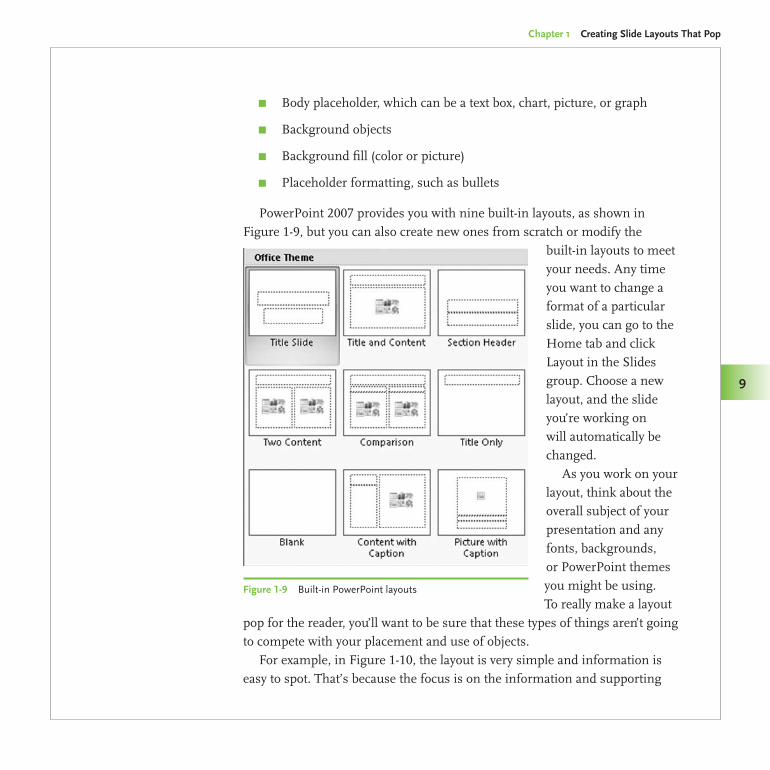
PowerPoint 2007 provides you with nine built-in layouts, as shown in Figure 1-9, but you can also create new ones from scratch or modify the
built-in layouts to meet your needs. Any time you want to change a format of a particular slide, you can go to the Home tab and click Layout in the Slides group. Choose a new layout, and the slide you’re working on will automatically be changed.
As you work on your layout, think about the overall subject of your presentation and any fonts, backgrounds, or PowerPoint themes you might be using. To really make a layout
pop for the reader, you’ll want to be sure that these types of things aren’t going to compete with your placement and use of objects.
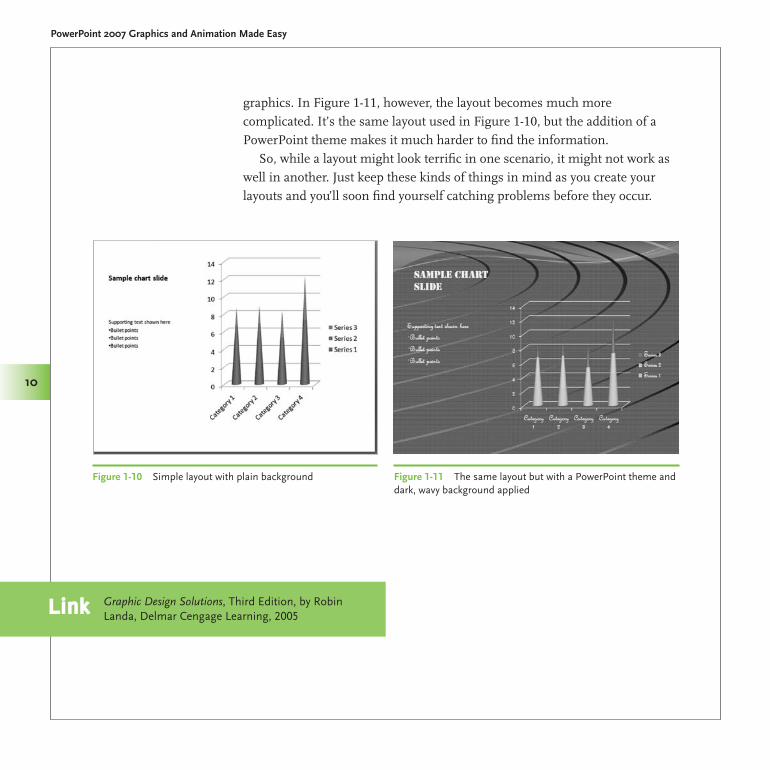
For example, in Figure 1-10, the layout is very simple and information is easy to spot. That’s because the focus is on the information and supporting
Figure 1-9 Built-in PowerPoint layouts
PowerPoint 2007 Graphics and Animation Made Easy
10
Made Easy/PowerPoint 2007 Graphics & Animation/Slack/0071600760/Chapter 1
10
graphics. In Figure 1-11, however, the layout becomes much more complicated. It’s the same layout used in Figure 1-10, but the addition of a PowerPoint theme makes it much harder to find the information.
So, while a layout might look terrific in one scenario, it might not work as well in another. Just keep these kinds of things in mind as you create your layouts and you’ll soon find yourself catching problems before they occur.
Figure 1-10 Simple layout with plain background Figure 1-11 The same layout but with a PowerPoint theme and dark, wavy background applied
Graphic Design Solutions, Third Edition, by Robin Landa, Delmar Cengage Learning, 2005Link
Made Easy/PowerPoint 2007 Graphics & Animation/Slack/0071600760/Chapter 1
Chapter 1 Creating Slide Layouts That Pop
11
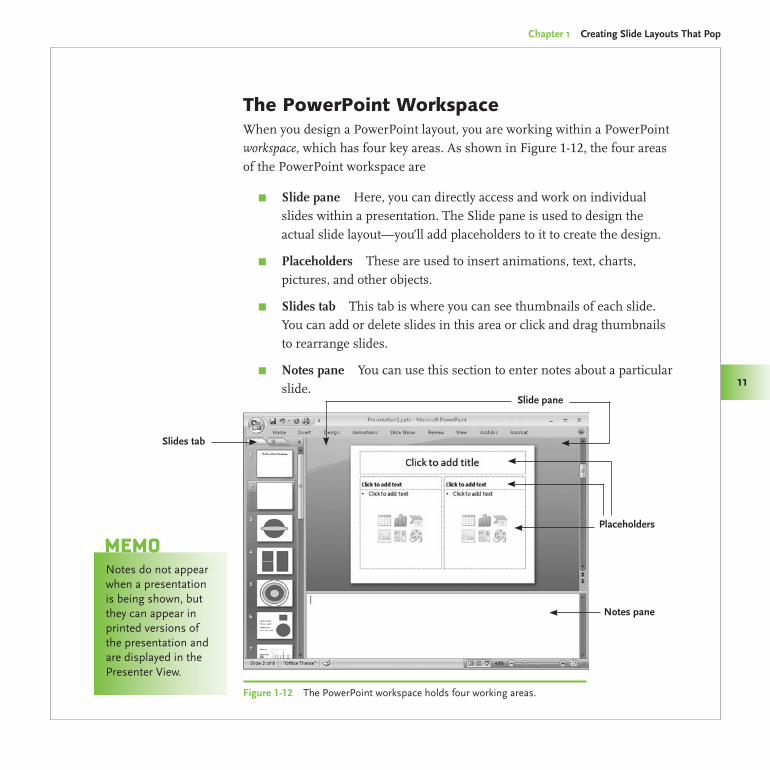
The PowerPoint WorkspaceWhen you design a PowerPoint layout, you are working within a PowerPoint workspace, which has four key areas. As shown in Figure 1-12, the four areas of the PowerPoint workspace are
Slide pane π Here, you can directly access and work on individual slides within a presentation. The Slide pane is used to design the actual slide layout—you’ll add placeholders to it to create the design.
Placeholders π These are used to insert animations, text, charts, pictures, and other objects.
Slides tab π This tab is where you can see thumbnails of each slide. You can add or delete slides in this area or click and drag thumbnails to rearrange slides.
Notes pane π You can use this section to enter notes about a particular slide.
Notes pane
Figure 1-12 The PowerPoint workspace holds four working areas.
Notes do not appear when a presentation is being shown, but they can appear in printed versions of the presentation and are displayed in the Presenter View.
MeMo
Slide pane
Placeholders
Slides tab
PowerPoint 2007 Graphics and Animation Made Easy
12
Made Easy/PowerPoint 2007 Graphics & Animation/Slack/0071600760/Chapter 1
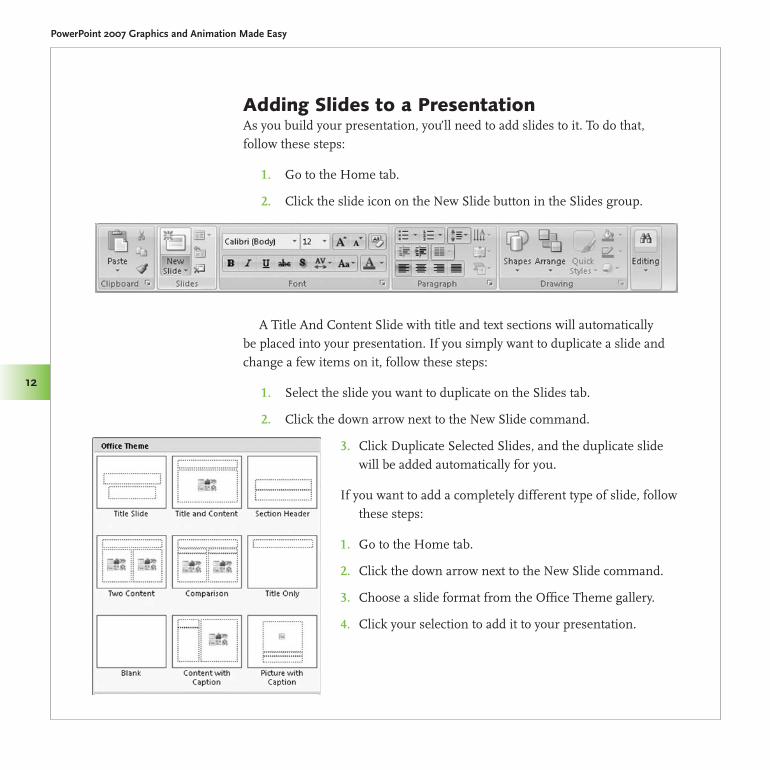
Adding Slides to a PresentationAs you build your presentation, you’ll need to add slides to it. To do that, follow these steps:
Go to the Home tab.1.
Click the slide icon on the New Slide button in the Slides group.2.
A Title And Content Slide with title and text sections will automatically be placed into your presentation. If you simply want to duplicate a slide and change a few items on it, follow these steps:
Select the slide you want to duplicate on the Slides tab.1.
Click the down arrow next to the New Slide command.2.
Click Duplicate Selected Slides, and the duplicate slide 3. will be added automatically for you.
If you want to add a completely different type of slide, follow these steps:
Go to the Home tab.1.
Click the down arrow next to the New Slide command.2.
Choose a slide format from the Office Theme gallery.3.
Click your selection to add it to your presentation.4.
Made Easy/PowerPoint 2007 Graphics & Animation/Slack/0071600760/Chapter 1
Chapter 1 Creating Slide Layouts That Pop
13
Working with Slide Masters and PlaceholdersPowerPoint Slide Masters are the part of a slide template that stores information through the use of placeholders. When you use a Slide Master, you can make changes to a single slide (the master) and the changes will be applied collectively throughout your presentation. So, for example, if you want to include a company logo on every slide footer in your presentation, you can add it to the Slide Master just once, and then the logo will be shown on each slide throughout your presentation. As you add new slides, those will also include the logo. Or, you can choose to add the logo only to certain types of slides in a presentation.
Slide Masters can be easily customized. In a Slide Master, layouts are used to position placeholders (such as the logo just mentioned) in any way you want. It’s a good idea to create all your Slide Masters before you start creating a presentation; slides added into a presentation are always based on the Slide Masters.
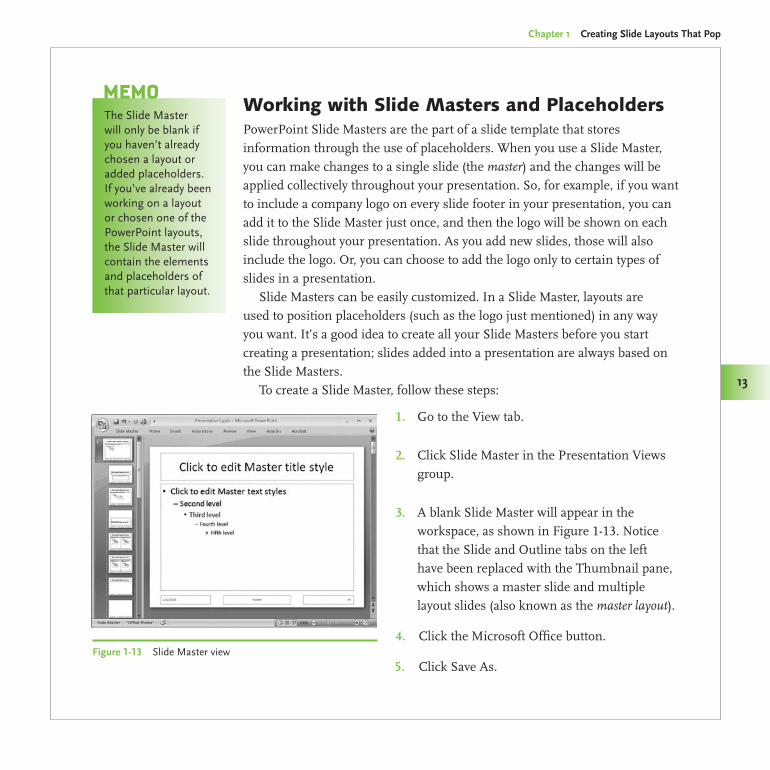
To create a Slide Master, follow these steps:
Go to the View tab.1.
Click Slide Master in the Presentation Views 2. group.
A blank Slide Master will appear in the 3. workspace, as shown in Figure 1-13. Notice that the Slide and Outline tabs on the left have been replaced with the Thumbnail pane, which shows a master slide and multiple layout slides (also known as the master layout).
Click the Microsoft Office button.4.
Click Save As. 5.
The Slide Master will only be blank if you haven’t already chosen a layout or added placeholders. If you’ve already been working on a layout or chosen one of the PowerPoint layouts, the Slide Master will contain the elements and placeholders of that particular layout.
MeMo
Figure 1-13 Slide Master view
PowerPoint 2007 Graphics and Animation Made Easy
14
Made Easy/PowerPoint 2007 Graphics & Animation/Slack/0071600760/Chapter 1
14
Type in a filename for the master slide layout or accept the suggested 6. filename.
Click PowerPoint Template (*.potx) in the Save As Type list. Leave the 7. default location (Templates).
Click Save.8.
Go to the Slide Master tab and click Close Master View in the Close 9. group.
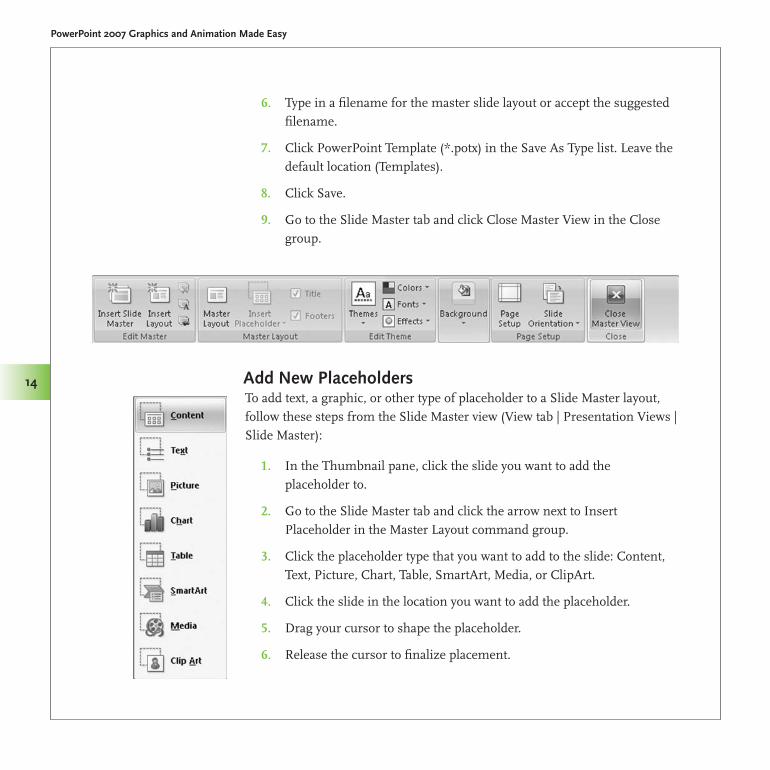
Add New PlaceholdersTo add text, a graphic, or other type of placeholder to a Slide Master layout, follow these steps from the Slide Master view (View tab | Presentation Views | Slide Master):
In the Thumbnail pane, click the slide you want to add the 1. placeholder to.
Go to the Slide Master tab and click the arrow next to Insert 2. Placeholder in the Master Layout command group.
Click the placeholder type that you want to add to the slide: Content, 3. Text, Picture, Chart, Table, SmartArt, Media, or ClipArt.
Click the slide in the location you want to add the placeholder.4.
Drag your cursor to shape the placeholder.5.
Release the cursor to finalize placement.6.
Made Easy/PowerPoint 2007 Graphics & Animation/Slack/0071600760/Chapter 1
Chapter 1 Creating Slide Layouts That Pop
15
Add Custom Text to a PlaceholderYou might want to add custom text to single or multiple slide layouts that use text placeholders. If you do, follow these steps using the Slide Master view:
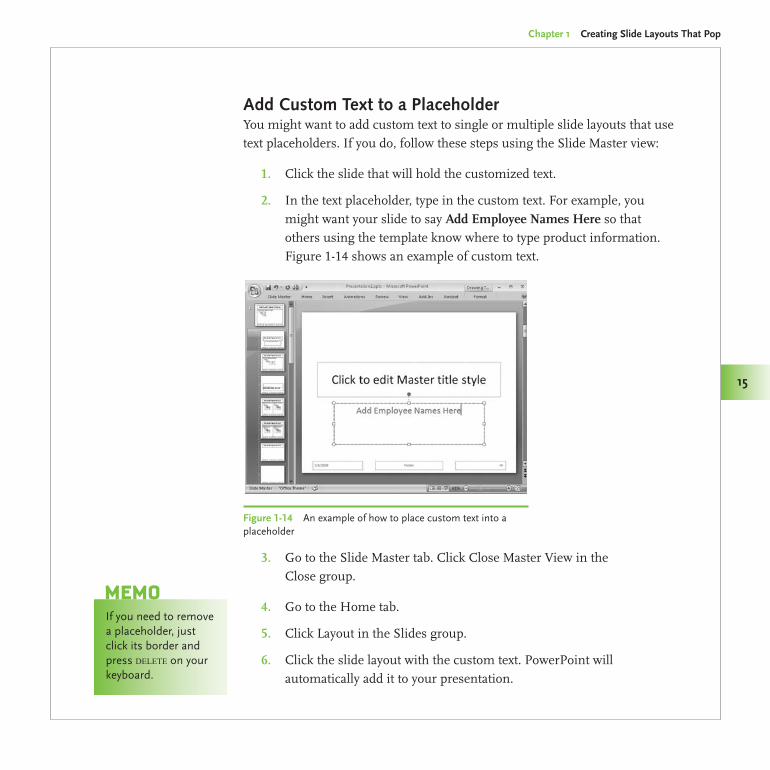
Click the slide that will hold the customized text.1.
In the text placeholder, type in the custom text. For example, you 2. might want your slide to say Add Employee Names Here so that others using the template know where to type product information. Figure 1-14 shows an example of custom text.
If you need to remove a placeholder, just click its border and press delete on your keyboard.
MeMo
Figure 1-14 An example of how to place custom text into a placeholder
Go to the Slide Master tab. Click Close Master View in the 3. Close group.
Go to the Home tab.4.
Click Layout in the Slides group.5.
Click the slide layout with the custom text. PowerPoint will 6. automatically add it to your presentation.
PowerPoint 2007 Graphics and Animation Made Easy
16
Made Easy/PowerPoint 2007 Graphics & Animation/Slack/0071600760/Chapter 1
16
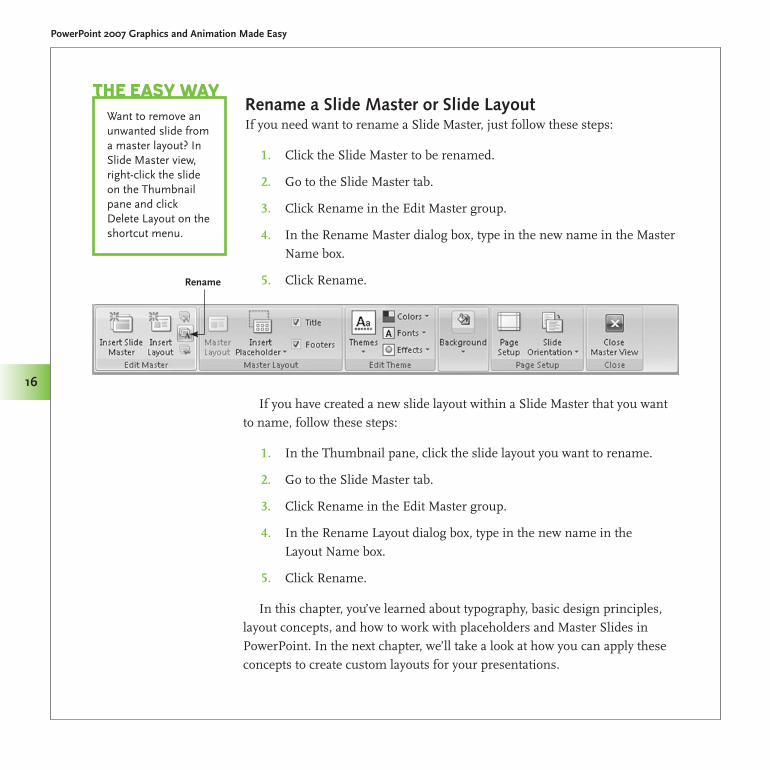
Rename a Slide Master or Slide LayoutIf you need want to rename a Slide Master, just follow these steps:
Click the Slide Master to be renamed.1.
Go to the Slide Master2. tab.
Click Rename in the Edit Master group.3.
In the Rename Master dialog box, type in the new name in the Master 4. Name box.
Click Rename.5.
If you have created a new slide layout within a Slide Master that you want to name, follow these steps:
In the Thumbnail pane, click the slide layout you want to rename.1.
Go to the Slide Master tab.2.
Click Rename in the Edit Master group.3.
In the Rename Layout dialog box, type in the new name in the 4. Layout Name box.
Click Rename.5.
In this chapter, you’ve learned about typography, basic design principles, layout concepts, and how to work with placeholders and Master Slides in PowerPoint. In the next chapter, we’ll take a look at how you can apply these concepts to create custom layouts for your presentations.
Want to remove an unwanted slide from a master layout? In Slide Master view, right-click the slide on the Thumbnail pane and click Delete Layout on the shortcut menu.
the easy Way
Rename
2Creating Custom Layouts
The best PowerPoint presentations are the ones that carefully consider both audience and content and provide the best fit for both. Technical audiences, for example, aren’t going to be confused by a presentation filled with lots of charts and minute details. More general business audiences, however, might fall asleep the very first time they see a chart. That doesn’t mean you shouldn’t use a chart with a business or academic audience—just that you’ll need to think through a custom layout geared to help your audience follow the chart easily or keep their attention.
Every slide in your presentation tells a piece of the overall story. You can move audiences from point to point using several slides, or you can cover multiple points in a single slide. You can use color to draw attention to a specific item on the slide or place bullets in a unique manner to surprise and capture the audience’s attention.
In this chapter, we’ll look at how custom layouts can be used in PowerPoint presentations to grab the audience’s attention from the first slide—and keep the audience focused throughout the entire presentation.
PowerPoint 2007 Graphics and Animation Made Easy
18
Made Easy/PowerPoint 2007 Graphics & Animation/Slack/0071600760/Chapter 2
18
Planning Your PresentationWhen you create a presentation, you’ll save a lot of time and aggravation if you create an outline in PowerPoint first. It doesn’t have to be exhaustive, but it should be detailed enough so you aren’t constantly trying to figure out what to put on your next slide.
In Chapter 1, we explained the PowerPoint workspace. In that workspace, next to the Slides tab, is the Outline tab. Click that tab, and let’s add a few slides so you can see how easily you can create an outline within PowerPoint. To begin adding slides, go to Home | Slides Group | New Slide. Then follow these steps to add a total of four slides to a blank presentation:
Add a Title Slide. On the title slide, type 1. Opening statement in the text box labeled Click To Add Title.
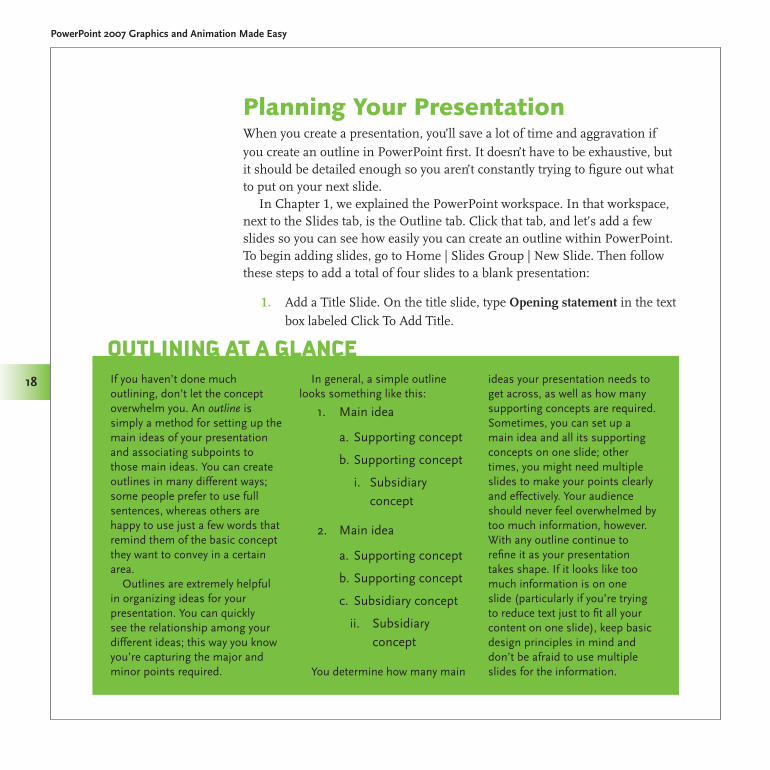
If you haven’t done much outlining, don’t let the concept overwhelm you. An outline is simply a method for setting up the main ideas of your presentation and associating subpoints to those main ideas. You can create outlines in many different ways; some people prefer to use full sentences, whereas others are happy to use just a few words that remind them of the basic concept they want to convey in a certain area.
Outlines are extremely helpful in organizing ideas for your presentation. You can quickly see the relationship among your different ideas; this way you know you’re capturing the major and minor points required.
In general, a simple outline looks something like this:
1. Mainidea
a.Supportingconcept
b.Supportingconcept
i. Subsidiary concept
2. Mainidea
a.Supportingconcept
b.Supportingconcept
c.Subsidiaryconcept
ii. Subsidiary concept
You determine how many main
ideas your presentation needs to get across, as well as how many supporting concepts are required. Sometimes, you can set up a main idea and all its supporting concepts on one slide; other times, you might need multiple slides to make your points clearly and effectively. Your audience should never feel overwhelmed by too much information, however. With any outline continue to refine it as your presentation takes shape. If it looks like too much information is on one slide (particularly if you’re trying to reduce text just to fit all your content on one slide), keep basic design principles in mind and don’t be afraid to use multiple slides for the information.
outlining at a glance
Chapter 2 Creating Custom Layouts
19
Made Easy/PowerPoint 2007 Graphics & Animation/Slack/0071600760/Chapter 2
19
Add a Comparison slide. Type 2. Objectives in the text box labeled Click To Add Title. In the left comparison box, type Current year in the subtitle box and What’s been done next to the bullet. In the right comparison box, type Upcoming fiscal year in the subtitle box and What will be done next to the bullet.
Add a blank slide. Select Insert | Text | Text Box to add a text box to 3. the slide. Place the text box wherever you prefer on the slide. Type Supporting data in the text box.
Add a Title And Content Slide. Type 4. Ending statement in the text box labeled Click To Add Title.
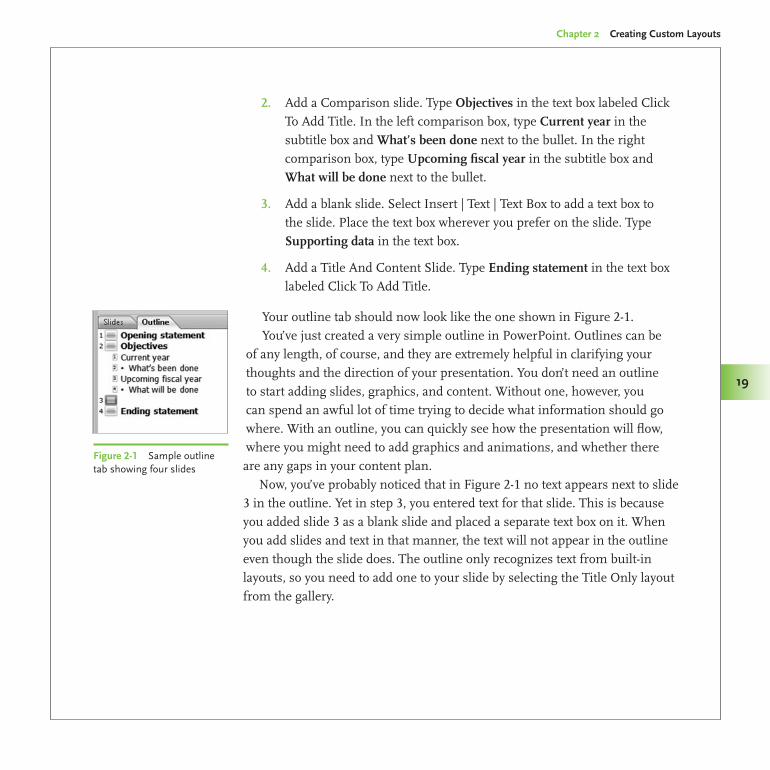
Your outline tab should now look like the one shown in Figure 2-1.You’ve just created a very simple outline in PowerPoint. Outlines can be
of any length, of course, and they are extremely helpful in clarifying your thoughts and the direction of your presentation. You don’t need an outline to start adding slides, graphics, and content. Without one, however, you can spend an awful lot of time trying to decide what information should go where. With an outline, you can quickly see how the presentation will flow, where you might need to add graphics and animations, and whether there are any gaps in your content plan.
Now, you’ve probably noticed that in Figure 2-1 no text appears next to slide 3 in the outline. Yet in step 3, you entered text for that slide. This is because you added slide 3 as a blank slide and placed a separate text box on it. When you add slides and text in that manner, the text will not appear in the outline even though the slide does. The outline only recognizes text from built-in layouts, so you need to add one to your slide by selecting the Title Only layout from the gallery.
Figure 2-1 Sample outline tab showing four slides
PowerPoint 2007 Graphics and Animation Made Easy
20
Made Easy/PowerPoint 2007 Graphics & Animation/Slack/0071600760/Chapter 2
20
Creating Layouts to Fit Your ContentLayouts are everywhere these days. From MySpace pages to scrapbooking to PowerPoint slides, the very best layouts help you present information in a clear and direct fashion. In Chapter 1, we showed you how to access the built-in layouts offered by PowerPoint 2007. Those layouts, however, are just the tip of the iceberg. In this section, we’ll show you how to create custom layouts to tell your story any way you want to.
Remember, layouts simply help you drop in the components of your slide’s content—don’t let them intimidate you. You don’t need a graphic design background to create eye-catching, informative custom-slide layouts. All you really need is a bit of imagination and a willingness to try new ideas.
PowerPoint gives you three different ways to create custom layouts.
You can use a blank slide and insert π
placeholders as needed.
You can use a built-in slide layout and π
move placeholders around as desired.
You can add a layout to a slide master in Slide Master view and then π
save the custom slide layout as explained in Chapter 1.
In this chapter, we’ll show you some ideas for custom layouts that will help you build on the built-in layouts already provided. As we showed you in Chapter 1, any PowerPoint slide layout can include a variety of elements.
Within body placeholders, there are eight
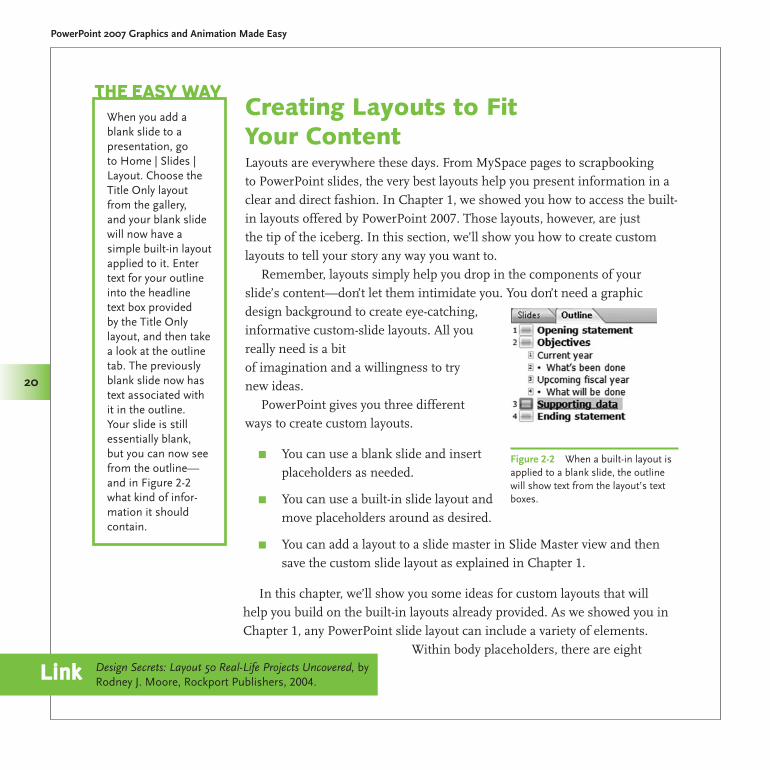
When you add a blank slide to a presentation, go to Home | Slides | Layout. Choose the Title Only layout from the gallery, and your blank slide will now have a simple built-in layout applied to it. Enter text for your outline into the headline text box provided by the Title Only layout, and then take a look at the outline tab. The previously blank slide now has text associated with it in the outline. Your slide is still essentially blank, but you can now see from the outline—and in Figure 2-2 what kind of infor-mation it should contain.
the easy Way
Figure 2-2 When a built-in layout is applied to a blank slide, the outline will show text from the layout’s text boxes.
Design Secrets: Layout 50 Real-Life Projects Uncovered, by Rodney J. Moore, Rockport Publishers, 2004.link
Chapter 2 Creating Custom Layouts
21
Made Easy/PowerPoint 2007 Graphics & Animation/Slack/0071600760/Chapter 2
21
different types of objects you can add to create custom layouts in PowerPoint 2007:
Shapes π
Chart π
Clip Art π
Thesefirsttwotechniquesareeasyandhandywhenyousimplywanttomakequickchangestoaslideanddon’tplanonusingthelayoutagaininanotherpre-sentation.Justcreatethecustomslidesandsavethepresenta-tionasyouwouldnormally.
MeMo
Picture π
Table π
SmartArt π
Text π
Media Clips π
We’ll explore the specifics of how to add and use each of these objects in later chapters; in this chapter, we’ll simply show you a few ideas for custom layouts that might spark some ideas as you create your next presentation. You can customize a PowerPoint layout in literally thousands of ways, so don’t ever be afraid to try something you haven’t seen before. Here, we’ll be using the simple typography and design principles explained in Chapter 1;
you can always get more sophisticated and creative if you like.
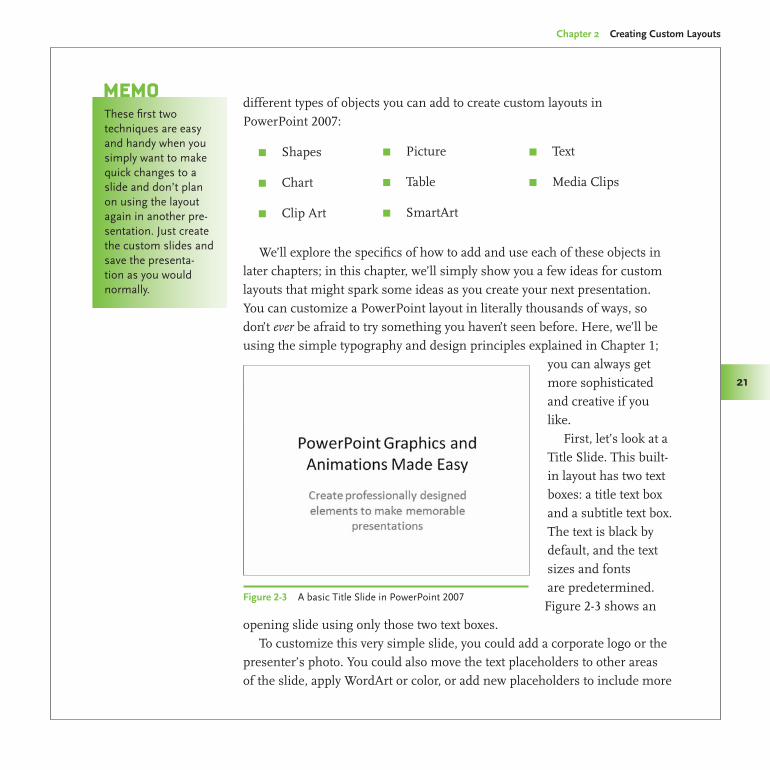
First, let’s look at a Title Slide. This built-in layout has two text boxes: a title text box and a subtitle text box. The text is black by default, and the text sizes and fonts are predetermined. Figure 2-3 shows an
opening slide using only those two text boxes.To customize this very simple slide, you could add a corporate logo or the
presenter’s photo. You could also move the text placeholders to other areas of the slide, apply WordArt or color, or add new placeholders to include more
Figure 2-3 A basic Title Slide in PowerPoint 2007
PowerPoint 2007 Graphics and Animation Made Easy
22
Made Easy/PowerPoint 2007 Graphics & Animation/Slack/0071600760/Chapter 2
22
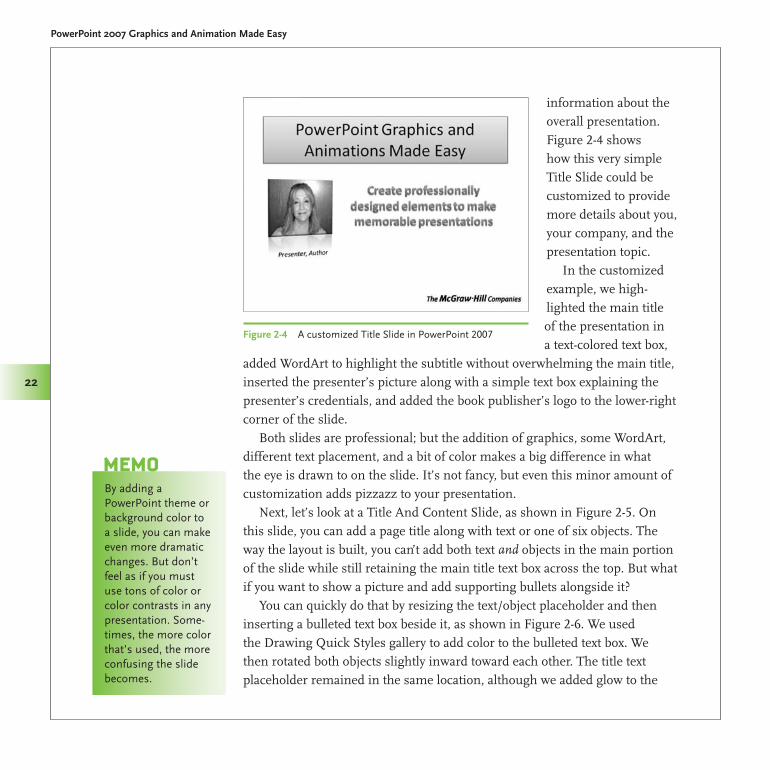
information about the overall presentation. Figure 2-4 shows how this very simple Title Slide could be customized to provide more details about you, your company, and the presentation topic.
In the customized example, we high-lighted the main title of the presentation in a text-colored text box,
added WordArt to highlight the subtitle without overwhelming the main title, inserted the presenter’s picture along with a simple text box explaining the presenter’s credentials, and added the book publisher’s logo to the lower-right corner of the slide.
Both slides are professional; but the addition of graphics, some WordArt, different text placement, and a bit of color makes a big difference in what the eye is drawn to on the slide. It’s not fancy, but even this minor amount of customization adds pizzazz to your presentation.
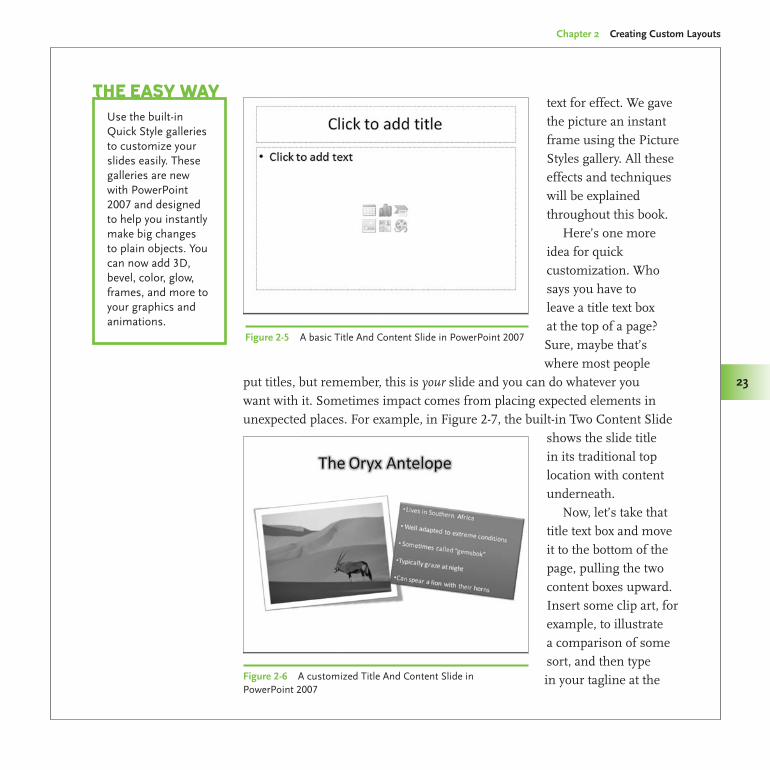
Next, let’s look at a Title And Content Slide, as shown in Figure 2-5. On this slide, you can add a page title along with text or one of six objects. The way the layout is built, you can’t add both text and objects in the main portion of the slide while still retaining the main title text box across the top. But what if you want to show a picture and add supporting bullets alongside it?
You can quickly do that by resizing the text/object placeholder and then inserting a bulleted text box beside it, as shown in Figure 2-6. We used the Drawing Quick Styles gallery to add color to the bulleted text box. We then rotated both objects slightly inward toward each other. The title text placeholder remained in the same location, although we added glow to the
Figure 2-4 A customized Title Slide in PowerPoint 2007
ByaddingaPowerPointthemeorbackgroundcolortoaslide,youcanmakeevenmoredramaticchanges.Butdon’tfeelasifyoumustusetonsofcolororcolorcontrastsinanypresentation.Some-times,themorecolorthat’sused,themoreconfusingtheslidebecomes.
MeMo
Chapter 2 Creating Custom Layouts
23
Made Easy/PowerPoint 2007 Graphics & Animation/Slack/0071600760/Chapter 2
23
text for effect. We gave the picture an instant frame using the Picture Styles gallery. All these effects and techniques will be explained throughout this book.
Here’s one more idea for quick customization. Who says you have to leave a title text box at the top of a page? Sure, maybe that’s where most people
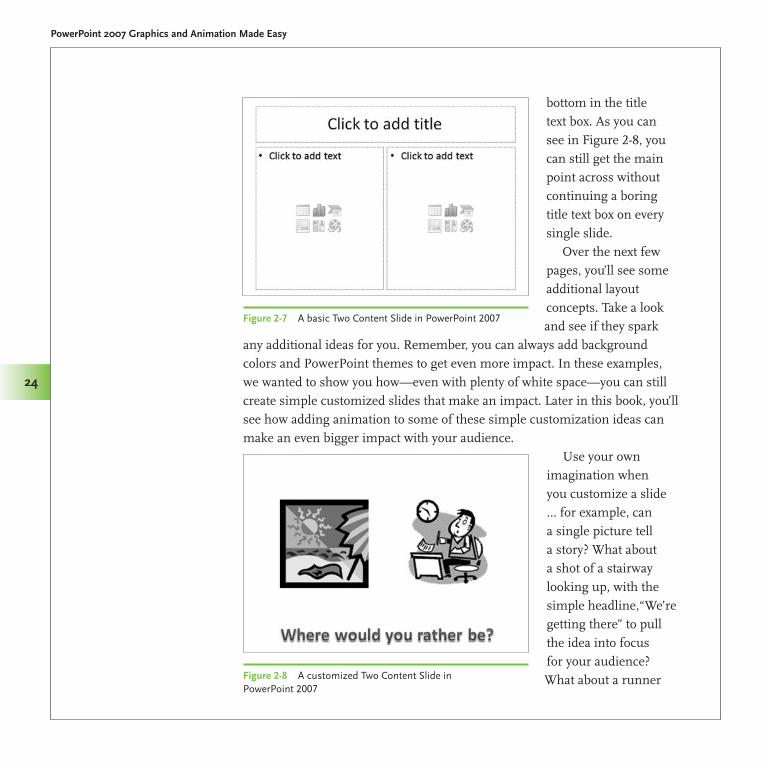
put titles, but remember, this is your slide and you can do whatever you want with it. Sometimes impact comes from placing expected elements in unexpected places. For example, in Figure 2-7, the built-in Two Content Slide
shows the slide title in its traditional top location with content underneath.
Now, let’s take that title text box and move it to the bottom of the page, pulling the two content boxes upward. Insert some clip art, for example, to illustrate a comparison of some sort, and then type in your tagline at the
Figure 2-5 A basic Title And Content Slide in PowerPoint 2007
Figure 2-6 A customized Title And Content Slide in PowerPoint 2007
Use the built-in Quick Style galleries to customize your slides easily. These galleries are new with PowerPoint 2007 and designed to help you instantly make big changes to plain objects. You can now add 3D, bevel, color, glow, frames, and more to your graphics and animations.
the easy Way
PowerPoint 2007 Graphics and Animation Made Easy
24
Made Easy/PowerPoint 2007 Graphics & Animation/Slack/0071600760/Chapter 2
24
bottom in the title text box. As you can see in Figure 2-8, you can still get the main point across without continuing a boring title text box on every single slide.
Over the next few pages, you’ll see some additional layout concepts. Take a look and see if they spark
any additional ideas for you. Remember, you can always add background colors and PowerPoint themes to get even more impact. In these examples, we wanted to show you how—even with plenty of white space—you can still create simple customized slides that make an impact. Later in this book, you’ll see how adding animation to some of these simple customization ideas can make an even bigger impact with your audience.
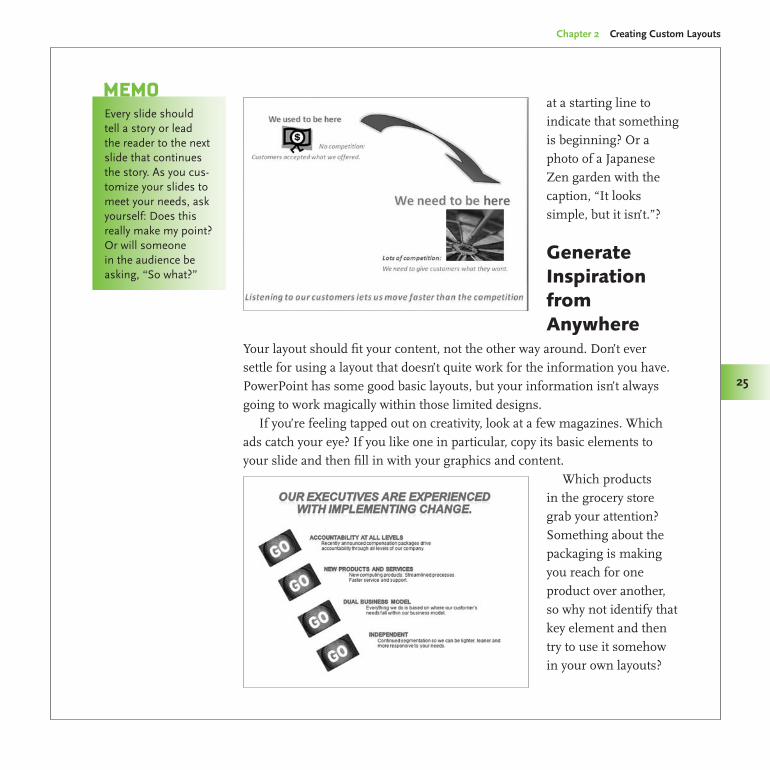
Use your own imagination when you customize a slide … for example, can a single picture tell a story? What about a shot of a stairway looking up, with the simple headline,“We’re getting there” to pull the idea into focus for your audience? What about a runner
Figure 2-7 A basic Two Content Slide in PowerPoint 2007
Figure 2-8 A customized Two Content Slide in PowerPoint 2007
Chapter 2 Creating Custom Layouts
25
Made Easy/PowerPoint 2007 Graphics & Animation/Slack/0071600760/Chapter 2
25
at a starting line to indicate that something is beginning? Or a photo of a Japanese Zen garden with the caption, “It looks simple, but it isn’t.”?
Generate Inspiration from Anywhere
Your layout should fit your content, not the other way around. Don’t ever settle for using a layout that doesn’t quite work for the information you have. PowerPoint has some good basic layouts, but your information isn’t always going to work magically within those limited designs.
If you’re feeling tapped out on creativity, look at a few magazines. Which ads catch your eye? If you like one in particular, copy its basic elements to your slide and then fill in with your graphics and content.
Which products in the grocery store grab your attention? Something about the packaging is making you reach for one product over another, so why not identify that key element and then try to use it somehow in your own layouts?
Everyslideshouldtellastoryorleadthereadertothenextslidethatcontinuesthestory.Asyoucus-tomizeyourslidestomeetyourneeds,askyourself:Doesthisreallymakemypoint?Orwillsomeoneintheaudiencebeasking,“Sowhat?”
MeMo
PowerPoint 2007 Graphics and Animation Made Easy
26
Made Easy/PowerPoint 2007 Graphics & Animation/Slack/0071600760/Chapter 2
26
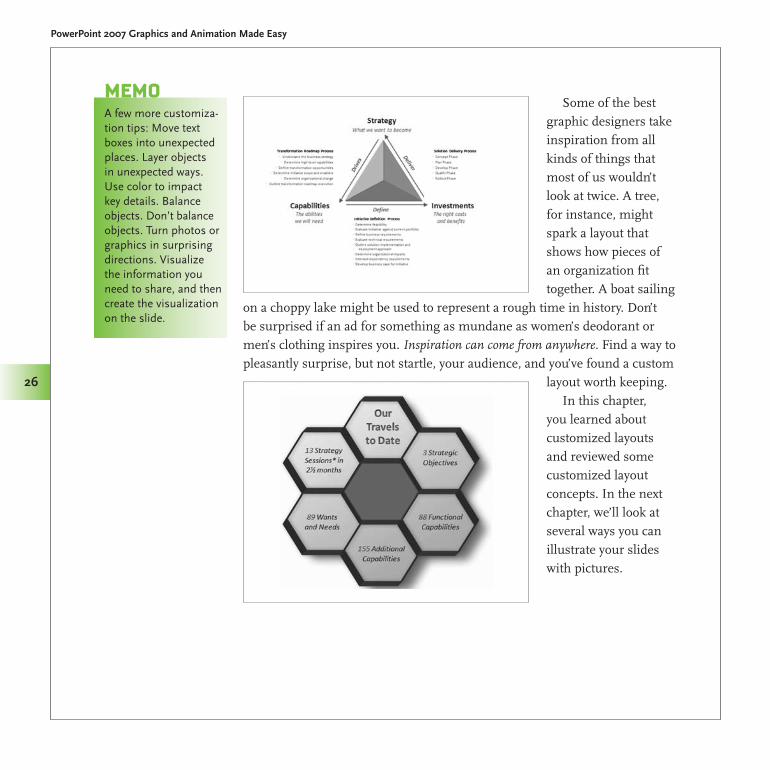
Some of the best graphic designers take inspiration from all kinds of things that most of us wouldn’t look at twice. A tree, for instance, might spark a layout that shows how pieces of an organization fit together. A boat sailing
on a choppy lake might be used to represent a rough time in history. Don’t be surprised if an ad for something as mundane as women’s deodorant or men’s clothing inspires you. Inspiration can come from anywhere. Find a way to pleasantly surprise, but not startle, your audience, and you’ve found a custom
layout worth keeping.In this chapter,
you learned about customized layouts and reviewed some customized layout concepts. In the next chapter, we’ll look at several ways you can illustrate your slides with pictures.
Afewmorecustomiza-tiontips:Movetextboxesintounexpectedplaces.Layerobjectsinunexpectedways.Usecolortoimpactkeydetails.Balanceobjects.Don’tbalanceobjects.Turnphotosorgraphicsinsurprisingdirections.Visualizetheinformationyouneedtoshare,andthencreatethevisualizationontheslide.
MeMo
3Illustrating with Pictures
Using photographs is easy in PowerPoint 2007. Once you discover the simplicity of inserting pictures and creating unique looks for each of them, you’ll enjoy exploring your creativity. From setting the mood to highlighting a funny moment, PowerPoint 2007 makes the experience come alive whether you’re viewing pictures for the first time or revisiting pictures that mean a lot to you. You’ll learn more about creating photo albums in Chapter 4. For now, let’s focus on the pictures themselves.
In this chapter, you’ll learn how to adjust pictures and add special effects to create different moods and presentations. You’ll also discover how to use picture styles and shapes to tell an interesting story, as well as how cropping, sizing, and framing your picture can highlight specific details of your story.
One of the fastest ways to become proficient in PowerPoint 2007 is to experiment with the many styles, special effects, and animations available. As you read through this book, remember that PowerPoint doesn’t always have to be used in a business setting. Take a few minutes with each section to discover how to make PowerPoint 2007 presentations that are fun to create and will impress friends and family members.
Made Easy/PowerPoint 2007 Graphics & Animation/Slack/0071600760/Chapter 3
PowerPoint 2007 Graphics and Animation Made Easy
28
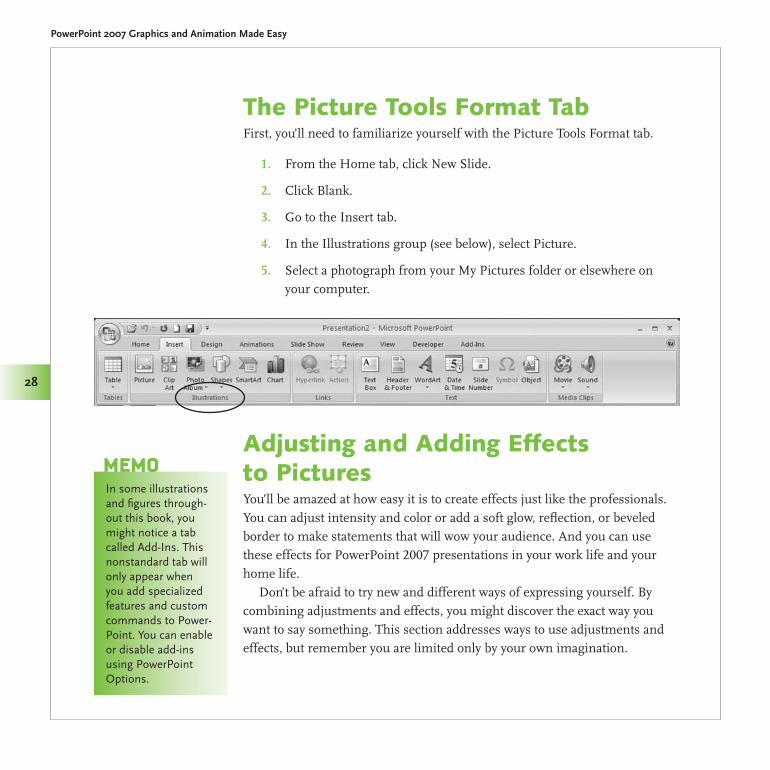
The Picture Tools Format TabFirst, you’ll need to familiarize yourself with the Picture Tools Format tab.
From the Home tab, click New Slide.1.
Click Blank.2.
Go to the Insert tab.3.
In the Illustrations group (see below), select Picture.4.
Select a photograph from your My Pictures5. folder or elsewhere on your computer.
Adjusting and Adding Effects to PicturesYou’ll be amazed at how easy it is to create effects just like the professionals. You can adjust intensity and color or add a soft glow, reflection, or beveled border to make statements that will wow your audience. And you can use these effects for PowerPoint 2007 presentations in your work life and your home life.
Don’t be afraid to try new and different ways of expressing yourself. By combining adjustments and effects, you might discover the exact way you want to say something. This section addresses ways to use adjustments and effects, but remember you are limited only by your own imagination.
In some illustrations and figures through-out this book, you might notice a tab called Add-Ins. This nonstandard tab will only appear when you add specialized features and custom commands to Power-Point. You can enable or disable add-ins using PowerPoint Options.
MeMo
Made Easy/PowerPoint 2007 Graphics & Animation/Slack/0071600760/Chapter 3
Chapter 3 Illustrating with Pictures
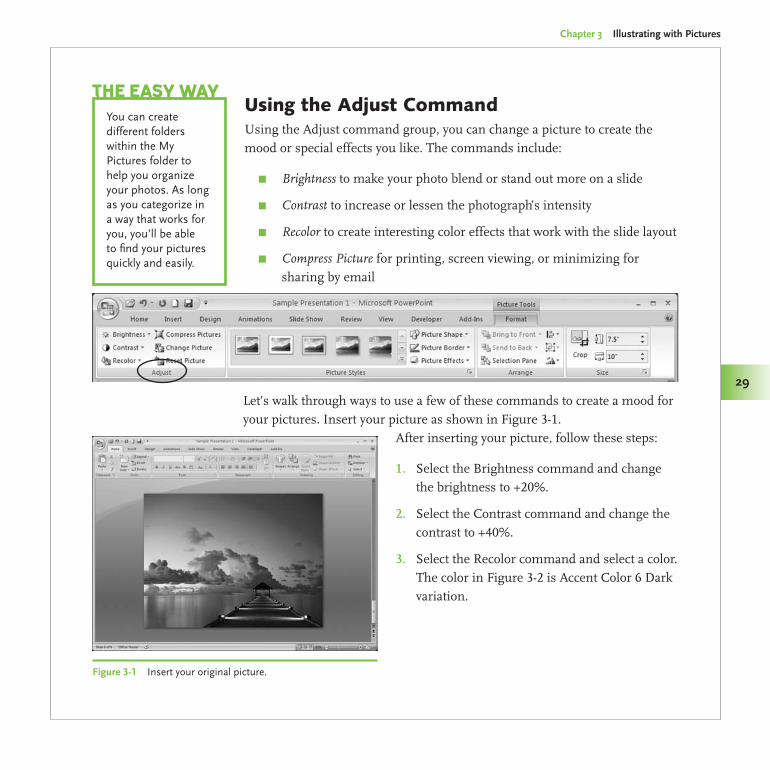
29
Using the Adjust CommandUsing the Adjust command group, you can change a picture to create the mood or special effects you like. The commands include:
Brightness π to make your photo blend or stand out more on a slide
Contrast π to increase or lessen the photograph’s intensity
Recolor π to create interesting color effects that work with the slide layout
Compress Picture π for printing, screen viewing, or minimizing for sharing by email
Let’s walk through ways to use a few of these commands to create a mood for your pictures. Insert your picture as shown in Figure 3-1.
After inserting your picture, follow these steps:
Select the Brightness1. command and change the brightness to +20%.
Select the Contrast2. command and change the contrast to +40%.
Select the Recolor3. command and select a color. The color in Figure 3-2 is Accent Color 6 Dark variation.
You can create different folders within the My Pictures folder to help you organize your photos. As long as you categorize in a way that works for you, you’ll be able to find your pictures quickly and easily.
The easy Way
Figure 3-1 Insert your original picture.
Made Easy/PowerPoint 2007 Graphics & Animation/Slack/0071600760/Chapter 3
PowerPoint 2007 Graphics and Animation Made Easy
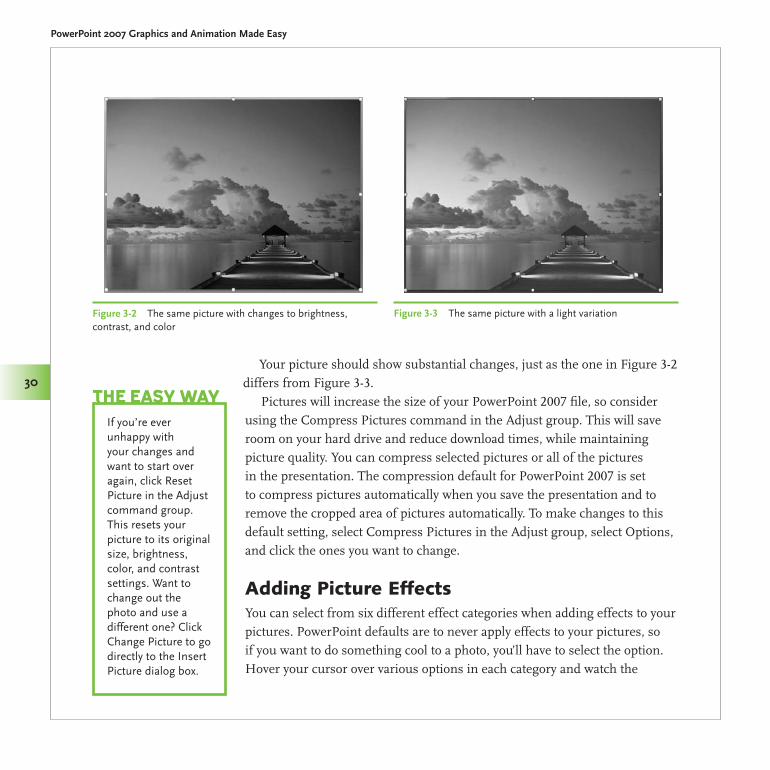
30Your picture should show substantial changes, just as the one in Figure 3-2
differs from Figure 3-3.Pictures will increase the size of your PowerPoint 2007 file, so consider
using the Compress Pictures command in the Adjust group. This will save room on your hard drive and reduce download times, while maintaining picture quality. You can compress selected pictures or all of the pictures in the presentation. The compression default for PowerPoint 2007 is set to compress pictures automatically when you save the presentation and to remove the cropped area of pictures automatically. To make changes to this default setting, select Compress Pictures in the Adjust group, select Options, and click the ones you want to change.
Adding Picture EffectsYou can select from six different effect categories when adding effects to your pictures. PowerPoint defaults are to never apply effects to your pictures, so if you want to do something cool to a photo, you’ll have to select the option. Hover your cursor over various options in each category and watch the
If you’re ever unhappy with your changes and want to start over again, click Reset Picture in the Adjust command group. This resets your picture to its original size, brightness, color, and contrast settings. Want to change out the photo and use a different one? Click Change Picture to go directly to the Insert Picture dialog box.
The easy Way
Figure 3-2 The same picture with changes to brightness, contrast, and color
Figure 3-3 The same picture with a light variation
Made Easy/PowerPoint 2007 Graphics & Animation/Slack/0071600760/Chapter 3
Chapter 3 Illustrating with Pictures
31
picture on your slide. PowerPoint 2007’s Live Preview will show you exactly how the photo will look if you decide to select a particular option. Here are the effect categories and what they do:
Shadow π Lets you add an inner, outer, or perspective shadow to your pictures.
Reflection π Produces different mirror images of your photo. You can choose from nine variations.
Glow π Makes your pictures look extremely hip. PowerPoint has a gallery of preselected colors, but you can also click More Glow Colors at the bottom of the gallery to create your own personalized glow.
Soft Edges π Allows you to soften the edges of your photos. As you soften, the photo will reduce by up to 50 percent, depending on the point size option you choose.
Bevel π Applies different edging options to your photos. Some are soft, some have dual edging, some add angles, and so on. You can even create and add 3D options to bevel effects.
3-D Rotation π Lets you instantly add preset 3D options to your picture.
Pictures can play an important role in presenting information in a text format. Although text is necessary for communicating with your audience, it can be overwhelming if not aesthetically designed to make it easy to digest. Bullets are one way to break up your text, but another way is to place pictures strategically on the slide.
You may have a text-only slide that, as a rule, is not interesting to look at. You could “underwhelm” your audience and their interest would wane.
Another option is to add a picture to your bulleted text. Inserting a framed oval picture on the slide increases interest.
You can invite readers in quickly by using a colorful background with the text on top. The brightness and contrast of this photo was adjusted so the text is still readable. If you’re using a photo in this way, adjust brightness and contrast to make sure text is legible. Landscape pictures generally lend themselves well to this type of use. Many landscape photos have enough contrast between light and dark areas so you can arrange text for legible reading.
PicTure This...
Made Easy/PowerPoint 2007 Graphics & Animation/Slack/0071600760/Chapter 3
PowerPoint 2007 Graphics and Animation Made Easy
32
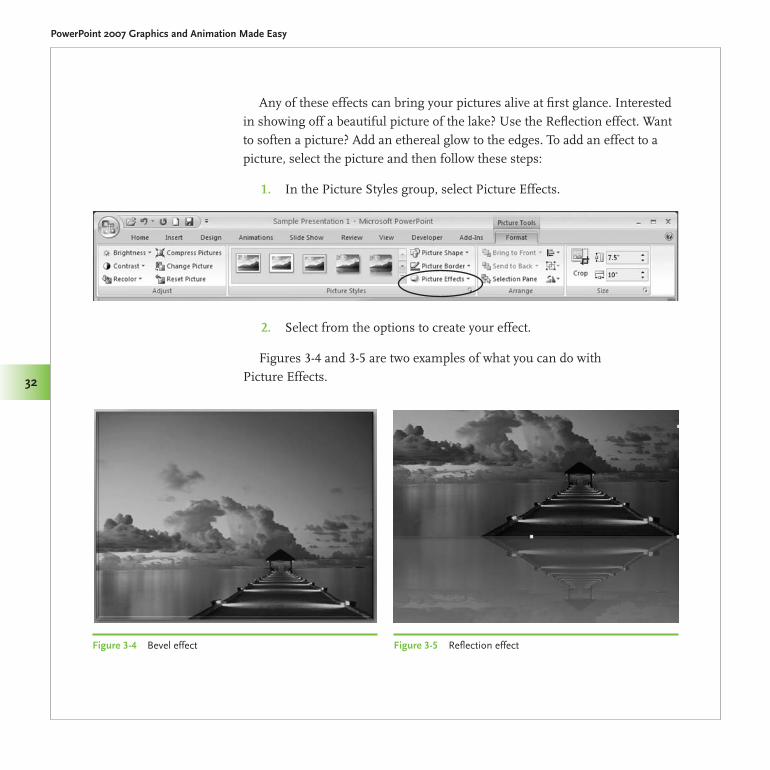
Any of these effects can bring your pictures alive at first glance. Interested in showing off a beautiful picture of the lake? Use the Reflection effect. Want to soften a picture? Add an ethereal glow to the edges. To add an effect to a picture, select the picture and then follow these steps:
In the Picture Styles group, select Picture Effects.1.
Select from the options to create your effect.2.
Figures 3-4 and 3-5 are two examples of what you can do with Picture Effects.
Figure 3-5 Reflection effectFigure 3-4 Bevel effect
Made Easy/PowerPoint 2007 Graphics & Animation/Slack/0071600760/Chapter 3
Chapter 3 Illustrating with Pictures
33
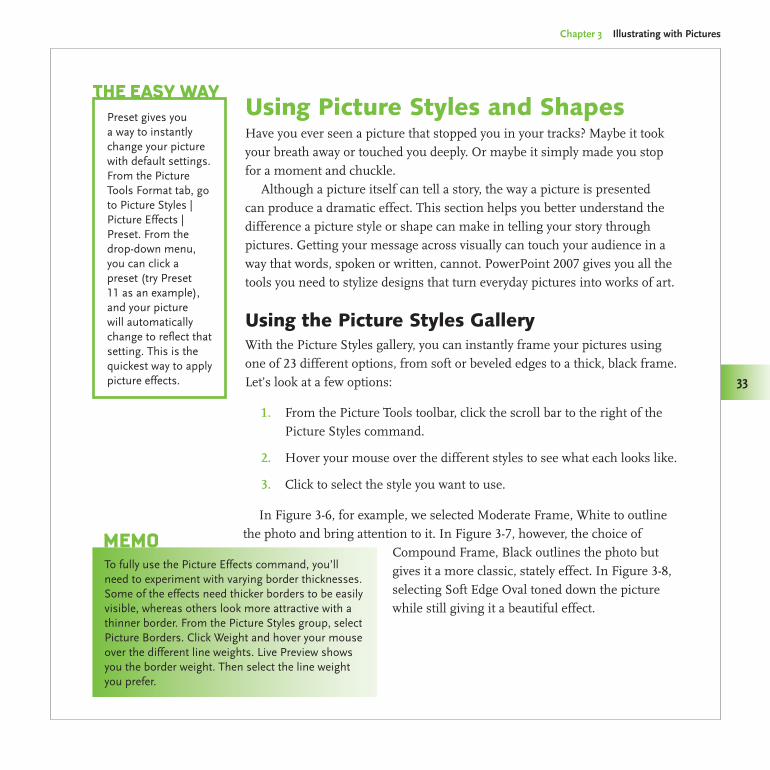
Using Picture Styles and ShapesHave you ever seen a picture that stopped you in your tracks? Maybe it took your breath away or touched you deeply. Or maybe it simply made you stop for a moment and chuckle.
Although a picture itself can tell a story, the way a picture is presented can produce a dramatic effect. This section helps you better understand the difference a picture style or shape can make in telling your story through pictures. Getting your message across visually can touch your audience in a way that words, spoken or written, cannot. PowerPoint 2007 gives you all the tools you need to stylize designs that turn everyday pictures into works of art.
Using the Picture Styles GalleryWith the Picture Styles gallery, you can instantly frame your pictures using one of 23 different options, from soft or beveled edges to a thick, black frame. Let’s look at a few options:
From the Picture Tools1. toolbar, click the scroll bar to the right of the Picture Styles command.
Hover your mouse over the different styles to see what each looks like.2.
Click to select the style you want to use.3.
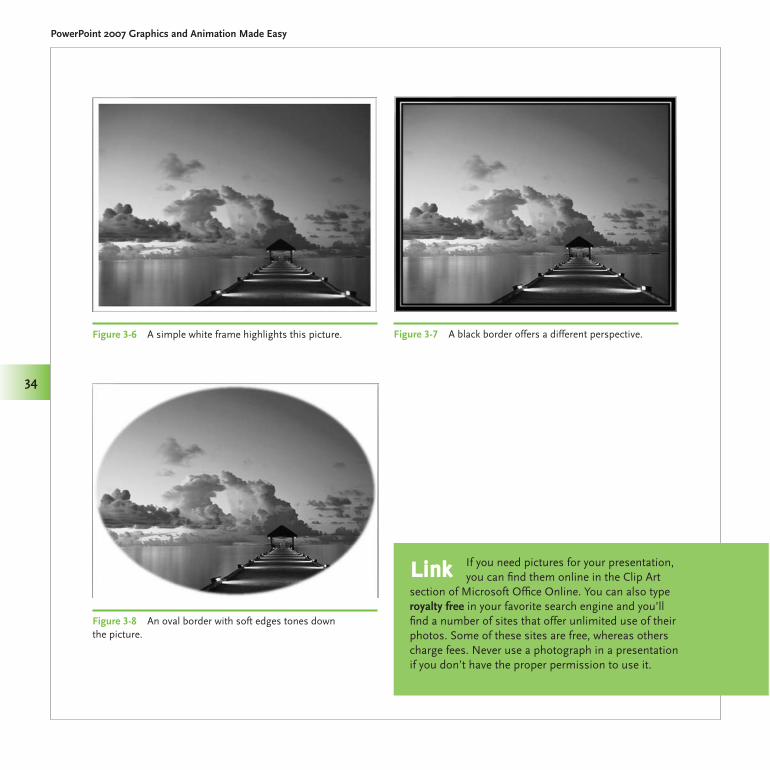
In Figure 3-6, for example, we selected Moderate Frame, White to outline the photo and bring attention to it. In Figure 3-7, however, the choice of
Compound Frame, Black outlines the photo but gives it a more classic, stately effect. In Figure 3-8, selecting Soft Edge Oval toned down the picture while still giving it a beautiful effect.
Preset gives you a way to instantly change your picture with default settings. From the Picture Tools Format tab, go to Picture Styles | Picture Effects | Preset. From the drop-down menu, you can click a preset (try Preset 11 as an example), and your picture will automatically change to reflect that setting. This is the quickest way to apply picture effects.
The easy Way
To fully use the Picture Effects command, you’ll need to experiment with varying border thicknesses. Some of the effects need thicker borders to be easily visible, whereas others look more attractive with a thinner border. From the Picture Styles group, select Picture Borders. Click Weight and hover your mouse over the different line weights. Live Preview shows you the border weight. Then select the line weight you prefer.
MeMo
Made Easy/PowerPoint 2007 Graphics & Animation/Slack/0071600760/Chapter 3
PowerPoint 2007 Graphics and Animation Made Easy
34
Figure 3-6 A simple white frame highlights this picture. Figure 3-7 A black border offers a different perspective.
Figure 3-8 An oval border with soft edges tones down the picture.
If you need pictures for your presentation, you can find them online in the Clip Art
section of Microsoft Office Online. You can also type royalty free in your favorite search engine and you’ll find a number of sites that offer unlimited use of their photos. Some of these sites are free, whereas others charge fees. Never use a photograph in a presentation if you don’t have the proper permission to use it.
Link
Made Easy/PowerPoint 2007 Graphics & Animation/Slack/0071600760/Chapter 3
Chapter 3 Illustrating with Pictures
35
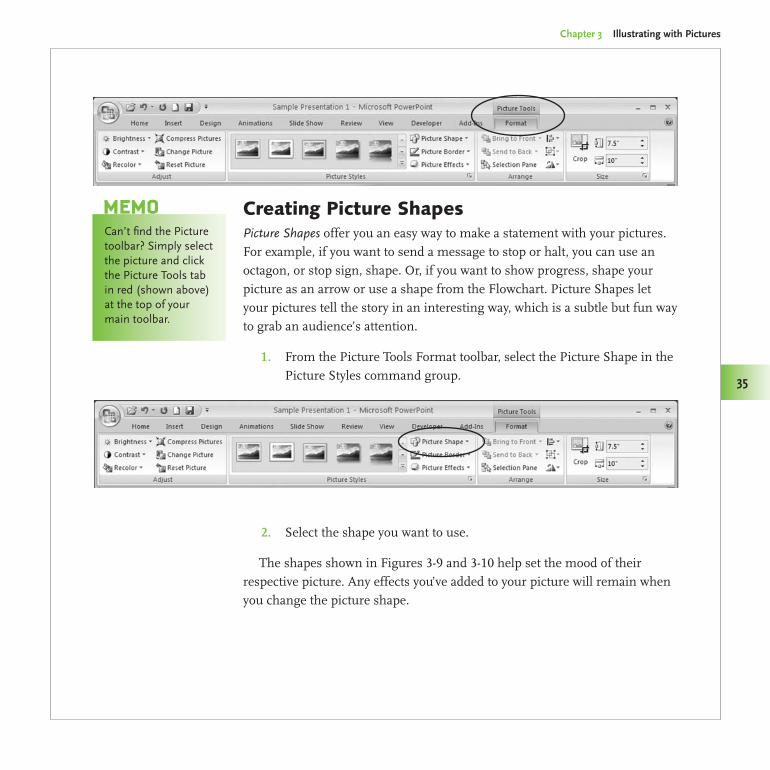
Creating Picture ShapesPicture Shapes offer you an easy way to make a statement with your pictures. For example, if you want to send a message to stop or halt, you can use an octagon, or stop sign, shape. Or, if you want to show progress, shape your picture as an arrow or use a shape from the Flowchart. Picture Shapes let your pictures tell the story in an interesting way, which is a subtle but fun way to grab an audience’s attention.
From the Picture Tools Format toolbar, select the Picture Shape in the 1. Picture Styles command group.
Select the shape you want to use.2.
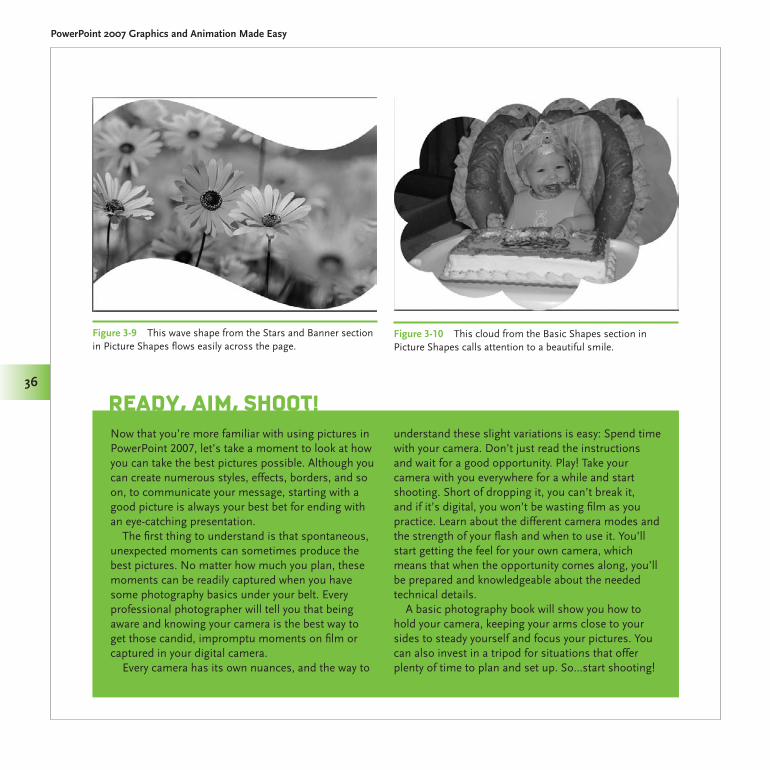
The shapes shown in Figures 3-9 and 3-10 help set the mood of their respective picture. Any effects you’ve added to your picture will remain when you change the picture shape.
Can’t find the Picture toolbar? Simply select the picture and click the Picture Tools tab in red (shown above) at the top of your main toolbar.
MeMo
Made Easy/PowerPoint 2007 Graphics & Animation/Slack/0071600760/Chapter 3
PowerPoint 2007 Graphics and Animation Made Easy
36
Now that you’re more familiar with using pictures in PowerPoint 2007, let’s take a moment to look at how you can take the best pictures possible. Although you can create numerous styles, effects, borders, and so on, to communicate your message, starting with a good picture is always your best bet for ending with an eye-catching presentation.
The first thing to understand is that spontaneous, unexpected moments can sometimes produce the best pictures. No matter how much you plan, these moments can be readily captured when you have some photography basics under your belt. Every professional photographer will tell you that being aware and knowing your camera is the best way to get those candid, impromptu moments on film or captured in your digital camera.
Every camera has its own nuances, and the way to
understand these slight variations is easy: Spend time with your camera. Don’t just read the instructions and wait for a good opportunity. Play! Take your camera with you everywhere for a while and start shooting. Short of dropping it, you can’t break it, and if it’s digital, you won’t be wasting film as you practice. Learn about the different camera modes and the strength of your flash and when to use it. You’ll start getting the feel for your own camera, which means that when the opportunity comes along, you’ll be prepared and knowledgeable about the needed technical details.
A basic photography book will show you how to hold your camera, keeping your arms close to your sides to steady yourself and focus your pictures. You can also invest in a tripod for situations that offer plenty of time to plan and set up. So…start shooting!
ready, aiM, shooT!
Figure 3-9 This wave shape from the Stars and Banner section in Picture Shapes flows easily across the page.
Figure 3-10 This cloud from the Basic Shapes section in Picture Shapes calls attention to a beautiful smile.
Made Easy/PowerPoint 2007 Graphics & Animation/Slack/0071600760/Chapter 3
Chapter 3 Illustrating with Pictures
37
Cropping, Sizing, and Framing Pictures for Maximum EffectResizing and framing pictures in PowerPoint 2007 means you can focus on what matters most—whether it’s your child’s bright smile, a business executive, or a group of friends laughing at dinner. When you edit pictures, you can add pictures styles, shapes, and borders in a variety of combinations.
The beauty of cropping, sizing, and framing pictures means you can take a so-so picture and make it stand out on the slide. Don’t depend on these commands too much though. As you just learned, you’re better off starting with a great picture and using these commands to enhance the photograph, rather than vice versa.
Cropping and SizingThe basic difference between cropping and sizing is changing the content of the picture versus changing the size of the picture. Cropping means you remove portions of the picture such as excess space that isn’t relevant. Sizing is simply making the picture bigger or smaller than its original size.
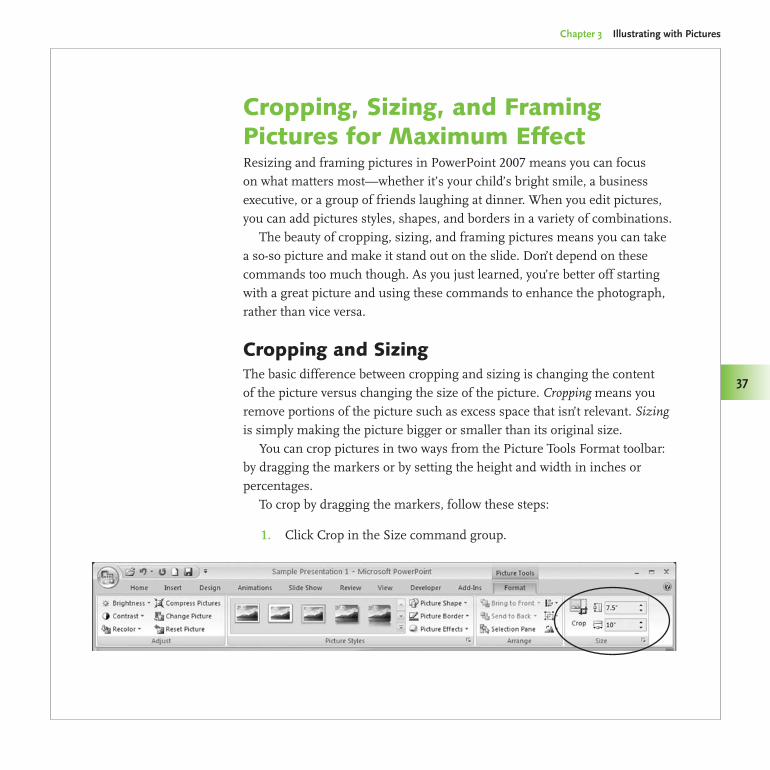
You can crop pictures in two ways from the Picture Tools Format toolbar: by dragging the markers or by setting the height and width in inches or percentages.
To crop by dragging the markers, follow these steps:
Click Crop in the Size command group.1.
Made Easy/PowerPoint 2007 Graphics & Animation/Slack/0071600760/Chapter 3
PowerPoint 2007 Graphics and Animation Made Easy
38
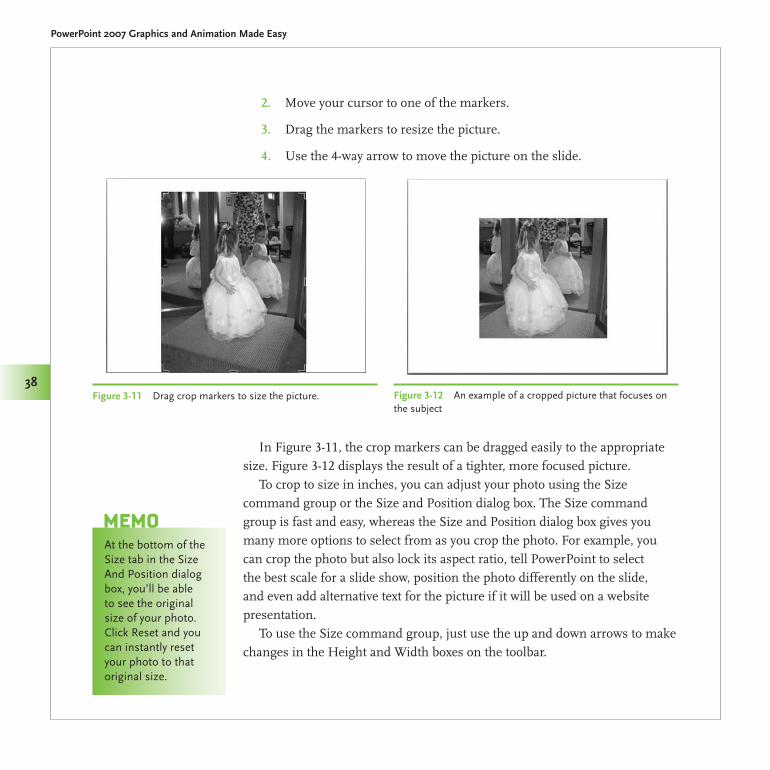
Move your cursor to one of the markers.2.
Drag the markers to resize the picture.3.
Use the 4-way arrow to move the picture on the slide.4.
In Figure 3-11, the crop markers can be dragged easily to the appropriate size. Figure 3-12 displays the result of a tighter, more focused picture.
To crop to size in inches, you can adjust your photo using the Size command group or the Size and Position dialog box. The Size command group is fast and easy, whereas the Size and Position dialog box gives you many more options to select from as you crop the photo. For example, you can crop the photo but also lock its aspect ratio, tell PowerPoint to select the best scale for a slide show, position the photo differently on the slide, and even add alternative text for the picture if it will be used on a website presentation.
To use the Size command group, just use the up and down arrows to make changes in the Height and Width boxes on the toolbar.
Figure 3-11 Drag crop markers to size the picture. Figure 3-12 An example of a cropped picture that focuses on the subject
At the bottom of the Size tab in the Size And Position dialog box, you’ll be able to see the original size of your photo. Click Reset and you can instantly reset your photo to that original size.
MeMo
Made Easy/PowerPoint 2007 Graphics & Animation/Slack/0071600760/Chapter 3
Chapter 3 Illustrating with Pictures
39
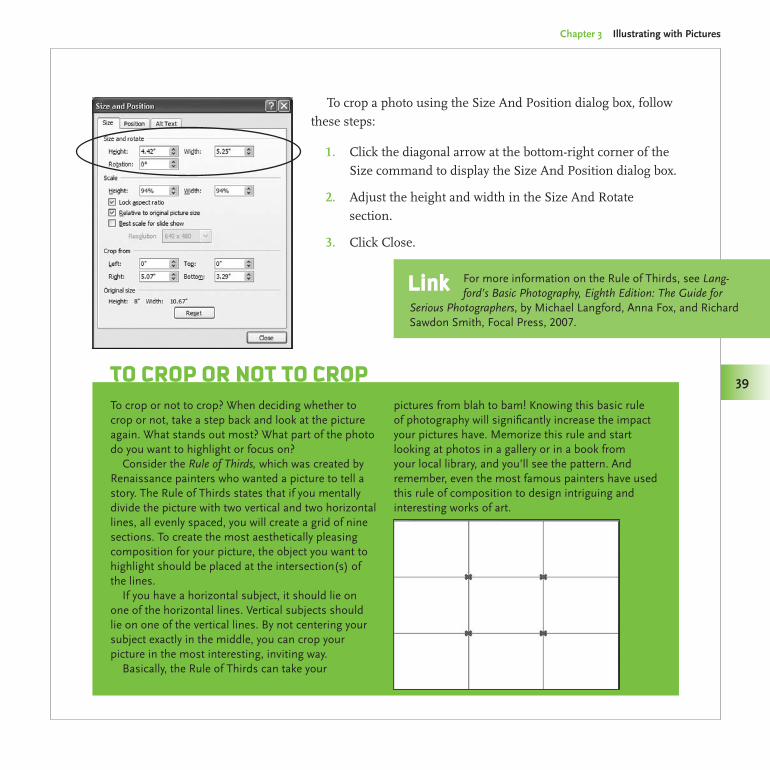
To crop a photo using the Size And Position dialog box, follow these steps:
Click the diagonal arrow at the bottom-right corner of the 1. Size command to display the Size And Position dialog box.
Adjust the height and width in the Size And Rotate 2. section.
Click Close.3.
To crop or not to crop? When deciding whether to crop or not, take a step back and look at the picture again. What stands out most? What part of the photo do you want to highlight or focus on?
Consider the Rule of Thirds, which was created by Renaissance painters who wanted a picture to tell a story. The Rule of Thirds states that if you mentally divide the picture with two vertical and two horizontal lines, all evenly spaced, you will create a grid of nine sections. To create the most aesthetically pleasing composition for your picture, the object you want to highlight should be placed at the intersection(s) of the lines.
If you have a horizontal subject, it should lie on one of the horizontal lines. Vertical subjects should lie on one of the vertical lines. By not centering your subject exactly in the middle, you can crop your picture in the most interesting, inviting way.
Basically, the Rule of Thirds can take your
pictures from blah to bam! Knowing this basic rule of photography will significantly increase the impact your pictures have. Memorize this rule and start looking at photos in a gallery or in a book from your local library, and you’ll see the pattern. And remember, even the most famous painters have used this rule of composition to design intriguing and interesting works of art.
To croP or NoT To croP
For more information on the Rule of Thirds, see Lang-ford’s Basic Photography, Eighth Edition: The Guide for
Serious Photographers, by Michael Langford, Anna Fox, and Richard Sawdon Smith, Focal Press, 2007.
Link
Made Easy/PowerPoint 2007 Graphics & Animation/Slack/0071600760/Chapter 3
PowerPoint 2007 Graphics and Animation Made Easy
40
To size by percentage using the Size And Position dialog box, follow these steps:
Click on the diagonal arrow at the bottom-right corner of the Size 1. command group.
In the Size And Position2. dialog box, select the picture size by adjusting the percentages in the Scale section.
Click Close.3.
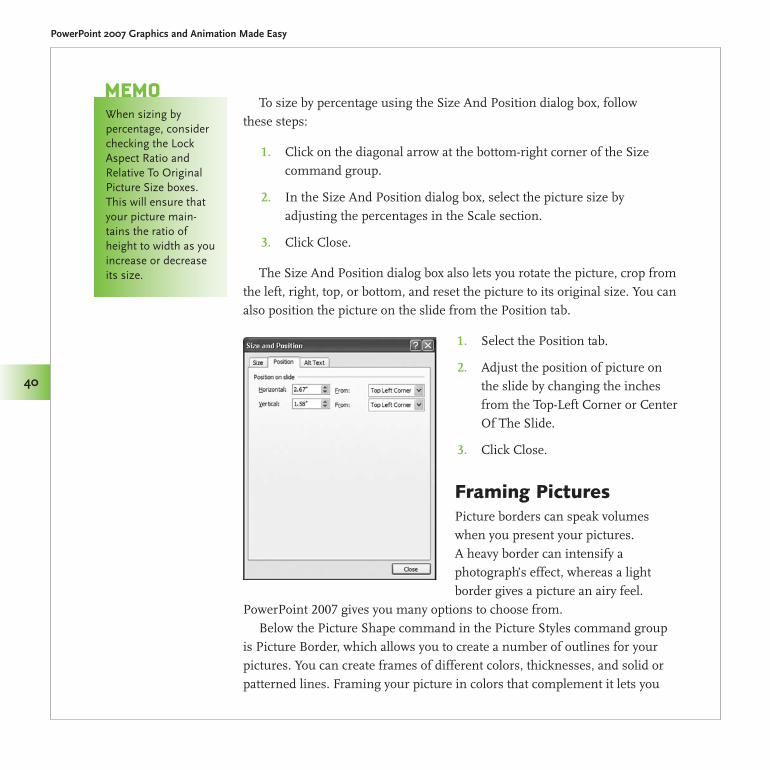
The Size And Position dialog box also lets you rotate the picture, crop from the left, right, top, or bottom, and reset the picture to its original size. You can also position the picture on the slide from the Position tab.
Select the Position tab.1.
Adjust the position of picture on 2. the slide by changing the inches from the Top-Left Corner or Center Of The Slide.
Click Close.3.
Framing PicturesPicture borders can speak volumes when you present your pictures. A heavy border can intensify a photograph’s effect, whereas a light border gives a picture an airy feel.
PowerPoint 2007 gives you many options to choose from.Below the Picture Shape command in the Picture Styles command group
is Picture Border, which allows you to create a number of outlines for your pictures. You can create frames of different colors, thicknesses, and solid or patterned lines. Framing your picture in colors that complement it lets you
When sizing by percentage, consider checking the Lock Aspect Ratio and Relative To Original Picture Size boxes. This will ensure that your picture main-tains the ratio of height to width as you increase or decrease its size.
MeMo
Made Easy/PowerPoint 2007 Graphics & Animation/Slack/0071600760/Chapter 3
Chapter 3 Illustrating with Pictures
41
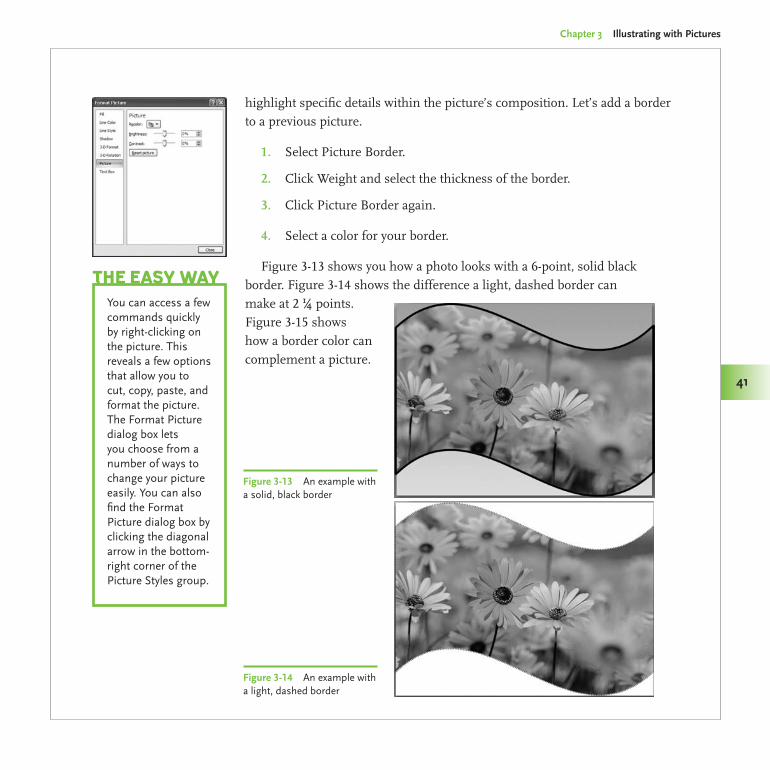
highlight specific details within the picture’s composition. Let’s add a border to a previous picture.
Select Picture Border.1.
Click Weight and select the thickness of the border.2.
Click Picture Border again.3.
Select a color for your border.4.
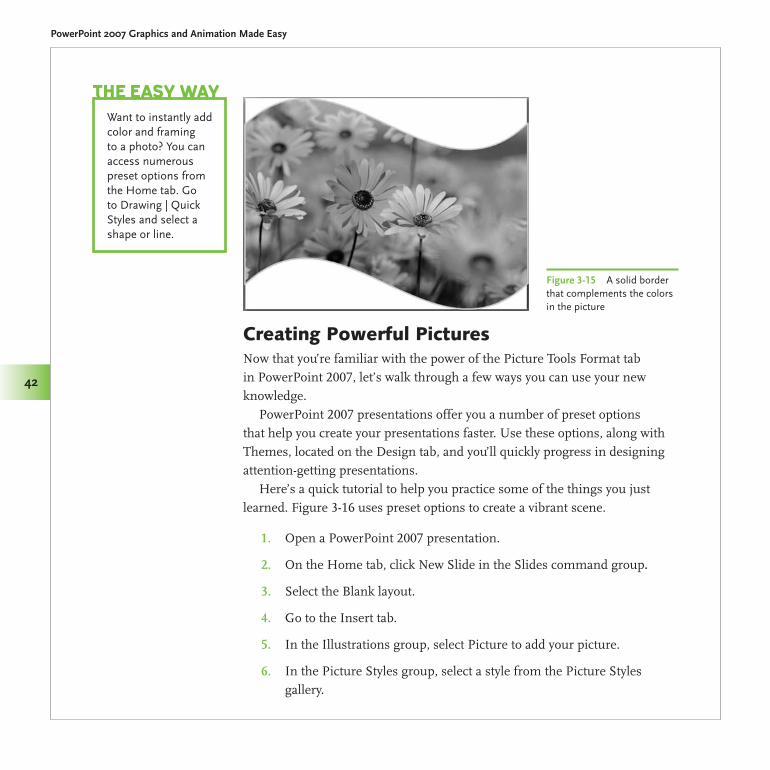
Figure 3-13 shows you how a photo looks with a 6-point, solid black border. Figure 3-14 shows the difference a light, dashed border can make at 2 ¼ points. Figure 3-15 shows how a border color can complement a picture.
You can access a few commands quickly by right-clicking on the picture. This reveals a few options that allow you to cut, copy, paste, and format the picture. The Format Picture dialog box lets you choose from a number of ways to change your picture easily. You can also find the Format Picture dialog box by clicking the diagonal arrow in the bottom-right corner of the Picture Styles group.
The easy Way
Figure 3-13 An example with a solid, black border
Figure 3-14 An example with a light, dashed border
Made Easy/PowerPoint 2007 Graphics & Animation/Slack/0071600760/Chapter 3
PowerPoint 2007 Graphics and Animation Made Easy
42
Creating Powerful PicturesNow that you’re familiar with the power of the Picture Tools Format tab in PowerPoint 2007, let’s walk through a few ways you can use your new knowledge.
PowerPoint 2007 presentations offer you a number of preset options that help you create your presentations faster. Use these options, along with Themes, located on the Design tab, and you’ll quickly progress in designing attention-getting presentations.
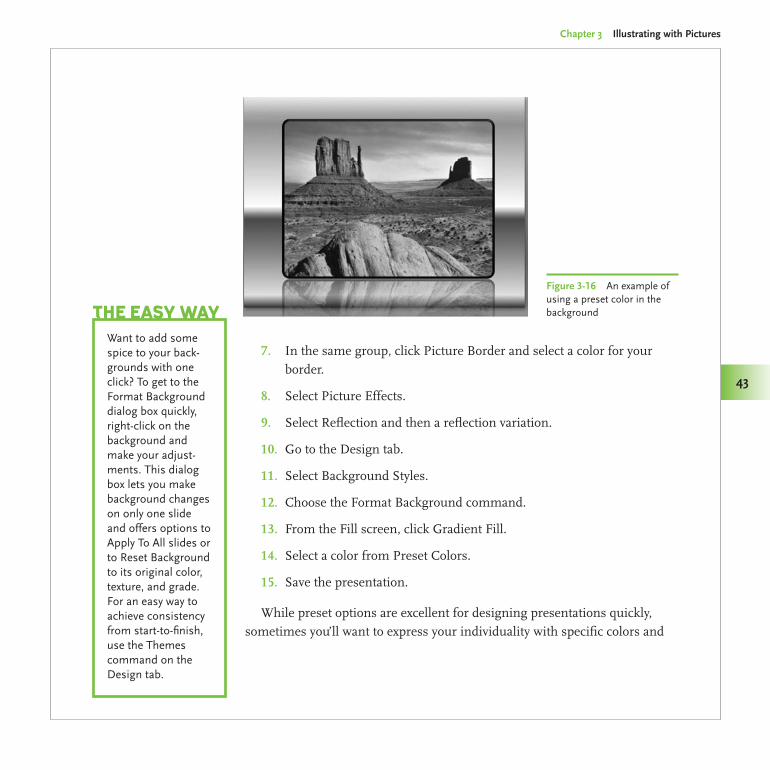
Here’s a quick tutorial to help you practice some of the things you just learned. Figure 3-16 uses preset options to create a vibrant scene.
Open a PowerPoint 2007 presentation.1.
On the Home tab, click New Slide in the Slides2. command group.
Select the Blank layout.3.
Go to the Insert4. tab.
In the Illustrations group, select Picture to add your picture.5.
In the Picture Styles group, select a style from the Picture Styles 6. gallery.
Want to instantly add color and framing to a photo? You can access numerous preset options from the Home tab. Go to Drawing | Quick Styles and select a shape or line.
The easy Way
Figure 3-15 A solid border that complements the colors in the picture
Made Easy/PowerPoint 2007 Graphics & Animation/Slack/0071600760/Chapter 3
Chapter 3 Illustrating with Pictures
43
In the same group, click Picture Border and select a color for your 7. border.
Select Picture Effects.8.
Select Reflection and then a reflection variation.9.
Go to the Design10. tab.
Select Background Styles.11.
Choose the Format Background command.12.
From the Fill screen, click Gradient Fill.13.
Select a color from Preset Colors.14.
Save the presentation.15.
While preset options are excellent for designing presentations quickly, sometimes you’ll want to express your individuality with specific colors and
Want to add some spice to your back-grounds with one click? To get to the Format Background dialog box quickly, right-click on the background and make your adjust-ments. This dialog box lets you make background changes on only one slide and offers options to Apply To All slides or to Reset Background to its original color, texture, and grade. For an easy way to achieve consistency from start-to-finish, use the Themes command on the Design tab.
The easy Way
Figure 3-16 An example of using a preset color in the background
PowerPoint 2007 Graphics and Animation Made Easy
44
Made Easy/PowerPoint 2007 Graphics & Animation/Slack/0071600760/Chapter 3
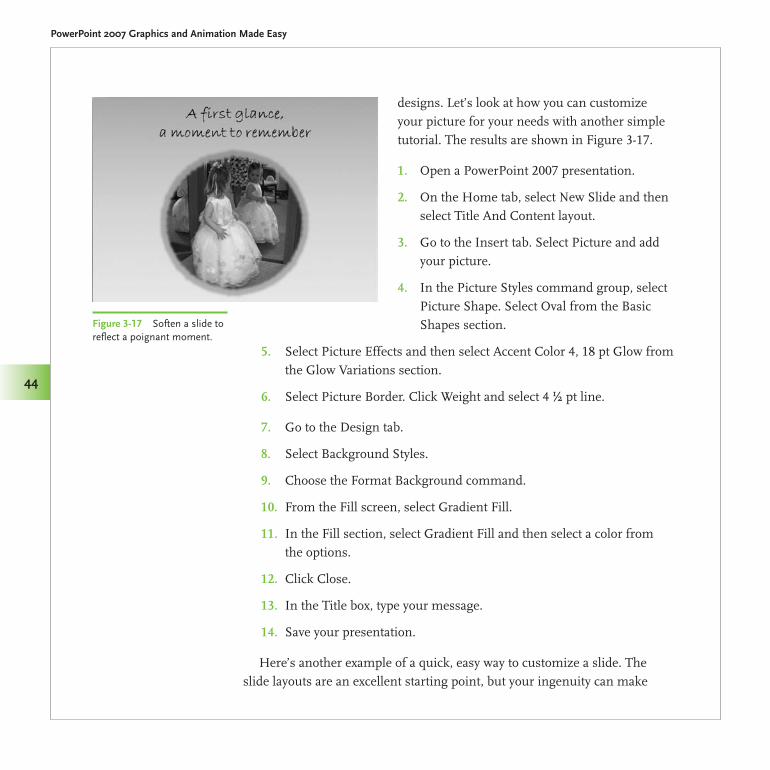
designs. Let’s look at how you can customize your picture for your needs with another simple tutorial. The results are shown in Figure 3-17.
Open a PowerPoint 2007 presentation.1.
On the Home tab, select New Slide and then 2. select Title And Content layout.
Go to the Insert tab. Select Picture and add 3. your picture.
In the Picture Styles command group, select 4. Picture Shape. Select Oval from the Basic Shapes section.
Select Picture Effects5. and then select Accent Color 4, 18 pt Glow from the Glow Variations section.
Select Picture Border. Click6. Weight and select 4 ½ pt line.
Go to the Design7. tab.
Select Background Styles.8.
Choose the Format Background command.9.
From the Fill10. screen, select Gradient Fill.
In the Fill section, select Gradient Fill and then select a color from 11. the options.
Click Close.12.
In the Title box, type your message.13.
Save your presentation.14.
Here’s another example of a quick, easy way to customize a slide. The slide layouts are an excellent starting point, but your ingenuity can make
Figure 3-17 Soften a slide to reflect a poignant moment.
Chapter 3 Illustrating with Pictures
45
Made Easy/PowerPoint 2007 Graphics & Animation/Slack/0071600760/Chapter 3
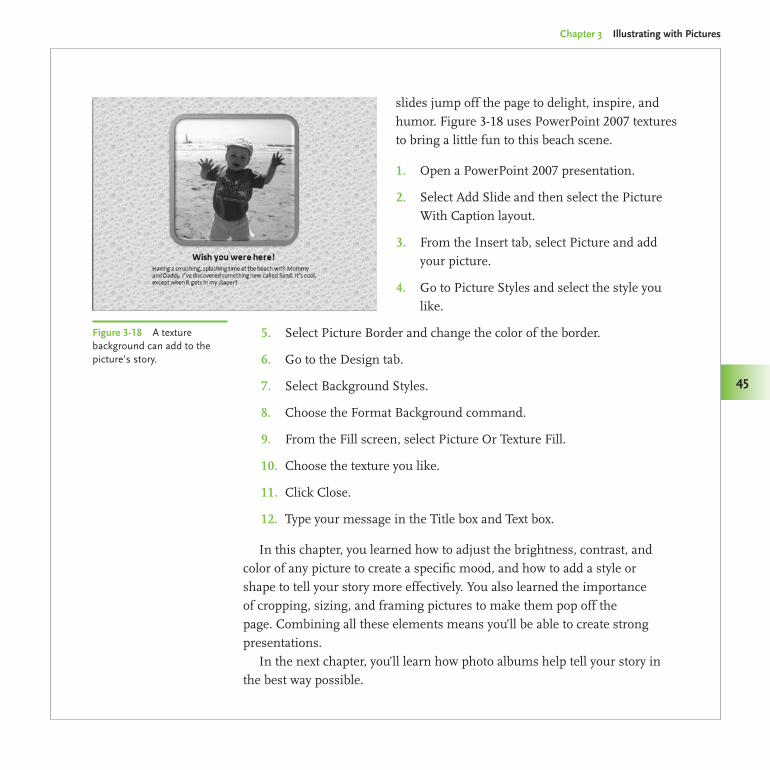
slides jump off the page to delight, inspire, and humor. Figure 3-18 uses PowerPoint 2007 textures to bring a little fun to this beach scene.
Open a PowerPoint 2007 presentation.1.
Select Add Slide and then select the Picture 2. With Caption layout.
From the Insert tab, select Picture and add 3. your picture.
Go to Picture Styles and select the style you 4. like.
Select Picture Border and change the color of the border.5.
Go to the Design tab.6.
Select Background Styles.7.
Choose the Format Background command.8.
From the Fill screen, select Picture Or Texture Fill.9.
Choose the texture you like.10.
Click Close.11.
Type your message in the Title box and Text box.12.
In this chapter, you learned how to adjust the brightness, contrast, and color of any picture to create a specific mood, and how to add a style or shape to tell your story more effectively. You also learned the importance of cropping, sizing, and framing pictures to make them pop off the page. Combining all these elements means you’ll be able to create strong presentations.
In the next chapter, you’ll learn how photo albums help tell your story in the best way possible.
Figure 3-18 A texture background can add to the picture’s story.

This page intentionally left blank

4Creating a Photo Album
Now that you know how to use pictures to their full potential in PowerPoint 2007, you need a way to capture the spirit of your photos in an organized way. The Photo Album lets you have a little fun with presenting photos to family and friends. In this chapter, you’ll learn about photo albums and album layouts and discover how to create, edit, and add captions to your photos. You can use PowerPoint 2007’s themes for consistency throughout your album, and you’ll also learn how simple it is to create a black and white photo album for dramatic effect. You’ll even learn how to customize your layout by resizing photos and adding text boxes manually.
Creating and editing a photo album in PowerPoint 2007 is easy. You have a number of options and layouts to choose from. You may want to say it with a caption or a title, or perhaps your photograph will tell a story without any words at all. The wonderful thing about the Photo Album feature is that you get to display your photos the way you want to.
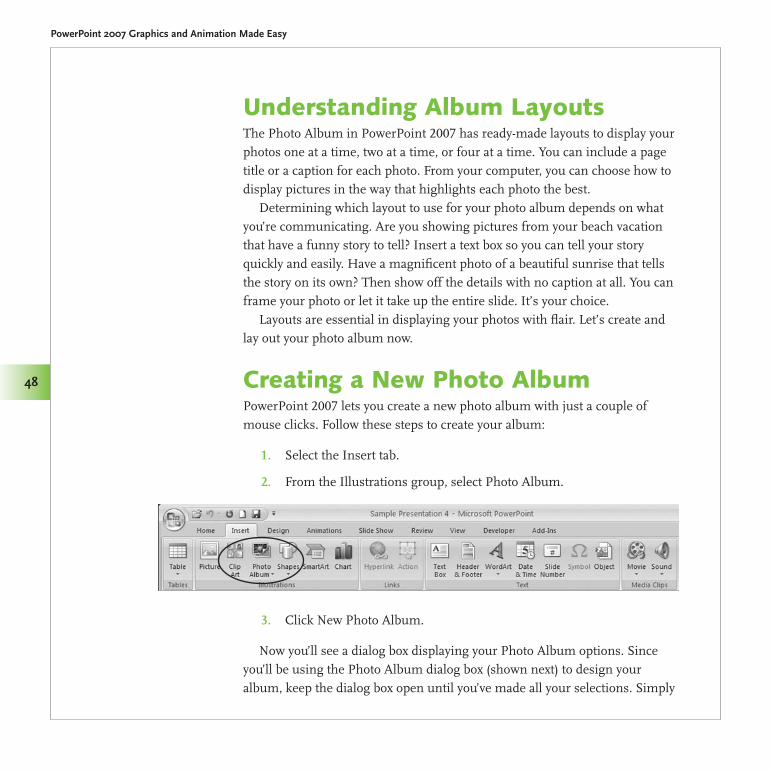
Made Easy/PowerPoint 2007 Graphics & Animation/Slack/0071600760/Chapter 4
PowerPoint 2007 Graphics and Animation Made Easy
48
Understanding Album LayoutsThe Photo Album in PowerPoint 2007 has ready-made layouts to display your photos one at a time, two at a time, or four at a time. You can include a page title or a caption for each photo. From your computer, you can choose how to display pictures in the way that highlights each photo the best.
Determining which layout to use for your photo album depends on what you’re communicating. Are you showing pictures from your beach vacation that have a funny story to tell? Insert a text box so you can tell your story quickly and easily. Have a magnificent photo of a beautiful sunrise that tells the story on its own? Then show off the details with no caption at all. You can frame your photo or let it take up the entire slide. It’s your choice.
Layouts are essential in displaying your photos with flair. Let’s create and lay out your photo album now.
Creating a New Photo AlbumPowerPoint 2007 lets you create a new photo album with just a couple of mouse clicks. Follow these steps to create your album:
Select the Insert1. tab.
From the Illustrations2. group, select Photo Album.
Click New Photo Album.3.
Now you’ll see a dialog box displaying your Photo Album options. Since you’ll be using the Photo Album dialog box (shown next) to design your album, keep the dialog box open until you’ve made all your selections. Simply
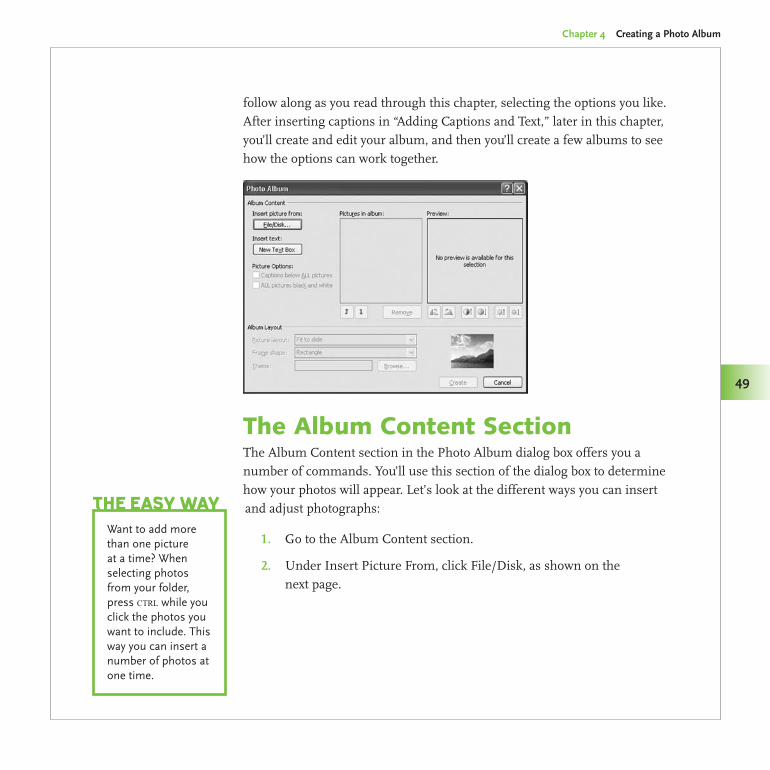
Made Easy/PowerPoint 2007 Graphics & Animation/Slack/0071600760/Chapter 4
Chapter 4 Creating a Photo Album
49
follow along as you read through this chapter, selecting the options you like. After inserting captions in “Adding Captions and Text,” later in this chapter, you’ll create and edit your album, and then you’ll create a few albums to see how the options can work together.
The Album Content SectionThe Album Content section in the Photo Album dialog box offers you a number of commands. You’ll use this section of the dialog box to determine how your photos will appear. Let’s look at the different ways you can insert and adjust photographs:
Go to the Album Content section.1.
Under Insert Picture From, click File/Disk, as shown on the 2. next page.
Want to add more than one picture at a time? When selecting photos from your folder, press ctrl while you click the photos you want to include. This way you can insert a number of photos at one time.
The easy Way
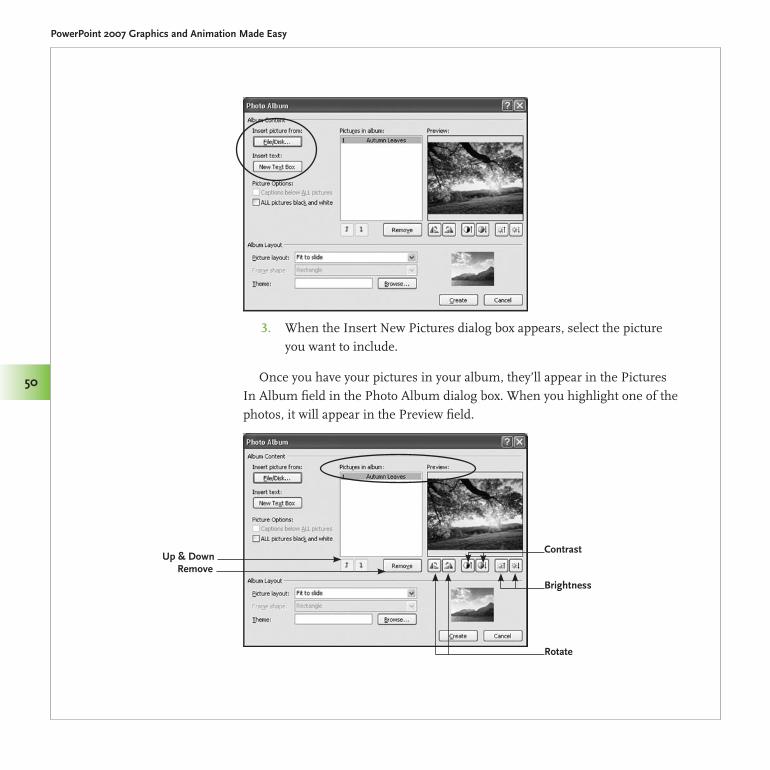
Made Easy/PowerPoint 2007 Graphics & Animation/Slack/0071600760/Chapter 4
PowerPoint 2007 Graphics and Animation Made Easy
50
When the Insert New Pictures dialog box appears, select the picture 3. you want to include.
Once you have your pictures in your album, they’ll appear in the Pictures In Album field in the Photo Album dialog box. When you highlight one of the photos, it will appear in the Preview field.
Remove
Rotate
Contrast
Brightness
Up & Down
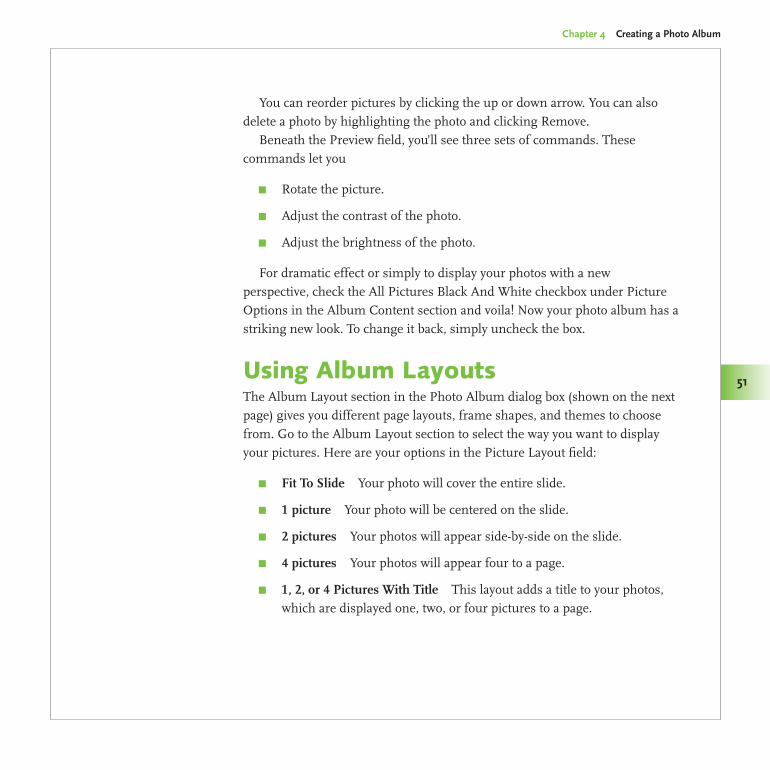
Made Easy/PowerPoint 2007 Graphics & Animation/Slack/0071600760/Chapter 4
Chapter 4 Creating a Photo Album
51
You can reorder pictures by clicking the up or down arrow. You can also delete a photo by highlighting the photo and clicking Remove.
Beneath the Preview field, you’ll see three sets of commands. These commands let you
Rotate the picture. π
Adjust the contrast of the photo. π
Adjust the brightness π of the photo.
For dramatic effect or simply to display your photos with a new perspective, check the All Pictures Black And White checkbox under Picture Options in the Album Content section and voila! Now your photo album has a striking new look. To change it back, simply uncheck the box.
Using Album LayoutsThe Album Layout section in the Photo Album dialog box (shown on the next page) gives you different page layouts, frame shapes, and themes to choose from. Go to the Album Layout section to select the way you want to display your pictures. Here are your options in the Picture Layout field:
Fit To Slide π Your photo will cover the entire slide.
1 picture π Your photo will be centered on the slide.
2 pictures π Your photos will appear side-by-side on the slide.
4 pictures π Your photos will appear four to a page.
1, 2, or 4 Pictures With Title π This layout adds a title to your photos, which are displayed one, two, or four pictures to a page.
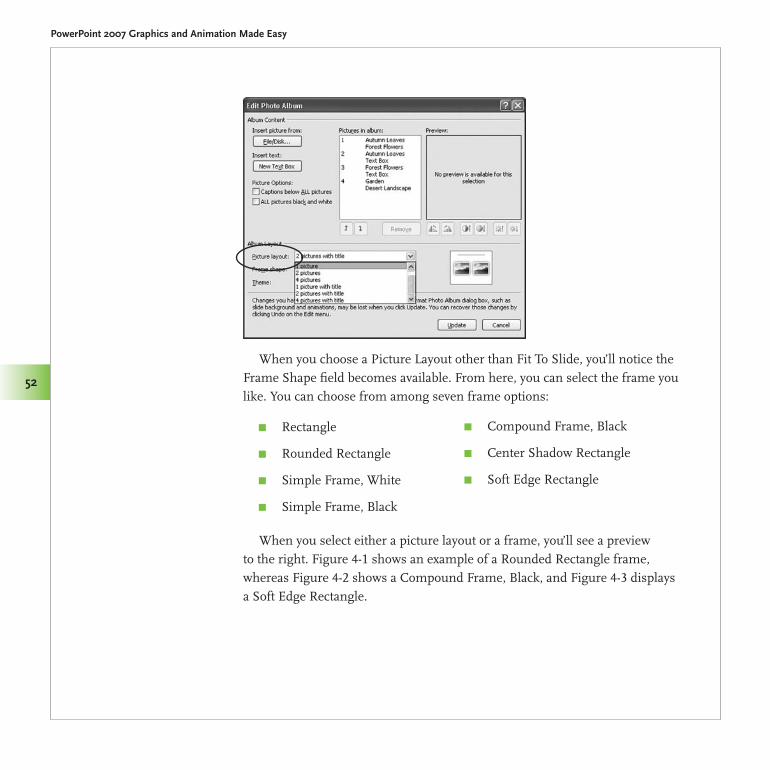
Made Easy/PowerPoint 2007 Graphics & Animation/Slack/0071600760/Chapter 4
PowerPoint 2007 Graphics and Animation Made Easy
52
When you choose a Picture Layout other than Fit To Slide, you’ll notice the Frame Shape field becomes available. From here, you can select the frame you like. You can choose from among seven frame options:
Rectangle π
Rounded Rectangle π
Simple Frame, White π
Simple Frame, Black π
Compound Frame, Black π
Center Shadow Rectangle π
Soft Edge Rectangle π
When you select either a picture layout or a frame, you’ll see a preview to the right. Figure 4-1 shows an example of a Rounded Rectangle frame, whereas Figure 4-2 shows a Compound Frame, Black, and Figure 4-3 displays a Soft Edge Rectangle.
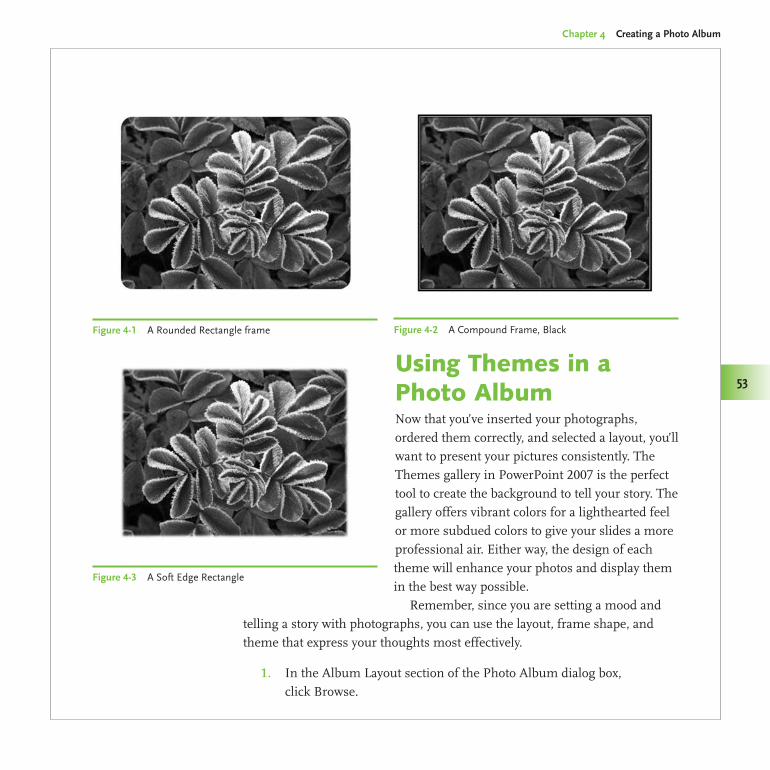
Made Easy/PowerPoint 2007 Graphics & Animation/Slack/0071600760/Chapter 4
Chapter 4 Creating a Photo Album
53Using Themes in a Photo AlbumNow that you’ve inserted your photographs, ordered them correctly, and selected a layout, you’ll want to present your pictures consistently. The Themes gallery in PowerPoint 2007 is the perfect tool to create the background to tell your story. The gallery offers vibrant colors for a lighthearted feel or more subdued colors to give your slides a more professional air. Either way, the design of each theme will enhance your photos and display them in the best way possible.
Remember, since you are setting a mood and telling a story with photographs, you can use the layout, frame shape, and theme that express your thoughts most effectively.
In the Album Layout section of the Photo Album dialog box, 1. click Browse.
Figure 4-1 A Rounded Rectangle frame Figure 4-2 A Compound Frame, Black
Figure 4-3 A Soft Edge Rectangle
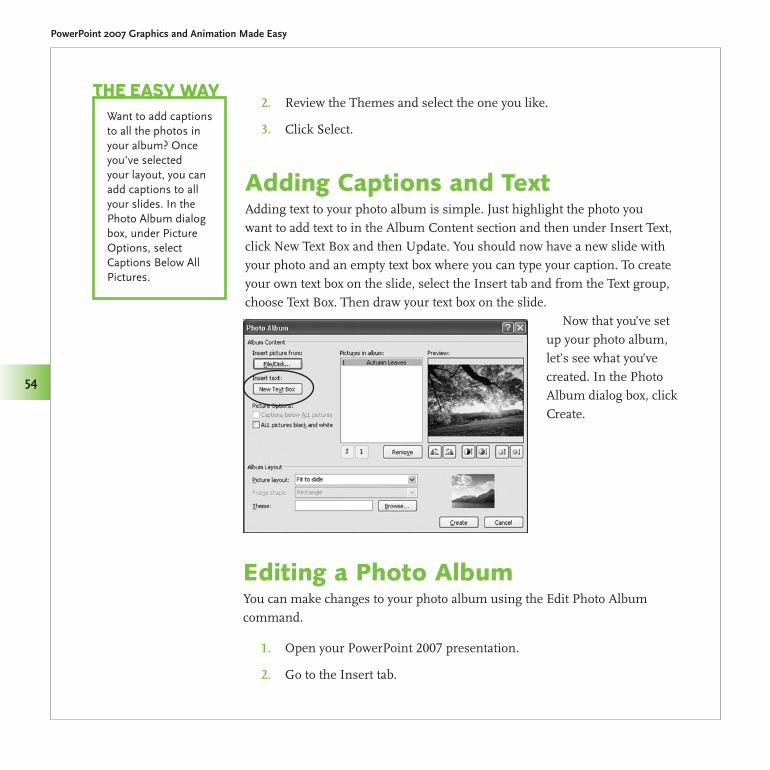
Made Easy/PowerPoint 2007 Graphics & Animation/Slack/0071600760/Chapter 4
PowerPoint 2007 Graphics and Animation Made Easy
54
Review the Themes and select the one you like.2.
Click Select.3.
Adding Captions and TextAdding text to your photo album is simple. Just highlight the photo you want to add text to in the Album Content section and then under Insert Text, click New Text Box and then Update. You should now have a new slide with your photo and an empty text box where you can type your caption. To create your own text box on the slide, select the Insert tab and from the Text group, choose Text Box. Then draw your text box on the slide.
Now that you’ve set up your photo album, let’s see what you’ve created. In the Photo Album dialog box, click Create.
Editing a Photo AlbumYou can make changes to your photo album using the Edit Photo Album command.
Open your PowerPoint 2007 presentation.1.
Go to the Insert tab.2.
Want to add captions to all the photos in your album? Once you’ve selected your layout, you can add captions to all your slides. In the Photo Album dialog box, under Picture Options, select Captions Below All Pictures.
The easy Way
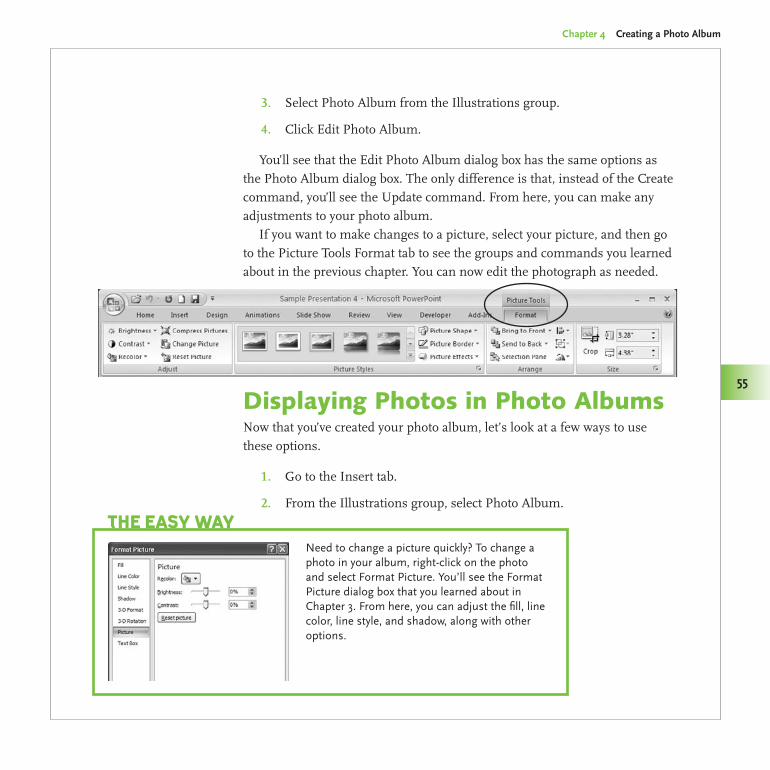
Made Easy/PowerPoint 2007 Graphics & Animation/Slack/0071600760/Chapter 4
Chapter 4 Creating a Photo Album
55
Select Photo Album from the3. Illustrations group.
Click Edit Photo Album.4.
You’ll see that the Edit Photo Album dialog box has the same options as the Photo Album dialog box. The only difference is that, instead of the Create command, you’ll see the Update command. From here, you can make any adjustments to your photo album.
If you want to make changes to a picture, select your picture, and then go to the Picture Tools Format tab to see the groups and commands you learned about in the previous chapter. You can now edit the photograph as needed.
Displaying Photos in Photo AlbumsNow that you’ve created your photo album, let’s look at a few ways to use these options.
Go to the Insert tab.1.
From the Illustrations group, select Photo Album.2.
Need to change a picture quickly? To change a photo in your album, right-click on the photo and select Format Picture. You’ll see the Format Picture dialog box that you learned about in Chapter 3. From here, you can adjust the fill, line color, line style, and shadow, along with other options.
The easy Way
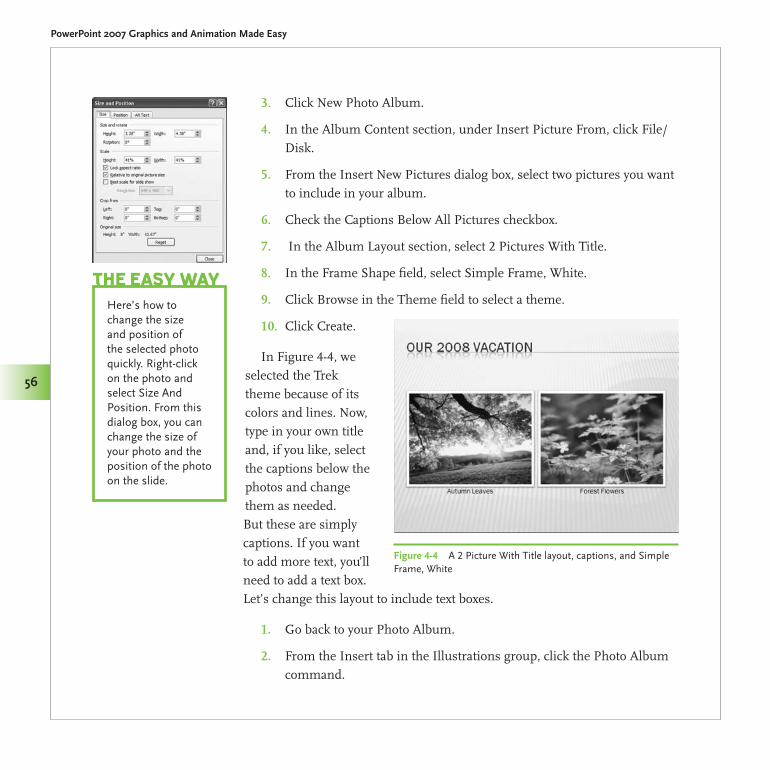
Made Easy/PowerPoint 2007 Graphics & Animation/Slack/0071600760/Chapter 4
PowerPoint 2007 Graphics and Animation Made Easy
56
Click New Photo Album.3.
In the Album Content section, under Insert Picture From, click File/4. Disk.
From the Insert New Pictures dialog box, select two pictures you want 5. to include in your album.
Check the Captions Below All Pictures checkbox.6.
In the Album Layout section, select 2 Pictures With Title.7.
In the Frame Shape field, select Simple Frame, White.8.
Click Browse in the Theme field to select a theme.9.
Click Create.10.
In Figure 4-4, we selected the Trek theme because of its colors and lines. Now, type in your own title and, if you like, select the captions below the photos and change them as needed. But these are simply captions. If you want to add more text, you’ll need to add a text box. Let’s change this layout to include text boxes.
Go back to your Photo Album.1.
From the Insert tab in the Illustrations group, click the Photo Album 2. command.
Here’s how to change the size and position of the selected photo quickly. Right-click on the photo and select Size And Position. From this dialog box, you can change the size of your photo and the position of the photo on the slide.
The easy Way
Figure 4-4 A 2 Picture With Title layout, captions, and Simple Frame, White
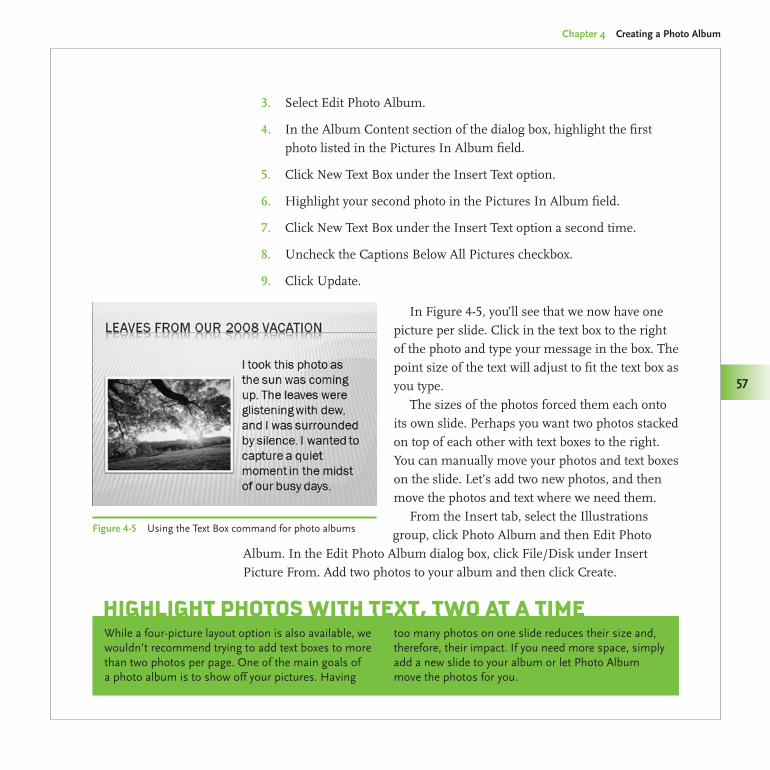
Made Easy/PowerPoint 2007 Graphics & Animation/Slack/0071600760/Chapter 4
Chapter 4 Creating a Photo Album
57
Select Edit Photo Album.3.
In the Album Content section of the dialog box, highlight the first 4. photo listed in the Pictures In Album field.
Click New Text Box under the Insert Text option.5.
Highlight your second photo in the Pictures In Album field.6.
Click New Text Box under the Insert Text option a second time.7.
Uncheck the Captions Below All Pictures checkbox.8.
Click Update.9.
In Figure 4-5, you’ll see that we now have one picture per slide. Click in the text box to the right of the photo and type your message in the box. The point size of the text will adjust to fit the text box as you type.
The sizes of the photos forced them each onto its own slide. Perhaps you want two photos stacked on top of each other with text boxes to the right. You can manually move your photos and text boxes on the slide. Let’s add two new photos, and then move the photos and text where we need them.
From the Insert tab, select the Illustrations group, click Photo Album and then Edit Photo
Album. In the Edit Photo Album dialog box, click File/Disk under Insert Picture From. Add two photos to your album and then click Create.
Figure 4-5 Using the Text Box command for photo albums
While a four-picture layout option is also available, we wouldn’t recommend trying to add text boxes to more than two photos per page. One of the main goals of a photo album is to show off your pictures. Having
too many photos on one slide reduces their size and, therefore, their impact. If you need more space, simply add a new slide to your album or let Photo Album move the photos for you.
highlighT PhoTos WiTh TexT, TWo aT a Time
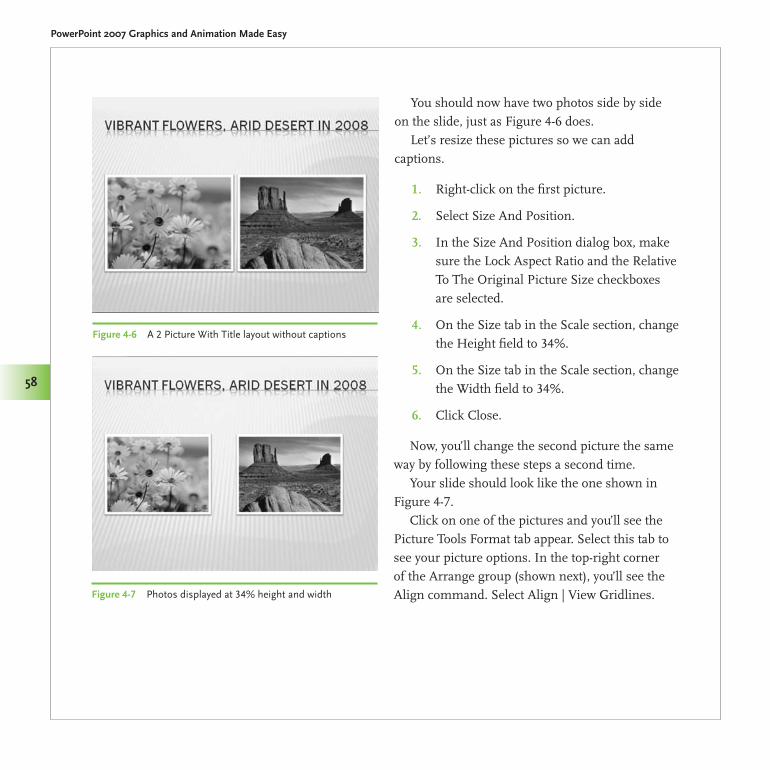
Made Easy/PowerPoint 2007 Graphics & Animation/Slack/0071600760/Chapter 4
PowerPoint 2007 Graphics and Animation Made Easy
58
You should now have two photos side by side on the slide, just as Figure 4-6 does.
Let’s resize these pictures so we can add captions.
Right-click on the first picture.1.
Select Size And Position.2.
In the Size And Position dialog box, make 3. sure the Lock Aspect Ratio and the Relative To The Original Picture Size checkboxes are selected.
On the Size tab in the Scale section, change 4. the Height field to 34%.
On the Size tab in the Scale section, change 5. the Width field to 34%.
Click Close.6.
Now, you’ll change the second picture the same way by following these steps a second time.
Your slide should look like the one shown in Figure 4-7.
Click on one of the pictures and you’ll see the Picture Tools Format tab appear. Select this tab to see your picture options. In the top-right corner of the Arrange group (shown next), you’ll see the Align command. Select Align | View Gridlines.
Figure 4-6 A 2 Picture With Title layout without captions
Figure 4-7 Photos displayed at 34% height and width
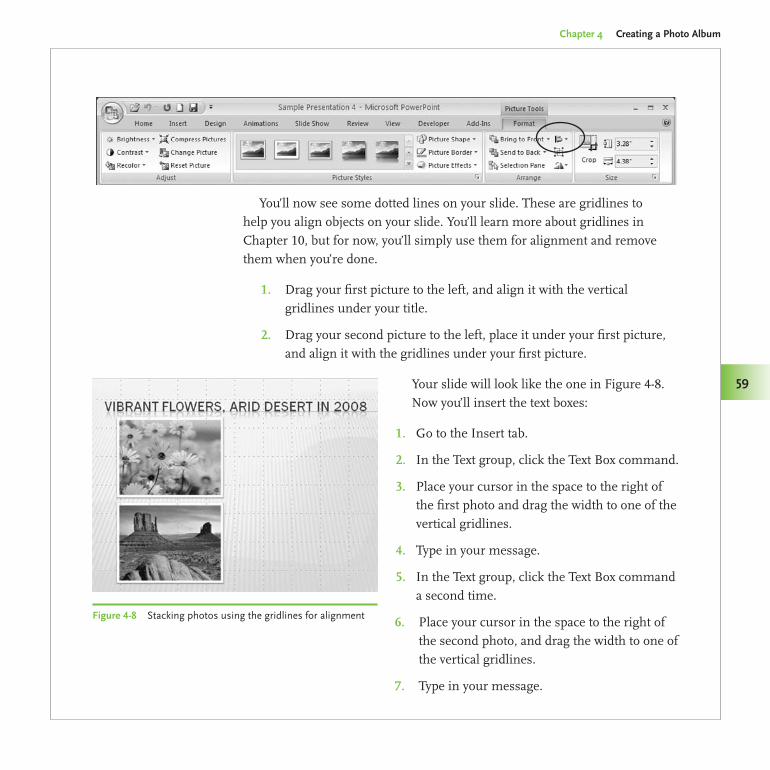
Chapter 4 Creating a Photo Album
59
Made Easy/PowerPoint 2007 Graphics & Animation/Slack/0071600760/Chapter 4
59
You’ll now see some dotted lines on your slide. These are gridlines to help you align objects on your slide. You’ll learn more about gridlines in Chapter 10, but for now, you’ll simply use them for alignment and remove them when you’re done.
Drag your first picture to the left, and align it with the vertical 1. gridlines under your title.
Drag your second picture to the left, place it under your first picture, 2. and align it with the gridlines under your first picture.
Your slide will look like the one in Figure 4-8.Now you’ll insert the text boxes:
Go to the Insert tab.1.
In the Text group, click the Text Box command.2.
Place your cursor in the space to the right of 3. the first photo and drag the width to one of the vertical gridlines.
Type in your message.4.
In the Text group, click the Text Box command 5. a second time.
Place your cursor in the space to the right of 6. the second photo, and drag the width to one of the vertical gridlines.
Type in your message.7.
Figure 4-8 Stacking photos using the gridlines for alignment
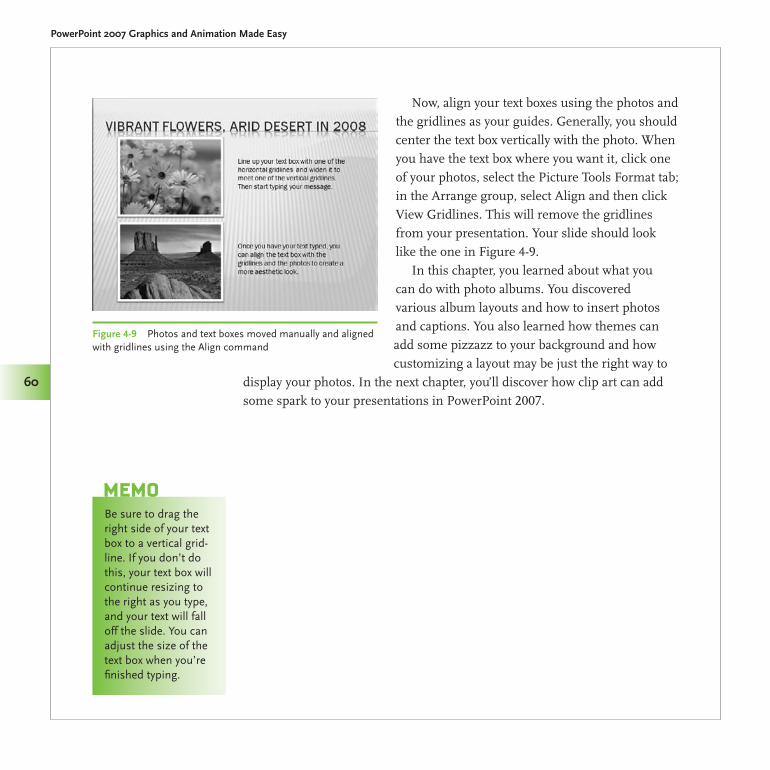
Made Easy/PowerPoint 2007 Graphics & Animation/Slack/0071600760/Chapter 4
PowerPoint 2007 Graphics and Animation Made Easy
60
Now, align your text boxes using the photos and the gridlines as your guides. Generally, you should center the text box vertically with the photo. When you have the text box where you want it, click one of your photos, select the Picture Tools Format tab; in the Arrange group, select Align and then click View Gridlines. This will remove the gridlines from your presentation. Your slide should look like the one in Figure 4-9.
In this chapter, you learned about what you can do with photo albums. You discovered various album layouts and how to insert photos and captions. You also learned how themes can add some pizzazz to your background and how customizing a layout may be just the right way to
display your photos. In the next chapter, you’ll discover how clip art can add some spark to your presentations in PowerPoint 2007.
Be sure to drag the right side of your text box to a vertical grid-line. If you don’t do this, your text box will continue resizing to the right as you type, and your text will fall off the slide. You can adjust the size of the text box when you’re finished typing.
memo
Figure 4-9 Photos and text boxes moved manually and aligned with gridlines using the Align command
5Working with Clip Art
When you think of adding graphics to a presentation, do you automatically think of using the clip art provided in PowerPoint? That’s not unusual. In fact, many people rely solely on clip art for presentations. It’s easy to find clip art to suit your needs, and it can illustrate a point in a fun way. That’s why people use clip art in a presentation, by the way, to liven up a slide in some way and complement text.
Most clip art comes in the form of illustrations, line drawings, or cartoons, but the term also includes photos, movies, sounds, or website icons. Before clip art became available through the Internet, artwork was actually cut out or “clipped” from books—hence the term clip art. The graphic would then be used to accompany the text in magazines, books, or other printed media. Today, of course, clip art can be used digitally on websites, in online newsletters or magazines, and in PowerPoint presentations.
There’s more to clip art, however, than just dropping in a cute cartoon from the PowerPoint Clip Art Collection. You can manipulate the colors in the art, twist the art around, find art from Office Online or on the Internet, and use shared collections of clip art from corporate networks. In this chapter, we’ll explore all those options and give you a few more tips, too.
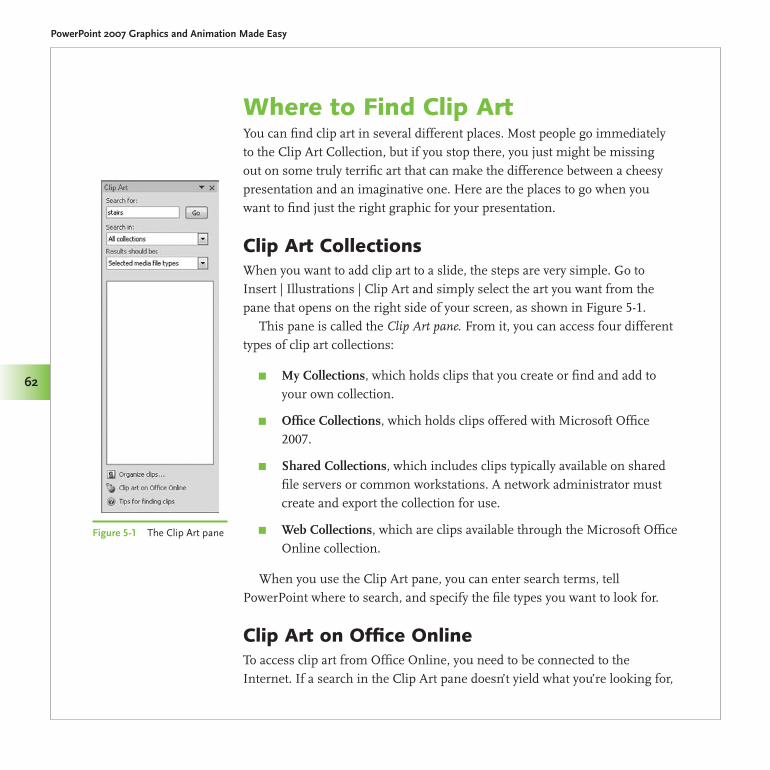
Made Easy/PowerPoint 2007 Graphics & Animation/Slack/0071600760/Chapter 5
PowerPoint 2007 Graphics and Animation Made Easy
62
Where to Find Clip ArtYou can find clip art in several different places. Most people go immediately to the Clip Art Collection, but if you stop there, you just might be missing out on some truly terrific art that can make the difference between a cheesy presentation and an imaginative one. Here are the places to go when you want to find just the right graphic for your presentation.
Clip Art CollectionsWhen you want to add clip art to a slide, the steps are very simple. Go to Insert | Illustrations | Clip Art and simply select the art you want from the pane that opens on the right side of your screen, as shown in Figure 5-1.
This pane is called the Clip Art pane. From it, you can access four different types of clip art collections:
My Collections π , which holds clips that you create or find and add to your own collection.
Office Collections π , which holds clips offered with Microsoft Office 2007.
Shared Collections π , which includes clips typically available on shared file servers or common workstations. A network administrator must create and export the collection for use.
Web Collections π , which are clips available through the Microsoft Office Online collection.
When you use the Clip Art pane, you can enter search terms, tell PowerPoint where to search, and specify the file types you want to look for.
Clip Art on Office OnlineTo access clip art from Office Online, you need to be connected to the Internet. If a search in the Clip Art pane doesn’t yield what you’re looking for,
Figure 5-1 The Clip Art pane
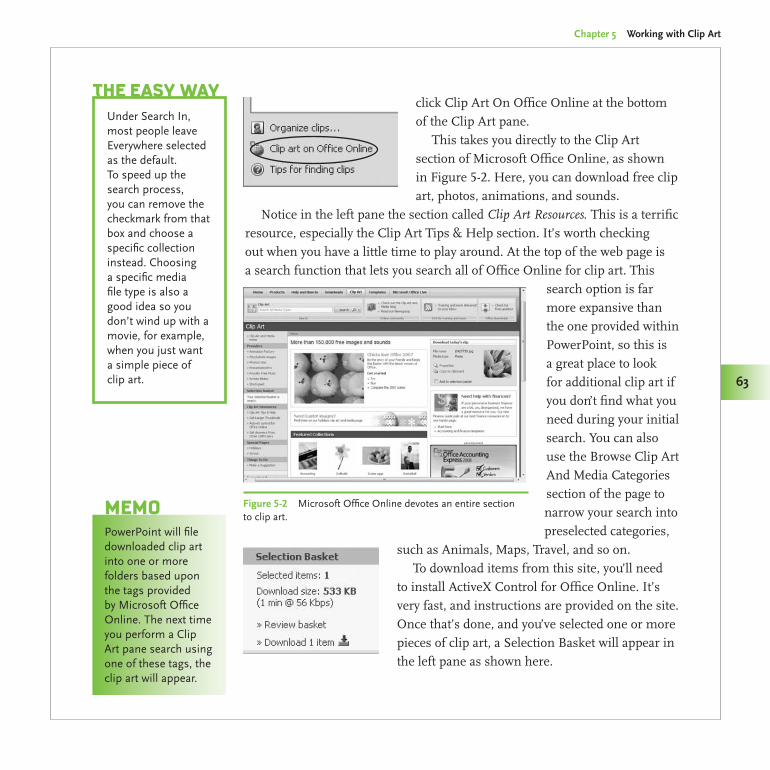
Made Easy/PowerPoint 2007 Graphics & Animation/Slack/0071600760/Chapter 5
Chapter 5 Working with Clip Art
63
click Clip Art On Office Online at the bottom of the Clip Art pane.
This takes you directly to the Clip Art section of Microsoft Office Online, as shown in Figure 5-2. Here, you can download free clip art, photos, animations, and sounds.
Notice in the left pane the section called Clip Art Resources. This is a terrific resource, especially the Clip Art Tips & Help section. It’s worth checking out when you have a little time to play around. At the top of the web page is a search function that lets you search all of Office Online for clip art. This
search option is far more expansive than the one provided within PowerPoint, so this is a great place to look for additional clip art if you don’t find what you need during your initial search. You can also use the Browse Clip Art And Media Categories section of the page to narrow your search into preselected categories,
such as Animals, Maps, Travel, and so on.To download items from this site, you’ll need
to install ActiveX Control for Office Online. It’s very fast, and instructions are provided on the site. Once that’s done, and you’ve selected one or more pieces of clip art, a Selection Basket will appear in the left pane as shown here.
Under Search In, most people leave Everywhere selected as the default. To speed up the search process, you can remove the checkmark from that box and choose a specific collection instead. Choosing a specific media file type is also a good idea so you don’t wind up with a movie, for example, when you just want a simple piece of clip art.
The easy Way
Figure 5-2 Microsoft Office Online devotes an entire section to clip art.
PowerPoint will file downloaded clip art into one or more folders based upon the tags provided by Microsoft Office Online. The next time you perform a Clip Art pane search using one of these tags, the clip art will appear.
MeMo
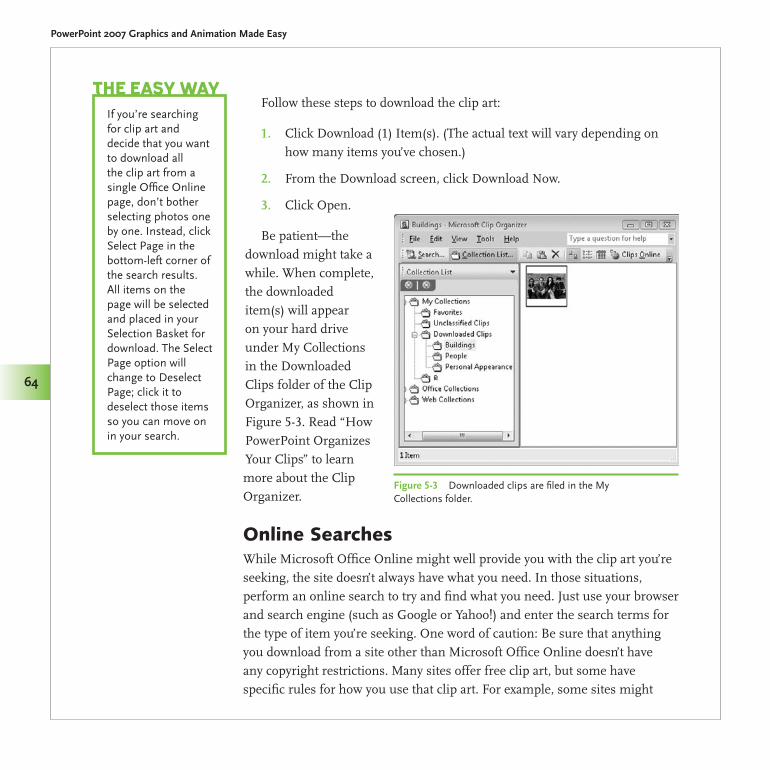
Made Easy/PowerPoint 2007 Graphics & Animation/Slack/0071600760/Chapter 5
PowerPoint 2007 Graphics and Animation Made Easy
64
Follow these steps to download the clip art:
Click Download (1) Item(s). (The actual text will vary depending on 1. how many items you’ve chosen.)
From the Download screen, click Download Now.2.
Click Open.3.
Be patient—the download might take a while. When complete, the downloaded item(s) will appear on your hard drive under My Collections in the Downloaded Clips folder of the Clip Organizer, as shown in Figure 5-3. Read “How PowerPoint Organizes Your Clips” to learn more about the Clip Organizer.
Online SearchesWhile Microsoft Office Online might well provide you with the clip art you’re seeking, the site doesn’t always have what you need. In those situations, perform an online search to try and find what you need. Just use your browser and search engine (such as Google or Yahoo!) and enter the search terms for the type of item you’re seeking. One word of caution: Be sure that anything you download from a site other than Microsoft Office Online doesn’t have any copyright restrictions. Many sites offer free clip art, but some have specific rules for how you use that clip art. For example, some sites might
If you’re searching for clip art and decide that you want to download all the clip art from a single Office Online page, don’t bother selecting photos one by one. Instead, click Select Page in the bottom-left corner of the search results. All items on the page will be selected and placed in your Selection Basket for download. The Select Page option will change to Deselect Page; click it to deselect those items so you can move on in your search.
The easy Way
Figure 5-3 Downloaded clips are filed in the My Collections folder.
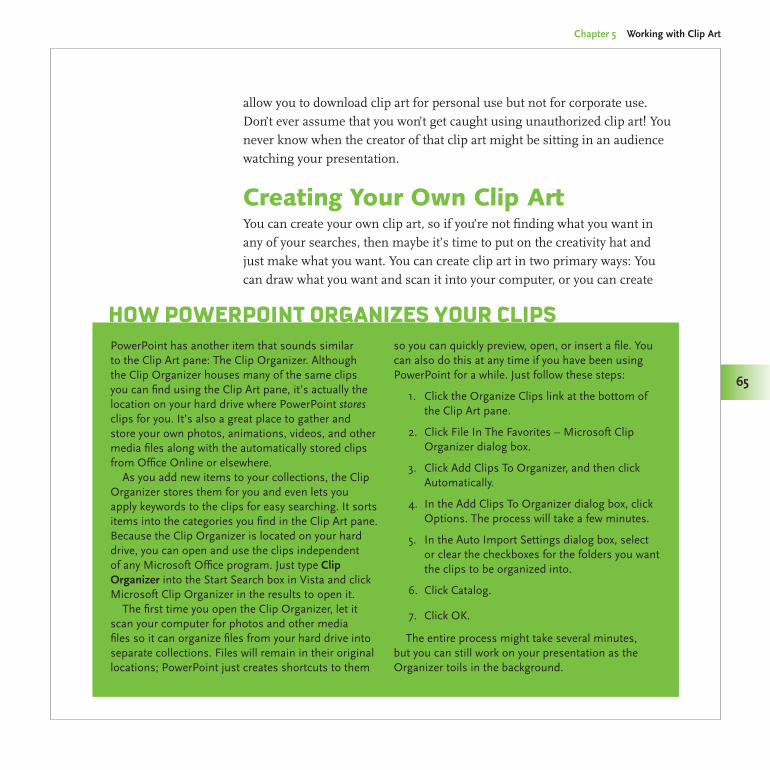
Made Easy/PowerPoint 2007 Graphics & Animation/Slack/0071600760/Chapter 5
Chapter 5 Working with Clip Art
65
allow you to download clip art for personal use but not for corporate use. Don’t ever assume that you won’t get caught using unauthorized clip art! You never know when the creator of that clip art might be sitting in an audience watching your presentation.
Creating Your Own Clip ArtYou can create your own clip art, so if you’re not finding what you want in any of your searches, then maybe it’s time to put on the creativity hat and just make what you want. You can create clip art in two primary ways: You can draw what you want and scan it into your computer, or you can create
PowerPoint has another item that sounds similar to the Clip Art pane: The Clip Organizer. Although the Clip Organizer houses many of the same clips you can find using the Clip Art pane, it’s actually the location on your hard drive where PowerPoint stores clips for you. It’s also a great place to gather and store your own photos, animations, videos, and other media files along with the automatically stored clips from Office Online or elsewhere.
As you add new items to your collections, the Clip Organizer stores them for you and even lets you apply keywords to the clips for easy searching. It sorts items into the categories you find in the Clip Art pane. Because the Clip Organizer is located on your hard drive, you can open and use the clips independent of any Microsoft Office program. Just type Clip Organizer into the Start Search box in Vista and click Microsoft Clip Organizer in the results to open it.
The first time you open the Clip Organizer, let it scan your computer for photos and other media files so it can organize files from your hard drive into separate collections. Files will remain in their original locations; PowerPoint just creates shortcuts to them
so you can quickly preview, open, or insert a file. You can also do this at any time if you have been using PowerPoint for a while. Just follow these steps:
Click the Organize Clips link at the bottom of 1. the Clip Art pane.
Click File In The Favorites – Microsoft Clip 2. Organizer dialog box.
Click Add Clips To Organizer, and then click 3. Automatically.
In the Add Clips To Organizer dialog box, click 4. Options. The process will take a few minutes.
In the Auto Import Settings dialog box, select 5. or clear the checkboxes for the folders you want the clips to be organized into.
Click Catalog.6.
Click OK.7.
The entire process might take several minutes, but you can still work on your presentation as the Organizer toils in the background.
hoW PoWerPoinT organizes your CliPs
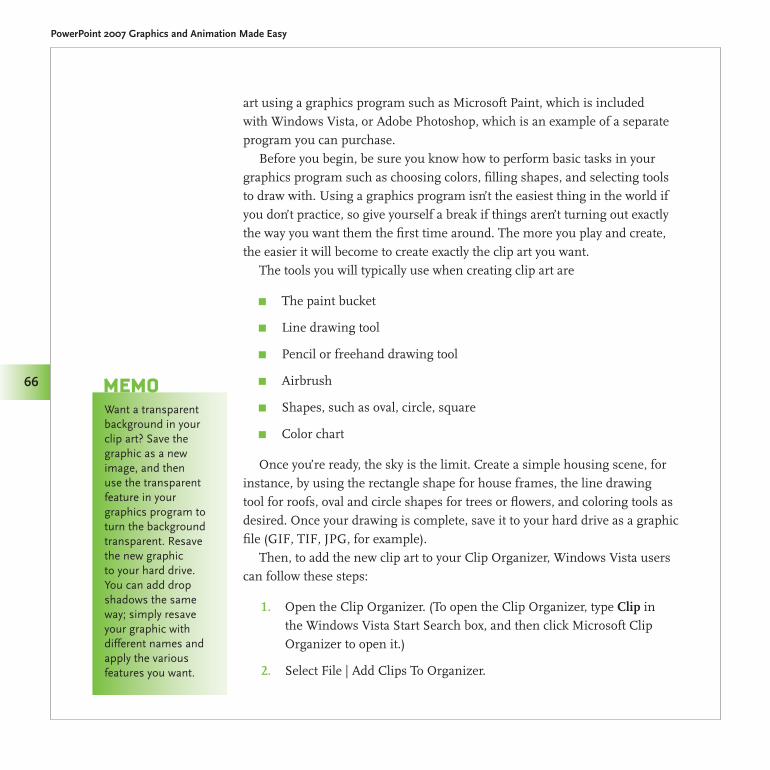
Made Easy/PowerPoint 2007 Graphics & Animation/Slack/0071600760/Chapter 5
PowerPoint 2007 Graphics and Animation Made Easy
66
art using a graphics program such as Microsoft Paint, which is included with Windows Vista, or Adobe Photoshop, which is an example of a separate program you can purchase.
Before you begin, be sure you know how to perform basic tasks in your graphics program such as choosing colors, filling shapes, and selecting tools to draw with. Using a graphics program isn’t the easiest thing in the world if you don’t practice, so give yourself a break if things aren’t turning out exactly the way you want them the first time around. The more you play and create, the easier it will become to create exactly the clip art you want.
The tools you will typically use when creating clip art are
The paint bucket π
Line drawing tool π
Pencil or freehand drawing tool π
Airbrush π
Shapes, such as oval, circle, square π
Color chart π
Once you’re ready, the sky is the limit. Create a simple housing scene, for instance, by using the rectangle shape for house frames, the line drawing tool for roofs, oval and circle shapes for trees or flowers, and coloring tools as desired. Once your drawing is complete, save it to your hard drive as a graphic file (GIF, TIF, JPG, for example).
Then, to add the new clip art to your Clip Organizer, Windows Vista users can follow these steps:
Open the Clip Organizer. (To open the Clip Organizer, type 1. Clip in the Windows Vista Start Search box, and then click Microsoft Clip Organizer to open it.)
Select File | Add Clips To Organizer.2.
Want a transparent background in your clip art? Save the graphic as a new image, and then use the transparent feature in your graphics program to turn the background transparent. Resave the new graphic to your hard drive. You can add drop shadows the same way; simply resave your graphic with different names and apply the various features you want.
MeMo
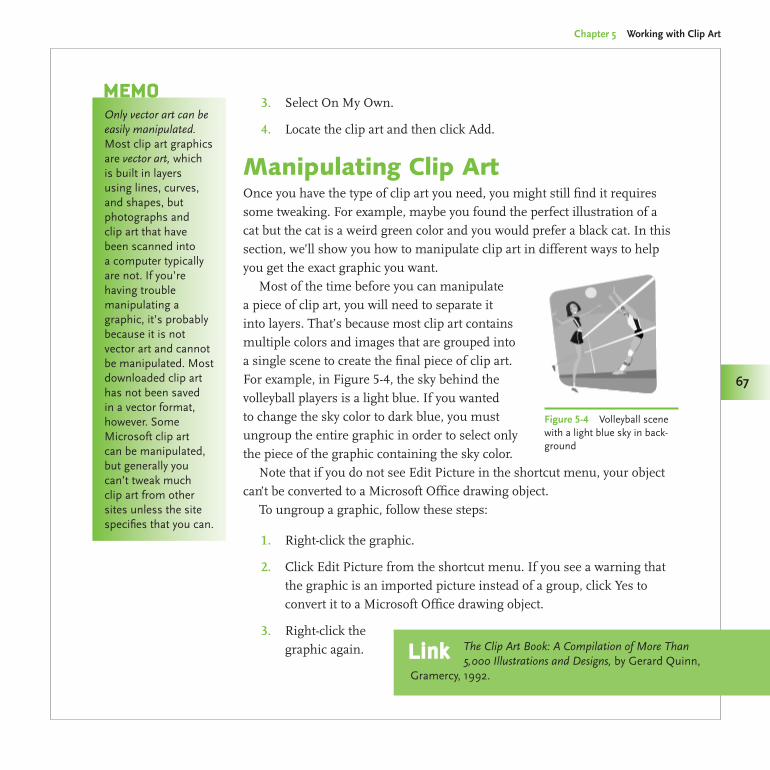
Made Easy/PowerPoint 2007 Graphics & Animation/Slack/0071600760/Chapter 5
Chapter 5 Working with Clip Art
67
Select On My Own.3.
Locate the clip art and then click Add.4.
Manipulating Clip ArtOnce you have the type of clip art you need, you might still find it requires some tweaking. For example, maybe you found the perfect illustration of a cat but the cat is a weird green color and you would prefer a black cat. In this section, we’ll show you how to manipulate clip art in different ways to help you get the exact graphic you want.
Most of the time before you can manipulate a piece of clip art, you will need to separate it into layers. That’s because most clip art contains multiple colors and images that are grouped into a single scene to create the final piece of clip art. For example, in Figure 5-4, the sky behind the volleyball players is a light blue. If you wanted to change the sky color to dark blue, you must ungroup the entire graphic in order to select only the piece of the graphic containing the sky color.
Note that if you do not see Edit Picture in the shortcut menu, your object can’t be converted to a Microsoft Office drawing object.
To ungroup a graphic, follow these steps:
Right-click the graphic.1.
Click Edit Picture from the shortcut menu. If you see a warning that 2. the graphic is an imported picture instead of a group, click Yes to convert it to a Microsoft Office drawing object.
Right-click the 3. graphic again. The Clip Art Book: A Compilation of More Than
5,000 Illustrations and Designs, by Gerard Quinn, Gramercy, 1992.
link
Only vector art can be easily manipulated. Most clip art graphics are vector art, which is built in layers using lines, curves, and shapes, but photographs and clip art that have been scanned into a computer typically are not. If you’re having trouble manipulating a graphic, it’s probably because it is not vector art and cannot be manipulated. Most downloaded clip art has not been saved in a vector format, however. Some Microsoft clip art can be manipulated, but generally you can’t tweak much clip art from other sites unless the site specifies that you can.
MeMo
Figure 5-4 Volleyball scene with a light blue sky in back-ground
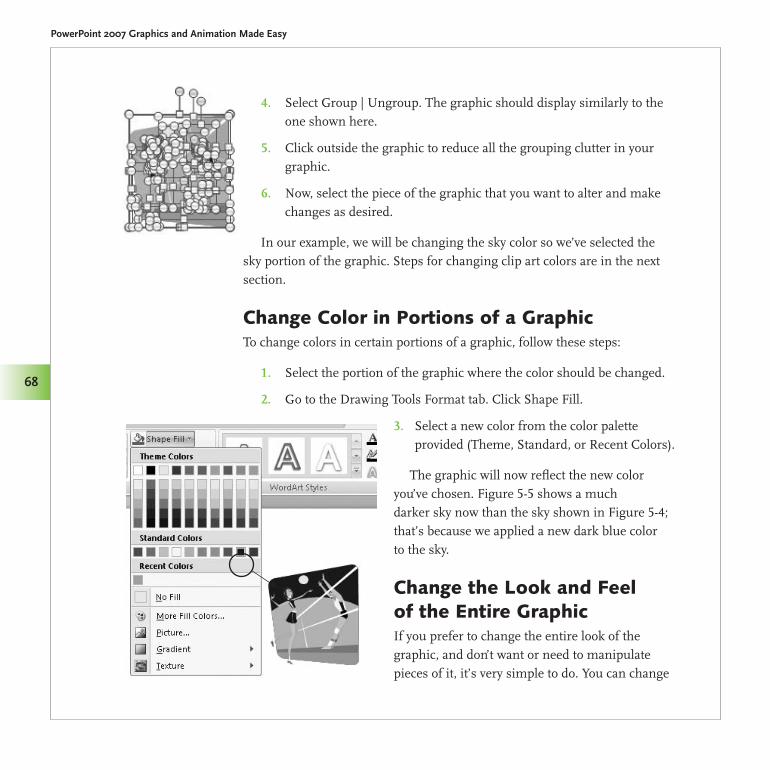
Made Easy/PowerPoint 2007 Graphics & Animation/Slack/0071600760/Chapter 5
PowerPoint 2007 Graphics and Animation Made Easy
68
Select Group | Ungroup. The graphic should display similarly to the 4. one shown here.
Click outside the graphic to reduce all the grouping clutter in your 5. graphic.
Now, select the piece of the graphic that you want to alter and make 6. changes as desired.
In our example, we will be changing the sky color so we’ve selected the sky portion of the graphic. Steps for changing clip art colors are in the next section.
Change Color in Portions of a GraphicTo change colors in certain portions of a graphic, follow these steps:
Select the portion of the graphic where the color should be changed.1.
Go to the Drawing Tools Format tab. Click Shape Fill.2.
Select a new color from the color palette 3. provided (Theme, Standard, or Recent Colors).
The graphic will now reflect the new color you’ve chosen. Figure 5-5 shows a much darker sky now than the sky shown in Figure 5-4; that’s because we applied a new dark blue color to the sky.
Change the Look and Feel of the Entire GraphicIf you prefer to change the entire look of the graphic, and don’t want or need to manipulate pieces of it, it’s very simple to do. You can change
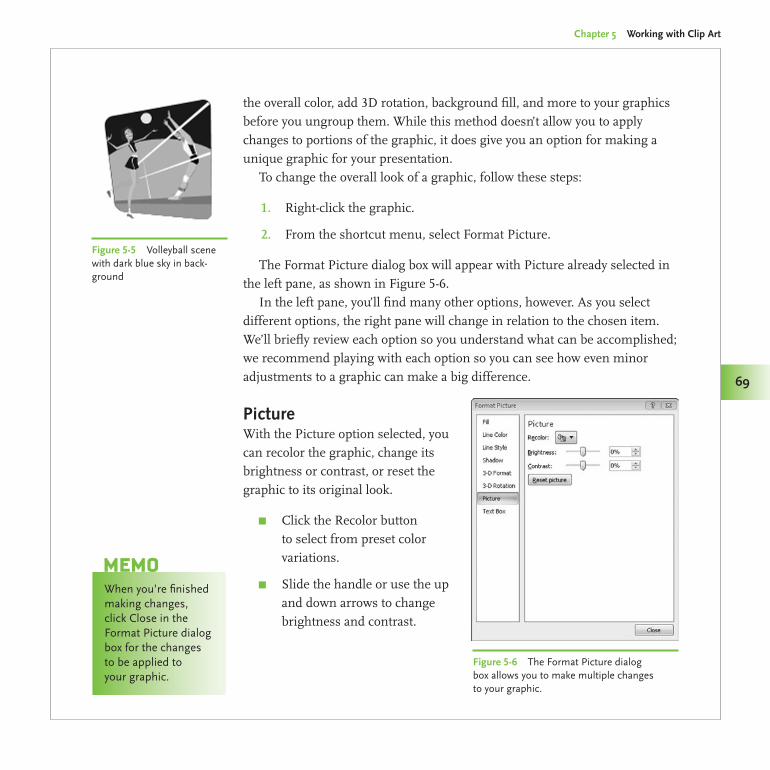
Made Easy/PowerPoint 2007 Graphics & Animation/Slack/0071600760/Chapter 5
Chapter 5 Working with Clip Art
69
the overall color, add 3D rotation, background fill, and more to your graphics before you ungroup them. While this method doesn’t allow you to apply changes to portions of the graphic, it does give you an option for making a unique graphic for your presentation.
To change the overall look of a graphic, follow these steps:
Right-click the graphic.1.
From the shortcut menu, select Format Picture.2.
The Format Picture dialog box will appear with Picture already selected in the left pane, as shown in Figure 5-6.
In the left pane, you’ll find many other options, however. As you select different options, the right pane will change in relation to the chosen item. We’ll briefly review each option so you understand what can be accomplished; we recommend playing with each option so you can see how even minor adjustments to a graphic can make a big difference.
PictureWith the Picture option selected, you can recolor the graphic, change its brightness or contrast, or reset the graphic to its original look.
Click the Recolor button π
to select from preset color variations.
Slide the handle or use the up π
and down arrows to change brightness and contrast.
Figure 5-5 Volleyball scene with dark blue sky in back-ground
When you’re finished making changes, click Close in the Format Picture dialog box for the changes to be applied to your graphic.
MeMo
Figure 5-6 The Format Picture dialog box allows you to make multiple changes to your graphic.
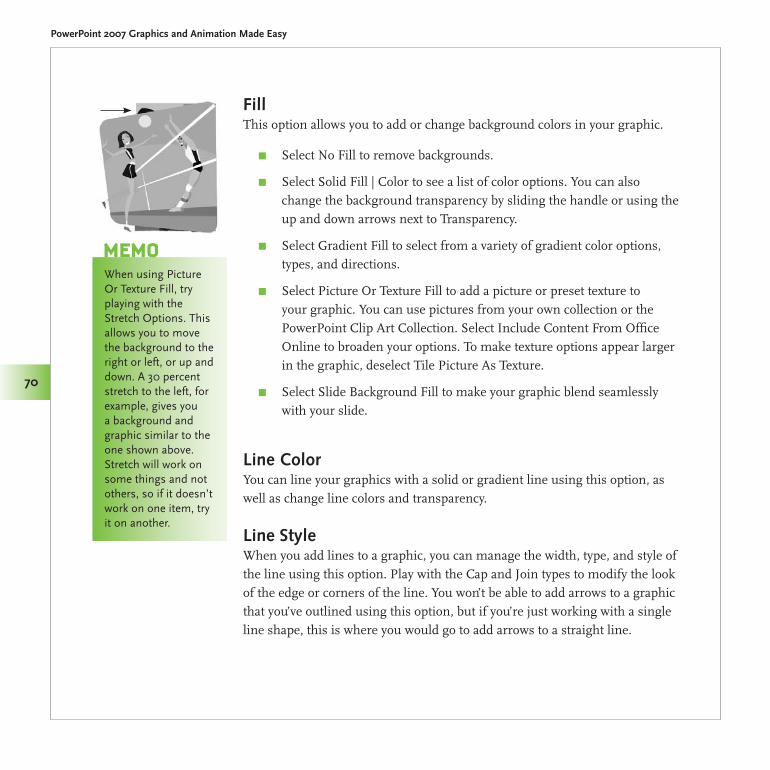
Made Easy/PowerPoint 2007 Graphics & Animation/Slack/0071600760/Chapter 5
PowerPoint 2007 Graphics and Animation Made Easy
70
FillThis option allows you to add or change background colors in your graphic.
Select No Fill to remove backgrounds. π
Select Solid Fill | Color to see a list of color options. You can also π
change the background transparency by sliding the handle or using the up and down arrows next to Transparency.
Select Gradient Fill to select from a variety of gradient color options, π
types, and directions.
Select Picture Or Texture Fill to add a picture or preset texture to π
your graphic. You can use pictures from your own collection or the PowerPoint Clip Art Collection. Select Include Content From Office Online to broaden your options. To make texture options appear larger in the graphic, deselect Tile Picture As Texture.
Select Slide Background Fill to make your graphic blend seamlessly π
with your slide.
Line ColorYou can line your graphics with a solid or gradient line using this option, as well as change line colors and transparency.
Line StyleWhen you add lines to a graphic, you can manage the width, type, and style of the line using this option. Play with the Cap and Join types to modify the look of the edge or corners of the line. You won’t be able to add arrows to a graphic that you’ve outlined using this option, but if you’re just working with a single line shape, this is where you would go to add arrows to a straight line.
When using Picture Or Texture Fill, try playing with the Stretch Options. This allows you to move the background to the right or left, or up and down. A 30 percent stretch to the left, for example, gives you a background and graphic similar to the one shown above. Stretch will work on some things and not others, so if it doesn’t work on one item, try it on another.
MeMo
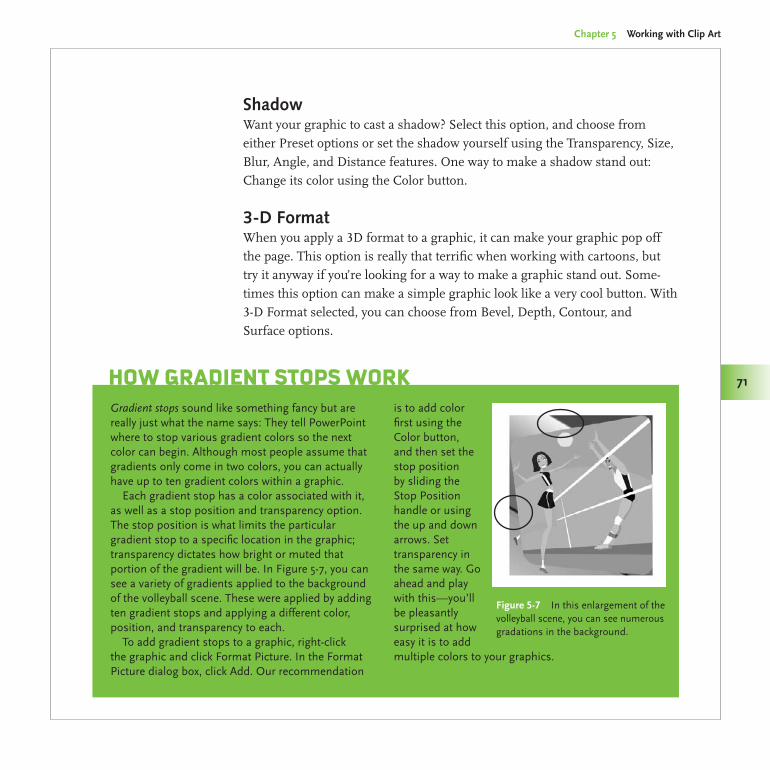
Made Easy/PowerPoint 2007 Graphics & Animation/Slack/0071600760/Chapter 5
Chapter 5 Working with Clip Art
71
ShadowWant your graphic to cast a shadow? Select this option, and choose from either Preset options or set the shadow yourself using the Transparency, Size, Blur, Angle, and Distance features. One way to make a shadow stand out: Change its color using the Color button.
3-D FormatWhen you apply a 3D format to a graphic, it can make your graphic pop off the page. This option is really that terrific when working with cartoons, but try it anyway if you’re looking for a way to make a graphic stand out. Some-times this option can make a simple graphic look like a very cool button. With 3-D Format selected, you can choose from Bevel, Depth, Contour, and Surface options.
Gradient stops sound like something fancy but are really just what the name says: They tell PowerPoint where to stop various gradient colors so the next color can begin. Although most people assume that gradients only come in two colors, you can actually have up to ten gradient colors within a graphic.
Each gradient stop has a color associated with it, as well as a stop position and transparency option. The stop position is what limits the particular gradient stop to a specific location in the graphic; transparency dictates how bright or muted that portion of the gradient will be. In Figure 5-7, you can see a variety of gradients applied to the background of the volleyball scene. These were applied by adding ten gradient stops and applying a different color, position, and transparency to each.
To add gradient stops to a graphic, right-click the graphic and click Format Picture. In the Format Picture dialog box, click Add. Our recommendation
is to add color first using the Color button, and then set the stop position by sliding the Stop Position handle or using the up and down arrows. Set transparency in the same way. Go ahead and play with this—you’ll be pleasantly surprised at how easy it is to add multiple colors to your graphics.
hoW gradienT sToPs Work
Figure 5-7 In this enlargement of the volleyball scene, you can see numerous gradations in the background.
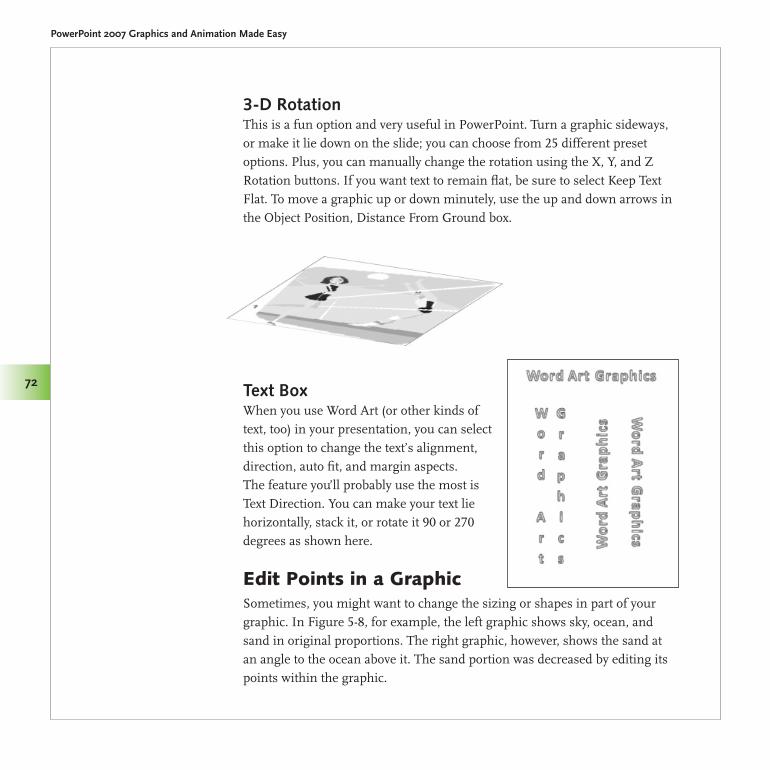
Made Easy/PowerPoint 2007 Graphics & Animation/Slack/0071600760/Chapter 5
PowerPoint 2007 Graphics and Animation Made Easy
72
3-D RotationThis is a fun option and very useful in PowerPoint. Turn a graphic sideways, or make it lie down on the slide; you can choose from 25 different preset options. Plus, you can manually change the rotation using the X, Y, and Z Rotation buttons. If you want text to remain flat, be sure to select Keep Text Flat. To move a graphic up or down minutely, use the up and down arrows in the Object Position, Distance From Ground box.
Text BoxWhen you use Word Art (or other kinds of text, too) in your presentation, you can select this option to change the text’s alignment, direction, auto fit, and margin aspects. The feature you’ll probably use the most is Text Direction. You can make your text lie horizontally, stack it, or rotate it 90 or 270 degrees as shown here.
Edit Points in a GraphicSometimes, you might want to change the sizing or shapes in part of your graphic. In Figure 5-8, for example, the left graphic shows sky, ocean, and sand in original proportions. The right graphic, however, shows the sand at an angle to the ocean above it. The sand portion was decreased by editing its points within the graphic.
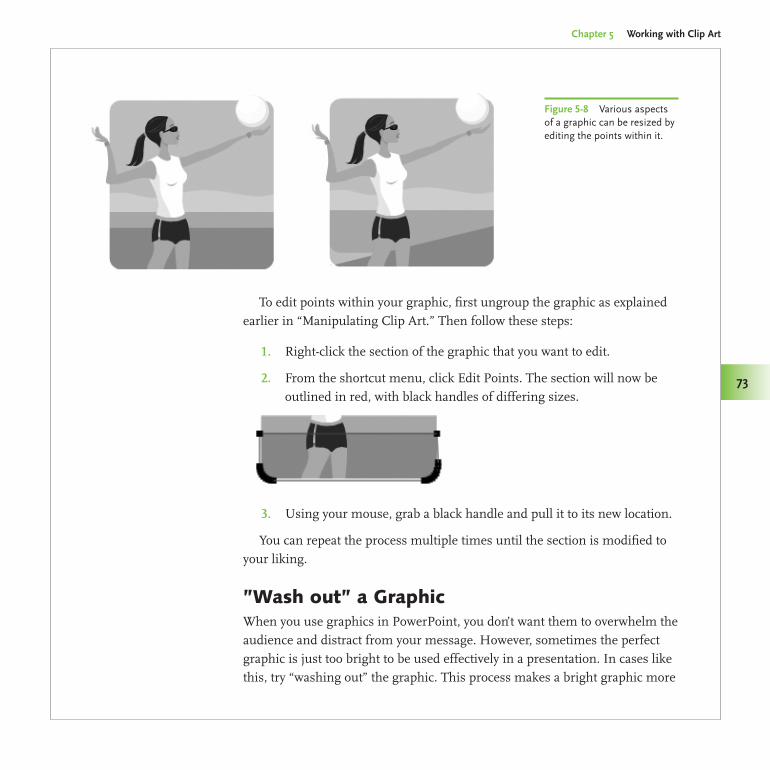
Chapter 5 Working with Clip Art
73
Made Easy/PowerPoint 2007 Graphics & Animation/Slack/0071600760/Chapter 5
73
To edit points within your graphic, first ungroup the graphic as explained earlier in “Manipulating Clip Art.” Then follow these steps:
Right-click the section of the graphic that you want to edit.1.
From the shortcut menu, click Edit Points. The section will now be 2. outlined in red, with black handles of differing sizes.
Using your mouse, grab a black handle and pull it to its new location.3.
You can repeat the process multiple times until the section is modified to your liking.
”Wash out” a GraphicWhen you use graphics in PowerPoint, you don’t want them to overwhelm the audience and distract from your message. However, sometimes the perfect graphic is just too bright to be used effectively in a presentation. In cases like this, try “washing out” the graphic. This process makes a bright graphic more
Figure 5-8 Various aspects of a graphic can be resized by editing the points within it.
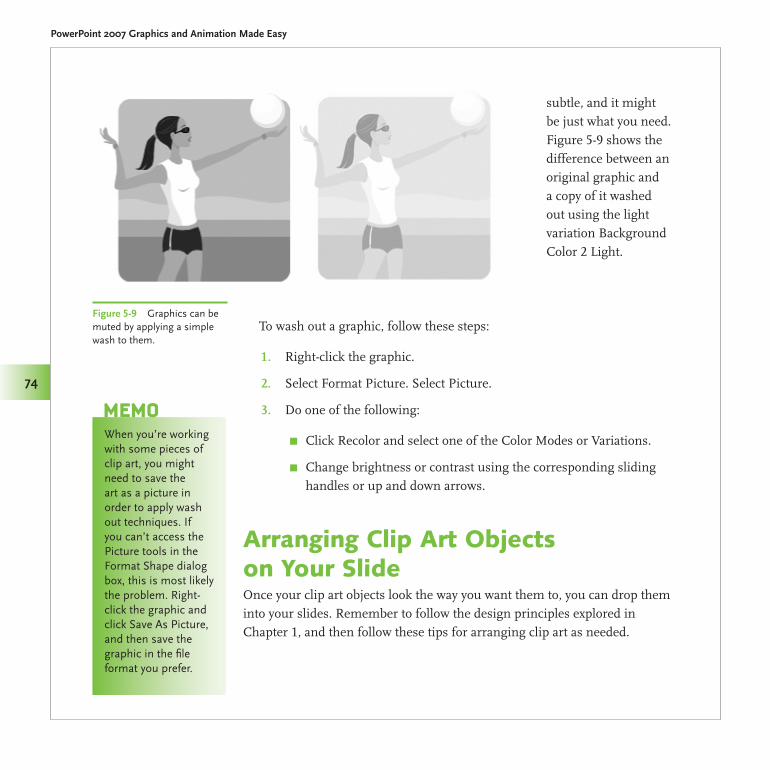
Made Easy/PowerPoint 2007 Graphics & Animation/Slack/0071600760/Chapter 5
PowerPoint 2007 Graphics and Animation Made Easy
74
subtle, and it might be just what you need. Figure 5-9 shows the difference between an original graphic and a copy of it washed out using the light variation Background Color 2 Light.
To wash out a graphic, follow these steps:
Right-click the graphic.1.
Select Format Picture. Select Picture.2.
Do one of the following:3.
Click Recolor and select one of the Color Modes or Variations. π
Change brightness or contrast using the corresponding sliding π
handles or up and down arrows.
Arranging Clip Art Objects on Your SlideOnce your clip art objects look the way you want them to, you can drop them into your slides. Remember to follow the design principles explored in Chapter 1, and then follow these tips for arranging clip art as needed.
Figure 5-9 Graphics can be muted by applying a simple wash to them.
When you’re working with some pieces of clip art, you might need to save the art as a picture in order to apply wash out techniques. If you can’t access the Picture tools in the Format Shape dialog box, this is most likely the problem. Right-click the graphic and click Save As Picture, and then save the graphic in the file format you prefer.
MeMo
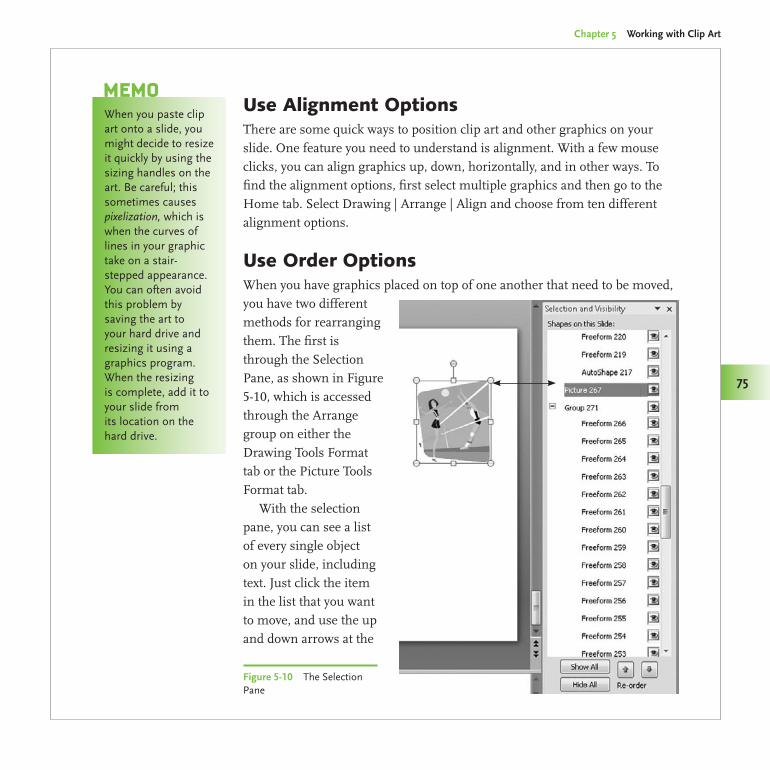
Made Easy/PowerPoint 2007 Graphics & Animation/Slack/0071600760/Chapter 5
Chapter 5 Working with Clip Art
75
Use Alignment OptionsThere are some quick ways to position clip art and other graphics on your slide. One feature you need to understand is alignment. With a few mouse clicks, you can align graphics up, down, horizontally, and in other ways. To find the alignment options, first select multiple graphics and then go to the Home tab. Select Drawing | Arrange | Align and choose from ten different alignment options.
Use Order OptionsWhen you have graphics placed on top of one another that need to be moved, you have two different methods for rearranging them. The first is through the Selection Pane, as shown in Figure 5-10, which is accessed through the Arrange group on either the Drawing Tools Format tab or the Picture Tools Format tab.
With the selection pane, you can see a list of every single object on your slide, including text. Just click the item in the list that you want to move, and use the up and down arrows at the
When you paste clip art onto a slide, you might decide to resize it quickly by using the sizing handles on the art. Be careful; this sometimes causes pixelization, which is when the curves of lines in your graphic take on a stair-stepped appearance. You can often avoid this problem by saving the art to your hard drive and resizing it using a graphics program. When the resizing is complete, add it to your slide from its location on the hard drive.
MeMo
Figure 5-10 The Selection Pane
PowerPoint 2007 Graphics and Animation Made Easy
76
Made Easy/PowerPoint 2007 Graphics & Animation/Slack/0071600760/Chapter 5
bottom of the pane to reorder the object you’ve selected. However, the second way is our favorite method, so see The Easy Way.
In this chapter, you discovered many different ways to work with clip art. Don’t be timid about playing with clip art. You’ll find that the more familiar you become with the features covered in this chapter, the easier it will be to create the perfect graphics for your presentations. In the next chapter, we’ll explain how to work with tables in PowerPoint 2007.
Go to Home | Drawing | Arrange and select an order option: Bring To Front, Send To Back, Bring Forward, or Send Backward. Bring To Front and Send To Back move items all the way to the front or back, respectively, whereas Bring Forward or Send Backward moves items one step at a time.
The easy Way
Working with Tables
Maybe you don’t think of a table as a graphic presentation tool, but we sure do. Purists might say tables are simply used to lay out information graphically, but they aren’t considering the fact that information within tables can be animated in PowerPoint (more on that in Chapter 12) or can be changed into pictures and, therefore, become graphics in and of themselves.
The bottom line is that tables are a wonderful tool for displaying information; you can compile information from a variety of sources and lump it all together into a single table that clearly outlines every detail. Easy to understand and use, tables can be added to a presentation through either an automatic process or a custom design.
If you’ve got a presentation that seems heavy on bullets, consider using a table. Tables are a great way to break up the monotony of bulleted page after bulleted page, and the effects and options available in PowerPoint 2007 can make your tables look sharp and professional. Although you might not have considered using tables as a graphic presentation tool, you can design tables in new ways that will have you thinking twice about the entire idea.
6
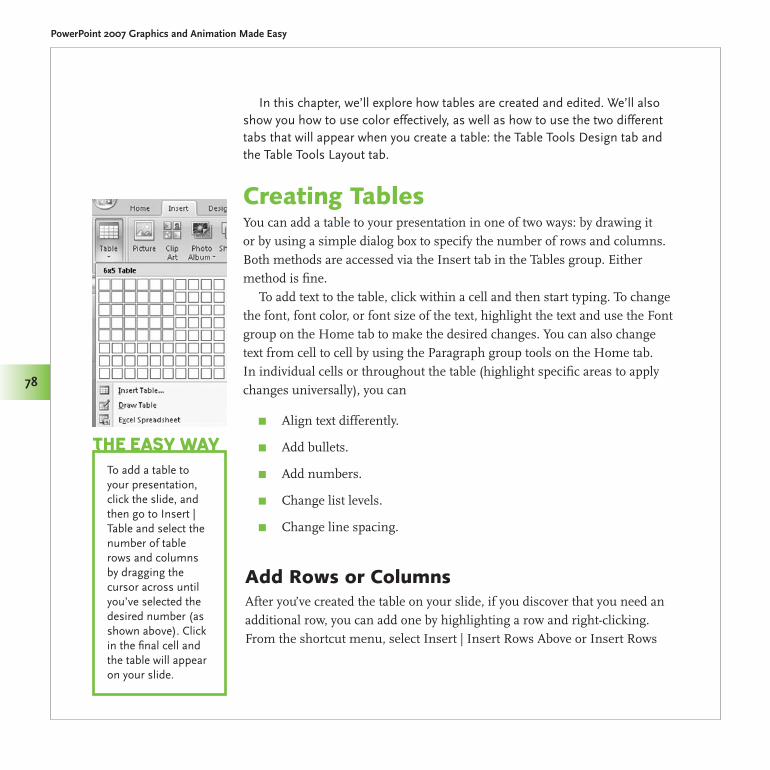
Made Easy/PowerPoint 2007 Graphics & Animation/Slack/0071600760/Chapter 6
PowerPoint 2007 Graphics and Animation Made Easy
78
In this chapter, we’ll explore how tables are created and edited. We’ll also show you how to use color effectively, as well as how to use the two different tabs that will appear when you create a table: the Table Tools Design tab and the Table Tools Layout tab.
Creating TablesYou can add a table to your presentation in one of two ways: by drawing it or by using a simple dialog box to specify the number of rows and columns. Both methods are accessed via the Insert tab in the Tables group. Either method is fine.
To add text to the table, click within a cell and then start typing. To change the font, font color, or font size of the text, highlight the text and use the Font group on the Home tab to make the desired changes. You can also change text from cell to cell by using the Paragraph group tools on the Home tab. In individual cells or throughout the table (highlight specific areas to apply changes universally), you can
Align text differently. π
Add bullets. π
Add numbers. π
Change list levels. π
Change line spacing. π
Add Rows or ColumnsAfter you’ve created the table on your slide, if you discover that you need an additional row, you can add one by highlighting a row and right-clicking. From the shortcut menu, select Insert | Insert Rows Above or Insert Rows
To add a table to your presentation, click the slide, and then go to Insert | Table and select the number of table rows and columns by dragging the cursor across until you’ve selected the desired number (as shown above). Click in the final cell and the table will appear on your slide.
The easy Way
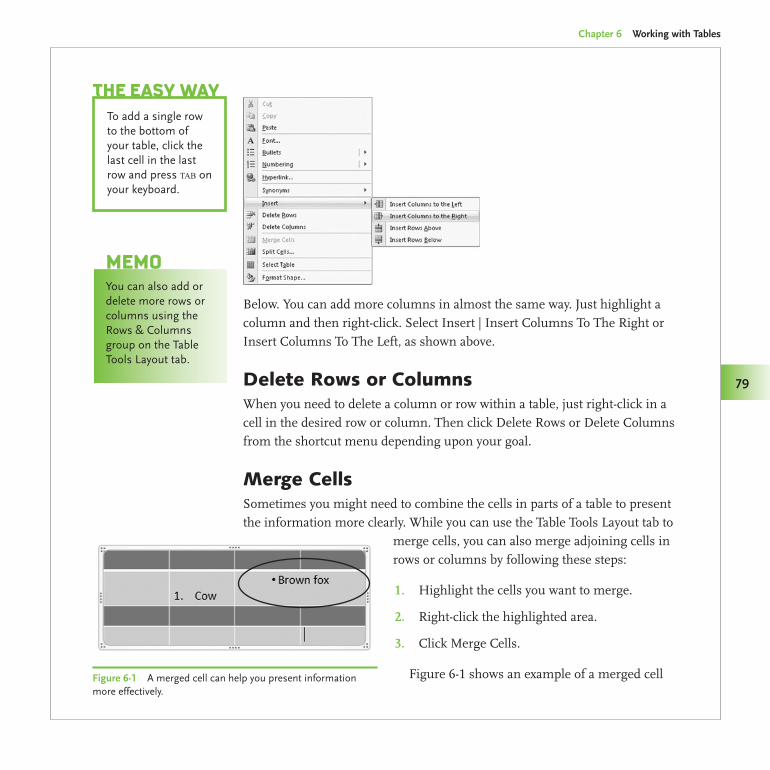
Made Easy/PowerPoint 2007 Graphics & Animation/Slack/0071600760/Chapter 6
Chapter 6 Working with Tables
79
Below. You can add more columns in almost the same way. Just highlight a column and then right-click. Select Insert | Insert Columns To The Right or Insert Columns To The Left, as shown above.
Delete Rows or ColumnsWhen you need to delete a column or row within a table, just right-click in a cell in the desired row or column. Then click Delete Rows or Delete Columns from the shortcut menu depending upon your goal.
Merge CellsSometimes you might need to combine the cells in parts of a table to present the information more clearly. While you can use the Table Tools Layout tab to
merge cells, you can also merge adjoining cells in rows or columns by following these steps:
Highlight the cells you want to merge.1.
Right-click the highlighted area.2.
Click Merge Cells.3.
Figure 6-1 shows an example of a merged cell
To add a single row to the bottom of your table, click the last cell in the last row and press tab on your keyboard.
The easy Way
You can also add or delete more rows or columns using the Rows & Columns group on the Table Tools Layout tab.
MeMo
Figure 6-1 A merged cell can help you present information more effectively.
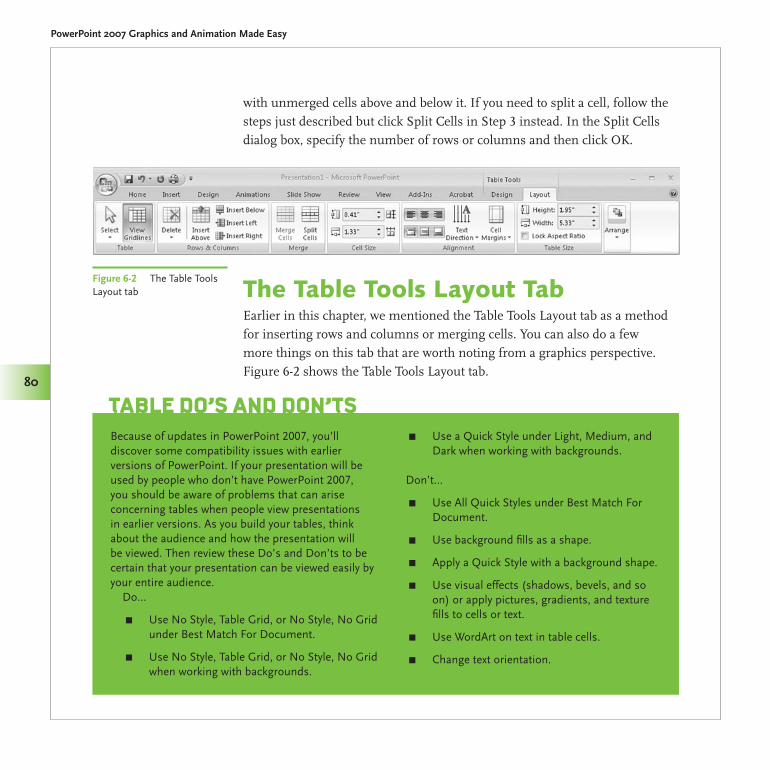
Made Easy/PowerPoint 2007 Graphics & Animation/Slack/0071600760/Chapter 6
PowerPoint 2007 Graphics and Animation Made Easy
80
with unmerged cells above and below it. If you need to split a cell, follow the steps just described but click Split Cells in Step 3 instead. In the Split Cells dialog box, specify the number of rows or columns and then click OK.
The Table Tools Layout TabEarlier in this chapter, we mentioned the Table Tools Layout tab as a method for inserting rows and columns or merging cells. You can also do a few more things on this tab that are worth noting from a graphics perspective. Figure 6-2 shows the Table Tools Layout tab.
Because of updates in PowerPoint 2007, you’ll discover some compatibility issues with earlier versions of PowerPoint. If your presentation will be used by people who don’t have PowerPoint 2007, you should be aware of problems that can arise concerning tables when people view presentations in earlier versions. As you build your tables, think about the audience and how the presentation will be viewed. Then review these Do’s and Don’ts to be certain that your presentation can be viewed easily by your entire audience.
Do…
Use No Style, Table Grid, or No Style, No Grid π
under Best Match For Document.
Use No Style, Table Grid, or No Style, No Grid π
when working with backgrounds.
Use a Quick Style under Light, Medium, and π
Dark when working with backgrounds.
Don’t…
Use All Quick Styles under Best Match For π
Document.
Use background fills as a shape. π
Apply a Quick Style with a background shape. π
Use visual effects (shadows, bevels, and so π
on) or apply pictures, gradients, and texture fills to cells or text.
Use WordArt on text in table cells. π
Change text orientation. π
Table Do’s anD Don’Ts
Figure 6-2 The Table Tools Layout tab
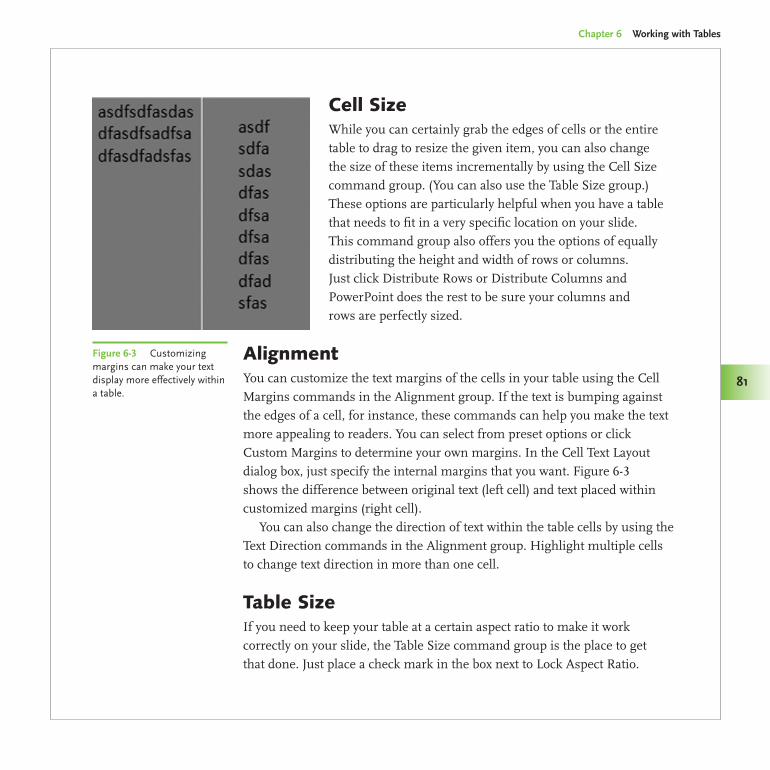
Made Easy/PowerPoint 2007 Graphics & Animation/Slack/0071600760/Chapter 6
Chapter 6 Working with Tables
81
Cell SizeWhile you can certainly grab the edges of cells or the entire table to drag to resize the given item, you can also change the size of these items incrementally by using the Cell Size command group. (You can also use the Table Size group.) These options are particularly helpful when you have a table that needs to fit in a very specific location on your slide. This command group also offers you the options of equally distributing the height and width of rows or columns. Just click Distribute Rows or Distribute Columns and PowerPoint does the rest to be sure your columns and rows are perfectly sized.
AlignmentYou can customize the text margins of the cells in your table using the Cell Margins commands in the Alignment group. If the text is bumping against the edges of a cell, for instance, these commands can help you make the text more appealing to readers. You can select from preset options or click Custom Margins to determine your own margins. In the Cell Text Layout dialog box, just specify the internal margins that you want. Figure 6-3 shows the difference between original text (left cell) and text placed within customized margins (right cell).
You can also change the direction of text within the table cells by using the Text Direction commands in the Alignment group. Highlight multiple cells to change text direction in more than one cell.
Table SizeIf you need to keep your table at a certain aspect ratio to make it work correctly on your slide, the Table Size command group is the place to get that done. Just place a check mark in the box next to Lock Aspect Ratio.
Figure 6-3 Customizing margins can make your text display more effectively within a table.
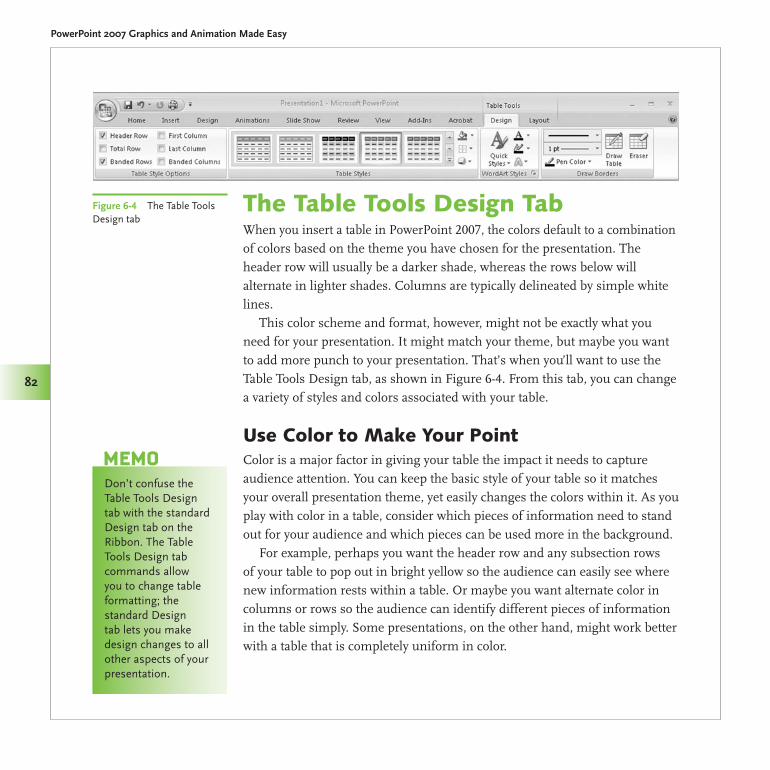
Made Easy/PowerPoint 2007 Graphics & Animation/Slack/0071600760/Chapter 6
PowerPoint 2007 Graphics and Animation Made Easy
82
The Table Tools Design TabWhen you insert a table in PowerPoint 2007, the colors default to a combination of colors based on the theme you have chosen for the presentation. The header row will usually be a darker shade, whereas the rows below will alternate in lighter shades. Columns are typically delineated by simple white lines.
This color scheme and format, however, might not be exactly what you need for your presentation. It might match your theme, but maybe you want to add more punch to your presentation. That’s when you’ll want to use the Table Tools Design tab, as shown in Figure 6-4. From this tab, you can change a variety of styles and colors associated with your table.
Use Color to Make Your PointColor is a major factor in giving your table the impact it needs to capture audience attention. You can keep the basic style of your table so it matches your overall presentation theme, yet easily changes the colors within it. As you play with color in a table, consider which pieces of information need to stand out for your audience and which pieces can be used more in the background.
For example, perhaps you want the header row and any subsection rows of your table to pop out in bright yellow so the audience can easily see where new information rests within a table. Or maybe you want alternate color in columns or rows so the audience can identify different pieces of information in the table simply. Some presentations, on the other hand, might work better with a table that is completely uniform in color.
Don’t confuse the Table Tools Design tab with the standard Design tab on the Ribbon. The Table Tools Design tab commands allow you to change table formatting; the standard Design tab lets you make design changes to all other aspects of your presentation.
MeMo
Figure 6-4 The Table Tools Design tab
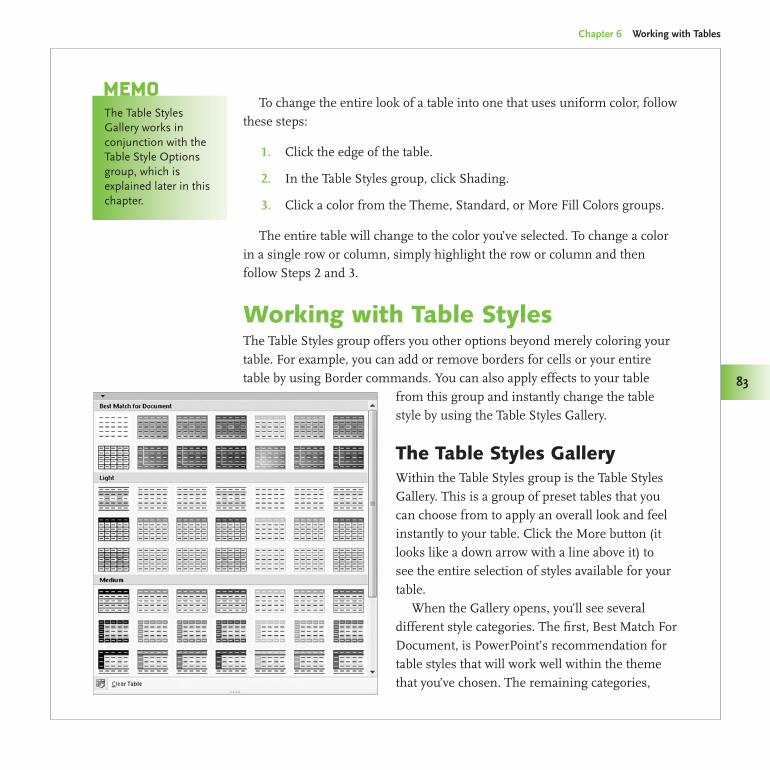
Made Easy/PowerPoint 2007 Graphics & Animation/Slack/0071600760/Chapter 6
Chapter 6 Working with Tables
83
To change the entire look of a table into one that uses uniform color, follow these steps:
Click the edge of the table.1.
In the Table Styles group, click Shading.2.
Click a color from the Theme, Standard, or More Fill Colors groups.3.
The entire table will change to the color you’ve selected. To change a color in a single row or column, simply highlight the row or column and then follow Steps 2 and 3.
Working with Table StylesThe Table Styles group offers you other options beyond merely coloring your table. For example, you can add or remove borders for cells or your entire table by using Border commands. You can also apply effects to your table
from this group and instantly change the table style by using the Table Styles Gallery.
The Table Styles GalleryWithin the Table Styles group is the Table Styles Gallery. This is a group of preset tables that you can choose from to apply an overall look and feel instantly to your table. Click the More button (it looks like a down arrow with a line above it) to see the entire selection of styles available for your table.
When the Gallery opens, you’ll see several different style categories. The first, Best Match For Document, is PowerPoint’s recommendation for table styles that will work well within the theme that you’ve chosen. The remaining categories,
The Table Styles Gallery works in conjunction with the Table Style Options group, which is explained later in this chapter.
MeMo
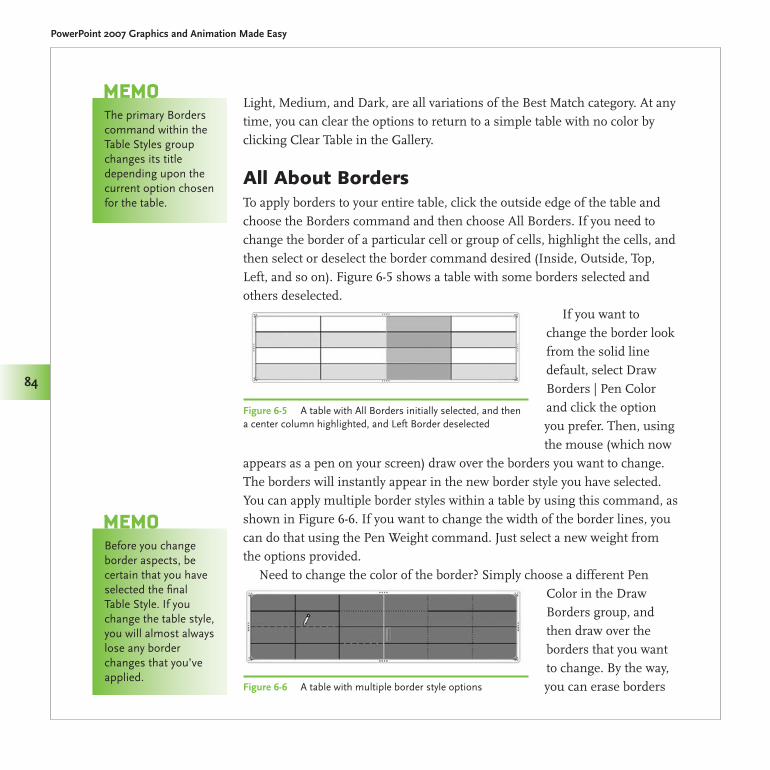
Made Easy/PowerPoint 2007 Graphics & Animation/Slack/0071600760/Chapter 6
PowerPoint 2007 Graphics and Animation Made Easy
84
Light, Medium, and Dark, are all variations of the Best Match category. At any time, you can clear the options to return to a simple table with no color by clicking Clear Table in the Gallery.
All About BordersTo apply borders to your entire table, click the outside edge of the table and choose the Borders command and then choose All Borders. If you need to change the border of a particular cell or group of cells, highlight the cells, and then select or deselect the border command desired (Inside, Outside, Top, Left, and so on). Figure 6-5 shows a table with some borders selected and others deselected.
If you want to change the border look from the solid line default, select Draw Borders | Pen Color and click the option you prefer. Then, using the mouse (which now
appears as a pen on your screen) draw over the borders you want to change. The borders will instantly appear in the new border style you have selected. You can apply multiple border styles within a table by using this command, as shown in Figure 6-6. If you want to change the width of the border lines, you can do that using the Pen Weight command. Just select a new weight from the options provided.
Need to change the color of the border? Simply choose a different Pen Color in the Draw Borders group, and then draw over the borders that you want to change. By the way, you can erase borders
Before you change border aspects, be certain that you have selected the final Table Style. If you change the table style, you will almost always lose any border changes that you’ve applied.
MeMo
Figure 6-5 A table with All Borders initially selected, and then a center column highlighted, and Left Border deselected
The primary Borders command within the Table Styles group changes its title depending upon the current option chosen for the table.
MeMo
Figure 6-6 A table with multiple border style options
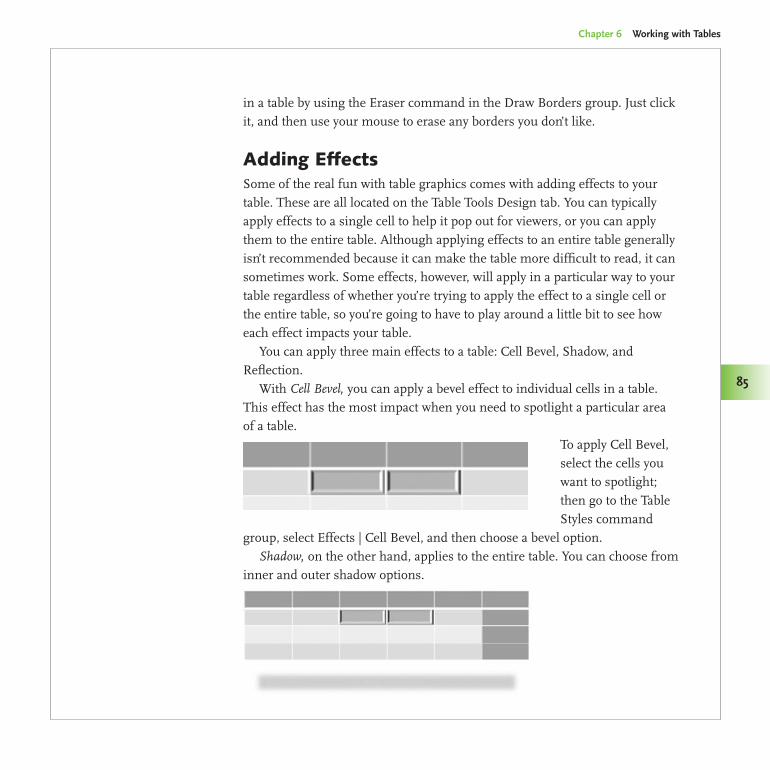
Made Easy/PowerPoint 2007 Graphics & Animation/Slack/0071600760/Chapter 6
Chapter 6 Working with Tables
85
in a table by using the Eraser command in the Draw Borders group. Just click it, and then use your mouse to erase any borders you don’t like.
Adding EffectsSome of the real fun with table graphics comes with adding effects to your table. These are all located on the Table Tools Design tab. You can typically apply effects to a single cell to help it pop out for viewers, or you can apply them to the entire table. Although applying effects to an entire table generally isn’t recommended because it can make the table more difficult to read, it can sometimes work. Some effects, however, will apply in a particular way to your table regardless of whether you’re trying to apply the effect to a single cell or the entire table, so you’re going to have to play around a little bit to see how each effect impacts your table.
You can apply three main effects to a table: Cell Bevel, Shadow, and Reflection.
With Cell Bevel, you can apply a bevel effect to individual cells in a table. This effect has the most impact when you need to spotlight a particular area of a table.
To apply Cell Bevel, select the cells you want to spotlight; then go to the Table Styles command
group, select Effects | Cell Bevel, and then choose a bevel option.Shadow, on the other hand, applies to the entire table. You can choose from
inner and outer shadow options.
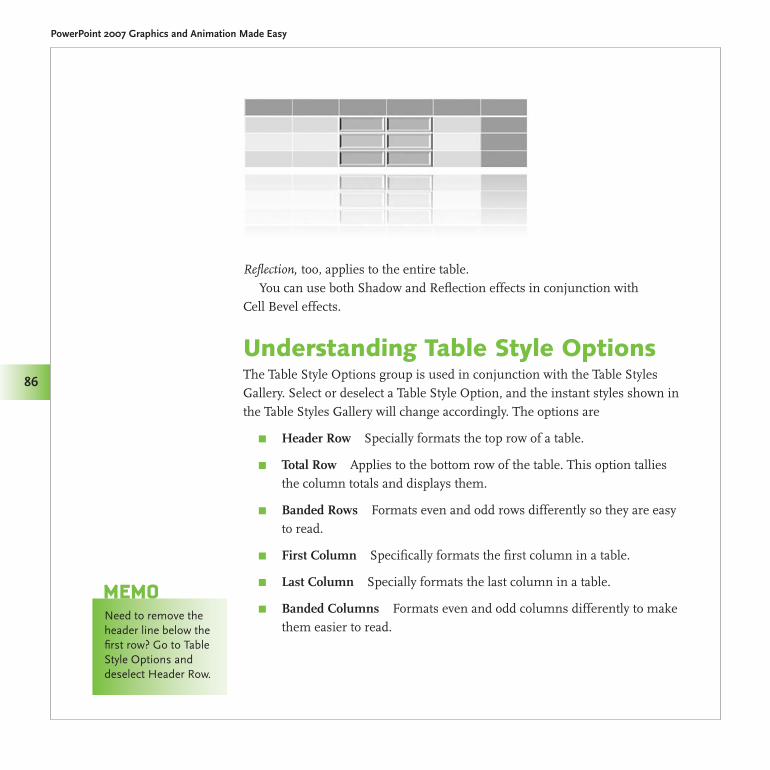
Made Easy/PowerPoint 2007 Graphics & Animation/Slack/0071600760/Chapter 6
PowerPoint 2007 Graphics and Animation Made Easy
86
Reflection, too, applies to the entire table.You can use both Shadow and Reflection effects in conjunction with
Cell Bevel effects.
Understanding Table Style OptionsThe Table Style Options group is used in conjunction with the Table Styles Gallery. Select or deselect a Table Style Option, and the instant styles shown in the Table Styles Gallery will change accordingly. The options are
Header Row π Specially formats the top row of a table.
Total Row π Applies to the bottom row of the table. This option tallies the column totals and displays them.
Banded Rows π Formats even and odd rows differently so they are easy to read.
First Column π Specifically formats the first column in a table.
Last Column π Specially formats the last column in a table.
Banded Columns π Formats even and odd columns differently to make them easier to read.
Need to remove the header line below the first row? Go to Table Style Options and deselect Header Row.
MeMo
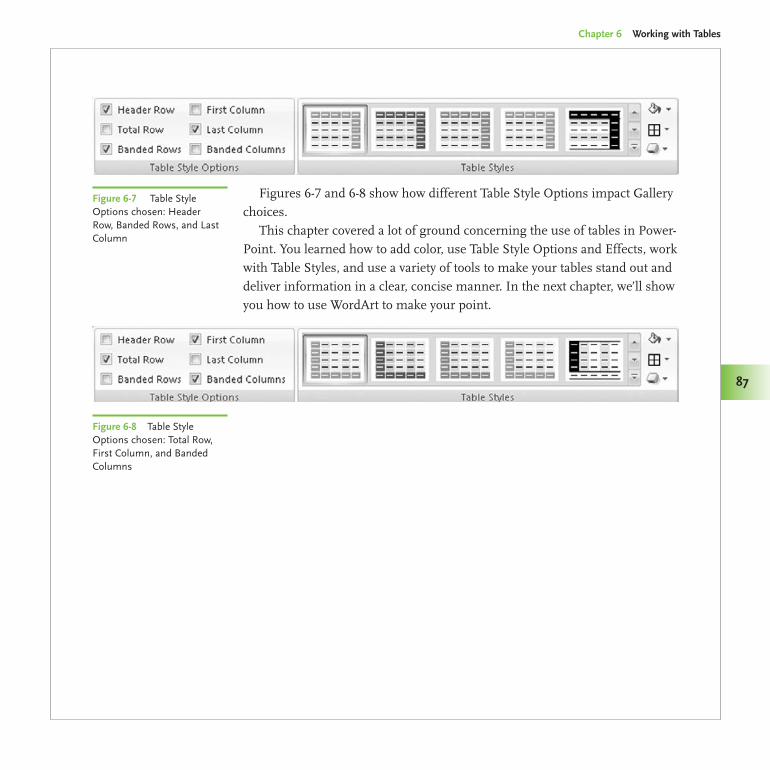
Made Easy/PowerPoint 2007 Graphics & Animation/Slack/0071600760/Chapter 6
Chapter 6 Working with Tables
87
Figures 6-7 and 6-8 show how different Table Style Options impact Gallery choices.
This chapter covered a lot of ground concerning the use of tables in Power-Point. You learned how to add color, use Table Style Options and Effects, work with Table Styles, and use a variety of tools to make your tables stand out and deliver information in a clear, concise manner. In the next chapter, we’ll show you how to use WordArt to make your point.
Figure 6-7 Table Style Options chosen: Header Row, Banded Rows, and Last Column
Figure 6-8 Table Style Options chosen: Total Row, First Column, and Banded Columns

This page intentionally left blank
Using WordArt to Make Your PointWordArt in PowerPoint 2007 gets your message to your audience in an exciting way. Sure, they’re just words, but when you need to get your point across quickly and effectively in literally seconds, you can depend on WordArt to create a lasting impression.
Remember, your PowerPoint 2007 presentations are telling a story and conveying a message. You want to use every opportunity to make sure those viewing the presentation are captivated enough to remember what you said. If they don’t find at least one “memorable moment,” you’ll feel like you wasted your time. So whether you’re presenting to family or friends, a group of coworkers or potential clients, you can use numerous features in PowerPoint 2007 to keep your presentation at the front of your audience’s minds.
In this chapter, you’ll discover a variety of ways that WordArt can enhance your presentation, including applying fill, outlines, shapes, and effects. You’ll also learn how to align, rotate, and flip the art for maximum effect and how to use a dialog box that lets you make changes from one location.
7
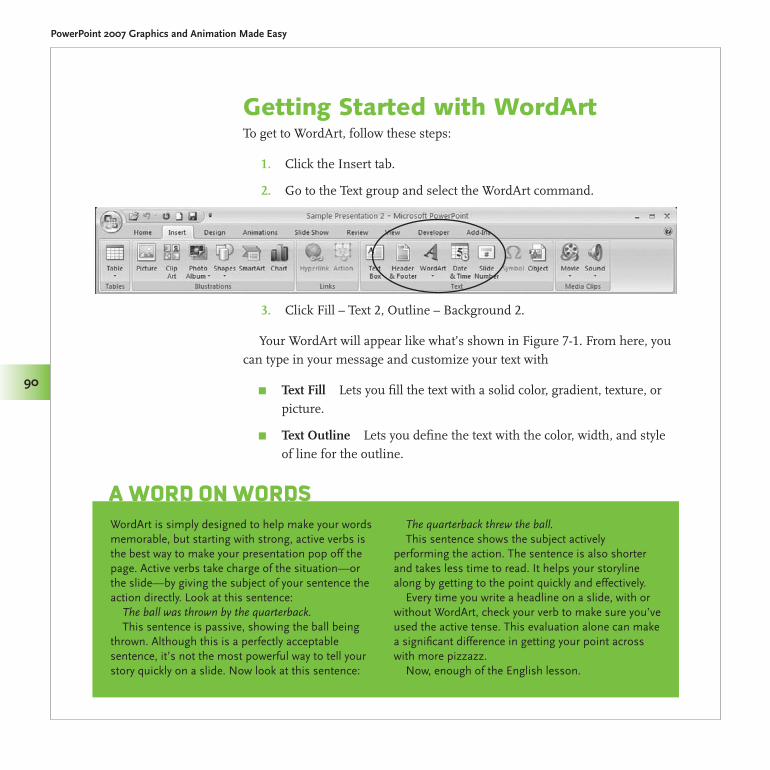
Made Easy/PowerPoint 2007 Graphics & Animation/Slack/0071600760/Chapter 7
PowerPoint 2007 Graphics and Animation Made Easy
90
Getting Started with WordArtTo get to WordArt, follow these steps:
Click the Insert tab.1.
Go to the Text2. group and select the WordArt command.
Click Fill – Text 2, Outline – Background 2.3.
Your WordArt will appear like what’s shown in Figure 7-1. From here, you can type in your message and customize your text with
Text Fill π Lets you fill the text with a solid color, gradient, texture, or picture.
Text Outline π Lets you define the text with the color, width, and style of line for the outline.
WordArt is simply designed to help make your words memorable, but starting with strong, active verbs is the best way to make your presentation pop off the page. Active verbs take charge of the situation—or the slide—by giving the subject of your sentence the action directly. Look at this sentence:
The ball was thrown by the quarterback.This sentence is passive, showing the ball being
thrown. Although this is a perfectly acceptable sentence, it’s not the most powerful way to tell your story quickly on a slide. Now look at this sentence:
The quarterback threw the ball.This sentence shows the subject actively
performing the action. The sentence is also shorter and takes less time to read. It helps your storyline along by getting to the point quickly and effectively.
Every time you write a headline on a slide, with or without WordArt, check your verb to make sure you’ve used the active tense. This evaluation alone can make a significant difference in getting your point across with more pizzazz.
Now, enough of the English lesson.
A Word on Words
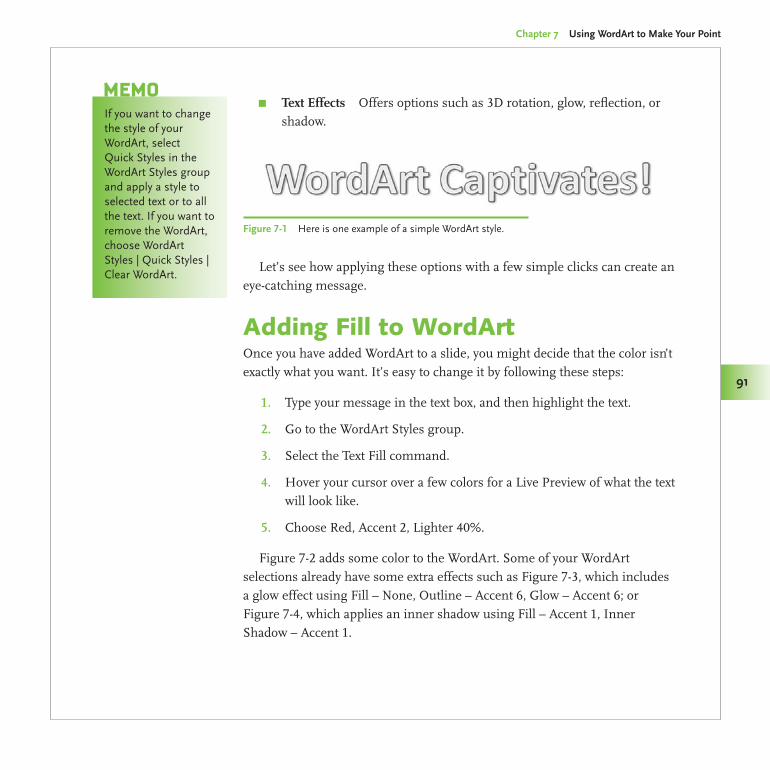
Made Easy/PowerPoint 2007 Graphics & Animation/Slack/0071600760/Chapter 7
Chapter 7 Using WordArt to Make Your Point
91
Text Effects π Offers options such as 3D rotation, glow, reflection, or shadow.
Let’s see how applying these options with a few simple clicks can create an eye-catching message.
Adding Fill to WordArtOnce you have added WordArt to a slide, you might decide that the color isn’t exactly what you want. It’s easy to change it by following these steps:
Type your message in the text box, and then highlight the text.1.
Go to the WordArt Styles group.2.
Select the Text Fill command.3.
Hover your cursor over a few colors for a Live Preview of what the text 4. will look like.
Choose Red, Accent 2, Lighter 40%.5.
Figure 7-2 adds some color to the WordArt. Some of your WordArt selections already have some extra effects such as Figure 7-3, which includes a glow effect using Fill – None, Outline – Accent 6, Glow – Accent 6; or Figure 7-4, which applies an inner shadow using Fill – Accent 1, Inner Shadow – Accent 1.
If you want to change the style of your WordArt, select Quick Styles in the WordArt Styles group and apply a style to selected text or to all the text. If you want to remove the WordArt, choose WordArt Styles | Quick Styles | Clear WordArt.
MeMo
Figure 7-1 Here is one example of a simple WordArt style.
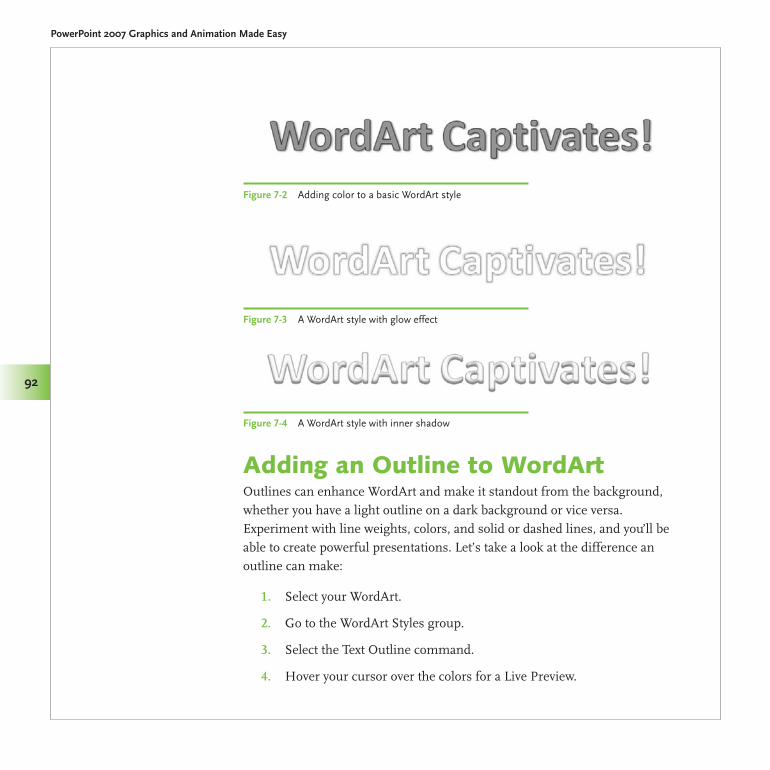
Made Easy/PowerPoint 2007 Graphics & Animation/Slack/0071600760/Chapter 7
PowerPoint 2007 Graphics and Animation Made Easy
92
Adding an Outline to WordArtOutlines can enhance WordArt and make it standout from the background, whether you have a light outline on a dark background or vice versa. Experiment with line weights, colors, and solid or dashed lines, and you’ll be able to create powerful presentations. Let’s take a look at the difference an outline can make:
Select your WordArt.1.
Go to the WordArt Styles group.2.
Select the Text Outline command.3.
Hover your cursor over the colors for a Live Preview.4.
Figure 7-2 Adding color to a basic WordArt style
Figure 7-3 A WordArt style with glow effect
Figure 7-4 A WordArt style with inner shadow
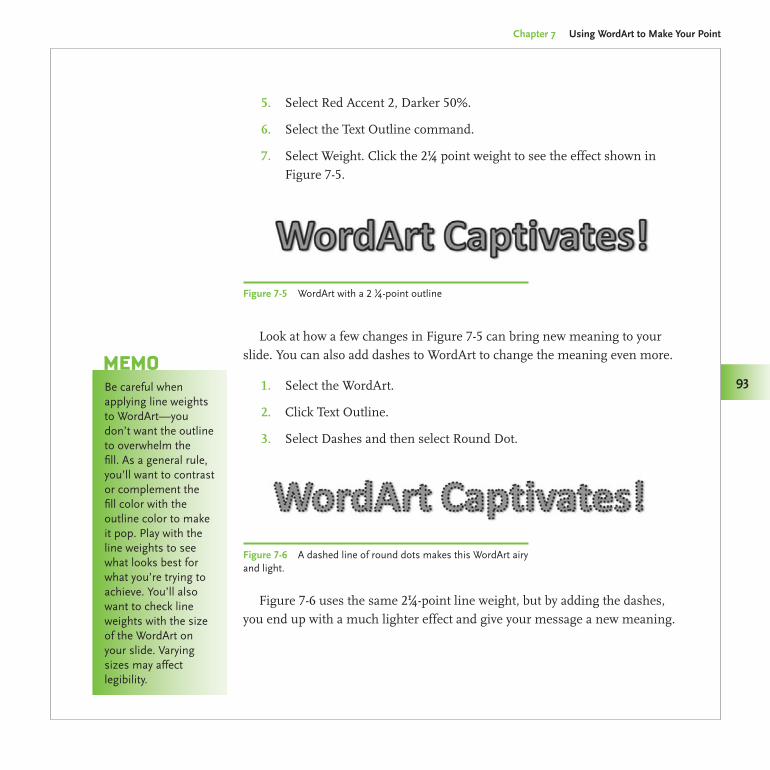
Chapter 7 Using WordArt to Make Your Point
93
Made Easy/PowerPoint 2007 Graphics & Animation/Slack/0071600760/Chapter 7
93
Select Red Accent 2, Darker 50%.5.
Select the Text Outline command.6.
Select Weight. Click the 2¼ point weight to see the effect shown in 7. Figure 7-5.
Figure 7-5 WordArt with a 2 ¼-point outline
Be careful when applying line weights to WordArt—you don’t want the outline to overwhelm the fill. As a general rule, you’ll want to contrast or complement the fill color with the outline color to make it pop. Play with the line weights to see what looks best for what you’re trying to achieve. You’ll also want to check line weights with the size of the WordArt on your slide. Varying sizes may affect legibility.
MeMo
Look at how a few changes in Figure 7-5 can bring new meaning to your slide. You can also add dashes to WordArt to change the meaning even more.
Select the WordArt.1.
Click Text Outline.2.
Select Dashes3. and then select Round Dot.
Figure 7-6 A dashed line of round dots makes this WordArt airy and light.
Figure 7-6 uses the same 2¼-point line weight, but by adding the dashes, you end up with a much lighter effect and give your message a new meaning.
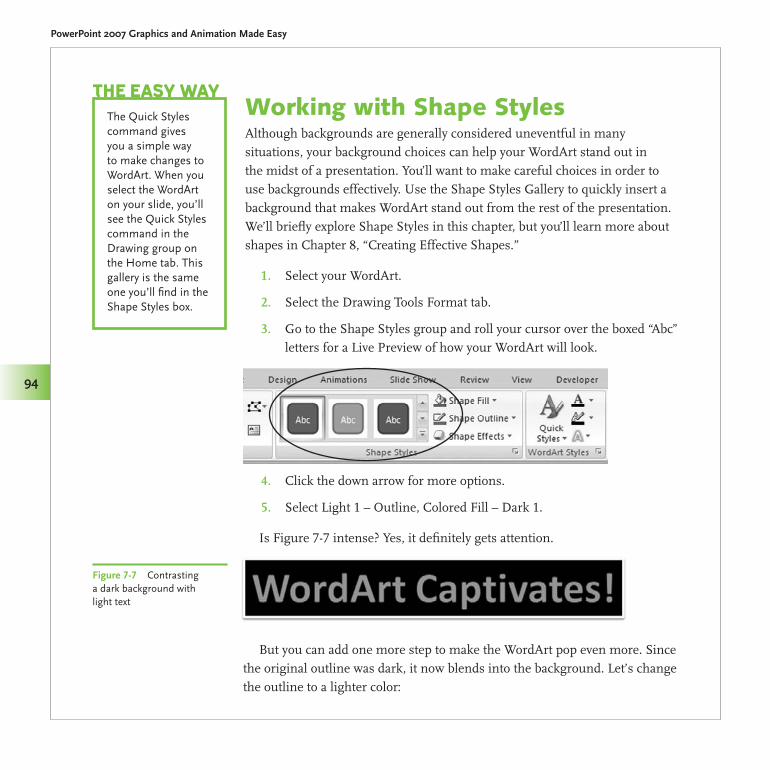
Made Easy/PowerPoint 2007 Graphics & Animation/Slack/0071600760/Chapter 7
PowerPoint 2007 Graphics and Animation Made Easy
94
Working with Shape StylesAlthough backgrounds are generally considered uneventful in many situations, your background choices can help your WordArt stand out in the midst of a presentation. You’ll want to make careful choices in order to use backgrounds effectively. Use the Shape Styles Gallery to quickly insert a background that makes WordArt stand out from the rest of the presentation. We’ll briefly explore Shape Styles in this chapter, but you’ll learn more about shapes in Chapter 8, “Creating Effective Shapes.”
Select your WordArt.1.
Select the Drawing Tools Format tab.2.
Go to the Shape Styles group and roll your cursor over the boxed “Abc” 3. letters for a Live Preview of how your WordArt will look.
Click the down arrow for more options.4.
Select Light 1 – Outline, Colored Fill – Dark 1.5.
Is Figure 7-7 intense? Yes, it definitely gets attention.
But you can add one more step to make the WordArt pop even more. Since the original outline was dark, it now blends into the background. Let’s change the outline to a lighter color:
Figure 7-7 Contrasting a dark background with light text
The Quick Styles command gives you a simple way to make changes to WordArt. When you select the WordArt on your slide, you’ll see the Quick Styles command in the Drawing group on the Home tab. This gallery is the same one you’ll find in the Shape Styles box.
The eAsy WAy
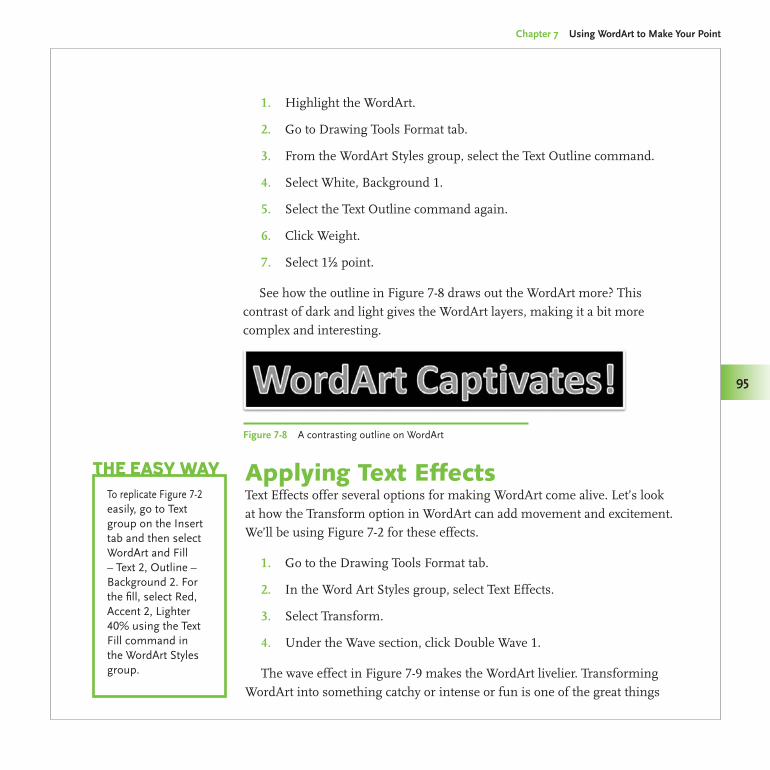
Made Easy/PowerPoint 2007 Graphics & Animation/Slack/0071600760/Chapter 7
Chapter 7 Using WordArt to Make Your Point
95
Highlight the WordArt.1.
Go to Drawing Tools Format tab.2.
From the WordArt Styles group, select the Text Outline command.3.
Select White, Background 1.4.
Select the Text Outline command again.5.
Click Weight.6.
Select 1½ point.7.
See how the outline in Figure 7-8 draws out the WordArt more? This contrast of dark and light gives the WordArt layers, making it a bit more complex and interesting.
Applying Text EffectsText Effects offer several options for making WordArt come alive. Let’s look at how the Transform option in WordArt can add movement and excitement. We’ll be using Figure 7-2 for these effects.
Go to the Drawing Tools Format tab.1.
In the Word Art Styles group, select Text Effects.2.
Select Transform.3.
Under the Wave section, click Double Wave 1.4.
The wave effect in Figure 7-9 makes the WordArt livelier. Transforming WordArt into something catchy or intense or fun is one of the great things
Figure 7-8 A contrasting outline on WordArt
To replicate Figure 7-2 easily, go to Text group on the Insert tab and then select WordArt and Fill – Text 2, Outline – Background 2. For the fill, select Red, Accent 2, Lighter 40% using the Text Fill command in the WordArt Styles group.
The eAsy WAy
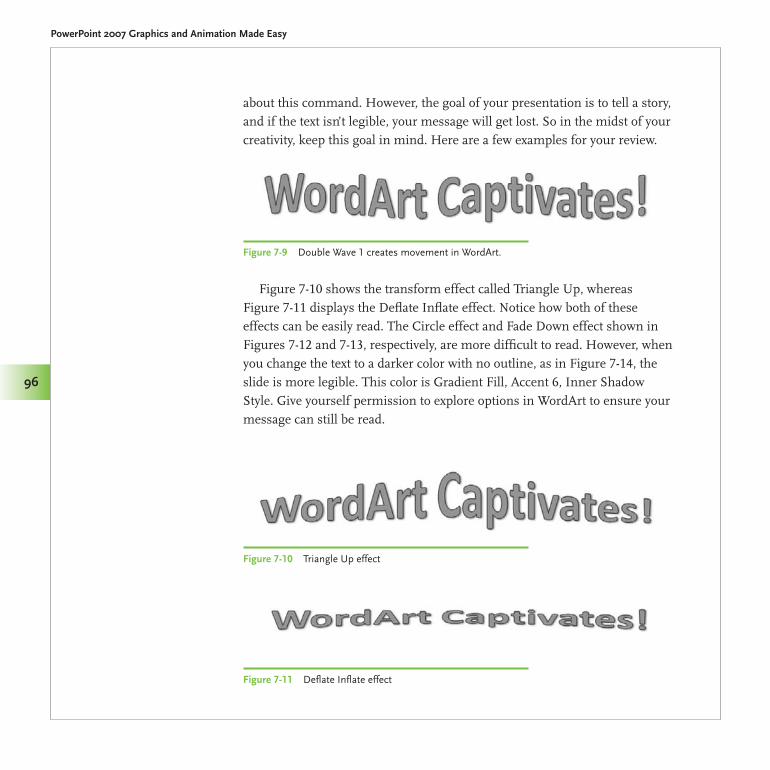
Made Easy/PowerPoint 2007 Graphics & Animation/Slack/0071600760/Chapter 7
PowerPoint 2007 Graphics and Animation Made Easy
96
about this command. However, the goal of your presentation is to tell a story, and if the text isn’t legible, your message will get lost. So in the midst of your creativity, keep this goal in mind. Here are a few examples for your review.
Figure 7-10 shows the transform effect called Triangle Up, whereas Figure 7-11 displays the Deflate Inflate effect. Notice how both of these effects can be easily read. The Circle effect and Fade Down effect shown in Figures 7-12 and 7-13, respectively, are more difficult to read. However, when you change the text to a darker color with no outline, as in Figure 7-14, the slide is more legible. This color is Gradient Fill, Accent 6, Inner Shadow Style. Give yourself permission to explore options in WordArt to ensure your message can still be read.
Figure 7-9 Double Wave 1 creates movement in WordArt.
Figure 7-11 Deflate Inflate effect
Figure 7-10 Triangle Up effect
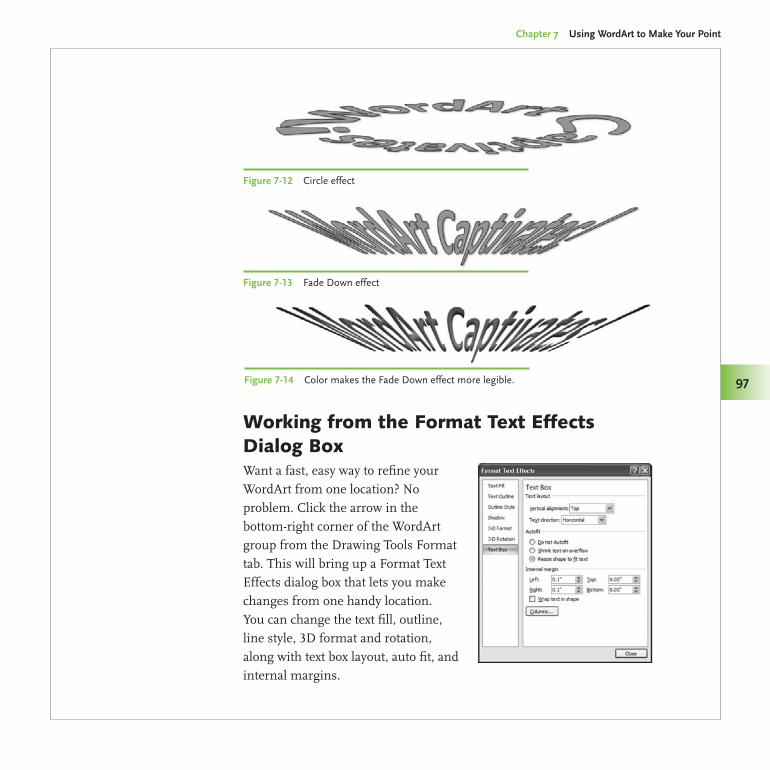
Made Easy/PowerPoint 2007 Graphics & Animation/Slack/0071600760/Chapter 7
Chapter 7 Using WordArt to Make Your Point
97
Working from the Format Text Effects Dialog BoxWant a fast, easy way to refine your WordArt from one location? No problem. Click the arrow in the bottom-right corner of the WordArt group from the Drawing Tools Format tab. This will bring up a Format Text Effects dialog box that lets you make changes from one handy location. You can change the text fill, outline, line style, 3D format and rotation, along with text box layout, auto fit, and internal margins.
Figure 7-12 Circle effect
Figure 7-13 Fade Down effect
Figure 7-14 Color makes the Fade Down effect more legible.
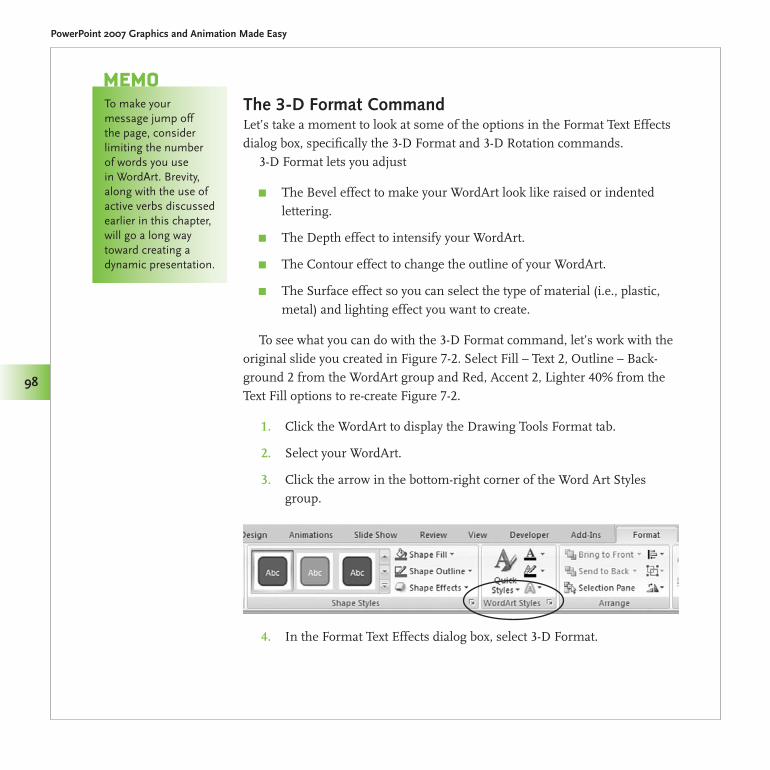
Made Easy/PowerPoint 2007 Graphics & Animation/Slack/0071600760/Chapter 7
PowerPoint 2007 Graphics and Animation Made Easy
98
The 3-D Format CommandLet’s take a moment to look at some of the options in the Format Text Effects dialog box, specifically the 3-D Format and 3-D Rotation commands.
3-D Format lets you adjust
The Bevel effect to make your WordArt look like raised or indented π
lettering.
The Depth effect to intensify your WordArt. π
The Contour effect to change the outline of your WordArt. π
The Surface effect so you can select the type of material (i.e., plastic, π
metal) and lighting effect you want to create.
To see what you can do with the 3-D Format command, let’s work with the original slide you created in Figure 7-2. Select Fill – Text 2, Outline – Back-ground 2 from the WordArt group and Red, Accent 2, Lighter 40% from the Text Fill options to re-create Figure 7-2.
Click the WordArt to display the Drawing Tools Format tab.1.
Select your WordArt.2.
Click the arrow in the bottom-right corner of the Word Art Styles 3. group.
In the Format Text Effects dialog box, select 3-D Format.4.
To make your message jump off the page, consider limiting the number of words you use in WordArt. Brevity, along with the use of active verbs discussed earlier in this chapter, will go a long way toward creating a dynamic presentation.
MeMo
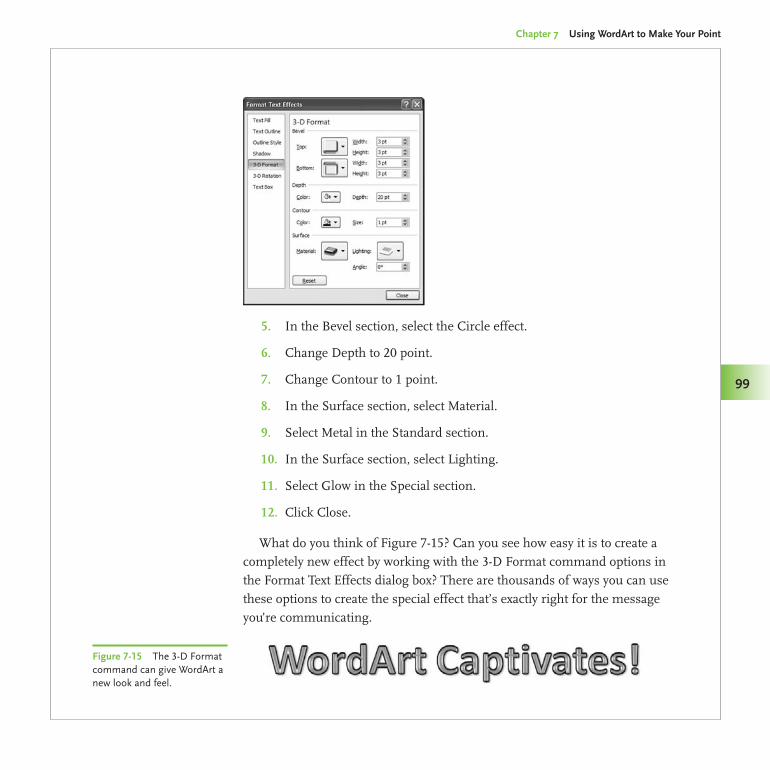
Made Easy/PowerPoint 2007 Graphics & Animation/Slack/0071600760/Chapter 7
Chapter 7 Using WordArt to Make Your Point
99
In the Bevel section, select the Circle effect.5.
Change Depth to 20 point.6.
Change Contour to 1 point.7.
In the Surface section, select Material.8.
Select Metal in the Standard section.9.
In the Surface section, select Lighting.10.
Select Glow in the Special section.11.
Click Close.12.
What do you think of Figure 7-15? Can you see how easy it is to create a completely new effect by working with the 3-D Format command options in the Format Text Effects dialog box? There are thousands of ways you can use these options to create the special effect that’s exactly right for the message you’re communicating.
Figure 7-15 The 3-D Format command can give WordArt a new look and feel.
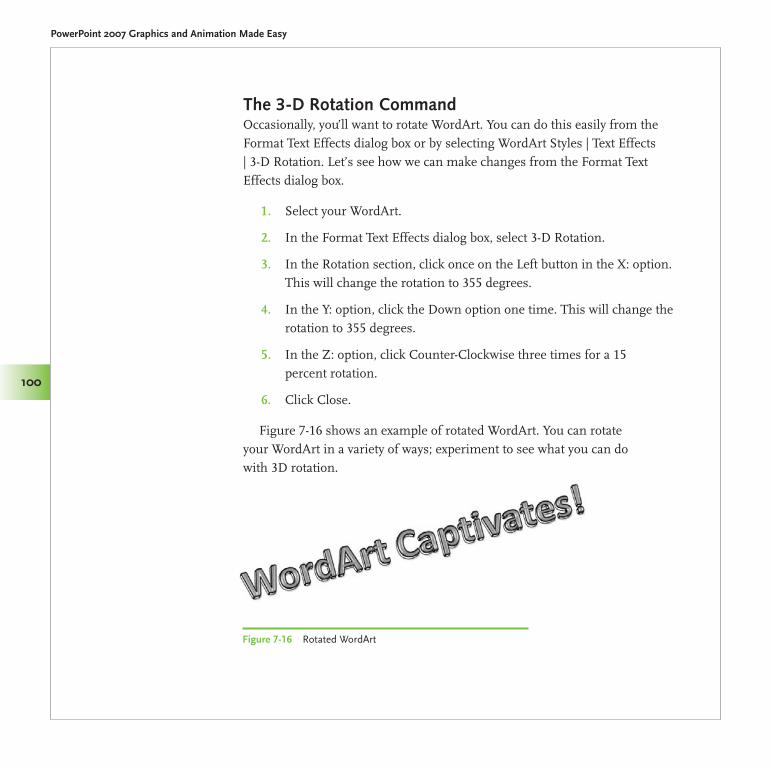
Made Easy/PowerPoint 2007 Graphics & Animation/Slack/0071600760/Chapter 7
PowerPoint 2007 Graphics and Animation Made Easy
100
Figure 7-16 Rotated WordArt
The 3-D Rotation CommandOccasionally, you’ll want to rotate WordArt. You can do this easily from the Format Text Effects dialog box or by selecting WordArt Styles | Text Effects | 3-D Rotation. Let’s see how we can make changes from the Format Text Effects dialog box.
Select your WordArt.1.
In the Format Text Effects dialog box, select 3-D Rotation.2.
In the Rotation section, click once on the Left button in the X: option. 3. This will change the rotation to 355 degrees.
In the Y: option, click the Down option one time. This will change the 4. rotation to 355 degrees.
In the Z: option, click Counter-Clockwise three times for a 15 5. percent rotation.
Click Close.6.
Figure 7-16 shows an example of rotated WordArt. You can rotate your WordArt in a variety of ways; experiment to see what you can do with 3D rotation.
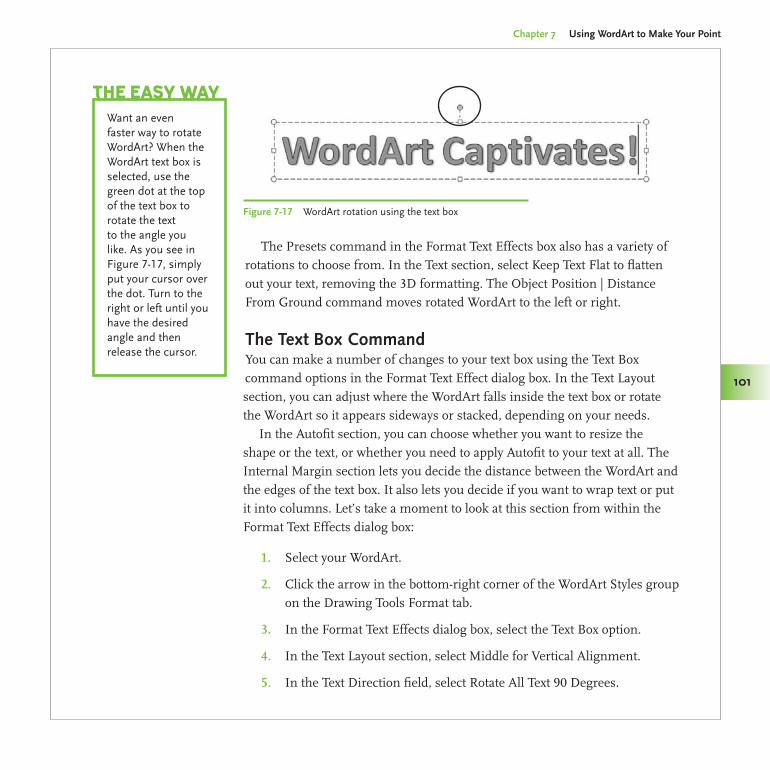
Chapter 7 Using WordArt to Make Your Point
101
Made Easy/PowerPoint 2007 Graphics & Animation/Slack/0071600760/Chapter 7
101
The Presets command in the Format Text Effects box also has a variety of rotations to choose from. In the Text section, select Keep Text Flat to flatten out your text, removing the 3D formatting. The Object Position | Distance From Ground command moves rotated WordArt to the left or right.
The Text Box CommandYou can make a number of changes to your text box using the Text Box command options in the Format Text Effect dialog box. In the Text Layout section, you can adjust where the WordArt falls inside the text box or rotate the WordArt so it appears sideways or stacked, depending on your needs.
In the Autofit section, you can choose whether you want to resize the shape or the text, or whether you need to apply Autofit to your text at all. The
Internal Margin section lets you decide the distance between the WordArt and the edges of the text box. It also lets you decide if you want to wrap text or put it into columns. Let’s take a moment to look at this section from within the Format Text Effects dialog box:
Select your WordArt.1.
Click the arrow in the bottom-right corner of the WordArt Styles group 2. on the Drawing Tools Format tab.
In the Format Text Effects dialog box, select the Text Box option.3.
In the Text Layout section, select Middle for Vertical Alignment.4.
In the Text Direction field, select Rotate All Text 90 Degrees.5.
Want an even faster way to rotate WordArt? When the WordArt text box is selected, use the green dot at the top of the text box to rotate the text to the angle you like. As you see in Figure 7-17, simply put your cursor over the dot. Turn to the right or left until you have the desired angle and then release the cursor.
The eAsy WAy
Figure 7-17 WordArt rotation using the text box
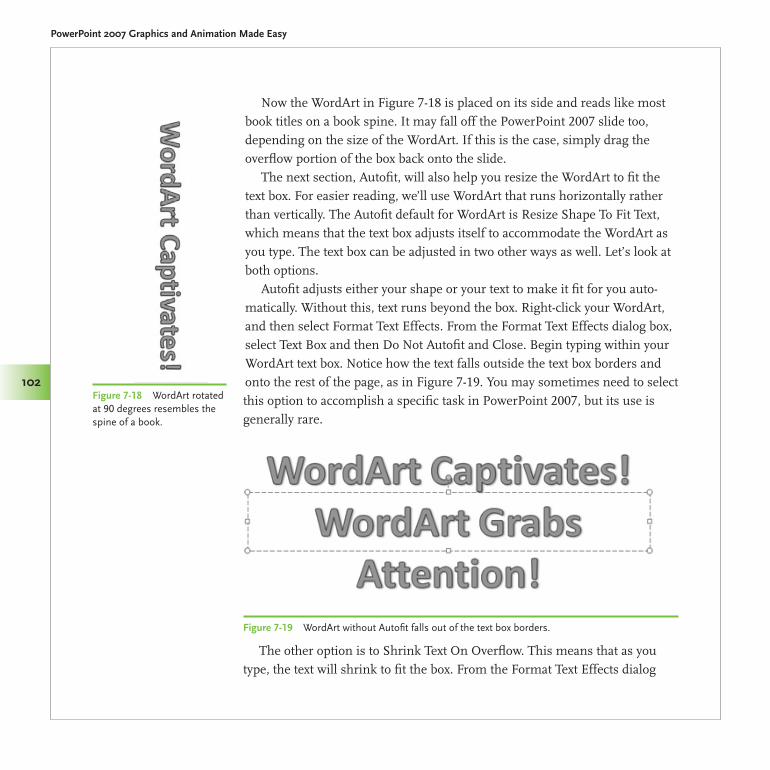
PowerPoint 2007 Graphics and Animation Made Easy
102
Made Easy/PowerPoint 2007 Graphics & Animation/Slack/0071600760/Chapter 7
Now the WordArt in Figure 7-18 is placed on its side and reads like most book titles on a book spine. It may fall off the PowerPoint 2007 slide too, depending on the size of the WordArt. If this is the case, simply drag the overflow portion of the box back onto the slide.
The next section, Autofit, will also help you resize the WordArt to fit the text box. For easier reading, we’ll use WordArt that runs horizontally rather than vertically. The Autofit default for WordArt is Resize Shape To Fit Text, which means that the text box adjusts itself to accommodate the WordArt as you type. The text box can be adjusted in two other ways as well. Let’s look at both options.
Autofit adjusts either your shape or your text to make it fit for you auto-matically. Without this, text runs beyond the box. Right-click your WordArt, and then select Format Text Effects. From the Format Text Effects dialog box, select Text Box and then Do Not Autofit and Close. Begin typing within your WordArt text box. Notice how the text falls outside the text box borders and onto the rest of the page, as in Figure 7-19. You may sometimes need to select this option to accomplish a specific task in PowerPoint 2007, but its use is generally rare.
Figure 7-19 WordArt without Autofit falls out of the text box borders.
The other option is to Shrink Text On Overflow. This means that as you type, the text will shrink to fit the box. From the Format Text Effects dialog
Figure 7-18 WordArt rotated at 90 degrees resembles the spine of a book.
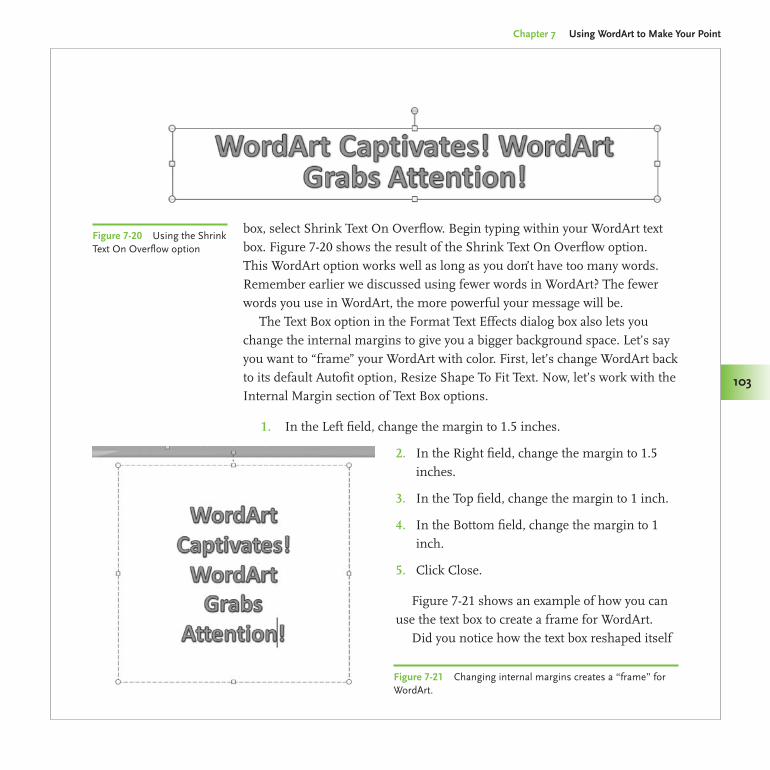
Chapter 7 Using WordArt to Make Your Point
103
Made Easy/PowerPoint 2007 Graphics & Animation/Slack/0071600760/Chapter 7
box, select Shrink Text On Overflow. Begin typing within your WordArt text box. Figure 7-20 shows the result of the Shrink Text On Overflow option. This WordArt option works well as long as you don’t have too many words. Remember earlier we discussed using fewer words in WordArt? The fewer words you use in WordArt, the more powerful your message will be.
The Text Box option in the Format Text Effects dialog box also lets you change the internal margins to give you a bigger background space. Let’s say you want to “frame” your WordArt with color. First, let’s change WordArt back to its default Autofit option, Resize Shape To Fit Text. Now, let’s work with the Internal Margin section of Text Box options.
In the Left field, change the margin to 1.5 inches.1.
In the Right field, change the margin to 1.5 2. inches.
In the Top field, change the margin to 1 inch.3.
In the Bottom field, change the margin to 1 4. inch.
Click Close.5.
Figure 7-21 shows an example of how you can use the text box to create a frame for WordArt.
Did you notice how the text box reshaped itself
Figure 7-20 Using the Shrink Text On Overflow option
Figure 7-21 Changing internal margins creates a “frame” for WordArt.
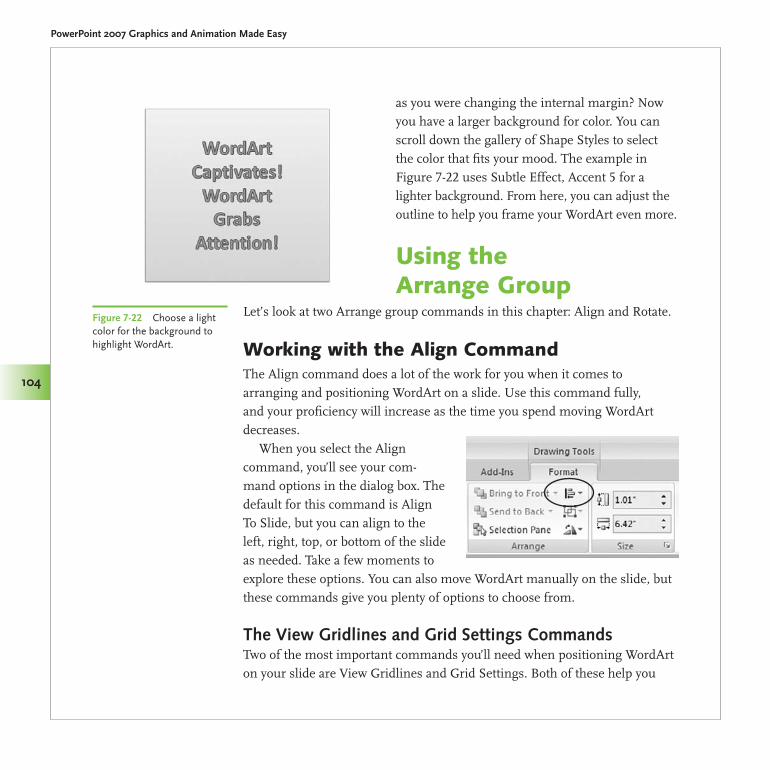
PowerPoint 2007 Graphics and Animation Made Easy
104
Made Easy/PowerPoint 2007 Graphics & Animation/Slack/0071600760/Chapter 7
as you were changing the internal margin? Now you have a larger background for color. You can scroll down the gallery of Shape Styles to select the color that fits your mood. The example in Figure 7-22 uses Subtle Effect, Accent 5 for a lighter background. From here, you can adjust the outline to help you frame your WordArt even more.
Using the Arrange Group
Let’s look at two Arrange group commands in this chapter: Align and Rotate.
Working with the Align CommandThe Align command does a lot of the work for you when it comes to arranging and positioning WordArt on a slide. Use this command fully, and your proficiency will increase as the time you spend moving WordArt decreases.
When you select the Align command, you’ll see your com-mand options in the dialog box. The default for this command is Align To Slide, but you can align to the left, right, top, or bottom of the slide as needed. Take a few moments to explore these options. You can also move WordArt manually on the slide, but these commands give you plenty of options to choose from.
The View Gridlines and Grid Settings CommandsTwo of the most important commands you’ll need when positioning WordArt on your slide are View Gridlines and Grid Settings. Both of these help you
Figure 7-22 Choose a light color for the background to highlight WordArt.
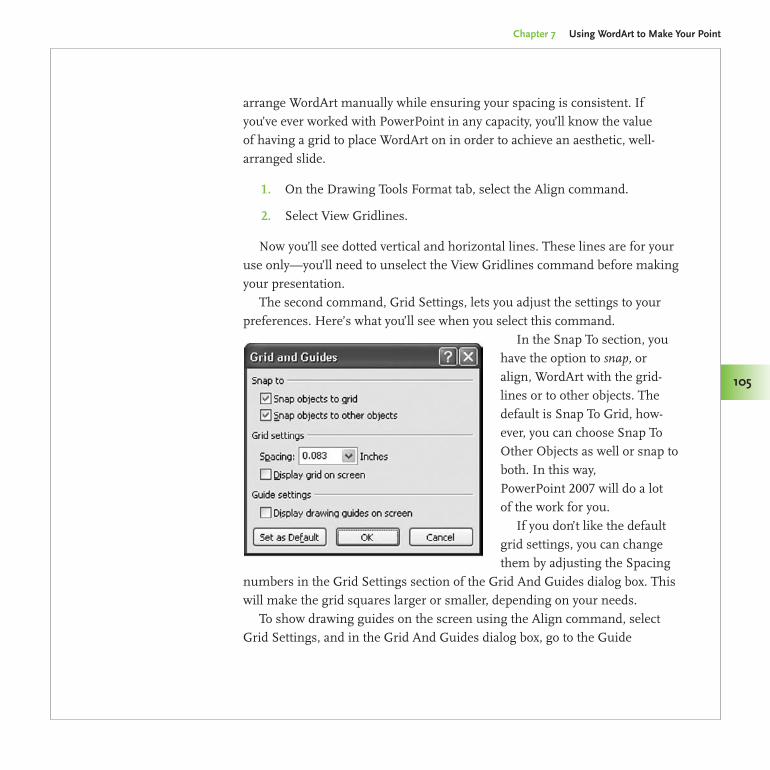
Chapter 7 Using WordArt to Make Your Point
105
Made Easy/PowerPoint 2007 Graphics & Animation/Slack/0071600760/Chapter 7
arrange WordArt manually while ensuring your spacing is consistent. If you’ve ever worked with PowerPoint in any capacity, you’ll know the value of having a grid to place WordArt on in order to achieve an aesthetic, well-arranged slide.
On the Drawing Tools Format tab, select the Align command.1.
Select View Gridlines.2.
Now you’ll see dotted vertical and horizontal lines. These lines are for your use only—you’ll need to unselect the View Gridlines command before making your presentation.
The second command, Grid Settings, lets you adjust the settings to your preferences. Here’s what you’ll see when you select this command.
In the Snap To section, you have the option to snap, or align, WordArt with the grid-lines or to other objects. The default is Snap To Grid, how-ever, you can choose Snap To Other Objects as well or snap to both. In this way, PowerPoint 2007 will do a lot of the work for you.
If you don’t like the default grid settings, you can change them by adjusting the Spacing
numbers in the Grid Settings section of the Grid And Guides dialog box. This will make the grid squares larger or smaller, depending on your needs.
To show drawing guides on the screen using the Align command, select Grid Settings, and in the Grid And Guides dialog box, go to the Guide
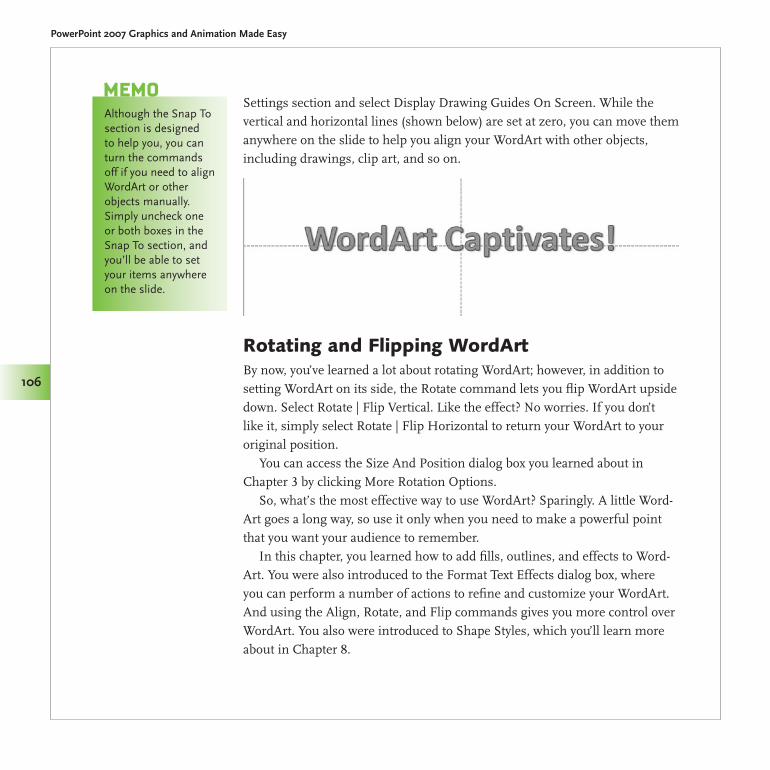
PowerPoint 2007 Graphics and Animation Made Easy
106
Made Easy/PowerPoint 2007 Graphics & Animation/Slack/0071600760/Chapter 7
Settings section and select Display Drawing Guides On Screen. While the vertical and horizontal lines (shown below) are set at zero, you can move them anywhere on the slide to help you align your WordArt with other objects, including drawings, clip art, and so on.
Rotating and Flipping WordArtBy now, you’ve learned a lot about rotating WordArt; however, in addition to setting WordArt on its side, the Rotate command lets you flip WordArt upside down. Select Rotate | Flip Vertical. Like the effect? No worries. If you don’t like it, simply select Rotate | Flip Horizontal to return your WordArt to your original position.
You can access the Size And Position dialog box you learned about in Chapter 3 by clicking More Rotation Options.
So, what’s the most effective way to use WordArt? Sparingly. A little Word-Art goes a long way, so use it only when you need to make a powerful point that you want your audience to remember.
In this chapter, you learned how to add fills, outlines, and effects to Word-Art. You were also introduced to the Format Text Effects dialog box, where you can perform a number of actions to refine and customize your WordArt. And using the Align, Rotate, and Flip commands gives you more control over WordArt. You also were introduced to Shape Styles, which you’ll learn more about in Chapter 8.
Although the Snap To section is designed to help you, you can turn the commands off if you need to align WordArt or other objects manually. Simply uncheck one or both boxes in the Snap To section, and you’ll be able to set your items anywhere on the slide.
MeMo
Creating Effective ShapesShapes in PowerPoint 2007 lend themselves to a number of uses for work and play. Whether you need shapes for a flow chart or you simply want to show off the “star” of your family, shapes are a great way to highlight important points, people, and objects in your presentation.
PowerPoint 2007’s ready-made shapes are the perfect start for using shapes, but you can also customize a shape to suit your needs. In this chapter, you’ll learn when to use shapes, how to add fill, outlines, and effects to shapes, and how to add text to a shape to give your message more punch. You’ll also learn how to edit a shape or create your own for those special messages that need a little more zing.
8
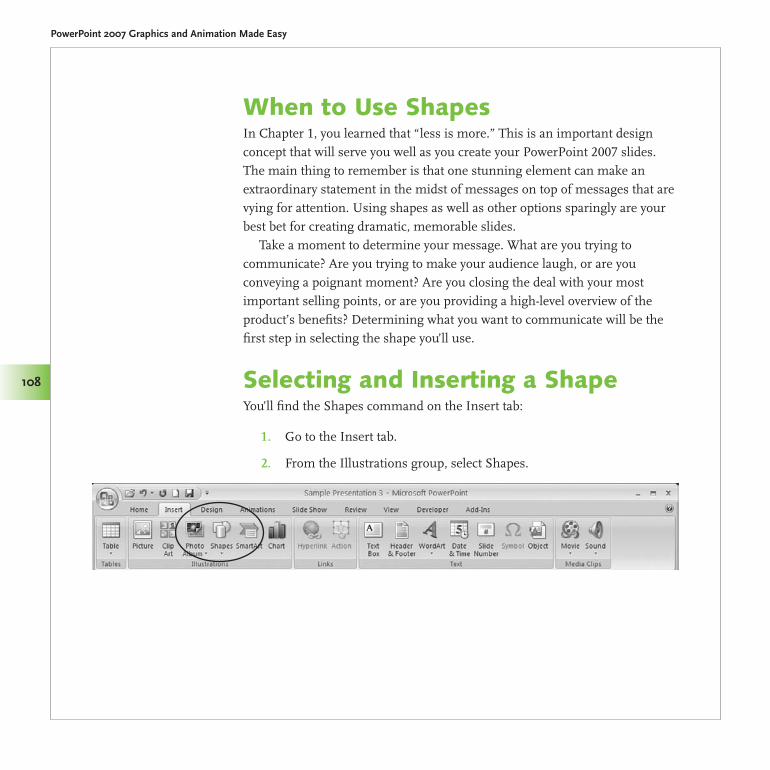
Made Easy/PowerPoint 2007 Graphics & Animation/Slack/0071600760/Chapter 8
PowerPoint 2007 Graphics and Animation Made Easy
108
When to Use ShapesIn Chapter 1, you learned that “less is more.” This is an important design concept that will serve you well as you create your PowerPoint 2007 slides. The main thing to remember is that one stunning element can make an extraordinary statement in the midst of messages on top of messages that are vying for attention. Using shapes as well as other options sparingly are your best bet for creating dramatic, memorable slides.
Take a moment to determine your message. What are you trying to communicate? Are you trying to make your audience laugh, or are you conveying a poignant moment? Are you closing the deal with your most important selling points, or are you providing a high-level overview of the product’s benefits? Determining what you want to communicate will be the first step in selecting the shape you’ll use.
Selecting and Inserting a ShapeYou’ll find the Shapes command on the Insert tab:
Go to the Insert tab.1.
From the Illustrations group, select Shapes.2.
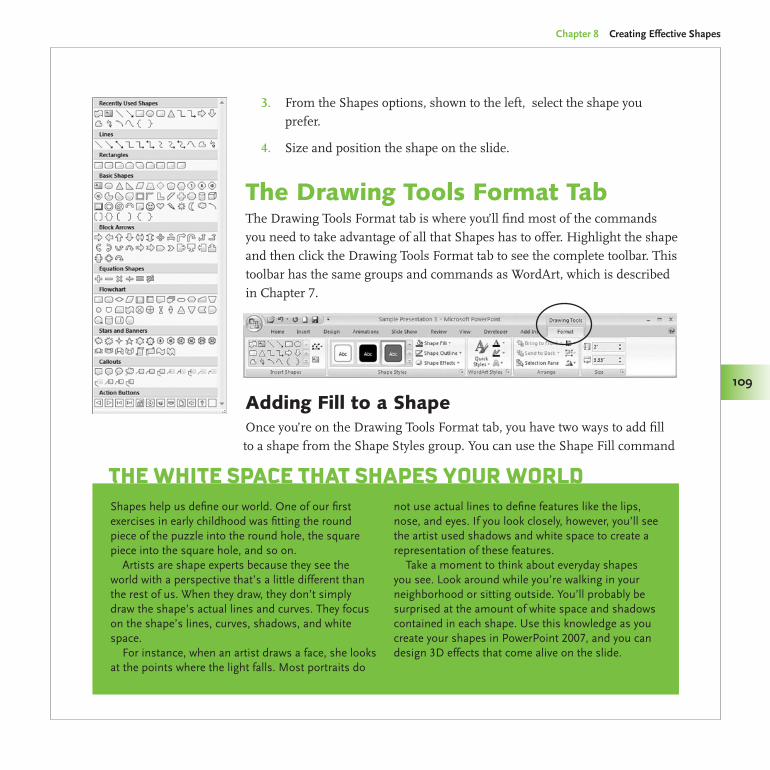
Made Easy/PowerPoint 2007 Graphics & Animation/Slack/0071600760/Chapter 8
Chapter 8 Creating Effective Shapes
109
From the Shapes options, shown to the left, select the shape you 3. prefer.
Size and position the shape on the slide.4.
The Drawing Tools Format TabThe Drawing Tools Format tab is where you’ll find most of the commands you need to take advantage of all that Shapes has to offer. Highlight the shape and then click the Drawing Tools Format tab to see the complete toolbar. This toolbar has the same groups and commands as WordArt, which is described in Chapter 7.
Adding Fill to a ShapeOnce you’re on the Drawing Tools Format tab, you have two ways to add fill to a shape from the Shape Styles group. You can use the Shape Fill command
Shapes help us define our world. One of our first exercises in early childhood was fitting the round piece of the puzzle into the round hole, the square piece into the square hole, and so on.
Artists are shape experts because they see the world with a perspective that’s a little different than the rest of us. When they draw, they don’t simply draw the shape’s actual lines and curves. They focus on the shape’s lines, curves, shadows, and white space.
For instance, when an artist draws a face, she looks at the points where the light falls. Most portraits do
not use actual lines to define features like the lips, nose, and eyes. If you look closely, however, you’ll see the artist used shadows and white space to create a representation of these features.
Take a moment to think about everyday shapes you see. Look around while you’re walking in your neighborhood or sitting outside. You’ll probably be surprised at the amount of white space and shadows contained in each shape. Use this knowledge as you create your shapes in PowerPoint 2007, and you can design 3D effects that come alive on the slide.
The WhiTe Space ThaT ShapeS Your World
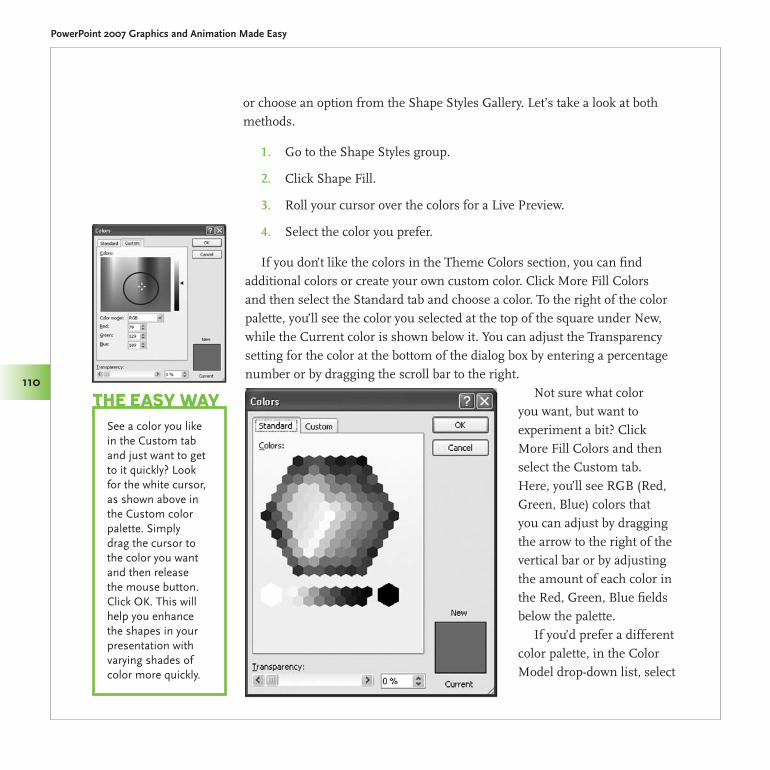
Made Easy/PowerPoint 2007 Graphics & Animation/Slack/0071600760/Chapter 8
PowerPoint 2007 Graphics and Animation Made Easy
110
or choose an option from the Shape Styles Gallery. Let’s take a look at both methods.
Go to the Shape Styles group.1.
Click Shape Fill.2.
Roll your cursor over the colors for a Live Preview.3.
Select the color you prefer.4.
If you don’t like the colors in the Theme Colors section, you can find additional colors or create your own custom color. Click More Fill Colors and then select the Standard tab and choose a color. To the right of the color palette, you’ll see the color you selected at the top of the square under New, while the Current color is shown below it. You can adjust the Transparency setting for the color at the bottom of the dialog box by entering a percentage number or by dragging the scroll bar to the right.
Not sure what color you want, but want to experiment a bit? Click More Fill Colors and then select the Custom tab. Here, you’ll see RGB (Red, Green, Blue) colors that you can adjust by dragging the arrow to the right of the vertical bar or by adjusting the amount of each color in the Red, Green, Blue fields below the palette.
If you’d prefer a different color palette, in the Color Model drop-down list, select
See a color you like in the Custom tab and just want to get to it quickly? Look for the white cursor, as shown above in the Custom color palette. Simply drag the cursor to the color you want and then release the mouse button. Click OK. This will help you enhance the shapes in your presentation with varying shades of color more quickly.
The eaSY WaY
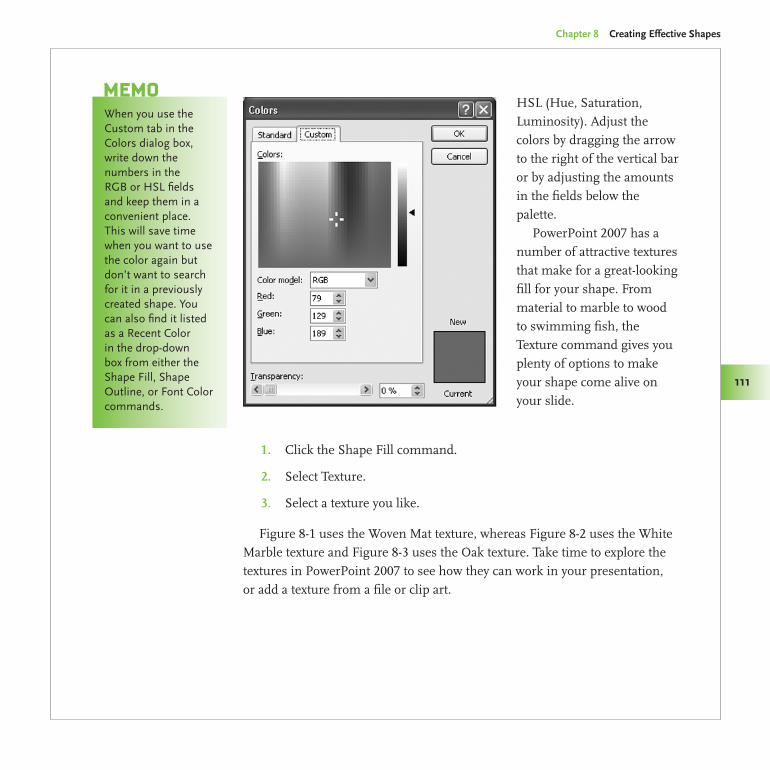
Made Easy/PowerPoint 2007 Graphics & Animation/Slack/0071600760/Chapter 8
Chapter 8 Creating Effective Shapes
111
HSL (Hue, Saturation, Luminosity). Adjust the colors by dragging the arrow to the right of the vertical bar or by adjusting the amounts in the fields below the palette.
PowerPoint 2007 has a number of attractive textures that make for a great-looking fill for your shape. From material to marble to wood to swimming fish, the Texture command gives you plenty of options to make your shape come alive on your slide.
Click the Shape Fill command.1.
Select Texture.2.
Select a texture you like.3.
Figure 8-1 uses the Woven Mat texture, whereas Figure 8-2 uses the White Marble texture and Figure 8-3 uses the Oak texture. Take time to explore the textures in PowerPoint 2007 to see how they can work in your presentation, or add a texture from a file or clip art.
When you use the Custom tab in the Colors dialog box, write down the numbers in the RGB or HSL fields and keep them in a convenient place. This will save time when you want to use the color again but don’t want to search for it in a previously created shape. You can also find it listed as a Recent Color in the drop-down box from either the Shape Fill, Shape Outline, or Font Color commands.
MeMo
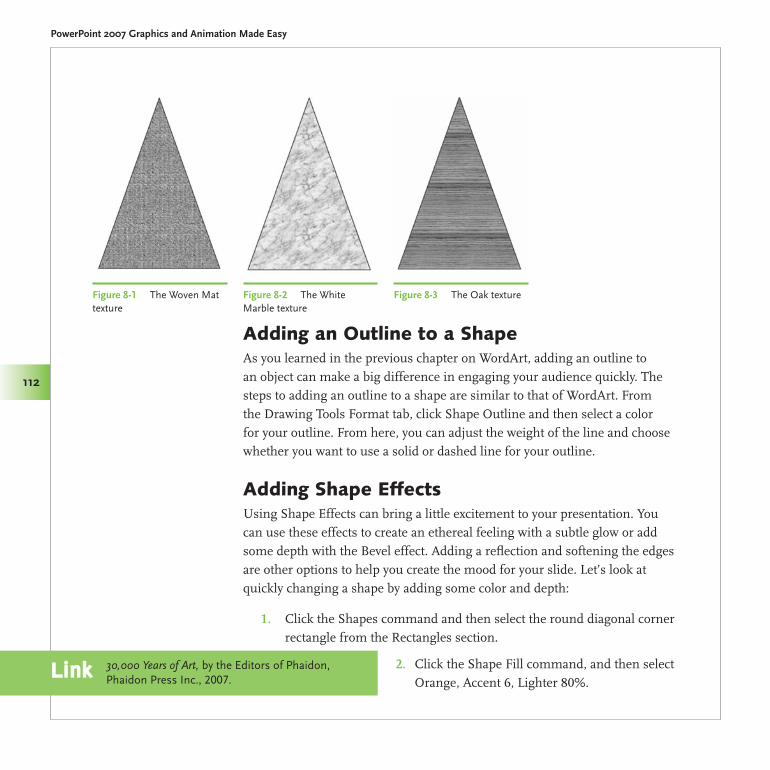
Made Easy/PowerPoint 2007 Graphics & Animation/Slack/0071600760/Chapter 8
PowerPoint 2007 Graphics and Animation Made Easy
112
Adding an Outline to a ShapeAs you learned in the previous chapter on WordArt, adding an outline to an object can make a big difference in engaging your audience quickly. The steps to adding an outline to a shape are similar to that of WordArt. From the Drawing Tools Format tab, click Shape Outline and then select a color for your outline. From here, you can adjust the weight of the line and choose whether you want to use a solid or dashed line for your outline.
Adding Shape EffectsUsing Shape Effects can bring a little excitement to your presentation. You can use these effects to create an ethereal feeling with a subtle glow or add some depth with the Bevel effect. Adding a reflection and softening the edges are other options to help you create the mood for your slide. Let’s look at quickly changing a shape by adding some color and depth:
Click the Shapes command and then select the round diagonal corner 1. rectangle from the Rectangles section.
Click the Shape Fill command, and then select 2. Orange, Accent 6, Lighter 80%.
Figure 8-1 The Woven Mat texture
Figure 8-2 The White Marble texture
Figure 8-3 The Oak texture
30,000 Years of Art, by the Editors of Phaidon, Phaidon Press Inc., 2007.link
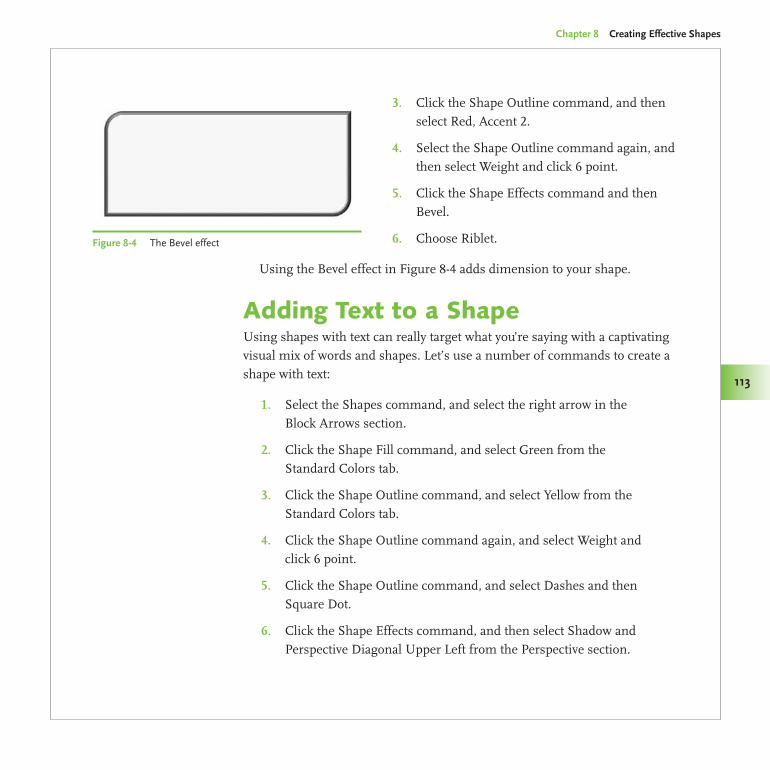
Made Easy/PowerPoint 2007 Graphics & Animation/Slack/0071600760/Chapter 8
Chapter 8 Creating Effective Shapes
113
Click the Shape Outline command, and then 3. select Red, Accent 2.
Select the Shape Outline command again, and 4. then select Weight and click 6 point.
Click the Shape Effects command and then 5. Bevel.
Choose Riblet.6.
Using the Bevel effect in Figure 8-4 adds dimension to your shape.
Adding Text to a ShapeUsing shapes with text can really target what you’re saying with a captivating visual mix of words and shapes. Let’s use a number of commands to create a shape with text:
Select the Shapes command, and select the right arrow in the 1. Block Arrows section.
Click the Shape Fill command, and select Green from the 2. Standard Colors tab.
Click the Shape Outline command, and select Yellow from the 3. Standard Colors tab.
Click the Shape Outline command again, and select Weight and 4. click 6 point.
Click the Shape Outline command, and select Dashes and then 5. Square Dot.
Click the Shape Effects command, and then select Shadow and 6. Perspective Diagonal Upper Left from the Perspective section.
Figure 8-4 The Bevel effect
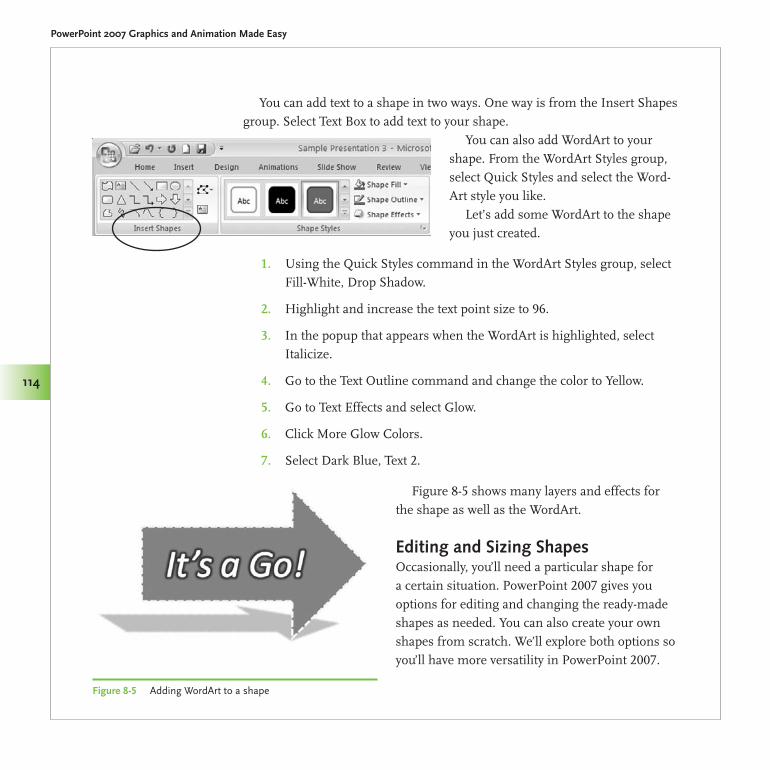
Made Easy/PowerPoint 2007 Graphics & Animation/Slack/0071600760/Chapter 8
PowerPoint 2007 Graphics and Animation Made Easy
114
You can add text to a shape in two ways. One way is from the Insert Shapes group. Select Text Box to add text to your shape.
You can also add WordArt to your shape. From the WordArt Styles group, select Quick Styles and select the Word-Art style you like.
Let’s add some WordArt to the shape you just created.
Using the Quick Styles command in the WordArt Styles group, select 1. Fill-White, Drop Shadow.
Highlight and increase the text point size to 96.2.
In the popup that appears when the WordArt is highlighted, select 3. Italicize.
Go to the Text Outline command and change the color to Yellow.4.
Go to Text Effects and select Glow.5.
Click More Glow Colors.6.
Select Dark Blue, Text 2.7.
Figure 8-5 shows many layers and effects for the shape as well as the WordArt.
Editing and Sizing ShapesOccasionally, you’ll need a particular shape for a certain situation. PowerPoint 2007 gives you options for editing and changing the ready-made shapes as needed. You can also create your own shapes from scratch. We’ll explore both options so you’ll have more versatility in PowerPoint 2007.
Figure 8-5 Adding WordArt to a shape
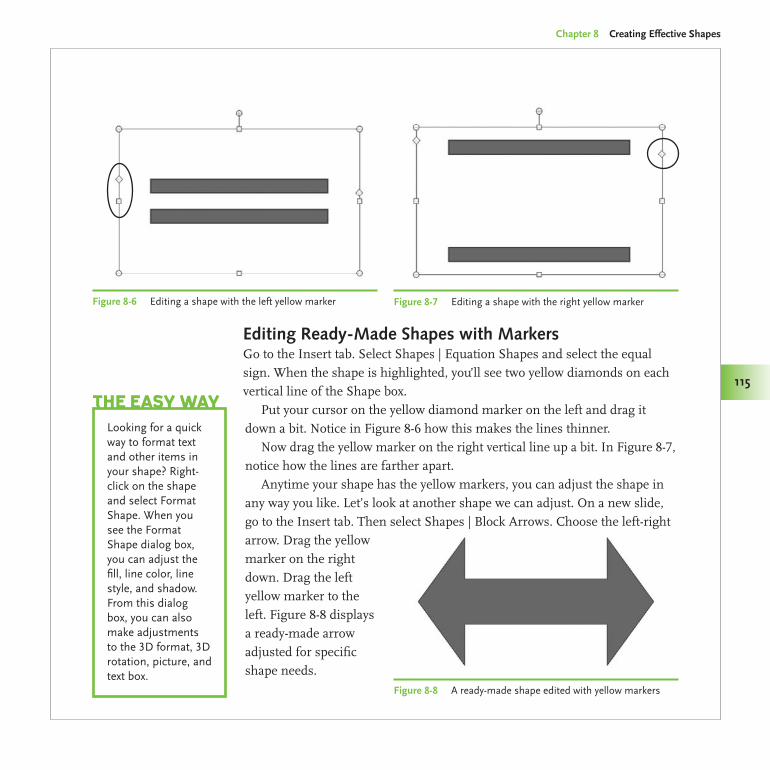
Made Easy/PowerPoint 2007 Graphics & Animation/Slack/0071600760/Chapter 8
Chapter 8 Creating Effective Shapes
115
Editing Ready-Made Shapes with MarkersGo to the Insert tab. Select Shapes | Equation Shapes and select the equal sign. When the shape is highlighted, you’ll see two yellow diamonds on each vertical line of the Shape box.
Put your cursor on the yellow diamond marker on the left and drag it down a bit. Notice in Figure 8-6 how this makes the lines thinner.
Now drag the yellow marker on the right vertical line up a bit. In Figure 8-7, notice how the lines are farther apart.
Anytime your shape has the yellow markers, you can adjust the shape in any way you like. Let’s look at another shape we can adjust. On a new slide, go to the Insert tab. Then select Shapes | Block Arrows. Choose the left-right arrow. Drag the yellow marker on the right down. Drag the left yellow marker to the left. Figure 8-8 displays a ready-made arrow adjusted for specific shape needs.
Looking for a quick way to format text and other items in your shape? Right-click on the shape and select Format Shape. When you see the Format Shape dialog box, you can adjust the fill, line color, line style, and shadow. From this dialog box, you can also make adjustments to the 3D format, 3D rotation, picture, and text box.
The eaSY WaY
Figure 8-6 Editing a shape with the left yellow marker Figure 8-7 Editing a shape with the right yellow marker
Figure 8-8 A ready-made shape edited with yellow markers
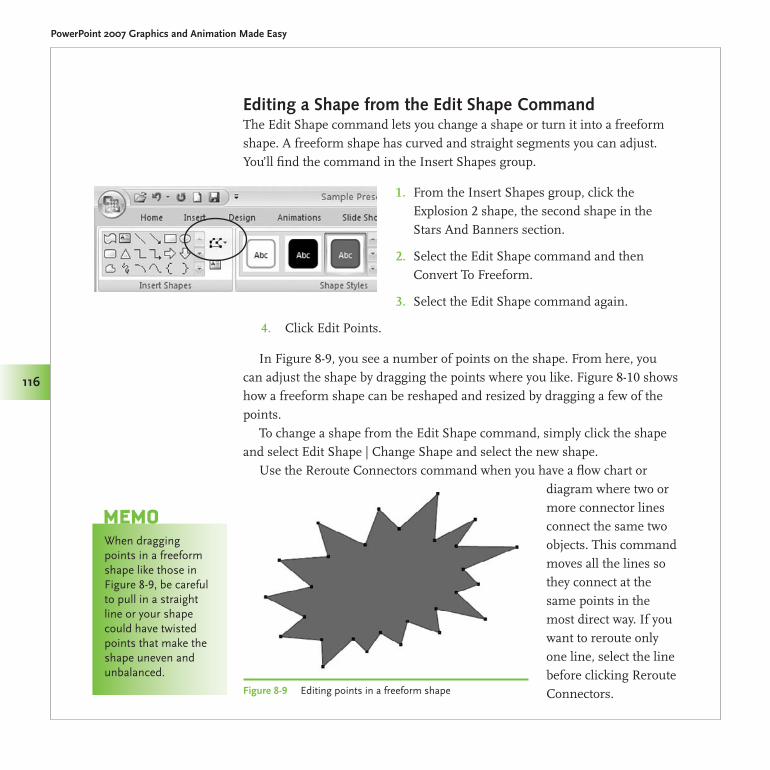
Made Easy/PowerPoint 2007 Graphics & Animation/Slack/0071600760/Chapter 8
PowerPoint 2007 Graphics and Animation Made Easy
116
Editing a Shape from the Edit Shape CommandThe Edit Shape command lets you change a shape or turn it into a freeform shape. A freeform shape has curved and straight segments you can adjust. You’ll find the command in the Insert Shapes group.
From the Insert Shapes group, click the 1. Explosion 2 shape, the second shape in the Stars And Banners section.
Select the Edit Shape command and then 2. Convert To Freeform.
Select the Edit Shape command again.3.
Click Edit Points.4.
In Figure 8-9, you see a number of points on the shape. From here, you can adjust the shape by dragging the points where you like. Figure 8-10 shows how a freeform shape can be reshaped and resized by dragging a few of the points.
To change a shape from the Edit Shape command, simply click the shape and select Edit Shape | Change Shape and select the new shape.
Use the Reroute Connectors command when you have a flow chart or diagram where two or more connector lines connect the same two objects. This command moves all the lines so they connect at the same points in the most direct way. If you want to reroute only one line, select the line before clicking Reroute Connectors.
When dragging points in a freeform shape like those in Figure 8-9, be careful to pull in a straight line or your shape could have twisted points that make the shape uneven and unbalanced.
MeMo
Figure 8-9 Editing points in a freeform shape
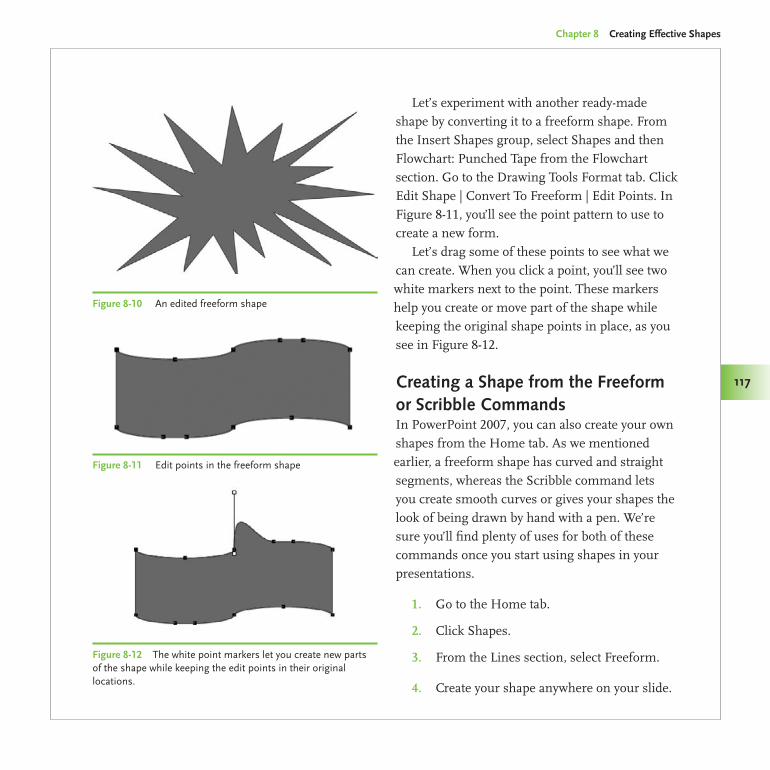
Made Easy/PowerPoint 2007 Graphics & Animation/Slack/0071600760/Chapter 8
Chapter 8 Creating Effective Shapes
117
Let’s experiment with another ready-made shape by converting it to a freeform shape. From the Insert Shapes group, select Shapes and then Flowchart: Punched Tape from the Flowchart section. Go to the Drawing Tools Format tab. Click Edit Shape | Convert To Freeform | Edit Points. In Figure 8-11, you’ll see the point pattern to use to create a new form.
Let’s drag some of these points to see what we can create. When you click a point, you’ll see two white markers next to the point. These markers help you create or move part of the shape while keeping the original shape points in place, as you see in Figure 8-12.
Creating a Shape from the Freeform or Scribble CommandsIn PowerPoint 2007, you can also create your own shapes from the Home tab. As we mentioned earlier, a freeform shape has curved and straight segments, whereas the Scribble command lets you create smooth curves or gives your shapes the look of being drawn by hand with a pen. We’re sure you’ll find plenty of uses for both of these commands once you start using shapes in your presentations.
Go to the Home tab.1.
Click Shapes.2.
From the Lines section, select Freeform.3.
Create your shape anywhere on your slide.4.
Figure 8-10 An edited freeform shape
Figure 8-11 Edit points in the freeform shape
Figure 8-12 The white point markers let you create new parts of the shape while keeping the edit points in their original locations.
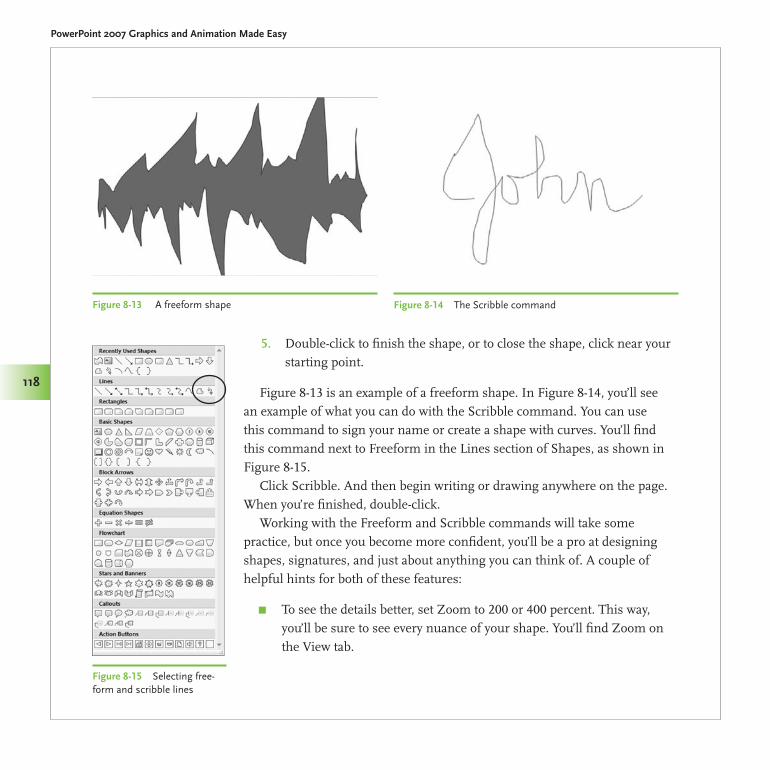
Made Easy/PowerPoint 2007 Graphics & Animation/Slack/0071600760/Chapter 8
PowerPoint 2007 Graphics and Animation Made Easy
118
Double-click to finish the shape, or to close the shape, click near your 5. starting point.
Figure 8-13 is an example of a freeform shape. In Figure 8-14, you’ll see an example of what you can do with the Scribble command. You can use this command to sign your name or create a shape with curves. You’ll find this command next to Freeform in the Lines section of Shapes, as shown in Figure 8-15.
Click Scribble. And then begin writing or drawing anywhere on the page. When you’re finished, double-click.
Working with the Freeform and Scribble commands will take some practice, but once you become more confident, you’ll be a pro at designing shapes, signatures, and just about anything you can think of. A couple of helpful hints for both of these features:
To see the details better, set Zoom to 200 or 400 percent. This way, π
you’ll be sure to see every nuance of your shape. You’ll find Zoom on the View tab.
Figure 8-13 A freeform shape Figure 8-14 The Scribble command
Figure 8-15 Selecting free-form and scribble lines
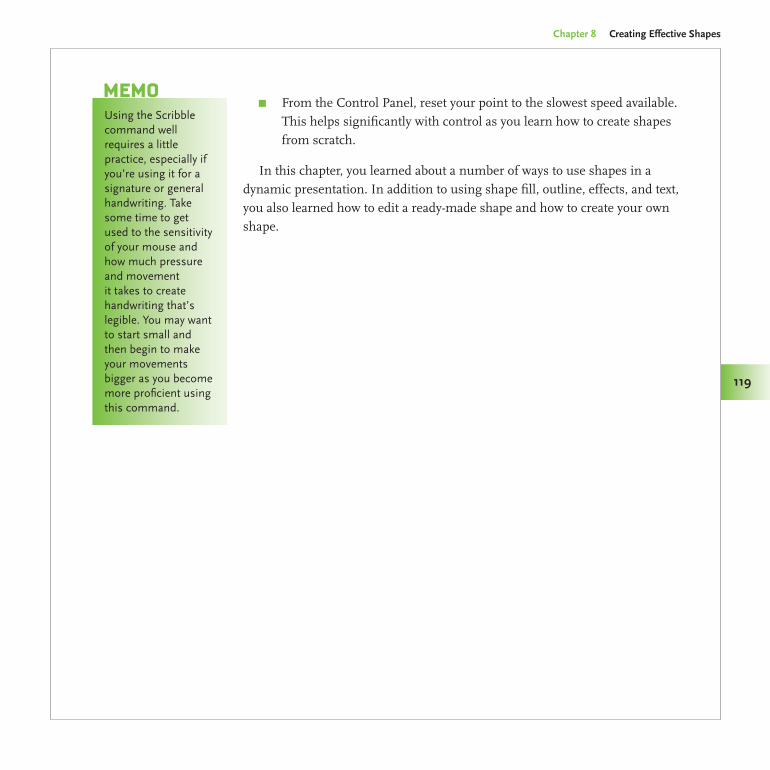
Chapter 8 Creating Effective Shapes
119
Made Easy/PowerPoint 2007 Graphics & Animation/Slack/0071600760/Chapter 8
119
From the Control Panel, reset your point to the slowest speed available. π
This helps significantly with control as you learn how to create shapes from scratch.
In this chapter, you learned about a number of ways to use shapes in a dynamic presentation. In addition to using shape fill, outline, effects, and text, you also learned how to edit a ready-made shape and how to create your own shape.
Using the Scribble command well requires a little practice, especially if you’re using it for a signature or general handwriting. Take some time to get used to the sensitivity of your mouse and how much pressure and movement it takes to create handwriting that’s legible. You may want to start small and then begin to make your movements bigger as you become more proficient using this command.
MeMo

This page intentionally left blank
Comparing and Illustrating Content with SmartArt
If you haven’t really used SmartArt yet, you’re going to be quite impressed by what it can do. If you have used it, then you know that it can make life substantially easier when designing a presentation. The beauty of SmartArt—a visual method for displaying your content—is that it turns simple text into dynamic graphics that are easy to read and understand. In particular, SmartArt lets you show concepts, processes, hierarchies, and other relationships in a visual way by providing preset graphics that you can simply drop your information into. You can customize both the look and layout of SmartArt and animate it as well.
We’ll also show you how to work with charts, which are wonderful graphic elements that you can add to presentations in which you need to display numerical data. Charts aren’t quite as flexible as SmartArt, but you can still make them look professional using color and the Quick Styles Gallery.
In this chapter, we’ll explain what SmartArt and charts entail and how they both work. You’ll learn
9
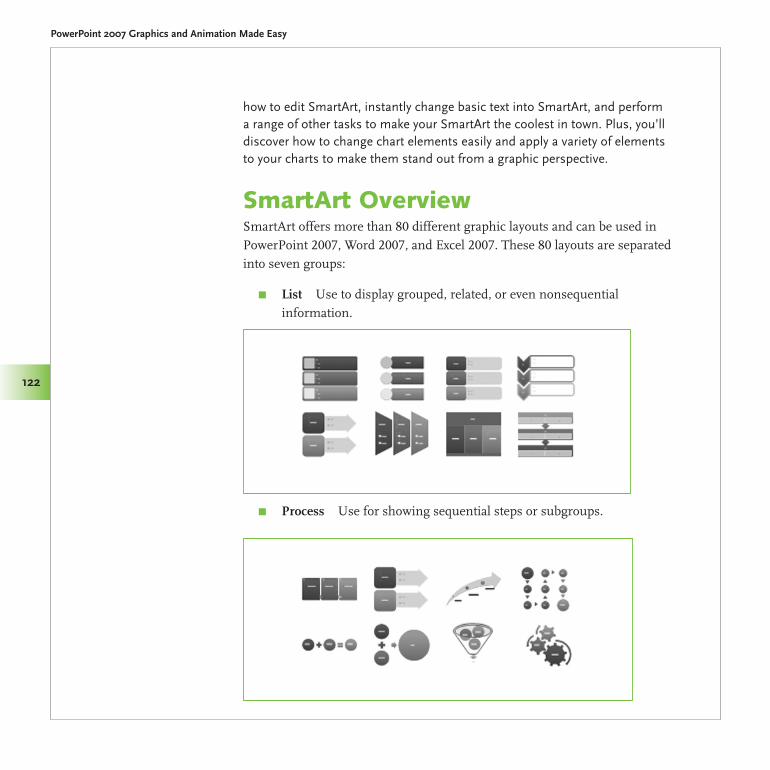
Made Easy/PowerPoint 2007 Graphics & Animation/Slack/0071600760/Chapter 9
PowerPoint 2007 Graphics and Animation Made Easy
122
how to edit SmartArt, instantly change basic text into SmartArt, and perform a range of other tasks to make your SmartArt the coolest in town. Plus, you’ll discover how to change chart elements easily and apply a variety of elements to your charts to make them stand out from a graphic perspective.
SmartArt OverviewSmartArt offers more than 80 different graphic layouts and can be used in PowerPoint 2007, Word 2007, and Excel 2007. These 80 layouts are separated into seven groups:
List π Use to display grouped, related, or even nonsequential information.
Process π Use for showing sequential steps or subgroups.
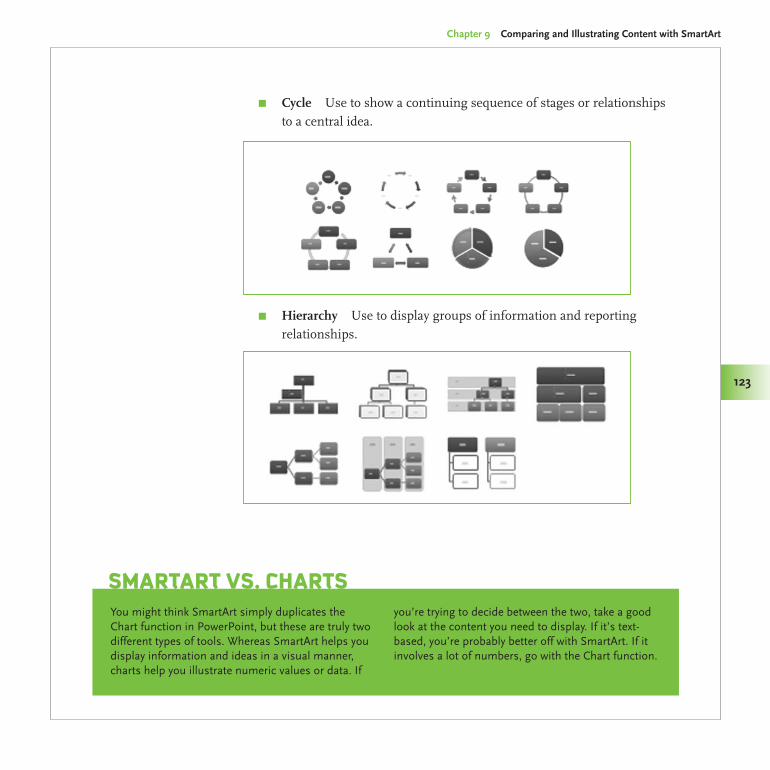
Made Easy/PowerPoint 2007 Graphics & Animation/Slack/0071600760/Chapter 9
Chapter 9 Comparing and Illustrating Content with SmartArt
123
Cycle π Use to show a continuing sequence of stages or relationships to a central idea.
Hierarchy π Use to display groups of information and reporting relationships.
You might think SmartArt simply duplicates the Chart function in PowerPoint, but these are truly two different types of tools. Whereas SmartArt helps you display information and ideas in a visual manner, charts help you illustrate numeric values or data. If
you’re trying to decide between the two, take a good look at the content you need to display. If it’s text-based, you’re probably better off with SmartArt. If it involves a lot of numbers, go with the Chart function.
Smartart vS. ChartS
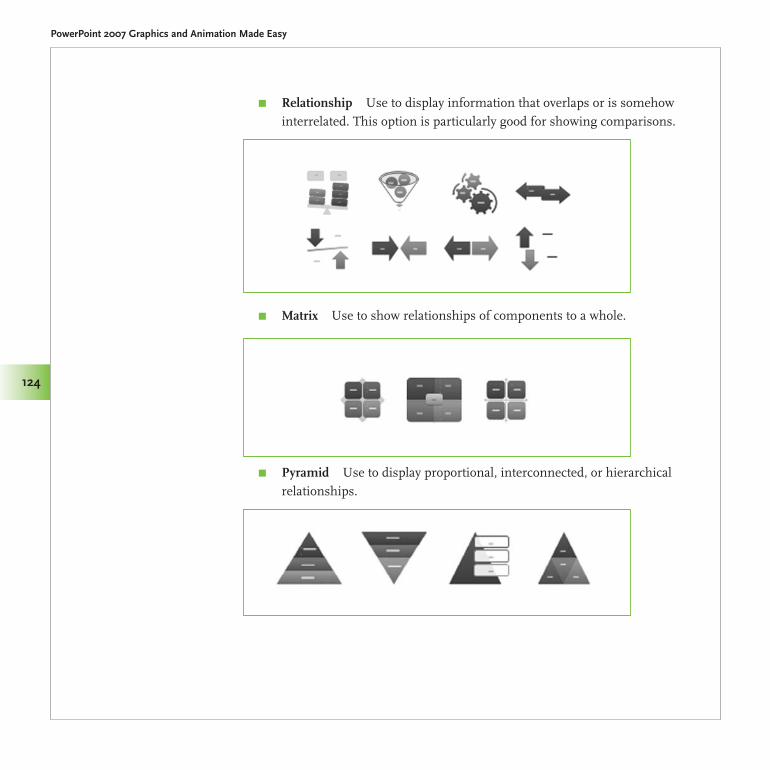
Made Easy/PowerPoint 2007 Graphics & Animation/Slack/0071600760/Chapter 9
PowerPoint 2007 Graphics and Animation Made Easy
124
Relationship π Use to display information that overlaps or is somehow interrelated. This option is particularly good for showing comparisons.
Matrix π Use to show relationships of components to a whole.
Pyramid π Use to display proportional, interconnected, or hierarchical relationships.
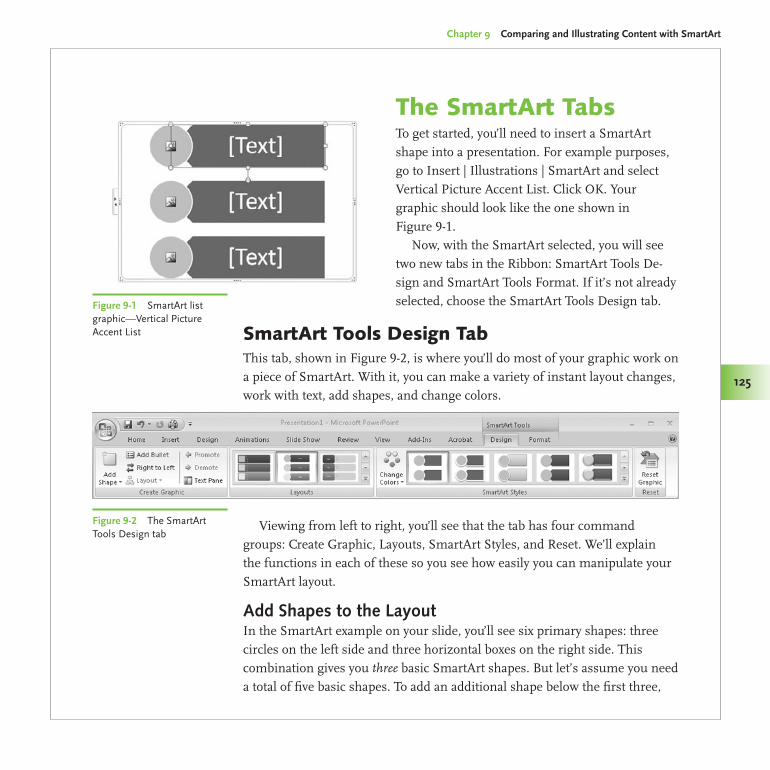
Made Easy/PowerPoint 2007 Graphics & Animation/Slack/0071600760/Chapter 9
Chapter 9 Comparing and Illustrating Content with SmartArt
125
The SmartArt TabsTo get started, you’ll need to insert a SmartArt shape into a presentation. For example purposes, go to Insert | Illustrations | SmartArt and select Vertical Picture Accent List. Click OK. Your graphic should look like the one shown in Figure 9-1.
Now, with the SmartArt selected, you will see two new tabs in the Ribbon: SmartArt Tools De-sign and SmartArt Tools Format. If it’s not already selected, choose the SmartArt Tools Design tab.
SmartArt Tools Design TabThis tab, shown in Figure 9-2, is where you’ll do most of your graphic work on a piece of SmartArt. With it, you can make a variety of instant layout changes, work with text, add shapes, and change colors.
Viewing from left to right, you’ll see that the tab has four command groups: Create Graphic, Layouts, SmartArt Styles, and Reset. We’ll explain the functions in each of these so you see how easily you can manipulate your SmartArt layout.
Add Shapes to the LayoutIn the SmartArt example on your slide, you’ll see six primary shapes: three circles on the left side and three horizontal boxes on the right side. This combination gives you three basic SmartArt shapes. But let’s assume you need a total of five basic shapes. To add an additional shape below the first three,
Figure 9-1 SmartArt list graphic—Vertical Picture Accent List
Figure 9-2 The SmartArt Tools Design tab
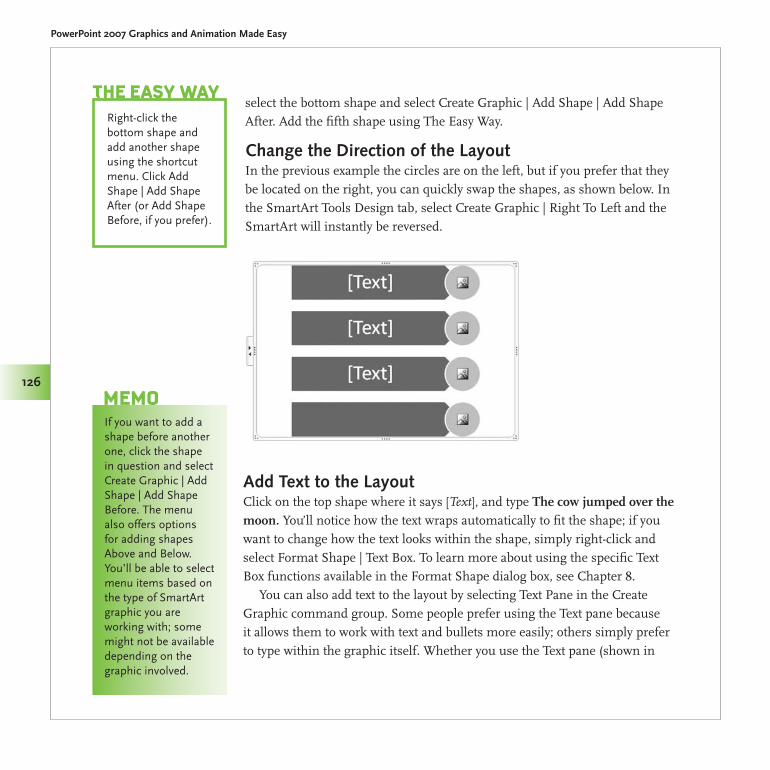
Made Easy/PowerPoint 2007 Graphics & Animation/Slack/0071600760/Chapter 9
PowerPoint 2007 Graphics and Animation Made Easy
126
select the bottom shape and select Create Graphic | Add Shape | Add Shape After. Add the fifth shape using The Easy Way.
Change the Direction of the LayoutIn the previous example the circles are on the left, but if you prefer that they be located on the right, you can quickly swap the shapes, as shown below. In the SmartArt Tools Design tab, select Create Graphic | Right To Left and the SmartArt will instantly be reversed.
Add Text to the LayoutClick on the top shape where it says [Text], and type The cow jumped over the moon. You’ll notice how the text wraps automatically to fit the shape; if you want to change how the text looks within the shape, simply right-click and select Format Shape | Text Box. To learn more about using the specific Text Box functions available in the Format Shape dialog box, see Chapter 8.
You can also add text to the layout by selecting Text Pane in the Create Graphic command group. Some people prefer using the Text pane because it allows them to work with text and bullets more easily; others simply prefer to type within the graphic itself. Whether you use the Text pane (shown in
Right-click the bottom shape and add another shape using the shortcut menu. Click Add Shape | Add Shape After (or Add Shape Before, if you prefer).
The easy Way
If you want to add a shape before another one, click the shape in question and select Create Graphic | Add Shape | Add Shape Before. The menu also offers options for adding shapes Above and Below. You’ll be able to select menu items based on the type of SmartArt graphic you are working with; some might not be available depending on the graphic involved.
MeMo
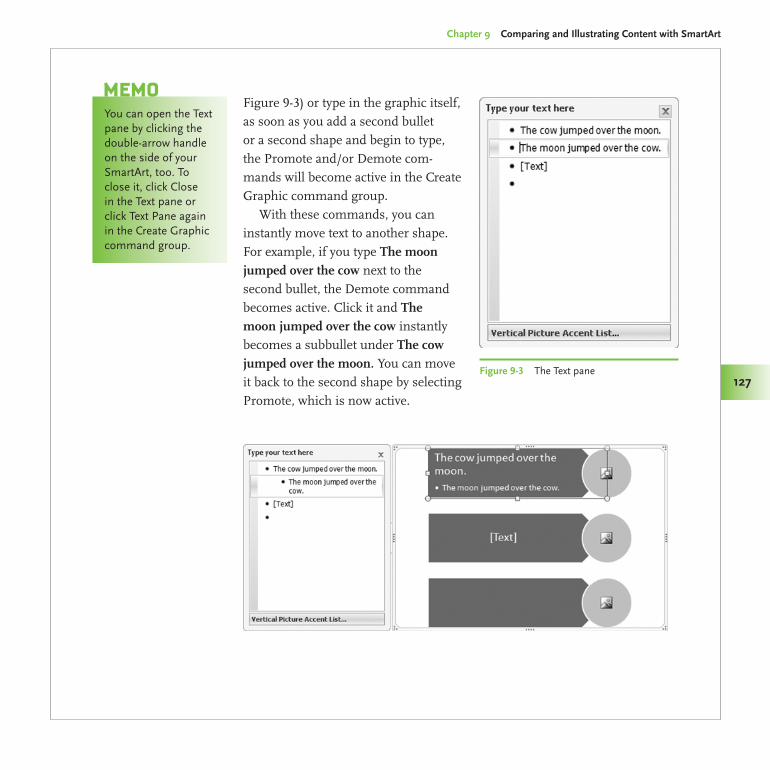
Made Easy/PowerPoint 2007 Graphics & Animation/Slack/0071600760/Chapter 9
Chapter 9 Comparing and Illustrating Content with SmartArt
127
Figure 9-3) or type in the graphic itself, as soon as you add a second bullet or a second shape and begin to type, the Promote and/or Demote com-mands will become active in the Create Graphic command group.
With these commands, you can instantly move text to another shape. For example, if you type The moon jumped over the cow next to the second bullet, the Demote command becomes active. Click it and The moon jumped over the cow instantly becomes a subbullet under The cow jumped over the moon. You can move it back to the second shape by selecting Promote, which is now active.
Figure 9-3 The Text pane
You can open the Text pane by clicking the double-arrow handle on the side of your SmartArt, too. To close it, click Close in the Text pane or click Text Pane again in the Create Graphic command group.
memo
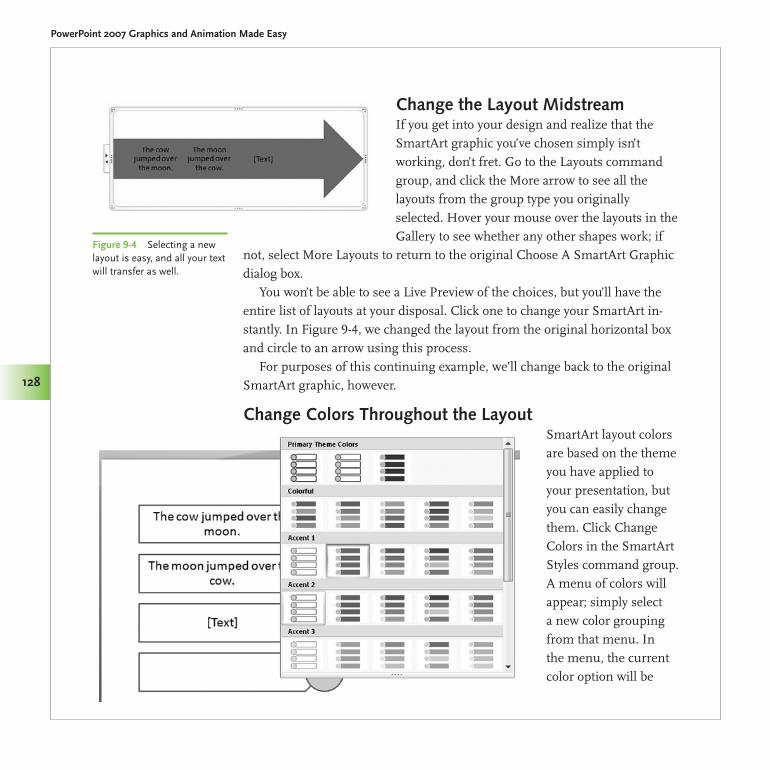
Made Easy/PowerPoint 2007 Graphics & Animation/Slack/0071600760/Chapter 9
PowerPoint 2007 Graphics and Animation Made Easy
128
Change the Layout MidstreamIf you get into your design and realize that the SmartArt graphic you’ve chosen simply isn’t working, don’t fret. Go to the Layouts command group, and click the More arrow to see all the layouts from the group type you originally selected. Hover your mouse over the layouts in the Gallery to see whether any other shapes work; if
not, select More Layouts to return to the original Choose A SmartArt Graphic dialog box.
You won’t be able to see a Live Preview of the choices, but you’ll have the entire list of layouts at your disposal. Click one to change your SmartArt in-stantly. In Figure 9-4, we changed the layout from the original horizontal box and circle to an arrow using this process.
For purposes of this continuing example, we’ll change back to the original SmartArt graphic, however.
Change Colors Throughout the LayoutSmartArt layout colors are based on the theme you have applied to your presentation, but you can easily change them. Click Change Colors in the SmartArt Styles command group. A menu of colors will appear; simply select a new color grouping from that menu. In the menu, the current color option will be
Figure 9-4 Selecting a new layout is easy, and all your text will transfer as well.
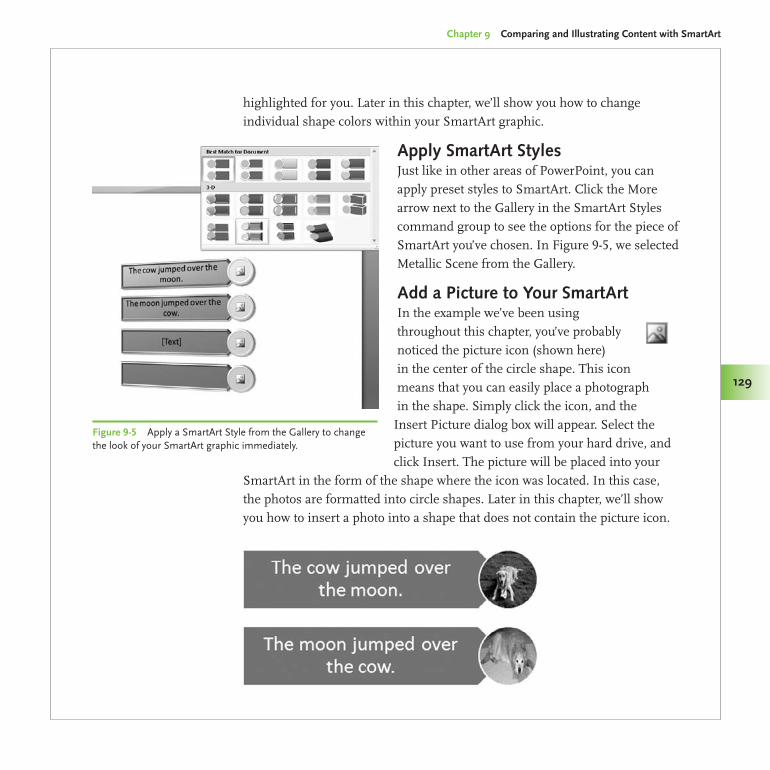
Made Easy/PowerPoint 2007 Graphics & Animation/Slack/0071600760/Chapter 9
Chapter 9 Comparing and Illustrating Content with SmartArt
129
highlighted for you. Later in this chapter, we’ll show you how to change individual shape colors within your SmartArt graphic.
Apply SmartArt StylesJust like in other areas of PowerPoint, you can apply preset styles to SmartArt. Click the More arrow next to the Gallery in the SmartArt Styles command group to see the options for the piece of SmartArt you’ve chosen. In Figure 9-5, we selected Metallic Scene from the Gallery.
Add a Picture to Your SmartArtIn the example we’ve been using throughout this chapter, you’ve probably noticed the picture icon (shown here) in the center of the circle shape. This icon means that you can easily place a photograph in the shape. Simply click the icon, and the
Insert Picture dialog box will appear. Select the picture you want to use from your hard drive, and click Insert. The picture will be placed into your
SmartArt in the form of the shape where the icon was located. In this case, the photos are formatted into circle shapes. Later in this chapter, we’ll show you how to insert a photo into a shape that does not contain the picture icon.
Figure 9-5 Apply a SmartArt Style from the Gallery to change the look of your SmartArt graphic immediately.
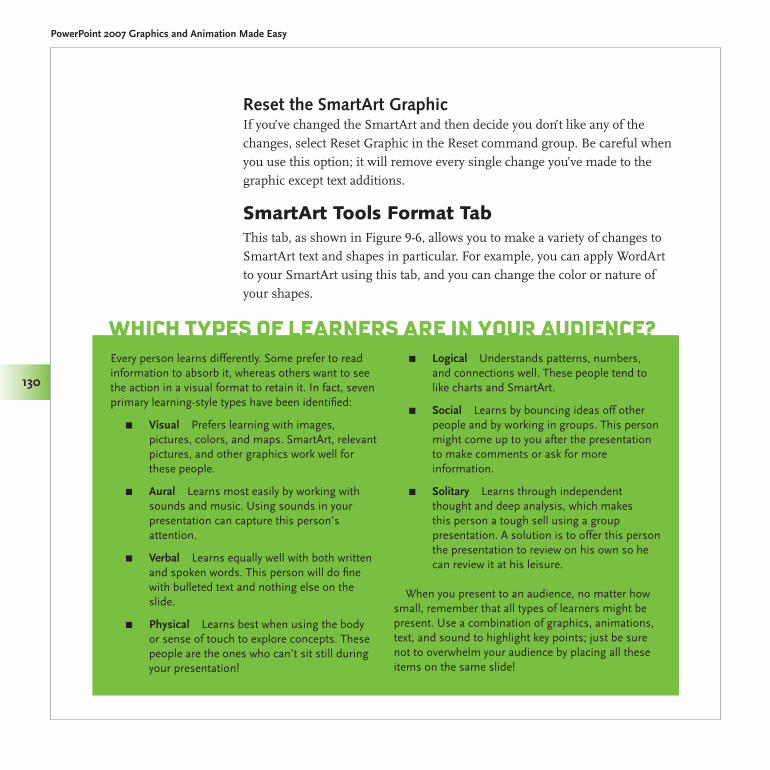
Made Easy/PowerPoint 2007 Graphics & Animation/Slack/0071600760/Chapter 9
PowerPoint 2007 Graphics and Animation Made Easy
130
Reset the SmartArt GraphicIf you’ve changed the SmartArt and then decide you don’t like any of the changes, select Reset Graphic in the Reset command group. Be careful when you use this option; it will remove every single change you’ve made to the graphic except text additions.
SmartArt Tools Format TabThis tab, as shown in Figure 9-6, allows you to make a variety of changes to SmartArt text and shapes in particular. For example, you can apply WordArt to your SmartArt using this tab, and you can change the color or nature of your shapes.
Every person learns differently. Some prefer to read information to absorb it, whereas others want to see the action in a visual format to retain it. In fact, seven primary learning-style types have been identified:
Visual π Prefers learning with images, pictures, colors, and maps. SmartArt, relevant pictures, and other graphics work well for these people.
Aural π Learns most easily by working with sounds and music. Using sounds in your presentation can capture this person’s attention.
Verbal π Learns equally well with both written and spoken words. This person will do fine with bulleted text and nothing else on the slide.
Physical π Learns best when using the body or sense of touch to explore concepts. These people are the ones who can’t sit still during your presentation!
Logical π Understands patterns, numbers, and connections well. These people tend to like charts and SmartArt.
Social π Learns by bouncing ideas off other people and by working in groups. This person might come up to you after the presentation to make comments or ask for more information.
Solitary π Learns through independent thought and deep analysis, which makes this person a tough sell using a group presentation. A solution is to offer this person the presentation to review on his own so he can review it at his leisure.
When you present to an audience, no matter how small, remember that all types of learners might be present. Use a combination of graphics, animations, text, and sound to highlight key points; just be sure not to overwhelm your audience by placing all these items on the same slide!
WhiCh typeS of LearnerS are in your audienCe?
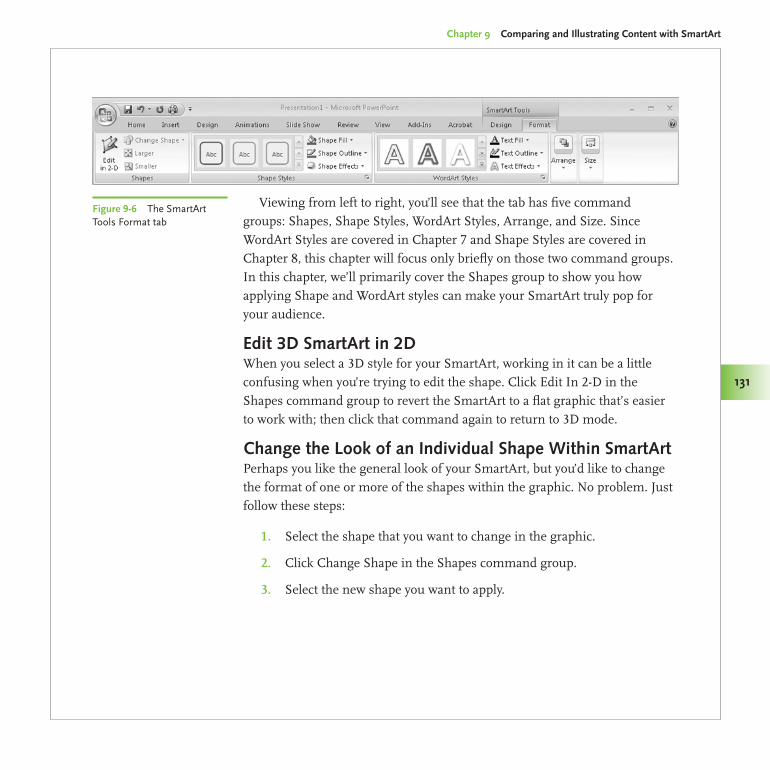
Made Easy/PowerPoint 2007 Graphics & Animation/Slack/0071600760/Chapter 9
Chapter 9 Comparing and Illustrating Content with SmartArt
131
Viewing from left to right, you’ll see that the tab has five command groups: Shapes, Shape Styles, WordArt Styles, Arrange, and Size. Since WordArt Styles are covered in Chapter 7 and Shape Styles are covered in Chapter 8, this chapter will focus only briefly on those two command groups. In this chapter, we’ll primarily cover the Shapes group to show you how applying Shape and WordArt styles can make your SmartArt truly pop for your audience.
Edit 3D SmartArt in 2DWhen you select a 3D style for your SmartArt, working in it can be a little confusing when you’re trying to edit the shape. Click Edit In 2-D in the Shapes command group to revert the SmartArt to a flat graphic that’s easier to work with; then click that command again to return to 3D mode.
Change the Look of an Individual Shape Within SmartArtPerhaps you like the general look of your SmartArt, but you’d like to change the format of one or more of the shapes within the graphic. No problem. Just follow these steps:
Select the shape that you want to change in the graphic.1.
Click Change Shape in the Shapes command group.2.
Select the new shape you want to apply.3.
Figure 9-6 The SmartArt Tools Format tab
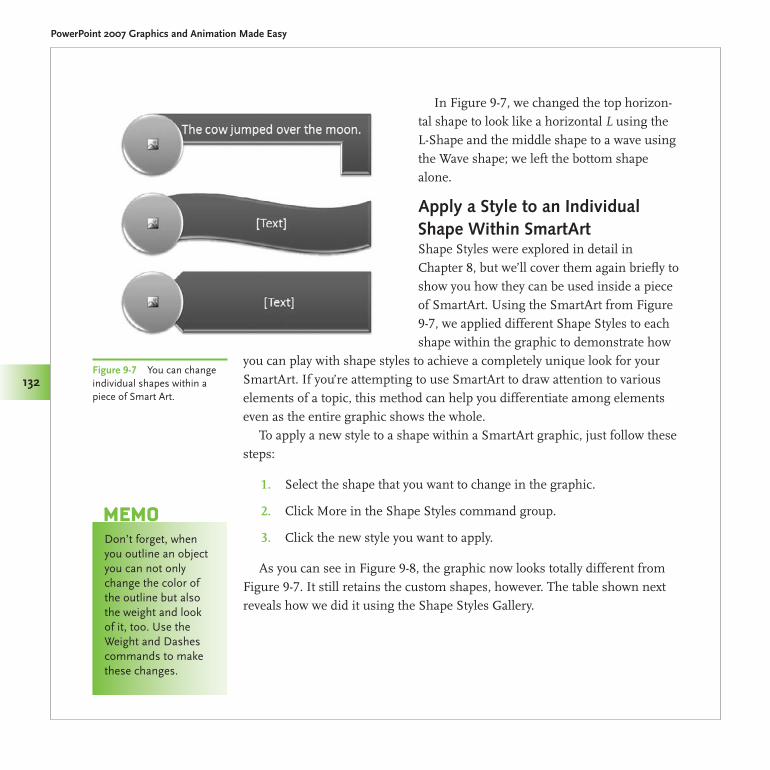
Made Easy/PowerPoint 2007 Graphics & Animation/Slack/0071600760/Chapter 9
PowerPoint 2007 Graphics and Animation Made Easy
132
In Figure 9-7, we changed the top horizon-tal shape to look like a horizontal L using the L-Shape and the middle shape to a wave using the Wave shape; we left the bottom shape alone.
Apply a Style to an Individual Shape Within SmartArtShape Styles were explored in detail in Chapter 8, but we’ll cover them again briefly to show you how they can be used inside a piece of SmartArt. Using the SmartArt from Figure 9-7, we applied different Shape Styles to each shape within the graphic to demonstrate how
you can play with shape styles to achieve a completely unique look for your SmartArt. If you’re attempting to use SmartArt to draw attention to various elements of a topic, this method can help you differentiate among elements even as the entire graphic shows the whole.
To apply a new style to a shape within a SmartArt graphic, just follow these steps:
Select the shape that you want to change in the graphic.1.
Click More in the Shape Styles command group.2.
Click the new style you want to apply.3.
As you can see in Figure 9-8, the graphic now looks totally different from Figure 9-7. It still retains the custom shapes, however. The table shown next reveals how we did it using the Shape Styles Gallery.
Don’t forget, when you outline an object you can not only change the color of the outline but also the weight and look of it, too. Use the Weight and Dashes commands to make these changes.
memo
Figure 9-7 You can change individual shapes within a piece of Smart Art.
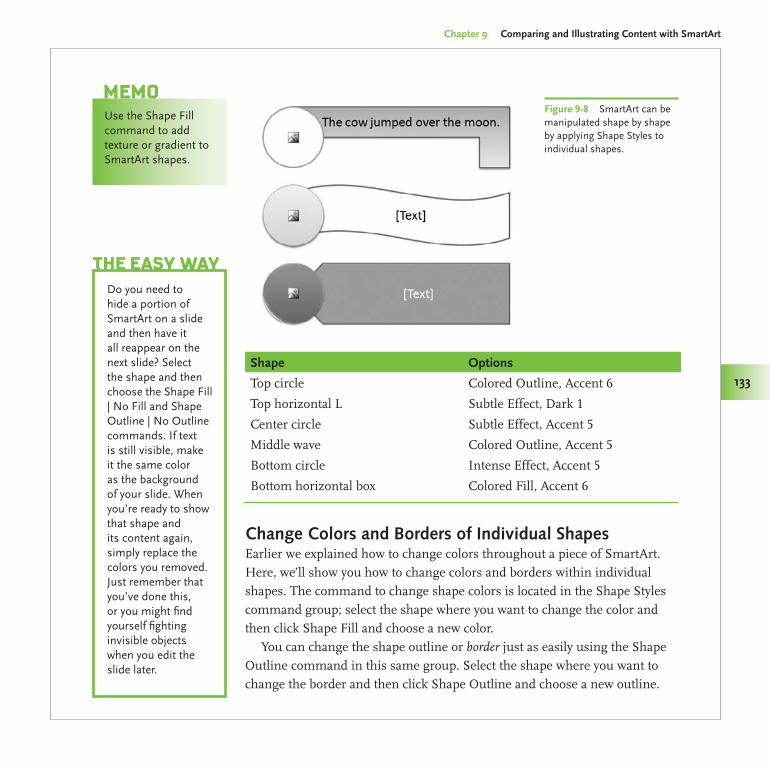
Chapter 9 Comparing and Illustrating Content with SmartArt
133
Made Easy/PowerPoint 2007 Graphics & Animation/Slack/0071600760/Chapter 9
133Shape Options
Top circle Colored Outline, Accent 6
Top horizontal L Subtle Effect, Dark 1
Center circle Subtle Effect, Accent 5
Middle wave Colored Outline, Accent 5
Bottom circle Intense Effect, Accent 5
Bottom horizontal box Colored Fill, Accent 6
Change Colors and Borders of Individual ShapesEarlier we explained how to change colors throughout a piece of SmartArt. Here, we’ll show you how to change colors and borders within individual shapes. The command to change shape colors is located in the Shape Styles command group; select the shape where you want to change the color and then click Shape Fill and choose a new color.
You can change the shape outline or border just as easily using the Shape Outline command in this same group. Select the shape where you want to change the border and then click Shape Outline and choose a new outline.
Use the Shape Fill command to add texture or gradient to SmartArt shapes.
memoFigure 9-8 SmartArt can be manipulated shape by shape by applying Shape Styles to individual shapes.
Do you need to hide a portion of SmartArt on a slide and then have it all reappear on the next slide? Select the shape and then choose the Shape Fill | No Fill and Shape Outline | No Outline commands. If text is still visible, make it the same color as the background of your slide. When you’re ready to show that shape and its content again, simply replace the colors you removed. Just remember that you’ve done this, or you might find yourself fighting invisible objects when you edit the slide later.
the eaSy Way
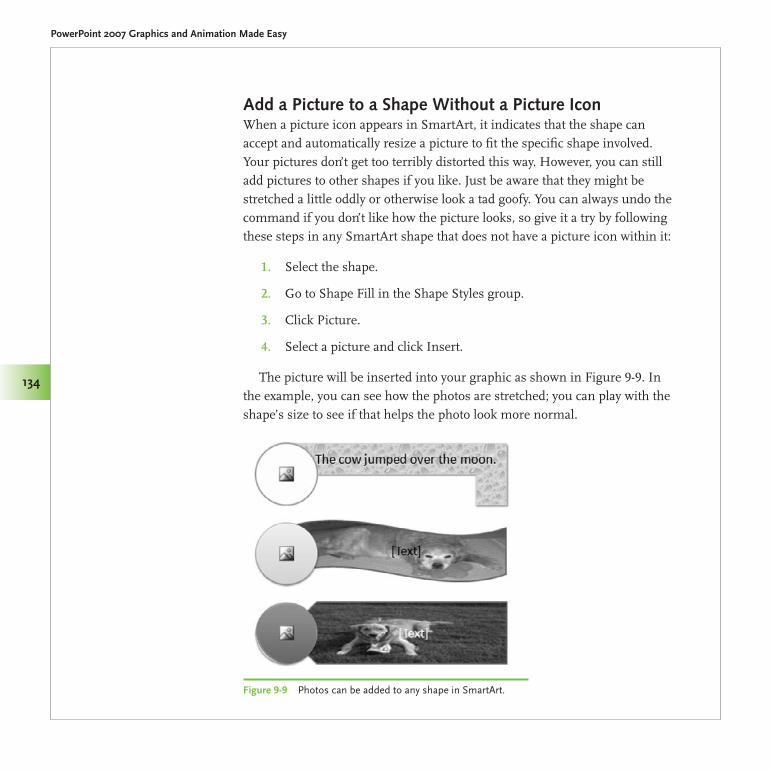
PowerPoint 2007 Graphics and Animation Made Easy
134
Made Easy/PowerPoint 2007 Graphics & Animation/Slack/0071600760/Chapter 9
Add a Picture to a Shape Without a Picture IconWhen a picture icon appears in SmartArt, it indicates that the shape can accept and automatically resize a picture to fit the specific shape involved. Your pictures don’t get too terribly distorted this way. However, you can still add pictures to other shapes if you like. Just be aware that they might be stretched a little oddly or otherwise look a tad goofy. You can always undo the command if you don’t like how the picture looks, so give it a try by following these steps in any SmartArt shape that does not have a picture icon within it:
Select the shape.1.
Go to Shape Fill in the Shape Styles group.2.
Click Picture.3.
Select a picture and click Insert.4.
The picture will be inserted into your graphic as shown in Figure 9-9. In the example, you can see how the photos are stretched; you can play with the shape’s size to see if that helps the photo look more normal.
Figure 9-9 Photos can be added to any shape in SmartArt.
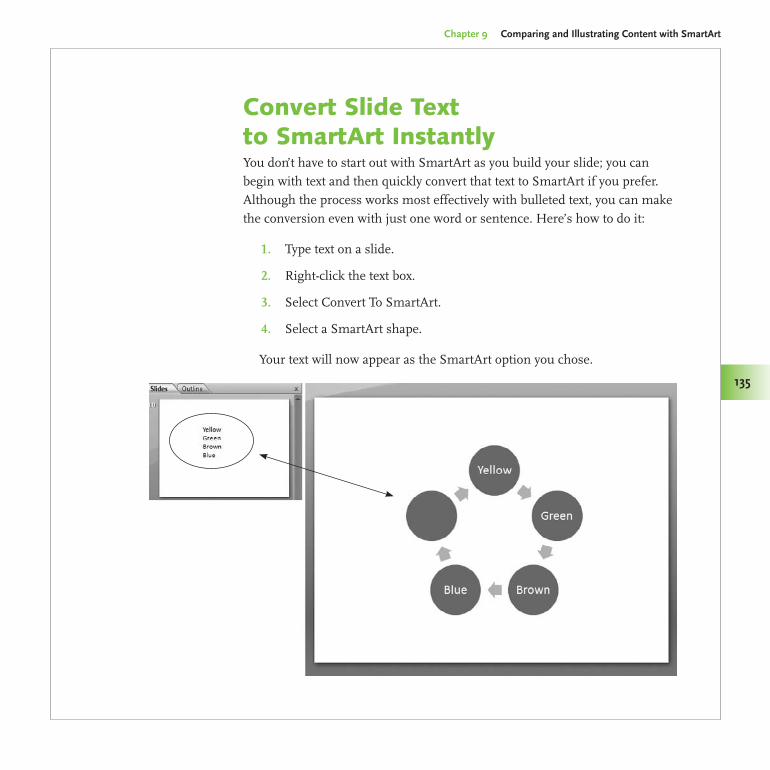
Chapter 9 Comparing and Illustrating Content with SmartArt
135
Made Easy/PowerPoint 2007 Graphics & Animation/Slack/0071600760/Chapter 9
Convert Slide Text to SmartArt InstantlyYou don’t have to start out with SmartArt as you build your slide; you can begin with text and then quickly convert that text to SmartArt if you prefer. Although the process works most effectively with bulleted text, you can make the conversion even with just one word or sentence. Here’s how to do it:
Type text on a slide.1.
Right-click the text box.2.
Select Convert To SmartArt.3.
Select a SmartArt shape.4.
Your text will now appear as the SmartArt option you chose.
PowerPoint 2007 Graphics and Animation Made Easy
136
Made Easy/PowerPoint 2007 Graphics & Animation/Slack/0071600760/Chapter 9
Animating with SmartArtAll right, so now we get to the true fun of SmartArt: animation. Although we’ll explain animation in more detail in Chapter 12, we’ll show you a few things you can do with SmartArt right now. You can animate SmartArt just like you would animate almost any other object, but here are a few caveats:
First, the order in which the shapes appear in your SmartArt will π
dictate the order in which the animation plays. You can’t pick and choose which shapes will animate at a particular time, although you can, of course, reverse your entire SmartArt graphic to animate it in reverse if you like.
Second, treat each SmartArt graphic as the unique item it is. π
Animations will occur in different ways given the type of SmartArt involved, so we can’t possibly explain all the different combinations in a few paragraphs. When you first begin animating SmartArt, allow yourself some extra time to play around. But don’t try to figure it all out when you’ve got a heavy deadline for your presentation.
Third, connecting lines between SmartArt shapes will not animate π
individually—they always associate with the second shape. Don’t bother trying to change it; you’ll just waste a lot of precious time on something that can’t be done.
Finally, use caution when you’re working with diagrams created in π
earlier versions of PowerPoint. If those diagrams have been converted to SmartArt and animation is applied, the animation might get pretty funky. You can try—it does work sometimes—but if you start having trouble, we recommend just starting over from scratch or ditching the animation for that particular object.
Connecting lines connect two shapes and stay connected to those shapes. They will have connection points at each end and appear as red dots. The dots show you where you can attach a connecting line to a shape. You can reroute connecting lines to make more direct connections if you wish. To do that, go to the Drawing Tools Format tab and the Insert Shapes command group. Select | Edit Shape | Reroute Connectors or you can manually move the connectors as needed.
memo
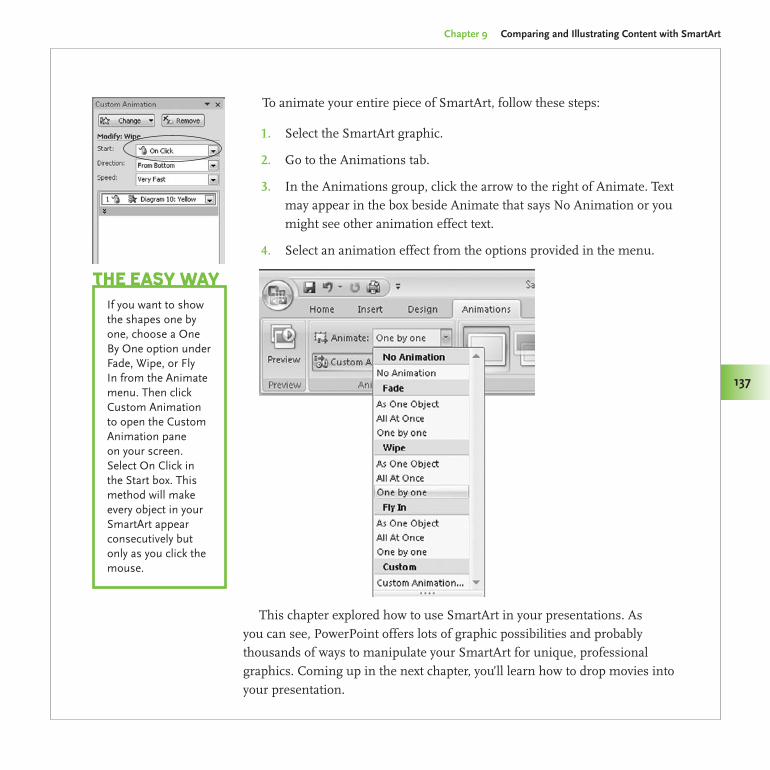
Chapter 9 Comparing and Illustrating Content with SmartArt
137
Made Easy/PowerPoint 2007 Graphics & Animation/Slack/0071600760/Chapter 9
To animate your entire piece of SmartArt, follow these steps:
Select the SmartArt graphic.1.
Go to the Animations tab.2.
In the Animations group, click the arrow to the right of Animate. Text 3. may appear in the box beside Animate that says No Animation or you might see other animation effect text.
Select an animation effect from the options provided in the menu.4.
If you want to show the shapes one by one, choose a One By One option under Fade, Wipe, or Fly In from the Animate menu. Then click Custom Animation to open the Custom Animation pane on your screen. Select On Click in the Start box. This method will make every object in your SmartArt appear consecutively but only as you click the mouse.
the eaSy Way
This chapter explored how to use SmartArt in your presentations. As you can see, PowerPoint offers lots of graphic possibilities and probably thousands of ways to manipulate your SmartArt for unique, professional graphics. Coming up in the next chapter, you’ll learn how to drop movies into your presentation.

This page intentionally left blank
Adding a Movie to Your PresentationMovies in PowerPoint 2007 can really spice up your presentation. With all the technology available to us today, why not use it to your advantage? This chapter on movies, along with the next chapter on sound, will keep all eyes—and ears—on your presentation. The more ways you present the information, the better the chance your audience will comprehend and remember it.10
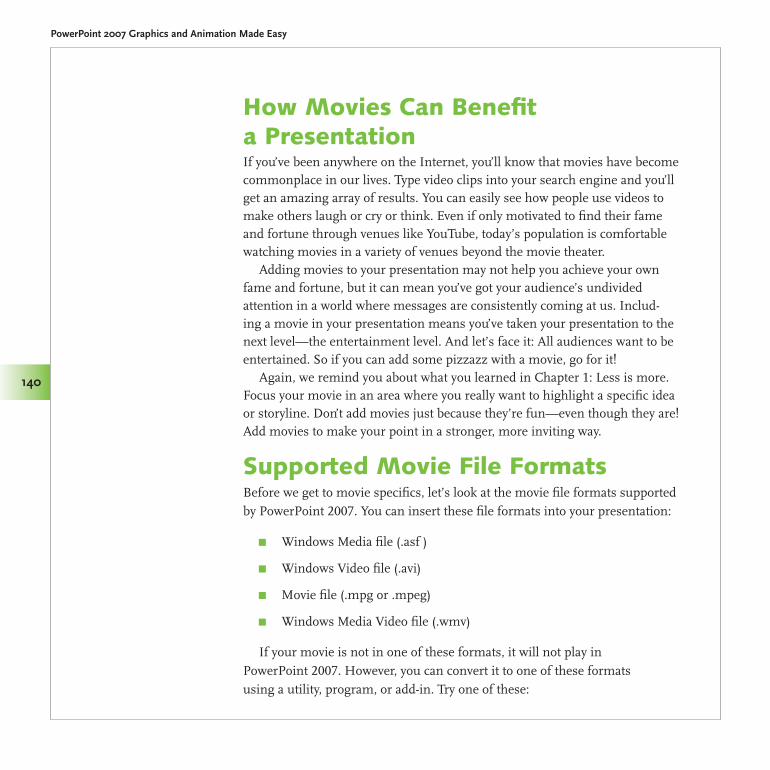
Made Easy/PowerPoint 2007 Graphics & Animation/Slack/0071600760/Chapter 10
PowerPoint 2007 Graphics and Animation Made Easy
140
How Movies Can Benefit a PresentationIf you’ve been anywhere on the Internet, you’ll know that movies have become commonplace in our lives. Type video clips into your search engine and you’ll get an amazing array of results. You can easily see how people use videos to make others laugh or cry or think. Even if only motivated to find their fame and fortune through venues like YouTube, today’s population is comfortable watching movies in a variety of venues beyond the movie theater.
Adding movies to your presentation may not help you achieve your own fame and fortune, but it can mean you’ve got your audience’s undivided attention in a world where messages are consistently coming at us. Includ-ing a movie in your presentation means you’ve taken your presentation to the next level—the entertainment level. And let’s face it: All audiences want to be entertained. So if you can add some pizzazz with a movie, go for it!
Again, we remind you about what you learned in Chapter 1: Less is more. Focus your movie in an area where you really want to highlight a specific idea or storyline. Don’t add movies just because they’re fun—even though they are! Add movies to make your point in a stronger, more inviting way.
Supported Movie File FormatsBefore we get to movie specifics, let’s look at the movie file formats supported by PowerPoint 2007. You can insert these file formats into your presentation:
Windows Media file (.asf ) π
Windows Video file (.avi) π
Movie file (.mpg or .mpeg) π
Windows Media Video file (.wmv) π
If your movie is not in one of these formats, it will not play in PowerPoint 2007. However, you can convert it to one of these formats using a utility, program, or add-in. Try one of these:
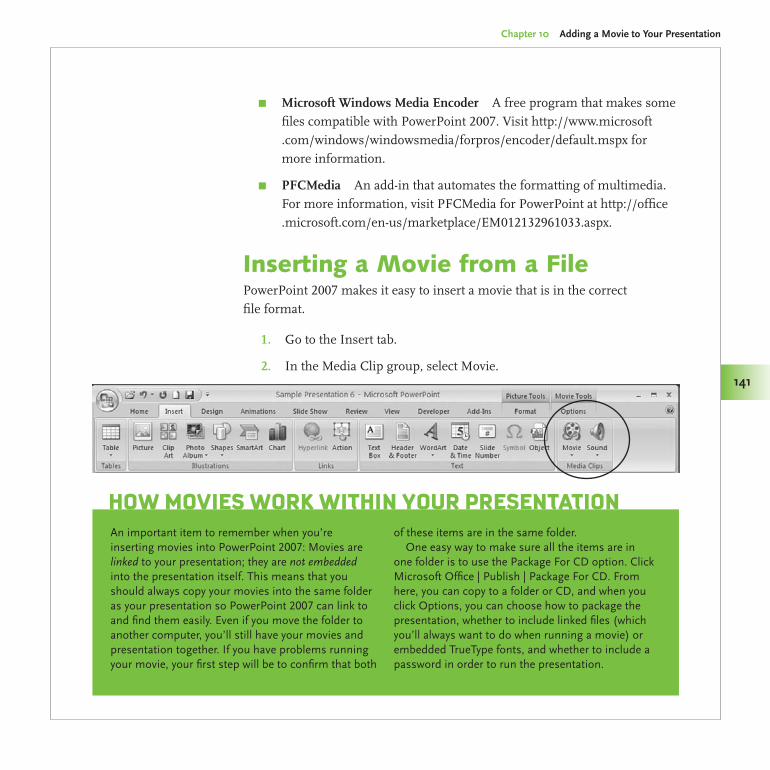
Made Easy/PowerPoint 2007 Graphics & Animation/Slack/0071600760/Chapter 10
Chapter 10 Adding a Movie to Your Presentation
141
Microsoft Windows Media Encoder π A free program that makes some files compatible with PowerPoint 2007. Visit http://www.microsoft .com/windows/windowsmedia/forpros/encoder/default.mspx for more information.
PFCMedia π An add-in that automates the formatting of multimedia. For more information, visit PFCMedia for PowerPoint at http://office .microsoft.com/en-us/marketplace/EM012132961033.aspx.
Inserting a Movie from a FilePowerPoint 2007 makes it easy to insert a movie that is in the correct file format.
Go to the Insert tab.1.
In the Media Clip group, select Movie.2.
An important item to remember when you’re inserting movies into PowerPoint 2007: Movies are linked to your presentation; they are not embedded into the presentation itself. This means that you should always copy your movies into the same folder as your presentation so PowerPoint 2007 can link to and find them easily. Even if you move the folder to another computer, you’ll still have your movies and presentation together. If you have problems running your movie, your first step will be to confirm that both
of these items are in the same folder.One easy way to make sure all the items are in
one folder is to use the Package For CD option. Click Microsoft Office | Publish | Package For CD. From here, you can copy to a folder or CD, and when you click Options, you can choose how to package the presentation, whether to include linked files (which you’ll always want to do when running a movie) or embedded TrueType fonts, and whether to include a password in order to run the presentation.
How Movies work witHin Your Presentation
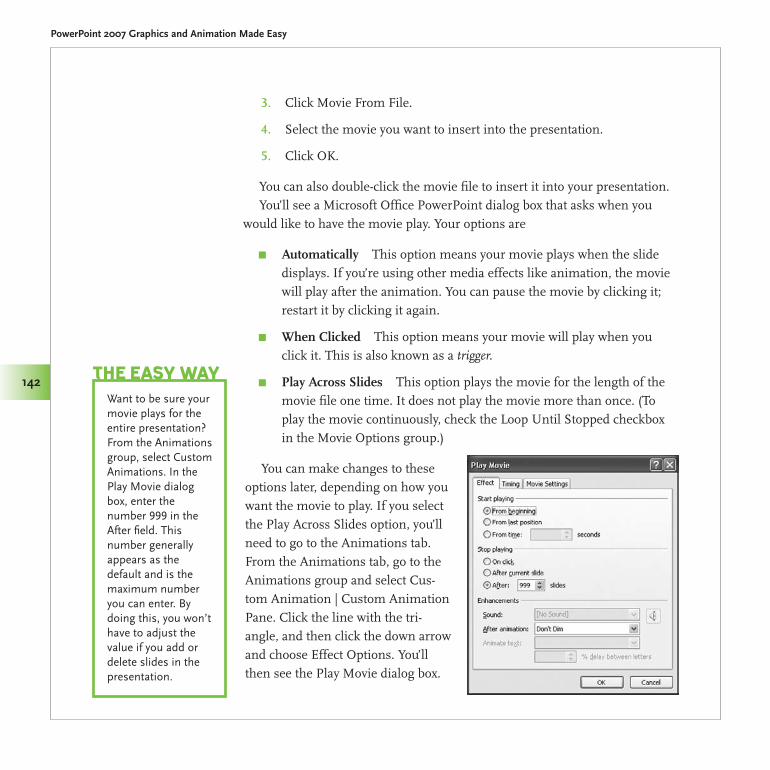
Made Easy/PowerPoint 2007 Graphics & Animation/Slack/0071600760/Chapter 10
PowerPoint 2007 Graphics and Animation Made Easy
142
Click Movie From File.3.
Select the movie you want to insert into the presentation.4.
Click OK.5.
You can also double-click the movie file to insert it into your presentation.You’ll see a Microsoft Office PowerPoint dialog box that asks when you
would like to have the movie play. Your options are
Automatically π This option means your movie plays when the slide displays. If you’re using other media effects like animation, the movie will play after the animation. You can pause the movie by clicking it; restart it by clicking it again.
When Clicked π This option means your movie will play when you click it. This is also known as a trigger.
Play Across Slides π This option plays the movie for the length of the movie file one time. It does not play the movie more than once. (To play the movie continuously, check the Loop Until Stopped checkbox in the Movie Options group.)
You can make changes to these options later, depending on how you want the movie to play. If you select the Play Across Slides option, you’ll need to go to the Animations tab. From the Animations tab, go to the Animations group and select Cus-tom Animation | Custom Animation Pane. Click the line with the tri-angle, and then click the down arrow and choose Effect Options. You’ll then see the Play Movie dialog box.
Want to be sure your movie plays for the entire presentation? From the Animations group, select Custom Animations. In the Play Movie dialog box, enter the number 999 in the After field. This number generally appears as the default and is the maximum number you can enter. By doing this, you won’t have to adjust the value if you add or delete slides in the presentation.
tHe easY waY
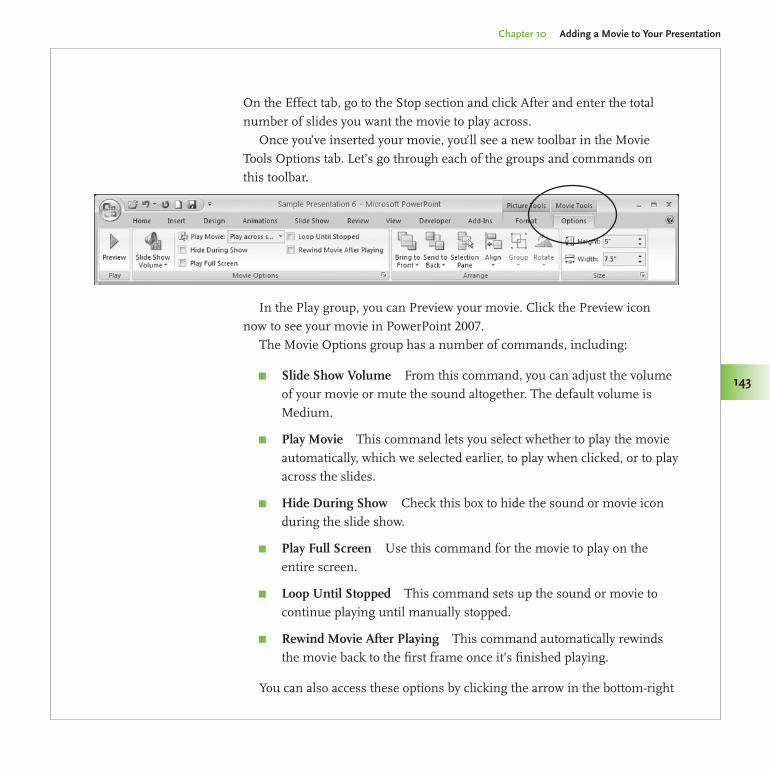
Chapter 10 Adding a Movie to Your Presentation
143
Made Easy/PowerPoint 2007 Graphics & Animation/Slack/0071600760/Chapter 10
143
On the Effect tab, go to the Stop section and click After and enter the total number of slides you want the movie to play across.
Once you’ve inserted your movie, you’ll see a new toolbar in the Movie Tools Options tab. Let’s go through each of the groups and commands on this toolbar.
In the Play group, you can Preview your movie. Click the Preview icon now to see your movie in PowerPoint 2007.
The Movie Options group has a number of commands, including:
Slide Show Volume π From this command, you can adjust the volume of your movie or mute the sound altogether. The default volume is Medium.
Play Movie π This command lets you select whether to play the movie automatically, which we selected earlier, to play when clicked, or to play across the slides.
Hide During Show π Check this box to hide the sound or movie icon during the slide show.
Play Full Screen π Use this command for the movie to play on the entire screen.
Loop Until Stopped π This command sets up the sound or movie to continue playing until manually stopped.
Rewind Movie After Playing π This command automatically rewinds the movie back to the first frame once it’s finished playing.
You can also access these options by clicking the arrow in the bottom-right
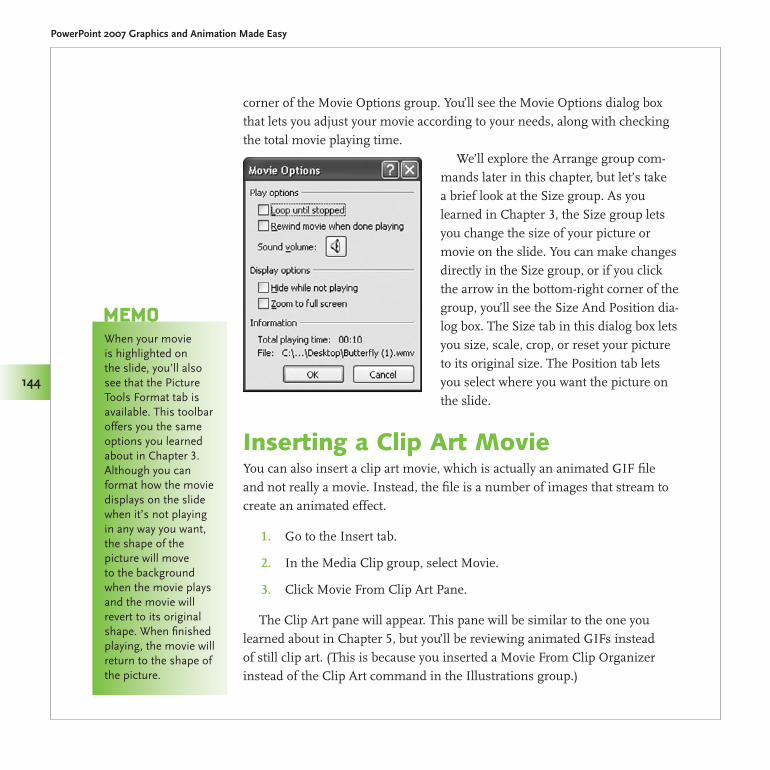
Made Easy/PowerPoint 2007 Graphics & Animation/Slack/0071600760/Chapter 10
PowerPoint 2007 Graphics and Animation Made Easy
144
corner of the Movie Options group. You’ll see the Movie Options dialog box that lets you adjust your movie according to your needs, along with checking the total movie playing time.
We’ll explore the Arrange group com-mands later in this chapter, but let’s take a brief look at the Size group. As you learned in Chapter 3, the Size group lets you change the size of your picture or movie on the slide. You can make changes directly in the Size group, or if you click the arrow in the bottom-right corner of the group, you’ll see the Size And Position dia-log box. The Size tab in this dialog box lets you size, scale, crop, or reset your picture to its original size. The Position tab lets you select where you want the picture on the slide.
Inserting a Clip Art MovieYou can also insert a clip art movie, which is actually an animated GIF file and not really a movie. Instead, the file is a number of images that stream to create an animated effect.
Go to the Insert tab.1.
In the Media Clip group, select Movie.2.
Click Movie From Clip Art Pane.3.
The Clip Art pane will appear. This pane will be similar to the one you learned about in Chapter 5, but you’ll be reviewing animated GIFs instead of still clip art. (This is because you inserted a Movie From Clip Organizer instead of the Clip Art command in the Illustrations group.)
When your movie is highlighted on the slide, you’ll also see that the Picture Tools Format tab is available. This toolbar offers you the same options you learned about in Chapter 3. Although you can format how the movie displays on the slide when it’s not playing in any way you want, the shape of the picture will move to the background when the movie plays and the movie will revert to its original shape. When finished playing, the movie will return to the shape of the picture.
MeMo
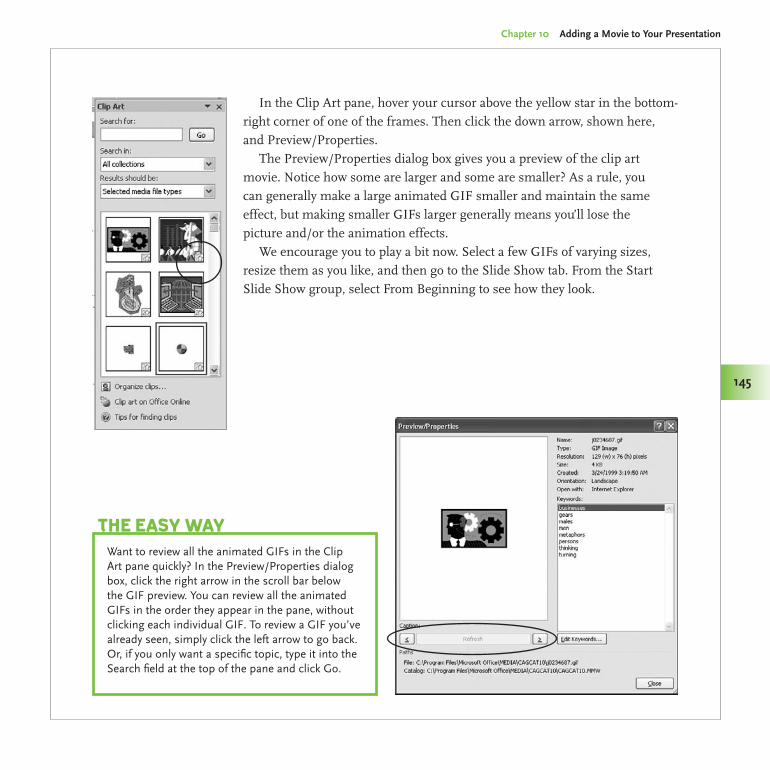
Made Easy/PowerPoint 2007 Graphics & Animation/Slack/0071600760/Chapter 10
Chapter 10 Adding a Movie to Your Presentation
145
In the Clip Art pane, hover your cursor above the yellow star in the bottom-right corner of one of the frames. Then click the down arrow, shown here, and Preview/Properties.
The Preview/Properties dialog box gives you a preview of the clip art movie. Notice how some are larger and some are smaller? As a rule, you can generally make a large animated GIF smaller and maintain the same effect, but making smaller GIFs larger generally means you’ll lose the picture and/or the animation effects.
We encourage you to play a bit now. Select a few GIFs of varying sizes, resize them as you like, and then go to the Slide Show tab. From the Start Slide Show group, select From Beginning to see how they look.
Want to review all the animated GIFs in the Clip Art pane quickly? In the Preview/Properties dialog box, click the right arrow in the scroll bar below the GIF preview. You can review all the animated GIFs in the order they appear in the pane, without clicking each individual GIF. To review a GIF you’ve already seen, simply click the left arrow to go back. Or, if you only want a specific topic, type it into the Search field at the top of the pane and click Go.
tHe easY waY
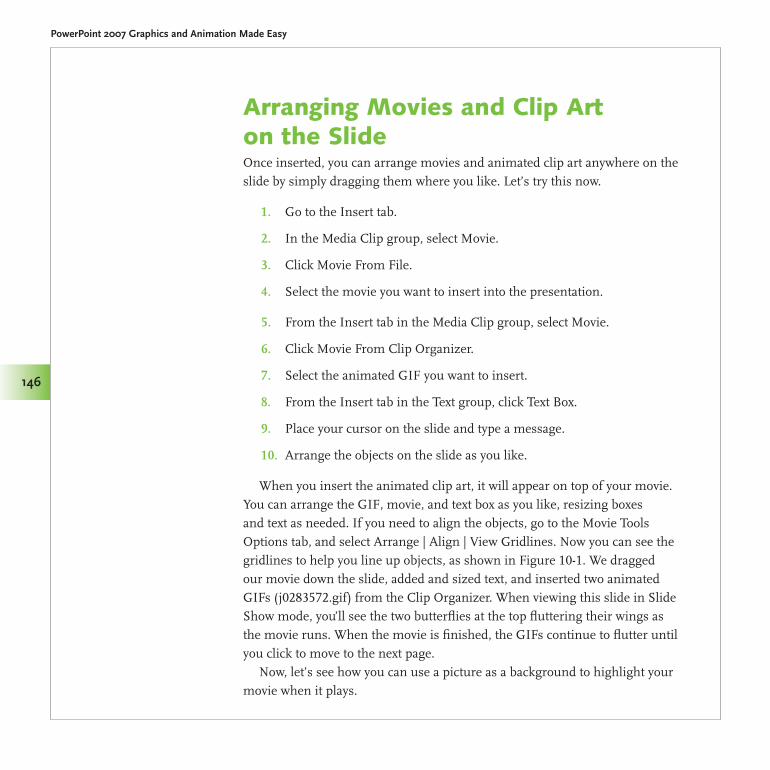
Made Easy/PowerPoint 2007 Graphics & Animation/Slack/0071600760/Chapter 10
PowerPoint 2007 Graphics and Animation Made Easy
146
Arranging Movies and Clip Art on the SlideOnce inserted, you can arrange movies and animated clip art anywhere on the slide by simply dragging them where you like. Let’s try this now.
Go to the Insert tab.1.
In the Media Clip group, select Movie.2.
Click Movie From File.3.
Select the movie you want to insert into the presentation.4.
From the Insert tab in the Media Clip group, select Movie.5.
Click Movie From Clip Organizer.6.
Select the animated GIF you want to insert.7.
From the Insert tab in the Text group, click Text Box.8.
Place your cursor on the slide and type a message.9.
Arrange the objects on the slide as you like.10.
When you insert the animated clip art, it will appear on top of your movie. You can arrange the GIF, movie, and text box as you like, resizing boxes and text as needed. If you need to align the objects, go to the Movie Tools Options tab, and select Arrange | Align | View Gridlines. Now you can see the gridlines to help you line up objects, as shown in Figure 10-1. We dragged our movie down the slide, added and sized text, and inserted two animated GIFs (j0283572.gif) from the Clip Organizer. When viewing this slide in Slide Show mode, you’ll see the two butterflies at the top fluttering their wings as the movie runs. When the movie is finished, the GIFs continue to flutter until you click to move to the next page.
Now, let’s see how you can use a picture as a background to highlight your movie when it plays.
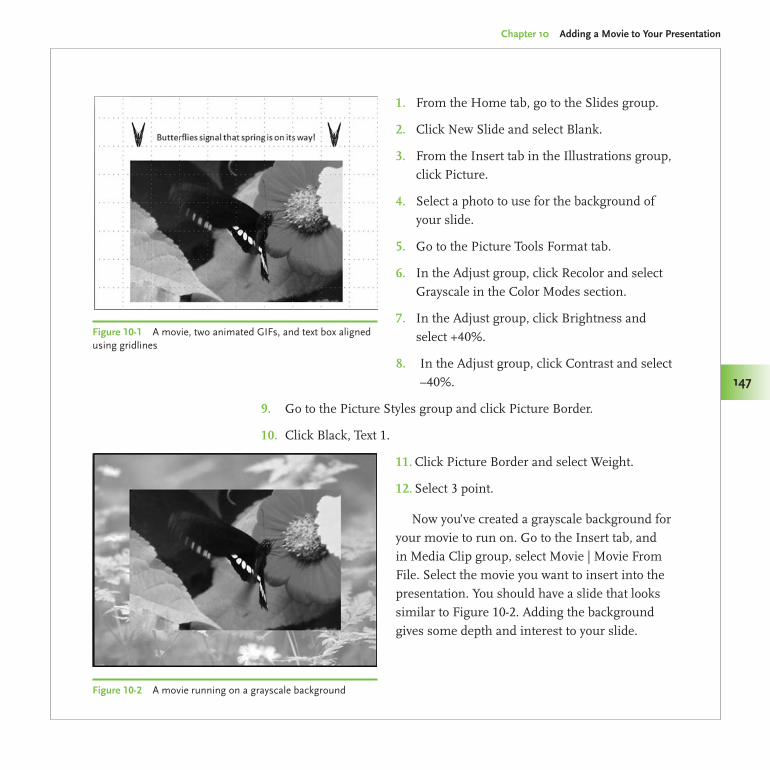
Made Easy/PowerPoint 2007 Graphics & Animation/Slack/0071600760/Chapter 10
Chapter 10 Adding a Movie to Your Presentation
147
From the Home tab, go to the Slides group.1.
Click New Slide and select Blank.2.
From the Insert tab in the Illustrations group, 3. click Picture.
Select a photo to use for the background of 4. your slide.
Go to the Picture Tools Format tab.5.
In the Adjust group, click Recolor and select 6. Grayscale in the Color Modes section.
In the Adjust group, click Brightness and 7. select +40%.
In the Adjust group, click Contrast and select 8. –40%.
Go to the Picture Styles group and click Picture Border.9.
Click Black, Text 1.10.
Click Picture Border and select Weight.11.
Select 3 point.12.
Now you’ve created a grayscale background for your movie to run on. Go to the Insert tab, and in Media Clip group, select Movie | Movie From File. Select the movie you want to insert into the presentation. You should have a slide that looks similar to Figure 10-2. Adding the background gives some depth and interest to your slide.
Figure 10-2 A movie running on a grayscale background
Figure 10-1 A movie, two animated GIFs, and text box aligned using gridlines
Made Easy/PowerPoint 2007 Graphics & Animation/Slack/0071600760/Chapter 10
PowerPoint 2007 Graphics and Animation Made Easy
148
Performance ConsiderationsWhen using movies in a PowerPoint 2007 presentation, remember that too much activity on a slide can delay or completely halt the movie’s ability to play. And using a number of movies or animated clip art items can increase your file size significantly, which could lead to performance issues as well. To improve your presentation’s performance:
Go to the Slide Show tab.1.
In the Monitors group, click the down arrow in the Resolution field.2.
Select 640×480 (Fastest, Lowest Fidelity).3.
This option speeds up the performance while lowering the fidelity of the presentation. You will need to run the slide show in its entirety to see how clarity is affected. If the change is too dramatic, you can select the Use Current Resolution option or try the other options: the 1024×768 (Slowest, Highest Fidelity), which offers a crisp image but slows down the perfor-mance, or the 800×600 option, which is the “middle ground” between the two other options.
As a reminder, if you’re sending the presentation via email, be sure to zip or compress it before sending to ensure it goes through as fast as possible.
In this chapter, you learned about when to consider movies as an option in your presentation, along with compatible file formats and conversion options. You also learned how to insert a movie or animated GIF into your presenta-tion. You also saw two examples of using animated clip art with a movie or a picture as a background to the movie. In the next chapter, you’ll learn about the many ways to use sound to enhance your presentation even more.
When selecting a picture to use for the background, be careful not to use something that competes with the movie. In Figure 10-2, the background photo has lighter, more subtle features, which makes it easier to adjust in grayscale. This type of image is better than a close up of an image with bold, well-defined lines that would detract from, not complement, the movie.
MeMo
Adding Sound to Your PresentationLike movies, sound can also add some life to your presentation. Whether you’re trying to establish a mood, offer a narration, or simply drive home an important point, sound can give some sizzle to the steak. In this chapter, you’ll learn how to insert sound files, how to start and stop the sounds, and how to set up objects and text to trigger the sounds. You’ll also learn how to add CDs and record a narration.11
Made Easy/PowerPoint 2007 Graphics & Animation/Slack/0071600760/Chapter 11
PowerPoint 2007 Graphics and Animation Made Easy
150
When Sound Is AppropriateSound is wonderful when you’re using it to help you make a point. But how many websites have you clicked on only to be greeted with blaring sound because you forgot to turn down the volume? Startling, isn’t it?
That’s why being prudent with sound is your best bet. If you’re unveiling something new and different, a drum roll is appropriate. If you’ve achieved a significant company goal or objective, a little applause is in order. Or if you want some soothing background music during your presentation, sound can do the trick in helping communicate your message.
The bottom line is to use sound for specific reasons that enhance your presentation and make your messages memorable.
Supported Sound File FormatsPowerPoint 2007 supports the following sound file formats:
AIFF audio file π Audio Interchange File Format (.aiff)
AU audio file π Unix Audio (.au)
MIDI file π Musical Instrument Digital Interface (.mid or .midi)
MP3 audio file π MPEG Audio Layer 3 (.mp3)
Windows audio file π Wave Form (.wav)
Windows Media audio file π Windows Media Audio (.wma)
If your sound file is not in one of these formats, it will not play in Power-Point 2007. However, you can convert it to one of these formats using a utility, program, or add-in such as:
Microsoft Windows Media Encoder, a free program that makes some π
files compatible with PowerPoint 2007. Visit http://www.microsoft .com/windows/windowsmedia/forpros/encoder/default.mspx for more information.
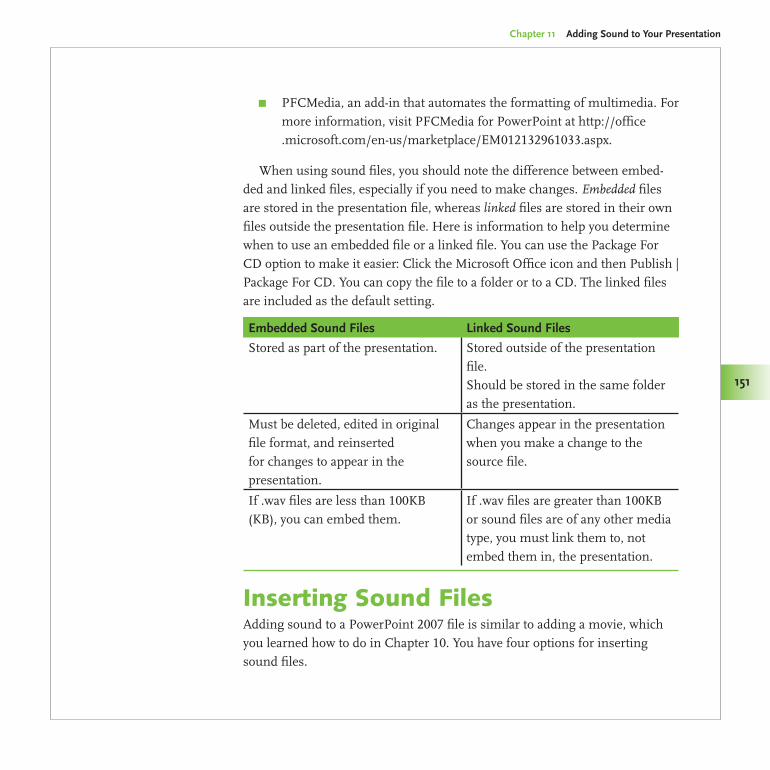
Made Easy/PowerPoint 2007 Graphics & Animation/Slack/0071600760/Chapter 10
Chapter 11 Adding Sound to Your Presentation
151
PFCMedia, an add-in that automates the formatting of multimedia. For π
more information, visit PFCMedia for PowerPoint at http://office .microsoft.com/en-us/marketplace/EM012132961033.aspx.
When using sound files, you should note the difference between embed-ded and linked files, especially if you need to make changes. Embedded files are stored in the presentation file, whereas linked files are stored in their own files outside the presentation file. Here is information to help you determine when to use an embedded file or a linked file. You can use the Package For CD option to make it easier: Click the Microsoft Office icon and then Publish | Package For CD. You can copy the file to a folder or to a CD. The linked files are included as the default setting.
Embedded Sound Files Linked Sound Files
Stored as part of the presentation. Stored outside of the presentation file. Should be stored in the same folder as the presentation.
Must be deleted, edited in original file format, and reinserted for changes to appear in the presentation.
Changes appear in the presentation when you make a change to the source file.
If .wav files are less than 100KB (KB), you can embed them.
If .wav files are greater than 100KB or sound files are of any other media type, you must link them to, not embed them in, the presentation.
Inserting Sound FilesAdding sound to a PowerPoint 2007 file is similar to adding a movie, which you learned how to do in Chapter 10. You have four options for inserting sound files.
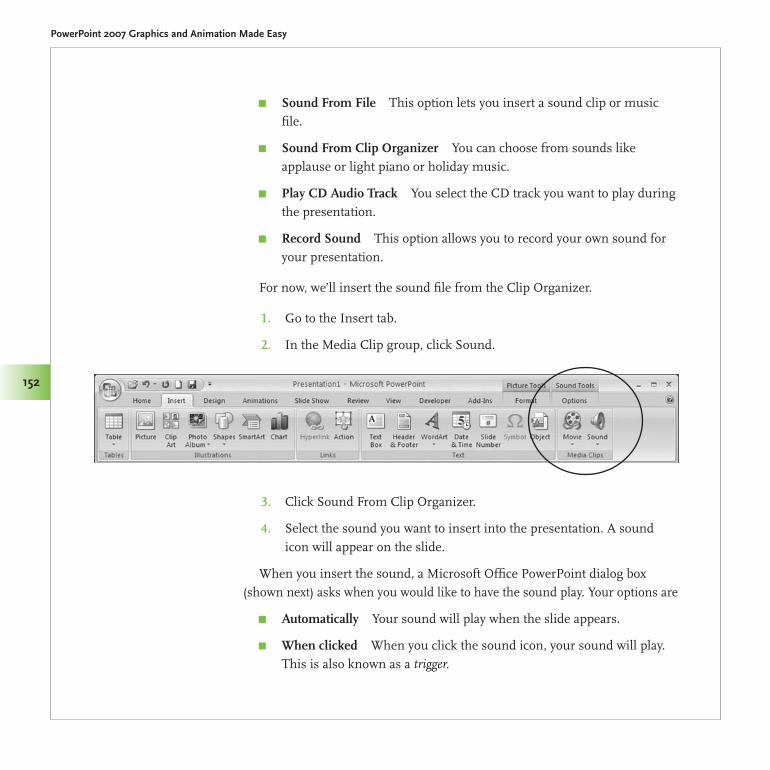
Made Easy/PowerPoint 2007 Graphics & Animation/Slack/0071600760/Chapter 11
PowerPoint 2007 Graphics and Animation Made Easy
152
Sound From File π This option lets you insert a sound clip or music file.
Sound From Clip Organizer π You can choose from sounds like applause or light piano or holiday music.
Play CD Audio Track π You select the CD track you want to play during the presentation.
Record Sound π This option allows you to record your own sound for your presentation.
For now, we’ll insert the sound file from the Clip Organizer.
Go to the Insert tab.1.
In the Media Clip group, click Sound.2.
Click Sound From Clip Organizer.3.
Select the sound you want to insert into the presentation. A sound 4. icon will appear on the slide.
When you insert the sound, a Microsoft Office PowerPoint dialog box (shown next) asks when you would like to have the sound play. Your options are
Automatically π Your sound will play when the slide appears.
When clicked π When you click the sound icon, your sound will play. This is also known as a trigger.
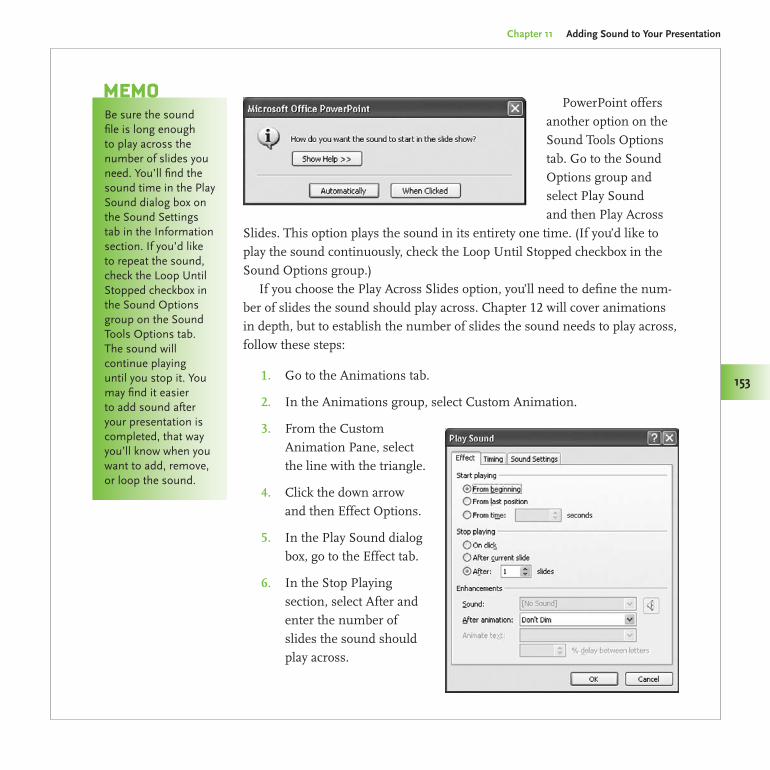
Chapter 11 Adding Sound to Your Presentation
153
Made Easy/PowerPoint 2007 Graphics & Animation/Slack/0071600760/Chapter 10
153
PowerPoint offers another option on the Sound Tools Options tab. Go to the Sound Options group and select Play Sound and then Play Across
Slides. This option plays the sound in its entirety one time. (If you’d like to play the sound continuously, check the Loop Until Stopped checkbox in the Sound Options group.)
If you choose the Play Across Slides option, you’ll need to define the num-ber of slides the sound should play across. Chapter 12 will cover animations in depth, but to establish the number of slides the sound needs to play across, follow these steps:
Go to the Animations tab.1.
In the Animations group, select Custom Animation.2.
From the Custom 3. Animation Pane, select the line with the triangle.
Click the down arrow 4. and then Effect Options.
In the Play Sound dialog 5. box, go to the Effect tab.
In the Stop Playing 6. section, select After and enter the number of slides the sound should play across.
Be sure the sound file is long enough to play across the number of slides you need. You’ll find the sound time in the Play Sound dialog box on the Sound Settings tab in the Information section. If you’d like to repeat the sound, check the Loop Until Stopped checkbox in the Sound Options group on the Sound Tools Options tab. The sound will continue playing until you stop it. You may find it easier to add sound after your presentation is completed, that way you’ll know when you want to add, remove, or loop the sound.
MeMo
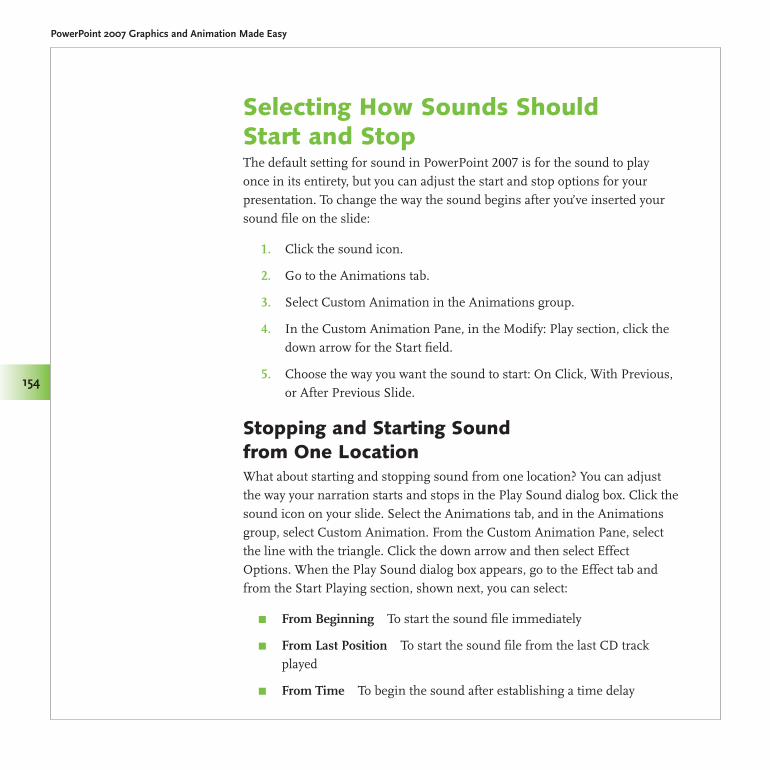
Made Easy/PowerPoint 2007 Graphics & Animation/Slack/0071600760/Chapter 11
PowerPoint 2007 Graphics and Animation Made Easy
154
Selecting How Sounds Should Start and StopThe default setting for sound in PowerPoint 2007 is for the sound to play once in its entirety, but you can adjust the start and stop options for your presentation. To change the way the sound begins after you’ve inserted your sound file on the slide:
Click the sound icon.1.
Go to the Animations tab.2.
Select Custom Animation in the Animations group.3.
In the Custom Animation Pane, in the Modify: Play section, click the 4. down arrow for the Start field.
Choose the way you want the sound to start: On Click, With Previous, 5. or After Previous Slide.
Stopping and Starting Sound from One LocationWhat about starting and stopping sound from one location? You can adjust the way your narration starts and stops in the Play Sound dialog box. Click the sound icon on your slide. Select the Animations tab, and in the Animations group, select Custom Animation. From the Custom Animation Pane, select the line with the triangle. Click the down arrow and then select Effect Options. When the Play Sound dialog box appears, go to the Effect tab and from the Start Playing section, shown next, you can select:
From Beginning π To start the sound file immediately
From Last Position π To start the sound file from the last CD track played
From Time π To begin the sound after establishing a time delay
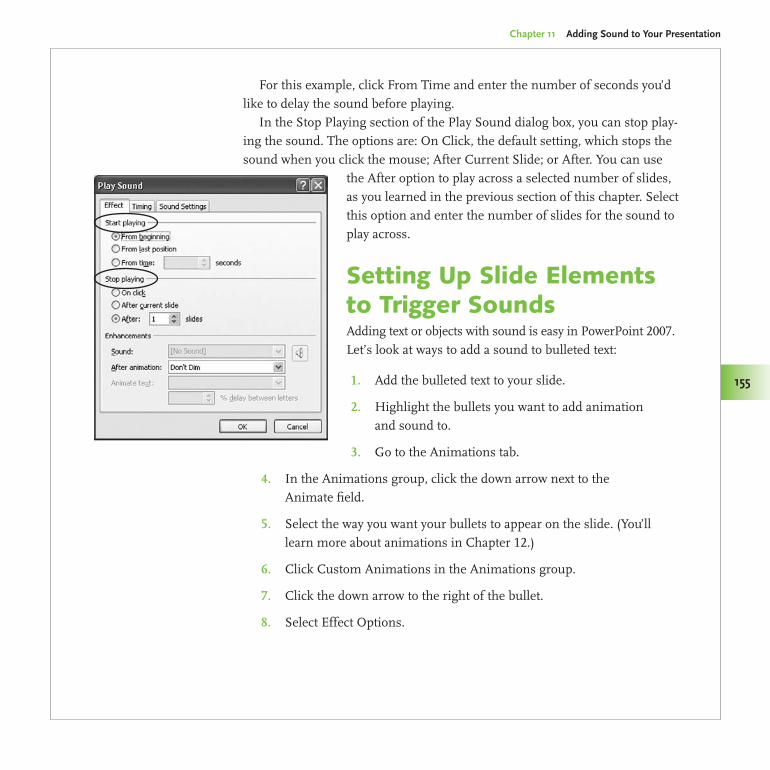
Made Easy/PowerPoint 2007 Graphics & Animation/Slack/0071600760/Chapter 10
Chapter 11 Adding Sound to Your Presentation
155
For this example, click From Time and enter the number of seconds you’d like to delay the sound before playing.
In the Stop Playing section of the Play Sound dialog box, you can stop play-ing the sound. The options are: On Click, the default setting, which stops the sound when you click the mouse; After Current Slide; or After. You can use
the After option to play across a selected number of slides, as you learned in the previous section of this chapter. Select this option and enter the number of slides for the sound to play across.
Setting Up Slide Elements to Trigger SoundsAdding text or objects with sound is easy in PowerPoint 2007. Let’s look at ways to add a sound to bulleted text:
Add the bulleted text to your slide.1.
Highlight the bullets you want to add animation 2. and sound to.
Go to the Animations tab.3.
In the Animations group, click the down arrow next to the 4. Animate field.
Select the way you want your bullets to appear on the slide. (You’ll 5. learn more about animations in Chapter 12.)
Click Custom Animations in the Animations group.6.
Click the down arrow to the right of the bullet.7.
Select Effect Options.8.
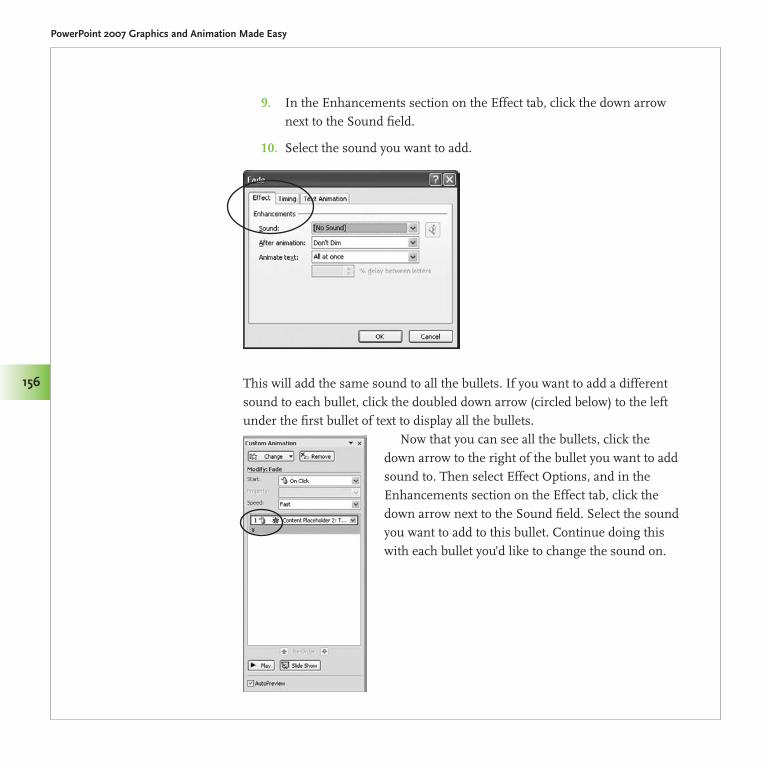
Made Easy/PowerPoint 2007 Graphics & Animation/Slack/0071600760/Chapter 11
PowerPoint 2007 Graphics and Animation Made Easy
156
In the Enhancements section on the Effect tab, click the down arrow 9. next to the Sound field.
Select the sound you want to add.10.
This will add the same sound to all the bullets. If you want to add a different sound to each bullet, click the doubled down arrow (circled below) to the left under the first bullet of text to display all the bullets.
Now that you can see all the bullets, click the down arrow to the right of the bullet you want to add sound to. Then select Effect Options, and in the Enhancements section on the Effect tab, click the down arrow next to the Sound field. Select the sound you want to add to this bullet. Continue doing this with each bullet you’d like to change the sound on.
Made Easy/PowerPoint 2007 Graphics & Animation/Slack/0071600760/Chapter 10
Chapter 11 Adding Sound to Your Presentation
157
Playing CDs with Slide ShowsSometimes you may want to play a certain song during your presentation. You can easily use music from a CD while giving your presentation. Just remember the CD is still separate from your presentation; it is not linked to or embedded in the presentation file.
Insert the CD into your computer’s CD drive.1.
Select the slide that you want the music to begin playing on.2.
Go to the Insert tab.3.
In the Media Clips group, select Play CD Audio Track.4.
In the Insert CD Audio dialog box, enter the Start At track number 5. and the End At track number.
Change the times in the time boxes as needed.6.
Click OK.7.
Select when you would like the CD to play: Automatically or 8. When Clicked.
Recording a Narration with Slide ShowsThe ability to record a narration with your PowerPoint 2007 presentation is the perfect answer for those times when more information is needed for a fuller presentation. You can record a narration before or during a presentation, and you have the option of recording narration for one slide or for the entire presentation.
To record the narration, you’ll need a sound card, microphone, and speakers on your computer. These options have become standard on most recently built computers and generally offer enough sound quality for your
Voice narration overrides other sounds, with only one sound playing at a time. If you have other sounds set to play automatically, they will not play if a narration is included. If you have set the sounds to play When Clicked, however, they will continue to play when you click them in the order you established.
MeMo
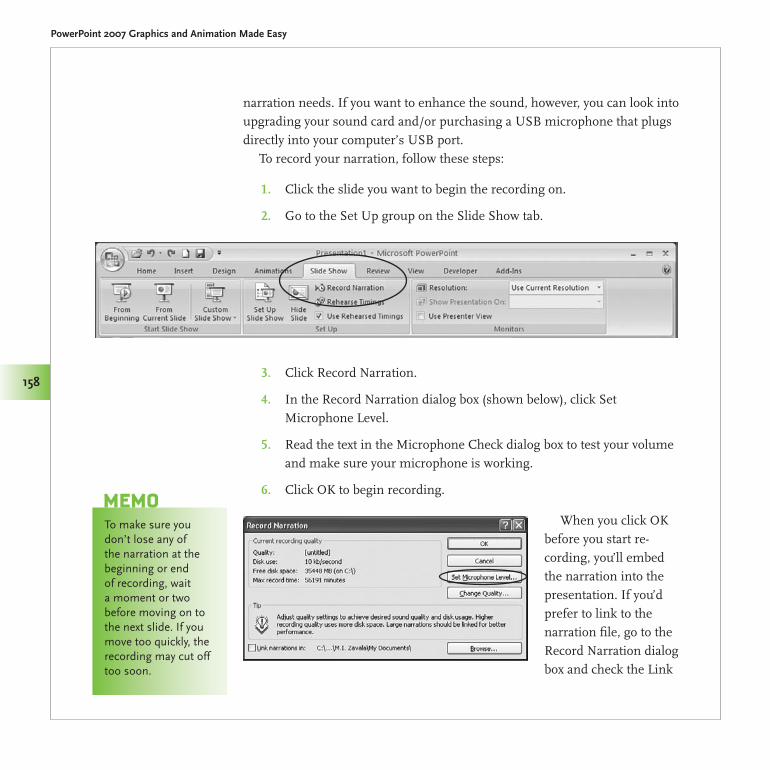
Made Easy/PowerPoint 2007 Graphics & Animation/Slack/0071600760/Chapter 11
PowerPoint 2007 Graphics and Animation Made Easy
158
narration needs. If you want to enhance the sound, however, you can look into upgrading your sound card and/or purchasing a USB microphone that plugs directly into your computer’s USB port.
To record your narration, follow these steps:
Click the slide you want to begin the recording on.1.
Go to the Set Up group on the Slide Show tab.2.
Click Record Narration.3.
In the Record Narration dialog box (shown below), click Set 4. Microphone Level.
Read the text in the Microphone Check dialog box to test your volume 5. and make sure your microphone is working.
Click OK to begin recording.6.
When you click OK before you start re-cording, you’ll embed the narration into the presentation. If you’d prefer to link to the narration file, go to the Record Narration dialog box and check the Link
To make sure you don’t lose any of the narration at the beginning or end of recording, wait a moment or two before moving on to the next slide. If you move too quickly, the recording may cut off too soon.
MeMo
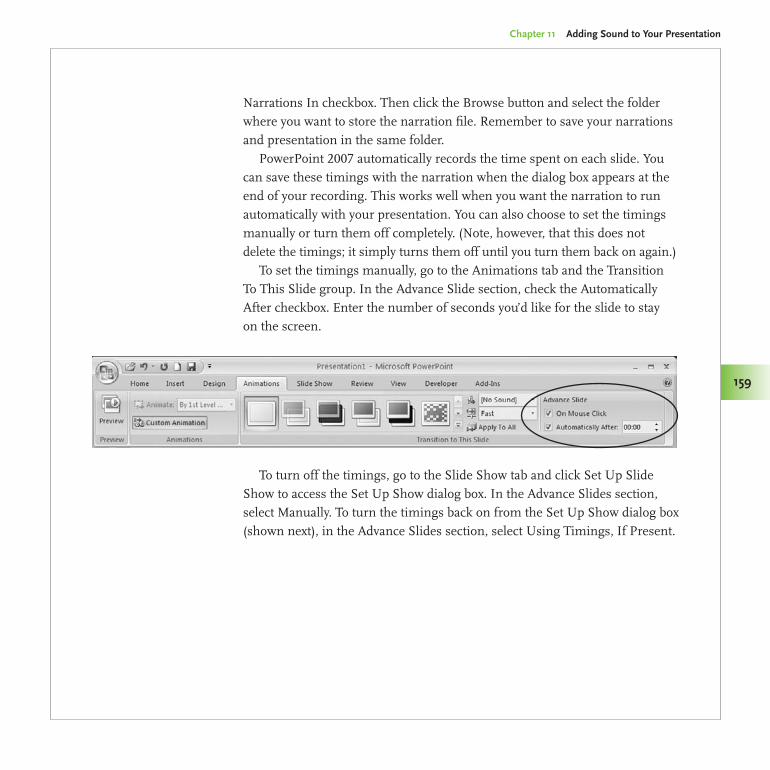
Made Easy/PowerPoint 2007 Graphics & Animation/Slack/0071600760/Chapter 10
Chapter 11 Adding Sound to Your Presentation
159
Narrations In checkbox. Then click the Browse button and select the folder where you want to store the narration file. Remember to save your narrations and presentation in the same folder.
PowerPoint 2007 automatically records the time spent on each slide. You can save these timings with the narration when the dialog box appears at the end of your recording. This works well when you want the narration to run automatically with your presentation. You can also choose to set the timings manually or turn them off completely. (Note, however, that this does not delete the timings; it simply turns them off until you turn them back on again.)
To set the timings manually, go to the Animations tab and the Transition To This Slide group. In the Advance Slide section, check the Automatically After checkbox. Enter the number of seconds you’d like for the slide to stay on the screen.
To turn off the timings, go to the Slide Show tab and click Set Up Slide Show to access the Set Up Show dialog box. In the Advance Slides section, select Manually. To turn the timings back on from the Set Up Show dialog box (shown next), in the Advance Slides section, select Using Timings, If Present.
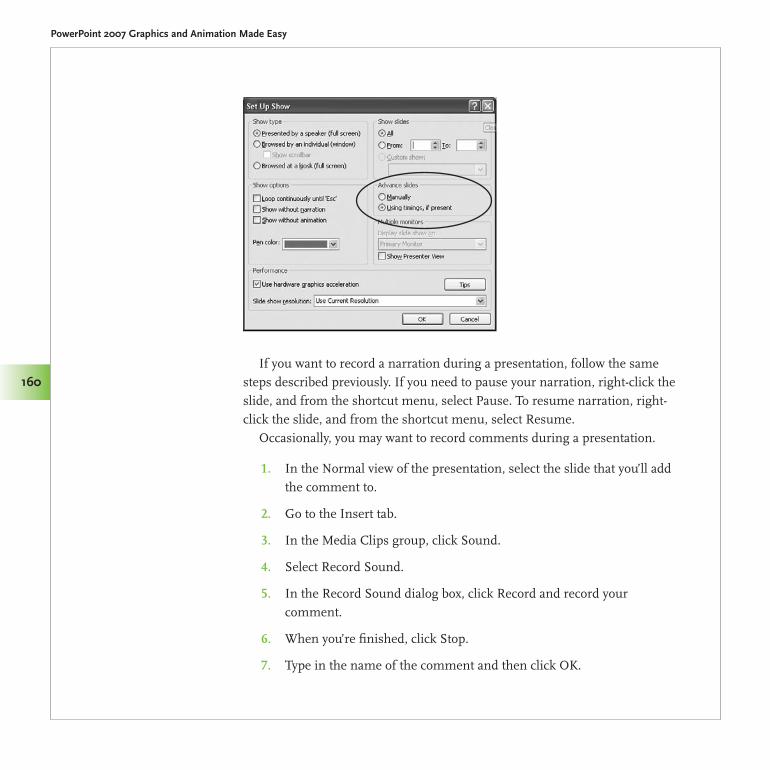
Made Easy/PowerPoint 2007 Graphics & Animation/Slack/0071600760/Chapter 11
PowerPoint 2007 Graphics and Animation Made Easy
160
If you want to record a narration during a presentation, follow the same steps described previously. If you need to pause your narration, right-click the slide, and from the shortcut menu, select Pause. To resume narration, right-click the slide, and from the shortcut menu, select Resume.
Occasionally, you may want to record comments during a presentation.
In the Normal view of the presentation, select the slide that you’ll add 1. the comment to.
Go to the Insert tab.2.
In the Media Clips group, click Sound.3.
Select Record Sound.4.
In the Record Sound dialog box, click Record and record your 5. comment.
When you’re finished, click Stop.6.
Type in the name of the comment and then click OK.7.
Chapter 11 Adding Sound to Your Presentation
161
Made Easy/PowerPoint 2007 Graphics & Animation/Slack/0071600760/Chapter 10
161
The sound icon will appear on the slide.In this chapter, you learned when to consider adding sound to your
presentation, how to insert and adjust sound files, how to set up text and objects to trigger the sound, and how to use CDs and narrations to enhance your presentation. We briefly touched on animations in this chapter, but in the next chapter, you’ll learn about animations in more detail.
When you’re recording a narration, be aware of how your voice sounds. For example, if you’re reading directly from a script, rehearse it a few times so you sound more natural instead of like you’re reading.
Do you have a tendency to sound monotone? Then look closely at what you’re reading or saying and find spots where you can offer a bit of inflection to make it more interesting for the listener. The rise and fall of your voice can make the difference in whether you excite or bore the listener.
Are you enunciating? Wake up that lazy tongue so it doesn’t lie in the back of your throat or say hello-o-o-o to lips that don’t open fully. Practice over-enunciating this phrase a few times to get your mouth warmed up: “The lips, the teeth, and the tip of the tongue.” Over-enunciating may seem strange when you
rehearse, but once you begin recording, you’ll fall into an easy and understandable rhythm that sounds natural.
Does your voice have a tendency to go into the upper regions that only dogs can hear? Then practice keeping your voice in the lower ranges and record yourself as you practice. This way, you’ll know what sounds pleasing to the ear.
No matter what your voice issue is, you can improve it with some concentrated practice and by recording yourself regularly. If you’re serious about making a change, hire a vocal coach who specializes in the spoken word. Or check your local college or university; many times, an abbreviated class may be open to non-students during the semester.
How Does Your Voice sounD?

This page intentionally left blank
Creating and Using AnimationsPart of the fun of using graphics in a presentation is the ability to animate them to increase their visual impact. Almost any object, including text, single bullets, and list items, can be animated. Plus, you can apply animation effects to individual slides, the Slide Master, or custom layouts.
With animation, you essentially bring a still object to life by allowing it to move on the slide. This movement is what captures the audience’s attention. The trick to effective animation, however, is to use restraint. Too much animation can become overwhelming for viewers, in which case they can’t focus on the information you want them to retain.
In this chapter, we’ll take a look at how animation can be used effectively in a presentation. We’ll also show you how to use built-in animations, create custom animations, and how to work with special animation effects. As a bonus in this chapter, we’ll also explain how to rehearse a presentation and use Presenter View. You’ll need these skills to be certain your animations are coming across as effectively as you think they are.
12
Made Easy/PowerPoint 2007 Graphics & Animation/Slack/0071600760/Chapter 12
PowerPoint 2007 Graphics and Animation Made Easy
164
Overview of AnimationsWhen you work with animations, keep in mind the design principles mentioned in Chapter 1. Simplicity, really, is the key to using animations successfully. Usually, a single animation is plenty for a given slide. Sometimes, however, multiple animations might be not only useful but also downright necessary.
For example, bulleted lists can sometimes be overpowering on a slide. Easing viewers into a concept slowly by displaying bullets one at a time might be more helpful. In this case, the use of multiple animations is the right choice: You can select an animation sequence that displays bullets only as you click the mouse. This method keeps the pertinent point on the screen and allows you to control when the audience sees the next pertinent point. Audience members who might be tempted to read ahead without listening to you are thwarted, and you remain in control of how—and when—your content is displayed.
On the other hand, if you use this approach but also apply busy animations to each bullet as it appears (for instance, each bullet flies in from the side or top of the slide, spinning as it drops into place), you might defeat the entire purpose of thoughtfully drawing your viewers through salient points one by one. Instead, their focus will be on wondering where the next bullet will come flying in from.
Animation speed is also an important consideration. Animate too many objects too quickly on a slide, and your audience might get dizzy. Animate objects too slowly, and your audience might nod off to sleep.
In the end, rehearsing your slide show is critical so you can see what your audience will see. Look at your presentation from their perspective, and you just might discover that a fun, quirky animation isn’t really that cool after all.
Rehearsing Your PresentationBefore we get started with animations, let’s take a minute to get up to speed on rehearsing slide shows. Rehearsing is a way to preview your presentation
In most cases, use the same animation feature for all objects on a single slide. For example, if you wipe in one object, wipe them all in. You can have them appear from different places, but your audience will be less distracted if all items essentially appear on the screen in the same manner.
The easy Way
Sound can be used in the animation process, too. Check out Chapter 11 for information about playing sounds as part of an animation sequence.
MeMo
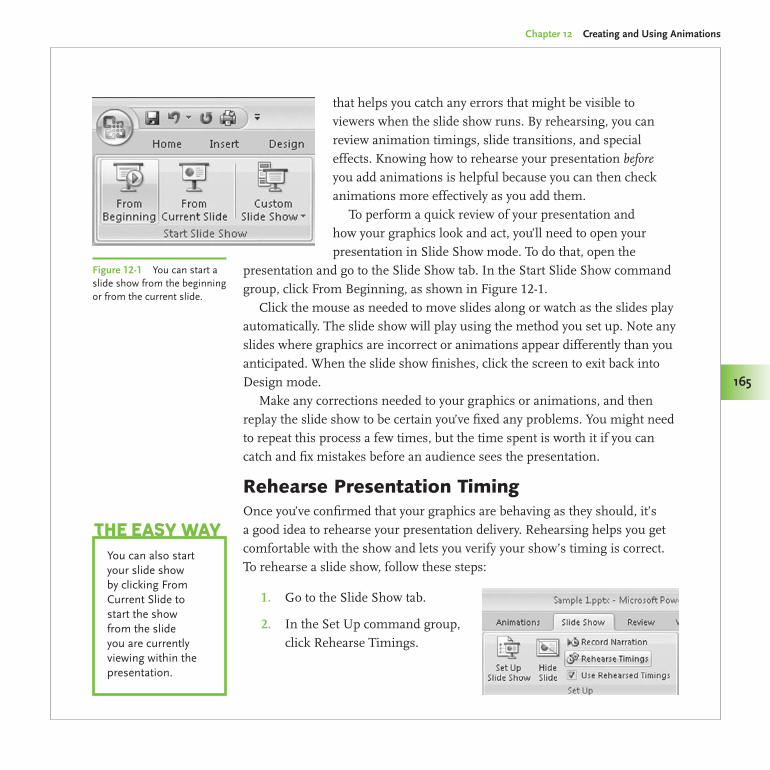
Made Easy/PowerPoint 2007 Graphics & Animation/Slack/0071600760/Chapter 12
Chapter 12 Creating and Using Animations
165
that helps you catch any errors that might be visible to viewers when the slide show runs. By rehearsing, you can review animation timings, slide transitions, and special effects. Knowing how to rehearse your presentation before you add animations is helpful because you can then check animations more effectively as you add them.
To perform a quick review of your presentation and how your graphics look and act, you’ll need to open your presentation in Slide Show mode. To do that, open the
presentation and go to the Slide Show tab. In the Start Slide Show command group, click From Beginning, as shown in Figure 12-1.
Click the mouse as needed to move slides along or watch as the slides play automatically. The slide show will play using the method you set up. Note any slides where graphics are incorrect or animations appear differently than you anticipated. When the slide show finishes, click the screen to exit back into Design mode.
Make any corrections needed to your graphics or animations, and then replay the slide show to be certain you’ve fixed any problems. You might need to repeat this process a few times, but the time spent is worth it if you can catch and fix mistakes before an audience sees the presentation.
Rehearse Presentation TimingOnce you’ve confirmed that your graphics are behaving as they should, it’s a good idea to rehearse your presentation delivery. Rehearsing helps you get comfortable with the show and lets you verify your show’s timing is correct. To rehearse a slide show, follow these steps:
Go to the Slide Show tab.1.
In the Set Up command group, 2. click Rehearse Timings.
You can also start your slide show by clicking From Current Slide to start the show from the slide you are currently viewing within the presentation.
The easy Way
Figure 12-1 You can start a slide show from the beginning or from the current slide.
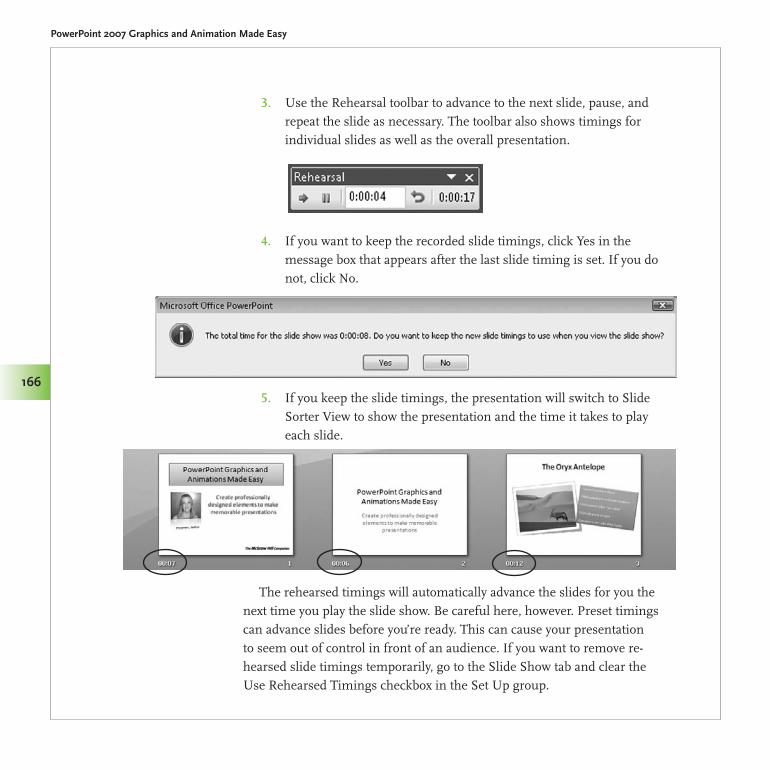
Made Easy/PowerPoint 2007 Graphics & Animation/Slack/0071600760/Chapter 12
PowerPoint 2007 Graphics and Animation Made Easy
166
Use the Rehearsal toolbar to advance to the next slide, pause, and 3. repeat the slide as necessary. The toolbar also shows timings for individual slides as well as the overall presentation.
If you want to keep the recorded slide timings, click Yes in the 4. message box that appears after the last slide timing is set. If you do not, click No.
If you keep the slide timings, the presentation will switch to Slide 5. Sorter View to show the presentation and the time it takes to play each slide.
The rehearsed timings will automatically advance the slides for you the next time you play the slide show. Be careful here, however. Preset timings can advance slides before you’re ready. This can cause your presentation to seem out of control in front of an audience. If you want to remove re-hearsed slide timings temporarily, go to the Slide Show tab and clear the Use Rehearsed Timings checkbox in the Set Up group.
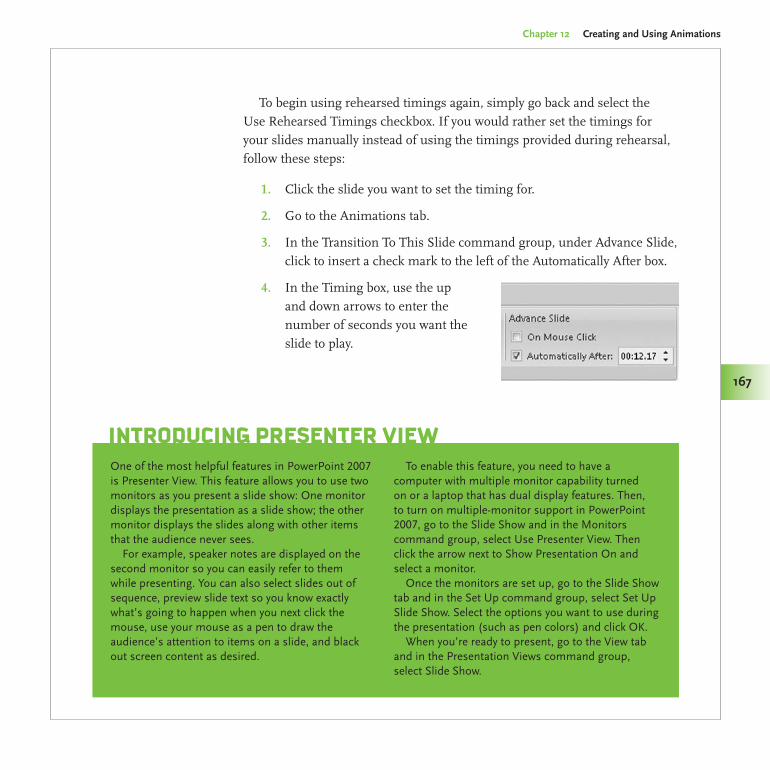
Chapter 12 Creating and Using Animations
167
Made Easy/PowerPoint 2007 Graphics & Animation/Slack/0071600760/Chapter 12
167
To begin using rehearsed timings again, simply go back and select the Use Rehearsed Timings checkbox. If you would rather set the timings for your slides manually instead of using the timings provided during rehearsal, follow these steps:
Click the slide you want to set the timing for.1.
Go to the Animations tab.2.
In the Transition To This Slide command group, under Advance Slide, 3. click to insert a check mark to the left of the Automatically After box.
In the Timing box, use the up 4. and down arrows to enter the number of seconds you want the slide to play.
One of the most helpful features in PowerPoint 2007 is Presenter View. This feature allows you to use two monitors as you present a slide show: One monitor displays the presentation as a slide show; the other monitor displays the slides along with other items that the audience never sees.
For example, speaker notes are displayed on the second monitor so you can easily refer to them while presenting. You can also select slides out of sequence, preview slide text so you know exactly what’s going to happen when you next click the mouse, use your mouse as a pen to draw the audience’s attention to items on a slide, and black out screen content as desired.
To enable this feature, you need to have a computer with multiple monitor capability turned on or a laptop that has dual display features. Then, to turn on multiple-monitor support in PowerPoint 2007, go to the Slide Show and in the Monitors command group, select Use Presenter View. Then click the arrow next to Show Presentation On and select a monitor.
Once the monitors are set up, go to the Slide Show tab and in the Set Up command group, select Set Up Slide Show. Select the options you want to use during the presentation (such as pen colors) and click OK.
When you’re ready to present, go to the View tab and in the Presentation Views command group, select Slide Show.
InTroducIng PresenTer VIeW
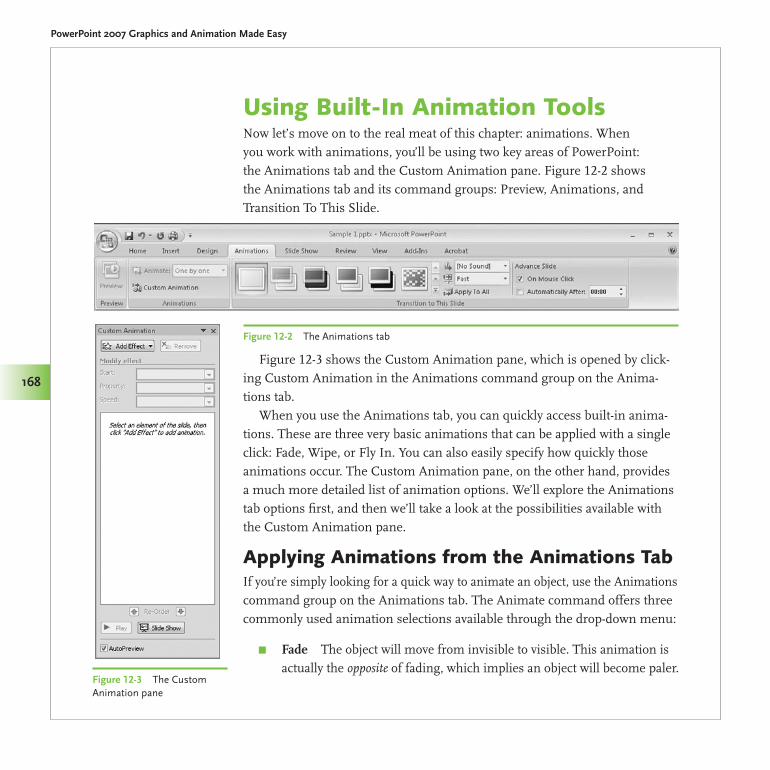
Made Easy/PowerPoint 2007 Graphics & Animation/Slack/0071600760/Chapter 12
PowerPoint 2007 Graphics and Animation Made Easy
168
Using Built-In Animation ToolsNow let’s move on to the real meat of this chapter: animations. When you work with animations, you’ll be using two key areas of PowerPoint: the Animations tab and the Custom Animation pane. Figure 12-2 shows the Animations tab and its command groups: Preview, Animations, and Transition To This Slide.
Figure 12-2 The Animations tab
Figure 12-3 shows the Custom Animation pane, which is opened by click-ing Custom Animation in the Animations command group on the Anima-tions tab.
When you use the Animations tab, you can quickly access built-in anima-tions. These are three very basic animations that can be applied with a single click: Fade, Wipe, or Fly In. You can also easily specify how quickly those animations occur. The Custom Animation pane, on the other hand, provides a much more detailed list of animation options. We’ll explore the Animations tab options first, and then we’ll take a look at the possibilities available with the Custom Animation pane.
Applying Animations from the Animations TabIf you’re simply looking for a quick way to animate an object, use the Animations command group on the Animations tab. The Animate command offers three commonly used animation selections available through the drop-down menu:
Fade π The object will move from invisible to visible. This animation is actually the opposite of fading, which implies an object will become paler.
Figure 12-3 The Custom Animation pane
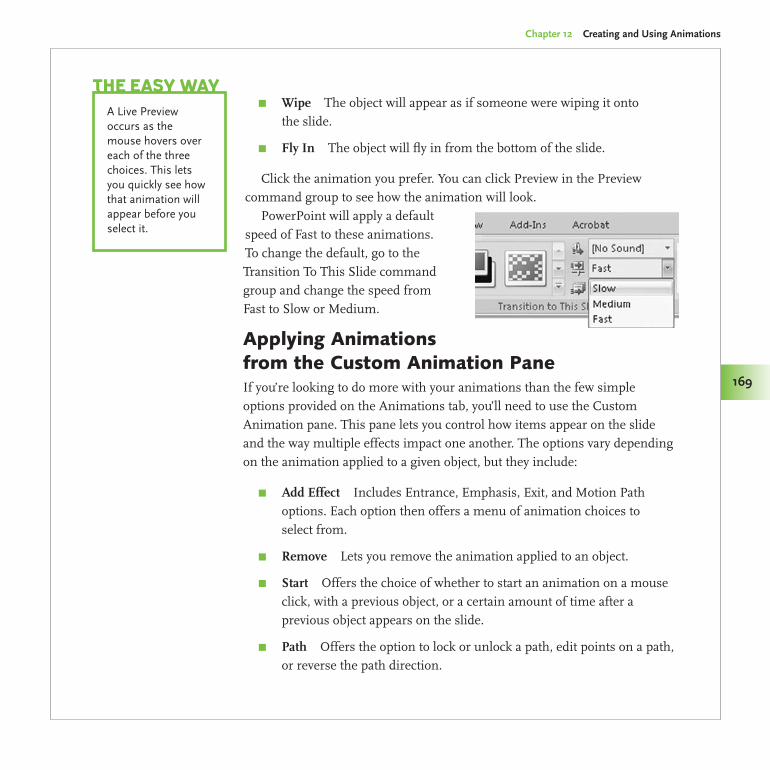
Made Easy/PowerPoint 2007 Graphics & Animation/Slack/0071600760/Chapter 12
Chapter 12 Creating and Using Animations
169
Wipe π The object will appear as if someone were wiping it onto the slide.
Fly In π The object will fly in from the bottom of the slide.
Click the animation you prefer. You can click Preview in the Preview command group to see how the animation will look.
PowerPoint will apply a default speed of Fast to these animations. To change the default, go to the Transition To This Slide command group and change the speed from Fast to Slow or Medium.
Applying Animations from the Custom Animation PaneIf you’re looking to do more with your animations than the few simple options provided on the Animations tab, you’ll need to use the Custom Animation pane. This pane lets you control how items appear on the slide and the way multiple effects impact one another. The options vary depending on the animation applied to a given object, but they include:
Add Effect π Includes Entrance, Emphasis, Exit, and Motion Path options. Each option then offers a menu of animation choices to select from.
Remove π Lets you remove the animation applied to an object.
Start π Offers the choice of whether to start an animation on a mouse click, with a previous object, or a certain amount of time after a previous object appears on the slide.
Path π Offers the option to lock or unlock a path, edit points on a path, or reverse the path direction.
A Live Preview occurs as the mouse hovers over each of the three choices. This lets you quickly see how that animation will appear before you select it.
The easy Way
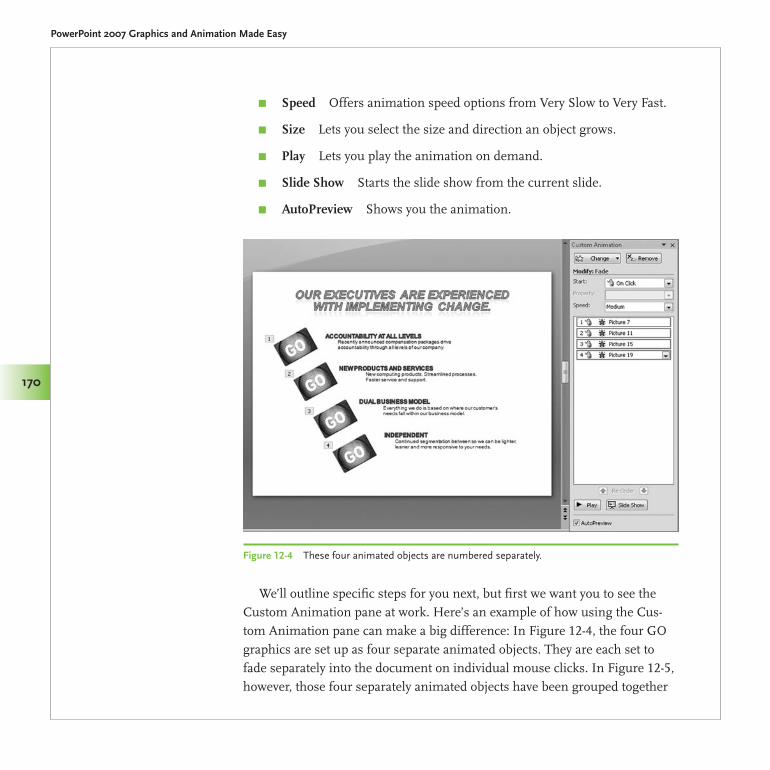
Made Easy/PowerPoint 2007 Graphics & Animation/Slack/0071600760/Chapter 12
PowerPoint 2007 Graphics and Animation Made Easy
170
Speed π Offers animation speed options from Very Slow to Very Fast.
Size π Lets you select the size and direction an object grows.
Play π Lets you play the animation on demand.
Slide Show π Starts the slide show from the current slide.
AutoPreview π Shows you the animation.
We’ll outline specific steps for you next, but first we want you to see the Custom Animation pane at work. Here’s an example of how using the Cus-tom Animation pane can make a big difference: In Figure 12-4, the four GO graphics are set up as four separate animated objects. They are each set to fade separately into the document on individual mouse clicks. In Figure 12-5, however, those four separately animated objects have been grouped together
Figure 12-4 These four animated objects are numbered separately.
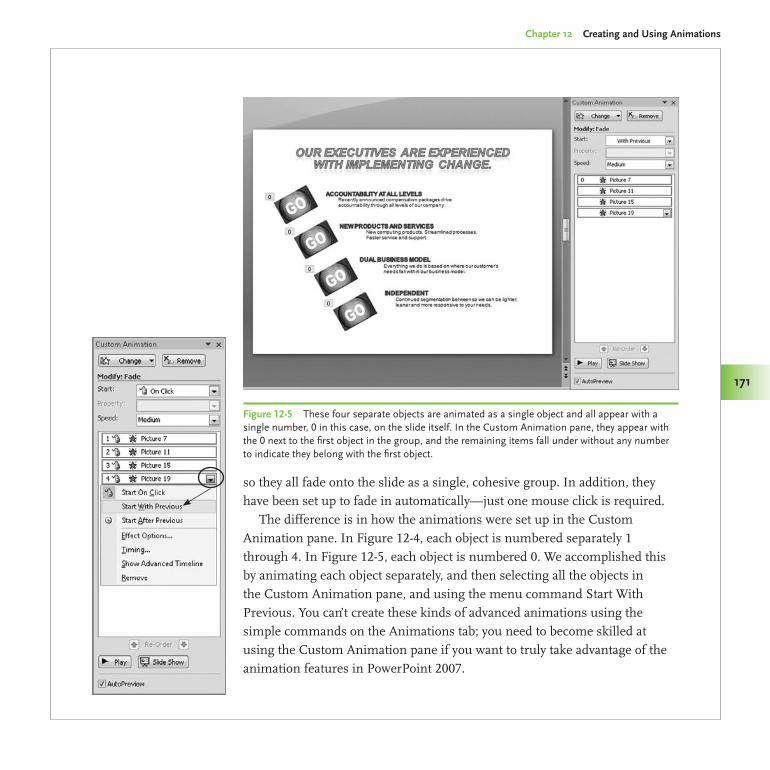
Made Easy/PowerPoint 2007 Graphics & Animation/Slack/0071600760/Chapter 12
Chapter 12 Creating and Using Animations
171
so they all fade onto the slide as a single, cohesive group. In addition, they have been set up to fade in automatically—just one mouse click is required.
The difference is in how the animations were set up in the Custom Animation pane. In Figure 12-4, each object is numbered separately 1 through 4. In Figure 12-5, each object is numbered 0. We accomplished this by animating each object separately, and then selecting all the objects in the Custom Animation pane, and using the menu command Start With Previous. You can’t create these kinds of advanced animations using the simple commands on the Animations tab; you need to become skilled at using the Custom Animation pane if you want to truly take advantage of the animation features in PowerPoint 2007.
Figure 12-5 These four separate objects are animated as a single object and all appear with a single number, 0 in this case, on the slide itself. In the Custom Animation pane, they appear with the 0 next to the first object in the group, and the remaining items fall under without any number to indicate they belong with the first object.
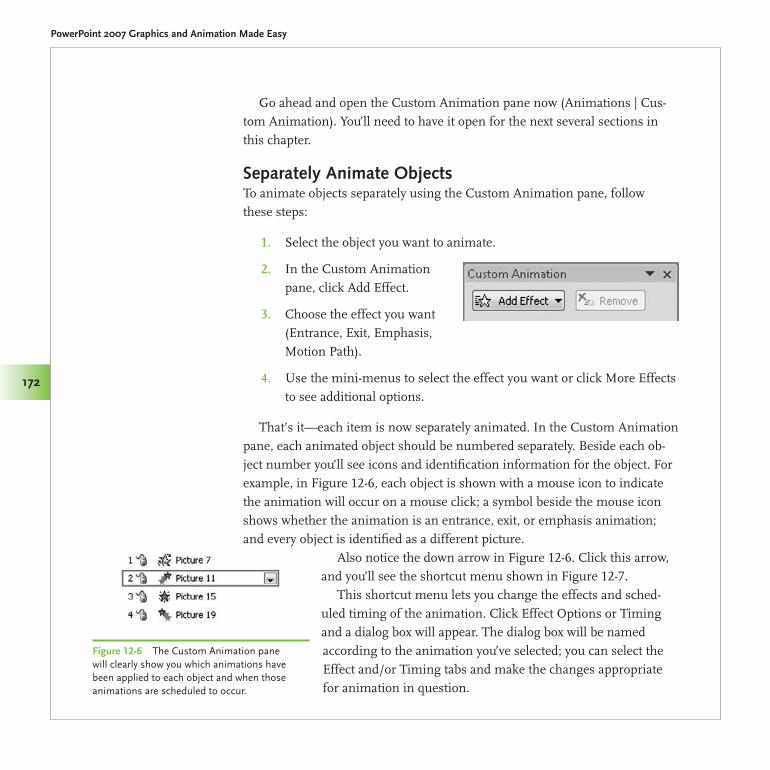
Made Easy/PowerPoint 2007 Graphics & Animation/Slack/0071600760/Chapter 12
PowerPoint 2007 Graphics and Animation Made Easy
172
Go ahead and open the Custom Animation pane now (Animations | Cus-tom Animation). You’ll need to have it open for the next several sections in this chapter.
Separately Animate ObjectsTo animate objects separately using the Custom Animation pane, follow these steps:
Select the object you want to animate.1.
In the Custom Animation 2. pane, click Add Effect.
Choose the effect you want 3. (Entrance, Exit, Emphasis, Motion Path).
Use the mini-menus to select the effect you want or click More Effects 4. to see additional options.
That’s it—each item is now separately animated. In the Custom Animation pane, each animated object should be numbered separately. Beside each ob-ject number you’ll see icons and identification information for the object. For example, in Figure 12-6, each object is shown with a mouse icon to indicate the animation will occur on a mouse click; a symbol beside the mouse icon shows whether the animation is an entrance, exit, or emphasis animation; and every object is identified as a different picture.
Also notice the down arrow in Figure 12-6. Click this arrow, and you’ll see the shortcut menu shown in Figure 12-7.
This shortcut menu lets you change the effects and sched-uled timing of the animation. Click Effect Options or Timing and a dialog box will appear. The dialog box will be named according to the animation you’ve selected; you can select the Effect and/or Timing tabs and make the changes appropriate for animation in question.
Figure 12-6 The Custom Animation pane will clearly show you which animations have been applied to each object and when those animations are scheduled to occur.
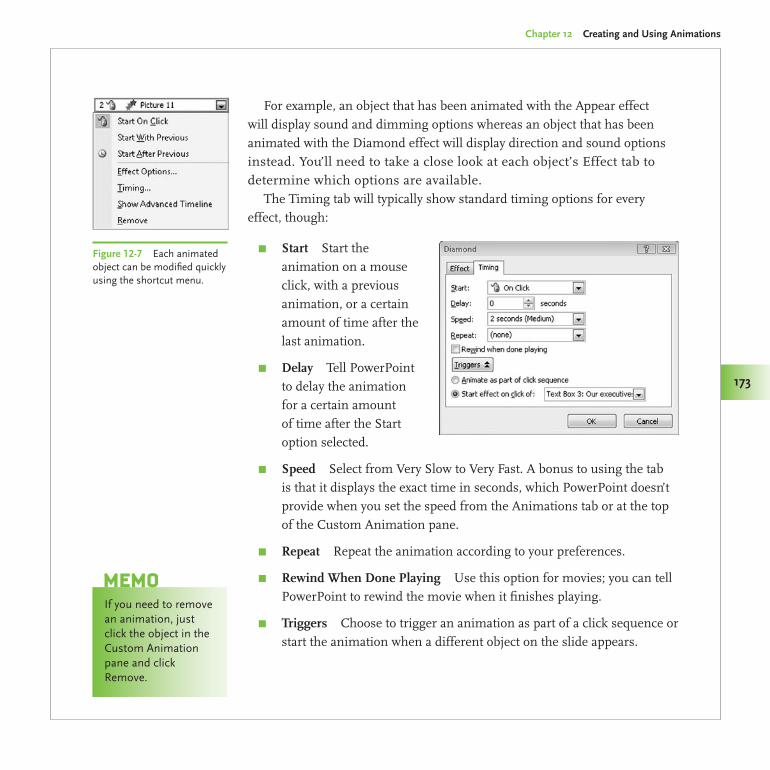
Made Easy/PowerPoint 2007 Graphics & Animation/Slack/0071600760/Chapter 12
Chapter 12 Creating and Using Animations
173
For example, an object that has been animated with the Appear effect will display sound and dimming options whereas an object that has been animated with the Diamond effect will display direction and sound options instead. You’ll need to take a close look at each object’s Effect tab to determine which options are available.
The Timing tab will typically show standard timing options for every effect, though:
Start π Start the animation on a mouse click, with a previous animation, or a certain amount of time after the last animation.
Delay π Tell PowerPoint to delay the animation for a certain amount of time after the Start option selected.
Speed π Select from Very Slow to Very Fast. A bonus to using the tab is that it displays the exact time in seconds, which PowerPoint doesn’t provide when you set the speed from the Animations tab or at the top of the Custom Animation pane.
Repeat π Repeat the animation according to your preferences.
Rewind When Done Playing π Use this option for movies; you can tell PowerPoint to rewind the movie when it finishes playing.
Triggers π Choose to trigger an animation as part of a click sequence or start the animation when a different object on the slide appears.
Figure 12-7 Each animated object can be modified quickly using the shortcut menu.
If you need to remove an animation, just click the object in the Custom Animation pane and click Remove.
MeMo
Made Easy/PowerPoint 2007 Graphics & Animation/Slack/0071600760/Chapter 12
PowerPoint 2007 Graphics and Animation Made Easy
174
Combine Objects for a Single AnimationTo animate multiple objects as a single object like we showed in the previous example shown in Figure 12-5, follow these steps:
Select each object you want to animate, and apply the animation effect 1. you want to each one object individually.
In the Custom Animation pane, click the first object in the group you 2. want to create. Press ctrl on your keyboard, and click to select the additional objects you want to include in the group.
Click the down arrow to open the shortcut menu; select Start With 3. Previous.
The objects will now be linked together as a group.
Apply Animations to Bulleted TextThis animation is really easy to do and very effective with audiences because it keeps them from reading ahead as you present important points on a slide. Simply highlight the text in a bullet, and click Add Effect in the Custom Animation pane. Apply the effect you want, and select when you want the effect to start. Applying the same effect to all bullets in a group is best; switching effects can distract your audience.
Adding Animations to TablesAnimating parts of a table used to be pretty easy in PowerPoint, but PowerPoint 2007’s increased table sizes makes it more difficult. You can’t just ungroup and animate parts of a table like you could in previous versions. You can, however, still apply some effects to a table to make it appear as if parts of the table are animated. Essentially, you’re going to change your table from an object to a picture file and then ungroup parts of it and animate the specific parts you want.
A word of caution when linking objects to animate as a group: PowerPoint will do exactly what you tell it to do; so if you group objects and then move them up or down in the Custom Animation pane, you will find the objects displaying when you least expect them to. You’ve told PowerPoint to Start With Previous, remember, so as objects move, they then become linked to new “previous” items. Take your time and carefully lay out the slide before you attempt to group objects together. Watch for “invisible” objects, too—objects that are now hidden behind others as you worked on your slide. Hidden objects can make your animations work strangely, so if you’re experiencing trouble take a close look for these issues in particular.
MeMo
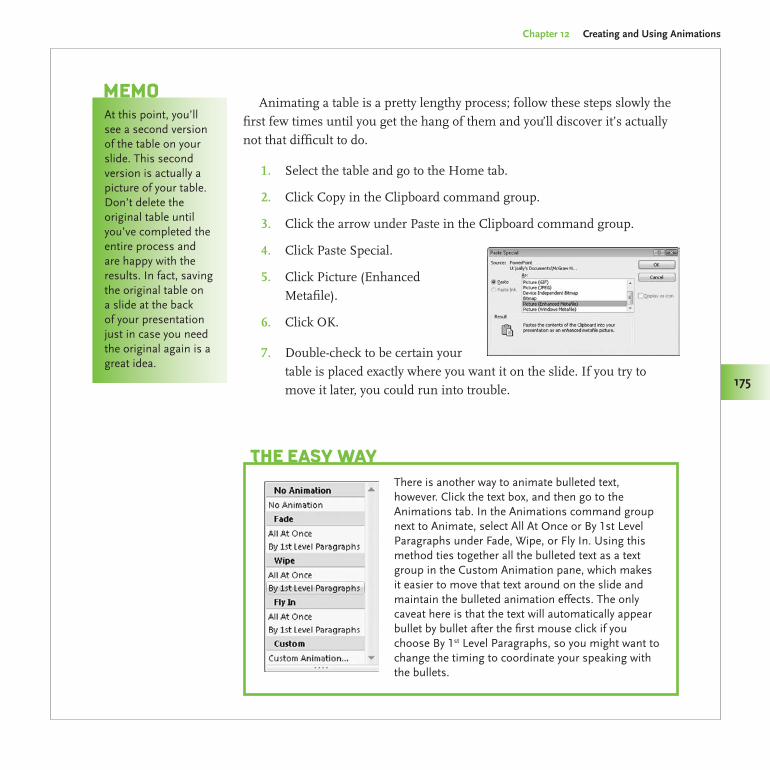
Chapter 12 Creating and Using Animations
175
Made Easy/PowerPoint 2007 Graphics & Animation/Slack/0071600760/Chapter 12
175
Animating a table is a pretty lengthy process; follow these steps slowly the first few times until you get the hang of them and you’ll discover it’s actually not that difficult to do.
Select the table and go to the Home tab.1.
Click Copy in the Clipboard command group.2.
Click the arrow under Paste in the Clipboard command group.3.
Click Paste Special.4.
Click Picture (Enhanced 5. Metafile).
Click OK.6.
Double-check to be certain your 7. table is placed exactly where you want it on the slide. If you try to move it later, you could run into trouble.
There is another way to animate bulleted text, however. Click the text box, and then go to the Animations tab. In the Animations command group next to Animate, select All At Once or By 1st Level Paragraphs under Fade, Wipe, or Fly In. Using this method ties together all the bulleted text as a text group in the Custom Animation pane, which makes it easier to move that text around on the slide and maintain the bulleted animation effects. The only caveat here is that the text will automatically appear bullet by bullet after the first mouse click if you choose By 1st Level Paragraphs, so you might want to change the timing to coordinate your speaking with the bullets.
The easy Way
At this point, you’ll see a second version of the table on your slide. This second version is actually a picture of your table. Don’t delete the original table until you’ve completed the entire process and are happy with the results. In fact, saving the original table on a slide at the back of your presentation just in case you need the original again is a great idea.
MeMo
PowerPoint 2007 Graphics and Animation Made Easy
176
Made Easy/PowerPoint 2007 Graphics & Animation/Slack/0071600760/Chapter 12
If the new picture is not selected, select it and go to the Picture Tools 8. Format tab.
Click Group in the Arrange command group.9.
Click Ungroup.10.
Click Yes when prompted to convert the picture to a Microsoft Office 11. drawing object.
Go to the Drawing Tools Format tab.12.
Click Group in the Arrange command group.13.
Click Ungroup.14.
Press 15. ctrl and then click the portions of the table that you want to animate.
On the Drawing Tools Format tab, click Group in the Arrange 16. command group.
Click Group.17.
Go to the Animations tab.18.
Click Custom Animation to open the Custom Animation pane.19.
In the Custom Animation pane, click Add Effect.20.
Select the effect you want to apply.21.
Add any other animation features you want using the Custom 22. Animation pane.
Click outside the table to eliminate the number of groupings shown. Doing this will give you a better view of the table so you can select the items you want to animate.
MeMo
Do not try to regroup the entire table when you’re done. Your animation effects will not apply if you do. This makes it difficult to move the table around on the slide, so be sure you’ve placed the table where you want it before you apply the steps in this process.
MeMo
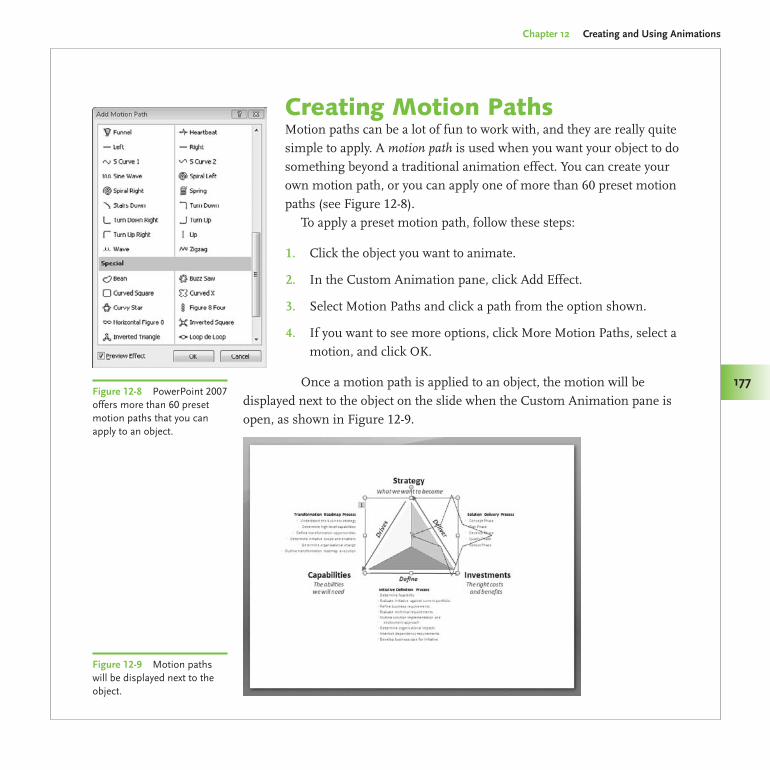
Chapter 12 Creating and Using Animations
177
Made Easy/PowerPoint 2007 Graphics & Animation/Slack/0071600760/Chapter 12
Creating Motion PathsMotion paths can be a lot of fun to work with, and they are really quite simple to apply. A motion path is used when you want your object to do something beyond a traditional animation effect. You can create your own motion path, or you can apply one of more than 60 preset motion paths (see Figure 12-8).
To apply a preset motion path, follow these steps:
Click the object you want to animate.1.
In the Custom Animation pane, click Add Effect.2.
Select Motion Paths and click a path from the option shown.3.
If you want to see more options, click More Motion Paths, select a 4. motion, and click OK.
Once a motion path is applied to an object, the motion will be displayed next to the object on the slide when the Custom Animation pane is open, as shown in Figure 12-9.
Figure 12-8 PowerPoint 2007 offers more than 60 preset motion paths that you can apply to an object.
Figure 12-9 Motion paths will be displayed next to the object.
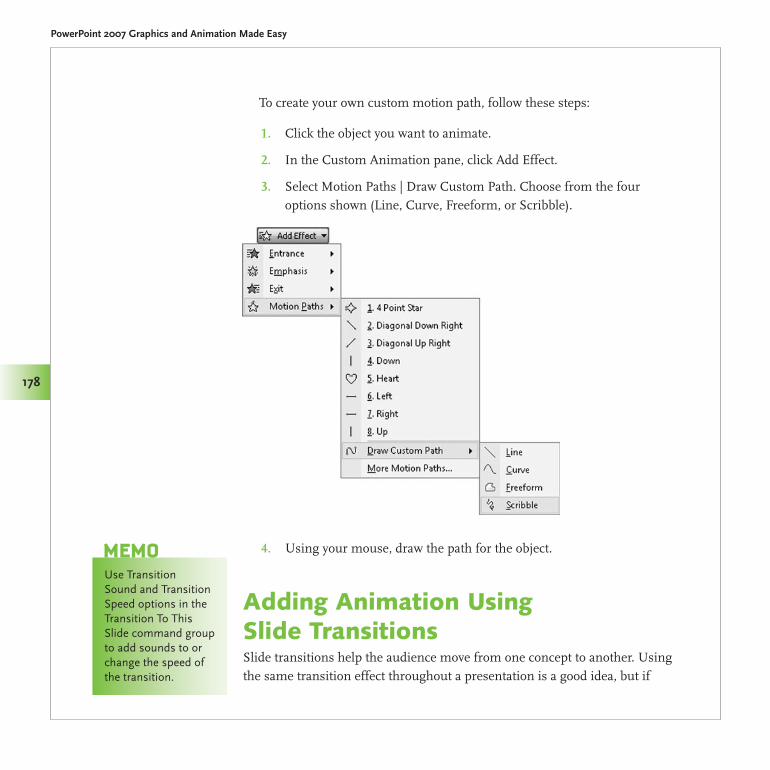
PowerPoint 2007 Graphics and Animation Made Easy
178
Made Easy/PowerPoint 2007 Graphics & Animation/Slack/0071600760/Chapter 12
To create your own custom motion path, follow these steps:
Click the object you want to animate.1.
In the Custom Animation pane, click Add Effect.2.
Select Motion Paths | Draw Custom Path. Choose from the four 3. options shown (Line, Curve, Freeform, or Scribble).
Using your mouse, draw the path for the object.4.
Adding Animation Using Slide TransitionsSlide transitions help the audience move from one concept to another. Using the same transition effect throughout a presentation is a good idea, but if
Use Transition Sound and Transition Speed options in the Transition To This Slide command group to add sounds to or change the speed of the transition.
MeMo
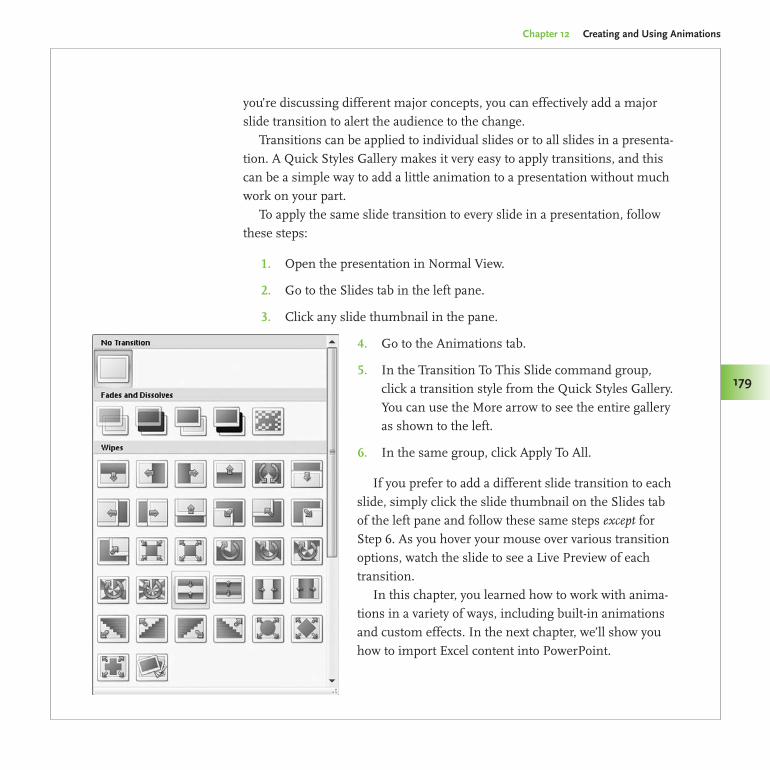
Chapter 12 Creating and Using Animations
179
Made Easy/PowerPoint 2007 Graphics & Animation/Slack/0071600760/Chapter 12
you’re discussing different major concepts, you can effectively add a major slide transition to alert the audience to the change.
Transitions can be applied to individual slides or to all slides in a presenta-tion. A Quick Styles Gallery makes it very easy to apply transitions, and this can be a simple way to add a little animation to a presentation without much work on your part.
To apply the same slide transition to every slide in a presentation, follow these steps:
Open the presentation in Normal View.1.
Go to the Slides tab in the left pane.2.
Click any slide thumbnail in the pane.3.
Go to the Animations tab.4.
In the Transition To This Slide command group, 5. click a transition style from the Quick Styles Gallery. You can use the More arrow to see the entire gallery as shown to the left.
In the same group, click Apply To All.6.
If you prefer to add a different slide transition to each slide, simply click the slide thumbnail on the Slides tab of the left pane and follow these same steps except for Step 6. As you hover your mouse over various transition options, watch the slide to see a Live Preview of each transition.
In this chapter, you learned how to work with anima-tions in a variety of ways, including built-in animations and custom effects. In the next chapter, we’ll show you how to import Excel content into PowerPoint.

This page intentionally left blank
Importing Excel Content into PowerPoint 2007PowerPoint 2007 makes it easy to use Excel content within your presentation. You can copy a chart or worksheet data from Excel to your presentation or simply create your own chart within PowerPoint. This will save you time and a lot of headaches because you enter the data only once and move it to the appropriate place.
Compatibility is not only a time-saver but also a quick way to make your presentations look sharper and more professional. Let’s take a look at how you can move information to PowerPoint with just a few mouse clicks.
13
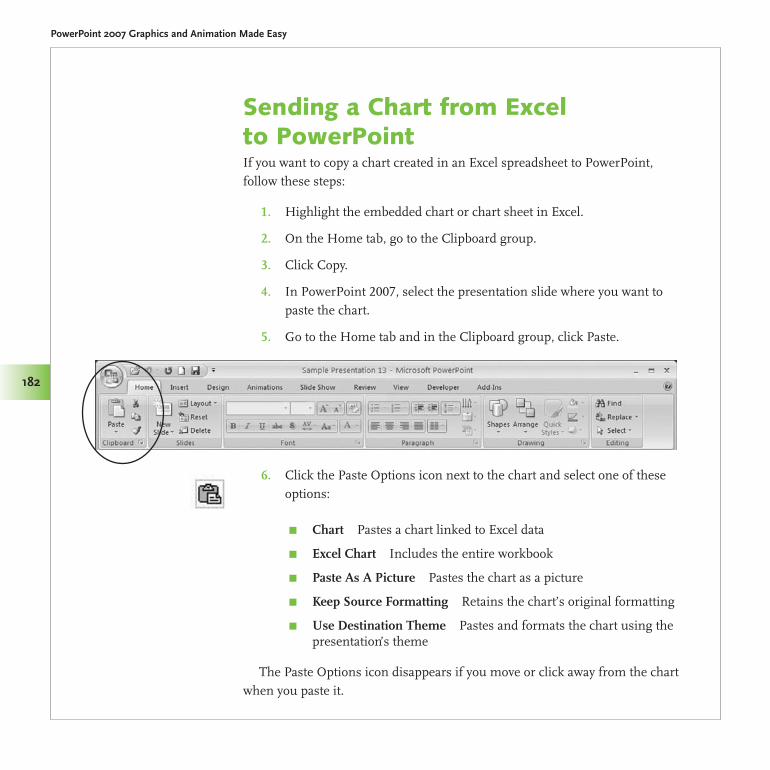
Made Easy/PowerPoint 2007 Graphics & Animation/Slack/0071600760/Chapter 13
PowerPoint 2007 Graphics and Animation Made Easy
182
Sending a Chart from Excel to PowerPointIf you want to copy a chart created in an Excel spreadsheet to PowerPoint, follow these steps:
Highlight the embedded chart or chart sheet in Excel.1.
On the Home tab, go to the Clipboard group.2.
Click Copy.3.
In PowerPoint 2007, select the presentation slide where you want to 4. paste the chart.
Go to the Home tab and in the Clipboard group, click Paste.5.
Click the Paste Options icon next to the chart and select one of these 6. options:
Chart π Pastes a chart linked to Excel data
Excel Chart π Includes the entire workbook
Paste As A Picture π Pastes the chart as a picture
Keep Source Formatting π Retains the chart’s original formatting
Use Destination Theme π Pastes and formats the chart using the presentation’s theme
The Paste Options icon disappears if you move or click away from the chart when you paste it.
Made Easy/PowerPoint 2007 Graphics & Animation/Slack/0071600760/Chapter 13
Chapter 13 Importing Excel Content into PowerPoint 2007
183
Copying Worksheet Data into PowerPointIn PowerPoint 2007, you have a few different options for entering data. You can copy data from an Excel worksheet into PowerPoint, create an Excel spreadsheet in PowerPoint to enter your data into directly, paste data from other formats, or add hyperlinks.
In Excel, select the data you want to copy from the worksheet.1.
Go to the Home tab in the Clipboard group.2.
Click Copy.3.
In PowerPoint 2007, select the slide you want to paste the data into.4.
Go to the Home tab.5.
In the Clipboard group, select Paste.6.
Click the Paste Options icon next to the data on the slide and select 7. one of the following:
Keep Source Formatting π Maintains the original format
Use Destination Theme π Uses the document theme applied to the PowerPoint presentation
Keep Text Only π Pastes the data as text
You also have other options for pasting the chart into your presentation. In PowerPoint 2007, go to the Home tab and from the Clipboard group, select Paste | Paste Special. From the Paste Special dialog box, you can paste the chart in a number of ways— as a graphic object, bitmap, or picture in a few different formats.
MeMo
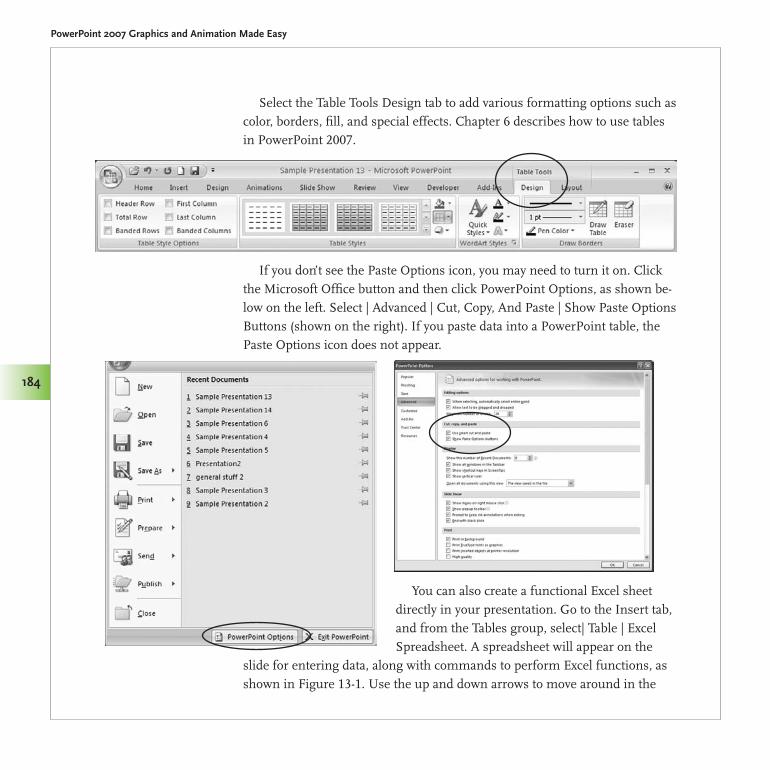
Made Easy/PowerPoint 2007 Graphics & Animation/Slack/0071600760/Chapter 13
PowerPoint 2007 Graphics and Animation Made Easy
184
Select the Table Tools Design tab to add various formatting options such as color, borders, fill, and special effects. Chapter 6 describes how to use tables in PowerPoint 2007.
If you don’t see the Paste Options icon, you may need to turn it on. Click the Microsoft Office button and then click PowerPoint Options, as shown be-low on the left. Select | Advanced | Cut, Copy, And Paste | Show Paste Options Buttons (shown on the right). If you paste data into a PowerPoint table, the Paste Options icon does not appear.
You can also create a functional Excel sheet directly in your presentation. Go to the Insert tab, and from the Tables group, select| Table | Excel Spreadsheet. A spreadsheet will appear on the
slide for entering data, along with commands to perform Excel functions, as shown in Figure 13-1. Use the up and down arrows to move around in the
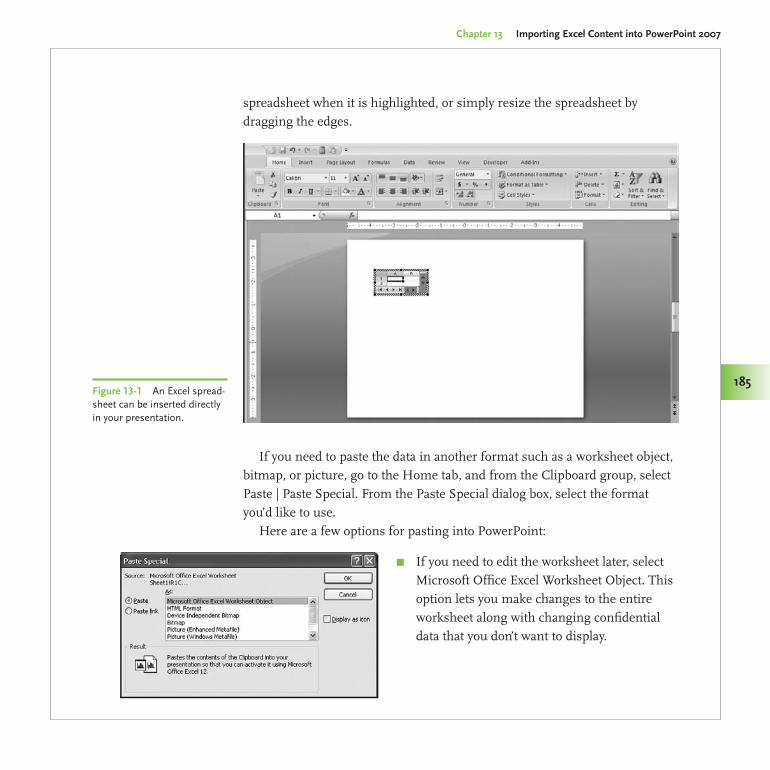
Chapter 13 Importing Excel Content into PowerPoint 2007
185
Made Easy/PowerPoint 2007 Graphics & Animation/Slack/0071600760/Chapter 13
185
spreadsheet when it is highlighted, or simply resize the spreadsheet by dragging the edges.
If you need to paste the data in another format such as a worksheet object, bitmap, or picture, go to the Home tab, and from the Clipboard group, select Paste | Paste Special. From the Paste Special dialog box, select the format you’d like to use.
Here are a few options for pasting into PowerPoint:
If you need to edit the worksheet later, select π
Microsoft Office Excel Worksheet Object. This option lets you make changes to the entire worksheet along with changing confidential data that you don’t want to display.
Figure 13-1 An Excel spread-sheet can be inserted directly in your presentation.
Made Easy/PowerPoint 2007 Graphics & Animation/Slack/0071600760/Chapter 13
PowerPoint 2007 Graphics and Animation Made Easy
186
If you want to paste the data using π Object Linking and Embedding (OLE) and as a PowerPoint icon instead of including the actual content, select Microsoft Office Excel Worksheet Object and select the Display As Icon checkbox. In your presentation, click the icon to see the content.
In the Paste Special dialog box, you can ensure the table in the π
presentation is updated when changes are made to the Excel data by selecting Paste Link. This will link to the source file and maintain the original formatting from Excel.
In the Paste Special dialog box, you can select Attach Hyperlink if you π
want to include a hyperlink in the presentation to your source data in Excel.
By clicking the down arrow in the Paste command group, you can π
select Paste As Hyperlink to insert a hyperlink to the source data in Excel. (Be sure to save the source data before attaching a hyperlink or this option will not work.)
If you want to paste as a picture, you can select Device Independent π
Bitmap, Bitmap, Picture (Enhanced Metafile), or Picture (Windows Metafile).
To paste as text, click Formatted Text (RTF) or Unformatted Text. π
You can also paste the data in the HTML format by selecting HTML π
Format.
You can expand the range of data pasted into your presentation when π
the correlating data on the Excel worksheet expands. Just define a name for the range of Excel data before you copy it, and then you can paste a link to that range. From the Home tab, go to the Clipboard group and select Paste | Paste Special. In the Paste Special dialog box, click Paste Link and select Microsoft Office Excel Worksheet Object from the drop-down list. This option works when you copy data that isn’t in table format in Excel.
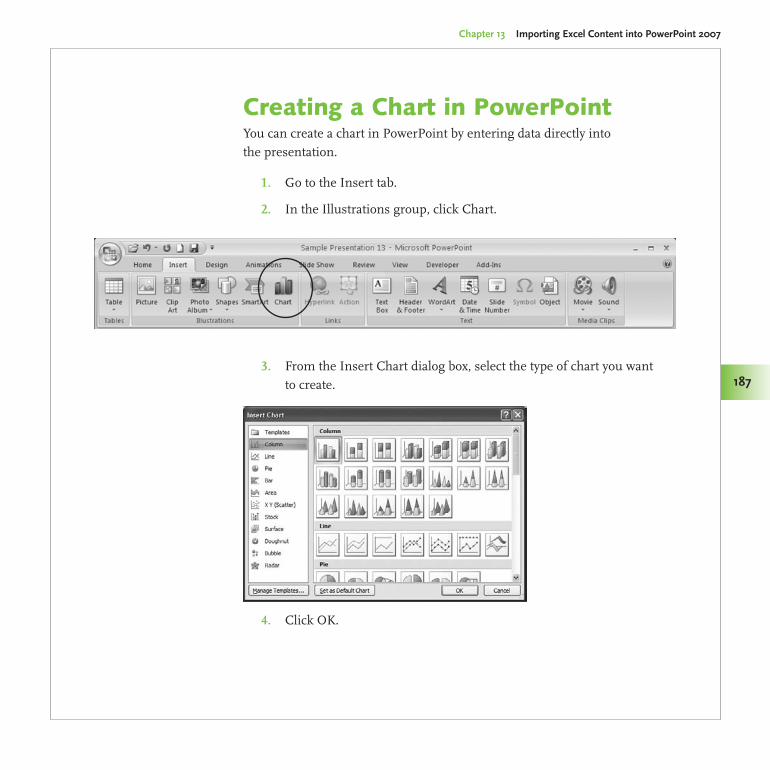
Made Easy/PowerPoint 2007 Graphics & Animation/Slack/0071600760/Chapter 13
Chapter 13 Importing Excel Content into PowerPoint 2007
187
Creating a Chart in PowerPointYou can create a chart in PowerPoint by entering data directly into the presentation.
Go to the Insert tab.1.
In the Illustrations group, click Chart.2.
From the Insert Chart dialog box, select the type of chart you want 3. to create.
Click OK.4.
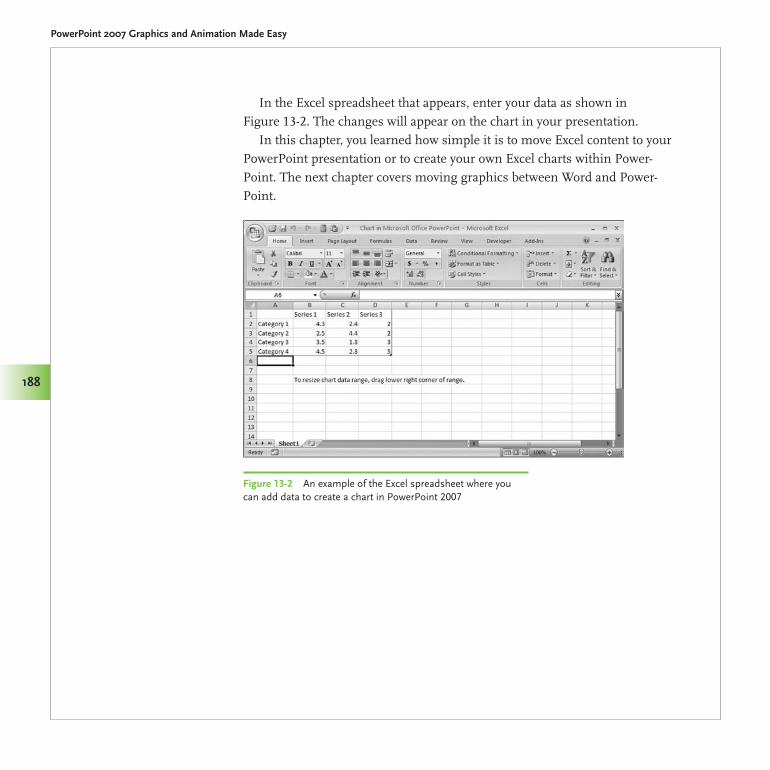
Made Easy/PowerPoint 2007 Graphics & Animation/Slack/0071600760/Chapter 13
PowerPoint 2007 Graphics and Animation Made Easy
188
In the Excel spreadsheet that appears, enter your data as shown in Figure 13-2. The changes will appear on the chart in your presentation.
In this chapter, you learned how simple it is to move Excel content to your PowerPoint presentation or to create your own Excel charts within Power-Point. The next chapter covers moving graphics between Word and Power-Point.
Figure 13-2 An example of the Excel spreadsheet where you can add data to create a chart in PowerPoint 2007
Moving Graphics Between Word and PowerPointOne of the best things about PowerPoint 2007 is the ability to move items back and forth between applications. Sure, you still need to watch out for a few things, but for the most part, moving graphics between PowerPoint 2007 and Word is pretty straightforward. In this chapter, we’ll look at how easy it is to move graphics between these applications; review the various ways you can format the object, text, or picture; and point out the exceptions to pasting in both applications. As a reminder, graphics can include clip art, pictures, charts, tables, or bulleted text.
14
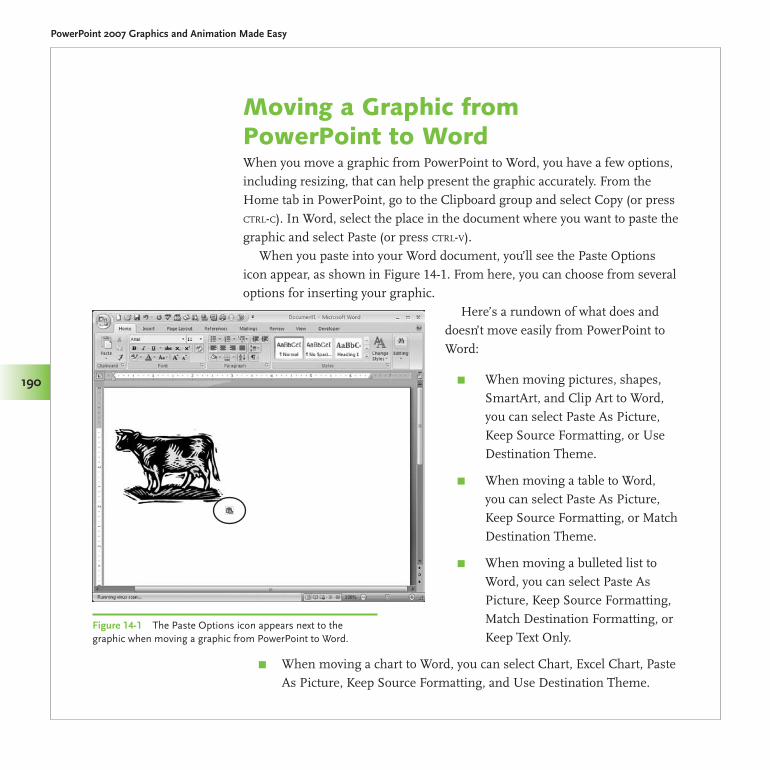
Made Easy/PowerPoint 2007 Graphics & Animation/Slack/0071600760/Chapter 14
PowerPoint 2007 Graphics and Animation Made Easy
190
Moving a Graphic from PowerPoint to WordWhen you move a graphic from PowerPoint to Word, you have a few options, including resizing, that can help present the graphic accurately. From the Home tab in PowerPoint, go to the Clipboard group and select Copy (or press ctrl-c). In Word, select the place in the document where you want to paste the graphic and select Paste (or press ctrl-v).
When you paste into your Word document, you’ll see the Paste Options icon appear, as shown in Figure 14-1. From here, you can choose from several options for inserting your graphic.
Here’s a rundown of what does and doesn’t move easily from PowerPoint to Word:
When moving pictures, shapes, π
SmartArt, and Clip Art to Word, you can select Paste As Picture, Keep Source Formatting, or Use Destination Theme.
When moving a table to Word, π
you can select Paste As Picture, Keep Source Formatting, or Match Destination Theme.
When moving a bulleted list to π
Word, you can select Paste As Picture, Keep Source Formatting, Match Destination Formatting, or Keep Text Only.
When moving a chart to Word, you can select Chart, Excel Chart, Paste π
As Picture, Keep Source Formatting, and Use Destination Theme.
Figure 14-1 The Paste Options icon appears next to the graphic when moving a graphic from PowerPoint to Word.
Made Easy/PowerPoint 2007 Graphics & Animation/Slack/0071600760/Chapter 14
Chapter 14 Moving Graphics Between Word and PowerPoint
191
When moving WordArt to Word, the only option that allows you to π
maintain the formatting is Paste As Picture. The other options—Keep Source Formatting, Match Destination Formatting, or Keep Text Only—will cause you to lose the WordArt formatting.
Let’s review what some of these options mean.
Paste As Picture π Pastes the graphic in as a picture
Keep Source Formatting π Maintains the original format from PowerPoint
Use Destination Theme, Match Destination Theme, or Match π
Destination Formatting Inserts the graphic with the same document theme or format as the Word document
Keep Text Only π Pastes as text into the Word document
Chart π Pastes a chart linked to Excel data
Excel Chart π Includes the entire workbook
Moving a Graphic from Word to PowerPointMoving a graphic from Word to PowerPoint is simple. From the Home tab in Word, go to the Clipboard group and select Copy (or press ctrl-c). In PowerPoint, select the slide where you want to paste the graphic and click Paste (or press ctrl-v). You’ll see the Paste Options icon appear. Click to decide how to insert your graphic.
Sometimes, you’ll find a font that you really want to use in your presenta-tion or document. You can embed TrueType fonts in Word and PowerPoint to ensure you have the look you want. The steps are similar in both programs, but we’ll look at how to do this in PowerPoint.
Anytime you select the Paste As Picture option, you cannot make changes to the graphic you’ve inserted. So if you need to adjust any of your graphics, make the changes in PowerPoint before pasting the graphic into Word.
MeMo
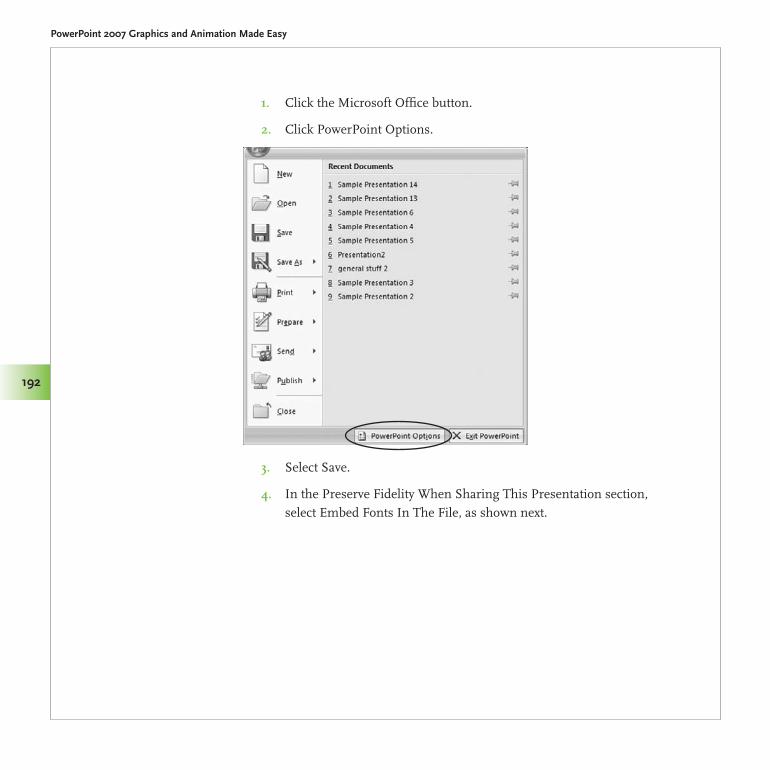
Made Easy/PowerPoint 2007 Graphics & Animation/Slack/0071600760/Chapter 14
PowerPoint 2007 Graphics and Animation Made Easy
192
Click the Microsoft Office button.1.
Click PowerPoint Options.2.
Select Save.3.
In the Preserve Fidelity When Sharing This Presentation section, 4.select Embed Fonts In The File, as shown next.
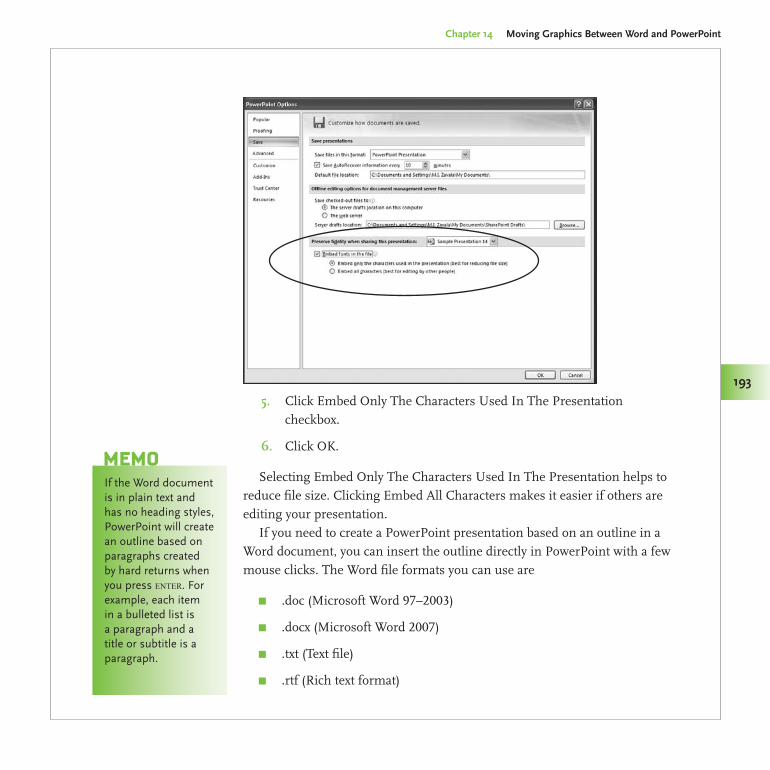
Chapter 14 Moving Graphics Between Word and PowerPoint
193
Made Easy/PowerPoint 2007 Graphics & Animation/Slack/0071600760/Chapter 14
193
Click Embed Only The Characters Used In The Presentation 5.checkbox.
Click OK.6.
Selecting Embed Only The Characters Used In The Presentation helps to reduce file size. Clicking Embed All Characters makes it easier if others are editing your presentation.
If you need to create a PowerPoint presentation based on an outline in a Word document, you can insert the outline directly in PowerPoint with a few mouse clicks. The Word file formats you can use are
.doc (Microsoft Word 97–2003) π
.docx (Microsoft Word 2007) π
.txt (Text file) π
.rtf (Rich text format) π
If the Word document is in plain text and has no heading styles, PowerPoint will create an outline based on paragraphs created by hard returns when you press enter. For example, each item in a bulleted list is a paragraph and a title or subtitle is a paragraph.
MeMo
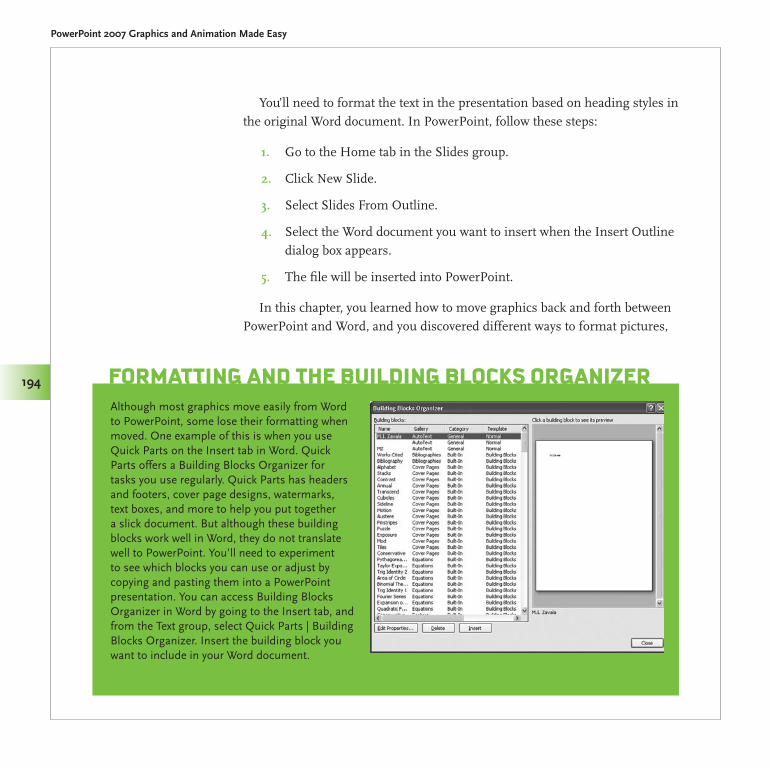
Made Easy/PowerPoint 2007 Graphics & Animation/Slack/0071600760/Chapter 14
PowerPoint 2007 Graphics and Animation Made Easy
194
You’ll need to format the text in the presentation based on heading styles in the original Word document. In PowerPoint, follow these steps:
Go to the Home tab in the Slides group.1.
Click New Slide.2.
Select Slides From Outline.3.
Select the Word document you want to insert when the Insert Outline 4.dialog box appears.
The file will be inserted into PowerPoint.5.
In this chapter, you learned how to move graphics back and forth between PowerPoint and Word, and you discovered different ways to format pictures,
Although most graphics move easily from Word to PowerPoint, some lose their formatting when moved. One example of this is when you use Quick Parts on the Insert tab in Word. Quick Parts offers a Building Blocks Organizer for tasks you use regularly. Quick Parts has headers and footers, cover page designs, watermarks, text boxes, and more to help you put together a slick document. But although these building blocks work well in Word, they do not translate well to PowerPoint. You’ll need to experiment to see which blocks you can use or adjust by copying and pasting them into a PowerPoint presentation. You can access Building Blocks Organizer in Word by going to the Insert tab, and from the Text group, select Quick Parts | Building Blocks Organizer. Insert the building block you want to include in your Word document.
ForMatting and the Building Blocks organizer
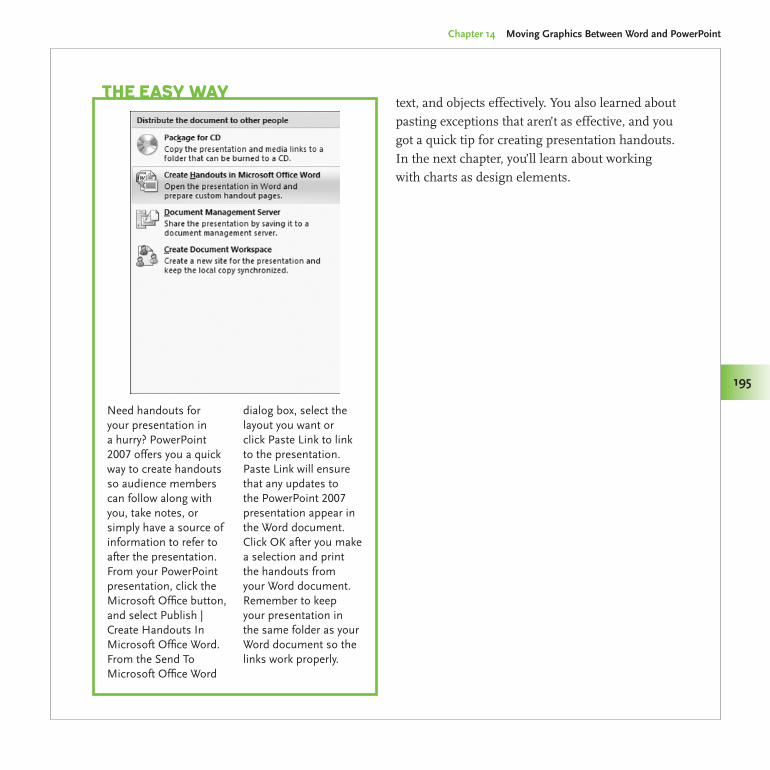
Made Easy/PowerPoint 2007 Graphics & Animation/Slack/0071600760/Chapter 14
Chapter 14 Moving Graphics Between Word and PowerPoint
195
text, and objects effectively. You also learned about pasting exceptions that aren’t as effective, and you got a quick tip for creating presentation handouts. In the next chapter, you’ll learn about working with charts as design elements.
Need handouts for your presentation in a hurry? PowerPoint 2007 offers you a quick way to create handouts so audience members can follow along with you, take notes, or simply have a source of information to refer to after the presentation. From your PowerPoint presentation, click the Microsoft Office button, and select Publish | Create Handouts In Microsoft Office Word. From the Send To Microsoft Office Word
dialog box, select the layout you want or click Paste Link to link to the presentation. Paste Link will ensure that any updates to the PowerPoint 2007 presentation appear in the Word document. Click OK after you make a selection and print the handouts from your Word document. Remember to keep your presentation in the same folder as your Word document so the links work properly.
the easy Way

This page intentionally left blank
Working with Charts as Design ElementsCharts are a great way to share numerical information with an audience. Whereas SmartArt is a good choice for other types of information, charts are really your best bet when you have to explain numbers. They are a great way to illustrate and compare numerical data.
From the military to corporations around the world, charts are a universal method for sharing numerical data. Although we don’t know when the chart was first invented, it’s clear that once it was, the chart became a communication tool that could be used to bridge languages and cultures.
With PowerPoint 2007, adding a professional looking chart to a presentation is a pretty simple process; the Quick Style Galleries you’ve seen in other areas of PowerPoint are also available with charts, and three different Ribbon tabs allow you to make modifications to your charts quickly and easily.
In this chapter, we’ll cover the commands available with each of the chart Ribbon tabs and show you how to create eye-catching charts.
15
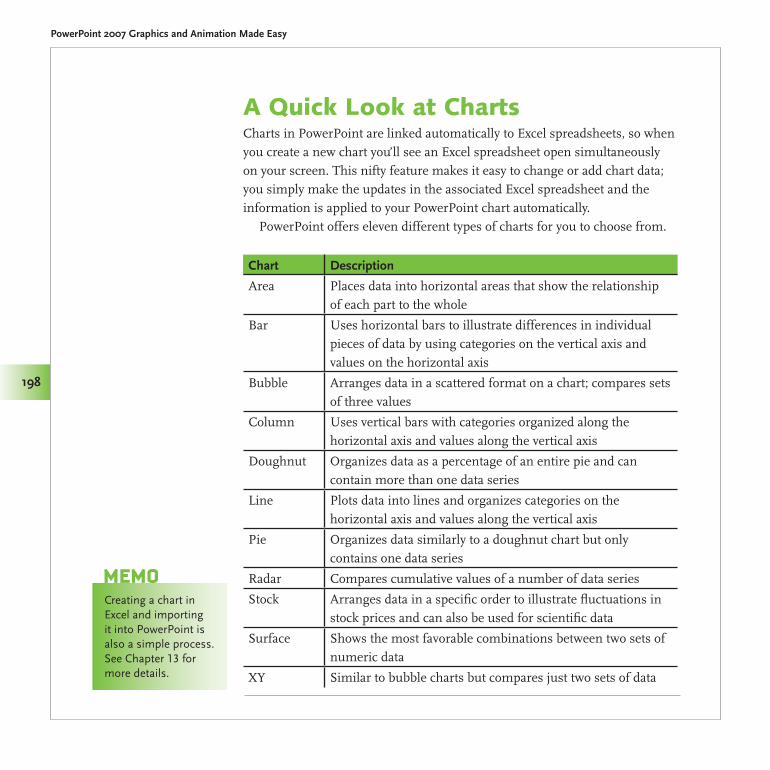
Made Easy/PowerPoint 2007 Graphics & Animation/Slack/0071600760/Chapter 15
PowerPoint 2007 Graphics and Animation Made Easy
198
A Quick Look at ChartsCharts in PowerPoint are linked automatically to Excel spreadsheets, so when you create a new chart you’ll see an Excel spreadsheet open simultaneously on your screen. This nifty feature makes it easy to change or add chart data; you simply make the updates in the associated Excel spreadsheet and the information is applied to your PowerPoint chart automatically.
PowerPoint offers eleven different types of charts for you to choose from.
Chart Description
Area Places data into horizontal areas that show the relationship of each part to the whole
Bar Uses horizontal bars to illustrate differences in individual pieces of data by using categories on the vertical axis and values on the horizontal axis
Bubble Arranges data in a scattered format on a chart; compares sets of three values
Column Uses vertical bars with categories organized along the horizontal axis and values along the vertical axis
Doughnut Organizes data as a percentage of an entire pie and can contain more than one data series
Line Plots data into lines and organizes categories on the horizontal axis and values along the vertical axis
Pie Organizes data similarly to a doughnut chart but only contains one data series
Radar Compares cumulative values of a number of data series
Stock Arranges data in a specific order to illustrate fluctuations in stock prices and can also be used for scientific data
Surface Shows the most favorable combinations between two sets of numeric data
XY Similar to bubble charts but compares just two sets of data
Creating a chart in Excel and importing it into PowerPoint is also a simple process. See Chapter 13 for more details.
MeMo
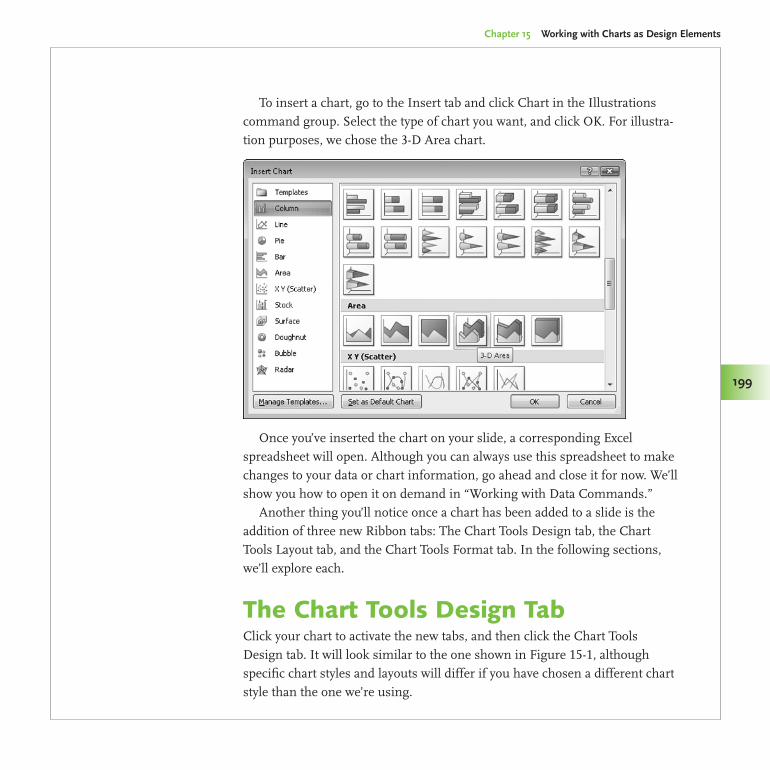
Made Easy/PowerPoint 2007 Graphics & Animation/Slack/0071600760/Chapter 15
Chapter 15 Working with Charts as Design Elements
199
To insert a chart, go to the Insert tab and click Chart in the Illustrations command group. Select the type of chart you want, and click OK. For illustra-tion purposes, we chose the 3-D Area chart.
Once you’ve inserted the chart on your slide, a corresponding Excel spreadsheet will open. Although you can always use this spreadsheet to make changes to your data or chart information, go ahead and close it for now. We’ll show you how to open it on demand in “Working with Data Commands.”
Another thing you’ll notice once a chart has been added to a slide is the addition of three new Ribbon tabs: The Chart Tools Design tab, the Chart Tools Layout tab, and the Chart Tools Format tab. In the following sections, we’ll explore each.
The Chart Tools Design TabClick your chart to activate the new tabs, and then click the Chart Tools Design tab. It will look similar to the one shown in Figure 15-1, although specific chart styles and layouts will differ if you have chosen a different chart style than the one we’re using.
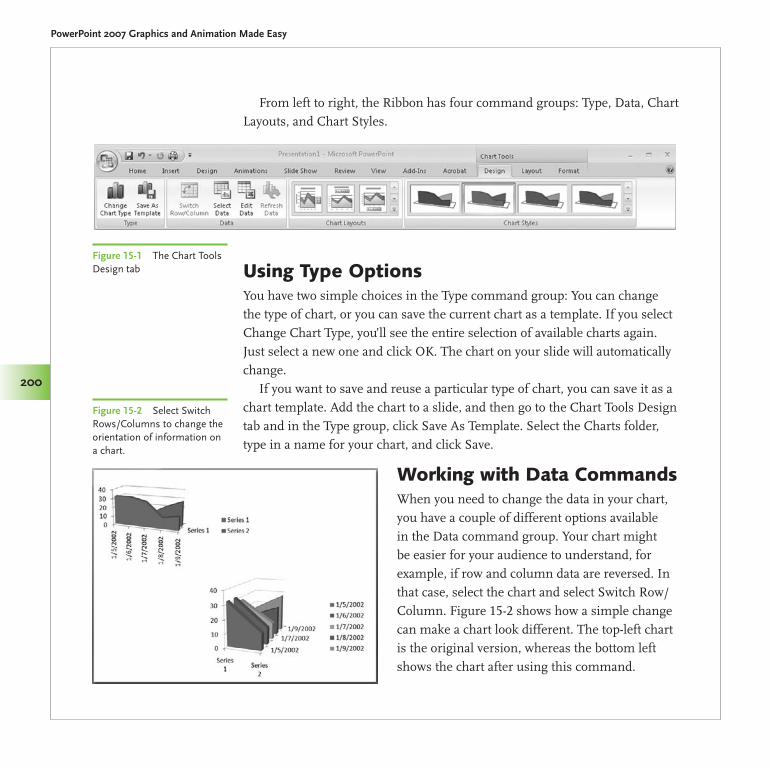
Made Easy/PowerPoint 2007 Graphics & Animation/Slack/0071600760/Chapter 15
PowerPoint 2007 Graphics and Animation Made Easy
200
From left to right, the Ribbon has four command groups: Type, Data, Chart Layouts, and Chart Styles.
Using Type OptionsYou have two simple choices in the Type command group: You can change the type of chart, or you can save the current chart as a template. If you select Change Chart Type, you’ll see the entire selection of available charts again. Just select a new one and click OK. The chart on your slide will automatically change.
If you want to save and reuse a particular type of chart, you can save it as a chart template. Add the chart to a slide, and then go to the Chart Tools Design tab and in the Type group, click Save As Template. Select the Charts folder, type in a name for your chart, and click Save.
Working with Data CommandsWhen you need to change the data in your chart, you have a couple of different options available in the Data command group. Your chart might be easier for your audience to understand, for example, if row and column data are reversed. In that case, select the chart and select Switch Row/Column. Figure 15-2 shows how a simple change can make a chart look different. The top-left chart is the original version, whereas the bottom left shows the chart after using this command.
Figure 15-1 The Chart Tools Design tab
Figure 15-2 Select Switch Rows/Columns to change the orientation of information on a chart.
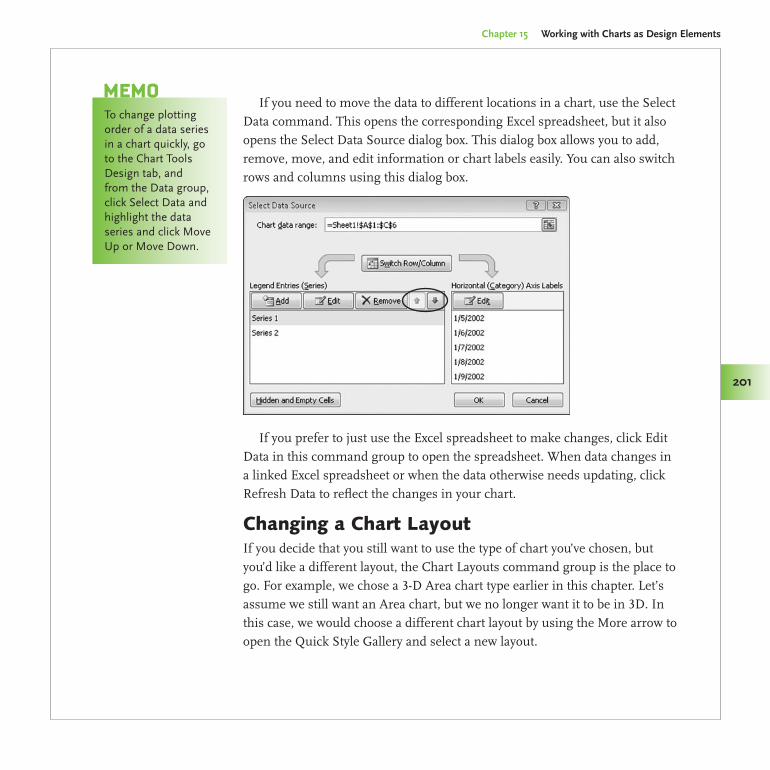
Chapter 15 Working with Charts as Design Elements
201
Made Easy/PowerPoint 2007 Graphics & Animation/Slack/0071600760/Chapter 15
201
If you need to move the data to different locations in a chart, use the Select Data command. This opens the corresponding Excel spreadsheet, but it also opens the Select Data Source dialog box. This dialog box allows you to add, remove, move, and edit information or chart labels easily. You can also switch rows and columns using this dialog box.
If you prefer to just use the Excel spreadsheet to make changes, click Edit Data in this command group to open the spreadsheet. When data changes in a linked Excel spreadsheet or when the data otherwise needs updating, click Refresh Data to reflect the changes in your chart.
Changing a Chart LayoutIf you decide that you still want to use the type of chart you’ve chosen, but you’d like a different layout, the Chart Layouts command group is the place to go. For example, we chose a 3-D Area chart type earlier in this chapter. Let’s assume we still want an Area chart, but we no longer want it to be in 3D. In this case, we would choose a different chart layout by using the More arrow to open the Quick Style Gallery and select a new layout.
To change plotting order of a data series in a chart quickly, go to the Chart Tools Design tab, and from the Data group, click Select Data and highlight the data series and click Move Up or Move Down.
MeMo
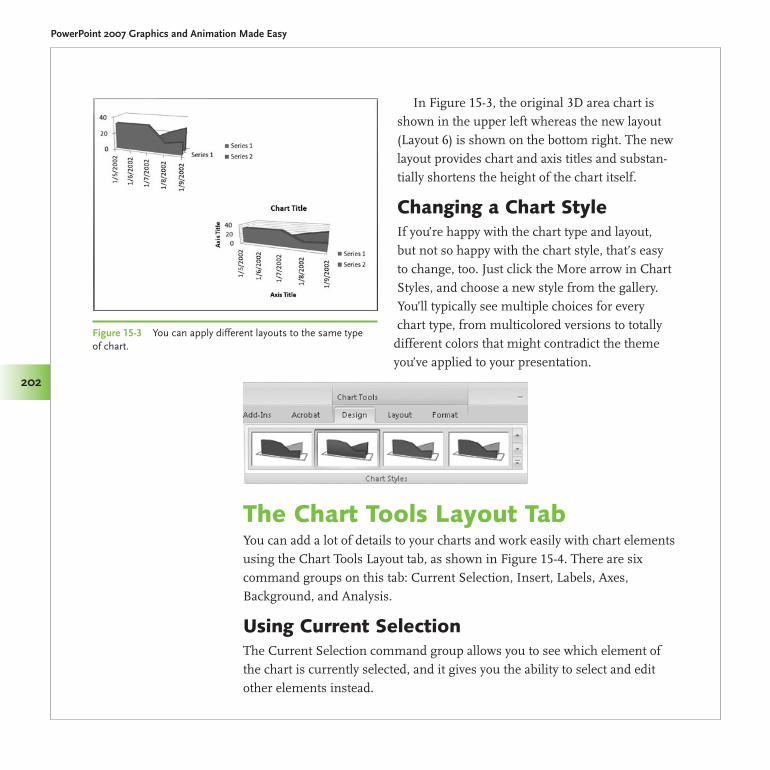
Made Easy/PowerPoint 2007 Graphics & Animation/Slack/0071600760/Chapter 15
PowerPoint 2007 Graphics and Animation Made Easy
202
In Figure 15-3, the original 3D area chart is shown in the upper left whereas the new layout (Layout 6) is shown on the bottom right. The new layout provides chart and axis titles and substan-tially shortens the height of the chart itself.
Changing a Chart StyleIf you’re happy with the chart type and layout, but not so happy with the chart style, that’s easy to change, too. Just click the More arrow in Chart Styles, and choose a new style from the gallery. You’ll typically see multiple choices for every chart type, from multicolored versions to totally
different colors that might contradict the theme you’ve applied to your presentation.
The Chart Tools Layout TabYou can add a lot of details to your charts and work easily with chart elements using the Chart Tools Layout tab, as shown in Figure 15-4. There are six command groups on this tab: Current Selection, Insert, Labels, Axes, Background, and Analysis.
Using Current SelectionThe Current Selection command group allows you to see which element of the chart is currently selected, and it gives you the ability to select and edit other elements instead.
Figure 15-3 You can apply different layouts to the same type of chart.
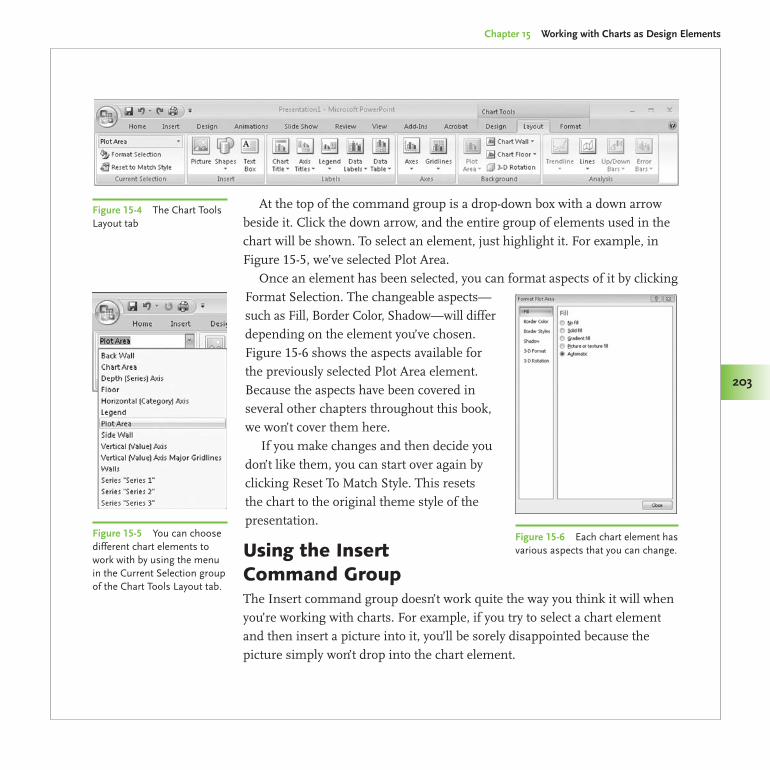
Made Easy/PowerPoint 2007 Graphics & Animation/Slack/0071600760/Chapter 15
Chapter 15 Working with Charts as Design Elements
203
At the top of the command group is a drop-down box with a down arrow beside it. Click the down arrow, and the entire group of elements used in the chart will be shown. To select an element, just highlight it. For example, in Figure 15-5, we’ve selected Plot Area.
Once an element has been selected, you can format aspects of it by clicking Format Selection. The changeable aspects—such as Fill, Border Color, Shadow—will differ depending on the element you’ve chosen. Figure 15-6 shows the aspects available for the previously selected Plot Area element. Because the aspects have been covered in several other chapters throughout this book, we won’t cover them here.
If you make changes and then decide you don’t like them, you can start over again by clicking Reset To Match Style. This resets the chart to the original theme style of the presentation.
Using the Insert Command GroupThe Insert command group doesn’t work quite the way you think it will when you’re working with charts. For example, if you try to select a chart element and then insert a picture into it, you’ll be sorely disappointed because the picture simply won’t drop into the chart element.
Figure 15-4 The Chart Tools Layout tab
Figure 15-5 You can choose different chart elements to work with by using the menu in the Current Selection group of the Chart Tools Layout tab.
Figure 15-6 Each chart element has various aspects that you can change.
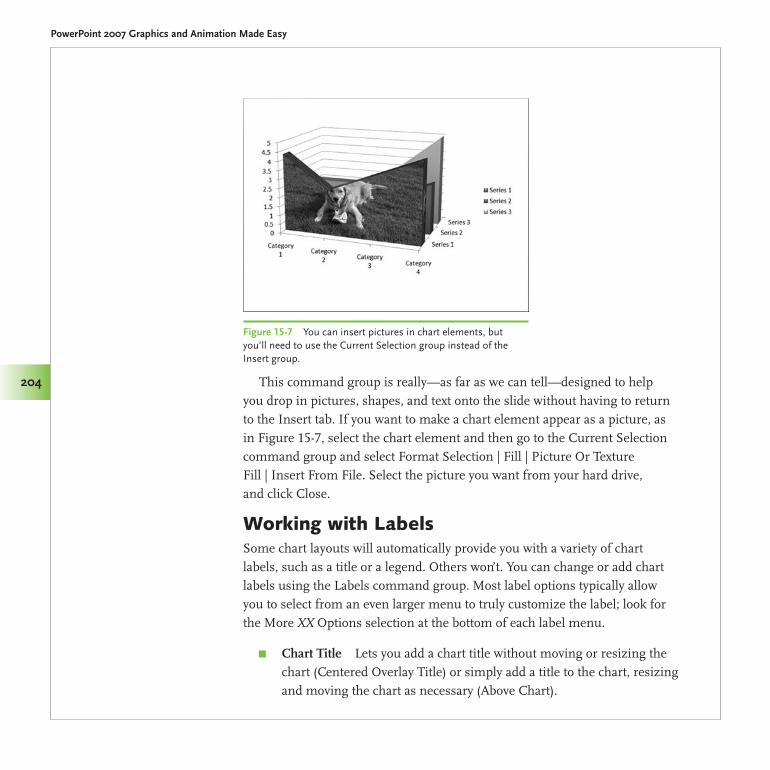
Made Easy/PowerPoint 2007 Graphics & Animation/Slack/0071600760/Chapter 15
PowerPoint 2007 Graphics and Animation Made Easy
204 This command group is really—as far as we can tell—designed to help you drop in pictures, shapes, and text onto the slide without having to return to the Insert tab. If you want to make a chart element appear as a picture, as in Figure 15-7, select the chart element and then go to the Current Selection command group and select Format Selection | Fill | Picture Or Texture Fill | Insert From File. Select the picture you want from your hard drive, and click Close.
Working with LabelsSome chart layouts will automatically provide you with a variety of chart labels, such as a title or a legend. Others won’t. You can change or add chart labels using the Labels command group. Most label options typically allow you to select from an even larger menu to truly customize the label; look for the More XX Options selection at the bottom of each label menu.
Chart Title π Lets you add a chart title without moving or resizing the chart (Centered Overlay Title) or simply add a title to the chart, resizing and moving the chart as necessary (Above Chart).
Figure 15-7 You can insert pictures in chart elements, but you’ll need to use the Current Selection group instead of the Insert group.
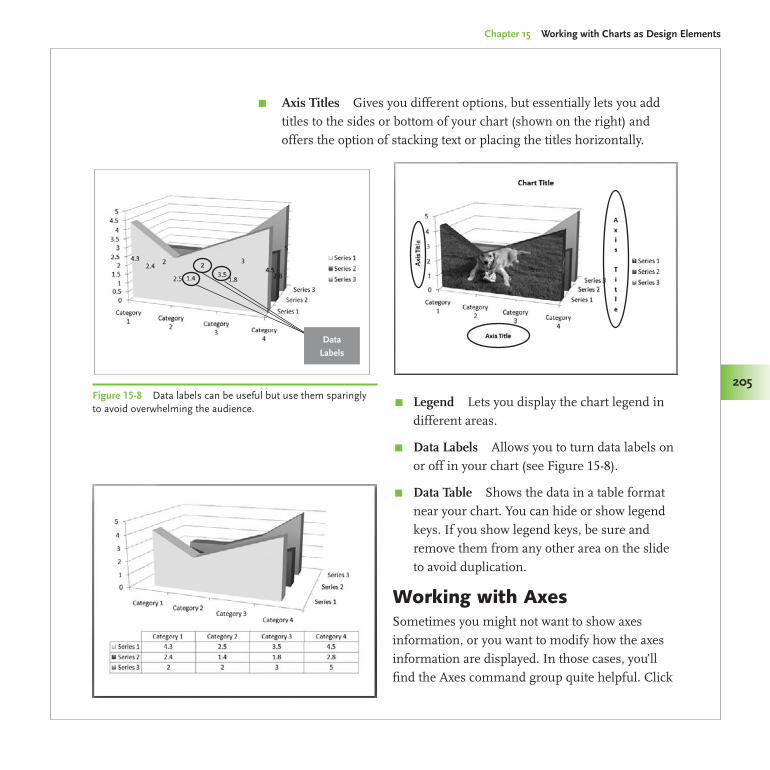
Made Easy/PowerPoint 2007 Graphics & Animation/Slack/0071600760/Chapter 15
Chapter 15 Working with Charts as Design Elements
205
Axis Titles π Gives you different options, but essentially lets you add titles to the sides or bottom of your chart (shown on the right) and offers the option of stacking text or placing the titles horizontally.
Legend π Lets you display the chart legend in different areas.
Data Labels π Allows you to turn data labels on or off in your chart (see Figure 15-8).
Data Table π Shows the data in a table format near your chart. You can hide or show legend keys. If you show legend keys, be sure and remove them from any other area on the slide to avoid duplication.
Working with AxesSometimes you might not want to show axes information, or you want to modify how the axes information are displayed. In those cases, you’ll find the Axes command group quite helpful. Click
Figure 15-8 Data labels can be useful but use them sparingly to avoid overwhelming the audience.
Data
Labels
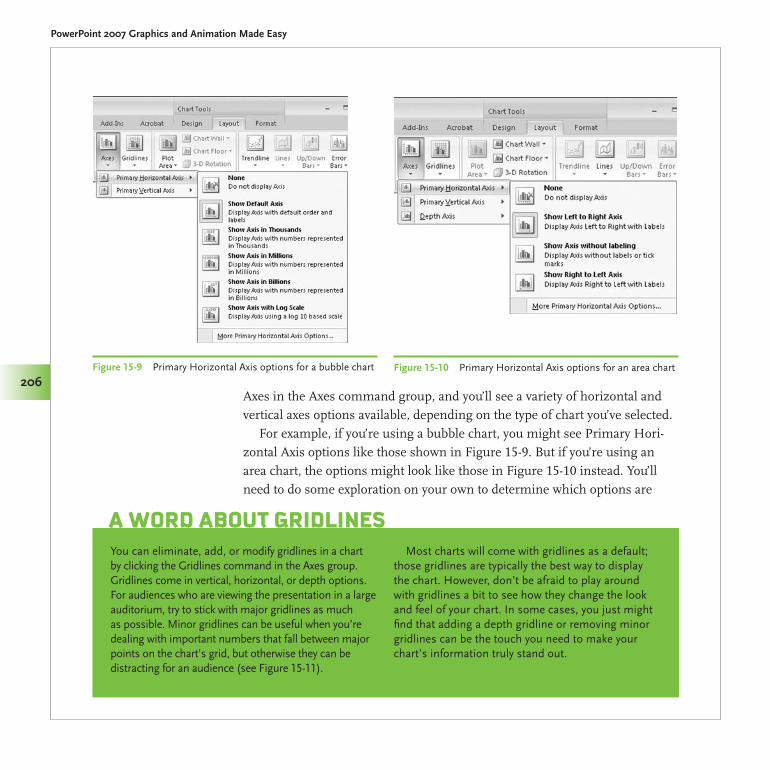
Made Easy/PowerPoint 2007 Graphics & Animation/Slack/0071600760/Chapter 15
PowerPoint 2007 Graphics and Animation Made Easy
206Axes in the Axes command group, and you’ll see a variety of horizontal and vertical axes options available, depending on the type of chart you’ve selected.
For example, if you’re using a bubble chart, you might see Primary Hori-zontal Axis options like those shown in Figure 15-9. But if you’re using an area chart, the options might look like those in Figure 15-10 instead. You’ll need to do some exploration on your own to determine which options are
Figure 15-9 Primary Horizontal Axis options for a bubble chart Figure 15-10 Primary Horizontal Axis options for an area chart
You can eliminate, add, or modify gridlines in a chart by clicking the Gridlines command in the Axes group. Gridlines come in vertical, horizontal, or depth options. For audiences who are viewing the presentation in a large auditorium, try to stick with major gridlines as much as possible. Minor gridlines can be useful when you’re dealing with important numbers that fall between major points on the chart’s grid, but otherwise they can be distracting for an audience (see Figure 15-11).
Most charts will come with gridlines as a default; those gridlines are typically the best way to display the chart. However, don’t be afraid to play around with gridlines a bit to see how they change the look and feel of your chart. In some cases, you just might find that adding a depth gridline or removing minor gridlines can be the touch you need to make your chart’s information truly stand out.
A Word About Gridlines
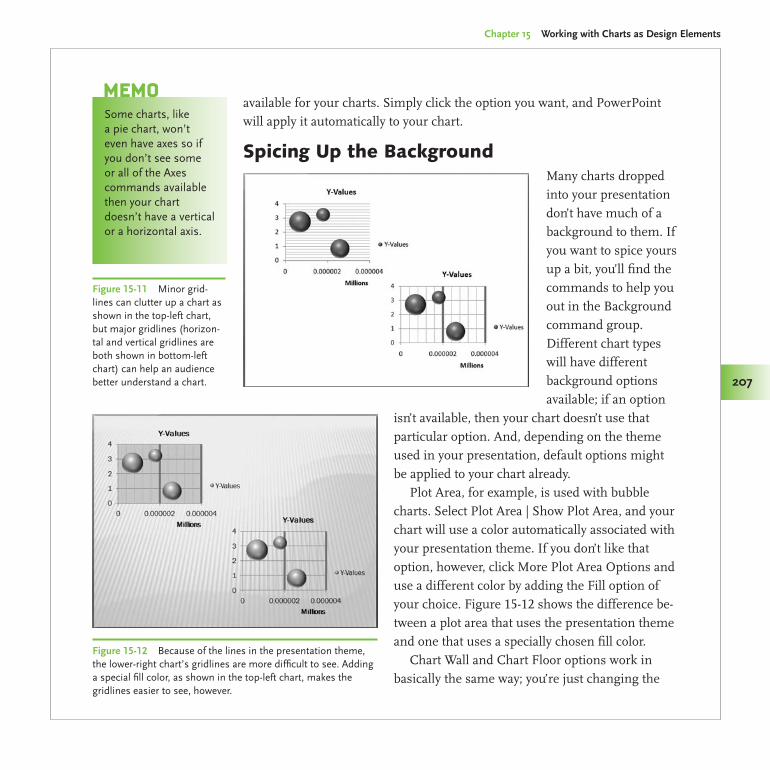
Made Easy/PowerPoint 2007 Graphics & Animation/Slack/0071600760/Chapter 15
Chapter 15 Working with Charts as Design Elements
207
available for your charts. Simply click the option you want, and PowerPoint will apply it automatically to your chart.
Spicing Up the BackgroundMany charts dropped into your presentation don’t have much of a background to them. If you want to spice yours up a bit, you’ll find the commands to help you out in the Background command group. Different chart types will have different background options available; if an option
isn’t available, then your chart doesn’t use that particular option. And, depending on the theme used in your presentation, default options might be applied to your chart already.
Plot Area, for example, is used with bubble charts. Select Plot Area | Show Plot Area, and your chart will use a color automatically associated with your presentation theme. If you don’t like that option, however, click More Plot Area Options and use a different color by adding the Fill option of your choice. Figure 15-12 shows the difference be-tween a plot area that uses the presentation theme and one that uses a specially chosen fill color.
Chart Wall and Chart Floor options work in basically the same way; you’re just changing the
Figure 15-11 Minor grid-lines can clutter up a chart as shown in the top-left chart, but major gridlines (horizon-tal and vertical gridlines are both shown in bottom-left chart) can help an audience better understand a chart.
Some charts, like a pie chart, won’t even have axes so if you don’t see some or all of the Axes commands available then your chart doesn’t have a vertical or a horizontal axis.
MeMo
Figure 15-12 Because of the lines in the presentation theme, the lower-right chart’s gridlines are more difficult to see. Adding a special fill color, as shown in the top-left chart, makes the gridlines easier to see, however.
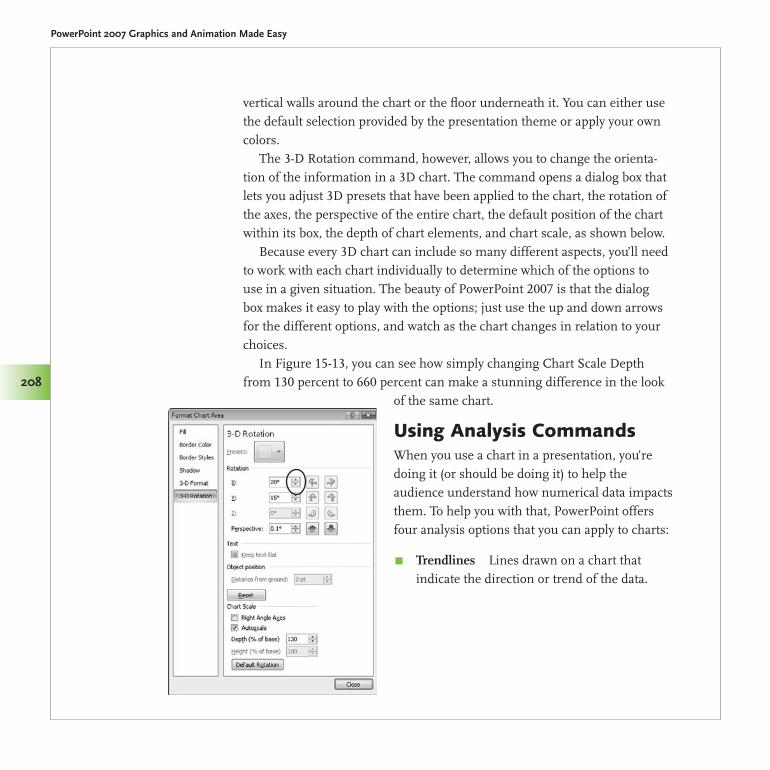
Made Easy/PowerPoint 2007 Graphics & Animation/Slack/0071600760/Chapter 15
PowerPoint 2007 Graphics and Animation Made Easy
208
vertical walls around the chart or the floor underneath it. You can either use the default selection provided by the presentation theme or apply your own colors.
The 3-D Rotation command, however, allows you to change the orienta-tion of the information in a 3D chart. The command opens a dialog box that lets you adjust 3D presets that have been applied to the chart, the rotation of the axes, the perspective of the entire chart, the default position of the chart within its box, the depth of chart elements, and chart scale, as shown below.
Because every 3D chart can include so many different aspects, you’ll need to work with each chart individually to determine which of the options to use in a given situation. The beauty of PowerPoint 2007 is that the dialog box makes it easy to play with the options; just use the up and down arrows for the different options, and watch as the chart changes in relation to your choices.
In Figure 15-13, you can see how simply changing Chart Scale Depth from 130 percent to 660 percent can make a stunning difference in the look
of the same chart.
Using Analysis CommandsWhen you use a chart in a presentation, you’re doing it (or should be doing it) to help the audience understand how numerical data impacts them. To help you with that, PowerPoint offers four analysis options that you can apply to charts:
Trendlines π Lines drawn on a chart that indicate the direction or trend of the data.
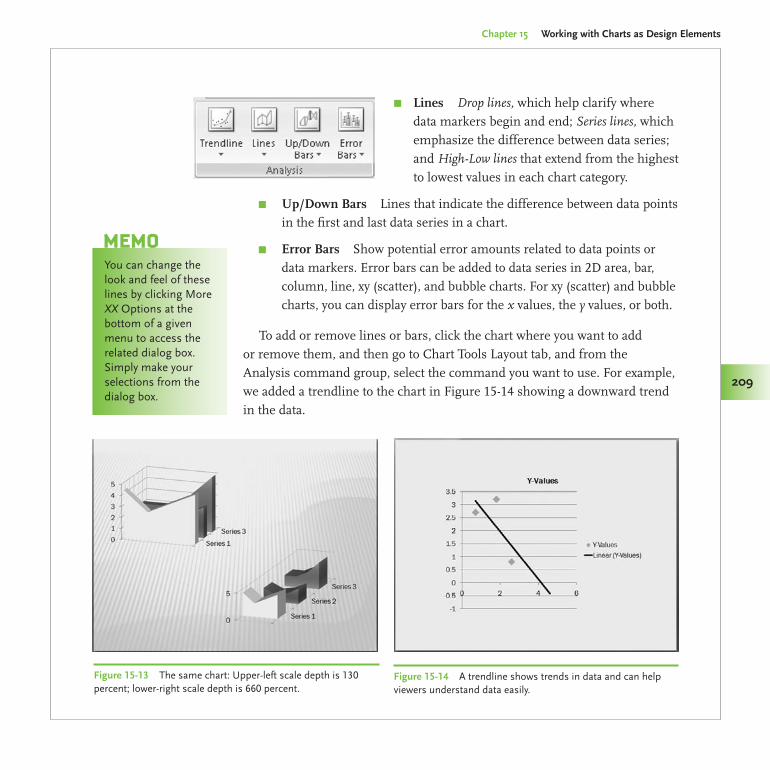
Chapter 15 Working with Charts as Design Elements
209
Made Easy/PowerPoint 2007 Graphics & Animation/Slack/0071600760/Chapter 15
209
Lines π Drop lines, which help clarify where data markers begin and end; Series lines, which emphasize the difference between data series; and High-Low lines that extend from the highest to lowest values in each chart category.
Up/Down Bars π Lines that indicate the difference between data points in the first and last data series in a chart.
Error Bars π Show potential error amounts related to data points or data markers. Error bars can be added to data series in 2D area, bar, column, line, xy (scatter), and bubble charts. For xy (scatter) and bubble charts, you can display error bars for the x values, the y values, or both.
To add or remove lines or bars, click the chart where you want to add or remove them, and then go to Chart Tools Layout tab, and from the Analysis command group, select the command you want to use. For example, we added a trendline to the chart in Figure 15-14 showing a downward trend in the data.
Figure 15-13 The same chart: Upper-left scale depth is 130 percent; lower-right scale depth is 660 percent.
Figure 15-14 A trendline shows trends in data and can help viewers understand data easily.
You can change the look and feel of these lines by clicking More XX Options at the bottom of a given menu to access the related dialog box. Simply make your selections from the dialog box.
MeMo
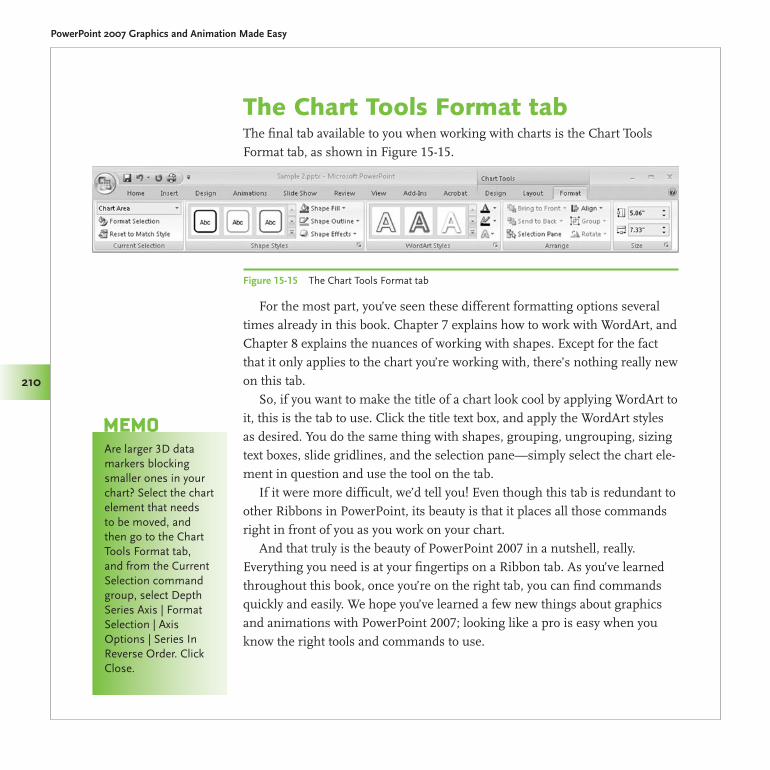
PowerPoint 2007 Graphics and Animation Made Easy
210
Made Easy/PowerPoint 2007 Graphics & Animation/Slack/0071600760/Chapter 15
The Chart Tools Format tabThe final tab available to you when working with charts is the Chart Tools Format tab, as shown in Figure 15-15.
Figure 15-15 The Chart Tools Format tab
For the most part, you’ve seen these different formatting options several times already in this book. Chapter 7 explains how to work with WordArt, and Chapter 8 explains the nuances of working with shapes. Except for the fact that it only applies to the chart you’re working with, there’s nothing really new on this tab.
So, if you want to make the title of a chart look cool by applying WordArt to it, this is the tab to use. Click the title text box, and apply the WordArt styles as desired. You do the same thing with shapes, grouping, ungrouping, sizing text boxes, slide gridlines, and the selection pane—simply select the chart ele-ment in question and use the tool on the tab.
If it were more difficult, we’d tell you! Even though this tab is redundant to other Ribbons in PowerPoint, its beauty is that it places all those commands right in front of you as you work on your chart.
And that truly is the beauty of PowerPoint 2007 in a nutshell, really. Everything you need is at your fingertips on a Ribbon tab. As you’ve learned throughout this book, once you’re on the right tab, you can find commands quickly and easily. We hope you’ve learned a few new things about graphics and animations with PowerPoint 2007; looking like a pro is easy when you know the right tools and commands to use.
Are larger 3D data markers blocking smaller ones in your chart? Select the chart element that needs to be moved, and then go to the Chart Tools Format tab, and from the Current Selection command group, select Depth Series Axis | Format Selection | Axis Options | Series In Reverse Order. Click Close.
MeMo


This page intentionally left blank
Made Easy/PowerPoint 2007 Graphics & Animation/Slack/0071600760/FM
A
active verbs, 90Add Motion Path dialog box,
177Add Shape Before command,
126Add-Ins tab, 28adjusting pictures, 29–30.aiff file format, 150Album Content section
(Photo Album dialog box), 49–51
Album Layout section (Photo Album dialog box), 49, 51–53
albums. See photo albumsaligning
clip art on slide, 75picture to grid, 58–59text boxes, 60text in table cells, 81WordArt, 104–106
animation. See also clip art; movies
about, 163–164applying from
Animations tab, 168–169
arranging clip art on slide, 146–147
built-in tools for, 168bulleted text with, 164,
174, 175combining objects for
single, 174Custom Animation pane
for, 169–172easy bulleted text, 175motion paths, 177–178presentations with
clip art, 144–145removing, 173slide transitions for
adding, 178–179SmartArt with,
136–137sound with, 164timing for, 173uniform use of, 164using for separate
objects, 170–173Animations tab, 168, 175area charts, 198, 206Arrange group commands,
104–106arrows, 115art. See clip art; SmartArt.asf file format, 140
aspect ratios, 40, 81asymmetry, 7.au file format, 150audience
leading through story, 25
styles of learning for, 130
tailoring slide show to, 17
Autofit for WordArt, 102.avi file format, 140axes
using titles for, 205working with chart,
205–207
B
backgroundsadding interest with, 31adjusting clip art, 70chart, 207–208choosing movie, 148color for, 22, 44modifying WordArt, 94texture, 45transparent clip art, 66using presets for, 43
bar charts, 198
Index
PowerPoint 2007 Graphics and Animation Made Easy
214
Bevel effect, 31, 32, 113body placeholders, 20–21borders
customizing SmartArt, 133
experimenting with, 33framing pictures with,
40–42table, 84–85
brevity, 98brightness, 29, 30Bring Forward order option,
76Bring To Front order option,
76bubble charts, 198, 206–207Building Blocks Organizer
(Word), 194built-in animation tools,
168–174built-in layouts, 9bulleted text
applying animation to, 164, 174, 175
triggering sound with, 155–156
using, 31
C
captions for pictures, 54, 56CDs, 152, 157Cell Bevel effect, 85Cell Size group (Table Tools
Layout tab), 81cells. See also tables
adjusting size of table, 81
aligning text in, 81merging table, 79–80sizing, 81
Chart Tools Design tab, 199–202
Chart Tools Format tab, 210Chart Tools Layout tab,
202–209charts
advantages of, 197backgrounds for,
207–208changing data plotting
order on, 201creating, 187–188data analysis options for,
208–209gridlines for, 206–207Insert command group
options for, 203–204inserting, 199labels for, 204–205modifying layout of,
201–202moving to Word,
190–191pasting from Excel,
182–183SmartArt vs., 123titles for, 204types of PowerPoint, 198using Chart Tools
Design tab, 199–200various styles for, 201viewing element
currently selected, 202–203
working with axes, 205–207
clip artaccessing from Office
Online, 62–64adding gradient stops,
71
adjusting backgrounds in, 70
aligning, 75applying 3-D format to,
71arranging on slide,
74–76, 146–147changing color in parts
of, 68creating, 65–67downloading, 63–64editing points in, 72–73including in Clip
Organizer, 66–67line color and style
choices for, 70movies of, 144–145ordering options for,
75–76organizing, 65pixelizing when
resizing, 75recoloring, 69redoing look of, 68–69reviewing animated
GIFs, 145saving as picture, 74shadows added to, 713-D rotation with, 72transparent
backgrounds for, 66types of collections for,
62ungrouping, 67–68using, 23–24, 61vector art and, 67washing out, 73–74Web resources for, 34,
62–65Clip Art pane, 62, 144–145
215
Index
Clip Organizerabout, 65adding art to, 66–67inserting sound file
from, 152–153Close button (Format Picture
dialog box), 69color
adding with presets, 42adjusting table, 82–83changing table’s border,
84custom background, 44customizing for
SmartArt shape, 133formatting for SmartArt
outlines, 132inserting in shape fill,
110–111modifying layout,
128–129modifying portions of
clip art, 68recoloring clip art, 69using in slides, 22
Colors dialog box, 110–111column charts, 198columns. See also tables
deleting, 79inserting in tables,
78–79orienting on chart, 200
commands. See also shortcut menu
access from picture, 41Add Shape Before, 126Arrange group, 104–106Borders, 84Current Selection,
202–203Edit Shape, 116–117
found in Data command group, 200–201
Grid Settings, 105Insert command group
options, 203–204Movie Options group,
143Reroute Connectors,
116, 136Scribble, 117, 118–119Shape Effects, 112–113Shape Fill, 109–110, 133Shapes, 108–109Text Box, 101–104Text Outline, 953-D Format, 98–993-D Rotation, 100–101Type group, 200using Chart Tools
Layout tab, 202–209View Gridlines, 104–105
compatibilityconverting movies for,
140–141Excel content, 181PowerPoint table, 80
compressing files, 29, 30computer speakers, 157connecting lines, 116, 136content. See also story
customizing layout to fit, 20–25
SmartArt and, 121–122contrast adjustments, 29cropping pictures, 37–39Current Selection command
group, 202–203current slide, 165Custom Animations pane
adding sound to animation in, 156
applying animations from, 169–172
illustrated, 168selecting, 142
custom layouts. See also layouts
creating to fit content, 20–25
customizing Title And Content Slides, 22–23
designing custom Title Slides, 21–22
finding inspiration for, 25–26
outlining, 18–19Custom tab (Colors dialog
box), 110–111
D
dataanalyzing chart, 208–209copying Excel
worksheet, 183–186formatting and
replotting chart, 200–201
labels for chart, 205types of charts for, 198
deletinganimation, 173chart gridlines, 206–207placeholders, 15slide from master
layout, 16table rows or columns,
79design. See also layouts
about, 4adding interest to
information with, 31
PowerPoint 2007 Graphics and Animation Made Easy
216
Index
creating use for, 4–5Design tab vs. Table
Tools Design tab, 82keeping invisible, 5–6modifying chart layout,
201–202Rule of Thirds, 39shadows in shapes, 109simplicity in, 5, 6, 164visual balance, 6–7white space in, 7–8, 109
Design tab, 82diagram animation, 136.doc file format, 193.docx file format, 193doughnut charts, 198downloading clip art, 63–64dragging text boxes, 60Drawing Tools Format tab
Arrange group commands on, 104–106
options for shapes on, 109
Shape Styles options on, 94
Text Outline command on, 95
Transform options on, 95–97
using with Format Text Effects dialog box, 98
drop lines, 209duplicating slides, 12
E
Edit Photo album, 52Edit Shape command,
116–117
editingchart gridlines, 206–207entire look of clip art,
68–69photo albums, 54–55points in clip art, 72–73shapes, 114–117SmartArt layouts
midstream, 1283-D art in 2-D, 131
effectspicture, 30–32using with WordArt,
91–92, 95–104elements
found in Slide Masters, 13
slide, 8–9triggering sound with
slide, 155–156viewing currently
selected chart, 202–203
embeddingfonts, 191, 192–193movie files, 141narration into
presentation, 159presentation characters,
193sound, 151
error bars, 209Excel
copying worksheet data into PowerPoint, 183–186
importing charts from, 182
working with spreadsheet data from, 201
F
Fade dialog box, 156file formats
movie, 140–141sound, 150sound conversion
utilities and, 150–151Word, 193
files. See also file formatscompressing, 29, 30finding downloaded clip
art, 63inserting movies in
presentation from, 141–144
looping sound, 153presentation
performance and movie, 148
sound conversion utilities, 150–151
filladding to shapes,
109–111adding to WordArt,
91–92removing from images,
70flipping WordArt, 106folders
organizing pictures in, 29
presentation and movies in same, 141
fonts, 191, 192–193Format Background dialog
box, 43Format Chart Area dialog,
208
217
Index
Format Picture dialog boxdisplaying from photo,
55recoloring graphics
with, 69using, 41
Format Shape dialog box, 74, 115
Format Text Effects dialog boxabout, 97Text Box command in,
101–1043-D Format command
from, 98–993-D Rotation command,
100–101formatting. See also specific
Format dialog boxes
changing SmartArt shape’s, 131–132
chart data, 200–201keeping WordArt, 191lost when graphic
copied from Word, 194
3-D, 71, 98–99four-picture layout, 57framing
adding with presets, 42borders for, 40–40–6options for, 33–34selecting shapes for
photo albums, 52–53freeform shapes, 116–117,
118
G
GIF animation. See animationGlow effect, 31gradient stops, 71
graphics. See also animation; clip art; images; pictures; SmartArt
design trends in, 5recoloring, 69styles of supporting, 3–4washing out, 73–74
Grid Settings command, 105gridlines
adding, modifying, or deleting chart, 206–207
aligning picture to, 58–59
text box alignment to, 60WordArt alignment to,
104–106Grids and Guides dialog box,
105grouping
clip art, 67–68objects when animating
tables, 176
H
handoutscreating quick, 195moving graphics from
PowerPoint to Word, 190–191
taking graphics from Word into PowerPoint, 191–195
header rows, 86hidden objects, 174hiding/showing SmartArt on
consecutive slides, 133High-Low lines, 209HSL color model, 110–111
I
images. See also clip art; pictures; SmartArt; WordArt
applying 3-D format to, 71
blending in slides, 2–4changing portions of
clip art color, 68editing points in clip art,
72–73gradient stops in, 71landscape photos as
background, 31line color and style for,
70manipulating clip art,
67–68recoloring graphic, 69removing fill from, 70revising look of clip art,
68–69shadows for clip art, 71supporting text with,
2–33-D rotation for, 72using pictures, 27washing out clip art,
73–74WordArt with, 72
importing Excel charts and data, 182–188
Insert Chart dialog box, 187, 199
Insert command group options, 203–204
Insert tab, 108–109invisibility of design, 5–6
PowerPoint 2007 Graphics and Animation Made Easy
218
L
labels, chart, 204–205landscape photos, 31Laws of Simplicity, The
(Maeda), 5layouts
built-in, 9changing direction for
SmartArt, 126deleting slide from
master, 16displaying content with
SmartArt, 121–122editing SmartArt, 128effect of changes on
text, 8elements of slide, 8–9finding inspiration for,
25–26groups of SmartArt,
122–124modifying chart,
201–202modifying color
throughout, 128–129photo album, 48renaming, 16text boxes in, 56–57two- and four-picture, 57workspace in, 11
learning styles, 130legends, 205line charts, 198lines
applying line weight to WordArt, 93
color and style for clip art, 70
options for chart analysis, 209
rerouting direction of connector, 116, 136
selecting scribble, 117, 118–119
linkingmovies to presentation,
141objects to animate, 174sound files, 151
Live Preview, 31, 169logos, 21–22looping sound files, 153Loveland Round-up, 2
M
Maeda, John, 5margins in WordArt text
boxes, 103–104merging table cells, 79–80microphone, 157–158Microsoft Excel. See ExcelMicrosoft Office Online. See
Office OnlineMicrosoft Windows Media
Encoder, 141, 150Microsoft Word. See Word.midi file format, 150minimalist design, 5motion paths, 177–178Movie Options dialog box,
144Movie Tools Options tab, 143movies
adding clip art, 144–145arranging on slide,
146–147choosing picture
backgrounds compatible with, 148
file formats for, 140–141
inserting from file, 141–144
linking vs. embedding, 141
Movie Options group commands for, 143
performance considerations for, 148
timing play of, 142using in presentations,
139–140moving graphics
about, 189from PowerPoint to
Word, 190–191from Word to
PowerPoint, 191–195.mp3 file format, 150.mpg/mpeg file format, 140multiple monitor capability,
167My Collections, 62My Pictures folder, 29
N
narration, 157–161adjusting timing for,
158–159embedding into
presentation, 159live recording during
presentations, 160–161
playing with other sounds, 157
practicing, 161recording, 157–159timing slide changes
with, 159
219
Index
notesinvisible in presentation,
11seeing in Presenter
View, 167Notes pane, 11
O
objectsadjusting timing for
animated, 173animating separate,
170–173combining for single
animation, 174effect on animation of
hidden, 174grouping/ungrouping
when animating tables, 176
linking to animate, 174simplicity in animating,
164tips for layering, 26types for custom layouts,
21Office Collections, 62Office Online
downloading clip art from, 62–64
searching clip art collections on, 63, 64–65
ordering clip art, 75–76Outline tab, 18, 19outlines
about presentation, 18adding to WordArt,
92–93, 94–95
applied for PowerPoint text in Word, 193
formatting color and weight of lines, 132
steps for presentation, 18–19
viewing in new slide, 20outlining shapes, 112
P
Package For CD option, 141, 151
passive verbs, 90Paste As Picture option, 191Paste Options icon, 182, 190Paste Special dialog box, 175,
185, 186pasting
Excel charts in presentations, 182–183
graphics from PowerPoint to Word, 190–191
graphics from Word to PowerPoint, 191–195
worksheet data from Excel, 183–186
PFCMedia, 141, 151Photo Album dialog box
Album Content section, 49–51
Album Layout section, 49, 51–53
illustrated, 49inserting text box from,
54photo albums
about, 47
captions and text for, 54, 56–57
creating, 48–49displaying photos in,
55–60editing, 54–55inserting and adjusting
pictures in, 49–51layouts for, 48, 49, 51–53multiple pictures
inserted in, 49previewing pictures in,
50–51themes for, 53–54
photos. See picturesPicture Effects, 30–32, 33Picture Shapes, 35–36Picture Styles gallery, 33–34Picture toolbar, 35Picture Tools Format tab
about, 28cropping from, 37–38finding, 35using when movie
highlighted, 144pictures. See also shortcut
menuaccessing shortcut
menu from, 41adding effects to, 30–32adjusting, 29–30aligning to grid, 58–59borders for, 40–40–6captions for, 54, 56choosing for movie
background, 148cropping and sizing,
37–40, 56, 58displaying in photo
albums, 55–60framing, 33–34, 40–42
PowerPoint 2007 Graphics and Animation Made Easy
220
inserting and adjusting in albums, 49–51
inserting in chart elements, 203–204
layouts with two- and four-, 57–58
permissions to use, 34placing anywhere in
SmartArt shapes, 134positioning, 40, 56presets for powerful,
42–45resetting adjustments
to, 30saving clip art as, 74selecting shape for,
35–36SmartArt used with, 129taking better, 36using in slides, 27
pie charts, 198, 207pixelization, 75placeholders
deleting, 15inserting in slides, 14objects for body, 20–21putting custom text in,
15shown in workspace, 11using in layout, 8
Play Movie dialog box, 142Play Sound dialog box, 153,
155points
editing clip art, 72–73modifying freeform
shape, 116, 117positioning
pictures, 40, 56text boxes, 60
.potx files, 14
PowerPointbuilt-in layouts for, 9charts in, 198Clip Organizer, 65copying Excel worksheet
data into, 183–186importing Excel charts
into, 182moving graphics from
Word to, 191–195pasting graphics to
Word from, 190–191Presenter View in, 167table compatibility with
earlier versions, 80PowerPoint Options dialog
box, 184presentations. See also story
about, 1adding slides to, 12, 20applying design
principles to, 4–8audience’s learning
styles and, 130blending images in, 2–4clip art movies in,
144–145creating quick handouts
of, 195inserting movies in,
141–144keeping in same folder
with movies, 141layout concepts for, 8–10movies in, 139–140notes invisible during,
11outlining, 18–19pasting Excel charts in,
182–183
playing CDs with, 152, 157
recording narration during, 160–161
rehearsing, 164–167tailoring to audience, 17using multiple monitors
in Presenter View, 167
worksheet data pasted from Excel, 183–186
Presenter View, 167presets
adding color and framing with, 42
applying picture effects with, 33
creating powerful pictures with, 42–45
found in Format Text Effects dialog box, 101
using background, 43Preview/Properties dialog
box, 145previewing
photos in album, 50–51presentations by
rehearsing, 164–165purpose of design, 4–5
Q
Quick Parts, 194Quick Styles galleries
about, 23changing WordArt styles
with, 91, 94selecting chart layout
from, 201
221
Index
selecting transitions from, 179
R
radar charts, 198recolor adjustments, 29Record Narration dialog box,
158recording narration, 157–159Reflection effect, 31, 32, 85,
86Rehearsal toolbar, 166Rehearsed Timings checkbox,
166rehearsing presentations,
164–167renaming Slide Master or
layouts, 16Reroute Connectors
command, 116, 136resetting picture adjustments,
30reviewing animated GIFs, 145RGB color model, 110–111Ribbon tabs. See specific tabs
right-clicking objects. See shortcut menu
rotatingabout 3-D rotation, 31clip art in 3-D, 72WordArt, 100–101, 106
rows. See also tablesdeleting, 79inserting in tables,
78–79orienting on chart, 200removing header, 86
Rows & Columns group (Table Tools Layout tab), 79, 80
royalty-free images, 34.rtf file format, 193Rule of Thirds, 39
S
savingclip art as picture, 74PowerPoint templates,
14scribble lines, 117, 118–119searching online clip art
collections, 63, 64–65Select Data Source dialog box,
201Send Backward order option,
76Send To Back order option, 76series lines, 209Set Up Show dialog box,
159–160Shadow effect, 31, 85shadows
adding to clip art, 71found in shapes, 109
Shape Effects command, 112–113
Shape Fill command, 109–110, 133
Shape Styles Gallery, 94shapes
about, 107adding additional
SmartArt, 126changing formatting of
SmartArt, 131–132choosing for picture,
35–36converting text to
SmartArt, 135
converting to freeform, 116–117
custom color and border for SmartArt, 133
Drawing Tools Format tab options for, 109
editing, 114–117enhancing with Shape
Effects, 112–113filling, 109–111inserting from SmartArt
Tools Design tab, 125–126
outlining, 112picking frame, 52–53placing pictures
anywhere in SmartArt, 134
selecting and inserting, 108–109
text placed in SmartArt, 126–127
using text in, 113–114when to use, 108white space and
shadows in, 109yellow markers for
editing, 115Shapes command, 108–109Shared Collections, 62shortcut menu
accessing from pictures, 41
adding additional SmartArt shapes from, 126
Format Picture dialog box, 55
Size And Position dialog box, 56
PowerPoint 2007 Graphics and Animation Made Easy
222
shrinking overflowing text, 102–104
simplicityanimation, 164design, 5, 6, 164
Size And Position dialog box, 38, 39–40, 56
Size tab (Size And Position dialog box), 38
sizingaspect ratios when table,
81cells for tables, 81pictures, 37, 38, 40,
56, 58pixelization and, 75
slide layouts. See layoutsSlide Masters, 13–14, 16Slide pane, 11slides. See also presentations
adding blank, 20adding to presentations,
12animating transition,
178–179arranging clip art on,
74–76, 146–147customizing with Quick
Style galleries, 23designing interesting,
31elements of, 8–9ensuring sound plays
throughout, 153fitting layout to content,
20–25inserting charts in, 199layout concepts for, 8–10leading reader through
story, 25pictures in, 27
placing movies on, 146–147
playing CDs with slide shows, 157
previewing options for, 165
putting new placeholders in, 14
Slide Masters, 13–14, 16starting and stopping
sound for, 154–155tables on, 78timing changes with
narration, 159tips for animating tables
on, 175triggering sound from,
155–156using portions of
SmartArt on consecutive, 133
Slides tab, 11SmartArt
adding text in shapes, 126–127
animating with, 136–137applying styles for, 129changing layouts
midstream, 128Chart function vs., 123converting text to, 135customizing shape’s
color and border, 133editing 3-D art in 2-D,
131formatting shapes
within, 131–132groups of layouts,
122–124hiding and showing
portions of, 133
inserting shapes for, 125–126
modifying layout color throughout, 128–129
pictures used with, 129placing pictures
anywhere in shapes, 134
redirecting layout for, 126
resetting graphic, 130styles applied to shapes
within, 132–133tabs on Ribbon for, 125using, 121–122
SmartArt Tools Design tab. See also SmartArt
adding shapes from, 125–126
changing layout direction, 126
illustrated, 125SmartArt Tools Format tab.
See also SmartArtabout, 130–131Edit in 2-D option, 131illustrated, 131
Snap To section (Grid and Guides dialog box), 105, 106
Soft Edges effect, 31sound. See also narration
animation with, 164embedded vs. linked
files for, 151file formats for, 150including narration with
other, 157inserting in PowerPoint,
151–153looping files, 153
223
Index
playing CDs with slide shows, 157
recording narration from presentation, 160–161
starting and stopping, 154–155
triggering from slide element, 155–156
using during slide transitions, 178
when to use, 150sound card, 157, 158sound conversion utilities,
150–151Standard tab (Colors dialog
box), 110starting sounds, 154–155stock charts, 198stopping sounds, 154–155story
adding movies in presentations, 139–140
customizing layout to fit content, 20–25
enhancing with themes, 53–54
leading reader through, 25
limiting number of words, 98
telling through slides, 17
using active verbs in, 90when to add shapes
with, 108WordArt to enhance, 89
Stretch Options for fill, 70
styles. See also Quick Styles galleries; styles galleries
adding to tables, 82, 83–84
applied to SmartArt shapes, 132–133
audience learning, 130chart, 201using SmartArt, 129WordArt, 91
styles galleriesPicture, 33–34Shape, 94Table, 83–84, 86–87
surface charts, 198
T
Table Styles Gallery, 83–84, 86–87
Table Styles group (Table Tools Design tab), 83–84
Table Styles Options group (Table Tools Design tab)
Borders command in, 84
choosing styles from, 86–87
illustrated, 82, 83–84Table Tools Design tab, 82Table Tools Layout tab, 79,
80–81tables
about, 77–78adding to slides, 78adjusting cell size, 81aligning text in cells, 81animating, 174–176aspect ratios when
sizing, 81borders for, 84–85
creating, 78deleting rows or
columns, 79earlier versions of
PowerPoint, 80editing color for, 82–83effects with, 85–86formatting chart data as,
205inserting rows or
columns, 78–79merging cells on, 79–80removing header rows,
86styling, 82, 83–84Table Tools Layout tab
options for, 79, 80–81using grouped objects as
animating, 176tabs. See specific tab by name
taking better pictures, 36templates, 14text. See also text boxes;
WordArtactive/passive verbs in,
90adding to photo albums,
54aligning in table cells,
81animating, 164, 174, 175Autofit options for
WordArt, 102captions for pictures,
54, 56converting to SmartArt,
135effect of layout changes
on, 8flipping, 106
PowerPoint 2007 Graphics and Animation Made Easy
224
inserting in shapes, 113–114
limiting number of words, 98
outlining option when exported to Word, 193
placing in placeholders, 15
placing in SmartArt layout, 126–127
shrinking overflowing WordArt, 102–104
supporting with images, 2–3
using bullets in, 31Text Box command, 101–104text boxes
adding WordArt to, 72aligning, 60dragging, 60formatting WordArt,
101–104including in layout,
56–57moving into unexpected
places, 26setting internal margins
for, 103–104Text Outline command, 95Text pane, 126–127texture
adding to shapes, 111–112
using in background, 45themes
photo album, 53–54slide, 22
3-D art, editing in 2-D, 131
3-D chartsdata markers for, 210orienting information
in, 2083-D format
clip art with, 71using command for,
98–993-D rotation
about, 31changing orientation of
chart information with, 208
clip art with, 72command for, 100–101WordArt with, 100–101
timingadjusting for animated
objects, 173editing narration,
158–159movie play, 142rehearsing presentation,
165–167slide changes with
narration, 159Title And Content Slide, 12,
22–23Title Only slide layout, 20Title Slides, 21–22titles
axes, 205chart, 204
Transform options (Drawing Tools Format tab), 95–97
transitional slides, 178–179trendlines, 208, 209triggering
about, 142choosing method for
object’s, 173
sound elements in slides, 155–156
Two Content Slides, 23–24two-picture layout, 57–58.txt file format, 193Type command group, 200typography. See also text
defined, 2type for charts, 200
U
ungroupingclip art, 67–68objects when animating
tables, 176USB microphone, 157–158
V
van der Rohe, Ludwig Mies, 5vector art, 67viewing gridlines, 104–106visual balance, 6–7, 26visualizing information, 26voice quality, 161
W
washing out graphics, 73–74.wav file format, 150Web Collections, 62Web resources for clip art, 34,
62–65weight
changing SmartArt line, 132
modifying WordArt line, 93
white point markers, 117
225
Index
white space, 7–8, 109Windows Media Encoder,
141, 150.wma file format, 150.wmv file format, 140Word
Building Blocks Organizer, 194
formatting applied for PowerPoint text in, 193
moving graphics to PowerPoint from, 191–195
pasting graphics from PowerPoint to, 190–191
WordArtadding to text boxes, 72adjusting backgrounds
for, 94aligning, 104–106applying 3-D format to,
98–99changing styles with
Quick Styles, 91, 94enhancing story with, 89fill with, 91–92flipping, 106formatting effects for,
97–104getting started with,
90–91inserting in shape, 114moving to Word, 191outline added to, 92–93,
94–95rotating, 100–101, 106setting margins for,
103–104shrinking, 102–104
text box formatting for, 101–104
transforming with text effects, 95–97
workspaceareas of, 11Outline tab in, 18, 19Picture Tools Format tab
in, 28
X
XY charts, 198
Y
yellow markers, 115
Z
zoom, 118
Related Documents