POWERLINK NETWORK ASSET VALUATION REVIEW Prepared for Australian Competition & Consumer Commission Document Reference : P:\10211\Valuation Report Status : Final Prepared by : A Maticka / G. Brown Reviewed by : R Parmella Approved by : R Parmella Date : 19 April 2001

Welcome message from author
This document is posted to help you gain knowledge. Please leave a comment to let me know what you think about it! Share it to your friends and learn new things together.
Transcript
POWERLINKNETWORK ASSET VALUATION REVIEW
Prepared for
Australian Competition & Consumer Commission
Document Reference : P:\10211\Valuation
Report Status : Final
Prepared by :A Maticka / G. Brown
Reviewed by :R Parmella
Approved by :R Parmella
Date : 19 April 2001
PB Associates Powerlink Network Asset Valuation ReviewACCC
Doc No. P:\10211\Valuation April, 2001 Page i
TABLE OF CONTENTS
SECTIONS
1. INTRODUCTION ...........................................................................................................1
2. SUMMARY OF FINDINGS...........................................................................................3
3. BACKGROUND ............................................................................................................5
3.1 National Electricity Code Requirements........................................................................ 5
3.2 Statement of Regulatory Principles .............................................................................. 5
3.3 The Consortium Valuation ........................................................................................... 6
3.4 The Powerlink Valuation.............................................................................................. 7
3.5 Economic Valuation.................................................................................................... 8
3.6 Historic Cost Valuation ..............................................................................................10
4. ASSET DEFINITION AND IDENTIFICATION ........................................................11
4.1 General ....................................................................................................................11
4.2 Classification of Data.................................................................................................11
4.3 Validation / Verification of Data...................................................................................12
4.4 Separation of Regulated from Non-Regulated Assets ....................................................12
5. ASSET REPLACEMENT COSTS............................................................................14
5.1 Transmission Lines and Substations ...........................................................................14
5.1.1 Transmission Lines.......................................................................................14
5.1.2 Substations .................................................................................................16
5.1.3 Summary.....................................................................................................17
5.2 Interest During Construction .......................................................................................18
5.3 Easements ...............................................................................................................18
5.3.1 Deprival Valuation.........................................................................................18
5.3.2 Historic Roll-Forward Valuation ......................................................................21
5.3.3 Revalued Depreciated Actual Cost Approach...................................................21
PB Associates Powerlink Network Asset Valuation ReviewACCC
Doc No. P:\10211\Valuation April, 2001 Page ii
5.3.4 Recommendation and Conclusion ..................................................................24
6. ASSET LIVES..............................................................................................................25
6.1 Economic Lives .........................................................................................................25
6.2 Residual Lives ...........................................................................................................26
7. OPTIMISATION............................................................................................................27
7.1 General ....................................................................................................................27
7.2 Optimisation of the Powerlink System. ........................................................................27
8. INDEXING THE TRANSMISSION CAPITAL BASE FORWARD.......................29
APPENDIX A GLOSSARY OF TERMS

PB Associates Powerlink Network Asset Valuation ReviewACCC
Doc No. P:\10211\Valuation April, 2001 Page 1
1. INTRODUCTION
The Australian Competition & Consumer Commission (the Commission) is currentlyconducting an inquiry into the appropriate revenue cap to be applied to the non-contestableelements of the transmission services provided by the Powerlink transmission network.
An important facet of this Inquiry is determining the valuation of the assets used byPowerlink to provide these non-contestable transmission services. Section 6.2.3(d)(4)(iii) ofthe National Electricity Code (the Code) requires that assets in service on 1 July 1999 bevalued at the value determined by the Jurisdictional Regulator, in this case the QueenslandElectricity Reform Unit (ERU). The ERU’s valuation of Powerlink’s transmission assets asat 1 July 1999 is contained in a February 2000 report prepared by a consortium consistingof Arthur Andersen, GHD and Worley International (the Consortium).
However the Code permits the Commission to require the opening asset value to beindependently verified through a process agreed with the National Competition Council. Inaccordance with this provision of the Code, the Commission has engaged PB Associatesto review the optimised depreciated replacement cost (ODRC) valuation conducted by theConsortium. In particular the Consultant is required to review the appropriateness of theassumptions, methodologies and findings of the Consortium’s 1999 valuation of Powerlink’stransmission asset base in terms of meeting the requirements of the Code.
Furthermore PB Associates has been asked, as part of this review, to consider thefollowing:
• the appropriateness and practicality of using economic valuation or historic costapproaches as alternatives to ODRC, consistent with the requirements of the Code; and
• other matters as are necessary to enable the Commission to make a Code-compliantvaluation of the non-contestable assets of Powerlink expected to be in service on 1January 2002.
The Consortium’s valuation forms the basis for the existing regulatory determination madeby the ERU. However, following internal review, and refinement of its internal estimatingprocedures, Powerlink has submitted additional information to the Commission thatindicates that the Consortium valuation understates the replacement cost of its networkassets. Powerlink has also submitted further information on the treatment of easementsfor regulatory valuation purposes. In undertaking this review, PB Associates hasconsidered the additional information in addition to the Consortium’s valuation report.
This review is concerned only with the valuation of the Powerlink assets in service as of 1July 1999, and how the value of these assets should be adjusted to represent their deprivalvalue as of 1 January 2002. In order to determine a Code compliant valuation of thePowerlink asset base as of 1 January 2002 it is necessary to adjust the valuation toaccount for asset additions and removals between 1 July 1999 and 1 January 2002. TheCommission requires such assets to be treated differently in that they should be valued onthe basis of actual installation cost rather than an estimated replacement cost.Powerlink’s information on asset additions and deletions has been separately included aspart of its formal application to the Commission and is discussed in PB Associates’ reporton Powerlink’s capital expenditure.
Nevertheless Powerlink has provided both the Commission and PB Associates withinformation on the costs of its portion of the Queensland – New South WalesInterconnector (QNI) in relation to the project budget. At the time of writing this report QNIhad not been commissioned and was therefore not part of the regulated asset base. It isexpected to be in service by 1 January 2002. Consistent with the treatment of other asset

PB Associates Powerlink Network Asset Valuation ReviewACCC
Doc No. P:\10211\Valuation April, 2001 Page 2
additions and removals, this report does not address issues in relation to the value at whichQNI is added to the asset base. This issue will be discussed in PB Associatessubsequent report on Capital Expenditure.

PB Associates Powerlink Network Asset Valuation ReviewACCC
Doc No. P:\10211\Valuation April, 2001 Page 3
2. SUMMARY OF FINDINGS
The following comments summarise the results of our examination of the Consortium’sreport on the ODRC Valuation of Powerlink’s Network Assets:-
• The Consortium’s replacement cost valuation for Powerlink’s network assets, excludingeasements but including spares, was $2.992M. The optimised depreciatedreplacement cost (ODRC) valuation was $1,700M. This valuation was as of 1 July1999, and included both regulated and non-regulated assets.
• For regulatory pricing purposes the above valuations need to be adjusted for theremoval of regulated assets. This will require a reduction of the replacement costvaluation by $33M and a reduction of the ODRC valuation of $27M.
• Powerlink has provided its own valuation of asset replacement costs, for the assetbase as it existed on 1 July 1999, which it submits should be used as the basis for its2002 regulatory price review. This new valuation makes a number of adjustments,including the removal of non-regulated assets, to the Consortium valuation and inparticular incorporates higher asset replacement costs. The Powerlink valuation of thereplacement cost of these regulated network assets, excluding easements, spares andother non-network assets is $3,149M, with a valuation date of 1 July 2000.
• Powerlink’s revised valuation uses replacement costs that are based on its currentproject management and construction practices. In conducting this review PBAssociates tried to compare Powerlink’s estimated replacement costs with costselsewhere in the industry and with the costs that might be achievable in a highlycompetitive environment. However we were unable, in the time available, to reach anyfirm conclusion on the efficiency of the replacement costs used by Powerlink in itsrevised valuation.
• During discussions with Powerlink and the Commission, nothing has come to PBAssociates’ attention to indicate that the deprival value of the network assets should bewritten down below the assessed ODRC value.
• The processes used by the Consortium to verify and validate Powerlink’s register ofnetwork assets were robust and we concur with the Consortium’s conclusion that theasset register has sufficient integrity for the purposes of an ODRC valuation.
• The replacement cost of non-regulated network assets is assessed by Powerlink to be$38M as at 1 July 2000. We have not tested the accuracy of the schedule of non-regulated assets and note that there appear to be no guidelines on what assets are tobe included in the regulatory asset base and what assets lie outside the regulatoryframework. We suggest that the Commission include relevant guidelines in itsdocument on ODRC asset valuation to be issued by the end of 2002.
• We concur with Powerlink’s view that 7.6% is a more realistic value for interest duringconstruction than the 6.5% apparently used in the Consortium valuation.
• None of the three transmission line easement valuations reviewed for this studydemonstrated the degree of rigour and depth of analysis that has been applied to theestimation of asset replacement costs, even though the value of easements will have avery significant impact on the total value of the asset base.
• Of the three easement valuations, Powerlink’s valuation is the most robust, althoughwe are unable to endorse the methodology used as conforming to an accepted method

PB Associates Powerlink Network Asset Valuation ReviewACCC
Doc No. P:\10211\Valuation April, 2001 Page 4
of valuing easements. There are issues relating to the Powerlink valuation that requirefurther consideration, most particularly the derivation and allocation of assemblagecosts.
• Acceptance of the Powerlink valuation would result in a regulated easement valuationof $198M s at 1 July 2000. This is 16% of Powerlink’s assessment of the ODRC ofnetwork assets.
• The asset lives used in both the Consortium and Powerlink valuations are consistentwith those used in other regulatory jurisdictions. Further, the treatment of residual livesis generally consistent with the NSW Treasury Guidelines.
• The indication is that the Consortium’s valuation incorporates a reasonably thoroughoptimisation process. This has reduced the replacement cost of the network assetbase by 3%. The Powerlink valuation retains the optimisations used in the Consortiumreport and we recommend that the Commission accept these.
• Powerlink’s standard accounting practice is to index the asset base forward by theConsumer Price Index – All Groups, Brisbane, in order to update the replacement costof its asset base annually. However the relationship between the actual costs oftransmission projects and movements in the CPI is not necessarily consistent.
• Two possible approaches are possible for capturing movements in replacement costs,where these differ from CPI. One approach is to develop a composite industry-specificindex reflecting changes in the costs of inputs used for transmission systemconstruction. A second approach is to undertake a periodic revaluation of the assetbase, basing each revaluation on current replacement costs. This second approachmirrors the standard CPI-X approach to regulation, with its regular revenue resets. Ifthe second approach is adopted it might be appropriate to allow some indexation of thevalue of the asset base between valuations.
PB Associates Powerlink Network Asset Valuation ReviewACCC
Doc No. P:\10211\Valuation April, 2001 Page 5
3. BACKGROUND
3.1 NATIONAL ELECTRICITY CODE REQUIREMENTS
Section 6.2.3 of the Code requires that, for the determination of a revenue cap fortransmission network businesses, assets in existence and generally in service on 1 July1999 be valued at the value determined by the jurisdictional regulator, provided that thisvaluation does not exceed the deprival value. However the Code does allow theCommission to independently verify this valuation, through a process agreed with theNational Competition Council.
The deprival value of a network asset is a measure of the economic loss the network ownerwould suffer if it were deprived of the use of the asset. This is generally taken to be thelower of the ODRC or the economic value of the asset, where the economic value is thepresent value of the future revenue stream resulting from the use of the asset.
In assessing deprival values the ODRC generally prevails, except in cases where theprovision of a grid supply is uneconomic due to the high cost of the connection required.This can apply, for example, in the case of long rural distribution feeders where the revenuestream is small in relation to the capital cost of the feeder.
This is discussed further in Section 3.5
3.2 STATEMENT OF REGULATORY PRINCIPLES
On 27 May 1999 the Commission issued a Draft Statement of Principles for the Regulationof Transmission Revenues. Sections 4 and 5 of this document are pertinent to thevaluation of a transmission business’s asset base.
It should be noted that Commission’s document was only issued in draft form and that afinal document has still to be issued. While the document defines a number of “RegulatoryPrinciples” in relation to the valuation of transmission network assets, there are someareas where the Commission’s thinking requires further clarification. This is especially truein respect of optimisation and the methodology to be used for the valuation of easements.
Further the Draft Statement of Regulatory Principles indicates that the Commission ispresently not inclined to use a formal “economic value” test in the assessment of deprivalvalues. Rather, it is open to network owners to present evidence that an asset’s valueshould be written down if the asset is unable to generate an economic return. Alternativelyit is proposed that the Commission could write down the value of the system below ODRCon its own initiative in recognition of evidence that the current regulatory asset basevaluation exceeds the ODV of the network.
In respect of easement valuations, the Commission’s Draft Statement of Principles notesthat, to the extent that the acquisition of easements requires expenditure by the networkowner, it would be improper for the regulator to ignore their existence or deny a reasonablereturn on the funds employed. The Commission would appear attracted to a deprivalapproach to the valuation of easements, relying on an optimisation process to deal withsituations where easement replacement values have reached the point where lower costnetwork options, avoiding the use of the easement, are available. However any change inthe deprival value of an easement would need to be matched by a correspondingdepreciation adjustment. In situations where there was an appreciation in easement valuesthe adjustment would be negative. This would result in a loss of income in the year thedepreciation adjustment was applied and this would offset the windfall capital gain from theappreciation in asset value.
PB Associates Powerlink Network Asset Valuation ReviewACCC
Doc No. P:\10211\Valuation April, 2001 Page 6
3.3 THE CONSORTIUM VALUATION
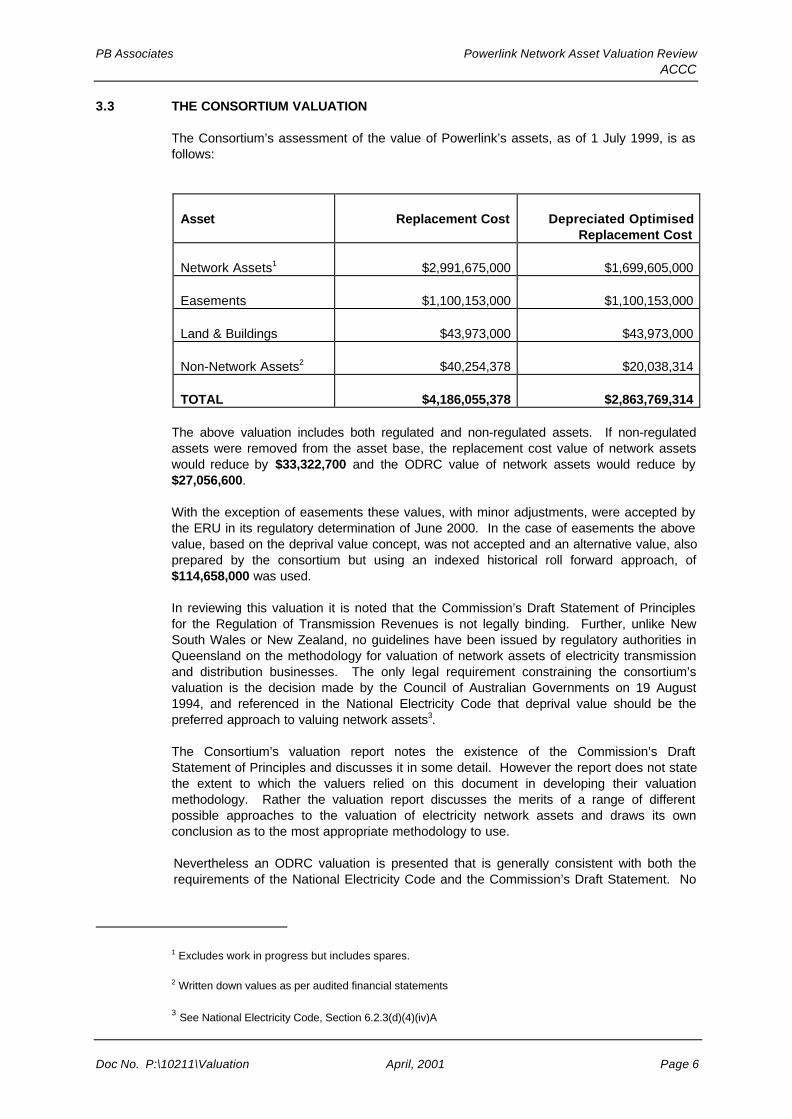
The Consortium’s assessment of the value of Powerlink’s assets, as of 1 July 1999, is asfollows:
Asset Replacement Cost Depreciated OptimisedReplacement Cost
Network Assets1 $2,991,675,000 $1,699,605,000
Easements $1,100,153,000 $1,100,153,000
Land & Buildings $43,973,000 $43,973,000
Non-Network Assets2 $40,254,378 $20,038,314
TOTAL $4,186,055,378 $2,863,769,314
The above valuation includes both regulated and non-regulated assets. If non-regulatedassets were removed from the asset base, the replacement cost value of network assetswould reduce by $33,322,700 and the ODRC value of network assets would reduce by$27,056,600.
With the exception of easements these values, with minor adjustments, were accepted bythe ERU in its regulatory determination of June 2000. In the case of easements the abovevalue, based on the deprival value concept, was not accepted and an alternative value, alsoprepared by the consortium but using an indexed historical roll forward approach, of$114,658,000 was used.
In reviewing this valuation it is noted that the Commission’s Draft Statement of Principlesfor the Regulation of Transmission Revenues is not legally binding. Further, unlike NewSouth Wales or New Zealand, no guidelines have been issued by regulatory authorities inQueensland on the methodology for valuation of network assets of electricity transmissionand distribution businesses. The only legal requirement constraining the consortium’svaluation is the decision made by the Council of Australian Governments on 19 August1994, and referenced in the National Electricity Code that deprival value should be thepreferred approach to valuing network assets3.
The Consortium’s valuation report notes the existence of the Commission’s DraftStatement of Principles and discusses it in some detail. However the report does not statethe extent to which the valuers relied on this document in developing their valuationmethodology. Rather the valuation report discusses the merits of a range of differentpossible approaches to the valuation of electricity network assets and draws its ownconclusion as to the most appropriate methodology to use.
Nevertheless an ODRC valuation is presented that is generally consistent with both therequirements of the National Electricity Code and the Commission’s Draft Statement. No
1 Excludes work in progress but includes spares.
2 Written down values as per audited financial statements
3 See National Electricity Code, Section 6.2.3(d)(4)(iv)A

PB Associates Powerlink Network Asset Valuation ReviewACCC
Doc No. P:\10211\Valuation April, 2001 Page 7
formal economic value test is applied. While this is consistent with the Commission’sapproach, it raises the question as to whether such a test is necessary for compliancewith the Code.
In the absence of any regulatory requirement as to the methodology to be used inundertaking the deprival valuation, PB Associates has reviewed the consortium’s valuationin the context of the relevant sections of the Commission’s Draft Statement. Whereappropriate, reference is also made to the requirements in other jurisdictions, particularlyNew South Wales and New Zealand, where the regulators have both issued comprehensiveguidelines for the ODV valuation of electricity network assets.
3.4 THE POWERLINK VALUATION
Powerlink has submitted a revised valuation for network assets and easements to theCommission, based on work that it has undertaken following the completion of theConsortium’s valuation. The Company has advised PB Associates that the replacementcosts used in the Consortium valuation were provided by the Consortium, rather than byPowerlink. Powerlink had concerns about some aspects of the costs but accepted themfor the ERU price determination, since there was not time for the further investigationrequired to substantiate Powerlink’s concerns.
This further investigation has now been undertaken and the new valuation incorporates theresults of these studies.
The new valuation is related to the Consortium valuation as follows:
• The network asset base is the same as that of the Consortium’s valuation, except forcorrection of minor errors. Hence both valuations relate to the asset base as it existedon 1 July 1999. Asset additions and removals subsequent to 1 July 1999 have notbeen included in the Powerlink valuation and are dealt with separately in Powerlink’sformal application to the Commission.
• An adjustment has been made to remove the non-regulated assets that were includedin the Consortium valuation.
• The Consortium’s valuation has been rolled forward to 1 July 2000 using the followingadjustments:
1. Replacement costs of all assets have been escalated by 2.2% to reflect themovement in the Brisbane consumer price index, as measured by the AustralianBureau of Statistics.
2. An additional year’s depreciation has been included in the assessment of ODRC.
• Subsequent to the above roll forward the following additional adjustments have beenmade:
1. Powerlink has re-evaluated the base replacement costs of substations and addedlocational factors to all substation costs, where this was deemed appropriate. AConsultant’s report on 132 kV substation costs has been provided to support thisre-evaluation. The net effect of this adjustment is to increase substationreplacement costs by 3.9% above the rolled forward Consortium value.
2. Powerlink has substituted revised transmission line costs to take account of thelatest costs associated with transmission line erection contracts and materials. Itstates that the revised costs reflect recent project costs and recent tenderinformation, as well as movements in commodity costs for aluminium and steel.The net effect of this adjustment is to increase transmission line replacement

PB Associates Powerlink Network Asset Valuation ReviewACCC
Doc No. P:\10211\Valuation April, 2001 Page 8
costs by 3.2% above the rolled forward Consortium value.
3. Powerlink has escalated all transmission line and substation costs by 1.1%, beingthe difference between its estimate of 7.6% as being a reasonable value forinterest during construction (IDC) and the 6.5% used by the Consortium. AConsultancy report by Price Waterhouse Coopers has been submitted in supportof the revised IDC value.
4. The Powerlink valuation classifies OPGW as a transmission line asset rather thana communication asset. This change is in keeping with the physical nature of theasset and is supported by PB Associates. It results in a value of around $8.2Mbeing transferred from communication to transmission line assets.
5. Powerlink supports the use of an optimised replacement cost approach to thevaluation of line easements. However, in taking this position, it may not haveconsidered the impact of any depreciation adjustment the Commission mayrequire. Alternatively, Powerlink proposes an alternative easement valuationmethodology that would value easements at approximately $84M (74%) above theConsortium’s lower easement valuation. This is discussed further in Section5.4.3.
A comparison between the Consortium’s July 1999 values for network assets andeasements and the corresponding July 2000 values proposed by Powerlink is given in thetable below:
Consortium Powerlink
ReplacementCost
ODRC ReplacementCost
ODRC
Transmission Lines $1,989M $1,186M $2,106M $1,214M
Substations $935M $477M $983M $473M
Communications $67M $34M $59M $25M
Easements
- ReplacementCost
- Historic RollForward
- Powerlink
$1,100M
$115M
$198M
Note: In the above table the Consortium valuation is taken directly from the Valuation Report and isexpressed in July 1999 dollars. The Powerlink valuation is for regulated assets only and includes all theadjustments noted in Section 3.4, including a 2.2% indexation to July 2000 dollars.
3.5 ECONOMIC VALUATION
PB Associates Powerlink Network Asset Valuation ReviewACCC
Doc No. P:\10211\Valuation April, 2001 Page 9
Application of the economic value test is problematic in regulated environments, as theasset valuation methodology requires a forecast of the future income stream. However thefuture income stream is, in itself, determined by the regulator, generally on the basis of thevalue of the assets employed. The logic is circular, as the assessment of the potentialincome stream is not independent of the valuation process.
In the case of a distribution network an economic value test can be applied fairly easily ifan agreed mechanism exists for avoiding this circularity problem. The New Zealand ODVguidelines previously allowed an unregulated electricity price to be assumed for thepurpose of application of the test, leaving the valuer free to assume a price based on thecost of alternative energy sources. This approach was not without its problems, and themost recent revision to the New Zealand Guidelines has placed a cap on the electricityprice that can be assumed. The New South Wales Guidelines do not address thiscircularity problem.
The traditional approach to assessment of economic value assumes that, having decidedon an appropriate pricing strategy, it is possible to forecast future revenue flows generatedby a given asset with a high level of certainty. Assuming a significant variable componentin the pricing mix, future revenues from a particular transmission asset will be determinedby the location of the generation on the network in relation to the load, as well as by themerit order for generator dispatch.
In the case of transmission networks operating within the National Electricity Market thisassumption of predictability is flawed, particularly for the shared portion of a network.
The network owner has little control over the location of generators, which is determined byinvestors in electricity generation. The likelihood is that generator locations will changewith time, but this change is unpredictable, and likely to occur relatively quickly whenassessed in the context of the engineering lives of transmission assets.
The merit order for generator dispatch is determined, not by Powerlink, but by NEMMCOon the basis of bids into the wholesale electricity market. This will be determined not onlyby the relative costs of different types of generation, but also by the location of eachgenerator on the network and the real time bidding strategies used by individual generatorsin the market. The merit order can therefore change quickly, and is likely to be even morevolatile and unpredictable than generator location.
The situation is further complicated by the fact that an electricity market will deliver thelowest energy prices only in situations where power flows the network are unaffected bycapacity constraints. This is because when power flows through a network are limited bya constraint, prices on one side of a constraint will be higher than they would have been ifthe constraint had not existed. Hence the very existence of the market makes a rationaleconomic analysis of the need for a particular transmission asset difficult, since thepresence of transmission constraints reduces the efficiency of market operation.
In the unshared components of a transmission network, individual assets, generallyreferred to as connection assets, can be assigned to specific customers, be theygenerators or loads. Capacity of connection assets can be readily matched to customerrequirements. However, removal of excess connection asset capacity is a technicaloptimisation issue. The economic valuation of connection assets is driven only by the levelof asset utilisation, assuming that revenue streams are not protected by bilateral contractsand that there is a high variable component in the pricing mix. As discussed above, assetutilisations can be volatile, particularly for generator customers, making future revenuesdifficult to forecast.
With the lack of any economic value analysis in the Consortium valuation, there is animplicit assumption that the deprival value of the network will be equal to the ODRC. Thisis a pragmatic approach, in the absence of any persuasive evidence to the contrary. It is
PB Associates Powerlink Network Asset Valuation ReviewACCC
Doc No. P:\10211\Valuation April, 2001 Page 10
also consistent with the approach taken by the Commission in its Draft Statement asdiscussed in Section 2.2.
Powerlink has made no request for the value of any part of its network to be written downbelow the ODRC value. Indeed all representations made by Powerlink to the Commissionand PB Associates have argued that the value of the asset base should be increasedabove the ODRC valuation assessed by the Consortium. Furthermore, during thediscussions with Powerlink and the Commission, nothing has come to PB Associates’attention to indicate that the deprival value of the network should be written down below theassessed ODRC value.
3.6 HISTORIC COST VALUATION
The use of depreciated historic costs as the basis for asset valuation assumes a pricingstrategy based on cost recovery. In our view this is incompatible with the economicphilosophy that underlies the electricity industry structure in Australia today. Thisassumes that energy prices should be set, not on the basis of costs, but by market forces.We note that the underlying premise for the deprival valuation methodology is that assetsshould be valued in terms of the economic loss suffered if deprived of the use of the asset.This loss is measured either on the basis of the cost of replacing the asset with a modernequivalent or, if this is not economic, on the basis of the future income stream foregone. Inour view this approach, while not perfect, is more consistent with modern economicthinking.
This view is also consistent with the Commission’s Draft Statement of RegulatoryPrinciples, which states categorically that the Commission will not consider historic costsas an asset valuation methodology for assets commissioned prior to 1 July 1999.
It is noted that assets commissioned after 1 July 1999 are to be added to the regulatoryasset base at actual cost, provided they meet the required prudency criteria. Changes tothe asset value due to the asset additions and removals after 1 July 1999, including theimpact of QNI, are considered in PB Associates report on capital expenditure.

PB Associates Powerlink Network Asset Valuation ReviewACCC
Doc No. P:\10211\Valuation April, 2001 Page 11
4. ASSET DEFINITION AND IDENTIFICATION
4.1 GENERAL
The starting point for the asset valuation is the type and number of assets owned byPowerlink. These details are included in spreadsheets attached to the Consortium report.Four separate spreadsheets are provided, for transmission lines, substations,communications assets and easements.
The accuracy of the asset register has a significant effect on the accuracy of the finalvaluation figure and as such the process used to verify the asset register is an importantconsideration in reviewing the valuation report. In commenting on the approach taken todefining and identifying transmission assets for this valuation, the following items, whichare considered to be prudent steps in the validation process, have been considered:
• what validation of the asset registers was undertaken during the valuation process;
• have sample field visits been carried out by Powerlink or the Consortium to verify assetdata;
• are the assets listed in the registers divided appropriately;
• are methods used to estimate asset details reasonable, where accurate data has notbeen provided; and
• was there a check on the definition of system boundaries.
An independent assessment of the accuracy of Powerlink’s transmission asset records isoutside of the scope of this review. The level of validation carried out is therefore reviewedonly on the basis of the comments made in the Consortium’s report. A review of theconsistency, type and thoroughness of the validation of the asset registers is set out in thefollowing sections.
4.2 CLASSIFICATION OF DATA
The Consortium’s valuation report classifies network assets into three separate categories,transmission lines, substations and communications equipment. This is consistent withthe way the assets are identified and recorded in the fixed assets module of Powerlink’sSAP financial system. Powerlink has confirmed that the SAP register is used as the basisfor both the financial and regulatory asset records.
The substation database breaks down substation assets into building blocks or “baseplanning objects” (BPO) that form the basis not only for valuation, but also for maintenancetracking and estimating the cost of new projects. Each substation on the network can bebuilt up by assembling together the necessary BPOs according to the substation’s sizeand configuration. An issue for this review is the manner in which replacement costs areassigned to individual BPOs. This is discussed in Section 5.2.
The transmission line database is broken down into “built sections”, where each builtsection represents an historical transmission line construction project. There is a widediversity in the size and age of built sections and, due to the reconfiguration of the networkover time, an existing transmission line may comprise several built sections. Themethodology used by Powerlink to assign replacement costs to individual built sections isdiscussed in Section 5.1.

PB Associates Powerlink Network Asset Valuation ReviewACCC
Doc No. P:\10211\Valuation April, 2001 Page 12
Communications assets are broken down by individual asset. Communication assets donot form a significant component of the total network asset base due to both their lowerinitial asset costs and their shorter engineering lives. In the Consortium valuation,communication assets amounted to 1.9% of the replacement cost of the network assetbase and 1.5% of the ODRC. Therefore, on the basis of materiality, communications asstsare not considered in detail in this review.
4.3 VALIDATION / VERIFICATION OF DATA
In undertaking its valuation the Consortium completed a sample audit of data prepared byPowerlink in respect of quantities, systems and processes. The audit process includedthe following steps:
1. A review of the systems and processes adopted to identify and record assets.
2. A physical inspection of sample assets. The consortium inspected six substationsand a number of transmission line sections in Powerlink’s southern and centralregions.
3. A review of other data sources such as operating diagrams and drawings.
4. A comparison of recorded asset data with independently sourced data in respect ofcontent, description capacity, age and condition.
The Consortium’s valuation report notes that Powerlink now adopts a formaliseddocumented system for the identification and recording of fixed assets. The proceduresused were considered appropriate and, if applied correctly, should lead to an accuraterecord of the asset base.
The validation process found errors in the recording of the commissioning date forsubstation control and protection (secondary) systems and also some inconsistencies inthe quantities of communication assets. These errors were corrected prior to thecompletion of the Consortium’s valuation, even though neither was likely to have a materialimpact on the total asset value.
Overall the Consortium concluded that the asset data had sufficient integrity for thepurposes of an ODRC valuation. We accept the validity of the approach used by theConsortium and concur with this conclusion.
Subsequent to the completion of the Consortium valuation, Powerlink has found someminor errors in the asset list used by the Consortium. The impact of these errors is notconsidered material but they have been corrected in the Powerlink valuation.
4.4 SEPARATION OF REGULATED FROM NON-REGULATED ASSETS
The Consortium valuation included all Powerlink assets, and did not distinguish betweenregulated and non-regulated assets.
However the subsequent Powerlink valuation has separated out assets associated withbilateral contracts which with a small number of large industrial customers, such as theBoyne Island aluminium smelter, which are connected directly to its network. Thesecontracts sit outside the regulatory framework and connection assets used to supply thesecustomers are not subject to regulation by the Commission.
Exclusion of these non-regulated assets is done by means of a regulation factor in thevaluation spreadsheet. Where an asset is fully regulated a regulation factor of 1 is used.Conversely, the regulation factor is 0 for assets that are not regulated. Where assets areshared between the regulated and non-regulated parts of the business, the regulation factor
PB Associates Powerlink Network Asset Valuation ReviewACCC
Doc No. P:\10211\Valuation April, 2001 Page 13
is between 0 and 1, depending on the relative use made of the asset between the regulatedand non-regulated part of the business.
This approach is reasonable and should give an accurate breakdown between regulated andnon-regulated assets, provided the regulation factors are correctly applied. However, theaccuracy with which these factors have been applied has not been tested as part of thisreview.
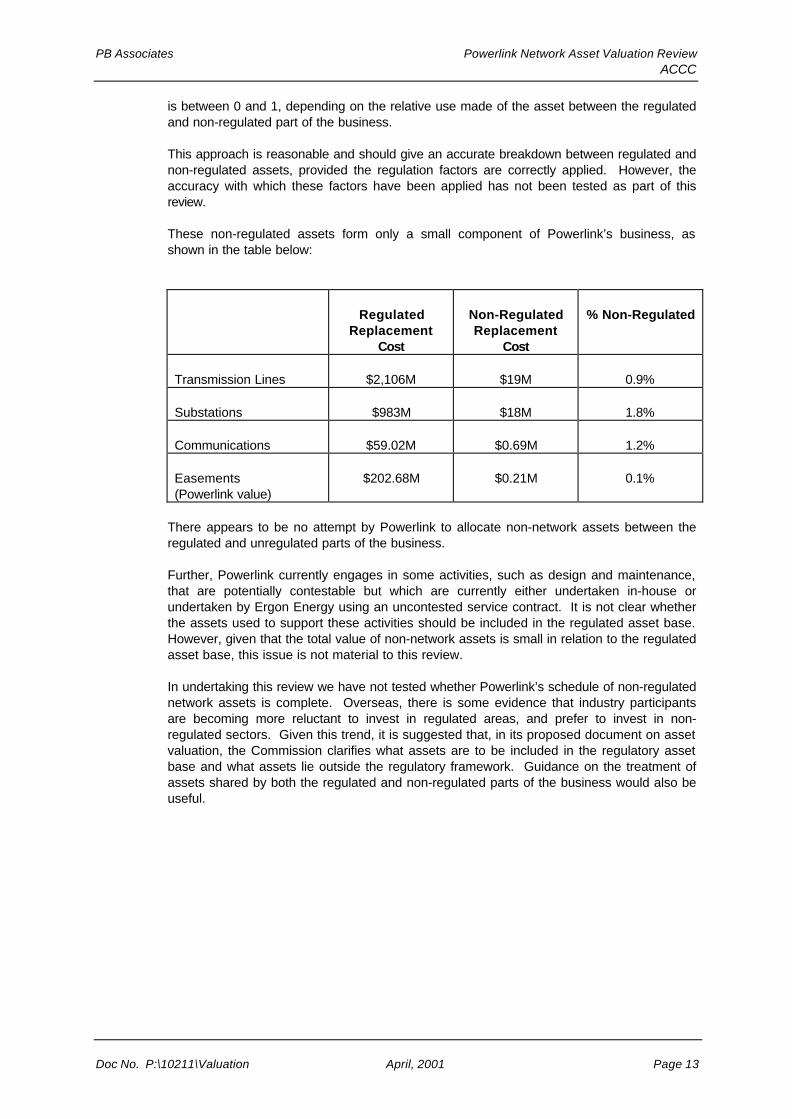
These non-regulated assets form only a small component of Powerlink’s business, asshown in the table below:
RegulatedReplacement
Cost
Non-RegulatedReplacement
Cost
% Non-Regulated
Transmission Lines $2,106M $19M 0.9%
Substations $983M $18M 1.8%
Communications $59.02M $0.69M 1.2%
Easements(Powerlink value)
$202.68M $0.21M 0.1%
There appears to be no attempt by Powerlink to allocate non-network assets between theregulated and unregulated parts of the business.
Further, Powerlink currently engages in some activities, such as design and maintenance,that are potentially contestable but which are currently either undertaken in-house orundertaken by Ergon Energy using an uncontested service contract. It is not clear whetherthe assets used to support these activities should be included in the regulated asset base.However, given that the total value of non-network assets is small in relation to the regulatedasset base, this issue is not material to this review.
In undertaking this review we have not tested whether Powerlink’s schedule of non-regulatednetwork assets is complete. Overseas, there is some evidence that industry participantsare becoming more reluctant to invest in regulated areas, and prefer to invest in non-regulated sectors. Given this trend, it is suggested that, in its proposed document on assetvaluation, the Commission clarifies what assets are to be included in the regulatory assetbase and what assets lie outside the regulatory framework. Guidance on the treatment ofassets shared by both the regulated and non-regulated parts of the business would also beuseful.
PB Associates Powerlink Network Asset Valuation ReviewACCC
Doc No. P:\10211\Valuation April, 2001 Page 14
5. ASSET REPLACEMENT COSTS
5.1 TRANSMISSION LINES AND SUBSTATIONS
5.1.1 Transmission Lines
PB Associates has undertaken a high level benchmarking study comparing thetransmission line replacement costs used in the Powerlink valuation costs with thoseaccepted by regulators in other jurisdictions. It should be noted that cost estimating is notan exact science and that costs are different in different areas. Hence the results of thecomparison should be taken as indicative rather than definitive.
The comparison indicates that:
1. From our discussions with Powerlink, we believe that its methodology for estimating thereplacement cost of transmission lines is generally sound.
The transmission line asset base is segmented into “built sections”, each representingan historical construction project. For each type of standard line constructionPowerlink estimates a base replacement cost, assuming defined standard projectconditions apply. For individual built sections, a range of correction factors is applied tothe relevant base cost to account for deviations from the defined standard conditions.This allows for project specific cost impacts to be taken into account.
Powerlink advises that the unit rates in Powerlink’s data bases are continually updatedand compared to actual construction costs, which gives weight to the reasoning thatthe variation factor approach used by Powerlink results in reasonable estimates beingproduced.4 This is important with regards to lines because: -
• The application of multiple correction factors could lead to a double counting ofsome of the impacts of transmission line constraints on replacement costs.
• Some aspects of the selection of the appropriate individual correction factor,particularly the terrain factor, could be subjective.
• Selection of short segmented ‘built sections’ could lead to higher prices than if unitrates are applied as the higher cost segments are specifically identified rather thanbuilt into the unit rate. This is borne out by an analysis of Powerlink’s valuationspreadsheet. The 25% of transmission line projects with the highest built sectionreplacement cost have an average length of 105 km and an average correctionfactor of 1.88. However the 25% of projects with the lowest built sectionreplacement cost have an average length of 0.68 km and an average correctionfactor of 8.41.
The Consortium’s valuation report states that the correction factors, including the terrainfactor, have been reviewed, applied to a sample of assets and found reasonable.Powerlink believes that its approach to the application of correction factors is the mostcomprehensive package for valuing the modern equivalent cost of installed transmissionlines in Australia and have provided examples where the use of correction factors hasresulted in cost estimates that were below the actual cost of construction. We havenot examined other estimating packages but have no reason to dispute this.
4 Neil Pearce, “Transmission Line Valuation – Factors”, Internal Memorandum, October 1999

PB Associates Powerlink Network Asset Valuation ReviewACCC
Doc No. P:\10211\Valuation April, 2001 Page 15
2. , There are a large number of different asset types recorded in the asset register,consistent with the detailed project by project approach taken by the Powerlink andreflective of a system constructed over a number of years using the optimumconstruction types at the time of construction. However the base replacement costsfor similar construction types in each asset class are the same. This indicates thatreplacement costs have been determined on the basis of replacement with a modernequivalent asset rather than a like for like replacement.
3. The Consortium has used the same correction factors as Powerlink in the estimationof replacement costs, but based its valuation on its own assessment of appropriateunit costs. The Powerlink valuation uses different unit costs, based on Powerlink’slatest data on transmission line erection contract costs and materials costs. Theresulting difference between the Powerlink unit costs and the Consortium’s costs is3.2% ($37M). From our discussions with Powerlink, we believe that the difference ismainly due to different sources of data used, obtained at different times. However,without having access to the Consortium’s detailed cost assumptions, it is difficult todetermine exactly where the differences lie.
4 The average replacement cost of Powerlink’s 275 kV lines is approximately 6% higherthan the average replacement cost of TransGrid’s 330 kV lines when normalised byroute length and 1% lower when normalised by circuit length, after TransGrid’s costshave been escalated forward to July 2000 dollars. However TransGrid has a higherproportion of single circuit lines, which would have a higher replacement cost percircuit km. There could be a number of reasons for these differences, given that thedifference in voltage should not have a major impact on the constructed cost of twolines of similar lengths and over similar routes. One possible reason, for example, isthe fact that 60% of Powerlink’s 275 kV lines are designed for cyclonic wind loading.
5 Averaged over the whole network Powerlink’s 132kV line replacement costs areapproximately 66% higher than those of TransGrid, when normalised by circuitkilometre.
However, there are fundamental differences between the two networks. These include:
• We understand that nearly all of TransGrid’s 132 kV lines are wood pole lines withlight conductors. However, most of Powerlink’s 132 kV lines are substantial steeltower lines with heavy conductors.
• The impact of locational differences and differences in scale may be significant.Powerlink has relatively short lengths of 132 kV construction and its 132 kV linesare concentrated in the central and northern areas, where construction costs arehigher.
• The 132kV NSW pole line construction costs are related to rural construction wheremuch of the Powerlink’s 132kV transmission network is located in more expensiveand difficult terrain.
• In northern parts of its area Powerlink must design for increased wind loading dueto cyclonic conditions.
6 110kV circuits are listed as 132kV assets for the purposes of valuation. It is notexpected that this will have a material effect.
Where Powerlink’s transmission line replacement costs appear higher than those on whichthe most recent TransGrid ODRC valuation is based, indications are that there are validexplanations for these differences. Powerlink has justified its own estimated replacementcosts by providing examples of recent transmission line construction projects where the
PB Associates Powerlink Network Asset Valuation ReviewACCC
Doc No. P:\10211\Valuation April, 2001 Page 16
actual construction cost was higher than the replacement cost estimated using its buildingblock estimating methodology.
It may also be that TransGrid has used a different approach to disaggregating its assetbase for estimation of replacement costs. Powerlink’s approach to disaggregation and, inparticular, its application of correction factors to individual projects assumes that the assetbases would be replaced on an incremental basis, reflecting the historical development ofthe network. Hence the replacement cost of the asset base incorporates a large number ofsmall, relatively high cost projects.
5.1.2 Substations
High level comparisons of the substation replacement costs proposed by Powerlink withthose used by TransGrid in the ODRC valuation included in the Commission’s recentregulatory review of TransGrid has given the following results, corrected to July 2000dollars:
• Powerlink’s proposed replacement cost is $85k per MVA of installed transformercapacity, whereas TransGrid’s was $45k.
• Powerlink’s proposed replacement cost is $12.5m per substation whereas TransGrid’swas $17m.
• Powerlink’s proposed replacement cost is $1,4m per circuit breaker bay whereasTransGrid’s was $1.5m.
• Powerlink’s proposed replacement cost is $7.8m per transformer whereas TransGrid’swas $8.6m per transformer.
The above comparisons indicate that substation costs vary widely and are influenced by alarge number of factors. In particular, high-level benchmarking comparisons do notadequately allow for the differences in the network configurations of the two TNSPs. Hencehigh-level comparisons are, in themselves, of limited value as a basis for whether aparticular TNSP’s asset replacement costs are reasonable for valuation purposes.
The difficulty in benchmarking substation costs is reinforced by the fact that the New SouthWales Treasury Guidelines give standard costs for transmission line construction, but notfor substations. Earlier versions of the New Zealand ODV Handbook also did not givestandard asset values for transmission substations. While later versions of the Handbookinclude such values, it is understood that TransPower provided these and they are thereforespecific to TransPower’s situation.
The Consortium valuation used replacement costs that were determined by the Consortiumitself, and not provided by Powerlink. PB Associates has not tested these costs in detailbut notes that they were independently developed on behalf of the ERU, and used by theERU as the basis for the regulatory determination that currently applies to Powerlink.
The replacement costs used in the Consortium’s valuation were similar to Powerlink’scosts for constructing 275 kV substations, but lower than its costs for constructing 132 kVsubstations. Powerlink therefore engaged GHD to compare the Consortium’s replacementcosts with Powerlink’s to try and find an explanation for the differences. The GHD reportfound that:
• The Consortium’s replacement cost estimate was based on capital city prices and didnot take due account of location.
• The cost of 132 kV substation bays was significantly impacted by the size of theproject.

PB Associates Powerlink Network Asset Valuation ReviewACCC
Doc No. P:\10211\Valuation April, 2001 Page 17
Based on these findings, Powerlink considers that the substation replacement costs in theConsortium’s final report should be adjusted upwards by the application of a locationalfactor and considers the locality factors published by Rawlinson to be appropriate.
Whilst locality factors may be applicable to general civil works, we question whether theyare appropriate for the purchase of electrical plant, given that delivery costs for locationsbeyond Brisbane are likely to be only a small proportion of equipment purchase costs. It isalso not clear why the Consortium’s 275 kV construction costs were more consistent thanits 132 kV costs with Powerlink’s own database, given that they also did not includelocational factors.
Nevertheless Powerlink has provided the following table that indicates that their estimatedcosts are comparable to actual construction costs, for both 275 kV and 132 kVsubstations. It can be seen that, for the four projects taken together, the actualconstruction cost was only 0.5% lower than the replacement cost estimated usingPowerlink’s replacement cost estimating methodology.
Project DateCompleted
Actual CostEsc to 2001/02
Building BlockEstimate
Variation
Rocklea 275/110kV 1997/98 $6.741M $6.587M -2.3%Calvale & Tarong275kV Extension
1998/99 $10.798M $11.377 5.4%
Tangkam 110kV 1999/00 $6.378M $6.414M 0.6%Tully 132kV 2000/01 $6.301M $5.990M -5.2%AVERAGE $30.224M $30.368M 0.5%
5.1.3 Summary
The Consortium valuation uses independently assessed replacement costs for the valuationof transmission line and substations. Subsequent to this valuation, Powerlink hasundertaken further study and has proposed a new valuation, with substation replacementcosts increased by around 3.9% and transmission line replacement costs increased byaround 3.2% when compared to the Consortium’s valuation, escalated to July 2000 values.Comparisons provided by Powerlink indicate that their revised valuations are a fair reflectionof expected replacement costs, based on Powerlink’s current project management andconstruction practices.
Such comparisons do not indicate whether Powerlink’s increased costs are reasonable incomparison with costs elsewhere in the industry and with the costs that might beachievable in a highly competitive environment. PB Associates attempted to establish thisby undertaking a high level benchmarking comparison with the replacement costs in thevaluation submitted by TransGrid for its recent regulatory review. Significant differenceswere identified, but it is possible that these could be accounted for by differences innetwork configuration, differences in the cost structure between Queensland and NewSouth Wales and legitimate differences in the assumptions on which the estimates werebased (e.g. a large scale or incremental approach to construction). It was therefore notpossible, in the time available, for us reach any conclusion on the efficiency of thereplacement costs proposed by Powerlink.
PB Associates Powerlink Network Asset Valuation ReviewACCC
Doc No. P:\10211\Valuation April, 2001 Page 18
5.2 INTEREST DURING CONSTRUCTION
In its submission to the Commission, Powerlink argues that the Consortium used a crudemodel for determining interest during construction (IDC). Accordingly, the Powerlinkvaluation incorporates a 1.1% loading on the assessed replacement cost of transmissionlines and substations to account for the difference between its assessment of 7.6% andthe figure of 6.5% that it states is used in the consortium valuation.
Powerlink’s assessment of 7.6% for IDC is based on a study undertaken by PriceWaterhouse Cooper (PWC) into the appropriate level of IDC. The PWC report argues thatIDC should be based on the weighted average cost of capital (WACC), rather than the costof debt capital alone. By examining the cash flows expended on five recent Powerlinkprojects, it develops a “standard” project S-curve and uses this to determine the cash flowprofile of a typical project, which is assumed to extend over a two-year time frame. Thisconverts into an IDC of 7.6% of the overall cost of the project if a WACC of 7.5% isassumed.
The PWC analysis is rigorous. The assumption of 7.5% for WACC is reasonable, givenrecent regulatory determinations, and the argument that IDC should be based on WACC isconsistent with the Commission’s Draft Statement of Principles. A two-year time frame isrealistic for a transmission line project but it could be argued that 18 months is a morereasonable time frame for a substation project, particularly if the incremental three bayextension used for assessing substation replacement costs is assumed. However thedifference this would make to the replacement value of the asset base is unlikely to bematerial and we therefore consider the PWC / Powerlink value for IDC to be reasonable.
There is nothing in the Consortium’s valuation report to indicate that 6.5% was the value itused for IDC. The Consortium refers to IDC only in the context of determining anappropriate loading for indirect costs, although the report does indicate that its assessmentof IDC is based on “an appropriate interest rate” rather than on WACC.
It should be noted that IDC is only relevant if the regulatory asset valuation makes noprovision for work in progress. This is in accordance with the Commission’s Statement ofRegulatory Principles, which indicates that work in progress should be rolled forward at anappropriate rate of return but only included in the regulatory asset base after the projecthas been commissioned.
If the regulatory asset valuation used for regulatory pricing includes work in progress, thenprovision should not be made for IDC when estimating asset replacement costs, since anappropriate return for the funds invested would be provided for in the allowed revenue cap.In this regard it is noted that the Consortium’s valuation included a line item for work inprogress.
5.3 EASEMENTS
Three alternative methodologies have been proposed for the valuation of easements. Theseare each discussed separately in the sections below:
5.3.1 Deprival Valuation
The deprival valuation concept attempts to assess the cost of replacing existingeasements, assuming current economic and social conditions. This approach is favouredby both Powerlink and the Consortium on the basis that it is consistent with the deprivalvaluation philosophy, although both acknowledge that the introduction of a pure deprivalapproach to easement valuation could create a price shock that may well be politicallyunacceptable. For example, the Consortium’s valuation of Powerlink’s existing easements
PB Associates Powerlink Network Asset Valuation ReviewACCC
Doc No. P:\10211\Valuation April, 2001 Page 19
using a deprival value approach was $1,100,153,000. This is almost 93% of theConsortium’s assessed ODRC of the transmission lines that use the easements.
In our view, it is simplistic to postulate that network companies should value easementsusing a pure replacement cost approach, simply because this is consistent with thedeprival valuation philosophy used for valuing other network assets. This ignores the verysignificant economic differences between easements and other physical transmissionnetwork assets such as lines, substations and land. In particular:
- Transmission lines, substation equipment and land can generally be traded on an openmarket. For these assets the ODRC valuation is a reasonable approximation for whata willing, but not anxious, buyer would be prepared to pay. In other words, should thenetwork owner have no further need for an asset, it could generally liquidate it at a priceapproaching the ODRC valuation. In the case of easements, there is no open marketand generally the only likely purchaser is the serviant tenement. A sale of theeasement may only be possible if there was a potential to generate an economic returngreater than the sale price of the easement. This could occur if, for example,extinguishing an easement increased the subdivision potential or enabled buildings tobe constructed on the land.
Often, the presence of a transmission line has little or no impact on the economicpotential of the land. This is particularly true in rural areas. We suspect therefore thatmany if not most, landowners would decline to buy back the easement, preferring tolet it lie on the title. It follows that the economic value of the asset should be reducedto account for this limited liquidity.
- Landowners, and the general public, are becoming much more sensitive toenvironmental issues. It is likely that political considerations would today prevent theacquisition of many existing easements, irrespective of the value placed on them.However, in using the deprival value concept, there is an implicit assumption that everyexisting easement would still be available provided the purchaser was prepared to paythe going price. We believe this assumption is flawed, as evidenced by the rejection ofthe original route proposed for the QNI interconnector.
- For any easement there is an upper limit to what a prudent network owner would beprepared to pay. This is equivalent to the cost of bypassing the easement, either byusing the same technology over a different route or using an alternative technology.For example, even if an easement in an urban area were politically acceptable, anetwork owner would not buy the easement if it would be cheaper to avoid easementcosts by running underground cables under public streets.
Essentially this is an optimisation issue. In undertaking optimisations, mostregulators accept the incremental basis on which a network was developed and allowexisting transmission line routes to be assumed. However, if easement costs were tobe taken into account in the optimisation process, it is doubtful that this would beappropriate. This is because, assuming a network owner was deprived of all hisassets, the configuration of an optimal replacement network would be very different ifexisting transmission line routes were not readily available.
The deprival concept valuation of easements presented in the Consortium report is simplythe Consortium’s assessment of the cost to Powerlink of replacing its existing easementsgiven their existing positions and assuming current market conditions. Even if the deprivalconcept were accepted in principle as a legitimate methodology for valuation ofeasements, we would expect proper consideration of the above factors to result in asignificant reduction to the valuation assessed by the Consortium.

PB Associates Powerlink Network Asset Valuation ReviewACCC
Doc No. P:\10211\Valuation April, 2001 Page 20
In valuing easements the Consortium divided the land into five categories: urban,transitional, rural farming and rural grazing and balance. Balance land was generallypublicly owned and easements over balance land were considered to have no value.
For the other land categories, the average price per hectare of unencumbered freehold landwas estimated for each of the three Powerlink areas, northern, central and southern, basedon Arthur Andersen’s experience and the experience of Powerlink and Ergon personnel.Each easement was valued on the basis of the likely freehold value of the land occupied bythe easement, given land type and location, multiplied by a correction factor to account forcompensation costs to cover additional factors such as injurious affection, disturbance,severance, timber, construction allowance encumbrance on title access tracks and theproximity affect on the home site.
Location factors ranged from 0.5 for rural grazing land to 1.5 for urban land. In determiningthe appropriate compensation factor the acquisition costs were compared to the landvalues for four easements. These easements did not include any transitional or urban landand in these cases the Consortium applied what it considered to be appropriate correctionfactors. Error in determining these two factors may not be material in that the proportion oftotal easement length that traverses urban or transitional land is likely to be small.
PB Associates has not engaged the services of a specialist land valuer to comment onthis methodology. However we do note that acquiring an easement does not involveobtaining title to the land covered by the easement and that the value of an easement islikely to be related to the loss of the economic potential of the land due to theencumbrance. In grazing and farming areas, this is likely to be minor, except for landused, or intended to be used, as commercial forest.
Further the transitional factors noted above are generally site specific. A standard methodof valuing an easement in a specific location is to assign a value equal to the difference invalue of the lot on which the easement is located with and without the encumbrance. Themethodology used by the consortium is at best an approximation, designed to simplify theprocess of deriving the total valuation of a large number of different easements, each withits own individual characteristics. In using this approach the selection of reliable correctionfactors is crucial, particularly in view of the materiality of the valuation in the context of thetotal value of the asset base. Indeed, given this materiality, an individual valuation of eacheasement could probably be justified. Irrespective of this, it is not at all clear thatassigning correction factors on the basis of such a limited sample of control easements,which do not even appear to have been selected at random, is appropriate.
In addition to the area-based values determined by the above process the Consortium hasadded a fixed cost of $20,000 per km of easement length, to cover both the costs ofdetermining an appropriate line route and also the costs of registering the easement.These costs include environmental impact studies, cultural heritage studies, corridorselection reports, community offsets, professional and survey fees and acquisition costs.This concept is reasonable. However, the report provides little evidence of any criticalanalysis by the Consortium into an appropriate level for these assemblage costs, and thefigure used in the valuation would seem to be based purely on information provided byPowerlink.
The Commission, in its Draft Statement of Principles, stated that it proposes to adopt adeprival valuation approach to the valuation of easements. However, where the deprivalvaluation of an easement changes over time, the Commission would require the change tobe reflected by a depreciation adjustment in a similar manner to the treatment of othernetwork assets. This would ameliorate the price shocks, since any appreciation in thevaluation of easements would be offset by a corresponding negative depreciationadjustment, which would reduce the regulated revenue cap in any year such an adjustmentwas applied.
PB Associates Powerlink Network Asset Valuation ReviewACCC
Doc No. P:\10211\Valuation April, 2001 Page 21
If, the Commission decides to proceed on this basis, we nevertheless consider that a morecareful assessment of Powerlink’s total easement value is necessary in order to ensurethat appropriate account is taken of the factors addressed above. A proper assessment islikely to be time consuming and expensive, but is justified on the basis that the inclusionof easement deprival values would significantly increase the total value of the asset base.
5.3.2 Historic Roll-Forward Valuation
The Consortium valuation also provides an historic roll forward valuation of the easements,which was assessed to be $114,658,000, or 10.4% of its assessed easement deprivalvalue.
This valuation is determined by taking the easement valuation as of 1 July 1997, adding inthe cost of easements acquired over the period 1996/1997 to 1998/1999 and indexing allvalues forward to 1 July 1999. It is understood that the opening easement value, and theactual costs added in for easements purchased after 1 July 1996, include all easementrelated costs, including assemblage costs. Further, while the opening easement assetvalue is shown at as 1 July 1997, the Consortium has subsequently added in easementspurchased in the twelve months prior to this date. The reasoning behind this adjustment isnot clear.
Powerlink considers the opening asset value used as the basis for this valuation to beunreliable. In its submission to the Commission it states that “Powerlink’s book value foreasements were not linked to actual historic cost. The current book values were theproduct of an allocation process undertaken in the early 1990s as a part of the industryrestructuring”
In rolling forward the easement values the Consortium did not use an accepted,statistically derived index but developed its own index, in what appears to be a ratherarbitrary fashion. The valuation report states:
“Due to time constraints we have been unable to properly analyse the market for thevarious easement categories to determine an appropriate property index. We havetherefore had regard to the Consumer Price Index (CPI). However, based on ourexperience and analysis of movements in property values over a long period of time,property prices historically exceed the CPI by 100 basis points”.
On this basis the Consortium has developed an indexing factor that arithmetically adds 1%to the calculated CPI movement for each year that a value is moved forward. Henceeasements acquired in 1998/99, which on the basis of CPI should have been inflated by0.08% corresponding to a 6-month index were actually inflated by 0.58%. Similarlyeasements acquired in 1996/7, which on the basis of CPI would have been inflated by1.9% corresponding to a 2.5 year index, were actually inflated by 4.4%, derived by adding1.9 to 2.5.
Given Powerlink’s concerns over the legitimacy of the opening asset value, and the lack ofrigour used in developing a roll forward index, the Consortium’s historical roll forwardvaluation is not considered sufficiently reliable to be used as a basis for regulatory pricing.
5.3.3 Revalued Depreciated Actual Cost Approach
Powerlink has presented a hybrid approach that it submits should be used to value itseasements for the price review, should the Commission not accept a replacement costapproach. The submission recognises that the Consortium’s ODRC valuation ofeasements may not be acceptable to the Commission due to possible price shocks.
Powerlink’s approach postulates that the costs of obtaining a transmission line easementshould be segmented into two components.

PB Associates Powerlink Network Asset Valuation ReviewACCC
Doc No. P:\10211\Valuation April, 2001 Page 22
1. The direct cost of purchasing the easement from the owner of the land.
2. The additional or assemblage factors that impact on the cost, and by implication thevalue of easements. These costs include environmental impact studies, culturalheritage studies, corridor selection reports, community offsets, professional and surveyfees and acquisition costs. In the Consortium’s deprival valuation, these costs wereassessed as currently amounting to $20,000 per km of easement length.
Powerlink considers that direct costs should be valued on a historical roll forward basiswith the historical costs being indexed forward to reflect the value of the dollar at the date ofthe valuation. This is also referred to an indexed depreciated actual cost (DAC) approach,although this description is misleading, as depreciation is not normally applied whenvaluing land and easements.
On the other hand, Powerlink considers that the additional or assemblage factors shouldbe valued on the basis of their assessed current cost of $20,000 per km, as used by theConsortium in its deprival concept easement valuation.
In effect this is a hybrid situation, where direct costs are assessed on a historical rollforward basis while assemblage costs, which tend to depend on easement length ratherthan land value, be assessed on today’s actual cost (ODRC).
On this basis Powerlink’s assessment of the June 2000 value of its regulated easementsis:
Direct costs (historical roll forward) $66,714,806
Assemblage Costs (ODRC) $131,612,000
Total $198,326,806
In its submission Powerlink states that, while it was intended that the Consortium’shistorical roll forward approach should represent an “indexed DAC” valuation, this did notoccur, since the valuation relied on Powerlink’s book value for easements which are notlinked to actual historic costs. The book values are the product of an allocation processundertaken in the early 1990s as part of the industry restructuring. Further, actual historiccosts of many existing easements are not available.
In order to estimate an appropriate historic cost for each individual easement, Powerlinkanalysed a number of corridors that it had acquired since 1958, and for which cost datawas available. It plotted the cost of acquisition for each easement in $/ha against year ofacquisition, and plotted a “curve of best fit” which enabled it to assign a historic acquisitioncost per hectare for every easement it owns, based on the size of the easement and thedate of acquisition. It is noted that this approach does not account for the type of landinvolved or the location of the easement.
The historic cost of each easement was calculated of the basis of its area and the unitcosts indicated by the “curve of best fit”, and then rolled forward on the basis of theconsumer price index (All Groups – Australia) to determine a July 2000 value. The impactof this roll forward is to increase the direct cost component of easement values by 94%over estimated historic costs of $34,462,969.
Powerlink commissioned a report from Arthur Andersen to critique this approach. Theconsultant concluded that:
• It could not endorse the methodology as conforming to accepted valuation standards.It was of the view that it should only be considered a transition method to avoid thesudden increase in value that would occur under the deprival concept.
PB Associates Powerlink Network Asset Valuation ReviewACCC
Doc No. P:\10211\Valuation April, 2001 Page 23
• Too few easements were analysed to make an accurate assessment of the manner inwhich the direct costs of easement acquisition would change with time. However, onthe basis of the numbers developed by Powerlink, Arthur Andersen would have used acurve of best fit that indicated significantly higher easement acquisition costs afterabout 1970, than those assumed by Powerlink.
• If the Commission accepts this alternative approach, there is a possibility that aprecedent may be set that could evolve into a number of potential problems forPowerlink, the Commission and other regulators and utilities. There could benumerous assessments of value between book value and ODRC value, all with equallysupportable justification.
• There is a real need for future research and discussion on this topic to betterunderstand the issues associated with stakeholder interests.
Notwithstanding Arthur Andersen’s legitimate concerns about the methodology, thePowerlink calculation would seem to be the most rigorous of the three valuationspresented. The “curve of best fit” used by Powerlink is conservative in that it ensures thatapparently high settlements reached in three of the eleven easements studies, do notexcessively inflate the estimates of historic cost on which the valuation is based.
The separation of an assemblage cost per km based on present day cost, to coverenvironmental impact studies, cultural heritage studies, corridor selection reports,community offsets, professional fees surveying and acquisition costs is supported. Thesecosts are real and are incurred whenever a new line is constructed. Inclusion of thesecosts in the ORDC asset base is consistent with the deprival concept of infrastructureasset valuation.
Whether these costs should be included as an easement cost or as a component of thereplacement cost of the transmission line asset is an issue. Usually a number of routesare considered at an early stage of the design of a new transmission line and many ofthese costs are incurred not because of the easement in itself, but because of the nature ofthe transmission line to be constructed on the easement. For these reasons ourpreference is for these additional assemblage costs to be allocated to the transmission lineassets rather than the easement. It may be that differing accounting treatment of thesecosts by different network owners helps explain why there is little consistency in thedetermination of appropriate easement valuations for regulatory pricing purposes.
In its deprival concept valuation the consortium used a fixed cost of $20,000 per km ofeasement for assemblage. However, the assemblage cost is likely to vary considerably,depending on the location of the line or easement. Further study is needed into theappropriate level of assemblage costs and how they should be treated in ODRC valuations.Issues that need to be addressed include what assemblage costs are valid, whetherlocational factors should be allowed for and whether the costs should be charged againstthe easement or the line. Other issues include treatment of older lines that are notconstructed over legal easements particularly where new easements would be required ifthese lines were to be replaced, and treatment of any easement with a capacity to carryadditional lines that have not yet been constructed. A further issue, particularly if it isaccepted that assemblage should be allocated against a line rather than an easement, isthe extent to which assemblage costs apply when a second or third line is constructedover an existing easement.
We agree that the direct cost of obtaining an easement should also be included in assetbase used for regulatory pricing purposes. In its Statement of Regulatory Principles theCommission states that “To the extent that the acquisition of easements requiresexpenditure by the TNSP, it would be improper for the regulator to their existence or deny areasonable return on the funds employed.” However, in both the Consortium’s historic rollforward approach and Powerlink’s indexed DAC approach the value is rolled forward
PB Associates Powerlink Network Asset Valuation ReviewACCC
Doc No. P:\10211\Valuation April, 2001 Page 24
according to an index that bears no relationship to the special characteristics of aneasement as an economic asset. The result is likely to be an easement value somewherebetween that which would apply using a pure historic cost approach and that which wouldapply using a replacement cost approach. While we are not opposed to the use of anindexed DAC approach, we note that is not based on any sound economic theory butappears to be a pragmatic compromise between two extremes, neither of which arecompletely satisfactory as a regulatory pricing mechanism. In this sense the methodologyis transitional, and likely to be useful only until a more robust easement valuationmechanism emerges.
5.3.4 Recommendation and Conclusion
Three different easement valuations, ranging between $115M and $1,100M and each usinga different valuation methodology, have been considered in this review. None of thevaluations demonstrated the degree of rigour and depth of analysis that had been applied tothe estimation of asset replacement costs, even though the value of easements will have asignificant impact on the total value of the asset base.
Of the three easement valuations presented, we consider that Powerlink’s valuation ofeasements is the most rigorous, although we are unable to endorse the methodology as anaccepted method for valuing easements for regulatory pricing purposes. Nevertheless thereare issues relating to the Powerlink valuation that require further consideration, particularlythe derivation and allocation of assemblage costs.
Acceptance of the Powerlink valuation would result in a regulated easement valuation of$198.3M as of 1 July 2000. This is 16% of Powerlink’s assessment of transmission lineODRC.
As a reality check, we attempted to benchmark this assessment against the value ofeasement included in the asset valuation accepted by the Commission for the TransGridpricing determination. However, in this case, the Commission did not use the ODRCvaluation but instead used a slightly lower alternative valuation provided by IPART. Thiswas an economic valuation that did not break the asset base down into separate assetcategories.
However the Determination did include a December 1998 ODRC valuation of the TransGridassets. This showed the value of easements as $428.1M, 39% of the total transmissionline ODRC. The Commission’s consultants confirmed that this value conformed to deprival/ ODRC principles but gave no details as to how this conclusion was reached. It was notclear of the extent to which this deprival valuation of TransGrid’s easements includedassemblage costs.

PB Associates Powerlink Network Asset Valuation ReviewACCC
Doc No. P:\10211\Valuation April, 2001 Page 25
6. ASSET LIVES
6.1 ECONOMIC LIVES
The Consortium’s valuation relied on asset lives supplied to it by Powerlink. These liveswere reviewed during the course of the valuation, but the Consortium found no reason todepart from these values.
In the Table below these asset lives are compared with those used elsewhere in Australia,and NZ and UK.
Category Powerlink NSWGuidelines
TransGrid NZ ODVHandbook1
UK(PB Power)
Transmission lines
Tower 50 50 50 55 68
Wood Pole 45 35 50 45 53
Underground cables 45 45 55
Transformers 40 50 35 to 40 55
HV Switching Equipment 40 40 40 45 50
Controls/Protection
Electromechanical 15 40 40 45
Auxiliary & AncillaryEquipment
40 35 to 40 40 45 40
Note 1 The NZ ODV Handbook is published by the NZ Ministry of Economic and Development.
It can be seen that, in general the asset lives employed by Powerlink are consistent withthose used elsewhere in the industry.
Some points of difference are:
Transmission lines on wood poles – Powerlink has used a 45 year life compared to a35 year life recommended by the NSW Treasury Guidelines. A 45 year life is consistentwith the recommended life for wood poles in NZ & UK, as well as the value used byTransGrid.
Transformers – the lives chosen by Powerlink are generally shorter than used elsewhere.This may be due to Powerlink’s proximity to the coast and high exposure to cyclones andlightning.
Controls and Protection – Powerlink apply an asset life of 15 years for all secondarysystems, which is lower than the 40 years used by other TNSPs and would appear to bebased on the expected life of electronic equipment. This difference is unlikely to bematerial and, in any case, will result in a lower asset valuation.

PB Associates Powerlink Network Asset Valuation ReviewACCC
Doc No. P:\10211\Valuation April, 2001 Page 26
Overall the asset lives used by Powerlink for valuation purposes are consistent with thoseused elsewhere in the industry and are considered appropriate for regulatory assetvaluation purposes. The shorter lives used for some assets would tend to reduce theODRC asset value, due to the higher depreciation associated with a shorter life.
A minor change was made to the asset lives used for valuing communication assets inPowerlink’s June 2000 valuation. This valuation uses a standard life of 15 years for allcommunications assets, except buildings, towers and establishment, rather than the rangeof values used by the consortium. This change was done to simplify the valuationassessment and is not considered material.
6.2 RESIDUAL LIVES
Both the Consortium and Powerlink allowed a minimum residual life of three years forassets that, at the time of valuation, had less than three years of their standard economiclife remaining or where the standard economic life had expired. For communicationsassets the residual life is two years. This is appropriate and is generally consistent withthe NSW Treasury Guidelines.
PB Associates Powerlink Network Asset Valuation ReviewACCC
Doc No. P:\10211\Valuation April, 2001 Page 27
7. OPTIMISATION
7.1 GENERAL
Optimisation is the process of adjusting the replacement cost of the existing networkassets to account for over design, over capacity and redundant assets. The optimisationprocess is consistent with the deprival valuation philosophy in that assets should beoptimised out if a network owner, when deprived of the assets, would not rebuild them whenconstructing a replacement network, designed to provide a similar level of service undersimilar load growth conditions.
The deprival philosophy suggests a greenfields approach to optimisation where acompletely new network is configured, in the most efficient way possible, having no regardto the existing network design. However, this ignores the fact that networks evolve over anextended period of time, and constantly have to be adapted in response to changingpatterns of electricity supply and demand. Therefore, regulators generally accept anincremental approach to optimisation.
In the optimisation of the Powerlink network, the Consortium indicated that the followingconstraints were assumed.
• The location of generating plants and points of bulk supply was assumed to be fixed.
• Only existing line and cable routes were assumed.
• The optimised network had an import / export capacity similar to that of the existingsystem.
• The optimised system should have inherent stability, reactive power support and faultlevel ratings sufficient for business and total asset management planning, but not morethan the existing system.
The Consortium states that a rigorous review of the optimisation of a transmission networkrequires detailed computer analysis and knowledge of the operation difficulties applicable tothe system. Hence optimisation studies are normally performed by the asset owner andreviewed by the valuer.
We concur with these comments, and the approach proposed, with the one proviso that, asnoted in Section 5.4.1, the assumption that only existing line routes be assumed isinappropriate if the easement replacement costs built into the asset valuation reach thepoint where alternative routes for any specific line would be more economic.
Powerlink has provided a copy of their network optimisation rules that, in broad terms,require that the requirements of the National Electricity code be met, under a single outagecontingency. This is appropriate.
7.2 OPTIMISATION OF THE POWERLINK SYSTEM.
In optimising the network for the consortium valuation, the optimisation used for the 1997ODRC valuation was taken as the basis for discussion.
The optimisation process resulted in the following adjustments:
• Transformer capacities were optimised down at seven substations.
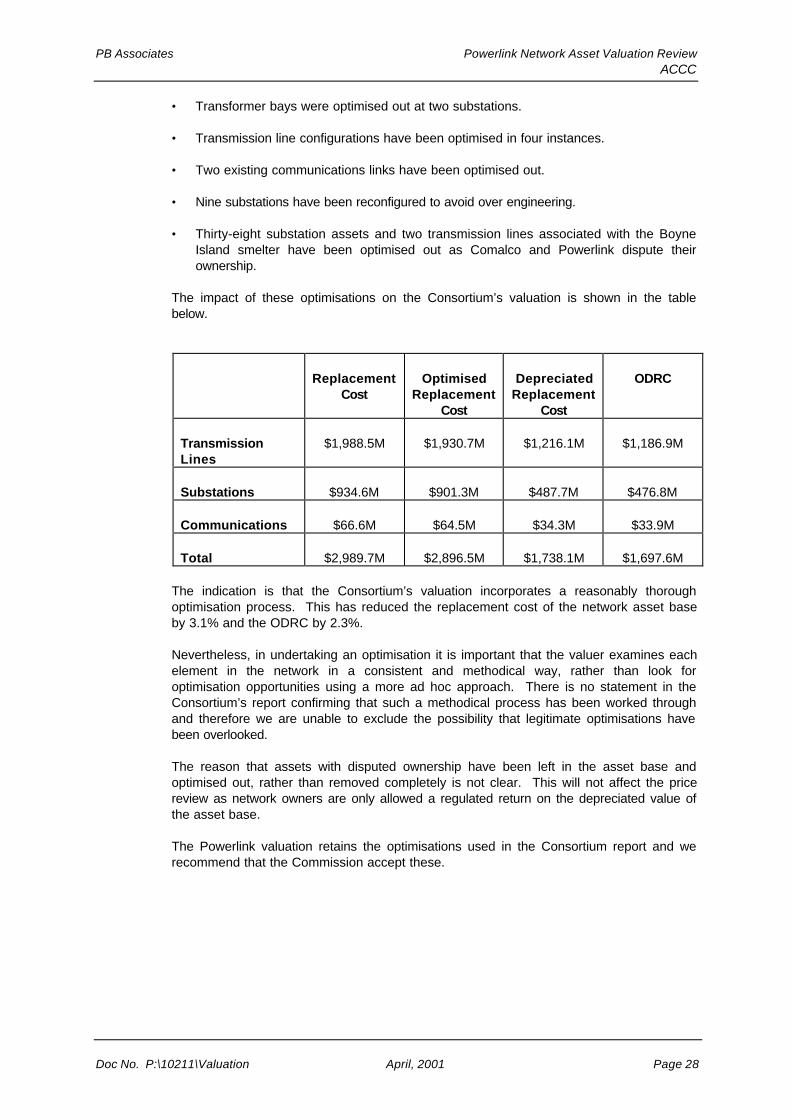
PB Associates Powerlink Network Asset Valuation ReviewACCC
Doc No. P:\10211\Valuation April, 2001 Page 28
• Transformer bays were optimised out at two substations.
• Transmission line configurations have been optimised in four instances.
• Two existing communications links have been optimised out.
• Nine substations have been reconfigured to avoid over engineering.
• Thirty-eight substation assets and two transmission lines associated with the BoyneIsland smelter have been optimised out as Comalco and Powerlink dispute theirownership.
The impact of these optimisations on the Consortium’s valuation is shown in the tablebelow.
ReplacementCost
OptimisedReplacement
Cost
DepreciatedReplacement
Cost
ODRC
TransmissionLines
$1,988.5M $1,930.7M $1,216.1M $1,186.9M
Substations $934.6M $901.3M $487.7M $476.8M
Communications $66.6M $64.5M $34.3M $33.9M
Total $2,989.7M $2,896.5M $1,738.1M $1,697.6M
The indication is that the Consortium’s valuation incorporates a reasonably thoroughoptimisation process. This has reduced the replacement cost of the network asset baseby 3.1% and the ODRC by 2.3%.
Nevertheless, in undertaking an optimisation it is important that the valuer examines eachelement in the network in a consistent and methodical way, rather than look foroptimisation opportunities using a more ad hoc approach. There is no statement in theConsortium’s report confirming that such a methodical process has been worked throughand therefore we are unable to exclude the possibility that legitimate optimisations havebeen overlooked.
The reason that assets with disputed ownership have been left in the asset base andoptimised out, rather than removed completely is not clear. This will not affect the pricereview as network owners are only allowed a regulated return on the depreciated value ofthe asset base.
The Powerlink valuation retains the optimisations used in the Consortium report and werecommend that the Commission accept these.

PB Associates Powerlink Network Asset Valuation ReviewACCC
Doc No. P:\10211\Valuation April, 2001 Page 29
8. INDEXING THE TRANSMISSION CAPITAL BASE FORWARD
Powerlink’s standard accounting practice is to index the asset base forward by theConsumer Price Index – All Groups, Brisbane, in order to update the replacement cost ofits asset base annually. In developing its June 2000 valuation further adjustments havebeen made where the base costs used by the Consortium in its valuation, indexed forwardto June 2000, did not align with Powerlink’s data.
The issue of indexing the capital base forward to so that the ODRC valuation reflectscurrent costs has no simple answer. For example, the replacement costs quoted in theNew South Wales Treasury Guidelines are based on estimated prices in 1995, when theGuidelines were written. These have been tested by PB Associates and found to becomparable with current price levels. This in itself infers that the prices are not linkeddirectly to the CPI and this is demonstrated by the UK experience.
It would seem that transmission system project costs might currently not be increasing inline with movements in the CPI. This is possibly due to the more competitive environmentin which transmission companies now operate. This may be providing the necessaryincentive for companies to seek more innovative and efficient ways of implementingprojects.
In the United Kingdom the average prices of the general transmission equipment includingtransmission switchgear, metering and protection, overhead line conductors, and woodpoles decreased by 7% during the period 1996 to 1998. These price trends were whollyconsistent with prevailing market conditions and the introduction of foreign competition.Suppliers have been forced to be more commercially innovative, stocks have been kept to aminimum and until mid to late 1996 supply had exceeded demand, certainly in Europeanmarkets.
In addition, many of the construction and refurbishment contracts put in place in therestructured and/or privatised supply industries are likely to require the successfulcontractor to purchase materials. Transmission businesses are employing more and morecontractors and the consequently the labour costs rather then the material costs arebecoming more relevant to capital budgeting.
In the recent UK Transmission Price Review the transmission businesses conceded a 1%per annum reduction in procurement costs over the period of the price review.
However, indications are that the situation is dynamic. Market conditions suggest ahealthy export market for plant and that supply is mirroring demand. Raw material costsare beginning to rise (e.g. copper, aluminium, and steel) and recent market testing hasindicated the following price trends in Europe for future purchases:
Line conductors and fittings +6% on current prices;
Primary Transformers +5% on current prices;
Transmission Switchgear +7% on current prices;
The above trends may not be directly applicable to the Australian electricity transmissionindustry but some of the principles will certainly apply here as the regulatory regime drivesthe transmission companies to strive for efficiencies in purchasing and procurement.
The above discussion indicates that, in PB Associates’ experience, transmission line andsubstation costs do not necessarily move in line with CPI. It follows that and a regular
PB Associates Powerlink Network Asset Valuation ReviewACCC
Doc No. P:\10211\Valuation April, 2001 Page 30
annual adjustment in line with CPI may not be a valid method of updating asset valuationsbased on replacement costs
It is likely that movements in replacement costs are influenced by two different drivers,each operating in a different direction:
• Resource inputs, particularly local plant and labour, will tend to increase with time,more or less in line with CPI.
• Market pressures, and the influences of a competitive environment, encourage themore efficient use of resources, which in turn acts to reduce costs. The introduction ofnew technology can also result in reductions in the cost of modern equivalent assets.
Movements in replacement costs with time will depend on the relative influence of each ofthe above drivers. It is likely that, over a short period of time, replacement cost movementswill be primarily driven by changes in the cost of resource inputs. However, over a longertime span, the influence of cost reductions due to competition and technology changesshould become apparent.
Two possible approaches are possible to capturing movements in replacement costs,where these differ from CPI. The first approach, suggested by Powerlink, is to develop acomposite industry specific index reflecting changes in the costs of inputs used fortransmission system construction. A second approach is to undertake a periodicrevaluation of the asset base, basing each revaluation on current replacement costs. Thissecond approach mirrors the standard CPI-X approach to regulation, with its regularrevenue resets. If the second approach is adopted it might be appropriate to allow someindexation of the value of the asset base between valuations.

APPENDIX AGLOSSARY OF TERMS
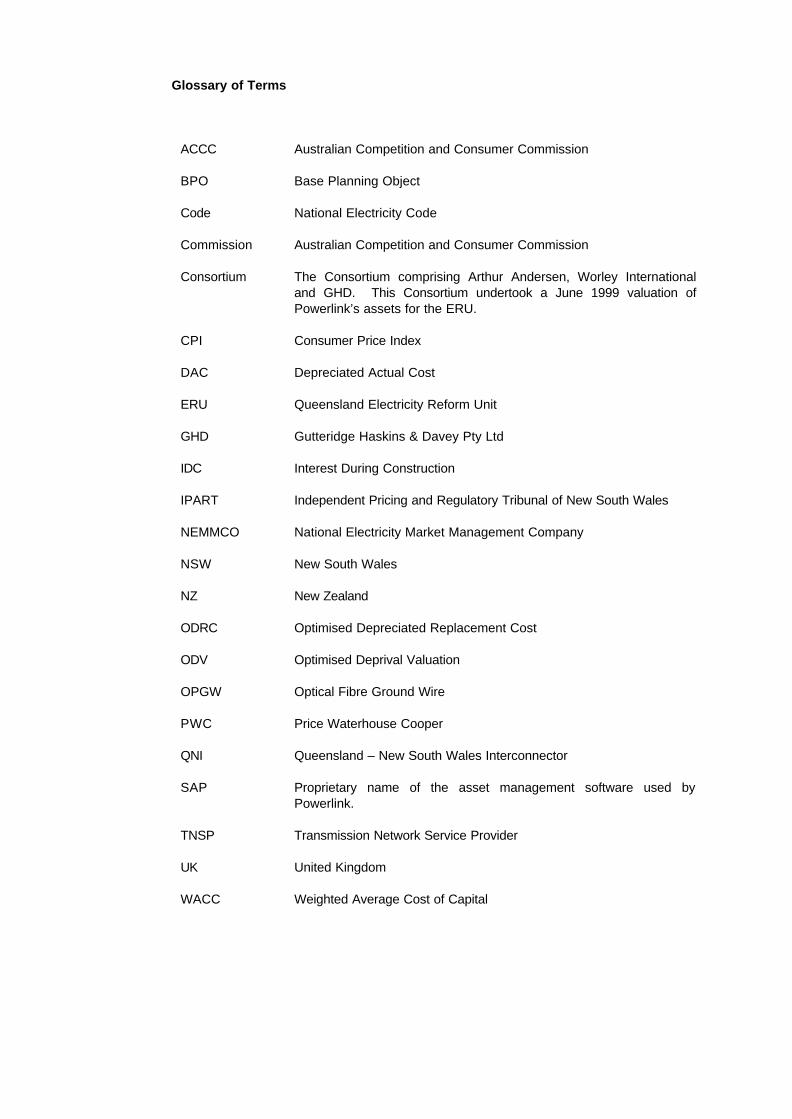
Glossary of Terms
ACCC Australian Competition and Consumer Commission
BPO Base Planning Object
Code National Electricity Code
Commission Australian Competition and Consumer Commission
Consortium The Consortium comprising Arthur Andersen, Worley Internationaland GHD. This Consortium undertook a June 1999 valuation ofPowerlink’s assets for the ERU.
CPI Consumer Price Index
DAC Depreciated Actual Cost
ERU Queensland Electricity Reform Unit
GHD Gutteridge Haskins & Davey Pty Ltd
IDC Interest During Construction
IPART Independent Pricing and Regulatory Tribunal of New South Wales
NEMMCO National Electricity Market Management Company
NSW New South Wales
NZ New Zealand
ODRC Optimised Depreciated Replacement Cost
ODV Optimised Deprival Valuation
OPGW Optical Fibre Ground Wire
PWC Price Waterhouse Cooper
QNI Queensland – New South Wales Interconnector
SAP Proprietary name of the asset management software used byPowerlink.
TNSP Transmission Network Service Provider
UK United Kingdom
WACC Weighted Average Cost of Capital
Related Documents