POWER SYSTEM STABILITY RESPONSE AND CONTROL USING SMALL SIGNAL ANALYSIS A Thesis Presented By Mark Germanos to The Department of Electrical and Computer Engineering in partial fulfillment of the requirements for the degree of Master of Science in the field of Electrical and Computer Engineering Northeastern University Boston, Massachusetts August 2015

Welcome message from author
This document is posted to help you gain knowledge. Please leave a comment to let me know what you think about it! Share it to your friends and learn new things together.
Transcript

POWER SYSTEM STABILITY RESPONSE AND CONTROL USING SMALL SIGNAL ANALYSIS
A Thesis Presented
By
Mark Germanos
to
The Department of Electrical and Computer Engineering
in partial fulfillment of the requirements for the degree of
Master of Science
in the field of
Electrical and Computer Engineering
Northeastern University Boston, Massachusetts
August 2015

1
Abstract
Small signal stability analysis involves the investigation of small perturbation impacts in the
operating point of power systems on system stability. Small signal stability is typically related to
the generator and load properties. The purpose of this investigation is to examine the effects of
small disturbances on system stability and determine the best locations to place power system
stabilizers in order to avoid instability due to these disturbances. This will be accomplished by
evaluating the eigenvalues and eigenvectors of the linearized differential and algebraic
equations of the system. These calculations facilitate determination of the so called
participation factors, which will then be used to identify the relevant modes of the system that
are pushing the system towards instability. Finally, best locations for power system stabilizers
to minimize the effects of these dominant modes and to stabilize the system will be identified.
IEEE 39 Bus test system will be used to illustrate the stability analysis as well as the effective
stabilization of the system by proper placement of power system stabilizers for various power
system contingencies.
Dedication
I would like to dedicate the work of this thesis to my father, Germanos Germanos, who has
devoted himself to me as a father by encouraging me during my career and motivating me
towards the field of engineering by finding his success even at the most difficult challenges.
Key Words: Admittance matrix, Swing Equation, Modes, States, Participation factors, Stability,
Power system stabilizers, Rotor angle, Rotor speed, Damping, Disturbance.

2
Table of Contents
Abstract ............................................................................................................................................ 1
Dedication ........................................................................................................................................ 1
Chapter 1.......................................................................................................................................... 6
1.1 Introduction ........................................................................................................................... 6
1.1.1 Historical Review – Power Systems ................................................................................ 6
1.1.2 Power System Stability – Small Signal Stability ............................................................... 8
1.2 Thesis Contribution .............................................................................................................. 10
Chapter 2........................................................................................................................................ 12
2.1 Electric System Network Model ........................................................................................... 12
2.2 Small Signal Stability ............................................................................................................ 17
2.3 Participation Factor Analysis ................................................................................................ 20
2.4 Power System Stabilizer ....................................................................................................... 25
Chapter 3........................................................................................................................................ 27
3.1 System Model – IEEE 39 Bus System ................................................................................... 27
3.1.1 General Outline ............................................................................................................. 27
3.1.2 Network ........................................................................................................................ 28
3.1.3 Generator Data ............................................................................................................. 28
3.1.4 Branch Data – Lines and Transformers ......................................................................... 28
3.1.5 Power and Voltage Data ............................................................................................... 29
3.2 Simulation Software ............................................................................................................. 29
Chapter 4........................................................................................................................................ 37
4.1 Simulation Results and Analysis ........................................................................................... 37
4.1.1 Methodology ................................................................................................................. 37
4.1.2 Base Case Modal Analysis ............................................................................................. 37
4.1.3 Stability Response to System Changes and System Stability Analysis .......................... 40
4.1.4 System Control and Power System Stabilizer Effect on System ................................... 56

3
Chapter 5........................................................................................................................................ 85
5.1 Conclusion ............................................................................................................................ 85
5.2 Future work .......................................................................................................................... 86
Bibliography ................................................................................................................................... 88
Appendix A ..................................................................................................................................... 90
Appendix B ..................................................................................................................................... 98
Figure 1: Graphical Representation of Electrical System ............................................................... 13
Figure 2: Block Diagram Model Used in Stability Analysis ............................................................. 26
Figure 3: Load Flow data Reproduced in PowerWorld .................................................................. 31
Figure 4: Transient Stability Module .............................................................................................. 31
Figure 5: Pre-Defined Power System Stabilizer Model .................................................................. 32
Figure 6: Gen. Rotor Angle Plot Sample ......................................................................................... 33
Figure 7: Gen. Rotor Speed Plot Sample ........................................................................................ 34
Figure 8: Gen. Real Accelerating Power Plot Sample ..................................................................... 35
Figure 9: Mode (Eigenvalue) Graphic Representation ................................................................... 36
Figure 10: Graphical Display of Modes (Eigenvalues) .................................................................... 40
Figure 11: Test Case 1a Graphical Display of Modes (Eigenvalues) ............................................... 49
Figure 12: Test Case 1b Graphical Display of Modes (Eigenvalues)............................................... 51
Figure 13: Test Case 1c Graphical Display of Modes (Eigenvalues) ............................................... 53
Figure 14: Test Case 1d Graphical Display of Modes (Eigenvalues)............................................... 55
Figure 15: Gen. Rotor Angle Plot Prior to PSS Insertion ................................................................ 58
Figure 16: Gen. Rotor Speed Plot Prior to PSS Insertion................................................................ 59
Figure 17: Gen. Accel. Power Plot Prior to PSS Insertion ............................................................... 60
Figure 18: Modes (Eigenvalues) Plot Prior to PSS Insertion .......................................................... 62
Figure 19: Gen. Rotor Angle Plot During Fault ............................................................................... 63
Figure 20: Gen. Rotor Speed Plot During Fault .............................................................................. 64
Figure 21: Gen. Accel. Power Plot During Fault ............................................................................. 65
Figure 22: Modes (EIgenvalues) Plot During Fault ......................................................................... 67
Figure 23: Gen. Rotor Angle Plot During Contingency, Applied Fault, and Prior to PSS Insertion 68
Figure 24: Gen. Rotor Speed Plot During Contingency, Applied Fault, and Prior to PSS Insertion 69
Figure 25: Gen. Accel. Power Plot During Contingency, Applied Fault, and Prior to PSS Insertion
....................................................................................................................................................... 70

4
Figure 26: Modes (Eigenvalues) Plot During Contingency, Applied Fault, and Prior to PSS
Insertion ......................................................................................................................................... 72
Figure 27: Gen. Rotor Angle Plot after PSS Insertion ..................................................................... 74
Figure 28: Gen. Rotor Speed Plot after PSS Insertion .................................................................... 75
Figure 29: Gen. Accel. Power Plot after PSS Insertion ................................................................... 76
Figure 30: Modes (Eigenvalues) Plot after PSS Insertion ............................................................... 78
Figure 31: Gen. Rotor Angle Plot after PSS Insertion ..................................................................... 79
Figure 32: Gen. Rotor Speed Plot after PSS Insertion .................................................................... 80
Figure 33: Gen. Accel. Power Plot after PSS Insertion ................................................................... 81
Figure 34: Modes (Eigenvalues) Plot after PSS Insertion ............................................................... 83
Figure 35: IEEE 39 Bus System ....................................................................................................... 90
Table 1: Base Case Load Flow Results ............................................................................................ 38
Table 2: Modal Analysis Summary Table ....................................................................................... 39
Table 3: List of Test Cases .............................................................................................................. 41
Table 4: Test Case 1a Load Flow Results ........................................................................................ 42
Table 5: Test Case 1b Load Flow Results ........................................................................................ 43
Table 6: Test Case 1c Load Flow Results ........................................................................................ 45
Table 7: Test Case 1d Load Flow Results ........................................................................................ 46
Table 8: Test Case 1a Modal Analysis Summary Table .................................................................. 48
Table 9: Test Case 1b Modal Analysis Summary Table .................................................................. 50
Table 10: Test Case 1c Modal Analysis Summary Table ................................................................ 52
Table 11: Test Case 1d Modal Analysis Summary Table ................................................................ 54
Table 12: Modes (Eigenvalues) Prior to PSS Insertion ................................................................... 61
Table 13: Modes (EIgenvalues) During Fault ................................................................................. 66
Table 14: Modes (Eigenvalues) During Contingency, Applied Fault, and Prior to PSS Insertion ... 71
Table 15: Modes (Eigenvalues) after PSS Insertion ....................................................................... 77
Table 16: Modes (Eigenvalues) after PSS Insertion ....................................................................... 82
Table 17: Generator Data .............................................................................................................. 91
Table 18: Branch Data .................................................................................................................... 94
Table 19: Power and Voltage Data ................................................................................................ 97

5
V Pre-Transient Bus Voltage Magnitude
I Current
θ Pre-Transient Bus Voltage Angle
P Real Power
Q Reactive Power
𝑌 Bus Admittance Matrix
𝑌𝑖𝑗 Bus Admittance Matrix Element
𝐺𝑖𝑗 Real-Part of Bus Admittance Matrix Element
𝐵𝑖𝑗 Imaginary-Part of Bus Admittance Matrix Element
𝑥𝑑′ Generator Internal Reactance
E Generator Terminal (Internal) Voltage
𝛿′ Generator Terminal (Internal) Angle
δ0 Initial generator angle
𝜔𝑠 System Radian Frequency
𝑇𝑎 Accelerating Torque
𝑇𝑀 Mechanical Torque
𝑇𝑒 Electrical Torque
J Moment of Inertia
H Generator Inertia
𝛿 Generator Rotor Angle
𝜔 Generator Rotor Speed
d Linear Damping Coefficient
𝑃𝑎 Generator Accelerating Power
𝑃𝑀 Generator Mechanical Power
𝑃𝑒 Generator Electrical Power Output
𝐴𝜔 Generator Electrical power Output Equations Matrix
𝐷 Damping Factor Matrix
𝜆 Eigenvalue
𝑤 Left Eigenvector
ν Right Eigenvector
𝑝 Participation Factor
𝑉 Right Eigenvector Matrix
𝑊 Left Eigenvector Matrix
𝑃 Participation Factor Matrix
𝛾 Damping Ratio
𝜎 Real-Prt of Eigenvalue
𝛼 Imaginary-Part of Eigenvalue
Table of Symbols

6
Chapter 1
1.1 Introduction
1.1.1 Historical Review – Power Systems
Power systems typically have three major components, generation, transmission and
distribution. . Power is produced by generators which deliver their output to the transmission
grid at various points. Transmission grid acts like a pool which accepts the power delivered by
the generators and delivers it to distribution systems connected to the transmission grid at
different points via distribution substations. The main function of all power systems is to
provide a constant and continuous supply of energy to all types of consumers ranging from large
industrial plants and commercial organizations to individual households. Because the reliability
of a power system is of utmost importance, a general understanding of the entire process is a
necessary prerequisite for power systems analysis.
Power can be generated by using fossil fuel, coal, water, nuclear sources, and wind. Fossil fuel
can be burned to produce steam, which in turn powers a steam turbine to produce energy. It
can also be burned in an engine or turbine to produce energy or a combination of both
mechanical and thermal (combined cycle). The byproducts of the combustion of coal are
utilized to provide steam which, in turn, powers a steam turbine to produce energy.
Hydroelectric power generation utilizes descending water kinetics to power turbines that turn
mechanical energy into electrical energy. Wind power works in much the same way with the
power source being wind. Nuclear fission produces extreme heat which, when used in
conjunction with cooling water, produces steam that drives a turbine in much the same way as
fossil fuel plants. Other methods of generation are solar, tidal, bio-fuel, etc. In conclusion,
power generation operates [or say all sources of power generation operate...] under the
principal of converting one type of energy into electrical energy, regardless of the means,
method, efficiency, or system used. Throughout the history of the industry, power generation

7
has evolved based on economics, the availability of prime energy, efficiency and reliability,
safety and environmental issues.
A transmission system is the means to transport high voltage power generated by power plants
across long distances to its final destination where it is transformed to medium and low voltage.
This system includes equipment such as substations, transformers, insulated conductors,
capacitor banks, disconnect switches, and protection relays and breakers. When planning to
install a transmission system the following must be taken into consideration: location of
population and industry, terrain, size of the area to be covered, and future expansion.
Distribution is simply the transport of medium and low voltage electricity to the end user. The
equipment involved in this phase of a power system includes switchgear, motor control centers,
transformers, breakers, and distribution panels.
The transmission and distribution systems vary in size and configuration but all have limitations,
related to safety and reliability which are important issues to consider in operating these
systems.
In the 1920’s, when power system stability emerged as a field of study, power systems were
relatively simple being small and having limited connections. Therefore stability was not a major
concern by reason of a simple system design and operation. A larger issue was synchronization
which was attended to by the design of a high quality transmission system. In addition, because
of limited technical understanding and the absence of detailed models along with an inadequate
computational ability, efficiency and reliability were low.
As power systems grew and became interconnected in the 1930’s, improvements were made,
such as the development of scaled physical models which enhanced system analysis. However,
the inability to perform complicated calculations impeded further development and restricted
the analysis of the network only rather than to the individual components, such as generators,

8
transformers, etc. During this time stability of systems was increased by faster protection
devices and better regulating components within the system [1].
With the advent of the computer in the 1950’s, the focus of analysis was no longer limited to the
network, but equipment performance could be analyzed and evaluated as well. Later as
interconnection of systems became a focus, transient stability became a greater concern [2].
Today the field of power system stability involves ongoing development in a variety of areas
including new analytical methods, computer generated calculations, more detailed models,
more complex testing, and higher performance levels of equipment.
1.1.2 Power System Stability – Small Signal Stability
Power System Stability is defined as that property of a power system that enables it to remain in
a state of operating equilibrium under normal operating conditions and to regain an acceptable
state of equilibrium after being subjected to a disturbance. This definition shapes the aspects of
power systems that each technique and methodology must address. This mentioned equilibrium
to be maintained both before and after disturbances incorporates several aspects and is
dependent upon specific system parameters. Synchronization of the machines within the system
and voltage stability is of primary concern. The components that govern these characteristics
are necessary to form the building blocks of stability analysis. One of the chief components of
synchronization is machine rotor angle. Rotor angle is the angle between a rotor axis of the
machine and its stator axis. In order for the system to remain stable, all of the synchronous
machines within a power system must maintain a synchronized state of equilibrium between
their rotor angles. Thus, rotor angle and system stability are one of the fundamental concerns of
analysis. Another important factor of system stability that involves the rotors of the machines is
the non-linear relationship between the machine electric power output and its rotor angle. It
accounts for both the amount of power transferred and the system’s ability to return to
equilibrium i.e. stable after a certain disturbance. Finally, the third major component of power
system stability is rotor speed. The change in rotor speed after a certain disturbance can

9
significantly affect the damping characteristics of the system. Therefore, oscillatory stability
becomes a vital point of emphasis. Having explained stability and its three major components,
the two designations of disturbances involved in stability analysis will be defined. These two
categories are small-signal stability analysis of small disturbances and transient stability analysis
of large disturbances. Small signal stability, covered in this analysis, is the study of system
response to small disturbances. These disturbances result in the system having to cope with
certain issues from rotor angle un-synchronism or oscillation problems due to insufficient
damping. Synchronism issues often involve application of voltage regulation but oscillation
problems form the majority of instability events and are more complex due to the fact that
there are many different oscillation modes. Small signal stability involves the analysis of power
systems around an equilibrium point ‘0’. This allows the complex dynamics of the system to be
transformed to a system of linear equations. In other words, stability is examined for small
disturbances using a simplified linear system model. The idea of small signal stability analysis is
to compose characteristics of the system with minimal error while significantly decreasing both
the complexity and computation effort involved. As the size and complexity of the power
systems increases, the computational effort involved can exceed the reasonable limits even
when using today’s capable and powerful computers. Therefore, techniques can be utilized to
simplify the process and still have a precise and useful outcome of a power system which has a
system response and behavior with minimal error and effort involved. The term “small signal” is
associated to minor disturbances on the system which are used to assess the simplified system
model. Small disturbances within a system are a very common type of disturbance and could be
used to represent the system as a linearized model. These disturbances could be represented as
load changes within a power system. In summary, small signal stability transforms a complex
non-linear power system to a linear system model which could be analyzed as a stable system
around an equilibrium point ‘0’ while it experiences small disturbances eliminating complex
dynamics so that an assumption could be made to make the computation effort more feasible.
However, linear approximations are only made at a certain point in time and these
approximations will change for other time instances. Transient stability analysis attributes to the

10
analysis of power systems including the complex non-linear dynamics. Larger disturbances are
analyzed at different operating points since the behavior of the system changes during a certain
period of time. Transient stability analysis differs in the nature and scale of a disturbance but
often leads to a state similar to small signal instability. Regarding transient instability, first swing
issues or long term end state instability resulting from growing oscillations could lead to
synchronization issues [3].
1.2 Thesis Contribution
The purpose of this study is to introduce power systems including the multi-machine classical
model, the simplified electrical network, and small signal stability including the swing equation
and its linear transformation. Then the system is analyzed using modal analysis in order to
determine the different modes of oscillation and the mode most likely to be driven to instability.
This will facilitate our analysis to identify how the system operates under certain conditions.
Moreover, the techniques specified above will enable us to determine a location to control the
system thus restoring its stability. The remainder of the thesis is devoted to:
Chapter 2: The second chapter of this literary work is first devoted to understanding the
derivation of the electric network model including the classical machine model and its inclusion
to the transmission system admittance network. Second, the chapter establishes a
mathematical foundation behind small signal stability and modal analysis techniques. Third,
introduce the power system stabilizer power system stabilizer and its role in controlling the
system. A literature review is conducted to explain and explore the derivations of the numerical
methods used by the simulation software to formulate the model, analyze the power system,
and explain the impact of the power system stabilizer on a corresponding machine by using
numerical methods and block diagrams to illustrate those facts. The small signal stability areas
addressed include linearization of non-linear differential equations i.e. the swing equation which
models a power system, modal analysis via state space representation, eigenvalue analysis,
eigenvectors, and participation factor analysis. Upon completion of Chapter 2, a thorough

11
understanding of the electric network model, small signal stability analysis process, and the
power system stabilizer should be obtained.
Chapter 3: The third chapter is devoted to introducing both the power system that is used in this
research and the simulation software used to conduct that analysis. The IEEE 39 Bus system is
presented along with all of the system data inputs that are necessary to model and analyze
system operation. These inputs include voltage magnitude and angle, real and reactive power,
impedance, admittance, and component data for the system buses, generators, loads,
transformers and transmission lines. In addition, the simulation software MATLAB and
PowerWorld are present. Software information that is detailed includes the capabilities and
calculative processes involved in system analysis. Examples of results yielded by MATLAB and
PowerWorld are shown, and explanations are given as to the interpretation and significance of
the tables, charts, and graphs.
Chapter 4: The fourth chapter is devoted to presenting the simulation results and their
associated analysis. A methodology is also outlined as to the approach taken during the
research. The results published in this chapter include load flow results, system eigenvalues,
mode distribution, and participation analysis using the modal analysis results. In addition to
these, machine rotor angle, machine rotor speed, and generator accelerating power plots
before and after controlling the system through power system stabilizers at determined
locations are presented.
Chapter 5: The fifth chapter is devoted to discussing the conclusions that are to be drawn from
the research results and future work. These conclusions include the system’s stability, the
system component that participates most in modal stability, and the location for controlling the
system to restore stability.
Following Chapter 5, Appendix A contains all the IEEE 39 Bus system data, while Appendix B
contains all the modal analysis simulation results that were not directly addressed in Chapter 4
and scripts used in programming simulations. This information can be drawn upon when a more

12
detailed account of the modal stability of the various system configurations is needed. Finally, a
list of references completes the thesis work.
Chapter 2
2.1 Electric System Network Model
The machine model used is the classical model of a multi-machine system. This model is based
on the fact that the mechanical power input is constant, damping or asynchronous power is
negligible, constant voltage behind the transient reactance model for the synchronous machines
is valid, mechanical rotor angle of a machine coincides with the angle of the voltage behind the
transient reactance, and loads are represented by passive impedances [4].
This model is useful for small signal stability analysis i.e. transient stability for short time
periods. The assumption that the damping factor is negligible is improved upon by assuming a
linear damping characteristic i.e. a damping torque diωi is added to the inertial torque in the
swing equation. The damping coefficient di includes various damping torque components, both
mechanical and electrical. Values of the damping coefficient usually used in stability studies are
in the range of 1-3 pu. This represents turbine damping, generator electrical damping, and the
damping effect of electrical loads [4].
The electrical network obtained for an m-machine system is as shown in Figure 1. Node 0 is the
reference node (neutral). Nodes 1, 2… m are the internal machine buses, or the buses to which
the voltages behind transient reactances are applied. Passive impedances connect the various
nodes and connect the nodes to the reference at load buses. The initial values of machine
voltage are determined from the pre-transient conditions. The machine voltage magnitudes are
held constant during the transient in this study [4].

13
Xd’1
IL1
E1<δ1
Transmission System
Admittance Matrix
m-machine system
m generation
r constant impedance loads
Xd’m
Em<δm
ILr
Node 0
Im
I1
Figure 1: Graphical Representation of Electrical System
The loads are converted to equivalent admittances. The needed data for this step are obtained
from the load flow study. Thus, if a certain load bus has a voltage ��𝐿, real power 𝑃𝐿 , reactive
power 𝑄𝐿 , and current 𝐼�� flowing into a load admittance ��𝐿 = 𝐺𝐿 + 𝑗𝐵𝐿, then
𝑃𝐿 + 𝑗𝑄𝐿 = ��𝐿𝐼��∗ = 𝑉𝐿
2(𝐺𝐿 − 𝑗𝐵𝐿)
(2.1)
The equivalent shunt admittance ��𝐿 at that bus is given by
��𝐿 = −(𝐺𝐿 + 𝑗𝐵𝐿) = −(𝑃𝐿 𝑉𝐿2⁄ − 𝑗(𝑄𝐿 𝑉𝐿
2⁄ ))

14
There is a negative sign for ��𝐿, since loads are assumed as injected quantities [2].
(2.2)
The internal voltages of the generators are also calculated from the load-flow data. These
internal angles are computed from the pre-transient terminal voltages.
𝑆𝑡𝑎𝑟𝑡𝑖𝑛𝑔 𝑤𝑖𝑡ℎ
𝐼 = 𝐼1 + 𝑗𝐼2
(2.3)
𝑇ℎ𝑒𝑛 𝑓𝑟𝑜𝑚 𝑡ℎ𝑒 𝑟𝑒𝑙𝑎𝑡𝑖𝑜𝑛 𝑃 + 𝑗𝑄 = ��𝐼∗ 𝑡ℎ𝑒 𝑓𝑜𝑙𝑙𝑜𝑤𝑖𝑛𝑔 𝑟𝑒𝑙𝑎𝑡𝑖𝑜𝑛 𝑖𝑠 𝑑𝑒𝑟𝑖𝑣𝑒𝑑
𝐼1 + 𝑗𝐼2 = (𝑃 − 𝑗𝑄) 𝑉⁄
(2.4)
𝑎𝑛𝑑 𝑠𝑖𝑛𝑐𝑒 𝐸∠𝛿′ = �� + 𝑗𝑥𝑑′ 𝐼 𝑡ℎ𝑒 𝑓𝑜𝑙𝑙𝑜𝑤𝑖𝑛𝑔 𝑟𝑒𝑙𝑎𝑡𝑖𝑜𝑛 𝑖𝑠 𝑑𝑒𝑟𝑖𝑣𝑒𝑑
𝐸∠𝛿′ = (𝑉 + 𝑄𝑥𝑑′ 𝑉⁄ ) + 𝑗(𝑃𝑥𝑑
′ /𝑉)
(2.5)
The initial generator angle δ0 is obtained by adding the pre-transient voltage angle θ to δ’.
In order to combine the system admittance matrix with the load admittances and generator
impedances, the following procedure is taken: The system admittance matrix is modified by
adding each load admittance to its corresponding bus (node). Then the system admittance
matrix is augmented to include the generator terminal buses (nodes) by creating a diagonal
matrix of the generator admittances 𝑦 which is simply the inverse of its impedance and then
adding in the fashion shown in equation (2.6).
15
𝑌𝑎𝑢𝑔𝑚𝑒𝑛𝑡𝑒𝑑 =
[
𝑦 | −𝑦 | 0
− | − − − − −−𝑦−0
| 𝑌𝑚𝑜𝑑𝑖𝑓𝑖𝑒𝑑]
(2.6)
Finally, all the nodes are eliminated except for the internal generator nodes thus obtaining the
reduced network. The reduction can be achieved by matrix operation since all the nodes have
zero injection currents except for the internal generator nodes. The reduction is shown in
equation (2.7).
[𝐼𝑚−0
] = [𝑌𝑚𝑚 | 𝑌𝑚𝑟
− − −𝑌𝑟𝑚 | 𝑌𝑟𝑟
] [𝑉𝑚−𝑉𝑟
]
Where m defines a generator node and r a remaining node.
𝐴𝑛𝑑 𝑏𝑦 𝑟𝑒𝑑𝑢𝑐𝑡𝑖𝑜𝑛 𝐼𝑚 = (𝑌𝑚𝑚 − 𝑌𝑚𝑟𝑌𝑟𝑟−1𝑌𝑟𝑚)𝑉𝑚
(2.7)
𝑡ℎ𝑢𝑠 𝑌𝑟𝑒𝑑𝑢𝑐𝑒𝑑 = (𝑌𝑚𝑚 − 𝑌𝑚𝑟𝑌𝑟𝑟−1𝑌𝑟𝑚)𝑉𝑚 𝑤ℎ𝑖𝑐ℎ 𝑖𝑠 𝑎𝑛 𝑚 × 𝑚 𝑚𝑎𝑡𝑟𝑖𝑥.
(2.8)
Note that this reduction can be done if the loads are assumed to be constant admittances.
Since the network buses have been eliminated, the internal nodes may be renumbered from 1,
…, m [2].
Where
𝐼�� = ∑𝑌𝑖𝑗 𝐸��
𝑚
𝑗=1
𝑖 = 1,… ,𝑚

16
(2.9)
The real electric power into the network at node 𝑖, which is the electrical power output 𝑃𝑒𝑖 of
machine 𝑖 in an m – machine system is given by
𝑃𝑒𝑖 = 𝑅𝑒[𝐸��𝐼��∗]
Replacing 𝐼��
𝑃𝑒𝑖 = 𝑅𝑒 [𝐸𝑖𝑒𝑗𝛿𝑖 ∑𝑌𝑖𝑗
∗𝐸��
∗𝑚
𝑗=1
]
𝑃𝑒𝑖 = 𝑅𝑒 [𝐸𝑖𝑒𝑗𝛿𝑖 ∑(𝐺𝑖𝑗 − 𝑗𝐵𝑖𝑗)𝐸𝑗𝑒
−𝑗𝛿𝑖
𝑚
𝑗=1
]
𝑃𝑒𝑖 = 𝑅𝑒 [∑(𝐺𝑖𝑗 − 𝑗𝐵𝑖𝑗)𝐸𝑖𝐸𝑗
𝑚
𝑗=1
[cos(𝛿𝑖 − 𝛿𝑗) + 𝑗 sin(𝛿𝑖 − 𝛿𝑗)]]
𝐸𝑖 = 𝑐𝑜𝑛𝑠𝑡𝑎𝑛𝑡 𝑣𝑜𝑙𝑡𝑎𝑔𝑒 𝑏𝑒ℎ𝑖𝑛𝑑 𝑡𝑟𝑎𝑛𝑠𝑖𝑒𝑛𝑡 𝑟𝑒𝑎𝑐𝑡𝑎𝑛𝑐𝑒 𝑓𝑜𝑟 𝑚𝑎𝑐ℎ𝑖𝑛𝑒 𝑖
𝐼𝑖 = 𝑐𝑢𝑟𝑟𝑒𝑛𝑡 𝑜𝑢𝑡 𝑜𝑓 𝑖𝑛𝑡𝑒𝑟𝑛𝑎𝑙 𝑛𝑜𝑑𝑒 𝑖
𝑌𝑖𝑖 = 𝐺𝑖𝑖 + 𝑗𝐵𝑖𝑖 𝑖𝑠 𝑎 𝑑𝑖𝑎𝑔𝑜𝑛𝑎𝑙 𝑒𝑙𝑒𝑚𝑒𝑛𝑡 𝑜𝑓 𝑡ℎ𝑒 𝑛𝑒𝑡𝑤𝑜𝑟𝑘 𝑎𝑑𝑚𝑖𝑡𝑡𝑎𝑛𝑐𝑒 𝑚𝑎𝑡𝑟𝑖𝑥 𝑌𝑟𝑒𝑑𝑢𝑐𝑒𝑑
𝑌𝑖𝑗 = 𝐺𝑖𝑗 + 𝑗𝐵𝑖𝑗 𝑖𝑠 𝑎𝑛 𝑜𝑓𝑓 𝑑𝑖𝑎𝑔𝑜𝑛𝑎𝑙 𝑒𝑙𝑒𝑚𝑒𝑛𝑡 𝑜𝑓 𝑡ℎ𝑒 𝑛𝑒𝑡𝑤𝑜𝑟𝑘 𝑎𝑑𝑚𝑖𝑡𝑡𝑎𝑛𝑐𝑒 𝑚𝑎𝑡𝑟𝑖𝑥 𝑌𝑟𝑒𝑑𝑢𝑐𝑒𝑑
𝑑𝑒𝑓𝑖𝑛𝑒:
𝛿𝑖𝑗 = 𝛿𝑖 − 𝛿𝑗
𝑃𝑒𝑖 = ∑𝐸𝑖𝐸𝑗(𝐵𝑖𝑗 sin 𝛿𝑖𝑗 + 𝐺𝑖𝑗 cos 𝛿𝑖𝑗)
𝑚
𝑗=1
17
(2.10)
2.2 Small Signal Stability
The process begins with modeling the system in order to mathematically quantify the system’s
response to whatever stimulus is injected. Necessary assumptions are made to achieve minimal
error and complexity. The system behavior is then presented and analyzed based on the design
methodology used in this study [5]. Small signal stability analysis is the transformation of the
complex dynamic system to a linearized model. In other words, the non-linear system equations
are linearized around an equilibrium point. Most often state-space representation is used. This
representation format quantifies the system into the simplest of terms while still holding the
true characteristics needed to outline the behavior of the system with minimal error. The
components that make up this representation are the state variables of the power system itself,
and it is the combination of these variables along with system inputs that determine how the
system performs. For any given system, there exists a singular behavior pattern for that system
given a set of inputs [6]. Nevertheless, there are often nonexclusive state space representations
for that system, as differing state variables can often be chosen to accurately represent the
system. The equilibrium points around which the analysis takes place basically takes a snapshot
of the response of the system to a given input at a specific instant of time i.e. setting all of the
derivatives to zero and then solving the equations graphically representing zero velocity [6].
Linear systems only have one equilibrium point and satisfy the equation f(x0) =0 [7] and,
therefore, consist of information about the stability of the system. The nature of linear systems
is that they are able to depict stability or instability independent of the input. The nature of the
system depends only on the system itself. Any stable system will return to a stable state
assuming zero input.

18
The state space representation and its corresponding linear system model of a power system
begin with transforming the nonlinear differential equations. These differential equations are
those, such as the popular swing equation, that numerically model the operation of the
different components of the system. In the instance of the generator models, the angular
dynamics between the rotor and stator axis depend on the angular difference [5].
The swing equation governs the motion of the machine rotor relating the inertia torque to the
resultant of the mechanical and electrical torques on the rotor as shown in equation (3.1) [4]
𝑑𝛿𝑖
𝑑𝑡= 𝜔𝑖 − 𝜔𝑠 𝑖 = 1,… ,𝑚
(3.1)
𝐽𝑖𝑑𝜔𝑖
𝑑𝑡= 𝑇𝑎𝑖 = 𝑇𝑀𝑖 − 𝑇𝑒𝑖
𝑤ℎ𝑒𝑟𝑒 𝐽𝑖 =2𝐻𝑖
𝜔𝑠
Due to the fact that the angular speed 𝜔𝑖 is nearly constant the accelerating power 𝑃𝑎𝑖 is
numerically nearly equal to the accelerating torque 𝑇𝑎𝑖 [4] and substituting 𝐽𝑖
2𝐻𝑖
𝜔𝑠
𝑑𝜔𝑖
𝑑𝑡= 𝑃𝑎𝑖 = 𝑃𝑀𝑖 − 𝑃𝑒𝑖 − 𝑑𝑖𝜔𝑖
𝑊ℎ𝑒𝑟𝑒 𝑑𝑖𝜔𝑖 𝑖𝑠 𝑎 𝑑𝑎𝑚𝑝𝑖𝑛𝑔 𝑡𝑜𝑟𝑞𝑢𝑒 𝑐𝑜𝑛𝑠𝑡𝑎𝑛𝑡 𝑎𝑑𝑑𝑒𝑑 𝑡𝑜 𝑡ℎ𝑒 𝑒𝑞𝑢𝑎𝑡𝑖𝑜𝑛
(3.2)
𝐿𝑖𝑛𝑒𝑎𝑟𝑖𝑧𝑎𝑡𝑖𝑜𝑛 𝑎𝑟𝑜𝑢𝑛𝑑 𝑎𝑛 𝑜𝑝𝑒𝑟𝑎𝑡𝑖𝑛𝑔 𝑝𝑜𝑖𝑛𝑡 0 𝑔𝑖𝑣𝑒𝑠
𝑑
𝑑𝑡𝛥𝛿𝑖 = 𝛥𝜔𝑖

19
𝑑
𝑑𝑡𝛥𝜔𝑖 =
𝜔𝑠
2𝐻𝑖
[𝛥𝑃𝑀𝑖 − 𝛥𝑃𝑒𝑖 − 𝑑𝑖𝛥𝜔𝑖]
(3.3)
𝐵𝑒𝑐𝑎𝑢𝑠𝑒 𝑃𝑀𝑖 = 𝑐𝑜𝑛𝑠𝑡𝑎𝑛𝑡 𝑎𝑛𝑑 𝛥𝑃𝑒𝑖 = ∑𝜕𝑃𝑒𝑖
𝜕𝛿𝑗𝛥𝛿𝑗
𝑚
𝑗=1𝑗≠𝑖
𝑑
𝑑𝑡𝛥𝛿𝑖 = 𝛥𝜔𝑖
𝑑
𝑑𝑡𝛥𝜔𝑖 = −
𝜔𝑠
2𝐻𝑖∑(
𝜕𝑃𝑒𝑖
𝜕𝛿𝑗𝛥𝛿𝑗)
𝑚
𝑗=1
−𝜔𝑠
2𝐻𝑖𝑑𝑖𝛥𝜔𝑖
(3.4)
𝐷𝑖𝑓𝑓𝑒𝑟𝑒𝑛𝑡𝑖𝑎𝑡𝑖𝑛𝑔 𝑒𝑞𝑢𝑎𝑡𝑖𝑜𝑛 (2.10)
−𝜕𝑃𝑒𝑖
𝜕𝛿𝑗 𝑖𝑠 𝑜𝑏𝑡𝑎𝑖𝑛𝑒𝑑 𝑎𝑠 𝑠ℎ𝑜𝑤𝑛 𝑖𝑛 𝑒𝑞𝑢𝑎𝑡𝑖𝑜𝑛 (3.5)
= −∑𝐸𝑖𝐸𝑗(𝐵𝑖𝑗 cos 𝛿𝑖𝑗0 − 𝐺𝑖𝑗 sin𝛿𝑖𝑗0)
𝑚
𝑗=1𝑗≠𝑖
𝑓𝑜𝑟 𝑗 = 𝑖
= 𝐸𝑖𝐸𝑗(𝐵𝑖𝑗 cos𝛿𝑖𝑗0 − 𝐺𝑖𝑗 sin 𝛿𝑖𝑗0) 𝑓𝑜𝑟 𝑗 ≠ 𝑖
(3.5)
𝐼𝑛 𝑚𝑎𝑥𝑡𝑟𝑖𝑥 𝑓𝑜𝑟𝑚 𝑡ℎ𝑒 𝑟𝑒𝑙𝑎𝑡𝑖𝑜𝑛 𝑖𝑠

20
[ 𝛥𝛿1
⋮𝛥𝛿𝑚
−
𝛥𝜔1
⋮𝛥𝜔𝑚
]
= [0 | 𝐼− − −𝐴𝜔 | 𝐷
]
[ 𝛥𝛿1
⋮𝛥𝛿𝑚−
𝛥𝜔1
⋮𝛥𝜔𝑚]
(3.6)
𝑇ℎ𝑒 𝑒𝑙𝑒𝑚𝑒𝑛𝑡𝑠 𝑜𝑓𝐴𝜔𝑎𝑟𝑒 𝑔𝑖𝑣𝑒𝑛 𝑏𝑦 −𝜔𝑠
2𝐻𝑖
𝜕𝑃𝑒𝑖
𝜕𝛿𝑗. 𝑇ℎ𝑒 𝑚𝑎𝑡𝑟𝑖𝑥 𝐴𝜔 𝑐𝑎𝑛 𝑏𝑒 𝑤𝑟𝑖𝑡𝑡𝑒𝑛 𝑎𝑠
𝐴𝜔 =
[ −
𝜔𝑠
2𝐻1
𝜕𝑃𝑒1
𝜕𝛿1⋯ −
𝜔𝑠
2𝐻1
𝜕𝑃𝑒1
𝜕𝛿𝑚
⋮ ⋱ ⋮
−𝜔𝑠
2𝐻𝑚
𝜕𝑃𝑒𝑚
𝜕𝛿1⋯ −
𝜔𝑠
2𝐻𝑚
𝜕𝑃𝑒𝑚
𝜕𝛿𝑚 ]
0
𝑤ℎ𝑒𝑟𝑒 [𝐴𝜔]0 𝑖𝑠 𝑙𝑖𝑛𝑒𝑎𝑟𝑖𝑧𝑒𝑑 𝑎𝑡 𝑎 𝑝𝑜𝑖𝑛𝑡 ′0′ 𝑖𝑛 𝑡𝑖𝑚𝑒
(3.7)
𝑇ℎ𝑒 𝑒𝑙𝑒𝑚𝑒𝑛𝑡𝑠 𝑜𝑓𝐷 𝑎𝑟𝑒 𝑔𝑖𝑣𝑒𝑛 𝑏𝑦 −𝜔𝑠
2𝐻𝑖𝑑𝑖. 𝑇ℎ𝑒 𝑚𝑎𝑡𝑟𝑖𝑥 𝐷 𝑐𝑎𝑛 𝑏𝑒 𝑤𝑟𝑖𝑡𝑡𝑒𝑛 𝑎𝑠
𝐷 =
[ −
𝜔𝑠
2𝐻1𝑑1 ⋯ 0
⋮ ⋱ ⋮
0 ⋯ −𝜔𝑠
2𝐻𝑚𝑑𝑚]
0
𝑤ℎ𝑒𝑟𝑒 [𝐷]0 𝑖𝑠 𝑙𝑖𝑛𝑒𝑎𝑟𝑖𝑧𝑒𝑑 𝑎𝑡 𝑎 𝑝𝑜𝑖𝑛𝑡 ′0′ 𝑖𝑛 𝑡𝑖𝑚𝑒
(3.8)
2.3 Participation Factor Analysis
Due to the large size of the power system, it is often necessary to construct reduced order
models for dynamic stability studies by retaining only a few modes [2]. The appropriate
definition and determination as to which state variables significantly participate in the selected

21
modes become very important. This requires a tool for identifying the state variables that have
significant state variables for an eigenvalue λi are those that correspond to large entries in the
corresponding eigenvector νi. However, the entries in the eigenvector are dependent on the
dimensions of the state variables which in this study are the generator rotor angle δ and speed
ω. Thus, participation factor analysis is used to measure state variable participation. For linear
systems, participation factor analysis is used in the identification of how each dynamic variable
affects a given system mode which corresponds to an eigenvalue [8].
𝐺𝑖𝑣𝑒𝑛 𝑎 𝑙𝑖𝑛𝑒𝑎𝑟 𝑠𝑦𝑠𝑡𝑒𝑚 �� = 𝐴𝑥
A participation factor is a sensitivity measure of an eigenvalue to a diagonal entry of the system
which is defined as
𝑝𝑘𝑖 =𝜕𝜆𝑖
𝜕𝑎𝑘𝑘
(3.9)
Where λi is the ith system eigenvalue, akk is a diagonal entry in the system A matrix, and pki is the
participation factor relating the kth state variable to the ith eigenvalue. pki can also be defines as
𝑝𝑘𝑖 =𝑤𝑘𝑖ν𝑘𝑖
𝑤𝑖𝑡ν𝑖
(3.10)
Where wki and νki are the kth entries in the left and right eigenvector associated with the ith
eigenvalue. The right eigenvector νi and the left eigenvector wi associated with the ith eigenvalue
λi satisfy the following equations
𝐴ν𝑖 = 𝜆𝑖ν𝑖
(3.11)

22
𝑤𝑖𝑡𝐴 = 𝑤𝑖
𝑡𝜆𝑖
(3.12)
To establish the equivalence the following system is considered
[𝐴 − 𝜆𝑖𝐼]ν𝑖 = 0
(3.13)
𝑤𝑖𝑡[𝐴 − 𝜆𝑖𝐼] = 0
(3.14)
Assuming that the eigenvalues and eigenvectors vary continuously with respect to the elements
of the matrix A, the following equation is derived as shown
(𝐴 + 𝛥𝐴)(ν𝑖 + 𝛥ν𝑖) = (𝜆𝑖 + 𝛥𝜆𝑖)(ν𝑖 + 𝛥ν𝑖)
(3.15)
[𝐴ν𝑖] + [𝛥𝐴ν𝑖 + 𝐴𝛥ν𝑖] + [𝛥𝐴𝛥ν𝑖] = [𝜆𝑖ν𝑖] + [𝛥𝜆𝑖ν𝑖 + 𝜆𝑖𝛥ν𝑖] + [𝛥𝜆𝑖𝛥ν𝑖]
(3.16)
[𝐴 − 𝜆𝑖𝐼]𝛥ν𝑖 + 𝛥𝐴ν𝑖 = 𝛥𝜆𝑖ν𝑖
(3.17)
𝑤𝑖𝑡[𝐴 − 𝜆𝑖𝐼]𝛥ν𝑖 + 𝑤𝑖
𝑡𝛥𝐴ν𝑖 = 𝑤𝑖𝑡𝛥𝜆𝑖ν𝑖
(3.18)
𝑤𝑖𝑡𝛥𝐴ν𝑖 = 𝑤𝑖
𝑡𝛥𝜆𝑖ν𝑖

23
(3.19)
The sensitivities of λi with respect to diagonal entries of A are related to the participation
factors. Assuming that the kth diagonal entry of A akk is perturbed then it will result in
𝑤𝑖𝑡𝛥𝐴ν𝑖 = 𝑤𝑖
𝑡𝛥a𝑘𝑘ν𝑖 = 𝑤𝑖𝑡𝛥𝜆𝑖ν𝑖
(3.20)
𝑠𝑜𝑙𝑣𝑖𝑛𝑔 𝑓𝑜𝑟 𝑡ℎ𝑒 𝑠𝑒𝑛𝑠𝑖𝑡𝑖𝑣𝑖𝑡𝑦 𝑔𝑖𝑣𝑒𝑠 𝑡ℎ𝑒 𝑝𝑎𝑟𝑡𝑖𝑐𝑎𝑡𝑖𝑜𝑛 𝑓𝑎𝑐𝑡𝑜𝑟 𝑎𝑠 𝑝𝑘𝑖 =𝑤𝑘𝑖ν𝑘𝑖
𝑤𝑖𝑡ν𝑖
Participation factor analysis is a type of analysis that indicates the influence (participation) of a xi
on its corresponding mode λk. This process is explained as shown in equation (3.27).
𝑉: 𝑟𝑖𝑔ℎ𝑡 𝑒𝑖𝑔𝑒𝑛𝑣𝑒𝑐𝑡𝑜𝑟 𝑚𝑎𝑡𝑟𝑖𝑥
𝑊: 𝑙𝑒𝑓𝑡 𝑒𝑖𝑔𝑒𝑛𝑣𝑒𝑐𝑡𝑜𝑟 𝑚𝑎𝑡𝑟𝑖𝑥
𝑃 = 𝑝𝑎𝑟𝑡𝑖𝑐𝑖𝑝𝑎𝑡𝑖𝑜𝑛 𝑓𝑎𝑐𝑡𝑜𝑟 𝑚𝑎𝑡𝑟𝑖𝑥
𝑉 × 𝐿 = 𝐼 𝑤ℎ𝑒𝑟𝑒 𝐼 𝑖𝑠 𝑡ℎ𝑒 𝑖𝑑𝑒𝑛𝑡𝑖𝑡𝑦 𝑚𝑎𝑡𝑟𝑖𝑥
𝑉 = ([𝜈11
𝜈1𝑘
⋮]… [
𝜈𝑖1
𝜈𝑖𝑘
⋮]… [
𝜈𝑛1
𝜈𝑛𝑘
⋮])
𝑊 =
(
[𝑤11 𝑤1𝑘 ⋯]⋮
[𝑤𝑖1 𝑤𝑖𝑘 ⋯]⋮
[𝑤𝑛1 𝑤𝑛𝑘 ⋯])
state
mode
mode
state

24
�� = 𝐴𝑥 → [𝑥1
𝑥��
⋮] = ([
𝑎11
𝑎1𝑘
⋮]… [
𝑎𝑖1
𝑎𝑖𝑘
⋮]… [
𝑎𝑛1
𝑎𝑛𝑘
⋮]) [
𝑥1
𝑥𝑘
⋮]
𝑃 = [
𝑝11 ⋯⋮ ⋯
𝑝1𝑖 ⋯⋮ ⋯
𝑝11 ⋯⋮ ⋯
𝑝𝑘𝑖 ⋯⋮ ⋯
]
𝑃(𝑘, 𝑖) = |𝑊(𝑖, 𝑘) · 𝑉(𝑘, 𝑖)|
(3.21)
After identifying an unstable mode represented by eigenvalue λk=σk±jαk where either σk >0 or
|σk|<ε and using participation factor analysis, it can be determined which state xi has most
influence on that particular mode λk by choosing the largest value pki of column matrix Pk. By
using this analysis, it can be deduced that returning the system back to stability i.e. letting σk <0
and |σk|>ε of the unstable mode λk is primarily dependent on controlling state xi. Moreover, the
state xi is associated with a specific generator which provides a starting point to control the
system.
Another factor which provides a good idea of the behavior of the system is the damping ratio γ
given by the following equation.
mode
mode
state
state

25
𝛾 =−𝜎
√𝜎2 + 𝛼2
(3.22)
2.4 Power System Stabilizer
During the 1950’s new generator units were equipped with voltage regulators (VR). However, as
the new units with their associated VR became a large percentage of the generating capability of
the system, the system began to experience instability during small magnitude oscillations and
low frequencies which persisted for a long period of time. Power System Stabilizers were
introduced to provide damping to the machine oscillations by producing an electrical torque on
the rotor which is in phase with speed variations [5].
A basic power system stabilizers design is based on the concept of classical control theory. This
design has been widely used in actual systems. It is simply a phase feedback control of a
generator’s compensated signal derived from speed, power, or frequency which then generates
a supplementary rotor torque to damp the oscillations [2].
Power system oscillations are a characteristic of the system and they are inevitable. Power
system stabilizers can help the power system oscillations damping. This controller has become
an accepted solution for oscillatory instability problems and thus improves system stability [2].
Power System Stabilizers are generator control equipment which are used in feedback to
enhance the damping of rotor oscillations caused due to small disturbances [2].
The power system stabilizer model as shown in Figure 28 is provided by the stability analysis
software tool PowerWorld. Once the power system stabilizer(s) is inserted in the system the
constants A1 through A6 and T1 through T6 are tuned using trial and error to achieve acceptable
damping on the rotor angle oscillations caused by a disturbance.

26
The power system stabilizers provided additional damping torque to the system usually a few
power swings in the rotor angle oscillations. If a disturbance is likely to render the system
unstable, when no control is provided, the additional damping assists the system to return to a
stable state.
Figure 2: Block Diagram Model Used in Stability Analysis

27
Chapter 3
3.1 System Model – IEEE 39 Bus System
3.1.1 General Outline
In order to succeed in the interpretation and analysis of our data using the analytical methods
outlined in Chapter 2, a test system must be used as a starting point for our analysis. In other
words, system data will be required and then applied to the equations derived in Chapter 2.
Thus, the IEEE 39 bus system is chosen as the representative test system.
This system is also well known as the 10-machine New-England Power System. Generators are
represented as the aggregation of a large number of generators. In this test system, one
generator is selected as the swing bus. For this test system, bus 31 was selected as the swing
bus and its characteristics will display as such. The presentation of system characteristics and
general descriptions for the various parameters needed by MATLAB and PowerWorld to
properly model the test system can be found in Appendix A. All parameters are from the book
titled 'Energy Function Analysis for Power System Stability.

28
3.1.2 Network
The network configuration and connectivity is depicted as shown in Figure 35 in Appendix A.
3.1.3 Generator Data
Regarding the modeling of the generators’ dynamic characteristics in both MATLAB and
PowerWorld, there are a number of parameters that must be inputted. These include:
Machine inertia
Machine sub-transient reactance
Machine armature resistance
All generator data can be found in Table 17 in Appendix A.
3.1.4 Branch Data – Lines and Transformers
Branch data is used to form the network admittance matrix using MATLAB
Concerning the line data, the data needed for the equivalent pi line model includes the
following:
The connected buses on both sides
The line impedance (resistance and reactance) in per unit
Total charging susceptance in per unit.
Concerning the transformer data, all transformers are modeled as two winding transformers
and their data includes the following:
The connected buses on both sides
The internal transformer winding impedance in per unit

29
The turns ratio and phase angle difference with respect to the ‘from bus’
All branch data can be found in Table 18 in Appendix A.
3.1.5 Power and Voltage Data
All data concerned with the power and voltage that are inputted into MATLAB to conduct load
flow analysis are as follows:
Type of bus varying from load bus to generator bus
Voltage set point of the bus in per unit
Real Power that is consumed by the load in MW
Reactive Power that is consumed by the load in Mvar
Real Power that is supplied by the generator in MW
Reactive Power that is supplied by the generator in Mvar
Generator unit number connected to the bus
There are three different types of buses when conducting a load flow listed below:
A swing/slack bus where both the bus voltage V and angle θ are kept constant
A generator or PV bus where the real power P and voltage V are kept constant
A load or PQ bus where the real and imaginary power P and Q are kept constant while
its corresponding voltage V and angle θ are variable
All power and voltage data can be found in Table 19 in Appendix A.
3.2 Simulation Software
In order to model the power system, the system data as described above is inputted in both
MATLAB and PowerWorld. The description, capabilities and functionality of these systems as
they pertain to the system analysis involved in this study are described as follows.

30
Using MATLAB scripts, the admittance matrix is calculated and stored. The load flow calculation
is performed using the Newton-Raphson method. Load flow data in addition to machine data is
used to model the dynamic performance of the system as a system of linear equations using
small signal stability. Small disturbances represented as load changes are implemented
iteratively on the system by modifying the load data and performing a load flow calculation. This
iterative process is repeated until the system renders unstable by modal analysis i.e. eigenvalue
and eigenvector calculation. Finally, participation factors are calculated which will indicate the
state’s influence on its corresponding modes; thus determining the most influential mode. All
results will be shown in tabular format.
The power system steady state and dynamic model is reproduced in PowerWorld as shown in
Figure 3. Then by utilizing the transient stability module which is presented in Figure 4, plots for
generator rotor angles, rotor speeds, and accelerating power as shown in Figures 6, 7, and 8 are
used to display generator transient performance. Predefined power system stabilizer models
with their corresponding parameter inputs as shown in Figure 5 are used to determine locations
by participation factor analysis to stabilize the system. The plots as shown in Figure 6, 7, and 8
will also be used to depict the influence of the power system stabilizers on controlling the
system and returning it to a stable one.

31
Figure 3: Load Flow data Reproduced in PowerWorld
Figure 4: Transient Stability Module

32
Figure 5: Pre-Defined Power System Stabilizer Model

33
Figure 6: Gen. Rotor Angle Plot Sample

34
Figure 7: Gen. Rotor Speed Plot Sample
35
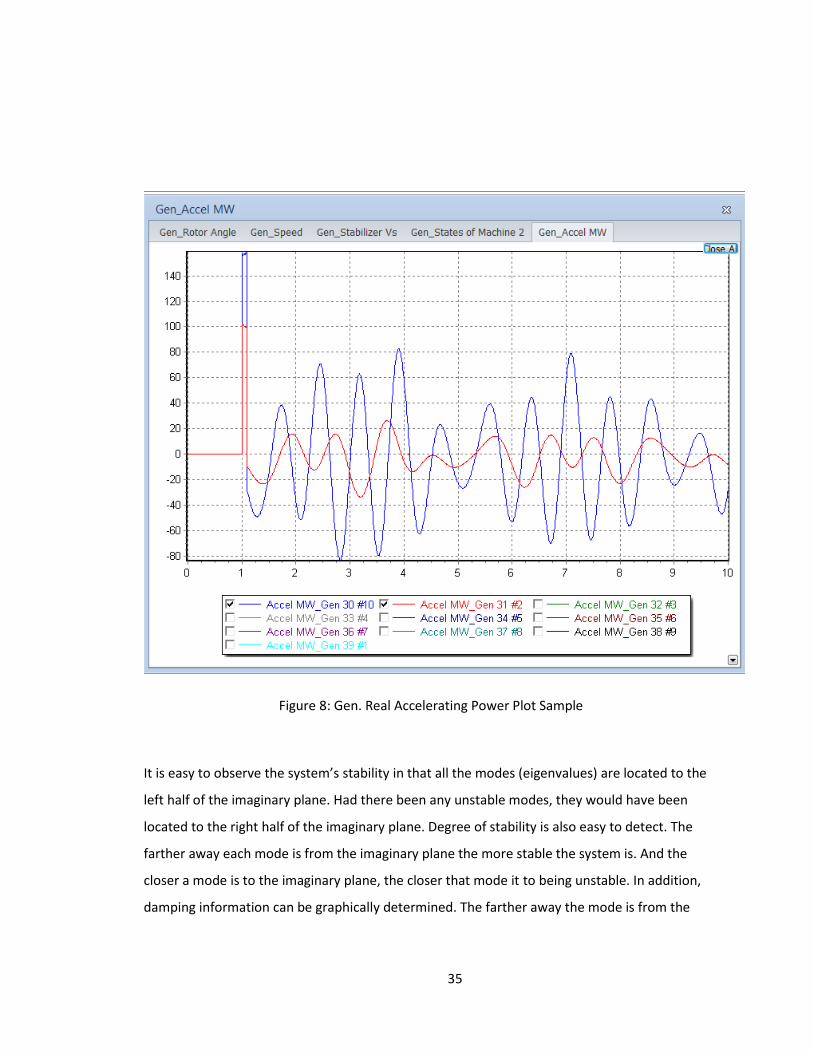
Figure 8: Gen. Real Accelerating Power Plot Sample
It is easy to observe the system’s stability in that all the modes (eigenvalues) are located to the
left half of the imaginary plane. Had there been any unstable modes, they would have been
located to the right half of the imaginary plane. Degree of stability is also easy to detect. The
farther away each mode is from the imaginary plane the more stable the system is. And the
closer a mode is to the imaginary plane, the closer that mode it to being unstable. In addition,
damping information can be graphically determined. The farther away the mode is from the

36
imaginary axis the larger the damping of that mode will be and vice-versa [8]. An example of
that graphical analysis is shown in Figure 9.
Figure 9: Mode (Eigenvalue) Graphic Representation
Chapter 3 concludes the background information and system data that will be used in the power
system research. The IEEE 39 bust test system was identified as well as its inputs. The MATLAB
script and PowerWorld software was also introduced. All of the scripts calculative procedures
pertaining to small signal stability, modal analysis, and participation factor calculation are
described in the literature review. The research methodology will now be presented in Chapter
4.

37
Chapter 4
4.1 Simulation Results and Analysis
4.1.1 Methodology
After defining the electrical system that will be put under test and describing the simulation
software and scripts, a system analysis and simulation will follow. The analysis and simulation
process of the IEEE 39 Bus system (New England system) contains several steps.
4.1.2 Base Case Modal Analysis
The modes of an undisturbed system or the Base case are calculated to achieve a good
understanding of the system stability and response behavior. This is achieved by running a load
flow calculation on the Base case and calculating the eigenvalues using small signal stability
analysis as described in the previous chapters. Once the results are obtained, a good starting
point will be established in order to have a good comparison for later results.
Using the data provided as depicted in Chapter 3 an admittance matrix is calculated followed by
a load flow calculation. The Base case load flow results are shown in Table 1.

38
Table 1: Base Case Load Flow Results
Bus V (PU) Theta (Rad) P (PU) Q (PU)
1 1.0474 -0.1473 0 0
2 1.0487 -0.1004 0 0
3 1.0302 -0.1501 -3.22 -0.024
4 1.0039 -0.1677 -5 -1.84
5 1.0053 -0.1503 0 0
6 1.0077 -0.1387 0 0
7 0.997 -0.1767 -2.338 -0.84
8 0.996 -0.1853 -5.22 -1.76
9 1.0282 -0.1802 0 0
10 1.0171 -0.0947 0 0
11 1.0127 -0.1097 0 0
12 1.0001 -0.109 -0.075 -0.88
13 1.0143 -0.1064 0 0
14 1.0117 -0.1336 0 0
15 1.0154 -0.135 -3.2 -1.53
16 1.0318 -0.108 -3.29 -0.323
17 1.0335 -0.1274 0 0
18 1.0309 -0.1435 -1.58 -0.3
19 1.0499 -0.0178 0 0
20 0.9912 -0.0352 -6.28 -1.03
21 1.0317 -0.066 -2.74 -1.15
22 1.0498 0.0117 0 0
23 1.0448 0.0082 -2.475 -0.846
24 1.0373 -0.1059 -3.086 0.92
25 1.0576 -0.0762 -2.24 -0.472
26 1.0521 -0.0965 -1.39 -0.17
27 1.0377 -0.1308 -2.81 -0.755
28 1.0501 -0.0352 -2.06 -0.276
29 1.0499 0.013 -2.835 -0.269
30 1.0475 -0.0582 2.5 1.4617
31 0.982 0 5.1161 1.9366
32 0.9831 0.0448 6.5 2.0516
33 0.9972 0.0732 6.32 1.0994
34 1.0123 0.0554 5.08 1.6578
35 1.0493 0.0983 6.5 2.1246
36 1.0635 0.1453 5.6 1.0121
37 1.0278 0.0423 5.4 0.0045
38 1.0265 0.1363 8.3 0.2285
39 1.03 -0.1755 -1.04 -1.6171

39
Referring to Table 1, the voltages at the PQ buses are between 0.99p.u. and 1.06p.u. which
indicate that the system is voltage stable as expected of an undisturbed system.
Once the load flow is complete, the initial values are determined. In addition to that, all loads
are converted to constant impedances and with the internal generator impedance data the
reduced admittance matrix is formed. Using these results the system is linearized using small
signal analysis; the eigenvalues are calculated with their corresponding largest participation
factor and damping ratio determining the most influential state on that mode. A summary table
of the results in addition to a plot of the modes is depicted in Table 2 and Figure 10.
Table 2: Modal Analysis Summary Table
Eigenvalue/Mode Largest Participation factor State Gen_Index Damping ratio
1 -0.2959 0.5451 speed 5 1
2 0 0.1272 angle 2 1
3 -0.1891 + 4.1623i 0.2147 speed 5 0.0454
4 -0.1891 - 4.1623i 0.2147 speed 5 0.0454
5 -0.2973 + 5.9988i 0.3458 speed 9 0.0495
6 -0.2973 - 5.9988i 0.3458 speed 9 0.0495
7 -0.3002 + 6.4350i 0.1521 angle 2 0.0466
8 -0.3002 - 6.4350i 0.1521 angle 2 0.0466
9 -0.3073 + 7.2381i 0.1947 speed 8 0.0424
10 -0.3073 - 7.2381i 0.1947 speed 8 0.0424
11 -0.2737 + 8.2921i 0.2637 speed 6 0.033
12 -0.2737 - 8.2921i 0.2637 speed 6 0.033
13 -0.2758 + 8.5519i 0.2566 speed 10 0.0322
14 -0.2758 - 8.5519i 0.2566 speed 10 0.0322
15 -0.3238 + 9.7490i 0.306 angle 3 0.0332
16 -0.3238 - 9.7490i 0.306 angle 3 0.0332
17 -0.3512 + 9.1023i 0.3833 angle 4 0.0386
18 -0.3512 - 9.1023i 0.3833 angle 4 0.0386
19 -0.3321 + 9.2995i 0.4039 speed 7 0.0357
20 -0.3321 - 9.2995i 0.4039 speed 7 0.0357

40
Figure 10: Graphical Display of Modes (Eigenvalues)
Referring to Table 2 and Figure 10, it is observed that the system is stable as expected since all
the modes λ are located on the left half of the imaginary plane. In addition to that, all modes
have large absolute values of their real-part σ which display that the mode is far away from the
origin and damping factors ϒ greater than 3% which also displays that the mode’s slope is very
steep. These observed factors indicate that the system is stable.
4.1.3 Stability Response to System Changes and System Stability Analysis
In the second part of our analysis, small disturbances are simulated in two distinct ways applied
to the system; one way is concerned in load changes, while the other in topological changes .
Similar calculations will be executed and a comparison with the Base case will be made. This

41
comparison will portray the response of these small disturbances. Also, the results by analyzing
the modal behavior due to each disturbance are quantified. In addition to that, using
participation factor analysis, the influence of a specific state on certain modes is determined and
a general idea of system control can then be identified.
In order to simulate a small disturbance as a load change, additional real load is added
incrementally to a load bus and in the case of a topology change a line is disconnected as a
design contingency. Finally, a load flow calculation is obtained for each test case.
Each load increment and the design contingency are both represented by test cases as seen in
Table 3.
Table 3: List of Test Cases
Test Case Load Bus Load Increment (MW)
1a 3 1000
1b 3 2000
1c 3 3900
Test Case Design Contigency
1d Line 9-39 Disconnected

42
The load flow results for each test case are shown in Tables 4 through 7.
Table 4: Test Case 1a Load Flow Results
Bus V (PU) Theta (Rad) P (PU) Q (PU)
1 1.0433 -0.0699 0 0
2 1.0368 -0.1603 0 0
3 1.0084 -0.2747 -13.22 -0.024
4 0.9887 -0.2224 -5 -1.84
5 0.9945 -0.1711 0 0
6 0.9979 -0.1568 -0.0001 0
7 0.9869 -0.1849 -2.338 -0.84
8 0.9857 -0.1883 -5.22 -1.76
9 1.0212 -0.0839 0 0
10 1.0082 -0.1212 0 0
11 1.0035 -0.1335 0 0
12 0.9902 -0.1366 -0.075 -0.88
13 1.0041 -0.1378 0 0
14 0.999 -0.1778 0 0
15 1.0038 -0.1894 -3.2 -1.53
16 1.0208 -0.1661 -3.29 -0.323
17 1.019 -0.2022 0 0
18 1.013 -0.2374 -1.58 -0.3
19 1.0452 -0.0624 0 0
20 0.9884 -0.0753 -6.28 -1.03
21 1.0232 -0.1175 -2.74 -1.15
22 1.0448 -0.033 0 0
23 1.0395 -0.0363 -2.475 -0.846
24 1.027 -0.1623 -3.086 0.92
25 1.0494 -0.135 -2.24 -0.472
26 1.0419 -0.1567 -1.39 -0.17
27 1.0252 -0.1981 -2.81 -0.755
28 1.0438 -0.0853 -2.06 -0.276
29 1.0453 -0.0338 -2.835 -0.269
30 1.0475 -0.1084 3.0366 2.164
31 0.982 0 5.7199 2.39
32 0.9831 0.0296 6.9574 2.5342
33 0.9972 0.0342 6.6854 1.4202
34 1.0123 0.0214 5.4122 1.825
35 1.0493 0.06 6.9446 2.5263
36 1.0635 0.1098 5.9373 1.2628
37 1.0278 -0.009 5.7105 0.3897
38 1.0265 0.0964 8.7408 0.5587
39 1.03 -0.0138 5.3481 -1.2621

43
Referring to Table 4, with a load addition of 1000MW at Bus #3, the voltages at the PQ buses
decrease to approximately 99.5% of Base case levels.
Table 5: Test Case 1b Load Flow Results
Bus V (PU) Theta (Rad) P (PU) Q (PU)
1 1.0193 -0.0019 -0.0001 0.0001
2 1.0076 -0.2443 -0.0005 0.0005
3 0.9628 -0.4349 -23.2182 -0.0235
4 0.9521 -0.2988 -4.9997 -1.8396
5 0.9656 -0.2066 -0.0003 0.0002
6 0.9714 -0.1884 -0.001 0.0006
7 0.9582 -0.2076 -2.3378 -0.84
8 0.9561 -0.2058 -5.2197 -1.7598
9 0.9991 0.0062 0.0001 0.0001
10 0.9859 -0.1624 -0.0001 0.0001
11 0.9797 -0.1717 0 0
12 0.9652 -0.1794 -0.075 -0.88
13 0.9793 -0.1851 -0.0001 0.0001
14 0.9694 -0.2411 -0.0001 0.0001
15 0.979 -0.2668 -3.1998 -1.5299
16 0.9985 -0.248 -3.29 -0.3228
17 0.989 -0.3035 -0.0001 0.0001
18 0.9755 -0.3611 -1.5801 -0.2999
19 1.0363 -0.1292 0.0001 0.0001
20 0.9833 -0.1377 -6.28 -1.03
21 1.0065 -0.1917 -2.74 -1.1499
22 1.0353 -0.0992 0.0001 0.0001
23 1.0296 -0.1024 -2.475 -0.8459
24 1.0062 -0.2423 -3.086 0.92
25 1.029 -0.2204 -2.2397 -0.4721
26 1.0207 -0.243 -1.39 -0.1699
27 0.9994 -0.2921 -2.81 -0.755
28 1.0316 -0.1602 -2.06 -0.276
29 1.0366 -0.1048 -2.8349 -0.2689
30 1.0475 -0.1814 3.5732 3.8444
31 0.982 0 6.6805 3.5427
32 0.9831 0.0021 7.4147 3.6449
33 0.9972 -0.0268 7.0508 2.0257
34 1.0123 -0.0346 5.7444 2.1268
35 1.0493 0.0007 7.3892 3.2503
36 1.0635 0.0534 6.2746 1.6985
37 1.0278 -0.0854 6.0209 1.3076
38 1.0265 0.0327 9.1816 1.1533
39 1.03 0.1428 11.7363 1.0308

44
Referring to Table 5, with a load addition of 2000MW at Bus #3, the voltages at the PQ buses
decrease to approximately 97.3% of Base case levels.
Bus V (PU) Theta (Rad) P (PU) Q (PU)
1 0.8888 0.0482 -0.0005 0.0001
2 0.8589 -0.5923 -0.0017 0.0001
3 0.7309 -1.0297 -37.1139 -0.0239
4 0.752 -0.5994 -5.0005 -1.8398
5 0.8078 -0.3701 -0.0005 0
6 0.8261 -0.3361 -0.0006 0.0003
7 0.8036 -0.3462 -2.3379 -0.84
8 0.7979 -0.3349 -5.2199 -1.76
9 0.8985 0.1209 -0.0002 0
10 0.8642 -0.3382 -0.0002 0
11 0.8496 -0.3388 0 0
12 0.8285 -0.3615 -0.075 -0.88
13 0.8445 -0.3817 -0.0002 0
14 0.8094 -0.4959 -0.0002 0.0001
15 0.8507 -0.5878 -3.1997 -1.53
16 0.8879 -0.5861 -3.2902 -0.323
17 0.838 -0.6986 -0.0005 0.0001
18 0.7849 -0.8267 -1.5806 -0.2999
19 0.994 -0.4321 -0.0001 0
20 0.9599 -0.4351 -6.28 -1.03
21 0.9262 -0.5092 -2.74 -1.15
22 0.9912 -0.3965 0 0
23 0.9837 -0.3996 -2.475 -0.846
24 0.9044 -0.5763 -3.086 0.92
25 0.9231 -0.5882 -2.2398 -0.4721
26 0.9172 -0.6096 -1.39 -0.17
27 0.872 -0.6767 -2.8099 -0.755
28 0.9756 -0.5007 -2.06 -0.276
29 0.9977 -0.4366 -2.835 -0.269
30 1.0475 -0.5031 4.319 12.3172
31 0.982 0 10.0025 9.9428
32 0.9831 -0.134 8.0505 9.4484
33 0.9972 -0.3196 7.5587 4.8293
34 1.0123 -0.3221 6.2061 3.4612
35 1.0493 -0.2834 8.0072 6.4909
36 1.0635 -0.2252 6.7434 3.5785
37 1.0278 -0.4297 6.4524 5.9685
38 1.0265 -0.2861 9.7942 3.7209
39 1.03 0.3612 20.6157 12.2172

45
Table 6: Test Case 1c Load Flow Results
Referring to Table 6, with a load addition of 3900MW at Bus #3, the voltages at the PQ buses
decrease to approximately 84.8% of Base case levels.

46
Table 7: Test Case 1d Load Flow Results
Bus V (PU) Theta (Rad) P (PU) Q (PU)
1 1.0469 -0.1361 0 0
2 1.0465 -0.0967 0 0
3 1.0246 -0.1488 -3.22 -0.024
4 0.9923 -0.1693 -5 -1.84
5 0.9887 -0.153 0 0
6 0.9919 -0.1412 0 0
7 0.9752 -0.181 -2.338 -0.84
8 0.9713 -0.1902 -5.22 -1.76
9 0.9571 -0.1893 0 0
10 1.0071 -0.0958 0 0
11 1.0007 -0.1111 0 0
12 0.9888 -0.1102 -0.075 -0.88
13 1.0043 -0.1075 0 0
14 1.0021 -0.1347 0 0
15 1.0099 -0.1352 -3.2 -1.53
16 1.0282 -0.1075 -3.29 -0.323
17 1.0297 -0.1266 0 0
18 1.0264 -0.1426 -1.58 -0.3
19 1.0486 -0.0171 0 0
20 0.9905 -0.0345 -6.28 -1.03
21 1.0293 -0.0653 -2.74 -1.15
22 1.0485 0.0125 0 0
23 1.0434 0.0091 -2.475 -0.846
24 1.0341 -0.1054 -3.086 0.92
25 1.0557 -0.073 -2.24 -0.472
26 1.0498 -0.0945 -1.39 -0.17
27 1.0347 -0.1294 -2.81 -0.755
28 1.049 -0.0331 -2.06 -0.276
29 1.0491 0.0152 -2.835 -0.269
30 1.0475 -0.0543 2.5 1.5863
31 0.982 0 5.1229 2.522
32 0.9831 0.0452 6.5 2.5191
33 0.9972 0.074 6.32 1.1843
34 1.0123 0.0561 5.08 1.6971
35 1.0493 0.0992 6.5 2.2199
36 1.0635 0.1463 5.6 1.0661
37 1.0278 0.0455 5.4 0.0849
38 1.0265 0.1385 8.3 0.2798
39 1.03 -0.1596 -1.04 -0.4022

47
Referring to Table 7, with a system topology change by applying the contingency of
disconnecting Branch 9 – 39, it is noticed that the PQ bus voltages and angles change from that
of the Base case. For instance, the voltage and associated angle at Bus #1 which was
1.0474p.u.∠-0.1473rad decreased to 1.0469p.u.∠-0.1361rad. This will lead to the change in the
system’s initial conditions affecting the system’s stability.
Regarding the test cases 1a, 1b, and 1c, it can be concluded from the results that as the load is
increased at the load bus, the voltage levels decrease pushing the system into voltage instability.
This manipulation of the voltage levels i.e. that lead to voltage instability will give a good
understanding of how the modes behave due to this manipulation or disturbance.
Next using the test cases (1a, 1b, 1c, and 1d) as specified above, the eigenvalues are calculated
and a modal analysis is done to compare with that of the Base case; thus indicating the
difference in behavior after the disturbance. Participation factor analysis is also used to show
the states’ influence on modes providing a starting point of controlling the system if it should be
driven to instability.

48
Table 8: Test Case 1a Modal Analysis Summary Table
Eigenvalue/Mode Largest Participation factor State Gen_Index Damping ratio
1 -0.282 0.5696 speed 1 1
2 0 0.1268 angle 5 1
3 -0.1981 + 4.2915i 0.2007 speed 1 0.0461
4 -0.1981 - 4.2915i 0.2007 speed 1 0.0461
5 -0.2964 + 6.0825i 0.344 speed 9 0.0487
6 -0.2964 - 6.0825i 0.344 speed 9 0.0487
7 -0.2987 + 6.4986i 0.1429 angle 5 0.0459
8 -0.2987 - 6.4986i 0.1429 angle 5 0.0459
9 -0.3075 + 7.2972i 0.1944 speed 6 0.0421
10 -0.3075 - 7.2972i 0.1944 speed 6 0.0421
11 -0.2714 + 8.4361i 0.2565 speed 3 0.0322
12 -0.2714 - 8.4361i 0.2565 speed 3 0.0322
13 -0.2745 + 8.7065i 0.252 speed 10 0.0315
14 -0.2745 - 8.7065i 0.252 speed 10 0.0315
15 -0.3510 + 9.2979i 0.3635 angle 8 0.0377
16 -0.3510 - 9.2979i 0.3635 angle 8 0.0377
17 -0.3366 + 9.4063i 0.3801 speed 4 0.0358
18 -0.3366 - 9.4063i 0.3801 speed 4 0.0358
19 -0.3232 + 9.8445i 0.3032 angle 7 0.0328
20 -0.3232 - 9.8445i 0.3032 angle 7 0.0328

49
Figure 11: Test Case 1a Graphical Display of Modes (Eigenvalues)
Referring to Table 8 and Figure 11, with load added as per Test Case 1a, the absolute value of
the real-part σ of modes λ5, λ6 and λ19, λ20 decreased to 0.2964 and 0.3232 or 99.6% and
97.3% of the Base case levels respectively. In addition to that, the damping ratio ϒ of modes λ5,
λ6 and λ19, λ20 have decreased to 4.87% and 3.28% or 98.4% and 92% of the Base case levels
respectively. These values still indicate a stable system; however, the degree of stability is less
than that of the Base case. Thus, the modes λ5, λ6 and λ19, λ20 are considered most likely to
become unstable and will be taken into account.

50
Table 9: Test Case 1b Modal Analysis Summary Table
Eigenvalue/Mode Largest Participation factor State Gen_Index Damping ratio
1 -0.2607 0.6065 speed 1 1
2 0 0.1238 angle 5 -1
3 -0.2094 + 4.3385i 0.1819 speed 1 0.0482
4 -0.2094 - 4.3385i 0.1819 speed 1 0.0482
5 -0.2951 + 6.1719i 0.3447 speed 9 0.0478
6 -0.2951 - 6.1719i 0.3447 speed 9 0.0478
7 -0.2981 + 6.5939i 0.142 angle 5 0.0452
8 -0.2981 - 6.5939i 0.142 angle 5 0.0452
9 -0.3072 + 7.3843i 0.1926 speed 6 0.0416
10 -0.3072 - 7.3843i 0.1926 speed 6 0.0416
11 -0.2597 + 8.7021i 0.2211 angle 3 0.0298
12 -0.2597 - 8.7021i 0.2211 angle 3 0.0298
13 -0.2886 + 9.0008i 0.2867 angle 2 0.032
14 -0.2886 - 9.0008i 0.2867 angle 2 0.032
15 -0.3548 + 9.5843i 0.3121 angle 8 0.037
16 -0.3548 - 9.5843i 0.3121 angle 8 0.037
17 -0.3329 + 9.5189i 0.2927 speed 4 0.035
18 -0.3329 - 9.5189i 0.2927 speed 4 0.035
19 -0.3223 + 9.9823i 0.2983 angle 7 0.0323
20 -0.3223 - 9.9823i 0.2983 angle 7 0.0323

51
Figure 12: Test Case 1b Graphical Display of Modes (Eigenvalues)
Referring to Table 9 and Figure 12, with load added as per Test Case 1b, the absolute value of
the real-part σ of considered modes λ5, λ6 and λ19, λ20 decreased to 0.2951 and 0.3223 or
99.2% and 97% of the Base case levels respectively. In addition to that, the damping ratio ϒ of
modes λ5, λ6 and λ19, λ20 have decreased to 4.78% and 3.23% or 98.4% and 90.5% of the Base
case levels respectively. The additional decrease of the absolute value of the real-part σ of the
mode and the damping ratio ϒ illustrates that considered modes are becoming less and less
stable.

52
Table 10: Test Case 1c Modal Analysis Summary Table
Eigenvalue/Mode Largest Participation factor State Gen_Index Damping ratio
1 -0.2409 + 3.9715i 0.1205 speed 1 0.0605
2 -0.2409 - 3.9715i 0.1205 speed 1 0.0605
3 -0.183 0.7397 speed 1 1
4 0 0.1528 angle 1 -1
5 -0.2916 + 6.2393i 0.3618 speed 9 0.0467
6 -0.2916 - 6.2393i 0.3618 speed 9 0.0467
7 -0.2983 + 6.7133i 0.1521 angle 5 0.0444
8 -0.2983 - 6.7133i 0.1521 angle 5 0.0444
9 -0.3121 + 7.5141i 0.1877 speed 6 0.0415
10 -0.3121 - 7.5141i 0.1877 speed 6 0.0415
11 -0.2737 + 9.1772i 0.2469 speed 10 0.0298
12 -0.2737 - 9.1772i 0.2469 speed 10 0.0298
13 -0.3317 + 9.9632i 0.4138 speed 4 0.0333
14 -0.3317 - 9.9632i 0.4138 speed 4 0.0333
15 -0.3448 +10.0861i 0.3883 angle 8 0.0342
16 -0.3448 -10.0861i 0.3883 angle 8 0.0342
17 -0.2951 +10.4831i 0.3871 angle 2 0.0281
18 -0.2951 -10.4831i 0.3871 angle 2 0.0281
19 -0.3187 +10.3846i 0.2784 angle 7 0.0307
20 -0.3187 -10.3846i 0.2784 angle 7 0.0307

53
Figure 13: Test Case 1c Graphical Display of Modes (Eigenvalues)
Referring to Table 10 and Figure 13, with load added as per Test Case 1c, the absolute value of
the real-part σ of modes λ5, λ6 and λ19, λ20 decreased to 0.2916 and 0.3187 or 98.1% and 96%
of the Base case levels respectively. In addition to that, the damping ratio ϒ of modes λ5, λ6 and
λ19, λ20 have decreased to 4.67% and 3.07% or 94.4% and 85.2% of the Base case levels
respectively.
It is noticed that with each load increase from 1000MW to 2000MW and until 3900MW, the
absolute value of the real-part σ of the modes and the damping ratio decreases for considered
modes λ5, λ6 and λ19, λ20. In other words, the modes are approaching the origin and their

54
associated slope is becoming less steep. Therefore, they are approaching instability. Referring to
the participation factor column of Tables 8, 9, and 10, state 9 associated with Generator 9 has
the largest influence on modes λ5, λ6 with a participation factor value of 0.3440, 0.3447, and
0.3618 respectively and state 7 associated with Generator 7 has the largest influence on modes
λ19, λ20 with a participation factor value of 0.3032, 0.2983, and 2784 respectively.
Table 11: Test Case 1d Modal Analysis Summary Table
Eigenvalue/Mode Largest Participation factor State Gen_Index Damping ratio
1 -0.2968 0.5436 speed 1 1
2 0 0.1271 angle 5 -1
3 -0.1933 + 4.1065i 0.2084 speed 1 0.047
4 -0.1933 - 4.1065i 0.2084 speed 1 0.047
5 -0.3236 + 9.7584i 0.3053 angle 7 0.0331
6 -0.3236 - 9.7584i 0.3053 angle 7 0.0331
7 -0.3326 + 9.3112i 0.4007 speed 4 0.0357
8 -0.3326 - 9.3112i 0.4007 speed 4 0.0357
9 -0.3754 + 9.0575i 0.4474 angle 8 0.0414
10 -0.3754 - 9.0575i 0.4474 angle 8 0.0414
11 -0.2911 + 8.4360i 0.2912 angle 2 0.0345
12 -0.2911 - 8.4360i 0.2912 angle 2 0.0345
13 -0.2935 + 5.9928i 0.3496 speed 9 0.0489
14 -0.2935 - 5.9928i 0.3496 speed 9 0.0489
15 -0.3048 + 6.4371i 0.1634 angle 5 0.0473
16 -0.3048 - 6.4371i 0.1634 angle 5 0.0473
17 -0.2281 + 6.9409i 0.4377 speed 10 0.0328
18 -0.2281 - 6.9409i 0.4377 speed 10 0.0328
19 -0.3076 + 7.2471i 0.1915 speed 6 0.0424
20 -0.3076 - 7.2471i 0.1915 speed 6 0.0424

55
Figure 14: Test Case 1d Graphical Display of Modes (Eigenvalues)
Referring to Table 11 and Figure 14, with the design contingency applied as per Test Case 1d, the
absolute value of the real-part σ of modes λ17, λ18 decreased to 0.2281 or 65% of the Base case
levels respectively. In addition to that, the damping ratio ϒ of modes λ17, λ18 have decreased to
3.28% and 85% of the Base case levels respectively. It is concluded that the modes are
approaching the origin and their associated slope is becoming less steep. Thus, the modes λ17,
λ18 are considered most likely to become unstable and will be taken into account.
Referring to the participation factor column of Tables 11, state 10 associated with Generator 10
has the largest influence on modes λ17, λ18 with a participation factor value of 0.4377.

56
From the modal analysis performed, it is noticed for the case of load incremental changes as the
voltage levels are continuously decreased, the modes of the system subsequently move closer
to the origin. It is also noticed that the slope of the eigenvalues for lower voltage levels is less
steep; thus, reducing the damping factor which is a major factor in system stability. Similar
modal behavior was noticed from the analysis of the design contingency (topology
change).These results prove the connection between a small disturbance either as a load change
at a bus or a change in the system’s topology and modal stability. The more severe the
disturbances, the more the modes of the system move towards instability.
From the participation factor analysis performed, it is noticed, for these specific disturbances,
that states associated with Generators 7 and 9 have a large influence on modes λ19, λ20 and λ5,
λ6 respectively for test cases 1a, 1b, and 1c while Generator 10 has a large influence on modes
λ17, λ18 for test case 1d. This is deduced due to the fact that for every load increment or design
contingency the modes are becoming more and more unstable and have a smaller and smaller
damping factor based on the modal plots comparing to the Base case. In summary, an effective
way of controlling the system could be done by controlling the identified generators.
4.1.4 System Control and Power System Stabilizer Effect on System
In order to depict system control and analyze the effect of power system stabilizers on the
system, the analyses for the load incremental changes and the topology change driven
instability must be handled differently.
For the first case of load change driven instability, the system is rendered into instability by
increasing the load at the load bus to a specific MW level.
Regarding the second case of topology change driven instability, a three-phase bolted fault,
which is a fault where all three phases and neutral are bolted together with zero impedance to
ground, was simulated at a specific bus to depict how the Base case system will ride through the
fault. Secondly, the design contingency as specified in Test Case 1d was applied to increase the

57
likelihood of the system becoming less stable as shown in the previous analysis. Then an
identical fault was applied to the system prior to the insertion of any power system stabilizers.
The system is then analyzed to illustrate its behavior including machine rotor angle, machine
rotor speed and generator accelerating power plots. Modes (eigenvalues) are calculated and
plotted to further show system instability. The following characteristics are used in order to
identify system instability.
Loss of synchronism between generator rotor angles
Drastic increase of generator rotor speeds
Unstable generator accelerating power
Modes located on the right half of the imaginary plane
Using the previous analysis, power system stabilizers are inserted into the determined locations
and a complementary system analysis is done during the disturbance to prove that stabilizing
the system by controlling it from the specified locations can be done effectively.
Results prior to the insertion of the power system stabilizers for the first case, where load Bus
#3 experiences a load increase of 5300 MW, are depicted in Figures 15 through 18 and Table 12.

58
Figure 15: Gen. Rotor Angle Plot Prior to PSS Insertion
Referring to Figure 15, after approximately 3.4 seconds, Generator 9 rotor angle separates from
the rest of the generators i.e. loses synchronism. At approximately 4 seconds all remaining
generators separate. Thus, all generators become unsynchronized with each other. The rotor
angles separated due insufficient damping torque.

59
Figure 16: Gen. Rotor Speed Plot Prior to PSS Insertion
Referring to Figure 16, after approximately 3.4 seconds, Generator 9 rotor speed increases
drastically beyond the stable system frequency of 60Hz. At approximately 4 seconds all
remaining generators except Generator 1 follow suit. During the 10 second time frame, the
rotor speeds of all generators excluding Generator 1 continue to increase beyond 65Hz and it is
safe to assume that they will not re-stabilize at system frequency (60Hz).

60
Figure 17: Gen. Accel. Power Plot Prior to PSS Insertion
Referring to Figure 17, at approximately 4 seconds all generators’ accelerating power oscillates
at an unstable frequency. Throughout the time frame of 10 seconds the generators’ accelerating
power do not stabilize but remain in this unstable condition due to insufficient damping.

61
Table 12: Modes (Eigenvalues) Prior to PSS Insertion
Eigenvalue/Mode
1 2.0764
2 -0.0236 + 3.8037i
3 -0.0249 + 3.7873i
4 -0.0346 + 6.6750i
5 -0.0302 + 5.5455i
6 -0.0290 + 6.4856i
7 -0.0330 + 7.0433i
8 5.8018
9 -0.0275 + 3.5229i
10 1.3349
11 -2.8064
12 -0.0236 - 3.8037i
13 -0.0249 - 3.7873i
14 -0.0346 - 6.6750i
15 -0.0302 - 5.5455i
16 -0.2900 - 6.4856i
17 -0.0330 - 7.0433i
18 -5.8567
19 -0.0275 - 3.5229i
20 -1.3612

62
Figure 18: Modes (Eigenvalues) Plot Prior to PSS Insertion
Referring to Table 12 and Figure 18, the values of modes λ1, λ8 and λ10 are 2.0764, 5.8018, and
1.3349 respectively which are real and positive; thus, located on the right half of the imaginary
plane. These unstable modes indicate system instability.
Results for the second case, which is applying a three-phase bolted fault at Bus #5 with a
clearing time of 0.24 seconds before and after applying the specified design contingency, are
shown in Figures 19 through 22 and Table 13. Both scenarios are prior to power system
stabilizer insertion.
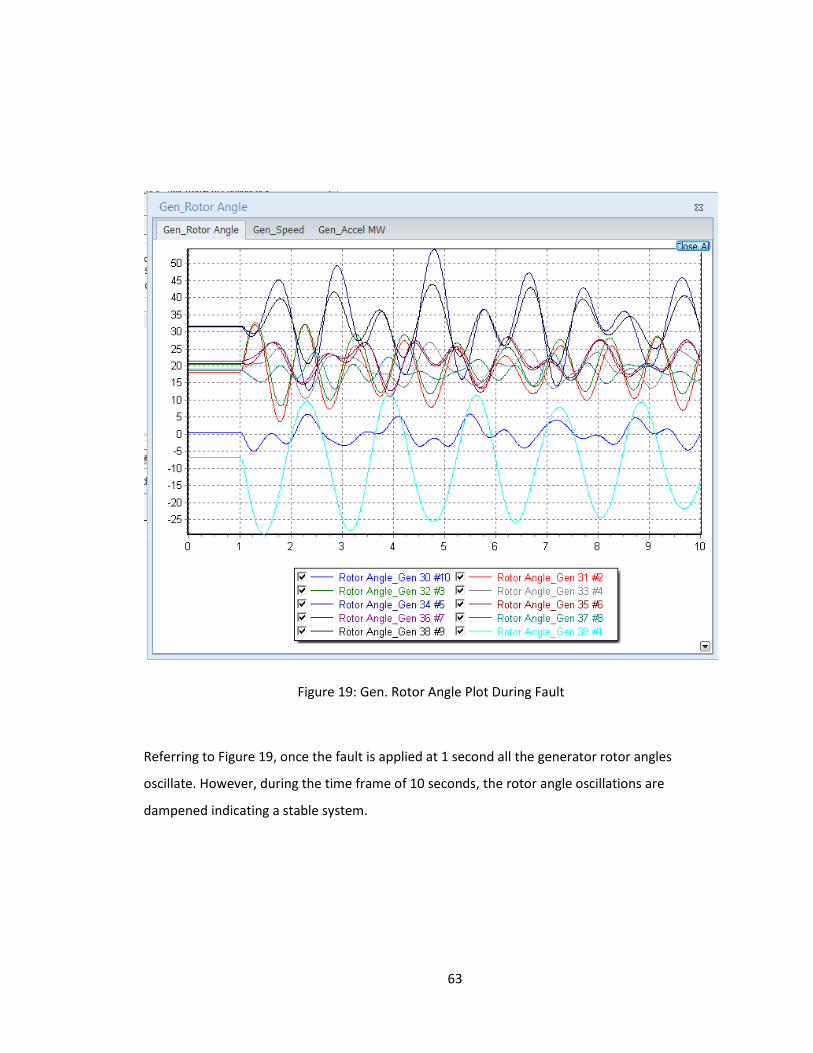
63
Figure 19: Gen. Rotor Angle Plot During Fault
Referring to Figure 19, once the fault is applied at 1 second all the generator rotor angles
oscillate. However, during the time frame of 10 seconds, the rotor angle oscillations are
dampened indicating a stable system.

64
Figure 20: Gen. Rotor Speed Plot During Fault
Referring to Figure 20, once the fault is applied at 1 second, the generators’ rotor speeds
increase to a maximum of 60.6Hz and a minimum of 59.85Hz. However, during the time frame
of 10 seconds, the rotor speeds stabilize between 60Hz and 60.45Hz indicating stability.

65
Figure 21: Gen. Accel. Power Plot During Fault
Referring to Figure 21, once the fault is applied at 1 second all the generators’ accelerating
power outputs oscillate. However, during the time frame of 10 seconds, the oscillations are
dampened indicating a stable system.

66
Table 13: Modes (EIgenvalues) During Fault
Eigenvalue/Mode
1 -0.0049 + 2.7645i
2 -0.0424 + 6.9112i
3 -0.0448 + 6.8726i
4 -0.0549 + 8.5336i
5 -0.0487 + 6.3247i
6 -0.0464 + 7.9202i
7 -0.0527 + 8.5084i
8 -0.0550 + 8.7919i
9 -0.0599 + 5.7702i
10 -0.0147 + 8.4840i
11 -0.0049 - 2.7645i
12 -0.0424 - 6.9112i
13 -0.0448 - 6.8726i
14 -0.0549 - 8.5336i
15 -0.0487 - 6.3247i
16 -0.0464 - 7.9202i
17 -0.0527 - 8.5084i
18 -0.0550 - 8.7919i
19 -0.0599 - 5.7702i
20 -0.0147 - 8.4840i

67
Figure 22: Modes (EIgenvalues) Plot During Fault
Referring to Table 13 and Figure 21, all modes λ are complex with negative real-parts σ; thus,
located on the left half of the imaginary plane. In this case they are damped oscillatory modes
indicating stability.

68
Figure 23: Gen. Rotor Angle Plot During Contingency, Applied Fault, and Prior to PSS Insertion
Referring to Figure 23, at 1 second the fault is applied, and after approximately 0.24 seconds or
at the same time the fault is cleared, Generator 1 rotor angle separates from the rest of the
generators i.e. loses synchronism. At approximately 4 seconds all remaining generators
separate. Thus, all generators become unsynchronized with each other. The rotor angles
separated due to insufficient damping torque.

69
Figure 24: Gen. Rotor Speed Plot During Contingency, Applied Fault, and Prior to PSS Insertion
Referring to Figure 24, after the fault is applied (1 second) all generator rotor speeds except that
of Generator 1 increase beyond the stable system frequency of 60Hz. At approximately 4.8
seconds, well beyond the time the fault is cleared (1.24 seconds), the same generator rotor
angles continue to increase while Generator 9 rotor angle increases even more drastically.
During the 10 second time frame, the rotor speeds of all generators excluding Generator 1
continue to increase to more than 70Hz; therefore, it is safe to assume that they will not re-
stabilize at system frequency (60Hz).

70
Figure 25: Gen. Accel. Power Plot During Contingency, Applied Fault, and Prior to PSS Insertion
Referring to Figure 25, after the fault is applied (1 second), all generators’ accelerating power
oscillates at an unstable frequency. Throughout the time frame of 10 seconds, the generators’
accelerating power does not stabilize but remain in this unstable condition due to insufficient
damping.

71
Table 14: Modes (Eigenvalues) During Contingency, Applied Fault, and Prior to PSS Insertion
Eigenvalue/Mode
1 -0.0050 + 0.2392i
2 -0.0318 + 6.2489i
3 -0.0336 + 6.2700i
4 -0.0407 + 7.2569i
5 -0.0361 + 4.3146i
6 -0.0345 + 7.2405i
7 -0.0391 + 7.8415i
8 -0.0405 + 5.2856i
9 5.8869
10 -0.0110 + 5.4224i
11 -0.0050 - 0.2392i
12 -0.0318 - 6.2489i
13 -0.0336 - 6.2700i
14 -0.0407 - 7.2569i
15 -0.0361 - 4.3146i
16 -0.0345 - 7.2405i
17 -0.0391 - 7.8415i
18 -0.0405 - 5.2856i
19 -5.8869
20 -0.0110 - 5.4224i

72
Figure 26: Modes (Eigenvalues) Plot During Contingency, Applied Fault, and Prior to PSS
Insertion
Referring to Table 14 and Figure 26, the value of mode λ9 is 5.8869 which is real and positive;
thus, located on the right half of the imaginary plane. This unstable mode indicates system
instability.
When Figures 19 through 22 are compared with Figures 23 through 26, a difference in generator
behavior (including rotor angles, speeds and accelerating power) and in mode values is observed
even though the same fault is applied to the system (fault type: bolted three-phase, location:
Bus #5, clearing time: 0.24 seconds). This discrepancy arises since the applied contingency

73
(disconnecting Branch 9 – 39) changed the system’s conditions making the system’s stability
more vulnerable when a disturbance might occur.
It can be clearly seen that the system has been driven to an unstable condition by looking at the
generator behavior where the machine rotor angles and speeds lose synchronism while
experiencing drastic acceleration. The system’s modes also illustrate instability of the system
since some modes are now located at the right half of the imaginary plane i.e. σ > 0.
In order to control the system through stabilizing it, the unstable modes must be now shifted to
the left half of the imaginary plane σ < 0. This can be established by providing sufficient positive
damping to the rotor angles so they do not lose synchronism with each other.
Power system stabilizers are then inserted at Generators 7 & 9 for the first case and 10 for the
second cases as specified previously to provide this necessary damping in order to control the
system.
First case results after the insertion of the power system stabilizers at Generators 7 & 9 are
depicted in Figures 27 through 30 and Table 15.

74
Figure 27: Gen. Rotor Angle Plot after PSS Insertion
Referring to Figure 27, once the power system stabilizers are inserted at Generators 7 and 9 and
the disturbance of increasing the load at Bus #3 to 5300MW is applied, the necessary positive
damping torque is provided to the system after a few oscillations by the power system
stabilizers, and it is clear that the rotor angles no longer separate but remain in synchronism
with each other. Moreover, during the time frame of 10 seconds, the rotor angle oscillations are
continually dampened indicating a stable system.

75
Figure 28: Gen. Rotor Speed Plot after PSS Insertion
Referring to Figure 28, once the power system stabilizers are inserted, the generator rotor
speeds no longer increase beyond the system frequency of 60Hz. However, there is a
continuous decrease in rotor angle speeds since the load increase of 5300MW at Bus #3 is kept
beyond the time frame of 10 seconds.

76
Figure 29: Gen. Accel. Power Plot after PSS Insertion
Referring to Figure 29, generators’ accelerating power no longer oscillates at an unstable
frequency and are dampened indicating a stable system.

77
Table 15: Modes (Eigenvalues) after PSS Insertion
Eigenvalue/Mode
1 -0.0056 + 2.4630i
2 -0.0481 + 5.7488i
3 -0.0508 + 5.5380i
4 -0.0619 + 6.9791i
5 -0.0549 + 4.4030i
6 -0.0523 + 6.8534i
7 -0.6132 + 0.0142i
8 -0.0620 + 7.7896i
9 -0.6281 + 0.0088i
10 -0.0167 + 7.5755i
11 -0.0056 - 2.4630i
12 -0.0481 - 5.7488i
13 -0.0508 - 5.5380i
14 -0.0619 - 6.9791i
15 -0.0549 - 4.4030i
16 -0.0523 - 6.8534i
17 -0.6132 - 0.0142i
18 -0.0620 - 7.7896i
19 -0.6281 - 0.0088i
20 -0.0167 - 7.5755i

78
Figure 30: Modes (Eigenvalues) Plot after PSS Insertion
Referring to Table 15 and Figure 30, previously unstable modes λ1, λ8 and λ10 are now stable
with values of -0.0056+2.4630i, -0.062+7.7896i, and -0.0167+7.5755i respectively; thus, they
have been shifted to the left half of the imaginary plane. All modes are now damped oscillatory
modes indicating system stability.
Second case results, after the insertion of the power system stabilizer at Generator 10, are
depicted in Figures 31 through 34 and Table 16.

79
Figure 31: Gen. Rotor Angle Plot after PSS Insertion
Referring to Figure 31, once the power system stabilizer is inserted at Generator 10 and design
contingency (disconnecting Branch 9 – 39) and fault are applied the necessary positive damping
torque is provided to the system after a few oscillations by the power system stabilizer, and it is
clear that the rotor angles no longer separate but remain in synchronism with each other.
Moreover, during the time frame of 10 seconds, the rotor angle oscillations are continually
dampened indicating a stable system. For example, at the first swing the minimum for
Generator 1 rotor angle is approximately -105 degrees, at the second swing the minimum is
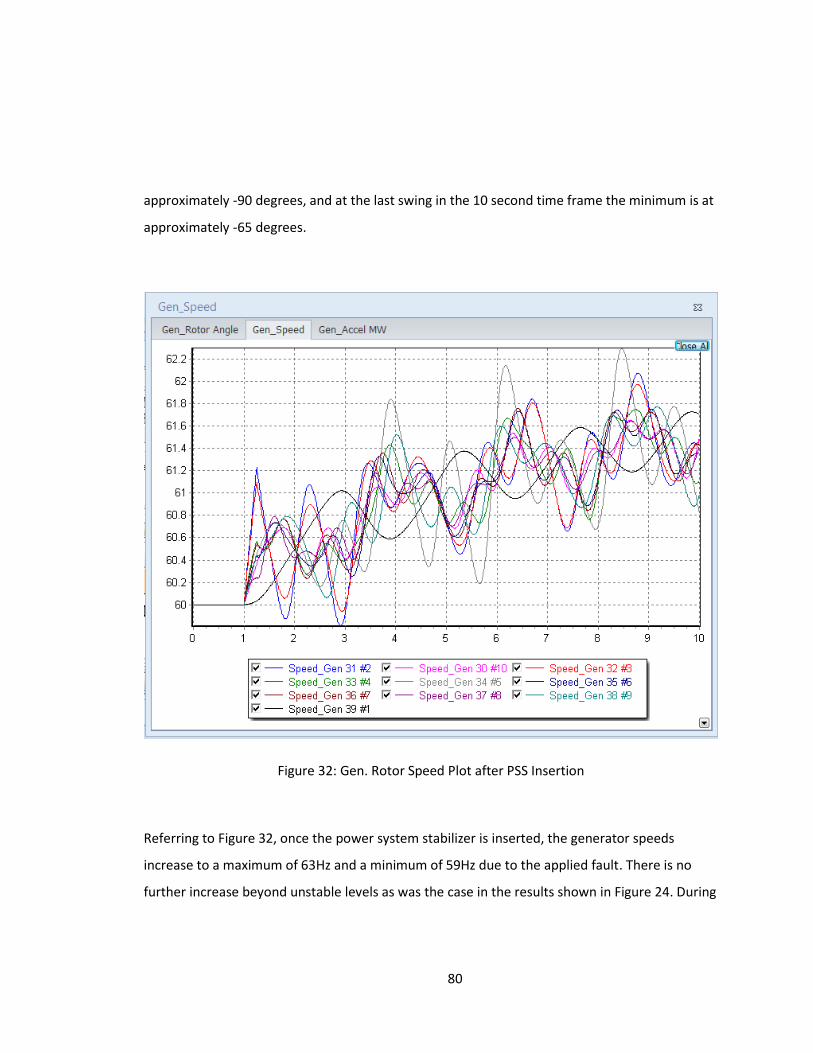
80
approximately -90 degrees, and at the last swing in the 10 second time frame the minimum is at
approximately -65 degrees.
Figure 32: Gen. Rotor Speed Plot after PSS Insertion
Referring to Figure 32, once the power system stabilizer is inserted, the generator speeds
increase to a maximum of 63Hz and a minimum of 59Hz due to the applied fault. There is no
further increase beyond unstable levels as was the case in the results shown in Figure 24. During

81
the time frame of 10 seconds, the rotor speeds stabilize between 60Hz and 61.8Hz indicating
stability.
Figure 33: Gen. Accel. Power Plot after PSS Insertion
Referring to Figure 33, the inserted power system stabilizer provide the necessary positive
damping torque to the system after a few oscillations, and it is clear that the generators’
accelerating power no longer oscillates at unstable frequencies but are continually dampened
throughout the time frame of 10 seconds indicating a stable system. For example, at the first
swing the minimum for Generator 1 accelerating power is approximately -1200 MW, at the

82
second swing the minimum is approximately -1000MW, and at the last swing in the 10 second
time frame the minimum is at approximately -800MW.
Table 16: Modes (Eigenvalues) after PSS Insertion
Eigenvalue/Mode
1 -0.0047 + 2.0959i
2 -0.0410 + 6.8546i
3 -0.0433 + 6.9256i
4 -0.0533 + 8.5675i
5 -0.0475 + 5.3651i
6 -0.6067 - 0.0157i
7 -0.0506 + 8.5510i
8 -0.6046 - 0.0150i
9 -0.0582 + 6.5662i
10 -0.0142 + 8.5926i
11 -0.0047 - 2.0959i
12 -0.0410 - 6.8546i
13 -0.0433 - 6.9256i
14 -0.0533 - 8.5675i
15 -0.0475 - 5.3651i
16 -0.6067 + 0.0157i
17 -0.0506 - 8.5510i
18 -0.6046 + 0.0150i
19 -0.0582 - 6.5662i
20 -0.0142 - 8.5926i

83
Figure 34: Modes (Eigenvalues) Plot after PSS Insertion
Referring to Table 16 and Figure 34, previously unstable mode λ9 is now stable with a value of
-0.0582+6.5662i; thus, it has been shifted to the left half of the imaginary plane. All modes are
now damped oscillatory modes indicating system stability.
It is concluded that the insertion of the power system stabilizers successfully stabilized the
system by relocating the unstable modes to the left half of the imaginary plane. In other words,
they have provided enough damping to keep the generators in synchronism throughout the
disturbance; thus, pushing the system back into stability.

84
In this chapter, the small signal stability analysis results of an IEEE 39 bus system were
presented. In defining various system inputs including bus data, generator data, line data, and
transformer data, simulation results were produced for the modal analysis of the system.
Furthermore, analysis was completed to study the behavior of the system during small
disturbances by increasing the load at a specific load bus in the system or by applying a design
contingency to the system which in this case was a disconnection of a branch. In summary, as
the stability margin decreased, so did modal stability. Participation analysis was also done to
deduce which state primarily influenced each mode thus determining a general location for
system control. Finally, the system was driven into instability and then power system stabilizers
were inserted at the specified locations illustrating that a system can be controlled or stabilized
by inserting the power system stabilizers at these specified locations.
Chapter 5 will review these results and draw conclusions based on the data. The conclusions will
include system stability, modal and participation factor analysis. In addition, future work
involved in continuing the research will be cited.

85
Chapter 5
5.1 Conclusion
Chapter 1 presented the foundational building blocks of power systems and power system
stability defining what each and how they evolved till present day. The major components of a
power system, generation, transmission and distribution were covered and examples of
different types of power systems were explained. Power system stability and its different
designations were then outlined. The approach of small signal stability is to simplify the analysis
and calculations of a system by transforming the complex dynamic system used in the time
varying differential methodology of transient analysis into a system of linear equations. Finally,
the contents of the thesis as pertaining to the expected contributions were introduced. Chapter
2 followed with a mathematical and literary review of the electrical system model, small signal
stability including the computational derivations to transform the dynamic differential equation
to a state space representation of a linearized modeled power system, state matrix calculation,
eigenvalue determination, left and right eigenvectors and participation matrix identification,
and an introduction to power system stabilizer highlighting its role in power system control.
Chapter 3, based on the foundation laid by the previous chapters, introduced the IEEE 39 Bus
system and simulation software that utilized the numerical analysis techniques that have been
established. The system inputs were presented and details are shown for exactly how the
simulation software analyzed the system. Chapter 4 bridged the background information
provided in the first three chapters and the research results by first outlining the approach and
methodology used in this effort. Modal analysis of an initial 39 bus system, that yields the
eigenvalues of the system was used to determine whether the system is stable or not at that
particular equilibrium point. Modal and participation factor analysis was performed during a
specified small disturbance either by load increments or applied design contingencies to identify
which modes are most likely to become unstable followed by locating the most influential states
on the identified modes i.e. how significant a role each generator (or group of generator) had on
the system during the small disturbance; thus, determining a location(s) for control i.e. system

86
stabilization. Finally, the system was pushed into instability and then control through power
system stabilizers was applied to the determined locations in order to re-stabilize the system
after the disturbance. Stability results prior and post power system stabilizer insertion were
compared to illustrate how the system response transformed from being unstable to stable by
combining modal and participation factor analysis to identify power system stabilizer locations
for control. Previous work was done using modal analysis to determine the degree of system
stability as well as power system stability response and control using power system stabilizers.
The relation between the severity of the disturbance and modal stability analyzed in this
research and in references [9] [10] [11] achieved similar conclusions. Furthermore, the results
obtained after control were applied to the system depicted stable behavior similar to references
[12] [13] [14] [15] [16] where rotor angle oscillations were damped, rotor speeds were stabilized
at system frequency, and unstable modes were moved to the stable region of the imaginary
plane. The research performed was a learning experience starting from the general concept of
small signal stability followed by the mathematical technique of modal and participation
analysis, power system modeling, to finally stability response analysis and control theory.
5.2 Future work
The research and methodology presented in this paper serve as a useful tool in solving real
world power system problems. In large power systems, such as industrial facilities, the modal
stability and participation factor analysis techniques can allow for a number of advantages.
These advantages include stability determination and monitoring as systems grow and expand
as well as achieving operational and stability improvement in the most efficient manner possible
by focusing engineering efforts on the components that participate most. From this, large cost
savings can be achieved as decreased power consumption yields lower utility costs, equipment
can be operated more efficiently, stability control efforts are minimized, and equipment life
cycles are prolonged. In addition, the evolution of Smart Grid technology allows for the
application of these techniques in a more ‘real time’ fashion to achieve more continual system

87
improvement that matches the dynamic nature of the power system. Again, this will result in
increased reliability and efficiency in power systems that yield cost savings.
Moving forward, future work includes expanding the investigative process by using more
detailed generator models that may include governors and exciters, dynamic load modeling, and
a more general linearization technique that includes more states which will drive studies to use
more detailed power system stabilizers.

88
Bibliography
[1] P. Kundur, G. Rogers, D. Wong, L. Weng and M. Lauby, "A Comprehensive Computer
Program Package for Small Signal Stability Analysis of Power Systems," IEEE Transactions on
Power Systems, vol. 5, no. 4, pp. 1076-1083, 1990.
[2] P. W. Sauer and M. Pai, Power System Dynamics and Stability, Champaign, IL: Stipes
Publishing, 1997.
[3] P. Kundar, Power System Stability and Control, New York: McGraw Hill, 1994.
[4] A. Anderson and P. Fouad, Power System Control and Stability, Piscatway, NJ: Wiley, 2003.
[5] A. Bergen and V. Vittal, Power System Analysis, Saddle River, NJ: Pearson, 2000.
[6] M. Gibbard, P. Pourbeik and D. Vowles, Small-Signal Stability, Control and Dynamic
Performance of Power Systems, Adelaide: University of Adelaide Press, 2015.
[7] H. Yee and B. Spalding, "Transient Stability Analysis of Multimachine Power Systems by the
Method of Hyperplanes," IEEE Transactions on Power Apparatus and Systems, Vols. PAS-96,
no. 1, pp. 276-284, 1977.
[8] B. Spalding, H. Yee and D. Goudie, "Coherency Recognition for Transient Stability Studies
Using Singular Points," IEEE Transactions on Power Apparatus and Systems, Vols. PAS-96,
no. 4, pp. 1368-1375, 1977.
[9] H.-K. Nam, Y.-K. Kim, K.-S. Shim and K. Y. Lee, "A New eigen-Sensitivity Theory of
Augmented Matrix and its Applications to Power System Stability Analysis," IEEE
Transactions on Power Systems, vol. 15, no. 1, pp. 363-369, 2000.
[10] M. Abido and Y. Abdel-Magid, "Eigenvalue Assignments in Multimachine Power Systems
Using Tabu Search Algorithm," PERGAMON, Saudi Arabia, 2000.
[11] G. Shahgholian and J. Faiz, "The Effect of Power System Stabilizer on Small Signal Stability in
Single-Machine Infinite-Bus," International Journal of Electrical and Power Engineering, vol.

89
4, no. 2, pp. 45-53, 2010.
[12] Y. Chompoobutrgool, Concepts for Power System Small Signal Stability Analysis and
Feedback Control Design Considering Synchrophasor Measurements, Stockholm,: KTH
School of Electrical Engineering, 2012.
[13] H. N. Vijaiyan, A. K. Ramasamy, A. M. Teng and S. K. Ahmed, "Effects of Variations in
Generator Inputs for Small Signal Stability Studies of a Three Machine Nine Bus Network,"
World Academy of Science, Engineering and Technology, vol. 5, no. 2, pp. 249-252, 2011.
[14] J. Rommes, N. Martins and F. D. Freitas, "Computing Rightmost Eigenvalues for Small-Signal
Stability Assessment of Large -Scale Power Systems," IEEE Transactions on Power Systems,
vol. 25, no. 2, pp. 929-938, 2010.
[15] A. A. Lerm, C. A. Canizares and N. Mithulananthan, "Effects of Limits in Small Signal Stability
Analysis of Power Systems," in IEEE-PES Summer Meeting, Vancouver, BC, 2001.
[16] K. Devender and S. S. Balwinder, "Power, Transient Stability of a Multi Machine System,"
International Journal of Engineering and Advanced Technology (IJEAT, vol. 2, no. 4, pp. 759-
762, 2013.

90
Appendix A
Figure 35: IEEE 39 Bus System

91
Table 17: Generator Data

92

93

94
Table 18: Branch Data

95

96

97
Table 19: Power and Voltage Data

98
Appendix B
Test 2 – Load Bus 4
System Manipulation and Evaluation
Case a – Increment of 1000MW
Bus V (PU) Theta (Rad) P (PU) Q (PU)
1 1.0454 0.0087 0 0
2 1.0395 -0.0477 0 0
3 1.0113 -0.1445 -3.22 -0.024
4 0.9781 -0.2422 -14.9999 -1.84
5 0.9864 -0.1745 0 0
6 0.9905 -0.1584 -0.0001 0.0001
7 0.979 -0.1838 -2.338 -0.84
8 0.9776 -0.1857 -5.22 -1.76
9 1.0155 -0.0475 0 0
10 1.0021 -0.1189 0 0
11 0.9969 -0.1324 0 0
12 0.9834 -0.1344 -0.075 -0.88
13 0.9974 -0.1345 0 0
14 0.9908 -0.172 0 0
15 0.9997 -0.1366 -3.2 -1.53
16 1.0197 -0.0933 -3.29 -0.323
17 1.0199 -0.1108 0 0
18 1.0151 -0.1313 -1.58 -0.3
19 1.0448 0.0105 0 0
20 0.9882 -0.0024 -6.28 -1.03
21 1.0224 -0.0446 -2.74 -1.15
22 1.0443 0.04 0 0
23 1.039 0.0367 -2.475 -0.846
24 1.0259 -0.0894 -3.086 0.92
25 1.05 -0.0249 -2.24 -0.472
26 1.042 -0.0559 -1.39 -0.17
27 1.0255 -0.1016 -2.81 -0.755
28 1.0439 0.0156 -2.06 -0.276
29 1.0454 0.0671 -2.835 -0.269
30 1.0475 0.004 3.0366 2.0064
31 0.982 0 5.7356 2.6656
32 0.9831 0.0328 6.9574 2.8152
33 0.9972 0.1071 6.6854 1.4478
34 1.0123 0.0944 5.4122 1.8378
35 1.0493 0.1331 6.9446 2.5574
36 1.0635 0.1828 5.9373 1.2805
37 1.0278 0.1011 5.7105 0.3636
38 1.0265 0.1973 8.7408 0.5556
39 1.03 0.0441 5.3481 -1.08

99
Eigenvalue/Mode Largest Participation factor State Gen_Index Damping ratio
1 -0.2798 0.5738 speed 1 1
2 0 0.1275 angle 5 1
3 -0.2000 + 4.3190i 0.1982 speed 1 0.0463
4 -0.2000 - 4.3190i 0.1982 speed 1 0.0463
5 -0.2955 + 6.0485i 0.3512 speed 9 0.0488
6 -0.2955 - 6.0485i 0.3512 speed 9 0.0488
7 -0.2984 + 6.4915i 0.1455 angle 5 0.0459
8 -0.2984 - 6.4915i 0.1455 angle 5 0.0459
9 -0.3072 + 7.2823i 0.1925 speed 6 0.0421
10 -0.3072 - 7.2823i 0.1925 speed 6 0.0421
11 -0.2680 + 8.4651i 0.255 speed 3 0.0316
12 -0.2680 - 8.4651i 0.255 speed 3 0.0316
13 -0.2809 + 8.7417i 0.2197 angle 2 0.0321
14 -0.2809 - 8.7417i 0.2197 angle 2 0.0321
15 -0.3498 + 9.2709i 0.3646 angle 8 0.0377
16 -0.3498 - 9.2709i 0.3646 angle 8 0.0377
17 -0.3354 + 9.3949i 0.3862 speed 4 0.0357
18 -0.3354 - 9.3949i 0.3862 speed 4 0.0357
19 -0.3232 + 9.8353i 0.3029 angle 7 0.0328
20 -0.3232 - 9.8353i 0.3029 angle 7 0.0328

100

101
Case b – Increment of 2000MW
Bus V (PU) Theta (Rad) P (PU) Q (PU)
1 1.0305 0.1687 -0.0001 0.0001
2 1.0164 -0.0014 -0.0004 0.0004
3 0.9686 -0.1534 -3.2216 -0.0233
4 0.9205 -0.3492 -24.9906 -1.8385
5 0.9385 -0.2174 -0.0012 0.0007
6 0.9466 -0.1948 -0.0032 0.0014
7 0.9305 -0.2085 -2.3373 -0.8399
8 0.9271 -0.2032 -5.2188 -1.7593
9 0.9759 0.0897 -0.0006 0.0004
10 0.9663 -0.1597 -0.0006 0.0003
11 0.9582 -0.1718 -0.0001 0
12 0.9432 -0.1772 -0.075 -0.8799
13 0.9579 -0.1806 -0.0004 0.0001
14 0.9437 -0.232 -0.0013 0.0005
15 0.9658 -0.154 -3.2 -1.5298
16 0.9944 -0.0919 -3.2901 -0.3228
17 0.9906 -0.1075 0 0
18 0.9805 -0.133 -1.5799 -0.3
19 1.0348 0.0274 0.0001 0.0001
20 0.9825 0.0188 -6.28 -1.03
21 1.0036 -0.0353 -2.7401 -1.1499
22 1.0337 0.0576 0.0001 0.0001
23 1.028 0.0544 -2.475 -0.8459
24 1.0025 -0.0861 -3.086 0.9201
25 1.032 0.0177 -2.2398 -0.4721
26 1.0213 -0.0256 -1.39 -0.1699
27 1 -0.0844 -2.81 -0.7549
28 1.0319 0.0572 -2.06 -0.276
29 1.0369 0.1125 -2.8349 -0.2689
30 1.0475 0.0609 3.5732 3.3472
31 0.982 0 6.7255 4.4793
32 0.9831 0.0082 7.4144 4.5583
33 0.9972 0.1298 7.0508 2.1248
34 1.0123 0.1219 5.7444 2.1727
35 1.0493 0.1576 7.3892 3.3621
36 1.0635 0.2103 6.2746 1.762
37 1.0278 0.1524 6.0209 1.1787
38 1.0265 0.25 9.1816 1.1393
39 1.03 0.2716 11.7363 1.5928

102
Eigenvalue/Mode Largest Participation factor State Gen_Index Damping ratio
1 -0.2585 0.6117 speed 1 1
2 0 0.1308 angle 9 1
3 -0.2135 + 4.4167i 0.1774 speed 1 0.0483
4 -0.2135 - 4.4167i 0.1774 speed 1 0.0483
5 -0.2925 + 6.0946i 0.3625 speed 9 0.0479
6 -0.2925 - 6.0946i 0.3625 speed 9 0.0479
7 -0.2973 + 6.5768i 0.145 angle 5 0.0452
8 -0.2973 - 6.5768i 0.145 angle 5 0.0452
9 -0.3066 + 7.3359i 0.1867 speed 6 0.0418
10 -0.3066 - 7.3359i 0.1867 speed 6 0.0418
11 -0.2592 + 8.7572i 0.2161 angle 3 0.0296
12 -0.2592 - 8.7572i 0.2161 angle 3 0.0296
13 -0.3006 + 9.1556i 0.3018 angle 2 0.0328
14 -0.3006 - 9.1556i 0.3018 angle 2 0.0328
15 -0.3297 + 9.4788i 0.2378 speed 4 0.0348
16 -0.3297 - 9.4788i 0.2378 speed 4 0.0348
17 -0.3476 + 9.5459i 0.2449 angle 8 0.0364
18 -0.3476 - 9.5459i 0.2449 angle 8 0.0364
19 -0.3221 + 9.9537i 0.2972 angle 7 0.0323
20 -0.3221 - 9.9537i 0.2972 angle 7 0.0323

103

104
Case c – Increment of 3000MW
Bus V (PU) Theta (Rad) P (PU) Q (PU)
1 0.984 0.3771 -0.0022 0.0008
2 0.9496 0.0366 -0.0097 0.002
3 0.8436 -0.2118 -3.2503 -0.0212
4 0.745 -0.6159 -34.8482 -1.8289
5 0.7888 -0.3388 -0.0208 0.0036
6 0.809 -0.2991 -0.026 0.0075
7 0.779 -0.3031 -2.3304 -0.8395
8 0.7699 -0.2874 -5.2102 -1.7565
9 0.8637 0.2823 -0.0159 -0.0012
10 0.8553 -0.2678 -0.0076 0.0013
11 0.8379 -0.2788 -0.0006 0
12 0.8184 -0.2909 -0.0749 -0.8794
13 0.8364 -0.3004 -0.0044 0.0007
14 0.8004 -0.3848 -0.0239 0.0035
15 0.8676 -0.2299 -3.2038 -1.5291
16 0.9233 -0.1361 -3.2922 -0.3226
17 0.9074 -0.148 -0.0006 0.0001
18 0.8808 -0.1814 -1.5793 -0.2999
19 1.0076 0.0063 -0.0008 0
20 0.9674 0.0017 -6.2799 -1.03
21 0.952 -0.0662 -2.7404 -1.1499
22 1.0054 0.0399 -0.0006 0
23 0.9985 0.0367 -2.4755 -0.846
24 0.937 -0.1276 -3.0857 0.9199
25 0.9806 0.0426 -2.239 -0.4727
26 0.9648 -0.0227 -1.3906 -0.1699
27 0.9293 -0.1034 -2.8098 -0.7549
28 1.0011 0.0759 -2.06 -0.276
29 1.0154 0.1367 -2.8352 -0.269
30 1.0475 0.1133 4.1095 7.1613
31 0.982 0 8.7494 10.1937
32 0.9831 -0.0662 7.8686 9.8265
33 0.9972 0.1157 7.4161 3.9307
34 1.0123 0.1118 6.0765 3.0341
35 1.0493 0.149 7.8337 5.4503
36 1.0635 0.2055 6.6118 2.9755
37 1.0278 0.1904 6.3311 3.4503
38 1.0265 0.2828 9.6223 2.5627
39 1.03 0.5679 18.1234 9.165

105
Eigenvalue/Mode Largest Participation factor State Gen_Index Damping ratio
1 -0.219 0.6816 speed 1 1
2 0 0.1415 angle 9 -1
3 -0.2364 + 4.3865i 0.1408 speed 1 0.0538
4 -0.2364 - 4.3865i 0.1408 speed 1 0.0538
5 -0.2873 + 6.1001i 0.3831 speed 9 0.047
6 -0.2873 - 6.1001i 0.3831 speed 9 0.047
7 -0.2939 + 6.6532i 0.1475 speed 3 0.0441
8 -0.2939 - 6.6532i 0.1475 speed 3 0.0441
9 -0.3094 + 7.3384i 0.1751 speed 6 0.0421
10 -0.3094 - 7.3384i 0.1751 speed 6 0.0421
11 -0.2761 + 9.2352i 0.2 speed 10 0.0299
12 -0.2761 - 9.2352i 0.2 speed 10 0.0299
13 -0.2890 +10.4041i 0.333 angle 2 0.0278
14 -0.2890 -10.4041i 0.333 angle 2 0.0278
15 -0.3292 + 9.7131i 0.3959 angle 4 0.0339
16 -0.3292 - 9.7131i 0.3959 angle 4 0.0339
17 -0.3480 + 9.8576i 0.3558 angle 8 0.0353
18 -0.3480 - 9.8576i 0.3558 angle 8 0.0353
19 -0.3197 +10.1566i 0.284 angle 7 0.0315
20 -0.3197 -10.1566i 0.284 angle 7 0.0315

106

107
System Control Analysis
Point of Instability – 5800MW

108

109

110
Eigenvalue/Mode
1 1.1009
2 -0.0304 + 2.9593i
3 -0.0323 + 3.6084i
4 -0.0396 + 6.5347i
5 -0.0352 + 5.0067i
6 -0.0333 + 6.2174i
7 -0.0378 + 6.7679i
8 -0.0394 + 6.2225i
9 -0.0430 + 4.8011i
10 -0.0105 + 5.0523i
11 -1.1009
12 -0.0304 - 2.9593i
13 -0.0323 - 3.6084i
14 -0.0396 - 6.5347i
15 -0.0352 - 5.0067i
16 -0.0333 - 6.2174i
17 -0.0378 - 6.7679i
18 -0.0394 - 6.2225i
19 -0.0430 - 4.8011i
20 -0.0105 - 5.0523i

111

112
Power system stabilizers Locations: Generators 4, 9, and 10

113

114

115
Eigenvalue/Mode
1 -0.0051 + 2.4615i
2 -0.0443 + 4.9124i
3 -0.0468 + 4.7588i
4 -0.0998
5 -0.0503 + 5.6053i
6 -0.0481 + 7.1137i
7 -0.0547 + 7.6789i
8 -0.0572 + 8.1127i
9 -0.9967
10 -0.9993
11 -0.0051 - 2.4615i
12 -0.0443 - 4.9124i
13 -0.0468 - 4.7588i
14 -0.378
15 -0.0503 - 5.6053i
16 -0.0481 - 7.1137i
17 -0.0547 - 7.6789i
18 -0.0572 - 8.1127i
19 -0.2358 - 6.4564i
20 -0.1409 - 8.2181i

116

117
Test 3 – Load Bus 7
System Manipulation and Evaluation
Case a – Increment of 1000MW
Bus V (PU) Theta (Rad) P (PU) Q (PU)
1 1.0464 0.0428 0 0
2 1.0416 0.0166 0 0
3 1.015 -0.0696 -3.22 -0.024
4 0.9821 -0.1466 -5 -1.84
5 0.9792 -0.1684 0 0
6 0.982 -0.1606 -0.0003 0.0001
7 0.9638 -0.2417 -12.3377 -0.84
8 0.9643 -0.2221 -5.2199 -1.7599
9 1.0071 -0.0515 0 0
10 0.9991 -0.0899 0 0
11 0.9917 -0.1133 0 0
12 0.98 -0.1055 -0.075 -0.88
13 0.9961 -0.0958 0 0
14 0.993 -0.1078 0 0
15 1.0013 -0.0691 -3.2 -1.53
16 1.0211 -0.0245 -3.29 -0.323
17 1.022 -0.0407 0 0
18 1.0179 -0.0593 -1.58 -0.3
19 1.0453 0.0792 0 0
20 0.9885 0.0663 -6.28 -1.03
21 1.0234 0.0241 -2.74 -1.15
22 1.0449 0.1087 0 0
23 1.0396 0.1053 -2.475 -0.846
24 1.0272 -0.0206 -3.086 0.92
25 1.0518 0.0405 -2.24 -0.472
26 1.0437 0.0118 -1.39 -0.17
27 1.0274 -0.0327 -2.81 -0.755
28 1.0447 0.0831 -2.06 -0.276
29 1.046 0.1346 -2.835 -0.269
30 1.0475 0.0682 3.0366 1.8914
31 0.982 0 5.7635 2.9865
32 0.9831 0.0623 6.9574 2.9561
33 0.9972 0.1758 6.6854 1.4136
34 1.0123 0.1631 5.4122 1.8219
35 1.0493 0.2016 6.9446 2.5189
36 1.0635 0.2514 5.9373 1.2586
37 1.0278 0.1663 5.7105 0.2859
38 1.0265 0.2648 8.7408 0.5183
39 1.03 0.0597 5.3481 -0.7187
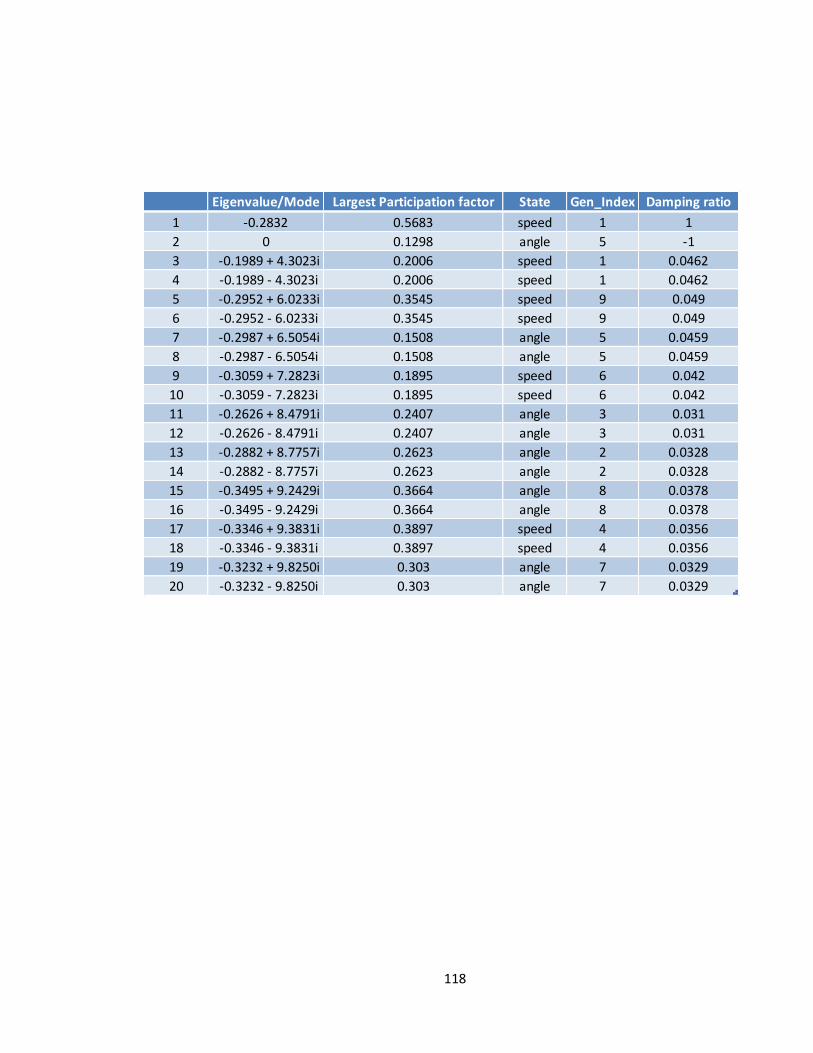
118
Eigenvalue/Mode Largest Participation factor State Gen_Index Damping ratio
1 -0.2832 0.5683 speed 1 1
2 0 0.1298 angle 5 -1
3 -0.1989 + 4.3023i 0.2006 speed 1 0.0462
4 -0.1989 - 4.3023i 0.2006 speed 1 0.0462
5 -0.2952 + 6.0233i 0.3545 speed 9 0.049
6 -0.2952 - 6.0233i 0.3545 speed 9 0.049
7 -0.2987 + 6.5054i 0.1508 angle 5 0.0459
8 -0.2987 - 6.5054i 0.1508 angle 5 0.0459
9 -0.3059 + 7.2823i 0.1895 speed 6 0.042
10 -0.3059 - 7.2823i 0.1895 speed 6 0.042
11 -0.2626 + 8.4791i 0.2407 angle 3 0.031
12 -0.2626 - 8.4791i 0.2407 angle 3 0.031
13 -0.2882 + 8.7757i 0.2623 angle 2 0.0328
14 -0.2882 - 8.7757i 0.2623 angle 2 0.0328
15 -0.3495 + 9.2429i 0.3664 angle 8 0.0378
16 -0.3495 - 9.2429i 0.3664 angle 8 0.0378
17 -0.3346 + 9.3831i 0.3897 speed 4 0.0356
18 -0.3346 - 9.3831i 0.3897 speed 4 0.0356
19 -0.3232 + 9.8250i 0.303 angle 7 0.0329
20 -0.3232 - 9.8250i 0.303 angle 7 0.0329

119

120
Case b – Increment of 2000MW
Bus V (PU) Theta (Rad) P (PU) Q (PU)
1 1.0369 0.2515 -0.0002 0.0001
2 1.0223 0.1412 -0.0006 0.0004
3 0.9765 0.0113 -3.222 -0.0234
4 0.9226 -0.14 -4.9995 -1.8388
5 0.9075 -0.2108 -0.0043 0.0013
6 0.9126 -0.2063 -0.0201 0.0071
7 0.8754 -0.3534 -22.2932 -0.8377
8 0.8759 -0.2961 -5.2162 -1.7536
9 0.9392 0.0926 -0.0083 0.0026
10 0.9503 -0.099 -0.0023 0.0009
11 0.9353 -0.1338 -0.0024 0.0005
12 0.9253 -0.1171 -0.075 -0.8798
13 0.9463 -0.0984 -0.0001 0
14 0.9421 -0.0931 -0.0009 0.0002
15 0.966 -0.0067 -3.2002 -1.5297
16 0.9959 0.0587 -3.2902 -0.3227
17 0.9941 0.0463 0 0
18 0.9858 0.0249 -1.5799 -0.3
19 1.0353 0.1779 0.0001 0.0001
20 0.9828 0.1694 -6.28 -1.03
21 1.0046 0.1152 -2.7401 -1.1499
22 1.0343 0.208 0.0001 0.0001
23 1.0285 0.2048 -2.475 -0.8459
24 1.0038 0.0645 -3.086 0.9201
25 1.0367 0.1627 -2.2398 -0.4721
26 1.0248 0.1237 -1.39 -0.1699
27 1.0037 0.0671 -2.81 -0.7549
28 1.0337 0.2062 -2.06 -0.276
29 1.0381 0.2615 -2.8349 -0.2689
30 1.0475 0.2032 3.5732 3.0093
31 0.982 0 6.8631 5.7831
32 0.9831 0.0717 7.4137 5.3013
33 0.9972 0.2803 7.0508 2.0904
34 1.0123 0.2724 5.7444 2.1568
35 1.0493 0.308 7.3892 3.3232
36 1.0635 0.3607 6.2746 1.7399
37 1.0278 0.2969 6.0209 0.9739
38 1.0265 0.3988 9.1816 1.0591
39 1.03 0.3191 11.7356 3.0385

121
Eigenvalue/Mode Largest Participation factor State Gen_Index Damping ratio
1 -0.2656 0.6005 speed 1 1
2 0 0.1345 angle 9 -1
3 -0.2125 + 4.4201i 0.1813 speed 1 0.048
4 -0.2125 - 4.4201i 0.1813 speed 1 0.048
5 -0.2916 + 6.0466i 0.3698 speed 9 0.0482
6 -0.2916 - 6.0466i 0.3698 speed 9 0.0482
7 -0.2981 + 6.6280i 0.1556 angle 5 0.0449
8 -0.2981 - 6.6280i 0.1556 angle 5 0.0449
9 -0.3024 + 7.3409i 0.1758 speed 6 0.0412
10 -0.3024 - 7.3409i 0.1758 speed 6 0.0412
11 -0.2538 + 8.7326i 0.2548 speed 10 0.0291
12 -0.2538 - 8.7326i 0.2548 speed 10 0.0291
13 -0.3224 + 9.3257i 0.3061 speed 2 0.0346
14 -0.3224 - 9.3257i 0.3061 speed 2 0.0346
15 -0.3408 + 9.5249i 0.224 speed 4 0.0358
16 -0.3408 - 9.5249i 0.224 speed 4 0.0358
17 -0.3219 + 9.4428i 0.1898 angle 4 0.0341
18 -0.3219 - 9.4428i 0.1898 angle 4 0.0341
19 -0.3221 + 9.9336i 0.2972 angle 7 0.0324
20 -0.3221 - 9.9336i 0.2972 angle 7 0.0324

122

123
Case c – Increment of 3000MW
Bus V (PU) Theta (Rad) P (PU) Q (PU)
1 1.0175 0.527 -0.0525 0.0515
2 0.9924 0.3096 -0.1461 0.1736
3 0.9189 0.123 -3.5573 0.1785
4 0.8346 -0.1248 -4.9936 -1.5854
5 0.8033 -0.2607 -0.3186 0.1202
6 0.8123 -0.2613 -1.393 0.5191
7 0.7473 -0.4903 -27.7525 -0.6754
8 0.7463 -0.3847 -4.7437 -0.9683
9 0.834 0.2977 -1.0809 0.741
10 0.8799 -0.1064 -0.2077 0.1405
11 0.8539 -0.1558 -0.2299 0.0836
12 0.8464 -0.1274 -0.0751 -0.8564
13 0.874 -0.097 0.0021 0.0034
14 0.8674 -0.0683 -0.1065 0.0646
15 0.915 0.0804 -3.2757 -1.4387
16 0.9602 0.172 -3.3721 -0.2225
17 0.954 0.1648 -0.0072 0.0099
18 0.9389 0.1403 -1.564 -0.2912
19 1.0217 0.3101 0.0316 0.0646
20 0.9752 0.306 -6.2716 -1.021
21 0.9789 0.2381 -2.7685 -1.1056
22 1.0203 0.341 0.0282 0.0548
23 1.0139 0.3379 -2.4638 -0.7943
24 0.971 0.1801 -3.0937 0.9506
25 1.0137 0.3267 -2.1795 -0.475
26 0.9981 0.2739 -1.4129 -0.1198
27 0.9698 0.2018 -2.8247 -0.7336
28 1.0192 0.37 -2.0695 -0.2581
29 1.028 0.4299 -2.7879 -0.2137
30 1.0475 0.383 4.1075 4.7425
31 0.982 0 7.7042 9.7665
32 0.9831 0.0861 7.7311 8.6483
33 0.9972 0.4189 7.4292 3.0043
34 1.0123 0.4156 6.0747 2.5997
35 1.0493 0.4486 7.8403 4.3788
36 1.0635 0.5045 6.6169 2.3657
37 1.0278 0.4708 6.3394 2.0112
38 1.0265 0.5751 9.638 1.7515
39 1.03 0.6565 17.899 9.3788

124
Eigenvalue/Mode Largest Participation factor State Gen_Index Damping ratio
1 -0.2395 0.6475 speed 1 1
2 0 0.1457 angle 9 1
3 -0.2305 + 4.5092i 0.1549 speed 1 0.051
4 -0.2305 - 4.5092i 0.1549 speed 1 0.051
5 -0.2876 + 6.0832i 0.3861 speed 9 0.0472
6 -0.2876 - 6.0832i 0.3861 speed 9 0.0472
7 -0.2993 + 6.7879i 0.1623 angle 5 0.0441
8 -0.2993 - 6.7879i 0.1623 angle 5 0.0441
9 -0.2966 + 7.4170i 0.152 speed 6 0.04
10 -0.2966 - 7.4170i 0.152 speed 6 0.04
11 -0.2542 + 8.9753i 0.2591 speed 10 0.0283
12 -0.2542 - 8.9753i 0.2591 speed 10 0.0283
13 -0.3328 + 9.6112i 0.3483 speed 4 0.0346
14 -0.3328 - 9.6112i 0.3483 speed 4 0.0346
15 -0.3621 + 9.7194i 0.3728 angle 8 0.0372
16 -0.3621 - 9.7194i 0.3728 angle 8 0.0372
17 -0.2947 +10.1887i 0.3678 angle 2 0.0289
18 -0.2947 -10.1887i 0.3678 angle 2 0.0289
19 -0.3208 +10.0746i 0.2903 angle 7 0.0318
20 -0.3208 -10.0746i 0.2903 angle 7 0.0318

125

126
System Control Analysis
Point of Instability – 5000MW

127

128

129
Eigenvalue/Mode
1 1.8855
2 -0.0318 + 3.0376i
3 -0.0336 + 3.6748i
4 -0.0402 + 7.4569i
5 -0.0354 + 6.0392i
6 -0.0339 + 6.7365i
7 -0.0385 + 7.3215i
8 -0.0408 + 5.6757i
9 -0.0435 + 4.9482i
10 -0.0109 + 4.9434i
11 -1.8855
12 -0.0318 - 3.0376i
13 -0.0336 - 3.6748i
14 -0.0402 - 7.4569i
15 -0.0354 - 6.0392i
16 -0.0339 - 6.7365i
17 -0.0385 - 7.3215i
18 -0.0408 - 5.6757i
19 -0.0435 - 4.9482i
20 -0.0109 - 4.9434i

130

131
Power system stabilizers Locations: Generators 1,2,4,6,7,10

132
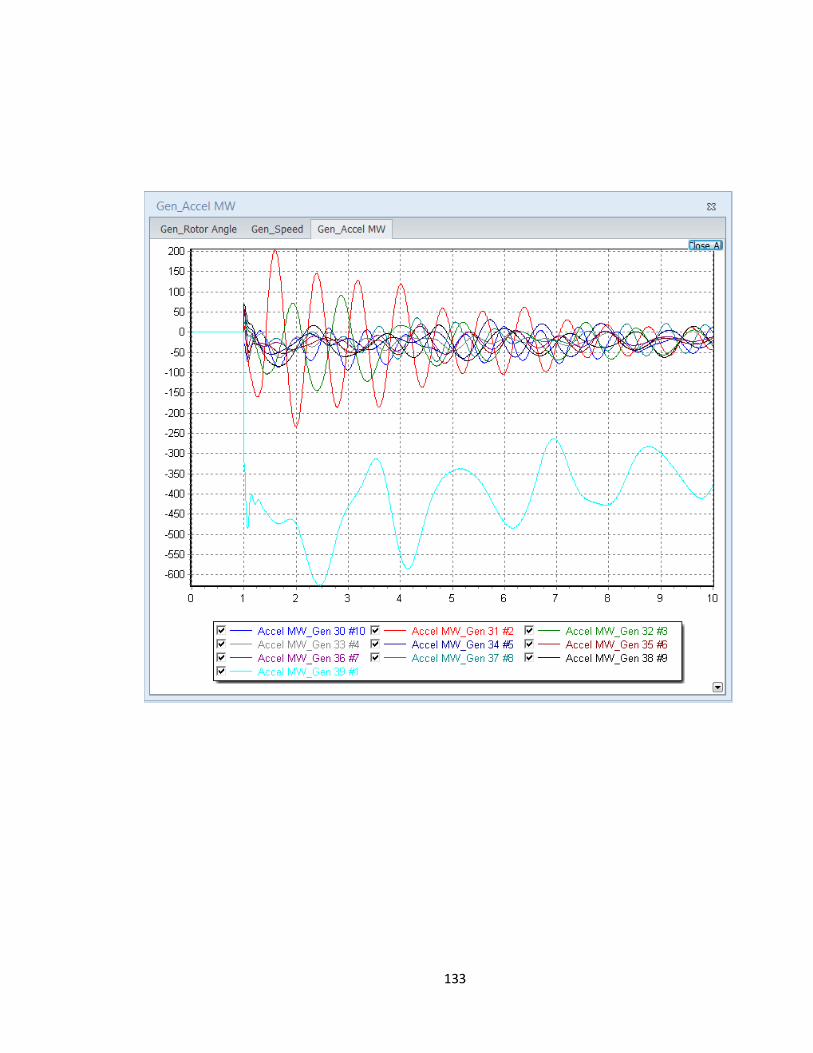
133

134
Eigenvalue/Mode
1 -0.6247 - 0.0073i
2 -0.5958 - 0.0134i
3 -0.0489 + 5.5381i
4 -0.6099 - 0.0167i
5 -0.0538 + 5.7197i
6 -0.6072 - 0.0162i
7 -0.6130 - 0.0138i
8 -0.0599 + 8.2948i
9 -0.0648 + 4.7306i
10 -0.6097 - 0.0088i
11 -0.6247 + 0.0073i
12 -0.5958 + 0.0134i
13 -0.0489 - 5.5381i
14 -0.6099 + 0.0167i
15 -0.0538 - 5.7197i
16 -0.6072 + 0.0162i
17 -0.6130 + 0.0138i
18 -0.0599 - 8.2948i
19 -0.0648 - 4.7306i
20 -0.6097 + 0.0088i

135

136
MATLAB Script:
function ybus = build(linedata); % Returns ybus
fb = linedata(:,1); % From bus number...
tb = linedata(:,2); % To bus number...
r = linedata(:,3); % Resistance, R...
x = linedata(:,4); % Reactance, X...
b = linedata(:,5); % Ground Admittance, B/2...
a = linedata(:,6); % Xfmr tap setting (ratio of Vfb/Vtb)
z = r + 1i*x; % Z matrix...
y = 1./z; % To get inverse of each element...
b = 1i*b; % Make B imaginary...
nbus = max(max(fb),max(tb)); % no. of buses...
nbranch = length(fb); % no. of branches...
ybus = zeros(nbus,nbus); % Initialise YBus...
% Formation of the Off Diagonal Elements...
for k=1:nbranch
if (a(k)==0)
ybus(fb(k),tb(k)) = -y(k);
ybus(tb(k),fb(k)) = ybus(fb(k),tb(k));
else
ybus(fb(k),tb(k)) = -y(k)/a(k);
ybus(tb(k),fb(k)) = ybus(fb(k),tb(k));
end
end
% Formation of Diagonal Elements....

137
for m=1:nbus
for n=1:nbranch
if (fb(n) == m || tb(n) == m)&&a(n)==0
ybus(m,m) = ybus(m,m) + y(n) + b(n);
end
if (fb(n) == m)&&a(n)~=0
ybus(m,m) = ybus(m,m) + y(n)/a(n) + y(n)*((1-
a(n))/a(n)^2);
end
if (tb(n) == m)&&a(n)~=0
ybus(m,m) = ybus(m,m) + y(n)/a(n) + y(n)*((a(n)-1)/a(n));
end
end
end

138
function [V theta P Q] = loadflow(lfdata , ybus0)
%naming constants and unknowns
V_SW=[];
theta_SW=[];
V_PV=[];
theta_PV=[];
V_PQ=[];
theta_PQ=[];
Pi_PV=[];
Pi_PQ=[];
Qi_PQ=[];
P_SW=[];
P_PV=[];
P_PQ=[];
Q_SW=[];
Q_PV=[];
Q_PQ=[];
%rearrange ybus based on bustype
bustype = lfdata(:,2)';
busindex=lfdata(:,1)';
busindex=[bustype' busindex'];
busindex=sortrows(busindex,1);
busindex(:,1)=[];
busindex=busindex';
ybus=[bustype' ybus0];
ybus=sortrows(ybus,1);
ybus(:,1)=[];
ybus=[bustype;ybus];
ybus=ybus';
ybus=sortrows(ybus,1);

139
ybus=ybus';
ybus(1,:)=[];
%initialize unknowns (V=1.0, theta=0.0, P=Pi, Q=Qi for PQ bus=3)
%determining constants (V and theta for swing bus=1 and V for PV bus=2)
for k=1:length(bustype)
if (bustype(k)==1)
V_SW=[V_SW lfdata(k,3)];
theta_SW=[theta_SW lfdata(k,4)];
P_SW=[P_SW 0];
Q_SW=[Q_SW 0];
end
if (bustype(k)==2)
V_PV=[V_PV lfdata(k,3)];
theta_PV=[theta_PV 0];
P_PV=[P_PV 0];
Q_PV=[Q_PV 0];
Pi_PV=[Pi_PV lfdata(k,5)];
end
if (bustype(k)==3)
V_PQ=[V_PQ 1];
theta_PQ=[theta_PQ 0];
P_PQ=[P_PQ 0];
Q_PQ=[Q_PQ 0];
Pi_PQ=[Pi_PQ -lfdata(k,5)];
Qi_PQ=[Qi_PQ -lfdata(k,6)];
end
end
error=1; % dummy value for error
while(abs(error(1))>0.01)

140
% all voltage and angles grouped in order of bustype
theta=[theta_SW theta_PV theta_PQ];
V=[V_SW V_PV V_PQ];
%re-calculating P and Q (reset P and Q to zero)
P=zeros(1,length(bustype));
Q=zeros(1,length(bustype));
for i=1:length(bustype)
for j=1:length(bustype)
P(i)=P(i)+abs(V(i))*abs(V(j))*(real(ybus(i,j))*cos(theta(i)-
theta(j))+imag(ybus(i,j))*sin(theta(i)-theta(j)));
end
end
for i=1:length(bustype)
for j=1:length(bustype)
Q(i)=Q(i)+abs(V(i))*abs(V(j))*(real(ybus(i,j))*sin(theta(i)-theta(j))-
imag(ybus(i,j))*cos(theta(i)-theta(j)));
end
end
P_SW=P(1:length(P_SW));
P_PV=P(length(P_SW)+1:length(P_SW)+length(P_PV));
P_PQ=P(length(P_SW)+length(P_PV)+1:length(P_SW)+length(P_PV)+length(P_P
Q));
Q_SW=Q(1:length(Q_SW));
Q_PV=Q(length(Q_SW)+1:length(Q_SW)+length(Q_PV));

141
Q_PQ=Q(length(Q_SW)+length(Q_PV)+1:length(Q_SW)+length(Q_PV)+length(Q_P
Q));
%develop Jacobian
for p=length(P_SW)+1:length(P_SW)+length(P_PV)+length(P_PQ)
for
q=length(theta_SW)+1:length(theta_SW)+length(theta_PV)+length(theta_PQ)
if(p~=q)
J11(p-length(P_SW),q-
length(theta_SW))=abs(V(p))*abs(V(q))*(real(ybus(p,q))*sin(theta(p)-
theta(q))-imag(ybus(p,q))*cos(theta(p)-theta(q)));
end
if(p==q)
J11(p-length(P_SW),q-length(theta_SW))=-Q(p)-
imag(ybus(p,p))*V(p)^2;
end
end
end
for
p=length(Q_SW)+length(Q_PV)+1:length(Q_SW)+length(Q_PV)+length(Q_PQ)
for
q=length(theta_SW)+1:length(theta_SW)+length(theta_PV)+length(theta_PQ)
if(p~=q)
J21(p-length(Q_SW)-length(Q_PV),q-length(theta_SW))=-
abs(V(p))*abs(V(q))*(real(ybus(p,q))*cos(theta(p)-
theta(q))+imag(ybus(p,q))*sin(theta(p)-theta(q)));
end
if(p==q)
J21(p-length(Q_SW)-length(Q_PV),q-
length(theta_SW))=P(p)-real(ybus(p,p))*V(p)^2;

142
end
end
end
for p=length(P_SW)+1:length(P_SW)+length(P_PV)+length(P_PQ)
for
q=length(V_SW)+length(V_PV)+1:length(V_SW)+length(V_PV)+length(V_PQ)
if(p~=q)
J12(p-length(P_SW),q-length(V_SW)-
length(V_PV))=abs(V(p))*(real(ybus(p,q))*cos(theta(p)-
theta(q))+imag(ybus(p,q))*sin(theta(p)-theta(q)));
end
if(p==q)
J12(p-length(P_SW),q-length(V_SW)-
length(V_PV))=P(p)/abs(V(p))+real(ybus(p,p))*abs(V(p));
end
end
end
for
p=length(Q_SW)+length(Q_PV)+1:length(Q_SW)+length(Q_PV)+length(Q_PQ)
for
q=length(V_SW)+length(V_PV)+1:length(V_SW)+length(V_PV)+length(V_PQ)
if(p~=q)
J22(p-length(Q_SW)-length(Q_PV),q-length(V_SW)-
length(V_PV))=abs(V(p))*(real(ybus(p,q))*sin(theta(p)-theta(q))-
imag(ybus(p,q))*cos(theta(p)-theta(q)));
end
if(p==q)
J22(p-length(Q_SW)-length(Q_PV),q-length(V_SW)-
length(V_PV))=Q(p)/abs(V(p))-imag(ybus(p,p))*abs(V(p));

143
end
end
end
%Jacobian
J=[J11 J12;J21 J22];
%x=angles and voltages
x=[theta_PV theta_PQ V_PQ];
%f(x)=P(x)-Pi and Q(x)-Qi
f_x=[P_PV-Pi_PV P_PQ-Pi_PQ Q_PQ-Qi_PQ];
%formula xk+1=xk-[J^-1*f(x)]
%precision of solution
error=inv(J)*f_x';
x=x-error';
theta_PV=x(1:length(theta_PV));
theta_PQ=x(length(theta_PV)+1:length(theta_PV)+length(theta_PQ));
V_PQ=x(length(theta_PV)+length(theta_PQ)+1:end);
end
%rearrange voltages and angles based on the bus indexing
theta=[theta_SW theta_PV theta_PQ];
V=[V_SW V_PV V_PQ];
V=[busindex' V'];
V=sortrows(V,1);
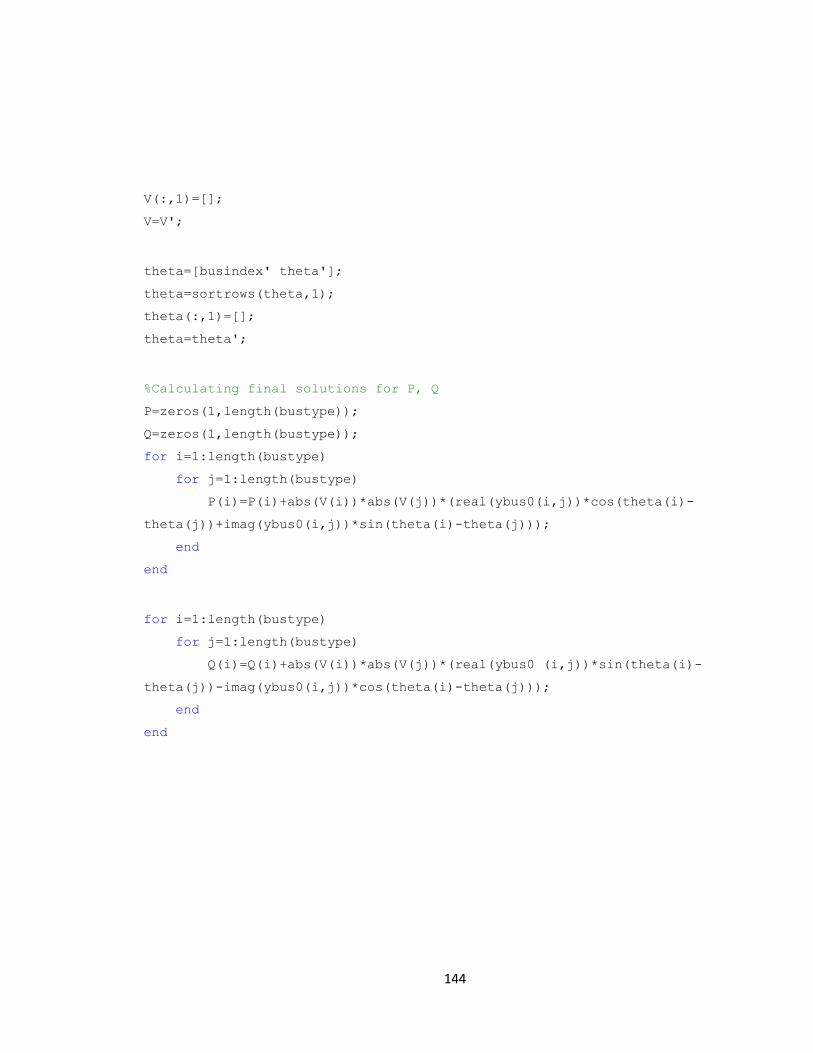
144
V(:,1)=[];
V=V';
theta=[busindex' theta'];
theta=sortrows(theta,1);
theta(:,1)=[];
theta=theta';
%Calculating final solutions for P, Q
P=zeros(1,length(bustype));
Q=zeros(1,length(bustype));
for i=1:length(bustype)
for j=1:length(bustype)
P(i)=P(i)+abs(V(i))*abs(V(j))*(real(ybus0(i,j))*cos(theta(i)-
theta(j))+imag(ybus0(i,j))*sin(theta(i)-theta(j)));
end
end
for i=1:length(bustype)
for j=1:length(bustype)
Q(i)=Q(i)+abs(V(i))*abs(V(j))*(real(ybus0 (i,j))*sin(theta(i)-
theta(j))-imag(ybus0(i,j))*cos(theta(i)-theta(j)));
end
end

145
function [M lamda Pf] = statematrix1(WR ,gen_data, load_data, P ,Q ,V
,theta ,ybus)
%determine the gen and load bus connections
load_conn=load_data(:,2);
gen_conn = gen_data(:,2);
%generator inertia constant
H=gen_data(:,4);
%generator admittances
xd=gen_data(:,3);
yd=-1i./xd;
%number of loads and gens
n_loads=max(load_data(:,1));
n_gens=max(gen_data(:,1));
%initializations
yload=[];
E_complex=[];
%determine Load admittances
for k=1:n_loads
yload=[yload -
P(load_conn(k))/V(load_conn(k))^2+1i*(Q(load_conn(k))/V(load_conn(k))^2
)];
end
%modifying the ybus with the load and generator admittances
genindex=0;
loadindex=0;
for k=1:length(ybus)

146
if any(gen_conn==k)
genindex=genindex+1;
ybus(k,k)=ybus(k,k)+yd(genindex);
end
if any(load_conn==k)
loadindex=loadindex+1;
ybus(k,k)=ybus(k,k)+yload(loadindex);
end
end
%rearranging ybus with the generator connected buses on the top
s=[];
genindex=0;
for k=1:length(ybus)
if any(gen_conn==k)
genindex=genindex+1;
s=[s gen_data(genindex,1)];
else
s=[s (n_gens+1)];
end
end
ybus=[s' ybus];
ybus=sortrows(ybus,1);
ybus(:,1)=[];
ybus=[s;ybus];
ybus=ybus';
ybus=sortrows(ybus,1);
ybus=ybus';
ybus(1,:)=[];
%adding generator impedance matrix to ybus

147
gen_imp_matrix=zeros(length(yd));
for i=1:length(yd)
for j=1:length(yd)
if(i==j)
gen_imp_matrix(i,i)=yd(i);
end
end
end
extra=zeros(length(yd),(length(ybus)-length(yd)));
temp1=[gen_imp_matrix -gen_imp_matrix extra];
temp2=[-gen_imp_matrix;extra'];
temp3=[temp2 ybus];
temp4=[temp1; temp3];
ybus_temp=temp4;
%KRON reduction of ybus
n=n_gens;
r=length(ybus_temp);
ybus_red=ybus_temp(1:n,1:n)-
ybus_temp(1:n,n+1:r)*inv(ybus_temp(n+1:r,n+1:r))*ybus_temp(n+1:r,1:n);
%finding E and delta for generators
for k=1:n
E_complex=[E_complex
V(gen_conn(k))+Q(gen_conn(k))*xd(k)/V(gen_conn(k))+1i*P(gen_conn(k))*xd
(k)/V(gen_conn(k))]; %#ok<AGROW>
end
E=abs(E_complex);
delta=angle(E_complex);
delta0=zeros(1,length(delta));

148
for k=1:length(theta)
if any(gen_conn==k)
index=1;
while(gen_conn(index)~=k)
index=index+1;
end
delta0(index)=delta(index)+theta(k);
end
end
%develop Ps matrix nxn (diagonal entries are meaningless and never
used)
for i=1:n
for j=1:n
Ps(i,j)=E(i)*E(j)*(imag(ybus_red(i,j))*cos(delta0(i)-
delta0(j))-real(ybus_red(i,j))*sin(delta0(i)-delta0(j)));
end
end
A=zeros(n);
%develop A matrix n-1xn-1 with the nth generator as a reference
for i=1:n
for j=1:n
if(i~=j)
A(i,j)=((WR/2)/H(i))*Ps(i,j);
end
if(i==j)
for k=1:n
if (k~=i)
A(i,i)=A(i,i)-((WR/2)/H(i))*Ps(i,k);
end
end
end
end
end
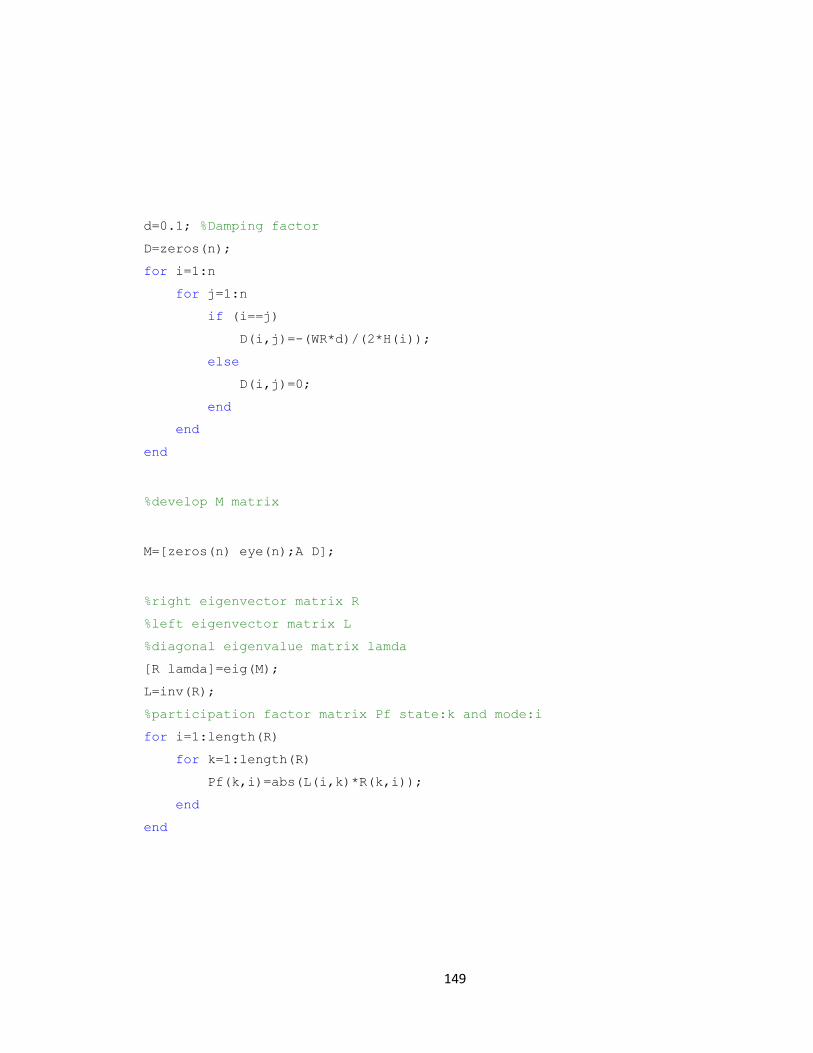
149
d=0.1; %Damping factor
D=zeros(n);
for i=1:n
for j=1:n
if (i==j)
D(i,j)=-(WR*d)/(2*H(i));
else
D(i,j)=0;
end
end
end
%develop M matrix
M=[zeros(n) eye(n);A D];
%right eigenvector matrix R
%left eigenvector matrix L
%diagonal eigenvalue matrix lamda
[R lamda]=eig(M);
L=inv(R);
%participation factor matrix Pf state:k and mode:i
for i=1:length(R)
for k=1:length(R)
Pf(k,i)=abs(L(i,k)*R(k,i));
end
end

150
Related Documents