International Journal of Applied Engineering Research ISSN 0973-4562 Volume 13, Number 6 (2018) pp. 4179-4194 © Research India Publications. http://www.ripublication.com 4179 Power System Analysis for a Utility with Localized Wind Generation: Southern Negros Oriental Case Maria Lorena Tuballa* a, b , Michael Lochinvar Abundo a, c a School of Engineering, University of San Carlos, Talamban, Cebu City 6000 Philippines. b College of Engineering and Design, Silliman University, Dumaguete City, 6200 Philippines. c Nanyang Technological University, Singapore. (* Corresponding author) Abstract: Wind power and solar energy systems are among the green energy options that have been developed to a fairly large extent in many countries. Along with this development comes the concept of microgrids – localized grids that can disconnect from traditional grids to operate autonomously and distributed generation (DG) – an approach where renewable energy generators are located near consumption areas. In this paper, an electric utility in Negros Oriental is selected and wind power is considered. An optimization study conducted separately has identified that wind power generation is an optimal resource given the load profile and the location of the site. It is important to check the present system before determining the possible operational behavior of the system with an additional generator. The challenges in the planning, operation, maintenance, and control of a power system are partly solved and determined using computer-based power system analysis. Electrical Transient Analyzer Program (ETAP) is used in this study. Generation matches load. The existing distribution system for this electric utility has shown bus marginal undervoltages during the load flow. Some cables appear overloaded. Certain overcurrent protective devices in the substations will be in critical states whenever faults occur in the incoming buses. The behavior of the system with and without wind power generation is observed and evaluated. The wind turbines tend to increase the bus voltages, especially at the nearest bus. Transient stability simulations for the existing system exhibit stability while in the new system some parameters are not able to recover. Keywords: microgrids, wind power, planning, ETAP, stability, renewable energy INTRODUCTION Power system analysis is essential in every power system and for every component of the power system: generation, transmission, and distribution. It determines the voltages at various buses and the currents that flow in the lines operating at different voltage levels. Planning, operation, and control of interconnected systems pose many challenges the solutions of which are partly solved by power system analysis. With electricity demands continuing to soar and climate change threatening lives and economies, the need to shift to greener energy and increasing the efficiency of electric systems become more remarkable. Wind power and solar power systems are among the green energy sources that have been developed to a large extent in many countries. Along with this comes the concept of microgrids – localized grids that can disconnect from traditional grids to operate autonomously and distributed generation (DG) – an approach where renewable energy (RE) generators are located near consumption areas. Because of this, distribution systems are gaining new attention. Moreover, the electric grid has become more complex. Issues like power quality, blackouts, protection, and others also need regard. Before interconnections can happen, it is crucial to check if the existing system is even good enough to handle the current workings of the grid. Wind and solar energy systems are among the most commonly used green energy resources [1]. Wind energy is one of the fastest-growing energy resources in the world and has many advantages such as being cost-effective and installations can be built on existing farms and ranches [2]. In a report by the Global Wind Energy Council, in 2016, more than 54 GW of wind power was installed globally, comprising more than 90 countries, including nine with more than 10,000 MW installations [3]. The same report highlighted that wind power penetration levels have increased. Denmark leads at 40%, followed by Uruguay. Portugal and Ireland have over 20%; Spain and Cyprus have around 20% and Germany has 16%. China, the US, and Canada have 4%, 5.5%, and 6% of their power needs met by wind energy, respectively. Along with this statistics are studies related to wind energy with various focus such as studies on power quality in distribution systems, integration challenges and power flow analysis, among others [4–9]. In this paper, an electric utility in Negros Oriental, Philippines is selected and wind power is considered. In one of the simulations of an optimization study conducted separately, wind power generation is optimal for the site based on the load profile, resource availability and associated costs. Only 12 MW is simulated though in anticipation of the large land area that would be required. Direct impact areas include wind turbine pads, access roads, substations, service buildings, and other infrastructures [10]. It is important to check the present system before determining the possible operational behavior of the system with an additional generator. The challenges in the planning, operation, maintenance, and control of a power system are partly solved and determined using computer-

Welcome message from author
This document is posted to help you gain knowledge. Please leave a comment to let me know what you think about it! Share it to your friends and learn new things together.
Transcript

International Journal of Applied Engineering Research ISSN 0973-4562 Volume 13, Number 6 (2018) pp. 4179-4194
© Research India Publications. http://www.ripublication.com
4179
Power System Analysis for a Utility with Localized Wind Generation:
Southern Negros Oriental Case
Maria Lorena Tuballa* a, b, Michael Lochinvar Abundo a, c
a School of Engineering, University of San Carlos, Talamban, Cebu City 6000 Philippines. b College of Engineering and Design, Silliman University, Dumaguete City, 6200 Philippines.
c Nanyang Technological University, Singapore.
(* Corresponding author)
Abstract:
Wind power and solar energy systems are among the green
energy options that have been developed to a fairly large
extent in many countries. Along with this development comes
the concept of microgrids – localized grids that can disconnect
from traditional grids to operate autonomously and distributed
generation (DG) – an approach where renewable energy
generators are located near consumption areas. In this paper,
an electric utility in Negros Oriental is selected and wind
power is considered. An optimization study conducted
separately has identified that wind power generation is an
optimal resource given the load profile and the location of the
site. It is important to check the present system before
determining the possible operational behavior of the system
with an additional generator. The challenges in the planning,
operation, maintenance, and control of a power system are
partly solved and determined using computer-based power
system analysis. Electrical Transient Analyzer Program
(ETAP) is used in this study. Generation matches load. The
existing distribution system for this electric utility has shown
bus marginal undervoltages during the load flow. Some cables
appear overloaded. Certain overcurrent protective devices in
the substations will be in critical states whenever faults occur
in the incoming buses. The behavior of the system with and
without wind power generation is observed and evaluated.
The wind turbines tend to increase the bus voltages, especially
at the nearest bus. Transient stability simulations for the
existing system exhibit stability while in the new system some
parameters are not able to recover. Keywords: microgrids, wind power, planning, ETAP,
stability, renewable energy
INTRODUCTION
Power system analysis is essential in every power system and
for every component of the power system: generation,
transmission, and distribution. It determines the voltages at
various buses and the currents that flow in the lines operating
at different voltage levels. Planning, operation, and control of
interconnected systems pose many challenges the solutions of
which are partly solved by power system analysis.
With electricity demands continuing to soar and climate
change threatening lives and economies, the need to shift to
greener energy and increasing the efficiency of electric
systems become more remarkable. Wind power and solar
power systems are among the green energy sources that have
been developed to a large extent in many countries. Along
with this comes the concept of microgrids – localized grids
that can disconnect from traditional grids to operate
autonomously and distributed generation (DG) – an approach
where renewable energy (RE) generators are located near
consumption areas. Because of this, distribution systems are
gaining new attention. Moreover, the electric grid has become
more complex. Issues like power quality, blackouts,
protection, and others also need regard. Before
interconnections can happen, it is crucial to check if the
existing system is even good enough to handle the current
workings of the grid.
Wind and solar energy systems are among the most
commonly used green energy resources [1]. Wind energy is
one of the fastest-growing energy resources in the world and
has many advantages such as being cost-effective and
installations can be built on existing farms and ranches [2]. In
a report by the Global Wind Energy Council, in 2016, more
than 54 GW of wind power was installed globally, comprising
more than 90 countries, including nine with more than 10,000
MW installations [3]. The same report highlighted that wind
power penetration levels have increased. Denmark leads at
40%, followed by Uruguay. Portugal and Ireland have over
20%; Spain and Cyprus have around 20% and Germany has
16%. China, the US, and Canada have 4%, 5.5%, and 6% of
their power needs met by wind energy, respectively. Along
with this statistics are studies related to wind energy with
various focus such as studies on power quality in distribution
systems, integration challenges and power flow analysis,
among others [4–9].
In this paper, an electric utility in Negros Oriental, Philippines
is selected and wind power is considered. In one of the
simulations of an optimization study conducted separately,
wind power generation is optimal for the site based on the
load profile, resource availability and associated costs. Only
12 MW is simulated though in anticipation of the large land
area that would be required. Direct impact areas include wind
turbine pads, access roads, substations, service buildings, and
other infrastructures [10]. It is important to check the present
system before determining the possible operational behavior
of the system with an additional generator. The challenges in
the planning, operation, maintenance, and control of a power
system are partly solved and determined using computer-

International Journal of Applied Engineering Research ISSN 0973-4562 Volume 13, Number 6 (2018) pp. 4179-4194
© Research India Publications. http://www.ripublication.com
4180
based power system analysis. Electrical Transient Analyzer
Program (ETAP) is used in the simulations in this study. With
the tool, a system model can be created and validated. Load
flow analysis, a check on whether the network is within the
necessary limits and tolerances in terms of the voltage profiles
and loading of the components, is performed. Short-circuit
analysis, which determines the magnitude of currents that
flow during electrical faults and compare these against the
ratings of the equipment, is done next. Transient stability
analysis, an examination of the ability of the system to
maintain synchronism when subjected to a severe fault or
disturbance, is also performed in this investigation.
Power system studies using computer tools and simulators
have become popular in recent years. They have become more
intuitive and user-friendly. Electrical Transient Analyzer
Program (ETAP) is one of the most comprehensive software
packages for electrical power system modeling, design,
analysis, optimization, control and automation [11]. This
software is used for load flow, short-circuit and transient
stability analyses of the existing distribution system. These
are three of the most common analyses performed during the
planning and in the investigation of electrical systems. This paper is organized as follows: A brief introduction starts
the paper; the methodology employed in the study is given
after. In the succeeding section, load flow analysis for the
existing system and for the system with wind power is
presented. Short-circuit analysis and transient stability
analysis follow. The last section contains the conclusions and
some recommendations.
METHODOLOGY The general methodology for this investigation is summarized below:
The steps in the power system analysis: load flow studies,
short-circuit studies, and transient stability studies are as
shown below.
LOAD FLOW ANALYSIS Load flow analysis is an important part of electrical system
design. It is a check on whether the network is within the
necessary limits and tolerances in terms of the voltage profiles
and loading of the components. Load flow studies and
analysis are performed during the planning stages, when
evaluating the operation and before changes to the existing
system can be appropriately made. ETAP also features
automatic device evaluation with a result analyzer and a
summary of alarms or warnings [12].
Existing System The existing distribution system is composed of 38 buses, 40 branches, 0 generators, 2 power grids and 17 loads. Load-MW
is 42.239 (non-peak), Load-Mvar is 9.871 (non-peak).
Generation matches load. Figure 1 shows the simplified system one-line view. Table 1 shows five buses on marginal states. Marginal states specified are 95% for loading, 102% for overvoltage and 98%
for undervoltage. Critical states specified are 100% for
loading, 105% for overvoltage and 95% for undervoltage.
Figure 2 shows the portion of the system where the marginal
states occur. They are in the Bayawan and Siaton substations. The cable appears to be in an overloaded state but this might
need to be verified further.
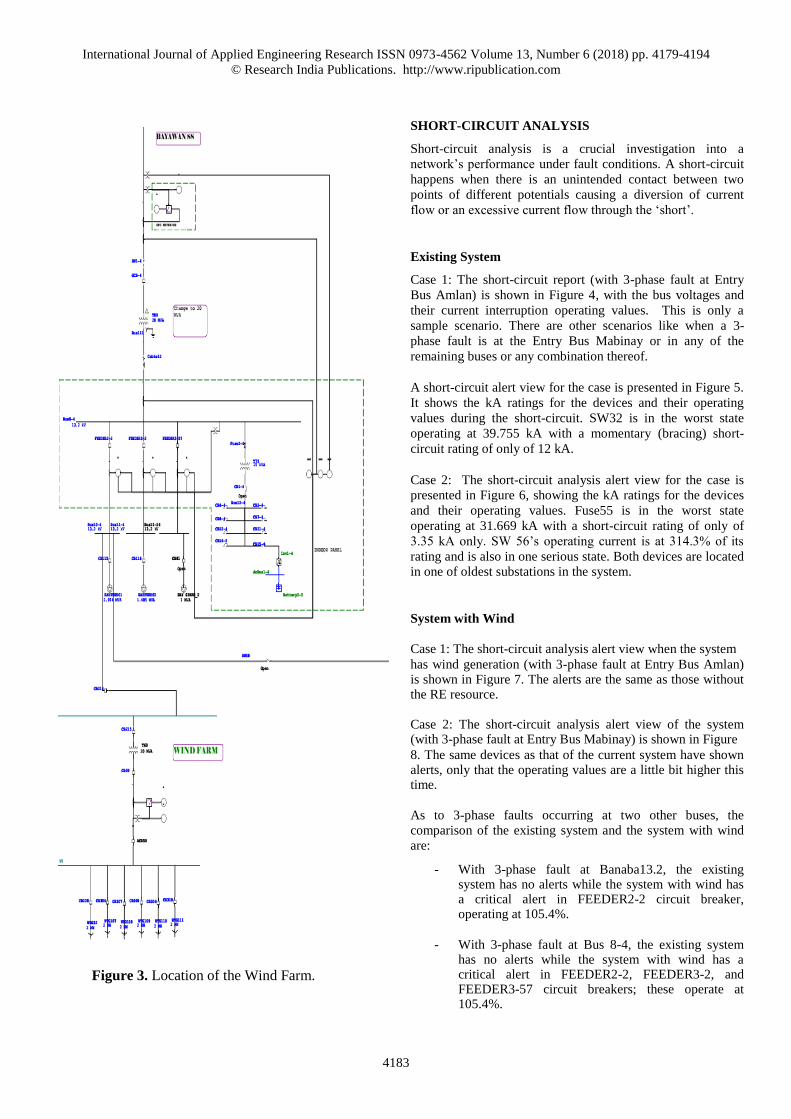
System with Wind Figure 2 illustrates the location of the wind farm. The wind
turbines are connected to the RE Line for load flow purposes.
Table 2 gives the load flow results of the buses when the wind
farm is connected to the system. The marginal undervoltages
in the existing system have gone normal but some other buses
are now in marginal undervoltage and overvoltage.
Data Gathering for Baseline Data
Inspection and Understanding of the
Existing System
Power System Analysis of Existing System
Power System Analysis of System with the
RE

International Journal of Applied Engineering Research ISSN 0973-4562 Volume 13, Number 6 (2018) pp. 4179-4194
© Research India Publications. http://www.ripublication.com
4181
Figure 1. Simplified Distribution System One-Line View.
Table 1: Bus Results on Load Flow Analyzer (Existing).
Table 2: Bus Results on Load Flow Analyzer (With Wind).
BUS ID Nominal kV LOAD FLOW (Voltage)
BANABA13.2 13.2 99.57
Bus8-4 13.2 96.42
Bus8-23 13.2 99.18
Bus8-24 13.2 99.18
Bus8-26 13.2 99.18
Bus8-28 13.2 99.18
Bus8-30 13.2 99.18
Bus10-4 13.2 96.42
Bus10-27 13.2 99.18
Bus10-28 13.2 99.18
Bus10-30 13.2 99.18
Bus10-32 13.2 99.18
Bus10-34 13.2 99.18
Bus10-36 13.2 99.18
Bus10-38 13.2 99.18
Bus11-4 13.2 96.42
Bus11-26 13.2 96.42
Bus11-29 13.2 99.18
Bus11-30 13.2 99.18
Bus11-32 13.2 99.18
Bus11-36 13.2 99.18
Bus11-42 13.2 99.18
Bus11-43 13.2 99.18
Bus11-44 13.2 99.18
Bus11-48 13.2 99.18
Bus11-49 13.2 99.18
Bus11-50 13.2 99.18
Bus61 13.2 99.18
Bus87 13.2 96.42
SIATON13.2 13.2 98.37
BUS ID Nominal kV LOAD FLOW (Voltage)
BANABA13.2 13.2 99.57
Bus8-4 13.2 101.55
Bus8-23 13.2 97.53
Bus8-24 13.2 97.97
Bus8-26 13.2 98.26
Bus8-28 13.2 98.61
Bus8-30 13.2 98.11
Bus10-4 13.2 101.55
Bus10-27 13.2 97.53
Bus10-28 13.2 97.97
Bus10-30 13.2 98.26
Bus10-32 13.2 98.61
Bus10-34 13.2 98.11
Bus10-36 13.2 98.11
Bus10-38 13.2 97.97
Bus11-4 13.2 101.55
Bus11-26 13.2 101.55
Bus11-29 13.2 97.53
Bus11-30 13.2 97.53
Bus11-32 13.2 97.97
Bus11-36 13.2 98.26
Bus11-42 13.2 98.61
Bus11-43 13.2 98.61
Bus11-44 13.2 98.61
Bus11-48 13.2 98.11
Bus11-49 13.2 98.11
Bus11-50 13.2 98.11
Bus61 13.2 97.53
Bus87 13.2 101.55
SIATON13.2 13.2 98.24
RE Line 7.97 104.10%

International Journal of Applied Engineering Research ISSN 0973-4562 Volume 13, Number 6 (2018) pp. 4179-4194
© Research India Publications. http://www.ripublication.com
4182
Figure 2: Portion of the System in Marginal States for Load Flow.
International Journal of Applied Engineering Research ISSN 0973-4562 Volume 13, Number 6 (2018) pp. 4179-4194
© Research India Publications. http://www.ripublication.com
4183
Figure 3. Location of the Wind Farm.
SHORT-CIRCUIT ANALYSIS
Short-circuit analysis is a crucial investigation into a
network’s performance under fault conditions. A short-circuit
happens when there is an unintended contact between two
points of different potentials causing a diversion of current
flow or an excessive current flow through the ‘short’.
Existing System
Case 1: The short-circuit report (with 3-phase fault at Entry
Bus Amlan) is shown in Figure 4, with the bus voltages and
their current interruption operating values. This is only a
sample scenario. There are other scenarios like when a 3-
phase fault is at the Entry Bus Mabinay or in any of the
remaining buses or any combination thereof.
A short-circuit alert view for the case is presented in Figure 5.
It shows the kA ratings for the devices and their operating
values during the short-circuit. SW32 is in the worst state
operating at 39.755 kA with a momentary (bracing) short-
circuit rating of only of 12 kA.
Case 2: The short-circuit analysis alert view for the case is
presented in Figure 6, showing the kA ratings for the devices
and their operating values. Fuse55 is in the worst state
operating at 31.669 kA with a short-circuit rating of only of
3.35 kA only. SW 56’s operating current is at 314.3% of its
rating and is also in one serious state. Both devices are located
in one of oldest substations in the system.
System with Wind
Case 1: The short-circuit analysis alert view when the system has wind generation (with 3-phase fault at Entry Bus Amlan) is shown in Figure 7. The alerts are the same as those without the RE resource. Case 2: The short-circuit analysis alert view of the system (with 3-phase fault at Entry Bus Mabinay) is shown in Figure 8. The same devices as that of the current system have shown alerts, only that the operating values are a little bit higher this time.
As to 3-phase faults occurring at two other buses, the
comparison of the existing system and the system with wind
are:
- With 3-phase fault at Banaba13.2, the existing system has no alerts while the system with wind has a critical alert in FEEDER2-2 circuit breaker, operating at 105.4%.
- With 3-phase fault at Bus 8-4, the existing system has no alerts while the system with wind has a critical alert in FEEDER2-2, FEEDER3-2, and FEEDER3-57 circuit breakers; these operate at 105.4%.

International Journal of Applied Engineering Research ISSN 0973-4562 Volume 13, Number 6 (2018) pp. 4179-4194
© Research India Publications. http://www.ripublication.com
4184
Figure 4: Short-Circuit Report_3-Phase Fault at Entry Bus Amlan.
Figure 5: Short-Circuit Analysis View_3-Phase Fault at Entry Bus Amlan.

International Journal of Applied Engineering Research ISSN 0973-4562 Volume 13, Number 6 (2018) pp. 4179-4194
© Research India Publications. http://www.ripublication.com
4185
Figure 6: Short-Circuit Analysis View_3-Phase Fault at Entry Bus Mabinay.
Figure 7: Short-Circuit Analysis View_3-Phase Fault at Entry Bus Amlan (With Wind).
Figure 8: Short-Circuit Analysis View_3-Phase Fault at Entry Bus Mabinay.
TRANSIENT STABILITY ANALYSIS
Transients are momentary events preceding the steady-state
condition during a sudden change of a circuit in a power
system. These momentary bursts of energy are characterized
by extremely high voltages that can drive very large amounts
of currents into the system for a limited time. The stability of
a system refers to the ability of a system to return back to its
steady state when subjected to a disturbance. The transient
stability analysis determines whether the components in the
system returns to their steady state in a timely manner once
the disturbance or fault is cleared.
The ETAP Transient Stability Analysis program can
investigate the system dynamic responses and stability limits
of a power system before, during, and after the occurrence of
disturbances.
Existing System
Case 1: Figures 9-13 are plots obtained for the study case
where there is a 3-phase fault at Entry Bus Amlan. The
concern is to verify the response of the substation buses due to
the disturbance. The fault is assumed to be cleared after 0.06
sec. The total simulation time was set to 0.5 sec, simulation
time step (dt) to 0.001 and plot time step of 20 x dt.
Figure 9 reveals that all substation voltages return to their
steady-state conditions after the fault is cleared. Their voltages
go down to zero after the fault but rise up to their stable values
in due time.
Figure 10 shows that all bus voltage angles return to their
original angles after the clearing of the fault.
There is no problem with the buses’ frequencies as shown in
Figure 11.
Figures 12 and 13 show the bus real and reactive power
loadings before, during and after the fault condition, respectively.. The loadings have returned to normal.

International Journal of Applied Engineering Research ISSN 0973-4562 Volume 13, Number 6 (2018) pp. 4179-4194
© Research India Publications. http://www.ripublication.com
4186
Figure 9: Bus Voltages at the Substations_3-Phase Fault at Entry Bus Amlan.
Figure 10: Bus Voltage Angles at the Substations _3-Phase Fault at Entry Bus Amlan.

International Journal of Applied Engineering Research ISSN 0973-4562 Volume 13, Number 6 (2018) pp. 4179-4194
© Research India Publications. http://www.ripublication.com
4187
Figure 11: Bus Frequencies at the Substations _3-Phase Fault at Entry Bus Amlan.
Figure 12: Bus Real Power Loading at the Substations_3-Phase Fault at Entry Bus Amlan.

International Journal of Applied Engineering Research ISSN 0973-4562 Volume 13, Number 6 (2018) pp. 4179-4194
© Research India Publications. http://www.ripublication.com
4188
Figure 13: Bus Reactive Power Loading at the Substations_3-Phase Fault at Entry Bus Amlan.
Figure 14: Bus Voltages at the Substations_3-Phase Fault at Entry Bus Mabinay.
Case 2: Figures 14-17 are plots obtained for the study case
where there is a 3-phase fault at Entry Bus Mabinay. The
response of the substation buses due to the disturbance is
verified. The fault is still assumed to be cleared after 0.06 sec.
The total simulation time was set to 0.5 sec, simulation time
step (dt) to 0.001 and plot time step of 20 x dt.
Figure 14 reveals that all substation voltages return to their
steady-state conditions after the fault is cleared. Their voltages
go down to zero after the fault but also go up to their stable
values in due time.
Figure 15 shows that Buses 8-4, 87, 10-4, and 11-4 do not go
back to the same angle right away but do so after a negligible
period of time.

International Journal of Applied Engineering Research ISSN 0973-4562 Volume 13, Number 6 (2018) pp. 4179-4194
© Research India Publications. http://www.ripublication.com
4189
Figure 15: Bus Voltage Angle_3-Phase Fault at Entry Bus Mabinay.
There is no problem with the buses’ frequencies as shown in
Figure 16.
Figure 16: Bus Frequencies at the Substations _3-Phase Fault at Entry Bus Mabinay.
Figure 17: Bus Real Power Loading at the Substations_3-Phase Fault at Entry Bus Mabinay.

International Journal of Applied Engineering Research ISSN 0973-4562 Volume 13, Number 6 (2018) pp. 4179-4194
© Research India Publications. http://www.ripublication.com
4190
Figure 17 shows the real power loadings before, during and
after the fault condition. The loadings have returned to
normal.
System with Wind
The transient stability study for the system with wind aims to
verify the response of the system to disturbances when it has a
localized wind generation system. A stable system must be
able to go back to its original state or to a state of equilibrium
after the clearing of faults. Figures 18-21 are sample stability
plots obtained under the different study cases where the
existing system and the system with wind show a particular
difference in behavior
Figure 18 is for 3-Phase Fault at Entry Bus Amlan.
(a)
(b)
Figure 18: Bus Voltage Angle (a) Existing System. (b) System with Wind.

International Journal of Applied Engineering Research ISSN 0973-4562 Volume 13, Number 6 (2018) pp. 4179-4194
© Research India Publications. http://www.ripublication.com
4191
Figure 19 is for 3-Phase Fault at Entry Bus Mabinay.
(a)
(b)
Figure 19: Bus Voltage Angle (a) Existing System. (b) System with Wind.

International Journal of Applied Engineering Research ISSN 0973-4562 Volume 13, Number 6 (2018) pp. 4179-4194
© Research India Publications. http://www.ripublication.com
4192
Figure 20 is for 3-Phase Fault at Bus8-4.
(a)
(b)
Figure 20: Bus Voltage Angle (a) Existing System. (b) System with Wind.
International Journal of Applied Engineering Research ISSN 0973-4562 Volume 13, Number 6 (2018) pp. 4179-4194
© Research India Publications. http://www.ripublication.com
4193
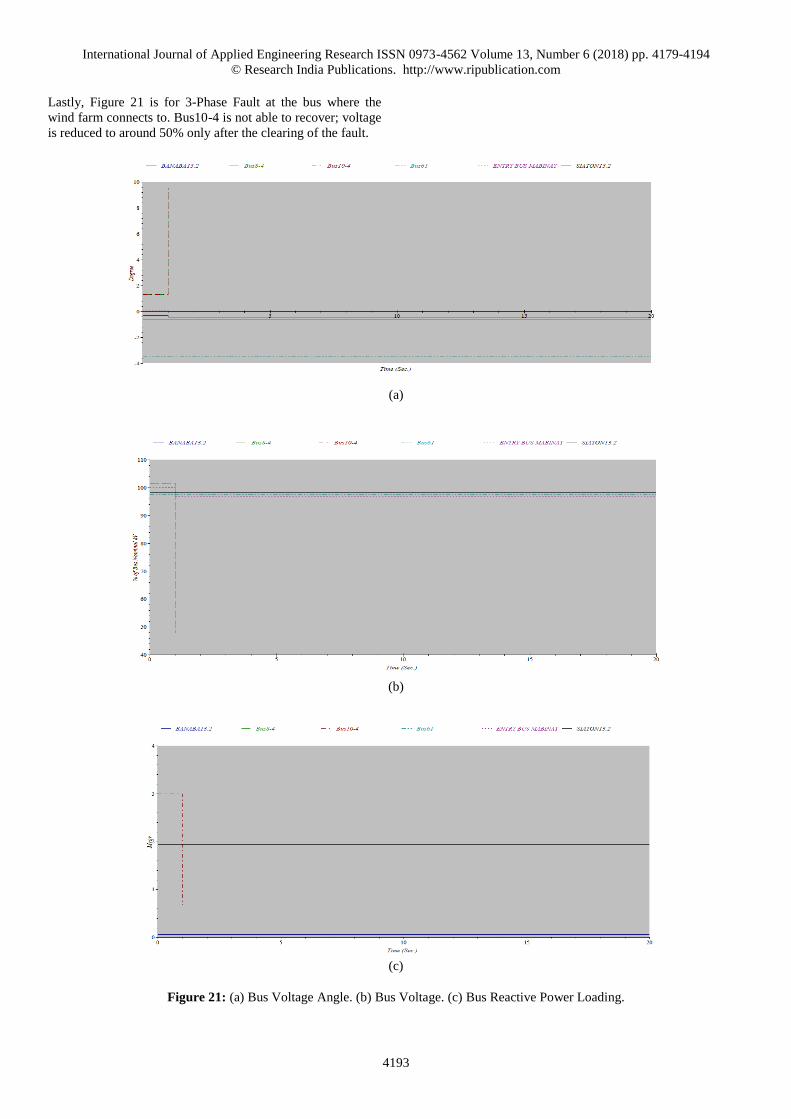
Lastly, Figure 21 is for 3-Phase Fault at the bus where the
wind farm connects to. Bus10-4 is not able to recover; voltage
is reduced to around 50% only after the clearing of the fault.
(a)
(b)
(c)
Figure 21: (a) Bus Voltage Angle. (b) Bus Voltage. (c) Bus Reactive Power Loading.

International Journal of Applied Engineering Research ISSN 0973-4562 Volume 13, Number 6 (2018) pp. 4179-4194
© Research India Publications. http://www.ripublication.com
4194
CONCLUSIONS AND RECOMMENDATIONS This investigation of the distribution system for the local
utility has shown some marginal undervoltages during the
load flow. The coming in of wind power generation can put
buses to overvoltage and such has happened as manifested by
a marginal overvoltage seen. Some cables appear overloaded.
The single line diagrams from the utility indicated the size
that was used in the simulations but the cable specifications
need to be verified further. Some overcurrent protective
devices can be in critical states during short-circuits and
faults. Transient stability simulations for both the existing and
new system with RE have generally shown buses and
parameters returning to their original states after the fault is
cleared, but not when the fault occurred at the bus where the
RE connects to; Bus10-4 parameters are not able to go back to
original values. This scenario can escalate when the
substations are in an interconnected mode. Additional
simulations are recommended. As some assumptions, despite being reasonable, are used in
this investigation, using the precise specifications for all the
devices used and intended for use in the system will help
yield better results. Further investigation of the specific
behaviors of the wind turbine generators is recommended,
too. Simulation and analysis employing additional devices,
equipment, and modifications to improve the systems
considered here would be an interesting separate piece of
work.
ACKNOWLEDGMENTS The authors would like to thank the utility manager,
Dionefred Macahig, utility engineers, Jeremiah Radoc and
Ralphrey Ampalayo, for helping provide the data used in this
study, the University of San Carlos’ Engineering Research
and Development for Technology (ERDT) Scholarship and
Silliman University for their support.
REFERENCES
[1] US Energy Information Administration. Renewable
Energy Sources - Energy Explained, Your Guide To
Understanding Energy - Energy Information
Administration 2017.
https://www.eia.gov/energyexplained/?page=renewa
ble_home (accessed July 1, 2017).
[2] US Department of Energy. Advantages and
Challenges of Wind Energy n.d.
https://energy.gov/eere/wind/advantages-and-
challenges-wind-energy (accessed September 1,
2017).
[3] Global Wind Energy Council. Global Statistics n.d.
http://gwec.net/global-figures/graphs/ (accessed
September 1, 2017).
[4] Hsu C-T, Korimara R, Cheng T-J. Power quality
analysis for the distribution systems with a wind
power generation system. Comput Electr Eng
2016;54:131–6.
doi:10.1016/J.COMPELECENG.2015.09.022.
[5] Rahmani S, Amjady N. A new optimal power flow
approach for wind energy integrated power systems.
Energy 2017;134:349–59.
doi:10.1016/J.ENERGY.2017.06.046.
[6] Qiao Z, Huang S, Li R, Guo Q, Sun H, Pan Z.
Unified Power Flow Analysis in Natural Gas and
Electricity Coupled Networks Considering the
Uncertainty of Wind Power. Energy Procedia
2016;103:322–7.
doi:10.1016/J.EGYPRO.2016.11.293.
[7] Honrubia-Escribano A, Gómez-Lázaro E, Fortmann
J, Sørensen P, Martin-Martinez S. Generic dynamic
wind turbine models for power system stability
analysis: A comprehensive review. Renew Sustain
Energy Rev 2018;81:1939–52.
doi:10.1016/J.RSER.2017.06.005.
[8] Mohod SW, Hatwar SM, Aware M V. Grid Support
with variable speed wind energy system and battery
storage for power quality. ICSGCE, 2011, p. 1032–
41.
[9] Ibrahim H, Ghandour M, Dimitrova M, Ilinca A,
Perron J. Integration of Wind Energy into Electricity
Systems: Technical Challenges and Actual Solutions.
MEDGREEN, 2011, p. 815–24.
[10] National Renewable Energy Laboratory. Land-Use
Requirements of Modern Wind Power Plants in the
United States. 2009.
[11] From Modeling to Operation 2015.
http://etap.com/why_etap.htm?lang=en-US (accessed
October 8, 2015).
[12] Load Flow Analysis (ETAP Brochure) n.d.
Related Documents


