Comparative Biochemistry and Physiology Part A 123 (1999) 95 – 110 Power spectra of ongoing activity of the snail brain can discriminate odorants A. Schu ¨tt a, *, E. Bas ¸ar a , T.H. Bullock b a Institute of Physiology, Medical Uni6ersity of Lu ¨beck, Ratzeburger Allee 160, 23538 Lu ¨beck, Germany b Department of Neurosciences, School of Medicine, Uni6ersity of California, San Diego, La Jolla, CA 92093 -0201, USA Received 14 August 1998; received in revised form 20 February 1999; accepted 3 March 1999 Abstract To test the hypothesis that different odorants are likely to cause distinctive changes in the ongoing electrical activity of populations of olfactory cells, we investigated field potentials (FP) in the Helix brain and their alterations by odorants as seen by semimicroelectrodes in an isolated preparation of the rostrum with its olfactory organ and whole central nervous system. Five pure chemicals and two natural odorants were applied as stimulants. Signals recorded both from the procerebrum (PC) and the visceral ganglion (VG) were analyzed. In the PC the five pure chemical odorants induce stimulus-specific characteristic responses, mainly in the low frequency range ( B15 Hz). Regardless of odor intensity, the frequency of the peak power of sustained induced activity is constant for each chemical: ammonia at 0.2 9B0.02 Hz; formic acid at 0.36 90.03 Hz; 2-pentanol at 0.48 90.04 Hz; 2-butanol at 0.67 90.03 Hz; ethanol at 1.31 90.09 Hz (means 995% confidence limits). These peak power frequencies, which we define as ‘odor-specific frequencies’, are confined to the low frequency range of B2.5 Hz. Those of natural odorants are: onion at 0.36 90.14 Hz and apple at 1.1 90.25 Hz. The activities evoked in the PC propagate to VG. The order of behavioural aversion determined by withdrawal reactions of the tentacles, 1% ammonia \formic acid \2-pentanol \2-butanol \ethanol, coincides with ‘the order of molecular affinity’ as well as with the sequence of peak power frequencies. There seems to be a strong correlation among behavioural valence, chemical nature of an odorant, and odor-specific frequency. The finding that, in the Helix olfactory center, odor input is processed as odorant specific low frequency FP activity may represent some general phenomena of olfactory information processing. © 1999 Elsevier Science Inc. All rights reserved. Keywords: Olfactory; Helix pomatia ; Field potentials; Frequency analysis; Behaviour 1. Introduction Odor stimulation brings neurons of olfactory centers into rhythmical activity [1,17,46]. Oscillations have been observed in the olfactory systems of various verte- brates, such as fish, frog, turtle, rodent, opossum, rab- bit, cat and human [59]. Recently, odorant-induced field potentials (FPs) have been recorded from the olfactory systems of invertebrates, such as slug (Limax ) [26 – 31,35,36], land snail [2,53,58]; locust [40,41,45]. Odor induced modulation of FP oscillations has also been observed in vertebrate olfactory systems [12,20 – 22,24]. In humans, odor-evoked as well as event-related potentials have recently been studied by a number of authors [23,37,38,42 – 44,60,64]. These authors now pre- dict that the oscillations in potential, which are modu- lated by odor-input, may have a functional role in odorant encoding. Molluscan central nervous systems exhibit sponta- neous local field potential fluctuations which are both oscillatory and non-oscillatory. When one of the large cells happens to dominate the record (or a few units, Abbre6iations: FAP, Frequency – Amplitude-Plot; EEG, electroen- cephalogram; FP, field potential; PC, procerebrum or procerebral; RMS, root-mean-square; VG, visceral ganglion. * Corresponding author. Tel.: +1-451-5004180; fax: +1-451- 5004171. E-mail address: [email protected] (A. Schu ¨ tt) 1095-6433/99/$ - see front matter © 1999 Elsevier Science Inc. All rights reserved. PII:S1095-6433(99)00045-8

Welcome message from author
This document is posted to help you gain knowledge. Please leave a comment to let me know what you think about it! Share it to your friends and learn new things together.
Transcript

Comparative Biochemistry and Physiology Part A 123 (1999) 95–110
Power spectra of ongoing activity of the snail brain can discriminateodorants
A. Schutt a,*, E. Basar a, T.H. Bullock b
a Institute of Physiology, Medical Uni6ersity of Lubeck, Ratzeburger Allee 160, 23538 Lubeck, Germanyb Department of Neurosciences, School of Medicine, Uni6ersity of California, San Diego, La Jolla, CA 92093-0201, USA
Received 14 August 1998; received in revised form 20 February 1999; accepted 3 March 1999
Abstract
To test the hypothesis that different odorants are likely to cause distinctive changes in the ongoing electrical activity ofpopulations of olfactory cells, we investigated field potentials (FP) in the Helix brain and their alterations by odorants as seen bysemimicroelectrodes in an isolated preparation of the rostrum with its olfactory organ and whole central nervous system. Fivepure chemicals and two natural odorants were applied as stimulants. Signals recorded both from the procerebrum (PC) and thevisceral ganglion (VG) were analyzed. In the PC the five pure chemical odorants induce stimulus-specific characteristic responses,mainly in the low frequency range (B15 Hz). Regardless of odor intensity, the frequency of the peak power of sustained inducedactivity is constant for each chemical: ammonia at 0.29B0.02 Hz; formic acid at 0.3690.03 Hz; 2-pentanol at 0.4890.04 Hz;2-butanol at 0.6790.03 Hz; ethanol at 1.3190.09 Hz (means995% confidence limits). These peak power frequencies, which wedefine as ‘odor-specific frequencies’, are confined to the low frequency range ofB2.5 Hz. Those of natural odorants are: onionat 0.3690.14 Hz and apple at 1.190.25 Hz. The activities evoked in the PC propagate to VG. The order of behavioural aversiondetermined by withdrawal reactions of the tentacles, 1% ammonia\ formic acid\2-pentanol\2-butanol\ethanol, coincideswith ‘the order of molecular affinity’ as well as with the sequence of peak power frequencies. There seems to be a strongcorrelation among behavioural valence, chemical nature of an odorant, and odor-specific frequency. The finding that, in the Helixolfactory center, odor input is processed as odorant specific low frequency FP activity may represent some general phenomena ofolfactory information processing. © 1999 Elsevier Science Inc. All rights reserved.
Keywords: Olfactory; Helix pomatia ; Field potentials; Frequency analysis; Behaviour
1. Introduction
Odor stimulation brings neurons of olfactory centersinto rhythmical activity [1,17,46]. Oscillations have beenobserved in the olfactory systems of various verte-brates, such as fish, frog, turtle, rodent, opossum, rab-bit, cat and human [59]. Recently, odorant-inducedfield potentials (FPs) have been recorded from the
olfactory systems of invertebrates, such as slug (Limax)[26–31,35,36], land snail [2,53,58]; locust [40,41,45].Odor induced modulation of FP oscillations has alsobeen observed in vertebrate olfactory systems [12,20–22,24]. In humans, odor-evoked as well as event-relatedpotentials have recently been studied by a number ofauthors [23,37,38,42–44,60,64]. These authors now pre-dict that the oscillations in potential, which are modu-lated by odor-input, may have a functional role inodorant encoding.
Molluscan central nervous systems exhibit sponta-neous local field potential fluctuations which are bothoscillatory and non-oscillatory. When one of the largecells happens to dominate the record (or a few units,
Abbre6iations: FAP, Frequency–Amplitude-Plot; EEG, electroen-cephalogram; FP, field potential; PC, procerebrum or procerebral;RMS, root-mean-square; VG, visceral ganglion.
* Corresponding author. Tel.: +1-451-5004180; fax: +1-451-5004171.
E-mail address: [email protected] (A. Schutt)
1095-6433/99/$ - see front matter © 1999 Elsevier Science Inc. All rights reserved.PII: S 1 0 9 5 -6433 (99 )00045 -8

A. Schutt et al. / Comparati6e Biochemistry and Physiology, Part A 123 (1999) 95–11096
well synchronized), the broad spikes are likely to bequite periodic, with a slowly shifting frequency; thegreat energy in the afterpotentials add a large compo-nent to the power spectrum in theB3 Hz bands. Whenthe recording locus avoids such units, as in most of therecords analyzed here, it is usual to observe no oscilla-tion standing out from the wideband activity. Peaks inthe power spectra are usually not in a consistent posi-tion (frequency) in successive spectra. But interestingexceptions will be reported here. Electrical stimulationevokes in these ganglia slow waves with frequencycomponents comparable to delta, theta, alpha, beta andgamma bands of mammalian EEG, that is energythroughout a broad range fromB2 to\30 Hz, thoughnot consistently peaked at fixed frequencies.
Studies with a variety of species (snail, fish, cat andhuman) have compared the similar frequency compo-nents of stimulus-induced brain electrical activities, tolook for shared basic aspects of information processingin the brain [8,10,14,15,52,54,55,57].
The aims of the present study were: first, to test thehypothesis that different odorants can elicit distinctivechanges in the ongoing electrical activity of populationsof cells; second, to relate the changes to behaviour in anattempt to find a candidate odor-encoding mechanism.We apply the technique of extracellular recording usingsemimicroelectrodes to measure population responsesof the Helix procerebral lobe and the visceral ganglionas field potentials. The analytical procedure is based onfrequency analysis and allows detection of subtlechanges of amplitudes of frequency components.
This study consists of three parts. First, we character-ized the patterns of odor-elicited changes in the pro-cerebrum (PC). Second, we repeated the same in thevisceral ganglion (VG). Third, to elucidate the be-havioural relevance of these induced activity patterns,we determined degree of aversiveness for each stimulantin active snails.
2. Materials and methods
2.1. Preparation
The preparation of the isolated whole central nervoussystem with the intact antennal sense organs was re-moved from 15–30 g Helix pomatia (Dealer: Exoterra,Deringen, Germany). The animals were anesthetized byimmersing in crushed ice for 40 min, after which thehead and foot part was quickly separated from the restof the body. The entire central nervous system was thenisolated together with the superior tentacles and theolfactory nerves. The whole cerebral ganglia includingthe PC lobe were kept intact, but the VG wasdesheathed. The whole preparation was then trans-ferred to the experimental chamber and fixed by hold-
ing the subesophageal ring lightly by a fine pin stuck inthe silicone rubber bottom. The chamber contained 0.5ml of a modified snail saline [61](130 mM NaCl, 4.5mM KCl and 9 mM CaCl2, buffered with 5 mMHEPES-Na and adjusted to pH 7.5 with HCl) and waskept at 1991oC. The preparation was immersed insaline except the receptor surface of one tentacle ipsilat-eral to the recording site.
2.2. Recording
For recording, two stainless steel semimicroelectrodes(Rhodes Medical Instruments SNE-300) with a shaftdiameter of 100 mm (impedanceB100 kohm at 1000Hz) were used. The electrodes were both varnished tothe tip and the recording was carried out against adistant electrode in the bath. For PC, the recordingelectrode was positioned directly on top of the sheath,away from the entrance of antennal nerves. For thevisceral ganglion, the electrode was placed on thedesheathed surface, in the central to lower part. Theelectrode was placed on the surface carefully avoidingany position where it recorded activity dominated byone or a few large unit spikes. These large unit spikesmay respond to an adequate stimulus by large and longlasting afterpotentials in both directions (afterdepolar-ization and afterhyperpolarization) having a significantpower and frequency components going down toB1Hz. An important caveat is that we do not have anyassurance in this molluscan preparation that the poten-tials all come from neurons; tissue near the electrodesmay include smooth muscle and connective tissuewhose possible contribution, especially to slow poten-tials, cannot presently be assessed. The activity wasconstantly monitored on a digital oscilloscope.
2.3. Data processing
For data acquisition and analysis, we used a softwarepackage specially developed by BrainData® (Lubeck,Germany).
After wide-band filtering at 0.1–100 Hz, the analogsignals, 18 000–36 000 times amplified, were continu-ously digitized at 200 Hz in epochs of 2048 samples(10.240 s). For each experimental condition, 20epochs=204.8 s were recorded without interval be-tween epochs. The digitized data were stored in acomputer and subsequently transferred to an opticaldisc for off-line data processing. Data analysis, per-formed off-line, used another computer, and includedpower spectra (0.1 Hz resolution) for single epochs toobserve changes of transient activities and the ‘Fre-quency-Amplitude-Plot (FAP)’, G( jv), of the averagedsignals based on all 20 epochs.

A. Schutt et al. / Comparati6e Biochemistry and Physiology, Part A 123 (1999) 95–110 97
2.4. Frequency–Amplitude-Plot (FAP)
A power spectrum can be applied as an analyticaltool for a system which fluctuates, such as the EEG organglionic activities. When odorants are administeredto the sense organs, the ongoing field potentials of thesnail ganglia change patterns and these can be charac-terized in frequency and amplitude.
We used the ‘method of transient response analysis’(Frequency–Amplitude Characteristics measurement)to characterize these transient responses in frequencyand amplitude [3,4].
The Frequency–Amplitude Characteristics of a fluc-tuating system can be described by the following equa-tion. We call the resulting plot, which depicts eachfrequency and its amount of activity as relative ampli-tude, the FAP.
G( jv)=&�
0
x(t) exp(− j 2pft) dt=FAP
where x(t)= the time history of the pattern to beanalysed, G( jv)=complex representation of theFourier-transformed time series, v=2pf, the angularfrequency, f= frequency of the input signal, and j=−1, the imaginary unit.
FAP is like a filter which, if applied to white noise,would yield the observed power spectrum. FAP at-tempts to emphasize the relative heights of peaks ineach sample de-emphasizing their absolute power bynormalizing to the power of the lowest frequencypassed by our filter. We do not claim this value has aunique comparability across samples of activity andtherefore, the zero of the ordinate is arbitrary andfluctuates, relative to all other frequencies, dependingon the amount of very slow potential shift (0.1 Hz and,with some attenuation, lower frequencies) at that time.
In an attempt to define the properties of the seem-ingly quasi-oscillations of the snail ganglia, we appliedthis method of FAP measurement. For this purpose weused a spectral averaging method (averaging in thefrequency domain): We first computed FrequencyCharacteristic of each epoch (10.24 s) and then theaverage of all 20 epochs (=204.8 s) as average FAP.To determine the peak power frequency, we subtractedthe average FAP of the control from that of the re-sponse, manually plotted the difference and estimatedthe frequency, at which the power increase was largest.When the increase was strong, the peak power fre-quency matched that of the ongoing activity duringodor exposure.
The low frequencies, including 0.1 Hz and lowerfrequencies, that are present even if attenuated by thefilter, will be in random phase during the 10 s epochand so the estimate of DC potential jumps aroundaccordingly. The fluctuating values at the ordinate thusreflect the mean voltage over the 20 ten s epochs. The
main effect of the random ‘DC’ is that the position ofthe zero on our ordinates is ‘arbitrary’—in the sensethat it has no interpretable significance for us andfluctuates by chance between curves or figures. Theaveraging starting at essentially random times obvi-ously attenuates higher frequencies faster than lowerfrequencies.
We also plot power spectra of 20 individual epochs,10.24 s each, for each trial, study the time evolution ofthe spectral pattern, visually estimate the affected fre-quency range as well as the peak power and comparethem with those detected in the corresponding FAPcomputed from the average of all the 20 trials (204.8 s).
2.5. RMS-6oltage
The time signals were also digitally filtered in differ-ent frequency bands. The pass-bands of 0.5–15 Hz or0.1–15 Hz were arbitrarily chosen for the evaluation ofRoot–Mean–Square (RMS)-voltage (mV), since olfac-tory response occurs mainly in the rangeB15 Hz. Anadditional pass-band of 15–50 Hz was also applied todetermine RMS-voltage of the high frequency compo-nent of VG. RMS-voltage (mV) of the filtered signals ofeach epoch, XRMS,
XRMS=�1
N%
N−1
N=0
Xn2�1/2
and the mean RMS-voltage of all 20 epochs were thencomputed. Fourier transform and digital filters are asdescribed in Basar [3].
2.6. Odor response
Control activity was recorded just before each seriesof odor tests. The odor was applied by placing a pieceof filter paper, stuffed into a glass barrel (3–4 mm indiameter) and lightly soaked with the odorant, 1 to 2mm away from the neuroepithelium. A sample of 20epochs (=204.8 s) was recorded every 5 min startingimmediately. The stimulus was then removed and twoto three additional recordings were made. In some casesrecordings were continued for some time to observe thechanges much longer. Odorants were administered atleast at four different concentrations (from just abovethreshhold to submaximal) to show that odor intensitywas not so strong as to cause nociceptive componentsof response. (For all odorants, the effects of maximalintensities were also investigated for the purpose ofcomparison.) The intensities of odorants administeredwere: ethanol (99.8%):undiluted to 1:64; 2-butanol:undiluted to 1:64; 2-pentanol: undiluted to 1:64; formicacid: undiluted to 1:64; ammonia: 1 to 0.01%. A recov-ery time of 10–15 min (or till the spontaneous dis-charge seemed to have returned to normal) was allowedbetween trials.

A. Schutt et al. / Comparati6e Biochemistry and Physiology, Part A 123 (1999) 95–11098
2.7. Degree of a6ersion
To estimate the degree of aversion, we tested theodorants described above on a number of active snails,which were later used in the in vitro experiments.
First, as the parameter for degree of aversion, thedistance between the superior tentacles and the odor-ant, at which the tentacles were quickly withdrawn, wasestimated. Formic acid, 2-pentanol, 2-butanol, ethanol(99.8%), onion juice and apple juice were applied with-out dilution. For ammonia we chose 1% solution. Thespeed, at which the odor source was manually movedfrom a distance, was kept at approx. 3–4 cm s−1. Weobserved by eye when the tentacles withdrew and wherethe source was at that moment. Of course, a latentperiod of unknown length probably varies with sub-stance and concentration, so the distance was actuallygreater when the snail sensed the average stimulus. Weallowed a few minutes of rest between the trials.
Second, we measured latency in terms of visiblewithdrawal of the tentacles as the parameter of aversionto examine whether this parameter was related to thatestimated in distance. An odor source, a piece of filterpaper soaked with an odorant, was shielded in a micro-tube and placed ca. 1 cm from the tentacle. The shield-ing lid was quickly opened and the latency wasdetermined. The chemicals were undiluted except am-monia which was at 1%. Several trials were made foreach odorant with two of the active snails describedabove. An interval of 5 min or longer was allowedbetween trials.
2.8. Statistical e6aluation
To give confidence in the results, we calculated 95%confidence limits for the average according to ‘Student’[62].
3. Results
3.1. Description of acti6ity
We consider that the boundary between ‘regular’ and‘irregular’ fluctuation is arbitrary and varies accordingto the frame of reference. In our usage variation ofperiod less than ca. 1
2 of an octave justifies the term‘oscillation’. We point out that according to this defini-tion the snail activities are mostly non-oscillatory (Fig.1a,b; Fig. 2a,b; Fig. 3a,b). In the present study weavoided such recording sites where large, rhythmicspike-like discharges were conspicuous. The type ofactivity observed in the PC lobe and VG may be calleda quasi-oscillation with a whole octave of fluctuation.
To control any noise from the recording system, wealso measured ‘bath controls’ with one electrode on an
inactive preparation and another in bath fluid. RMS-voltages obtained on four different days were 1.4–1.8mV in the 0.5–15 Hz band andB1.0 mV in the 15–30Hz range.The intrinsic PC and VG activities werenormally higher than the bath controls.
When odorant stimulation was applied to the senseorgan, the activity pattern was distinctively modulatedin frequency and amplitude both in PC and VG. Wedefine the change from control as the ganglionic ‘re-sponse’. This often took place as intermittent, strongspike-like discharges and we define this type of highactivity as ‘bursts’.
In an attempt to characterize these activities, werecorded the responses of the ganglia to different odor-ants and analyzed them in various parameters. Asstimulants, we applied five chemicals of different prop-erties and, in case of PC, additionally two naturalodorants, onion and apple. The results are summarizedin Table 1 and Table 2. We point out notable featuresof the activities in the following.
3.2. Procerebrum
3.2.1. Acti6ity in the absence of odorThe PC lobe showed intrinsic FP fluctuations mainly
in the low frequency bandB15 Hz. The frequencymaxima of controls (the first of a series of experimentsmade with each of twenty preparations) varied between0.2 and 1.3 Hz, but mostly between 0.4 and 0.7 Hz(0.5490.11 Hz, 95% confidence limits). The powerdecreased with increasing frequency (15 dB/octave).The RMS-voltage of the ongoing activity in the 0.5–15Hz range was most often less than 4 mV, occasionallyreaching 7 mV.
3.2.2. Odorant-induced acti6ity
3.2.2.1. Ethanol. As shown in Table 1 and Fig. 3,ethanol evoked in the PC, regardless of concentration,wide-band activity in the 0.1–10 Hz range with peakpower frequencies at 1.0–2.2 Hz (1.3190.09 Hz, 95%confidence limits). To show consistency, all observa-tions with typical responses are shown together (Fig.4a). The pattern of the peak power frequencies wasvirtually not influenced by odor intensity. Notable wasthat the elevation of the 0.5–4 Hz activity was usuallyaccompanied by a suppression of the 0.1–0.4 Hz activ-ity (Fig. 1c, Panel 3). A typical example of the responseis presented in Fig. 1a–c. Activity increased moststrongly between 0.5 and 6 Hz with peak power at 1.5Hz; another almost equally prominent peak was at 0.7Hz (Fig. 1c, Panel 3, 5 min). It remains to be investi-gated, however, whether or not this frequency is thesame as the robust spontaneous oscillation at 0.7 Hzreported in Limax PC [25]. Theta-rhythm (5–8 Hz) waselicited 9 min after stimulus onset (Fig. 1b,c, Panels 4).

A.
Schutt
etal./
Com
parati6eB
iochemistry
andP
hysiology,P
artA
123(1999)
95–
11099
Table 1Odorant-induced ongoing activities in the Helix procerebruma
Peak power freq.Odorant Range % Change of RMS-voltage (0.5–15 Hz)With LatencyTotal DurationConcentrationparticular Mean (range)(Hz) (min)(Hz) (min)responses
c da b
7; 15 1.0–2.2 0.5–10 +159 (−17, +590) Imm.–23 0.5–\95Ethanol Undiluted 9; 281.0–1.5 0.1–7 +27 (−32, +125) Imm.–5 2.5–2053;1: 4 4; 81.0–1.5 0.1–10 +25 (−7, +107) Imm.–15 5–\501: 8 4; 9 4; 61.0–2.0 0.1–8 +9 (−11, +16) Imm.–30 5–1063;113;1: 16
1; 3 1.0 0.1–10 +4 (−10, +18) 9–10 5–101: 32 1; 60.7 0.1–15 +47 (+17, +132) Imm–25 7–\1562-Butanol 3,63;Undiluted0.7 0.1–10 +30 (−7, +87) Imm–9 2–231: 8 4; 5 4; 5
0.5–0.7 0.1–10 +25 (+5, +45) 1.5–4 7–1022;22;1: 160.6–0.7 0.1–8 −2 (−31, +16) Imm.–22 5–151: 32 4; 7 4; 6
0.7 0.1–10 +6 (−9, +17) 2–10 0.5–1532;1: 64 2; 30.5–0.6 0.1–6 +44 (+19, +112) Imm.–1 5–\222-Pentanol Undiluted 4; 5 4; 50.3–0.6 0.1–3.5 +22 (+5, +37) Imm.–10 10–\2553;53;1: 8
1: 16 5 0.3–0.7 0.5–2 +2 (−5, +5) Imm. 0.5–303; 5 3;0.3–0.6 0.1–4 +207 (+0, +617) Imm.–10 5–2033 3;1: 32 3;
51: 64 0.2–0.6 0.1–4 +5 (+0, +13) Imm.–9 5–154; 5 4;4Undiluted 0.3–0.4 0.1–3.5 +285 (+38, +745) Imm. 8–102; 4 2;Formic acid
0.4–0.5 0.1–2.5 +835 (+25, +2218) Imm.–2 \1532;32;1. 211. 4 0.4 0.1–15 +271 Imm. \101; 1 1;
0.2–0.6 0.1–15 +77 (−24, +500) Imm.–5 5–402910;1: 8 10; 290.3–0.4 0.1–\50 +53 (−18, +605) Imm.–9 5–\301: 16 5, 15 5, 140.3–0.4 0.1–6 +32 (+0, +100) Imm.–15 2.5–2542;52,1: 32
1; 3 0.3–0.5 0.1–10 + 4 (+0, +11) Imm. 151; 31: 640.2 0.1–25 +96 (+25, +193) Imm. \104Ammonia 2;42;1%0.2 0.1–25 +26 (+18, +41) Imm. \100.1% 3; 4 3; 40.2 0.1–3 +5 (+5, +21) Imm. \1011;11;0.01%
0.2–0.6 0.1–7 +7 (+0, +21)Onion Imm. 10–\153; 9 3; 81.2 0.5–2.5 +0 5 511;Apple 1; 1
a (a) Number of all preparations tested; (b) number of all trials made with all the preparations; (c) number of preparations and (d) number of trials made with the preparations, in whichparticular responses were observed. Peak power frequency (Hz) (estimated from the single power spectra and average FAPs, weighting them on the curves obtained by subtracting the FAP curveof control from that of responses) varied within the range shown. Range (Hz) indicates the frequency range, in which power changed. That range covered those of all particular responses varyingintra- and interindividually. (cf. Examples for ethanol and formic acid are shown in Fig. 5). Note that, in spite of a large variation, percent change of the amplitude (RMS-voltage in the 0.5–15Hz range; for ammonia at 0.1–15 Hz) seemed to suggest a certain dependency on odor intensity. The rate of percent change appeared to be different for each odorant and may also be consideredto be related, not only to odor quantity, but to odor quality.
A.
Schutt
etal./
Com
parati6eB
iochemistry
andP
hysiology,P
artA
123(1999)
95–
110100
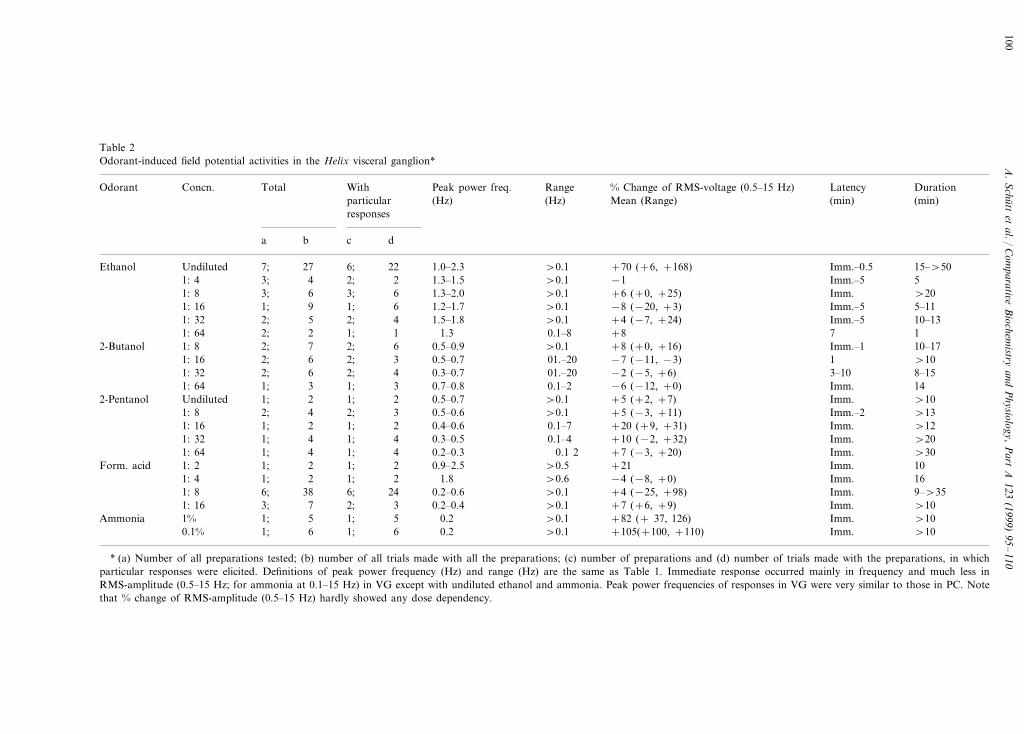
Table 2Odorant-induced field potential activities in the Helix visceral ganglion*
Concn.Odorant Peak power freq. Range % Change of RMS-voltage (0.5–15 Hz) Latency DurationTotal With(Hz) (min)(Hz) Mean (Range)particular (min)
responses
a b c d
1.0–2.3 \0.1 +70 (+6, +168) Imm.–0.56; 15–\50Ethanol 22277;Undiluted1: 4 2 1.3–1.5 \0.1 −1 Imm.–5 53; 4 2;
1.3–2.0 \0.1 +6 (+0, +25) Imm. \201: 8 3; 6 3; 61.2–1.7 \0.1 −8 (−20, +3) Imm.–5 5–1161;91;1: 161.5–1.8 \0.1 +4 (−7, +24) Imm.–5 10–131: 32 2; 5 2; 4
1.3 0.1–8 +8 7 111;22;1: 6461: 8 0.5–0.9 \0.1 +8 (+0, +16) Imm.–1 10–172; 7 2;2-Butanol
0.5–0.7 01.–20 −7 (−11, −3) 1 \1031: 16 2;62;41: 32 0.3–0.7 01.–20 −2 (−5, +6) 3–10 8–152; 6 2;
1; 3 0.7–0.8 0.1–2 −6 (−12, +0) Imm. 141;1: 64 30.5–0.7 \0.1 +5 (+2, +7) Imm. \1021;2-Pentanol Undiluted 1; 20.5–0.6 \0.1 +5 (−3, +11) Imm.–2 \131: 8 2; 4 2; 30.4–0.6 0.1–7 +20 (+9, +31) Imm. \1221;21;1: 16
41: 32 0.3–0.5 0.1–4 +10 (−2, +32) Imm. \201; 4 1;0.2–0.3 0.1 2 +7 (−3, +20) Imm. \3041: 64 1;41;
21: 2 0.9–2.5 \0.5 +21 Imm. 101; 2 1;Form. acid1; 2 1.8 \0.6 −4 (−8, +0) Imm. 161;1: 4 2
0.2–0.6 \0.1 +4 (−25, +98) Imm. 9–\352438 6;1: 8 6;31: 16 0.2–0.4 \0.1 +7 (+6, +9) Imm. \103; 7 2;
0.2 \0.1Ammonia +82 (+ 37, 126)1% Imm. \101; 5 1; 50.2 \0.1 +105(+100, +110) Imm. \1061; 1;60.1%
* (a) Number of all preparations tested; (b) number of all trials made with all the preparations; (c) number of preparations and (d) number of trials made with the preparations, in whichparticular responses were elicited. Definitions of peak power frequency (Hz) and range (Hz) are the same as Table 1. Immediate response occurred mainly in frequency and much less inRMS-amplitude (0.5–15 Hz; for ammonia at 0.1–15 Hz) in VG except with undiluted ethanol and ammonia. Peak power frequencies of responses in VG were very similar to those in PC. Notethat % change of RMS-amplitude (0.5–15 Hz) hardly showed any dose dependency.

A. Schutt et al. / Comparati6e Biochemistry and Physiology, Part A 123 (1999) 95–110 101
3.2.2.2. 2-Butanol. This higher alcohol induced a differ-ent response in the PC compared with ethanol andelevated activity mainly in the frequency rangeB8 Hz(occasionally reaching 10–15 Hz) with the maximalpeak at �0.7 Hz (0.6790.03 Hz, 95% confidencelimits) at all concentrations and in all preparations
(Table 1 and Table 4). As with ethanol, diluted butanolseemed to cause a decrease of amplitude in some cases.
3.2.2.3. 2-pentanol (amyl alcohol). PC responded to thisodorant with elevation of a lower frequency rangecompared with either ethanol or 2-butanol, i.e. B4 Hz
Fig. 1. Ethanol-induced response of the procerebrum (Preparation No. 88). This is a typical example of the response sequence which we observedin more than 50% of the trials. (a) Time signals from an experiment, in which 0.5–5 Hz burst activity occurred. In each panel an epoch of 10s is shown. From bottom: control (before stimulus); ca. 2, 6.5 and 9 min after stimulus onset. A multi-peaked fluctuation occurred starting around5 min with dominance around 1.5 Hz and elevation of amplitude. In a few minutes the pattern of activity changed shifting the dominant frequencytoB1 Hz and increasing activity around 6 Hz. (b) The corresponding power spectra of single epochs. From bottom: control (before stimulus),immediately, 5, 9 and 14 min after stimulus onset (stimulus removed at 14 min). Burst activity, occurring in the 0.5–5 Hz range 5 min afterstimulus, showed numerous frequency peaks that seemed to change positions in every epoch. The pattern of activity then changed in a few minutesshifting the frequency center toB1 Hz and at the same time elevating activity around 6 Hz, and finally subsiding altogether. (c) The correspondingaverage FAPs. The order of presentation is the same as (b). Note that the FAP of the burst activity at 5 min after stimulus depicts 1.5 Hz as thedominant peak and 0.7 Hz as almost equally strong peak. The change of activity 9 min after stimulus onset was here again visible as the shiftof dominance toB1 Hz.

A.
Schutt
etal./
Com
parati6eB
iochemistry
andP
hysiology,P
artA
123(1999)
95–
110102
Fig. 2. Ethanol-induced response of the visceral ganglion. The same preparation (No. 88) as Fig. 1. This is a typical response sequence which we observed in more than 70% of the trials. (a)Time signals from an experiment where burst oscillation of 1.5 Hz was intermittently elicited. Each panel is an epoch of 10 s. From bottom: control, 2.5 min, 5 min and 12.5 min after stimulusonset (stimulus was removed at 10 min after stimulus onset); (b) The corresponding power spectra of single epochs. Burst activity with strongest power around 1.5 Hz was elicited in intervalsfor 15 min and lasted longer than 50 min with frequency shifting to 2 Hz and power decreased; (c) The corresponding average FAPs. Ethanol elevated the 0.6–6 Hz activity peaking around 1.5Hz most strongly the first 15 min and then a relatively robust 2 Hz activity dominated the following 45 min.

A. Schutt et al. / Comparati6e Biochemistry and Physiology, Part A 123 (1999) 95–110 103
Fig. 3. Formic acid-induced response of the procerebrum. (a) Typicaltime signal of an epoch (10 s). From bottom: control; 1, 10 and 15min after stimulus onset. (b) The corresponding power spectra ofsingle epochs. Burst activity with many sharp peaks occurred inter-mittently. (c) The corresponding average FAPs. Elevation of 0.4 Hzactivity was clearly visible in the response.
3.2.2.4. Formic acid. The frequency range of the in-duced activity lay below 5 Hz with peak power frequen-cies at 0.3–0.5 Hz (0.3690.03 Hz, 95% confidencelimits) which seemed to be independent of the stimulusconcentration (Fig. 4b and Table 4). Typical records ofthe response are shown in Fig. 3a. Note that a slowfluctuation occurred starting at 1 min after stimulusonset bursting strongly at 10 min. The early response ofPC to formic acid was most evident in the increase ofpower in the lower frequency range (B0.7 Hz) with thepeak power at 0.4 Hz (Fig. 3a–c, Panels 2). The laterresponse burst (Fig. 3a–c, Panels 3) reached 10 Hz byits increase of power, but the strongest increase tookplace in the rangeB1.0 Hz with maximal frequency atthe same 0.4 Hz (Fig. 3c, Panel 3).
3.2.2.5. Ammonia. This chemical, found in nature as ametabolic product, induced an activity which was con-spicuous in the following points. (a) The frequencyrange of the response varied widely fromB0.7 toB25Hz depending on the preparation and was, withoutexception, characterized by the maximal peak at 0.29B0.02 Hz. (b) Latency was always very short. (c) At allconcentrations the induced 0.2 Hz activity decreasedwithin 20–30 s. But in spite of the adaptation, theresponse activity in the other frequency range lastedlonger than 10 min.
3.2.2.6. Onion. In all preparations procerebral responseoccurred immediately, but largely in frequency. Whenfreshly obtained onion juice was applied to the tentacle,activity below 1 Hz was enhanced with average FAPsdepicting elevation of power between 0.2 and 0.6 Hz(0.3690.14 Hz, 95% confidence limits; Table 1 andTable 4). It is noteworthy that this onion-induced peakpower frequency was very similar to that of formicacid, though the former was less aversive than the latter(Table 3).
3.2.2.7. Apple. This fruit is strongly favoured by thesnail as food and stimulation with the fresh juice ac-cordingly induced different response from onion (Table1, Table 3 and Table 4): immediate elevation of activitytook place mainly in the 0.3–4 Hz band with the peakpower frequencies varying between 0.9 and 1.3 Hz(1.1090.25 Hz, 95% confidence limits). Both apple andethanol (525%), attractive to the snail (cf. Locomo-tion behavior), notably had peak power frequencies\1Hz.
3.3. Visceral ganglion
3.3.1. Acti6ity in the absence of odorIntrinsic activity of VG was more spiky (Fig. 2a,
bottom) than PC (Fig. 1a, bottom). It depended on thepreparation and exact placement of the electrodes, but
with power maximum at �0.5 Hz (0.4890.04 Hz,95% confidence limits; Table 1 and Table 4). Amylalcohol induced fluctuations at all concentrations andin all preparations.

A. Schutt et al. / Comparati6e Biochemistry and Physiology, Part A 123 (1999) 95–110104
the activity was most often with a moderate amount ofspiking (a power peak below 10 Hz) and, occasionallywith a high amount of bursts (one peak atB50 Hz andanother between 50 and 150 Hz) [52,54]. Under thepresent digitization, the power of the activity of VGextended to at least up to 50 Hz and was higher thanthat of the PC lobe. This was also evident in theRMS-voltages: in the 0.5–15 Hz band, RMS-voltage ofVG was 2.6–9.1 mV (that of PC was 1.5–7.0 mV); in the15–50 Hz band, RMS-voltage of VG was 2.7–8.1 mV(that of PC was 0.7–1.0 mV).
3.3.2. Odorant-induced acti6ityVG controls the digestive as well as sexual organs
and is certainly expected to be involved in olfactoryinformation processing. Although the neuronal path-way from PC to VG is not known, odor input markedlyaltered activity. The responses of the VG shared simi-larity with those of PC in frequency. The results aresummarized in Table 2. We state some notable featuresof the responses in the following.
3.3.2.1. Ethanol. Olfactory stimulation with ethanolevoked strong FP fluctuations which were characterizedby frequency peaking at 1.0–2.3 Hz (1.6090.08 Hz,95% confidence limits; Table 2 and Table 4). Typicalrecords from one experiment are shown in Fig. 2a.Ethanol elicited burst activity enhancing nearly thesame frequency component as that in PC lobe of thesame preparation (cf. Fig. 1a–c and Fig. 2a–c), butwith higher power at �2 Hz. These intermittent burstssome minutes apart are largely due to quite regularspike discharges of a single unit or a synchronizedgroup of them. Any periodicity in the response was notmaintained for long. The typical voltage versus timerecords of the response (Fig. 2a, Panels 2–4) alsoclearly depict these frequency components. It is note-worthy that the �2 Hz activity occurred intermittently
for as long as 52 min in this particular preparationdecreasing its power with time. Interestingly, in VG,this induced �2 Hz fluctuation lasted long withoutshifting the frequency to below 1 Hz. On the contrary,in PC, the ethanol-induced activity either diminishedafter 10–15 min or shifted the frequency center toB1Hz.
3.3.2.2. 2-Butanol. The responses induced in VG by thishigher alcohol were not so conspicuous as in PC,differing in the following respects. (i)The stronger theintensity, the higher the frequency range extended to.(ii) The peak power frequencies of response were not sostrongly consistent as in PC, fluctuating slightly be-tween 0.3 and 0.9 Hz (0.6590.07 Hz, 95% confidencelimits; Table 4). (iii) Response in amplitude hardlydepicted a possible dose dependency, such as observedin PC.
3.3.2.3. 2-Pentanol (amyl alcohol). As observed withethanol or 2-butanol, the stronger the stimulus intensi-ties (undiluted and 1:8), the higher the frequency rangeof the induced activities. The peak power frequencies ofthe response activities were 0.4–0.7 Hz (0.4390.08 Hz,95% confidence limits; Table 4). Response in amplitudeappeared to be less conspicuous in VG compared withPC.
3.3.2.4. Formic acid. Spectral analyses depicted re-sponses with peak power mainly at 0.4 Hz, but occa-sionally at 1.5–2.5 Hz. The response had smallerincrease of theB0.5 Hz component compared with thatof PC and varied more intra- and inter-individually.The immediate response took place mainly in alterationof frequency and did not appear to be correlated withodorant intensities. The induced activity with maximalpeak at 0.4 Hz, for instance, lasted at least for 5 minand sometimes longer than 20 min (Table 2).
Table 3Degree of behavioural aversion determined in different parameters
IntensityOdorant Stimulus-tentacle-distance at withdrawal reactiona Latency of tentacle withdrawal reaction
(cm) a, b (s) a, b
Undiluted 1.090.5Ethanol* (5, 5) 6.190.9 (2, 13)(10, 10) (2, 11)2.990.6Undiluted2-Butanol 3.390.6
Undiluted 5.391.12-Pentanol (11, 11) 1.990.5 (2, 11)Formic acid Undiluted 6.491.0 (5, 5) 51 (2, 6)Ammonia 1% 8.591.0 (5, 7) B1 (2, 8)
Undiluted 3.590.6Onion juice (6, 15)Apple juice** Undiluted N.W.† (1, 1)
a The values of stimulus–tentacle distances and latencies are means995% confidence limits. (a) Number of snails; (b) number of trials.* When ethanol was diluted to 1:4, the snail did not withdraw the tentacles at the distance of 1 mm at least for 5 min.** The snail continuously sensed the odor source with the tentacles stretched to the touching distance.† N.W., no withdrawal. Note that the degree of aversion estimated in stimulus–tentacle distance appeared to be linearly related to that estimated
in latency, in spite of estimates by eye and manual treatment of odor source.

A. Schutt et al. / Comparati6e Biochemistry and Physiology, Part A 123 (1999) 95–110 105
Fig. 4. Induced field potential activities of the procerebrum at differ-ent odorant intensities. (a) Ethanol-induced response: the affectedfrequency range of an observation and its peak power frequency (]1Hz), marked on the horizontal line. In about 33% of observations,elevation of activity occurred at\0.5 Hz; (b) Formic acid-inducedresponse. Elevated activity went down to 0.1 Hz without exception,which was different from that of ethanol. Note that induced activitiesseldom reached beyond 15 Hz in both cases and that in 56% ofethanol-induced activities and in 24% of formic acid-induced activi-ties the frequency range extended beyond 5 Hz.
power frequencies, which lay below 2.5 Hz, seemed tobe constant regardless of preparations and intensitiesand hence may be specific for the odorant. (b) Peakpower frequencies induced in PC and those induced inVG were either the same or very similar, but theamplitude of theB15 Hz band was smaller in PC thanthat in VG.
3.4. Beha6ioural response
3.4.1. Locomotion beha6iourTo examine attractiveness of etanol and apple, we
performed experiments with two active snails by ob-serving locomotion behavior. We presented an activesnail a piece of filter paper soaked with 25% ethanol ata distance of 6 cm from the tentacles. The snail steadilycrawled towards the odor source and remained, for atleast 5 min, at such a position that the extended tenta-cles were within 1 mm reach of the odorant. This resultsuggested that the snail was attracted by 25% ethanol.Undiluted ethanol was, however, repellent to the snailto a certain degree: it reacted with the tentacle with-drawal reflex at a distance of 1.090.5 cm or with alatency of 690.9 s (Table 3). In another similar exper-iment with a piece of fresh apple, it was shown that thesnail was strongly attracted by the fruit moving steadilyforward with the tentacles extended and chewed on itfor a long time.
3.4.2. Degree of a6ersionTo see how differently the snail reacts to each odor-
ant, we also estimated the degree of aversion for eachodorant, with visible withdrawal of the tentacles asparameter, in two different ways: distance and latency.For this purpose we used a number of active snails thatwere later submitted to the in vitro experiments. Theresults are shown in Table 3. The snail senses ammonia(1%) as the most aversive of all odorants tested, with-drawing the tentacles at the longest distance of 8.591.0 cm (95% confidence limits) or at the shortest latencyof B1 s and ethanol as the least aversive, at theshortest distance of 1.090.5 cm or the longest latencyof 6.190.9 s (95% confidence limits). The parametersmeasured in distance seemed to be linearly related tothose in latency. Based on these parameters the order ofaversiveness can be described as follows: 1% ammo-nia\ formic acid\2-pentanol\butanol\ethanol.
A point of some interest, comparing our findingswith the paper of Ohloff [47], is that the order ofaversiveness of the five pure chemicals tested here,behaviourally, seems to correspond to that expectedfrom consideration of the molecular properties of thesechemicals that lead to adhesion of the molecules to thereceptor cell membrane.
3.3.2.5. Ammonia. This odorant induced strong re-sponses in VG and their patterns were partly similar tothose in PC. Elevation of power occurred over a widefrequency range extending from 0.1 up to at least 50Hz, but most stronglyB1 Hz. The most prominentfrequency of the response was 0.29B0.02 Hz (Table4). The response occurred always immediately afterstimulus onset. Interestingly, the 0.2 Hz activity of VGlasted much longer (5–10 min) than that of PC (20–30s) although the other frequency components lastedmuch longer.
We may conclude from these findings: (a) Each odor-ant induced, in the low frequency range, characteristic,wideband FP activities in theB15 Hz band. The peak

A. Schutt et al. / Comparati6e Biochemistry and Physiology, Part A 123 (1999) 95–110106
3.5. Relationship between degree of a6ersion andodorant-induced frequency
To examine if there was any correlation between thebehavioural valence of an odorant and the odorant-spe-cific peak power frequency, the degree of aversivenessin distance was semilogarithmically plotted against thepeak power frequency (Hz) of the induced FP activityin the isolated PC lobe as well as VG (Fig. 5a,b). Therewas evidently a linear relationship between them. Thismay suggest that there is some correlation between themost dominant low frequency component of the char-acteristic FP response and behaviour, i.e., the chemicalnature of the odorant: the lower the induced peakpower frequency, the more aversive the odorant. Fur-thermore, these most prominent frequencies may beconsidered to be odor-specific, since they are invariablyobserved regardless of intensities and preparations.
4. Discussion
We used semimicroelectrodes for recording electricalactivity and analyzed intrinsic as well as odorant-in-duced fluctuations by power spectra. This approachallowed us to describe and characterize changes ofactivity in frequency and amplitude, and relate them tospecific odorants. We could also correlate these changesto behaviour.
4.1. Odor-specific responses of the ganglia
Both PC and VG responded to each of the odorantstested here specifically in frequency, but PC also inamplitude (theB15 Hz band) exhibiting diffuse dose–
dependencies. Interestingly, the curve of this dose de-pendency appeared different for each odorantindicating a distinct sensitivity. This may suggest that,in PC, odor input is processed not only in frequency,but in amplitude as well. Response in amplitude mayalso be related to odor quality and, in part, to odorintensity. Notably, in VG, no dose-relatedness wasobserved. It is still to be studied whether or not this isdue to weak coupling between PC and VG, as observedbetween pedal cells and PC [29].
A number of studies with invertebrates [18,19,26–33,35,36,39–41,45,53] have shown that odor informa-tion brings neurons of the olfactory neuronal circuitinto increased FP fluctuation by spatio-temporal orga-nization of neuronal assemblies and predicted that thisinduced/evoked activity may strongly be related to themechanism of odor encoding in general. Our findingsalso strongly support this idea evidencing odor-inducedfrequency patterns that are specific to odorants testedin the present study.
An apparent difference between our descriptions andthose of Gelperin and associates concerns the ca. 0.7Hz rhythm, emphasized by those authors. We also seethis rhythm, chiefly in the form of spikes, whethersingle or multiunit. They are not prominent in the dataanalyzed, mainly because we deliberately avoided elec-trode placements where activity was dominated by asingle large rhythm, as is common in most invertebratesand especially gastropod recordings.
4.2. Odor-nonspecific responses of the ganglia
Activities in the \15 Hz were seen regularly in theVG, but only occasionally in PC. In VG, the FPs in thisband were enhanced by ethanol and ammonia and, in
Table 4Relationship between degree of aversion and peak power frequency of odor-induced field potential activity in the Helix procerebrum and visceralganglion
Degree of aversiona Peak power frequencies of odor-induced activityStimulus
Stimulus–tentacle distance at Procerebral lobe Visceral ganglion(Hz)withdrawal reaction (cm) (Hz)
1.6090.08 (11, 53)Ethanol 1.3190.09 (12, 62)1.090.5 (5, 5)2.990.6 (10, 10)2-Butanol 0.6790.03 (8, 23) 0.6590.07 (3, 22)
2-Pentanol 5.391.1 (11, 11) 0.4890.04 (11, 24) 0.4390.08 (4, 16)6.491.0 (5, 5) 0.3690.03 (12, 59)Formic acid 0.3690.04 (7, 49)8.591.0 (5, 7)Ammonia 0.29B0.02 (6, 9) 0.290.2 (2, 4)
Onion juice 3.590.6 (6, 15) 0.3690.14 (3, 6)N.W.† (1, 1) 1.1090.25 (3, 4)Apple juice
a Degree of aversion is expressed as stimulus–tentacle distance at withdrawal reaction. Number of observations, right, and that of preparations,left, in brackets.
† N.W.: No withdrawal. In these observations the criteria chosen for power maximization were: for ethanol]1 Hz; for other odorantsB1 Hz.All values are presented as means9 ‘95% confidence limits for the means’ calculated according to ‘Student’ and accompanied by number of snailsor preparations, left, and number of observations, right, in brackets. These results are also shown in Fig. 5.

A. Schutt et al. / Comparati6e Biochemistry and Physiology, Part A 123 (1999) 95–110 107
Fig. 5. Relationship between degree of aversion and frequency ofodorant-induced activity. The bars represent 95% confidence limitsfor the means. Numerical values are also presented in Table 4. Notethat there was a linear relationship between degree of aversivenessand peak power frequency of odorant-induced FP activity in theHelix procerebrum and visceral ganglion. This diagram suggests: (a)order of aversiveness appears to reflect that of molecular affinity: thestronger in affinity an odorant, the more aversive it is to the snail; (b)order of affinity is correlated to peak power frequency of induced FP:the stronger in affinity an odorant, the lower the odorant-inducedfrequency.; (c) the more aversive an odorant, the lower the peakpower frequency; (d) extrapolation of the curve to the abcissa yieldsa value of �2.5 Hz. This is the area for an appetitive odorant(ethanol) for the snail. These curves suggest that the odorant-specificfrequencies may, together with other frequency components, be in-volved in identification, classification and discrimination of odorantsor their classes and that the most crutial FP activities relevant for thisfunction may exist below �2.5 Hz.
be mentioned is that of the 3–20 Hz range, especiallythe activities in the 3–7 Hz band. In this case, a powerpeak between 3 and 7 Hz, weaker but relatively consis-tent, appeared over several epochs: in PC mainly bystimulation with ethanol and, in one case, with 2-pen-tanol and in VG by administration of all five odorants.
When there was a response in the\15 Hz band, theactivity in the 3–15 Hz band also normally increased.Whether or not there is some correlation between thesefrequencies remains still to be answered. In one prepa-ration we observed a conspicuous fluctuation in the6–20 Hz band lasting over several epochs with a powermaximum at 10 Hz. Interestingly, odorant-nonspecific7–13 Hz FP oscillations have also been observed in thefrog olfactory bulb [20]. These apparently odorant-non-specific frequencies seem to exist in a variety of species,but the functional meaning of each of these frequenciesis not yet known.
Odorant-evoked 20 Hz local field potential oscilla-tions [20,40] and 40 Hz- (gamma-) activity [12,22,25]have been reported, but the nature of these high fre-quency activities appears to be, more or less, odorant-nonspecific. The gamma-activty, for instance, is evokedin different species, including the Helix, with a varietyof stimulus modalities [10,55]. Interestingly, we ob-served, in some preparations, similar nonspecific\15Hz activities where increases of the RMS-voltages inthe 15–30 and 30–50 Hz bands were evident. We alsoconsider these high frequency activities to be involved,together with the other frequencies, in olfactory infor-mation processing, as hypothesized by the others.
4.3. Other features of the ganglionic responses
There are several other features to be noted: (a) Inmany cases the activity first subsided for one to severalminutes after stimulus onset over a wide range offrequency with waves or spikes totally disappearing(0.1–\15 Hz; Fig. 1b and Fig. 2b, Panel 2) and thenbecame suddenly bursting. This phenomenon may bedue to reorganization of cellular activity before comingto a frequency tuning. (b) The power often increasedwith time during stimulation (Fig. 2b–c and Fig. 3b–c)and then subsided probably due to adaptation. In somepreparations, however, removal of an odor coincidedwith sudden increase of the potentials in theB15 Hzband. It is still to be investigated whether the enhance-ment of the potentials was due to an OFF effect orrelated to some other function. (c) Another interestingaspect is that there was a large difference in the dura-tion of the odor-specific activity of ethanol between PCand VG: In VG, a characteristic bursting occurredintemittently for a long time (Fig. 2b and Fig. 2c) whilein PC it either subsided in a few minutes or continuedshifting the frequency center toB1 Hz. This intermit-tent activation of VG at �2 Hz, for instance, may berelated to specific memory function of this ganglion.
some experiments, by formic acid and 2-pentanol. InPC undiluted ethanol and dilutions of formic acid and2-butabol induced fluctuations in this band. The RMS-voltages of, for examples, the 15–30 Hz and 30–50 Hzbands increased and this may suggest that these fre-quency bands are also involved in processing of odorinformation. One other important response activity to

A. Schutt et al. / Comparati6e Biochemistry and Physiology, Part A 123 (1999) 95–110108
4.4. Propagation of acti6ity
Although the recordings from PC and VG were notcarried out simultaneously, our findings suggest thatthe activity patterns evoked in PC apparently propagateto VG. VG is known to control functions of digestiveand sexual organs, both of which may be activated byinput of attractive or repellent odors. Although theneuronal pathways to VG are still unidentified, cells areknown in the ganglion in Helix that respond to chemi-cal stimulation with quinine, e.g. serotonergic giantparietal neurons. The origin of this response is assumedto be in PC cells [63]. Since the parietal ganglia haveconnections to VG, olfactory signals could propagatefrom PC to VG through the parietal ganglia. Interest-ingly, intracellular injections of biocytin into PC cells ofthe Helix aspersa [49] suggested that direct interactionsof the PC with the other parts of the central nervoussystem could be possible through the neurite projec-tions to the various regions of the cerebral ganglion.
Our most recent experiments with the Helix pedalganglion (PG) [56] showed that in this center of loco-motion odor input evoked responses similar to thoseobserved in VG. The pedal cells with dendrites in thePC lobe are very likely to carry outputs from PC toPG, based on studies in Achatina [16]. Our preliminarystudy with simultaneous recordings from PC and PGshowed that responses with the same odorant-specificfrequencies were elicited in these ganglia (unpublisheddata). Further study in this direction would add tests ofour hypothesis.
Moreover, it has recently been reported that thespontaneous action potentials of cells in the Limax PGare weakly coupled to the local field potential oscilla-tion in the PC lobe [29]. The mechanism of the signaltransfer from PC to VG or PC to PG that we observedmay be explained by such a coupling.
4.5. Relation to beha6ioural 6alence of odorant
Although our estimates of behavioural valences ofthe odorants were based on observation by eye andmanual movement of odor source, the parameters thusobtained were linearly correlated to the odor-specificfrequencies. There seem to be strong correlationsamong chemical nature of an odorant, odor-specificpeak power frequency and behaviour. In other words:(a) The stronger the chemical affinity, the more aversiveto the snail. (b) The stronger the chemical affinity, thelower the odor-specific frequency. (c) The more aversivethe odor is to the snail, the lower the odor-specificfrequency of induced FP activity. (d) Sensitivity mani-fested as rate of RMS-amplitude increase of the lowfrequency range (B15 Hz) may also be related to odorquality and, in part, to odor concentration. (e) Extrapo-lation of the curves in Fig. 5 strongly suggests that the
behaviourally relevant frequencies may exist exclusivelyin the low frequency range ofB2.5 Hz, and play signifi-cant roles in the mechanism of encoding odor quality.
Our results seemed to agree with the observationsmade by Kimura and his colleagues [35] as well asGervais and his colleagues [31] who reported that thefrequency of local field potentials in the slug’s PC lobewas increased by stimulation with an appetitive odorand decreased by an aversive one. However, theseauthors could not relate the changed frequency patternsto specific odors or to their behavioural valences.
4.6. Rele6ance for comparati6e studies
The olfactory system of terrestrial molluscs has beendescribed as fundamentally similar to that of verte-brates in its anatomical architecture and may thereforebe heuristic for studying olfactory function in general[17]. The findings from the present species as a modelmay possibly be interpreted as representati6e of somegeneral phenomena of olfactory information processing.Concerning the relevance of the isolated brain, Delaneyand Hall [20] demonstrated that there are no differencesin odorant induced local field potentials between invitro and in vivo preparations. Bullock [13] claimed, forhis material and criteria, that ‘the activity manifestedby the completely isolated brain or ganglion is essen-tially the same as that in the intact animal in theintervals between gross movement and in the absence ofobvious stimulation’. Our preparations were equivalent.
Recently, a number of reports on chemosensoryevoked or event-related potentials in mammals haveappeared [11,34,37,43,44,50,60]. Some of them reportincrease of theta and/or alpha activity in EEG duringodor application. However, correlation of these olfac-tory rhythms to specific odors has not yet been estab-lished and similarities with the same parts of thespectrum in Helix can not yet be asserted with anyconfidence. Regarding delta (0.5–3.5 Hz) oscillationsinduced in the mammalian brain, known are thosewhich are universally evoked by a variety of non-olfac-tory, cognitive inputs [4–7,9,48,51]. The possibilities ofcomparable meanings or mechanisms represent a chal-lenging agenda for comparative studies.
5. Conclusion
Slow (B1 Hz) spontaneous fluctuations exist in theHelix brain as wideband, nonrhythmic FP activity.Olfactory input modulates these fluctuations pre-sumably bringing neurons to synchronous activitieseliciting bursts, with characteristic frequencies and am-plitudes possibly specific to certain odors of the limitednumber of odorants tested here.

A. Schutt et al. / Comparati6e Biochemistry and Physiology, Part A 123 (1999) 95–110 109
The induced activities \2.5 Hz are probably odor-ant non-specific. Peak power frequencies induced in PCand those induced in VG are either the same or verysimilar and this may mean that olfactory signals pro-cessed in the PC propagate further to VG.
These odorant-specific frequencies, that are also cor-related to behavioural output and exist exclusively inthe low frequency range ofB2.5 Hz, may play signifi-cant roles in the mechanism of encoding odor quality.These odor-specific low frequencies in combinationwith the other frequencies may function as identifica-tion codes for the odorants or the classes of odors theyeach represent.
Acknowledgements
We thank Alan Gelperin, Bell Labs Innovations,Lucent Technologies, N.J., USA, for important sugges-tions in initiating this work, Ronald Chase of McGillUniversity, Montreal, Canada, and David Kleinfeld ofUniversity of California, San Diego, CA, USA, forhelpful discussions. The authors also thank MartinSchurmann for valuable discussion, Ferdinand Gre-itschus for developing softwares, Martin Gehrmannand Gabriele Huck for technical assistance andGabriela Fletschinger for preparing graphics. This workwas supported by DFG grants Ba 831/11-1/2.
References
[1] Adrian ED. Olfactory reactions in the brain of the hedgehog. JPhysiol Lond 1942;199:459–73.
[2] Balaban PM, Maksimova OA. Positive and negative brain zonesin the snail. Eur J Neurosci 1993;5:768–74.
[3] Basar E. EEG-Brain Dynamics. Relation between EEG andbrain evoked potentials. Amsterdam: Elsevier, 1980.
[4] Basar E. Brain Oscillations: Principles and Approaches. Berlin:Springer, 1998.
[5] Basar E. Integrative Brain Function: Neurophysiology and Cog-nitive Processes Based on EEG Oscillations. Berlin: Springer,1999.
[6] Basar E, Schurmann M, Basar-Eroglu C. Potentials, rhythmicslow, behavioral correlates. In: Adelman G, Smith B, editors.Encyclopedia of Neuroscience. Boston: Birkhauser, 1996.
[7] Basar E, Basar-Eroglu C, Rosen B, Schutt A. A new approachto endogenous event-related potentials in man: Relation betweenEEG and P300-wave. Intern J Neurosci 1984;24:1–21.
[8] Basar-Eroglu C, Basar E. A compound P-300-40 Hz response ofthe cat hippocampus. Int J Neurosci 1991;60:227–37.
[9] Basar-Eroglu C, Struber D, Stadler M, Kruse P, Basar E.Multistable visual perception induces a slow positive wave. In-tern J Neurosci 1993;73:139–51.
[10] Basar E, Schutt A, Bullock TH. Dynamics of potentials from thebrain of anamniotes. In: Basar E, editor. Brain Function andOscillations. Integrative Brain Function. Neurophysiology andCognitive Processes, vol. II. Berlin: Springer, 1999:109–16.
[11] Brauchli P, Ruegg PB, Etzweiler F, Zeier H. Electrocortical andautonomic alteration by administration of a pleasant and anunpleasant odor. Chem Senses 1995;20:505–15.
[12] Bressler SL, Freeman WJ. Frequency analysis of olfactory sys-tem EEG in cat, rabbit and rat. Electroencephalogr Clin Neuro-physiol 1980;50:19–24.
[13] Bullock TH. Problems in the comparative study of brain waves.Yale J Biol Med 1945;17:657–79.
[14] Bullock TH. Introduction to induced rhythms: a widespread,heterogeneous class of oscillations. In: Basar E, Bullock TH,editors. Induced Rhythms in the Brain. Boston, MA: Birkhauser,1992:1–26.
[15] Bullock TH, Basar E. Comparison of ongoing compound fieldpotentials in the brains of invertebrates andd vertebrates. BrainRes Rev 1988;13:57–75.
[16] Chase R, Tolloczko B. Interganglionic dendrites constitute anoutput pathway from the procerebrum of the snail Achatinafulica. J Comp Neurol 1989;283:143–52.
[17] Chase R, Tolloczko B. Tracing neural pathways in snail olfac-tion: from the tip of the tentacles to the brain and beyond.Microscopy Res Tech 1993;24:214–30.
[18] Cinelli AR, Hamilton KA and Kauer JS. Salamander olfactorybulb neuronal activity observed by video rate, voltage-sensitivedye imaging. III. Spatial and temporal properties of responsesevoked by odorant stimulation. J Neurophysiol 1995;73:2053–71.
[19] Derby CD, Ache BW. Quality coding of a complex odorant inan invertebrate. J Neurophysiol 1984;51:906–24.
[20] Delaney KR, Hall BJ. An in vitro preparation of frog nose andbrain for the study of odour-evoked oscillatory activity. J Neu-rosci Methods 1996;68:193–202.
[21] Duchamp-Viret P, Duchamp A, Vigouroux M. Temporal aspectsof information processing in the first two stages of the frogolfactory system; influence of stimulus intensity. Chem Senses1990;15:349–65.
[22] Eckert M, Schmidt U. The influence of permanent odor stimulion the postnatal development of neural activity in the olfactorybulbs of laboratory mice. Dev Brain Res 1985;20:185–90.
[23] Evans WJ, Cui L, Starr A. Olfactory event-related potentials innormal human subjects: effects of age and gender. Electroen-cephalogr Clin Neurophysiol 1995;95:293–301.
[24] Freeman WJ. Mass Action in the Nervous System. New York:Academic, 1975.
[25] Freeman WJ, Skarda CA. Spatial EEG patterns, non-lineardynamics and perception: the neo-Sherringtonian view. BrainRes Rev 1985;10:147–75.
[26] Gelperin A. Nitric oxide mediates network oscillations of olfac-tory interneurons in a terrestrial mollusc. Nature 1994;369:61–3.
[27] Gelperin A, Kleinfeld D, Denk W, Cooke RC. Oscillations andgaseous oxides in invertebrate olfaction. J Neurobiol1996;30:110–22.
[28] Gelperin A, Rhines LD, Flores J, Tank DW. Coherent networkoscillations by olfactory interneurons: modulation by endoge-nous amines. J Neurophysiol 1993;69:1930–9.
[29] Gelperin A, Flores J. Vital staining from dye-coated microprobesidentifies new olfactory interneurons for optical and electricalrecording. J Neurosci Methods 1997;72:97–108.
[30] Gelperin A, Tank DW. Odour-modulated collective networkoscillations of olfactory interneurons in a terrestrial mollusc.Nature Lond 1990;435:437–40.
[31] Gervais R, Kleinfeld D, Delaney KR, Gelperin A. Central andreflex neuronal responses elicited by odor in a terrestrial mollusc.J Neurophysiol 1996;76:1327–39.
[32] Girardot MN, Derby CD. Neural coding of quality of complexolfactory stimuli in lobsters. J Neurophysiol 1988;60:303–24.
[33] Girardot MN, Derby CD. Independent components of the neu-ral population response for discrimination of quality and inten-sity of chemical stimuli. Brian Behav Evol 1990;35:129–45.
[34] Hummel T, Pauli E, Schuler P, Kettermann B, Stefan H, KobalG. Chemosensory event-related potentials in patients with tem-poral lobe epilepsy. Epilepsia 1995;36:79–85.

A. Schutt et al. / Comparati6e Biochemistry and Physiology, Part A 123 (1999) 95–110110
[35] Kimura T, Suzuki B, Yamada A, Sekiguchi T, Mizukami A.Response of oscillatory field potential to some conditioned odorsin slug’s brain. Zool Sci 1993;9:1241.
[36] Kleinfeld D, Delaney KR, Fee MS, Flores JA, Tank DW,Gelperin A. Dynamics of propagating waves in the olfactorynetwork of a terrestrial mollusk: an electrical and optical study.J Neurophysiol 1994;72:1402–19.
[37] Klemm WR, Lutes SD, Hendrix DV, Warrenburg S. Topo-graphical EEG maps of human responses to odors. Chem Senses1992;17:347–61.
[38] Kobal G, Hummel C. Cerebral chemosensory evoked potentialselicited by chemical stimulation of the human olfactory andrespiratory nasal mucosa. Electroencephalogr Clin Neurophysiol1988;71:241–50.
[39] Kuttner A, Joerges J, Menzel R. Optical imaging studies ofolfactory coding in the honeybee’s antennal lobes. Soc NeurosciAbstr 1995;21:135.
[40] Laurent G, Davidowitz H. Encoding of olfactory informationwith oscillating neural assemblies. Science 1994;265:1872–5.
[41] Laurent G, Wehr M, Davidowitz H. Temporal representationsof odors in an olfactory network. J Neurosci 1996;16:3837–47.
[42] Lorig TS, Huffman E, DeMartino A, DeMarco J. The effects oflow concentration odors on EEG activity and behavior. J Psy-chol 1991;5:69–77.
[43] Lorig TS, Turner JM, Matia DC, Warrenburg S. The contingentnegative variation in an odor labeling paradigm. Psychophysiol-ogy 1995;32:393–8.
[44] Lorig TS, Matia DC, Peszka J, Bryant DN. The effects of activeand passive stimulation on chemosensory event-related poten-tials. Int J Psychophysiol 1996;23:199–205.
[45] MacLeod K, Laurent G. Distinct mechanisms for synchroniza-tion and temporal patterning of odor-encoding neural assem-blies. Science 1996;274:976–9.
[46] Mellon DF. Characterization of oscillatory interneurons in theprocerebrum of the crayfish. J Exp Biol 1992;167:15–38.
[47] Ohloff G. Chemistry of odor stimuli. Experientia 1986;42:271.[48] Parnefjord R, Basar E. Delta oscillations as a correlate to
acoustical perception at the auditiry threshhold. Soc Proc Elec-troenceph Clin Neurophysiol 1995;94:44.
[49] Ratte S, Chase R. Morphology of interneurons in the procere-brum of the snail Helix aspersa. J Comp Neurol 1997;384:359–72.
[50] Sawada K, Koyama E, Kubota M, Hayashi I, Komaki R, InuiM, Torii S. Effects of odors on EEG relaxation and alphapower. Chem Senses 1992;17: JASTS XXV Abstracts:88.
[51] Schurmann M, Basar-Eroglu C, Kolev V, Basar E. A new metricfor analyzing single-trial event-related potentials (ERPs): appli-cation to human visual P300 delta response. Neurosci Lett1995;197:167–70.
[52] Schutt A, Basar E. The effects of acetylcholine, dopamine andnoradrenaline on the visceral ganglion of Helix pomatia-II.Stimulus-evoked field potentials. Comp Biochem Physiol1992;102C:169–76.
[53] Schutt A, Basar E. Olfactory field potential oscillations in theisolated Helix brain: different odors induce different rhythmic-ities. Proceedings of the 39th Annual Meeting of the GermanElectroencephalography Society 1994;148.
[54] Schutt A, Basar E, Bullock TH. The effects of acetylcholine,dopamine and noradrenaline on the visceral ganglion of Helixpomatia-I. Ongoing compound field potentials of low frequen-cies. Comp Biochem Physiol 1992;102C:159–68.
[55] Schutt A, Bullock TH, Basar E. Dynamics of potentials frominvertebrate brains. In: Basar E. Brain function and oscillations.Integrative brain function. Neurophysiology and cognitive pro-cesses, vol. II. Berlin: Springer, 1999, 1999:91–108.
[56] Schutt A, Bullock TH, Basar E. Odorant-evoked field potentialsof the Helix pedal ganglion are correlated to behavior. Gottin-gen Conference of the German Neuroscience Society, May 1999.
[57] Sturbeck K. Vergleichende Analyse evozierter Potentiale vonInvertebraten und Vertebraten. Dissertation, Medical UniversityLubeck, 1988.
[58] Suzuki N. Behavioral and electrical responses of the land snail,Ezohelix flexibilis (Fulton), to odours. J Faculty Sci HokkaidoUniversiy 1967;16:174–85.
[59] Tank DW, Gelperin A, Kleinfeld D. Odors, oscillations, andwaves: does it all compute? Science 1994;265:1819–20.
[60] Van Toller S, Behan J, Howells P, Kendal-Reed M, RichardsonA. An analysis of spontaneous human cortical EEG activity toodours. Chem Senses 1993;18:1–16.
[61] Witte OW, Speckmann E-J, Walden J. Acetylcholine responsesof identified neurons in Helix pomatia-II. Pharmacological prop-erties of acetylcholine responses. Comp Biochem Physiol1985;80C:25–35.
[62] Youden WJ. Statistical Methods for Chemists. New York: Wi-ley, 1964:18–20.
[63] Zakharov IS, Ierusalimsky VN, Balaban PM. Pedal serotonergicneurons modulate the synaptic input of withdrawal interneuronsof Helix. Invertebrate Neurosci 1995;1:41–52.
[64] Zatorre RJ, Jones-Gotman M, Evans AC, Meyer E. Functionallocalization and lateralization of human olfactory cortex. Nature1992;360:339–40.
.
Related Documents