Power Laws By Cameron Megaw 3/11/2013

Power Laws By Cameron Megaw 3/11/2013. What is a Power Law?
Dec 15, 2015
Welcome message from author
This document is posted to help you gain knowledge. Please leave a comment to let me know what you think about it! Share it to your friends and learn new things together.
Transcript

Power LawsBy Cameron Megaw3/11/2013

What is a Power Law?A power law is a distribution of the form:
similarly
Example: The size of cities in the US (population 1000 or more) • Highly right skewed
• The largest city has 8 million people• Most cities have much fewer people
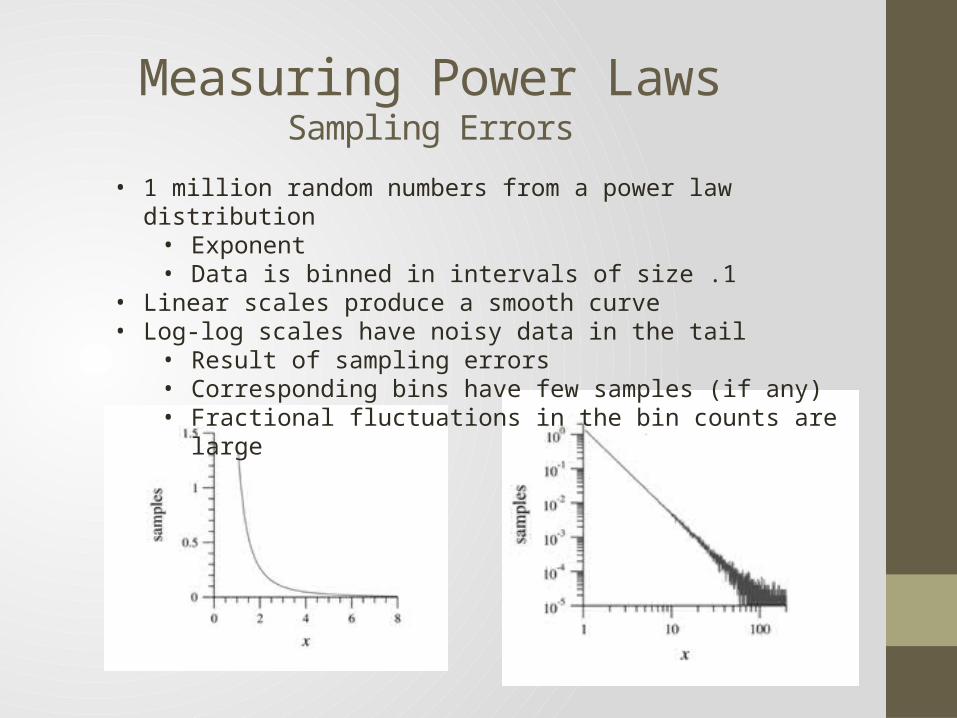
• 1 million random numbers from a power law distribution• Exponent • Data is binned in intervals of size .1
• Linear scales produce a smooth curve• Log-log scales have noisy data in the tail
• Result of sampling errors• Corresponding bins have few samples (if any) • Fractional fluctuations in the bin counts are large
Measuring Power LawsSampling Errors
Measuring Power LawsSampling errors
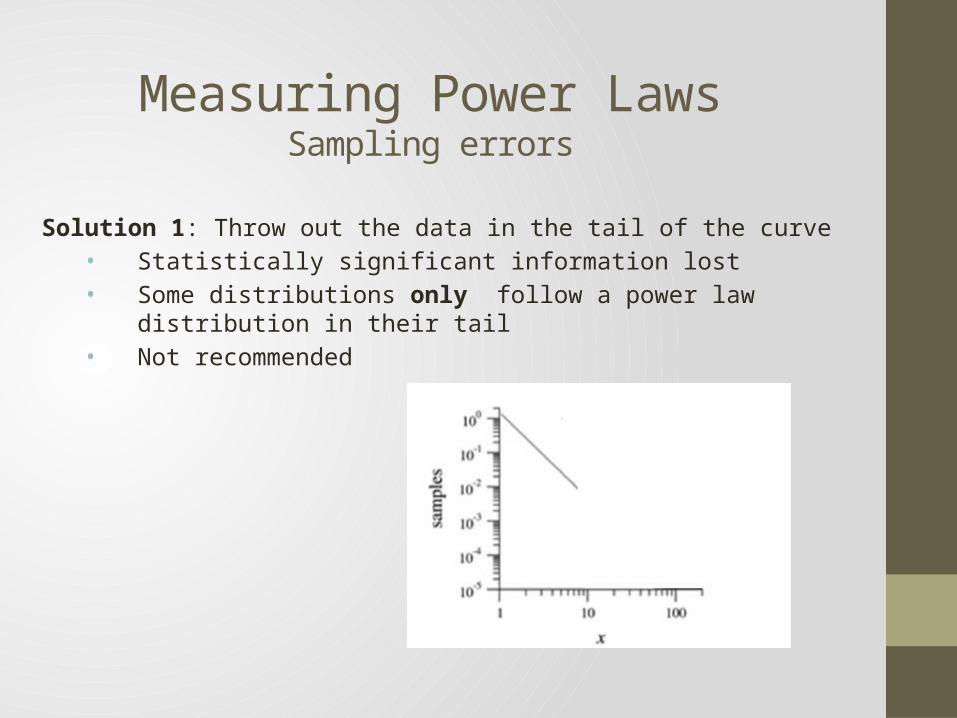
Solution 1: Throw out the data in the tail of the curve• Statistically significant information lost• Some distributions only follow a power law distribution in their tail• Not recommended

Measuring Power LawsSampling errors
Solution 2: Very the width of the bins• Normalize the data
• Results in a count per unit interval of x• Very bin size by a fixed multiplier (for example 2)• Bins become: 1 to 1.1, 1.1 to 1.3, 1.3 to 1.7 and so on • Called logarithmic binning
Measuring Power LawsSampling errors
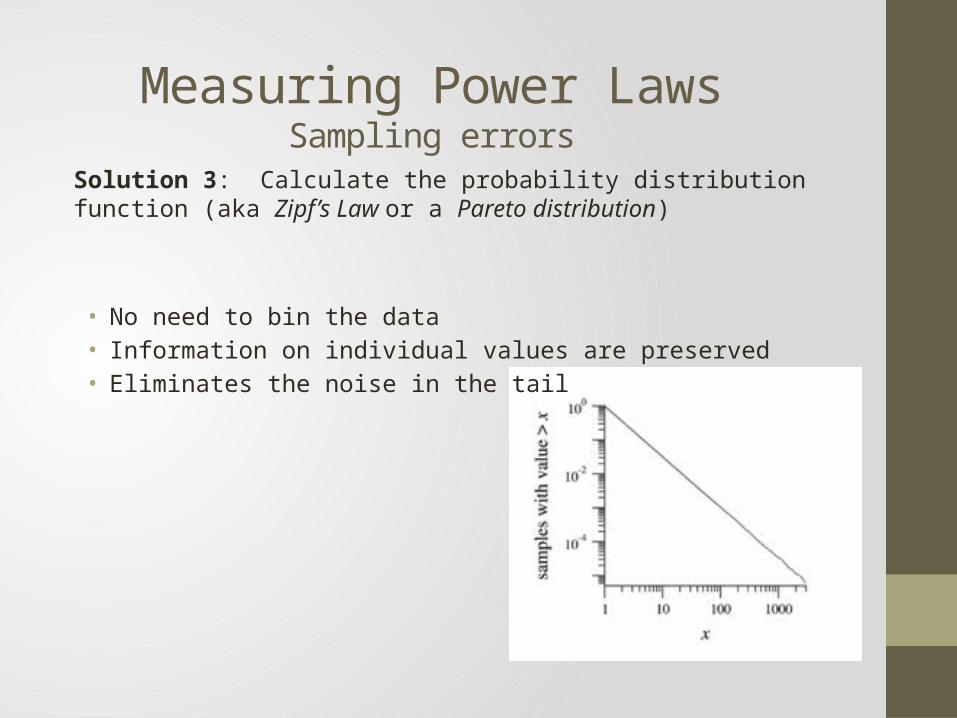
Solution 3: Calculate the probability distribution function (aka Zipf’s Law or a Pareto distribution)
• No need to bin the data• Information on individual values are preserved• Eliminates the noise in the tail

Measuring Power LawsUnknown exponent
1. Method of least squares:• Most common method• Plots the line of best fit in log-log scales• Introduces systematic biases in the value of the exponent• Estimated (actual 2.5)
2. Use maximum likelihood formula • A non-biased estimator• Calculate an error estimate
• standard bootstrap resampling• jackknife resampling
• Estimated


Mathematics of Power LawsCalculating C
Mathematics of Power LawsMoments
• All moments exists for and diverge otherwise: • Mean:• Variance:
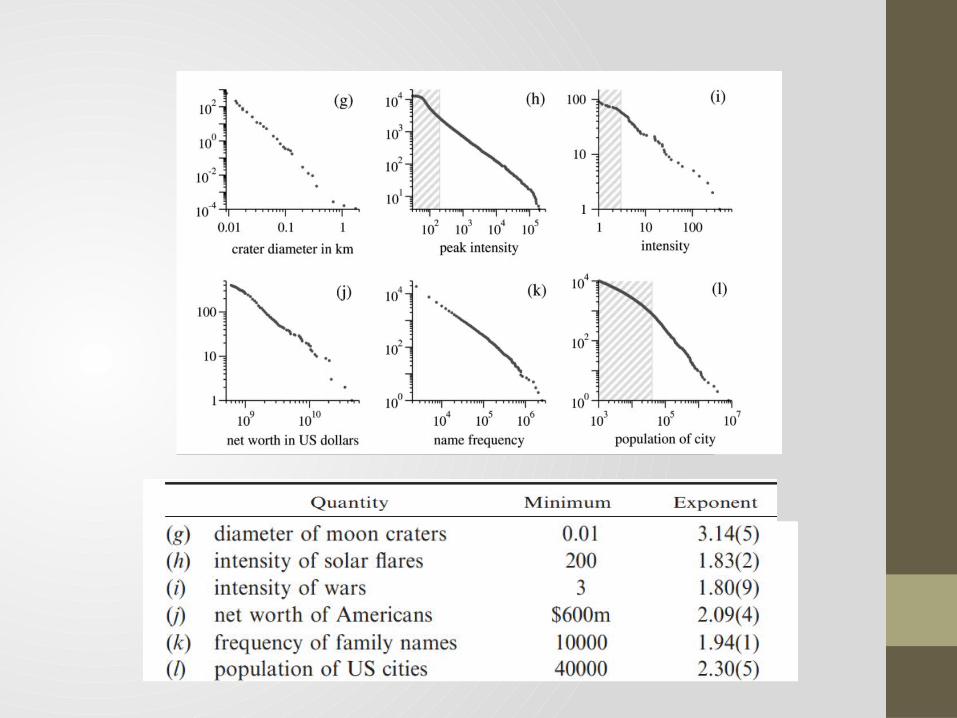
• Intensity of Solar flares have an exponent 1.4 is the average intensity infinite? • All data sets have finite upper bound• Larger sampling space gives a non-negligible chance of increasing the upper bound
Mathematics of Power LawsLargest Value
For a sample of size n we can estimate the largest value in the sample: as
Where B is beta-function
This estimate enables the calculation of moments for data sets whose moments would otherwise diverge.
Mathematics of Power LawsScale Free Distribution
• A function is said to be scale free if: • The unit of measure does not affect the shape of the distribution• If 2kB files are as common as 1kB files then 2mB files are as common as 1mb files
• Scale free distribution is unique to Power Law distributions • Scale free implies power law and vice versa

Mechanisms for Generating Power Laws
Some examples :• Combinations of exponents• Inverses of quantities• Random Walks• The Yule process • Critical phenomena
The Topology of the InternetSome Key Questions
What does the internet look like?
Are there any topological properties that stay constant in time?
How can I generate Internet-like graphs for simulation?

Internet Instances• Three Inter-domain topologies• November 1997, April and December 1998
• One Router topology from 1995
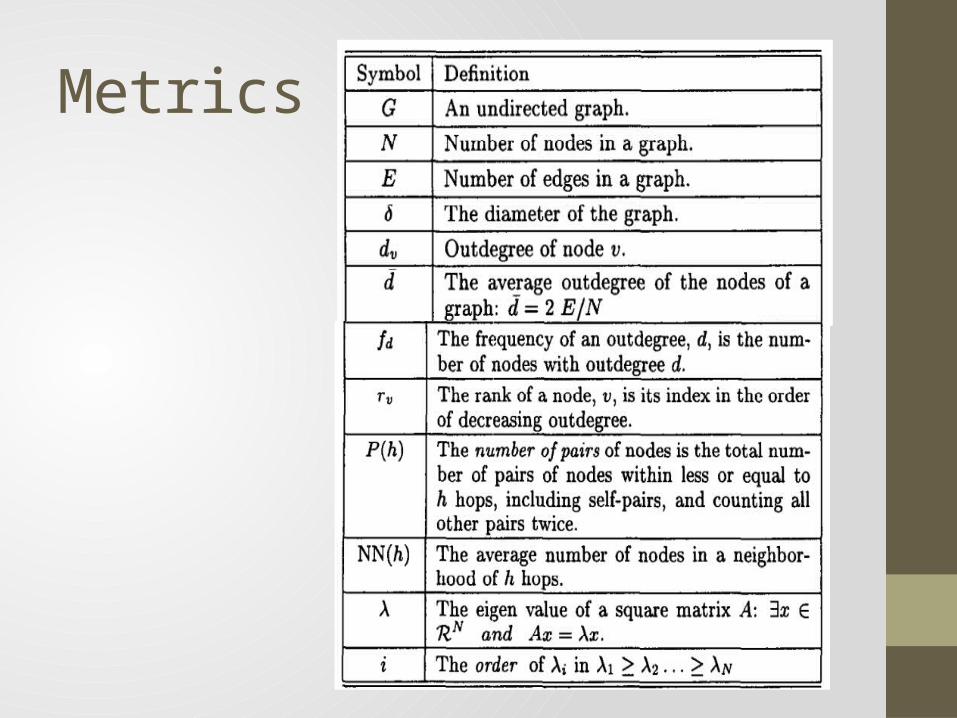
Metrics
Power Law 1: The out degree of a node v is proportional to the rank of the node, to the power of a constant R.
By setting it can be shown that
Outdegree of a Node and it’s Rank

Outdegree of a Node and it’s Rank
Inter domain topologies• Correlation coefficient above .974• Exponents -.81, -.82, -.74
Router• Correlation coefficient .948• Exponent -.48
The exponent is relatively fixed for the three inter-domain topologies• Topological property is fixed in time • Can be used to generate models or test authenticity
Significant difference in exponent value for the router topology• Can characterize different families of graphs
The rank exponent can be used to estimate the number of edges
Outdegree and it’s RankPower Law Analysis

Power Law 2: The frequency, of an outdegree, d, is proportional to the outdegree to the power :
Frequency of the Outdegree

Frequency of the Outdegree
Inter domain topologies• Correlation coefficient above .968• Exponents -2.15, -2.16, and -2.2
Router• Correlation coefficient .966• Exponent -2.48
The exponent is relatively fixed for the three inter-domain topologies• Topological property is fixed in time • Could be used to generate models or test authenticity
Similar exponent value for the router topology• Could suggest a fundamental property of the network
Frequency of the OutdegreePower Law Analysis
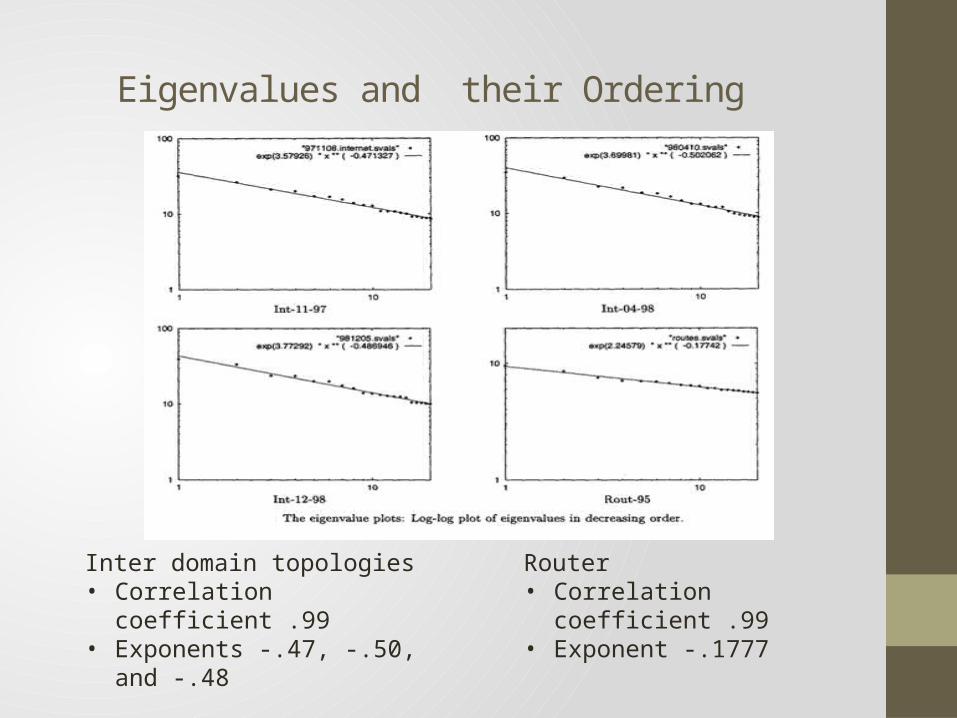
Power Law 3: The eigenvalues, of a graph are proportional to the order, to the power of a constant :
Eigenvalues and their Ordering
Eigenvalues and their Ordering
Inter domain topologies• Correlation coefficient .99• Exponents -.47, -.50, and -.48
Router• Correlation coefficient .99• Exponent -.1777
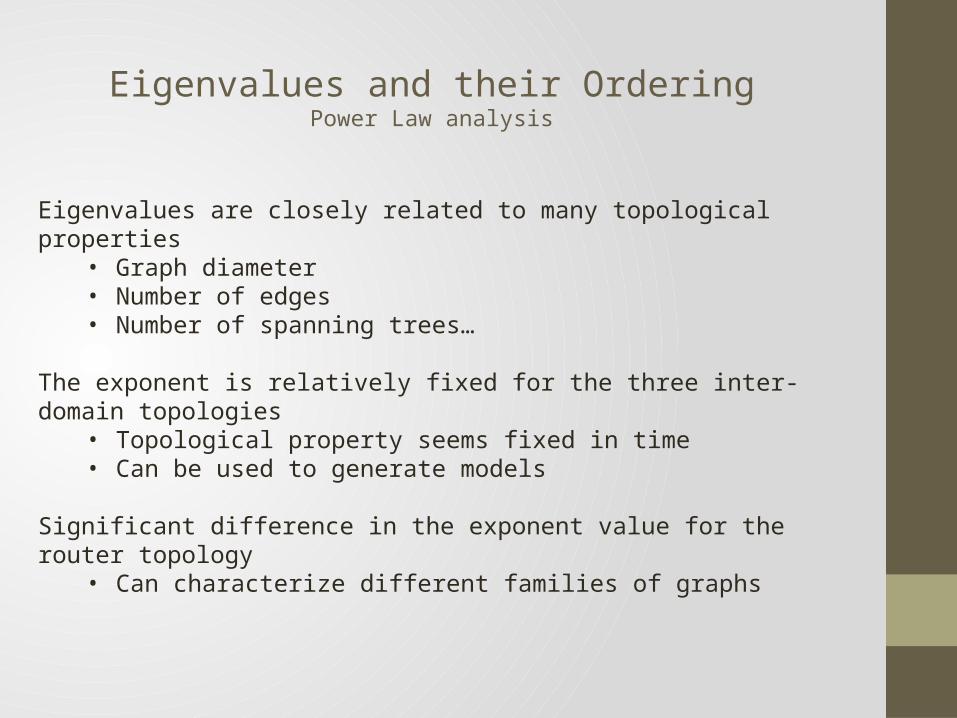
Eigenvalues are closely related to many topological properties• Graph diameter• Number of edges• Number of spanning trees…
The exponent is relatively fixed for the three inter-domain topologies• Topological property seems fixed in time • Can be used to generate models
Significant difference in the exponent value for the router topology• Can characterize different families of graphs
Eigenvalues and their OrderingPower Law analysis

Approximation 1: The total number of pairs of nodes, within hops can be approximated by:
Where
Hop Plot Exponent

Hop Plot Exponent
Inter domain topologies• First 4 hops • Correlation coefficient above .96• Exponents -4.6, -4.7, -4.86
Router• First 12 hops• Correlation coefficient .98• Exponent -2.8

• The exponent is relatively fixed for the three inter-domain topologies• Topological property seems fixed in time • Can be used to generate models
• Significant difference in the exponent value for the router topology• Can characterize different families of graphs
Hop Plot ExponentPower Law analysis
How many hops to reach a “sufficiently large” part of the network?• Too small a broadcast will not reach the target• Too large a broadcast can clog the network• A good guess is the intersection of the hop-plot at
The effective diameter
For the interdomain instances • 80% of nodes were within • 90% were within
The Effective Diameter

Average Neighborhood Size
Average outdegree:Hop-plot exponent:
Conclusions
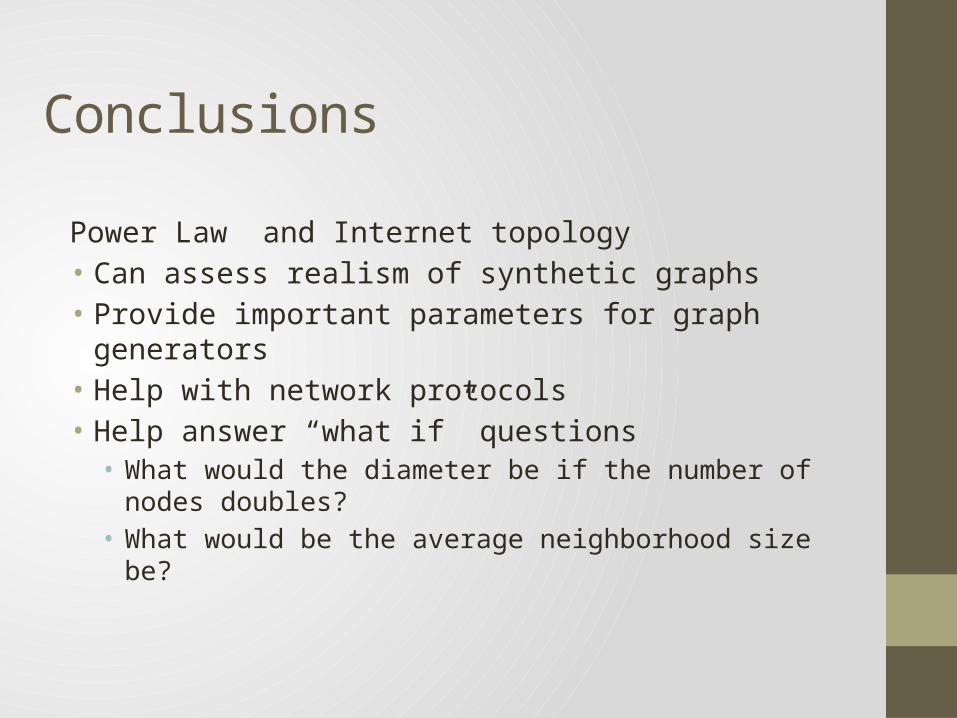
Power Law and Internet topology• Can assess realism of synthetic graphs• Provide important parameters for graph generators• Help with network protocols• Help answer “what if” questions• What would the diameter be if the number of nodes doubles?• What would be the average neighborhood size be?

Questions?
Related Documents