Power Finance Corporation Limited A Navratna PSU Performance Highlights Quarter & Year Ended (Standalone, Provisional & Un-audited) 31 st March 2010 We Create Possibility of a Better Tomorrow…. April 2010 S M T W Th F Sa 1 2 3 4 5 6 7 8 9 10 11 12 13 14 15 16 17 18 19 20 21 22 23 24 25 26 27 28 29 30

Welcome message from author
This document is posted to help you gain knowledge. Please leave a comment to let me know what you think about it! Share it to your friends and learn new things together.
Transcript
Power Finance Corporation LimitedA Navratna PSU
Performance Highlights Quarter & Year Ended
(Standalone, Provisional & Un-audited) 31st March 2010
We Create Possibility of a Better Tomorrow….
April 2010S M T W Th F Sa
1 2 3
4 5 6 7 8 9 10
11 12 13 14 15 16 17
18 19 20 21 22 23 24
25 26 27 28 29 30
2
We Create Possibility of a Better Tomorrow….
Focus & Strategy
Operational Performance
Shareholding Pattern
PFC Overview
PFC Overview
3
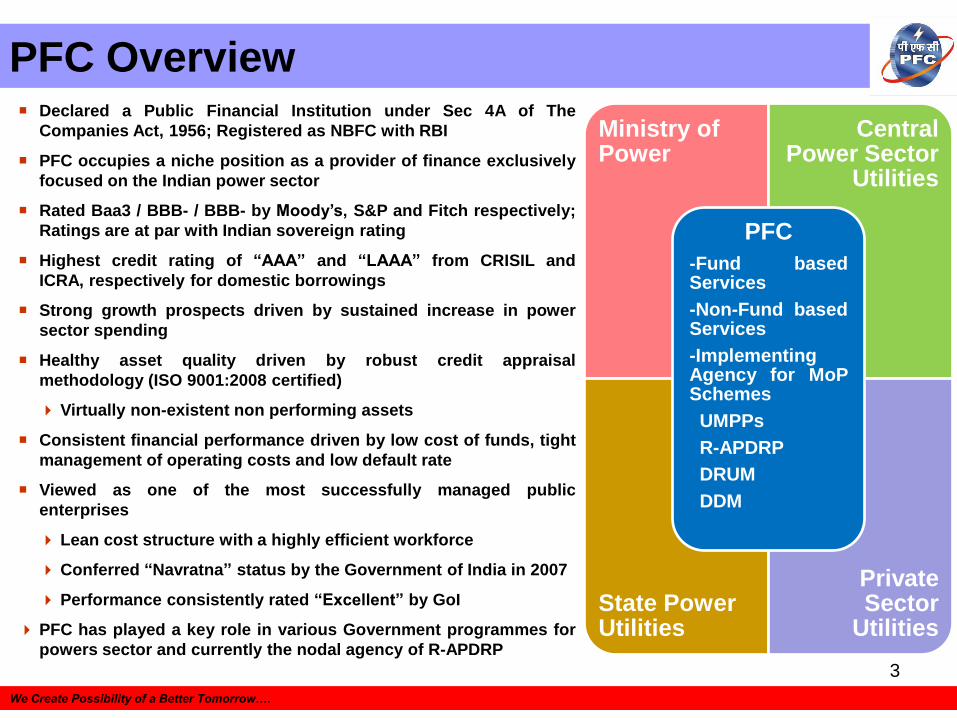
Declared a Public Financial Institution under Sec 4A of The
Companies Act, 1956; Registered as NBFC with RBI
PFC occupies a niche position as a provider of finance exclusively
focused on the Indian power sector
Rated Baa3 / BBB- / BBB- by Moody‟s, S&P and Fitch respectively;
Ratings are at par with Indian sovereign rating
Highest credit rating of “AAA” and “LAAA” from CRISIL and
ICRA, respectively for domestic borrowings
Strong growth prospects driven by sustained increase in power
sector spending
Healthy asset quality driven by robust credit appraisal
methodology (ISO 9001:2008 certified)
Virtually non-existent non performing assets
Consistent financial performance driven by low cost of funds, tight
management of operating costs and low default rate
Viewed as one of the most successfully managed public
enterprises
Lean cost structure with a highly efficient workforce
Conferred “Navratna” status by the Government of India in 2007
Performance consistently rated “Excellent” by GoI
PFC has played a key role in various Government programmes for
powers sector and currently the nodal agency of R-APDRP
We Create Possibility of a Better Tomorrow….
Ministry of Power
Central Power Sector
Utilities
State Power Utilities
Private Sector
Utilities
PFC
-Fund basedServices
-Non-Fund basedServices
-ImplementingAgency for MoPSchemes
UMPPs
R-APDRP
DRUM
DDM
Key Milestones
4
We Create Possibility of a Better Tomorrow….
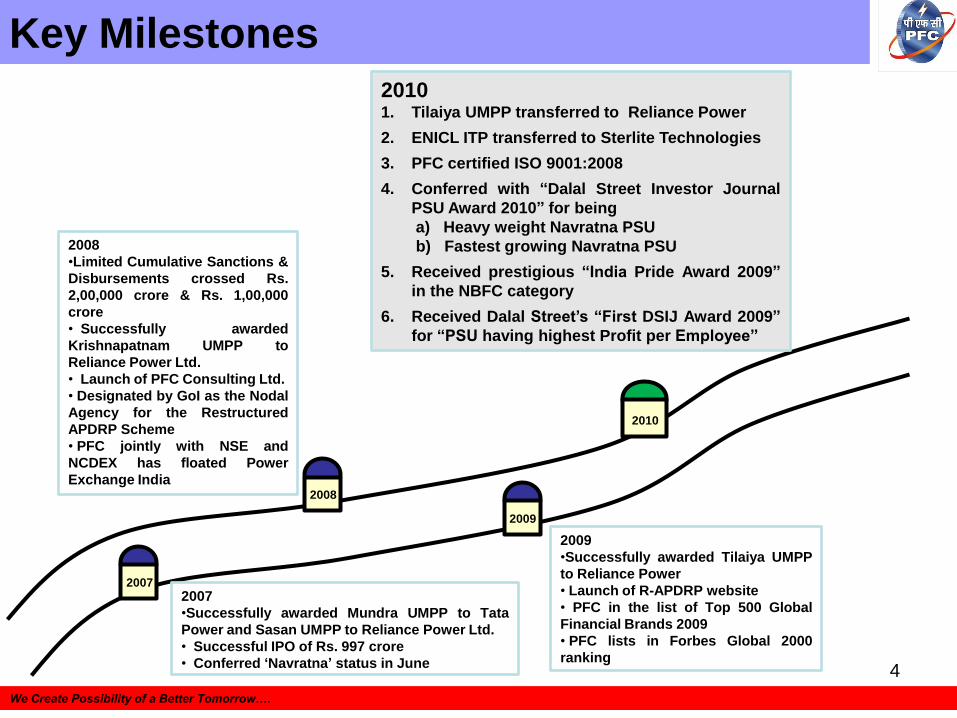
2007
2007
•Successfully awarded Mundra UMPP to Tata
Power and Sasan UMPP to Reliance Power Ltd.
• Successful IPO of Rs. 997 crore
• Conferred „Navratna‟ status in June
2008
•Limited Cumulative Sanctions &
Disbursements crossed Rs.
2,00,000 crore & Rs. 1,00,000
crore
• Successfully awarded
Krishnapatnam UMPP to
Reliance Power Ltd.
• Launch of PFC Consulting Ltd.
• Designated by GoI as the Nodal
Agency for the Restructured
APDRP Scheme
• PFC jointly with NSE and
NCDEX has floated Power
Exchange India
2010
20101. Tilaiya UMPP transferred to Reliance Power
2. ENICL ITP transferred to Sterlite Technologies
3. PFC certified ISO 9001:2008
4. Conferred with “Dalal Street Investor Journal
PSU Award 2010” for being
a) Heavy weight Navratna PSU
b) Fastest growing Navratna PSU
5. Received prestigious “India Pride Award 2009”
in the NBFC category
6. Received Dalal Street‟s “First DSIJ Award 2009”
for “PSU having highest Profit per Employee”
2009
•Successfully awarded Tilaiya UMPP
to Reliance Power
• Launch of R-APDRP website
• PFC in the list of Top 500 Global
Financial Brands 2009
• PFC lists in Forbes Global 2000
ranking
2009
2008
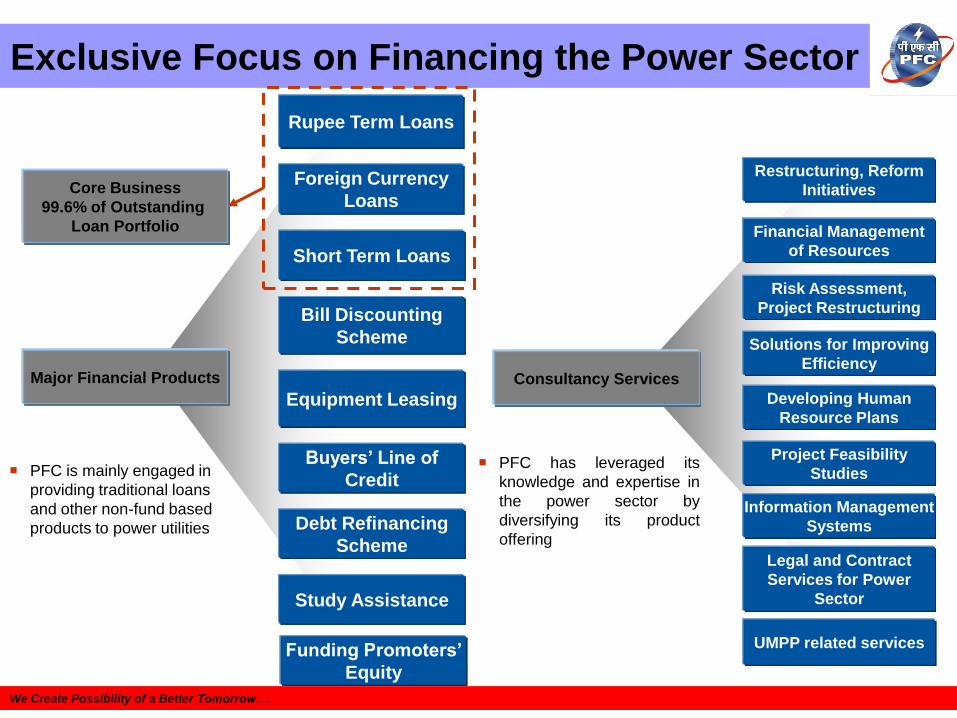
Exclusive Focus on Financing the Power Sector
Foreign Currency
Loans
Short Term Loans
Major Financial Products
Bill Discounting
Scheme
Equipment Leasing
Buyers‟ Line of
Credit
Debt Refinancing
Scheme
Rupee Term Loans
Study Assistance
Consultancy Services
Restructuring, Reform
Initiatives
Financial Management
of Resources
Risk Assessment,
Project Restructuring
Solutions for Improving
Efficiency
Developing Human
Resource Plans
Project Feasibility
Studies
Information Management
Systems
Legal and Contract
Services for Power
Sector
Core Business
99.6% of Outstanding
Loan Portfolio
PFC has leveraged its
knowledge and expertise in
the power sector by
diversifying its product
offering
PFC is mainly engaged in
providing traditional loans
and other non-fund based
products to power utilities
We Create Possibility of a Better Tomorrow….
Funding Promoters‟
Equity
UMPP related services
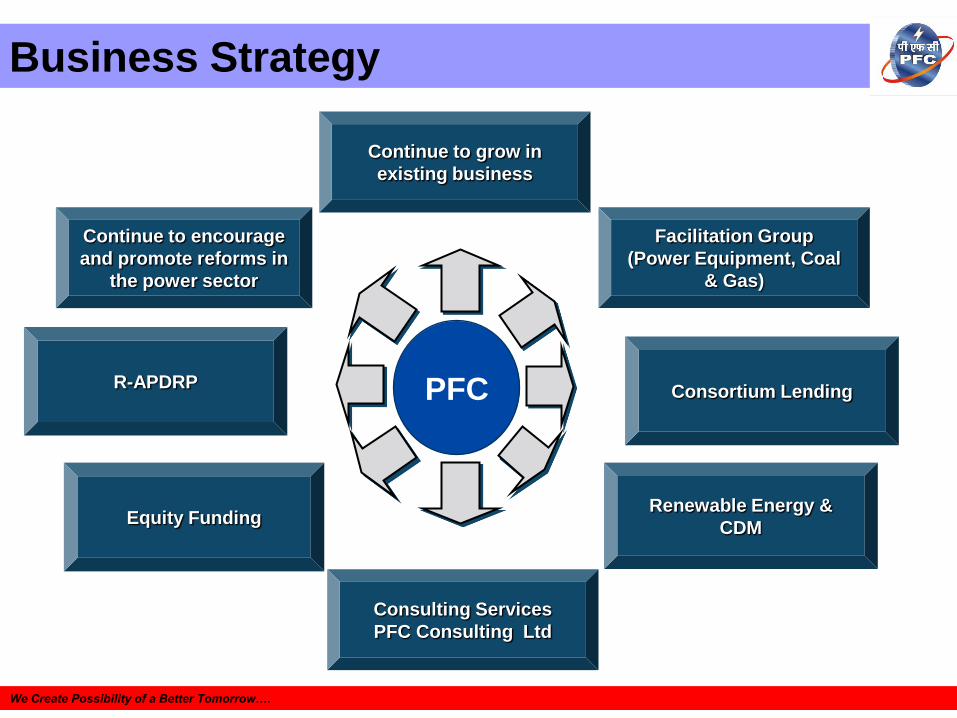
Business Strategy
R-APDRP
Equity Funding
Continue to encourage
and promote reforms in
the power sector
Consulting Services
PFC Consulting Ltd
Renewable Energy &
CDM
Consortium LendingPFC
Facilitation Group
(Power Equipment, Coal
& Gas)
Continue to grow in
existing business
We Create Possibility of a Better Tomorrow….
7
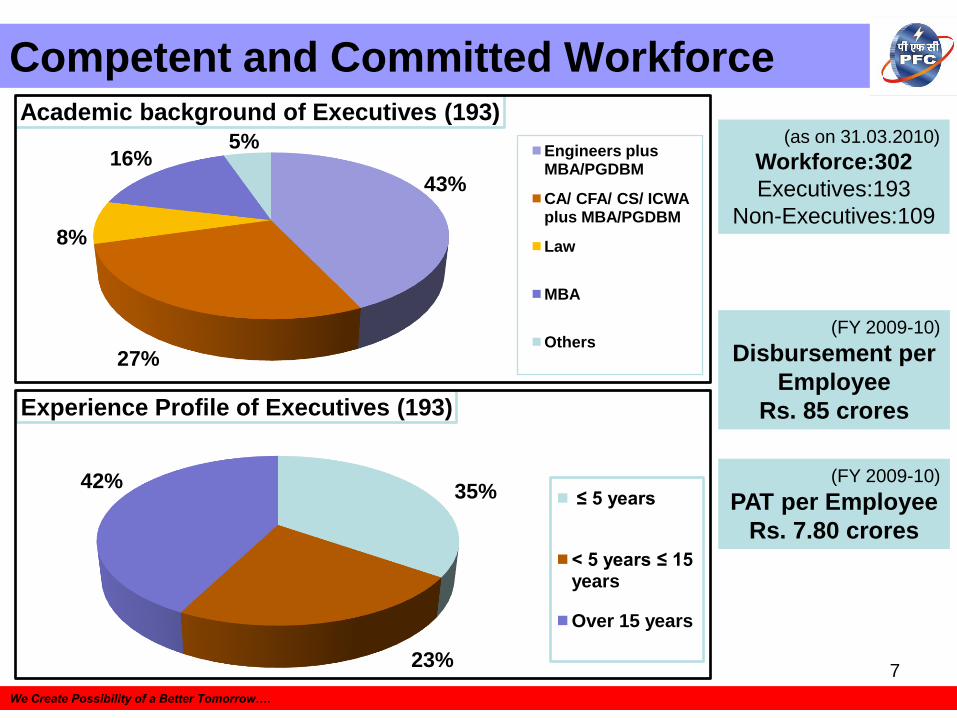
Competent and Committed Workforce
We Create Possibility of a Better Tomorrow….
(as on 31.03.2010)
Workforce:302
Executives:193
Non-Executives:109
(FY 2009-10)
Disbursement per
Employee
Rs. 85 crores
(FY 2009-10)
PAT per Employee
Rs. 7.80 crores
43%
27%
8%
16%5%
Academic background of Executives (193)
Engineers plus MBA/PGDBM
CA/ CFA/ CS/ ICWA plus MBA/PGDBM
Law
MBA
Others
35%
23%
42%
Experience Profile of Executives (193)
≤ 5 years
< 5 years ≤ 15 years
Over 15 years
Performance at a Glance
8
We Create Possibility of a Better Tomorrow….
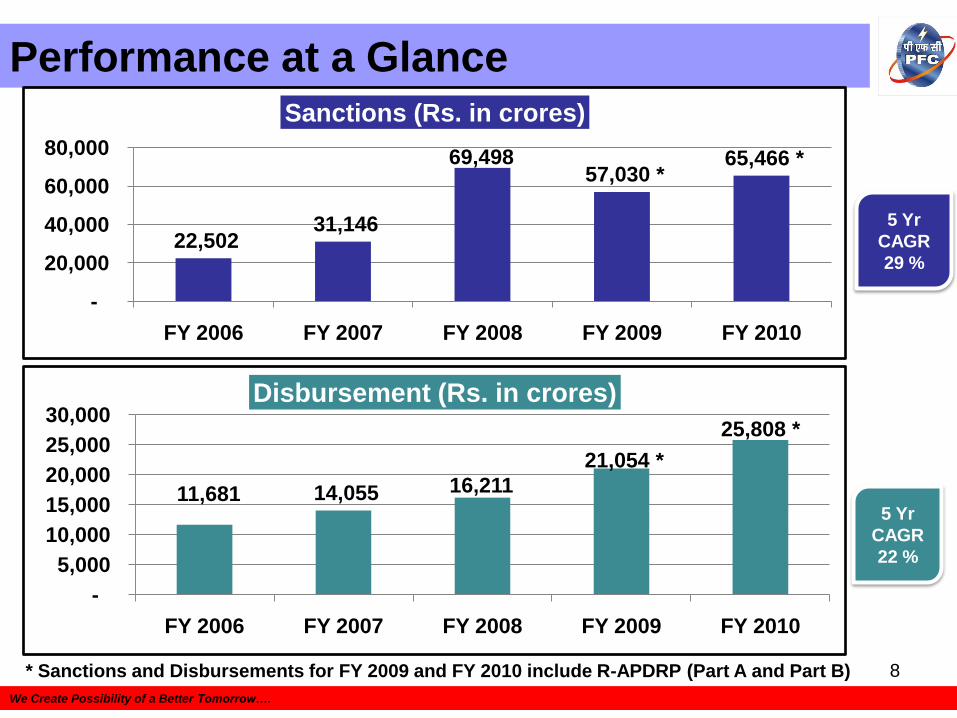
11,681 14,055 16,211
21,054 *
25,808 *
-
5,000
10,000
15,000
20,000
25,000
30,000
FY 2006 FY 2007 FY 2008 FY 2009 FY 2010
Disbursement (Rs. in crores)
5 Yr
CAGR
29 %
5 Yr
CAGR
22 %
22,502 31,146
69,498 57,030 *
65,466 *
-
20,000
40,000
60,000
80,000
FY 2006 FY 2007 FY 2008 FY 2009 FY 2010
Sanctions (Rs. in crores)
* Sanctions and Disbursements for FY 2009 and FY 2010 include R-APDRP (Part A and Part B)
Performance at a Glance
9
We Create Possibility of a Better Tomorrow….
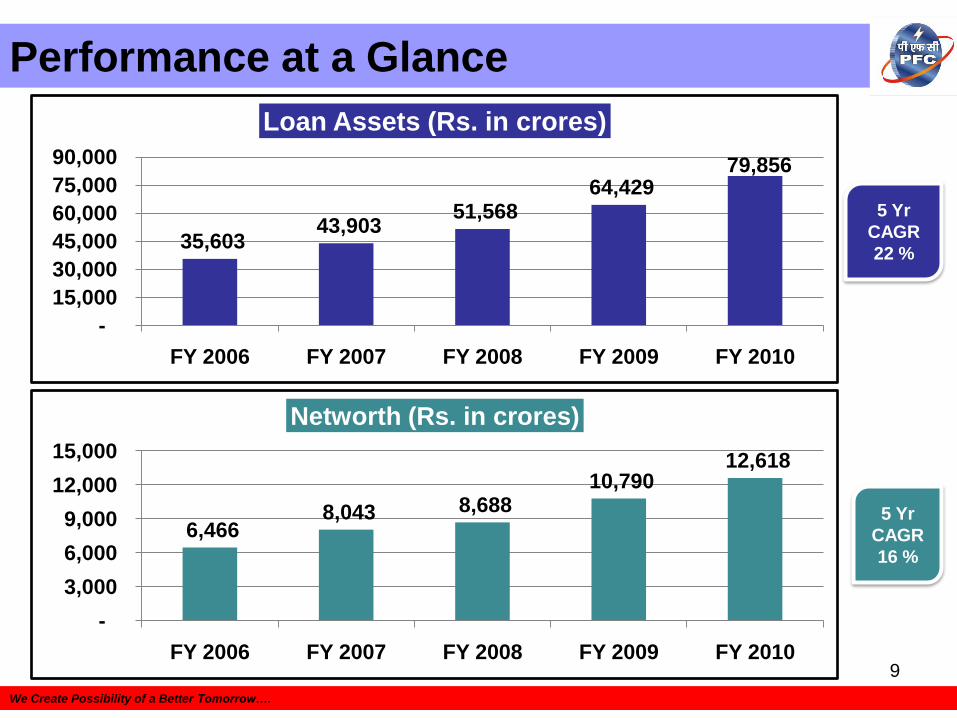
5 Yr
CAGR
22 %
5 Yr
CAGR
16 %
35,603 43,903
51,568 64,429
79,856
-
15,000
30,000
45,000
60,000
75,000
90,000
FY 2006 FY 2007 FY 2008 FY 2009 FY 2010
Loan Assets (Rs. in crores)
6,466 8,043 8,688
10,790 12,618
-
3,000
6,000
9,000
12,000
15,000
FY 2006 FY 2007 FY 2008 FY 2009 FY 2010
Networth (Rs. in crores)
Performance at a Glance
10
We Create Possibility of a Better Tomorrow….
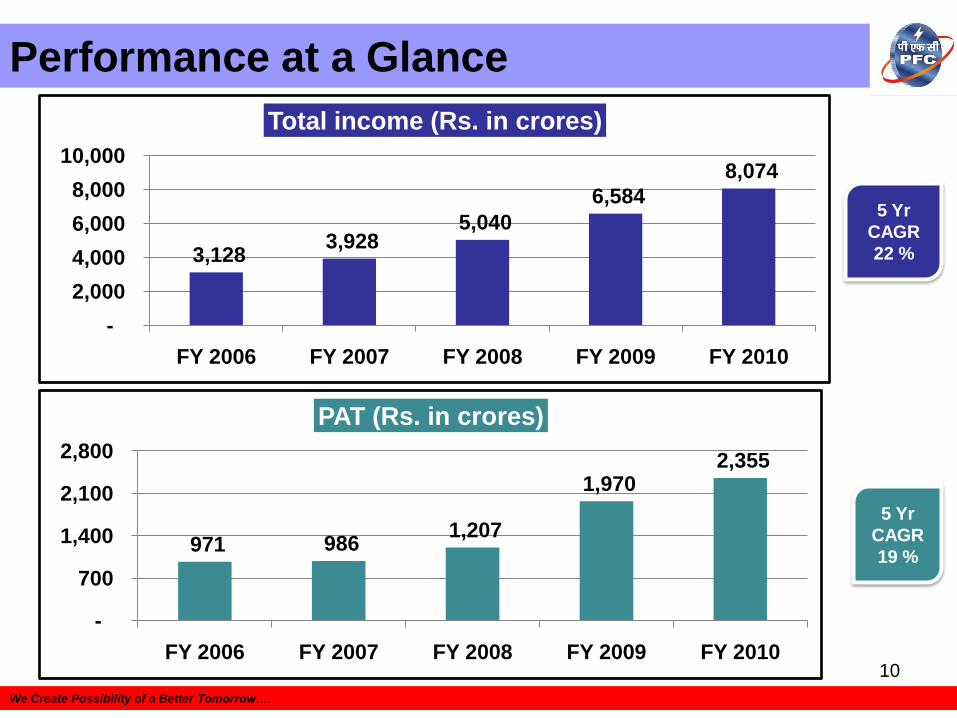
5 Yr
CAGR
22 %
5 Yr
CAGR
19 %
3,128 3,928
5,040
6,584
8,074
-
2,000
4,000
6,000
8,000
10,000
FY 2006 FY 2007 FY 2008 FY 2009 FY 2010
Total income (Rs. in crores)
971 986 1,207
1,970 2,355
-
700
1,400
2,100
2,800
FY 2006 FY 2007 FY 2008 FY 2009 FY 2010
PAT (Rs. in crores)
Performance at a Glance
11
We Create Possibility of a Better Tomorrow….
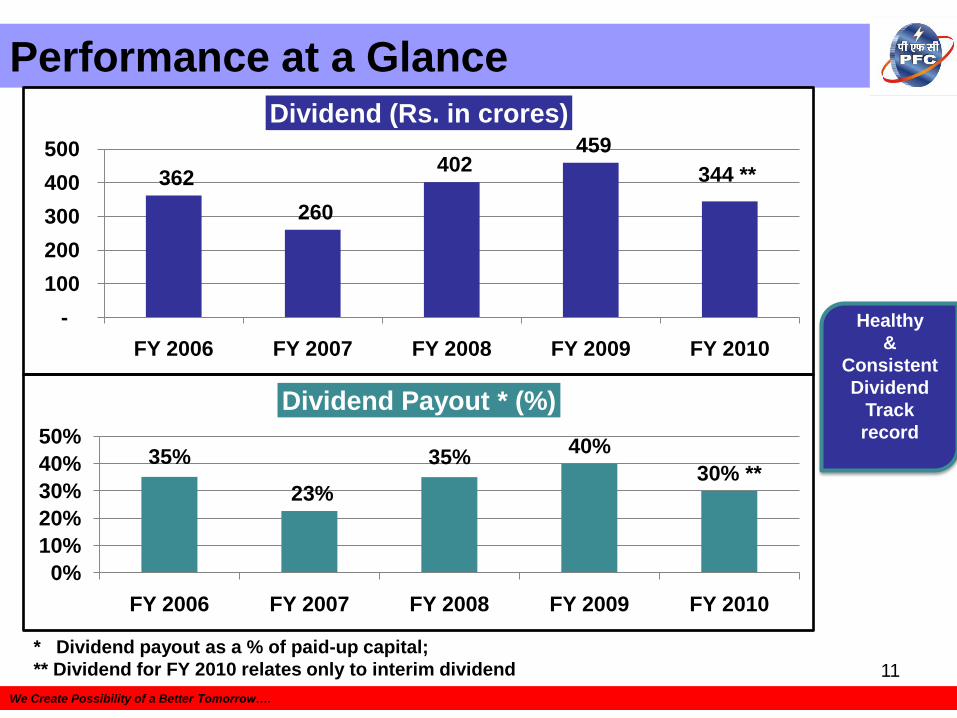
* Dividend payout as a % of paid-up capital;
** Dividend for FY 2010 relates only to interim dividend
362
260
402 459
344 **
-
100
200
300
400
500
FY 2006 FY 2007 FY 2008 FY 2009 FY 2010
Dividend (Rs. in crores)
Healthy
&
Consistent
Dividend
Track
record
35%
23%
35%40%
30% **
0%
10%
20%
30%
40%
50%
FY 2006 FY 2007 FY 2008 FY 2009 FY 2010
Dividend Payout * (%)
12
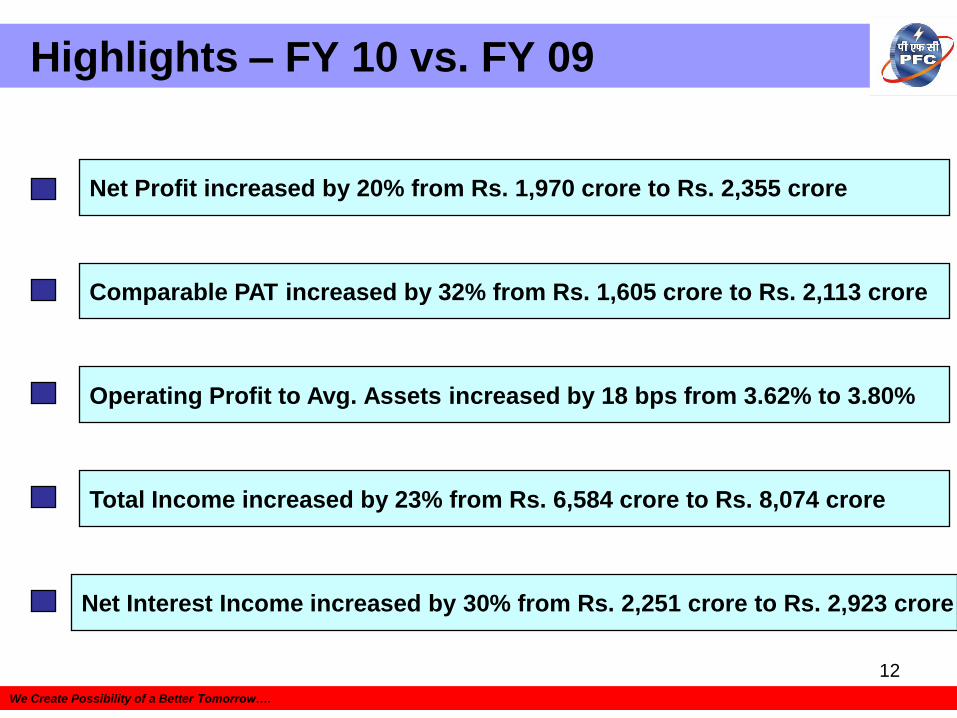
Highlights – FY 10 vs. FY 09
We Create Possibility of a Better Tomorrow….
Comparable PAT increased by 32% from Rs. 1,605 crore to Rs. 2,113 crore
Operating Profit to Avg. Assets increased by 18 bps from 3.62% to 3.80%
Net Interest Income increased by 30% from Rs. 2,251 crore to Rs. 2,923 crore
Net Profit increased by 20% from Rs. 1,970 crore to Rs. 2,355 crore
Total Income increased by 23% from Rs. 6,584 crore to Rs. 8,074 crore
13
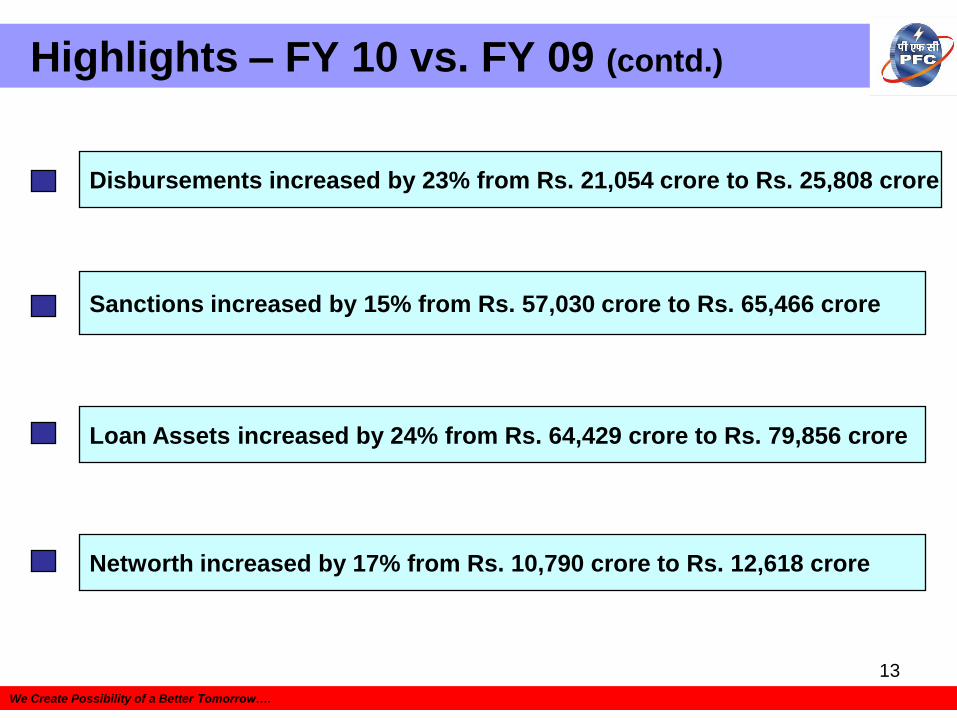
Highlights – FY 10 vs. FY 09 (contd.)
We Create Possibility of a Better Tomorrow….
Sanctions increased by 15% from Rs. 57,030 crore to Rs. 65,466 crore
Loan Assets increased by 24% from Rs. 64,429 crore to Rs. 79,856 crore
Networth increased by 17% from Rs. 10,790 crore to Rs. 12,618 crore
Disbursements increased by 23% from Rs. 21,054 crore to Rs. 25,808 crore
14
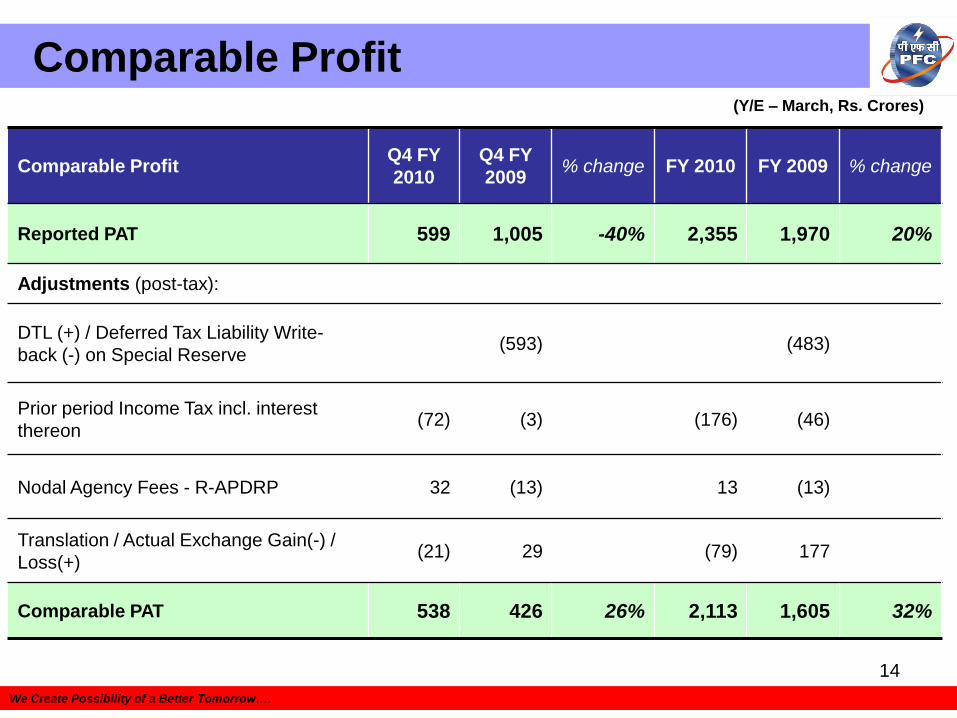
Comparable Profit
We Create Possibility of a Better Tomorrow….
Comparable ProfitQ4 FY
2010
Q4 FY
2009% change FY 2010 FY 2009 % change
Reported PAT 599 1,005 -40% 2,355 1,970 20%
Adjustments (post-tax):
DTL (+) / Deferred Tax Liability Write-
back (-) on Special Reserve(593) (483)
Prior period Income Tax incl. interest
thereon(72) (3) (176) (46)
Nodal Agency Fees - R-APDRP 32 (13) 13 (13)
Translation / Actual Exchange Gain(-) /
Loss(+)(21) 29 (79) 177
Comparable PAT 538 426 26% 2,113 1,605 32%
(Y/E – March, Rs. Crores)
15
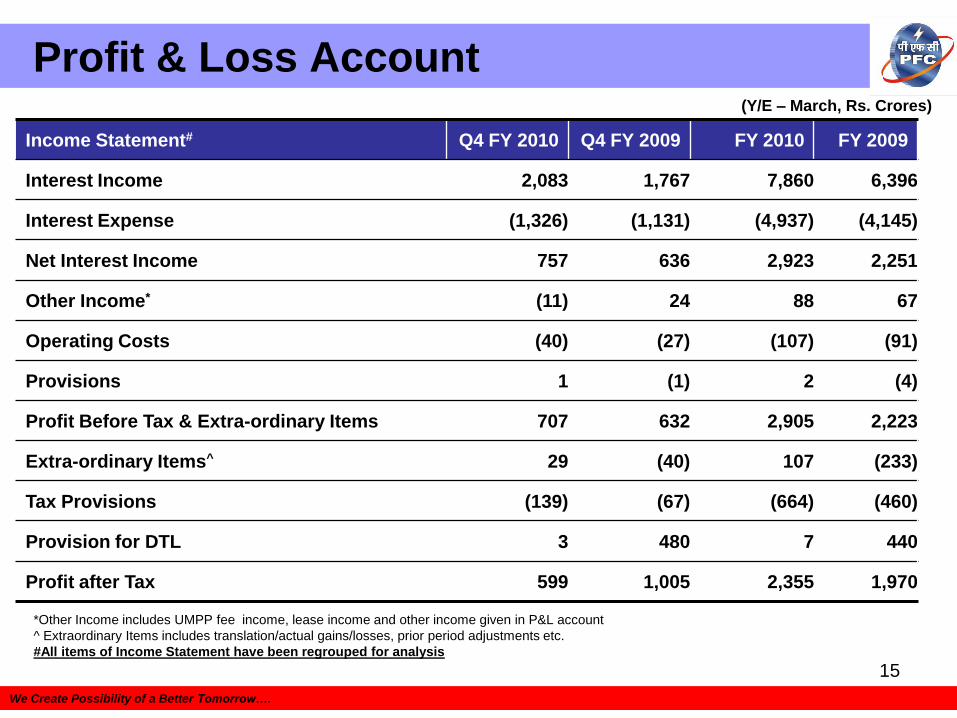
Profit & Loss Account
We Create Possibility of a Better Tomorrow….
Income Statement# Q4 FY 2010 Q4 FY 2009 FY 2010 FY 2009
Interest Income 2,083 1,767 7,860 6,396
Interest Expense (1,326) (1,131) (4,937) (4,145)
Net Interest Income 757 636 2,923 2,251
Other Income* (11) 24 88 67
Operating Costs (40) (27) (107) (91)
Provisions 1 (1) 2 (4)
Profit Before Tax & Extra-ordinary Items 707 632 2,905 2,223
Extra-ordinary Items^ 29 (40) 107 (233)
Tax Provisions (139) (67) (664) (460)
Provision for DTL 3 480 7 440
Profit after Tax 599 1,005 2,355 1,970
*Other Income includes UMPP fee income, lease income and other income given in P&L account
^ Extraordinary Items includes translation/actual gains/losses, prior period adjustments etc.
#All items of Income Statement have been regrouped for analysis
(Y/E – March, Rs. Crores)
16
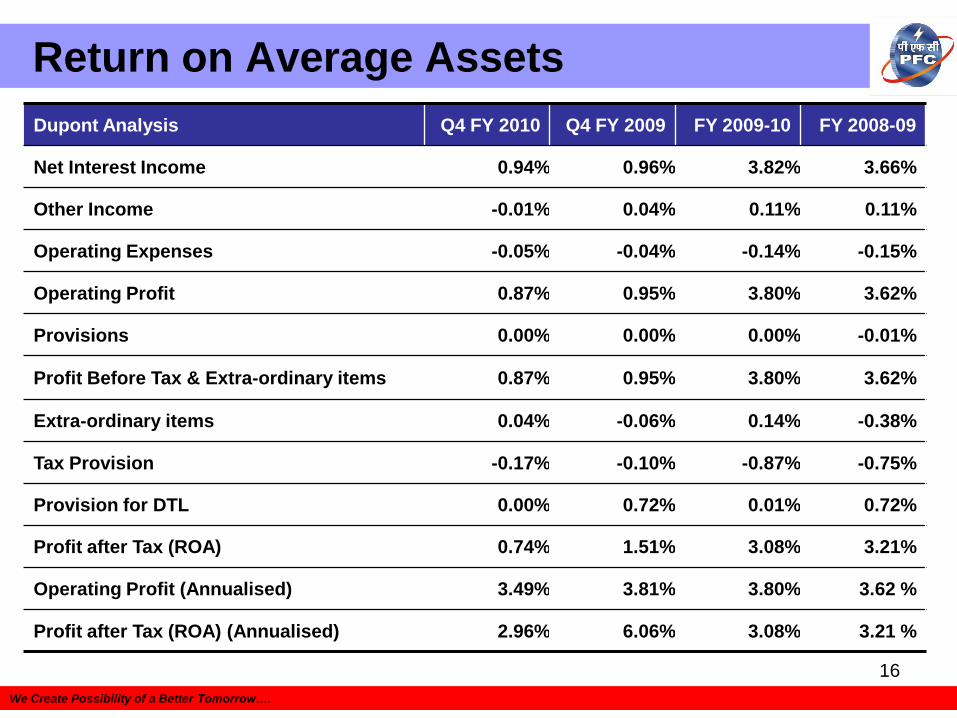
Return on Average Assets
We Create Possibility of a Better Tomorrow….
Dupont Analysis Q4 FY 2010 Q4 FY 2009 FY 2009-10 FY 2008-09
Net Interest Income 0.94% 0.96% 3.82% 3.66%
Other Income -0.01% 0.04% 0.11% 0.11%
Operating Expenses -0.05% -0.04% -0.14% -0.15%
Operating Profit 0.87% 0.95% 3.80% 3.62%
Provisions 0.00% 0.00% 0.00% -0.01%
Profit Before Tax & Extra-ordinary items 0.87% 0.95% 3.80% 3.62%
Extra-ordinary items 0.04% -0.06% 0.14% -0.38%
Tax Provision -0.17% -0.10% -0.87% -0.75%
Provision for DTL 0.00% 0.72% 0.01% 0.72%
Profit after Tax (ROA) 0.74% 1.51% 3.08% 3.21%
Operating Profit (Annualised) 3.49% 3.81% 3.80% 3.62 %
Profit after Tax (ROA) (Annualised) 2.96% 6.06% 3.08% 3.21 %
17
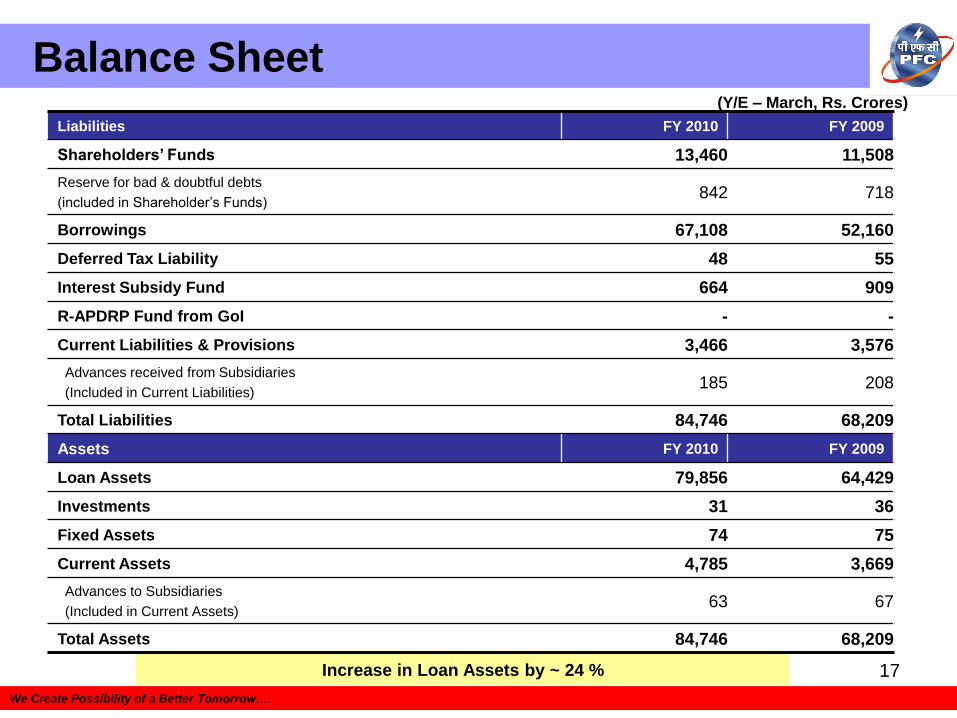
Balance Sheet
We Create Possibility of a Better Tomorrow….
Liabilities FY 2010 FY 2009
Shareholders‟ Funds 13,460 11,508
Reserve for bad & doubtful debts
(included in Shareholder’s Funds)842 718
Borrowings 67,108 52,160
Deferred Tax Liability 48 55
Interest Subsidy Fund 664 909
R-APDRP Fund from GoI - -
Current Liabilities & Provisions 3,466 3,576
Advances received from Subsidiaries
(Included in Current Liabilities)185 208
Total Liabilities 84,746 68,209
Assets FY 2010 FY 2009
Loan Assets 79,856 64,429
Investments 31 36
Fixed Assets 74 75
Current Assets 4,785 3,669
Advances to Subsidiaries
(Included in Current Assets)63 67
Total Assets 84,746 68,209
(Y/E – March, Rs. Crores)
Increase in Loan Assets by ~ 24 %
18
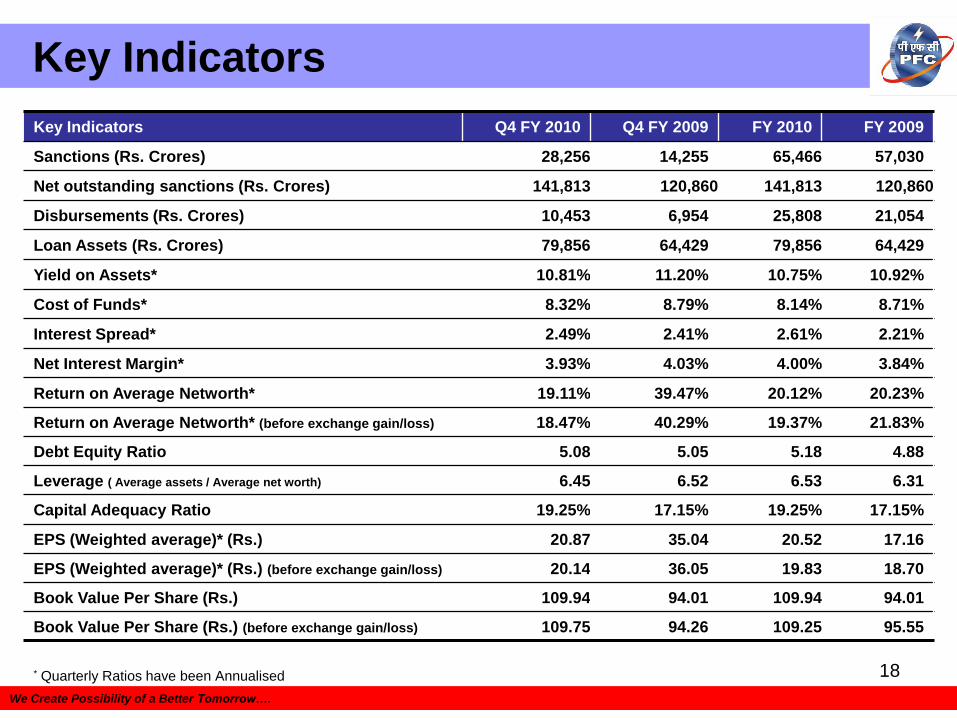
Key Indicators
We Create Possibility of a Better Tomorrow….
Key Indicators Q4 FY 2010 Q4 FY 2009 FY 2010 FY 2009
Sanctions (Rs. Crores) 28,256 14,255 65,466 57,030
Net outstanding sanctions (Rs. Crores) 141,813 120,860 141,813 120,860
Disbursements (Rs. Crores) 10,453 6,954 25,808 21,054
Loan Assets (Rs. Crores) 79,856 64,429 79,856 64,429
Yield on Assets* 10.81% 11.20% 10.75% 10.92%
Cost of Funds* 8.32% 8.79% 8.14% 8.71%
Interest Spread* 2.49% 2.41% 2.61% 2.21%
Net Interest Margin* 3.93% 4.03% 4.00% 3.84%
Return on Average Networth* 19.11% 39.47% 20.12% 20.23%
Return on Average Networth* (before exchange gain/loss) 18.47% 40.29% 19.37% 21.83%
Debt Equity Ratio 5.08 5.05 5.18 4.88
Leverage ( Average assets / Average net worth) 6.45 6.52 6.53 6.31
Capital Adequacy Ratio 19.25% 17.15% 19.25% 17.15%
EPS (Weighted average)* (Rs.) 20.87 35.04 20.52 17.16
EPS (Weighted average)* (Rs.) (before exchange gain/loss) 20.14 36.05 19.83 18.70
Book Value Per Share (Rs.) 109.94 94.01 109.94 94.01
Book Value Per Share (Rs.) (before exchange gain/loss) 109.75 94.26 109.25 95.55
* Quarterly Ratios have been Annualised
19
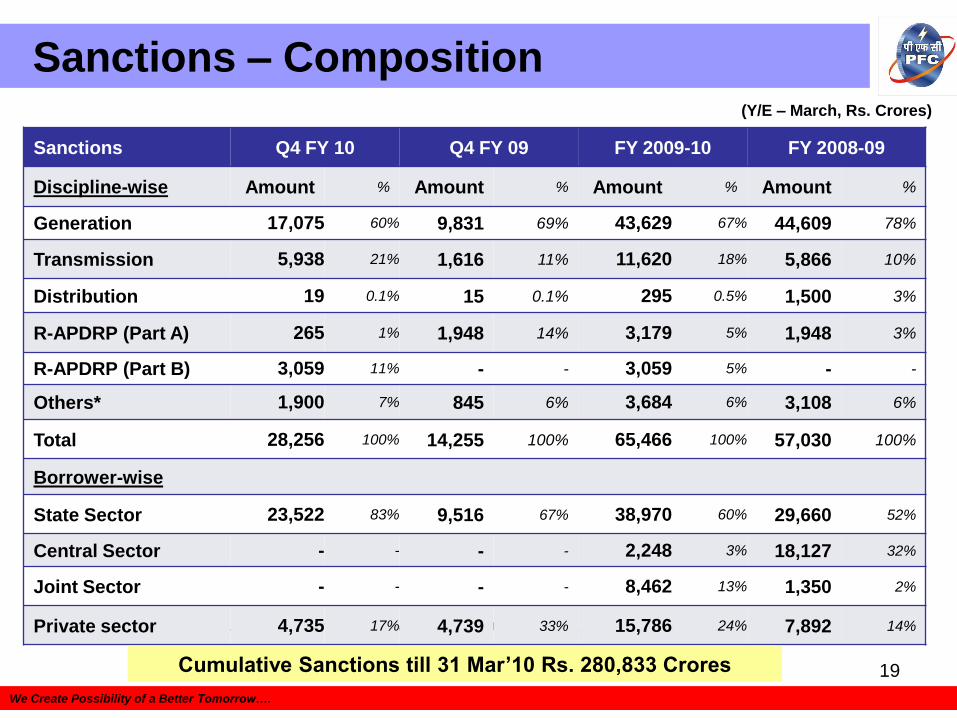
Sanctions – Composition
We Create Possibility of a Better Tomorrow….
(Y/E – March, Rs. Crores)
* Includes Computerisation, Studies, Short Term Loans, Buyer Line of Credit and Decentralised Management
Sanctions Q4 FY 10 Q4 FY 09 FY 2009-10 FY 2008-09
Discipline-wise Amount % Amount % Amount % Amount %
Generation 17,075 60% 9,831 69% 43,629 67% 44,609 78%
Transmission 5,938 21% 1,616 11% 11,620 18% 5,866 10%
Distribution 19 0.1% 15 0.1% 295 0.5% 1,500 3%
R-APDRP (Part A) 265 1% 1,948 14% 3,179 5% 1,948 3%
R-APDRP (Part B) 3,059 11% - - 3,059 5% - -
Others* 1,900 7% 845 6% 3,684 6% 3,108 6%
Total 28,256 100% 14,255 100% 65,466 100% 57,030 100%
Borrower-wise
State Sector 23,522 83% 9,516 67% 38,970 60% 29,660 52%
Central Sector - - - - 2,248 3% 18,127 32%
Joint Sector - - - - 8,462 13% 1,350 2%
Private sector 4,735 17% 4,739 33% 15,786 24% 7,892 14%
Cumulative Sanctions till 31 Mar‟10 Rs. 280,833 Crores
20
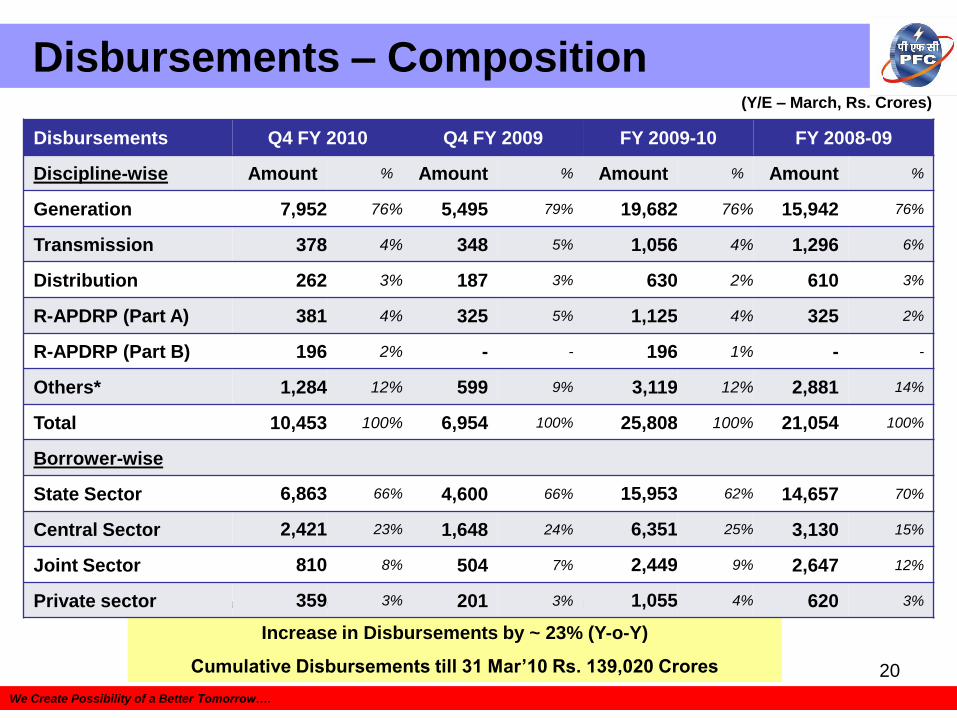
Disbursements – Composition
We Create Possibility of a Better Tomorrow….
(Y/E – March, Rs. Crores)
* Includes Computerisation, Studies, Short Term Loans, Buyer Line of Credit and Decentralised Management
Increase in Disbursements by ~ 23% (Y-o-Y)
Cumulative Disbursements till 31 Mar‟10 Rs. 139,020 Crores
Disbursements Q4 FY 2010 Q4 FY 2009 FY 2009-10 FY 2008-09
Discipline-wise Amount % Amount % Amount % Amount %
Generation 7,952 76% 5,495 79% 19,682 76% 15,942 76%
Transmission 378 4% 348 5% 1,056 4% 1,296 6%
Distribution 262 3% 187 3% 630 2% 610 3%
R-APDRP (Part A) 381 4% 325 5% 1,125 4% 325 2%
R-APDRP (Part B) 196 2% - - 196 1% - -
Others* 1,284 12% 599 9% 3,119 12% 2,881 14%
Total 10,453 100% 6,954 100% 25,808 100% 21,054 100%
Borrower-wise
State Sector 6,863 66% 4,600 66% 15,953 62% 14,657 70%
Central Sector 2,421 23% 1,648 24% 6,351 25% 3,130 15%
Joint Sector 810 8% 504 7% 2,449 9% 2,647 12%
Private sector 359 3% 201 3% 1,055 4% 620 3%
21
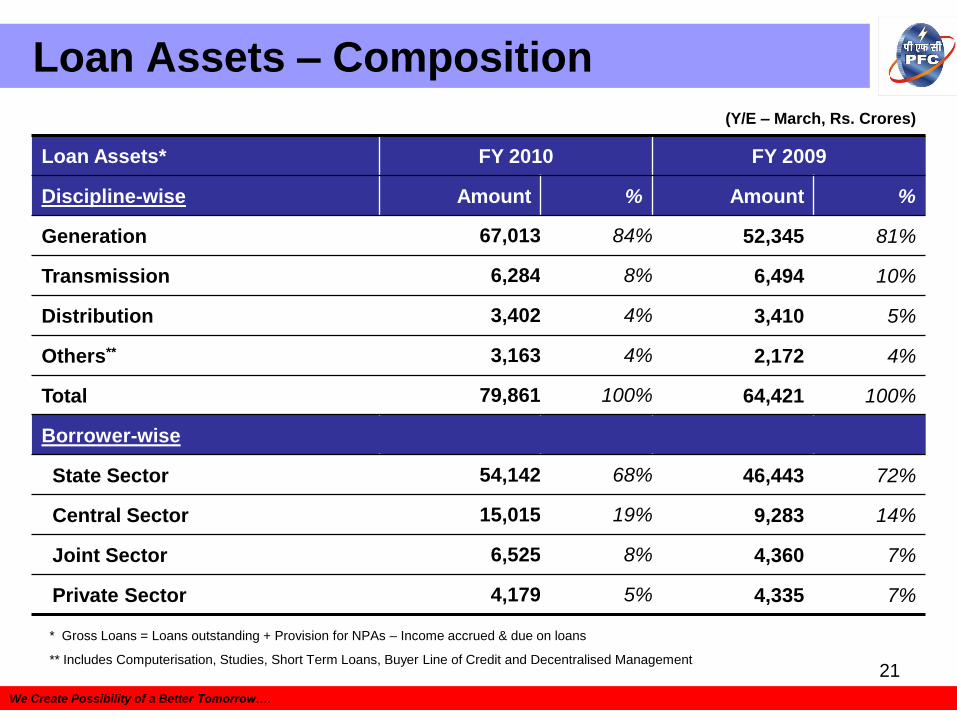
Loan Assets – Composition
We Create Possibility of a Better Tomorrow….
Loan Assets* FY 2010 FY 2009
Discipline-wise Amount % Amount %
Generation 67,013 84% 52,345 81%
Transmission 6,284 8% 6,494 10%
Distribution 3,402 4% 3,410 5%
Others** 3,163 4% 2,172 4%
Total 79,861 100% 64,421 100%
Borrower-wise
State Sector 54,142 68% 46,443 72%
Central Sector 15,015 19% 9,283 14%
Joint Sector 6,525 8% 4,360 7%
Private Sector 4,179 5% 4,335 7%
(Y/E – March, Rs. Crores)
* Gross Loans = Loans outstanding + Provision for NPAs – Income accrued & due on loans
** Includes Computerisation, Studies, Short Term Loans, Buyer Line of Credit and Decentralised Management
22
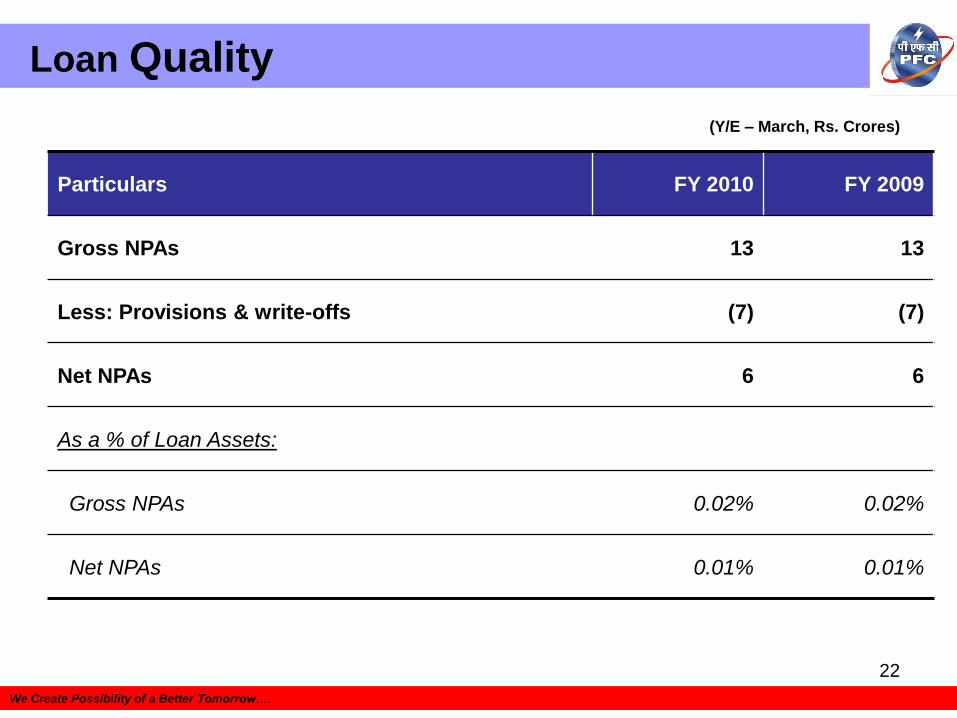
Loan Quality
We Create Possibility of a Better Tomorrow….
Particulars FY 2010 FY 2009
Gross NPAs 13 13
Less: Provisions & write-offs (7) (7)
Net NPAs 6 6
As a % of Loan Assets:
Gross NPAs 0.02% 0.02%
Net NPAs 0.01% 0.01%
(Y/E – March, Rs. Crores)
23
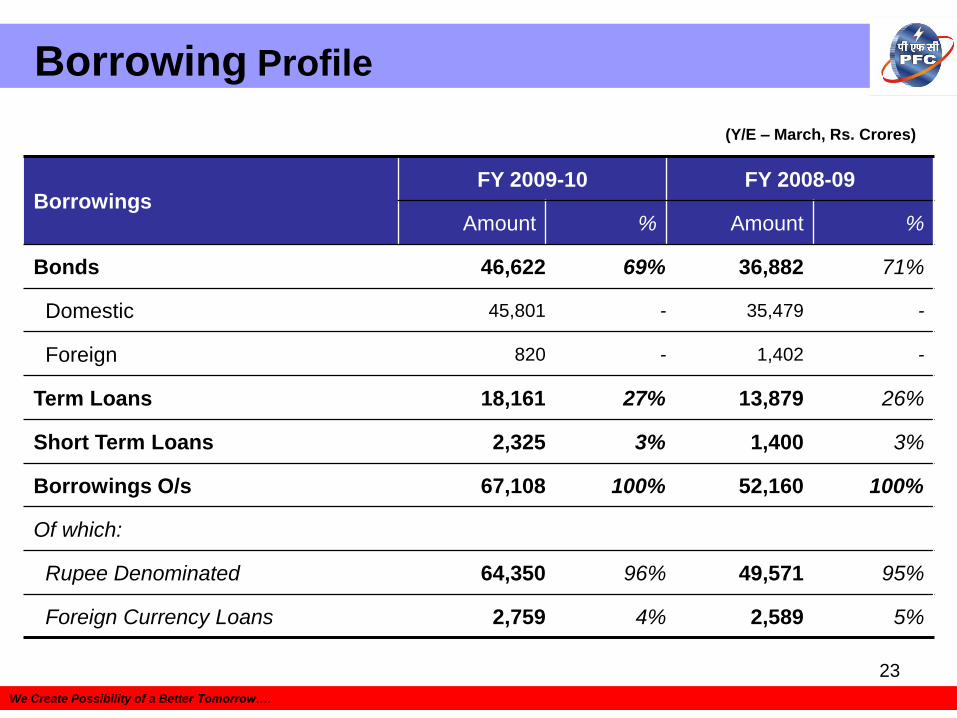
Borrowing Profile
We Create Possibility of a Better Tomorrow….
BorrowingsFY 2009-10 FY 2008-09
Amount % Amount %
Bonds 46,622 69% 36,882 71%
Domestic 45,801 - 35,479 -
Foreign 820 - 1,402 -
Term Loans 18,161 27% 13,879 26%
Short Term Loans 2,325 3% 1,400 3%
Borrowings O/s 67,108 100% 52,160 100%
Of which:
Rupee Denominated 64,350 96% 49,571 95%
Foreign Currency Loans 2,759 4% 2,589 5%
(Y/E – March, Rs. Crores)
24
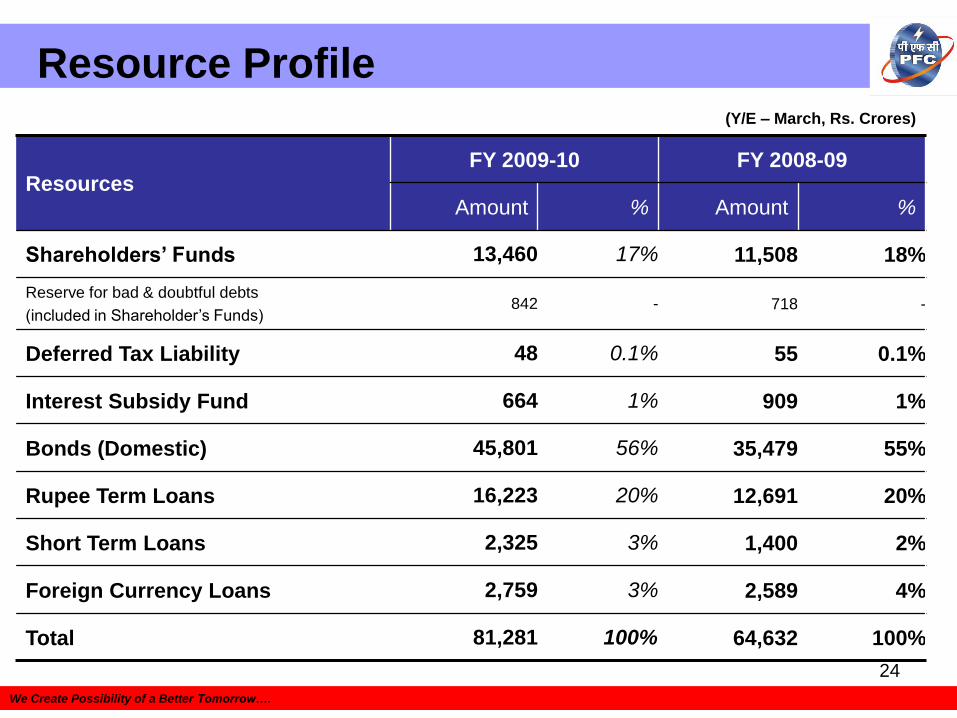
Resource Profile
We Create Possibility of a Better Tomorrow….
ResourcesFY 2009-10 FY 2008-09
Amount % Amount %
Shareholders‟ Funds 13,460 17% 11,508 18%
Reserve for bad & doubtful debts
(included in Shareholder’s Funds)842 - 718 -
Deferred Tax Liability 48 0.1% 55 0.1%
Interest Subsidy Fund 664 1% 909 1%
Bonds (Domestic) 45,801 56% 35,479 55%
Rupee Term Loans 16,223 20% 12,691 20%
Short Term Loans 2,325 3% 1,400 2%
Foreign Currency Loans 2,759 3% 2,589 4%
Total 81,281 100% 64,632 100%
(Y/E – March, Rs. Crores)
25
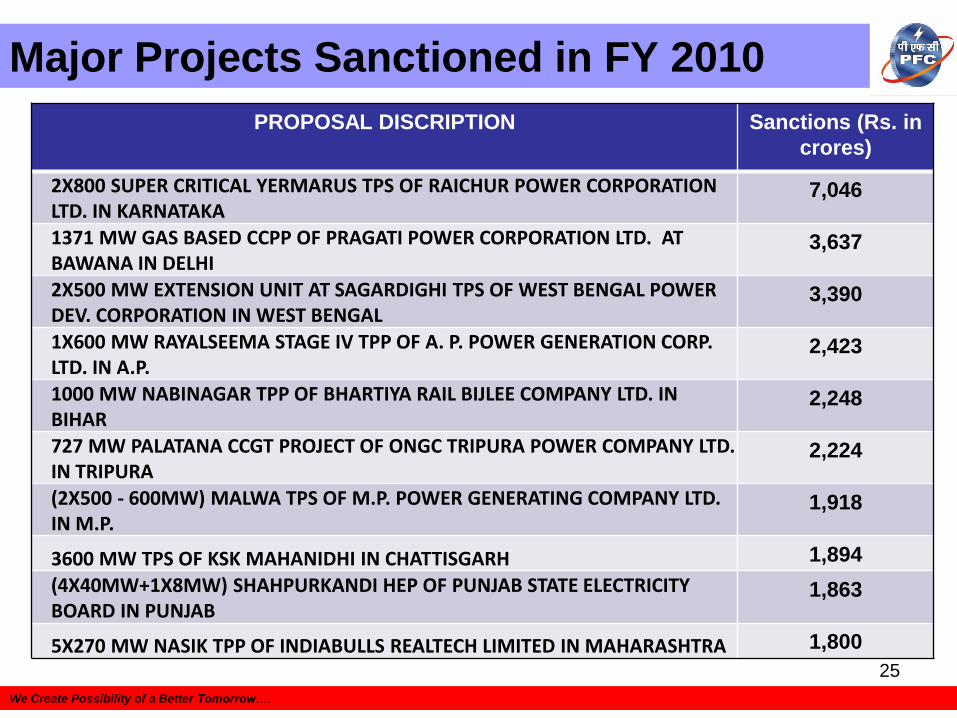
Major Projects Sanctioned in FY 2010
We Create Possibility of a Better Tomorrow….
PROPOSAL DISCRIPTION Sanctions (Rs. in
crores)
2X800 SUPER CRITICAL YERMARUS TPS OF RAICHUR POWER CORPORATION LTD. IN KARNATAKA
7,046
1371 MW GAS BASED CCPP OF PRAGATI POWER CORPORATION LTD. AT BAWANA IN DELHI
3,637
2X500 MW EXTENSION UNIT AT SAGARDIGHI TPS OF WEST BENGAL POWER DEV. CORPORATION IN WEST BENGAL
3,390
1X600 MW RAYALSEEMA STAGE IV TPP OF A. P. POWER GENERATION CORP. LTD. IN A.P.
2,423
1000 MW NABINAGAR TPP OF BHARTIYA RAIL BIJLEE COMPANY LTD. IN BIHAR
2,248
727 MW PALATANA CCGT PROJECT OF ONGC TRIPURA POWER COMPANY LTD. IN TRIPURA
2,224
(2X500 - 600MW) MALWA TPS OF M.P. POWER GENERATING COMPANY LTD. IN M.P.
1,918
3600 MW TPS OF KSK MAHANIDHI IN CHATTISGARH 1,894
(4X40MW+1X8MW) SHAHPURKANDI HEP OF PUNJAB STATE ELECTRICITY BOARD IN PUNJAB
1,863
5X270 MW NASIK TPP OF INDIABULLS REALTECH LIMITED IN MAHARASHTRA 1,800

Key Performance Targets for FY 2010-11
26
PARAMETERS Amount (Rs. in
crores)
Sanctions 69,000
Other than R-APDRP 60,000
R-APDRP 9,000
Disbursements 29,500
Other than R-APDRP 27,000
R-APDRP 2,500
Resource mobilisation 27,700
27
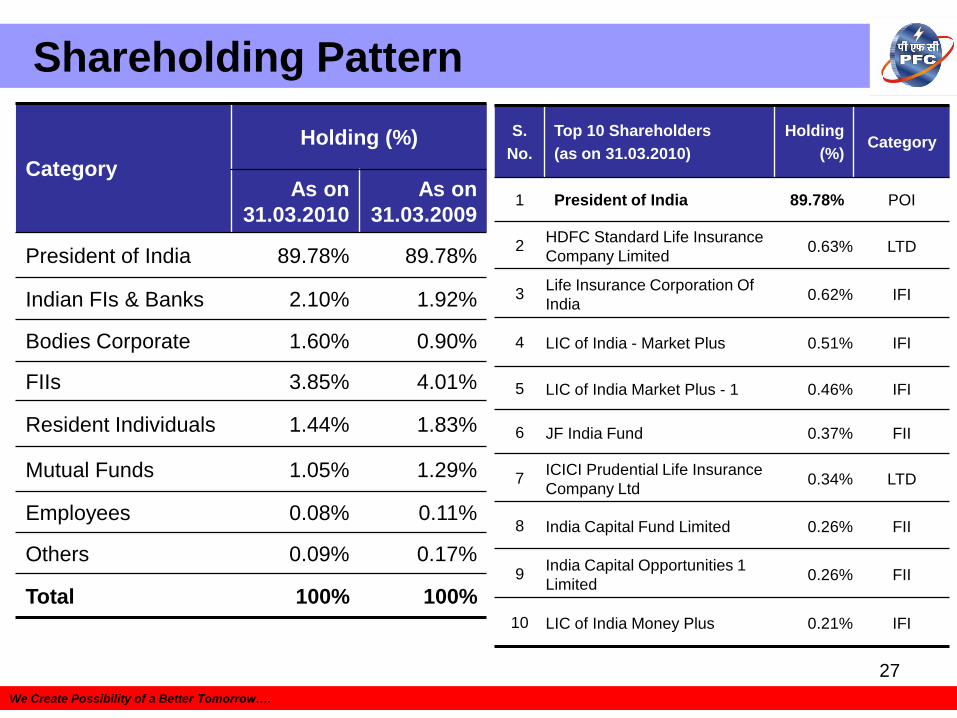
Shareholding Pattern
Category
Holding (%)
As on
31.03.2010
As on
31.03.2009
President of India 89.78% 89.78%
Indian FIs & Banks 2.10% 1.92%
Bodies Corporate 1.60% 0.90%
FIIs 3.85% 4.01%
Resident Individuals 1.44% 1.83%
Mutual Funds 1.05% 1.29%
Employees 0.08% 0.11%
Others 0.09% 0.17%
Total 100% 100%
We Create Possibility of a Better Tomorrow….
S.
No.
Top 10 Shareholders
(as on 31.03.2010)
Holding
(%)Category
1 President of India 89.78% POI
2HDFC Standard Life Insurance
Company Limited0.63% LTD
3Life Insurance Corporation Of
India0.62% IFI
4 LIC of India - Market Plus 0.51% IFI
5 LIC of India Market Plus - 1 0.46% IFI
6 JF India Fund 0.37% FII
7ICICI Prudential Life Insurance
Company Ltd0.34% LTD
8 India Capital Fund Limited 0.26% FII
9India Capital Opportunities 1
Limited0.26% FII
10 LIC of India Money Plus 0.21% IFI

28
Thank You!
We Create Possibility of a Better Tomorrow….
Related Documents