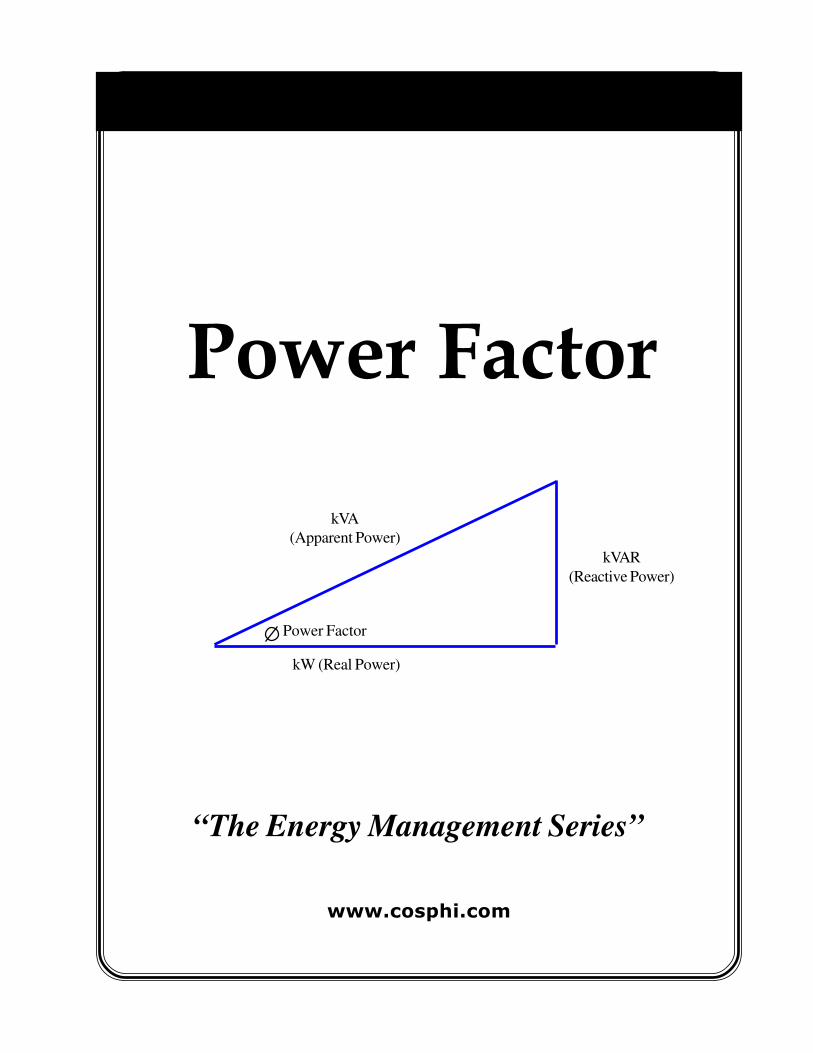
Power Factor “The Energy Management Series” kVA (Apparent Power) kVAR (Reactive Power) kW (Real Power) Power Factor www.cosphi.com

Welcome message from author
This document is posted to help you gain knowledge. Please leave a comment to let me know what you think about it! Share it to your friends and learn new things together.
Transcript
Power Factor
“The Energy Management Series”
kVA
(Apparent Power)
kVAR
(Reactive Power)
kW (Real Power)
Power Factor
www.cosphi.com
POWER FACTOR
2
POWER FACTOREnergy Management Series
Re-published by:
Cos Phi Inc.
240 Huckins St, P.O. Box 24
Goderich, Ontario
N7A 3Y5
Ph: (519) 440-0454
Fax: (519) 440-0446
www.cosphi.com
Originally published by:
Ontario Hydro

POWER FACTOR
3
Introduction
As energy costs continue to represent an increasing proportion of the overall cost of doing
business, energy management has become an important activity. Understanding power
factor and how it affects your company’s electricity bill can help reduce power costs.
Power Factor gives a reading of overall electricity use efficiency. High power factor indi-
cates that the amount of power doing real work is operating at a high level of efficiency.
Conversely, low power factor means poor electricity efficiency which is always costly.
Improving power factor can reduce billed peak demand and enhance equipment reliability.
Power factor is not an easy subject to discuss without some knowledge of electricity. The
section on Electricity basics provides a refresher of electricity and electrical power compo-
nents.
POWER FACTOR
4
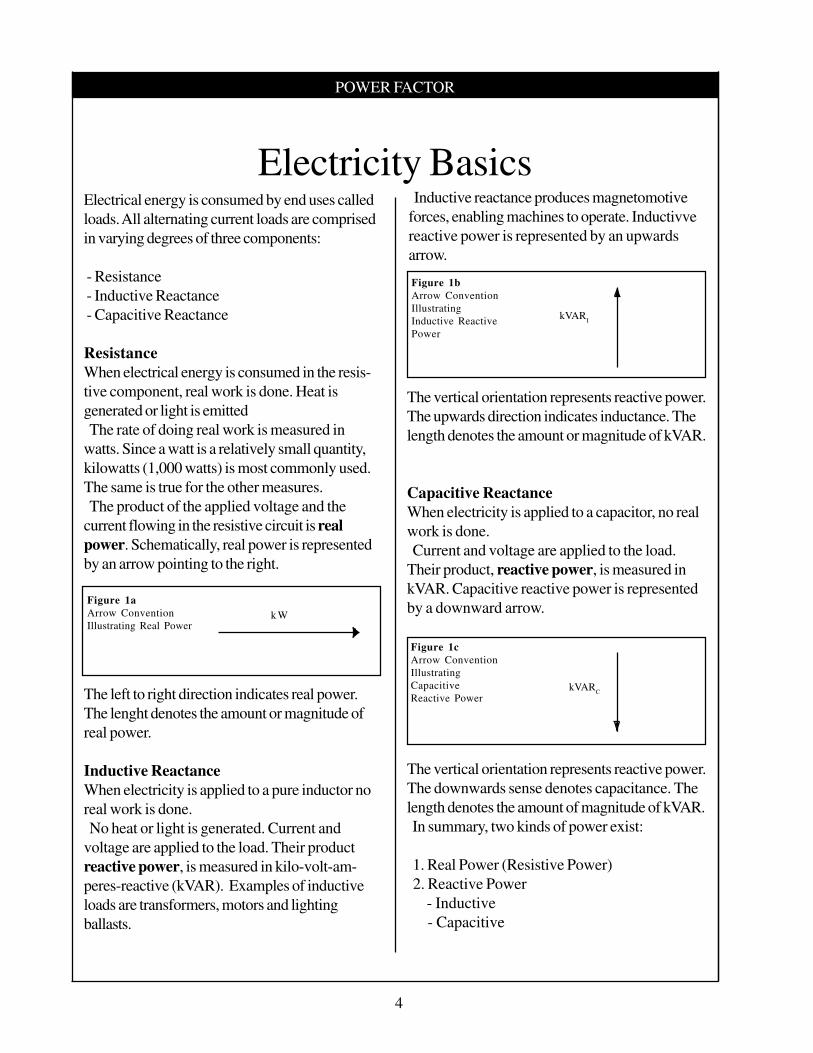
Electricity BasicsElectrical energy is consumed by end uses called
loads. All alternating current loads are comprised
in varying degrees of three components:
- Resistance
- Inductive Reactance
- Capacitive Reactance
Resistance
When electrical energy is consumed in the resis-
tive component, real work is done. Heat is
generated or light is emitted
The rate of doing real work is measured in
watts. Since a watt is a relatively small quantity,
kilowatts (1,000 watts) is most commonly used.
The same is true for the other measures.
The product of the applied voltage and the
current flowing in the resistive circuit is real
power. Schematically, real power is represented
by an arrow pointing to the right.
The left to right direction indicates real power.
The lenght denotes the amount or magnitude of
real power.
Inductive Reactance
When electricity is applied to a pure inductor no
real work is done.
No heat or light is generated. Current and
voltage are applied to the load. Their product
reactive power, is measured in kilo-volt-am-
peres-reactive (kVAR). Examples of inductive
loads are transformers, motors and lighting
ballasts.
The vertical orientation represents reactive power.
The upwards direction indicates inductance. The
length denotes the amount or magnitude of kVAR.
Capacitive Reactance
When electricity is applied to a capacitor, no real
work is done.
Current and voltage are applied to the load.
Their product, reactive power, is measured in
kVAR. Capacitive reactive power is represented
by a downward arrow.
Figure 1c
Arrow Convention
Illustrating
Capacitive
Reactive PowerkVAR
C
The vertical orientation represents reactive power.
The downwards sense denotes capacitance. The
length denotes the amount of magnitude of kVAR.
In summary, two kinds of power exist:
1. Real Power (Resistive Power)
2. Reactive Power
- Inductive
- Capacitive
Figure 1b
Arrow Convention
Illustrating
Inductive Reactive
Power
kVARI
Inductive reactance produces magnetomotive
forces, enabling machines to operate. Inductivve
reactive power is represented by an upwards
arrow.
Figure 1a
Arrow Convention
Illustrating Real Powerk W

POWER FACTOR
5
Power Triangle
Pure resistance, pure capacitance and pure
inductance exist only in theory. All real life loads
exhibit varying proportions of these three compo-
nents. Using arrow conventions and vector
addition rules a typical industrial plant’s electrical
load can be represented by a power triangle. The
power triangle describes the quality of power
used.
Real Power (Figure 1a) plus Inductive Reactive
Power (Figure 1b) results in a power triangle as
shown in Figure 2.
Apparent Power
Total power is referred to as apparent power. It
is the vector sum of real power and reactive
power and is measured in kilo-volt-amperes
(kVA). The hypotenuse closing the power triangle
represents apparent power. (See Figure 4.)
Billed Demand
The maximum rate of electrical consumption or
demand charge, measured in kW and the total
amount of energy consumed, or energy charge,
measured in kWh are calculated each month for
billing purpsoes. The demand charges applies to
the peak demand at which energy is taken and
the energy charge applies to the quality of the
electricity consumed during the billing period.
Billed demand is calculated according to the
way in which electrical power is used. It is made
up of two components:
1. Real Power (Resistive)
2. Reactive Power
- Inductive
- Capacitive
Given a fixed maximum rate of real work done
(kW) the length of the hypotenuse (kVA) varies
depending upon the amount of reactive power
(kVAR). Billed demand is based on the peak
value of 100 per cent of the kW or 90 per cent
of the kVA, whichever is larger. Thus the length
of the hypotenuse (kVA) influences the demand
portion of the electricity bill.
As soon as the kVAR component of the load
reaches the point where 90 per cent of the kVA is
larger than the total kW, the electrical billing
demand charge increases for the same amount of
work done.
Although only the power absorbed in the
resistive component of a load does real work the
principle of supplying power at cost dictates that
reactive power components must also be billed.
Real Power (Figure 1a) plus Capacitive Reac-
tive Power (Figure 1c) results in a power triangle
as shown in Figure 3.
Figure 2
Power Triangle
Illustrating
Inductive
Reactive PowerReal Power (kW)
Reactive
Power
(kVARI)
Inductive reactive loads are usually greater than
capacitive loads. When inductive reactive power
is greater it can be reduced by adding capacitive
reactive power. The power triangle is adjusted as
shown in Figure 4.
Figure 4
Effect of
Capacitance
in Reducing
Inductive
Load
Real Power (kW)
kVARI
Resultant
(kVARC)
Reduces
(kVARI)Apparent Power
(kVA)
Figure 3
Power Triangle
Illustrating
Capacitive
Reactive Power
Real Power (kW)
Reactive
Power
(kVARC)
POWER FACTOR
6
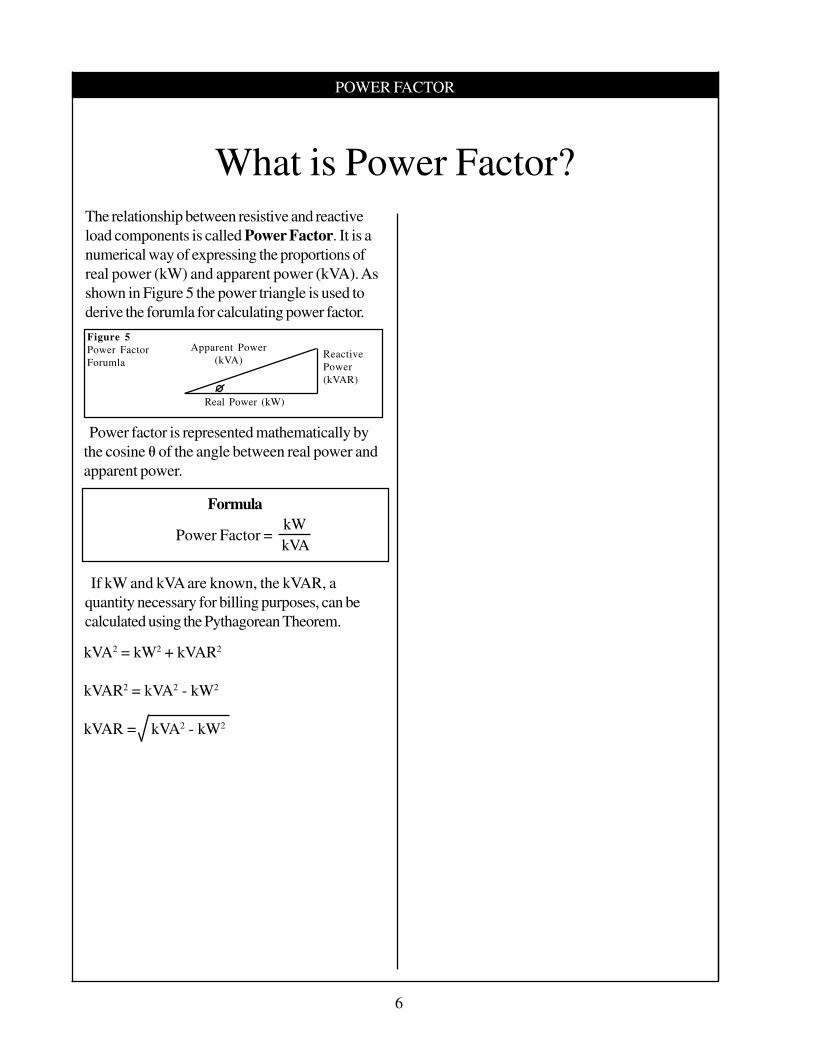
The relationship between resistive and reactive
load components is called Power Factor. It is a
numerical way of expressing the proportions of
real power (kW) and apparent power (kVA). As
shown in Figure 5 the power triangle is used to
derive the forumla for calculating power factor.
Figure 5
Power Factor
Forumla
Real Power (kW)
Reactive
Power
(kVAR)
Apparent Power
(kVA)
Power factor is represented mathematically by
the cosine θ of the angle between real power and
apparent power.
If kW and kVA are known, the kVAR, a
quantity necessary for billing purposes, can be
calculated using the Pythagorean Theorem.
Formula
Power Factor =kW
kVA
kVA2 = kW2 + kVAR2
kVAR2 = kVA2 - kW2
kVAR = kVA2 - kW2
What is Power Factor?
POWER FACTOR
7
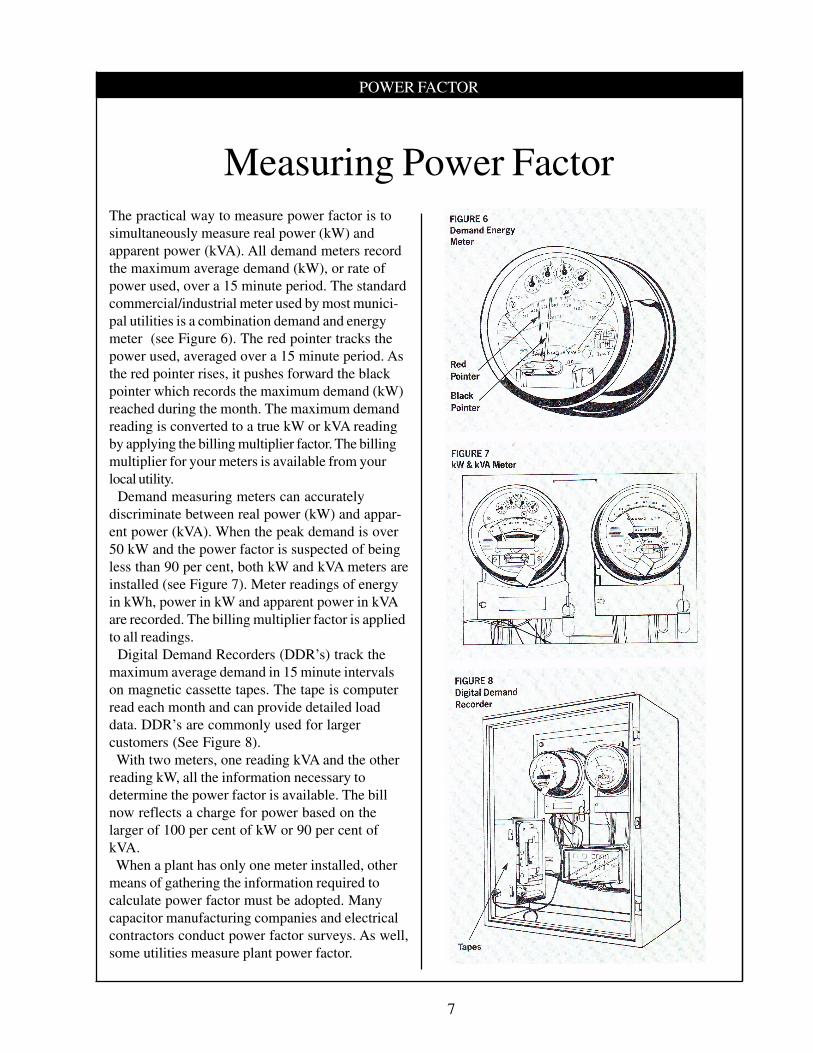
The practical way to measure power factor is to
simultaneously measure real power (kW) and
apparent power (kVA). All demand meters record
the maximum average demand (kW), or rate of
power used, over a 15 minute period. The standard
commercial/industrial meter used by most munici-
pal utilities is a combination demand and energy
meter (see Figure 6). The red pointer tracks the
power used, averaged over a 15 minute period. As
the red pointer rises, it pushes forward the black
pointer which records the maximum demand (kW)
reached during the month. The maximum demand
reading is converted to a true kW or kVA reading
by applying the billing multiplier factor. The billing
multiplier for your meters is available from your
local utility.
Demand measuring meters can accurately
discriminate between real power (kW) and appar-
ent power (kVA). When the peak demand is over
50 kW and the power factor is suspected of being
less than 90 per cent, both kW and kVA meters are
installed (see Figure 7). Meter readings of energy
in kWh, power in kW and apparent power in kVA
are recorded. The billing multiplier factor is applied
to all readings.
Digital Demand Recorders (DDR’s) track the
maximum average demand in 15 minute intervals
on magnetic cassette tapes. The tape is computer
read each month and can provide detailed load
data. DDR’s are commonly used for larger
customers (See Figure 8).
With two meters, one reading kVA and the other
reading kW, all the information necessary to
determine the power factor is available. The bill
now reflects a charge for power based on the
larger of 100 per cent of kW or 90 per cent of
kVA.
When a plant has only one meter installed, other
means of gathering the information required to
calculate power factor must be adopted. Many
capacitor manufacturing companies and electrical
contractors conduct power factor surveys. As well,
some utilities measure plant power factor.
Measuring Power Factor
POWER FACTOR
8
Poor power factor increases billed demand. It
costs Ontario industry millions of dollars annually.
In an electrical circuit with poor power factor a
large portion of the current does no useful work
and is not registered at the energy (kWh) meter.
In order for the utility to maintain the equipment
necessary to compensate for the increased
reactive power (kVAR), billed demand is in-
creased accordingly.
Although reacitve power (kVAR) does no useful
work it is necessary to make machinery operate.
Most utilities allow a percentage of reactive
power to be billed at no additional charge, though
this has being phased out over recent years. Poor
power factor results in higher than necessary
kVAR use and increases electricity costs. Power
factor billing charges are levied if the power factor
is below 90 per cent. This is sometimes referred
to as Power Factor Penalty.
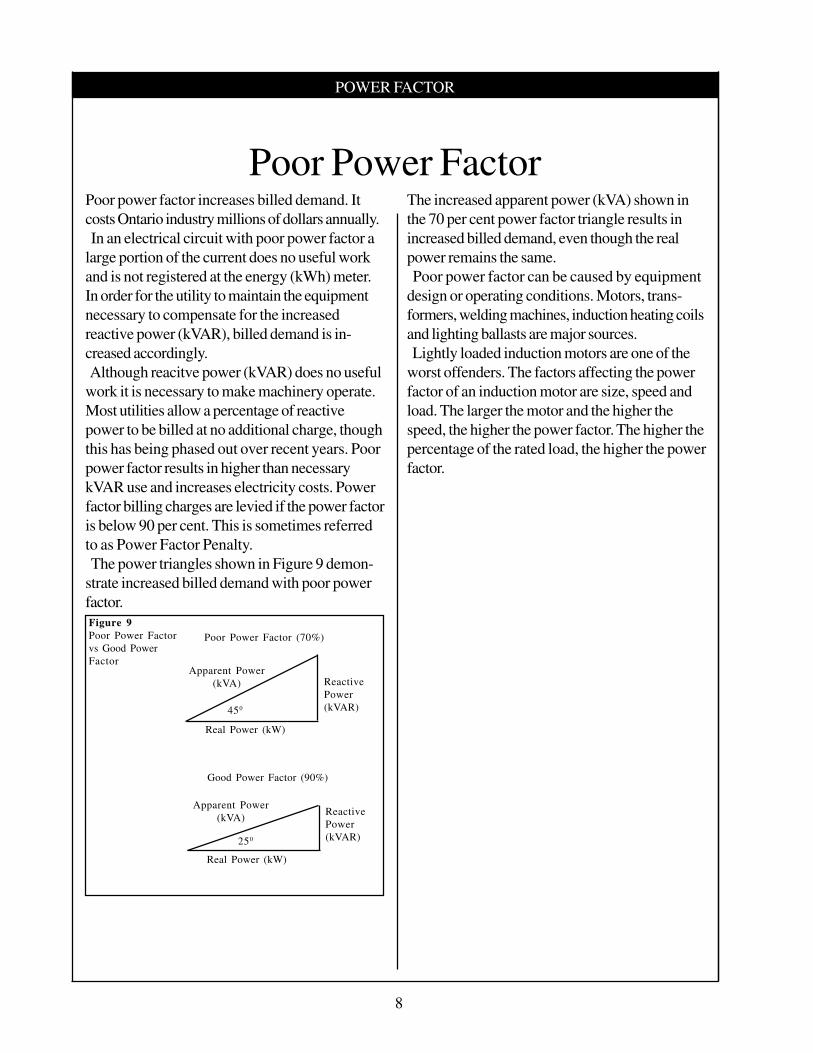
The power triangles shown in Figure 9 demon-
strate increased billed demand with poor power
factor.
Poor Power FactorThe increased apparent power (kVA) shown in
the 70 per cent power factor triangle results in
increased billed demand, even though the real
power remains the same.
Poor power factor can be caused by equipment
design or operating conditions. Motors, trans-
formers, welding machines, induction heating coils
and lighting ballasts are major sources.
Lightly loaded induction motors are one of the
worst offenders. The factors affecting the power
factor of an induction motor are size, speed and
load. The larger the motor and the higher the
speed, the higher the power factor. The higher the
percentage of the rated load, the higher the power
factor.
Figure 9
Poor Power Factor
vs Good Power
Factor
Real Power (kW)
Reactive
Power
(kVAR)
Apparent Power
(kVA)
Real Power (kW)
Reactive
Power
(kVAR)
Apparent Power
(kVA)
Poor Power Factor (70%)
450
250
Good Power Factor (90%)
POWER FACTOR
9
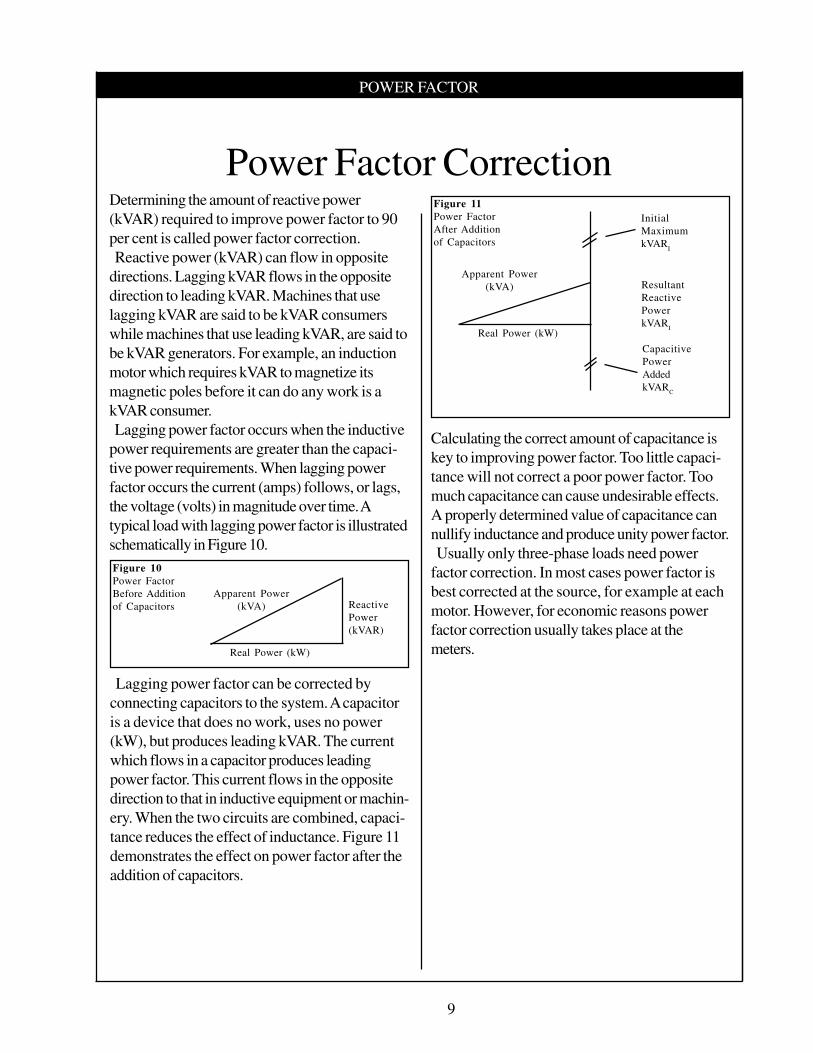
Determining the amount of reactive power
(kVAR) required to improve power factor to 90
per cent is called power factor correction.
Reactive power (kVAR) can flow in opposite
directions. Lagging kVAR flows in the opposite
direction to leading kVAR. Machines that use
lagging kVAR are said to be kVAR consumers
while machines that use leading kVAR, are said to
be kVAR generators. For example, an induction
motor which requires kVAR to magnetize its
magnetic poles before it can do any work is a
kVAR consumer.
Lagging power factor occurs when the inductive
power requirements are greater than the capaci-
tive power requirements. When lagging power
factor occurs the current (amps) follows, or lags,
the voltage (volts) in magnitude over time. A
typical load with lagging power factor is illustrated
schematically in Figure 10.
Power Factor Correction
Calculating the correct amount of capacitance is
key to improving power factor. Too little capaci-
tance will not correct a poor power factor. Too
much capacitance can cause undesirable effects.
A properly determined value of capacitance can
nullify inductance and produce unity power factor.
Usually only three-phase loads need power
factor correction. In most cases power factor is
best corrected at the source, for example at each
motor. However, for economic reasons power
factor correction usually takes place at the
meters.
Lagging power factor can be corrected by
connecting capacitors to the system. A capacitor
is a device that does no work, uses no power
(kW), but produces leading kVAR. The current
which flows in a capacitor produces leading
power factor. This current flows in the opposite
direction to that in inductive equipment or machin-
ery. When the two circuits are combined, capaci-
tance reduces the effect of inductance. Figure 11
demonstrates the effect on power factor after the
addition of capacitors.
Figure 11
Power Factor
After Addition
of Capacitors
Real Power (kW)
Resultant
Reactive
Power
kVARI
Apparent Power
(kVA)
Initial
Maximum
kVARI
Capacitive
Power
Added
kVARC
Figure 10
Power Factor
Before Addition
of Capacitors
Real Power (kW)
Reactive
Power
(kVAR)
Apparent Power
(kVA)
POWER FACTOR
10
The following exercise demonstrates a simple way
to determine power factor, how to improve it, and
the payback perod for capacitor installation.
Power Factor Correction and
Power Billing CalculationsStep 2: Drawing the Power Triangle
Calculate kVAR using the formula:
kW
kVAx 100% = P.F.
For example, if the watt meter reads 900kW and
the volt-ampere meter reads 1125 VA, the true
kW and kVA can be obtained by applying the
billing multiplier factor to each reading. Using a
billing multiplier factor of 2000, the peak de-
mands can be calculated as follows:
(900 x 2000)/1000 = 1800 kW
(1125 x 2000)/1000 = 2250 kVA
1800 kWx 100% = 80%
The power factor is:
2250 kVA
Assuming these are the peak readings for the
month, the bill will be based on 80 per cent
power factor.
Step 1: Determining Billed Demand
The billed demand is the true kW or 90 per cent
of the kVA, whichever is greater.
0.90 x 2250 kVA = 2025 kVA
Since 2025 kVA is greater than 1800 kW, the
billed demand is 2025 kW.
While the peak demand is 1800 kW, the billed
demand is 2025 kW. The difference of 225 kW
is the power factor penalty. In this instance the
power bill shows a higher kW figure than the
meter indicated.
It is not possible to determine whether or not
power factor penalty is present if only a kVA
meter is installed.
kVAR = kVA2 - kW2
= 22502 - 18002 = 1350kVAR
The power triangle in Figure 12 represents the
following values: 1800 kW; 1350 kVAR; 2250
kVA and 80 per cent power factor (Cos 36.90 =
1800 kW/2250 kVA = 0.8). Thus, the power
triangle completely describes the quality of power
used.
Figure 12
Power Triangle at
80 Per Cent
Power Factor
Real Power 1800 kW
Reactive
Power
1350 kVAR
Apparent Power
2250 kVA
36.90

POWER FACTOR
11
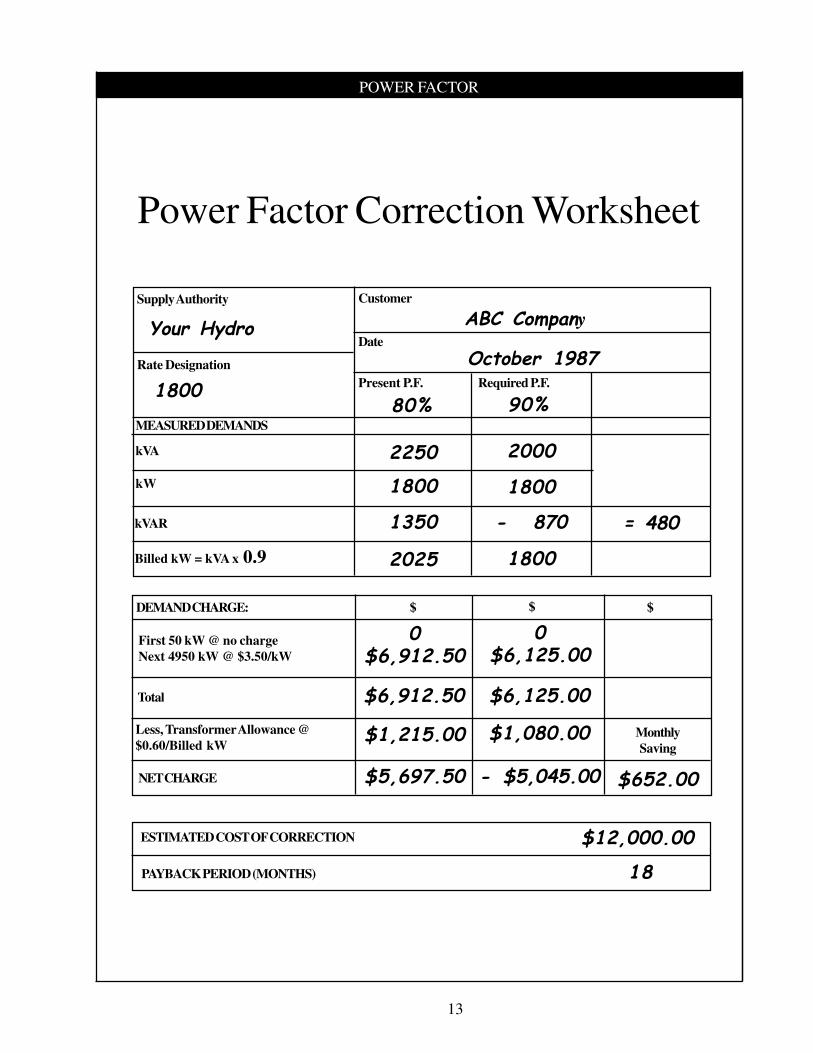
Step 3: Power Factor Correction Worksheet
at 80 Per Cent Power Factor
The Power Factor Correction Worksheet (page
xx) highlights the potential benefits and monthly
cost and savings that can be obtained by improving
power factor. It summarizes the demand portion of
the power bill and all power factor calculation
components.
The following values have been recorded on the
worksheet:
Present P.F. - 80%
kVA - 2250
kW - 1800
kVAR - 1350
These figures are used to calculate the demand
charges at 80 per cent power factor using the
General Service Rate Structure. The energy
consumption charge (kWh) is ignored for this
calculation as it is unaffected by the power factor.
Step 4: Total Cost at 80 Per Cent Power
Factor
The billed demand is 90 per cent of the kVA.
2250 x 0.90 = 2025 Billed Demand kW
In calculating the demand charge, the first 50 kW
are not billed. This eliminates small power users
paying demand charges and power factor penalites
(This reduction has been phased out in Ontario).
Gross Demand Charge: 2025kW - 50 kW =
1975kW x $3.50/kW = $6,912.50
Transformer allowances are available to customers
who own their own transformers. Allowances
range in value from $0.45 to $1.40 per kW of billed
demand, depending on the utility and the primary
supply voltage. In this example the customer is
eligible for $0.60 per billed kW allowance.
Transformer allowance:
2025 kW x $0.60 = $1,215.00
Net Demand Charge:
$6,912.50 - $1,215 =$5,697.50
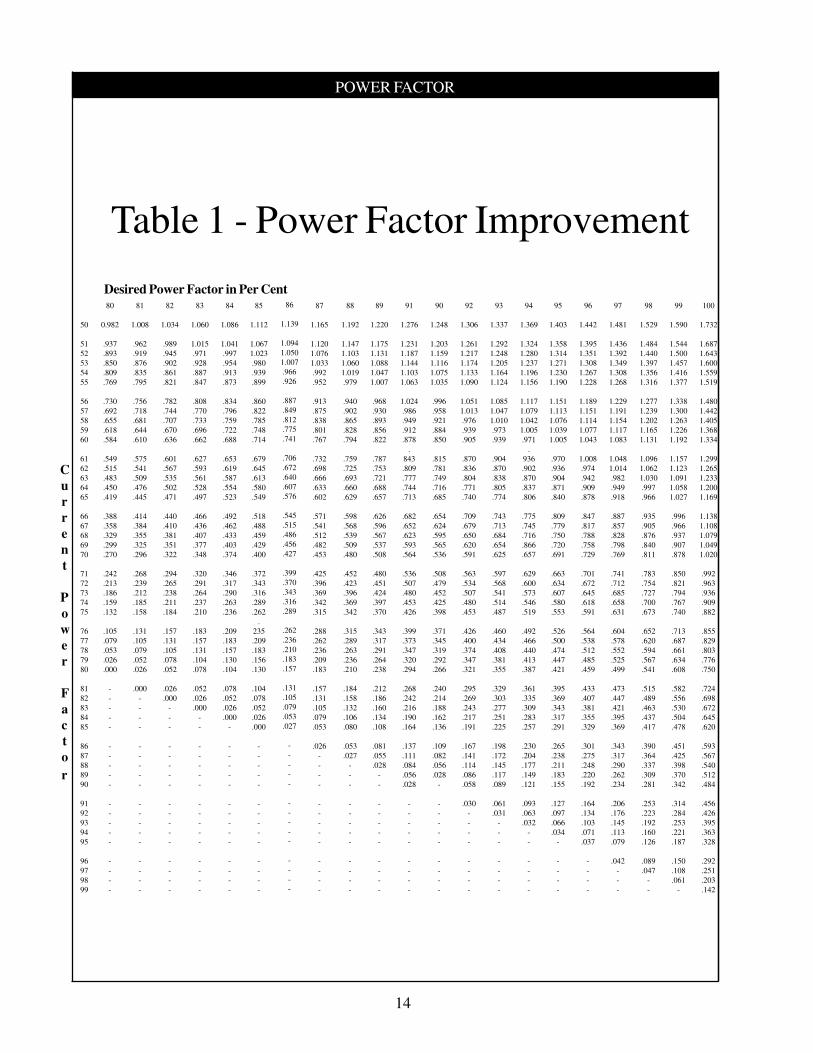
Step 5: Calculating Required kVAR for 90 Per
Cent Power Factor
Installing capacitors will raise the power factor to
90 per cent. While there is no change to the kW
meter reading, the kVA meter shows a reduction.
The Power Factor Improvement Table is used to
determine the kVAR of capacitors required to
improve the power factor. The left hand column
indicates the existing power factor. The top row of
numbers indicates the desired power factor.
Accordingly 0.266 x kW will determine the re-
quired kVAR of capacitors required to increase the
power factor to 90 per cent.
0.266 x 1800 kW = 480 kVAR
Installing 480 kVAR of capacitors will improve
power factor to 90 per cent.
Step 6: Power Factor Correction Worksheet
at 90 Per Cent Power Factor
Using the Power Factor Correction Worksheet, the
new demand charge and the resulting savings can
be determined. Improving power factor to 90 per
cent reduces total kVAR to:
1350 kVAR - 480 kVAR = 870 kVAR
The kVA is now:
= 2000 kVA0.90 P.F.
800 kW
POWER FACTOR
12
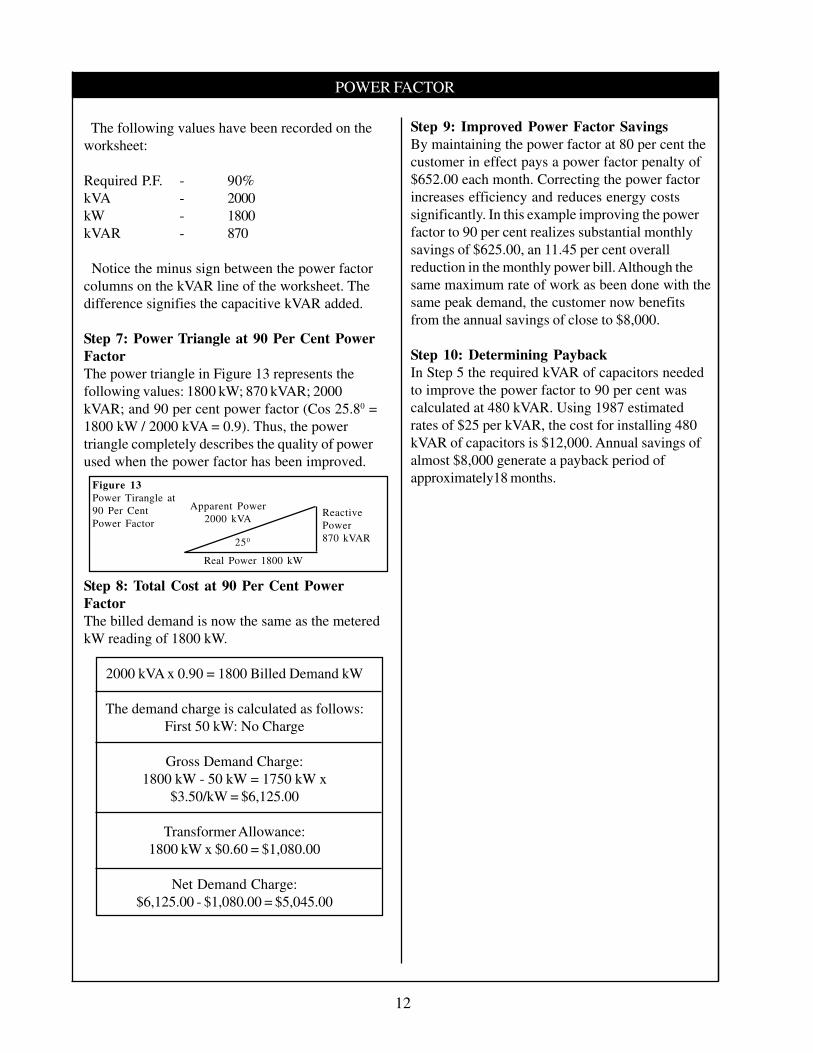
The following values have been recorded on the
worksheet:
Required P.F. - 90%
kVA - 2000
kW - 1800
kVAR - 870
Notice the minus sign between the power factor
columns on the kVAR line of the worksheet. The
difference signifies the capacitive kVAR added.
Step 7: Power Triangle at 90 Per Cent Power
Factor
The power triangle in Figure 13 represents the
following values: 1800 kW; 870 kVAR; 2000
kVAR; and 90 per cent power factor (Cos 25.80 =
1800 kW / 2000 kVA = 0.9). Thus, the power
triangle completely describes the quality of power
used when the power factor has been improved.
Step 9: Improved Power Factor Savings
By maintaining the power factor at 80 per cent the
customer in effect pays a power factor penalty of
$652.00 each month. Correcting the power factor
increases efficiency and reduces energy costs
significantly. In this example improving the power
factor to 90 per cent realizes substantial monthly
savings of $625.00, an 11.45 per cent overall
reduction in the monthly power bill. Although the
same maximum rate of work as been done with the
same peak demand, the customer now benefits
from the annual savings of close to $8,000.
Step 10: Determining Payback
In Step 5 the required kVAR of capacitors needed
to improve the power factor to 90 per cent was
calculated at 480 kVAR. Using 1987 estimated
rates of $25 per kVAR, the cost for installing 480
kVAR of capacitors is $12,000. Annual savings of
almost $8,000 generate a payback period of
approximately18 months.Figure 13
Power Tirangle at
90 Per Cent
Power Factor
Real Power 1800 kW
Reactive
Power
870 kVAR
Apparent Power
2000 kVA
250
Step 8: Total Cost at 90 Per Cent Power
Factor
The billed demand is now the same as the metered
kW reading of 1800 kW.
2000 kVA x 0.90 = 1800 Billed Demand kW
The demand charge is calculated as follows:
First 50 kW: No Charge
Gross Demand Charge:
1800 kW - 50 kW = 1750 kW x
$3.50/kW = $6,125.00
Transformer Allowance:
1800 kW x $0.60 = $1,080.00
Net Demand Charge:
$6,125.00 - $1,080.00 = $5,045.00
POWER FACTOR
13
Power Factor Correction Worksheet
ESTIMATED COST OF CORRECTION
PAYBACK PERIOD (MONTHS)
$12,000.00
18
DEMAND CHARGE: $ $ $
First 50 kW @ no charge
Next 4950 kW @ $3.50/kW
0$6,912.50
0$6,125.00
Total $6,912.50 $6,125.00
Less, Transformer Allowance @
$0.60/Billed kW$1,215.00 $1,080.00
NET CHARGE $5,697.50 - $5,045.00 $652.00
Monthly
Saving
Supply Authority Customer
Date
Present P.F. Required P.F.
MEASURED DEMANDS
kVA
kW
kVAR
Billed kW = kVA x 0.9
Rate Designation
2250 2000
1800 1800
1350 - 870
2025 1800
Your Hydro
1800
ABC Company
October 1987
80% 90%
= 480
POWER FACTOR
14
Table 1 - Power Factor Improvement
80
0.982
.937
.893
.850
.809
.769
.730
.692
.655
.618
.584
.549
.515
.483
.450
.419
.388
.358
.329
.299
.270
.242
.213
.186
.159
.132
.105
.079
.053
.026
.000
-
-
-
-
-
-
-
-
-
-
-
-
-
-
-
-
-
-
-
81
1.008
.962
.919
.876
.835
.795
.756
.718
.681
.644
.610
.575
.541
.509
.476
.445
.414
.384
.355
.325
.296
.268
.239
.212
.185
.158
.131
.105
.079
.052
.026
.000
-
-
-
-
-
-
-
-
-
-
-
-
-
-
-
-
-
-
82
1.034
.989
.945
.902
.861
.821
.782
.744
.707
.670
.636
.601
.567
.535
.502
.471
.440
.410
.381
.351
.322
.294
.265
.238
.211
.184
.157
.131
.105
.078
.052
.026
.000
-
-
-
-
-
-
-
-
-
-
-
-
-
-
-
-
-
83
1.060
1.015
.971
.928
.887
.847
.808
.770
.733
.696
.662
.627
.593
.561
.528
.497
.466
.436
.407
.377
.348
.320
.291
.264
.237
.210
.183
.157
.131
.104
.078
.052
.026
.000
-
-
-
-
-
-
-
-
-
-
-
-
-
-
-
-
84
1.086
1.041
.997
.954
.913
.873
.834
.796
.759
.722
.688
.653
.619
.587
.554
.523
.492
.462
.433
.403
.374
.346
.317
.290
.263
.236
.209
.183
.157
.130
.104
.078
.052
.026
.000
-
-
-
-
-
-
-
-
-
-
-
-
-
-
-
85
1.112
1.067
1.023
.980
.939
.899
.860
.822
.785
.748
.714
.679
.645
.613
.580
.549
.518
.488
.459
.429
.400
.372
.343
.316
.289
.262
.
235
.209
.183
.156
.130
.104
.078
.052
.026
.000
-
-
-
-
-
-
-
-
-
-
-
-
-
-
86
1.139
1.094
1.050
1.007
.966
.926
.887
.849
.812
.775
.741
.706
.672
.640
.607
.576
.545
.515
.486
.456
.427
.399
.370
.343
.316
.289
.262
.236
.210
.183
.157
.131
.105
.079
.053
.027
-
-
-
-
-
-
-
-
-
-
-
-
-
-
87
1.165
1.120
1.076
1.033
.992
.952
.913
.875
.838
.801
.767
.732
.698
.666
.633
.602
.571
.541
.512
.482
.453
.425
.396
.369
.342
.315
.288
.262
.236
.209
.183
.157
.131
.105
.079
.053
.026
-
-
-
-
-
-
-
-
-
-
-
-
-
88
1.192
1.147
1.103
1.060
1.019
.979
.940
.902
.865
.828
.794
.759
.725
.693
.660
.629
.598
.568
.539
.509
.480
.452
.423
.396
.369
.342
.315
.289
.263
.236
.210
.184
.158
.132
.106
.080
.053
.027
-
-
-
-
-
-
-
-
-
-
-
-
89
1.220
1.175
1.131
1.088
1.047
1.007
.968
.930
.893
.856
.822
.787
.753
.721
.688
.657
.626
.596
.567
.537
.508
.480
.451
.424
.397
.370
.343
.317
.291
.264
.238
.212
.186
.160
.134
.108
.081
.055
.028
-
-
-
-
-
-
-
-
-
-
-
90
1.248
1.203
1.159
1.116
1.075
1.035
.996
.958
.921
.884
.850
.815
.781
.749
.716
.685
.654
.624
.595
.565
.536
.508
.479
.452
.425
.398
.371
.345
.319
.292
.266
.240
.214
.188
.162
.136
.109
.082
.056
.028
-
-
-
-
-
-
-
-
-
-
91
1.276
1.231
1.187
1.144
1.103
1.063
1.024
.986
.949
.912
.878
.
843
.809
.777
.744
.713
.682
.652
.623
.593
.564
.536
.507
.480
.453
.426
.399
.373
.347
.320
.294
.268
.242
.216
.190
.164
.137
.111
.084
.056
.028
-
-
-
-
-
-
-
-
-
92
1.306
1.261
1.217
1.174
1.133
1.090
1.051
1.013
.976
.939
.905
.870
.836
.804
.771
.740
.709
.679
.650
.620
.591
.563
.534
.507
.480
.453
.426
.400
.374
.347
.321
.295
.269
.243
.217
.191
.167
.141
.114
.086
.058
.030
-
-
-
-
-
-
-
-
93
1.337
1.292
1.248
1.205
1.164
1.124
1.085
1.047
1.010
.973
.939
.904
.870
.838
.805
.774
.743
.713
.684
.654
.625
.597
.568
.541
.514
.487
.460
.434
.408
.381
.355
.329
.303
.277
.251
.225
.198
.172
.145
.117
.089
.061
.031
-
-
-
-
-
-
-
94
1.369
1.324
1.280
1.237
1.196
1.156
1.117
1.079
1.042
1.005
.971
.
936
.902
.870
.837
.806
.775
.745
.716
.866
.657
.629
.600
.573
.546
.519
.492
.466
.440
.413
.387
.361
.335
.309
.283
.257
.230
.204
.177
.149
.121
.093
.063
.032
-
-
-
-
-
-
95
1.403
1.358
1.314
1.271
1.230
1.190
1.151
1.113
1.076
1.039
1.005
.970
.936
.904
.871
.840
.809
.779
.750
.720
.691
.663
.634
.607
.580
.553
.526
.500
.474
.447
.421
.395
.369
.343
.317
.291
.265
.238
.211
.183
.155
.127
.097
.066
.034
-
-
-
-
-
96
1.442
1.395
1.351
1.308
1.267
1.228
1.189
1.151
1.114
1.077
1.043
1.008
.974
.942
.909
.878
.847
.817
.788
.758
.729
.701
.672
.645
.618
.591
.564
.538
.512
.485
.459
.433
.407
.381
.355
.329
.301
.275
.248
.220
.192
.164
.134
.103
.071
.037
-
-
-
-
97
1.481
1.436
1.392
1.349
1.308
1.268
1.229
1.191
1.154
1.117
1.083
1.048
1.014
.982
.949
.918
.887
.857
.828
.798
.769
.741
.712
.685
.658
.631
.604
.578
.552
.525
.499
.473
.447
.421
.395
.369
.343
.317
.290
.262
.234
.206
.176
.145
.113
.079
.042
-
-
-
98
1.529
1.484
1.440
1.397
1.356
1.316
1.277
1.239
1.202
1.165
1.131
1.096
1.062
1.030
.997
.966
.935
.905
.876
.840
.811
.783
.754
.727
.700
.673
.652
.620
.594
.567
.541
.515
.489
.463
.437
.417
.390
.364
.337
.309
.281
.253
.223
.192
.160
.126
.089
.047
-
-
99
1.590
1.544
1.500
1.457
1.416
1.377
1.338
1.300
1.263
1.226
1.192
1.157
1.123
1.091
1.058
1.027
.996
.966
.937
.907
.878
.850
.821
.794
.767
.740
.713
.687
.661
.634
.608
.582
.556
.530
.504
.478
.451
.425
.398
.370
.342
.314
.284
.253
.221
.187
.150
.108
.061
-
100
1.732
1.687
1.643
1.600
1.559
1.519
1.480
1.442
1.405
1.368
1.334
1.299
1.265
1.233
1.200
1.169
1.138
1.108
1.079
1.049
1.020
.992
.963
.936
.909
.882
.855
.829
.803
.776
.750
.724
.698
.672
.645
.620
.593
.567
.540
.512
.484
.456
.426
.395
.363
.328
.292
.251
.203
.142
50
51
52
53
54
55
56
57
58
59
60
61
62
63
64
65
66
67
68
69
70
71
72
73
74
75
76
77
78
79
80
81
82
83
84
85
86
87
88
89
90
91
92
93
94
95
96
97
98
99
C
u
r
r
e
n
t
P
o
w
e
r
F
a
c
t
o
r
Desired Power Factor in Per Cent

POWER FACTOR
15
Correcting power factor by installing capacitors
reduces billed demand. Assuming that the voltage
remains unchanged by the introduction of capaci-
tors, the reduction in kVA will result in a decrease
in current (amperes). Reducing current helps to
increase electrical equipment reliability by opti-
mizing and not overloading existing systems.
The following example demonstrates how
approaching 90 per cent power factor reduces
the current drawn.
The nameplate on a 100 hp, 3-phase motor
indicates that it draws 100 amps at 100 volts at
full load. The kW input can be calculated using
the formula
hp x 0.746
% efficiency
Improving System ReliabilityThe power triangle for this load is:
kW =
For a 3-phase motor of 90 per cent efficiency, the
input is 83kW. The kVA required can be calcu-
lated using the following forumula:
kVA = 3 x kilo-volts x amps
kVA input = 3 x 0.600 kV x 100 amps
= 104 kVA
Power Factor = 83 kW / 104 kVA = 80%
kVAR = (1042 - 832) = 63 kVAR
The Power Factor Improvement Table is used to
determine the kVAR of capacitors required to
increase the power factor to 90 per cent.
0.266 x 83 KW = 22 kVAR
If capacitors producing 22 leading kVAR are
added, the lagging 63 kVAR drawn by the motor
would be reduced to 41 kVAR. The power
triangle for this load at 90 per cent power factor
is:
Real Power 83 kW
Reactive
Power
63 kVAR
Apparent Power
104 kVA
36.90
Real Power 83 kW
Reactive
Power
41 kVAR
Apparent Power
92.2 kVA
25.80
At 600 volts, 92.2 kVA results in a draw of only
89 amps.
3 x 0.600 kV x 89 amps = 92.2 kVA
Adding capacitors to the motor has decreased the
current drawn from 100 amps to 89 amps, a
reduction of 11 per cent.

POWER FACTOR
16
Contactors
When capacitors are installed at the inductive
load side of the switchgear, contactors supplying
machinery may need to be upgraded.
Fuses
Non-renewable or HRC type fuses are recom-
mended. They are less likely to heat up than
renewable fuses.
Harmonics
Capacitors installed either in series or parallel to
inductive loads can create tank circuits. Unstable
resonances within the tank circuits can cause
stress to connected equipment and voltage
variations within the plant.
Harmonics generated by solid state rectification
can blow protective fuses. Harmonic voltages and
currents can create low impedance circuits when
capacitors have been added.
Location
The preferred location for capacitors is in the
switch room, on the load side of the meter. There
is less likelihood of capacitos being accidentally
disconnected in this location. As well, there is
often unused space and adequate wire size
available.
Capacitor Installation Pointers
Maintenance
While capacitors require little maintenance, they
should be accessible for inspection of fuses and
terminals. Capacitors should be frequently
checked with a clamp-on ammeter to be sure
they are operating.
Operation
Once capacitors are installed they must be left on
continuously. If a capacitor is left off for only 15
minutes during the load period, it may as well not
have been installed for the entire month.
Switching
Manual switching is preferred. The capacitors
should be left on at all times when a load is
running, unless, for example, there is excessive
voltage during light load periods.
Wiring
Since capacitors have 100 per cent load factor,
all wiring should be maximum copper cross-
section. All switches should be of extra heavy
duty construction.

POWER FACTOR
17
SAFETY
Capacitors can store extremely large voltages,
even when not connected or in use. Extreme caution
must be exercised when handling them. Always insist
that experienced personnel and licensed contractors
install electrical equipment.
All electrical equipment installations must be in-
spected by the Electrical Safety Authority (ESA)
For more information on Power Factor, Harmonics,Energy Management visit
www.cosphi.com
“The Solution Company”
Related Documents


