S.Ü. Müh. Bilim ve Tekn. Derg., c.6, s.4, ss. 643-653, 2018 Selcuk Univ. J. Eng. Sci. Tech., v.6, n.4, pp. 643-653, 2018 ISSN: 2147-9364 (Electronic) DOI: 10.15317/Scitech.2018.158 POWER COEFFICIENT IN ONE POINT LIQUID LIMIT TEST FOR SOILS OF NORTHERN TURKEY AT VARIOUS TEMPERATURES 1 Emre ÜYETÜRK, 2 Nejan HUVAJ 1 Middle East Technical University, Department of Civil Engineering, 06800, Ankara, Turkey, 2 Middle East Technical University, Department of Civil Engineering, 06800, Ankara, Turkey 1 [email protected], 2 [email protected] (Geliş/Received: 20.02.2018; Kabul/Accepted in Revised Form: 17.04.2018) ABSTRACT: In this study, the power coefficient of one-point liquid limit equation given by ASTM 4318-17 is evaluated for weathered volcanic deposits of Northern Turkey. Total of 35 soil samples taken from depths ranging from 0.2 m to 4 m from 8 different sites in the city of Rize and one site in Trabzon, Turkey are used, and a total of 77 Atterberg limit tests are conducted. Three different sample preparation methods are used: (1) starting from in-situ moisture content without any drying, (2) drying at 60C oven, (3) drying at 110C oven. For liquid limit determination by one-point method, the best fitting power coefficient is evaluated for different sample preparation conditions separately, and are compared with the power coefficient suggested by ASTM D4318-17. Soils used in this study are in ML-OL to MH-OH zones in plasticity chart and the liquid limit values vary in the range of 35% to 103% (moist preparation). Liquid limits obtained by multi-point method and the ones obtained by one-point method are found to be similar to each other. It is concluded that although the power coefficient changes (in the range of 0.106 to 0.133 with an average value of 0.120) due to sample preparation technique, they are close to ASTM-suggested power value of 0.121, and the differences in resulting liquid limits are negligibly small (0-2%). Key Words: Liquid limit, Multi point, One point Türkiye’nin Kuzeyindeki Zeminler İçin Farklı Sıcaklıklarda Tek Nokta Likit Limit Deneyindeki Üstel Katsayı ÖZ: Bu çalışmada ASTM D4318-17 tarafından önerilen tek nokta likit limit saptama denklemindeki üstel katsayı Türkiye’de Doğu Karadeniz bölgesinde bulunan ayrışmış volkanik zeminler için belirlenmiştir. Numuneler 0.2 m ila 4 m derinliklerden, Rize’den 8 sahadan ve Trabzon’dan 1 sahadan alınmış olup toplamda 35 adettir ve bu numunelerle 77 adet Atterberg kıvam limitleri deneyi yapılmıştır. Bu çalışmada 3 farklı numune hazırlama yöntemi kullanılmıştır. Bunlar (1) herhangi bir ısıtmaya maruz bırakılmadan doğal su muhtevasından numune hazırlama, (2) 60C fırında kurutulduktan sonra hazırlama ve (3) 110C fırında kurutulduktan sonra hazırlamadır. Tek nokta likit limit saptama denklemindeki üstel katsayı, farklı yöntemlerle hazırlanan numuneler için hesaplanmış ve bu üstel katsayı ASTM D4318-17 standardında tavsiye edilen değer ile karşılaştırılmıştır. Bu çalışmada kullanılan zeminler Plastisite abağında ML-OL ve MH-OH sınıfında olup likit limit değerleri %35 ile %103 arasında değişmektedir (ıslak hazırlama yöntemi ile). Öte yandan çok nokta yöntemiyle belirlenmiş olan likit limit değerleri ile tek nokta yöntemiyle belirlenen değerlerin birbirine yakın olduğu görülmüştür. Sonuç olarak farklı numune hazırlama tekniklerinin üstel katsayı değeri 0.106 ila 0.133 arasında olup, ortalama değer olarak 0.120 elde edilmiş ve

Welcome message from author
This document is posted to help you gain knowledge. Please leave a comment to let me know what you think about it! Share it to your friends and learn new things together.
Transcript

S.Ü. Müh. Bilim ve Tekn. Derg., c.6, s.4, ss. 643-653, 2018
Selcuk Univ. J. Eng. Sci. Tech., v.6, n.4, pp. 643-653, 2018
ISSN: 2147-9364 (Electronic)
DOI: 10.15317/Scitech.2018.158
POWER COEFFICIENT IN ONE POINT LIQUID LIMIT TEST FOR SOILS OF NORTHERN TURKEY
AT VARIOUS TEMPERATURES
1Emre ÜYETÜRK, 2Nejan HUVAJ
1Middle East Technical University, Department of Civil Engineering, 06800, Ankara, Turkey, 2Middle East Technical University, Department of Civil Engineering, 06800, Ankara, Turkey
[email protected], [email protected]
(Geliş/Received: 20.02.2018; Kabul/Accepted in Revised Form: 17.04.2018)
ABSTRACT: In this study, the power coefficient of one-point liquid limit equation given by ASTM 4318-17 is
evaluated for weathered volcanic deposits of Northern Turkey. Total of 35 soil samples taken from depths
ranging from 0.2 m to 4 m from 8 different sites in the city of Rize and one site in Trabzon, Turkey are used,
and a total of 77 Atterberg limit tests are conducted. Three different sample preparation methods are used:
(1) starting from in-situ moisture content without any drying, (2) drying at 60C oven, (3) drying at 110C
oven. For liquid limit determination by one-point method, the best fitting power coefficient is evaluated for
different sample preparation conditions separately, and are compared with the power coefficient suggested
by ASTM D4318-17. Soils used in this study are in ML-OL to MH-OH zones in plasticity chart and the liquid
limit values vary in the range of 35% to 103% (moist preparation). Liquid limits obtained by multi-point
method and the ones obtained by one-point method are found to be similar to each other. It is concluded
that although the power coefficient changes (in the range of 0.106 to 0.133 with an average value of 0.120)
due to sample preparation technique, they are close to ASTM-suggested power value of 0.121, and the
differences in resulting liquid limits are negligibly small (0-2%).
Key Words: Liquid limit, Multi point, One point
Türkiye’nin Kuzeyindeki Zeminler İçin Farklı Sıcaklıklarda Tek Nokta Likit Limit Deneyindeki Üstel
Katsayı
ÖZ: Bu çalışmada ASTM D4318-17 tarafından önerilen tek nokta likit limit saptama denklemindeki üstel
katsayı Türkiye’de Doğu Karadeniz bölgesinde bulunan ayrışmış volkanik zeminler için belirlenmiştir.
Numuneler 0.2 m ila 4 m derinliklerden, Rize’den 8 sahadan ve Trabzon’dan 1 sahadan alınmış olup
toplamda 35 adettir ve bu numunelerle 77 adet Atterberg kıvam limitleri deneyi yapılmıştır. Bu çalışmada 3
farklı numune hazırlama yöntemi kullanılmıştır. Bunlar (1) herhangi bir ısıtmaya maruz bırakılmadan doğal
su muhtevasından numune hazırlama, (2) 60C fırında kurutulduktan sonra hazırlama ve (3) 110C fırında
kurutulduktan sonra hazırlamadır. Tek nokta likit limit saptama denklemindeki üstel katsayı, farklı
yöntemlerle hazırlanan numuneler için hesaplanmış ve bu üstel katsayı ASTM D4318-17 standardında
tavsiye edilen değer ile karşılaştırılmıştır. Bu çalışmada kullanılan zeminler Plastisite abağında ML-OL ve
MH-OH sınıfında olup likit limit değerleri %35 ile %103 arasında değişmektedir (ıslak hazırlama yöntemi
ile). Öte yandan çok nokta yöntemiyle belirlenmiş olan likit limit değerleri ile tek nokta yöntemiyle
belirlenen değerlerin birbirine yakın olduğu görülmüştür. Sonuç olarak farklı numune hazırlama
tekniklerinin üstel katsayı değeri 0.106 ila 0.133 arasında olup, ortalama değer olarak 0.120 elde edilmiş ve

644 E. ÜYETÜRK, N. HUVAJ
bu değerlerin ASTMD4318-17 de tavsiye edilen 0.121 değerine yakın olduğu görülmüş ve bu farklılıkların
likit limit değerlerinde ihmal edilebilir bir farklılığa yol açtığı sonucuna varılmıştır (0-%2).
Anahtar Kelimeler: Likit limit, Çok nokta, Tek nokta
INTRODUCTION
The Atterberg limits are index properties of fine grained soils that are used for classification, as well as,
for estimating engineering properties of these soils, such as shear strength, compressibility, swelling
potential and for evaluating the suitability of them to be used as a fill material or as a subgrade soil
(Atterberg, 1911; Casagrande, 1932; Olmstead and Johnson, 1955; Terzaghi et al., 1996; Jefferson and Rogers,
1998; Orhan and Özer, 2006; Zolfaghari et al., 2015; Stanchi et al., 2017). In order to determine Atterberg
limits, ASTM D4318-17 requires soil samples to be prepared either by wet preparation, or by dry
preparation methods (at room temperature or in an oven at a temperature not exceeding 60C). This
standard method for determining the liquid limit (LL) requires that, at least three trials be made, each at a
different moisture content. In the conventional multi-point test, the aim is to obtain the water content of the
soil sample that requires 25 blows for the closure of the opening (for a length of 13 mm), which is originally
created by a groove tool as described by ASTM D4318-17. However, since obtaining 25 blows exactly, is
difficult, an interpolation with several data points are done to find the water content at 25 blows. Also, there
is another way to determine the LL of a soil sample, which is called “one-point method” (US Waterways,
1949, Olmstead and Johnston, 1955, Eden, 1955, Norman, 1959, Mohen and Goel, 1958, Roje – Bonacci, 2004).
This method requires obtaining blow count between 20 and 30 for closure of the opening in Casagrande cup,
by a 13 mm length and determining the water content of the soil sample at that consistency. Then, an
equation is to be used to find the LL at 25 blow count. This method is also standardized by ASTM (ASTM
D4318-17), as “method B”, and by British Standards (BS1377). ASTM D4318-17 suggests an equation and a
power coefficient to determine LL of a soil sample corresponding to 25 blow counts, from one data point
(equation 1).
𝐿𝐿𝑛 = 𝑤𝑛 (𝑁𝑛
25)
0.121
(1)
The power coefficient suggested by ASTM is 0.121, whereas 0.092 and 0.121 are used by British Standards
BS1377 and German DIN18122 standards, respectively.
ASTM D4318-17 notes that one-point method may not be applicable for some soils, such as organic soils,
and soils from marine environment. Similarly, according to Eden (1955), the assumptions made in one-point
method is not strictly correct for highly organic soils and Eden (1955) stated that “it should not be used on
soils which contain an appreciable amount of organic matter”. This paper investigates the influences of
different sample preparation methods, which are (i) wet preparation, (ii) 60C oven dried preparation, and
(iii) 110C oven dried preparation, on power coefficient in equation (1) to determine LL from one point test.
The resulting power coefficients are compared with ASTM D4318-17 suggested power value. Furthermore,
the differences in liquid limits obtained by multi-point and one-point tests are presented and comparison is
provided.
BACKGROUND
The origin of the one-point method for determination of LL may have developed from the U.S.
Waterways Experiment Station (1949) study, which stated that “Dr. Arthur Casagrande suggested that flow

Power Coefficient in One Point Liquid Limit Test for Soils of Northern Turkey at Various Temperatures 645
lines determined by liquid limit tests, plotting both water content and number of blows to a logarithmic
scale, might have a constant slope for soils of the same geologic origin”. According to Norman (1959) and
Mohan and Goel (1960), it is observed in the determination of LL tests that, slopes of the flow curves have
nearly the same slope, and this led to an increased interest in one-point method to determine LL of soils.
Some of the benefits of one-point LL test were reported as, a substantial reduction in the time and cost of
LL determinations, and reduced work load on technicians (U.S. Waterways Experiment Station 1949, Eden,
1955, Önalp and Kılıç, 1994). Önalp and Kılıç (1994) stated that for big projects with extensive site
investigation and laboratory tests, a lot of LL tests are to be done, increasing the work load on technicians,
which may increase the tendency of misinterpretation of the tests or mistakes in the long term.
According to Haigh and Vardanega (2014), one-point method is an applicable method to determine LL,
and it is allowed in the codes around the world, and hence further examination is valuable. Although it is
widely accepted and many codes worldwide allow the usage of the one-point method, limited amount of
research is done to investigate the one-point equation for different soils coming from various origins. Önalp
and Arel (2013), Olmstead and Johnson (1955), Mohan and Goel (1959) recommended further studies to be
conducted to investigate the power coefficient in one-point method for soils of different origins from
different parts of the world. On the contrary, some researchers suggest that the geological origin of the soil
need not be considered, and
be small (Eden, 1955). The power coefficient obtained as a result of various researches are summarized in
Table 1. Although the power coefficient seems to very in a broad range (Table 1), the effect of it on LL is not
that significant. Olmstead and Johnston (1955) suggested that, if the errors due to the one-point method fall
within the ± 2 percent range in LL, then one-point test should be an acceptable procedure.
Table 1. Power value in one-point LL equation
Reference Origin of Soil Type of
soils
Number
of
Soils
Average
tan𝜷 (range in
parenthesis)
US Waterways (1949) -
Southern US (Alluvial Valley of
the Mississippi River, the West
and the East Gulf Coastal
Plains)
medium to highly
plastic inorganic clays,
and a few silts and
sandy clays
767
0.121*
Olmstead and Johnston
(1954) the US - 759
0.135
Eden (1955) Canadian - 484 0.108 / 0.100
Mohan and Goel (1958) India Black cotton soils
(montmorillonitic) 250
0.068
Norman (1959) the UK/Overseas - 455/49 0.092**
Jain and Patwardhan (1960),
reported by Haigh &
Vardanega (2014)
India Gangetic alluvium 32
0.085
Kim (1973), reported by
Haigh & Vardanega (2014) Korea Korean soils 1017
0.118
Önalp (1994) Eastern Black Sea region,
Turkey Silts &clays 332
0.112
Vural (1998) Adapazarı, Turkey - 24 -
Roje – Bonacci (2004) Dalmatian region, Croatia CH clays 88 0.063 (range:
0.023 to 0.132)
Uysal (2004) Adapazarı, Turkey - 79 0.120
Önalp and Arel (2013) Istanbul, Turkey Marine clays 20 0.120
This study Northern Turkey (Rize and
Trabzon)
Weathered volcanic
deposits 35
0.120
* also ASTM D4318-17, TS 1900-1
** also BS1377
646 E. ÜYETÜRK, N. HUVAJ
METHODOLOGY
Soil samples for this study are taken from Northern Turkey, from the cities of Rize and Trabzon, 31 soil
samples are taken from eight different sites in Rize and 4 soil samples are taken from one site in Trabzon.
The sites in Rize are located in the following villages: Beydere (site 1), Çağlayan/Arslandere (site 2),
Köprübaşı (site 3), Aktaş (site 4), Çaglayan (site 5), Merdivenli (site 6), Gündoğan (site 7), Beyazkaya (site 8),
and site in Trabzon is located in Ambarlı village (site 9) (Figure 1). Depth of soil samples ranges from 0.2 m
to 4.0 m. When the soil samples were taken at these sites, sample were placed in plastic bags in order to
preserve their in-situ water content.
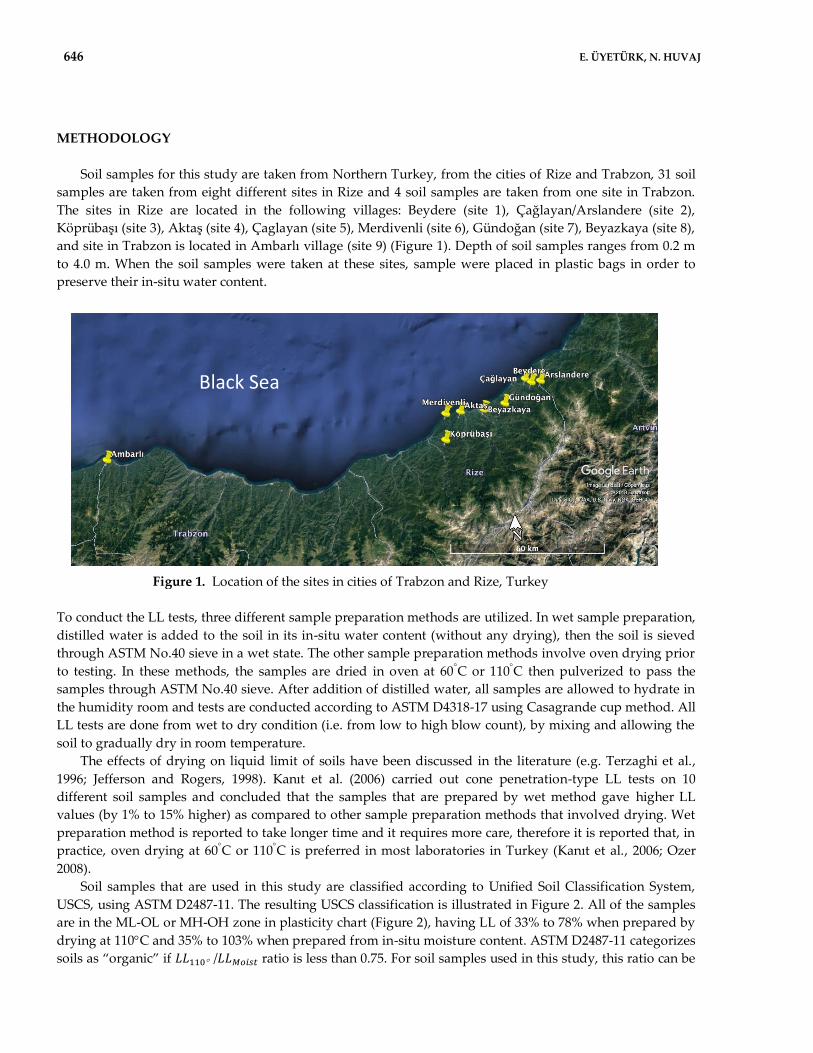
Figure 1. Location of the sites in cities of Trabzon and Rize, Turkey
To conduct the LL tests, three different sample preparation methods are utilized. In wet sample preparation,
distilled water is added to the soil in its in-situ water content (without any drying), then the soil is sieved
through ASTM No.40 sieve in a wet state. The other sample preparation methods involve oven drying prior
to testing. In these methods, the samples are dried in oven at 60C or 110C then pulverized to pass the
samples through ASTM No.40 sieve. After addition of distilled water, all samples are allowed to hydrate in
the humidity room and tests are conducted according to ASTM D4318-17 using Casagrande cup method. All
LL tests are done from wet to dry condition (i.e. from low to high blow count), by mixing and allowing the
soil to gradually dry in room temperature.
The effects of drying on liquid limit of soils have been discussed in the literature (e.g. Terzaghi et al.,
1996; Jefferson and Rogers, 1998). Kanıt et al. (2006) carried out cone penetration-type LL tests on 10
different soil samples and concluded that the samples that are prepared by wet method gave higher LL
values (by 1% to 15% higher) as compared to other sample preparation methods that involved drying. Wet
preparation method is reported to take longer time and it requires more care, therefore it is reported that, in
practice, oven drying at 60C or 110C is preferred in most laboratories in Turkey (Kanıt et al., 2006; Ozer
2008).
Soil samples that are used in this study are classified according to Unified Soil Classification System,
USCS, using ASTM D2487-11. The resulting USCS classification is illustrated in Figure 2. All of the samples
are in the ML-OL or MH-OH zone in plasticity chart (Figure 2), having LL of 33% to 78% when prepared by
drying at 110C and 35% to 103% when prepared from in-situ moisture content. ASTM D2487-11 categorizes
soils as “organic” if 𝐿𝐿110 /𝐿𝐿𝑀𝑜𝑖𝑠𝑡 ratio is less than 0.75. For soil samples used in this study, this ratio can be
Black Sea

Power Coefficient in One Point Liquid Limit Test for Soils of Northern Turkey at Various Temperatures 647
obtained from the LL values given in Table 2, and soils can be named accordingly, only a few of the soils
would be classified as “organic”, according to USCS.
Figure 2. Soil samples in the Plasticity Chart (wet preparation method)
Figures 3, 4 and 5 show the flow curves (water content versus number of drops, or blow counts) in semi-
logarithmic plot, for samples that are prepared by different sample preparation methods. It is noticeable that
in all three figures the slopes of flow curves seem similar, even for different sample preparation techniques.
It can be seen that the number of blows versus water content plot changes gradually rather than rapidly, and
as stated by US Waterways (1949), Eden (1955), Norman (1959), Mohan and Goel (1960), the slopes of flow
curves are similar for these soils.
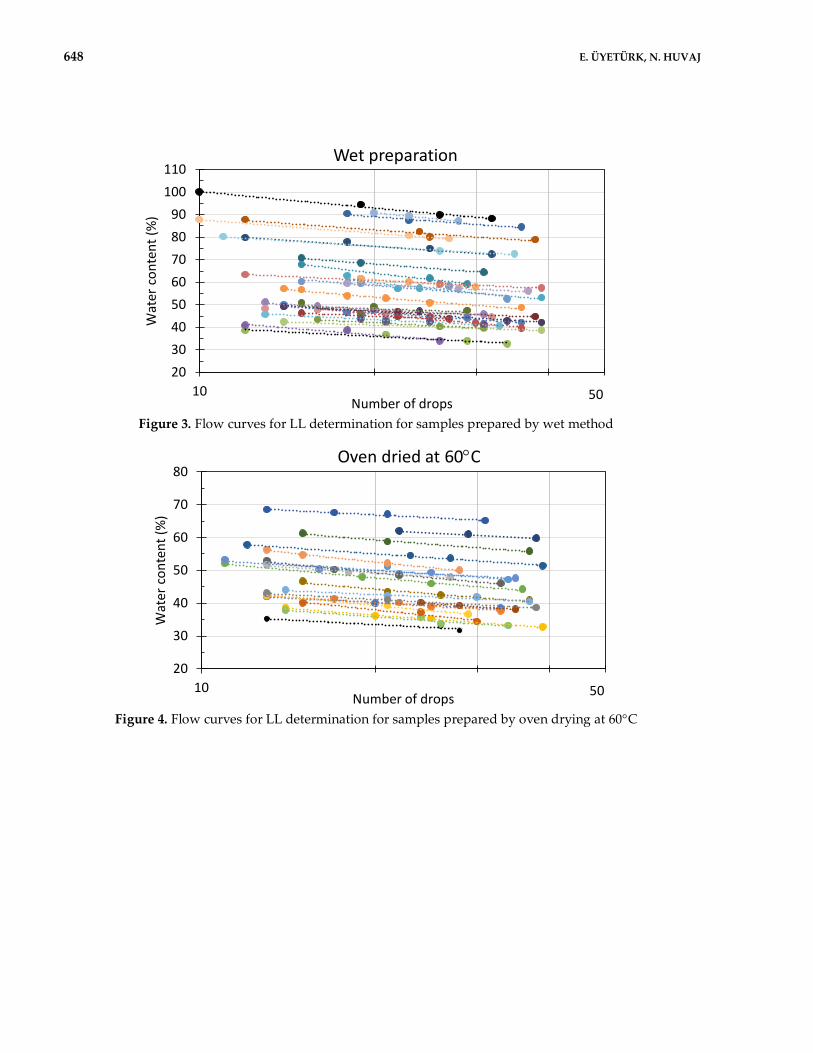
648 E. ÜYETÜRK, N. HUVAJ
Figure 3. Flow curves for LL determination for samples prepared by wet method
Figure 4. Flow curves for LL determination for samples prepared by oven drying at 60C
20
30
40
50
60
70
80
90
100
110
10
Wat
er c
on
ten
t (%
)
Number of drops
Wet preparation
50
20
30
40
50
60
70
80
10
Wat
er c
on
ten
t (%
)
Number of drops
Oven dried at 60C
50

Power Coefficient in One Point Liquid Limit Test for Soils of Northern Turkey at Various Temperatures 649
Figure 5. Flow curves for LL determination for samples prepared by oven drying at 110C
By using 77 flow curves that are presented in Figures 3, 4 and 5, the power coefficient (𝑡𝑎𝑛𝛽) in Equation (1)
is calculated for each test. The average 𝑡𝑎𝑛𝛽 values are calculated for three different sample preparation
techniques and are presented in Table 2. Table 2 shows clearly that, upon increase in drying temperature
𝑡𝑎𝑛𝛽 values are getting smaller. The frequency distribution of all 𝑡𝑎𝑛𝛽 values from all 77 tests is shown in
Figure 6. The average value of 𝑡𝑎𝑛𝛽 from all 77 tests is 0.120 (with a standard deviation is 0.047). This power
coefficient is in agreement with the ASTM 4318-17 suggested value of 0.121.
Table 2. The average power coefficient, i.e. 𝑡𝑎𝑛𝛽 values in Equation (1), for different sample preparation
techniques
Wet sample preparation Dried at 60 Dried at 110 Average of all data
𝑡𝑎𝑛𝛽 0.133 0.120 0.106 0.120
Figure 6. The frequency distribution of 𝑡𝑎𝑛𝛽 values in 77 LL tests
20
30
40
50
60
70
80
10
Wat
er c
on
ten
t (%
)
Number of drops
Oven dried at 110C
50
0
5
10
15
20
25
% o
f to
tal d
ata
tanb range
Sample size = 77
Mean = 0.120
Standard deviation = 0.047
650 E. ÜYETÜRK, N. HUVAJ
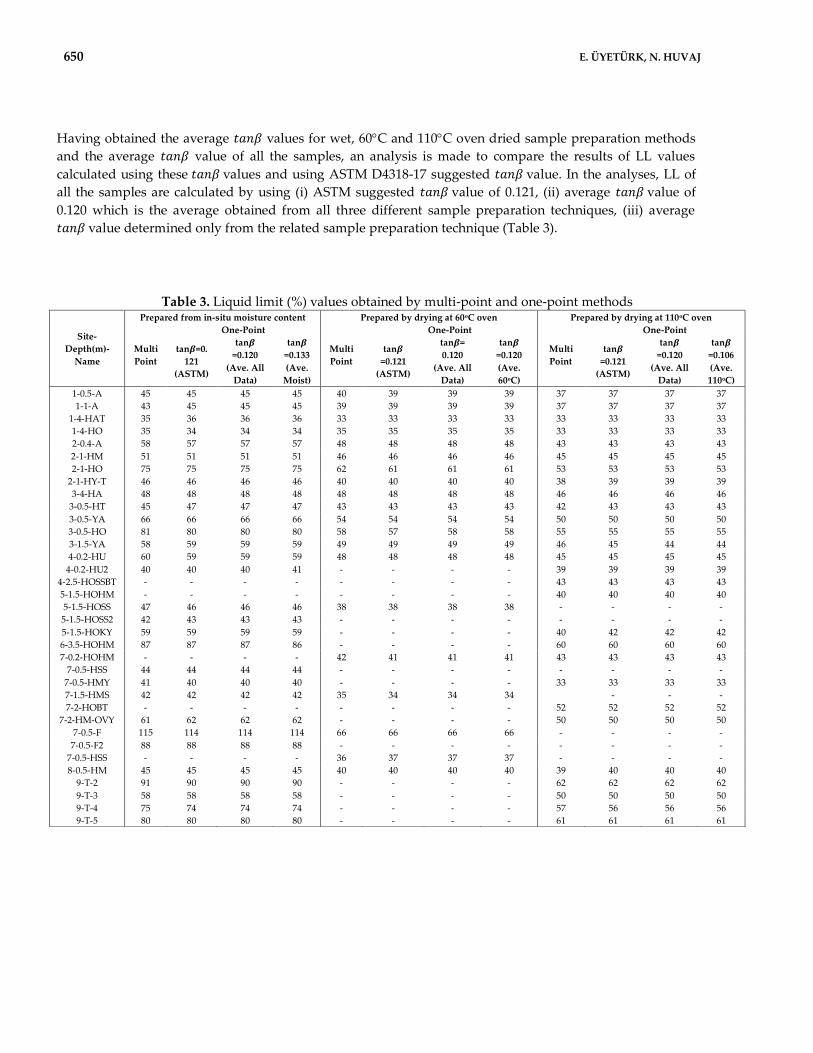
Having obtained the average 𝑡𝑎𝑛𝛽 values for wet, 60C and 110C oven dried sample preparation methods
and the average 𝑡𝑎𝑛𝛽 value of all the samples, an analysis is made to compare the results of LL values
calculated using these 𝑡𝑎𝑛𝛽 values and using ASTM D4318-17 suggested 𝑡𝑎𝑛𝛽 value. In the analyses, LL of
all the samples are calculated by using (i) ASTM suggested 𝑡𝑎𝑛𝛽 value of 0.121, (ii) average 𝑡𝑎𝑛𝛽 value of
0.120 which is the average obtained from all three different sample preparation techniques, (iii) average
𝑡𝑎𝑛𝛽 value determined only from the related sample preparation technique (Table 3).
Table 3. Liquid limit (%) values obtained by multi-point and one-point methods
Site-
Depth(m)-
Name
Prepared from in-situ moisture content Prepared by drying at 60oC oven Prepared by drying at 110oC oven
Multi
Point
One-Point
Multi
Point
One-Point
Multi
Point
One-Point
tan𝜷=0.
121
(ASTM)
tan𝜷
=0.120
(Ave. All
Data)
tan𝜷
=0.133
(Ave.
Moist)
tan𝜷
=0.121
(ASTM)
tan𝜷=
0.120
(Ave. All
Data)
tan𝜷
=0.120
(Ave.
60oC)
tan𝜷
=0.121
(ASTM)
tan𝜷
=0.120
(Ave. All
Data)
tan𝜷
=0.106
(Ave.
110oC)
1-0.5-A 45 45 45 45 40 39 39 39 37 37 37 37
1-1-A 43 45 45 45 39 39 39 39 37 37 37 37
1-4-HAT 35 36 36 36 33 33 33 33 33 33 33 33
1-4-HO 35 34 34 34 35 35 35 35 33 33 33 33
2-0.4-A 58 57 57 57 48 48 48 48 43 43 43 43
2-1-HM 51 51 51 51 46 46 46 46 45 45 45 45
2-1-HO 75 75 75 75 62 61 61 61 53 53 53 53
2-1-HY-T 46 46 46 46 40 40 40 40 38 39 39 39
3-4-HA 48 48 48 48 48 48 48 48 46 46 46 46
3-0.5-HT 45 47 47 47 43 43 43 43 42 43 43 43
3-0.5-YA 66 66 66 66 54 54 54 54 50 50 50 50
3-0.5-HO 81 80 80 80 58 57 58 58 55 55 55 55
3-1.5-YA 58 59 59 59 49 49 49 49 46 45 44 44
4-0.2-HU 60 59 59 59 48 48 48 48 45 45 45 45
4-0.2-HU2 40 40 40 41 - - - - 39 39 39 39
4-2.5-HOSSBT - - - - - - - - 43 43 43 43
5-1.5-HOHM - - - - - - - - 40 40 40 40
5-1.5-HOSS 47 46 46 46 38 38 38 38 - - - -
5-1.5-HOSS2 42 43 43 43 - - - - - - - -
5-1.5-HOKY 59 59 59 59 - - - - 40 42 42 42
6-3.5-HOHM 87 87 87 86 - - - - 60 60 60 60
7-0.2-HOHM - - - - 42 41 41 41 43 43 43 43
7-0.5-HSS 44 44 44 44 - - - - - - - -
7-0.5-HMY 41 40 40 40 - - - - 33 33 33 33
7-1.5-HMS 42 42 42 42 35 34 34 34
- - -
7-2-HOBT - - - - - - - - 52 52 52 52
7-2-HM-OVY 61 62 62 62 - - - - 50 50 50 50
7-0.5-F 115 114 114 114 66 66 66 66 - - - -
7-0.5-F2 88 88 88 88 - - - - - - - -
7-0.5-HSS - - - - 36 37 37 37 - - - -
8-0.5-HM 45 45 45 45 40 40 40 40 39 40 40 40
9-T-2 91 90 90 90 - - - - 62 62 62 62
9-T-3 58 58 58 58 - - - - 50 50 50 50
9-T-4 75 74 74 74 - - - - 57 56 56 56
9-T-5 80 80 80 80 - - - - 61 61 61 61
Power Coefficient in One Point Liquid Limit Test for Soils of Northern Turkey at Various Temperatures 651
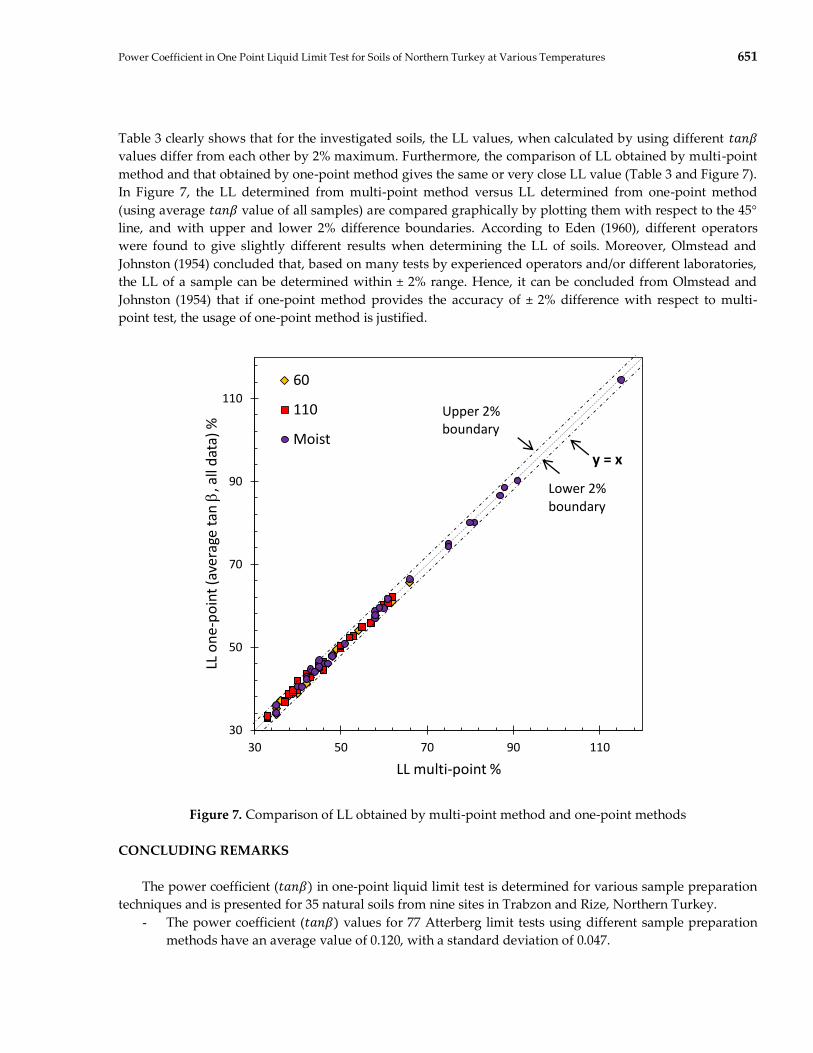
Table 3 clearly shows that for the investigated soils, the LL values, when calculated by using different 𝑡𝑎𝑛𝛽
values differ from each other by 2% maximum. Furthermore, the comparison of LL obtained by multi-point
method and that obtained by one-point method gives the same or very close LL value (Table 3 and Figure 7).
In Figure 7, the LL determined from multi-point method versus LL determined from one-point method
(using average 𝑡𝑎𝑛𝛽 value of all samples) are compared graphically by plotting them with respect to the 45
line, and with upper and lower 2% difference boundaries. According to Eden (1960), different operators
were found to give slightly different results when determining the LL of soils. Moreover, Olmstead and
Johnston (1954) concluded that, based on many tests by experienced operators and/or different laboratories,
the LL of a sample can be determined within ± 2% range. Hence, it can be concluded from Olmstead and
Johnston (1954) that if one-point method provides the accuracy of ± 2% difference with respect to multi-
point test, the usage of one-point method is justified.
Figure 7. Comparison of LL obtained by multi-point method and one-point methods
CONCLUDING REMARKS
The power coefficient (𝑡𝑎𝑛𝛽) in one-point liquid limit test is determined for various sample preparation
techniques and is presented for 35 natural soils from nine sites in Trabzon and Rize, Northern Turkey.
- The power coefficient (𝑡𝑎𝑛𝛽) values for 77 Atterberg limit tests using different sample preparation
methods have an average value of 0.120, with a standard deviation of 0.047.
y = x
30
50
70
90
110
30 50 70 90 110
LL o
ne
-po
int
(ave
rage
tan
b, a
ll d
ata)
%
LL multi-point %
60
110
Moist
Lower 2% boundary
Upper 2% boundary

652 E. ÜYETÜRK, N. HUVAJ
- ASTM D4318-17 suggested power coefficient (𝑡𝑎𝑛𝛽) value of 0.121 can be used. It can be noted that
this power value is demonstrated to give good results for ML-OL and MH-OH soils used in this
study.
- It is noted that upon increase in drying temperature, 𝑡𝑎𝑛𝛽 values are getting smaller.
- Differences between the LL values obtained by one-point method and multi-point methods are
insignificant (i.e. less than or equal to 2%), therefore one-point method can be considered as an
alternative to multi-point test considering the benefits it provides.
- Determined 𝑡𝑎𝑛𝛽 values in this study and previous studies of different researchers can be
considered to be similar.
- As a general recommendation, it is observed during the tests and the data analysis process that, as
also stated by Eden (1955), when using one-point method, using a blow count value near 25
increases the accuracy of the predicted LL.
- The results of this research support the conclusion given by the US Waterways (1949) and Eden
(1955) that the average slope value appears to be independent of soil type and geologic origin.
ACKNOWLEDGEMENTS
The authors acknowledge the help provided by Mustafa Hüseyinpaşaoğlu from Turkish National
Disaster Agency (AFAD)’s Rize office, Ozan Dadasbilge from GEOCON Company, undergraduate students
Berkutay Binol and Isam Khasib for their help during site visits and taking soil sample from the sites.
REFERENCES
ASTM D2487-11, Standard Practice forClassification of Soils for Engineering Purposes (unified soil
classification system), ASTM International.
ASTM D4318–10, Standard Test Methods for Liquid Limit, Plastic Limit, and Plasticity Index of Soils, ASTM
International.
Atterberg, A., 1911, “Uber die physikalische bodenuntei suchung and uber die plastizitat der tone int. mitt
far bodenkunde”, Berlin, 1.
Casagrande, A., 1932, “Research on the Atterberg Limits of Soils”, Public Roads, Vol.13, pp.121-136
DIN 18 121 Teil 1, Teil 2, Wassergehalt,
DIN 18 122 Teil 1, Teil 2, Zustandsgrenzen (Konsistenzgrenzen),
Eden, W. J., 1955, “Trial of One-Point Liquid Limit Method”, Proceedings of Ninth Canadian Soil Mechanics
Conference, Ottawa, December 15th to 16th 1955 (National Research Council for Canada), Appendix
A. Eden, W. 1960. Use of a one-point liquid limit procedure. In Papers on Soils 1959 Meetings.
ASTM International.
Haigh, S. K., Vardanega, P. J., 2014, “Fundamental Basis of Single-point Liquid Limit Measurement
Approaches”, Applied Clay Science, Vol. 102, pp. 8-14
Jain, L.C., Patwardhan, N.K., 1960, “Physical Properties of Soils from the Ganges Valley”, Journal of Scientific
and Industrial Research (India), Vol. 19A(4), pp. 162-167.
Jefferson, I., Rogers, C. D. F., 1998, “Liquid Limit and the Temperature Sensitivity of Clays”, Engineering
Geology, Vol. 49(2), pp. 95-109.
Kanıt, R., Özer, M., Özdemir, Ş., 2006, “Effect of Sample Preparation Method on the Cone Penetration
Liquid Limit Value (Örnek Hazırlama Yönteminin Koni Batma Likit Limit Değerine Etkisi)”, Journal
of Selcuk-Technic, Volume 5, Number: 3-2006.
Kim, J. B., 1973, “A study on the General and One Point Method of Test for Liquid Limit Procedure”, Journal
of the Korean Society of Agricultural Engineers, Vol. 15(4), pp. 3153-3159.

Power Coefficient in One Point Liquid Limit Test for Soils of Northern Turkey at Various Temperatures 653
Mohan, D., Goel, R. K., 1958, “Rapid Methods of Determining Liquid Limit of Soils”, Journal of Scientific and
Industrial Research (India) A 17, pp.498-501
Norman, L.E. J., 1959, “The One-Point Method of Determining the value of the Liquid Limit of a Soil”,
Geotechnique, Vol. 9 (1), pp.1-8
Olmstead, F. R., Johnston, C. M., 1955, “Rapid Methods for Determining Liquid Limits of Soils”, Highway
Research Board Bulletin, (95).
Orhan, M., Özer, M. 2006, “Comparison of Casagrande and Cone Penetration Methods in Determination of
Liqid Limit of Natural Soils”, Gazi Üniversitesi Mühendislik-Mimarlık Fakültesi Dergisi, Vol. 21(4).
Önalp, A., Kılıç, C., 1994, “One Point Method for Liquid Limit of Clays of Eastern Black Sea”, Proceedings of
the 5th National Soil Mechanics and Foundation Engineering Conference, Ankara, 155-160. (in Turkish)
Önalp, A., Arel, E., 2013, “Determination of Liquid Limit of Clays from European Section of İstanbul (Likit
limitin tek nokta yöntemi ile ölçümü ve İstanbul killerinde uygulama)”, 5. Geoteknik Sempozyumu, 5-
7 Aralık 2013, Çukurova Üniversitesi, Adana (in Turkish).
Özer, M., 2008, “Effects of Sample Preparation on the Liquid Limit Determined by Cone Penetration
Test”, Journal of Faculty of Engineering, Architecture, Gazi University, Vol. 23, (3), pp.689-698.
Roje-Bonacci, T., 2004, “Liquid Limit Determination of the High Plastic Clays by One-Point Method”, 4th
Slovenian Geotechnical Congress and 5th Sukljetovi days, p. 199-204.
Stanchi, S., Catoni, M., D'Amico, M. E., Falsone, G., Bonifacio, E., 2017, “Liquid and Plastic Limits of Clayey,
Organic C-rich Mountain Soils: Role of Organic Matter and Mineralogy”, Catena, Vol. 151, pp.238-
246.
Terzaghi, K., Peck, R. B., Mesri, G., 1996, Soil Mechanics In Engineering Practice, John Wiley & Sons.
US Waterways, 1949, Simplification of the Liquid Limit Test Procedure, U.S. Army Corps of Engineers Waterways
Experiment Station, Technical Memorandum No. 3-286, 64 p.
Uysal, A., 2004, Adapazarı ve Civarında Likit Limit Deneyinde Kullanılacak β Katsayısının Bulunması,
Yüksek Lisans Tezi, Sakarya Üniversitesi.
Zolfaghari, Z., Mosaddeghi, M. R., Ayoubi, S., Kelishadi, H., 2015, “Soil Atterberg Limits and Consistency
Indices as Influenced by Land use and Slope Position in Western Iran”, Journal of Mountain
Science, Vol. 12(6), pp. 1471-1483.
Related Documents