Power-aware Consolidation of Scientific Workflows in Virtualized Environments Qian Zhu Jiedan Zhu Gagan Agrawal Department of Computer Science and Engineering Ohio State University, Columbus OH 43210 {zhuq,zhujie,agrawal}@cse.ohio-state.edu ABSTRACT Use of virtualization technologies is becoming prevalent, including, but not limited to, the current commercial cloud environments. At the same time, besides resources costs and application performance, energy efficiency is becoming a dominant consideration while de- signing systems and executing applications on them. The premise of our work is that consolidation of scientific workflow tasks can be a promising approach for energy and resource cost optimization, with- out incurring substantial performance degradation. This is further supported by detailed analysis of resource requirements of scientific workflow tasks, and analysis of power consumption with use of vir- tualization and with consolidation of workloads. Based on the trends observed from our experiments, we have de- veloped pSciMapper, a power-aware consolidation framework for scientific workflow tasks. We view consolidation as a hierarchical clustering problem, and introduce a distance metric that is based on interference between resource requirements. We extract the key tem- poral features of the resource (CPU, memory, disk I/O, and network I/O) requirements of each workflow task, and use a dimensionality reduction method (KCCA) to relate the resource requirements to per- formance and power consumption. We have evaluated pSciMapper with both real-world and synthetic scientific workflows, and demon- strated that it is able to reduce power consumption by up to 56%, with less than 15% slowdown for the workflow. Our experiments also show that overhead of pSciMapper is very low, and it can be a practical approach even for workflows with hundreds of tasks. 1. INTRODUCTION Business and scientific computing processes can often be mod- eled as workflows. Formally, a “scientific workflow is a specifica- tion of a scientific process, which represents, streamlines, and auto- mates the analytical and computational steps that a scientist needs to go through from dataset selection and integration, computation and analysis, to final data product presentation and visualization” 1 . Large-scale scientific workflows are used to support research in ar- eas like astronomy [1], bioinformatics [5], physics [12], and seis- mic research [2], and many others. Scientific workflow manage- ment systems like Pegasus [18] and Kepler [31] have been developed with goals of supporting specification, management, and execution of workflows, especially on large datasets and high-end resources like the TeraGrid [4]. Another recent trend has been towards cloud computing. Lately, there is a growing interest in the use of cloud computing for scientific applications, as evidenced by a large-scale funded project like Mag- ellan 2 , and related research efforts like the Nimbus project 3 . Sev- eral projects have experimented with scientific workflows on cloud environments [17, 26, 23]. One of the characteristics of cloud en- 1 http://www.cs.wayne.edu/ shiyong/swf/swf2010.html 2 Please see http://www.cloudbook.net/doe-gov 3 http://workspace.globus.org vironments is the use of virtualization technologies, which enable applications to set up and deploy a customized virtual environment. Virtual Machines (VMs) are configured independent of the resources and can be easily migrated to other environments. Another feature of cloud computing is the pay-as-you-go model, or the support for on-demand computing. Applications have access to a seemingly un- limited set of resources, and users are charged based on the number and type of resources used. Resource utilization and resource costs are important considera- tions for both cloud service providers and cloud users. From users’ perspective, with the pay-as-you-go model, users need to maintain the tradeoff between resource costs and application performance. Cloud providers, on the other hand, will like to maintain high through- put, and meet the needs of a large number of users with a fixed set of resources. Power management is another critical issue for the clouds hosting thousands of computing servers. A single high-performance 300 W server consumes 2628 KWh of the energy per year, with an additional 748 KWh in cooling [10], which also causes a significant adverse impact on the environment in terms of CO2 emissions. Even in 2006, data centers accounted for 1.5% of the total U.S. electricity consumption, and this number is expected to grow to 3.0% by 2011 4 . Lately, there has been much interest in effective power management, and techniques like Dynamic Voltage and Frequency Scaling (DVFS) have been applied to reduce power consumption [22, 50, 40, 38]. This paper focuses on effective energy and resource costs man- agement for scientific workflows. Our work is driven by the obser- vation that tasks of a given workflow can have substantially different resource requirements, and even the resource requirements of a par- ticular task can vary over time. Mapping each workflow task to a different server can be energy inefficient, as servers with a very low load also consume more than 50% of the peak power [8]. Thus, server consolidation, i.e. allowing workflow tasks to be consolidated onto a smaller number of servers, can be a promising approach for reducing resource and energy costs. We apply consolidation to tasks of a scientific workflow, with the goal of minimizing the total power consumption and resource costs, without a substantial degradation in performance. Effective consol- idation, however, poses several challenges. First, we must carefully decide which workloads can be combined together, as the workload resource usage, performance, and power consumption is not addi- tive. Interference of combined workloads, particularly those hosted in virtualized machines, and the resulting power consumption and application performance needs to be carefully understood. Second, due to the time-varying resource requirements, resources should be provisioned at runtime among consolidated workloads. We have developed pSciMapper, a power-aware consolidation fra- mework to perform consolidation to scientific workflow tasks in vir- tualized environments. We first study how the resource usage im- pacts the total power consumption, particularly taking virtualization 4 http://www.energystar.gov/index.cfm?c=prod_development.server _efficiency_study

Welcome message from author
This document is posted to help you gain knowledge. Please leave a comment to let me know what you think about it! Share it to your friends and learn new things together.
Transcript

Power-aware Consolidation of Scientific Workflows inVirtualized Environments
Qian Zhu Jiedan Zhu Gagan AgrawalDepartment of Computer Science and Engineering
Ohio State University, Columbus OH 43210{zhuq,zhujie,agrawal}@cse.ohio-state.edu
ABSTRACTUse of virtualization technologies is becoming prevalent, including,but not limited to, the current commercial cloud environments. Atthe same time, besides resources costs and application performance,energy efficiency is becoming a dominant consideration while de-signing systems and executing applications on them. The premise ofour work is that consolidation of scientific workflow tasks can be apromising approach for energy and resource cost optimization, with-out incurring substantial performance degradation. This is furthersupported by detailed analysis of resource requirements of scientificworkflow tasks, and analysis of power consumption with use of vir-tualization and with consolidation of workloads.
Based on the trends observed from our experiments, we have de-velopedpSciMapper, a power-aware consolidation framework forscientific workflow tasks. We view consolidation as a hierarchicalclustering problem, and introduce a distance metric that is based oninterference between resource requirements. We extract the key tem-poral features of the resource (CPU, memory, disk I/O, and networkI/O) requirements of each workflow task, and use a dimensionalityreduction method (KCCA) to relate the resource requirements to per-formance and power consumption. We have evaluated pSciMapperwith both real-world and synthetic scientific workflows, and demon-strated that it is able to reduce power consumption by up to56%,with less than15% slowdown for the workflow. Our experimentsalso show that overhead of pSciMapper is very low, and it can be apractical approach even for workflows with hundreds of tasks.
1. INTRODUCTIONBusiness and scientific computing processes can often be mod-
eled as workflows. Formally, a“scientific workflow is a specifica-tion of a scientific process, which represents, streamlines, and auto-mates the analytical and computational steps that a scientist needsto go through from dataset selection and integration, computationand analysis, to final data product presentation and visualization”1.Large-scale scientific workflows are used to support research in ar-eas like astronomy [1], bioinformatics [5], physics [12], and seis-mic research [2], and many others. Scientific workflow manage-ment systems like Pegasus [18] and Kepler [31] have been developedwith goals of supporting specification, management, and executionof workflows, especially on large datasets and high-end resourceslike the TeraGrid [4].
Another recent trend has been towardscloud computing. Lately,there is a growing interest in the use of cloud computing for scientificapplications, as evidenced by a large-scale funded project like Mag-ellan 2, and related research efforts like the Nimbus project3. Sev-eral projects have experimented with scientific workflows on cloudenvironments [17, 26, 23]. One of the characteristics of cloud en-
1http://www.cs.wayne.edu/ shiyong/swf/swf2010.html2Please see http://www.cloudbook.net/doe-gov3http://workspace.globus.org
vironments is the use of virtualization technologies, which enableapplications to set up and deploy a customized virtual environment.Virtual Machines (VMs) are configured independent of the resourcesand can be easily migrated to other environments. Another featureof cloud computing is thepay-as-you-gomodel, or the support foron-demandcomputing. Applications have access to a seemingly un-limited set of resources, and users are charged based on the numberand type of resources used.
Resource utilization and resource costs are important considera-tions for both cloud service providers and cloud users. From users’perspective, with thepay-as-you-gomodel, users need to maintainthe tradeoff between resource costs and application performance.Cloud providers, on the other hand, will like to maintain high through-put, and meet the needs of a large number of users with a fixed set ofresources. Power management is another critical issue for the cloudshosting thousands of computing servers. A single high-performance300 W server consumes 2628 KWh of the energy per year, with anadditional 748 KWh in cooling [10], which also causes a significantadverse impact on the environment in terms ofCO2 emissions. Evenin 2006, data centers accounted for 1.5% of the total U.S. electricityconsumption, and this number is expected to grow to 3.0% by 20114.Lately, there has been much interest in effective power management,and techniques like Dynamic Voltage and Frequency Scaling (DVFS)have been applied to reduce power consumption [22, 50, 40, 38].
This paper focuses on effective energy and resource costs man-agement for scientific workflows. Our work is driven by the obser-vation that tasks of a given workflow can have substantially differentresource requirements, and even the resource requirements of a par-ticular task can vary over time. Mapping each workflow task to adifferent server can be energy inefficient, as servers with a very lowload also consume more than50% of the peak power [8]. Thus,server consolidation, i.e. allowing workflow tasks to be consolidatedonto a smaller number of servers, can be a promising approach forreducing resource and energy costs.
We apply consolidation to tasks of a scientific workflow, with thegoal of minimizing the total power consumption and resource costs,without a substantial degradation in performance. Effective consol-idation, however, poses several challenges. First, we must carefullydecide which workloads can be combined together, as the workloadresource usage, performance, and power consumption is not addi-tive. Interference of combined workloads, particularly those hostedin virtualized machines, and the resulting power consumption andapplication performance needs to be carefully understood. Second,due to the time-varying resource requirements, resources should beprovisioned at runtime among consolidated workloads.
We have developedpSciMapper, a power-aware consolidation fra-mework to perform consolidation to scientific workflow tasks in vir-tualized environments. We first study how the resource usage im-pacts the total power consumption, particularly taking virtualization
4http://www.energystar.gov/index.cfm?c=prod_development.server_efficiency_study

DataPartitioning
DataAggregation
Pipeline
data
gMM5
gWaterLevel
gTurbulentStress
gNetHeatFlux
gGridResolution
gPOM2D
gPOM3D
gVis
Figure 1: GLFS Workflow
into account. Then, we investigate the correlation between work-loads with different resource usage profiles, and how power and per-formance is impacted by their interference. Our algorithm derivesfrom the insights gained from these experiments. We first summarizethe key temporal features of the CPU, memory, disk, and networkactivity associated with each workflow task. Based on this profile,consolidation is viewed as ahierarchical clusteringproblem, with adistance metric capturing the interference between the tasks. We alsoconsider the possibility that the servers may be heterogeneous, andan optimization method is used to map each consolidated set (clus-ter) onto a server. As an enhancement to our static method, we alsoperform time varying resource provisioning at runtime.
We evaluated pSciMapper using several real and synthetic scien-tific workflows. The observations from our experiments show thatour consolidation algorithm, with time-varying resource provision-ing, is able to save up to56% of the total consumed power, with only10-15% performance slowdown, over the case where each workflowtask is mapped to a different server. This is close to, or even betterthan, an optimal static approach that is based on exhaustive search. Inaddition, we also show that the overhead of pSciMapper is negligibleand it is practical even for workflows with hundreds of tasks.
The rest of the paper is organized as follows. We motivate ourwork by analyzing the resource requirements of a scientific work-flow application in Section 2. We study the impact of a workload’sresource requirements, use of virtualization, and workload consoli-dation, on power consumption in Section 3. In Section 4, we describeour power-aware consolidation algorithm. Results from our experi-mental evaluation are reported in Section 5. We compare our workwith related research efforts in Section 6 and conclude in Section 7.
2. MOTIVATING APPLICATIONSThe work presented in this paper is driven by characteristics of
scientific workflows (or DAG-based computations), and the opportu-nities for optimizations they offer. We specifically study one appli-cation in details.
2.1 Great Lake Forecasting System (GLFS)We now describe one such scientific application in details. Par-
ticularly, we first show its DAG structure. Then, we analyze theresource usage of theGLFS workflow and discuss the characteris-tics that make consolidation a promising solution to save power andresource costs in any virtualized environment, including the clouds.
This application monitors meteorological conditions of the LakeErie for nowcasting (for the next hour) and forecasting (for the nextday). Every second, data comes into the system from the sensors
planted along the coastal line, or from the satellites supervising thisparticular coastal district. Normally, the Lake Erie is divided intomultiple coarse grids, each of which is assigned available resourcesfor model calculation and prediction. We illustrate the GLFS work-flow in Figure 1. The number of inputs processed by the workflowmay increase over time as more regions of Lake Erie need to becovered. This will also translate to an increase in the number ofcomputational tasks. The initial satellite sea surface temperature andother measured data, including the the wind speed, pressure and airhumidity, are fed into thegMM5 task. Then, the updated meteo-rological data go through a series of interaction models, includinggTurbulentStress, gNetHeatFluxandgWaterLevel, as shown in thefigure. These steps prepare the data that is required for predictingcorresponding meteorological information using thegPOM2Dor thegPOM3D tasks. Before starting the POM model, thegGridResolu-tion task decides the resolution that will be used in the model. Fi-nally, the grid resolution, along with the output from various inter-action models, serve as inputs to thegPOM2D task (which appliesa 2D ocean model) and/or thegPOM3D(which applies a 3D oceanmodel for more accurate prediction). Such POM models will predictmeteorological information, including the water level, current veloc-ity, and water temperature, for Lake Erie. ThegVis task is then usedto project the outputs onto images.
The runtime of most individual tasks in theGLFS workflow canbe quite small (seconds to few minutes). Yet,GLFS is clearly acompute-intensive application. On a standard PC (Dual Opteron 254(2.4GHz) processors, with 8 GB of main memory and 500 GB lo-cal disk space), predicting meteorological information for the nexttwo days for an area of 1 square miles took nearly 2 hours. Theexecution time could grow rapidly with need for increasing spatialcoverage (for example, the total area of Lake Erie is9, 940 squaremiles), and/or better temporal granularity. Better response time canbe achieved by using different servers for different workflow tasks.Obviously, this will also increase resource and power costs, and theright tradeoff between the execution time and resource and powercosts needs to be maintained. In the next subsection, we performa detailed analysis on the resource utilization of the GLFS workflowand motivate our work on using server consolidation to reduce powerand resource costs.
2.2 Resource Usage ofGLFS WorkflowWe execute theGLFS application in a Linux cluster, which con-
sists of 64 computing nodes. Each node has a dual Opteron 254(2.4GHz) with 8 GB of main memory and 500 GB local disk space,and the nodes are interconnected with a switched 1 Gb/s Ethernet.During the execution of theGLFS workflow, we usedSysstattools[3] to collect the following performance data every 1 second: CPUutilization, memory utilization, disk I/O (including reads and writes),and network I/O (including sends and receives). Like other scientificworkflows,GLFS has the long-running, iterative nature. For a givencertain input data, the steps between the transferring data into the firsttask,gMM5 to the output fromgVisare referred to as one invocationof the workflow. For different invocations, behavior of the applica-tion could be different, due to different data size, and/or dynamicsexposed by the application. Figure 2 shows the CPU, memory, disk,and network utilization of twoGLFS tasks, for 5 invocations of theworkflow.
As illustrated in Figure 2, each resource usage data can be ex-pressed as atime series. The resource usage of the first task variesacross different invocations. In contrast, resources consumed bythesecond task remains roughly the same across invocations. We furtheranalyze the characteristics of the time series we have obtained. Par-ticularly, we have applied the auto-correlation function (ACF) [27] tothe series and it shows that the resource utilization data from the sci-entific workflows is expressed as a periodic time series. Furthermore,a time series can be eitherstationary, with observations fluctuating

0 500 1000 1500 2000 2500 3000 3500 4000 4500 50000%
50%
100%
CP
U U
tiliz
atio
n
0 500 1000 1500 2000 2500 3000 3500 4000 4500 50000
1000
2000
3000
Mem
ory
Util
izat
ion
(MB
)
0 500 1000 1500 2000 2500 3000 3500 4000 4500 50000
2
4
6x 10
5
Dis
k I/O
(B
ytes
)
0 500 1000 1500 2000 2500 3000 3500 4000 4500 50000
2
4
6x 10
7
Net
wor
k I/O
(B
ytes
)
Execution Time (Sec)
CPU
Memory
Disk
Network
<500, 3, 600><1000, 6, 600> <1000, 6, 600><2000, 12, 1200><1000, 6, 600>
(a)
0 500 1000 1500 2000 2500 3000 3500 4000 4500 50000%
50%
100%
CP
U U
tiliz
atio
n
0 500 1000 1500 2000 2500 3000 3500 4000 4500 5000300
350
Mem
ory
Util
izat
ion
(MB
)
0 500 1000 1500 2000 2500 3000 3500 4000 4500 5000−1
0
1
Dis
k I/O
(B
ytes
)
0 500 1000 1500 2000 2500 3000 3500 4000 4500 50001
2
3x 10
7
Net
wor
k I/O
(B
ytes
)
Execution Time (Sec)
CPU
Memory
Disk
Network
<500, 3, 600><1000, 6, 600> <1000, 6, 600><2000, 12, 1200><1000, 6, 600>
(b)
Figure 2: The CPU, Memory, Disk and Network Usage of Two GLFS Components (< 1000, 6, 600 >, < 500, 3, 600 > and< 2000, 12, 200 > Represent Different Application Parameters
around a constant mean with constant variance, ornon-stationary,where the underlying process has unfixed moments (i.e. mean andvariance) that intend to increase or decrease over time. We claimthat the resource utilization time series from one invocation at leastmeets theweak stationaryrequirements, which are that the first twomoments (mean and variance) do not vary with time. The resourceusage pattern ofGLFS, in this respect, is similar to the observationsmade from other scientific workflow executions [13, 49].
Overall, we can make the following observations from the re-source usage patterns we have seen. 1) The scientific workflow canbe composed of a large number of tasks. The workflow tasks have aperiodic behavior with respect to CPU, memory, disk, and networkusage, with most of them incurring low resource utilization (e.g. Fig-ure 2(b)). 2) The resource usage of a workflow task is significantlysmaller than its peak value for more than80% of the time (exceptthat network activity, which remains constant over time). Therefore,provisioning resources based on peak requirements will likely leadto resource and power wastage. Furthermore, considering the timeseries of resource utilization of different tasks, we can see that theirrespective usage of the same resource does not peak at the same time.3) The resource consumed by a workflow task can be dependent onthe values of the application parameters for the particular invocation(Figure 2(a)), as well as characteristics of the host server. Compar-ing the 1st (and 2nd) to the 4th invocation, the resource usage patternremains the same, with only a change in the intensity of resourcesconsumption. However, even the pattern itself could change becauseof a different set of application parameters (i.e. consider the 3rd invo-cation). In the 5th invocation, the same parameter values were usedwith a change in the resource availability from the host server.
3. POWER ANALYSIS WITH VMS AND CON-SOLIDATION
In the previous section, we demonstrated how the resource require-ments of workflow tasks have a periodic pattern, with actual require-ments being significantly lower than peak requirements most of thetime. Our goal in this section is to understand the potential of usingvirtualization and consolidation of virtual machines (VMs) for opti-mizing resource and power requirements. To this end, we first an-alyze the relationship between resource usage and power consump-tion, particularly taking virtualization into account. Then, perfor-mance and power consumption with consolidation of different typesof workloads is analyzed.
3.1 Power Consumption AnalysisIn this subsection, we study how power consumption is related to
different levels of resource activities. Particularly, we conducted theexperiments on a single PC with Intel Dual Core processor at 3.0G
Workload CPU Memory Disk NetworkCPU-bound Vary 2% None None
Memory-bound 70% Vary None NoneDisk-bound 50% 2% Vary None
Network-bound 50% 2% 18MB/s Vary
Table 1: Resource Activities of Different Sets of Workloads
CPU−bound Memory−bound Disk−bound Network−bound0
10
20
30
40
50
60
Uni
t Pow
er C
onsu
mpt
ion
(Wat
t)
Low Moderately Low Moderately High High
Figure 3: Power Consumption with Different Levels of CPU,Memory, Disk, and Network Usage
Hz, 2 GB of memory and a 160 GB hard drive. This machine isconnected to the department research network through a 1 GB Eth-ernet connection. We clutched a power meter to this PC to measurethe power consumed as workloads are varied. Four distinct sets ofsynthetic workloads were used for our analysis. Note that a mix ofsuch workloads could be representatives of the scientific workflowtasks. These sets areCPU-bound, Memory-bound, Disk-bound, andNetwork-bound, where CPU-bound denotes that only the CPU us-age is varied, while other resource activities are fixed. Within eachset, the workload is varied betweenlow, moderately low, moderatelyhigh, andhigh levels. We summarize the resource needs for work-loads in each set in Table 1.
We present the experimental results in Figure 3. Unit power isreported here, and it denotes the power consumed every 1 second.When the system is idle, the power consumption is32 watt. Wevaried the CPU usage from20%, 40%, 80%, to 100% in the CPU-bound workload set. As we can see, CPU utilization has a significantimpact on the consumed power. Between a workload where CPUactivity is 20% and the workload where the CPU activity is 100%,power consumption increases by a factor of 64%. However, we canalso see that lowering CPU activity does not result in a proportionaldecrease in power consumption. If the CPU activity is lowered toone fifth of the peak capacity of the system, the power savings areonly close to 40% of the peak power.
In the memory-bound set, the memory utilization is10%, 20%,
C@C C@M C@D C@N M@M M@D M@N D@D D@N N@N0
10
20
30
40
50
60
Uni
t Pow
er C
onsu
mpt
ion
(Wat
t)
App1App2Consolidated VMs
(a)
C@C C@M C@D C@N M@M M@D M@N D@D D@N N@N0
20
40
60
80
100
120
140
Exe
cutio
n T
ime
(Sec
)
App1 App2 Consolidated VMs
(b)
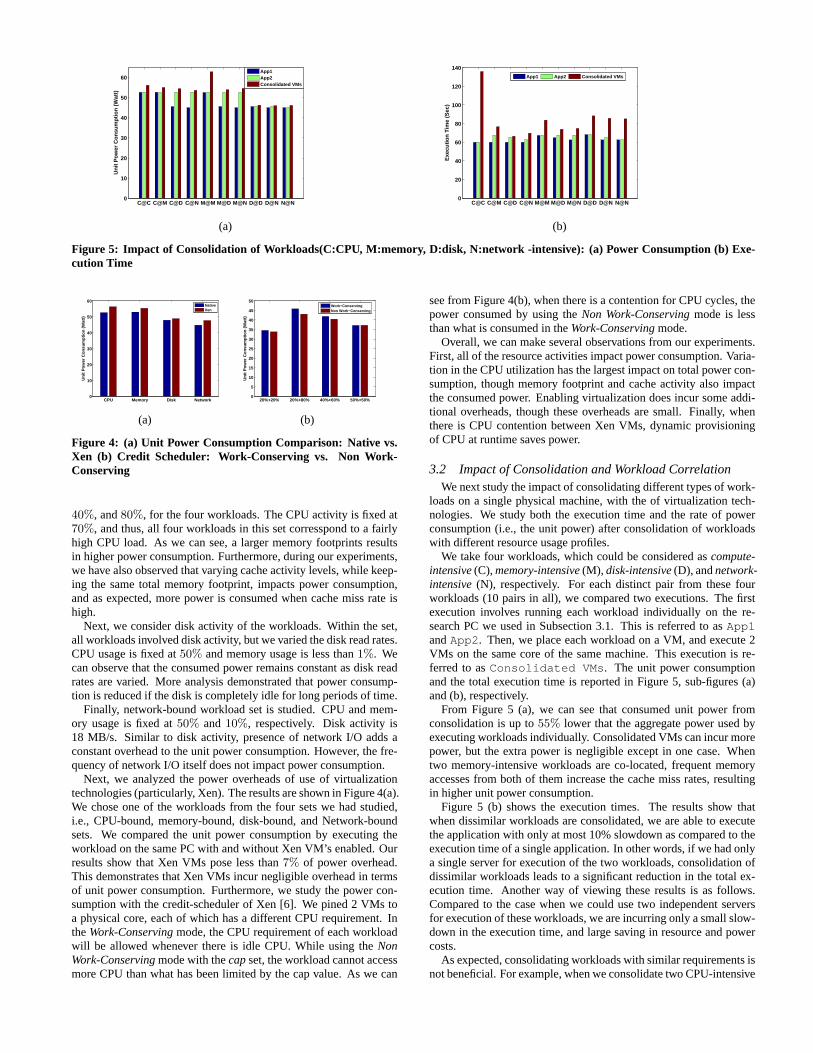
Figure 5: Impact of Consolidation of Workloads(C:CPU, M:memory, D:disk, N:network -intensive): (a) Power Consumption (b) Exe-cution Time
CPU Memory Disk Network0
10
20
30
40
50
60
Uni
t Pow
er C
onsu
mpt
ion
(Wat
t)
NativeXen
(a)
20%+20% 20%+80% 40%+60% 50%+50%0
5
10
15
20
25
30
35
40
45
50
Uni
t Pow
er C
onsu
mpt
ion
(Wat
t)
Work−ConservingNon Work−Conserving
(b)
Figure 4: (a) Unit Power Consumption Comparison: Native vs.Xen (b) Credit Scheduler: Work-Conserving vs. Non Work-Conserving
40%, and80%, for the four workloads. The CPU activity is fixed at70%, and thus, all four workloads in this set corresspond to a fairlyhigh CPU load. As we can see, a larger memory footprints resultsin higher power consumption. Furthermore, during our experiments,we have also observed that varying cache activity levels, while keep-ing the same total memory footprint, impacts power consumption,and as expected, more power is consumed when cache miss rate ishigh.
Next, we consider disk activity of the workloads. Within the set,all workloads involved disk activity, but we varied the disk read rates.CPU usage is fixed at50% and memory usage is less than1%. Wecan observe that the consumed power remains constant as disk readrates are varied. More analysis demonstrated that power consump-tion is reduced if the disk is completely idle for long periods of time.
Finally, network-bound workload set is studied. CPU and mem-ory usage is fixed at50% and10%, respectively. Disk activity is18 MB/s. Similar to disk activity, presence of network I/O adds aconstant overhead to the unit power consumption. However, the fre-quency of network I/O itself does not impact power consumption.
Next, we analyzed the power overheads of use of virtualizationtechnologies (particularly, Xen). The results are shown in Figure 4(a).We chose one of the workloads from the four sets we had studied,i.e., CPU-bound, memory-bound, disk-bound, and Network-boundsets. We compared the unit power consumption by executing theworkload on the same PC with and without Xen VM’s enabled. Ourresults show that Xen VMs pose less than7% of power overhead.This demonstrates that Xen VMs incur negligible overhead in termsof unit power consumption. Furthermore, we study the power con-sumption with the credit-scheduler of Xen [6]. We pined 2 VMs toa physical core, each of which has a different CPU requirement. IntheWork-Conservingmode, the CPU requirement of each workloadwill be allowed whenever there is idle CPU. While using theNonWork-Conservingmode with thecapset, the workload cannot accessmore CPU than what has been limited by the cap value. As we can
see from Figure 4(b), when there is a contention for CPU cycles, thepower consumed by using theNon Work-Conservingmode is lessthan what is consumed in theWork-Conservingmode.
Overall, we can make several observations from our experiments.First, all of the resource activities impact power consumption. Varia-tion in the CPU utilization has the largest impact on total power con-sumption, though memory footprint and cache activity also impactthe consumed power. Enabling virtualization does incur some addi-tional overheads, though these overheads are small. Finally, whenthere is CPU contention between Xen VMs, dynamic provisioningof CPU at runtime saves power.
3.2 Impact of Consolidation and Workload CorrelationWe next study the impact of consolidating different types of work-
loads on a single physical machine, with the of virtualization tech-nologies. We study both the execution time and the rate of powerconsumption (i.e., the unit power) after consolidation of workloadswith different resource usage profiles.
We take four workloads, which could be considered ascompute-intensive(C),memory-intensive(M), disk-intensive(D), andnetwork-intensive(N), respectively. For each distinct pair from these fourworkloads (10 pairs in all), we compared two executions. The firstexecution involves running each workload individually on the re-search PC we used in Subsection 3.1. This is referred to asApp1andApp2. Then, we place each workload on a VM, and execute 2VMs on the same core of the same machine. This execution is re-ferred to asConsolidated VMs. The unit power consumptionand the total execution time is reported in Figure 5, sub-figures (a)and (b), respectively.
From Figure 5 (a), we can see that consumed unit power fromconsolidation is up to55% lower that the aggregate power used byexecuting workloads individually. Consolidated VMs can incur morepower, but the extra power is negligible except in one case. Whentwo memory-intensive workloads are co-located, frequent memoryaccesses from both of them increase the cache miss rates, resultingin higher unit power consumption.
Figure 5 (b) shows the execution times. The results show thatwhen dissimilar workloads are consolidated, we are able to executethe application with only at most 10% slowdown as compared to theexecution time of a single application. In other words, if we had onlya single server for execution of the two workloads, consolidation ofdissimilar workloads leads to a significant reduction in the total ex-ecution time. Another way of viewing these results is as follows.Compared to the case when we could use two independent serversfor execution of these workloads, we are incurring only a small slow-down in the execution time, and large saving in resource and powercosts.
As expected, consolidating workloads with similar requirements isnot beneficial. For example, when we consolidate two CPU-intensive

Offline Analysis Online Consolidation
Scientific Workflows
Temporal Feature Extraction
Time Varying
ResourceProvisioning
Kernel CanonicalCorrelation Analysis
Knowledge
Base
Optimization Search
Algorithm
Time series
Temporalsignatures
Consolidated
Workloads
KCCA model
Hidden Markov Model (HMM)Hierarchical Clustering
Figure 6: The pSciMapper Framework Design
workloads, the execution time doubled. Also, for a pair of memory-intensive workloads, the execution time increased by41%. Consol-idation of two workloads that have a high disk or network activityalso leads to significant slowdowns. In these cases, even if the unitpower does not increase, the total power consumption will increasebecause the same power is being consumed for a longer duration.
Overall, our results indicate that consolidation of workloads withdissimilar requirements can reduce the total power consumption andresource requirements significantly, without a substantial degrada-tion in performance.
4. DESIGN OF PSCIMAPPERThis section presents the framework,pSciMapper, that we have
developed to consolidate scientific workflows in virtualized environ-ments. We first give an overview of our approach. Next, we discusshow we extract key temporal information from the given resource uti-lization profiles (time-series) for each task of the workflow, and fur-ther relate it with application performance and power consumption.Then, we present our power-aware consolidation algorithm, whichplaces tasks of a scientific workflow on servers so that power con-sumption is minimized, without a substantial increase in the comple-tion time. Finally, towards the end of this section, we describe howwe learn a model capturing the resource usage profile’s dependenceon the application parameters and the characteristics of the resourceson which the workflow is executed.
4.1 OverviewIn order to reduce the total power in a computing environment,
effective power management strategies have been developed [22, 50,44, 39]. Dynamic Voltage and Frequency Scaling (DVFS) is a widelyapplied technique to minimize the processor power by scaling downCPU frequencies. We use server consolidation in our work, whichis based on the characteristics of the workflows we have observed.Unlike the previous work on consolidating workloads [48, 43], wenot only specifically focus on scientific workflows (DAGs), but alsoconsider a more complex consolidation problem. We investigateserver heterogeneity, with respect to CPU, memory, disk, and net-work bandwidths, as well as the application requirements for theseresources. We also study the interference caused by resource con-tention when multiple workflow tasks are placed on a single server,and how it impacts the power consumption and application perfor-mance.
The overall design of pSciMapper is illustrated in Figure 6. Itconsists of two major components:online consolidationandofflineanalysis. The online consolidation algorithm assumes that for eachtask of the workflow to be scheduled, a set of time series data repre-senting the CPU, memory, disk, and network utilization is available.In practice, such specific information may not be available for thegiven hardware and the application parameters without executing theworkflow. We train a hidden Markov model (HMM) to predict such
time series, which we describe towards the end of this section.Now, for consolidation, we extract keytemporal featuresfrom the
time-series. This results in 52 features per workflow task , not allof which may be equally important for predicting the execution timeand power consumption. We use a dimensionality reduction tech-nique, Kernel Canonical Correlation Analysis (KCCA) [7], to relatethe key features to the execution time and power consumption.
Next, the online consolidation algorithm uses hierarchical cluster-ing [25] and the Nelder-Mead optimization algorithm [35], to searchfor the optimal consolidation, where power requirements are min-imized, without a substantial impact on performance. As an en-hancement to our static consolidation approach, we also performtime-varying resource provisioningbased on the dynamic resourcerequirements of the workflow tasks.
4.2 Temporal Feature Extraction and KernelCanonical Correlation Analysis
The relationships between resource usage time series and a work-flow task’s execution time and its power consumption are complex.To facilitate our analysis, we use a specifictemporal signaturetocapture the key characteristics of a given time series.Temporal Signature: Given a resource usage time series, whichspecifies the resource requirements with respect to a specific resource(CPU, memory, disk, or network) of a workflow task, we extract thefollowing three sets of information: 1)Peak value: We define it asthe max value of the time series data and denote it asmax. 2) Rela-tive variance: We compute the sample variance of the data, denotedas v2. However, the sample variance depends on the scale of themeasurement of a particular resource. Therefore, we transform thev2 values to a normalized[0, 1] space, with 0 being the lowest vari-ance and 1 being the highest. This value serves as an indicator offluctuation around the average resource utilization of the workflow.3) Pattern: Besides peak and variance, we need to capture how theresource usage varies around an expected baseline. We take the repet-itive pattern of the time series data and generate a sequence of sam-ples, choosing the sampling rate is a way such that the informationfrom the original time series is preserved as much as possible [27]. Inthis work, the pattern is represented by10 numbers,p1, p2, ..., p10.
Now the temporal signature for a resource utilization time seriesdata (Ti) can be represented as
Ti =< maxi, v2
i , p1,i, p2,i, ..., p10,i > (1)
As the last part of the offline analysis in pSciMapper, we need torelate the usage of resources with the workflow task’s performanceand power consumption when it is mapped onto a server. We traina model for this purpose. The input to such model is the tempo-ral signatures we extracted from the CPU, memory, disk, and net-work utilization time series, plus resource variables representing thehost server capacity. The model outputs time and consumed powerfor a task of the scientific workflow on this server. Thus, we have52 features in the input space and 2 features in the output space.In our work, we have used Kernel Canonical Correlation Analysis(KCCA) [7] for modeling theresource-timeandresource-powerre-lationships.
KCCA
Resource Usage
Projection
Metric
Projection
Maximum
correlation
Resource UsageTime Series
TemporalSignatures
<0.12, 0.3, 0.6, 0.3,0.3, 0.12, …, 0.6><0.0, 0.8, 0.8, 0.8,0.8, 0.8, …, 0.8>
...
Power &Performance
<34.5, 12.65><56.8, 33.85>
...
Figure 7: KCCA Training: From Vectors of Resource Usage Fea-tures to Vectors of Metric Features

Algorithm 4.1: WORKFLOWCONSOLIDATION(C, S)
INPUT C: the set of componentsS: the set of servers
OUTPUT Θ̂: the consolidation plan// initial assignment of componentsInitialCluster(C, S);// generate resource usage profilefor eachCi and Sj
GenerateTS(Ci, Sj);Θ = OptimalSearch(C, S);while (true)
for each clusteri and clusterj
//calculate distance between two clusterslinkagei,j = CalculateDist(clusteri, clusterj);if linkagei,j < mergethreshold
// consolidate workloads in two clustersMergeCluster(clusteri, clusterj)
Θ = OptimalSearch(C, S);if ( stopping criteria is met)
Θ̂ = Θ;break;
TimeV aryingResourceProvisioning(Θ̂);
Figure 8: Workflow Consolidation Algorithm
KCCA : Canonical Correlation Analysis (CCA) is a dimension-ality reduction technique that is useful to determine the correlationbetween two sets of multi-variate datasets. KCCA is a generalizationof CCA using kernel functions to model nonlinear relationships [7].GivenN temporal signatures from resource usage profiles, we formanN × N matrix Kx, where the(i, j)th entry is the kernel evalua-tion kx(xi, xj). Specifically, we have used the Gaussian kernel [37].Similarly, we also form anN × N matrixKy, where the(i, j)th el-ement is the kernel evaluationky(yi, yj) with respect to applicationperformance and power consumption. The KCCA algorithm takesthe matricesKx andKy, and solves the following generalized eigen-vector problem:
»
0 KxKy
KyKx 0
– »
A
B
–
= λ
»
KxKx 00 KyKy
– »
A
B
–
(2)
This procedure finds subspaces in the linear space spanned bythe eigenfunctions of the kernel functions such that projections ontothese subspaces are maximally correlated [7]. We refer to such pro-jections asresource usage projectionandmetric projection, respec-tively. We illustrate such projections in Figure 7. If the linear spaceassociated with the Gaussian kernel can be understood as clusters inthe original feature space, then KCCA finds correlated pairs of clus-ters in the resource usage vector space and the performance/powervector space.
4.3 Power-Aware ConsolidationWe now present the details of the online consolidation algorithm
in our pSciMapper framework. The main algorithm is summarizedin Figure 8. For generality, we assume that available servers may beheterogeneous. We first randomly assign each of the workflow tasksonto an underlying server. We assume for now that CPU, memory,disk, and network usage time-series for executing the task on thisparticular server is available. In practice, this is obtained using theHMM, which we will describe later.
Our consolidation problem can be viewed as aclusteringproblem.Normally, clustering groups similar objects together. Here, our goalis to group workflow tasks that are dissimilar in their resource re-quirements. This can be handled by defining a distance measure that
focuses on the interference between the resource requirements of theworkflow tasks.
Particularly, we apply the agglomerative hierarchical clusteringalgorithm [25] using the extracted temporal signature vectors. Theconsolidation procedure is iterative and it starts from the bottom ofthe hierarchical cluster structure, i.e., when each cluster is formedby a single workflow task. We decide whether two tasks,i andj,can be consolidated by calculating thedistancebetween them. To bespecific, we define the distance metric as the following.
Disti,j =X
R1,R2
aff_score(R1, R2) × Corr(peakR1
i , peakR1
j )
×Corr(peakR2
i , peakR2
j ) (3)
, whereR1, R2 denotes any type of resources (thus 10 pairs in total)and Corr(peak
R1
i , peakR1
j ) is the Pearson’s correlation betweentwo workloads with regards to the resource usage ofR1. We ar-gue that it is more important to consider the correlation of the peakvalues rather than the whole temporal signature. Theaff_score
is pre-specified based on our correlation analysis in Section 3.2. Itvaries between 0 and 1, with 0 denoting the least interference whenconsuming two resourcesR1 andR2 together. The DAG structurehas to be considered here. Although combining two workloads withactive network activities could incur significant computing overhead,communication cost can be reduced if there is a direct dependencybetween them. Thusaff_score is small for two network-intensiveworkloads with aparent-child relationship. We merge two clus-ters if the distance between them is smaller than a threshold, i.e .merge_threshold in the pseudo-code.
Next, a well-known optimization algorithm, the Nelder-Mead [35],is applied to identify how the clusters obtained can be mapped to thegiven set of servers. The goal here is to minimize the power, with-out incurring a significant performance degradation. The consumedpower and execution time for the one-to-one mapping of clusters tothe servers can be estimated using the KCCA model trained offline.To be specific, the input vector, which includes the temporal signa-ture of the resource usage profile along with the server capacity, isprojected into the resource subspace. We then infer the coordinatesin the metric subspace using thek nearest neighbors, wherek = 3 inour implementation. Finally, we map the metric projection back tothe metrics, which are the consumed power and the execution time. Aweighted sum of the metric projections from the nearestk neighborshas been used, with the weight to be the reverse distance betweencoordinates of two projections in the subspace. The optimal point ofthis iteration with the minimum total power consumption is recorded.
Then, temporal signature of the new cluster is updated from theconsolidated workloads. Such consolidation iterations stop when theclusters cannot be merged anymore since merging will incur signifi-cant interference, and/or the degradation in application performancewill be intolerable.
As an enhancement to the static consolidation algorithm, we fur-ther take into account the dynamic resource requirements in the con-solidated workloads to save power (Section 3.1). The reasons isthat co-located workloads could peak together, or the resource us-age from different workloads that we have co-located can vary. Forexample, the CPU utilization of a workload changes from30% to60% while its co-located workload drops from50% to 30%. To sup-port such dynamics, we propose a heuristic method for performingthe time varying resource provisioning for each of the consolidatedservers. Specifically, we make a reservation plan that simply allo-cates virtual CPU and memory (currently, Xen only supports run-time changes to CPU and memory) to individual workloads. Clearly,the total requirements from these two resources should not exceedwhat is available on the physical server. However, if we are unable tomeet the peak requirements, resources are allocated to workloads inproportion to their peak values. Note that such resource reallocation

only takes action at the time instances where there are significantchanges to the resource requirements, since dynamically changingthe resource allocations frequently can involve significant overheadstoo.
Level 1
Level 2
Level 3
Level 4
C1 C2 C3 C4 C5
CPU: moderate
Mem: low
Disk: low
Net: low
CPU: moderate
Mem: low
Disk: low
Net: moderate
CPU: moderate
Mem: high
Disk: high
Net: low
CPU: high
Mem: moderate
Disk: low
Net: low
CPU: low
Mem: low
Disk: high
Net: moderate
Assignment <power, time>
{C1, S2}, {C2, S3}, {C3, S5}, {C4, S1},{C5, S4} <180.56, 92.87>
{(C1, C2), S2}, {C3, S5}, {(C4, C5), S1}
{(C1, C2, C3), S2}, {(C4, C5), S1}
<135.11, 88.03>
<93.62,83.93>
C1 C2 C3 C4 C5
Figure 9: Consolidating Workflows: An Example
Example: We use an example to explain our consolidation algo-rithm, as illustrated in Figure 9. Assume that the workflow has 5tasks,C1, C2, ..., C5 and originally it is on 5 servers,S1, S2, ...
, S5. The resource usage profile for each task is known in advance.At the beginning of the consolidation algorithm, eachCi at level 1 israndomly assigned to a serverSj . Then the optimization algorithmgenerates an assignment where the power consumption is the mini-mum at the current level. Then we move up to level 2, whereC1 andC2, and,C4 andC5 are merged as new clusters. This is consistentwith what we expect by observing the resource utilization character-istics. The optimal search will find the servers for the consolidatedworkloads. Now the power consumption drops significantly as wenow are using only 3 servers. This procedure repeats in level 3, whereC3 is merged with the cluster which containsC1 andC2. Note thatdue to the high memory footprint ofC3 and intensive I/O activities,serious interference would occur if it is co-located withC4 or C5.Now, 5 tasks of the workflow are consolidated on 2 servers and weare able to save half of the power with only a9% performance degra-dation. Since no tasks can be consolidated anymore, our algorithmwill generateC1, C2, andC3 onS2, C4 andC5 onS1 as the output.
4.4 Hidden Markov Model for Resource Usage EstimateThe approach presented so far assumes that when a workflow is
submitted, along with a set of application parameters, we know thetime series of CPU, memory, disk I/O, and network I/O usage foreach workflow task on any of the servers in our environment. Inpractice, however, it is impossible to know this information. We nowdescribe how we train a hidden markov model (HMM) based on arepresentative set of application parameters and hardware specifica-tions. Using this HMM, resource usage time series can be generatedfor given application parameters and hardware specification.
A hidden Markov model(HMM) is a statistical model that assumesthat a sequence of observationsO = O1,O2, ...OT is generatedfrom a set ofN states (X = x1, x2, ..., xn), with transition probabil-ities,P (xt|xt−1), between them, and emission probabilities,P (Ot|xt),denoting the probability of an observationOt being generated fromthe statet. The probability of a particular state in an HMM is onlydependent on the previous state. The probability of an observation isdependent only on the state that produced this observation.
We generate our HMM for resource utilization prediction in thefollowing way.
• Hidden states: They represent equivalence classes in resourceusage. To be specific, a hidden statexi is of the format ofxi =< cpui, memi, diski, neti >, denoting the CPU, mem-ory utilization, disk I/O, and network I/O. One issue we hadto address is that, in practice, each resource usage variable is acontinuous number, which leads an infinite number of hidden
states. We discretize the variable and thus make the number ofstates finite.
• Observations: At time stept, the observationOt is a set thatcomprises of the values of the application parameters and thecurrent resource availability of the hosting node, denoted asOt =< parat, resourcet >.
• State transition probability: The transition matrix character-izes the distribution over the states for CPU, memory, disk, andnetwork usage. This is learned during the training of HMM.
• Emission probability given an hidden state: They are modeledusing per-state multivariate Gaussian distributions.
The HMM is trained offline so that we are able to predict the CPU,memory, disk, and network usage without executing the workflowtask on the server.
5. EXPERIMENTAL EVALUATIONThis section presents results from a number of experiments we
conducted to evaluate our power-aware consolidation algorithm.
5.1 Algorithms Compared, Metrics and GoalsAs a baseline for evaluating our proposed algorithm, we imple-
mented anoptimal approach. In this approach, the best consolida-tion plan is obtained with an exhaustive search, i.e., we try everycombination of placing workloads together and executing them ondifferent servers. The consolidation plan resulting in a minimumpower and less than15% performance degradation is taken as theresult. Furthermore, once the workloads are consolidated, we usework-conservingscheme during the application execution so that re-source requirements of a workflow task are always satisfied, as longas total requirements of consolidated tasks does not exceed availableresources. This consolidation plan thus is obtained and the resultingexecution is referred to asOptimal + Work Conserving.
We also evaluated two versions of our consolidation algorithm. Inthe first version, only the static consolidation was performed. Then,we statically assigned resources among consolidated workloads pro-portional to the mean of their resource requirements. This is de-noted aspSciMapper + Static Allocation. In the sec-ond version, we apply the time varying resource provisioning partof our algorithm. We refer this to aspSciMapper + DynamicProvisioning. Finally, the three versions thus obtained throughconsolidation are compared with the case where each workflow taskon an individual server, without virtualization. This is denoted asWith-out Consolidation.
To evaluate the performance of our approach against the optimaland the case where consolidation is not used, we use the followingtwo metrics:
• Normalized Total Power Consumption: This shows the powerthat has been saved from our power-aware consolidation algo-rithm, as a percentage of the total power that is consumed byWithout Consolidation version.
• Execution Time: It is defined as the makespan of the work-flows.
Using the optimal approach and the above two metrics, we de-signed the experiments with the following goals: 1) Demonstrate thatour power-aware consolidation algorithm can reduce total power sig-nificantly without incurring substantial slowdowns. 2) Demonstratethat the overhead of our algorithm is negligible, and the algorithm isscalable to workflows with a large number of tasks. 3) Demonstratethat our proposed resource prediction model is effective in estimat-ing resource usage. Also, models trained on one type of hardwarecan still be effective on another type of hardware.

Application CPU Memory Disk NetworkGLFS High Moderate Moderate LowVR Moderate High Moderate Moderate
SynApp1 Low Low High HighSynApp2 Moderate High Moderate LowSynApp3 High Moderate Low Low
Table 2: Resource Usage of Scientific Workflows
5.2 Experimental Setup and ApplicationsOur experiments are conducted using 2 Linux clusters, each of
which consists of 64 computing nodes. One cluster has dual Opteron250 (2.4GHz) processors with 8 MB L2 cache and 8 GB main mem-ory, while the other has Intel Xeon CPU E5345 (2.33 GHz) nodes,comprising two quad-core CPUs, with 8 MB L2 cache and 6 GBmain memory. Computing nodes are interconnected with switched 1Gb/s Ethernet within each cluster. We chose Xen as the virtualiza-tion technology and we used Xen-enabled 3.0 SMP Linux kernel ina stock Fedora 5 distribution. On a single consolidated server, hard-ware resources are shared between the virtual machines that host ap-plication service tasks and the management domain (dom0 in Xenterminology). Throughout our experiments, we restrict the manage-ment domain to use one physical core, thus isolating it and avoidingperformance interference. The virtual machines hosting applicationservices share the remaining physical cores. The placement of VMsare decided at the start of application execution. In order to facilitatehosting the scientific workflows, the VMs are created and customizedfor each application.
The experiments we report were conducted using two real applica-tions and three synthetic workflows. Two real applications areGLFSandVolume Rendering. The first of these applications was de-scribed earlier in Section 2.Volume Rendering interactivelycreates a 2D projection of a large time-varying 3D data set (volumedata) [19]. The workflow we implemented reads 7.5 GB of imagedata, stores the spatial and temporal information in a tree structure,and then renders the final image using composed unit images.VR isconsidered as a memory-intensive application as it consumes morethan 1GB of physical memory for76% of its execution time. Inorder to cover a wide range of scientific workflows with different re-source requirements and scales, we also evaluated our consolidationalgorithm using three synthetic scientific workflows. These syntheticscientific workflows are from a set of benchmark scientific applica-tions developed by Bharathiet al. [9]. GLFS andVR are executed onour clusters (with Xen virtual machines), whereas simulations wereused for the synthetic applications. We used GridSim [42] as the gridenvironment simulator and its extension, CloudSim [14], to simulatea virtualized environment. Table 2 shows the relative resource us-age of the two real workflows and three synthetic workflows, withrespect to CPU, memory, disk I/O, and network I/O.
Since we did not have physical access to these clusters to be ableto attach the power meter, we usedpower modelingfor estimat-ing power consumption. Particularly, we apply a full-system powermodel based on high-level system utilization metrics [20]. We val-idated this power model by actual measurements on the PC in ourresearch lab, and found it to be very accurate. Furthermore, as wereport only normalized power comparison for all of our experiments,limitations of the power model have a negligible impact on our re-sults.
5.3 Performance ComparisonWe now evaluate our proposed power-aware consolidation algo-
rithm against the optimal approach and the case without consolida-tion, with respect to two metrics, i.e., normalized total power con-sumption and execution time.Normalized Total Power Consumption Comparison: We now eval-
uate our power-aware consolidation algorithm and demonstrate thatthe total power has been reduced significantly from the case no con-solidation is applied. Moreover, we also show that power reductionsare close to, or in some cases even better than, the optimal (but static)approach, as time varying resource provisioning is enabled throughour approach.
First, we executed theGLFS workflow with four different combi-nations of application parameters, which are referred to asAppConf-1, AppConf-2, AppConf-3, andAppConf-4. For each of the param-eter configurations, the workflow is invoked 5 times and the av-erage is reported as the result. The normalized total power con-sumption, which is the ratio of consumed total power over that fromthe Without Consolidation version, is shown in Figure 10(a). We can make the following observations from these results.First, the total power is reduced up to27% by the Optimal +Work Conserving version. The CPU-bound characteristics ofGLFS limit the consolidation that can be performed without signif-icant performance degradation. In comparison, ourpSciMapper+ Static Allocation only performs4% worse. Although thenumber of servers on which theGLFS workflow has been consoli-dated is the same as what is obtained from the optimal approach, thetasks that are merged into a cluster might not always be the optimal,due to the our distance metric definition.
Next, we considerpSciMapper + Dynamic Provisioning,where time varying resource provisioning heuristic is enabled. Weare able to save up to35% of the total consumed power, which is8% better than the optimal (static) approach. This is consistent withour power analysis in Section 3.1, i.e., dynamically allocating CPUand memory to the consolidated tasks at runtime can help reduce thepower, as compared to work conserving, particularly when the vari-ance in resource requirement is large.
We repeated this experiment with theVR workflow and the threesynthetic scientific workflows. The results are presented in Figures 10(b) and (c), respectively. We executedVR with four different pa-rameter configurations. As we can see, we are able to reduce58%of the total power consumption in all cases, by applying the op-timal consolidation approach. pSciMapper achieves52% savings,and when time varying resource provisioning is enabled, pSciMap-per performs only2% worse than the optimal approach. Similarobservations can be made from the three synthetic workflows. Inthe optimal case, more than70% power is saved fromSynApp1due to its large number of tasks with low CPU and memory usage.AsSynApp1’s tasks have relatively constant resource requirements,dynamic resource provisioning does not help improve performance.pSciMapper, however, is still able to save66% of the power. Theother two synthetic workflows perform better withpSciMapper+ Dynamic Provisioning when comparing to the optimal ap-proach, and we are able to reduce the total power consumption by59% and44%, respectively.Execution Time Comparison: Next, we compare the performanceof pSciMapper with the other versions with respect of the workflowexecution time. We first conducted the experiments using theGLFSworkflow. Recall that we set performance degradation constraint tobe 15%, i.e., consolidation stops when the estimated performanceis still within 15% of theWithout Consolidation case. Asillustrated in Figure 11 (a), the execution time from theOptimal+ Work Conserving case is within15% of the case where eachtask of the workflow is mapped onto a single server.pSciMapper+ Static Allocation also leads to performance that is closeto the optimal case. This demonstrates the effectiveness of the tem-poral feature extraction and KCCA model in mapping resource us-age to power and execution time. With time varying resource provi-sioning, pSciMapper leads to3% better performance than the opti-mal case, and thus, the performance is within12% of theWithoutConsolidation case. The experiment was repeated with theVRworkflow and the other three synthetic workflows. The results are

AppConf−1 AppConf−2 AppConf−3 AppConf−40%
10%
20%
30%
40%
50%
60%
70%
80%
90%
100%N
orm
aliz
ed T
otal
Pow
er C
onsu
mpt
ion
Optimal + Work ConservingpSciMapper + Static AllocationpSciMapper + Dynamic Provisioning
(a)
AppConf−1 AppConf−2 AppConf−3 AppConf−40%
10%
20%
30%
40%
50%
60%
70%
80%
90%
100%
Nor
mal
ized
Tot
al P
ower
Con
sum
ptio
n
Optimal + Work Conserving
pSciMapper + Static Allocation
pSciMapper + Dynamic Provisioning
(b)
SynApp1 SynApp2 SynApp30%
10%
20%
30%
40%
50%
60%
70%
80%
90%
100%
Nor
mal
ized
Tot
al P
ower
Con
sum
ptio
n
Optimal + Work Conserving
pSciMapper + Static Allocation
pSciMapper + Dynamic Provisioning
(c)
Figure 10: Normalized Total Power Consumption Comparison: (a)GLFS (b) VR (c) Synthetic Workflows (Power Consumption ofWithout Consolidation is 100%)
AppConf−1 AppConf−2 AppConf−3 AppConf−40
50
100
150
200
250
Exe
cutio
n T
ime
(Min
)
Without Consolication
Optimal + Work Conserving
pSciMapper + Static Allocation
pSciMapper + Dynamic Provisioning
(a)
AppConf−1 AppConf−2 AppConf−3 AppConf−40
5
10
15
20
25
30
35
40E
xecu
tion
Tim
e (M
in)
Without Consolication
Optimal + Work Conserving
pSciMapper + Static Allocation
pSciMapper + Dynamic Provisioning
(b)
SynApp1 SynApp2 SynApp30
20
40
60
80
100
120
140
Exe
cutio
n T
ime(
Min
)
Without ConsolidationOptimal + Work ConservingpSciMapper + Static AllocationpSciMapper + Dynamic Provisioning
(c)
Figure 11: Execution Time Comparison: (a)GLFS (b) VR (c) Synthetic Workflows
demonstrated in Figure 11 (b) and (c). Similar observations can bemade here. With time-varying resource allocation, pSciMapper re-sults in only a7% degradation.
5.4 Consolidation Overhead and ScalabilityWe now evaluate the execution time of our consolidation algorithm
and compare it to the optimal approach. We usedGLFS and theVRworkflows, which have 16 and 24 tasks, respectively. The results areshown in Figure 12 (a). As shown in the Figure, our algorithm is ableto consolidate 16 and 24 tasks onto 2 emulated grid sites, each with64 nodes, with an algorithm execution time of1.5 and2.2 seconds,respectively. The overhead comes from the Nelder-Mead optimiza-tion algorithm at each level in the hierarchical cluster structure. Incomparison, optimal algorithm involves an exhaustive search, andcompletes the consolidation in10.4 and 26.5 seconds. The over-head of our algorithm is clearly very small, as compared to the actualexecution time of any real scientific workflow. It may appear fromthese results that even the optimal algorithm is an acceptable choicefor scheduling real workflows. However, the execution time of theoptimal search will grow exponentially with respect to the numberof tasks in the workflow and/or the number of servers. Therefore,its overhead will be unacceptable for consolidating large-scale sci-entific workflows, where hundreds or even thousands of tasks can beinvolved.
Furthermore, we evaluate the scalability of pSciMapper in Fig-ure 12 (b). We used synthetic workflows and simulated 640 process-ing nodes for a grid computing environment. The number of tasksfrom the synthetic workflow is varied from 100 to 200, 400, 800,and 1000. We can see that the consolidation overhead only increaseslinearly as the number of workflow tasks increases, and it takes lessthan 1 minute to consolidate 1000 workflow tasks on 640 nodes.
GLFS VR0
5
10
15
20
25
30
Con
solid
atio
n O
verh
ead
(Sec
)
pSciMapper
Optimal
(a)
100 200 400 800 1000 100 200 400 8000
10
20
30
40
50
60
Numbef of Workflow Tasks
Con
solid
atio
n O
verh
ead
(Sec
)
(b)
Figure 12: (a) Consolidation Overhead Comparison ofpSciMapper with Optimal (b)Scalability
5.5 Model EvaluationIn this subsection, we evaluate the HMM-based model, and show
that our model can accurately estimate the CPU, memory, disk andnetwork usage, given the application parameters and the resource ca-pacity of the host server. Furthermore, we show that the model can betrained on one server, and then used on a server with a different typeof hardware effectively. This is an important requirement in cloudcomputing, as a service provider may use different types of hard-ware, with a user not having any control on what is made availableto them.
We use tasks from both theGLFS andVR workflows. The datacontains two sets of vectors. One includes the application parame-ter values and the resource capacity information of the server, whilethe other is the corresponding CPU, memory, disk and network uti-lization data. We performedcross-validationon the training data set
0 50 100 150 200 250 300 350 4000%
10%
20%
30%
40%
50%
60%
70%
80%
90%
100%
Execution Time (Sec)
CP
U U
tiliz
atio
n
Measured CPU UsageEstimated CPU Usage
(a)
0 50 100 150 200 250 300 350 400500
1000
1500
Execution Time (Sec)
Mem
ory
Util
izat
ion
(MB
)
Measured Memory UsageEstimated Memory Usage
(b)
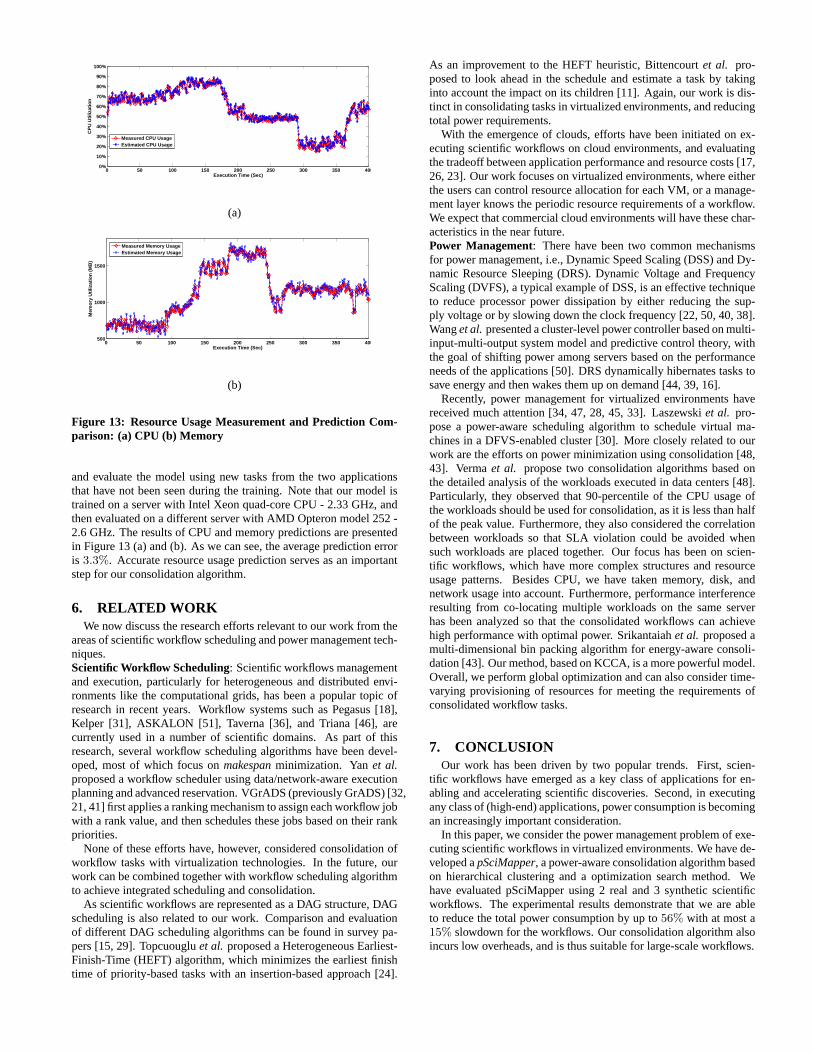
Figure 13: Resource Usage Measurement and Prediction Com-parison: (a) CPU (b) Memory
and evaluate the model using new tasks from the two applicationsthat have not been seen during the training. Note that our model istrained on a server with Intel Xeon quad-core CPU - 2.33 GHz, andthen evaluated on a different server with AMD Opteron model 252 -2.6 GHz. The results of CPU and memory predictions are presentedin Figure 13 (a) and (b). As we can see, the average prediction erroris 3.3%. Accurate resource usage prediction serves as an importantstep for our consolidation algorithm.
6. RELATED WORKWe now discuss the research efforts relevant to our work from the
areas of scientific workflow scheduling and power management tech-niques.Scientific Workflow Scheduling: Scientific workflows managementand execution, particularly for heterogeneous and distributed envi-ronments like the computational grids, has been a popular topic ofresearch in recent years. Workflow systems such as Pegasus [18],Kelper [31], ASKALON [51], Taverna [36], and Triana [46], arecurrently used in a number of scientific domains. As part of thisresearch, several workflow scheduling algorithms have been devel-oped, most of which focus onmakespanminimization. Yanet al.proposed a workflow scheduler using data/network-aware executionplanning and advanced reservation. VGrADS (previously GrADS) [32,21, 41] first applies a ranking mechanism to assign each workflow jobwith a rank value, and then schedules these jobs based on their rankpriorities.
None of these efforts have, however, considered consolidation ofworkflow tasks with virtualization technologies. In the future, ourwork can be combined together with workflow scheduling algorithmto achieve integrated scheduling and consolidation.
As scientific workflows are represented as a DAG structure, DAGscheduling is also related to our work. Comparison and evaluationof different DAG scheduling algorithms can be found in survey pa-pers [15, 29]. Topcuougluet al. proposed a Heterogeneous Earliest-Finish-Time (HEFT) algorithm, which minimizes the earliest finishtime of priority-based tasks with an insertion-based approach [24].
As an improvement to the HEFT heuristic, Bittencourtet al. pro-posed to look ahead in the schedule and estimate a task by takinginto account the impact on its children [11]. Again, our work is dis-tinct in consolidating tasks in virtualized environments, and reducingtotal power requirements.
With the emergence of clouds, efforts have been initiated on ex-ecuting scientific workflows on cloud environments, and evaluatingthe tradeoff between application performance and resource costs [17,26, 23]. Our work focuses on virtualized environments, where eitherthe users can control resource allocation for each VM, or a manage-ment layer knows the periodic resource requirements of a workflow.We expect that commercial cloud environments will have these char-acteristics in the near future.Power Management: There have been two common mechanismsfor power management, i.e., Dynamic Speed Scaling (DSS) and Dy-namic Resource Sleeping (DRS). Dynamic Voltage and FrequencyScaling (DVFS), a typical example of DSS, is an effective techniqueto reduce processor power dissipation by either reducing the sup-ply voltage or by slowing down the clock frequency [22, 50, 40, 38].Wanget al. presented a cluster-level power controller based on multi-input-multi-output system model and predictive control theory, withthe goal of shifting power among servers based on the performanceneeds of the applications [50]. DRS dynamically hibernates tasks tosave energy and then wakes them up on demand [44, 39, 16].
Recently, power management for virtualized environments havereceived much attention [34, 47, 28, 45, 33]. Laszewskiet al. pro-pose a power-aware scheduling algorithm to schedule virtual ma-chines in a DFVS-enabled cluster [30]. More closely related to ourwork are the efforts on power minimization using consolidation [48,43]. Vermaet al. propose two consolidation algorithms based onthe detailed analysis of the workloads executed in data centers [48].Particularly, they observed that 90-percentile of the CPU usage ofthe workloads should be used for consolidation, as it is less than halfof the peak value. Furthermore, they also considered the correlationbetween workloads so that SLA violation could be avoided whensuch workloads are placed together. Our focus has been on scien-tific workflows, which have more complex structures and resourceusage patterns. Besides CPU, we have taken memory, disk, andnetwork usage into account. Furthermore, performance interferenceresulting from co-locating multiple workloads on the same serverhas been analyzed so that the consolidated workflows can achievehigh performance with optimal power. Srikantaiahet al. proposed amulti-dimensional bin packing algorithm for energy-aware consoli-dation [43]. Our method, based on KCCA, is a more powerful model.Overall, we perform global optimization and can also consider time-varying provisioning of resources for meeting the requirements ofconsolidated workflow tasks.
7. CONCLUSIONOur work has been driven by two popular trends. First, scien-
tific workflows have emerged as a key class of applications for en-abling and accelerating scientific discoveries. Second, in executingany class of (high-end) applications, power consumption is becomingan increasingly important consideration.
In this paper, we consider the power management problem of exe-cuting scientific workflows in virtualized environments. We have de-veloped apSciMapper, a power-aware consolidation algorithm basedon hierarchical clustering and a optimization search method. Wehave evaluated pSciMapper using 2 real and 3 synthetic scientificworkflows. The experimental results demonstrate that we are ableto reduce the total power consumption by up to56% with at most a15% slowdown for the workflows. Our consolidation algorithm alsoincurs low overheads, and is thus suitable for large-scale workflows.

8. REFERENCES[1] Montage: An astronomical image engine.
http://montage.ipac.caltech.edu/.[2] Southern california earthquake center, community modeling
environment (cme).http://www.scec.org/cme.[3] Sysstat.
http://pagesperso-orange.fr/sebastien.godard/.[4] Teragrid.http://www.teragrid.org/.[5] Usc epigenome center.http://epigenome.usc.edu.[6] Xen credit-bsed cpu scheduler.http:
//wiki.xensource.com/xenwiki/CreditScheduler.[7] F. R. Bach and M. I. Jordan. Kernel independent component analysis.
Journal of Machine Learning Research, 3, 2003.[8] L.A. Barroso and U. Hölzle. The case for engergy-proportional
computing.IEEE Computer, 14(12), 2007.[9] S. Bharathi, A. Chervenak, E. Deelman, G. Mehta, M.H. Su, and
K. Vahi. Characterization of scientific workflows. InProceedings of the3rd Workshop on Workflows in Support of Large-Scale Science(WORKS08), pages 1–10, Nov. 2008.
[10] R. Bianchini and R. Rajamony. Power and energy management forserver systems.IEEE Computer, 37(11), 2004.
[11] L.F. Bittencourt, R. Sakellariou, and E. Madeira. Dag scheduling usinga lookahead variant of the heterogeneous earliest finish timealgorithm.In Proceedings of the 18th Euromicro International Conference onParallel, Distributed and Network-Based Computing (PDP 2010), Feb.2010.
[12] D.A. Brown, P.R. Brady, A. Dietz, J. Cao, B. Johnson, andJ. McNabb.A case study on the use of workflow technologies for scientificanalysis: Gravitational wave data analysis.Workflows for eScience,2006.
[13] E.S. Buneci and D.A. Reed. Analysis of application heartbeats:Learning structural and temporal features in time series dataforidentification of performance problems. InProceedings of the 22ndInternational Conference on High Performance Computing andNetworking (SC08), pages 1–12, Nov. 2008.
[14] R. Buyya, R. Ranjan, and R.N. Calheiros. Modeling and simulation ofscalable cloud computing environments and the cloudsim toolkit:Challenges and opportunities. InProceedings of the 7th InternationalConference on High Performance Computing & Simulation (HPCS09),June 2009.
[15] L.C. Canon, E. Jeannot, R. Sakellariou, and W. Zheng. Comparativeevaluation of the robustness of dag scheduling heuristics.In CoreGRIDTechnical Report TR-0120, 2007.
[16] J. Chase, D. Anderson, P. Thakar, A. Vahdat, and R. Doyle. Managingenergy and server resources in hosting centers. InProceedings of the18th ACM Symposium on Operating Systems Principles (SOSP01),pages 103–116, Oct. 2001.
[17] E. Deelman, G. Singh, M. Livny, B. Berriman, and J. Good. The costof doing science on the cloud: the montage example. InProceedings ofthe 22nd International Conference on High Performance Computingand Networking (SC08), pages 50–61, Nov. 2008.
[18] E. Deelman, G. Singh, M.H. Su, J. Blythe, Y. Gil, C. Kesselman,G. Mehta, K. Vahi, G.B. Berriman, J. Good, A. Laity, J.C. Jacob, andD.S. Katz. Pegasus: A framework for mapping complex scientificworkflows onto distributed systems.Scientific Programming, 13(3),2005.
[19] R.A Drebin, L.Carpenter, and P.Hanrahan. Volume rendering. InProceedings of the 15th Annual Conference on Computer Graphicsand Interactive Techniques, pages 65–74, 1988.
[20] D. Economou, S. Rivoire, C. Kozyrakis, and P. Ranganathan.Full-system power analysis and modeling for server environments. InProceedings of the Workshop on Modeling Benchmarking andSimulation (MOBS06), June 2006.
[21] F.Berman, H.Casanova, A.Chien, K.Cooper, H.Dail, A.Dasgupta,W.Deng, J. Dongarra, L. Johnsson andK.Kennedy, C.Koelbel,B.Liu,X. Liu, A.Mandal, G.Marin, M.Mazina, J.Mellor-Crummey,C.Mendes, A. Olugbile, M.Patel, D.Reed, Z.Shi, O.Sievert,H.Xia, andA. YarKhan. New grid scheduling and rescheduling methods in thegrads project.International Journal of Parallel Programming, 33(2),2005.
[22] S. Govindan, J. Choi, B. Urgaonkar, A. Sivasubramaniam, andA. Baldini. Statistical profiling-based techniques for effective powerprovisioning in data centers. InProceedings of the 4th ACM Europeanconference on Computer systems (EuroSys09), pages 317–330, April2009.
[23] C. Hoffa, G. Mehta, T. Freeman, E. Deelman, K. Keahey, B. Berriman,and J. Good. On the use of cloud computing for scientific workflows. InProceedings of the 3rd International Workshop on ScientificWorkflowsand Business Workflow Standards in e-Science (SWBES08), Dec. 2008.
[24] H.Topcuoglu, S.Hariri, and M.Y.Wu. Performance-effective andlow-complexity task scheduling for heterogeneous computing. IEEETransactions on Parallel and Distributed Systems, 13, 2002.
[25] S.C. Johnson. Hierarchical clustering schemes.Psychometrika, 32(3),1966.
[26] G. Juve, E. Deelman, K. Vahi, G. Mehta, B. Berriman, B.P. Berman,and P. Maechling. Scientific workflow applications on amazon ec2. InWorkshop on Cloud-based Services and Applications in conjunctionwith 5th IEEE Internation Conference on e-Science (e-Science09),Dec. 2009.
[27] L.H. Koopsman. Sampling, aliasing and discrete-time models.TheSpectral Analysis of Time Series, 1995.
[28] D. Kusic, J.O. Kephart, J.E. Hanson, N. Kandasamy, and G.F. Jiang.Power and performance management of virtualized computingenvironments via lookahead control. InProceedings of the 5thInternational Conference on Autonomic Computing (ICAC08), pages3–12, June 2008.
[29] Y.K. Kwok and I. Ahmad. Static scheduling algorithms for allocatingdirected task graphs to multiprocessors.ACM Computing Surveys,31(4), 1999.
[30] G.V. Laszewski, L.Z. Wang, A. Younge, and X. He. Power-awarescheduling of virtual machines in dvfs-enabled clusters. InProceedingsof the IEEE International Conference on Cluster Computing(Cluster09), pages 1–10, 2009.
[31] B. Ludäscher, I. Altintas, C. Berkley, D. Higgins, E. Jaeger, M. Jones,E.A. Lee, J. Tao, and Y. Zhao. Scientific workflow management andthe kepler system.Concurrency and Computation: Practice &Experience, 18(10), 2006.
[32] A. Mandal, K. Kennedy, C. Koelbel, G. Marin, J. Mellor-Crummey,B. Liu, and L. Johnsson. Scheduling strategies for mapping applicationworkflows onto the grid. InProceedings of the 14th IEEE InternationalSymposium on High Performance Distributed Computing(HPDC05),pages 125–134, June 2005.
[33] R. Nathuji and K. Schwan. Virtualpower: Coordinated powermanagement in virtualized enterprise systems. InProceedings of the21st ACM Symposium on Operating Systems Principles (SOSP07),pages 265–278, Oct. 2007.
[34] R. Nathuji and K. Schwan. Vpm tokens: virtual machine-aware powerbudgeting in datacenters. InProceedings of the 17th IEEEInternational Symposium on High Performance DistributedComputing(HPDC08), pages 119–128, June 2008.
[35] J.A. Nelder and R. Mead. A simplex method for functionminimization.Computer Journal, 1965.
[36] T. Oinn, M. Greenwood, M. Addis, M.N. Alpdemir, J. Ferris,K. Glover, C. Goble, A. Goderis, D. Hull, D. Marvin, P. Li, P. Lord,M.R. Pocock, M. Senger, R. Stevens, A. Wipat, and C. Wroe. Taverna:lessons in creating a workflow environment for the life sciences.Concurrency and Computation: Practice and Experience, 18, 2006.
[37] E. Parzen. On estimation of a probability density function and mode.The Annals of Mathematical Statistics, 3, 1962.
[38] P. Pillai and K.G. Shin. Real-time dynamic voltage scaling forlow-power embedded operating systems. InProceedings of the 18thACM Symposium on Operating Systems Principles (SOSP01), pages89–102, Oct. 2001.
[39] E. Pinheiro, R. Bianchini, and C. Dubnicki. Exploitingredundancy toconserve energy in storage systems.ACM SIGMETRICS PerformanceEvaluation Review, 34(1), 2006.
[40] C. Poellabauer, T. Zhang, S. Pande, and K. Schwan. An efficientfrequency scaling approach for energy-aware embedded real-timesystems. InProceedings of the 18th International Conference onArchitecture of Computing Systems (ARCS05), pages 207–221, March2005.
[41] L. Ramakrishnan, C. Koelbel, Y.S. Kee, R. Wolski, D. Nurmi,D. Gannon, G. Obertelli, A. YarKhan, A. Mandal, T.M. Huang,K. Thyagaraja, and D. Zagorodnov. Vgrads: enabling e-scienceworkflows on grids and clouds with fault tolerance. InProceedings ofthe 23rd International Conference on High Performance Computingand Networking (SC09), pages 1–12, Nov. 2009.
[42] R.Buyya and M.Murshed. Gridsim: A toolkit for the modeling andsimulation of distributed resource management and schedulingfor gridcompu ting.Concurrency and Computation: Practice and Experience,
14, 2002.[43] S. Srikantaiah, A. Kansal, and F. Zhao. Energy. InWorkshop on Power
Aware Computing and Systems (HotPower08), Dec. 2008.[44] M. Steinder, I. Whalley, J.E. Hanson, and J.O. Kephart. Coordinated
management of power usage and runtime performance. InProceedingsof the IEEE/IFIP Network Operations and Management Symposium(NOMS08), pages 387–394, April 2008.
[45] J. Stoess, C. Lang, and F. Bellosa. Energy management forhypervisor-based virtual machines. InProceedings of the 2007USENIX Annual Technical Conference (USENIX07), pages 1–14, June2007.
[46] I. Taylor, M. Shields, I. Wang, and A. Harrison. The triana workflowenvironment: Architecture and applications.Workflows for e-Science,2007.
[47] A. Verma, P. Ahuja, and A. Neogi. pmapper: Power and migration costaware application placement in virtualized systems. InProceedings ofthe 9th ACM/IFIP/USENIX International Conference on Middleware(Middleware08), pages 243–264, Sept. 2008.
[48] A. Verma, G. Dasgupta, T.K. Nayak, P. De, and R. Kothari. Serverworkload analysis for power minimization using consolidation. InProceedings of the 2009 USENIX Annual Technical Conference(USENIX09), June 2009.
[49] F. Wang, Q. Xin, B. Hong, S. Brandt, E. Miller, D. Long, andT. McLarty. File system workload analysis for large scale scientificcomputing applications. InProceedings of the 21st IEEE / 12th NASAGoddard, 2004.
[50] X.R. Wang and M. Chen. Cluster-level feedback power control forperformance optimization. InProceedings of the 14th IEEEInternational Symposium on High-Performance Computer Architecture(HPCA08), pages 101–110, Feb. 2008.
[51] M. Wieczorek, R. Prodan, and T. Fahringer. Scheduling of scientificworkflows in the askalon grid environment.ACM SIGMOD Record,34(3), 2005.
Related Documents