© 2005 IBM Corporation ACM Computing Frontiers 2005 Power and Performance Optimization at the System Level Valentina Salapura IBM T.J. Watson Research Center

Welcome message from author
This document is posted to help you gain knowledge. Please leave a comment to let me know what you think about it! Share it to your friends and learn new things together.
Transcript
© 2005 IBM Corporation
ACM Computing Frontiers 2005
Power and Performance Optimizationat the System Level
Valentina SalapuraIBM T.J. Watson Research Center

© 2005 IBM Corporation2 IBM BlueGene – Power and Performance Optimization at the System LevelValentina Salapura, Computing Frontiers 2005
The BlueGene/L Team

© 2005 IBM Corporation3 IBM BlueGene – Power and Performance Optimization at the System LevelValentina Salapura, Computing Frontiers 2005
The Supercomputer Challenge
More Performance More Power– Systems limited by data center cooling capacity
• New buildings for new supercomputers– FLOPS/W not improving from technology
Traditional supercomputer design hitting power & cost limits
Scaling single core performance degrades power-efficiency
© 2005 IBM Corporation4 IBM BlueGene – Power and Performance Optimization at the System LevelValentina Salapura, Computing Frontiers 2005
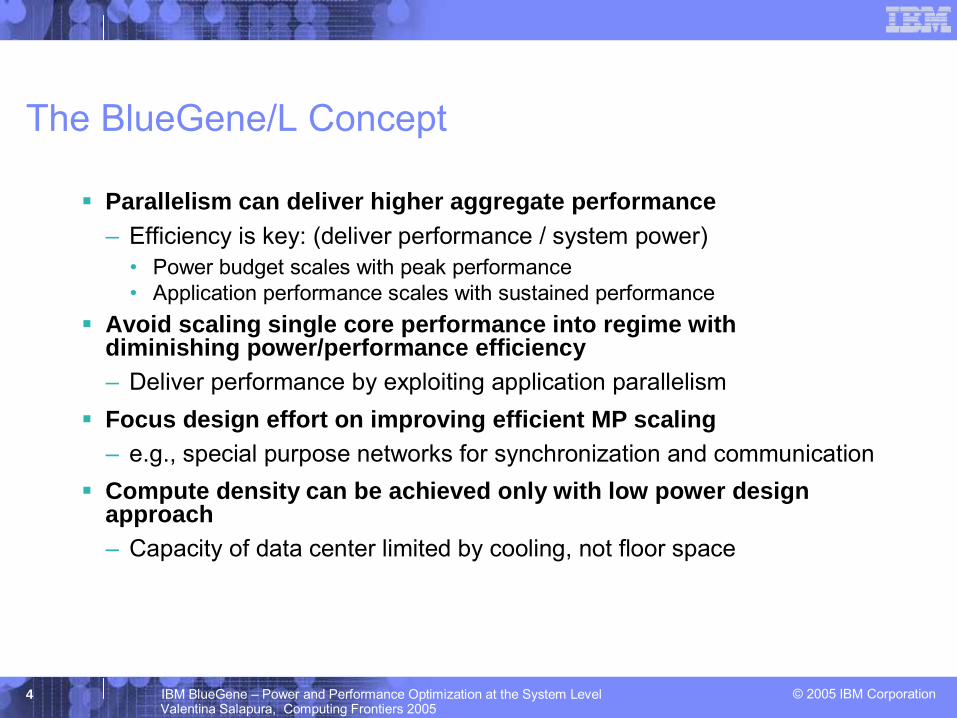
The BlueGene/L Concept
Parallelism can deliver higher aggregate performance– Efficiency is key: (deliver performance / system power)
• Power budget scales with peak performance• Application performance scales with sustained performance
Avoid scaling single core performance into regime with diminishing power/performance efficiency– Deliver performance by exploiting application parallelism Focus design effort on improving efficient MP scaling– e.g., special purpose networks for synchronization and communicationCompute density can be achieved only with low power design approach– Capacity of data center limited by cooling, not floor space

© 2005 IBM Corporation5 IBM BlueGene – Power and Performance Optimization at the System LevelValentina Salapura, Computing Frontiers 2005
BlueGene/L Design Philosophy
Use standard embedded system-on-a-chip (SoC) design methodologyUtilize PowerPC architecture and standard messaging interface (MPI)– Standard programming model– Mature compiler supportFocus on low power– Air cooling – power budget per rack 25 KWImprove cost/performance (total cost/time to solution)– Use & develop only two ASICs: node and link– Leverage industry-standard PowerPC designSingle-chip nodes, less complexity– Enables high density

© 2005 IBM Corporation6 IBM BlueGene – Power and Performance Optimization at the System LevelValentina Salapura, Computing Frontiers 2005
The BlueGene/L System
A 64k-node highly integrated supercomputer360 teraflops peak performanceStrategic partnership with LLNL and high-performance computing centers– Validate and optimize architecture using real applications– LLNL is accustomed to new architectures and
experienced at application tuning to adapt to constraints– Help us investigate the reach of this machineFocuses on numerically intensive scientific problems“Grand challenge” science projects

© 2005 IBM Corporation7 IBM BlueGene – Power and Performance Optimization at the System LevelValentina Salapura, Computing Frontiers 2005
BlueGene/L
Chip(2 processors)
Compute Card(2 chips, 2x1x1)
Node Board(32 chips, 4x4x2)
16 Compute Cards
System(64 cabinets, 64x32x32)
Cabinet(32 Node boards, 8x8x16)
2.8/5.6 GFLOPS4 MB
11.2 GFLOPS0.5 GB DDR
180 GFLOPS8 GB DDR
5.7 TFLOPS256 GB DDR
360 TFLOPS16 TB DDR
per processor/chip

© 2005 IBM Corporation8 IBM BlueGene – Power and Performance Optimization at the System LevelValentina Salapura, Computing Frontiers 2005
System Characteristics
Chip multiprocessor– 2 PowerPC cores per chip
Data parallelism– Double floating point unit for advanced SIMD operations
High integration– 2 PowerPC cores + EDRAM cache + DDR memory interface +
network interfaces on a single chip
High performance networks – Directly on chip reduce latency– Multiple optimized, task-specific networks
• Synchronization, data exchange, I/O

© 2005 IBM Corporation
ACM Computing Frontiers 2005
BlueGene/L Architecture

© 2005 IBM Corporation10 IBM BlueGene – Power and Performance Optimization at the System LevelValentina Salapura, Computing Frontiers 2005
BlueGene/L Compute SoC ASIC
PLB (4:1)
“Double FPU”
EthernetGbit
JTAGAccess
144 bit wideDDR256MB
JTAGGbitEthernet
440 CPU
440 CPUI/O proc
L2
L2
MultiportedSharedSRAM Buffer
Torus
DDR Control with ECC
SharedL3 directoryfor EDRAM
Includes ECC
4MB EDRAM
L3 CacheorMemory
l
6 out and6 in, each at 1.4 Gbit/s link
256
256
1024+144 ECC256
128
128
32k/32k L1
32k/32k L1
2.7GB/s
22GB/s
11GB/s
“Double FPU”
5.5GB/s
5.5 GB/s
256
snoop
Collective
3 out and3 in, each at 2.8 Gbit/s link
GlobalBarrier
4 global barriers orinterrupts
128
5.6GFpeaknode

© 2005 IBM Corporation11 IBM BlueGene – Power and Performance Optimization at the System LevelValentina Salapura, Computing Frontiers 2005
High performance embedded PowerPC core2.0 DMIPS/MHzBook E ArchitectureSuperscalar: two instructions per cycleOut of order issue, execution, and completion7 stage pipeline 3 Execution pipelines32 32 bit GPRDynamic branch prediction
BHT & BTACCaches
ƒ32KB instruction & 32KB data cache ƒ64-way set associative, 32 byte line
36-bit phisical address128-bit CoreConnect PLB Interface
PowerPC 440 Processor Core Features

© 2005 IBM Corporation12 IBM BlueGene – Power and Performance Optimization at the System LevelValentina Salapura, Computing Frontiers 2005
Double Hummer Floating-Point Unit
Two replicas of a standard single-pipe PowerPC FPU– 2 x 32 64-bit registers
Enhanced ISA, includes instructions– Executed in either pipe– Simultaneously execute the same
operation on both sides – SIMD instructions
– Simultaneously execute two different operations of limited types on different data
Two FP multiply-add operations per cycle– 2.8 GFlops peak

© 2005 IBM Corporation13 IBM BlueGene – Power and Performance Optimization at the System LevelValentina Salapura, Computing Frontiers 2005
L3 Cache Implementation
On-chip 4 MB L3 cache
Use EDRAM
Two-way interleaved
2MB EDRAM per bank, 8-way set-associative, 128-byte lines
ECC protected
32-byte read and write bus per core @ 350MHz
2 x 64-byte EDRAM access @ 175MHz
ReadQueue
WriteQueue
Write Buffer
EDRAM 0
Directory 0
EDRAM 1
Directory 1
Miss Handler
ReadQueue
WriteQueue
ReadQueue
WriteQueue
PU0Interface
PU1Interface
PLB slaveInterface
DDRInterface
PrefetchController

© 2005 IBM Corporation14 IBM BlueGene – Power and Performance Optimization at the System LevelValentina Salapura, Computing Frontiers 2005
Memory Hierarchy
32kB D&I private cache per processorSmall private L2 data prefetch caches– Supports 7 streams/processorOn-chip 4MB L3 cacheAccess to main memory via L3 cacheSRAM for fast exchange of control informationSynchronization via lockbox semaphores
L2 cache LockboxPPC440
L2 cachePPC440
PU0
PU1L3 Cache
SRAM
DDRInterface
TestInterface(JTAG)
256
12864
256 128+16
Latency (cycles)
Memory Type
86Main memory
28/36/40L3 cache11L2 cache3L1 cache
© 2005 IBM Corporation15 IBM BlueGene – Power and Performance Optimization at the System LevelValentina Salapura, Computing Frontiers 2005
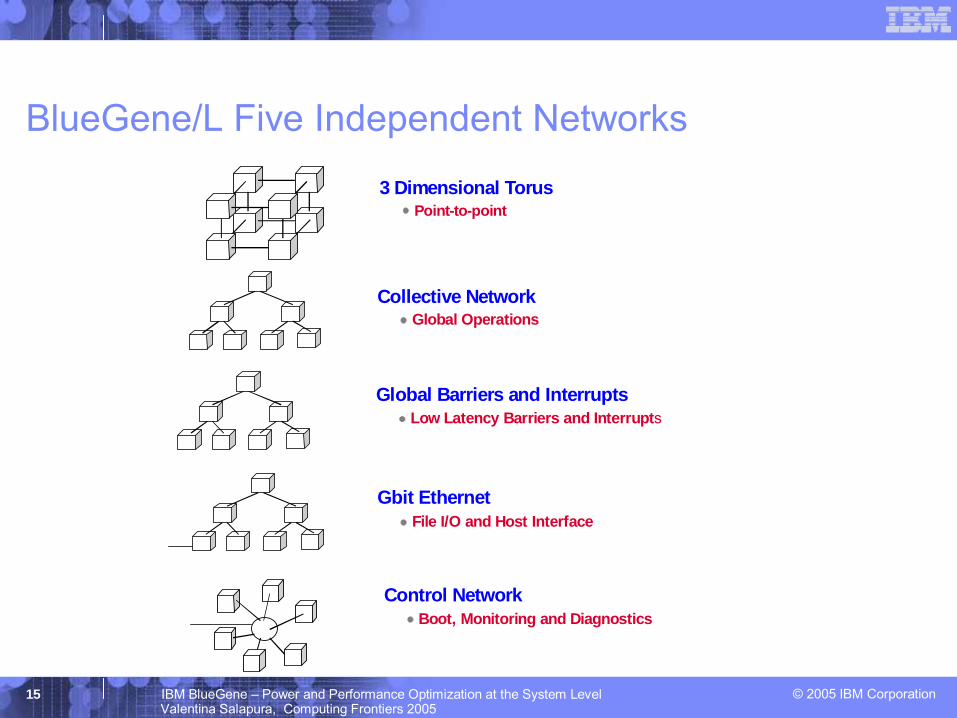
Gbit EthernetFile I/O and Host Interface
3 Dimensional TorusPoint-to-point
Collective Network Global Operations
Global Barriers and Interrupts
Low Latency Barriers and Interrupts
Control Network Boot, Monitoring and Diagnostics
BlueGene/L Five Independent Networks

© 2005 IBM Corporation16 IBM BlueGene – Power and Performance Optimization at the System LevelValentina Salapura, Computing Frontiers 2005
Point-to-point communicationNearest neighbor interconnect
Links 1 bit wide, 6 bidirectional links/chip
Per-link bandwidth 1.4Gb/sPer-node bandwidth 2.1GB/s Cut-through routing without
software interventionAdaptive routingPacket length
32–256 bytes, 4-byte trailerPer-hop latency ~100 ns (avg.)Worst case latency for 64k
machine (64 x 32 x 32) 6.4 µs (64 hops)
Three-Dimensional Torus Network
Torus router

© 2005 IBM Corporation17 IBM BlueGene – Power and Performance Optimization at the System LevelValentina Salapura, Computing Frontiers 2005
Collective Network
Global reduction supportBidirectional 3 links per nodePer node bandwidth 2.1 GB/sWorst case latency (round trip) 5.0µsEfficient for collective communication – For broadcast messages– Arithmetic reductions
implemented in hardwareFault-tolerant for tree topologiesConnect every node to I/O node for file system
NodecardNodecardNodecard
Nodecard
Nodecard
Nodecard
Nodecard
Nodecard
NodecardNodecard
Nodecard
X+X- Y+Y- Z+Z-
LINK-CHIPS (SERIAL REPEATER)
MIDPLANE
Redundant connections Connections participating in tree

© 2005 IBM Corporation18 IBM BlueGene – Power and Performance Optimization at the System LevelValentina Salapura, Computing Frontiers 2005
BlueGene/L Chip Design Characteristics
IBM Cu-11 0.13µ CMOSASIC process technology 11 x 11 mm die size 95M transistors1.5/2.5V12.9WCBGA package, 474 pins
Chip Area usage

© 2005 IBM Corporation19 IBM BlueGene – Power and Performance Optimization at the System LevelValentina Salapura, Computing Frontiers 2005
BlueGene/L Compute Chip Power and Area
CPU/FPU/L1
L2/L3/DDR control
Torus network
Collective network
Others
Clock tree + accessLeakage
Power
CPU/FPU/L1
L2/L3/DDR control
Torus network
Collective network
Others
Clock tree + access
Area

© 2005 IBM Corporation
ACM Computing Frontiers 2005
BlueGene/L System Package

© 2005 IBM Corporation21 IBM BlueGene – Power and Performance Optimization at the System LevelValentina Salapura, Computing Frontiers 2005
Dual Node Compute Card
9 x 512 Mb DRAM
Heatsinks designed for 15W
206 mm (8.125”) wide, 54mm high (2.125”), 14 layers, single sided, ground referenced
Metral 4000 high speed differential connector (180 pins)

© 2005 IBM Corporation22 IBM BlueGene – Power and Performance Optimization at the System LevelValentina Salapura, Computing Frontiers 2005
dc-dc converters
IO Gb Ethernet connectors through tailstock Latching and retention
Midplane (450 pins) torus, collective, barrier, clock, Ethernet service port
16 compute cards
2 optional IO cards
Ethernet-JTAG FPGA
3232-- Way (4x4x2) Node BoardWay (4x4x2) Node Board

© 2005 IBM Corporation23 IBM BlueGene – Power and Performance Optimization at the System LevelValentina Salapura, Computing Frontiers 2005
BlueGene/L Rack
512 – way (8 x 8 x 8) “midplane” (half-cabinet)
16 node boards
All wiring up to this level (>90%) card-level Two midplanes interconnected
with data cables
X
Y
Z
© 2005 IBM Corporation24 IBM BlueGene – Power and Performance Optimization at the System LevelValentina Salapura, Computing Frontiers 2005
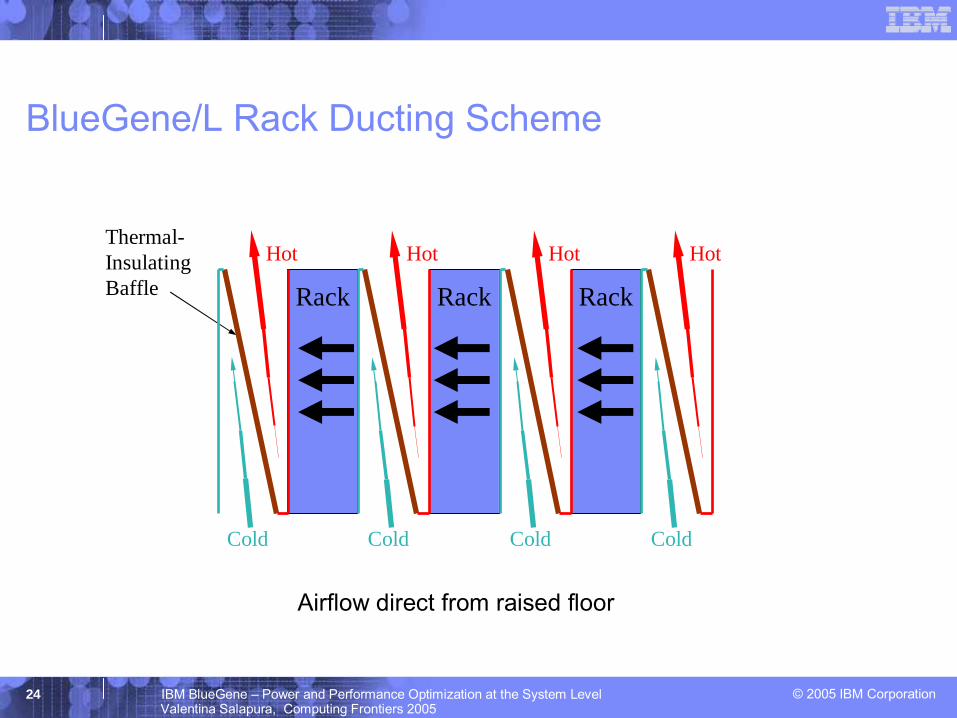
Thermal-InsulatingBaffle RackRack Rack
Hot
Cold
Hot
Cold
Hot
Cold
Hot
Cold
BlueGene/L Rack Ducting Scheme
Airflow direct from raised floor

© 2005 IBM Corporation25 IBM BlueGene – Power and Performance Optimization at the System LevelValentina Salapura, Computing Frontiers 2005
BlueGene/L 16-Rack System at IBM Rochester
16384 + 256 BLC chips. About 400 kW

© 2005 IBM Corporation26 IBM BlueGene – Power and Performance Optimization at the System LevelValentina Salapura, Computing Frontiers 2005
BlueGene/L System

© 2005 IBM Corporation
ACM Computing Frontiers 2005
BlueGene/L System Software

© 2005 IBM Corporation28 IBM BlueGene – Power and Performance Optimization at the System LevelValentina Salapura, Computing Frontiers 2005
BlueGene/L – Familiar Software Environment
Fortran, C, C++ with MPI– Full language support– Automatic SIMD FPU exploitation
Linux development environment– Cross-compilers and other cross-tools execute on
Linux front-end nodes– Users interact with system from front-end nodes
Tools support – debuggers, hardware performance monitors, trace based
visualization
© 2005 IBM Corporation29 IBM BlueGene – Power and Performance Optimization at the System LevelValentina Salapura, Computing Frontiers 2005
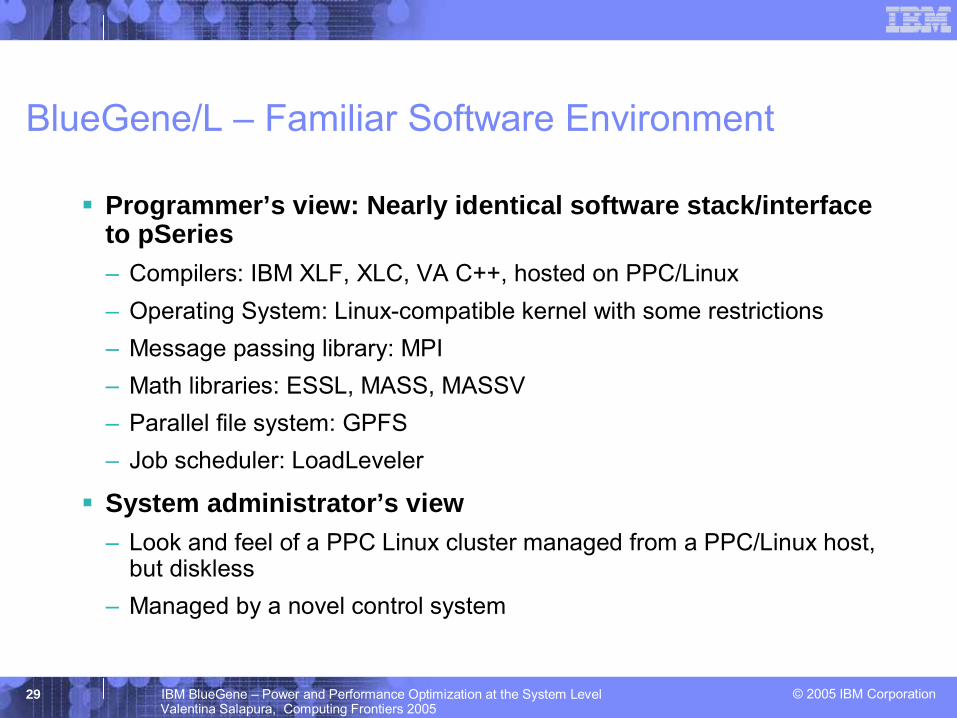
BlueGene/L – Familiar Software Environment
Programmer’s view: Nearly identical software stack/interface to pSeries– Compilers: IBM XLF, XLC, VA C++, hosted on PPC/Linux– Operating System: Linux-compatible kernel with some restrictions – Message passing library: MPI– Math libraries: ESSL, MASS, MASSV– Parallel file system: GPFS– Job scheduler: LoadLeveler
System administrator’s view– Look and feel of a PPC Linux cluster managed from a PPC/Linux host,
but diskless – Managed by a novel control system

© 2005 IBM Corporation30 IBM BlueGene – Power and Performance Optimization at the System LevelValentina Salapura, Computing Frontiers 2005
BlueGene/L System Software Main Characteristics
Logical partitioning (LPAR) of the system for multiple concurrent users– Link chip partitions the system into logically separate systemsStrictly space sharing– One parallel job (user) per partition of machine– One process per processor of compute nodeIntra-chip communication– MPI message passing programming modelModes of operation– Co-processor mode
• Compute processor + communication off-load engine– Virtual node mode
• Symmetric processors

© 2005 IBM Corporation31 IBM BlueGene – Power and Performance Optimization at the System LevelValentina Salapura, Computing Frontiers 2005
BlueGene/L Operating Environment
blrts operating system– Linux compatible minimalist kernel– Single user single program operation
• Minimal operating system interferenceVirtual memory constrained to physical memory size– Implies no demand paging
Torus memory mapped in the user address space– no operating system calls needed for application communication

© 2005 IBM Corporation32 IBM BlueGene – Power and Performance Optimization at the System LevelValentina Salapura, Computing Frontiers 2005
BlueGene/L System Software Architecture
Compute nodes for user applications– Simple Compute Node Kernel– Connected by 3D torus and collective
networkI/O nodes for interaction with the outside world – Run Linux – Provide OS services – file access,
process launch/termination, debugging– Tree network and Gigabit EthernetService nodes for machine monitoring and control – Linux cluster– Custom components for booting,
partitioning, configuration

© 2005 IBM Corporation33 IBM BlueGene – Power and Performance Optimization at the System LevelValentina Salapura, Computing Frontiers 2005
Blue Gene/L System Architecture

© 2005 IBM Corporation34 IBM BlueGene – Power and Performance Optimization at the System LevelValentina Salapura, Computing Frontiers 2005
MPI
MPI 1.1 compatible implementation for message passing between compute nodes– Only the most widely used features of
MPI implementedBased on MPICH2 from ANLPoint-to-point– Utilizes Torus– Implements a BlueGene/L version
ADI3 on top of message layerGlobal operations– Utilizes both torus and collective
networkProcess management– Use BlueGene/L’s control system
rather than MPICH’s process managers
Message passingProcess
management

© 2005 IBM Corporation
ACM Computing Frontiers 2005
BlueGene/L ApplicationPerformance and Power Analysis

© 2005 IBM Corporation36 IBM BlueGene – Power and Performance Optimization at the System LevelValentina Salapura, Computing Frontiers 2005
LINPACK Performance
DD1 hardware @ 500 MHz
#4 on June 2004 TOP500 list
11.68 TFLOP/s on 4K nodes
DD2 hardware @ 700 MHz
#1 on Nov 2004 TOP500 list
70.72 TFLOP/s on 16K nodes
77% of peak0
10000
20000
30000
40000
50000
60000
70000
80000
1 32 1024 4096 16384
0
20000
40000
60000
80000
100000
120000
140000
1 32 1024 4096 16384
Number of nodes
GFL
OPS
© 2005 IBM Corporation37 IBM BlueGene – Power and Performance Optimization at the System LevelValentina Salapura, Computing Frontiers 2005
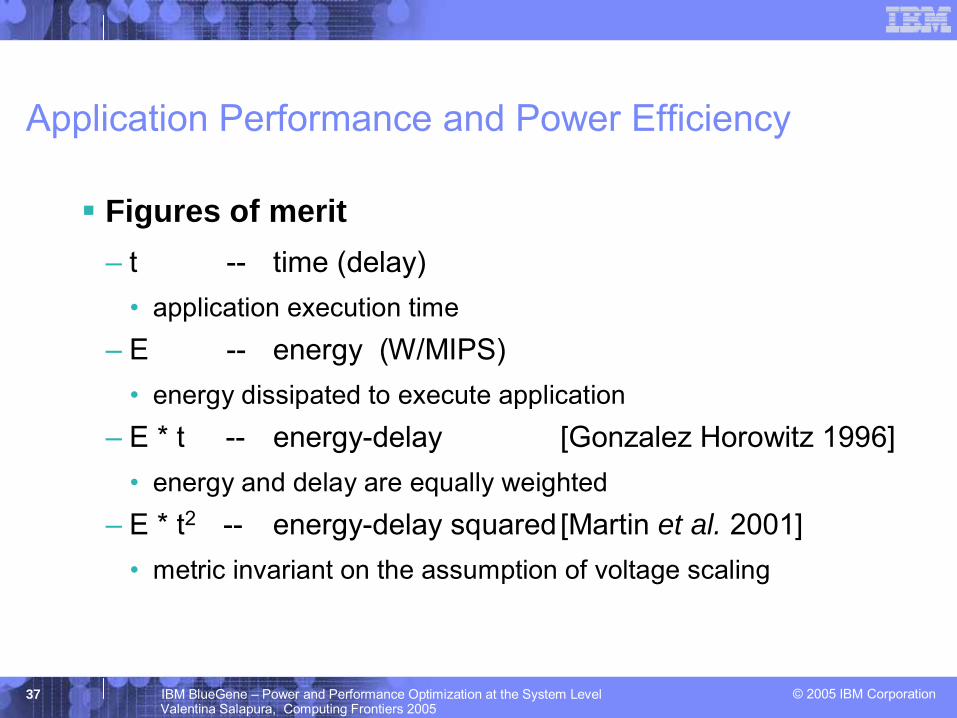
Application Performance and Power Efficiency
Figures of merit– t -- time (delay)
• application execution time– E -- energy (W/MIPS)
• energy dissipated to execute application – E * t -- energy-delay [Gonzalez Horowitz 1996]
• energy and delay are equally weighted– E * t2 -- energy-delay squared[Martin et al. 2001]
• metric invariant on the assumption of voltage scaling

© 2005 IBM Corporation38 IBM BlueGene – Power and Performance Optimization at the System LevelValentina Salapura, Computing Frontiers 2005
Low Power - High Performance System Concept
0
0.2
0.4
0.6
0.8
1
1.2
0 100 200 300 400 500 600
nodes
norm
aliz
edEE * tE * t²

© 2005 IBM Corporation39 IBM BlueGene – Power and Performance Optimization at the System LevelValentina Salapura, Computing Frontiers 2005
Low Power - High Performance System Concept (log-log)
0.000001
0.00001
0.0001
0.001
0.01
0.1
1
1 10 100 1000
nodes
norm
aliz
ed
EE * tE * t²

© 2005 IBM Corporation40 IBM BlueGene – Power and Performance Optimization at the System LevelValentina Salapura, Computing Frontiers 2005
Low Power - High Performance System Concept (log-log)
0.000001
0.00001
0.0001
0.001
0.01
0.1
1
1 10 100 1000
nodes
norm
aliz
ed
EE * tE * t²
E*t2 invariant to voltage scaling

© 2005 IBM Corporation41 IBM BlueGene – Power and Performance Optimization at the System LevelValentina Salapura, Computing Frontiers 2005
Applying Metrics to Actual Applications
LINPACK highly parallel – follows 77% of peak performance – Problem size matches the size of the system– Weak scalingMany applications require constant amount of computation regardless of the size of the system– Fixed sized problems– Strong scaling– More conservative performance evaluationApply metrics for several applications and problems– e.g., NAMD, UMT2K

© 2005 IBM Corporation42 IBM BlueGene – Power and Performance Optimization at the System LevelValentina Salapura, Computing Frontiers 2005
NAMD
Parallel, object-oriented molecular dynamics code designed for high-performance simulation of large biomolecular systems– Developed by the Theoretical Biophysics Group in the
Beckman Institute for Advanced Science and Technology at the University of Illinois at Urbana-Champaign
Distributed free of charge with source code– Based on Charm++ parallel objects
NAMD benchmark– Box with one molecule of apoprotein A1
solvated in waterFixed size problem on 92,224 atoms

© 2005 IBM Corporation43 IBM BlueGene – Power and Performance Optimization at the System LevelValentina Salapura, Computing Frontiers 2005
NAMD Performance Scaling
0
5
10
15
20
25
0 500 1000 1500 2000 2500
nodes
perfo
rman
ce
© 2005 IBM Corporation44 IBM BlueGene – Power and Performance Optimization at the System LevelValentina Salapura, Computing Frontiers 2005
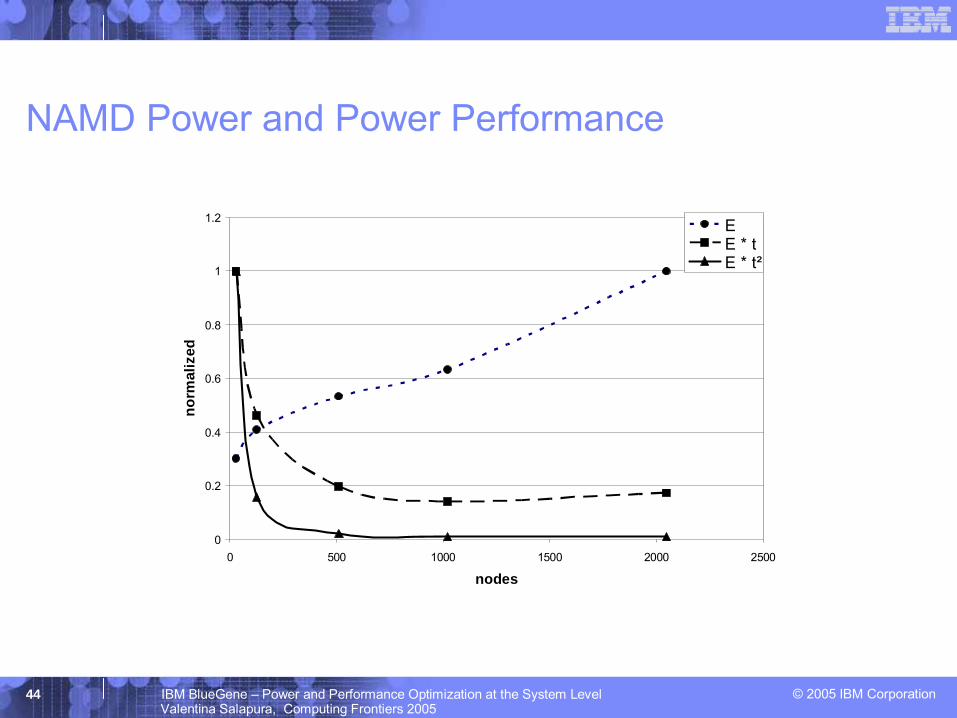
NAMD Power and Power Performance
0
0.2
0.4
0.6
0.8
1
1.2
0 500 1000 1500 2000 2500
nodes
norm
aliz
ed
EE * tE * t²
© 2005 IBM Corporation45 IBM BlueGene – Power and Performance Optimization at the System LevelValentina Salapura, Computing Frontiers 2005
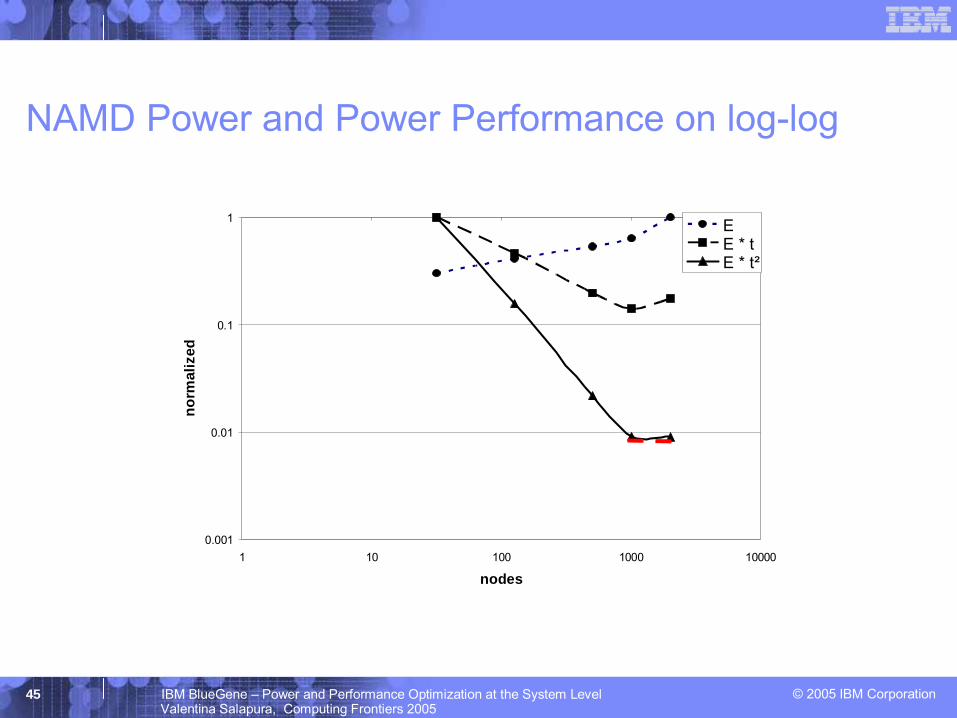
NAMD Power and Power Performance on log-log
0.001
0.01
0.1
1
1 10 100 1000 10000
nodes
norm
aliz
ed
EE * tE * t²

© 2005 IBM Corporation46 IBM BlueGene – Power and Performance Optimization at the System LevelValentina Salapura, Computing Frontiers 2005
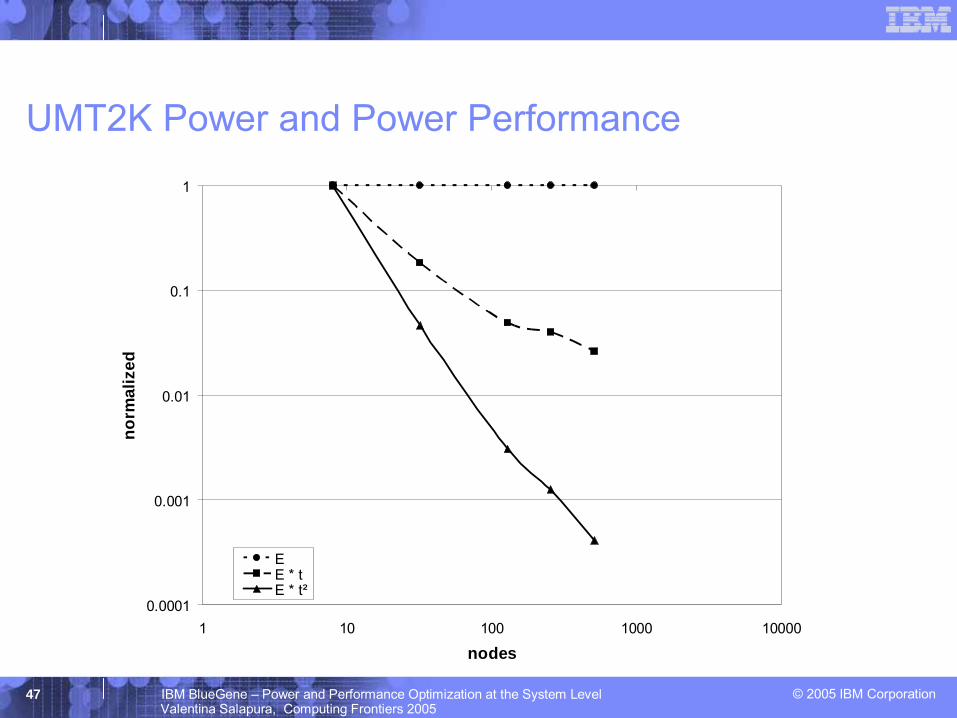
ASCI Purple Benchmarks – UMT2K
UMT2K – Unstructured mesh radiation transportProblem size fixedExcellent scalability up to mid-sized configurations– Load balancing problems
when scaling to 2000 or more nodes
– Needed algorithmic changes in original program
– Tuned UMT2K version scales well beyond 8000 BlueGene/L nodes
0
5
10
15
20
25
30
35
40
Spee
d re
lativ
e to
8 n
odes
8 32 128 256 512Number of nodes
BGL (500 MHz)
© 2005 IBM Corporation47 IBM BlueGene – Power and Performance Optimization at the System LevelValentina Salapura, Computing Frontiers 2005
UMT2K Power and Power Performance
0.0001
0.001
0.01
0.1
1
1 10 100 1000 10000
nodes
norm
aliz
ed
EE * tE * t²

© 2005 IBM Corporation48 IBM BlueGene – Power and Performance Optimization at the System LevelValentina Salapura, Computing Frontiers 2005
Recent UMT2K Runs Demonstrate Good Performance
UMT2K Weak Scaling Results
0
0.5
1
1.5
2
2.5
0 2048 4096 6144 8192 10240 12288 14336 16384Nodes
Coprocessor mode
Nearest neighbor communication consistentLoad balance unchanged from 1K to 8K
time
0.1
1
1000 10000 100000
nodes
norm
aliz
ed
EE * tE * t²

© 2005 IBM Corporation49 IBM BlueGene – Power and Performance Optimization at the System LevelValentina Salapura, Computing Frontiers 2005
HOMME
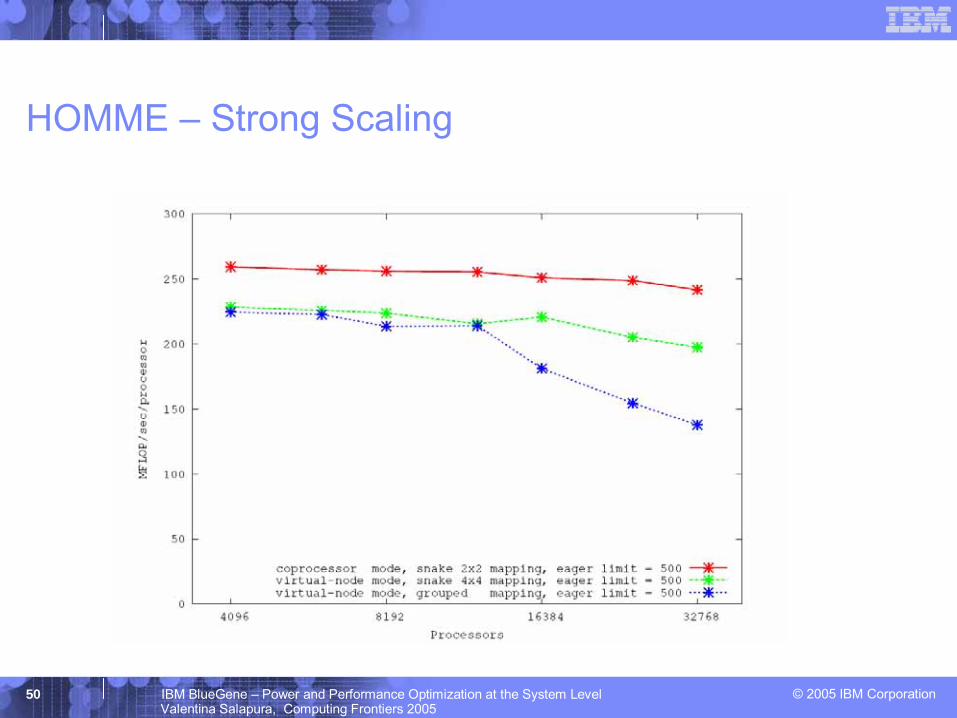
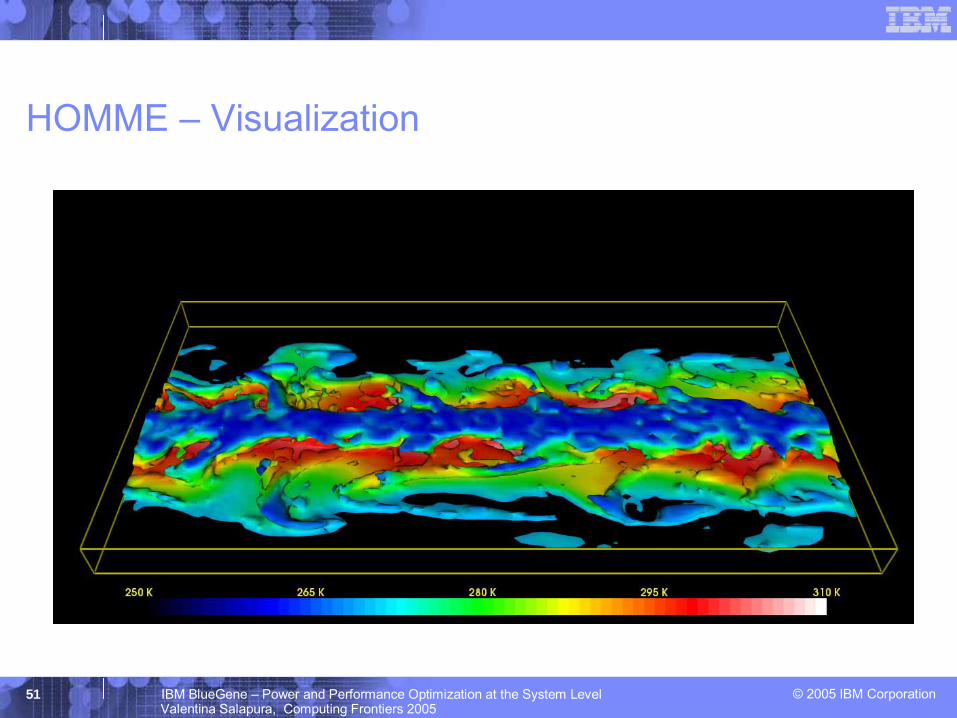
National Center for Atmospheric Research– Cooperation NCAR, Boulder and IBMMoist Held-Suarez test – Atmospheric moist processes fundamental component of atmospheric
dynamics• Most uncertain aspect of climate change research
– Moisture injected into the system at a constant rate from the surfaceImportance of problem– Moist processes must be included for relevant weather model
• Formation of clouds and the development and fallout of precipitation– Requires high horizontal and vertical resolution
• Order of 1 kilometer– Key to a better scientific understanding of global climate change
© 2005 IBM Corporation50 IBM BlueGene – Power and Performance Optimization at the System LevelValentina Salapura, Computing Frontiers 2005
HOMME – Strong Scaling
© 2005 IBM Corporation51 IBM BlueGene – Power and Performance Optimization at the System LevelValentina Salapura, Computing Frontiers 2005
HOMME – Visualization
© 2005 IBM Corporation52 IBM BlueGene – Power and Performance Optimization at the System LevelValentina Salapura, Computing Frontiers 2005
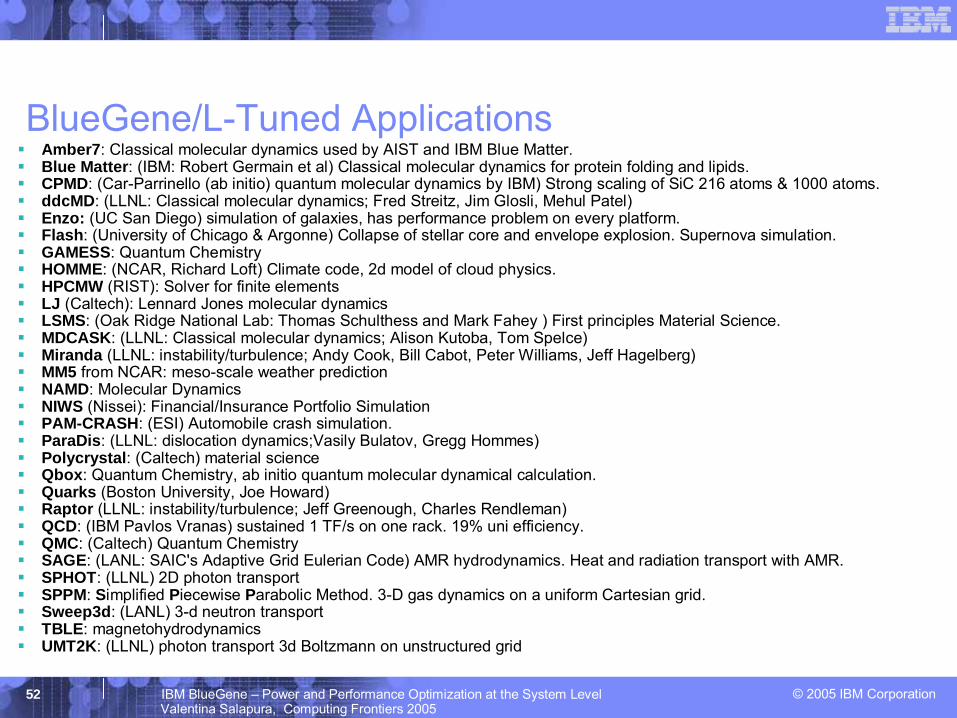
BlueGene/L-Tuned ApplicationsAmber7: Classical molecular dynamics used by AIST and IBM Blue Matter.Blue Matter: (IBM: Robert Germain et al) Classical molecular dynamics for protein folding and lipids. CPMD: (Car-Parrinello (ab initio) quantum molecular dynamics by IBM) Strong scaling of SiC 216 atoms & 1000 atoms.ddcMD: (LLNL: Classical molecular dynamics; Fred Streitz, Jim Glosli, Mehul Patel)Enzo: (UC San Diego) simulation of galaxies, has performance problem on every platform.Flash: (University of Chicago & Argonne) Collapse of stellar core and envelope explosion. Supernova simulation.GAMESS: Quantum ChemistryHOMME: (NCAR, Richard Loft) Climate code, 2d model of cloud physics.HPCMW (RIST): Solver for finite elementsLJ (Caltech): Lennard Jones molecular dynamicsLSMS: (Oak Ridge National Lab: Thomas Schulthess and Mark Fahey ) First principles Material Science.MDCASK: (LLNL: Classical molecular dynamics; Alison Kutoba, Tom Spelce)Miranda (LLNL: instability/turbulence; Andy Cook, Bill Cabot, Peter Williams, Jeff Hagelberg)MM5 from NCAR: meso-scale weather predictionNAMD: Molecular DynamicsNIWS (Nissei): Financial/Insurance Portfolio SimulationPAM-CRASH: (ESI) Automobile crash simulation.ParaDis: (LLNL: dislocation dynamics;Vasily Bulatov, Gregg Hommes)Polycrystal: (Caltech) material scienceQbox: Quantum Chemistry, ab initio quantum molecular dynamical calculation. Quarks (Boston University, Joe Howard)Raptor (LLNL: instability/turbulence; Jeff Greenough, Charles Rendleman)QCD: (IBM Pavlos Vranas) sustained 1 TF/s on one rack. 19% uni efficiency. QMC: (Caltech) Quantum ChemistrySAGE: (LANL: SAIC's Adaptive Grid Eulerian Code) AMR hydrodynamics. Heat and radiation transport with AMR.SPHOT: (LLNL) 2D photon transportSPPM: Simplified Piecewise Parabolic Method. 3-D gas dynamics on a uniform Cartesian grid.Sweep3d: (LANL) 3-d neutron transportTBLE: magnetohydrodynamicsUMT2K: (LLNL) photon transport 3d Boltzmann on unstructured grid

© 2005 IBM Corporation53 IBM BlueGene – Power and Performance Optimization at the System LevelValentina Salapura, Computing Frontiers 2005
BlueGene/L Performance and Density
30047.912Speed/Power(GFlops/kW)
1600131613Speed/Space
(GFlops/m²)
1403.1178.6Memory/Space(GB/m²)
BG/LEarth Simulator
ASCI QASCI White
Metric
4.53Linpack Teraflops
2.86Peak Teraflops (Coprocessor mode)
5.73Peak Teraflops (Virtual Node mode)
Single Rack Blue GenePerformance Metric
© 2005 IBM Corporation54 IBM BlueGene – Power and Performance Optimization at the System LevelValentina Salapura, Computing Frontiers 2005
BlueGene/L - Paradigm Shift for Supercomputers
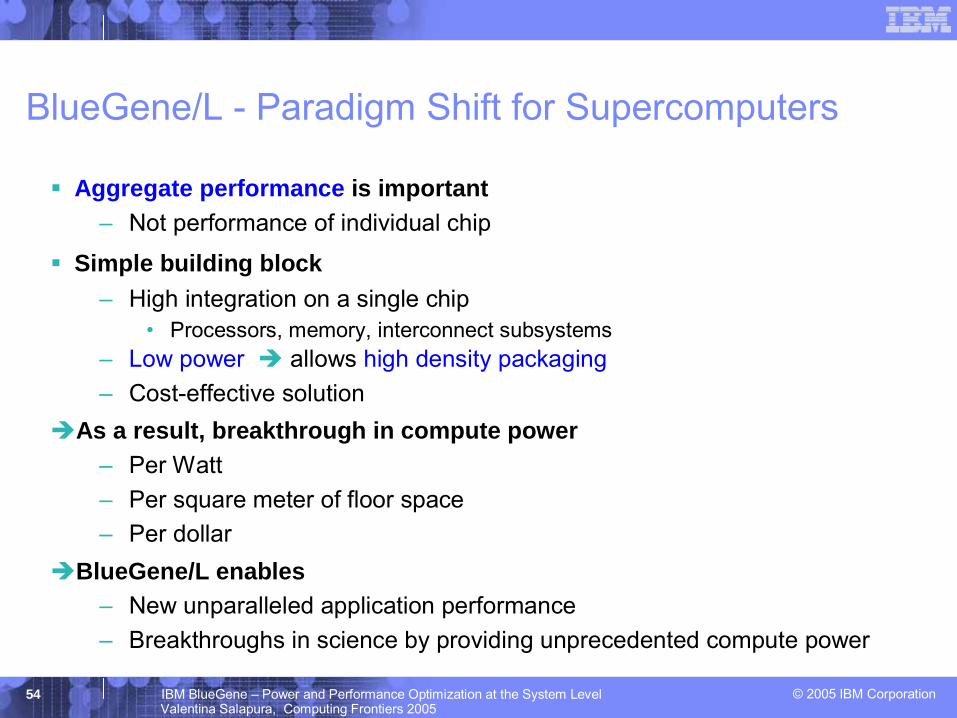
Aggregate performance is important – Not performance of individual chip
Simple building block– High integration on a single chip
• Processors, memory, interconnect subsystems– Low power allows high density packaging– Cost-effective solution
As a result, breakthrough in compute power– Per Watt– Per square meter of floor space– Per dollar
BlueGene/L enables– New unparalleled application performance– Breakthroughs in science by providing unprecedented compute power

© 2005 IBM Corporation55 IBM BlueGene – Power and Performance Optimization at the System LevelValentina Salapura, Computing Frontiers 2005
BlueGene/L on the Web
The Blue Gene/L project has been supported and partially funded by the Lawrence Livermore National Laboratories on behalf of the United States Department of Energy, under Lawrence Livermore National Laboratories Subcontract No. B517552.
© 2005 IBM Corporation56 IBM BlueGene – Power and Performance Optimization at the System LevelValentina Salapura, Computing Frontiers 2005
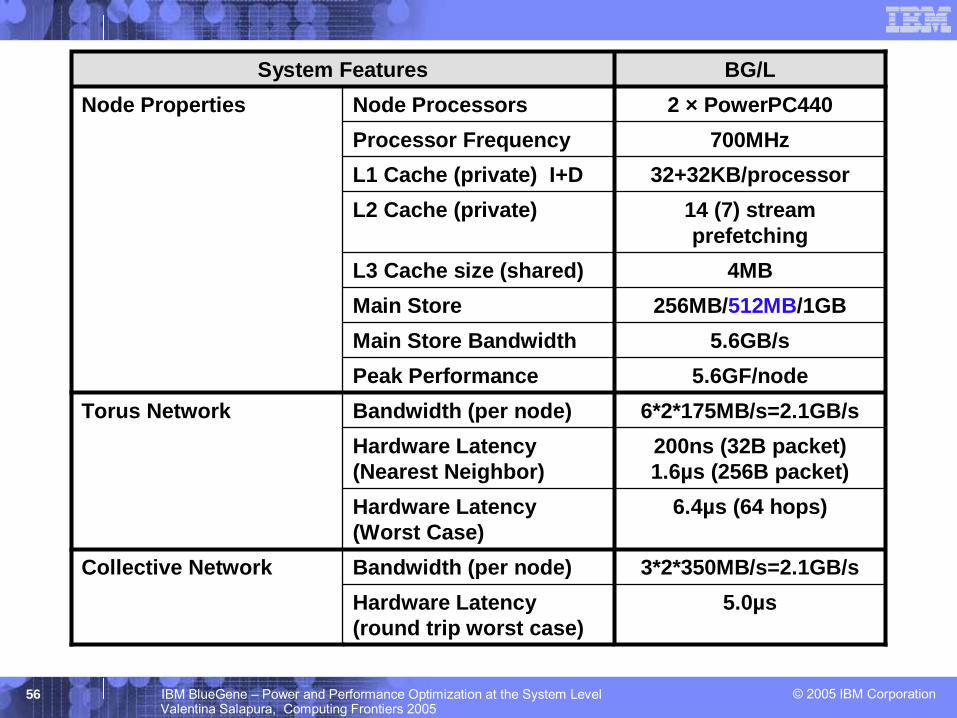
5.6GB/sMain Store Bandwidth
Collective Network
Torus Network
Node PropertiesSystem Features
14 (7) stream prefetching
L2 Cache (private)
4MBL3 Cache size (shared)
32+32KB/processorL1 Cache (private) I+D
5.0µsHardware Latency (round trip worst case)
3*2*350MB/s=2.1GB/sBandwidth (per node)
6.4µs (64 hops)Hardware Latency(Worst Case)
200ns (32B packet)1.6µs (256B packet)
Hardware Latency (Nearest Neighbor)
6*2*175MB/s=2.1GB/sBandwidth (per node)5.6GF/nodePeak Performance
256MB/512MB/1GBMain Store
700MHzProcessor Frequency2 × PowerPC440Node Processors
BG/L

© 2005 IBM Corporation57 IBM BlueGene – Power and Performance Optimization at the System LevelValentina Salapura, Computing Frontiers 2005
BlueGene/L at a Glance
Related Documents