Power Analyzer Package Key Features • Automatic switching device measurements • Color coded overlay to identify power losses • Control loop and time domain response analysis • Line power and harmonics tests to IEC 61000-3-2 • Setup tools reduce sources of measurement error • Total harmonic distortion table shows frequency contribution • B-H Curve shows magnetic device saturation Quickly Measure and Analyze Operating Characteristics of Power Conversion Circuits Critical power switching device mea- surements, control loop modulation analysis, and line power harmonic testing are all simplified with a dedi- cated user interface and automatic measurements. Power Analyzer provides quick and easy setup of voltage and current inputs and makes measurements as simple as the push of a button. Tools are provided to help reduce sources of measurement errors, measurement parameters provide details of single cycle or average value over multiple cycles. Automatic Switching Device Measurements Areas of power device turn-on and turnoff transitions, and conduction are all identified with color-coded waveform overlays. Measurement parameter table automatically calcu- lates each element of device losses and sums their total. Control Loop Response Analysis Modulation analysis capabilities provide insight to understand control loop response to critical events such as a power supply’s soft start perfor- mance or step response to line and load changes. Line Power and Harmonics Testing Line power analysis tools provide insight to power consumption as well as enables quick precompliance testing to EN 61000-3-2. Decisions on power quality are aided with total harmonic distortion and analysis of contributions to distortion. Support on Multiple Oscilloscope Platforms The Power Analyzer Package is avail- able on a wide range of oscilloscope models from 200 MHz to 65 GHz. Automatically and accurately analyze the performance of switched-mode power circuits

Welcome message from author
This document is posted to help you gain knowledge. Please leave a comment to let me know what you think about it! Share it to your friends and learn new things together.
Transcript
Power AnalyzerPackage
Key Features
• Automatic switching device
measurements
• Color coded overlay to identify
power losses
• Control loop and time domain
response analysis
• Line power and harmonics tests
to IEC 61000-3-2
• Setup tools reduce sources of
measurement error
• Total harmonic distortion table
shows frequency contribution
• B-H Curve shows magnetic
device saturation
Quickly Measure and Analyze Operating Characteristics of Power Conversion Circuits Critical power switching device mea-
surements, control loop modulation
analysis, and line power harmonic
testing are all simplified with a dedi-
cated user interface and automatic
measurements. Power Analyzer
provides quick and easy setup of
voltage and current inputs and makes
measurements as simple as the push
of a button. Tools are provided to help
reduce sources of measurement
errors, measurement parameters
provide details of single cycle or
average value over multiple cycles.
Automatic Switching Device Measurements Areas of power device turn-on and
turnoff transitions, and conduction are
all identified with color-coded
waveform overlays. Measurement
parameter table automatically calcu-
lates each element of device losses
and sums their total.
Control Loop Response Analysis Modulation analysis capabilities
provide insight to understand control
loop response to critical events such
as a power supply’s soft start perfor-
mance or step response to line and
load changes.
Line Power and Harmonics Testing Line power analysis tools provide
insight to power consumption as well
as enables quick precompliance
testing to EN 61000-3-2. Decisions
on power quality are aided with total
harmonic distortion and analysis of
contributions to distortion.
Support on Multiple Oscilloscope Platforms
The Power Analyzer Package is avail-
able on a wide range of oscilloscope
models from 200 MHz to 65 GHz.
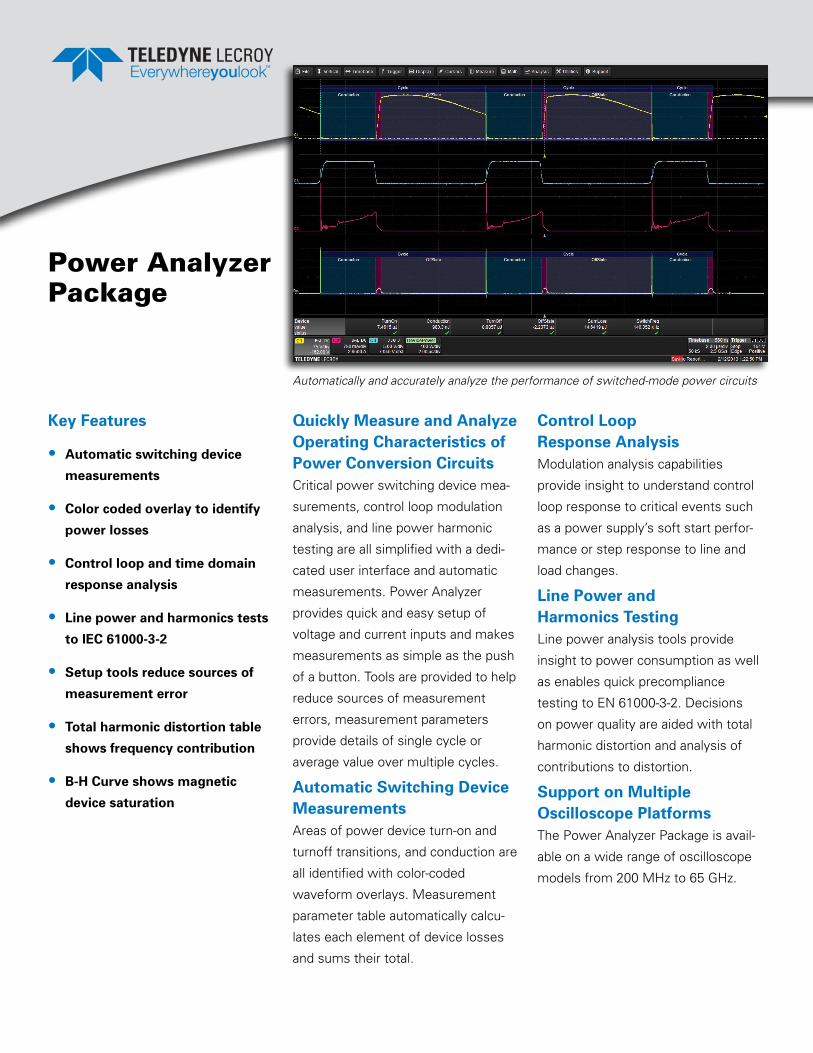
Automatically and accurately analyze the performance of switched-mode power circuits
2
POwER DEvICE AnALySIS
Teledyne LeCroy’s HDO4000 and HDO6000 High Definition Oscilloscopes with 12-bit HD4096 technology are the ideal oscilloscope for power measurement. With 16x more resolution than a traditional 8-bit oscilloscope signal details of the saturation voltage are now clearly visible and conduction losses are more accurate.
Analyze power device performance
while the device is operating in
circuit. Easily make switching loss,
dynamic-on resistance, dv/dt and
di/dt measurements. Quickly view
safe operating area and
B-H hysteresis curves.
Power Device Losses Turn-on, turn-off and conduction
zones are identified with a color-
coded overlay, power losses in these
zones are automatically measured
and displayed. Losses associated
with the switching, conduction, and
off-state are measured independently
and displayed along with the sum of
selected loss types.
Safe Operating Area Gain insight to circuit performance by
seeing SOA plots to look for violations
in the first cycles after an event or
over long time periods. Finding SOA
violations that occur for only a few
cycles after an event, such as short
circuit or startup, can be problematic.
These violations often go undetected,
and degrade the device over time.
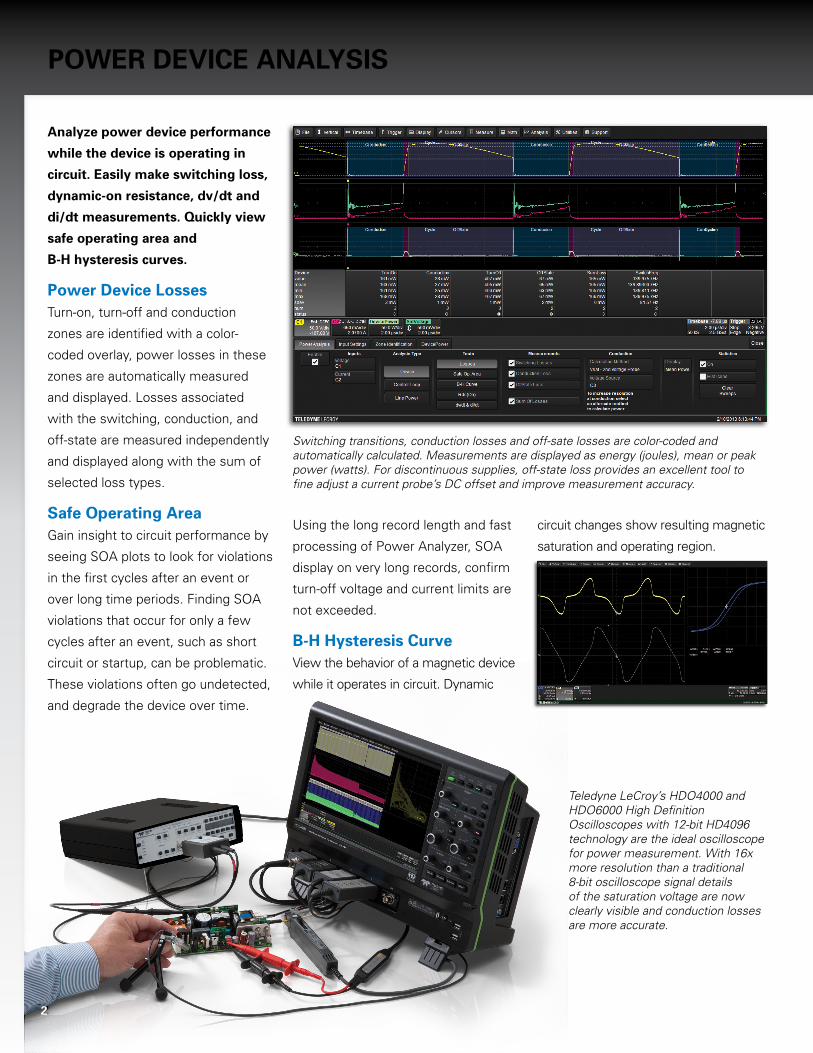
Switching transitions, conduction losses and off-sate losses are color-coded and automatically calculated. Measurements are displayed as energy (joules), mean or peak power (watts). For discontinuous supplies, off-state loss provides an excellent tool to fine adjust a current probe’s DC offset and improve measurement accuracy.
2
Using the long record length and fast
processing of Power Analyzer, SOA
display on very long records, confirm
turn-off voltage and current limits are
not exceeded.
B-H Hysteresis Curve View the behavior of a magnetic device
while it operates in circuit. Dynamic
circuit changes show resulting magnetic
saturation and operating region.
3
MODuLATIOn AnD LInE HARMOnIC AnALySIS
Line Power Analysis Easily measure an off-line power
supply’s incoming RMS line voltage,
RMS current consumption (in watts
and VA), Power Factor, Apparent
Power, Real Power and Crest Factor.
Line current harmonic measurements
are made and compared to standard
templates for EN 61000-3-2 Class
A, B, C, or D equipment. Results
can be displayed graphically to see
mask violations or in a table with
test results. Total harmonic distortion
measurements are provided with
details of which frequencies are
contributing to the distortion.
Control Loop AnalysisView time domain display which
graphically presents the modulated
parameter in a time vs. parameter
value graphical plot. A controller’s
output pulse widths, duty cycles
or frequencies, are individually
plotted and time correlated with the
controller’s output. Integrated with the
oscilloscope’s triggering capabilities,
this analysis is a convenient tool for
intuitively viewing the time domain,
closed-loop response of the entire
control loop, including any time
constants added by the
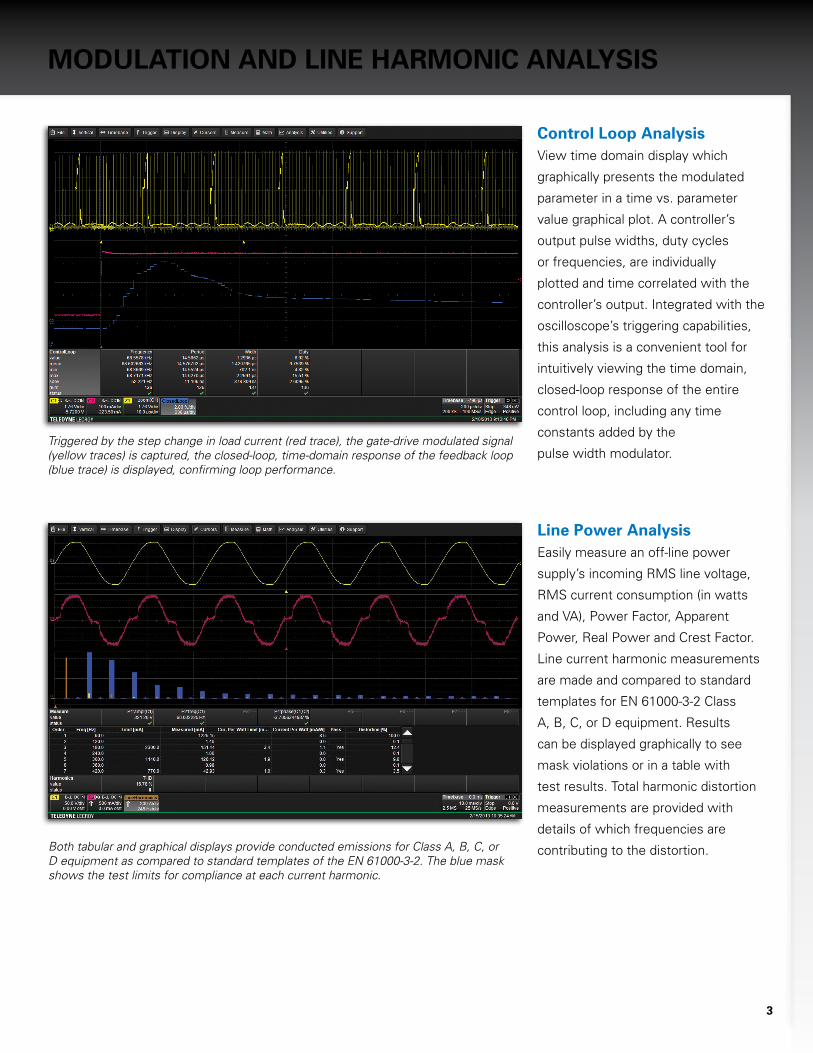
pulse width modulator.Triggered by the step change in load current (red trace), the gate-drive modulated signal (yellow traces) is captured, the closed-loop, time-domain response of the feedback loop (blue trace) is displayed, confirming loop performance.
Both tabular and graphical displays provide conducted emissions for Class A, B, C, or D equipment as compared to standard templates of the EN 61000-3-2. The blue mask shows the test limits for compliance at each current harmonic.
OSCILLOSCOPE PROBES AnD ACCESSORIES
Product Description Product Code
Power Analyzer Software OptionsPower Analyzer Software Option for HDO4000 HDO4K-PWRPower Analyzer Software Option for HDO6000 HDO6K-PWRPower Analyzer Software Option for WaveSurfer Xs WSXs-PWRPower Analyzer Software Option for WaveRunner 6 Zi WR6Zi-PWRPower Analyzer Software Option for WavePro 7 Zi/Zi-A WPZi-PWRPower Analyzer Software Option for WaveMaster 8 Zi-A WM8Zi-PWRPower Analyzer Software Option for LabMaster 9 Zi-A LM9Zi-PWRPower Analyzer Software Option for LabMaster 10 Zi LM10Zi-PWR
Differential Amplifiers and Accessories1 Ch, 100 MHz Differential Amplifier with Precision Voltage Source
DA1855A
2 Ch, 100 MHz Differential Amplifier with Precision Voltage Source
DA1855A-PR2
100 or ÷10 Selectable, 250 MHz Passive Differential Probe Pair
DXC100A*
÷1, 50 MHz Passive Differential Probe Pair DXC200*÷100, 250 MHz 2.5kv, High Voltage Probe Pair (requires DA101 for full performance)
DXC-5100*
÷10, 1 MΩ External Passive Attenuator (recommended with DXC5100)
DA101*
2 Ch, DA1855A with Rackmount DA1855A-PR2-RM
* For use with DA1855A Differential Amplifiers.
Current Probes30 A; 100 MHz Current Probe – AC/DC; 30 Arms; 50 Apeak Pulse CP03130 A; 50 MHz Current Probe – AC/DC; 30 Arms; 50 Apeak Pulse CP030150 A; 10 MHz Current Probe – AC/DC; 150 Arms; 500 Apeak Pulse CP150500 A; 2 MHz Current Probe – AC/DC; 500 Arms; 700 Apeak Pulse CP50030 A; 50 MHz Current Probe – AC/DC; 30 Arms; 50 Apeak Pulse AP015Deskew Calibration Source (for CP030, CP031, AP015) DCS015
High voltage Differential Probes1,400 V, 100 MHz Differential Probe ADP3051,400 V, 20 MHz Differential Probe ADP300700 V, 15 MHz Differential Probe (÷10, ÷100) AP031
Product Description Product Code
High Frequency Differential Probes200 MHz, 3.5 pF, 1 MΩ Active Differential Probe ±20 V differential mode range, ±60 V common mode range
ZD200
500 MHz, 1.0 pF, 1 MΩ Active Differential Probe ±8 V (16 Vp-p) differential mode range, ±10 V common mode range
ZD500
1 GHz, 1.0 pF, 1 MΩ Active Differential Probe ±8 V (16 Vp-p) differential mode range, ±10 V common mode range
ZD1000
1.5 GHz, 1.0 pF, 1 MΩ Active Differential Probe ±8 V (16 Vp-p) differential mode range, ±10 V common mode range
ZD1500
High voltage Passive Probes÷1000; 100 MHz; 50 MΩ High-Voltage Probe 20 kV (40 kV Peak) max. Voltage DC and Peak AC
PPE20KV
÷100; 400 MHz; 50 MΩ High-Voltage Probe 2 kV max. Voltage DC and Peak AC
PPE2KV
÷100; 400 MHz; 50 MΩ High-Voltage Probe 4 kV max. Voltage DC and Peak AC
PPE4KV
÷100; 400 MHz; 50 MΩ High-Voltage Probe 5 kV max. Voltage DC and Peak AC
PPE5KV
÷1000; 400 MHz; 50 MΩ High-Voltage Probe 6 kV max. Voltage DC and Peak AC
PPE6KV
÷10/÷100; 200/300 MHz; 5 MΩ/50 MΩ High-Voltage Probe 600 V/1.2 kV max. Voltage DC and Peak AC
PPE1.2KV
Transmission Line Probes7.5 GHz Low Capacitance Passive Probe (÷10, 1 kΩ; ÷20, 500 Ω)
PP066
© 2013 Teledyne LeCroy. All rights reserved. Specifications, prices, availability, and delivery subject to change without notice. Product or brand names are trademarks or requested trademarks of their respective holders.
power-analyzer-ds-15feb13
Local sales offices are located throughout the world. visit our website to find the most convenient location.
1-800-5-LeCroy teledynelecroy.com
Customer Service Teledyne LeCroy oscilloscopes and probes are designed, built, and tested to ensure high reliability. In the unlikely event you experience difficulties, our digital oscilloscopes are fully warranted for three years and our probes are warranted for one year. This warranty includes: • No charge for return shipping • Long-term 7-year support• Upgrade to latest software at no charge
Ordering Information
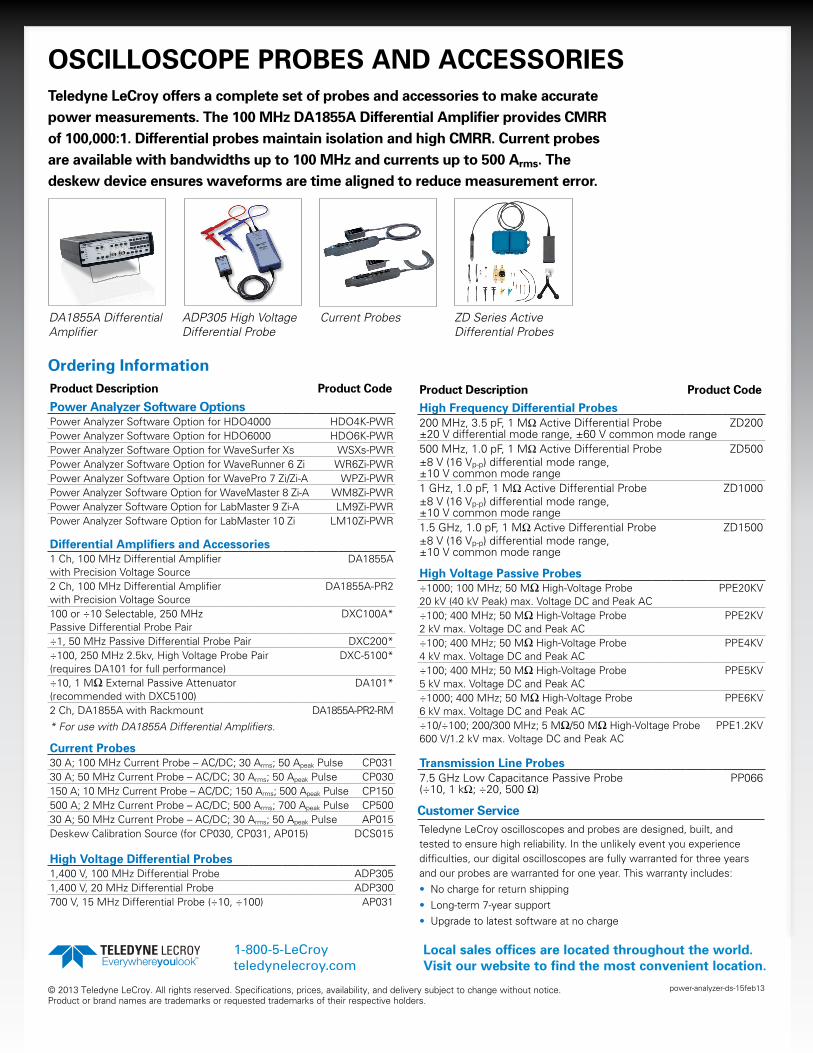
Teledyne LeCroy offers a complete set of probes and accessories to make accurate power measurements. The 100 MHz DA1855A Differential Amplifier provides CMRR of 100,000:1. Differential probes maintain isolation and high CMRR. Current probes are available with bandwidths up to 100 MHz and currents up to 500 Arms. The deskew device ensures waveforms are time aligned to reduce measurement error.
ADP305 High Voltage Differential Probe
ZD Series Active Differential Probes
DA1855A Differential Amplifier
Current Probes
Related Documents