CAPS Methods Core 1 SGregorich ……………………………………………………. Power Analysis for Logistic Regression Models Fit to Clustered Data: Choosing the Right Rho ……………………………………………………. CAPS Methods Core Seminar Steve Gregorich May 16, 2014

Welcome message from author
This document is posted to help you gain knowledge. Please leave a comment to let me know what you think about it! Share it to your friends and learn new things together.
Transcript

CAPS Methods Core 1 SGregorich
…………………………………………………….
Power Analysis for Logistic Regression Models
Fit to Clustered Data: Choosing the Right Rho
…………………………………………………….
CAPS Methods Core Seminar
Steve Gregorich
May 16, 2014

CAPS Methods Core 2 SGregorich
Abstract
Context
Power analyses for logistic regression models fit to clustered data
Approach
. estimate effective sample size (Neff: cluster-adjusted total sample sizes)
. input Neff into standard power analysis routines for independent obs.
Wrinkle
. in the context of logistic regression there are two general approaches
to estimating the intra-cluster correlation of Y:
. phi-type coefficient and
. tetrachoric-type coefficient.
Resolution
. The phi-type coefficient should be used when calculating Neff
I will present background on this topic as well as some simulation results

CAPS Methods Core 3 SGregorich
Simple random sampling (SRS)
. Fully random selection of participants
e.g., start with a list, select N units at random
. Some key features wrt statistical inference:
representativeness
all units have equal probability of selection
all sampled units can be considered to be independent of one another
. SRS with replacement versus without replacement

CAPS Methods Core 4 SGregorich
Clustered sampling
. Rnd sample of m clusters; rnd sample of n units w/in each cluster
multi-stage area sampling
patients within clinics
. Repeated measures
Random sample of m respondents; n repeated measures are taken
repeated measures are clustered within respondents
. Typically, elements within the same cluster are more similar to each other than
elements from different clusters
. The n units w/in a cluster usually do not contain the same amount of
info wrt some parameter, θ, as the same number of units in an SRS sample
…the concept of effective sample size, Neff…
Therefore, it is usually true that ( ) ( )2 2
clus srsˆ ˆσ θ σ θ≠

CAPS Methods Core 5 SGregorich
Two-stage clustered sampling design
Unless otherwise noted, I assume
. Clustered sampling of m clusters, each with n units:
N = m×n
. Normally distributed unit-standardized x, binary y
exchangeable / compound symmetric correlation structure
y
ρ >0: intra-cluster correlation of y (outcome) response
x
ρ = 0 or 1: intra-cluster correlation of x (explanatory var) response
. Regression of y onto x via
. a mixed logistic model with random cluster intercepts or
. a GEE logistic model
. Common effects of x across clusters, i.e., no random slopes for x
. Common between- and within-cluster effects of x

CAPS Methods Core 6 SGregorich
The design effect, deff
. deff can be thought of as a design-attributable multiplicative change in variation
that results from choice of a clustered sampling versus an SRS design
����� =���� ���
����� ��� and ����� = ������ , where
( )2
clusˆσ θ is the estimated parameter variation given a clustered sampling design;
( )2
srsˆσ θ is the estimated parameter variation given a SRS design;
N is the common size of the SRS and clustered (N=m×n) samples;
effN̂ estimated effective size of the clustered sample wrt information about θ̂ ,
relative to what would have been obtained with a SRS of size N
Assumes compound symmetric covariance structure of the response

CAPS Methods Core 7 SGregorich
The misspecification effect, meff
Conceptually similar to deff except that the multiplicative change corresponds to
the effect of correctly modeling the clustering of observations versus
ignoring the cluster structure
����� = ���� ���
���� ��� and ����� = ������ , where
( )2
clusˆσ θ is the estimated parameter variation given clustered responses;
���� ! "#� is the estimated parameter variation ignoring clustering of responses;
N is the total size of the clustered sample;
effN̂ is the effective size of the clustered sample wrt information about θ̂ ,
relative to what would have been obtained with a SRS of the same size
Assumes compound symmetric covariance structure of the response

CAPS Methods Core 8 SGregorich
deff, meff, and the sample size ratio
A ‘context free’ label for deff and meff is the sample size ratio, SSR
eff
SSR=ˆ
N
N
. deff, meff, and SSR have equivalent meaning wrt power analysis,
but deff and meff are conceptually distinct
. deff assumes that you are considering SRS versus clustered sampling
. meff assumes that you have chosen a clustered sampling design and
want to make adjustments to an analysis that assumed SRS
. I will use meff for this talk
CAPS Methods Core 9 SGregorich
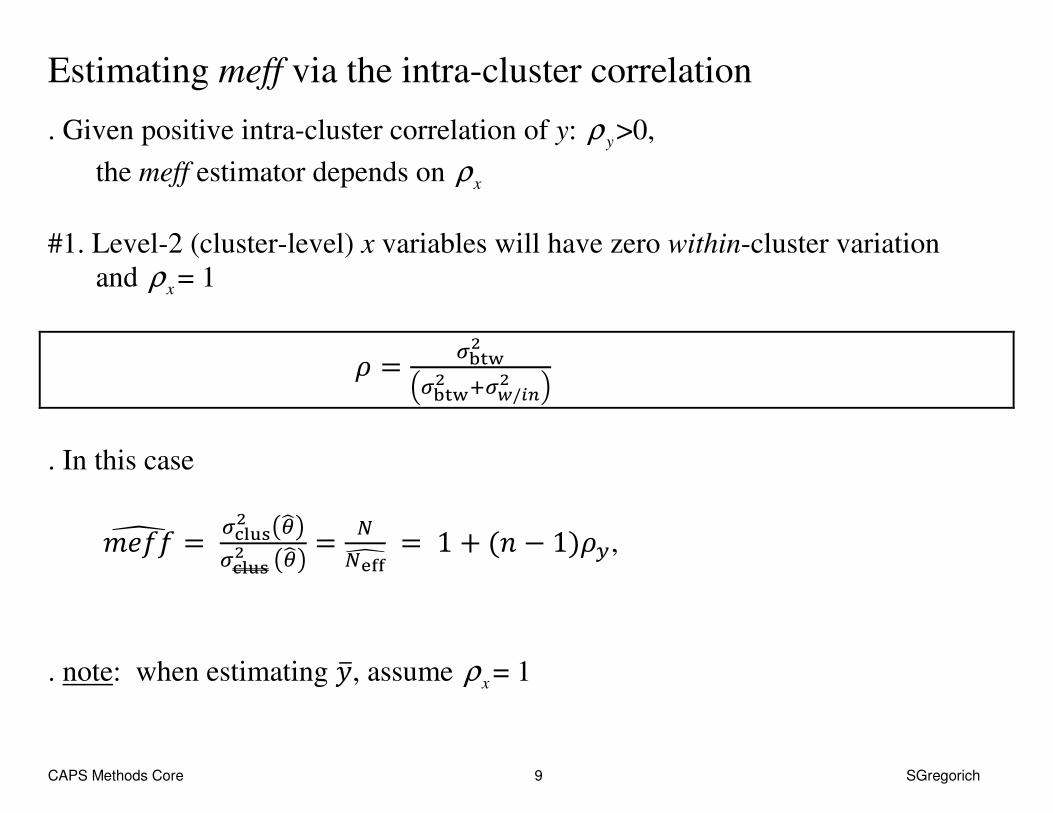
Estimating meff via the intra-cluster correlation
. Given positive intra-cluster correlation of y: y
ρ >0,
the meff estimator depends on x
ρ
#1. Level-2 (cluster-level) x variables will have zero within-cluster variation
and x
ρ = 1
$ = �%&'�
(�%&'� )�*/,-� .
. In this case
����� = ���� ���
���� ��� =�
�/00� = 1 + (4 − 1)$7,
. note: when estimating 89, assume
xρ = 1

CAPS Methods Core 10 SGregorich
Estimating meff via the intra-cluster correlation
#2. Consider a level-1 stochastic x variable with positive within-cluster variation
and zero between-cluster variation: x
ρ = 0:
$ = �%&'�
(�%&'� )�*/,-� .
. In this case
����� = ���� ���
���� ��� =�
�/00� ≈ 1 − $7(; (;<=)⁄ )
note: 4 (4 − 1)⁄ → 1 as 4 → ∞
(for Level-1 x variables with 0 <
xρ < 1 see my March 2010 CAPS Methods Core talk)
CAPS Methods Core 11 SGregorich
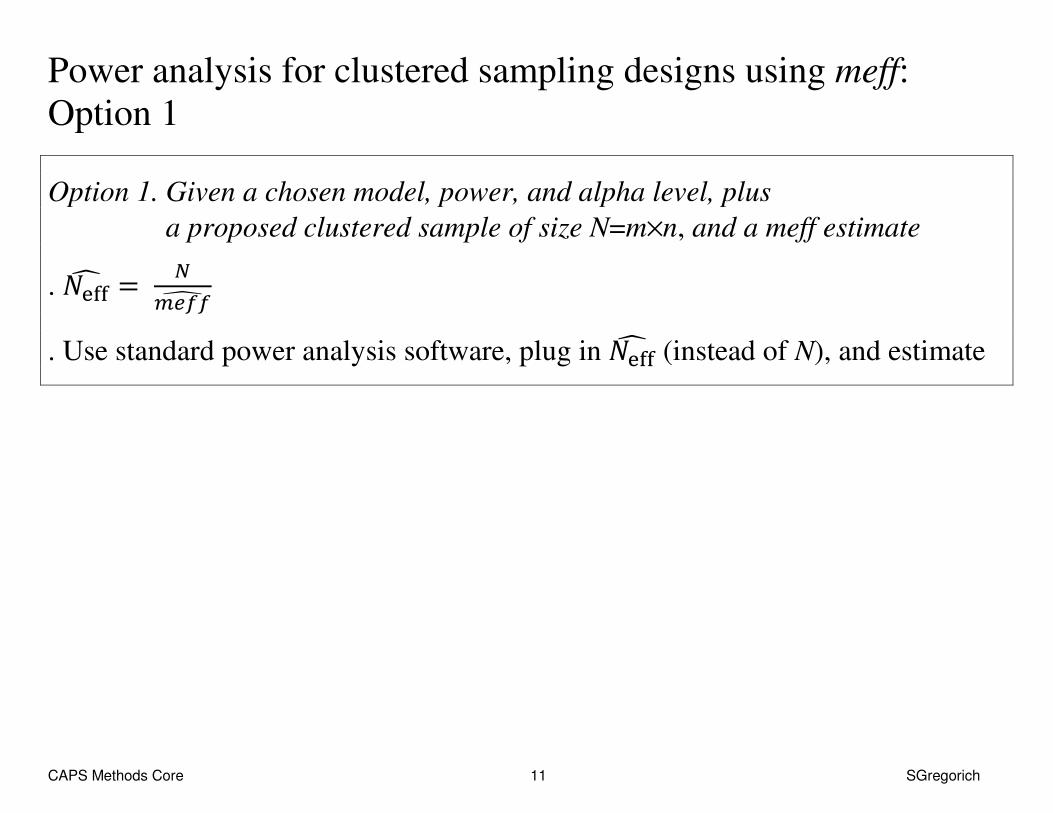
Power analysis for clustered sampling designs using meff:
Option 1
Option 1. Given a chosen model, power, and alpha level, plus
a proposed clustered sample of size N=m×n, and a meff estimate
. ����� = ������
. Use standard power analysis software, plug in ����� (instead of N), and estimate

CAPS Methods Core 12 SGregorich
Power analysis for clustered sampling designs using meff:
Option 1 Example
Estimate Power by Simulation
. Simulate data from a CRT with 100 clusters (j) and 30 individuals/cluster (i)
8AB = groupBH. + JB + �AB K
where, VAR(uj) = VAR(eij) = 1,
VAR(uj) + VAR(eij) = 2, and
ρy = �L! (�L! + ��!)⁄ = 0.50
. Linear mixed model results from analysis of 2000 replicate samples
. ρy = 0.501
. residual std dev = ≈ √N 1.416
. O#PQR�S = H. TUK . simulated power for group effect: 67.7%
all relatively
unbiased
needed later for PASS

CAPS Methods Core 13 SGregorich
Power analysis for clustered sampling designs using meff:
Option 1 Example
. Simulation result: power = 67.7%
. Use PASS Linear Regression routine to solve for power
. ����� = 1 + (30 − 1)×H. KHX= 15.529
. ����� = 100 × 30 ÷ 15.529 ≈ 193
.specify 193 as N in PASS
. specify H1 slope = 0.495
. specify Residual Std Dev = (resid. @ level-1 plus level-2) 1.416
. PASS result: power = 67.6%
Summary
. choose meff estimator and estimate meff
. estimate Neff
. plug Neff into power analysis software (w/ other parameters)
. estimate power

CAPS Methods Core 14 SGregorich
Power analysis for clustered sampling designs using meff: Option 1 Example

CAPS Methods Core 15 SGregorich
Power analysis for clustered sampling designs using meff: Option 1 Example
PASS: power = 67.6%
Simulation: power = 67.7%

CAPS Methods Core 16 SGregorich
Power analysis for clustered sampling designs using meff:
Option 2 example
Option 2. Given a clustered sample design, chosen model, power, and
alpha level, plus an effect size estimate and a meff estimate
. Use standard power analysis software to estimate required sample size
assuming independent observations, i.e., Neff. Then estimate N
. �� = ����� �����
Option 2: Step 1
Start with…
. the group effect (b= ), 0.495
. a residual standard deviation of , 1.416
. and power equal to 67.6%,
. Use PASS to estimate the required effective sample size, ����� = 193

CAPS Methods Core 17 SGregorich
Power analysis for clustered sampling designs using meff: Option 2 example
Result: ����� = 193

CAPS Methods Core 18 SGregorich
Power analysis for clustered sampling designs using meff:
Option 2 example
Option 2: Step 2
. Given ����� = 193, clusters of size n=30, and ρy = 0.501,
adjust ����� = 193 to obtain the required needed sample size
. for a CRT, x
ρ = 1 and ����� = 1+ (4 − 1)$7
. �� = 193 × ^1 + (30 − 1)×0.501_ ≈ 3000
. Given clusters of size n=30, ��=3000 suggests that
100 clusters need to be sampled and randomized (i.e., 3000 ÷ 30)
This example used the linear mixed models framework.
Now onto the models for clustered data with binary outcomes.

CAPS Methods Core 19 SGregorich
Logistic Regression Models Fit to Clustered Data
misspecification effects
. Consider a logistic model fit to 2-level clustered data
. e.g., primary care clinics, patients within clinics
. exchangeable correlation
. Assume the GEE or GLMM (not the survey sampling) modeling framework
. With binary outcomes, there is more than one type of ρy estimate
. a phi-type estimate
. a tetrachoric-type estimate
. note that for linear models, there is no corresponding distinction
. Which estimate of ρy should be used when estimating meff ?
. Answer: the phi-type coefficient, whether modeling via GEE or GLMM
. Investigate via Monte Carlo simulation.

CAPS Methods Core 20 SGregorich
Simulated data: Mixed Logistic Model
. m=100 clusters, each with n=50 units: N = m×n = 5000 per replicate sample
. Generate binary y values with exchangeable correlation structure
via a mixed logistic model with random intercepts,
8AB∗ = 0.5 + 0.1a1AB + 0.5a2B + JB + �AB; if y* > 0 then y = 1, else y = 0
where
. JB~�(0, d! 3⁄ ); the level-2 residuals; between-cluster variation
. �AB~efghijhk(0, d! 3⁄ ); the level-1 residuals; within-cluster variation
. ρy = 0.5 and l̂n�n.7 = 0.54
. a1AB~�(0,1); a stochastic level-1 x variable with ρx=0; meffx1 ≈≈≈≈ 1-ρρρρy
. a2B ~�(0,1); a stochastic level-2 x variable: ρx=1; meffx2 = 1+(n-1)ρρρρy
. lo=,o! = 0
. 500 replicate samples

CAPS Methods Core 21 SGregorich
Simulation: Logistic Regression Models Fit to Clustered Data
Fit two models to each replicate sample:
GEE logistic and mixed logistic with random intercepts (Laplace)
. Save parameter and standard error estimates, $p7, simulated power
CAPS Methods Core 22 SGregorich
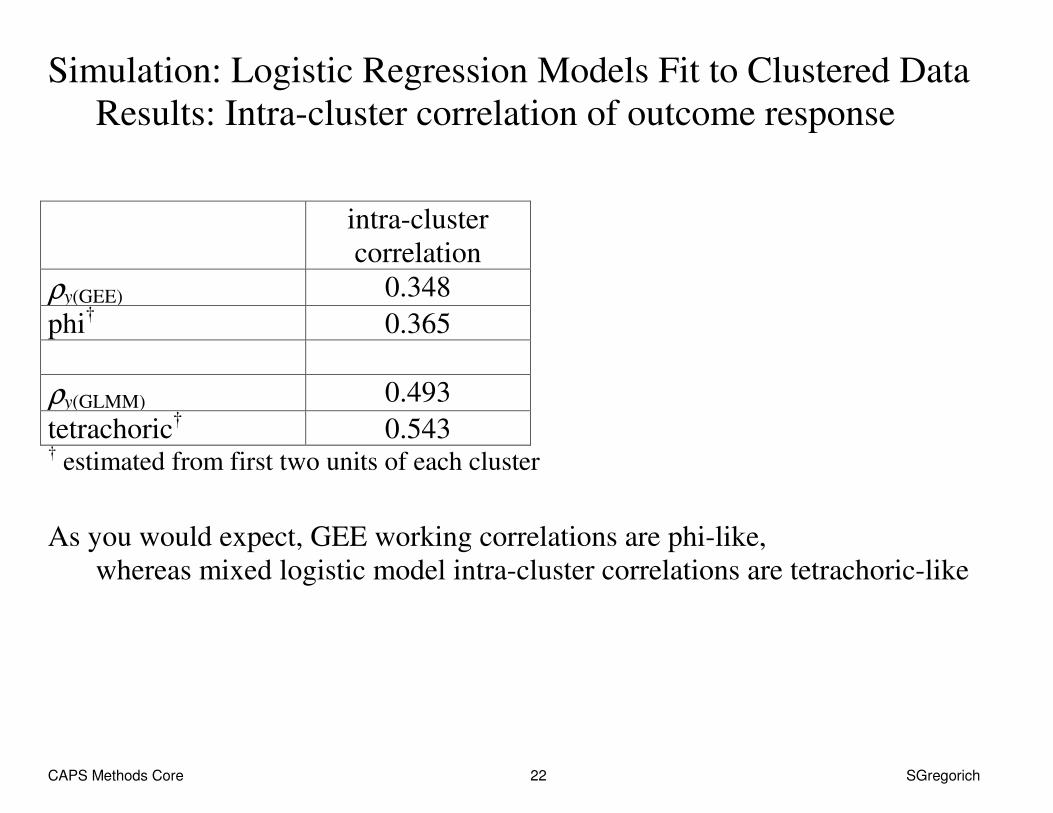
Simulation: Logistic Regression Models Fit to Clustered Data
Results: Intra-cluster correlation of outcome response
intra-cluster
correlation
ρy(GEE) 0.348
phi† 0.365
ρy(GLMM) 0.493
tetrachoric† 0.543
† estimated from first two units of each cluster
As you would expect, GEE working correlations are phi-like,
whereas mixed logistic model intra-cluster correlations are tetrachoric-like

CAPS Methods Core 23 SGregorich
Simulation: Logistic Regression Models Fit to Clustered Data
Results: Parameter and Standard error estimates
GEE GLMM
Intercept
parameter (std dev) 0.330 (.123) 0.509 (.189)
standard error .124 .186
x1
parameter (std dev) 0.064 (.024) 0.099 (.036)
standard error .024 .036
x2
parameter (std dev) 0.327 (.128) 0.501 (.190)
standard error .126 .187
Summary
. GLMM parameter estimates are relatively unbiased (green highlight)
. GEE and GLMM standard error estimates relatively unbiased (yellow highlight)

CAPS Methods Core 24 SGregorich
Simulation: Logistic Regression Models Fit to Clustered Data
Results: GEE Parameter Estimates Relatively Unbiased
GEE GLMM ratio
Intercept
parameter est.
0.330 0.509 .648
x1
parameter est.
0.064 0.099 .651
x2
parameter est. 0.327 0.501 .652
GEE parameter estimates are relatively unbiased
. ρy(GEE) = 0.348
. Scaling factor: 1 - ρy(GEE) = .652 (equal to meffx1(GEE) in this example)
. bGEE ≈ bGLMM × (1 - ρy(GEE))
The same scaling factor applies to standard error estimates
Neuhaus and Jewel (1990); Neuhaus, Kalbfleisch, and Hauck (1991); Neuhaus 1992 report #21, Eq. 14

CAPS Methods Core 25 SGregorich
Using PASS to estimate power (compare to simulated power)
. For the GEE and GLMM results, calculate
a. Pr(yij=1 | x1 = x2 = 0) (intercept)
b. Pr(yij=1 | x1 = 1)
c. meffo= ≈ 1 − $7 (because $o=0 and n is large)
d. Pr(yij=1 | x2 = 1)
e. meffo! = 1 + (4 − 1)$7 (because $o=1)
.I estimated meffx1 and meffx2 using both ρy(GEE) and ρy(GLMM)
. To solve for power for logistic regression, PASS requests
. specification of alpha: 0.05, two-tailed
. sample size: 5000 ÷ meffx1 or 5000 ÷ meffx2, as appropriate
. baseline probability: a
. alternative probability: b or d, as appropriate
. distribution of x: unit-standardized normal
PASS: estimate power for int., x1, x2, using both GEE- and GLMM-based meffs

CAPS Methods Core 26 SGregorich
Simulation: Logistic Regression Models Fit to Clustered Data
Results: Power
GEE
ρy(GEE) = 0.348
GLMM
ρy(GLMM) = 0.493
Intercept
power: simulated [PASS] .742 [.760] .762 [.942]
meff = 1+(n-1)ρy (Neff) 0.652 (277) 0.507 (199)
x1
power: simulated [PASS] .788 [.787] .778 [.997]
meff ≈ 1-ρy (Neff) 18.032 (7,664) 25.172 (9,868)
x2
power: simulated [PASS] .726 [.734] .756 [.942]
meff = 1+(n-1)ρy (Neff) 0.652 (277) 0.507 (199)
. meff-based estimates of Neff in combination with PASS
provided power estimates that were roughly equivalent to simulated values.
. Clearly, when ρy(GLMM) is used to estimate meffs, the result is not correct.
CAPS Methods Core 27 SGregorich
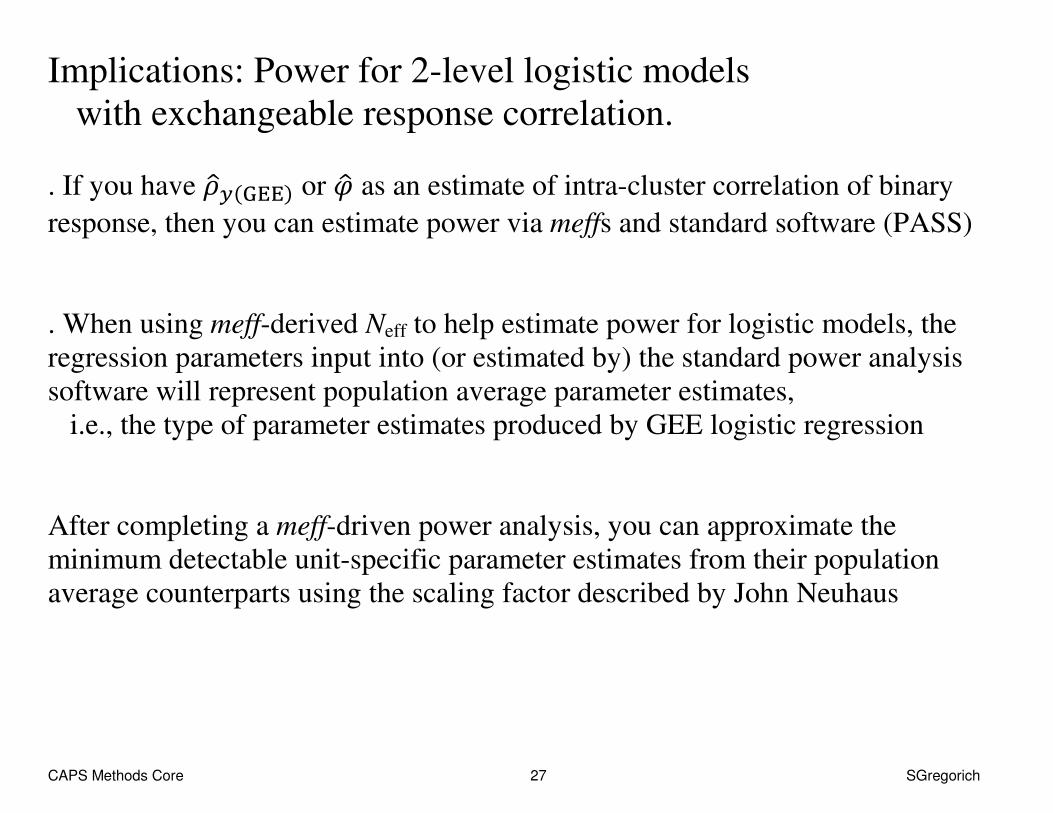
Implications: Power for 2-level logistic models
with exchangeable response correlation.
. If you have $p7(tuu) or vp as an estimate of intra-cluster correlation of binary
response, then you can estimate power via meffs and standard software (PASS)
. When using meff-derived Neff to help estimate power for logistic models, the
regression parameters input into (or estimated by) the standard power analysis
software will represent population average parameter estimates,
i.e., the type of parameter estimates produced by GEE logistic regression
After completing a meff-driven power analysis, you can approximate the
minimum detectable unit-specific parameter estimates from their population
average counterparts using the scaling factor described by John Neuhaus

CAPS Methods Core 28 SGregorich
Implications: Power for 2-level logistic models
with exchangeable response correlation.
. If you only have $p7(twxx) or l̂y�y as an intra-cluster correlation estimate of
binary response, then you should not use them to estimate power via meffs
Instead…
(i) estimate power by simulation using a GLMM data-generating model
When using a GLMM data-generating model, you subsequently
can estimate power via GLMM or GEE logistic regression
It is your call, because given exchangeable response correlation
GEE and GLMM models provide equivalent power
or
(ii) use the GLMM-generated data to estimate $p7(tuu) by simulation and
then proceed with meff-based methods

CAPS Methods Core 29 SGregorich
Limitations
Very limited simulation
. 'large' number of clusters and 'large' clusters considered
. meff-based approximations may not work as well with smaller m or n
. simple two-level model
. balanced cluster size
. limited values of $7 and $o considered.
. limited replicate samples
When in doubt, estimate power by simulation
Thank you
Related Documents