POVERTY REDUCTION STRATEGY PAPER: ANNUAL PROGRESS REPORT FY 2008/09 PRSP Secretariat - Finance Division Government of Pakistan

Welcome message from author
This document is posted to help you gain knowledge. Please leave a comment to let me know what you think about it! Share it to your friends and learn new things together.
Transcript

POVERTY REDUCTION STRATEGY
PAPER:
ANNUAL PROGRESS REPORT FY 2008/09
PRSP Secretariat - Finance Division Government of Pakistan
ANNUAL PROGRESS REPORT
FY 2008/09
The report has been written by Strengthening Poverty Reduction Strategy (PRS)
Monitoring Project, United Nations Development Program (UNDP), Federal Bank of Cooperatives, Islamabad.
Annual Progress Report FY 2008/09 Poverty Reduction Strategy Paper (PRSP)
2
Table of Contents
List of Tables ................................................................................................................................. 4 List of Graphs/Figures…………..…………………..………………………………………..………….6 List of Acronyms ......................................................................................................................................... 7 1.0 Introduction .......................................................................................................................................... 9 2.0 Trends in Macroeconomic Indicators ................................... Error! Bookmark not defined.11
2.1 Agriculture ................................................................................................................................. 13 2.2 Industry ...................................................................................................................................... 15 2.3 Services ........................................................................................................................ 16 2.4 Fiscal Balance .............................................................................................................. 16 2.5 Current Account Balance .............................................................................................. 17 2.6 Trade Balance .............................................................................................................. 17 2.7 Investment and Savings ............................................................................................... 18 2.8 Per Capita Income ........................................................................................................ 18 2.9 Inflation ......................................................................................................................... 19 2.10 Macroeconomic Stabilization Program........................................................................... 20
3.0 Trends in Expenditure - FY2008-09 ................................................................................. 22 3.2 Budget Allocations for FY2008-09: ................................................................................ 28 3.3 Current and Development Budgetary allocations and Expenditures: ............................. 34 3.4 PRSP Expenditures in Sub Sectors of Education and Health: ...................................... 37 3.5 Actual PRSP Budgetary Expenditures for FY2008-09 Vs PRSP II Projections: ........... 40
4.0 Protecting the Poor and Vulnerable ..................................................................................... 42 4.1 Pakistan Bait-ul Mal (PBM) ........................................................................................... 42 4.2 Zakat ............................................................................................................................. 43 4.3 Employees’ Old Age Benefit Institution ........................................................................ 44 4.4 Benazir income Support Programme (BISP) ................................................................ 45 4.5 Punjab Food Support Scheme (PFSS) ......................................................................... 46 4.6 Punjab Sasti Roti Initiative/Scheme .............................................................................. 47 4.7 Workers Welfare Fund (WWF) ..................................................................................... 47 4.8 Micro Finance ............................................................................................................... 48
5.0 Monitoring the PRSP Intermediate (Output) Indicators ....................................................... 53 5.1 Education Sector .......................................................................................................... 53 5.2 Health Sector ................................................................................................................ 60 5.3 Lady Health Workers (LHWs) ....................................................................................... 63 5.4 Enviroment/Water Supply and Senitation ..................................................................... 65 5.5 Peoples Works Program-1 (PWP-1) ............................................................................ 69 5.6 Capital and Finance for Development .......................................................................... 70 5.7 Employment ................................................................................................................. 72
6.0 Monitoring the Outcome Indicators ....................................................................................... 73 6.1 Education ...................................................................................................................... 73 6.2 Primary Education ........................................................................................................ 74 6.3 GER at Middle Level ..................................................................................................... 77 6.4 GER at Matric Level ..................................................................................................... 79 6.5 Drop-out Rates Aged 15-19 Years – By gender and Class .......................................... 82 6.2 Health ........................................................................................................................... 82 6.3 Environment/Water Supply and Sanitation ................................................................... 86 6.4 Seats Held by Women at Various Levels ..................................................................... 88
7.0 Conclusion ........................................................................................................................... 91
Annual Progress Report FY 2008/09 Poverty Reduction Strategy Paper (PRSP)
3
Annex I .......................................................................................................................................... 2 Annex II ......................................................................................................................................... 2 Annex III ........................................................................................................................................ 4 Annex IV ....................................................................................................................................... 2 Annex V ........................................................................................................................................ 6 Annex VI………………………………………………………………………………………………….10
Annual Progress Report FY 2008/09 Poverty Reduction Strategy Paper (PRSP)
4
List of Tables
Table 2.1 Growth in Key Macroeconomic Indicators (Projected vs Actual) FY 2003/04 – FY 2007/08……………………………...…………………………………………..……….…12
Table 2.2 Inflation During FY 2008/09 ……………………………………………………..….…..…19 Table 3.1: PRSP Budgetary Expenditures and Percentage Change Between FY 2007/08 and
FY 2008/09………………………………………………………………………….….…..22 Table 3.2: Effect of subsidies on aggregate expenditure change between FY 2007/08 and FY
2008/09……………………………………………………………………………………..24 Table 3.3: Proportionate share of Major items in Budget estimates for Subsidies
(FY2008-09)………………………………………………………… ….…………….....…24 Table 3.4: Comparison of Proportional Contribution of PRSP Sectors in Budgetary Expenditures
between FY 2007/08 and FY 2008/09…………………………….………………..…...25 Table 3.5: Percentage change in PRSP expenditures between FY 2007/08 and FY 2008/09 by
sector and province…………………………………………….……………….………...27 Table 3.6: PRSP Budgetary allocations for FY 2008-09…………………..............................…..29 Table 3.7: Sectoral shares in the Provincial and Federal Budgets (FY2008-09)….......... …….30 Table 3.8: Deviations of Budgeted and Actual PRSP Expenditures……..………………..…….31 Table 3.9: Deviations of Budgeted and Actual, Current and Development PRSP Expenditures
FY 2008-09……………………………………………….……………………..………….33 Table 3.10:Total Current and Development PRSP Expenditure (FY 2007/08 – FY
2008/09)…………………………………………………………………………...…….. 34 Table 3.11: Development budget allocations between FY 2007-08 & FY2008-09………..……..35 Table 3.12 : Percent change in Current and Development expenditure by
provinces..…………………………………………………………….……………..….35 Table 3.13: Percentage change in Current and Development Expenditure by sectors between
FY2007/08 and FY 2008/09………………..……………………….………………….36 Table 3.14: Percentage change in PRSP education expenditures between FY 2007/08 and FY
2008/09 by province and sectors of education…………………........................…37 Table 3.15 : Percentage distribution of education expenditures in FY 2008/09 and FY 2008/09
by province and sectors of education……………………………………………….38 Table 3.16: Percentage change in PRSP health expenditures between FY 2007/08 and FY
2008/09 by province and sectors of health……….……………………….……..…39 Table 3.17: Percentage distribution of health expenditures in FY 2008/09 and FY 2007/08 by
province and sectors of Health……………………………………………..….....…39 Table 3.18: Actual PRSP Budgetary Expenditures FY2008-09 Vs Projections in PRSP
II…………………………………………………………………………….……………40 Table 4.1: Pakistan Bait-ul-Mal (PBM) Programme………….……………………..……………..43 Table 4.2: Comparison of Zakat Programmes between FY 2007/08 and FY 2008/09 (Rs in
Millions)…… ………………………………………………………………………...….43 Table 4.3: Programs of Employees’ Old Age Benefits Institution (EOBI)……………..…….....44 Table 4.4: Benazir Income Support Programme……………………….….…………….…….....46 Table 4.5: Punjab Food Support Scheme…………………………………..…………................47 Table 4.6: Workers Welfare Funds Programme..........................................................................48 Table 4.7: Active Borrowers, Active Savers and Active Policy holders by Peer Group during
2007/08 and 2008/09………………………………………….………........................49 Table 4.8: Active Borrowers, Active Savers and Active Policy holders by Peer Group (FY
2007/08 - FY 2008/09)……………………….………………………...............……..50

Annual Progress Report FY 2008/09 Poverty Reduction Strategy Paper (PRSP)
5
Table 4.9: Summary of Microcredit Provision…………………………………………..………….51 Table 5.1: Number of Functional Public Schools………………………………………………….54 Table 5.2: Posts Filled Against Sanctioned Posts……………………………………..…...……..55 Table 5.3 : Percentage of Trained Teachers……………………………...………………55 Table 5.4: Proportion of Public Schools with Basic Facilities……….………..……….…56 Table 5.5 Private Schools and Deeni Madrasahs…………………………..…………….59 Table 5.6 Technical/Vocational Trainings…………………………………………………59 Table 5.7 National Internship Program……………………………………………………60 Table 5.8: TT- Immunization Coverage for Pregnant Women…………………………..61 Table 5.9: Percentage of Children 12-23 Months That Have Been Immunized……....62 Table 5.10 Population Covered by LHWs………………………………………………………….64 Table 5.11 Total Strength of Lady Health Workers…………………………………………..…...65 Table 5.12 Percentage of Land Area Covered by Forests…………………………….………....66 Table 5.13 Land Protected Area…………………………………………………………………….66 Table 5.14 Depletion of Ozone Layer…………………………………………………..…………..67 Table 5.15 Integrated Energy Development……………………………………………..………..68 Table 5.16 Water Supply through Water Purification Plants…………………………….…..…..68 Table 5.17: Number of Schemes Approved Under Each Category…………………….……....69 Table 5.18 Progress of Output Indicators………………………………………………………....70 Table 5.19: Labor Force, Employed Labor Force, and Unpaid Family Helpers...................…72 Table 6.1: Literacy- Population 10 Years and Older - By Region and Province……………....73 Table 6.2: GER at Primary Level (age 5-9) - By Region and Province (excluding katchi
class)…… …………………………………..…………………………………….……..75 Table 6.3: NER at Primary Level (age 5-9) - By Region and Province (excluding katchi class)…
……………………………………………………………………….……….…………...76 Table 6.4: GER at the Middle Level (age 10-12) - By Region and Province……………….…...77 Table 6.5: NER at the Middle Level (age 10-12) - By Region and Province……………….……..78 Table 6.6: GER at the Matric Level (age 13-14) - By Region and Province…………………..….80 Table 6.7: NER at the Matric Level (age 13-14) - By Region and Province……………….……..81 Table 6.8: Drop-out Rates (percent)……………………………………………………………....82 Table 6.9: Children under five (5) suffering from diarrhea in past 30 days - by region and
Province…………………….……………………………………………………………83 Table 6.10: Total Fertility Rate (TFR)……………………………………………………...……....84 Table 6.11: Infant Mortality - By Sex and Region (Deaths per thousands live births)..……...84 Table 6.12: Contraceptive Prevalence Rate (Women Aged 15-49 Years)……………….……85 Table 6.13: Pre Natal Consultations by Province…………………………...……………………85 Table 6.14: Main Sources of Drinking Water in Pakistan (Percentages)………………………86 Table 6.15: Type of Toilet Used By Households…………………………………………………87 Table 6.16: Senate/National Assembly/Provincial Assemblies…………………………......….88 Table 6.17: Seats Held by Women in District/Tehsil/Town/Union Councils………………..…90

Annual Progress Report FY 2008/09 Poverty Reduction Strategy Paper (PRSP)
6
Lists of Figures/Graphs/Boxes
Figure 2.1 Agriculture Growth Rate *(Actual vs. Projected)…………………………………...13 Figure 2.2 Agriculture Growth Rate………………………………………………………………14 Figure 2.3 Fiscal Deficits as a Percentage of GDP……………………………………………..17 Figure 4.1 Active borrowers FY 2007/08 and FY 2008/09 ...................................................50 Figure4.2 Active Savers FY 2007/08 and FY 2008/09 …………………………………………50 Figure 4.3 Active Policy holders FY 2007/08 and FY 2008/09………………………………...50 Graph 6.1 Main source of Drinking Water Overall Pakistan FY 2007/08…………………….87 Graph 6.2: Type of Toilet Used By Households……………………………………………..…88 Graph 6.3: Seats Held by Women at Various Levels………………………………………..…89 Box 2.1: The IMF Stabilization Program………………………………………………………….20

Annual Progress Report FY 2008/09 Poverty Reduction Strategy Paper (PRSP)
7
List of Acronyms
AJ&K Azad Jammu & Kashmir ADB Asian Development Bank ACEPAM Academy for Educational Planning and Management BHUs Basic Health Units BISP Benazir Income Support Programme BCG Bacillus Calmette Guerin CDA Capital Development Authority CPR Contraceptive Prevalence Rate CPI Consumer Price Index CNIC Computerized National Identity Card CSP Child Support Programme CDWA Clean Drinking Water for All CAR Capital Adequacy Ratio CRAR Capital to Risk (weighted) Assets Ratio DPT Diphtheria Pertusis Tetanus EOBI Employee Old Age Benefit Institutions EFA Education for All FEDLA Fiscal Responsibility and Debt Limitation Act FBS Federal Bureau of Statistics FY Financial Year FATA Federal Administrative Tribal Areas FSP Food Support Program FSV Forced Sale Value FANA Federal Administrative Northern Areas GOP Government of Pakistan GDP Gross Domestic Product GLP Gross Loan Portfolio GER Gross Enrolment Rate IMF International Monetary Fund IT Information Technology IR Institutional Rehabilitation IFA Individual Financial Assistance IMR Infant Mortality Rate ICT Islamabad Capital Territory KWH Kilo Watt Hour KESC Karachi Electric Supply Corporation LSM Large Scale Manufacturing LHWs Lady Health Workers LFS Labor Force Survey MIS Management Information System MICS Multiple Indicator Cluster Survey MDGs Millennium Development Goals MFIs Micro Finance Institutions MFBs Micro Finance Banks NEMIS National Education Management Information System NCRCL National Centre for Rehabilitation of Child Labor
Annual Progress Report FY 2008/09 Poverty Reduction Strategy Paper (PRSP)
8
NGO Non-Governmental Organization NER Net Enrolment Rate NWFP North West Frontier Province NIP National Internship Programme NAVTEC National Vocational and Technical Education Commission NPLs Non Performing Loans OMC Oil Marketing Companies PMN Pakistan Microfinance Network PWP-I Peoples Works Programme-I PBM Pakistan Bait-ul-Mal PRSP Poverty Reduction Strategy Paper PPPs Public Private Partnerships PSLM Pakistan Social and Living Standard Measurement Survey PFSS Punjab Food Support Scheme PSDP Public Sector Development Programme RSPs Rural Support Programmes ROA Return on Assets SPI Sensitive Price indicator SBP State Bank of Pakistan SME Small and Medium Enterprises TCP Trading Corporation of Pakistan TFR Total Fertility Rate TUS Time Use Survey TBA Trained Birth Attendants TT-1 Tetanus Toxoid-1 TT-2+ Tetanus Toxoid-2+ TVET Technical and Vocational Education & Training VTC Vocational Training Centers WPI Wholesale Price Index WAPDA Water and Power Development Authority

Annual Progress Report FY 2008/09 Poverty Reduction Strategy Paper (PRSP)
9
1 Introduction 1.1 The Poverty Reduction Strategy Paper (PRSP) Annual Progress Report for FY 2008/09 is eighth in line in the on-going process which was initiated ever since the establishment of the PRSP Secretariat in the Ministry of Finance in Year 2000. The PRSP Secretariat regularly reports budgeted and non-budgeted expenditures in selected pro-poor sectors followed by monitoring of the key output and outcome indicators. The purpose of the PRSP quarterly and annual progress reports is to keep track of progress in all efforts directed towards poverty reduction in the country. 1.2 This Annual Report FY 2008/09 is the first report since the PRSP-II was finalized in FY 2008/09. The PRSP-II covers the three year period FY 2008/09 – FY 2010/II. The PRSP-I has been a successful strategy, as sound progress has been made in all pro poor sectors during the last eight years. During 2003 onwards, the Strategy focused on four pillars, i.e. (i) Accelerating Economic Growth; (ii) Improving Governance; (iii) Investing in Human Capital; and (iv) Targeting the Poor and Vulnerable. Taking into account socio-economic developments, both domestic and international, the PRSP-II has been built upon the government’s nine point economic reform poverty reduction agenda encompassing the following nine pillars (i) Macroeconomic stability and Real Sector Growth; (ii) Protecting the Poor and Vulnerable; (iii) Increasing Productivity and Value Addition in Agriculture; (iv) Integrated Energy Development Programme; (v) Making Industry Internationally Competitive; (vi) Human Development for the 21st Century; (vii) Removing Infrastructure Bottlenecks through Public Private Partnerships (PPP); (viii) Capital and Finance for Development; and (ix) Governance for a Just and Fair System. 1.3 PRSP Annual Progress Report for FY 2008/09 begins with an Introduction in Section 1, followed by an overview of the Pakistan’s economy along with a brief discussion on key macroeconomic indicators in Section 2. Section 3 gives a detailed analysis of; budgetary expenditures in 17 pro-poor sectors; examines the dominating effect of Subsidies; computes and analyze deviations of actual expenditures from original approved Budgetary Allocations at aggregate level and at disaggregated sectoral level, both for development and non-development expenditures; analyses budgetary allocations and sectoral shares in overall pro-poor budgetary allocation; presents comprehensive analysis of Development and Current expenditures; examines two key Human Development related Sectors, Education and Health and finally, the progress made in actual PRSP expenditures expressed as percentage of GDP vis-à-vis projections reflected in PRSP-II. Section 4 highlights both budgetary and non-budgetary modes to provide social protection to the poor and vulnerable and also illustrates tracking of the non-budgetary programmes. Section 5 explains in detail the PRSP key output (intermediate) indicators revised in the PRSP-II Monitoring Matrix. Since the Pakistan Social and Living Standard Measurement Survey (PSLM) FY 2007/08 Survey details have already been released, Section 6 gives an analysis of tracking performance of social sectors goals (outcomes) particularly about: Education; Health and Water Supply & Sanitation. Section 7 ends the report with the concluding remarks. Following previous practice, this year’s PRSP Annual Progress Report also includes: a box on Time Use Survey (TUS) 2007 Report published in Year 2009; a brief on highlighting Environment Management; a brief on Performance of Microfinance Sector in Pakistan; a brief on Pakistan Labour Force Survey FY 2007/08; Budgetary Expenditures Statement for the FY 2008/09; and Revised Accounting Codes for the Budgetary Expenditures. 1.4 Pro-poor expenditure targets set for FY 2008/09 have been achieved in accordance with the Fiscal Responsibility and Debt Limitation Act (FRDLA), 2005. The Act stipulates that ‘social
Annual Progress Report FY 2008/09 Poverty Reduction Strategy Paper (PRSP)
10
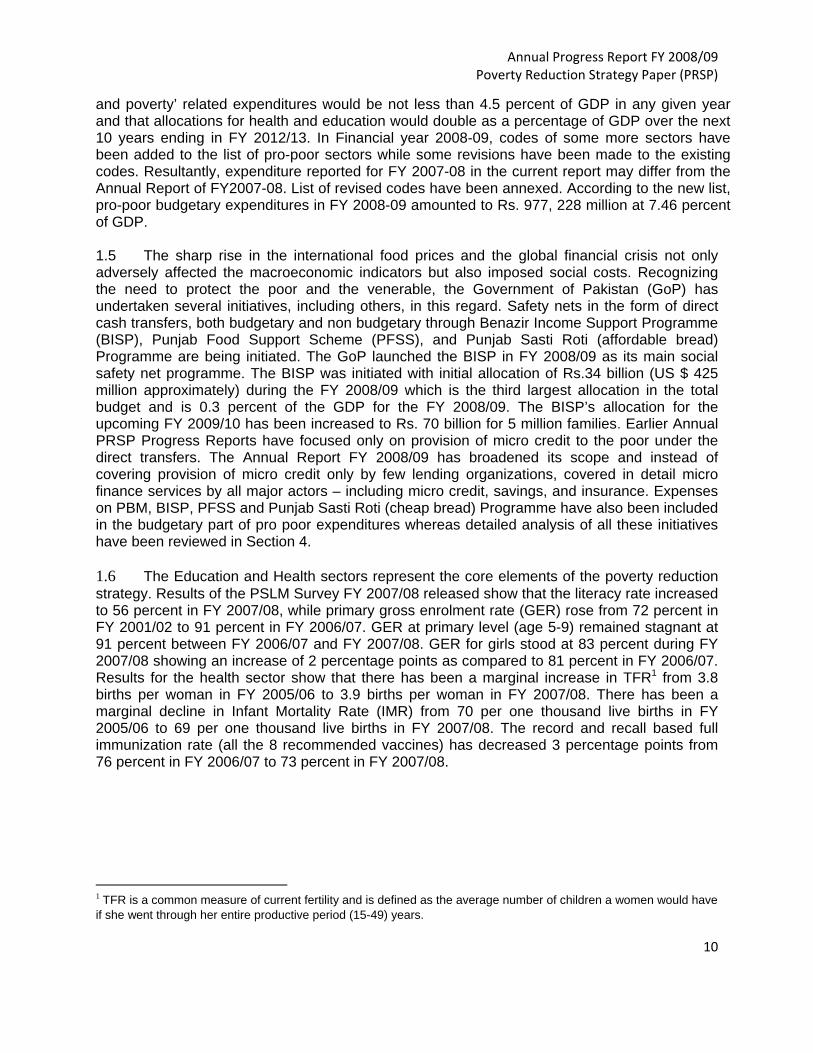
and poverty’ related expenditures would be not less than 4.5 percent of GDP in any given year and that allocations for health and education would double as a percentage of GDP over the next 10 years ending in FY 2012/13. In Financial year 2008-09, codes of some more sectors have been added to the list of pro-poor sectors while some revisions have been made to the existing codes. Resultantly, expenditure reported for FY 2007-08 in the current report may differ from the Annual Report of FY2007-08. List of revised codes have been annexed. According to the new list, pro-poor budgetary expenditures in FY 2008-09 amounted to Rs. 977, 228 million at 7.46 percent of GDP. 1.5 The sharp rise in the international food prices and the global financial crisis not only adversely affected the macroeconomic indicators but also imposed social costs. Recognizing the need to protect the poor and the venerable, the Government of Pakistan (GoP) has undertaken several initiatives, including others, in this regard. Safety nets in the form of direct cash transfers, both budgetary and non budgetary through Benazir Income Support Programme (BISP), Punjab Food Support Scheme (PFSS), and Punjab Sasti Roti (affordable bread) Programme are being initiated. The GoP launched the BISP in FY 2008/09 as its main social safety net programme. The BISP was initiated with initial allocation of Rs.34 billion (US $ 425 million approximately) during the FY 2008/09 which is the third largest allocation in the total budget and is 0.3 percent of the GDP for the FY 2008/09. The BISP’s allocation for the upcoming FY 2009/10 has been increased to Rs. 70 billion for 5 million families. Earlier Annual PRSP Progress Reports have focused only on provision of micro credit to the poor under the direct transfers. The Annual Report FY 2008/09 has broadened its scope and instead of covering provision of micro credit only by few lending organizations, covered in detail micro finance services by all major actors – including micro credit, savings, and insurance. Expenses on PBM, BISP, PFSS and Punjab Sasti Roti (cheap bread) Programme have also been included in the budgetary part of pro poor expenditures whereas detailed analysis of all these initiatives have been reviewed in Section 4. 1.6 The Education and Health sectors represent the core elements of the poverty reduction strategy. Results of the PSLM Survey FY 2007/08 released show that the literacy rate increased to 56 percent in FY 2007/08, while primary gross enrolment rate (GER) rose from 72 percent in FY 2001/02 to 91 percent in FY 2006/07. GER at primary level (age 5-9) remained stagnant at 91 percent between FY 2006/07 and FY 2007/08. GER for girls stood at 83 percent during FY 2007/08 showing an increase of 2 percentage points as compared to 81 percent in FY 2006/07. Results for the health sector show that there has been a marginal increase in TFR1 from 3.8 births per woman in FY 2005/06 to 3.9 births per woman in FY 2007/08. There has been a marginal decline in Infant Mortality Rate (IMR) from 70 per one thousand live births in FY 2005/06 to 69 per one thousand live births in FY 2007/08. The record and recall based full immunization rate (all the 8 recommended vaccines) has decreased 3 percentage points from 76 percent in FY 2006/07 to 73 percent in FY 2007/08.
1 TFR is a common measure of current fertility and is defined as the average number of children a women would have if she went through her entire productive period (15-49) years.
Annual Progress Report FY 2008/09 Poverty Reduction Strategy Paper (PRSP)
11
2 Trends in Macroeconomic Indicators
2.1 Pakistan’s economic outlook and macroeconomic environment in FY 2008/09 was
affected both by internal and external pressures of acute nature. These were driven by an
intensification of war on terror coupled with law and order situation, power shortages, supply
shocks, augmented by external factors driven shadowed by the global financial crisis shrinking
external demand leading to a decline in Pakistan’s exports and a visible slow down in foreign
direct investment inflows. While the fiscal and current account imbalances narrowed, the
exchange rate stabilized, foreign reserves rose but inflation remained stubbornly high and
growth plunged. A modest improvement in growth is expected in FY 2009/10.
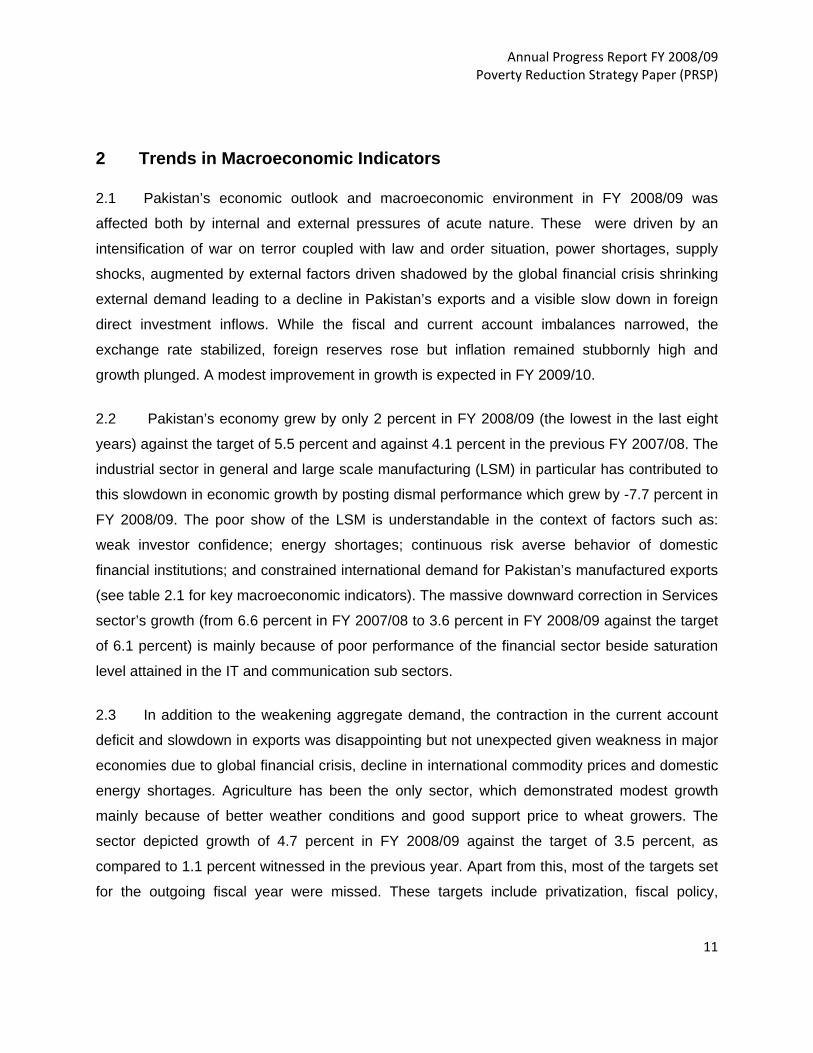
2.2 Pakistan’s economy grew by only 2 percent in FY 2008/09 (the lowest in the last eight
years) against the target of 5.5 percent and against 4.1 percent in the previous FY 2007/08. The
industrial sector in general and large scale manufacturing (LSM) in particular has contributed to
this slowdown in economic growth by posting dismal performance which grew by -7.7 percent in
FY 2008/09. The poor show of the LSM is understandable in the context of factors such as:
weak investor confidence; energy shortages; continuous risk averse behavior of domestic
financial institutions; and constrained international demand for Pakistan’s manufactured exports
(see table 2.1 for key macroeconomic indicators). The massive downward correction in Services
sector’s growth (from 6.6 percent in FY 2007/08 to 3.6 percent in FY 2008/09 against the target
of 6.1 percent) is mainly because of poor performance of the financial sector beside saturation
level attained in the IT and communication sub sectors.
2.3 In addition to the weakening aggregate demand, the contraction in the current account
deficit and slowdown in exports was disappointing but not unexpected given weakness in major
economies due to global financial crisis, decline in international commodity prices and domestic
energy shortages. Agriculture has been the only sector, which demonstrated modest growth
mainly because of better weather conditions and good support price to wheat growers. The
sector depicted growth of 4.7 percent in FY 2008/09 against the target of 3.5 percent, as
compared to 1.1 percent witnessed in the previous year. Apart from this, most of the targets set
for the outgoing fiscal year were missed. These targets include privatization, fiscal policy,
Annual Progress Report FY 2008/09 Poverty Reduction Strategy Paper (PRSP)
12
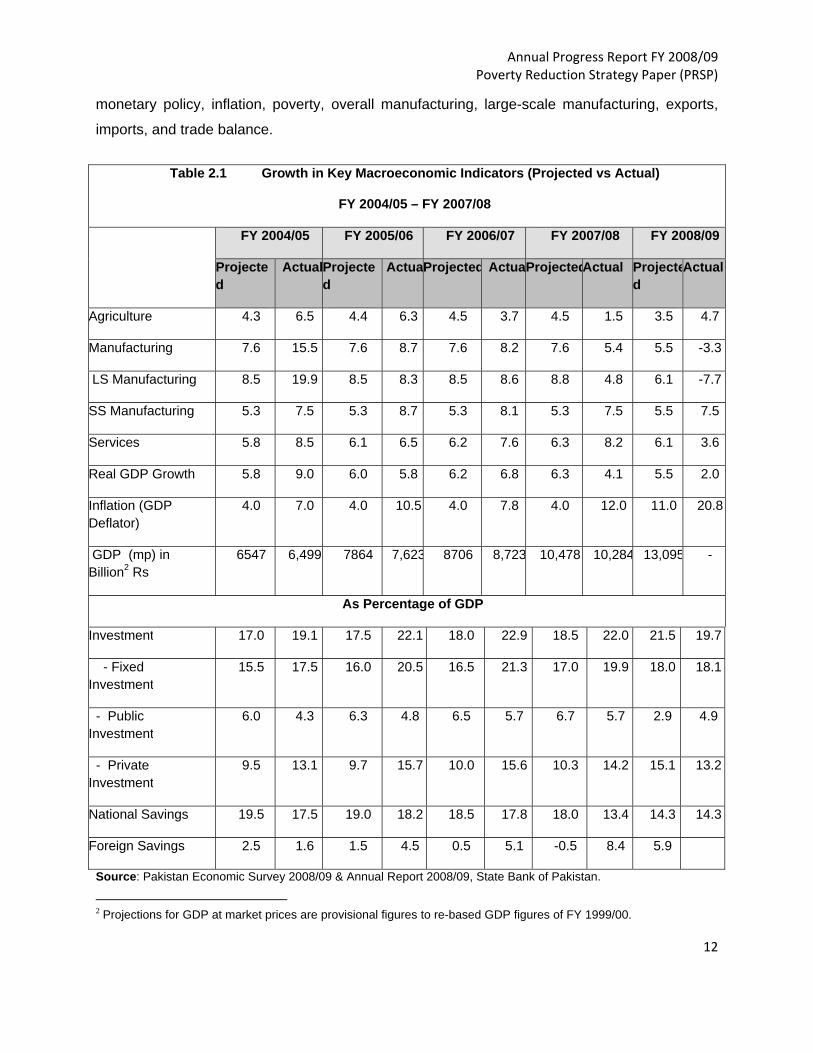
monetary policy, inflation, poverty, overall manufacturing, large-scale manufacturing, exports,
imports, and trade balance.
Table 2.1 Growth in Key Macroeconomic Indicators (Projected vs Actual)
FY 2004/05 – FY 2007/08
FY 2004/05 FY 2005/06 FY 2006/07 FY 2007/08 FY 2008/09
Projected
ActualProjected
ActuaProjected ActuaProjectedActual Projected
Actual
Agriculture 4.3 6.5 4.4 6.3 4.5 3.7 4.5 1.5 3.5 4.7
Manufacturing 7.6 15.5 7.6 8.7 7.6 8.2 7.6 5.4 5.5 -3.3
LS Manufacturing 8.5 19.9 8.5 8.3 8.5 8.6 8.8 4.8 6.1 -7.7
SS Manufacturing 5.3 7.5 5.3 8.7 5.3 8.1 5.3 7.5 5.5 7.5
Services 5.8 8.5 6.1 6.5 6.2 7.6 6.3 8.2 6.1 3.6
Real GDP Growth 5.8 9.0 6.0 5.8 6.2 6.8 6.3 4.1 5.5 2.0
Inflation (GDP Deflator)
4.0 7.0 4.0 10.5 4.0 7.8 4.0 12.0 11.0 20.8
GDP (mp) in Billion2 Rs
6547 6,499 7864 7,623 8706 8,723 10,478 10,284 13,095 -
As Percentage of GDP
Investment 17.0 19.1 17.5 22.1 18.0 22.9 18.5 22.0 21.5 19.7
- Fixed Investment
15.5 17.5 16.0 20.5 16.5 21.3 17.0 19.9 18.0 18.1
- Public Investment
6.0 4.3 6.3 4.8 6.5 5.7 6.7 5.7 2.9 4.9
- Private Investment
9.5 13.1 9.7 15.7 10.0 15.6 10.3 14.2 15.1 13.2
National Savings 19.5 17.5 19.0 18.2 18.5 17.8 18.0 13.4 14.3 14.3
Foreign Savings 2.5 1.6 1.5 4.5 0.5 5.1 -0.5 8.4 5.9
Source: Pakistan Economic Survey 2008/09 & Annual Report 2008/09, State Bank of Pakistan.
2 Projections for GDP at market prices are provisional figures to re-based GDP figures of FY 1999/00.

Annual Progress Report FY 2008/09 Poverty Reduction Strategy Paper (PRSP)
13
Projections for FY 2004/05 – FY 2008/09 are from PRSP-I (2003) and PRSP II 2008/09.
2.4 A brief discussion on the growth trends in various sectors of the economy is presented
below.
2.1 Agriculture
2.5 The Agriculture sector is the major contributor in Pakistan’s economy – contributed 21.8
percent to the GDP. The agriculture sector has grown at an average rate of 4.1 percent per
annum since FY 2002/03 with variations from 6.5 percent highest in FY 2004/05 and lowest 1.1
percent in previous FY 2007/08(see fig 2.1). The sector has shown negative growth rate during
FY 2005/06 and FY 2007/08 under the major crops (see fig 2.2).
Figure 2.1 Agriculture Growth Rate *(Actual vs. Projected)
6.5
6.3
3.7
1.5
4.7
4.3
4.4
4.5
4.5
3.5
0 1 2 3 4 5 6 7
2004/05
2005/06
2006/07
2007/08
2008/09
Project Growth Rate Actual Growth Rate
Source: Economic Survey of Pakistan 2008-09

Annual Progress Report FY 2008/09 Poverty Reduction Strategy Paper (PRSP)
14
Figure 2.2 Agriculture Growth Rates
4.1
6.8
1.9 2.41.73.9
6.5
17.7
1.5
6.3
-3.9
0.4
4.1
7.7
-1
1.1
-6.4
10.9
4.7
7.7
3.6
-10
-5
0
5
10
15
20
2002-03 2003-04 2004-05 2005-06 2006-07 2007-08 2008-09
Agriculture Major Crops Minor Crops
Source: Economic Survey of Pakistan 2008-09
2.6 The sector grew by 4.7% as compared to 1.1 percent in the previous year and surpassed the target of 3.5% of the FY 2008/09 owing to bumper wheat, maize and rice crops. Major crops accounting for 33.4 percent of agricultural value-added registered an impressive growth of 7.7 percent as against a negative growth of 6.4 percent last year and a target of 4.5 percent. The growth in minor crops was also impressive despite production declines in crops such as canola, onions, mangoes and some pulses. Minor crops contributed 12 percent to overall agriculture growth which grew by 3.6 percent in FY 2008/09 as against 10.9 percent last year.
2.7 The performance of livestock, a sub sector of agriculture – could not achieve the target of 4.2% percent in FY 2008/09, grew only by 3.7 percent as against 4.2 percent in the previous year. The performance of fishery sub sector remained positive at 2.3 percent though the previous year growth stood at 9.2 percent. Lastly, like in the previous few years, forestry has once again posted negative growth of 15.7 percent.
2.2 Industry
2.8 The industrial sector is the second largest sector of the economy having 24.3 percent contribution to GDP. This sector has recorded its weakest growth in a decade during the current

Annual Progress Report FY 2008/09 Poverty Reduction Strategy Paper (PRSP)
15
fiscal year depicting a negative growth rate of 3.3 percent against the target of 5.5 percent in FY 2008/09. Small and medium manufacturing sector maintained its healthy growth of last year at 7.5 percent. Large-scale manufacturing depicted contraction of 7.7 percent as against expansion of 4.0 percent in the last year.
2.9 Other than mining and quarrying sub sectors, production in all major industrial sub sectors declined during FY 2008/09. Textile sector, being an export-oriented industry of Pakistan and more prone to international demand shocks, has been under severe stress amid a global recession. However, textile production declined slightly by 0.7 percent in FY 2008/09. The textile sector was badly hit by power shortages and weak external demand. The construction industry registered a sharp decline of 10.8 percent in FY 2008/09 - the largest fall in 37 years. Sharp increase in building material prices, besides significant cuts in Public Sector Development Program funds and dearth of financing facilities caused the construction activities to shrink significantly.
2.10 A sustained growth in recent years in cement industry has been an outcome of increase in its production capacity and exploitation of export markets. The cement sector posted a growth rate of 4.71 percent during the current fiscal year and exports increased by 48.8 percent. Fertilizer industry also posted positive growth due to increase in production. In order to achieve and sustain a high growth in industrial sector, it is increasingly important for the sector to focus on removing structural constraints. Effectiveness of government’s measures to tackle the ongoing energy crisis and law and order situation remains indeed vital in this regard.
2.11 The manufacturing sector has been hard hit by domestic and international factors. Political instability and frequent eruptions of incidents detrimental to law and order have created uncertain environment, resulting in loss of output. This sector has also fallen victim to acute energy shortages. Continuous power breakdowns are preventing industries from operating at their capacity level. In unison with increasing prices for fuel and energy, all these factors have caused slower growth in LSM.
2.3 Services
2.12 The services sector constitutes 53.8 percent of GDP and employs 36.1 percent of labor force. The sector has registered a growth of 3.6 percent in FY 2008/09 as against the target of 6.1 percent – the lowest growth in the preceding eight years. The services sector missed its growth target for the second consecutive year; the magnitude of slippage in FY 2008/09 was significantly higher than that in FY 2007/08. However, the services sector has compensated some of the lost growth of the industrial sector by growing at 3.6 percent and contributed to the overall economic growth. Major reasons for the weak performance are lower corporate earnings due to stiff competition, increased taxation on cellular communication, capital market instability, and decline in value addition of finance and insurance sector.
2.13 Value-added in the wholesale and retail trade sector grew at 3.1 percent in FY 2008/09 as compared to 5.3 percent in last year and target for the year of 5.4 percent. Finance and insurance sector witnessed a slowdown to 12.9 percent in FY 2007/08 but registered negative growth of 1.2 percent in FY 2008/09. Transport, Storage and Communication sub-sector portrayed a sharp deceleration in growth to 2.9 percent in FY 2008/09 as compared to 5.7 percent for the last year.

Annual Progress Report FY 2008/09 Poverty Reduction Strategy Paper (PRSP)
16
2.4 Fiscal Balance
2.14 During the last eight years – Country’s fiscal position improved considerably averaging 4 percent during FY 2000/01 - FY 2008/09. There has been a significant improvement in fiscal performance during FY 2008/09 compared to FY 2007/08 (the highest 7.4 % since FY 2000/01) due to the policy shift i.e. successful implementation of the Macroeconomic Stabilization Programme resulted in a reduction in fiscal deficit 2.4 percentage point of GDP to 5.2 percent during FY 2008/09. The consolidation of fiscal balance during FY 2008/09 resulted largely from a steep deceleration in the growth of total expenditures. In addition during FY 2008/09, Government shifted its policy in the composition of budgetary financing away from extremely inflationary borrowing from the central bank (see Figure 2.2).
Figure 2.3 Fiscal Deficits as a Percentage of GDP
4.34.3
3.7
2.4
3.3
4.24.3
7.4
5.2
0 1 2 3 4 5 6 7 8
FY 2001
FY 2002
FY 2003
FY 2004
FY 2005
FY 2006
FY 2007
FY 2008
FY 2009
Source: Annual Report FY-2008/09, State Bank of Pakistan
2.5 Current Account Balance
2.15 After worsening of current account deficit in the last four consecutive years, it has contracted considerably to 5.3 percent during FY 2008/09 from 8.4 percent in FY 2007/08. The entire improvement took place in the latter half of the FY 2008/09. Improvement in current account are largely based on (1) reduction in imports due to steep fall in import prices, subsidizing aggregate demand pressures, and exchange rate depreciation and (2) an increase in remittances. This relative improvement was also reflected in the exchange rate stability and re-building of foreign exchange reserves. In the days ahead, it would be challenging to maintain improvement in external account in the light of downward risk to remittances inflows and likely increase in imports owing to recovery of commodity prices in the international market. Investment inflows are subjected to large risks as Pakistan’s sovereign credit risk is still considerably high and prospects for world investment remain uncertain.
Annual Progress Report FY 2008/09 Poverty Reduction Strategy Paper (PRSP)
17
2.6 Trade Balance
2.16 The trade deficit in the FY 2008/09 narrowed to US - $ 17.04 billion compared with US - $ 20.91 billion in the FY 2007/08. The steeper fall in imports compared to exports led to 16.8 percent contraction in trade deficit during FY 2008/09. The contraction in imports is due to lower petroleum group, telecom group and raw cotton imports. Fall in petroleum group was largely 95 percent caused by reduction in oil prices in the international market, while telecom group imports fell mainly due to imposition of custom duty on cellular phones. During FY 2008/09, exports also declined to 6.0 percent against a commendable increase of 18.2 percent in the previous year. The major reasons are contraction in textile exports, shrinking external demand due to global crisis and severe domestic energy crisis.
2.7 Investment and Savings
2.17 Investment as percentage of GDP declined for the second consecutive year to 19.7 percent in FY 2008/09. Resultantly, aggregate investments declined by 6.5 percent the largest fall in 40 years. The major reasons for contraction are law and order situation, heightened security risk, and on-going energy crisis. Higher interest rates, lower corporate earnings, and increase in country risk premium were additional factors delaying investment decisions.
2.18 Fixed investment has decreased to 18.1 percent of GDP during FY 2008/09 from 20.4 percent last year. Private sector investment was decelerating persistently since 2004/05 and its ratio to GDP has declined from 15.7 percent in 2004/05 to 13.2 percent in 2008/09. Public sector investment has also declined to 4.5 percent in FY 2008/09 compared with 5.4 percent in the previous year. National savings as percentage of GDP at 14.3 percent in FY 2008/09 improved slightly, compared to 13.4 percent in the previous year.
2.8 Per Capita Income
2.19 The per capita income is treated as one of the foremost indicators of the depth of growth and general well being of the country in dollar terms. Per capital income has been persistently increasing since 2003/04 to 2008/09 from US $ 669 to US $ 1,046. There has been a marginal increase in per capita income during FY 2008/09 compared with FY 2007/08 from US $ 10,42 to US $ 1,046. The per capita income grew by merely 0.3 percent mainly because of low economic growth, depreciation of Pak rupee and deteriorating law and order situation. The main factor responsible for the rise in per capita during last six years is increase in the inflows of workers’ remittances from aboard. Real per capita income in rupee terms has also increased by 2.5 percent as compared to 0.3 percent growth in the previous year.
2.9 Inflation
2.20 The impact of global recession was most evident in the significant reduction in international commodity prices. Food and energy commodity prices in particular, fell sharply from the peak levels seen in mid-2008. Consequently according to IMF commodity price index, (August 2009), international commodity prices were down by 40.6 percent from their peak levels. Inflationary pressures in the Pakistan’s economy finally began easing in FY 2008/09 with all major price indices i.e. CPI, Wholesale Price Index (WPI), and Sensitive Price Indictor (SPI) - showing steady decline after reaching the peak in August 2008. The annual average CPI

Annual Progress Report FY 2008/09 Poverty Reduction Strategy Paper (PRSP)
18
inflation for FY 2008/09 was 20.8 percent compared to 12 percent for the previous year significantly higher than the annual target of 11 percent.
2.21 Core inflation also increased as food prices rose sharply (to 32% in June 2008 year on year); hitting the poorest groups in society the hardest. Subsidies on oil, food, fertilizer, and power contributed to the budget deficit but failed to contain inflation as food prices soared and the price of fuel was adjusted upward in the last 4 months of FY2008. The steep depreciation of the Pakistan rupee stoked inflation pressures. The consumer price index on a year-on-year basis climbed to 21.5% in June 2008 and to 25.3% in August 2008—the highest in 30 years. Core inflation also increased. As food prices rose sharply (to 32% in June 2008 year on year), the poorest groups in society were the hardest hit. There was significant decline in overall inflation and core inflation (see Table 2.2). The reasons for declining inflationary trend include: (1) impact of declining international commodity prices; (2) weak domestic demand; and (3) monetary tightening policy during much of the Year.
Conclusion
2.22 The FY 2008/09 witnessed lowest GDP growth rate, low savings and investment, soaring fiscal and current account deficits, high inflationary pressures, rise in public and external debt burden, depletion of foreign exchange reserves along with associated increase in poverty and unemployment. Widening macroeconomic imbalances and rapid depletion of the country’s foreign exchange reserves raised serious risks to the domestic economy that finally forced implementation of an aggressive, macroeconomic stabilization programme, with the support of an IMF Stand-By Arrangement (see box 2.1). The crux of the macroeconomic policy involved tightening monetary and fiscal conditions to contain the demand for domestic goods (to curb inflationary pressures), foreign goods (to cut imports and mitigate exchange rate pressures), and other measures to remove (or ease) structural bottlenecks.
Table 2.2: Inflation during FY 2008/09
Month - Year CPI Food Core 8-Jun 21.5 32 13 8-Jul 24.3 33.8 14.7 8-Aug 25.3 34.1 16.4 8-Sep 23.9 29.9 17.3 8-Oct 25 31.7 18.3 8-Nov 24.7 30.4 18.9 8-Dec 23.3 27.9 18.8 9-Jan 20.5 21.6 18.9 9-Feb 21.1 22.9 18.9 9-Mar 19.1 19.7 18.5 9-Apr 17.2 17 17.7 9-May 14.4 12.1 16.6 9-Jun 13.1 10.5 15.9

Annual Progress Report FY 2008/09 Poverty Reduction Strategy Paper (PRSP)
19
Box 2.1: The IMF Stabilization Programme
In November 2008, the Government and the International Monetary Fund reached an agreement according to which a 23-month standby arrangement amounting to $7.6 billion was made available to Pakistan to support its economic stabilization program. The arrangement released $3.1 billion immediately; subsequently quarterly reviews will determine the availability of the remaining tranches. The two key objectives of the support are: to restore macroeconomic stability and confidence through a tightening of macroeconomic policies; and to ensure social stability and adequate support for the poor and vulnerable in Pakistan. The specific areas that are being targeted to meet these key objectives are:
1. External balance - to be targeted via fiscal tightening.
2. Fiscal balance—the program requires a fiscal deficit tightening from 7.4% of GDP in FY 2008 to 4.2% in FY 2009 and then 3.3% in FY 2010. The tightening will come principally through phasing out energy subsidies, better prioritizing development spending, and implementing strong tax policy and administration measures.
3. Monetary tightening—through increases in the policy discount rate, to contain inflation, offload government borrowing from the central bank, and build reserves.
4. Financial institution reform—structural changes to deal with risk contingencies, insolvent banks and to strengthen the SBP’s resolution capacity.
5. Foreign exchange intervention by the central bank—geared only toward achieving the program’s reserve targets and smoothing excessive exchange rate volatility.
6. Social assistance—to be strengthened but better targeted, such that spending on the social safety net will be increased to 0.9% of GDP in FY 2009, an increase of 0.6 percentage points of GDP.
Source: ADB outlook 2009
2.23 The macroeconomic stabilization programme in FY 09 resulted in considerable fiscal consolidation during the year. The overall fiscal deficit dropped to Rs 680.4 billion during FY 09 from Rs 777.2 billion in the preceding year. As a percentage of GDP, fiscal improvement led to a reduction in the budget deficit by 2.4 percentage points to 5.2 percent during FY 09. The Macroeconomic Stabilization Programme has led to considerable improvements in key indicators helped by favorable exogenous factors, and provided the base for a gradual move from stabilization polices towards those fostering a continuation of growth. However, improvements in the economy are still frail, and could be reversed in short run by adverse shocks or any failure in the structured implementation of fiscal and monetary reforms.
Annual Progress Report FY 2008/09 Poverty Reduction Strategy Paper (PRSP)
20
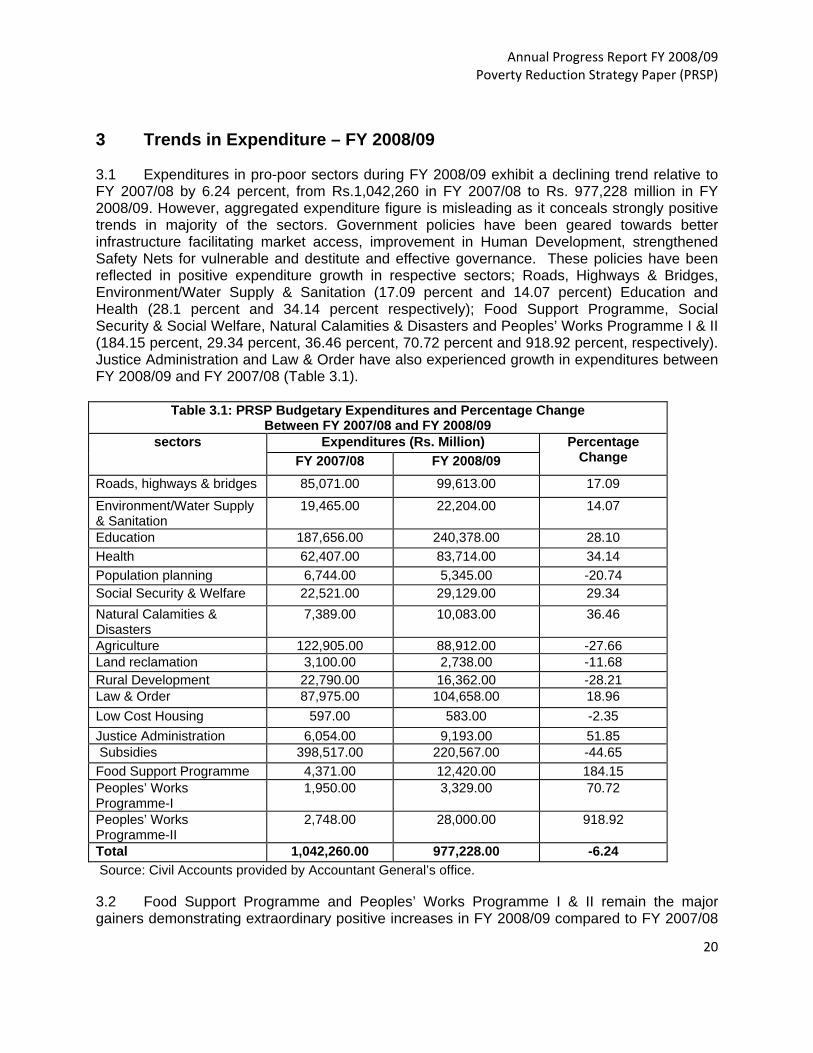
3 Trends in Expenditure – FY 2008/09 3.1 Expenditures in pro-poor sectors during FY 2008/09 exhibit a declining trend relative to FY 2007/08 by 6.24 percent, from Rs.1,042,260 in FY 2007/08 to Rs. 977,228 million in FY 2008/09. However, aggregated expenditure figure is misleading as it conceals strongly positive trends in majority of the sectors. Government policies have been geared towards better infrastructure facilitating market access, improvement in Human Development, strengthened Safety Nets for vulnerable and destitute and effective governance. These policies have been reflected in positive expenditure growth in respective sectors; Roads, Highways & Bridges, Environment/Water Supply & Sanitation (17.09 percent and 14.07 percent) Education and Health (28.1 percent and 34.14 percent respectively); Food Support Programme, Social Security & Social Welfare, Natural Calamities & Disasters and Peoples’ Works Programme I & II (184.15 percent, 29.34 percent, 36.46 percent, 70.72 percent and 918.92 percent, respectively). Justice Administration and Law & Order have also experienced growth in expenditures between FY 2008/09 and FY 2007/08 (Table 3.1).
Table 3.1: PRSP Budgetary Expenditures and Percentage Change Between FY 2007/08 and FY 2008/09
sectors Expenditures (Rs. Million) Percentage Change FY 2007/08 FY 2008/09
Roads, highways & bridges 85,071.00 99,613.00 17.09
Environment/Water Supply & Sanitation
19,465.00 22,204.00 14.07
Education 187,656.00 240,378.00 28.10 Health 62,407.00 83,714.00 34.14 Population planning 6,744.00 5,345.00 -20.74 Social Security & Welfare 22,521.00 29,129.00 29.34 Natural Calamities & Disasters
7,389.00 10,083.00 36.46
Agriculture 122,905.00 88,912.00 -27.66 Land reclamation 3,100.00 2,738.00 -11.68 Rural Development 22,790.00 16,362.00 -28.21 Law & Order 87,975.00 104,658.00 18.96 Low Cost Housing 597.00 583.00 -2.35 Justice Administration 6,054.00 9,193.00 51.85 Subsidies 398,517.00 220,567.00 -44.65 Food Support Programme 4,371.00 12,420.00 184.15 Peoples’ Works Programme-I
1,950.00 3,329.00 70.72
Peoples’ Works Programme-II
2,748.00 28,000.00 918.92
Total 1,042,260.00 977,228.00 -6.24 Source: Civil Accounts provided by Accountant General’s office. 3.2 Food Support Programme and Peoples’ Works Programme I & II remain the major gainers demonstrating extraordinary positive increases in FY 2008/09 compared to FY 2007/08

Annual Progress Report FY 2008/09 Poverty Reduction Strategy Paper (PRSP)
21
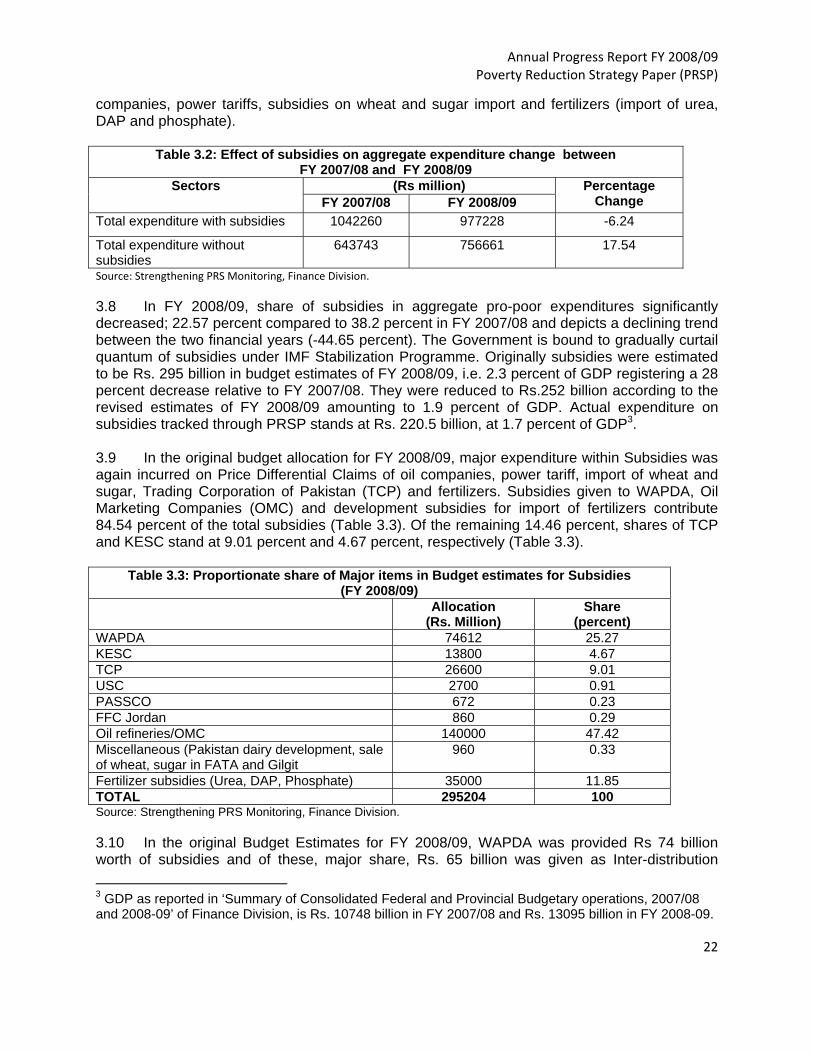
followed by Justice Administration. Peoples’ Works Programme mostly includes schemes in rural electrification, gas supply, roads infrastructure and water supply and is in addition to the pro-poor sectors, Roads, Highways & Bridges, Agriculture, etc., which incorporate infrastructure expenditures and appear with substantial increasing trends. Peoples’ Works Programme is only at federal level while Roads, Highways & Bridges covers all four provinces and federation. 3.3 Particularly important are substantial increases in Education, Health, Environment/Water Supply & Sanitation and Safety Nets i.e. Food Support Programme and Social Security & Welfare which also includes Benazir Income Support Programme. Major part of FY 2008/09 has been a difficult year dealing with volatile and inflationary food prices coupled with wheat shortage crisis. Externally there has been no sign of global economic recovery reflected in poor exports’ volume while internally our manufacturing sector remains crippled by power outages resulting in highly negative growth. Overall, economic growth remained abysmal with potential to hit the poorer sections of society harder. However, positive policy response of the government is evident in direct income transfers to the poor, provision of basic health services and greater access to education services reflected in higher expenditure outlays in all three sectors. 3.4 Although majority of pro-poor sectors register positive growth, aggregate expenditures register negative trend, weighed down by highly negative trends in five sectors; Population Planning, Agriculture, Rural Development, Low Cost Housing and Subsidies. Three allied sectors; Agriculture, Rural Development, Land Reclamation, experienced significant decline in FY 2008/09 (-27.66 percent, -28.21 percent and -11.68 percent respectively). Combined with substantial reduction in Subsidies (-44.65 percent), these four sectors have caused negative trend in overall PRSP expenditures. Subsidies will be examined in a separate sub section 3.1.1 that follows. 3.5 Collective share of three allied sectors, Agriculture, Land Reclamation and Rural development, stands at an impressive 11.05 percent of the total pro-poor expenditure in FY 2008/09 but it has declined compared to 14.3 percent in FY 2007/08. Combined together, these three sectors depict declining trend of 27.4 percent over the two financial years under examination (FY 2008/09 and FY 2007/08). In FY 2008/09, the only sector exhibiting redeeming positive growth was Agriculture (4.7 percent) which appears even more commendable when viewed in the context of decreasing trends in expenditure in Agriculture and its allied sectors. This indicates the great potential of our Agriculture sector which can get remarkable boost with positive investment in Rural Development and Land Reclamation. 3.1.1 Effect of Subsidies 3.6 Negative aggregate expenditure in FY 2008/09 is driven by drastic reduction in Subsidies provided in FY 2008/09 as compared to FY 2007/08. Pro-poor expenditures decline by 6.24 percent when subsidies are included but turn significantly positive when subsidies are excluded from the list of pro-poor sectors (Table 3.2). In FY 2007/08, Subsidy expenditure was budgeted at Rs.114 billion or 1.1 percent of GDP but it increased to Rs. 407 billion according to revised estimates of FY 2007/08 and estimated at 3.9 percent of GDP (Budget in brief FY 2007/08). 3.7 Actual expenditure on subsidies in FY 2007/08 amounted to Rs. 399 billion and is 3.04 percent of GDP. The phenomenal increase in subsidies during FY 2007/08 owes to fuel and food price shocks. Bulk of subsidies were given as Price Differential Claims (PDC) of oil
Annual Progress Report FY 2008/09 Poverty Reduction Strategy Paper (PRSP)
22
companies, power tariffs, subsidies on wheat and sugar import and fertilizers (import of urea, DAP and phosphate).
Table 3.2: Effect of subsidies on aggregate expenditure change between FY 2007/08 and FY 2008/09
Sectors (Rs million) Percentage Change FY 2007/08 FY 2008/09
Total expenditure with subsidies 1042260 977228 -6.24
Total expenditure without subsidies
643743 756661 17.54
Source: Strengthening PRS Monitoring, Finance Division. 3.8 In FY 2008/09, share of subsidies in aggregate pro-poor expenditures significantly decreased; 22.57 percent compared to 38.2 percent in FY 2007/08 and depicts a declining trend between the two financial years (-44.65 percent). The Government is bound to gradually curtail quantum of subsidies under IMF Stabilization Programme. Originally subsidies were estimated to be Rs. 295 billion in budget estimates of FY 2008/09, i.e. 2.3 percent of GDP registering a 28 percent decrease relative to FY 2007/08. They were reduced to Rs.252 billion according to the revised estimates of FY 2008/09 amounting to 1.9 percent of GDP. Actual expenditure on subsidies tracked through PRSP stands at Rs. 220.5 billion, at 1.7 percent of GDP3. 3.9 In the original budget allocation for FY 2008/09, major expenditure within Subsidies was again incurred on Price Differential Claims of oil companies, power tariff, import of wheat and sugar, Trading Corporation of Pakistan (TCP) and fertilizers. Subsidies given to WAPDA, Oil Marketing Companies (OMC) and development subsidies for import of fertilizers contribute 84.54 percent of the total subsidies (Table 3.3). Of the remaining 14.46 percent, shares of TCP and KESC stand at 9.01 percent and 4.67 percent, respectively (Table 3.3).
Table 3.3: Proportionate share of Major items in Budget estimates for Subsidies (FY 2008/09)
Allocation (Rs. Million)
Share (percent)
WAPDA 74612 25.27 KESC 13800 4.67 TCP 26600 9.01 USC 2700 0.91 PASSCO 672 0.23 FFC Jordan 860 0.29 Oil refineries/OMC 140000 47.42 Miscellaneous (Pakistan dairy development, sale of wheat, sugar in FATA and Gilgit
960 0.33
Fertilizer subsidies (Urea, DAP, Phosphate) 35000 11.85 TOTAL 295204 100 Source: Strengthening PRS Monitoring, Finance Division. 3.10 In the original Budget Estimates for FY 2008/09, WAPDA was provided Rs 74 billion worth of subsidies and of these, major share, Rs. 65 billion was given as Inter-distribution 3 GDP as reported in ‘Summary of Consolidated Federal and Provincial Budgetary operations, 2007/08 and 2008-09’ of Finance Division, is Rs. 10748 billion in FY 2007/08 and Rs. 13095 billion in FY 2008-09.

Annual Progress Report FY 2008/09 Poverty Reduction Strategy Paper (PRSP)
23
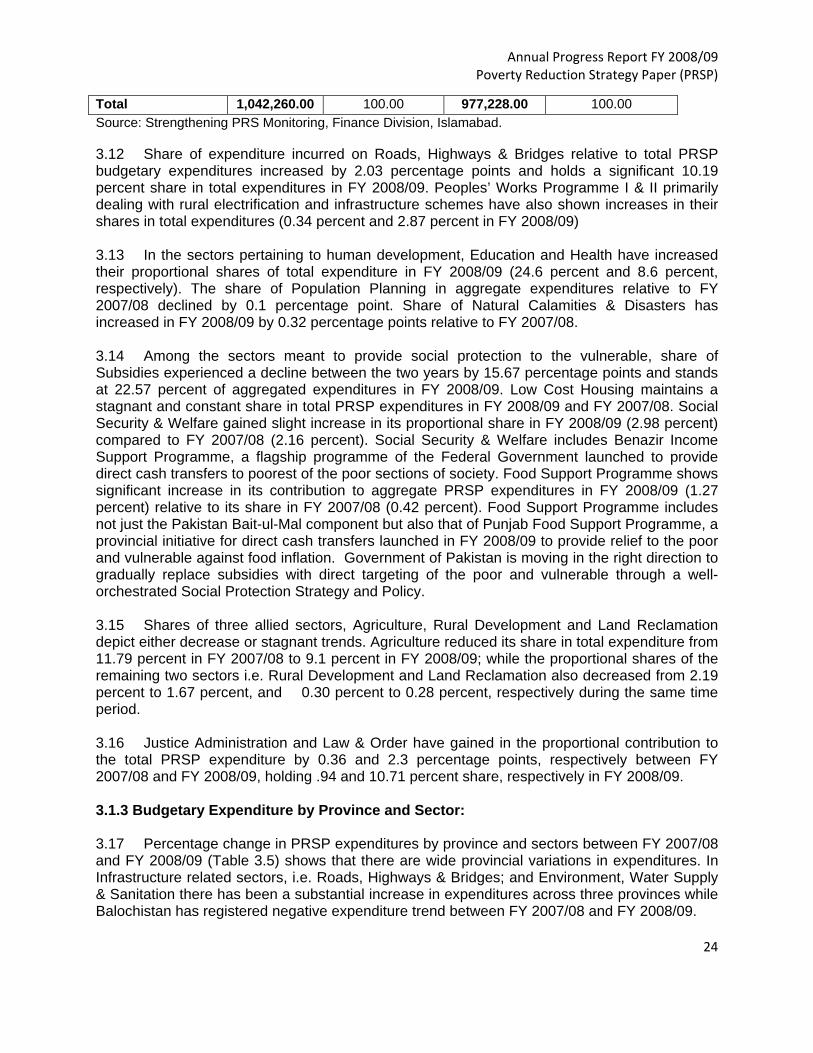
Companies’ Tariff Differential. Subsidy given to WAPDA in FY 2008/09 is less than that in FY 2007/08 (Rs.113 billion) in accordance with the policy of the Government to reduce subsidies on petroleum products and power tariffs. Allocation of subsidy to KESC was reduced to Rs. 13.8 billion in FY 2008/09 from Rs.19 billion in FY 2007/8, due to a projected reduced tariff differential payment in FY 2008/09. To control inflation, subsidy of Rs. 26.6 billion was allocated to Trading Corporation of Pakistan (TCP) of which Rs. 6.3 billion was earmarked for sugar imports in FY 2008/09. Oil and Refineries, OMCs were allocated Rs140 billion in FY 2008/09, less than the amount allocated in FY 2007/08 i.e. Rs 175 billion. 3.1.2 Proportional Contribution of Sub Sectoral Expenditures 3.11 Proportional shares of PRSP sectors in Budgetary expenditures in FY 2007/08 and FY2008/09 (Table 3.4) depict significant shifts between the two years. In FY 2007/08, Subsidies held highest share (38.24 percent) of the total expenditure followed by Education holding 18 percent of total PRSP outlays. In FY 2008/09, share of Subsidies declined considerably (22.57 percent) while share of Education in aggregate PRSP expenditures increased by 6.6 percentage points and stood at 24.60 percent of the total pro-poor expenditures.
Table 3.4: Comparison of Proportional Contribution of PRSP Sectors in Budgetary Expenditures between FY 2007/08 and FY 2008/09
Sectors FY 2007/08 FY 2008/09 Expenditure
s Rs. million
Proportion/ percent of total
expenditure (percent)
Expenditures (Rs. million)
Proportion/ percent of total
expenditure
Roads, highways & bridges
85,071.00 8.16 99,613.00 10.19
Environment/Water Supply & Sanitation
19,465.00 1.87 22,204.00 2.27
Education 187,656.00 18.00 240,378.00 24.60 Health 62,407.00 5.99 83,714.00 8.57 Population planning 6,744.00 0.65 5,345.00 0.55 Social Security & Welfare
22,521.00 2.16 29,129.00 2.98
Natural Calamities & Disasters
7,389.00 0.71 10,083.00 1.03
Agriculture 122,905.00 11.79 88,912.00 9.10 Land Reclamation 3,100.00 0.30 2,738.00 0.28 Rural Development 22,790.00 2.19 16,362.00 1.67 Law & Order 87,975.00 8.44 104,658.00 10.71 Low Cost Housing 597.00 0.06 583.00 0.06 Justice Administration
6,054.00 0.58 9,193.00 0.94
Subsidies 398,517.00 38.24 220,567.00 22.57 Food Support Programme
4,371.00 0.42 12,420.00 1.27
Peoples’ Works Programme-I
1,950.00 0.19 3,329.00 0.34
Peoples’ Works Programme-II
2,748.00 0.26 28,000.00 2.87
Annual Progress Report FY 2008/09 Poverty Reduction Strategy Paper (PRSP)
24
Total 1,042,260.00 100.00 977,228.00 100.00 Source: Strengthening PRS Monitoring, Finance Division, Islamabad. 3.12 Share of expenditure incurred on Roads, Highways & Bridges relative to total PRSP budgetary expenditures increased by 2.03 percentage points and holds a significant 10.19 percent share in total expenditures in FY 2008/09. Peoples’ Works Programme I & II primarily dealing with rural electrification and infrastructure schemes have also shown increases in their shares in total expenditures (0.34 percent and 2.87 percent in FY 2008/09) 3.13 In the sectors pertaining to human development, Education and Health have increased their proportional shares of total expenditure in FY 2008/09 (24.6 percent and 8.6 percent, respectively). The share of Population Planning in aggregate expenditures relative to FY 2007/08 declined by 0.1 percentage point. Share of Natural Calamities & Disasters has increased in FY 2008/09 by 0.32 percentage points relative to FY 2007/08. 3.14 Among the sectors meant to provide social protection to the vulnerable, share of Subsidies experienced a decline between the two years by 15.67 percentage points and stands at 22.57 percent of aggregated expenditures in FY 2008/09. Low Cost Housing maintains a stagnant and constant share in total PRSP expenditures in FY 2008/09 and FY 2007/08. Social Security & Welfare gained slight increase in its proportional share in FY 2008/09 (2.98 percent) compared to FY 2007/08 (2.16 percent). Social Security & Welfare includes Benazir Income Support Programme, a flagship programme of the Federal Government launched to provide direct cash transfers to poorest of the poor sections of society. Food Support Programme shows significant increase in its contribution to aggregate PRSP expenditures in FY 2008/09 (1.27 percent) relative to its share in FY 2007/08 (0.42 percent). Food Support Programme includes not just the Pakistan Bait-ul-Mal component but also that of Punjab Food Support Programme, a provincial initiative for direct cash transfers launched in FY 2008/09 to provide relief to the poor and vulnerable against food inflation. Government of Pakistan is moving in the right direction to gradually replace subsidies with direct targeting of the poor and vulnerable through a well-orchestrated Social Protection Strategy and Policy. 3.15 Shares of three allied sectors, Agriculture, Rural Development and Land Reclamation depict either decrease or stagnant trends. Agriculture reduced its share in total expenditure from 11.79 percent in FY 2007/08 to 9.1 percent in FY 2008/09; while the proportional shares of the remaining two sectors i.e. Rural Development and Land Reclamation also decreased from 2.19 percent to 1.67 percent, and 0.30 percent to 0.28 percent, respectively during the same time period. 3.16 Justice Administration and Law & Order have gained in the proportional contribution to the total PRSP expenditure by 0.36 and 2.3 percentage points, respectively between FY 2007/08 and FY 2008/09, holding .94 and 10.71 percent share, respectively in FY 2008/09. 3.1.3 Budgetary Expenditure by Province and Sector: 3.17 Percentage change in PRSP expenditures by province and sectors between FY 2007/08 and FY 2008/09 (Table 3.5) shows that there are wide provincial variations in expenditures. In Infrastructure related sectors, i.e. Roads, Highways & Bridges; and Environment, Water Supply & Sanitation there has been a substantial increase in expenditures across three provinces while Balochistan has registered negative expenditure trend between FY 2007/08 and FY 2008/09.
Annual Progress Report FY 2008/09 Poverty Reduction Strategy Paper (PRSP)
25
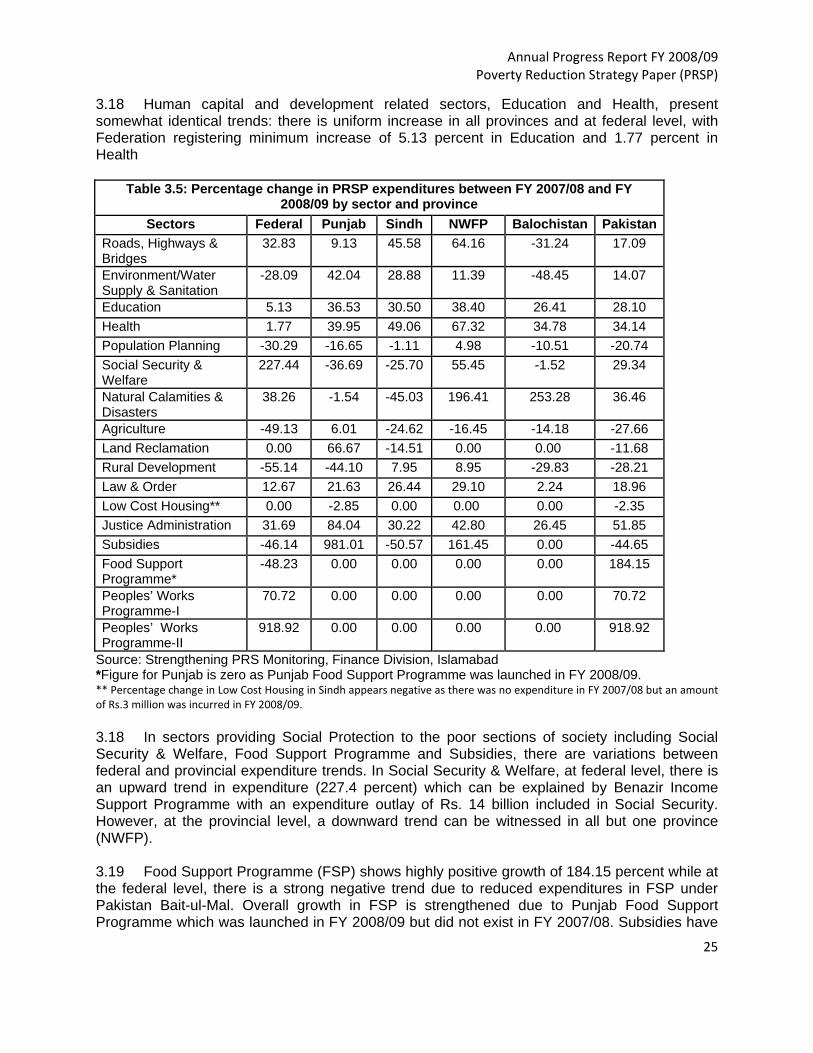
3.18 Human capital and development related sectors, Education and Health, present somewhat identical trends: there is uniform increase in all provinces and at federal level, with Federation registering minimum increase of 5.13 percent in Education and 1.77 percent in Health
Table 3.5: Percentage change in PRSP expenditures between FY 2007/08 and FY 2008/09 by sector and province
Sectors Federal Punjab Sindh NWFP Balochistan PakistanRoads, Highways & Bridges
32.83 9.13 45.58 64.16 -31.24 17.09
Environment/Water Supply & Sanitation
-28.09 42.04 28.88 11.39 -48.45 14.07
Education 5.13 36.53 30.50 38.40 26.41 28.10 Health 1.77 39.95 49.06 67.32 34.78 34.14 Population Planning -30.29 -16.65 -1.11 4.98 -10.51 -20.74 Social Security & Welfare
227.44 -36.69 -25.70 55.45 -1.52 29.34
Natural Calamities & Disasters
38.26 -1.54 -45.03 196.41 253.28 36.46
Agriculture -49.13 6.01 -24.62 -16.45 -14.18 -27.66 Land Reclamation 0.00 66.67 -14.51 0.00 0.00 -11.68 Rural Development -55.14 -44.10 7.95 8.95 -29.83 -28.21 Law & Order 12.67 21.63 26.44 29.10 2.24 18.96 Low Cost Housing** 0.00 -2.85 0.00 0.00 0.00 -2.35 Justice Administration 31.69 84.04 30.22 42.80 26.45 51.85 Subsidies -46.14 981.01 -50.57 161.45 0.00 -44.65 Food Support Programme*
-48.23 0.00 0.00 0.00 0.00 184.15
Peoples’ Works Programme-I
70.72 0.00 0.00 0.00 0.00 70.72
Peoples’ Works Programme-II
918.92 0.00 0.00 0.00 0.00 918.92
Source: Strengthening PRS Monitoring, Finance Division, Islamabad *Figure for Punjab is zero as Punjab Food Support Programme was launched in FY 2008/09. ** Percentage change in Low Cost Housing in Sindh appears negative as there was no expenditure in FY 2007/08 but an amount of Rs.3 million was incurred in FY 2008/09. 3.18 In sectors providing Social Protection to the poor sections of society including Social Security & Welfare, Food Support Programme and Subsidies, there are variations between federal and provincial expenditure trends. In Social Security & Welfare, at federal level, there is an upward trend in expenditure (227.4 percent) which can be explained by Benazir Income Support Programme with an expenditure outlay of Rs. 14 billion included in Social Security. However, at the provincial level, a downward trend can be witnessed in all but one province (NWFP). 3.19 Food Support Programme (FSP) shows highly positive growth of 184.15 percent while at the federal level, there is a strong negative trend due to reduced expenditures in FSP under Pakistan Bait-ul-Mal. Overall growth in FSP is strengthened due to Punjab Food Support Programme which was launched in FY 2008/09 but did not exist in FY 2007/08. Subsidies have
Annual Progress Report FY 2008/09 Poverty Reduction Strategy Paper (PRSP)
26
been discussed in detail in an earlier section. At the provincial level, Subsidies are on an increasing trend in Punjab and NWFP, with negative trends in Sindh. Punjab has started ‘Sasti Roti’ (affordable bread) Programme in FY 2008/09 to provide subsidized ‘roti’ at designated 14,226 enlisted tandoors (ovens). Healthy growth in Subsidies in Punjab during FY 2008/09 is mainly attributed to this scheme. 3.20 Natural Calamities & Disasters witnessed strong growth at the federal level and in NWFP and Balochistan. Balochistan was hit by an earthquake in December 2008 while NWFP is experiencing extraordinary circumstances due to military operations launched in militancy hit tribal areas. NWFP and the Federal Government have to deal with the phenomenon of Internally Displaced People (IDPs) to provide relief, shelter and food to an enormous number of refugees. These factors have contributed to increase spending in this sector during FY 2008/09. 3.21 Sectors dealing with rule of Law and Governance have shown consistent and uniform increases in all provinces and at federal level. Increase in expenditure on Law & Order is due to the upsurge in terrorist and security threats necessitating greater expenditure outlays on security forces. 3.22 Agriculture shows negative expenditure at federal level and in all provinces except Punjab. Remaining two allied sectors, Land Reclamation and Rural Development are also depicting predominantly negative trends. In Land Reclamation, there has been hardly any expenditure at federal level and in all provinces. Only Punjab has shown an increase in its spending on this sector between FY 2007/08 and FY 2008/09. 3.2 Budget Allocations for FY 2008/09: 3.2.1 Sectoral Shares in total PRSP Budgetary Allocation4: 3.23 Current section deals with analysis of expenditure relative to budgetary allocations and its utilization. Overall budget allocated for pro-poor sectors in FY 2008/09 was Rs. 1,097,630 million. Shares of different sectors in total budgetary allocation are given in Table 3.6 and show that Education and Subsidies hold maximum shares in total allocations meant for pro-poor sectors. Combined, budgetary allocations to these two sectors account for more than 50 percent of the total pro-poor budget (53.2 percent). 3.24 Overall, sectoral distribution of budget in total budgetary allocations for pro-poor sectors, FY 2008/09 exhibits that Education, Subsidies and Agriculture hold major shares of 25.11 percent, 28.07 percent and 12.57 percent, respectively. Of the remaining sectors, Roads Highways & Bridges and Health hold equivalent shares of above 7 percent of the total budget while shares of Social Security & Welfare and Law & Order are 4.84 percent and 5.91 percent, respectively. Shares of all other sectors excluding PWP II are less than 2 percent of the total allocated budget to pro-poor sectors. 4 Sub sections 3.2.1 and 3.2.2 have been repeated from PRSP Report for Q3 FY 2008‐09 since original approved budgetary allocations have not changed and the same were relied for analysis of sectoral shares in total PRSP Budgetary allocations in both reports; Q3 and Annual Report FY 2008‐09.

Annual Progress Report FY 2008/09 Poverty Reduction Strategy Paper (PRSP)
27
3.25 Somewhat higher shares of Law & Order can be explained by increasing security concerns caused by terrorist threats. Social Security & Welfare includes Benazir Income Support Programme component in Federal Budget allocations affecting the overall share of Social Security & Welfare.
Table 3.6: PRSP Budgetary allocations for FY 2008/09
Budget allocations (Rs. Million)
Sectoral shares in Budget allocations (percent)
2008/09 2008/09 Roads, Highways & Bridges 77,075 7.02
Environment/Water Supply & Sanitation
14,808 1.35
Education 275,601 25.11 Health 77,375 7.05 Population Planning 6,851 0.62 Social security & welfare 53,117 4.84 Natural Calamities & Disasters 4,369 0.40 Agriculture 138,011 12.57 Land Reclamation 3,606 0.33 Rural Development 16,033 1.46 Law & Order 64,826 5.91 Low Cost Housing 1,827 0.17 Justice Administration 8,510 0.78 Subsidies 308199 28.07 Food support Programme 19000 1.73 Peoples’ Works Programme I 4,420 0.40 Peoples’ Works Programme II 24,000 2.19 TOTAL 1,097,630 100.00 Source: Finance Division 3.2.2 Budgetary allocations by Province and Sector:
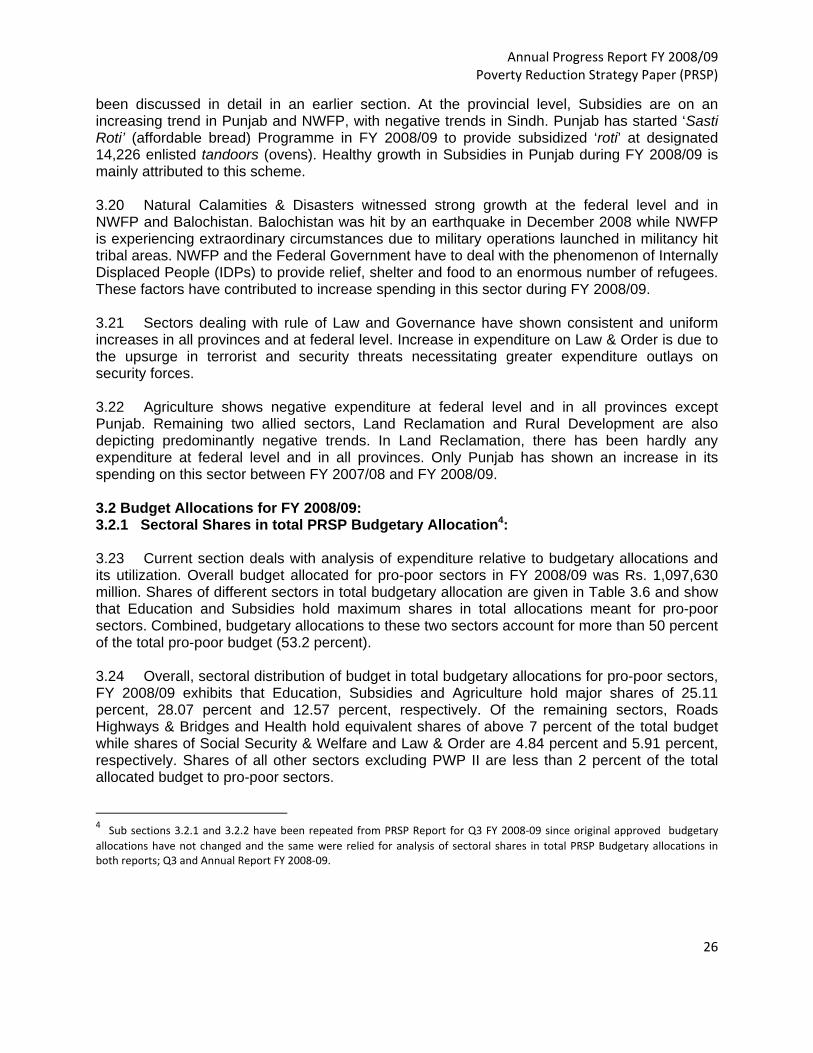
3.26 Allocations for specific sectors at federal and provincial level reflect different priorities of the Federation and Provinces. Education emerges as the most important priority with every province allocating up to 40 percent of its total budget to this sector in FY 2008/09. In Punjab however, share of Education in its total budget for PRSP sectors surpasses all other provinces (42.14 percent). Punjab and Balochistan give preference to Roads, Highways & Bridges by allocating second highest budget share. Sindh and NWFP aligns their priorities along different lines; Sindh allocating equivalent amount of budget to Agriculture (15.60percent) and Law & Order (15.06 percent) after Education while NWFP allocates 16.21 percent to Agriculture highest for any province. NWFP also allocates a sizeable amount of budget to Roads, Highways & Bridges (10.22 percent) though less than Punjab and Balochistan (Table 3.7). 3.27 In Rural Development, Law & Order, Subsidies, Social Security & Welfare, there is significant divergence among provinces and at the federal level with one of the provinces following a trend different from the rest. In Rural Development at provincial and federal level, allocations are less than 1 percent of respective budgets except Punjab allocating 3.16 percent while NWFP stands out by allocating 7.35 percent of total budget to Rural Development. In Law
Annual Progress Report FY 2008/09 Poverty Reduction Strategy Paper (PRSP)
28
& Order, there are significant allocations in all provinces ranging from 8.57 percent (NWFP) to a maximum of 15.06 percent (Sindh) while Punjab allocates only 2 percent of its pro-poor budgetary allocations. Nowhere is this inter-provincial variation more prominent than Subsidies with federal allocations of 51.38 percent, followed by a maximum of 7.9 percent (Balochistan) while in remaining provinces, allocations are less than 2 percent. Social Security & Welfare too, receives preferential allocations, only at the federal level (7.25 percent) and Sindh (6.89 percent) with remaining three provinces allocating negligible budgets, less than 1 percent of their total pro-poor budgets.
Table 3.7: Sectoral Shares in the Provincial and Federal Budgets (FY 2008/09) Federal Punjab Sindh NWFP Balochistan
Roads, Highways & Bridges 0.34 19.23 6.68 10.22 18.20 Environment/Water Supply & Sanitation
0.06 3.20 2.47 2.13 2.05
Education 11.71 42.14 37.28 36.99 38.95 Health 4.39 10.46 10.42 9.30 5.65 Population Planning 0.79 0.00 0.02 2.99 0.00 Social security & welfare 7.25 0.38 6.89 0.27 0.74 Natural Calamities & Disasters 0.44 0.43 0.16 0.51 0.08
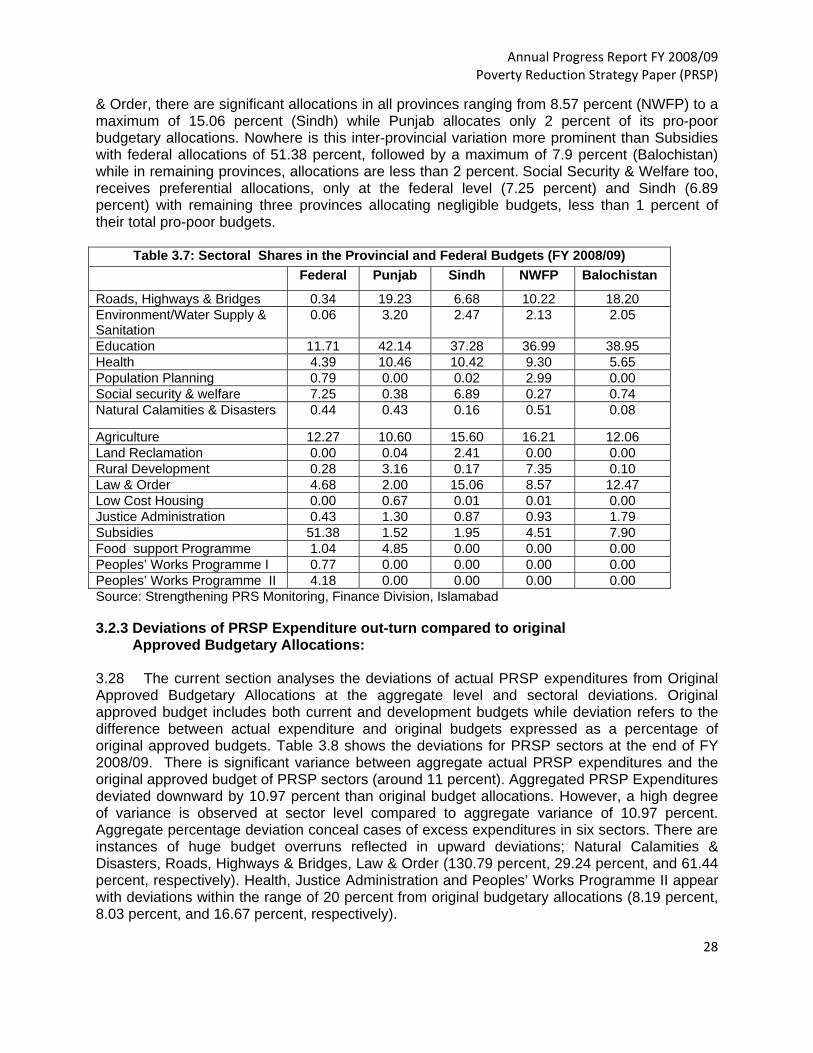
Agriculture 12.27 10.60 15.60 16.21 12.06 Land Reclamation 0.00 0.04 2.41 0.00 0.00 Rural Development 0.28 3.16 0.17 7.35 0.10 Law & Order 4.68 2.00 15.06 8.57 12.47 Low Cost Housing 0.00 0.67 0.01 0.01 0.00 Justice Administration 0.43 1.30 0.87 0.93 1.79 Subsidies 51.38 1.52 1.95 4.51 7.90 Food support Programme 1.04 4.85 0.00 0.00 0.00 Peoples’ Works Programme I 0.77 0.00 0.00 0.00 0.00 Peoples’ Works Programme II 4.18 0.00 0.00 0.00 0.00 Source: Strengthening PRS Monitoring, Finance Division, Islamabad 3.2.3 Deviations of PRSP Expenditure out-turn compared to original Approved Budgetary Allocations: 3.28 The current section analyses the deviations of actual PRSP expenditures from Original Approved Budgetary Allocations at the aggregate level and sectoral deviations. Original approved budget includes both current and development budgets while deviation refers to the difference between actual expenditure and original budgets expressed as a percentage of original approved budgets. Table 3.8 shows the deviations for PRSP sectors at the end of FY 2008/09. There is significant variance between aggregate actual PRSP expenditures and the original approved budget of PRSP sectors (around 11 percent). Aggregated PRSP Expenditures deviated downward by 10.97 percent than original budget allocations. However, a high degree of variance is observed at sector level compared to aggregate variance of 10.97 percent. Aggregate percentage deviation conceal cases of excess expenditures in six sectors. There are instances of huge budget overruns reflected in upward deviations; Natural Calamities & Disasters, Roads, Highways & Bridges, Law & Order (130.79 percent, 29.24 percent, and 61.44 percent, respectively). Health, Justice Administration and Peoples’ Works Programme II appear with deviations within the range of 20 percent from original budgetary allocations (8.19 percent, 8.03 percent, and 16.67 percent, respectively).
Annual Progress Report FY 2008/09 Poverty Reduction Strategy Paper (PRSP)
29
Table 3.8: Deviations of Budgeted and Actual PRSP Expenditures
FY 2008/09 Sectors Budgeted Actual Deviation
(percent) Roads, highways & bridges 77,075 99,613.00 (29.24) Environment/Water Supply & Sanitation*
14,808 22,204.00 (49.95)
Education 275,601 240,378.00 12.78 Health 77,375 83,714.00 (8.19) Population planning 6,851 5,345.00 21.98 Social security & welfare 53,117 29,129.00 45.16 Natural Calamities & Disasters 4,369 10,083.00 (130.79) Agriculture 138,011 88,912.00 35.58 Land reclamation 3,606 2,738.00 24.07 Rural Development 16,033 16,362.00 (2.05)
Law & Order 64,826 104,658.00 (61.44)
Low Cost Housing 1,827 583 68.09 Justice Administration 8,510 9,193.00 (8.03) Subsidies 308,199 220,599.00 28.42 Food Support Programme 19,000 12,420.00 34.63 Peoples’ Works Programme-I 4,420 3,329.00 24.68 Peoples’ Works Programme-II 24,000 28,000.00 (16.67)
TOTAL 1,097,630 977,228.00 10.97
Source: Strengthening PRS Monitoring, Finance Division, Islamabad Note: Figures in parenthesis represent upward deviations; actual expenditures incurred in excess of original budgetary allocations. *Budget allocations for Environment/Water Supply & Sanitation do not include the codes for Environment while expenditures include newly incorporated codes for Environment. Hence the comparison of deviation with other sectors is not accurate. 3.29 Abnormal excess spending in Natural Calamities & Disasters and Law & Order were largely caused by circumstances beyond the control of the Government. Balochistan Earthquake of 2008 and phenomenon of Internally Displaced People (IDP) in the wake of military offensive launched to establish rule of law in tribal areas necessitated rehabilitation and relief efforts on an extraordinary scale reflected in budget overruns in Natural Calamities & Disasters. To counter volatile security situation and militancy, higher than budgeted expenditure outlays in Law & Order ensued. 3.30 Remaining sectors depict underutilization of original budgetary allocations reflected in downward deviations of more than 20 percent relative to approved budgets; Population Planning, Agriculture, Social Security & Welfare, Land Reclamation, Low Cost Housing, Subsidies and Peoples’ Works’ Programme I. Deviation of expenditure in Education compared to approved budgetary allocation is less than 15 percent.

Annual Progress Report FY 2008/09 Poverty Reduction Strategy Paper (PRSP)
30
3.31 Food Support Programme experienced reduced spending due to poor utilization of budgeted allocation of Food Support Programme of PBM. Against an estimated amount of Rs. 6.6 billion for Pakistan Bait-ul-Mal (Rs. 6 billion for FSP), an actual expenditure of Rs.2.2 billion incurred causing downward deviation of 34.63 percent in this sector. Punjab Food Support Programme has achieved satisfactory utilization of more than 70 percent of total allocated Budget for this Programme. Social Security & Welfare shows underutilization reflected in downward deviation, to the extent of 45.16 percent relative to original approved budget. Major reason was lower than target disbursements in Benazir Income Support Programme (BISP) for FY2008/09. Initially Rs.34 billion was earmarked for BISP but actual disbursements amounted to Rs.14 billion in FY 2008/09. This was the first year of BISP launch and due to initial problems in identification of poor, outreach and delivery of disbursements all over Pakistan, budgeted target could not be reached. BISP is a step in the direction of strengthening safety nets and the Government is engaged with World Bank to devise an efficient mechanism of effective targeting of the poor through Poverty Scorecard with universal coverage of the population. 3.32 The gap between original approved budgets and actual expenditure outlays in majority of PRSP sectors with downward deviations can be attributed to increasing fiscal
Source: United Nations High Commission for Refugees (UNHCR) and economic pressures in FY 2008/09. Volatile security environment, unforeseen situation caused by influx of IDPs, slow down of manufacturing activity by power outages and security
Internally Displaced People
In August 2008, the Government of Pakistan (GoP) began operations against militants in the Bajaur Agency, (FATA) sparking the first wave of the displacement in the north-west. This was followed by operations in Mohmand agency, also in the tribal areas, leading to further outflows of people. As reported by UNHCR, at the end of April 2009, there were 93,627 people residing in 11 camps in NWFP and the larger majority of 462,912 people (77,529 families) living in host communities with extended family or renting rooms. In late April/early May 2009, confrontations between government forces and militants escalated on several fronts including Lower Dir, Buner and Swat. They joined those who had fled earlier and more than 2.5 million people (or 383,192 families) were verified as registered IDPs by late August.
Displacement of people on a large scale resulted in losing economic returns from their livelihood sources and added to the costs that the Government had to bear in providing relief and shelter. UNCHR has come forward and has been leading the coordination of three clusters in the humanitarian response under the Inter-Agency Standing Committee (IASC) ‘global cluster approach’: 1) Camp Coordination and Camp Management (CCCM), 2) Emergency Shelter Cluster and 3) Protection, including registration, attention to the needs of women, children and the vulnerable groups as well as establishment of monitoring and referral mechanisms.
The revised Pakistan Humanitarian Response Plan (PHRP) launched by UNHCR in May 2009 appealed for a total of US$445 million, with UNHCR’s component comprising some US$105 million. However, UNHCR has since revised its needs to US$141 million due to a higher number of beneficiaries than previously anticipated (2.5 million rather than 1.5 million), and further operations in Waziristan

Annual Progress Report FY 2008/09 Poverty Reduction Strategy Paper (PRSP)
31
threats, affected the revenue collection and resulted in achieving lesser than targeted tax to GDP ratio. To maintain 4.3 percent fiscal deficit target set for FY 2008/09, under obligation of IMF Stabilization Programme, the Government had to substantially curtail subsidies, particularly oil and power tariff subsidies. In addition to the above mentioned factors contributing to lesser than budgeted expenditures, overoptimistic budgeting can also be a cause where budget estimation is conducted with inadequate capacity to spend. Subsequent section 3.2.4 analyses the deviations of Current and Development PRSP expenditures from Original Current and Development Budgetary allocations by province and sector while section 3.3 includes analysis of sectoral deviations in Current and Development Expenditure categories relative to Original respective budgetary allocations for FY 2008/09. 3.2.4 Deviations of actual Current and Development Expenditures from Original Budget Estimates: 3.33 Table 3.9 illustrates sector specific percentage deviation of Development and Current expenditures relative to approved budgetary estimates for FY 2008/09. Variance of expenditures relative to approved budgetary allocations is greater on the development side (16.18 percent) as compared to current expenditures (8.33 percent) representing lower utilization of allocated budgets in both categories. In accordance with the broader trends of excess expenditures in Natural Calamities & Disasters, Roads, Highways & Bridges, deviations reflecting excess expenditures relative to original budgetary allocations are observed in both current and development categories. Current expenditures in Health, Rural Development, Law & Order and Justice Administration deviated from original budget estimates and recorded upward trends.
Table 3.9: Deviations of Budgeted and Actual, Current and Development PRSP Expenditures
FY 2008/09 Sectors Development (Rs. Million) Current (Rs. Million)
Budget Actual Deviation (percent)
Budget Actual Deviation (percent)
Roads, highways & bridges
68,544.00 85,988.00 (25.45) 8,530.00 13,625.00 (59.73)
Environment/ Water Supply & Sanitation*
12,430.00 15,239.00 (22.60) 2,378.00 6,965.00 (192.89)
Education 75,146.00 42,655.00 43.24 200,454.00 197,723.00 1.36 Health 42,893.00 26,456.00 38.32 34,481.00 57,258.00 (66.06) Population planning
6,594.00 5,114.00 22.44 256.00 231.00 9.77
Social security & welfare
11,338.00 11,087.00 2.21 41,779.00 18,042.00 56.82
Natural Calamities & Disasters
5.00 2,304.00 (45980.00) 4,364.00 7,779.00 (78.25)
Agriculture 66,500.00 50,681.00 23.79 71,510.00 38,231.00 46.54 Land reclamation 0.00 0.00 3,605.00 2,738.00 24.05 Rural Development
15,455.00 15,235.00 1.42 576.00 1,127.00 (95.66)
Law & Order 3,495.00 1,371.00 60.77 61,331.00 103,287.00 (68.41)

Annual Progress Report FY 2008/09 Poverty Reduction Strategy Paper (PRSP)
32
Low Cost Housing 0.00 32.00 1,826.00 551.00 69.82 Justice Administration
2,142.00 362.00 83.10 6,367.00 8,831.00 (38.70)
Subsidies 35,070.00 20,599.00 41.26 279,129.00 199,968.00 28.36 Food Support Programme
0.00 0.00 0.00 19,000.00 12,420.00 34.63
Peoples’ Works Programme-I
4,420.00 3,329.00 24.68 0.00 0.00 0.00
Peoples’ Works Programme-II
24,000.00 28,000.00 (16.67) 0.00 0.00 0.00
TOTAL 368,036.00 308,452.00 16.18 729,594.00 668,776.00
8.33
Source: Strengthening PRS Monitoring, Finance Division, Islamabad. Note: Figures in parenthesis represent percent deviation denoting expenditures incurred above original approved budgetary allocations. 3.34 On the development side, a substantial downward deviation from approved budgetary allocations is witnessed in all sectors barring few, mentioned above. Deviations of development expenditure outlays from original budgetary allocations are as low as 1.42 percent (Rural Development) to as high as 83.10 percent (Justice Administration). Sector specific variances enormously exceed the aggregate variance of 16.18 percent and are much higher than 20 percent in all sectors with downward deviations except, Social Security & Welfare and Rural Development. Substantial downward deviations from approved budgetary estimates can be attributed partly to tight fiscal situation resulting in low releases of development budgets but also reflects poorly on the capacity to absorb and utilize the available resources efficiently.
3.3 Current and Development Budgetary Allocations and Expenditures:
3.35 Comparison of Current and Development expenditure (Table 3.10) illustrates a decrease
of 11.03 percent in current expenditure in FY 2008/09 relative to FY 2007/08 while development
expenditures have expanded by 6.6 percent in FY 2008/09. Decrease in current expenditure
corresponds to a substantial decrease in current expenditure for Subsidies. Current subsidies
register a whopping 48.58 percent decline while development expenditure in subsidies
increased by 115.2 percent in FY 2008/09 compared to FY 2007/08. It has been discussed in
section 3.1.3 that including or excluding subsidies entirely alters the percentage change in
aggregate PRSP expenditures. Similarly, if current subsidies are excluded from both financial
years under comparison, aggregate current expenditures present a hugely positive trend (29.07
percent). Aggregate development expenditure has been helped by development subsidies.
Nevertheless, development expenditures remain positive even in the absence of subsidies.
Table 3.10: Total Current and Development PRSP Expenditure
(FY 2007/08 – FY 2008/09) PRSP Expenditures (Rs Million)

Annual Progress Report FY 2008/09 Poverty Reduction Strategy Paper (PRSP)
33
Fiscal Year Current Development Total
FY 2007/08 751,716 290,544 1042260 FY 2008/09 668,776 308,452 977228
Percentage change -11.03 6.16 -6.24 Source: Civil Accounts provided by Accountant General’s office. 3.36 In FY 2008/09, original development budget allocations have been revised downward due to fiscal constraints (Table 3.11). In the approved Development budget, federal allocations amounted to Rs. 400 billion, while revised estimates were Rs.269 billion, a reduction of 32.75 percent. Share of provincial development budget allocations was not changed. There was further shortfall of Rs.40 billion resulting in downward revision to the extent of Rs.379 billion. Actual development expenditure for FY 2008/09 stands at Rs.397.5 billion with federal contribution of Rs.196 billion. Provinces have much higher aggregate actual development expenditure, i.e. Rs. 202 billion than the original projections of Rs. 150 billion (source Budget Wing, Finance Division).
Table 3.11: Development budget allocations between FY 2007/08 & FY 2008/09
2007/08 (Rs. billion)
2008/09 (Rs. billion)
(2008/09) (Rs. Billion)
Revised Federal 335 400 269
Provincial 150 150 150
TOTAL 520 550 419
Source: Budget Wing, Ministry of Finance. 3.37 Comparison of current and development expenditures between FY 2008/09 and FY 2007/08 illustrates (Table 3.12) substantial increases in current expenditure of all provinces, Punjab showing the highest increase of 39.84 percent while Balochistan the lowest of 23.08 percent. At the federal level, Current expenditures register a significant reduction of 38.02 percent between FY 2008/09 and FY 2008/09. The decrease in Current Expenditures at federal level owes to massive decline in the amount of current subsidies as Subsidies form 53.4 percent of aggregate expenditure at the federal level while Current subsidies contribute 19.7 percent of pro-poor expenditure in FY 2008/09. Table 3.12 : Percent change in Current and Development expenditure by
provinces
FY 2008/09 (Rs. million) FY 2007/08 (Rs. million) Percentage change
Current Development Current Development Current Development
Federal 285,822 112,287 461,179 104,046 -38.02 7.92
Punjab 212,404 90,031 151,892 87,928 39.84 2.39
Sindh 86,629 64,165 73,650 56,536 17.62 13.49
NWFP 56,552 27,999 42,759 19,498 32.26 43.60

Annual Progress Report FY 2008/09 Poverty Reduction Strategy Paper (PRSP)
34
Balochistan 27,369 13,970 22,236 22,536 23.08 -38.01
Source: Civil Accounts provided by Accountant General’s office. 3.38 Development Expenditures for all provinces have shown increases with substantial inter-provincial variations. NWFP and Sindh show the highest percentage change between FY 2008/09 and FY 2007/08 (43.6 percent & 13.49 percent, respectively) while Punjab shows an increase of 2.39 percent. Development expenditure in Balochistan shows a reduction of 38 percent in FY 2008/09 compared to FY 2007/08. 3.39 Sectoral rates of change in Current and Development expenditures between FY 2008/09 and FY 2007/08 (Table 3.13) show increases in Development expenditures of Roads, Highways & Bridges, Environment/Water Supply & Sanitation, Education, Health and Subsidies. Highest increase in Development expenditure is observed in Subsidies (115 percent) followed by Health, while development expenditure for remaining sectors register significant decreases. 3.40 Current expenditures of all sectors have shown increases except in the case of Subsidies, Land Reclamation and Population Planning. Highest increase in Current expenditure is observed in Social Security & Welfare (151.39 percent), Food Support Programme (184.15 percent) and Natural Calamities & Disasters (92.6 percent) due to inclusion of BISP in Social Security which started in FY 2008/09 and massive influx of IDPs by ongoing conflict in Northern areas of Pakistan. Remaining sectors have also shown enormous but variable increases; 56.47 percent in Justice Administration, 13.92 percent in Agriculture while Education, Health show increases in the range of up to 40 percent between the two financial years under examination.
Table 3.13: Percentage change in Current and Development Expenditure by sectors between FY2007/08 and FY 2008/09
Sectors Percentage change Total Current Development
Roads Highways and Bridges 17.09 21.11 16.48 Environment/Water Supply & Sanitation
14.07 29.75 8.10
Education 28.1 27.05 33.16 Health 34.14 28.21 49.06 Population Planning -20.74 -75.48 -11.86 Social Security and Welfare 29.34 149.68 -27.51 Natural Calamities and Disasters 36.46 92.60 -31.22
Agriculture -27.66 13.92 -43.28 Land Reclamation -11.68 -11.68 0.00 Rural Development -28.21 9.10 -29.98 Law & Order 18.96 9.10 -44.04 Low Cost Housing -2.35 27.84 -80.72 Justice Administration 51.85 56.47 -11.71 Subsidies -44.65 -48.59 115.25 Food Support Programme 184.15 184.15 0.00 Peoples’ Works Programme I 70.72 70.72 70.72

Annual Progress Report FY 2008/09 Poverty Reduction Strategy Paper (PRSP)
35
Peoples’ Works Programme II 918.92 918.92 918.92
Total -6.24 -11.03 6.16 Source: Strengthening PRS Monitoring, Finance Division, Islamabad. 3.4 PRSP Expenditures in Sub Sectors of Education and Health: 3.4.1 PRSP Expenditures in sub sectors of Education:
3.41 Education related expenditures in FY 2008/09 recorded an increase of 28.10 percent relative to FY 2007/08 with largest increase in ‘Others’ followed closely by Secondary and Primary Education (Table 3.14). There are considerable provincial variations in sub sectors of Education; Punjab achieving highest percentage increase in Secondary and Professional Education; in NWFP, two sub sectors of higher education, General university and Professional Education taking precedence over Primary and Secondary Education; Balochistan showing a similar trend with highest expenditure in University Education while ‘Others’ appear with negative trend. In Punjab, Balochistan and Sindh, expenditure in Teacher & Vocational Training depicts increase in FY 2008/09 compared to FY 2007/08. 3.42 At the Federal level, Primary Education and University Education register equally positive expenditure trends between FY 2008/09 and FY 2007/08 but growth in Primary Education is not as strong as in Provinces. Remaining three sub sectors at federal level, Professional Education, Teacher & Vocational Training and ‘Others’ depict significantly reduced expenditures in FY 2008/09 compared to FY 2007/08. 3.43 At aggregate level, expenditure in Education shows positive growth of 28.10 percent in FY 2008/09 compared to FY 2007/08. In all the provinces, expenditure on education expanded in the range of 25-39 percent while aggregate expenditure at federal level record positive trend of 5.13 percent over the two financial years under examination. Table 3.14: Percentage change in PRSP education expenditures between FY 2007/08 and
FY 2008/09 by province and sectors of education Federal Punjab Sindh NWFP Balochistan Pakista
n Primary Education 16.01 10.83 48.14 29.96 34.87 22.82 Secondary Education
11.33 44.58 37.66 33.97 39.25 37.62
University/College Education
12.34 23.08 144.55 87.42 40.90 26.46
Professional/Tech Universities
-13.23 49.19 32.05 52.81 27.17 14.00
Teacher & Vocational Training
-21.35 23.86 95.83 0.00 21.57 27.13
Others -17.34 104.97 77.96 58.30 -6.85 63.43 Total Percentage Change
5.13 36.53 30.50 38.40 26.41 28.10
Source: Strengthening PRS Monitoring, Finance Division, Islamabad.

Annual Progress Report FY 2008/09 Poverty Reduction Strategy Paper (PRSP)
36
3.44 Proportional contribution of sub sectors of Education to aggregate expenditure (Table 3.15) depicts that Primary and Secondary Education hold major shares in total Education related expenditures. Professional Education and Teacher & Vocational Training hold the least shares in FY 2008/09. Similar trends are witnessed in FY 2007/08 wherein highest proportional contribution is recorded by Primary and Secondary Education. 3.45 A uniform pattern emerges at the provincial level with Primary and Secondary Education contributing most to respective aggregate provincial educational expenditures. In University/College education, all provinces exhibit identical trend with a share of 8-10 percent while Professional Education presents variations. Among all four provinces, in only NWFP, Professional Education depicts highest share of 7.85 percent in FY 2008/09. Teacher & Vocational Training assumes the least contribution in all but two provinces i.e. Balochistan with 1.96 percent and Punjab with 2.93 percent of aggregate education expenditure.
Table 3.15 : Percentage distribution of education expenditures in FY 2008/09 and FY 2008/09 by province and sectors of education
Federal Punjab Sindh NWFP Balochistan Pakistan FY 2008/09
Primary Education
6.20 37.64 40.71 38.01 34.90 32.40
Secondary Education
8.52 24.21 29.24 38.88 31.64 24.68
University/College Education
63.92 8.21 11.97 8.06 9.63 19.30
Professional/Tech Universities
10.81 1.78 5.26 7.85 4.94 5.13
Teacher & Vocational Training
0.16 2.93 0.77 0.00 1.96 1.53
Others 10.39 25.23 12.05 7.20 16.93 16.96 Total 100.00 100.00 100.00 100.00 100.00 100
FY 2007/08 Primary Education 5.62 46.37 35.86 40.48 32.71 33.79 Secondary Education 8.04 22.86 27.72 40.16 28.72 22.97 University/College Education
59.81 9.11 6.39 7.11 8.64 19.55
Professional/Tech Universities
13.10 1.63 5.20 7.11 4.91 5.76
Teacher & Vocational Training
0.21 3.22 0.51 0.00 2.04 1.54
Others 13.22 16.81 8.83 6.29 22.97 13.29 Total 100 100 100 100 100 100 Source: Strengthening PRS Monitoring, Finance Division, Islamabad 3.4.2 PRSP Expenditures in sub-sectors of Health 3.46 Aggregate expenditures in Health experienced positive trends in FY 2008/09 with all the sub-sectors recording substantial growth. Largest increase is witnessed in ‘Others’ and ‘Mother & Child Health’ at the aggregate level (Table 3.16). However, at provincial level there
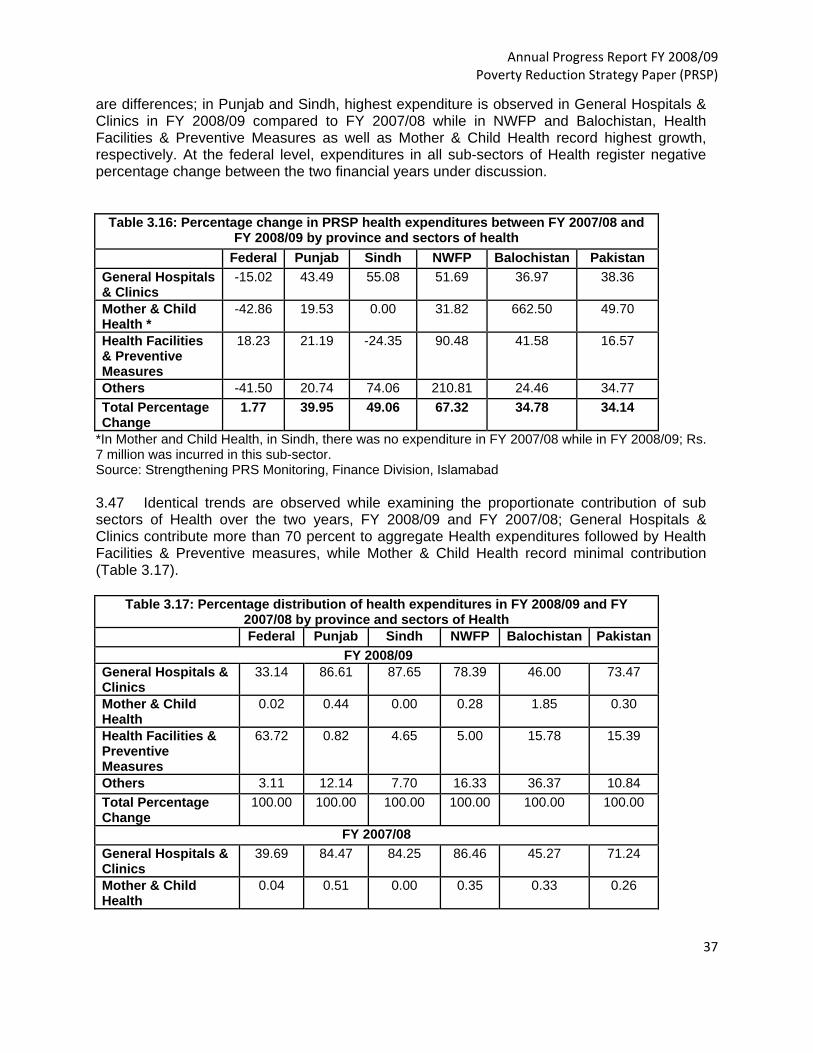
Annual Progress Report FY 2008/09 Poverty Reduction Strategy Paper (PRSP)
37
are differences; in Punjab and Sindh, highest expenditure is observed in General Hospitals & Clinics in FY 2008/09 compared to FY 2007/08 while in NWFP and Balochistan, Health Facilities & Preventive Measures as well as Mother & Child Health record highest growth, respectively. At the federal level, expenditures in all sub-sectors of Health register negative percentage change between the two financial years under discussion.
Table 3.16: Percentage change in PRSP health expenditures between FY 2007/08 and FY 2008/09 by province and sectors of health
Federal Punjab Sindh NWFP Balochistan Pakistan General Hospitals & Clinics
-15.02 43.49 55.08 51.69 36.97 38.36
Mother & Child Health *
-42.86 19.53 0.00 31.82 662.50 49.70
Health Facilities & Preventive Measures
18.23 21.19 -24.35 90.48 41.58 16.57
Others -41.50 20.74 74.06 210.81 24.46 34.77 Total Percentage Change
1.77 39.95 49.06 67.32 34.78 34.14
*In Mother and Child Health, in Sindh, there was no expenditure in FY 2007/08 while in FY 2008/09; Rs. 7 million was incurred in this sub-sector. Source: Strengthening PRS Monitoring, Finance Division, Islamabad 3.47 Identical trends are observed while examining the proportionate contribution of sub sectors of Health over the two years, FY 2008/09 and FY 2007/08; General Hospitals & Clinics contribute more than 70 percent to aggregate Health expenditures followed by Health Facilities & Preventive measures, while Mother & Child Health record minimal contribution (Table 3.17).
Table 3.17: Percentage distribution of health expenditures in FY 2008/09 and FY 2007/08 by province and sectors of Health
Federal Punjab Sindh NWFP Balochistan Pakistan FY 2008/09
General Hospitals & Clinics
33.14 86.61 87.65 78.39 46.00 73.47
Mother & Child Health
0.02 0.44 0.00 0.28 1.85 0.30
Health Facilities & Preventive Measures
63.72 0.82 4.65 5.00 15.78 15.39
Others 3.11 12.14 7.70 16.33 36.37 10.84 Total Percentage Change
100.00 100.00 100.00 100.00 100.00 100.00
FY 2007/08 General Hospitals & Clinics
39.69 84.47 84.25 86.46 45.27 71.24
Mother & Child Health
0.04 0.51 0.00 0.35 0.33 0.26

Annual Progress Report FY 2008/09 Poverty Reduction Strategy Paper (PRSP)
38
Health Facilities & Preventive Measures
54.85 0.94 9.16 4.40 15.02 17.71
Others 5.41 14.08 6.60 8.79 39.39 10.79 Total 100 100 100 100 100 100
Source: Strengthening PRS Monitoring, Finance Division, Islamabad 3.48 There is a uniform pattern in all provinces in that, General Hospitals & Clinics hold the maximum share while Mother & Child Health contribute the least to aggregate Health expenditures in respective provinces in FY 2008/09 and FY 2007/08. In FY 2008/09, a considerable divergence is observed in Health Facilities & Preventive Measures in three provinces, Sindh, NWFP and Balochistan; there is a significant proportional contribution by this sub-sector to aggregate health expenditure (4.65 percent, 5 percent and 15.78 percent, respectively). In Punjab, percentage share of Health Facilities & Preventive Measures in aggregate health expenditure of the province is nominal in both the financial years, FY 2008/09 and FY 2007/08. 3.49 At the federal level, trend is reversed with maximum expenditure contributed by Health Facilities & Preventive measures in FY 2008/09 and FY 2007/08. General Hospitals & Clinics hold second largest share in total Health expenditures at the federal level in both the financial years. These two sub-sectors contribute more than 90 percent to the aggregate Health expenditures while ‘Others’ contribute the remainder. 3.5 Actual PRSP budgetary expenditures for FY 2008/09 relative to PRSP II Projections: 3.50 Current section analyses the achievements or shortfalls in PRSP Expenditures as a percent of GDP viewed against the targets and projections in the PRSP II document as shown in Table 3.18. Sectors have been categorized according to the five groups formulated in PRSP-II; Market Access and Community Services, Human Development, Rural Development, Safety Nets and Governance. 3.51 Aggregate PRSP expenditures in FY 2008/09 at 7.5 percent of GDP surpass the target set in PRSP-II, which was 5.86 percent of GDP. Current and Development expenditures have also exceeded the projections made for FY 2008/09; Development expenditure is higher by 0.61 percent at 2.35 percent of GDP while Current expenditure is greater than the projections by 0.98 percent and stands at 5.1 percent of GDP.
Table 3.18: Actual PRSP Budgetary Expenditures FY 2008/09 relative to Projections in PRSP-II
PRSP Expenditures percent GDP (FY 2008/09) Actual Projected in PRSP II
Development 2.35 1.74 Current 5.1 4.12 Total 7.46 5.86
Market Access and Community Services Roads, Highways& Bridges 0.76 0.36
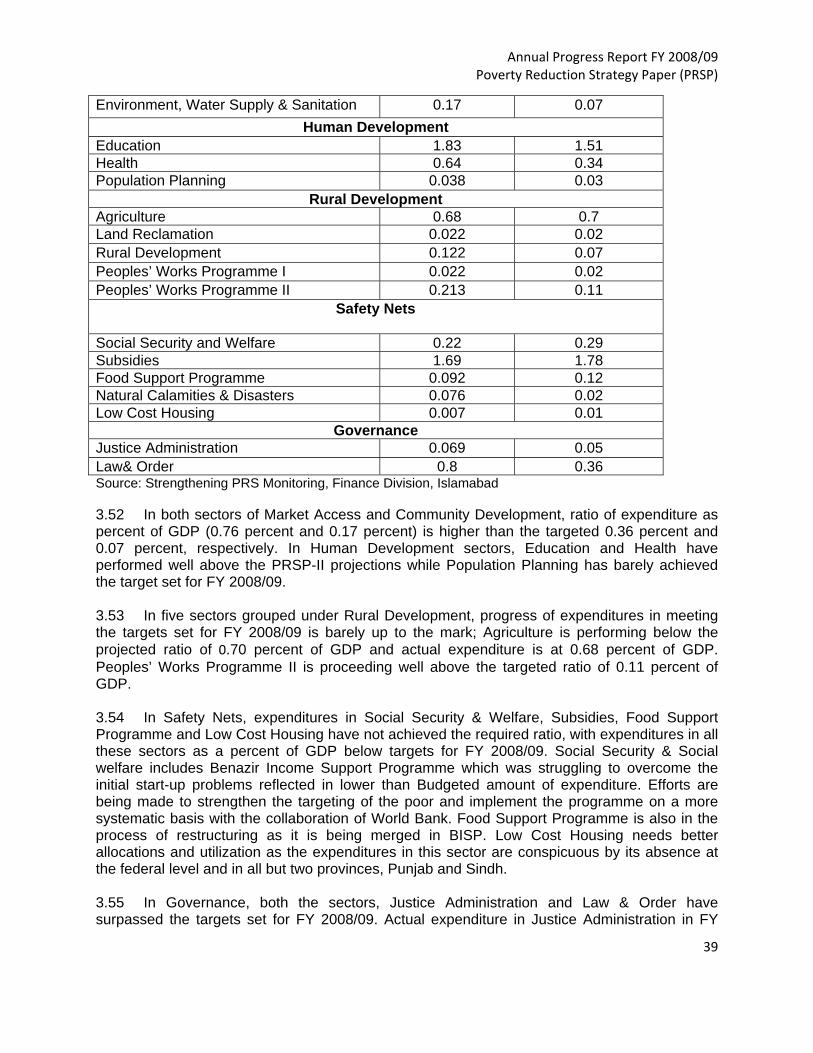
Annual Progress Report FY 2008/09 Poverty Reduction Strategy Paper (PRSP)
39
Environment, Water Supply & Sanitation 0.17 0.07 Human Development
Education 1.83 1.51 Health 0.64 0.34 Population Planning 0.038 0.03
Rural Development Agriculture 0.68 0.7 Land Reclamation 0.022 0.02 Rural Development 0.122 0.07 Peoples’ Works Programme I 0.022 0.02 Peoples’ Works Programme II 0.213 0.11 Safety Nets
Social Security and Welfare 0.22 0.29 Subsidies 1.69 1.78 Food Support Programme 0.092 0.12 Natural Calamities & Disasters 0.076 0.02 Low Cost Housing 0.007 0.01
Governance Justice Administration 0.069 0.05 Law& Order 0.8 0.36 Source: Strengthening PRS Monitoring, Finance Division, Islamabad 3.52 In both sectors of Market Access and Community Development, ratio of expenditure as percent of GDP (0.76 percent and 0.17 percent) is higher than the targeted 0.36 percent and 0.07 percent, respectively. In Human Development sectors, Education and Health have performed well above the PRSP-II projections while Population Planning has barely achieved the target set for FY 2008/09. 3.53 In five sectors grouped under Rural Development, progress of expenditures in meeting the targets set for FY 2008/09 is barely up to the mark; Agriculture is performing below the projected ratio of 0.70 percent of GDP and actual expenditure is at 0.68 percent of GDP. Peoples’ Works Programme II is proceeding well above the targeted ratio of 0.11 percent of GDP. 3.54 In Safety Nets, expenditures in Social Security & Welfare, Subsidies, Food Support Programme and Low Cost Housing have not achieved the required ratio, with expenditures in all these sectors as a percent of GDP below targets for FY 2008/09. Social Security & Social welfare includes Benazir Income Support Programme which was struggling to overcome the initial start-up problems reflected in lower than Budgeted amount of expenditure. Efforts are being made to strengthen the targeting of the poor and implement the programme on a more systematic basis with the collaboration of World Bank. Food Support Programme is also in the process of restructuring as it is being merged in BISP. Low Cost Housing needs better allocations and utilization as the expenditures in this sector are conspicuous by its absence at the federal level and in all but two provinces, Punjab and Sindh. 3.55 In Governance, both the sectors, Justice Administration and Law & Order have surpassed the targets set for FY 2008/09. Actual expenditure in Justice Administration in FY
Annual Progress Report FY 2008/09 Poverty Reduction Strategy Paper (PRSP)
40
2008/09 stood at 0.069 percent of GDP against the projection of 0.05 in PRSP-II. Expenditure in Law & Order constitutes 0.8 percent of GDP against the target of 0.36 percent. 4. Protecting the Poor and Vulnerable 4.1 Social safety nets are an integral part of Pakistan’s Poverty Reduction Paradigm, which interacts with and supplements social protection endeavours: in the areas of health, education and financial services; and in provision of utilities and infrastructure; and other policies aimed at reducing poverty and managing risk. The sharp rise in the international food prices and the global financial crisis during FY 2007/08 not only adversely impacted the macroeconomic indicators but also imposed social costs. Recognizing the urgent need to protect the poor and the vulnerable, the Government of Pakistan (GoP) has undertaken some new initiatives as well as strengthened earlier initiated in this regard. Safety nets in the form of direct cash transfers, both budgetary and non budgetary, including others are, Benazir Income Support Programme (BISP), Punjab Food Support Scheme (PFSS), and Punjab Sasti Roti (bread) Programme. Expenses on Pakistan Baitul Mall (PBM), BISP, PFSS and Punjab Sasti Roti (bread) Programme have been included in the budgetary part of pro-poor expenditures whereas detailed analysis of these initiatives have been reviewed in this section. 4.1 Pakistan Bait-ul-Mal (PBM) 4.2 A sharp decline in PBM programme was noticed during FY 2008/09 in comparison with FY 2007/08. Table 4.1 shows PBM interventions declined by 38 percent from Rs 5,521 million during FY 2007/08 to Rs 3,432 in FY 2008/09 registering a fall in beneficiaries by 46 percent from 2,129,277 to 1,158,922 during the same period. The core reason behind this sharp decline in overall disbursement and subsequent beneficiaries was due to a substantial decrease i.e. 48 percent both in disbursements and beneficiaries, under its flagship programme i.e. Food Support Programme (FSP) in FY 2008/09 as compared to FY 2007/08. Similarly, disbursement under National Center for rehabilitation of Child Labor (NCRCL) and Vocational Training Center (VTC) under PBM fell by 20 percent and 15 percent, respectively in FY 2008/09 against the last year. However, during the same period, beneficiaries grew by 56% under NCRCL while fell by 8 percent under VTC. 4.3 A significant increase of 136 percent and 123 percent respectively was observed in disbursement under Child Support Programme (CSP) and Institutional Rehabilitation (IR) and a marginal increase of 3 percent in Individual Financial Assistance (IFA) disbursement. However, number of beneficiaries increased by 97 percent. However, number of beneficiaries increased by 97 percent under CSP whereas showed a decline of 56 percent and 72 percent under IFA and IR, respectively. Share of FSP in total disbursement was 66 percent in FY 2008/09 as compared to 79 percent in FY 2007/08, the highest among all, followed by IFA 23 percent, NCRCL 6 percent, VTC and IR both 3 percent and CSP 1 percent during FY 2008/09 against the share of 14 percent, 4 percent, 2 percent, 1 percent and 0.2 percent, respectively during FY 2007/08.

Annual Progress Report FY 2008/09 Poverty Reduction Strategy Paper (PRSP)
41
Table 4.1: Pakistan Bait-ul-Mal (PBM) Programme
Programs
FY 2007/08 (July 01 – June 30)
FY 2008/09 (July 01 – June 30)
No. of Beneficiaries
Disbursement (Rs. Millions)
No. of Beneficiaries
Disbursement (Rs. Millions)
Food Support Programme (FSP) 1,456,886 4371 754,332 2263
Individual Financial Assistance (IFA) 43,310 754 18,974 775
National Centre for Rehabilitation of Child Labor (NCRCL)
116,293 244 181,607 194
Vocational Training Centers (VTC) 57318 102 52,462 87
Institutional Rehabilitation (Grant-In-Aid to NGOs) 442,197 39 125,406 87
Child Support Programme (CSP) 13,273 11 26,141 26
Total Disbursement under all Programmes 2,129,277 5,521 1,158,922 3,432
Source: Pakistan Bait-ul-Mal.
4.2 Zakat 4.4 A slight increase in Zakat disbursements and a significant decline in beneficiaries were noticed during FY 2008/09 in comparison with FY 2007/08. Table 4.2 shows that a total of Rs 2,877 million was disbursed under different programmes of Zakat as compared to Rs 2,482 million during FY 2007/08 registering an increase of 16 percent. During the same period, beneficiaries decreased by 25 percent from 1,456,548 to 1,085378. Of the total Zakat disbursements, 51 percent was disbursed under Regular Zakat Programmes, 33 percent under Other Zakat Programmes and 16 percent under National Level Schemes during FY 2008/09 against the previous year’s share of 62 percent, 22 percent and 16 percent, respectively. 4.5 Disbursements under Education stipends, stipends to students of deeni, social welfare/rehabilitation, marriage assistance to unmarried women, stipend for technical education and national level health institutions gone up by 111, 36, 27, 16, 128 and 18 percent, respectively increasing number of beneficiaries by 89, 20, 104, 19, 156 and 2 percent, respectively during FY 2008/09 as compared to FY 2007/08. However, in case of Guzara allowance, disbursements and beneficiaries both fell by 23 and 60 percent during the same period. Nothing was spent under the Permanent Rehabilitation Scheme of zakat during both years. Table 4.2: Comparison of Zakat Programmes between FY 2007/08 and FY 2008/09
FY 2007/08 FY 2008/09
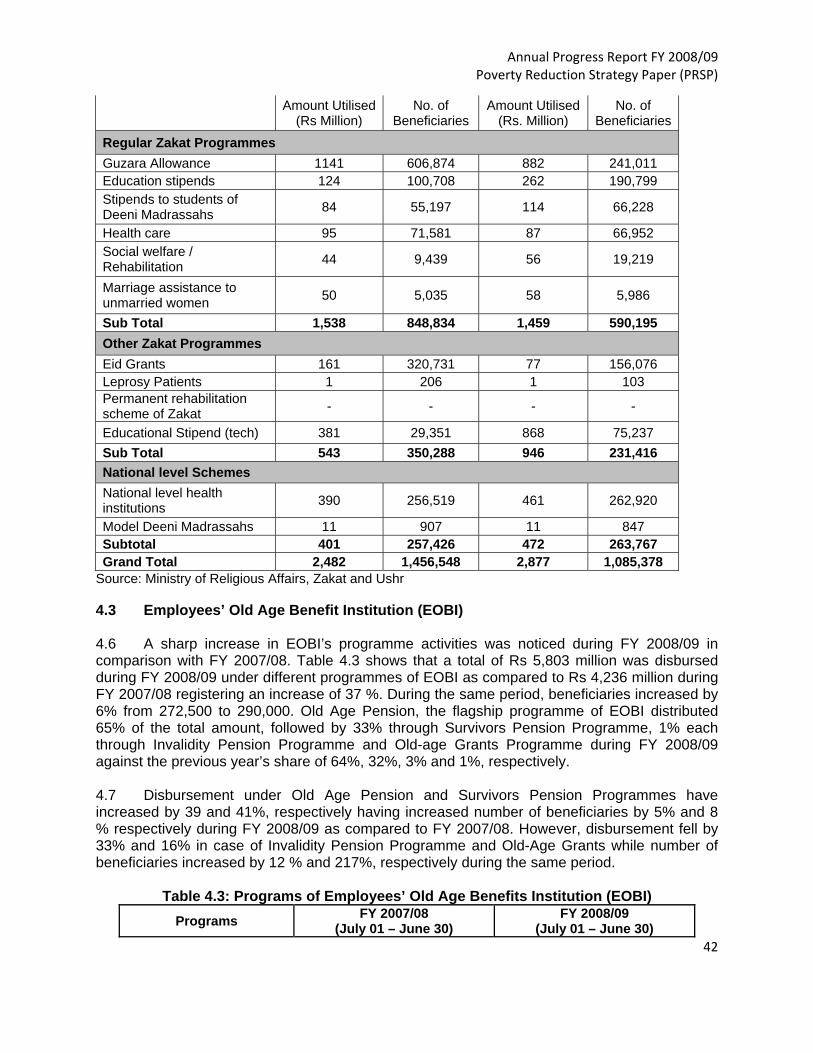
Annual Progress Report FY 2008/09 Poverty Reduction Strategy Paper (PRSP)
42
Amount Utilised (Rs Million)
No. of Beneficiaries
Amount Utilised (Rs. Million)
No. of Beneficiaries
Regular Zakat Programmes Guzara Allowance 1141 606,874 882 241,011 Education stipends 124 100,708 262 190,799 Stipends to students of Deeni Madrassahs 84 55,197 114 66,228
Health care 95 71,581 87 66,952 Social welfare / Rehabilitation 44 9,439 56 19,219
Marriage assistance to unmarried women 50 5,035 58 5,986
Sub Total 1,538 848,834 1,459 590,195 Other Zakat Programmes Eid Grants 161 320,731 77 156,076 Leprosy Patients 1 206 1 103 Permanent rehabilitation scheme of Zakat - - - -
Educational Stipend (tech) 381 29,351 868 75,237 Sub Total 543 350,288 946 231,416 National level Schemes National level health institutions 390 256,519 461 262,920
Model Deeni Madrassahs 11 907 11 847 Subtotal 401 257,426 472 263,767 Grand Total 2,482 1,456,548 2,877 1,085,378
Source: Ministry of Religious Affairs, Zakat and Ushr 4.3 Employees’ Old Age Benefit Institution (EOBI) 4.6 A sharp increase in EOBI’s programme activities was noticed during FY 2008/09 in comparison with FY 2007/08. Table 4.3 shows that a total of Rs 5,803 million was disbursed during FY 2008/09 under different programmes of EOBI as compared to Rs 4,236 million during FY 2007/08 registering an increase of 37 %. During the same period, beneficiaries increased by 6% from 272,500 to 290,000. Old Age Pension, the flagship programme of EOBI distributed 65% of the total amount, followed by 33% through Survivors Pension Programme, 1% each through Invalidity Pension Programme and Old-age Grants Programme during FY 2008/09 against the previous year’s share of 64%, 32%, 3% and 1%, respectively. 4.7 Disbursement under Old Age Pension and Survivors Pension Programmes have increased by 39 and 41%, respectively having increased number of beneficiaries by 5% and 8 % respectively during FY 2008/09 as compared to FY 2007/08. However, disbursement fell by 33% and 16% in case of Invalidity Pension Programme and Old-Age Grants while number of beneficiaries increased by 12 % and 217%, respectively during the same period.
Table 4.3: Programs of Employees’ Old Age Benefits Institution (EOBI) Programs FY 2007/08
(July 01 – June 30) FY 2008/09
(July 01 – June 30)

Annual Progress Report FY 2008/09 Poverty Reduction Strategy Paper (PRSP)
43
No. of Beneficiaries
Disbursement (Rs. Millions)
No. of Beneficiaries
Disbursement (Rs. Millions)
Old Age Pension 177,000 2,711 185,600 3,775
Invalidity Pension 4,100 127 4,600 85
Survivors Pension 90,800 1,354 97,900 1,905
Old-Age Grants 600 45 1,900 38
Total 272,500 4,237 290,000 5,803 Source: Employees’ Old Age Benefits Institution (EOBI). 4.4 Benazir income Support Programme (BISP) 4.8 The Government of Pakistan (GoP) launched the Benazir Income Support Programme (BISP) in 2008 as its main social safety net programme. This program would serve as a platform to provide cash transfers to the vulnerable identified on the basis of poverty scorecard and would be backed by an exit strategy. BISP was initiated with initial allocation of Rs.34 billion (US $ 425 million approximately) during FY 2008/09 which is the third largest allocation in the total budget and is 0.3% of the GDP for FY 2008/09. The Programme was initiated to partially offset the impact of inflation on the purchasing power of the poorer sections of the society. In FY 2007/08, a sharp rise in oil prices and primary products in the international, as well as, domestic market resulted in a double digit inflation rate, which has almost halved the purchasing power of the people. Hence, with an urgent need for direct and speedy relief to the poor sections of the society, BISP was the right response. The Programme is aimed at covering almost 15% of the entire population, which constitutes 40% of the population living below the poverty line. A monthly payment of Rs.1000 per family5 would increase the income of a family earning Rs.5000 by 20%. BISP will cover all four provinces including FATA, AJK, FANA & ICT. 4.9 During FY 2008/09, a total of Rs. 14 billion6 was disbursed to 1.76 million beneficiaries across all parts of the country (see Table 4.4). Of the total BISP’s disbursement, 36% was disbursed in Punjab, followed by 21% in Sindh, 15% in N.W.F.P, 5% in Baluchistan, 2% in FATA, 1% in Islamabad, .10% in FANA, and .04% in Azad Jammu & Kashmir. Countrywide 21% data is not segregated in to provinces and subsequent beneficiaries yet. The current BISP’s Management Information System (MIS) does not provide exact beneficiary details about the graduating clients and the new clients separately for each province. Hence, cumulative details for BISP’s beneficiaries are given in Table 4.4. 4.10 The BISP’s allocation for the upcoming FY 2009/10 has been increased to Rs. 70 billion for 5 million families. In order to transform the poor segment of society from depending upon the government’s monthly financial assistance to self-reliance, one member from each qualifying household will be equipped with technical and vocational skills making them the earning hands. The second phase of the skill development programme will be provision of micro finance for poor families to help them run small
5 Husband, wife and dependent children constitute a family.
6 Around Rs. 1 billion has been spent on the administrative and other expenses of the BISP during FY 2008/09.
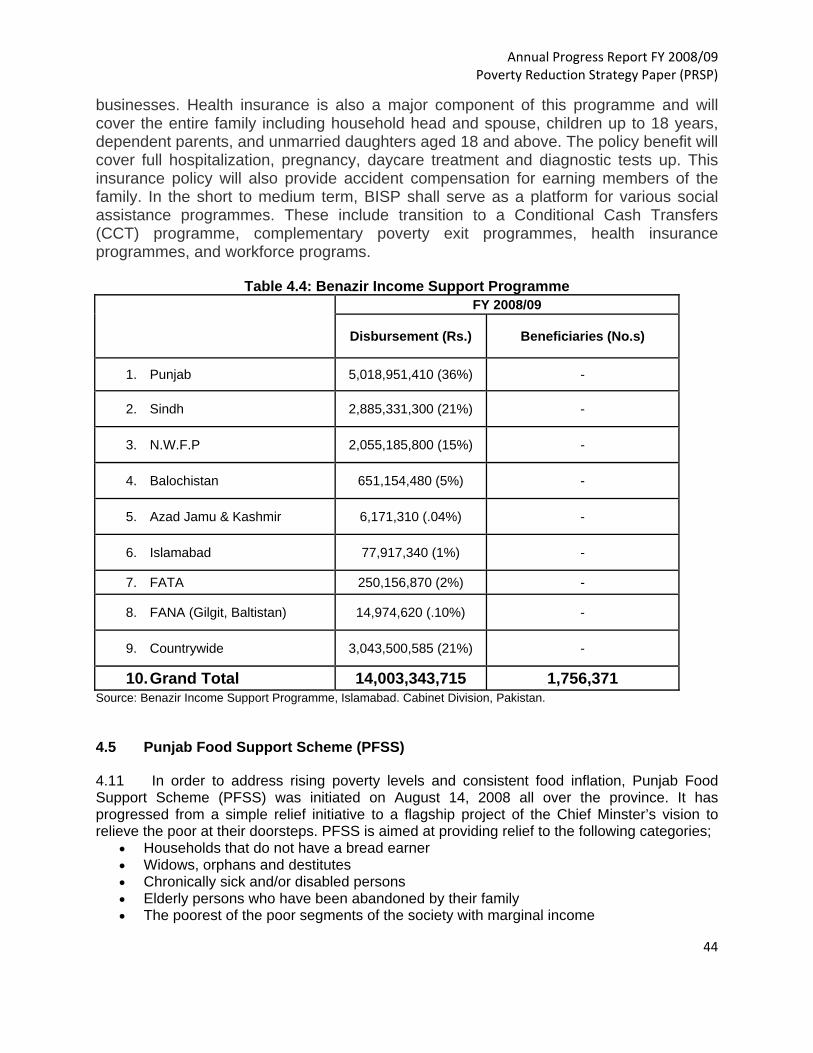
Annual Progress Report FY 2008/09 Poverty Reduction Strategy Paper (PRSP)
44
businesses. Health insurance is also a major component of this programme and will cover the entire family including household head and spouse, children up to 18 years, dependent parents, and unmarried daughters aged 18 and above. The policy benefit will cover full hospitalization, pregnancy, daycare treatment and diagnostic tests up. This insurance policy will also provide accident compensation for earning members of the family. In the short to medium term, BISP shall serve as a platform for various social assistance programmes. These include transition to a Conditional Cash Transfers (CCT) programme, complementary poverty exit programmes, health insurance programmes, and workforce programs.
Table 4.4: Benazir Income Support Programme
FY 2008/09
Disbursement (Rs.) Beneficiaries (No.s)
1. Punjab 5,018,951,410 (36%) -
2. Sindh 2,885,331,300 (21%) -
3. N.W.F.P 2,055,185,800 (15%) -
4. Balochistan 651,154,480 (5%) -
5. Azad Jamu & Kashmir 6,171,310 (.04%) -
6. Islamabad 77,917,340 (1%) -
7. FATA 250,156,870 (2%) -
8. FANA (Gilgit, Baltistan) 14,974,620 (.10%) -
9. Countrywide 3,043,500,585 (21%) -
10. Grand Total 14,003,343,715 1,756,371 Source: Benazir Income Support Programme, Islamabad. Cabinet Division, Pakistan.
4.5 Punjab Food Support Scheme (PFSS) 4.11 In order to address rising poverty levels and consistent food inflation, Punjab Food Support Scheme (PFSS) was initiated on August 14, 2008 all over the province. It has progressed from a simple relief initiative to a flagship project of the Chief Minster’s vision to relieve the poor at their doorsteps. PFSS is aimed at providing relief to the following categories;
• Households that do not have a bread earner • Widows, orphans and destitutes • Chronically sick and/or disabled persons • Elderly persons who have been abandoned by their family • The poorest of the poor segments of the society with marginal income
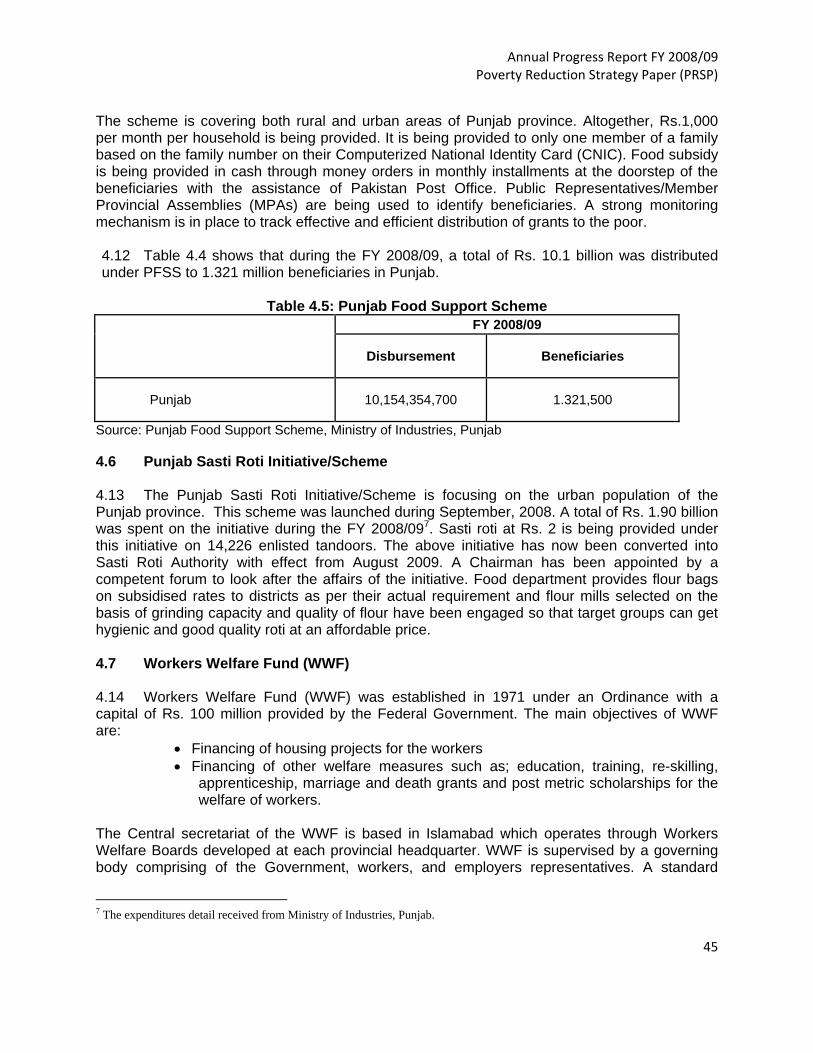
Annual Progress Report FY 2008/09 Poverty Reduction Strategy Paper (PRSP)
45
The scheme is covering both rural and urban areas of Punjab province. Altogether, Rs.1,000 per month per household is being provided. It is being provided to only one member of a family based on the family number on their Computerized National Identity Card (CNIC). Food subsidy is being provided in cash through money orders in monthly installments at the doorstep of the beneficiaries with the assistance of Pakistan Post Office. Public Representatives/Member Provincial Assemblies (MPAs) are being used to identify beneficiaries. A strong monitoring mechanism is in place to track effective and efficient distribution of grants to the poor. 4.12 Table 4.4 shows that during the FY 2008/09, a total of Rs. 10.1 billion was distributed under PFSS to 1.321 million beneficiaries in Punjab.
Table 4.5: Punjab Food Support Scheme
FY 2008/09
Disbursement Beneficiaries
Punjab 10,154,354,700 1.321,500
Source: Punjab Food Support Scheme, Ministry of Industries, Punjab 4.6 Punjab Sasti Roti Initiative/Scheme 4.13 The Punjab Sasti Roti Initiative/Scheme is focusing on the urban population of the Punjab province. This scheme was launched during September, 2008. A total of Rs. 1.90 billion was spent on the initiative during the FY 2008/097. Sasti roti at Rs. 2 is being provided under this initiative on 14,226 enlisted tandoors. The above initiative has now been converted into Sasti Roti Authority with effect from August 2009. A Chairman has been appointed by a competent forum to look after the affairs of the initiative. Food department provides flour bags on subsidised rates to districts as per their actual requirement and flour mills selected on the basis of grinding capacity and quality of flour have been engaged so that target groups can get hygienic and good quality roti at an affordable price. 4.7 Workers Welfare Fund (WWF) 4.14 Workers Welfare Fund (WWF) was established in 1971 under an Ordinance with a capital of Rs. 100 million provided by the Federal Government. The main objectives of WWF are:
• Financing of housing projects for the workers • Financing of other welfare measures such as; education, training, re-skilling,
apprenticeship, marriage and death grants and post metric scholarships for the welfare of workers.
The Central secretariat of the WWF is based in Islamabad which operates through Workers Welfare Boards developed at each provincial headquarter. WWF is supervised by a governing body comprising of the Government, workers, and employers representatives. A standard
7 The expenditures detail received from Ministry of Industries, Punjab.
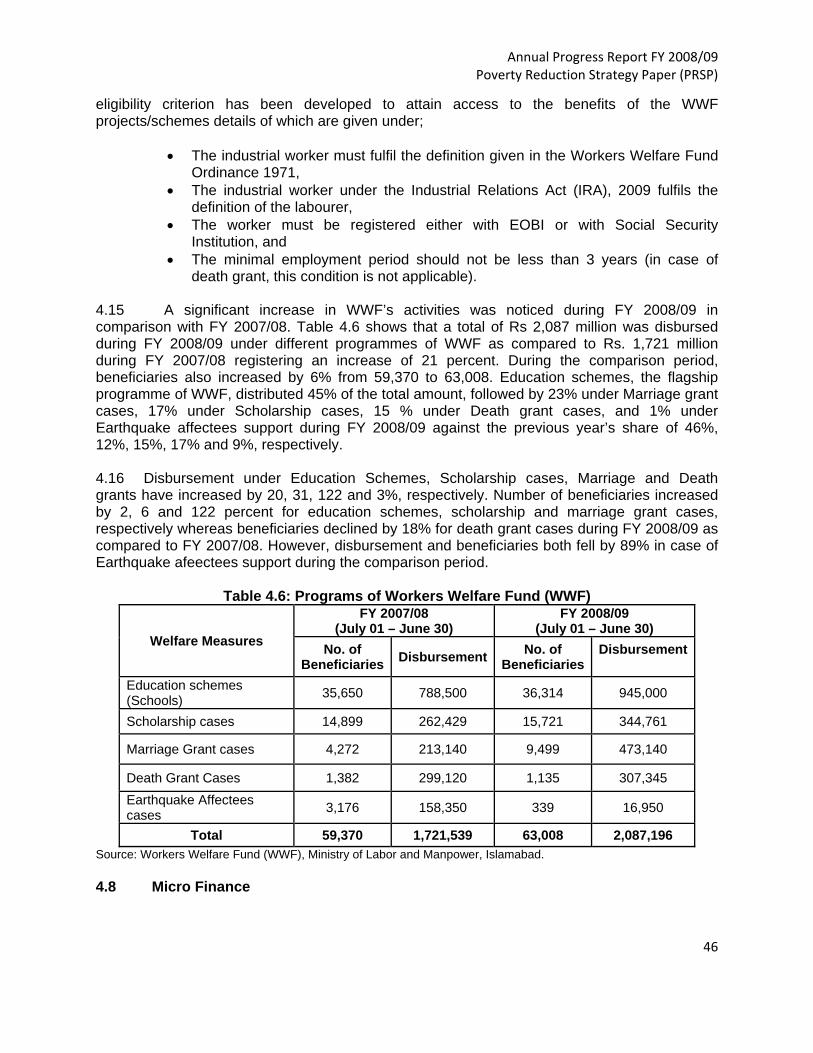
Annual Progress Report FY 2008/09 Poverty Reduction Strategy Paper (PRSP)
46
eligibility criterion has been developed to attain access to the benefits of the WWF projects/schemes details of which are given under;
• The industrial worker must fulfil the definition given in the Workers Welfare Fund Ordinance 1971,
• The industrial worker under the Industrial Relations Act (IRA), 2009 fulfils the definition of the labourer,
• The worker must be registered either with EOBI or with Social Security Institution, and
• The minimal employment period should not be less than 3 years (in case of death grant, this condition is not applicable).
4.15 A significant increase in WWF’s activities was noticed during FY 2008/09 in comparison with FY 2007/08. Table 4.6 shows that a total of Rs 2,087 million was disbursed during FY 2008/09 under different programmes of WWF as compared to Rs. 1,721 million during FY 2007/08 registering an increase of 21 percent. During the comparison period, beneficiaries also increased by 6% from 59,370 to 63,008. Education schemes, the flagship programme of WWF, distributed 45% of the total amount, followed by 23% under Marriage grant cases, 17% under Scholarship cases, 15 % under Death grant cases, and 1% under Earthquake affectees support during FY 2008/09 against the previous year’s share of 46%, 12%, 15%, 17% and 9%, respectively. 4.16 Disbursement under Education Schemes, Scholarship cases, Marriage and Death grants have increased by 20, 31, 122 and 3%, respectively. Number of beneficiaries increased by 2, 6 and 122 percent for education schemes, scholarship and marriage grant cases, respectively whereas beneficiaries declined by 18% for death grant cases during FY 2008/09 as compared to FY 2007/08. However, disbursement and beneficiaries both fell by 89% in case of Earthquake afeectees support during the comparison period.
Table 4.6: Programs of Workers Welfare Fund (WWF)
Welfare Measures
FY 2007/08 (July 01 – June 30)
FY 2008/09 (July 01 – June 30)
No. of Beneficiaries Disbursement No. of
Beneficiaries Disbursement
Education schemes (Schools) 35,650 788,500 36,314 945,000
Scholarship cases 14,899 262,429 15,721 344,761
Marriage Grant cases 4,272 213,140 9,499 473,140
Death Grant Cases 1,382 299,120 1,135 307,345 Earthquake Affectees cases 3,176 158,350 339 16,950
Total 59,370 1,721,539 63,008 2,087,196 Source: Workers Welfare Fund (WWF), Ministry of Labor and Manpower, Islamabad. 4.8 Micro Finance
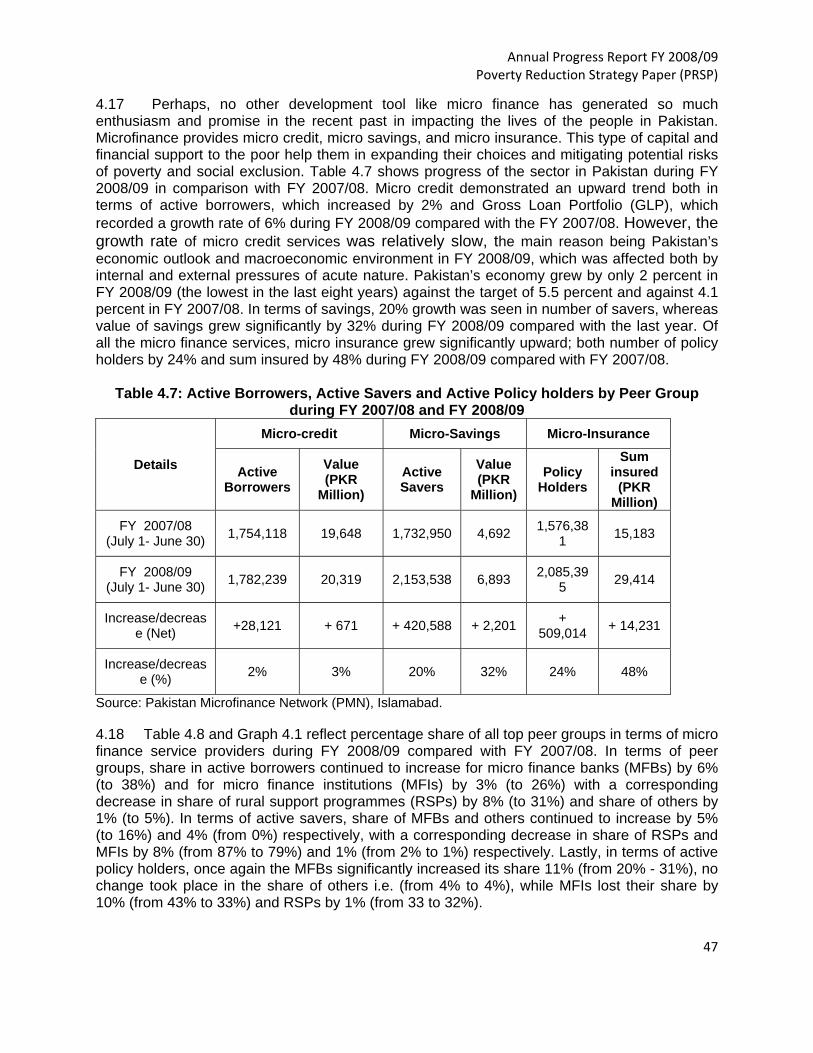
Annual Progress Report FY 2008/09 Poverty Reduction Strategy Paper (PRSP)
47
4.17 Perhaps, no other development tool like micro finance has generated so much enthusiasm and promise in the recent past in impacting the lives of the people in Pakistan. Microfinance provides micro credit, micro savings, and micro insurance. This type of capital and financial support to the poor help them in expanding their choices and mitigating potential risks of poverty and social exclusion. Table 4.7 shows progress of the sector in Pakistan during FY 2008/09 in comparison with FY 2007/08. Micro credit demonstrated an upward trend both in terms of active borrowers, which increased by 2% and Gross Loan Portfolio (GLP), which recorded a growth rate of 6% during FY 2008/09 compared with the FY 2007/08. However, the growth rate of micro credit services was relatively slow, the main reason being Pakistan’s economic outlook and macroeconomic environment in FY 2008/09, which was affected both by internal and external pressures of acute nature. Pakistan’s economy grew by only 2 percent in FY 2008/09 (the lowest in the last eight years) against the target of 5.5 percent and against 4.1 percent in FY 2007/08. In terms of savings, 20% growth was seen in number of savers, whereas value of savings grew significantly by 32% during FY 2008/09 compared with the last year. Of all the micro finance services, micro insurance grew significantly upward; both number of policy holders by 24% and sum insured by 48% during FY 2008/09 compared with FY 2007/08.
Table 4.7: Active Borrowers, Active Savers and Active Policy holders by Peer Group during FY 2007/08 and FY 2008/09
Details
Micro-credit Micro-Savings Micro-Insurance
Active Borrowers
Value (PKR
Million) Active Savers
Value (PKR
Million) Policy
Holders
Sum insured
(PKR Million)
FY 2007/08 (July 1- June 30) 1,754,118 19,648 1,732,950 4,692 1,576,38
1 15,183
FY 2008/09 (July 1- June 30) 1,782,239 20,319 2,153,538 6,893 2,085,39
5 29,414
Increase/decrease (Net) +28,121 + 671 + 420,588 + 2,201 +
509,014 + 14,231
Increase/decrease (%) 2% 3% 20% 32% 24% 48%
Source: Pakistan Microfinance Network (PMN), Islamabad. 4.18 Table 4.8 and Graph 4.1 reflect percentage share of all top peer groups in terms of micro finance service providers during FY 2008/09 compared with FY 2007/08. In terms of peer groups, share in active borrowers continued to increase for micro finance banks (MFBs) by 6% (to 38%) and for micro finance institutions (MFIs) by 3% (to 26%) with a corresponding decrease in share of rural support programmes (RSPs) by 8% (to 31%) and share of others by 1% (to 5%). In terms of active savers, share of MFBs and others continued to increase by 5% (to 16%) and 4% (from 0%) respectively, with a corresponding decrease in share of RSPs and MFIs by 8% (from 87% to 79%) and 1% (from 2% to 1%) respectively. Lastly, in terms of active policy holders, once again the MFBs significantly increased its share 11% (from 20% - 31%), no change took place in the share of others i.e. (from 4% to 4%), while MFIs lost their share by 10% (from 43% to 33%) and RSPs by 1% (from 33 to 32%).
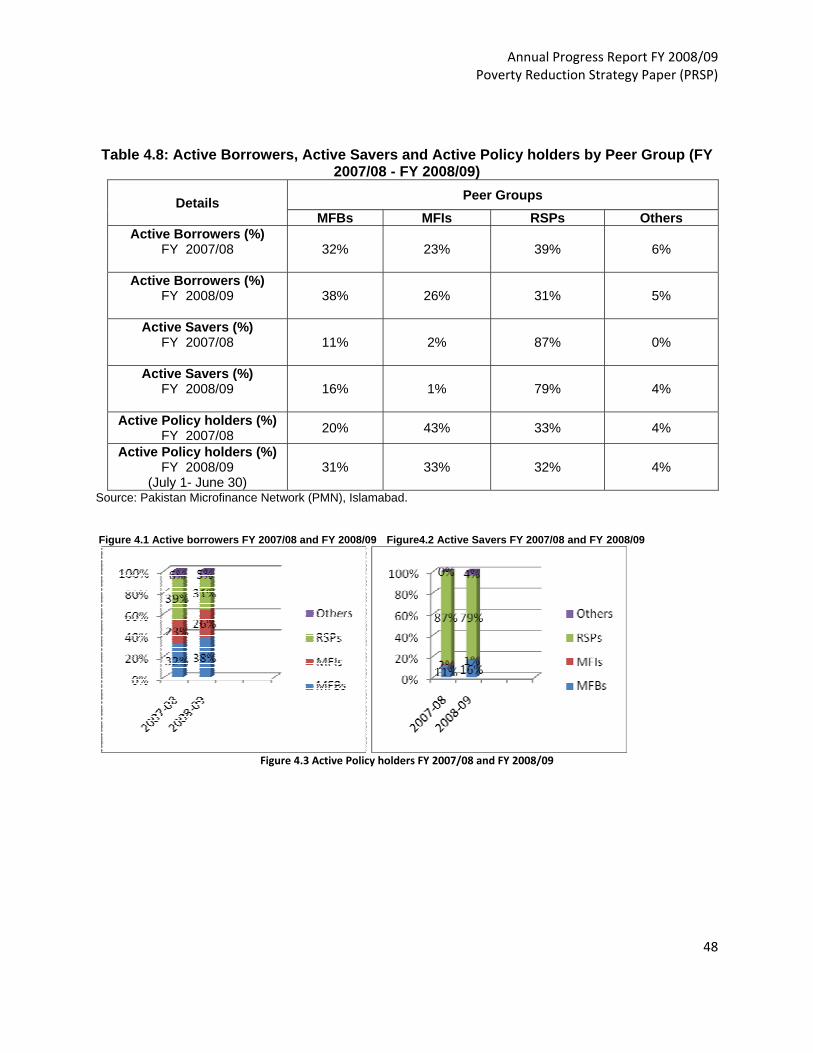
Annual Progress Report FY 2008/09 Poverty Reduction Strategy Paper (PRSP)
48
Table 4.8: Active Borrowers, Active Savers and Active Policy holders by Peer Group (FY
2007/08 - FY 2008/09)
Details Peer Groups MFBs MFIs RSPs Others
Active Borrowers (%) FY 2007/08
32% 23% 39% 6%
Active Borrowers (%) FY 2008/09
38% 26% 31% 5%
Active Savers (%) FY 2007/08
11% 2% 87% 0%
Active Savers (%) FY 2008/09
16% 1% 79% 4%
Active Policy holders (%) FY 2007/08 20% 43% 33% 4%
Active Policy holders (%) FY 2008/09
(July 1- June 30) 31% 33% 32% 4%
Source: Pakistan Microfinance Network (PMN), Islamabad. Figure 4.1 Active borrowers FY 2007/08 and FY 2008/09 Figure4.2 Active Savers FY 2007/08 and FY 2008/09
Figure 4.3 Active Policy holders FY 2007/08 and FY 2008/09
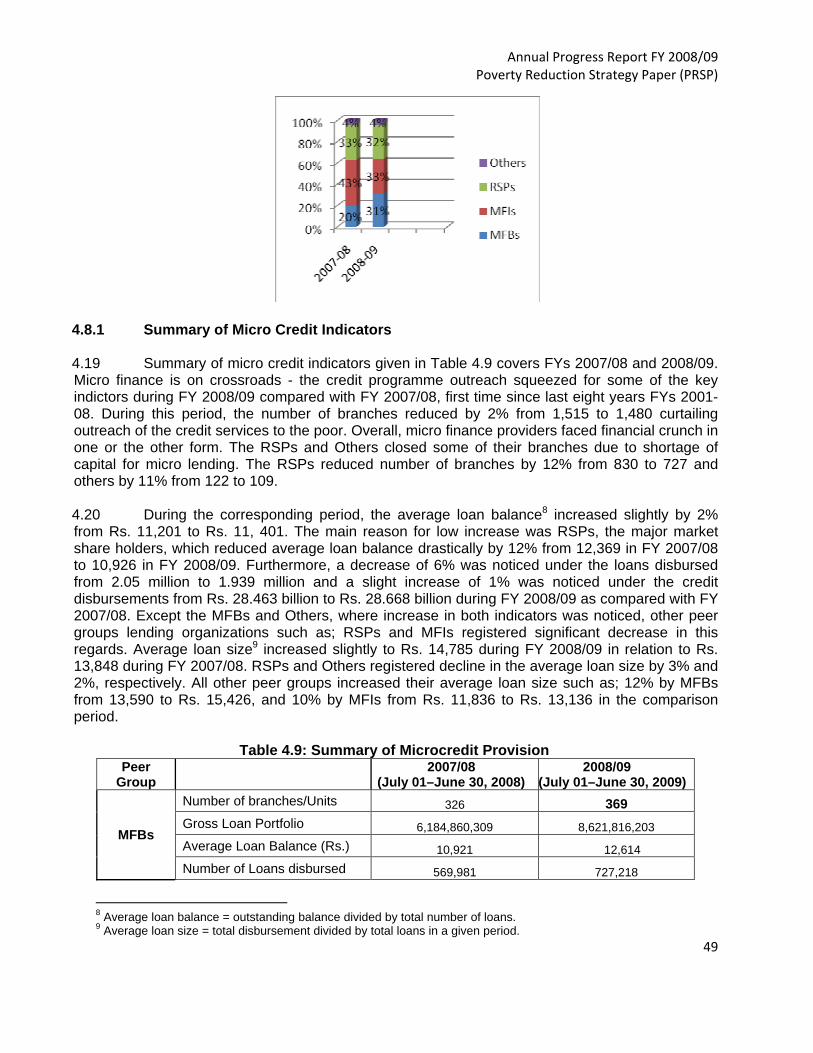
Annual Progress Report FY 2008/09 Poverty Reduction Strategy Paper (PRSP)
49
4.8.1 Summary of Micro Credit Indicators 4.19 Summary of micro credit indicators given in Table 4.9 covers FYs 2007/08 and 2008/09. Micro finance is on crossroads - the credit programme outreach squeezed for some of the key indictors during FY 2008/09 compared with FY 2007/08, first time since last eight years FYs 2001-08. During this period, the number of branches reduced by 2% from 1,515 to 1,480 curtailing outreach of the credit services to the poor. Overall, micro finance providers faced financial crunch in one or the other form. The RSPs and Others closed some of their branches due to shortage of capital for micro lending. The RSPs reduced number of branches by 12% from 830 to 727 and others by 11% from 122 to 109. 4.20 During the corresponding period, the average loan balance8 increased slightly by 2% from Rs. 11,201 to Rs. 11, 401. The main reason for low increase was RSPs, the major market share holders, which reduced average loan balance drastically by 12% from 12,369 in FY 2007/08 to 10,926 in FY 2008/09. Furthermore, a decrease of 6% was noticed under the loans disbursed from 2.05 million to 1.939 million and a slight increase of 1% was noticed under the credit disbursements from Rs. 28.463 billion to Rs. 28.668 billion during FY 2008/09 as compared with FY 2007/08. Except the MFBs and Others, where increase in both indicators was noticed, other peer groups lending organizations such as; RSPs and MFIs registered significant decrease in this regards. Average loan size9 increased slightly to Rs. 14,785 during FY 2008/09 in relation to Rs. 13,848 during FY 2007/08. RSPs and Others registered decline in the average loan size by 3% and 2%, respectively. All other peer groups increased their average loan size such as; 12% by MFBs from 13,590 to Rs. 15,426, and 10% by MFIs from Rs. 11,836 to Rs. 13,136 in the comparison period. Table 4.9: Summary of Microcredit Provision
Peer Group
2007/08 (July 01–June 30, 2008)
2008/09 (July 01–June 30, 2009)
MFBs
Number of branches/Units 326 369 Gross Loan Portfolio 6,184,860,309 8,621,816,203 Average Loan Balance (Rs.) 10,921 12,614 Number of Loans disbursed 569,981 727,218
8 Average loan balance = outstanding balance divided by total number of loans. 9 Average loan size = total disbursement divided by total loans in a given period.

Annual Progress Report FY 2008/09 Poverty Reduction Strategy Paper (PRSP)
50
Credit Disbursements (Rs.) 7,745,500,894 11,217,802,369 Average Loan Size (Rs.) 13,590 15,426
MFIs
Number of branches/Units 237 275
Gross Loan Portfolio (Rs) 3,597,465,467 4,286,895,612
Average Loan Balance (Rs.) 9,072 9,406
Number of Loans disbursed 635,519 473,509
Credit Disbursements (Rs) 75,21,806,894 62,20,077,227
Average Loan Size (Rs.) 11,836 13,136
RSPs
Number of branches/Units 830 727
Gross Loan Portfolio (Rs) 8,551,589,734 6,013,607,287
Average Loan Balance (Rs.) 12,369 10,926
Number of Loans disbursed 804,097 648,220
Credit Disbursements (Rs) 12,443,265,030 9,777,511,425
Average Loan Size (Rs.) 15,474 15,084
Others
Number of branches/Units 122 109
Gross Loan Portfolio (Rs) 1,314,128,740 1,396,534,909
Average Loan Balance (Rs.) 13,160 15,084
Number of Loans disbursed 45,777 90,103
Credit Disbursements (Rs) 752,680,920 14,53,484,451
Average Loan Size (Rs.) 16,443 16,131
Total
Number of branches/Units 1,515 1,480
Gross Loan Portfolio (Rs.) 19,648,044,250 20,318,854,011
Average Loan Balance (Rs.) 11,201 11,401
Number of Loans disbursed 11,201 11,401
Credit Disbursements (Rs.) 28,463,253,738 28,668,875,472
Average Loan Size (Rs.) 13,848 14,785 Source: Pakistan Microfinance Network (PMN), Islamabad.
Annual Progress Report FY 2008/09 Poverty Reduction Strategy Paper (PRSP)
51
5. Monitoring the PRSP Intermediate (Output) Indicators
5.1 This section of the report analyzes the performance of intermediate (output) indicators regarding Education, Health, Environment, Energy Development, Water Supply and Sanitation, People Works Programme- I, Capital for Finance and Development along-with recent information on employment situation in Pakistan.
5.1 Education Sector
5.1.1 Performance of Intermediate (Output) Indicators
5.2 Education sector intermediate (output) indicators include information about public schools and details pertaining to the functional public school10,teachers actual posts filled against sanctioned posts11, percentage of teachers trained, an update on basic facilitates in these schools, private schools and deeni madrasas, technical and vocational skills training, and national internship program. Progress of these indicators during FY 2008/09 compared with FY 2007/08 is discussed below.
5.1.2 Functional Schools
5.3 Number of functional primary and middle schools including mosque schools in Pakistan are reported in table 5.1. A total of 144,784 schools were functional in FY 2008/09 against 143,885 in FY 2007/08 registering an increase of 899 schools. During the same period, both primary and middle functional schools increased by 0.4 and 2.50 percent, respectively. The upward trend in functional schools will contribute in improving the outcome level indicators situation (literacy rate and completion of primary and middle level education) in Pakistan in the coming years.
10 According to Education Department: Functional School means teaching and Students Learning going on in the particular school. Non-Functional school means either no enrolment or no teacher in the particular school, and closed School means notification issued by the Government about formal closure of the particular school. 11 Data for FY 2008/09 has not been received from Ministry of Education and data for FY 2007/08 has already been discussed in the PRSP Annul Progress Report FY 2007/08.

Annual Progress Report FY 2008/09 Poverty Reduction Strategy Paper (PRSP)
52
5.4 The province and other constitutional entity wise analysis is as under. Punjab, the most populous province also has the largest number of functional schools i.e. 55,657 in FY 2008/09; followed by 40,872 in Sindh, 25,165 in NWFP, 10,689 in Baluchistan, 5,237 in FATA, 5,134 in AJK, 1,767 in FANA, and 265 in Islamabad Capital Territory (ICT). It is encouraging to see an increase of 2.60 percent in Sindh, 0.76 percent in NWFP, 0.23 percent in AJK, 4.31 percent in FANA, 2.52 percent in FATA, and 0.38 percent in federal capital in FY 2008/09 in relation to FY 2007/08. Whereas, a decline of 0.79 percent and 0.84 percent was observed in the number of functional schools in Punjab and Balochistan in FY 2008/09 as compared to FY 2007/08. The main reasons of decrease in functional schools were informed as under; 1. because of the minimum acceptable low enrolment in one school the same school was merged into another nearer school. 2. some of the primary schools were altogether closed because of the low enrolment. 3. some of the primary schools were merged into middle schools.
Table 5.1: Number of Functional Public Schools Region/Province Year Primary Middle Total
Pakistan FY 2007/08 (A) 128,592 15,293 143,885
FY 2008/09 (E) 129,109 15,675 144,784
Punjab FY 2007/08 (A) 48,665 7,438 56,103
FY 2008/09 (E) 48,131 7,526 55,657
Sindh FY 2007/08 (A) 37,290 2,548 39,838
FY 2008/09 (E) 38,176 2,696 40,872
NWFP FY 2007/08 (A) 22,466 2,510 24,976
FY 2008/09 (E) 22,613 2,552 25,165
Balochistan FY 2007/08 (A) 9,924 856 10,780
FY 2008/09 (E) 9,805 884 10,689
AJK FY 2007/08 (A) 4,086 1,036 5,122
FY 2008/09 (E) 4,097 1,037 5,134
FANA FY 2007/08 (A) 1,283 411 1,694
FY 2008/09 (E) 1,293 474 1,767
FATA FY 2007/08 (A) 4,664 444 5,108
FY 2008/09 (E) 4,779 458 5,237
Federal FY 2007/08 (A) 214 50 264
FY 2008/09 (E) 216 49 265
A= Actual data, E= Estimated data.

Annual Progress Report FY 2008/09 Poverty Reduction Strategy Paper (PRSP)
53
Source: National Education Management Information System (NEMIS), Academy of Educational Planning and Management, Ministry of Education, Government of Pakistan. Note: Mosque schools are included in primary schools.
5.1.3 Percentage of Trained Teachers
5.6 The percentage of trained teachers dropped by 1 percentage point at the primary level (from 98% to 97%) and no change has been reported at the middle level i.e. 99% during the FY 2008/09 as compared to FY 2007/08 (see table 5.2). In Punjab 100 percent teachers were trained both at the primary and middle level during FY 2008/09. In NWFP, 100 percent teachers were trained at the primary level while 99% were trained at the middle level. At the primary level, percentage of trained teachers decreased by 8 percentage points in FANA and 1 percentage point each in Sindh, Baluchistan, AJK, FATA, and ICT during FY 2008/09 in comparison with FY 2007/08. At the middle level, percentage of trained teachers decreased by 3 percentage point in FANA and 1 percentage point each in Sindh, Baluchistan, and ICT. No change has been observed at the middle level in percentage of teachers trained in AJK and FATA during FY 2008/09 as compared to the last year.
Table 5.2 : Percentage of Trained Teachers
Region Province
FY 2007/08 FY 2008/09 (Estimated*)
Primary Middle Primary Middle
Pakistan 98 99 97
99
Punjab 100 100 100 100
Sindh 94 95 93 94
NWFP 100 100 100 99
Baluchistan 99 94 98 93
AJK 92 97 91 97
FATA 98 100 97 100
FANA 74 88 66 85
ICT 96 98 95 97
(E*): Estimated Source: 1. National Educational Management Information System (NEMIS), Academy of Educational Planning and Management (AEPAM), Ministry of Education, Government of Pakistan. 2. Pakistan Education Statistics 2007-08, AEPAM, Ministry of Education.
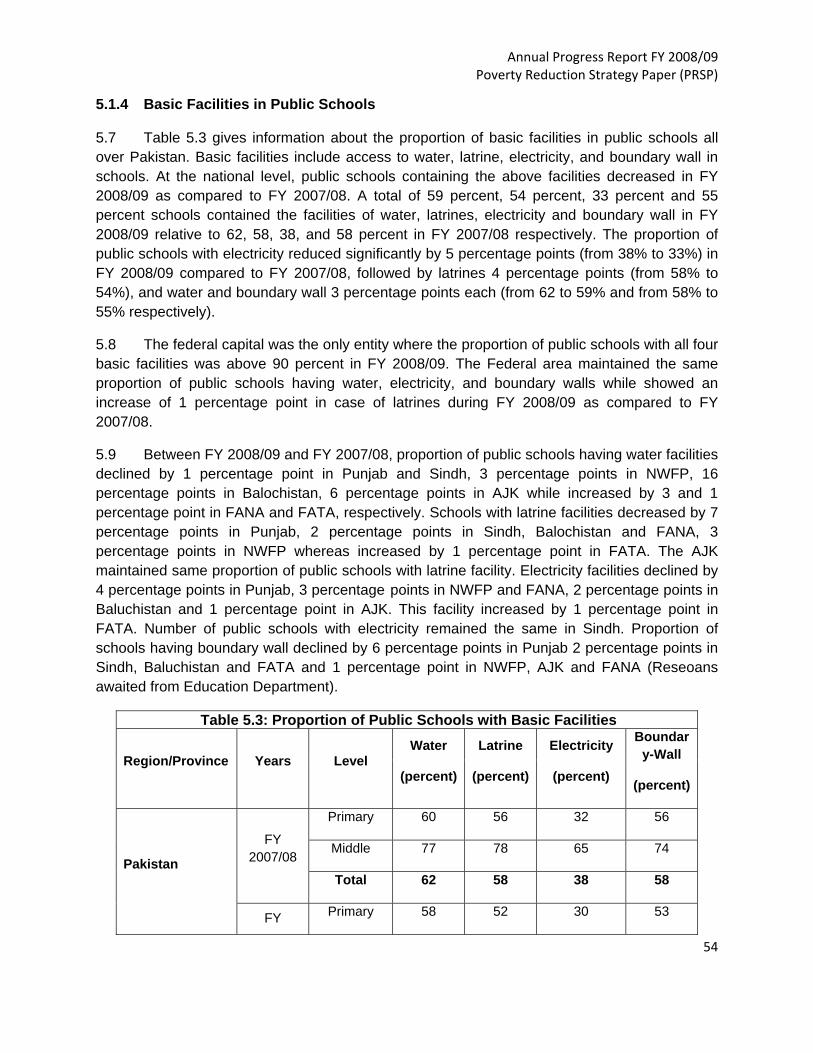
Annual Progress Report FY 2008/09 Poverty Reduction Strategy Paper (PRSP)
54
5.1.4 Basic Facilities in Public Schools
5.7 Table 5.3 gives information about the proportion of basic facilities in public schools all over Pakistan. Basic facilities include access to water, latrine, electricity, and boundary wall in schools. At the national level, public schools containing the above facilities decreased in FY 2008/09 as compared to FY 2007/08. A total of 59 percent, 54 percent, 33 percent and 55 percent schools contained the facilities of water, latrines, electricity and boundary wall in FY 2008/09 relative to 62, 58, 38, and 58 percent in FY 2007/08 respectively. The proportion of public schools with electricity reduced significantly by 5 percentage points (from 38% to 33%) in FY 2008/09 compared to FY 2007/08, followed by latrines 4 percentage points (from 58% to 54%), and water and boundary wall 3 percentage points each (from 62 to 59% and from 58% to 55% respectively).
5.8 The federal capital was the only entity where the proportion of public schools with all four basic facilities was above 90 percent in FY 2008/09. The Federal area maintained the same proportion of public schools having water, electricity, and boundary walls while showed an increase of 1 percentage point in case of latrines during FY 2008/09 as compared to FY 2007/08.
5.9 Between FY 2008/09 and FY 2007/08, proportion of public schools having water facilities declined by 1 percentage point in Punjab and Sindh, 3 percentage points in NWFP, 16 percentage points in Balochistan, 6 percentage points in AJK while increased by 3 and 1 percentage point in FANA and FATA, respectively. Schools with latrine facilities decreased by 7 percentage points in Punjab, 2 percentage points in Sindh, Balochistan and FANA, 3 percentage points in NWFP whereas increased by 1 percentage point in FATA. The AJK maintained same proportion of public schools with latrine facility. Electricity facilities declined by 4 percentage points in Punjab, 3 percentage points in NWFP and FANA, 2 percentage points in Baluchistan and 1 percentage point in AJK. This facility increased by 1 percentage point in FATA. Number of public schools with electricity remained the same in Sindh. Proportion of schools having boundary wall declined by 6 percentage points in Punjab 2 percentage points in Sindh, Baluchistan and FATA and 1 percentage point in NWFP, AJK and FANA (Reseoans awaited from Education Department).
Table 5.3: Proportion of Public Schools with Basic Facilities
Region/Province Years Level Water
(percent)
Latrine
(percent)
Electricity
(percent)
Boundary-Wall
(percent)
Pakistan
FY 2007/08
Primary 60 56 32 56
Middle 77 78 65 74
Total 62 58 38 58
FY Primary 58 52 30 53

Annual Progress Report FY 2008/09 Poverty Reduction Strategy Paper (PRSP)
55
2008/09E*
Middle 75 74 63 71
Total 59 54 33 55
Punjab
FY 2007/08
Primary 79 67 43 72
Middle 96 90 86 90
Total 81 70 48 74
FY 2008/09
Primary 78 60 38 66
Middle 95 84 82 85
Total 80 63 44 68
Sindh
FY 2007/08
Primary 44 51 17 46
Middle 51 62 32 59
Total 44 51 18 46
FY 2008/09
Primary 43 48 17 43
Middle 51 62 33 59
Total 43 49 18 44
NWFP
FY 2007/08
Primary 59 66 43 62
Middle 69 81 61 71
Total 60 68 45 63
FY 2008/09
Primary 56 63 41 61
Middle 67 79 59 69
Total 57 65 42 62
Balochistan
FY 2007/08
Primary 65 25 16 31
Middle 65 55 39 65
Total 65 27 18 34
FY 2008/09
Primary 48 23 14 29
Middle 57 53 37 63

Annual Progress Report FY 2008/09 Poverty Reduction Strategy Paper (PRSP)
56
Total 49 25 16 32
AJK
FY 2007/08
Primary 39 36 13 11
Middle 59 52 41 18
Total 43 39 18 13
FY 2008/09
Primary 33 35 12 11
Middle 54 57 38 17
Total 37 39 17 12
FANA
FY 2007/08
Primary 26 40 37 47
Middle 33 51 62 33
Total 27 41 41 44
FY 2008/09
Primary 28 35 33 43
Middle 43 57 62 41
Total 30 39 38 43
FATA
FY 2007/08
Primary 35 40 41 59
Middle 62 67 68 90
Total 37 42 44 61
FY 2008/09
Primary 36 40 42 56
Middle 59 68 69 89
Total 38 43 45 59
Federal
FY 2007/08
Primary 94 89 95 94
Middle 98 92 100 84
Total 95 89 96 92
FY 2008/09
Primary 94 90 95 94
Middle 98 92 100 85
Total 95 90 96 92
E*= Estimated 2008-09 Note: Mosque schools are included in primary schools.

Annual Progress Report FY 2008/09 Poverty Reduction Strategy Paper (PRSP)
57
Source: National Education Management Information System (NEMIS), Academy of Educational Planning and Management, Ministry of Education, Government of Pakistan.
5.1.5 Private Schools and Deeni Madrasahs12
5.10 Table 5.4 gives information about private schools and Deeni Madrasahs. At the national level, a total of 58,350 private schools were reported in FY 2007/08 and a total of 12,448 Deeni Madrasahs were mainstreamed.
Table 5.4 Private Schools and Deeni Madrasahs
S. No. Indicator FY 2007/08 FY 2008/09*
Target Actual Target Actual
1. No. of Private Schools
- 58,350 - -
2. No. of madrassas mainstreamed
- 12,448 - -
Note: Mosque schools are included in primary schools. Information about primary and Deeni Madrasas for FY 2008/09 is not available. Source: Pakistan Education Statistics 2007/08
5.1.7 Technical and Vocational Trainings
5.11 There is an established positive linkage between economic growth and investment in human capital. The establishment of National Vocational and Technical Education Commission (NAVTEC) and a coherent national policy for Technical and Vocational Education & Training (TVET) is expected to be a key driver of Pakistan’s economic growth. Pakistan’s global competitiveness depends on ability of our TVET system to adapt and innovate. Through industrial linkages, employment generation and growth supporting interventions for skill development, the Commission intends to contribute towards poverty alleviation in the country. It aims to provide adequate access to TVET facilities and cater for deficient areas and target groups such as women, workers of the informal sector and the destitute sections of society. During FY 2008/09, the target for the technical and vocational trainings were almost doubled i.e. 73,251 (91 percent) against 38,418 fixed for the last Year (see table 5.5). Whereas, the actual number of trainees decreased to 18 percent from 33, 001 in FY 2007/08 to 26,925 in
12 Schools where both religious and formal education is imparted.
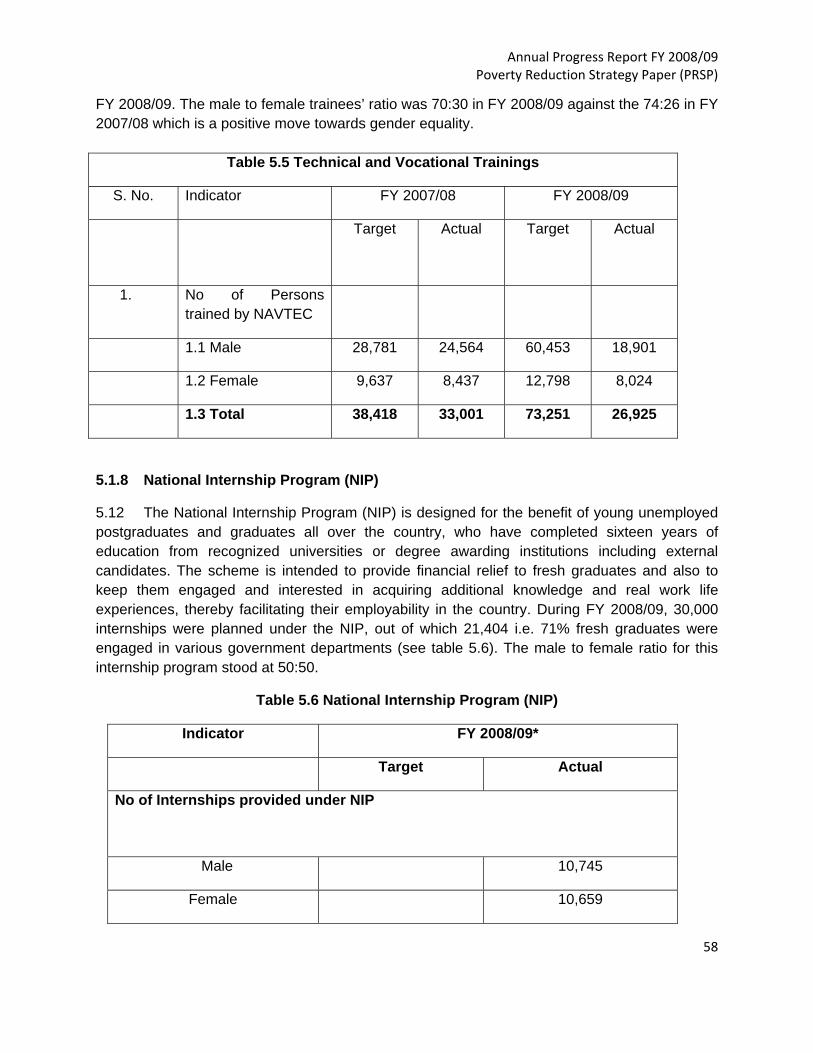
Annual Progress Report FY 2008/09 Poverty Reduction Strategy Paper (PRSP)
58
FY 2008/09. The male to female trainees’ ratio was 70:30 in FY 2008/09 against the 74:26 in FY 2007/08 which is a positive move towards gender equality.
Table 5.5 Technical and Vocational Trainings
S. No. Indicator FY 2007/08 FY 2008/09
Target Actual Target Actual
1. No of Persons trained by NAVTEC
1.1 Male 28,781 24,564 60,453 18,901
1.2 Female 9,637 8,437 12,798 8,024
1.3 Total 38,418 33,001 73,251 26,925
5.1.8 National Internship Program (NIP)
5.12 The National Internship Program (NIP) is designed for the benefit of young unemployed postgraduates and graduates all over the country, who have completed sixteen years of education from recognized universities or degree awarding institutions including external candidates. The scheme is intended to provide financial relief to fresh graduates and also to keep them engaged and interested in acquiring additional knowledge and real work life experiences, thereby facilitating their employability in the country. During FY 2008/09, 30,000 internships were planned under the NIP, out of which 21,404 i.e. 71% fresh graduates were engaged in various government departments (see table 5.6). The male to female ratio for this internship program stood at 50:50.
Table 5.6 National Internship Program (NIP)
Indicator FY 2008/09*
Target Actual
No of Internships provided under NIP
Male 10,745
Female 10,659

Annual Progress Report FY 2008/09 Poverty Reduction Strategy Paper (PRSP)
59
Total 30,000 21,404
Note: Data is not available for the FY 2007/08.
5.2 Health Sector
5.2.1 Performance of Intermediate (Output) Indicators
5.13 This section discusses the progress of some of the health sector intermediate (output) indicators such as; immunization coverage for pregnant women and children (aged 12-23 months); number of lady health workers and coverage of the lady health workers during FY 2008/09 compared with last year.
5.2.2 Immunization Coverage of Pregnant Women
5.14 Coverage of Tetanus Toxoid-1 (TT-1) and Tetanus Toxoid-2+ (TT-2+) immunization for pregnant women in every region is reported in table 5.7. At the national level, 7.42 million pregnant women were targeted for immunization in FY 2008/09 as compared to 7.17 million during FY 2007/08. A significant increase has been observed, as 51 and 54 percent women were immunized relative to 45 and 46 percent under TT-1and TT-2 respectively during the same period. Both TT-1 and TT-2 immunization coverage increased by 6 and 8 percentage points, respectively in FY 2008/09.
5.15 Among all regions, AJK had the highest coverage i.e. 61 percent for TT-1 immunization while FATA had the highest coverage of 68 percent under TT-2 immunization. However, FANA had the lowest coverage of 29 percent in TT-1 immunization while CDA had the lowest TT-2 immunization coverage of 16 percent in FY 2008/09. Punjab, Sindh, N.W.F.P FATA, Baluchistan and AJK witnessed an increase in the immunization coverage. The coverage in Punjab increased by 11 percentage points in TT-1 immunization and 12 percentage points in TT-2 immunization during FY 2008/09 compared to FY 2007/08. Immunization coverage in Sindh increased by 3 percentage points for TT-1 and 4 percentage points for TT-2. TT-2 immunization coverage in NWFP increased by 1 percentage points while it registered no change in TT-1 immunization coverage. Coverage in AJK increased by 1 percentage point for TT-2 and registered no change in TT-1 immunization coverage. TT-1 immunization coverage in FANA increased by 3 percentage points and registered decline of 8 percentage points in TT-2 immunization coverage. TT-1 immunization coverage in ICT13 decreased by 2 percentage points and registered no change in TT-2 immunization coverage. During FY 2008/09, a decline of 10 percentage points and an increase of 6 percentage points were observed in area under CDA under TT-2 and TT-1 immunization coverage, respectively.
13 Islamabad Capital Territory includes surrounding areas of Islamabad.

Annual Progress Report FY 2008/09 Poverty Reduction Strategy Paper (PRSP)
60
Table 5.7: TT- Immunization Coverage for Pregnant Women
Province/Region
FY 2007/08 FY 2008/09
TT-Immunization TT-Immunization
Target Population
TT-1 TT2+ Target Population
TT-1 TT2+
(+4.1 percent
Pop)
Cov percent
Cov percent
(+4.1 percent
Pop)
Cov percent
Cov percent
Punjab 3,855,974 47 48 39,78,194 58 60
Sindh 1,620,848 42 47 1,683,236 45 51
NWFP 949,041 43 40 984,117 43 41
FATA 153,688 38 38 164,416 55 68
Balochistan 340,664 31 31 354,656 31 33
AJK 150,866 61 56 156,866 61 57
FANA 50,905 26 41 45,583 29 33
ICT 18,242 41 30 19,184 39 30
CDA 34,970 26 26 36,770 32 16
Others - - - - - -
Pakistan 7,175,199 45 46 7,423,023 51 54
Source: Federal EPI/CDD Cell, National Institute of Health, Pakistan.
5.2.3 Immunization Coverage of Children 12-23 months
5.16 Immunization has a positive impact on reduction in child malnutrition as well as mortality. Full immunization of a child includes eight recommended vaccines – BCG, DPT1, DPT2, DPT3, Polio1, Polio 2, Polio 3 and measles. In the PSLM 2007/08, survey data on child immunization was collected using two methods, ‘recall’ and ‘record’. The analysis given below represents results based on both methods jointly.
Table 5.8: Percentage of Children 12-23 Months That Have Been Immunized
Province/Region FY 2006/07 PSLM FY 2007/08 PSLM
Male Female Both Male Female Both
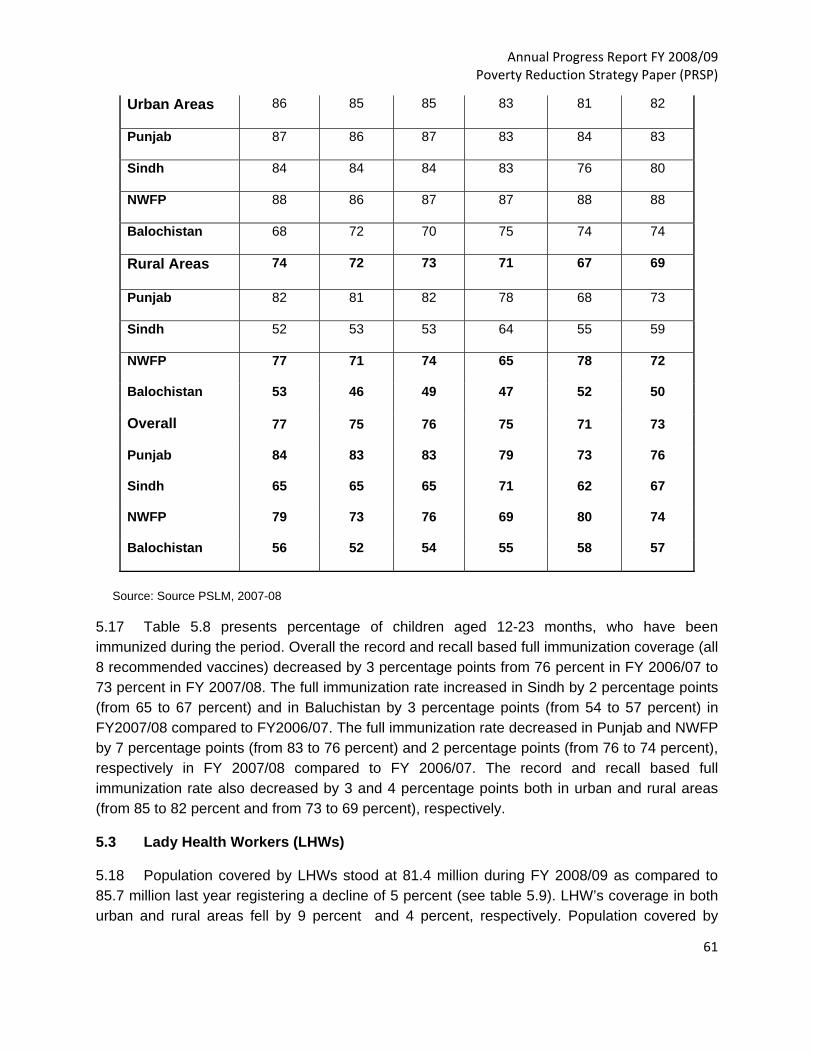
Annual Progress Report FY 2008/09 Poverty Reduction Strategy Paper (PRSP)
61
Urban Areas 86 85 85 83 81 82
Punjab 87 86 87 83 84 83
Sindh 84 84 84 83 76 80
NWFP 88 86 87 87 88 88
Balochistan 68 72 70 75 74 74
Rural Areas 74 72 73 71 67 69
Punjab 82 81 82 78 68 73
Sindh 52 53 53 64 55 59
NWFP 77 71 74 65 78 72
Balochistan 53 46 49 47 52 50
Overall 77 75 76 75 71 73
Punjab 84 83 83 79 73 76
Sindh 65 65 65 71 62 67
NWFP 79 73 76 69 80 74
Balochistan 56 52 54 55 58 57
Source: Source PSLM, 2007-08
5.17 Table 5.8 presents percentage of children aged 12-23 months, who have been immunized during the period. Overall the record and recall based full immunization coverage (all 8 recommended vaccines) decreased by 3 percentage points from 76 percent in FY 2006/07 to 73 percent in FY 2007/08. The full immunization rate increased in Sindh by 2 percentage points (from 65 to 67 percent) and in Baluchistan by 3 percentage points (from 54 to 57 percent) in FY2007/08 compared to FY2006/07. The full immunization rate decreased in Punjab and NWFP by 7 percentage points (from 83 to 76 percent) and 2 percentage points (from 76 to 74 percent), respectively in FY 2007/08 compared to FY 2006/07. The record and recall based full immunization rate also decreased by 3 and 4 percentage points both in urban and rural areas (from 85 to 82 percent and from 73 to 69 percent), respectively.
5.3 Lady Health Workers (LHWs)
5.18 Population covered by LHWs stood at 81.4 million during FY 2008/09 as compared to 85.7 million last year registering a decline of 5 percent (see table 5.9). LHW’s coverage in both urban and rural areas fell by 9 percent and 4 percent, respectively. Population covered by
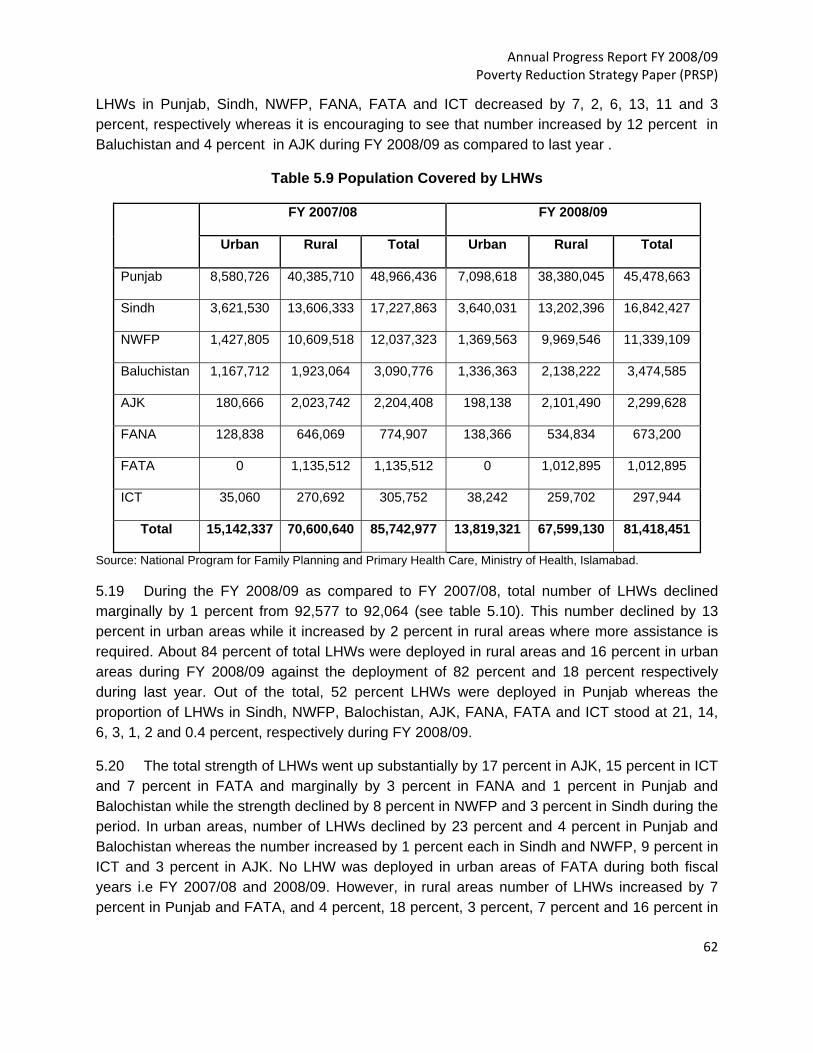
Annual Progress Report FY 2008/09 Poverty Reduction Strategy Paper (PRSP)
62
LHWs in Punjab, Sindh, NWFP, FANA, FATA and ICT decreased by 7, 2, 6, 13, 11 and 3 percent, respectively whereas it is encouraging to see that number increased by 12 percent in Baluchistan and 4 percent in AJK during FY 2008/09 as compared to last year .
Table 5.9 Population Covered by LHWs
FY 2007/08 FY 2008/09
Urban Rural Total Urban Rural Total
Punjab 8,580,726 40,385,710 48,966,436 7,098,618 38,380,045 45,478,663
Sindh 3,621,530 13,606,333 17,227,863 3,640,031 13,202,396 16,842,427
NWFP 1,427,805 10,609,518 12,037,323 1,369,563 9,969,546 11,339,109
Baluchistan 1,167,712 1,923,064 3,090,776 1,336,363 2,138,222 3,474,585
AJK 180,666 2,023,742 2,204,408 198,138 2,101,490 2,299,628
FANA 128,838 646,069 774,907 138,366 534,834 673,200
FATA 0 1,135,512 1,135,512 0 1,012,895 1,012,895
ICT 35,060 270,692 305,752 38,242 259,702 297,944
Total 15,142,337 70,600,640 85,742,977 13,819,321 67,599,130 81,418,451
Source: National Program for Family Planning and Primary Health Care, Ministry of Health, Islamabad.
5.19 During the FY 2008/09 as compared to FY 2007/08, total number of LHWs declined marginally by 1 percent from 92,577 to 92,064 (see table 5.10). This number declined by 13 percent in urban areas while it increased by 2 percent in rural areas where more assistance is required. About 84 percent of total LHWs were deployed in rural areas and 16 percent in urban areas during FY 2008/09 against the deployment of 82 percent and 18 percent respectively during last year. Out of the total, 52 percent LHWs were deployed in Punjab whereas the proportion of LHWs in Sindh, NWFP, Balochistan, AJK, FANA, FATA and ICT stood at 21, 14, 6, 3, 1, 2 and 0.4 percent, respectively during FY 2008/09.
5.20 The total strength of LHWs went up substantially by 17 percent in AJK, 15 percent in ICT and 7 percent in FATA and marginally by 3 percent in FANA and 1 percent in Punjab and Balochistan while the strength declined by 8 percent in NWFP and 3 percent in Sindh during the period. In urban areas, number of LHWs declined by 23 percent and 4 percent in Punjab and Balochistan whereas the number increased by 1 percent each in Sindh and NWFP, 9 percent in ICT and 3 percent in AJK. No LHW was deployed in urban areas of FATA during both fiscal years i.e FY 2007/08 and 2008/09. However, in rural areas number of LHWs increased by 7 percent in Punjab and FATA, and 4 percent, 18 percent, 3 percent, 7 percent and 16 percent in
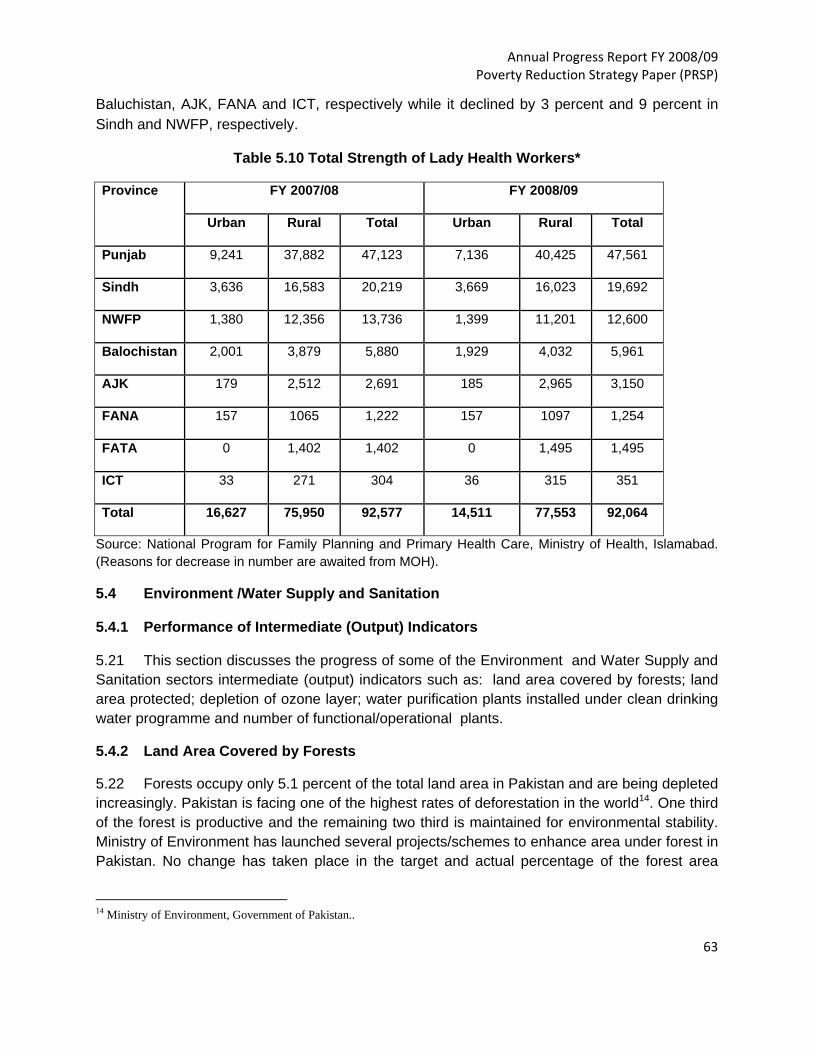
Annual Progress Report FY 2008/09 Poverty Reduction Strategy Paper (PRSP)
63
Baluchistan, AJK, FANA and ICT, respectively while it declined by 3 percent and 9 percent in Sindh and NWFP, respectively.
Table 5.10 Total Strength of Lady Health Workers*
Province FY 2007/08 FY 2008/09
Urban Rural Total Urban Rural Total
Punjab 9,241 37,882 47,123 7,136 40,425 47,561
Sindh 3,636 16,583 20,219 3,669 16,023 19,692
NWFP 1,380 12,356 13,736 1,399 11,201 12,600
Balochistan 2,001 3,879 5,880 1,929 4,032 5,961
AJK 179 2,512 2,691 185 2,965 3,150
FANA 157 1065 1,222 157 1097 1,254
FATA 0 1,402 1,402 0 1,495 1,495
ICT 33 271 304 36 315 351
Total 16,627 75,950 92,577 14,511 77,553 92,064
Source: National Program for Family Planning and Primary Health Care, Ministry of Health, Islamabad. (Reasons for decrease in number are awaited from MOH).
5.4 Environment /Water Supply and Sanitation
5.4.1 Performance of Intermediate (Output) Indicators
5.21 This section discusses the progress of some of the Environment and Water Supply and Sanitation sectors intermediate (output) indicators such as: land area covered by forests; land area protected; depletion of ozone layer; water purification plants installed under clean drinking water programme and number of functional/operational plants.
5.4.2 Land Area Covered by Forests
5.22 Forests occupy only 5.1 percent of the total land area in Pakistan and are being depleted increasingly. Pakistan is facing one of the highest rates of deforestation in the world14. One third of the forest is productive and the remaining two third is maintained for environmental stability. Ministry of Environment has launched several projects/schemes to enhance area under forest in Pakistan. No change has taken place in the target and actual percentage of the forest area
14 Ministry of Environment, Government of Pakistan..
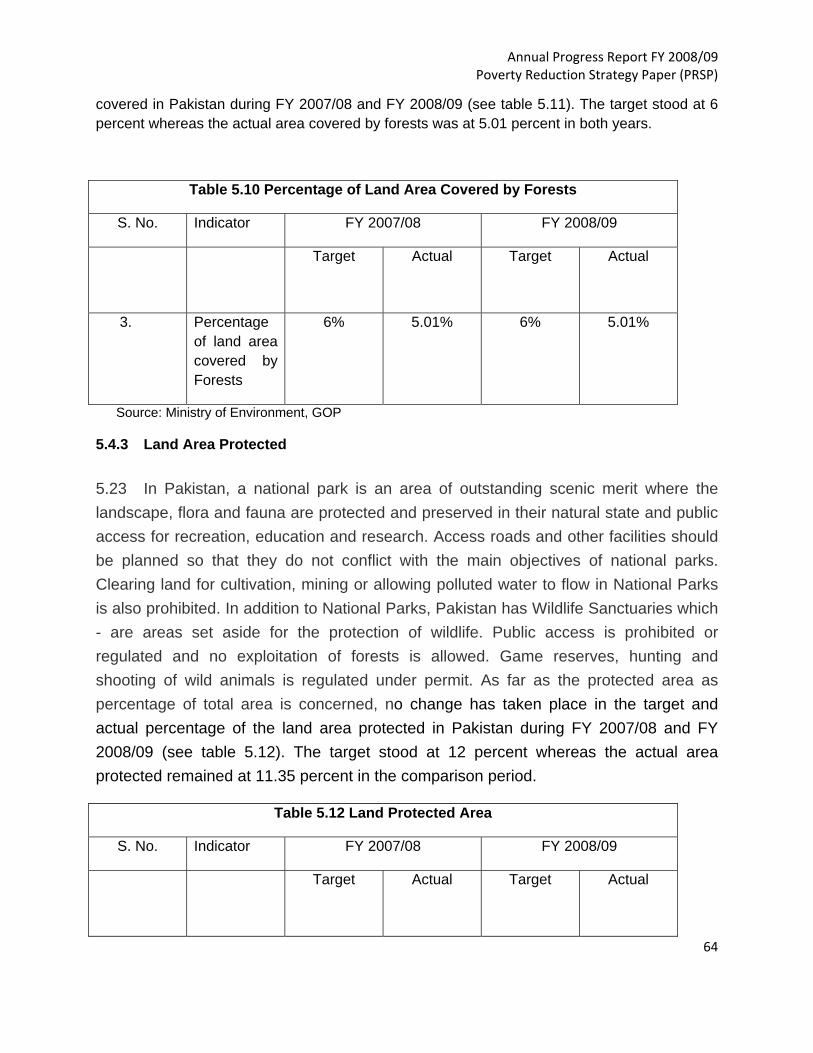
Annual Progress Report FY 2008/09 Poverty Reduction Strategy Paper (PRSP)
64
covered in Pakistan during FY 2007/08 and FY 2008/09 (see table 5.11). The target stood at 6 percent whereas the actual area covered by forests was at 5.01 percent in both years.
Table 5.10 Percentage of Land Area Covered by Forests
S. No. Indicator FY 2007/08 FY 2008/09
Target Actual Target Actual
3. Percentage of land area covered by Forests
6% 5.01% 6% 5.01%
Source: Ministry of Environment, GOP
5.4.3 Land Area Protected
5.23 In Pakistan, a national park is an area of outstanding scenic merit where the landscape, flora and fauna are protected and preserved in their natural state and public access for recreation, education and research. Access roads and other facilities should be planned so that they do not conflict with the main objectives of national parks. Clearing land for cultivation, mining or allowing polluted water to flow in National Parks is also prohibited. In addition to National Parks, Pakistan has Wildlife Sanctuaries which - are areas set aside for the protection of wildlife. Public access is prohibited or regulated and no exploitation of forests is allowed. Game reserves, hunting and shooting of wild animals is regulated under permit. As far as the protected area as percentage of total area is concerned, no change has taken place in the target and actual percentage of the land area protected in Pakistan during FY 2007/08 and FY 2008/09 (see table 5.12). The target stood at 12 percent whereas the actual area protected remained at 11.35 percent in the comparison period.
Table 5.12 Land Protected Area
S. No. Indicator FY 2007/08 FY 2008/09
Target Actual Target Actual
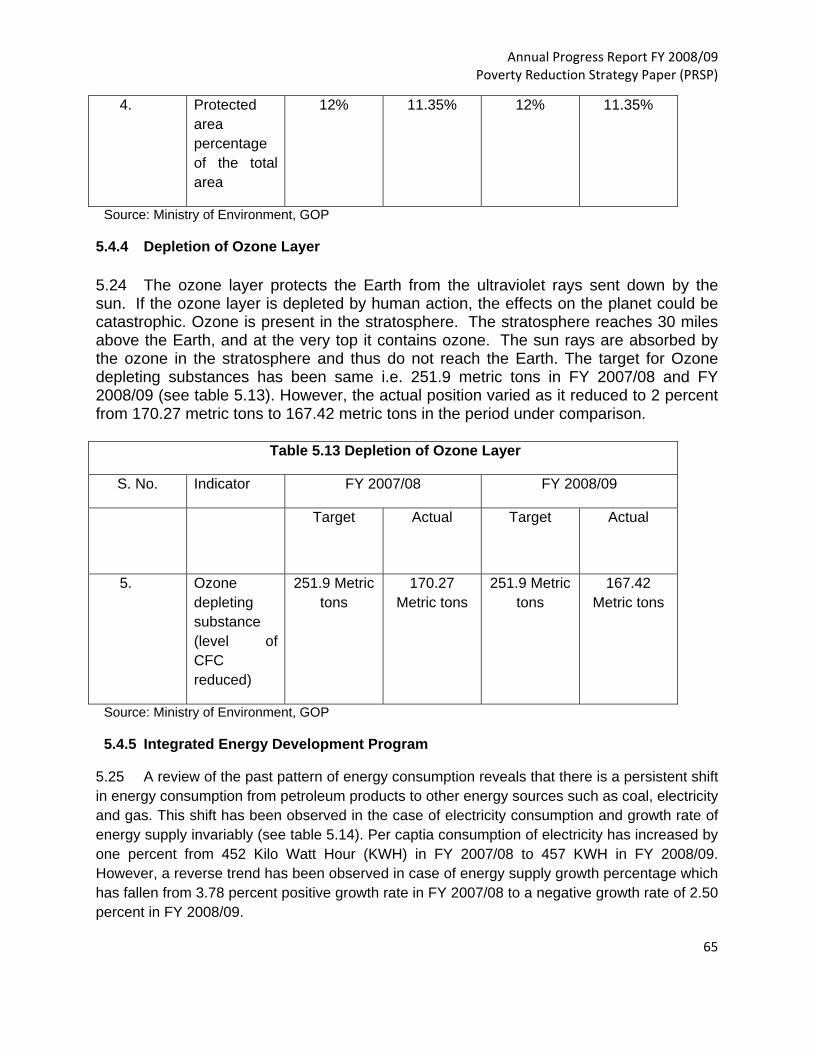
Annual Progress Report FY 2008/09 Poverty Reduction Strategy Paper (PRSP)
65
4. Protected area percentage of the total area
12% 11.35% 12% 11.35%
Source: Ministry of Environment, GOP
5.4.4 Depletion of Ozone Layer
5.24 The ozone layer protects the Earth from the ultraviolet rays sent down by the sun. If the ozone layer is depleted by human action, the effects on the planet could be catastrophic. Ozone is present in the stratosphere. The stratosphere reaches 30 miles above the Earth, and at the very top it contains ozone. The sun rays are absorbed by the ozone in the stratosphere and thus do not reach the Earth. The target for Ozone depleting substances has been same i.e. 251.9 metric tons in FY 2007/08 and FY 2008/09 (see table 5.13). However, the actual position varied as it reduced to 2 percent from 170.27 metric tons to 167.42 metric tons in the period under comparison.
Table 5.13 Depletion of Ozone Layer
S. No. Indicator FY 2007/08 FY 2008/09
Target Actual Target Actual
5. Ozone depleting substance (level of CFC reduced)
251.9 Metric tons
170.27 Metric tons
251.9 Metric tons
167.42 Metric tons
Source: Ministry of Environment, GOP
5.4.5 Integrated Energy Development Program
5.25 A review of the past pattern of energy consumption reveals that there is a persistent shift in energy consumption from petroleum products to other energy sources such as coal, electricity and gas. This shift has been observed in the case of electricity consumption and growth rate of energy supply invariably (see table 5.14). Per captia consumption of electricity has increased by one percent from 452 Kilo Watt Hour (KWH) in FY 2007/08 to 457 KWH in FY 2008/09. However, a reverse trend has been observed in case of energy supply growth percentage which has fallen from 3.78 percent positive growth rate in FY 2007/08 to a negative growth rate of 2.50 percent in FY 2008/09.

Annual Progress Report FY 2008/09 Poverty Reduction Strategy Paper (PRSP)
66
Table 5.14 Integrated Energy Development
S. No. Indicator FY 2007/08 FY 2008/09*
Target Actual Target Actual
1. Per capita consumption of electricity (KWH)
452 KWH 457 KWH
2. Energy supplies growth (%)
3.78% -2.50%
Source: Ministry of Petroleum and Natural Resources, GOP Note*: Based on 9 months data
5.4.6 Water Supply and Sanitation
5.26 It is priority of the Government to provide clean drinking water to its people. Unfortunately, most of the water sources are contaminated and there is no proper mechanism exits whereby poor people could get clean water (both biologically and chemically treated). Safe drinking water supplied through water purification plants provides safeguard to human health, including reduction in the mortality rate (associated with lack of access to safe drinking water, inadequate sanitation and poor hygiene) by improving the quality of drinking water. Against the target of 2,721 water purification plants to be installed in FY 2008/09 (see table 5.15), 28 percent i.e. 775 plants have been installed out of which 88% i.e. 680 plants are functional now.
Table 5.15 Water Supply through Water Purification Plants
S. No. Indicator FY 2007/08 FY 2008/09*
Target Actual Target Actual
1. No. of water purification plants installed under clean drinking water program
- - 2721 775
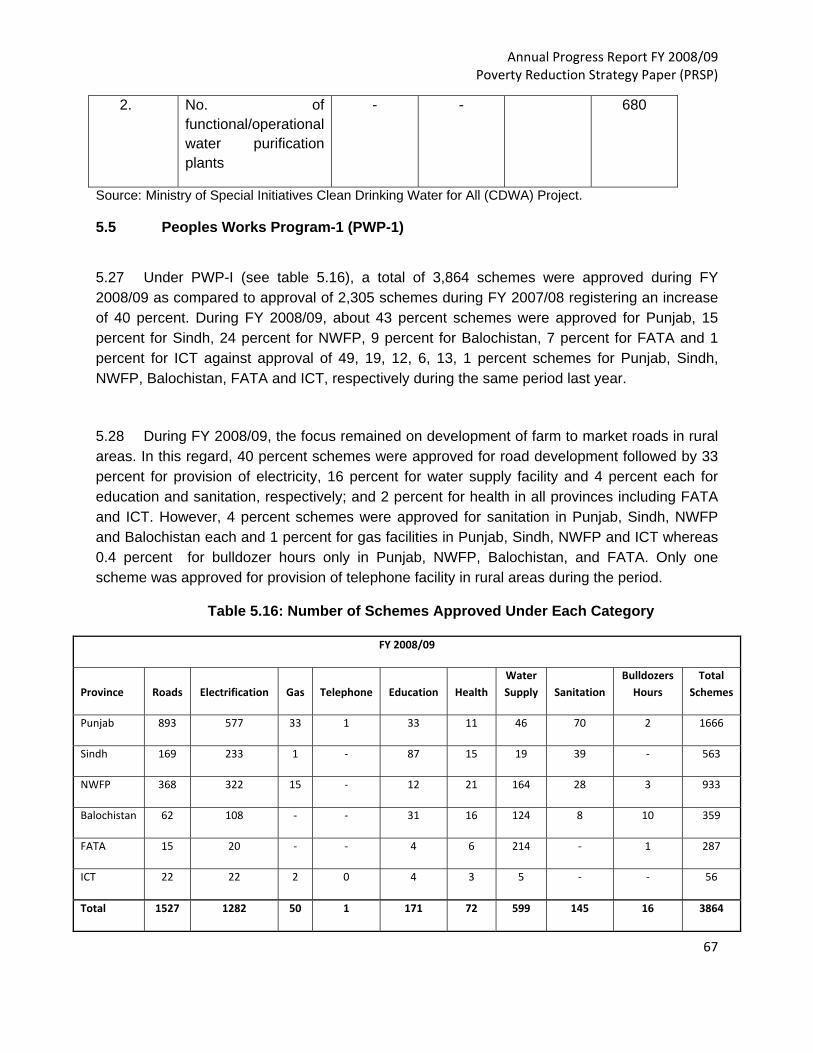
Annual Progress Report FY 2008/09 Poverty Reduction Strategy Paper (PRSP)
67
2. No. of functional/operational water purification plants
- - 680
Source: Ministry of Special Initiatives Clean Drinking Water for All (CDWA) Project.
5.5 Peoples Works Program-1 (PWP-1)
5.27 Under PWP-I (see table 5.16), a total of 3,864 schemes were approved during FY 2008/09 as compared to approval of 2,305 schemes during FY 2007/08 registering an increase of 40 percent. During FY 2008/09, about 43 percent schemes were approved for Punjab, 15 percent for Sindh, 24 percent for NWFP, 9 percent for Balochistan, 7 percent for FATA and 1 percent for ICT against approval of 49, 19, 12, 6, 13, 1 percent schemes for Punjab, Sindh, NWFP, Balochistan, FATA and ICT, respectively during the same period last year.
5.28 During FY 2008/09, the focus remained on development of farm to market roads in rural areas. In this regard, 40 percent schemes were approved for road development followed by 33 percent for provision of electricity, 16 percent for water supply facility and 4 percent each for education and sanitation, respectively; and 2 percent for health in all provinces including FATA and ICT. However, 4 percent schemes were approved for sanitation in Punjab, Sindh, NWFP and Balochistan each and 1 percent for gas facilities in Punjab, Sindh, NWFP and ICT whereas 0.4 percent for bulldozer hours only in Punjab, NWFP, Balochistan, and FATA. Only one scheme was approved for provision of telephone facility in rural areas during the period.
Table 5.16: Number of Schemes Approved Under Each Category
FY 2008/09
Province Roads Electrification Gas Telephone Education Health Water Supply Sanitation
Bulldozers Hours
Total Schemes
Punjab 893 577 33 1 33 11 46 70 2 1666
Sindh 169 233 1 ‐ 87 15 19 39 ‐ 563
NWFP 368 322 15 ‐ 12 21 164 28 3 933
Balochistan 62 108 ‐ ‐ 31 16 124 8 10 359
FATA 15 20 ‐ ‐ 4 6 214 ‐ 1 287
ICT 22 22 2 0 4 3 5 ‐ ‐ 56
Total 1527 1282 50 1 171 72 599 145 16 3864
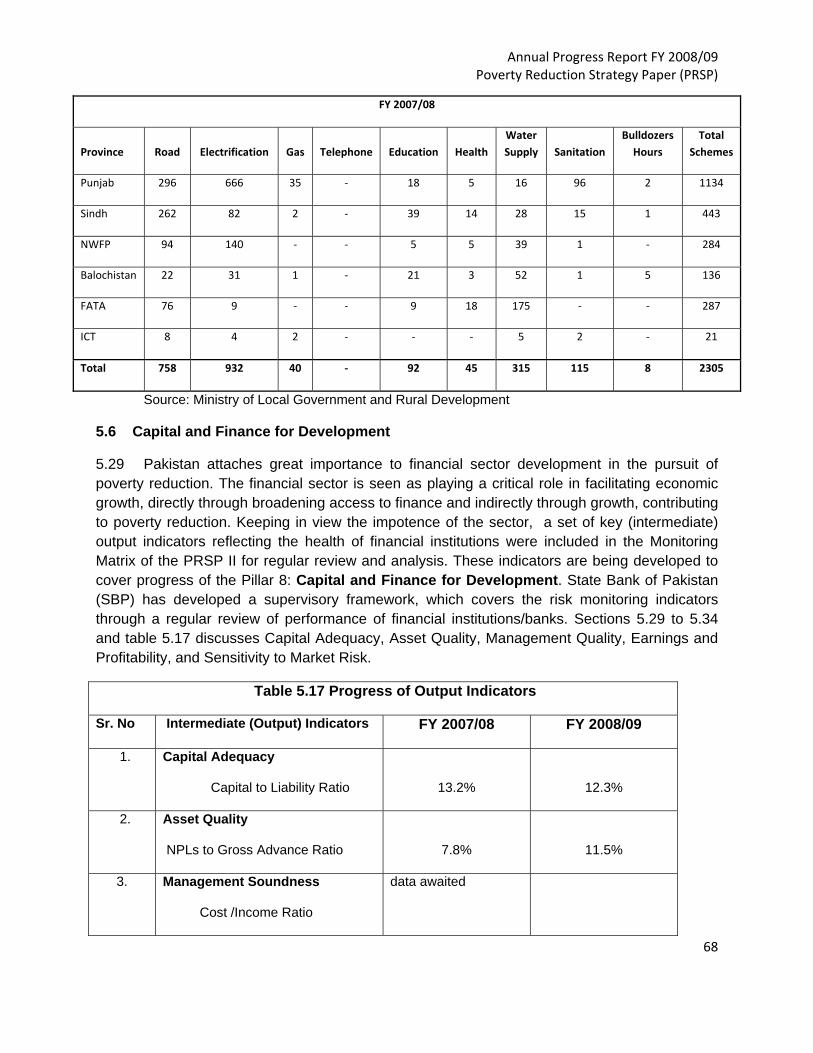
Annual Progress Report FY 2008/09 Poverty Reduction Strategy Paper (PRSP)
68
FY 2007/08
Province Road Electrification Gas Telephone Education Health Water Supply Sanitation
Bulldozers Hours
Total Schemes
Punjab 296 666 35 ‐ 18 5 16 96 2 1134
Sindh 262 82 2 ‐ 39 14 28 15 1 443
NWFP 94 140 ‐ ‐ 5 5 39 1 ‐ 284
Balochistan 22 31 1 ‐ 21 3 52 1 5 136
FATA 76 9 ‐ ‐ 9 18 175 ‐ ‐ 287
ICT 8 4 2 ‐ ‐ ‐ 5 2 ‐ 21
Total 758 932 40 ‐ 92 45 315 115 8 2305
Source: Ministry of Local Government and Rural Development
5.6 Capital and Finance for Development
5.29 Pakistan attaches great importance to financial sector development in the pursuit of poverty reduction. The financial sector is seen as playing a critical role in facilitating economic growth, directly through broadening access to finance and indirectly through growth, contributing to poverty reduction. Keeping in view the impotence of the sector, a set of key (intermediate) output indicators reflecting the health of financial institutions were included in the Monitoring Matrix of the PRSP II for regular review and analysis. These indicators are being developed to cover progress of the Pillar 8: Capital and Finance for Development. State Bank of Pakistan (SBP) has developed a supervisory framework, which covers the risk monitoring indicators through a regular review of performance of financial institutions/banks. Sections 5.29 to 5.34 and table 5.17 discusses Capital Adequacy, Asset Quality, Management Quality, Earnings and Profitability, and Sensitivity to Market Risk.
Table 5.17 Progress of Output Indicators
Sr. No Intermediate (Output) Indicators FY 2007/08 FY 2008/09
1. Capital Adequacy
Capital to Liability Ratio
13.2%
12.3%
2. Asset Quality
NPLs to Gross Advance Ratio
7.8%
11.5%
3. Management Soundness
Cost /Income Ratio
data awaited
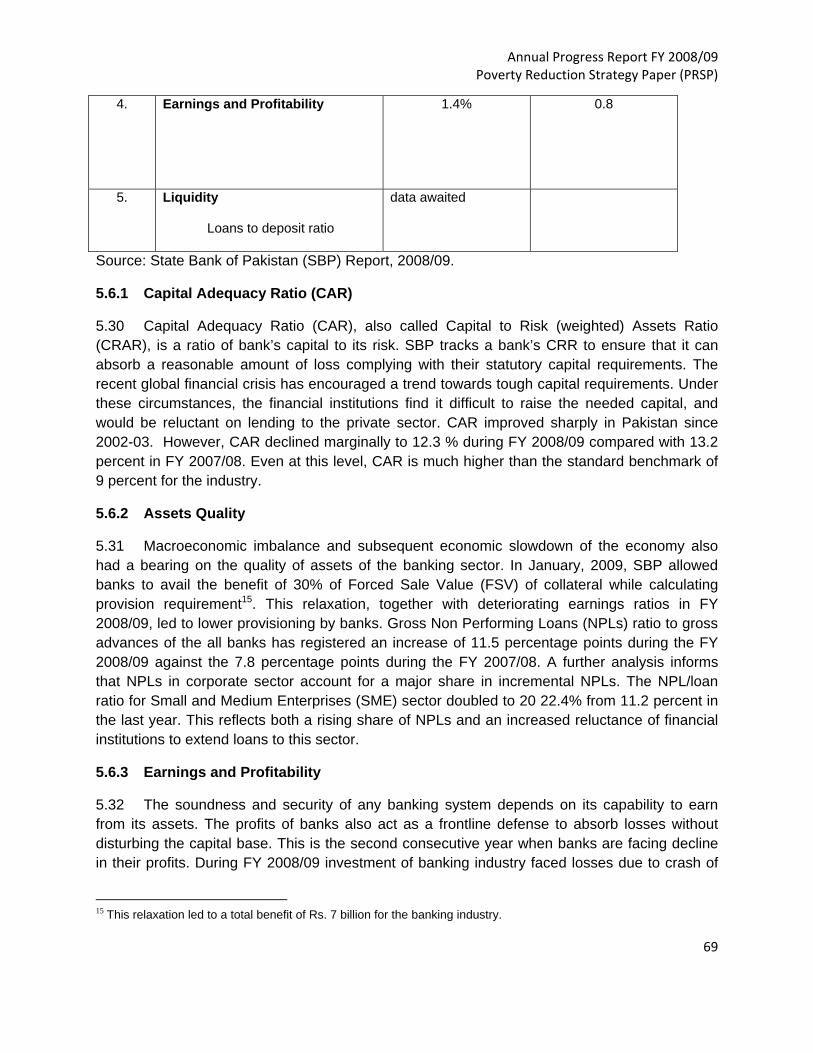
Annual Progress Report FY 2008/09 Poverty Reduction Strategy Paper (PRSP)
69
4. Earnings and Profitability
1.4% 0.8
5. Liquidity
Loans to deposit ratio
data awaited
Source: State Bank of Pakistan (SBP) Report, 2008/09.
5.6.1 Capital Adequacy Ratio (CAR)
5.30 Capital Adequacy Ratio (CAR), also called Capital to Risk (weighted) Assets Ratio (CRAR), is a ratio of bank’s capital to its risk. SBP tracks a bank’s CRR to ensure that it can absorb a reasonable amount of loss complying with their statutory capital requirements. The recent global financial crisis has encouraged a trend towards tough capital requirements. Under these circumstances, the financial institutions find it difficult to raise the needed capital, and would be reluctant on lending to the private sector. CAR improved sharply in Pakistan since 2002-03. However, CAR declined marginally to 12.3 % during FY 2008/09 compared with 13.2 percent in FY 2007/08. Even at this level, CAR is much higher than the standard benchmark of 9 percent for the industry.
5.6.2 Assets Quality
5.31 Macroeconomic imbalance and subsequent economic slowdown of the economy also had a bearing on the quality of assets of the banking sector. In January, 2009, SBP allowed banks to avail the benefit of 30% of Forced Sale Value (FSV) of collateral while calculating provision requirement15. This relaxation, together with deteriorating earnings ratios in FY 2008/09, led to lower provisioning by banks. Gross Non Performing Loans (NPLs) ratio to gross advances of the all banks has registered an increase of 11.5 percentage points during the FY 2008/09 against the 7.8 percentage points during the FY 2007/08. A further analysis informs that NPLs in corporate sector account for a major share in incremental NPLs. The NPL/loan ratio for Small and Medium Enterprises (SME) sector doubled to 20 22.4% from 11.2 percent in the last year. This reflects both a rising share of NPLs and an increased reluctance of financial institutions to extend loans to this sector.
5.6.3 Earnings and Profitability
5.32 The soundness and security of any banking system depends on its capability to earn from its assets. The profits of banks also act as a frontline defense to absorb losses without disturbing the capital base. This is the second consecutive year when banks are facing decline in their profits. During FY 2008/09 investment of banking industry faced losses due to crash of
15 This relaxation led to a total benefit of Rs. 7 billion for the banking industry.
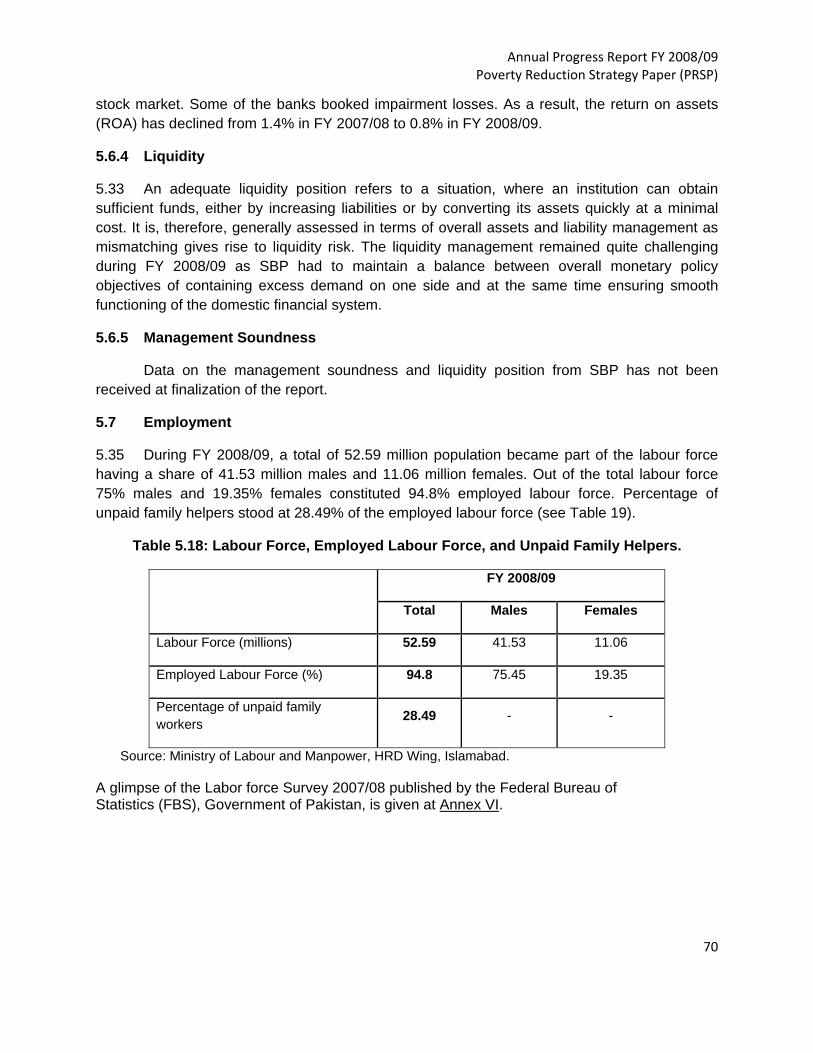
Annual Progress Report FY 2008/09 Poverty Reduction Strategy Paper (PRSP)
70
stock market. Some of the banks booked impairment losses. As a result, the return on assets (ROA) has declined from 1.4% in FY 2007/08 to 0.8% in FY 2008/09.
5.6.4 Liquidity
5.33 An adequate liquidity position refers to a situation, where an institution can obtain sufficient funds, either by increasing liabilities or by converting its assets quickly at a minimal cost. It is, therefore, generally assessed in terms of overall assets and liability management as mismatching gives rise to liquidity risk. The liquidity management remained quite challenging during FY 2008/09 as SBP had to maintain a balance between overall monetary policy objectives of containing excess demand on one side and at the same time ensuring smooth functioning of the domestic financial system.
5.6.5 Management Soundness
Data on the management soundness and liquidity position from SBP has not been received at finalization of the report.
5.7 Employment
5.35 During FY 2008/09, a total of 52.59 million population became part of the labour force having a share of 41.53 million males and 11.06 million females. Out of the total labour force 75% males and 19.35% females constituted 94.8% employed labour force. Percentage of unpaid family helpers stood at 28.49% of the employed labour force (see Table 19).
Table 5.18: Labour Force, Employed Labour Force, and Unpaid Family Helpers.
FY 2008/09
Total Males Females
Labour Force (millions) 52.59 41.53 11.06
Employed Labour Force (%) 94.8 75.45 19.35
Percentage of unpaid family workers 28.49 - -
Source: Ministry of Labour and Manpower, HRD Wing, Islamabad.
A glimpse of the Labor force Survey 2007/08 published by the Federal Bureau of Statistics (FBS), Government of Pakistan, is given at Annex VI.
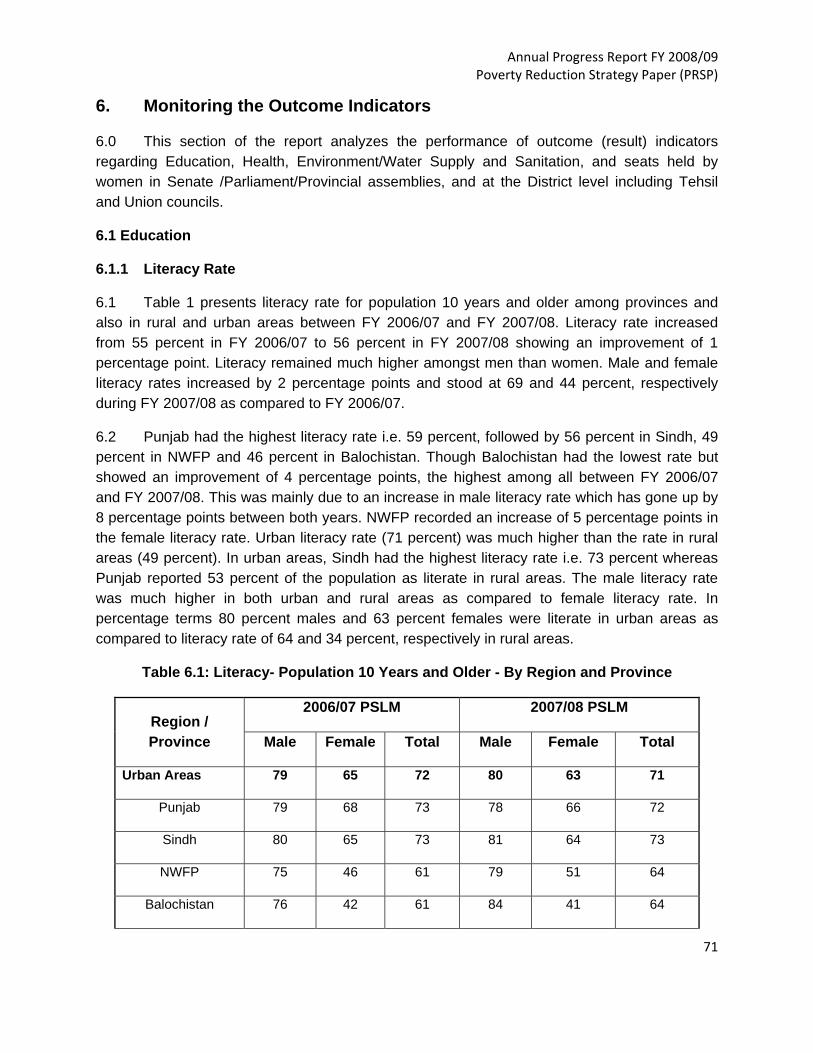
Annual Progress Report FY 2008/09 Poverty Reduction Strategy Paper (PRSP)
71
6. Monitoring the Outcome Indicators
6.0 This section of the report analyzes the performance of outcome (result) indicators regarding Education, Health, Environment/Water Supply and Sanitation, and seats held by women in Senate /Parliament/Provincial assemblies, and at the District level including Tehsil and Union councils.
6.1 Education
6.1.1 Literacy Rate
6.1 Table 1 presents literacy rate for population 10 years and older among provinces and also in rural and urban areas between FY 2006/07 and FY 2007/08. Literacy rate increased from 55 percent in FY 2006/07 to 56 percent in FY 2007/08 showing an improvement of 1 percentage point. Literacy remained much higher amongst men than women. Male and female literacy rates increased by 2 percentage points and stood at 69 and 44 percent, respectively during FY 2007/08 as compared to FY 2006/07.
6.2 Punjab had the highest literacy rate i.e. 59 percent, followed by 56 percent in Sindh, 49 percent in NWFP and 46 percent in Balochistan. Though Balochistan had the lowest rate but showed an improvement of 4 percentage points, the highest among all between FY 2006/07 and FY 2007/08. This was mainly due to an increase in male literacy rate which has gone up by 8 percentage points between both years. NWFP recorded an increase of 5 percentage points in the female literacy rate. Urban literacy rate (71 percent) was much higher than the rate in rural areas (49 percent). In urban areas, Sindh had the highest literacy rate i.e. 73 percent whereas Punjab reported 53 percent of the population as literate in rural areas. The male literacy rate was much higher in both urban and rural areas as compared to female literacy rate. In percentage terms 80 percent males and 63 percent females were literate in urban areas as compared to literacy rate of 64 and 34 percent, respectively in rural areas.
Table 6.1: Literacy- Population 10 Years and Older - By Region and Province
Region / Province
2006/07 PSLM 2007/08 PSLM
Male Female Total Male Female Total
Urban Areas 79 65 72 80 63 71
Punjab 79 68 73 78 66 72
Sindh 80 65 73 81 64 73
NWFP 75 46 61 79 51 64
Balochistan 76 42 61 84 41 64
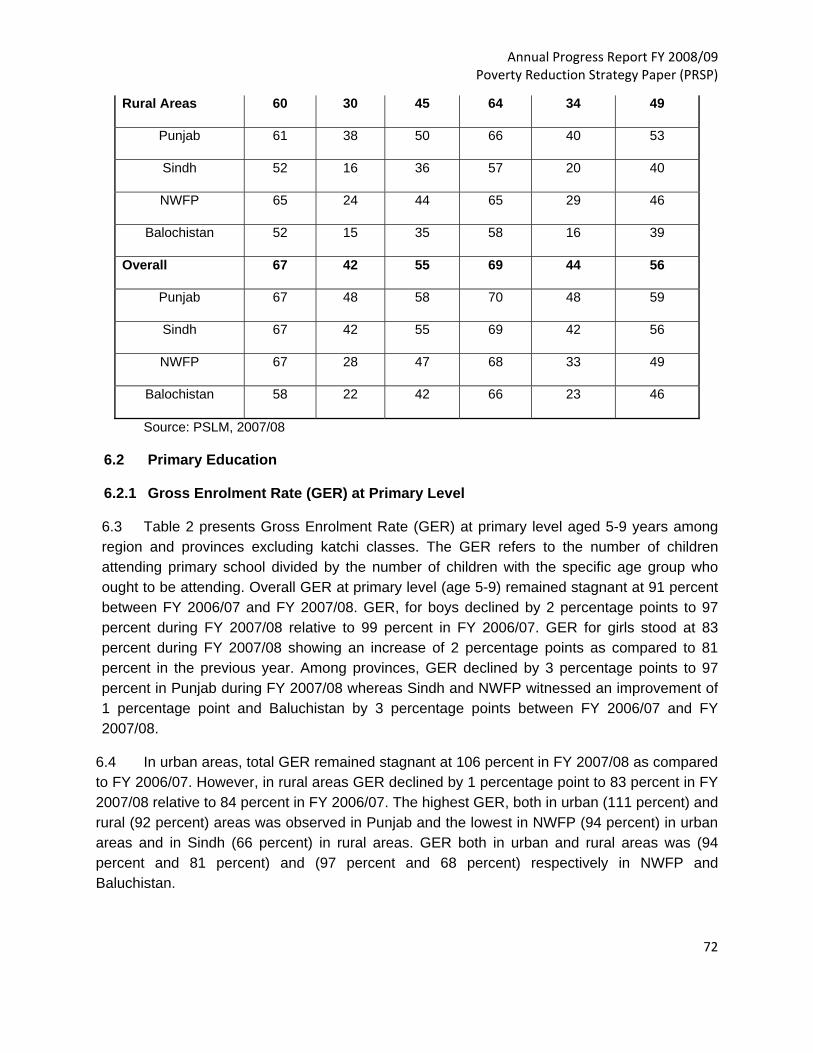
Annual Progress Report FY 2008/09 Poverty Reduction Strategy Paper (PRSP)
72
Rural Areas 60 30 45 64 34 49
Punjab 61 38 50 66 40 53
Sindh 52 16 36 57 20 40
NWFP 65 24 44 65 29 46
Balochistan 52 15 35 58 16 39
Overall 67 42 55 69 44 56
Punjab 67 48 58 70 48 59
Sindh 67 42 55 69 42 56
NWFP 67 28 47 68 33 49
Balochistan 58 22 42 66 23 46
Source: PSLM, 2007/08
6.2 Primary Education
6.2.1 Gross Enrolment Rate (GER) at Primary Level
6.3 Table 2 presents Gross Enrolment Rate (GER) at primary level aged 5-9 years among region and provinces excluding katchi classes. The GER refers to the number of children attending primary school divided by the number of children with the specific age group who ought to be attending. Overall GER at primary level (age 5-9) remained stagnant at 91 percent between FY 2006/07 and FY 2007/08. GER, for boys declined by 2 percentage points to 97 percent during FY 2007/08 relative to 99 percent in FY 2006/07. GER for girls stood at 83 percent during FY 2007/08 showing an increase of 2 percentage points as compared to 81 percent in the previous year. Among provinces, GER declined by 3 percentage points to 97 percent in Punjab during FY 2007/08 whereas Sindh and NWFP witnessed an improvement of 1 percentage point and Baluchistan by 3 percentage points between FY 2006/07 and FY 2007/08.
6.4 In urban areas, total GER remained stagnant at 106 percent in FY 2007/08 as compared to FY 2006/07. However, in rural areas GER declined by 1 percentage point to 83 percent in FY 2007/08 relative to 84 percent in FY 2006/07. The highest GER, both in urban (111 percent) and rural (92 percent) areas was observed in Punjab and the lowest in NWFP (94 percent) in urban areas and in Sindh (66 percent) in rural areas. GER both in urban and rural areas was (94 percent and 81 percent) and (97 percent and 68 percent) respectively in NWFP and Baluchistan.
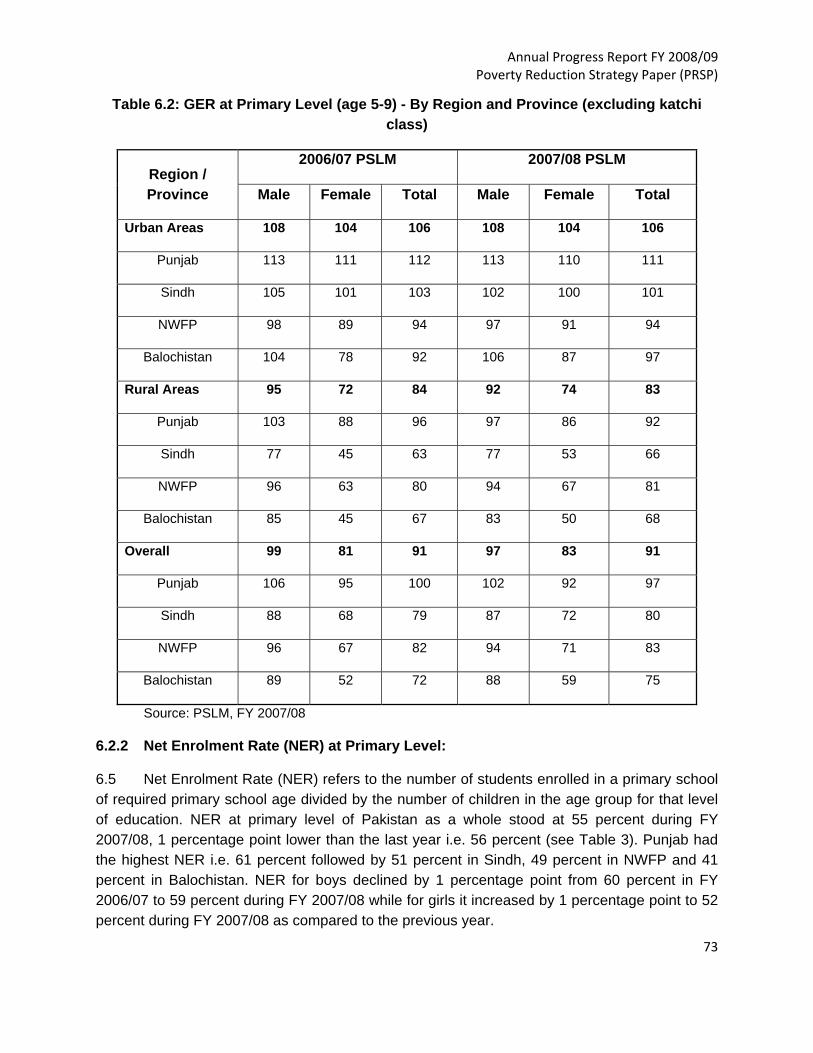
Annual Progress Report FY 2008/09 Poverty Reduction Strategy Paper (PRSP)
73
Table 6.2: GER at Primary Level (age 5-9) - By Region and Province (excluding katchi class)
Region / Province
2006/07 PSLM 2007/08 PSLM
Male Female Total Male Female Total
Urban Areas 108 104 106 108 104 106
Punjab 113 111 112 113 110 111
Sindh 105 101 103 102 100 101
NWFP 98 89 94 97 91 94
Balochistan 104 78 92 106 87 97
Rural Areas 95 72 84 92 74 83
Punjab 103 88 96 97 86 92
Sindh 77 45 63 77 53 66
NWFP 96 63 80 94 67 81
Balochistan 85 45 67 83 50 68
Overall 99 81 91 97 83 91
Punjab 106 95 100 102 92 97
Sindh 88 68 79 87 72 80
NWFP 96 67 82 94 71 83
Balochistan 89 52 72 88 59 75
Source: PSLM, FY 2007/08
6.2.2 Net Enrolment Rate (NER) at Primary Level:
6.5 Net Enrolment Rate (NER) refers to the number of students enrolled in a primary school of required primary school age divided by the number of children in the age group for that level of education. NER at primary level of Pakistan as a whole stood at 55 percent during FY 2007/08, 1 percentage point lower than the last year i.e. 56 percent (see Table 3). Punjab had the highest NER i.e. 61 percent followed by 51 percent in Sindh, 49 percent in NWFP and 41 percent in Balochistan. NER for boys declined by 1 percentage point from 60 percent in FY 2006/07 to 59 percent during FY 2007/08 while for girls it increased by 1 percentage point to 52 percent during FY 2007/08 as compared to the previous year.

Annual Progress Report FY 2008/09 Poverty Reduction Strategy Paper (PRSP)
74
6.6 Among provinces, NER for boys declined by 2 percentage points in Punjab and Balochistan and by 1 percentage point in Sindh and NWFP between FY 2006/07 and FY 2007/08 while girls net enrolment in Punjab (59 percent) and NWFP (41 percent) remained stagnant but increased by 3 percentage points in both Sindh and Balochistan. Total NER in urban areas remained the same i.e. 66 percent during FY 2007/08 relative to FY 2006/07 whereas NER fell slightly by 1 percentage point to 51 percent in rural areas. Punjab had the highest NER in urban areas (71 percent), having increased by 1 percentage point during FY 2007/08 and also in rural areas (56 percent) though declined by 3 percentage points during FY 2007/08 compared to last year. NER for girls was higher i.e. 67 percent in urban areas while in rural areas the NER was higher for boys at 56 percent.
Table 6.3: NER at Primary Level (age 5-9) - By Region and Province (excluding katchi class)
Region / Province
FY 2006/07 PSLM FY 2007/08 PSLM
Male Female Total Male Female Total
Urban Areas 67 65 66 66 67 66
Punjab 69 70 70 71 72 71
Sindh 67 61 64 61 62 62
NWFP 59 53 56 59 55 57
Balochistan 58 49 54 61 53 57
Rural Areas 57 46 52 56 46 51
Punjab 62 55 59 59 54 56
Sindh 49 31 41 51 35 44
NWFP 56 39 48 55 39 47
Balochistan 46 28 38 42 29 36
Overall 60 51 56 59 52 55
Punjab 64 59 62 62 59 61
Sindh 56 43 50 55 46 51
NWFP 56 41 49 55 41 49
Balochistan 49 32 41 47 35 41
Source: PSLM, 2007/08
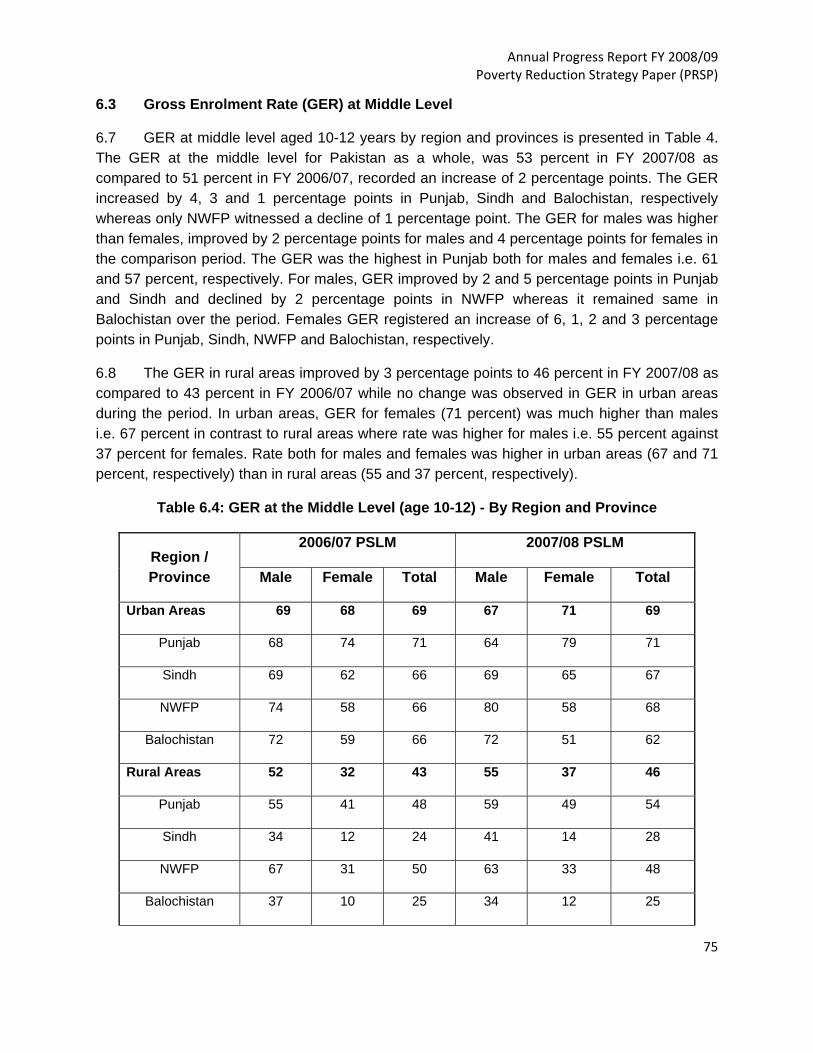
Annual Progress Report FY 2008/09 Poverty Reduction Strategy Paper (PRSP)
75
6.3 Gross Enrolment Rate (GER) at Middle Level
6.7 GER at middle level aged 10-12 years by region and provinces is presented in Table 4. The GER at the middle level for Pakistan as a whole, was 53 percent in FY 2007/08 as compared to 51 percent in FY 2006/07, recorded an increase of 2 percentage points. The GER increased by 4, 3 and 1 percentage points in Punjab, Sindh and Balochistan, respectively whereas only NWFP witnessed a decline of 1 percentage point. The GER for males was higher than females, improved by 2 percentage points for males and 4 percentage points for females in the comparison period. The GER was the highest in Punjab both for males and females i.e. 61 and 57 percent, respectively. For males, GER improved by 2 and 5 percentage points in Punjab and Sindh and declined by 2 percentage points in NWFP whereas it remained same in Balochistan over the period. Females GER registered an increase of 6, 1, 2 and 3 percentage points in Punjab, Sindh, NWFP and Balochistan, respectively.
6.8 The GER in rural areas improved by 3 percentage points to 46 percent in FY 2007/08 as compared to 43 percent in FY 2006/07 while no change was observed in GER in urban areas during the period. In urban areas, GER for females (71 percent) was much higher than males i.e. 67 percent in contrast to rural areas where rate was higher for males i.e. 55 percent against 37 percent for females. Rate both for males and females was higher in urban areas (67 and 71 percent, respectively) than in rural areas (55 and 37 percent, respectively).
Table 6.4: GER at the Middle Level (age 10-12) - By Region and Province
Region / Province
2006/07 PSLM 2007/08 PSLM
Male Female Total Male Female Total
Urban Areas 69 68 69 67 71 69
Punjab 68 74 71 64 79 71
Sindh 69 62 66 69 65 67
NWFP 74 58 66 80 58 68
Balochistan 72 59 66 72 51 62
Rural Areas 52 32 43 55 37 46
Punjab 55 41 48 59 49 54
Sindh 34 12 24 41 14 28
NWFP 67 31 50 63 33 48
Balochistan 37 10 25 34 12 25
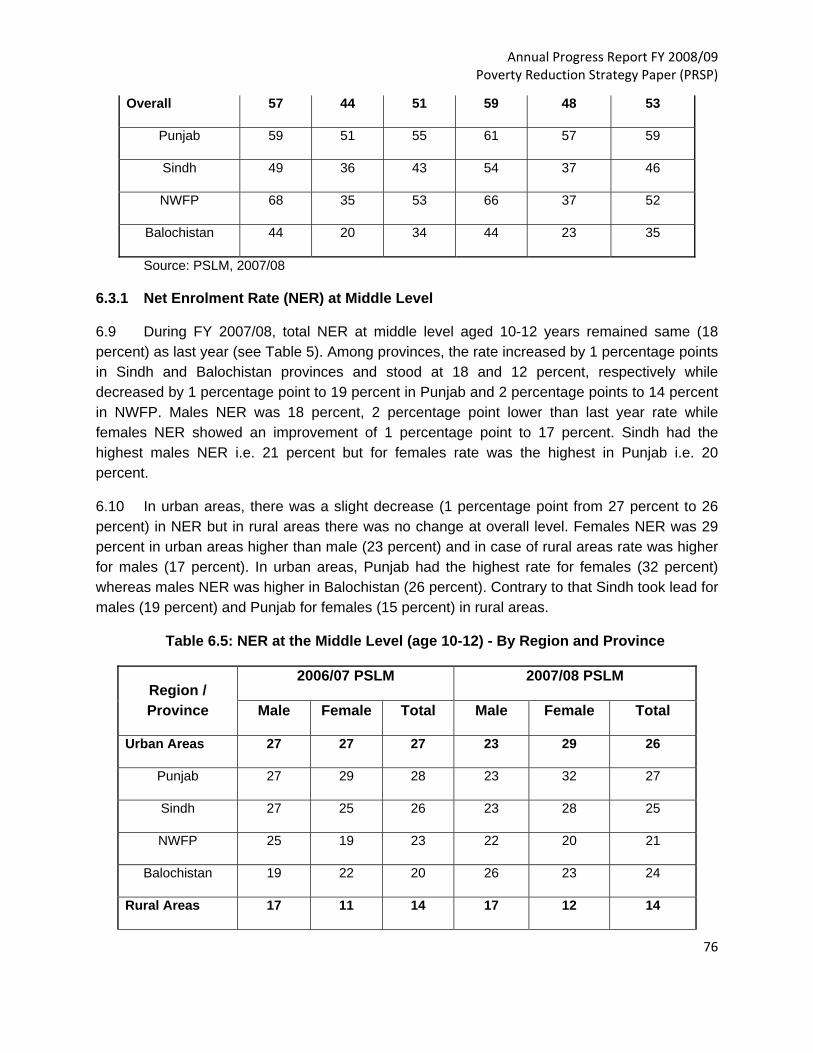
Annual Progress Report FY 2008/09 Poverty Reduction Strategy Paper (PRSP)
76
Overall 57 44 51 59 48 53
Punjab 59 51 55 61 57 59
Sindh 49 36 43 54 37 46
NWFP 68 35 53 66 37 52
Balochistan 44 20 34 44 23 35
Source: PSLM, 2007/08
6.3.1 Net Enrolment Rate (NER) at Middle Level
6.9 During FY 2007/08, total NER at middle level aged 10-12 years remained same (18 percent) as last year (see Table 5). Among provinces, the rate increased by 1 percentage points in Sindh and Balochistan provinces and stood at 18 and 12 percent, respectively while decreased by 1 percentage point to 19 percent in Punjab and 2 percentage points to 14 percent in NWFP. Males NER was 18 percent, 2 percentage point lower than last year rate while females NER showed an improvement of 1 percentage point to 17 percent. Sindh had the highest males NER i.e. 21 percent but for females rate was the highest in Punjab i.e. 20 percent.
6.10 In urban areas, there was a slight decrease (1 percentage point from 27 percent to 26 percent) in NER but in rural areas there was no change at overall level. Females NER was 29 percent in urban areas higher than male (23 percent) and in case of rural areas rate was higher for males (17 percent). In urban areas, Punjab had the highest rate for females (32 percent) whereas males NER was higher in Balochistan (26 percent). Contrary to that Sindh took lead for males (19 percent) and Punjab for females (15 percent) in rural areas.
Table 6.5: NER at the Middle Level (age 10-12) - By Region and Province
Region / Province
2006/07 PSLM 2007/08 PSLM
Male Female Total Male Female Total
Urban Areas 27 27 27 23 29 26
Punjab 27 29 28 23 32 27
Sindh 27 25 26 23 28 25
NWFP 25 19 23 22 20 21
Balochistan 19 22 20 26 23 24
Rural Areas 17 11 14 17 12 14

Annual Progress Report FY 2008/09 Poverty Reduction Strategy Paper (PRSP)
77
Punjab 19 14 17 16 15 16
Sindh 13 5 9 19 6 13
NWFP 19 9 15 17 9 13
Balochistan 9 3 6 10 5 8
Overall 20 16 18 18 17 18
Punjab 21 19 20 18 20 19
Sindh 19 14 17 21 16 18
NWFP 20 11 16 18 11 14
Balochistan 11 7 9 14 10 12
Source: PSLM, FY 2007/08
6.4 GER at Matric Level
6.11 Table 6 illustrates GER at matric level aged 13-14 years by region and province. The GER at matric level rose by 2 percentage points to 50 percent in FY 2008/09 as compared to 48 percent in FY 2006/07. The GER in Punjab stood at 54 percent followed by 48 percent in NWFP, 44 percent in Sindh and 34 percent in Balochistan registering an increase of 3 percentage points in Punjab and NWFP and 1 percentage point in Balochistan while decreased by 1 percentage point in Sindh. Both males and females GER increased by 2 and 6 percentage points from 57 to 59 percent and from 35 to 41 percent, respectively over the period. At matric level, NWFP had the highest GER i.e. 66 percent for males whereas Punjab had the highest rate for females 47 percent.
6.12 The GER in urban areas declined by 1 percentage points to 67 percent but still much higher than the rural areas whereas it increased by 4 percentage points to 42 percent in FY 2007/08 in relation to FY 2006/07. GER both for males and females i.e. 69 and 65 percent, respectively in urban areas was higher than rural areas indicating enrollment of 54 percent for males and 30 percent for females. For males, NWFP had the highest NER in urban areas (75 percent) as well as in rural areas (64 percent) whereas for females Punjab had the highest rate both in urban (68 percent) and rural areas (37 percent).
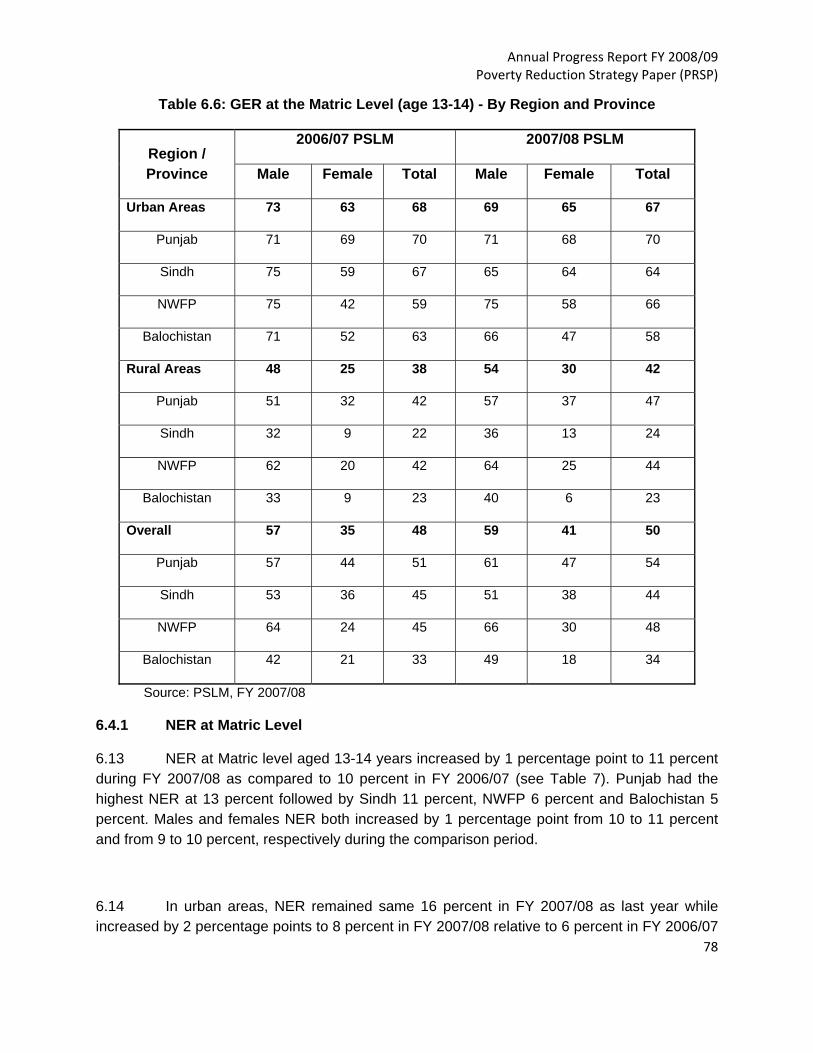
Annual Progress Report FY 2008/09 Poverty Reduction Strategy Paper (PRSP)
78
Table 6.6: GER at the Matric Level (age 13-14) - By Region and Province
Region / Province
2006/07 PSLM 2007/08 PSLM
Male Female Total Male Female Total
Urban Areas 73 63 68 69 65 67
Punjab 71 69 70 71 68 70
Sindh 75 59 67 65 64 64
NWFP 75 42 59 75 58 66
Balochistan 71 52 63 66 47 58
Rural Areas 48 25 38 54 30 42
Punjab 51 32 42 57 37 47
Sindh 32 9 22 36 13 24
NWFP 62 20 42 64 25 44
Balochistan 33 9 23 40 6 23
Overall 57 35 48 59 41 50
Punjab 57 44 51 61 47 54
Sindh 53 36 45 51 38 44
NWFP 64 24 45 66 30 48
Balochistan 42 21 33 49 18 34
Source: PSLM, FY 2007/08
6.4.1 NER at Matric Level
6.13 NER at Matric level aged 13-14 years increased by 1 percentage point to 11 percent during FY 2007/08 as compared to 10 percent in FY 2006/07 (see Table 7). Punjab had the highest NER at 13 percent followed by Sindh 11 percent, NWFP 6 percent and Balochistan 5 percent. Males and females NER both increased by 1 percentage point from 10 to 11 percent and from 9 to 10 percent, respectively during the comparison period.
6.14 In urban areas, NER remained same 16 percent in FY 2007/08 as last year while increased by 2 percentage points to 8 percent in FY 2007/08 relative to 6 percent in FY 2006/07

Annual Progress Report FY 2008/09 Poverty Reduction Strategy Paper (PRSP)
79
in rural areas. Females NER was higher in urban areas i.e. 17 percent as compared to males NER which was higher in rural areas (10 percent). Punjab had the highest NER both for males and females in urban as well as rural areas.
Table 6.7: NER at the Matric Level (age 13-14) - By Region and Province
Region / Province
2006/07 PSLM 2007/08 PSLM
Male Female Total Male Female Total
Urban Areas 15 17 16 14 17 16
Punjab 16 20 18 15 19 17
Sindh 15 15 15 13 17 15
NWFP 13 9 11 14 7 10
Balochistan 8 13 10 12 10 11
Rural Areas 8 5 6 10 7 8
Punjab 9 6 8 12 9 10
Sindh 7 2 5 9 3 6
NWFP 7 3 5 5 5 5
Balochistan 3 1 3 4 1 3
Overall 10 9 10 11 10 11
Punjab 11 11 11 13 12 13
Sindh 11 9 10 11 10 11
NWFP 8 4 6 6 6 6
Balochistan 4 5 5 6 4 5
Source: PSLM, FY 2007/08
6.5 Drop-out Rates Aged 15-19 Years – by Gender and Class
6.15 Table 8 illustrates dropout rate percentages for classes I to 6 by gender and class. The dropout rate was observed highest 22.1 percent in class 6 and lowest 0.3 percent in class 1 during the FY 2007/08 as compared to 24.5 percent and 0.3 percent respectively in FY 2005/06. The drop out percentage was 8.8, 5.4, 2.7, and 0.9 from class 5 to class 2 in descending order in FY 2007/08 whereas it was 10.3, 6.4, 3.6 and 1 percent, respectively during the FY 2005/06.

Annual Progress Report FY 2008/09 Poverty Reduction Strategy Paper (PRSP)
80
The male dropout percentage has declined significantly in class 6 from 21.5 percent in FY 2005/06 to 16 percent in FY 2007/08 whereas; the female dropout percentage has also declined from 29 percent in FY 2005/06 to 26.3 percent in FY 2007/08.
Table 6.8: Drop-out Rates (percent)
2005/06 PSLM 2007/08 PSLM
Male Female Total Male Female Total
Class 1 0.4 0.2 0.3 0.3 0.3 0.3
Class 2 1.1 0.9 1 0.5 1.2 0.9
Class 3 3.7 3.3 3.6 1.5 3.5 2.7
Class 4 6.2 6.9 6.4 3.9 6.4 5.4
Class 5 10 11 10.3 6.1 10.6 8.8
Class 6 21.5 29 24.5 16 26.3 22.1
Source: PSLM, 2007/08
6.2 Health
6.16 The PSLM surveys FY 2005/06, FY 2006/07 and FY 2007/08 provide useful information about children under 5 suffering from diarrhea, Total Fertility Rate (TFR), Infant Mortality Rate (IMR), Contraceptive Prevalence Rate (CPR), pre-natal consultations, and drinking water supply and sanitation. Some of these outcome level indicators are discussed below.
6.2.1 Children under five (5) suffering from diarrhea in past 30 days - by Region and Province
6.17 Table 9 illustrates overall percentage of children who have suffered from diarrhea in the 30 days decreased slightly from 11 percent in FY 2006/07 to 10 percent in FY 2007/08. However, no change took place in both urban and rural areas, as percentage of the children who have suffered from diarrhea in the past 30 days were 10 percent and 11 percent, respectively in FY 2006/07 and FY 2008/09. The diarrhea cases decreased in Sindh from 12 percent in FY 2006/07 to 7 percent in FY 2007/08 whereas, the percentage remained stagnant in Punjab in the period under comparison. However, NWFP and Baluchistan have shown an increase from 8 percent in FY 2006/07 to 12 percent in FY 2007/08 and from 7 percent to 8 percent, respectively.
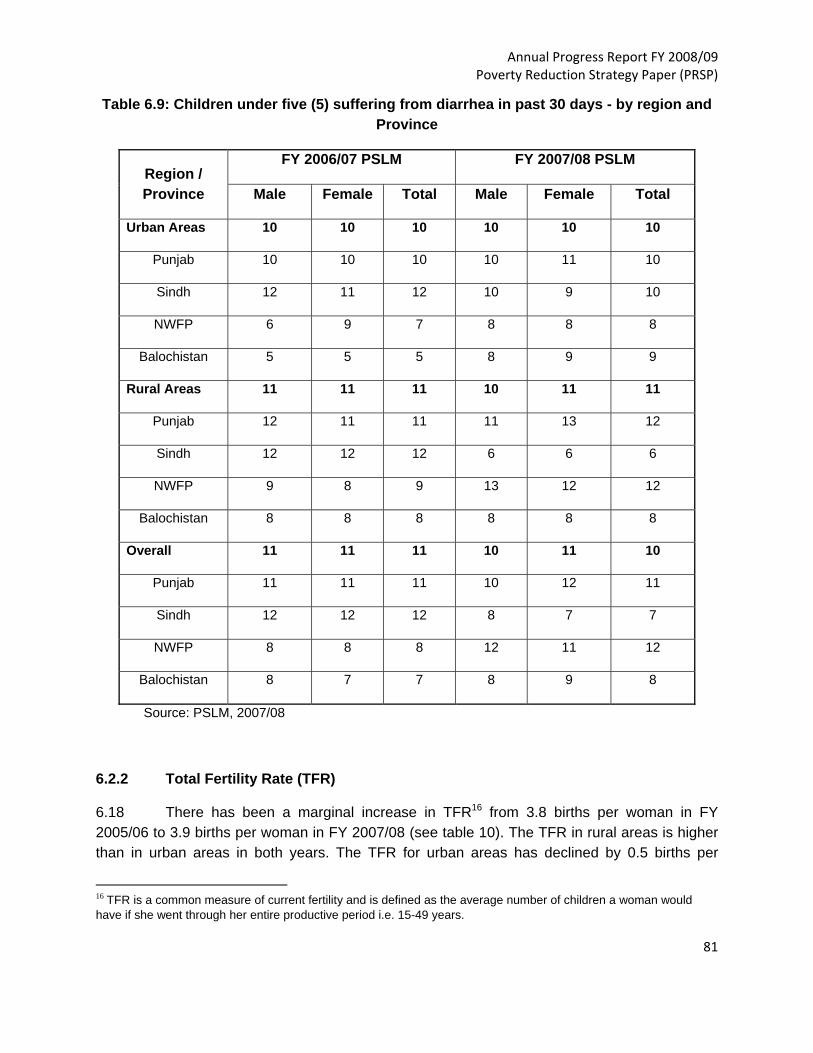
Annual Progress Report FY 2008/09 Poverty Reduction Strategy Paper (PRSP)
81
Table 6.9: Children under five (5) suffering from diarrhea in past 30 days - by region and Province
Region / Province
FY 2006/07 PSLM FY 2007/08 PSLM
Male Female Total Male Female Total
Urban Areas 10 10 10 10 10 10
Punjab 10 10 10 10 11 10
Sindh 12 11 12 10 9 10
NWFP 6 9 7 8 8 8
Balochistan 5 5 5 8 9 9
Rural Areas 11 11 11 10 11 11
Punjab 12 11 11 11 13 12
Sindh 12 12 12 6 6 6
NWFP 9 8 9 13 12 12
Balochistan 8 8 8 8 8 8
Overall 11 11 11 10 11 10
Punjab 11 11 11 10 12 11
Sindh 12 12 12 8 7 7
NWFP 8 8 8 12 11 12
Balochistan 8 7 7 8 9 8
Source: PSLM, 2007/08
6.2.2 Total Fertility Rate (TFR)
6.18 There has been a marginal increase in TFR16 from 3.8 births per woman in FY 2005/06 to 3.9 births per woman in FY 2007/08 (see table 10). The TFR in rural areas is higher than in urban areas in both years. The TFR for urban areas has declined by 0.5 births per
16 TFR is a common measure of current fertility and is defined as the average number of children a woman would have if she went through her entire productive period i.e. 15-49 years.
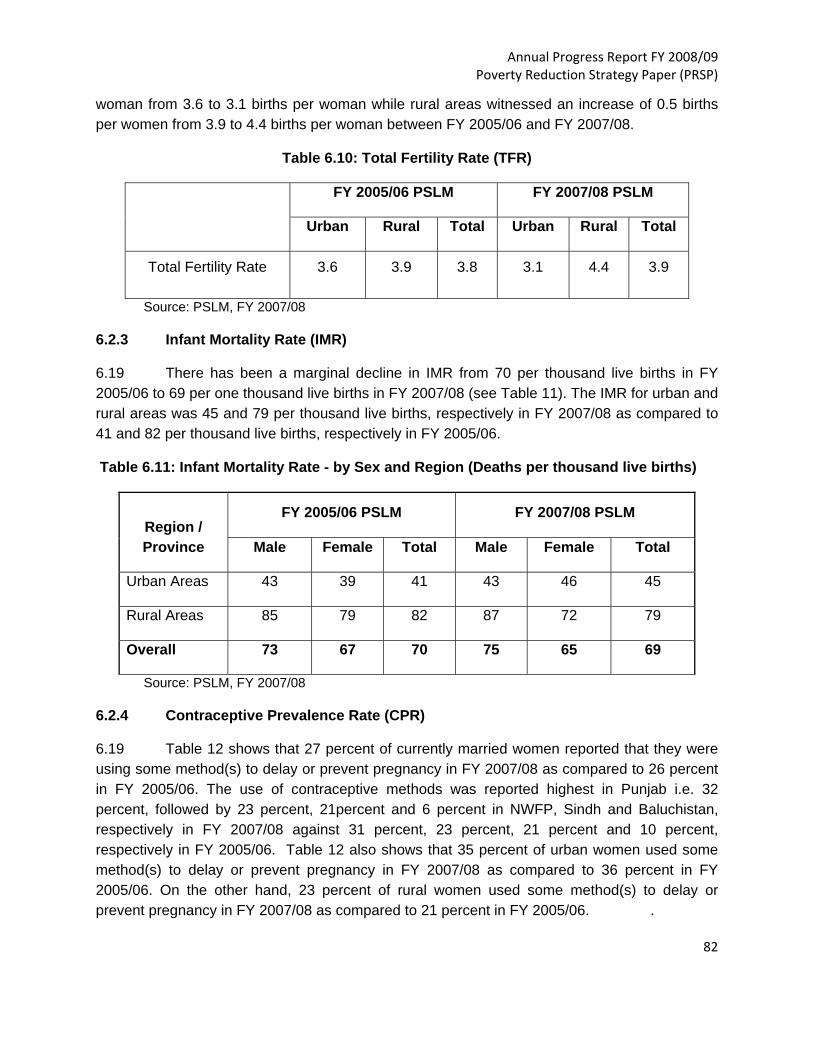
Annual Progress Report FY 2008/09 Poverty Reduction Strategy Paper (PRSP)
82
woman from 3.6 to 3.1 births per woman while rural areas witnessed an increase of 0.5 births per women from 3.9 to 4.4 births per woman between FY 2005/06 and FY 2007/08.
Table 6.10: Total Fertility Rate (TFR)
FY 2005/06 PSLM FY 2007/08 PSLM
Urban Rural Total Urban Rural Total
Total Fertility Rate 3.6 3.9 3.8 3.1 4.4 3.9
Source: PSLM, FY 2007/08
6.2.3 Infant Mortality Rate (IMR)
6.19 There has been a marginal decline in IMR from 70 per thousand live births in FY 2005/06 to 69 per one thousand live births in FY 2007/08 (see Table 11). The IMR for urban and rural areas was 45 and 79 per thousand live births, respectively in FY 2007/08 as compared to 41 and 82 per thousand live births, respectively in FY 2005/06.
Table 6.11: Infant Mortality Rate - by Sex and Region (Deaths per thousand live births)
Region / Province
FY 2005/06 PSLM FY 2007/08 PSLM
Male Female Total Male Female Total
Urban Areas 43 39 41 43 46 45
Rural Areas 85 79 82 87 72 79
Overall 73 67 70 75 65 69
Source: PSLM, FY 2007/08
6.2.4 Contraceptive Prevalence Rate (CPR)
6.19 Table 12 shows that 27 percent of currently married women reported that they were using some method(s) to delay or prevent pregnancy in FY 2007/08 as compared to 26 percent in FY 2005/06. The use of contraceptive methods was reported highest in Punjab i.e. 32 percent, followed by 23 percent, 21percent and 6 percent in NWFP, Sindh and Baluchistan, respectively in FY 2007/08 against 31 percent, 23 percent, 21 percent and 10 percent, respectively in FY 2005/06. Table 12 also shows that 35 percent of urban women used some method(s) to delay or prevent pregnancy in FY 2007/08 as compared to 36 percent in FY 2005/06. On the other hand, 23 percent of rural women used some method(s) to delay or prevent pregnancy in FY 2007/08 as compared to 21 percent in FY 2005/06. .
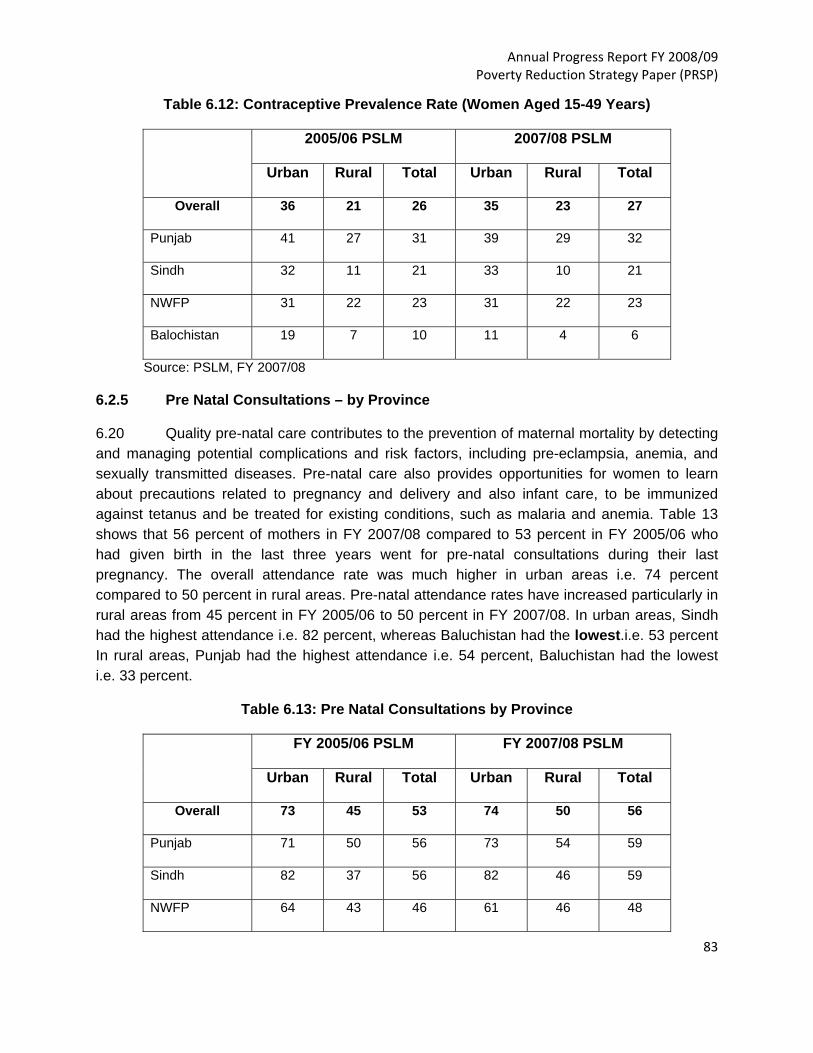
Annual Progress Report FY 2008/09 Poverty Reduction Strategy Paper (PRSP)
83
Table 6.12: Contraceptive Prevalence Rate (Women Aged 15-49 Years)
2005/06 PSLM 2007/08 PSLM
Urban Rural Total Urban Rural Total
Overall 36 21 26 35 23 27
Punjab 41 27 31 39 29 32
Sindh 32 11 21 33 10 21
NWFP 31 22 23 31 22 23
Balochistan 19 7 10 11 4 6
Source: PSLM, FY 2007/08
6.2.5 Pre Natal Consultations – by Province
6.20 Quality pre-natal care contributes to the prevention of maternal mortality by detecting and managing potential complications and risk factors, including pre-eclampsia, anemia, and sexually transmitted diseases. Pre-natal care also provides opportunities for women to learn about precautions related to pregnancy and delivery and also infant care, to be immunized against tetanus and be treated for existing conditions, such as malaria and anemia. Table 13 shows that 56 percent of mothers in FY 2007/08 compared to 53 percent in FY 2005/06 who had given birth in the last three years went for pre-natal consultations during their last pregnancy. The overall attendance rate was much higher in urban areas i.e. 74 percent compared to 50 percent in rural areas. Pre-natal attendance rates have increased particularly in rural areas from 45 percent in FY 2005/06 to 50 percent in FY 2007/08. In urban areas, Sindh had the highest attendance i.e. 82 percent, whereas Baluchistan had the lowest.i.e. 53 percent In rural areas, Punjab had the highest attendance i.e. 54 percent, Baluchistan had the lowest i.e. 33 percent.
Table 6.13: Pre Natal Consultations by Province
FY 2005/06 PSLM FY 2007/08 PSLM
Urban Rural Total Urban Rural Total
Overall 73 45 53 74 50 56
Punjab 71 50 56 73 54 59
Sindh 82 37 56 82 46 59
NWFP 64 43 46 61 46 48

Annual Progress Report FY 2008/09 Poverty Reduction Strategy Paper (PRSP)
84
Balochistan 56 25 31 53 33 39
Source: PSLM, FY 2007/08
6.3 Environment/Water Supply and Sanitation
6.3.1 Main Sources of Drinking Water
6.21 The main source of drinking water in Pakistan is tap water17, as 36 percent of the total population used this source of drinking water during FYs 2006/07 and 2007/08 (see Table 14 and Graph 1). Hand and motor pumps together provided 55 percent of the household with drinking water in FY 2007/08 as compared to 51percent in FY 2006/07. However, compared to the previous surveys held in FY 2005/06 and FY 2006/07, the usage of hand pump has declined whereas the use of motor pumps has increased both in urban and rural areas. Moreover, the percentage of households depending on dug well as a water source remained same at 4 percent whereas other sources decreased from 8 percent in FY 2006/07 to 6 percent in FY 2007/08.
Table 6.14: Main Sources of Drinking Water in Pakistan (Percentages)
FY 2006/07 PSLM FY 2007/08 PSLM
Urban Rural Total Urban Rural Total
Pakistan
Tap waters 62 22 36 61 22 36
Hand pump 9 41 30 10 40 30
Motor pump 24 20 21 24 25 25
Dug well 1 6 4 1 6 4
Others 4 10 8 5 7 6
Total 100 100 100 100 100 100
Source: PSLM, 2007/08
17 In PSLM survey, interviewers were told to record the ultimate source of drinking water. For example, water piped directly from a stream and delivered through a tap, without passing through a settlement tank, would have ‘stream’ as its source, not ‘tap in house’.

Annual Progress Report FY 2008/09 Poverty Reduction Strategy Paper (PRSP)
85
Graph 1: Main S oruce of Drinking Water, Overall Pakis tan
FY 2007/08
36
30
25
46
Tap water
Hand pump
Motro pump
Dug well
Other
6.3.2 Type of Toilet used by Household
6.22 Overall, 24 percent households in FY 2007/08 compared to 27% in FY 2006/07 do not have access to any toilet facility in Pakistan (see Table 15 and Graph 2). This varies largely between urban and rural areas i.e. 3 percent of urban households had no toilet compared to 35 percent of rural households. The percentage of flush and non-flush use has also changed over the comparison period, as the use of flush increased from 58 percent in FY 2006/07 to 66 percent in FY 2007/08 and the use of non-flush decreased from 15 to 10 percent.
Table 6.15: Type of Toilet Used by Households
FY 2006/07 PSLM FY 2007/08 PSLM
Urban Rural Total Urban Rural Total
Type of toilets used by households
Flush 92 41 58 94 51 66
Non-flush 4 21 15 3 14 10
No toilet 4 39 27 3 35 24
Source: PSLM, FY 2007/08
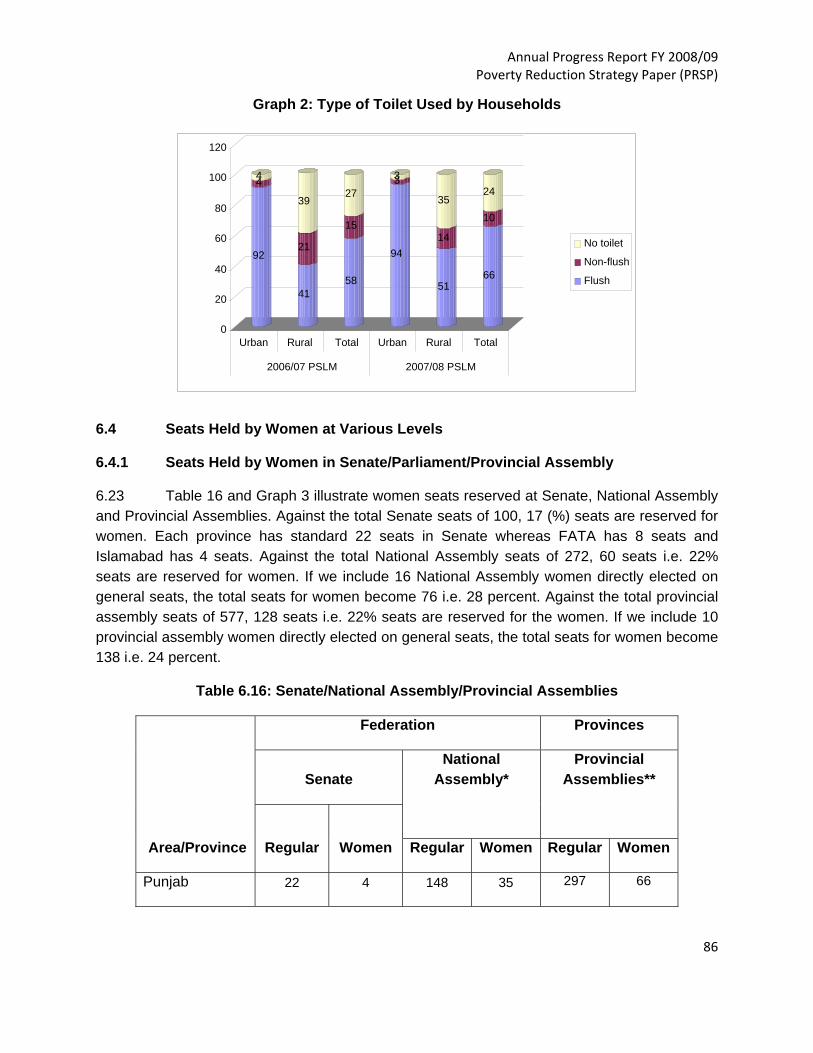
Annual Progress Report FY 2008/09 Poverty Reduction Strategy Paper (PRSP)
86
Graph 2: Type of Toilet Used by Households
6.4 Seats Held by Women at Various Levels
6.4.1 Seats Held by Women in Senate/Parliament/Provincial Assembly
6.23 Table 16 and Graph 3 illustrate women seats reserved at Senate, National Assembly and Provincial Assemblies. Against the total Senate seats of 100, 17 (%) seats are reserved for women. Each province has standard 22 seats in Senate whereas FATA has 8 seats and Islamabad has 4 seats. Against the total National Assembly seats of 272, 60 seats i.e. 22% seats are reserved for women. If we include 16 National Assembly women directly elected on general seats, the total seats for women become 76 i.e. 28 percent. Against the total provincial assembly seats of 577, 128 seats i.e. 22% seats are reserved for the women. If we include 10 provincial assembly women directly elected on general seats, the total seats for women become 138 i.e. 24 percent.
Table 6.16: Senate/National Assembly/Provincial Assemblies
Area/Province
Federation Provinces
Senate National
Assembly* Provincial
Assemblies**
Regular Women
Regular Women Regular Women
Punjab 22 4 148 35 297 66
92
44
41
21
39
58
15
27
94
33
51
14
35
66
10
24
0
20
40
60
80
100
120
Urban Rural Total Urban Rural Total
2006/07 PSLM 2007/08 PSLM
No toilet
Non-flush
Flush
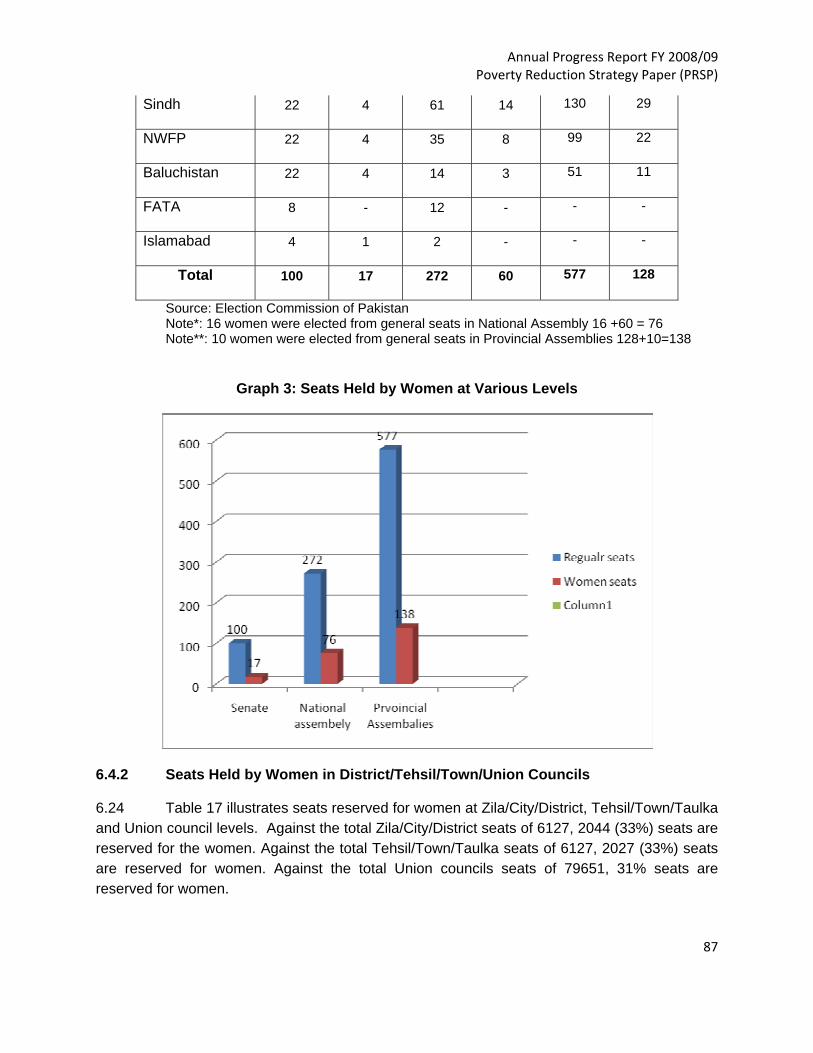
Annual Progress Report FY 2008/09 Poverty Reduction Strategy Paper (PRSP)
87
Sindh 22 4 61 14 130 29
NWFP 22 4 35 8 99 22
Baluchistan 22 4 14 3 51 11
FATA 8 - 12 - - -
Islamabad 4 1 2 - - -
Total 100 17 272 60 577 128
Source: Election Commission of Pakistan Note*: 16 women were elected from general seats in National Assembly 16 +60 = 76 Note**: 10 women were elected from general seats in Provincial Assemblies 128+10=138
Graph 3: Seats Held by Women at Various Levels
6.4.2 Seats Held by Women in District/Tehsil/Town/Union Councils
6.24 Table 17 illustrates seats reserved for women at Zila/City/District, Tehsil/Town/Taulka and Union council levels. Against the total Zila/City/District seats of 6127, 2044 (33%) seats are reserved for the women. Against the total Tehsil/Town/Taulka seats of 6127, 2027 (33%) seats are reserved for women. Against the total Union councils seats of 79651, 31% seats are reserved for women.

Annual Progress Report FY 2008/09 Poverty Reduction Strategy Paper (PRSP)
88
Table 6.17: Seats Held by Women in District/Tehsil/Town/Union Councils
Area/Province
Number and Percentage
Zila/City District Tehsil/Town/Taluka Union councils
Regular Women
Regular Women Regular Women
Punjab 3464 1151 (33%) 3464
1151 (33%)
45032 13856
Sindh 1110 371
(33%) 1110 357
(33%) 14430 4440
NWFP 986 329
(33%) 986 326
(33%) 12818 3944
Baluchistan 567 193
(33%) 567 193
(33%) 7371 2268
Total 6127 2044 (33%) 6127
2027
(33%)
79651 24508 (31%)
Source: Election Commission of Pakistan

Annual Progress Report FY 2008/09 Poverty Reduction Strategy Paper (PRSP)
89
7. Conclusion
7.1 The PRSP Annual Progress Report for FY 2008/09 is the first Annual Report of the PRSP-II three-year period FY 2008/09 – FY 2010/2011. Efforts to track pro-poor expenditures both in the form of budgetary and non budgetary and relevant output (intermediate) and (outcome) indicators originally initiated during the Interim PRSP and later on revised during the PRSP-II have been consistently followed since FY 2001. The overall expenditures on pro poor sectors have shown a constant positive increase throughout except FY 2008/09, whereas monitoring indicators (both output and outcome) have also registered steady progress. 7.2 Pakistan’s economic outlook and macroeconomic environment in FY 2008/09 was affected both by internal and external pressures of acute nature. These were driven by: an intensification of war on terror coupled with law and order situation; power shortages; supply shocks augmented by external factors i.e. global financial crisis reflected in shrinking external demand leading to a decline in Pakistan’s exports; and, a visible slow down in foreign direct investment inflows. While the fiscal and current account imbalances narrowed, the exchange rate stabilized, foreign reserves rose but inflation remained stubbornly high and growth plunged. Pakistan’s economic growth slowed down to 2 percent only in 2008/09 (the lowest in the last eight years), as against 4.1 percent last year and remained well below this year’s target of 5.5 percent due to a combination of domestic and external shocks. However, a modest improvement in growth is expected in FY 2009/10. 7.3 Expenditures incurred in pro-poor sectors during FY 2008/09, were well above 4.5 percent of GDP keeping in line with the government’s FRDLA Act (2005). During FY 2008-09, PRSP expenditures stood at Rs. 977,228 million recording a decrease of Rs. 65,032 million (6.24 percent) compared to FY 2007-08. Decrease in aggregate pro-poor expenditures owes to mitigating circumstances in FY 2008-09 faced by fiscal constraints and stabilization measures aimed at rationalizing subsidies by providing direct assistance through strengthened safety nets. A positive increase was witnessed in social sectors of Health, Education, Natural Calamities and Disasters ; Infrastructure related sectors, Roads, Highways& Bridges and Environment, Water Supply and Sanitation ; Safety Nets covered under Social Security and Welfare and Food Support Programme. Governance related sectors; Law& Order and Administration of Justice witnessed an upsurge in expenditures in FY 2008-09 due to volatile security situation. Expenditures in Agriculture and allied sectors, Land Reclamation and Rural Development experienced sharp fall in FY 2008-09. The highest provincial increase in expenditures in FY 2008-09 is observed in NWFP at 35.80 percent compared to FY 2007-08 while Balochistan witnessed negative trend in aggregate pro-poor expenditures in FY 2008-09 (7.66 percent) relative to FY 2007-08 7.4 With the allocation of Rs. 70 billion for BISP in the Federal Budget FY 2009/10, the outreach and coverage of the program will definitely enhance in the forthcoming year. Poverty Score Card System which is not yet been initiated in some of the districts and completion of the same survey in other districts during FY 2009/10 will help in better targeting of the poor and vulnerable through this program. The increase in allocation of funds for the BISP does not mean that funds need to be reduced from other safety net programs already tested and successful.
Annual Progress Report FY 2008/09 Poverty Reduction Strategy Paper (PRSP)
90
7.5 Tracking of indicators in the education sector reflects an overall increase in the number of functional public schools (including Deeni Madrasahs). A total of 144,784 functional schools have been reported in FY 2008/09 against 143,885 in FY 2007/08 registered an increase of 899 schools. During the same period both primary and middle functional schools have increased by 0.4 percent and 2.43 percent respectively. Basic facilities include access to water, latrine, electricity, and boundary wall in public schools. At the national level, public schools containing the above facilities decreased in FY 2008/09 as compared to FY 2007/08. A total of 59 percent, 54 percent, 33 percent and 55 percent schools contained the facilities of water, latrines, electricity and boundary wall in FY 2008/09 relative to 62, 58, 38, and 58 percent in FY 2007/08 respectively. The proportion of public schools with electricity reduced significantly by 5 percentage (from 38 percent to 33 percent) in FY 2008/09 compared to FY 2007/08, followed by latrines 4 percentage (from 58 percent to 54 percent), and water and boundary wall 3 percentage each (from 62 percent to 59 percent) and (from 58 percent to 55 percent) respectively. Health sector intermediate indicators that are regularly tracked in PRSP Progress Reports, including others, comprise immunization coverage of children (aged 12-23 months); immunization coverage for pregnant women; number of lady health workers; and coverage of lady health workers. Overall the record and recall based full immunization coverage (all 8 recommended vaccines) decreased by 3 percentage points from 76 percent in FY 2006/07 to 73 percent in FY 2007/08. At the national level, 7.42 million pregnant women were targeted for immunization in FY 2008/09 as compared to 7.17 million during FY 2007/08. A significant increase has been observed, as 51 percent and 54 percent women were immunized relative to 45 percent and 46 percent under TT-1 and TT-2 respectively during the same period. LHW’s coverage in both urban and rural areas fell by 9 percent and 4 percent, respectively in FY 2008/09 as compared to FY 2007/08 while the number of LHWs increased by 8 percent in urban areas and by 3 percent in rural areas.
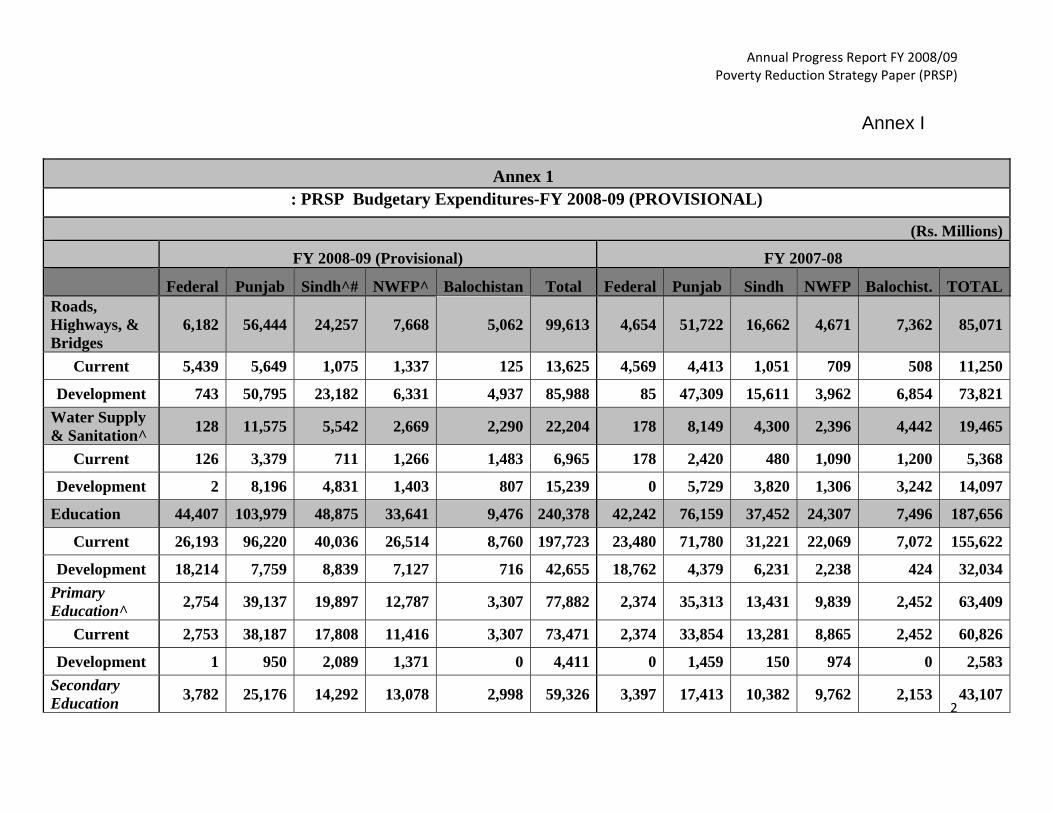
Annual Progress Report FY 2008/09 Poverty Reduction Strategy Paper (PRSP)
2
Annex I
Annex 1 : PRSP Budgetary Expenditures-FY 2008-09 (PROVISIONAL)
(Rs. Millions) FY 2008-09 (Provisional) FY 2007-08
Federal Punjab Sindh^# NWFP^ Balochistan Total Federal Punjab Sindh NWFP Balochist. TOTAL Roads, Highways, & Bridges
6,182 56,444 24,257 7,668 5,062 99,613 4,654 51,722 16,662 4,671 7,362 85,071
Current 5,439 5,649 1,075 1,337 125 13,625 4,569 4,413 1,051 709 508 11,250
Development 743 50,795 23,182 6,331 4,937 85,988 85 47,309 15,611 3,962 6,854 73,821 Water Supply & Sanitation^ 128 11,575 5,542 2,669 2,290 22,204 178 8,149 4,300 2,396 4,442 19,465
Current 126 3,379 711 1,266 1,483 6,965 178 2,420 480 1,090 1,200 5,368
Development 2 8,196 4,831 1,403 807 15,239 0 5,729 3,820 1,306 3,242 14,097
Education 44,407 103,979 48,875 33,641 9,476 240,378 42,242 76,159 37,452 24,307 7,496 187,656
Current 26,193 96,220 40,036 26,514 8,760 197,723 23,480 71,780 31,221 22,069 7,072 155,622
Development 18,214 7,759 8,839 7,127 716 42,655 18,762 4,379 6,231 2,238 424 32,034 Primary Education^ 2,754 39,137 19,897 12,787 3,307 77,882 2,374 35,313 13,431 9,839 2,452 63,409
Current 2,753 38,187 17,808 11,416 3,307 73,471 2,374 33,854 13,281 8,865 2,452 60,826
Development 1 950 2,089 1,371 0 4,411 0 1,459 150 974 0 2,583 Secondary Education 3,782 25,176 14,292 13,078 2,998 59,326 3,397 17,413 10,382 9,762 2,153 43,107
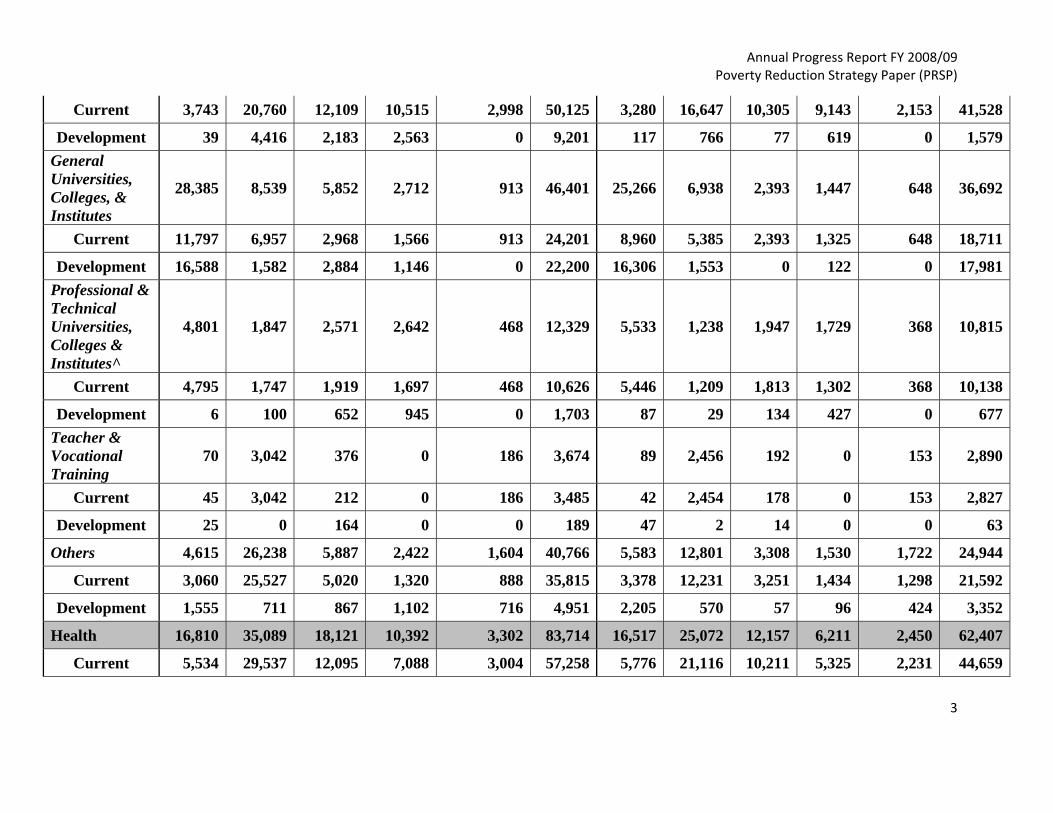
Annual Progress Report FY 2008/09 Poverty Reduction Strategy Paper (PRSP)
3
Current 3,743 20,760 12,109 10,515 2,998 50,125 3,280 16,647 10,305 9,143 2,153 41,528
Development 39 4,416 2,183 2,563 0 9,201 117 766 77 619 0 1,579 General Universities, Colleges, & Institutes
28,385 8,539 5,852 2,712 913 46,401 25,266 6,938 2,393 1,447 648 36,692
Current 11,797 6,957 2,968 1,566 913 24,201 8,960 5,385 2,393 1,325 648 18,711
Development 16,588 1,582 2,884 1,146 0 22,200 16,306 1,553 0 122 0 17,981 Professional & Technical Universities, Colleges & Institutes^
4,801 1,847 2,571 2,642 468 12,329 5,533 1,238 1,947 1,729 368 10,815
Current 4,795 1,747 1,919 1,697 468 10,626 5,446 1,209 1,813 1,302 368 10,138
Development 6 100 652 945 0 1,703 87 29 134 427 0 677 Teacher & Vocational Training
70 3,042 376 0 186 3,674 89 2,456 192 0 153 2,890
Current 45 3,042 212 0 186 3,485 42 2,454 178 0 153 2,827
Development 25 0 164 0 0 189 47 2 14 0 0 63
Others 4,615 26,238 5,887 2,422 1,604 40,766 5,583 12,801 3,308 1,530 1,722 24,944
Current 3,060 25,527 5,020 1,320 888 35,815 3,378 12,231 3,251 1,434 1,298 21,592
Development 1,555 711 867 1,102 716 4,951 2,205 570 57 96 424 3,352
Health 16,810 35,089 18,121 10,392 3,302 83,714 16,517 25,072 12,157 6,211 2,450 62,407
Current 5,534 29,537 12,095 7,088 3,004 57,258 5,776 21,116 10,211 5,325 2,231 44,659
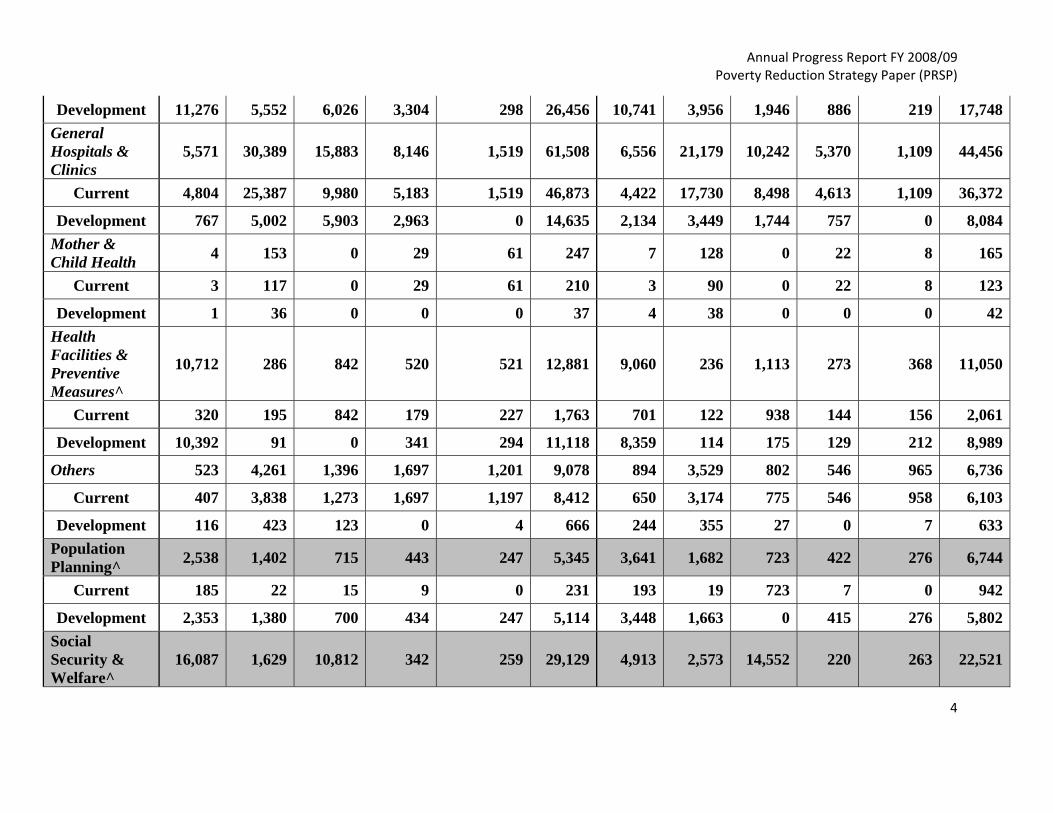
Annual Progress Report FY 2008/09 Poverty Reduction Strategy Paper (PRSP)
4
Development 11,276 5,552 6,026 3,304 298 26,456 10,741 3,956 1,946 886 219 17,748 General Hospitals & Clinics
5,571 30,389 15,883 8,146 1,519 61,508 6,556 21,179 10,242 5,370 1,109 44,456
Current 4,804 25,387 9,980 5,183 1,519 46,873 4,422 17,730 8,498 4,613 1,109 36,372
Development 767 5,002 5,903 2,963 0 14,635 2,134 3,449 1,744 757 0 8,084 Mother & Child Health 4 153 0 29 61 247 7 128 0 22 8 165
Current 3 117 0 29 61 210 3 90 0 22 8 123
Development 1 36 0 0 0 37 4 38 0 0 0 42 Health Facilities & Preventive Measures^
10,712 286 842 520 521 12,881 9,060 236 1,113 273 368 11,050
Current 320 195 842 179 227 1,763 701 122 938 144 156 2,061
Development 10,392 91 0 341 294 11,118 8,359 114 175 129 212 8,989
Others 523 4,261 1,396 1,697 1,201 9,078 894 3,529 802 546 965 6,736
Current 407 3,838 1,273 1,697 1,197 8,412 650 3,174 775 546 958 6,103
Development 116 423 123 0 4 666 244 355 27 0 7 633 Population Planning^ 2,538 1,402 715 443 247 5,345 3,641 1,682 723 422 276 6,744
Current 185 22 15 9 0 231 193 19 723 7 0 942
Development 2,353 1,380 700 434 247 5,114 3,448 1,663 0 415 276 5,802 Social Security & Welfare^
16,087 1,629 10,812 342 259 29,129 4,913 2,573 14,552 220 263 22,521

Annual Progress Report FY 2008/09 Poverty Reduction Strategy Paper (PRSP)
5
Current 15,735 1,338 503 225 241 18,042 4,665 1,860 353 161 187 7,226
Development 352 291 10,309 117 18 11,087 248 713 14,199 59 76 15,295 Natural Calamities & Other Disasters^
4,481 3,070 166 1,073 1,293 10,083 3,241 3,118 302 362 366 7,389
Current 3,952 1,347 114 1,073 1,293 7,779 2,019 1,018 302 362 338 4,039
Development 529 1,723 52 0 0 2,304 1,222 2,100 0 0 28 3,350
Agriculture*^ 28,427 28,482 16,376 7,042 8,585 88,912 55,881 26,868 21,725 8,428 10,003 122,905
Current 2,573 19,508 6,163 3,713 6,274 38,231 2,792 14,694 7,071 3,281 5,721 33,559
Development 25,854 8,974 10,213 3,329 2,311 50,681 53,089 12,174 14,654 5,147 4,282 89,346 Land Reclamation 0 180 2,558 0 0 2,738 0 108 2,992 0 0 3,100
Current 0 180 2,558 0 0 2,738 0 108 2,992 0 0 3,100
Development 0 0 0 0 0 0 0 0 0 0 0 0 Rural Development 811 5,553 163 6,147 3,688 16,362 1,808 9,933 151 5,642 5,256 22,790
Current 56 234 163 236 438 1,127 80 259 151 157 386 1,033
Development 755 5,319 0 5,911 3,250 15,235 1,728 9,674 0 5,485 4,870 21,757 Law and Order 30,415 38,175 20,682 8,904 6,482 104,658 26,995 31,386 16,357 6,897 6,340 87,975
Current 30,376 38,171 20,682 8,861 5,197 103,287 26,788 31,321 16,357 6,897 4,162 85,525
Development 39 4 0 43 1,285 1,371 207 65 0 0 2,178 2,450 Low Cost Housing 0 580 3 0 0 583 0 597 0 0 0 597

Annual Progress Report FY 2008/09 Poverty Reduction Strategy Paper (PRSP)
6
Current 0 548 3 0 0 551 0 431 0 0 0 431
Development 0 32 0 0 0 32 0 166 0 0 0 166
Justice Admn 1,525 4,185 1,827 1,001 655 9,193 1,158 2,274 1,403 701 518 6,054
Current 1,283 4,179 1,814 1,001 554 8,831 910 2,274 1,328 701 431 5,644
Development 242 6 13 0 101 362 248 0 75 0 87 410
Subsidies** 212,706 1,935 697 5,229 0 220,567 394,928 179 1,410 2,000 0 398,517
Current 192,107 1,935 697 5,229 0 199,968 385,358 179 1,410 2,000 0 388,947
Development 20,599 0 0 0 0 20,599 9,570 0 0 0 0 9,570 Food Support Programme~ 2,263 10,157 12,420 4,371 4,371
People's Works Programme-I
3,329 3,329 1,950 1,950
People's Works Programme-II***
28,000 28,000 2,748 2,748
GRAND TOTAL~ 398,109 302,435 150,794 84,551 41,339 977,228 565,225 239,820 130,186 62,257 44,772 ######
*This includes irrigation, fisheries, forestry & livestock **This includes subsidies on financial & fiscal affairs, commercial affairs and food. ***This includes schemes in the area of electricity, gas, water supply & sanitation and roads. ~ Total expenditures exclude district expenditures of Sindh for Q4 FY 2008/09, NWFP food subsidy for 4th quarter FY 2008/09 and Punjab Food Support Scheme for 3rd and 4th quarter of FY 2008/09. ^District expenditures of Sindh and NWFP have been included according to old codes. Changes will be made upon receipt of information on revised codes. Note 1: Total disbursement under different programmes of Pakistan Bait-ul-Mal is Rs. 5,521 million and Rs. 3,432 million for FY 2007/08 & FY 2008/09 respectively.
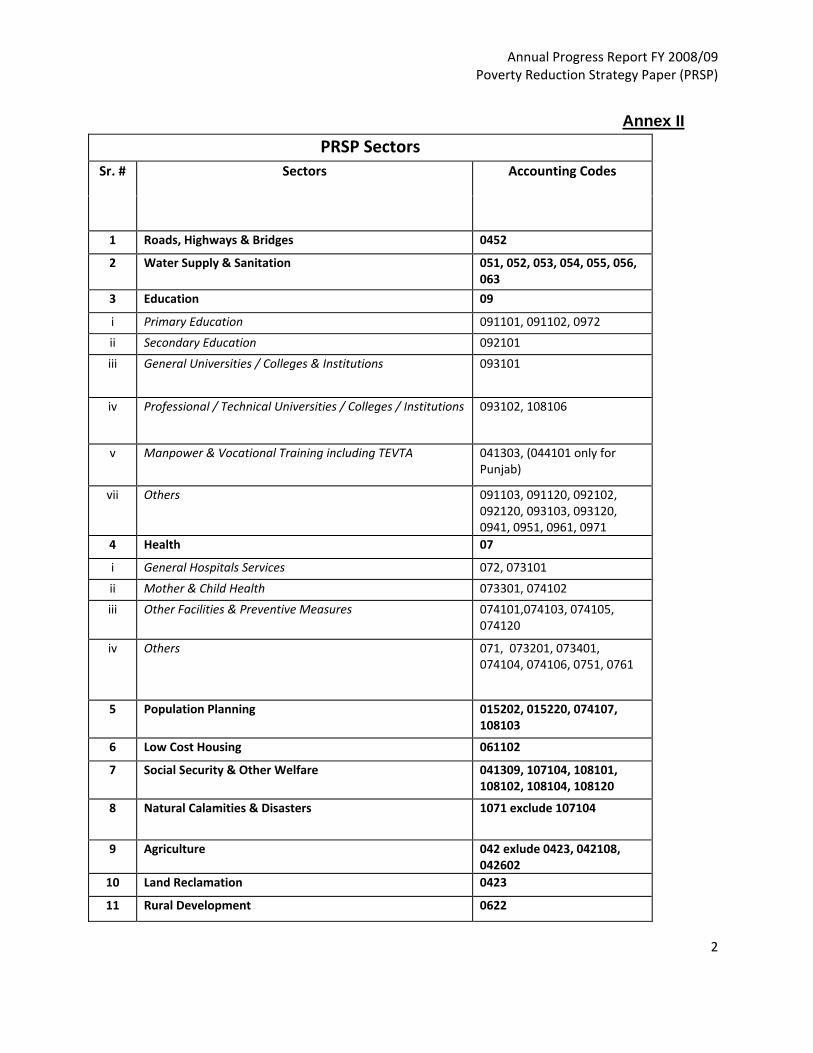
Annual Progress Report FY 2008/09 Poverty Reduction Strategy Paper (PRSP)
2
Annex II PRSP Sectors
Sr. # Sectors Accounting Codes
1 Roads, Highways & Bridges 0452
2 Water Supply & Sanitation 051, 052, 053, 054, 055, 056, 063
3 Education 09
i Primary Education 091101, 091102, 0972
ii Secondary Education 092101
iii General Universities / Colleges & Institutions 093101
iv Professional / Technical Universities / Colleges / Institutions 093102, 108106
v Manpower & Vocational Training including TEVTA 041303, (044101 only for Punjab)
vii Others 091103, 091120, 092102, 092120, 093103, 093120, 0941, 0951, 0961, 0971
4 Health 07
i General Hospitals Services 072, 073101
ii Mother & Child Health 073301, 074102
iii Other Facilities & Preventive Measures 074101,074103, 074105, 074120
iv Others 071, 073201, 073401, 074104, 074106, 0751, 0761
5 Population Planning 015202, 015220, 074107, 108103
6 Low Cost Housing 061102
7 Social Security & Other Welfare 041309, 107104, 108101, 108102, 108104, 108120
8 Natural Calamities & Disasters 1071 exclude 107104
9 Agriculture 042 exlude 0423, 042108, 042602
10 Land Reclamation 0423
11 Rural Development 0622
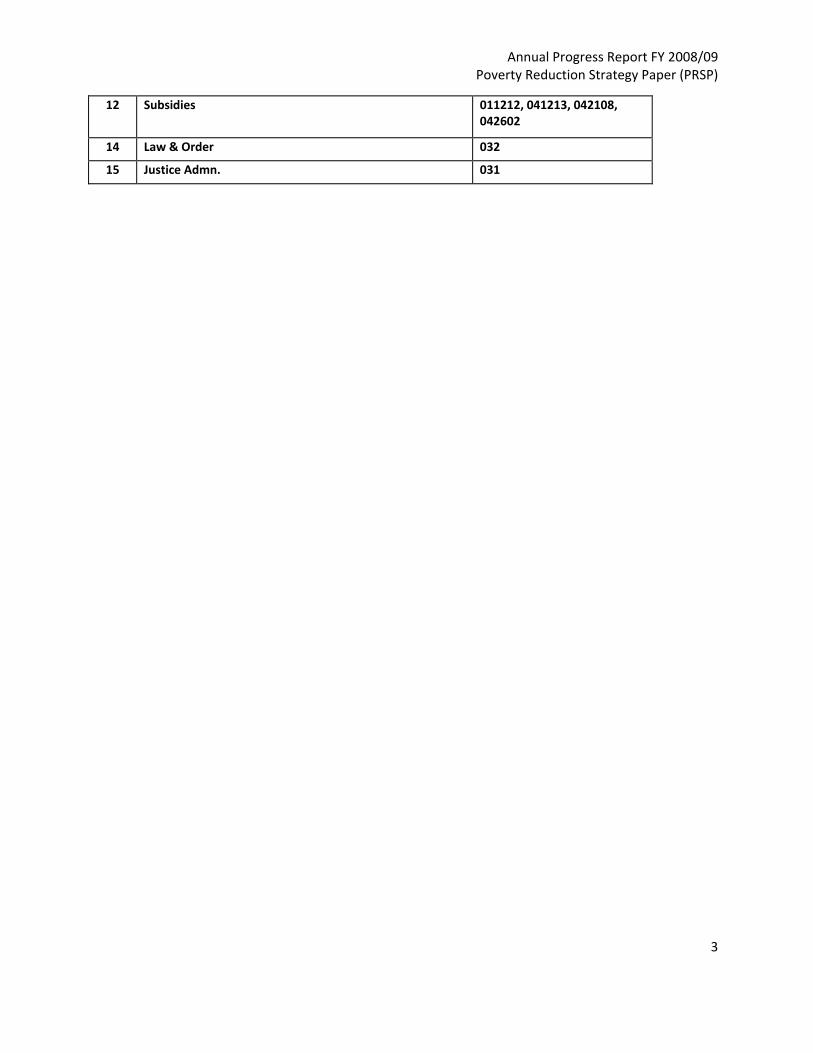
Annual Progress Report FY 2008/09 Poverty Reduction Strategy Paper (PRSP)
3
12 Subsidies 011212, 041213, 042108, 042602
14 Law & Order 032
15 Justice Admn. 031
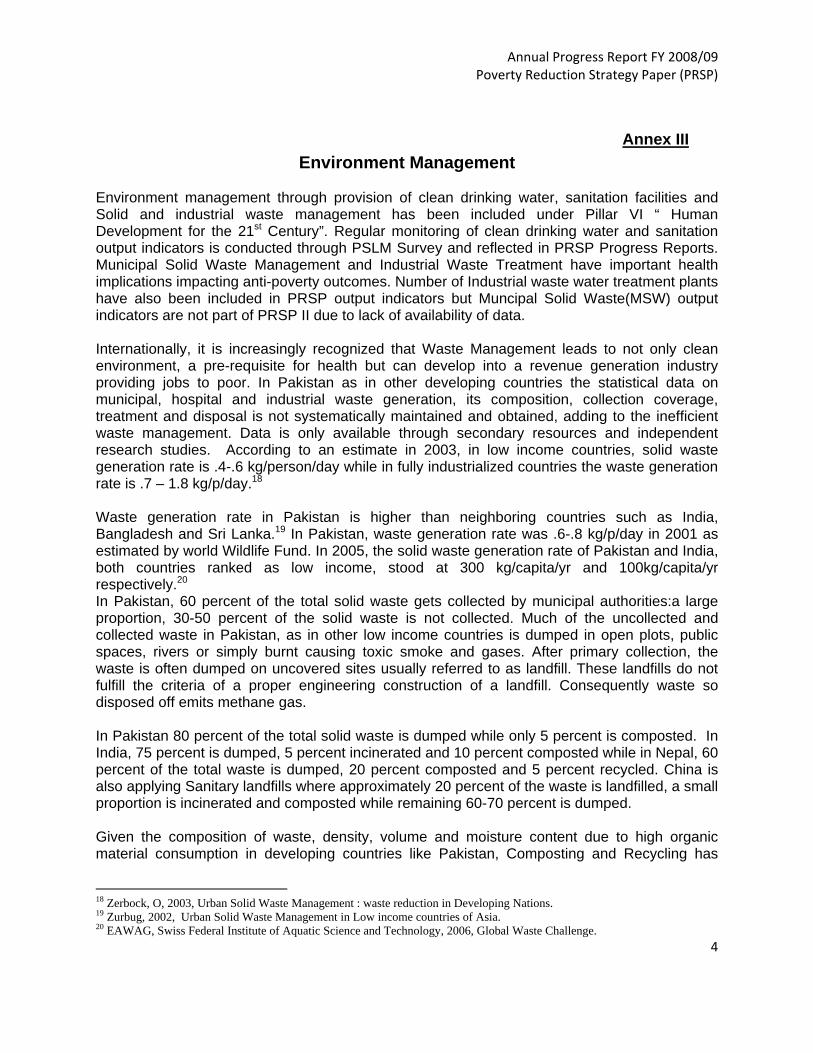
Annual Progress Report FY 2008/09 Poverty Reduction Strategy Paper (PRSP)
4
Annex III Environment Management
Environment management through provision of clean drinking water, sanitation facilities and Solid and industrial waste management has been included under Pillar VI “ Human Development for the 21st Century”. Regular monitoring of clean drinking water and sanitation output indicators is conducted through PSLM Survey and reflected in PRSP Progress Reports. Municipal Solid Waste Management and Industrial Waste Treatment have important health implications impacting anti-poverty outcomes. Number of Industrial waste water treatment plants have also been included in PRSP output indicators but Muncipal Solid Waste(MSW) output indicators are not part of PRSP II due to lack of availability of data. Internationally, it is increasingly recognized that Waste Management leads to not only clean environment, a pre-requisite for health but can develop into a revenue generation industry providing jobs to poor. In Pakistan as in other developing countries the statistical data on municipal, hospital and industrial waste generation, its composition, collection coverage, treatment and disposal is not systematically maintained and obtained, adding to the inefficient waste management. Data is only available through secondary resources and independent research studies. According to an estimate in 2003, in low income countries, solid waste generation rate is .4-.6 kg/person/day while in fully industrialized countries the waste generation rate is .7 – 1.8 kg/p/day.18 Waste generation rate in Pakistan is higher than neighboring countries such as India, Bangladesh and Sri Lanka.19 In Pakistan, waste generation rate was .6-.8 kg/p/day in 2001 as estimated by world Wildlife Fund. In 2005, the solid waste generation rate of Pakistan and India, both countries ranked as low income, stood at 300 kg/capita/yr and 100kg/capita/yr respectively.20 In Pakistan, 60 percent of the total solid waste gets collected by municipal authorities:a large proportion, 30-50 percent of the solid waste is not collected. Much of the uncollected and collected waste in Pakistan, as in other low income countries is dumped in open plots, public spaces, rivers or simply burnt causing toxic smoke and gases. After primary collection, the waste is often dumped on uncovered sites usually referred to as landfill. These landfills do not fulfill the criteria of a proper engineering construction of a landfill. Consequently waste so disposed off emits methane gas. In Pakistan 80 percent of the total solid waste is dumped while only 5 percent is composted. In India, 75 percent is dumped, 5 percent incinerated and 10 percent composted while in Nepal, 60 percent of the total waste is dumped, 20 percent composted and 5 percent recycled. China is also applying Sanitary landfills where approximately 20 percent of the waste is landfilled, a small proportion is incinerated and composted while remaining 60-70 percent is dumped. Given the composition of waste, density, volume and moisture content due to high organic material consumption in developing countries like Pakistan, Composting and Recycling has
18 Zerbock, O, 2003, Urban Solid Waste Management : waste reduction in Developing Nations. 19 Zurbug, 2002, Urban Solid Waste Management in Low income countries of Asia. 20 EAWAG, Swiss Federal Institute of Aquatic Science and Technology, 2006, Global Waste Challenge.
Annual Progress Report FY 2008/09 Poverty Reduction Strategy Paper (PRSP)
5
greater economic potential. However there are no weighing facilities, for waste sampling and analysis. In contrast to developed countries, there are no separate storage arrangements for collection of recyclables. Recycling is often done by informal sector, usually scavenger and waste pickers who recover recyclable materials and sell in the market. Scavengers live in shabby condition and suffer from health problems by exposure to toxic waste. Recycling has an enormous economic potential as revealed by a survey21 conducted on 360 households in Lahore for years 2001 and 2005. The study showed that out of the total waste generated in Lahore, 21 percent is recyclable. A major portion of this recyclable waste, 15 percent is being used for recycling generating revenue of Rs. 271 million per year through informal private sectors. If recycling is adopted as a formal industry by inducing private sector it can conserve soil used for dumping or landfills and it can also provide jobs to poverty stricken scavengers by integrating them in Recycling industry. Hospital waste, often hazardous is collected as part of the MSW and causes even more pollution. According to World Wildlife Fund (WWF), 250,000 tons of medical waste is annually produced from all sorts of health care facilities. In Punjab, 15 tons of hazardous hospital waste is produced daily, with a generation rate of 1.8 kg per day per bed while in Karachi only, 20 tons of waste is produced every day and only 2.5 tons is disposed of by City District Government Karachi. Incineration is widely used in many hospital as the main technique to reduce the volume of disposable waste and incinerator plants have been installed at some hospitals to burn the waste. Incinerator plants have been installed at Shalimar hospital Lahore and United Christian hospital under a project ‘Private sector hospital waste management’. Shaukat Khanum and Shaikh Zaid Hospital in Lahore and Aga Khan Hospital Karachi are also working. Incinerators have been installed at Karachi Metropolitan Corporation to burn waste from KMC’s hospital22. However, incinerators installed at a number of hospitals in Karachi, Lahore and Islamabad, do not meet the National Environment Quality standards (NEQs) resulting in emissions of toxic black fumes. Industrial waste treatment is also a neglected area within the Solid waste management, marred by lack of any statistical data. Sketchy picture emerges from the reports and studies of researchers and much like Municipal solid waste, there is no efficient treatment and handling of industrial waste. The obstacles are many; lack of coordination among the stake holders, financing of the industrial waste treatment facilities, loopholes or lack of clarity in the specific provisions of EPA, weakness in the enforceability of available provisions of the Act, non enforceability and non applicability of Polluter Pays Principle (PPP) being applied in all developed industrial countries and a few developing countries. PPP states that Polluter and not the Government is responsible for financial cost of reducing the unacceptable level of pollutant discharge. Polluter Pays Principle is not enshrined in Environment Protection Act of Pakistan but the Act contains provisions, section 6 and section 16 indirectly indicating the financial responsibility of the polluters. Construction of Industrial waste treatment plants and recurrent maintenance costs are the factors hindering construction of Effluent Treatment plants (ETP) and Common Effluent Treatment Plants (CETP). Only two CETP plants have been constructed so far but there are 21 Batool, S.A Chaudhry, 2008, Economic Potential of Recycling Business in Lahore, Pakistan.
22 Pakistan Environment Protection Agency, State of Environment Report, 2005
Annual Progress Report FY 2008/09 Poverty Reduction Strategy Paper (PRSP)
6
problems regarding the financial liability of maintenance costs of the plants which limits the environmental benefits from the investments made in these plants. There are 80 major industrial estates but only 50-100 ETPs for the industrial wastewater. There are only two CETP, one for Leather tanners of Kasur providing pre-treatment of wastewater and the other for 80 Korangi Industrial Area Tanners providing post treatment. Both the CETPs have been installed with the financial assistance of international development agencies and the Government of Pakistan with a limited indigenous financing by the industrial sector. Some industrial units have preferred their individual ETPs which are more expensive to build while CETP are cost-effective and requires lesser operational and maintenance costs. However construction of a CETP involves a lengthy process due to the requirement of the consensus among stake holders, sharing of the capital costs, assigning responsibility of coverage of operational costs. Due to these reasons, despite CETP being efficient and cost-effective to deal with industrial wastes, industrial units are either not complying with NEQs or building individual ETPs on international buyers’ pressure. ETPs have limited environmental benefits due to discharge of treated wastewater in untreated canal systems and non coverage of the remaining industrial estates’ pollutants discharges. Policy of the Government has been to try and reach a consensus with the industrial sector where government partially pays the cost of CETP, and a part is funded by the industry. However the policy has limited success in cases where industry resists the pressure to pay for the share in construction and later, maintenance costs of the plant.

Annual Progress Report FY 2008/09 Poverty Reduction Strategy Paper (PRSP)
2
The findings of the TUS would be assisting the government to determine whether changes in household incomes and control over the incomes by gender results in higher social investments. It would also be serving as policy input for budgetary allocations for development spending at large and for gender budgeting in particular.
Annex IV First Time Use Survey (TUS) – 2007
How people spend their time on socio-economic and other activities Time Use Survey (TUS) is the first of its kind ever carried out in Pakistan by Ministry of Finance in collaboration with the Federal Bureau of Statistics (FBS), Pakistan to analyze and document how people in Pakistan spend their time on socioeconomic and other activities. The objective of the survey was to profile the quantum and distribution of paid/unpaid work as a means to infer Policy/Programme implications from the perspective of gender equity and to collect and analyze the comprehensive information about the time spent by people on market and non-market economic activities and personal care and related activities that cannot be delegated to others. TUS provides the most complete account of all human activities performed by the respondents: the time spent on each of them, the sex and family context of persons performing them, as well as the location in the day when these activities are performed. TUS do this by using a “demographic” questionnaire and a “time diary”, which can be combined and compared. Respondents are expected to report the duration and timing of their different activities in sequence throughout the day(s) of the reference period, together with information on the context of the activities, i.e., “where” the activities are performed, “with whom” and “for what purpose”. The survey report has been released by the FBS in March, 2009 and it has already been launched in May 2009. FBS, the main producer of national official statistics, takes the lead for data collection and research for survey throughout Pakistan during January – December Year 2007 with a sample size of 19,600 households. To take care of the seasonal variation in the activity patterns, fieldwork of the survey was undertaken during the whole year. The survey results are representative at national and provincial level providing inter provincial analysis and rural-urban breakdown. The survey was initiated by the Gender Responsive Budgeting Initiative Project and is currently being completed with support of the Strengthening Poverty Reduction Strategy PRS Monitoring Project funded by the United Nations Development Program (UNDP). The data collected through TUS helps in analyzing how people allocate their time to various activities such as paid and unpaid work (e.g. caring children and sick people).In addition, this data can be used for drawing up ofsatellite accounts as proposed in the Systemof National Accounts (SNA) to find out economic value of unpaid work and this part would be covered in part two of the article. The survey findings reveal that, two-third population is rural and rest is urban. Age wise, more than seven-tenth (71%) is in potentially productive 10+ age groups, mostly in 20-39 bracket (27%). About one-fourth (24%) are adolescents and teens (10-19 years) while one-seventh (14%) are in forties and fifties. Elderly (sixty plus) are about one in seventeen (6%). The remaining one-third (29%) are below 10 years aged. Sex wise, all groups are evenly composed save the twenties and thirties which is more feminine (29%) than masculine (25%). The survey results show literacy trends, majority (42%) is with no formal education. Among the rest, below matric is the leading category (38%) followed distantly by below intermediate (11%).
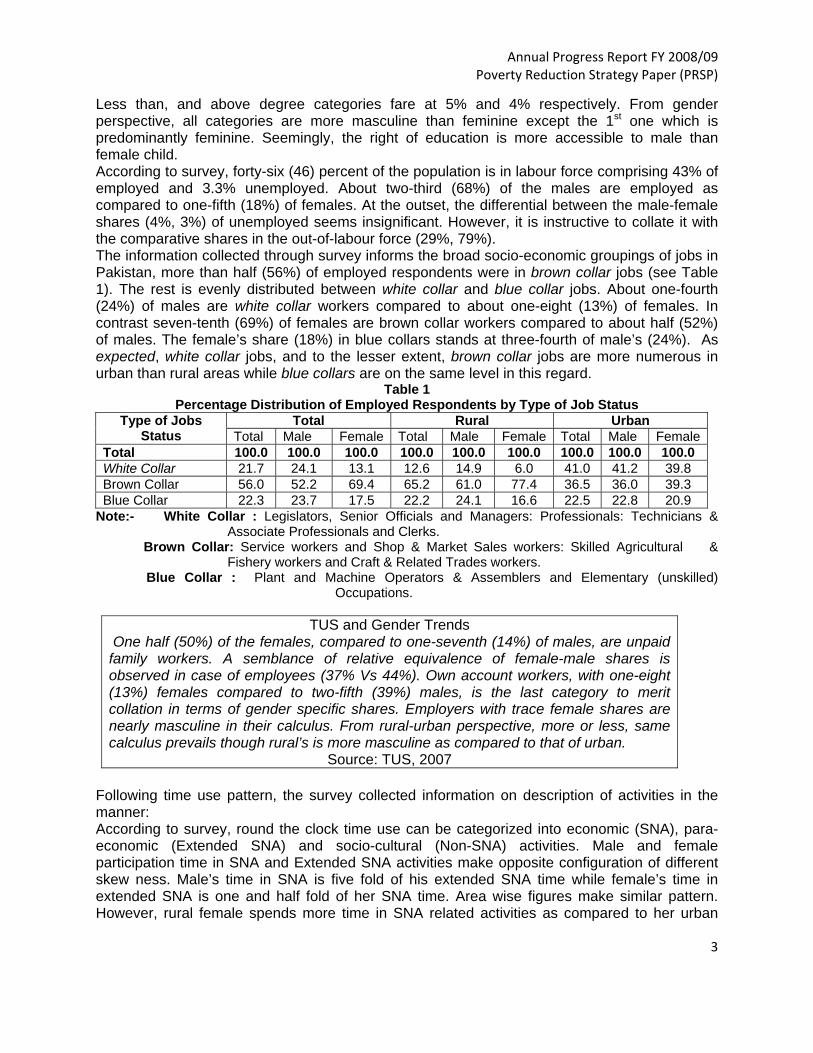
Annual Progress Report FY 2008/09 Poverty Reduction Strategy Paper (PRSP)
3
Less than, and above degree categories fare at 5% and 4% respectively. From gender perspective, all categories are more masculine than feminine except the 1st one which is predominantly feminine. Seemingly, the right of education is more accessible to male than female child. According to survey, forty-six (46) percent of the population is in labour force comprising 43% of employed and 3.3% unemployed. About two-third (68%) of the males are employed as compared to one-fifth (18%) of females. At the outset, the differential between the male-female shares (4%, 3%) of unemployed seems insignificant. However, it is instructive to collate it with the comparative shares in the out-of-labour force (29%, 79%). The information collected through survey informs the broad socio-economic groupings of jobs in Pakistan, more than half (56%) of employed respondents were in brown collar jobs (see Table 1). The rest is evenly distributed between white collar and blue collar jobs. About one-fourth (24%) of males are white collar workers compared to about one-eight (13%) of females. In contrast seven-tenth (69%) of females are brown collar workers compared to about half (52%) of males. The female’s share (18%) in blue collars stands at three-fourth of male’s (24%). As expected, white collar jobs, and to the lesser extent, brown collar jobs are more numerous in urban than rural areas while blue collars are on the same level in this regard.
Table 1 Percentage Distribution of Employed Respondents by Type of Job Status
Type of Jobs Status
Total Rural Urban Total Male Female Total Male Female Total Male Female
Total 100.0 100.0 100.0 100.0 100.0 100.0 100.0 100.0 100.0 White Collar 21.7 24.1 13.1 12.6 14.9 6.0 41.0 41.2 39.8 Brown Collar 56.0 52.2 69.4 65.2 61.0 77.4 36.5 36.0 39.3 Blue Collar 22.3 23.7 17.5 22.2 24.1 16.6 22.5 22.8 20.9
Note:- White Collar : Legislators, Senior Officials and Managers: Professionals: Technicians & Associate Professionals and Clerks.
Brown Collar: Service workers and Shop & Market Sales workers: Skilled Agricultural & Fishery workers and Craft & Related Trades workers.
Blue Collar : Plant and Machine Operators & Assemblers and Elementary (unskilled) Occupations.
TUS and Gender Trends
One half (50%) of the females, compared to one-seventh (14%) of males, are unpaid family workers. A semblance of relative equivalence of female-male shares is observed in case of employees (37% Vs 44%). Own account workers, with one-eight (13%) females compared to two-fifth (39%) males, is the last category to merit collation in terms of gender specific shares. Employers with trace female shares are nearly masculine in their calculus. From rural-urban perspective, more or less, same calculus prevails though rural’s is more masculine as compared to that of urban.
Source: TUS, 2007 Following time use pattern, the survey collected information on description of activities in the manner: According to survey, round the clock time use can be categorized into economic (SNA), para-economic (Extended SNA) and socio-cultural (Non-SNA) activities. Male and female participation time in SNA and Extended SNA activities make opposite configuration of different skew ness. Male’s time in SNA is five fold of his extended SNA time while female’s time in extended SNA is one and half fold of her SNA time. Area wise figures make similar pattern. However, rural female spends more time in SNA related activities as compared to her urban
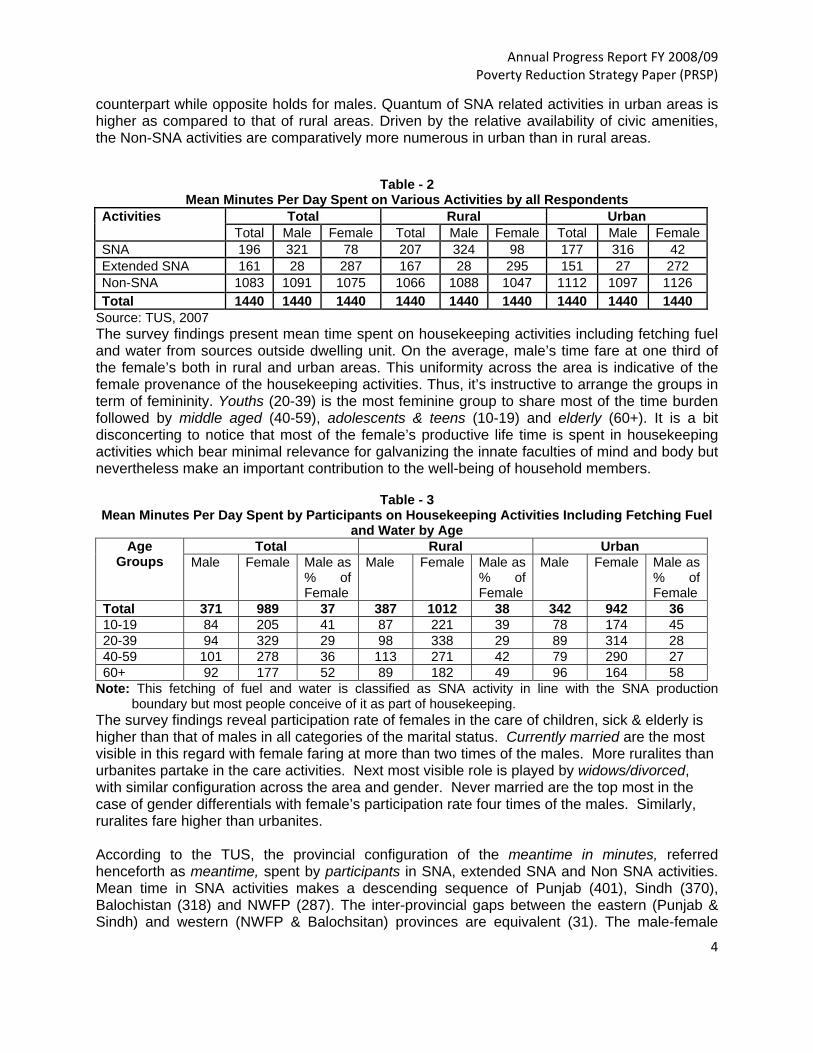
Annual Progress Report FY 2008/09 Poverty Reduction Strategy Paper (PRSP)
4
counterpart while opposite holds for males. Quantum of SNA related activities in urban areas is higher as compared to that of rural areas. Driven by the relative availability of civic amenities, the Non-SNA activities are comparatively more numerous in urban than in rural areas.
Table - 2 Mean Minutes Per Day Spent on Various Activities by all Respondents
Activities Total Rural Urban Total Male Female Total Male Female Total Male Female
SNA 196 321 78 207 324 98 177 316 42 Extended SNA 161 28 287 167 28 295 151 27 272 Non-SNA 1083 1091 1075 1066 1088 1047 1112 1097 1126 Total 1440 1440 1440 1440 1440 1440 1440 1440 1440
Source: TUS, 2007 The survey findings present mean time spent on housekeeping activities including fetching fuel and water from sources outside dwelling unit. On the average, male’s time fare at one third of the female’s both in rural and urban areas. This uniformity across the area is indicative of the female provenance of the housekeeping activities. Thus, it’s instructive to arrange the groups in term of femininity. Youths (20-39) is the most feminine group to share most of the time burden followed by middle aged (40-59), adolescents & teens (10-19) and elderly (60+). It is a bit disconcerting to notice that most of the female’s productive life time is spent in housekeeping activities which bear minimal relevance for galvanizing the innate faculties of mind and body but nevertheless make an important contribution to the well-being of household members.
Table - 3
Mean Minutes Per Day Spent by Participants on Housekeeping Activities Including Fetching Fuel and Water by Age
Age Groups
Total Rural Urban Male Female Male as
% of Female
Male Female Male as % of Female
Male Female Male as % of Female
Total 371 989 37 387 1012 38 342 942 36 10-19 84 205 41 87 221 39 78 174 45 20-39 94 329 29 98 338 29 89 314 28 40-59 101 278 36 113 271 42 79 290 27 60+ 92 177 52 89 182 49 96 164 58
Note: This fetching of fuel and water is classified as SNA activity in line with the SNA production boundary but most people conceive of it as part of housekeeping.
The survey findings reveal participation rate of females in the care of children, sick & elderly is higher than that of males in all categories of the marital status. Currently married are the most visible in this regard with female faring at more than two times of the males. More ruralites than urbanites partake in the care activities. Next most visible role is played by widows/divorced, with similar configuration across the area and gender. Never married are the top most in the case of gender differentials with female’s participation rate four times of the males. Similarly, ruralites fare higher than urbanites. According to the TUS, the provincial configuration of the meantime in minutes, referred henceforth as meantime, spent by participants in SNA, extended SNA and Non SNA activities. Mean time in SNA activities makes a descending sequence of Punjab (401), Sindh (370), Balochistan (318) and NWFP (287). The inter-provincial gaps between the eastern (Punjab & Sindh) and western (NWFP & Balochsitan) provinces are equivalent (31). The male-female

Annual Progress Report FY 2008/09 Poverty Reduction Strategy Paper (PRSP)
5
differentials show SNA activities as preponderantly male’s preview, more in Sindh (278) followed decreasingly by Balochistan (265), Punjab (251) and NWFP (229). Areas wise, SNA tasks are more exacting for urban than rural participants in a declining order of Sindh (100), NWFP (84), Punjab (65) and Balochistan (35) as shown by the urban-rural differentials in the parenthesis. Overall, implementation of the TUS however, is relatively technical and lengthy process. Respondents, especially those living in rural areas and less educated, normally did not care with time. They faced difficulty in providing information on when and how they spent time for each activity. On the other hand respondents, especially women, may conduct more than one activity at the same time. A mother for example, may do cooking and cleaning house interchangeable, and at the same time carrying her child in her neck. This might results that the total number of hours for all activities more than 24 hours a day. This was Pakistan’s first national survey on time use. The overall conclusion is that the survey shows gender and rural/urban differences in time use, and characterises the life pattern of the working and non-working population and paid and unpaid work. It highlights the volume of actual working time more clearly than any other quantitative measure. Time use statistics have great value in informing the government policy development process. It would help the policy makers to devise and implement gender equitable paradigm of socioeconomic development so as to realize the full productive potential of the society. Much public policy is concerned with the boundaries between paid and unpaid work, and these boundaries are different for women and men, and for different groups in the society.
Annual Progress Report FY 2008/09 Poverty Reduction Strategy Paper (PRSP)
6
Annex V Achieving Social and Financial Sustainability
A Study on the Performance of Microfinance Sector in Pakistan*23 The report (2009) analyses the performance of micro finance sector in Pakistan in fulfilling its dual objective of ‘social uplift’ and achieving ‘financial sustainability’. The main object of the report has been the performance of micro finance industry in Pakistan with specific focus on ‘both supply and demand side issues’. Section one explain importance of the micro finance initiatives undertaken to-date by Pakistan. Section two focuses on study scope and sample size and, section three gives an overall financial review of the sector. Section four covers survey findings and section five briefly speaks about impact of the sector. Last section six concludes the study.
1. Micro Finance Acknowledging the success of Grameen Bank in Bangladesh, Government of Pakistan (GOP) has taken major steps to promote micro finance in the country by introducing the micro finance ordinance in 2001. Since then Pakistan Poverty Alleviation Fund (PPAF) and Khushali Bank (KB) have been sponsored by the state for greater outreach of the micro finance services. A number of other initiatives have been undertaken by the GOP and State Bank of Pakistan (SBP) to ensure steady growth of the micro finance industry. The multipronged approach to use micro finance for social uplift and lowering poverty, though successful, has been confronted with several other challenges. Overall, sustainability in general and financial and social sustainability in particular and efficiency issues lie at the heart of micro finance sector’s growth in Pakistan. 2. Study Scope and Sample size The survey covered three provinces – Punjab, Sindh and Baluchistan where ILO’s child labor project partner NGOs also introduced their PPAF supported microfinance interventions. The research has covered key issues by obtaining first hand information from both micro finance providers and users. The sample size includes 500 clients (users) of micro finance institutions based in Sialkot (Punjab), Hyderabad and Karachi (Sindh) and Gawadar (Baluchistan). UN-ILO arranged access to three of their child labor project partners NGOs, Bunyad Foundation in Sialkot, National Rural Support Program (NRSP) in Hyderabad and Taraqee Foundation in Gawadar. These three ILO partners introduced the PPAF support microfinance interventions among the willing families of child laborers in these target areas. The SBP facilitated access to six micro finance banks. Clients (users) and field teams of these organizations were interviewed for this study. However the sample is not restricted to other clients and organizations operational in the selected areas. 3. Financial Review of the Micro Finance Sector During 2003-2007 the sector has shown significant growth both in terms of expansion and outreach24. The assets of the industry has increased to Rs. 22.9 billion in 2007 from Rs. 7.8 billion in 200325 which shows tremendous expansion of the sector. Gross loan portfolio has increased to 388% in the same period. During the review period, the sector has maintained gender balance in terms of active borrowers. A network of 1,165 branches exists to cater the
23 This report is a result of collaboration between International Labor Organization (ILO) Pakistan and State Bank of Pakistan (SBP) and is based on a survey of micro finance sector in year 2008.
24 The data source is Pakistan Micro Finance Network (PMN) quarterly and annual reports (Pakistan micro Finance review). 25 Before 2003, the size of formal sector was too small to analyze in comparison with the overall sector.

Annual Progress Report FY 2008/09 Poverty Reduction Strategy Paper (PRSP)
7
need of the borrowers. The growth in assets reflects expansion of micro finance activities in the country. Although there is an increase of around 900 thousands of borrowers since 2003 but this coverage seems quite low compared to the large demand around 25-30 million potential borrowers in the country. Enhancing outreach while maintaining sustainability and efficiency of institutions is one of the key challenges faced by the micro finance organizations. Nevertheless, outreach has expanded significantly as discussed but asset quality indicators are not satisfactory when compared the overall financial sector. Portfolio of Risk (PAR)26 is rising reflected by declining risk coverage ratio (RCR)27. The reason behind is that the regulated sector is more transparent in its reporting and following international accounting standards. In presence of dominated unregulated sector, a matter of concern is that sector has not been able to earn profit to date see Table 2. Key indicators such as ROA and ROE as shown in the table have deteriorated over the years from 2003-2007.
Table 2: Profitability Indicators (Percent) of the Sector 2003 2004 2005 2006 2007
Profit margin(adjusted) -51.6 -53.7 -63.9 -50.4 -35.2 Adjusted return on
assets (ROA) -5.0 -5.0 -7.2 -6.1 -6.4
Adjusted return on equity (ROE)
-8.7 -10.0 -18.7 -19.0 -20.9
Total expenses (Rs. Millions)
129 287 528 552 781
Source: Pakistan Micro Finance Network (PMN) The review of the operational self sufficiency (OSS)28 and financial self sufficiency (FSS)29 indicators present an encouraging scenario in the industry. At the end of 2007, OSS stands at 90 % which is compatible with the regional average of 89% and FSS 74.5% is less than the regional average of 95%. One encouraging fact is that OSS has shown an improvement of 10 percentage points over the last 4 years see Figure 3. On the other hand improvement in FSS does not appear to be significant but is encouraging as this has occurred in the presence of massive increase in operational expenditure of the sector due to expanding operations in the country. 4. Survey Findings According the survey, more than 91 percent respondents indicated that loan is extended for expansion of already business .This might be because assessment and appraisal of running business is easier and less risky than of a new business. According to a senior manager of a micro finance institution:
“We extend loans to only those individuals who have a running business for at least two years”. 26 PAR measures the quality of portfolio. 27 RCR is the ratio of adjusted loan loss reserve to portfolio at risk> 30 days and tells how much of the PAR covered by an MFI’s loan loss allowance. 28 Operational self sufficiency (OSS) measures how well an MFI covers its costs through operating revenues. 29 Financial self sufficiency (FSS) measures how well an MFI covers its costs, cost of capital and loan losses.

Annual Progress Report FY 2008/09 Poverty Reduction Strategy Paper (PRSP)
8
Following the global trend, Pakistan’s micro finance institutions use the group lending model. According to the survey findings group formation for acquiring a loan is one of the major hurdles in securing a loan. Group lending is critical to overcome the problem of voluntary default since it works as social collateral.
Source: Achieving social and financial sustainability - SBP-ILO Study
The micro finance industry has been highly criticized on charging high rate of interest on loan advances. During the survey most of the interviewed micro finance officials justified charging of high rate of interest because of high operational cost and it still being lower than the interest rate charged by the money lenders. The demand side (clients) responded on the same issue differently as one of the reasons for poor people willing to pay high interest rate is that the poor are more concerned with the access and availability of credit at their door steps rather than cost of it. Micro finance institutions uses different interest rates mechanisms which are difficult to understand by the clients. The survey findings reveled that due to low literacy level micro finance clients were unable to fully understand the procedure underlying interest calculation. Also, it is worth highlighting that most of the MFIs do not make satisfactory efforts to communicate the mechanism behind interest rate calculations. High loan recovery rate of micro finance institution is regarded as one of the greatest achievement of micro finance sector. Survey findings supported this claim as results indicate that the recovery rate of all micro finance institutions surveyed was above 90 percent. This is remarkable as there is no requirement of financial and other collateral. According to the credit officers interviewed in the field, clients were not comfortable with high processing fee charged by the micro finance institutions for acquiring a loan. Survey results show that 37 percent of the respondents paid Rs. 300 to Rs. 500 as loan processing fee which appears to be high for a loan mount of Rs. 10,000. While around 34% paid around Rs 100 to 300 for obtaining a loan. On average the processing fee for regulated institution is even higher i.e. Rs. 500 (see Figure 5). However no respondent mentioned processing fee as a reason for not availing a loan. Survey data regarding respondents’ living standard revealed that micro finance clients do not belong to the poor segment of the society. Loan officers prefer to offer loans to those belong to economically better off for timely recovery of the loan repayments. More than 65% of the respondents have monthly income of more than Rs. 8000 which is also supported by their living standards (see Figure 6). More than 24% of the respondents have monthly income between Rs. 5001 to Rs. 8000 followed by 8.3 % between Rs. 3001 to Rs. 5000. Not only did a majority of respondents, more than 87% possessed their own house but they also have facilities of
According to the field managers of the micro finance institution,
“people generally provide two reasons for not availing loans (i) problems related to group formation and (ii) insufficient loan amount. “
According to the management of micro finance institution,
“for the purpose of sustainability, micro finance institutions should keep balance between its social and financial objective.”

Annual Progress Report FY 2008/09 Poverty Reduction Strategy Paper (PRSP)
9
electricity (98.4%) gas (89.8%) television (96%) washing machine (86.6%) and mobile phone (65%). 5. Impact of Micro Finance Nevertheless, the social impact of micro finance cannot be quantified especially when the initiatives being reviewed have a short history of five years. The earlier impact studies could not be able to quantify the exact impact however, majority of the respondents were satisfied with the qualitative improvement in their standard of living. The survey results informed that clients of both formal and informal micro finance sector had experienced a positive change in their socio-economic condition. Majority of the credit officers interviewed were of the opinion that micro finance interventions certainly had positive outcomes but the magnitude of these improvements was undermined by factors like inflation and other natural calamities. Another and second positive impact of microfinance intervention is female empowerment. Women particularly from conservative cultures have unequal access to education, provision of capital and training opportunities. Increase access to finance demonstrated an improvement in the socio-economic condition of the women.
One important finding of the survey was in cases where loans were provided to women, they were generally utilized by male members of the family. However, this practice is not being discouraged because the ultimate user of the loan is family and this practice does not neutralize the objectives of micro finance i.e. socio-economic uplift of the poor. 6. Conclusion Micro finance industry has grown at a significant pace in Pakistan; however, there is a need to initiate further steps both at the government and private level to cater the need of 25-30 million potential clients of the micro finance. Lack of product diversification has been found as one of the major impediments in increasing outreach and attaining sustainability. This calls for research and innovation on the product development side. On the demand side, the main concern of micro finance clients is access to credit rather than the interest rate. Other apprehension of micro finance client is lower loan amount and the condition of group formation. It is critically important for micro finance institutions to improve on the efficiency and sustainability frontiers. All key stakeholders of microfinance industry need to realize that micro finance is but one element of a comprehensive strategy to alleviate poverty.
According to micro finance bank field manager “Earlier women especially in rural areas did not have National Identity Cards (NICs). Previously they were not allowed to come out of their house and NIC was not considered important for them. Now they have their NICs and running their own businesses.”
According to a field officer “women borrowers become stronger in house affairs because even if male is using the loan she will be the focal contact making her important which is expected to raise her status at home.”
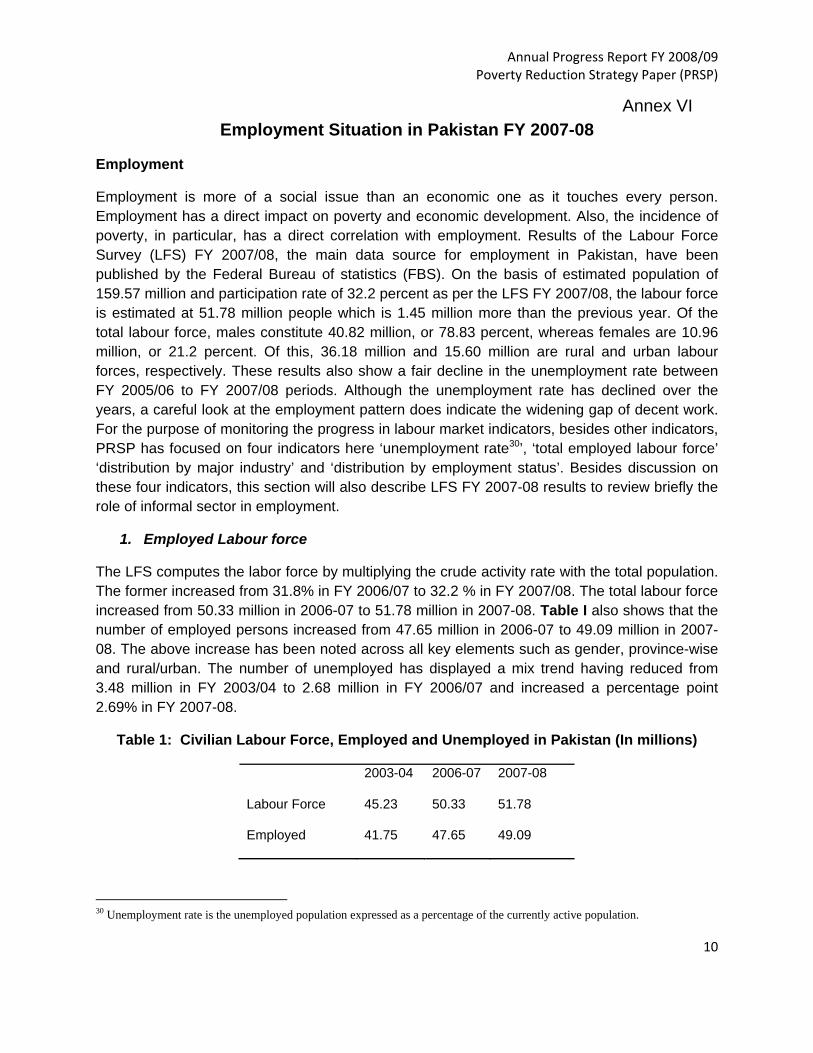
Annual Progress Report FY 2008/09 Poverty Reduction Strategy Paper (PRSP)
10
Annex VI Employment Situation in Pakistan FY 2007-08
Employment
Employment is more of a social issue than an economic one as it touches every person. Employment has a direct impact on poverty and economic development. Also, the incidence of poverty, in particular, has a direct correlation with employment. Results of the Labour Force Survey (LFS) FY 2007/08, the main data source for employment in Pakistan, have been published by the Federal Bureau of statistics (FBS). On the basis of estimated population of 159.57 million and participation rate of 32.2 percent as per the LFS FY 2007/08, the labour force is estimated at 51.78 million people which is 1.45 million more than the previous year. Of the total labour force, males constitute 40.82 million, or 78.83 percent, whereas females are 10.96 million, or 21.2 percent. Of this, 36.18 million and 15.60 million are rural and urban labour forces, respectively. These results also show a fair decline in the unemployment rate between FY 2005/06 to FY 2007/08 periods. Although the unemployment rate has declined over the years, a careful look at the employment pattern does indicate the widening gap of decent work. For the purpose of monitoring the progress in labour market indicators, besides other indicators, PRSP has focused on four indicators here ‘unemployment rate30’, ‘total employed labour force’ ‘distribution by major industry’ and ‘distribution by employment status’. Besides discussion on these four indicators, this section will also describe LFS FY 2007-08 results to review briefly the role of informal sector in employment.
1. Employed Labour force
The LFS computes the labor force by multiplying the crude activity rate with the total population. The former increased from 31.8% in FY 2006/07 to 32.2 % in FY 2007/08. The total labour force increased from 50.33 million in 2006-07 to 51.78 million in 2007-08. Table I also shows that the number of employed persons increased from 47.65 million in 2006-07 to 49.09 million in 2007-08. The above increase has been noted across all key elements such as gender, province-wise and rural/urban. The number of unemployed has displayed a mix trend having reduced from 3.48 million in FY 2003/04 to 2.68 million in FY 2006/07 and increased a percentage point 2.69% in FY 2007-08.
Table 1: Civilian Labour Force, Employed and Unemployed in Pakistan (In millions)
2003-04 2006-07 2007-08
Labour Force 45.23 50.33 51.78
Employed 41.75 47.65 49.09
30 Unemployment rate is the unemployed population expressed as a percentage of the currently active population.
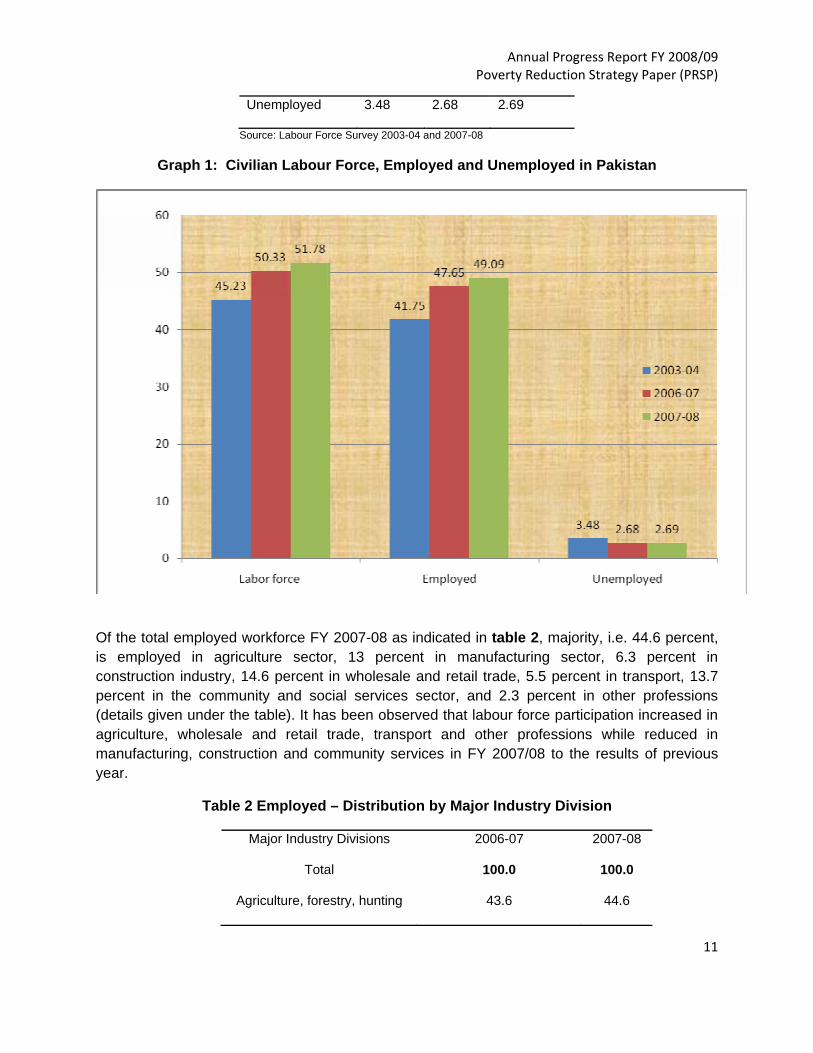
Annual Progress Report FY 2008/09 Poverty Reduction Strategy Paper (PRSP)
11
Unemployed 3.48 2.68 2.69
Source: Labour Force Survey 2003-04 and 2007-08
Graph 1: Civilian Labour Force, Employed and Unemployed in Pakistan
Of the total employed workforce FY 2007-08 as indicated in table 2, majority, i.e. 44.6 percent, is employed in agriculture sector, 13 percent in manufacturing sector, 6.3 percent in construction industry, 14.6 percent in wholesale and retail trade, 5.5 percent in transport, 13.7 percent in the community and social services sector, and 2.3 percent in other professions (details given under the table). It has been observed that labour force participation increased in agriculture, wholesale and retail trade, transport and other professions while reduced in manufacturing, construction and community services in FY 2007/08 to the results of previous year.
Table 2 Employed – Distribution by Major Industry Division
Major Industry Divisions 2006-07 2007-08
Total 100.0 100.0
Agriculture, forestry, hunting 43.6 44.6
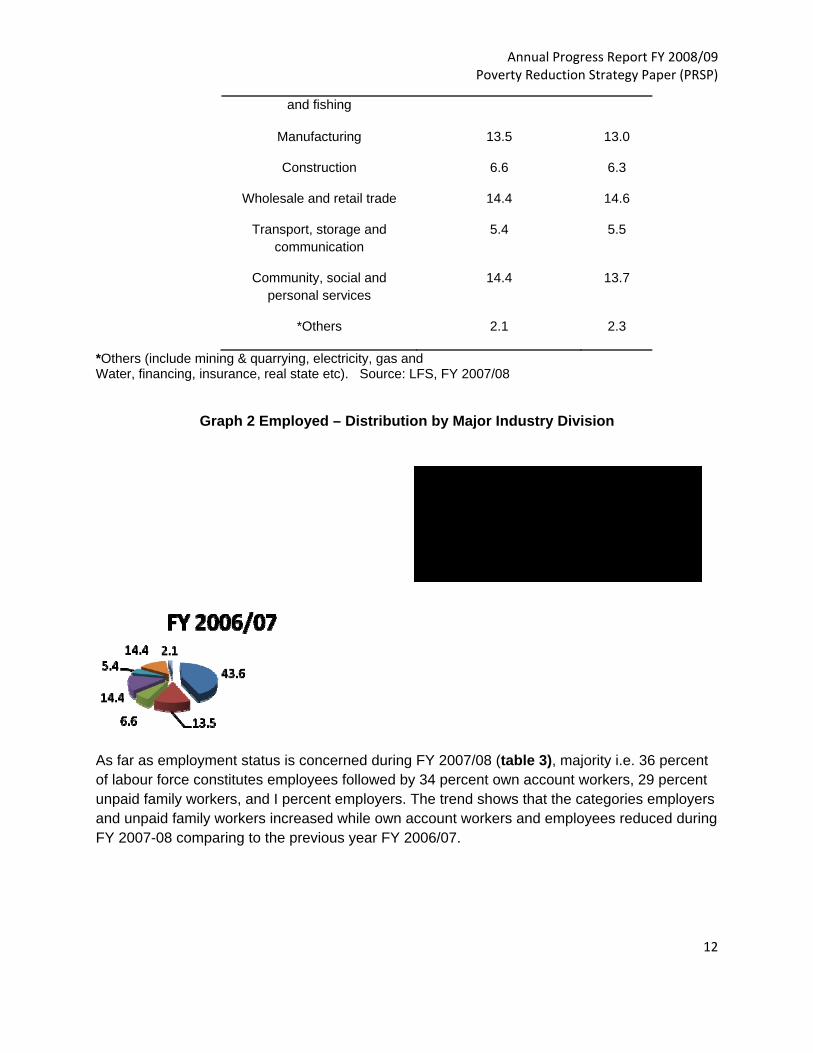
Annual Progress Report FY 2008/09 Poverty Reduction Strategy Paper (PRSP)
12
44.6
136.314.6
5.5 13.72.3
FY 2007/08AgricutureManufactrungConstrcutionWholesaleTransport
and fishing
Manufacturing 13.5 13.0
Construction 6.6 6.3
Wholesale and retail trade 14.4 14.6
Transport, storage and communication
5.4 5.5
Community, social and personal services
14.4 13.7
*Others 2.1 2.3
*Others (include mining & quarrying, electricity, gas and Water, financing, insurance, real state etc). Source: LFS, FY 2007/08
Graph 2 Employed – Distribution by Major Industry Division
As far as employment status is concerned during FY 2007/08 (table 3), majority i.e. 36 percent of labour force constitutes employees followed by 34 percent own account workers, 29 percent unpaid family workers, and I percent employers. The trend shows that the categories employers and unpaid family workers increased while own account workers and employees reduced during FY 2007-08 comparing to the previous year FY 2006/07.
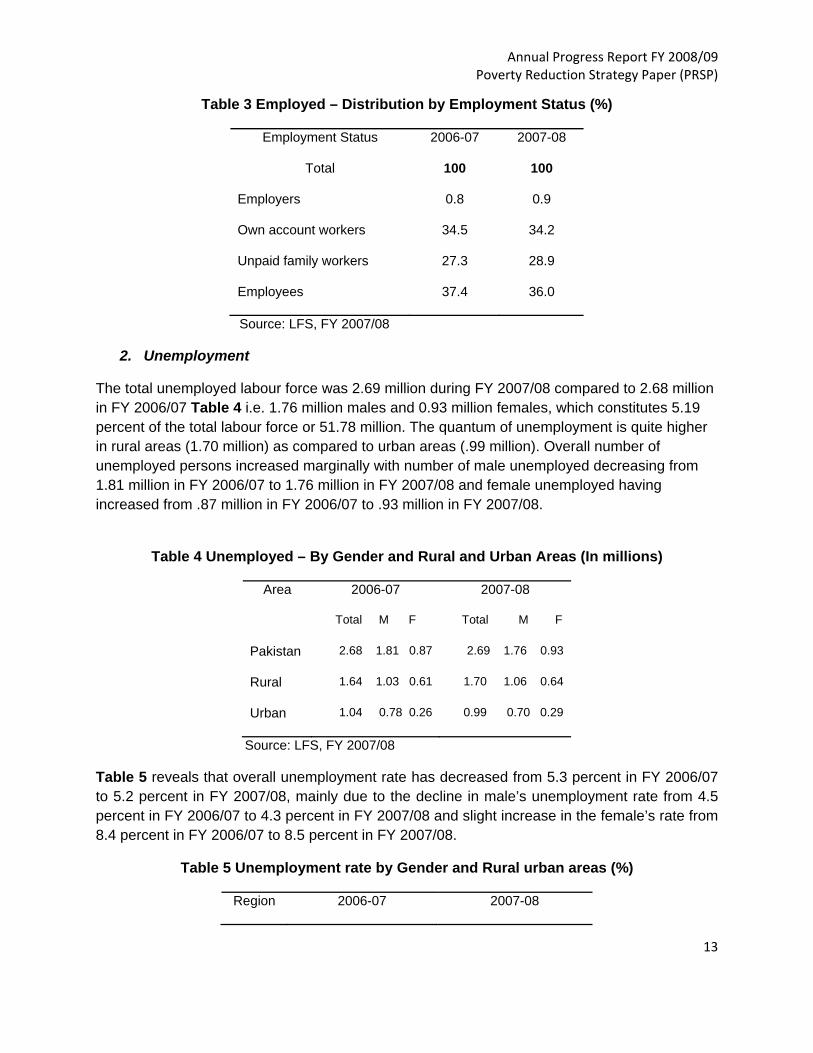
Annual Progress Report FY 2008/09 Poverty Reduction Strategy Paper (PRSP)
13
Table 3 Employed – Distribution by Employment Status (%)
Employment Status 2006-07 2007-08
Total 100 100
Employers 0.8 0.9
Own account workers 34.5 34.2
Unpaid family workers 27.3 28.9
Employees 37.4 36.0
Source: LFS, FY 2007/08
2. Unemployment
The total unemployed labour force was 2.69 million during FY 2007/08 compared to 2.68 million in FY 2006/07 Table 4 i.e. 1.76 million males and 0.93 million females, which constitutes 5.19 percent of the total labour force or 51.78 million. The quantum of unemployment is quite higher in rural areas (1.70 million) as compared to urban areas (.99 million). Overall number of unemployed persons increased marginally with number of male unemployed decreasing from 1.81 million in FY 2006/07 to 1.76 million in FY 2007/08 and female unemployed having increased from .87 million in FY 2006/07 to .93 million in FY 2007/08.
Table 4 Unemployed – By Gender and Rural and Urban Areas (In millions)
Area 2006-07 2007-08
Total M F Total M F
Pakistan 2.68 1.81 0.87 2.69 1.76 0.93
Rural 1.64 1.03 0.61 1.70 1.06 0.64
Urban 1.04 0.78 0.26 0.99 0.70 0.29
Source: LFS, FY 2007/08
Table 5 reveals that overall unemployment rate has decreased from 5.3 percent in FY 2006/07 to 5.2 percent in FY 2007/08, mainly due to the decline in male’s unemployment rate from 4.5 percent in FY 2006/07 to 4.3 percent in FY 2007/08 and slight increase in the female’s rate from 8.4 percent in FY 2006/07 to 8.5 percent in FY 2007/08.
Table 5 Unemployment rate by Gender and Rural urban areas (%)
Region 2006-07 2007-08

Annual Progress Report FY 2008/09 Poverty Reduction Strategy Paper (PRSP)
14
Total Male Female Total Male Female
Rural 4.7 4.0 7.1 4.7 3.9 6.9
Urban 6.7 5.6 14.6 6.3 5.0 17.7
All areas 5.3 4.5 8.4 5.2 4.3 8.5
Source: LFS, 2007-08
Changes in the unemployment rates vary between rural and urban areas. Male unemployment rate declined in both rural and urban areas during FY 2007/08 and it has declining significantly more in urban than rural areas. Female unemployment rate also declined marginally in rural areas but increased significantly in urban areas from 14.6 percent in FY 2006/07 to 17.7% in FY 2007/08. With regards to decline in male unemployment rate in both rural and urban areas, this could be due to the one reason; expansion in job opportunities in both urban and rural markets particularly in private sector business opportunities. The rise in female unemployment in urban areas is a serious concern for which the Government needs to introduce focused programmes for women. Skill generation and enterprise development is one option in the Benazir Income Support Programme through which female unemployment issue in urban areas can be addressed.
Graph 3: Unemployment rate both sex by age groups (2006-07, 2007-08)
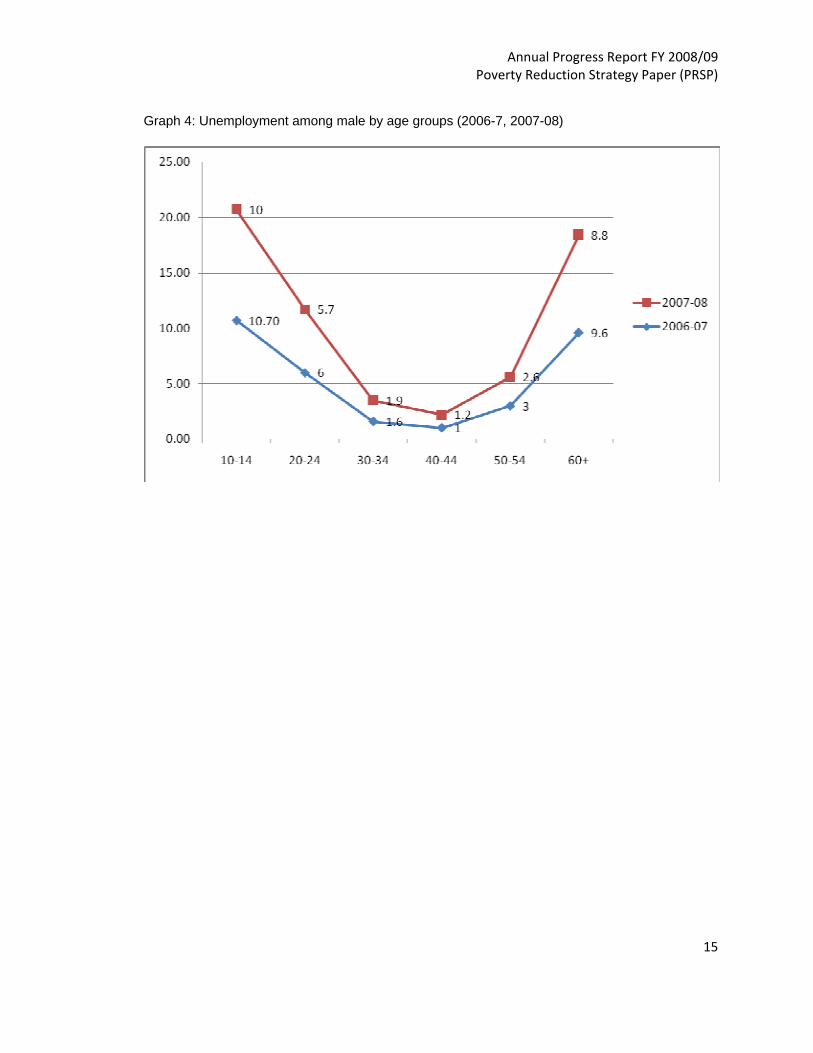
Annual Progress Report FY 2008/09 Poverty Reduction Strategy Paper (PRSP)
15
Graph 4: Unemployment among male by age groups (2006-7, 2007-08)
Related Documents