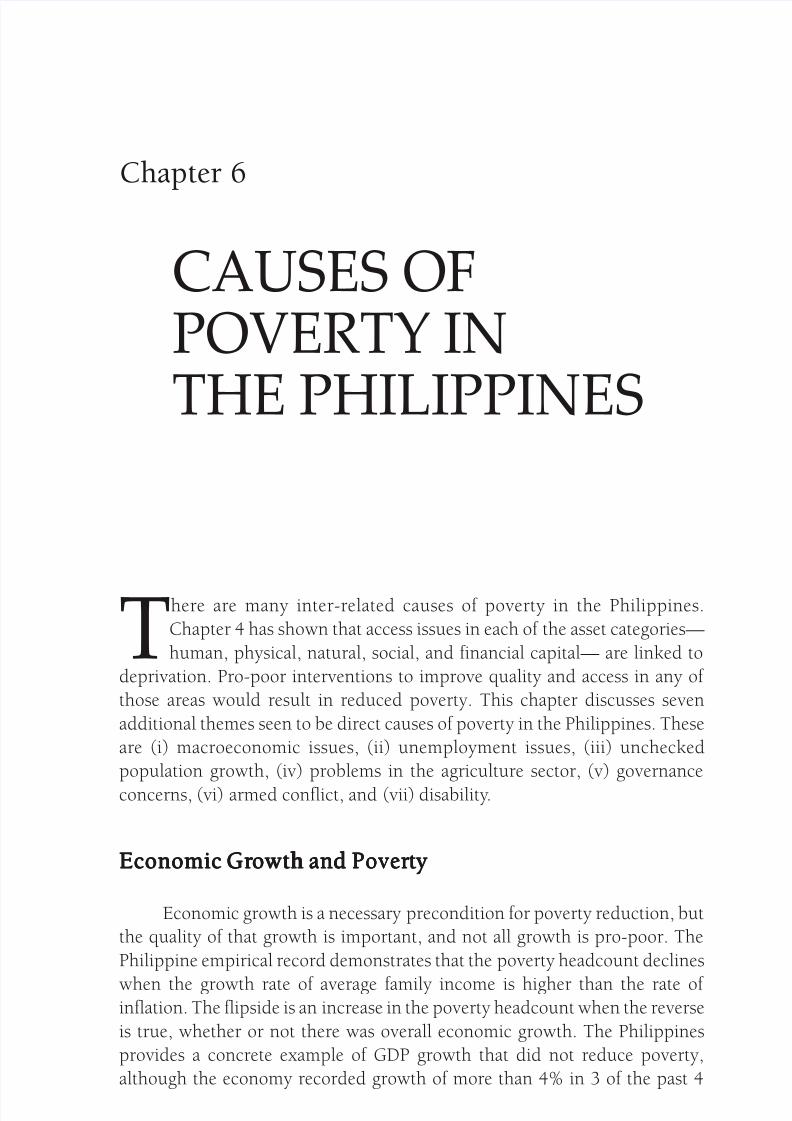
85 Chapter 6: Causes of Poverty in the Philippines Chapter 6 CAUSES OF POVERTY IN THE PHILIPPINES T here are many inter-related causes of poverty in the Philippines. Chapter 4 has shown that access issues in each of the asset categories— human, physical, natural, social, and financial capital— are linked to deprivation. Pro-poor interventions to improve quality and access in any of those areas would result in reduced poverty. This chapter discusses seven additional themes seen to be direct causes of poverty in the Philippines. These are (i) macroeconomic issues, (ii) unemployment issues, (iii) unchecked population growth, (iv) problems in the agriculture sector, (v) governance concerns, (vi) armed conflict, and (vii) disability . Economic Gr Economic Gr Economic Gr Economic Gr Economic Growth and Pover owth and Pover owth and Pover owth and Pover owth and Pover ty ty ty ty ty Economic growth is a necessary precondition for poverty reduction, but the quality of that growth is important, and not all growth is pro-poor. The Philippine empirical record demonstrates that the poverty headcount declines when the growth rate of average family income is higher than the rate of inflation. The flipside is an increase in the poverty headcount when the reverse is true, whether or not there was overall economic growth. The Philippines provides a concrete example of GDP growth that did not reduce poverty, although the economy recorded growth of more than 4% in 3 of the past 4

Welcome message from author
This document is posted to help you gain knowledge. Please leave a comment to let me know what you think about it! Share it to your friends and learn new things together.
Transcript
8/6/2019 Poverty in Philippines
http://slidepdf.com/reader/full/poverty-in-philippines 1/23
85Chapter 6: Causes of Poverty in the Philippines
Chapter 6
CAUSES OF
POVERTY IN
THE PHILIPPINES
There are many inter-related causes of poverty in the Philippines.
Chapter 4 has shown that access issues in each of the asset categories—
human, physical, natural, social, and financial capital— are linked to
deprivation. Pro-poor interventions to improve quality and access in any of
those areas would result in reduced poverty. This chapter discusses seven
additional themes seen to be direct causes of poverty in the Philippines. These
are (i) macroeconomic issues, (ii) unemployment issues, (iii) unchecked
population growth, (iv) problems in the agriculture sector, (v) governance
concerns, (vi) armed conflict, and (vii) disability.
Economic GrEconomic GrEconomic GrEconomic GrEconomic Growth and Poverowth and Poverowth and Poverowth and Poverowth and Povertytytytyty
Economic growth is a necessary precondition for poverty reduction, but
the quality of that growth is important, and not all growth is pro-poor. The
Philippine empirical record demonstrates that the poverty headcount declines
when the growth rate of average family income is higher than the rate of inflation. The flipside is an increase in the poverty headcount when the reverse
is true, whether or not there was overall economic growth. The Philippines
provides a concrete example of GDP growth that did not reduce poverty,
although the economy recorded growth of more than 4% in 3 of the past 4

8/6/2019 Poverty in Philippines
http://slidepdf.com/reader/full/poverty-in-philippines 2/23
86 Poverty in the Philippines: Income, Assets and Access
years. The 2003 FIES shows average family incomes to have increased by only
2.5% over the 2000 level, while the CPI indicates an inflation rate of 13.9%. It
is therefore almost certain that the poverty headcount increased during thisperiod. It most likely increased by a greater degree than from 1997–2000,
when average family incomes grew by 18%, inflation was 22%, and the poverty
incidence of the population increased by 1%.
Economic growth has not been high enough to keep up with population
growth: GNP per capita has lingered at around $1,000 for the past 20 years.
This is partly a result of mismanagement of the economy, and partly a result of
external shocks, to which the Philippines is particularly vulnerable. It is widely
recognized that the impact of the 1997 Asian financial crisis was not as serious
in the Philippines as it was in neighboring countries, and that the Philippineswas able to recover relatively quickly. Nevertheless, it did have an impact on
poverty, undoing some of the gains made in the early to mid-1990s in terms of
income poverty incidence. Importantly, the crisis came at the same time as the
devastating El Niño drought.
Datt and Hoogeveen (2003) analyze the dual impacts of the financial
crisis and El Niño on poverty and inequality in the Philippines. When the
financial crisis set in, the Philippine economy stalled. Per capita real GNP
declined by 2.7%. Agriculture contracted by 6.6% while industrial productionfell by 1.7%. With the slowdown in output growth came the labor market
shock, with unemployment rates increasing. Inflation accelerated, and food
prices increased even faster than the general level of prices with the plummeting
of agricultural output. Datt and Hoogveen’s regression analysis finds that the
impact of the financial crisis on poverty was modest relative to estimates for
other crisis-affected countries. In the Philippines, it caused a 5% reduction in
average living standards, increased the incidence of poverty by about 9%, and
the depth and severity of poverty by 11% and 13%, respectively. In contrast,the authors find that the largest share of the overall impact on poverty was
attributable to the El Niño shock, its share ranging between 47% and 57% of
the total impact on measures of incidence, depth and severity of poverty.
While the Philippines managed to recover after the dual shock of the
Asian financial crisis and the El Niño weather phenomenon, a number of
problems persist on the macroeconomic management side. The high fiscal
deficit, a fluctuating regulatory environment, ambiguous enforcement of
contracts, and security concerns all contribute to a lack of investor confidence.
This has flattened the economic growth trends and long-term development
prospects of the economy. The list of chronic macroeconomic problems in the
Philippines is long and includes:

8/6/2019 Poverty in Philippines
http://slidepdf.com/reader/full/poverty-in-philippines 3/23
87Chapter 6: Causes of Poverty in the Philippines
• declining revenue collection causing fiscal deficit and heavy public
sector debt;
• a poor investment climate resulting in particularly low foreign directinvestment;
• nonperforming loans in the banking sector;
• a gradual loss of international competitiveness; and
• a governance structure rife with corruption and inefficiency in
economic management.
Fiscal deficit and public sector debt
Poverty reduction requires dedicated resources, something the PhilippineGovernment is lacking. The fiscal deficit and the national government debt
are the Achilles heel of the Philippine economy. They have caused the decline
of capital expenditures, thus affecting capacity for poverty reduction efforts.
The revenue/gross national product (GNP) ratio declined from 16.3% of GNP
in 1997 to only 13.6% in 2003 (see Table 28).64 Because of the Government’s
fundamental limitations in human, financial, and physical resources, aggravated
by excessive red tape, graft, and corruption, the Government has generally
been unable to properly run the country. It has failed to ensure the efficientdelivery of necessary public services, and has not brought about the economic
development and widespread prosperity the country deserves.
With the chronic fiscal deficit problem, the Government has to borrow
to meet its operational requirements and to survive. Debt interest payments
have increased from 19.5% in 1998 to 27.4% in 2003, crowding out the
productive portion of the national budget. The results have been predictably
negative:
• steadily growing interest expenses that now take up more than one
third of all government revenues;
• a squeezing out of other necessary expenditures such as health,
education, and agricultural services, all of which have declined as a
percentage of GDP for 3 consecutive years;
• growing concern about the possibility of a collapse of the peso, an
important obstacle to both foreign and domestic investment.
64 The revenue/GNP ratio should be at 25% or above.

8/6/2019 Poverty in Philippines
http://slidepdf.com/reader/full/poverty-in-philippines 4/23
88 Poverty in the Philippines: Income, Assets and Access
On the expenditure side, the continued use of “pork barrel” spending
programs at all levels of government cripples the government’s ability to function
effectively, by putting a significant portion of these already limited resourcesout of reach of those who are attempting to formulate serious plans for allocating
spending according to the right criteria.
The country cannot continue to borrow, since its credit rating will further
deteriorate and the only sources of funds will then come with sky-high interest
rates from foreign banks or private sector sources. If there is no appropriate
and effective reform, the next few years will see serious challenges on the debt
issue that will lead to expenditures shortage, credit deterioration, and worsening
public services. An increasing debt stock will further result in a depreciated
local currency and a wider trade deficit. The increased borrowing in 2003caused apprehensions to be expressed by various multilateral and credit rating
agencies that urged the Government to significantly raise revenues and control
spending. To reduce debt load, the Government must increase revenues and
rationalize the expenditure structure. Key elements will include enhancing
LGU revenue collection and instituting civil service reform.
Table 28
Public Finance RatiosPublic Finance RatiosPublic Finance RatiosPublic Finance RatiosPublic Finance Ratios (%)
1998 1999 2000 2001 2002 2003
Deficit/GNP -1.8 -3.6 -3.8 -3.8 -4.9 -4.3
Total Revenue/GNP 16.5 15.3 14.7 14.5 13.4 13.6
Tax Revenue/GNP 14.9 13.8 13.2 12.6 11.8 11.6
Interest Payment/
Total Expend. 19.5 18.0 21.7 24.6 23.9 27.4
Capital Outlays/
Total Expend. 8.6 10.6 9.4 14.8 16.0 13.5
Source: Department of Finance and Department of Budget Management.
GNP = gross national product.

8/6/2019 Poverty in Philippines
http://slidepdf.com/reader/full/poverty-in-philippines 5/23
89Chapter 6: Causes of Poverty in the Philippines
Poor investment climate65
The investment level in the Philippines has been low and falling sincethe Asian financial crisis of the late 1990s (see Table 29). Increasing investment
levels hinges on an attractive investment climate, something the Philippines
has not achieved. As a result, the country suffers from limited capital formation,
limited productivity improvements and limited competitiveness of firms. The
Government has a central role to play in shaping the investment climate,
which essentially comprises the macroeconomic fundamentals, infrastructure,
and governance and institutions (such as the legal and regulatory framework).
All of these combine to influence the costs and returns of doing business.
The highly educated, English-speaking workforce of the Philippines isconsidered one of the most technically proficient in Asia, but the country
faces increasing pressure from heightened global competition for market
and capital. Without improvements in the investment climate, the country
will continue to lose out.
Table 29Investment and SavingsInvestment and SavingsInvestment and SavingsInvestment and SavingsInvestment and Savings (% of GNP)
1998 1999 2000 2001 2002 2003
Gross domestic investment 19.3 17.8 19.9 17.8 16.5 15.5
Public 4.4 4.2 3.7 2.8 3.0 2.3
Private 14.9 13.6 16.2 15.0 13.5 13.2
Gross domestic savings 21.6 27.0 31.1 19.5 21.8 19.4
Public 1.4 0.8 (0.6) (1.4) (2.1) (2.6)
Private 20.2 26.2 31.8 20.9 23.9 22.0
Resource Gap/Surplus 2.3 9.2 11.2 1.7 5.4 3.9
Source: National Economic and Development Authority (NEDA).
In 2003 ADB launched the Investment Climate and Productivity Study
(ICS), in collaboration with the World Bank. The goal of the ICS, completed
in 2004, was to investigate the stumbling blocks and constraints to private
investment and productivity growth. To this end, a survey of 716 business
establishments was conducted in four major manufacturing sectors (electronics,
65 The World Bank’s World Development Report 2005 focuses on the theme of improving the investmentclimate, arguing that the investment climate is fundamental to driving growth and reducing povertyand should therefore be a top priority for governments. The WDR 2005 draws on surveys of nearly30,000 firms in 53 developing countries, on country case studies, and on other new research.

8/6/2019 Poverty in Philippines
http://slidepdf.com/reader/full/poverty-in-philippines 6/23
90 Poverty in the Philippines: Income, Assets and Access
food and food processing, garments, and textiles). A large share of firms
surveyed reported the following constraints to be either major or severe:
macroeconomic instability (40% of firms), corruption (34%), electricity (33%),tax rates (32%), uncertainty of economic policy (29%), crime, theft and disorder
(26%), and tax administration (26%).
The ICS reports that corruption affects exporters more than non-exporters
and foreign firms more than domestic firms. Transactions at the customs bureau
are particularly perceived to be riddled with corruption. More than half of
exporting and foreign firms surveyed regard customs administration as a
moderate to major obstacle to business, and delays in getting goods cleared
through customs are a major bottleneck for firms that rely on imported inputs.
On the infrastructure front, electricity is a critical concern (33% of firms),more critical than transportation (18%) and telecommunications (10%). Losses
as a result of power failures amount to an average of 8% of production. While
a number of measures to deal with the major investment stumbling blocks
have already been initiated by the current and previous government
administrations, much more needs to be done. The ICS makes a number of
recommendations for reviving investor confidence in order to generate more
capital infusions and productive investments, which will employ labor and
ultimately reduce poverty in the Philippines (see ADB, 2004d).
Gradual loss of international competitiveness
In the 1980s and 1990s Philippine exports grew rapidly. However, since
the late 1990s there has been great competition from the People’s Republic of
China (PRC) and Viet Nam. Philippine exports in 2003 grew by only a little
more than 1%. The overall weak export performance is attributed to relatively
concentrated export markets and to the gradual decline of the competitivenessof once highly demanded electronics products. The two pillar sectors in
industry, electronics and garments, account for nearly 50% and 20% of total
goods exports. These sectors registered export declines of about 2% and 5%
in 2003, respectively.
Electronics. In the electronics sector, the decline of export shares is a
result of a lack of investment, high production costs, poor infrastructure, and
slow upgrading to new technology. The engine for growth in electronics should
be investment, especially foreign investments, but from 1996 to 2003
investments were erratic. Gradually the sector has lost competitiveness in the
international market as neighboring countries have increased their efforts. PRC,
Indonesia, Malaysia, and Viet Nam all are able to produce electronics with
higher quality, cheaper labor and more advanced technologies.

8/6/2019 Poverty in Philippines
http://slidepdf.com/reader/full/poverty-in-philippines 7/23
91Chapter 6: Causes of Poverty in the Philippines
Garments. The major constraint in the garment sector is the export quota
issue. The WTO 1995 Agreement on Textiles and Clothing set 10-year quotas
up to January 2005, and the quota for garment exports thwarts any substantialincrease in exports. When quotas are removed starting in 2005, the PRC will
likely control two thirds of world exports. The PRC currently accounts for
40% of global garment exports and its share continues to grow. The Philippine
garment industry expects to use existing trade mechanisms such as safeguards,
countervailing steps, and antidumping measures rather than seeking deferment
of the quota phaseout.
It is expected that world exports will expand by about 20% in 2004, but
the Philippines’ exports are forecasted to increase by only 10%, resulting in a
gradual loss of export share. The export of fruits and vegetables and mineralproducts can mitigate some, but not all, of the losses in garments and electronics.
The Government would thus do well to prioritize attracting more investment
in the electronics and garment sectors to improve international competitiveness.
Employment and PovertyEmployment and PovertyEmployment and PovertyEmployment and PovertyEmployment and Poverty
Labor is the most important asset of the poor. Unemployment andunderemployment are thus key determinants of poverty, as is the sector of
employment. The official unemployment rate for 2003 was 11.4% of the labor
force. The labor force participation rate in 2003 was 67.1% of the population
aged 15 years and over (NSCB, 2003 Philippine Statistical Yearbook). In the
2000 FIES, 35.5% of family heads were employed in the agriculture sector,
and close to half of those were classified as poor (see Table 30).
The average income of the poor in the agriculture sector is about 84.5% of
the poverty line, according to the poverty gap measure. Inequality is also highestamong the families whose heads are in agriculture. To reduce the high poverty
levels, the Government will need to give priority to raising the incomes of those
in the agriculture, fishery, and forestry sectors. The question of land reform is
crucial, and is examined separately in this chapter. The other sectors where
poverty incidence is relatively high include construction (28.5%), transport
(17.2%) and services (11.4%). The sectors with high poverty gap ratio other
than agriculture include mining (12.6%) and construction (7.5%).
Of the 16.4% of families whose heads were unemployed in 2000,15.7%
were poor. Of the employed household heads, poverty rates were higher among
the self-employed than the wage earners, 36.5% and 23.6% respectively (see
Table 31). Table 31 also shows that agricultural wage earners were considerably
better off than their self-employed counterparts.

8/6/2019 Poverty in Philippines
http://slidepdf.com/reader/full/poverty-in-philippines 8/23
92 Poverty in the Philippines: Income, Assets and Access
Poverty and employment issues are also addressed in the APIS. Recalling
that this survey uses the lowest 40% income bracket as proxy for poverty, the
2002 APIS results show that 84.5% of the poor were employed in 2002, which
is remarkably close to the 2000 FIES finding of 83.6%. Most of the poor by
the APIS definition are in agriculture (66.2%) and in wholesale and retail trade.
By occupation, they are laborers (42.5%) and as farmers (34.1%). Most of the
poor are self-employed (43.5%), engaged in either family sustenance or
Table 30PoverPoverPoverPoverPoverty Measurty Measurty Measurty Measurty Measures by Sector of Employmentes by Sector of Employmentes by Sector of Employmentes by Sector of Employmentes by Sector of Employment
of the Household Head, 2000of the Household Head, 2000of the Household Head, 2000of the Household Head, 2000of the Household Head, 2000
Share of ContributionHousehold Poverty to Poverty
Heads Incidence Incidence
Sector (%) (%) (%)
Agriculture, Fishing, and Forestry 35.5 48.5 61.6
Mining 1.0 44.8 1.7
Manufacturing 7.1 16.6 4.2
Utilities 0.5 7.7 0.1Construction 6.6 28.5 6.7
Trade 11.8 14.8 6.3
Transport 8.9 17.2 5.4
Finance 0.6 2.1 0
Services 11.6 11.4 4.7
Unemployed 16.4 15.7 9.2
Total 100.0 100.0
Source: NSO FIES 2000
Table 31PoverPoverPoverPoverPoverty by Class of Wty by Class of Wty by Class of Wty by Class of Wty by Class of Workers, 1997–2000orkers, 1997–2000orkers, 1997–2000orkers, 1997–2000orkers, 1997–2000
Poverty Incidence
2000 1997
Wage Earners 23.6 19.9
Agriculture 18.7 15.0
Non-Agriculture 53.1 48.1Self-employed 36.5 37.6
Agriculture 47.2 47.4
Non-Agriculture 18.7 16.5
Source: NSO FIES 2000
8/6/2019 Poverty in Philippines
http://slidepdf.com/reader/full/poverty-in-philippines 9/23
93Chapter 6: Causes of Poverty in the Philippines
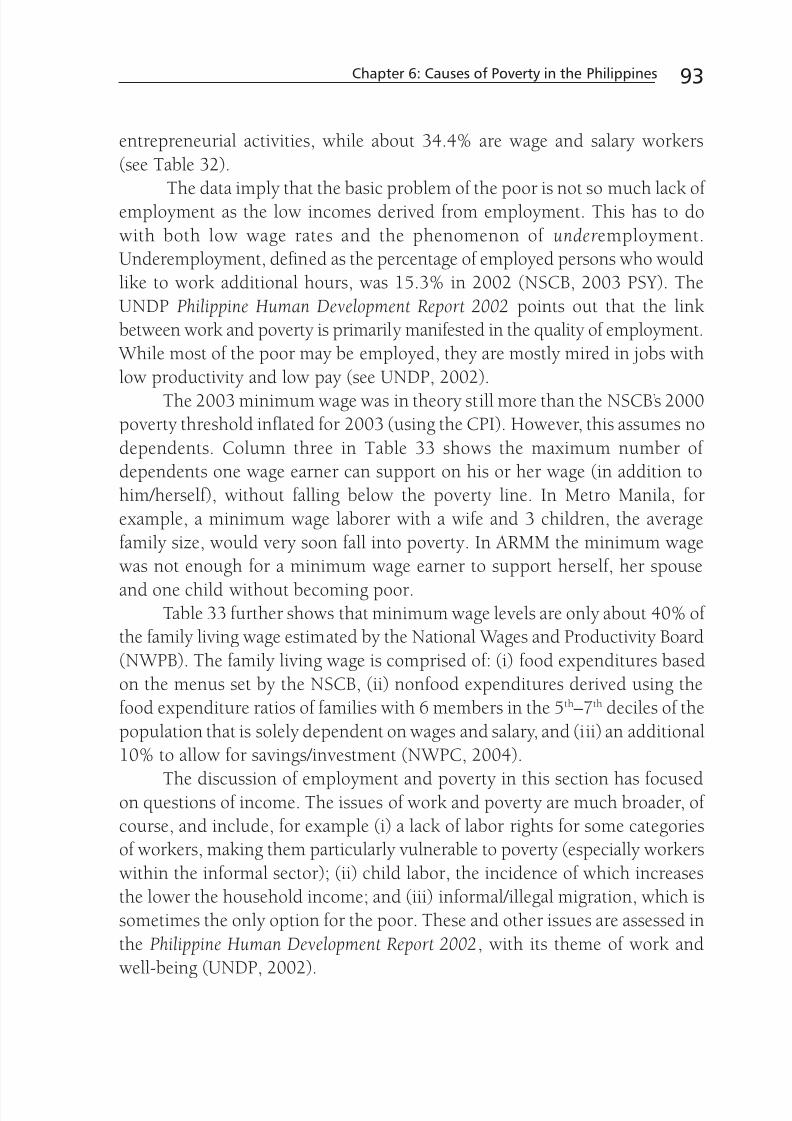
entrepreneurial activities, while about 34.4% are wage and salary workers
(see Table 32).
The data imply that the basic problem of the poor is not so much lack of employment as the low incomes derived from employment. This has to do
with both low wage rates and the phenomenon of underemployment.
Underemployment, defined as the percentage of employed persons who would
like to work additional hours, was 15.3% in 2002 (NSCB, 2003 PSY). The
UNDP Philippine Human Development Report 2002 points out that the link
between work and poverty is primarily manifested in the quality of employment.
While most of the poor may be employed, they are mostly mired in jobs with
low productivity and low pay (see UNDP, 2002).
The 2003 minimum wage was in theory still more than the NSCB’s 2000poverty threshold inflated for 2003 (using the CPI). However, this assumes no
dependents. Column three in Table 33 shows the maximum number of
dependents one wage earner can support on his or her wage (in addition to
him/herself), without falling below the poverty line. In Metro Manila, for
example, a minimum wage laborer with a wife and 3 children, the average
family size, would very soon fall into poverty. In ARMM the minimum wage
was not enough for a minimum wage earner to support herself, her spouse
and one child without becoming poor.Table 33 further shows that minimum wage levels are only about 40% of
the family living wage estimated by the National Wages and Productivity Board
(NWPB). The family living wage is comprised of: (i) food expenditures based
on the menus set by the NSCB, (ii) nonfood expenditures derived using the
food expenditure ratios of families with 6 members in the 5th–7th deciles of the
population that is solely dependent on wages and salary, and (iii) an additional
10% to allow for savings/investment (NWPC, 2004).
The discussion of employment and poverty in this section has focusedon questions of income. The issues of work and poverty are much broader, of
course, and include, for example (i) a lack of labor rights for some categories
of workers, making them particularly vulnerable to poverty (especially workers
within the informal sector); (ii) child labor, the incidence of which increases
the lower the household income; and (iii) informal/illegal migration, which is
sometimes the only option for the poor. These and other issues are assessed in
the Philippine Human Development Report 2002, with its theme of work and
well-being (UNDP, 2002).

8/6/2019 Poverty in Philippines
http://slidepdf.com/reader/full/poverty-in-philippines 10/23
94 Poverty in the Philippines: Income, Assets and Access
Table 32
Employment of Families by Income Stratum, 2002 APISEmployment of Families by Income Stratum, 2002 APISEmployment of Families by Income Stratum, 2002 APISEmployment of Families by Income Stratum, 2002 APISEmployment of Families by Income Stratum, 2002 APIS
Bottom Top40% 60% Philippines
Families with employed head 84.9 78.7 81.2
Families with members 18 years old and
over in employment 92.7 94 93.5
Type of Economic Activity
Family sustenance activity 76.6 26.9 46.9
Net sharing of crops 6.7 5.7 6.1Entrepreneurial activity 74.2 58.9 65.1
Wage & salary employment 53.5 76.5 67.2
By Class of Workers
Wage & salary workers 34.4 57.1 48.6
Own-account workers 43.5 32.6 36.7
Unpaid family workers 22.2 10.2 14.7
By Major Industry Group
Agriculture, fishery, and forestry 66.2 20.9 37.9
Mining & quarrying 0.4 0.3 0.4
Manufacturing 5.1 12.5 9.7
Electricity, gas, and water - 0.5 0.3
Construction 4.1 6.2 5.4
Wholesale and retail trade 11.5 23.4 18.9
Hotel and restaurant 0.7 3.3 2.3
Transportation, storage, and communication 4.2 9.5 7.5
Financing, insurance, and real estate 0.5 4.5 3.0
Community, social, and personal services 4.6 16.7 12.2
By Major Occupation Group
Laborers 42.5 22.7 30.1
Farmers 34.1 11.5 20.1
Technicians 0.9 4.0 2.8
Clerks 0.9 6.8 4.6
Service Workers 5.1 11.4 9.0
Traders 7.0 11.6 9.9
Plant and machine operators 3.5 10.0 7.6
Special occupations 0.2 0.4 0.3Professionals 0.4 7.4 4.8
Officials of the Government 5.2 14.1 10.7
Source: 2002 APIS

8/6/2019 Poverty in Philippines
http://slidepdf.com/reader/full/poverty-in-philippines 11/23
95Chapter 6: Causes of Poverty in the Philippines
Table 33Comparing the Monthly Minimum WComparing the Monthly Minimum WComparing the Monthly Minimum WComparing the Monthly Minimum WComparing the Monthly Minimum Wage, the Poverage, the Poverage, the Poverage, the Poverage, the Poverty Line,ty Line,ty Line,ty Line,ty Line,
and the Family Living Wand the Family Living Wand the Family Living Wand the Family Living Wand the Family Living Wage, 2003age, 2003age, 2003age, 2003age, 2003
Monthly
Monthly Poverty Max.
Minimum Threshold No. of
Wage (pesos per Depen-(pesos) person) dents Food Nonfood Total
NCR 6,160.00 1,479.00 3.2 3,828.00 7,480.00 12,430.00
Region 1 4,180.00 1,146.00 2.6 3,828.00 6,138.00 10,956.00
Region 2 4,070.00 965.00 3.2 3,564.00 5,478.00 9,944.00Region 3 5,027.00 1,237.00 3.1 3,916.00 5,742.00 10,604.00
Region 4 5,214.00 1,226.00 3.3 3,850.00 6,578.00 11,484.00
Region 5 4,004.00 1,062.00 2.8 3,608.00 6,226.00 10,824.00
Region 6 3,960.00 1,049.00 2.8 3,344.00 5,060.00 9,240.00
Region 7 4,400.00 900.00 3.9 3,212.00 7,150.00 11,396.00
Region 8 4,136.00 878.00 3.7 3,212.00 4,158.00 8,118.00
Region 9 3,850.00 838.00 3.6 3,278.00 6,512.00 10,780.00
Region 10 4,224.00 925.00 3.6 3,300.00 6,006.00 10,230.00
Region 11 4,290.00 974.00 3.4 3,366.00 5,324.00 9,570.00
Region 12 3,960.00 999.00 3.0 3,520.00 5,918.00 10,384.00CAR 4,180.00 1,217.00 2.4 3,696.00 7,150.00 11,924.00
ARMM 3,080.00 1,174.00 1.6 – – –
Caraga 3,938.00 959.00 3.1 – – –
Source: adapted from Templo (2003) with additional calculations.
ARMM = Autonomous Region in Muslim Mindanao, CAR = Cordillera Administrative Region, NCR =
National Capital Region.
Population and PoverPopulation and PoverPopulation and PoverPopulation and PoverPopulation and Povertytytytyty
As shown at the outset of Chapter 1, the population of the Philippines is
growing at the very high rate of 2.36% per year. At this rate, more than 5,000
people are born every day in a country where the number of poor people has
increased by more than four million since 1985 [M92]. The population is
projected to reach 111 million by 2015. Population growth in and of itself is
not a problem if resources are available to cope with the additional people
requiring public services, employment, housing, and so on. But in a countrywhere the budget is already stretched and where poverty is high to begin with,
population growth becomes a major issue.
The links between rapid population growth and persistent poverty have
been well established. Rapid population growth hinders development for two

8/6/2019 Poverty in Philippines
http://slidepdf.com/reader/full/poverty-in-philippines 12/23
96 Poverty in the Philippines: Income, Assets and Access
interrelated reasons. First, because it reduces growth in per capita incomes
and thus savings, it reduces the funds available for investment in productive
capacity. This underinvestment in turn reduces overall economic growth andprospects for poverty reduction. Second, as population growth outpaces the
capacity of industry to absorb new labor, urban unemployment and rural
underemployment are compounded. In 2003, the Philippine economy
generated 566,000 new jobs, of which 60% were in the services sector. Despite
this job creation, unemployment levels rose because the job market was
inundated with 624,000 new entrants (ADB Asian Development Outlook 2004).
The larger the family, the more likely it is to be poor. Table 34 shows
poverty incidence by family size for 1997 and 2000, and the two are very
strongly correlated. Orbeta (2002) reviews the empirical evidence to showthat high fertility is associated with decreasing investments in human capital
(health and education). Children in large families perform less well in school,
have poorer health, lower survival probabilities, and are less developed
physically. The problem is one of resource dilution, where each additional
child means a smaller share of family resources including income, time, and
maternal nutrition.
Orbeta (2002) further shows that larger family sizes in the Philippines
are not the result of rational choice among the poor. Surveys including the APIS66 have shown that the poor have more limited access to family planning
Table 34Poverty Incidence of Families by Family Size,Poverty Incidence of Families by Family Size,Poverty Incidence of Families by Family Size,Poverty Incidence of Families by Family Size,Poverty Incidence of Families by Family Size,
1997–2000 [M92]1997–2000 [M92]1997–2000 [M92]1997–2000 [M92]1997–2000 [M92]
(%)(%)(%)(%)(%)
1997 2000
All Families 31.8 33.7
By Family Size
1 9.8 9.8
2 14.3 15.7
3 17.8 18.6
4 23.4 23.8
5 30.4 31.1
6 38.2 40.5
7 45.3 48.4
8 50.0 54.9
9 or more 52.6 57.3
Source: NSO FIES [M92], in Reyes (2002a).

8/6/2019 Poverty in Philippines
http://slidepdf.com/reader/full/poverty-in-philippines 13/23
97Chapter 6: Causes of Poverty in the Philippines
services, lower contraceptive prevalence rates, higher unwanted fertility, and
higher unmet needs for family planning. The author’s conclusion is that
subsidized family planning services for the poor must be an integral componentof any poverty reduction strategy.
Balisacan and Tubianosa (2004) undertook cross-country research to
quantify the direct effects of population on economic growth, social services,
and labor force participation in the Philippines. The Philippines and Thailand
were similar in terms of both population and GDP per capita in 1975, but by
2000, there were 13 million more Filipinos than Thais. Total fertility rate (TFR)
in Thailand had dropped to 1.9, while it remained at 3.6 in the Philippines. At
the same time, by 2000 GDP per capita in Thailand had grown to 8 times its
1975 rate, while the Philippines’ GDP per capita was only 2.6 times higher.The empirical analysis shows that population is not the only cause of the poor
performance of the economy, but it is the most significant one, ahead of
corruption, for example. In an interesting exercise, the authors assess what
the monetary savings in education and health would have been, had the
Philippine population growth pattern followed that of Thailand. The authors
find that P128 billion would have been saved in the education sector from
1991 to 2000, while P52 billion could have been saved in the health sector
from 1996 to 2000.The Government’s new MTPDP 2004–2010 has been criticized for not
articulating a clear population policy. Instead, it presents only a target: that
population growth will slow to 1.98% per year by 2010. The NEDA response
to this critique states that the population policy of the plan is based on
responsible parenthood, respect for life, informed choice, and birth spacing
(NEDA, 2004). This is insufficient. The Government, with strong donor
support, should scale up family planning education and services. Innovative
mechanisms and clear messages promoting contraceptive use are needed,because access does not automatically result in use, as reported in the 1999
APIS. The data shows that nearly 90% of married women aged 15–49 had
access but less than 40% were actually practicing family planning. Population
policy should not concentrate too narrowly on contraception alone: women’s
rights, reproductive health, and education are also critical elements of the
population-development equation. Rather than a singular focus on married
couples, heightened emphasis should be placed on informing, educating, and
providing access to adolescents and youth.
66 The 1998 and 1999 APIS questionnaires included a series of family planning and maternal carequestions–but only for married women. These were removed from the 2002 APIS for an unknownreason.
8/6/2019 Poverty in Philippines
http://slidepdf.com/reader/full/poverty-in-philippines 14/23
98 Poverty in the Philippines: Income, Assets and Access
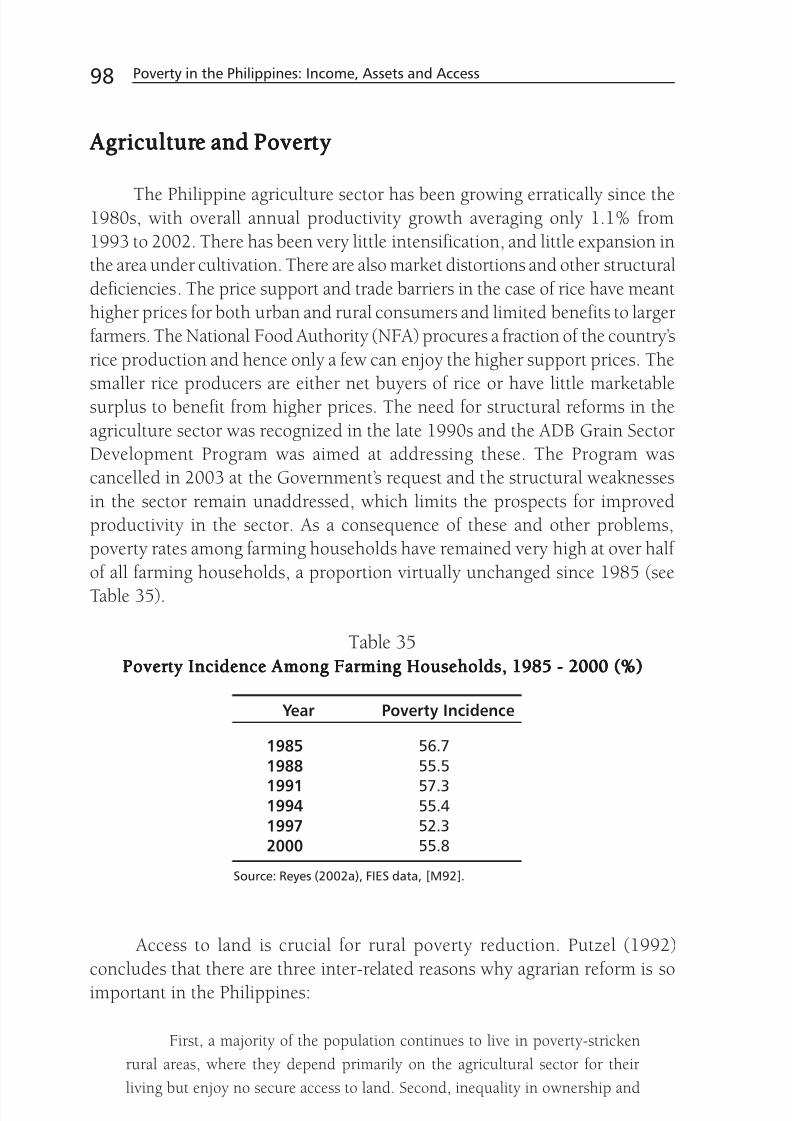
AgriculturAgriculturAgriculturAgriculturAgriculture and Povere and Povere and Povere and Povere and Povertytytytyty
The Philippine agriculture sector has been growing erratically since the1980s, with overall annual productivity growth averaging only 1.1% from
1993 to 2002. There has been very little intensification, and little expansion in
the area under cultivation. There are also market distortions and other structural
deficiencies. The price support and trade barriers in the case of rice have meant
higher prices for both urban and rural consumers and limited benefits to larger
farmers. The National Food Authority (NFA) procures a fraction of the country’s
rice production and hence only a few can enjoy the higher support prices. The
smaller rice producers are either net buyers of rice or have little marketablesurplus to benefit from higher prices. The need for structural reforms in the
agriculture sector was recognized in the late 1990s and the ADB Grain Sector
Development Program was aimed at addressing these. The Program was
cancelled in 2003 at the Government’s request and the structural weaknesses
in the sector remain unaddressed, which limits the prospects for improved
productivity in the sector. As a consequence of these and other problems,
poverty rates among farming households have remained very high at over half
of all farming households, a proportion virtually unchanged since 1985 (see
Table 35).
Table 35PoverPoverPoverPoverPoverty Incidence Among Farty Incidence Among Farty Incidence Among Farty Incidence Among Farty Incidence Among Farming Households, 1985 - 2000 (%)ming Households, 1985 - 2000 (%)ming Households, 1985 - 2000 (%)ming Households, 1985 - 2000 (%)ming Households, 1985 - 2000 (%)
Year Poverty Incidence
1985 56.7
1988 55.5
1991 57.31994 55.4
1997 52.3
2000 55.8
Source: Reyes (2002a), FIES data, [M92].
Access to land is crucial for rural poverty reduction. Putzel (1992)
concludes that there are three inter-related reasons why agrarian reform is so
important in the Philippines:
First, a majority of the population continues to live in poverty-stricken
rural areas, where they depend primarily on the agricultural sector for their
living but enjoy no secure access to land. Second, inequality in ownership and

8/6/2019 Poverty in Philippines
http://slidepdf.com/reader/full/poverty-in-philippines 15/23
99Chapter 6: Causes of Poverty in the Philippines
control over land remains acute and is more extreme than most analysts have
previously imagined. Third […], the legal peasant movement and the
underground communist movement have continued to organize and wage wararound demands for land redistribution […] because skewed access to land is
still and important source of not only economic deprivation but also political
domination. 67
The promises of the Comprehensive Agrarian Reform Program (CARP)
have not been met. The deadline for the completion of this program has been
postponed on many occasions. Its postponement has resulted in the incomplete
development of the land market, has induced speculation, and has resulted in
poor land-use planning. Sustainable rural sector growth is critical for ensuringoverall pro-poor growth in the Philippines, and in this context land reform
remains a major bottleneck. While the land reform agenda has been adopted
by successive administrations, not much has been achieved. Access to land
not only improves equity, it also enables new asset owners to apply for bank
loans and secure access to financial capital. The lack of sufficient collateral has
affected growth of rural credit. CARP’s farmer-beneficiaries are supposed to be
landless residents of the barangay or municipality where the land in question
is located, and are meant to have worked directly on the land, whether astenants or seasonal farm workers. This has not always been the case. There are
many examples of wealthy landlords circumventing the regulations. The World
Bank in 2000 recommended that a shift in CARP implementation toward better
targeting the landless is warranted.
Bello et al. (2004) give a scathing critique of CARP. In their assessment,
the program has failed to change the feudal landscape and to address the
historical roots of land concentration in the hands of a few rural and urban
elites. CARP has suffered from the same problems since its inception, includinglack of funds, opposition from landlord-dominated Congress, lackluster
performance of the Department of Agrarian Reform (DAR), intense resistance
from landlords, and legal hurdles. By DAR’s account at the end of 2003 both
DAR and the Department of Environment and Natural Resources (DENR) had
redistributed 5.8 million hectares, or 72% of the overall 8.1 million hectare
67 The Philippines still sees violence around reform demands from agricultural laborers. In November
2004, farm workers at the Luisita Sugar Mill and Plantation went on strike to demand better wagesand benefits. After 11 days, the police and military took action to disperse the strikers and firedinto the crowd, killing 7 workers. More than 50 others sustained gunshot wounds, and 130 werearrested. Hacienda Luisita is owned by the family of former President Cory Aquino. In 1987, 13farmers at Luisita were killed by the military in a strike dispersal operation. The farmers wereseeking genuine land reform. (Strikers Dispersed at Hacienda Luisita, 7 Dead. Philippine DailyInquirer, 17 November, 2004)

8/6/2019 Poverty in Philippines
http://slidepdf.com/reader/full/poverty-in-philippines 16/23
100 Poverty in the Philippines: Income, Assets and Access
target. In other words, 58% of the country’s total farmland, benefiting 2.7
million rural households or 44% of the country’s total peasant population.
Bello et al. question the 72% figure, noting that it accounts for hectares thathave been awarded but not necessarily distributed, the distinction being
whether the farmer beneficiary has security of tenure or not.
Even if land reform were completed, it is clear that unless asset reforms
are accompanied by reforms in the agriculture sector—such as investment in
productivity improvements and supporting infrastructure—the impact of asset
reform will remain limited.
GoverGoverGoverGoverGovernance and Povernance and Povernance and Povernance and Povernance and Povertytytytyty
The 1986 People Power revolution ousted dictator Ferdinand Marcos
and became a significant milestone in Philippine political development, paving
the way for strengthened democratic institutions in the country. While much
has been achieved in the process of democratization since then, events of
recent years have spawned a sense of disappointment over the ability of the
political system to address the needs of Philippine society, and particularly the
poor. Some claim that politics is the main economic problem confronting thecountry today—weak governance seems to be the major contributory factor
for the economy’s lackluster performance and the insignificant impacts on
poverty over the years. A July 2004 article in The Economist equates Philippine
democracy with “showbiz” and refers to the “sorry political culture” (Economist,
2004). A strong political party system is one of the vital institutions of a
representative government. In the Philippines, political parties are seen as
personal tools of self-serving politicians rather than as social vehicles of
collective interest.Governance issues are central to the widespread perception that the
country is becoming less competitive and provides a less attractive destination
for investment. Transparency International’s Corruption Perceptions Index
ranks the Philippines at 92 out of 133 countries, a less than inspiring score for
investors. Three particular governance issues affect the poverty problem in
the Philippines: corruption, a weak and inefficient state, and security problems.
Corruption. Corruption increases income inequality and poverty through
reduced economic growth; biased tax systems favoring the rich and well-
connected; poor targeting of social programs; the use of wealth by the well-to-
do to lobby government for favorable policies that perpetuate inequality in
asset ownership; and lower social spending (see Gupta et al., 1998). Political
patronage in Philippine poverty programs has influenced the choice of target
groups and the distribution of poverty funds, as well as the appointment of
8/6/2019 Poverty in Philippines
http://slidepdf.com/reader/full/poverty-in-philippines 17/23
101Chapter 6: Causes of Poverty in the Philippines
officials to poverty program positions in order to pay political debts (more
detail can be found in Chapter 7). A regression analysis of provincial growth
by Balisacan and Fuwa (2004) showed that a “dynasty” variable (measuringthe proportion of Philippine provincial officials related by blood or affinity)
had significantly negative effects on subsequent income growth.68
A weak and inefficient state. A weak and inefficient state is unable to
efficiently deliver the necessary services to its population as a result of low
capacity. One main reason the Philippine Government is unable to deliver
necessary services to the population is an inability to collect sufficient revenues.
A second reason is the country’s cumbersome bureaucracy, run by close to 1.5
million civil servants and structurally challenged by (i) weak mechanisms for
planning, agenda-setting, and policy-making; (ii) a failure to implement andmaintain an appropriate performance management and measurement system;
(iii) an overly large bureaucracy that is nevertheless plagued with gaps, overlaps,
and duplication of functions, activities, and jurisdiction at all levels; (iv)
overemphasis on rules and procedures instead of directing resources towards
the realization of intended outcomes and impacts, (v) highly politicized
bureaucracy with opportunities for rent seeking; (vi) lack of managerial and
technical competencies; and (vii) wrong mindsets, attitudes, and corporate
culture. A weak judiciary also contributes to a weak and inefficient state. Because
of its mandate to resolve disputes, review the constitutionality of government
action, and exact accountability from individuals, public officials and
government itself, the judiciary plays a crucial role in the economic governance
of the country. In the Philippines the enactment of laws is often slow and
reforms take several years.69 The poor have particularly limited access to justice.
Security problems. Where security is not maintained, underdevelopment
and poverty are the result, particularly where armed conflicts arise. Violentconflict results in the decline of the state and democratic political processes,
military actors have increased influence, and the rule of law breaks down.
Conflict is inextricably linked with chronic poverty and affects access to each
of the five types of capital. Mindanao is a case in point. Conflict as a cause of
poverty in Mindanao is explored in depth in the next section.
68 Balisacan and Fuwa point out that the lack of a competitive political system in the Philippines is
one of the main factors resulting in suboptimal policy choices in the Philippine Government andthus leading to the relatively poor economic performance as compared to its Asian neighbors(2004:18-19).
69 Examples include the Power Sector Reform Act (enacted June 2001) and the Special Purpose Vehicle Act (enacted January 2003). Implementation of both acts has been very slow. The inefficienciesrange from challenges to judicial integrity, independence and accountability, and fiscal autonomyto inadequate judicial competence and support services.

8/6/2019 Poverty in Philippines
http://slidepdf.com/reader/full/poverty-in-philippines 18/23
102 Poverty in the Philippines: Income, Assets and Access
A special aspect of governance that must be emphasized in the Philippine
context is the decentralization program and how it has had an impact on
poverty reduction and the achievement of the MDGs. This is emerging as amajor issue in several countries that have decentralized in recent years. The
problems in the Philippines relate to LGU capacity, financial resources, and
governance. The Local Government Code was passed in 1991. Principal
responsibility for the delivery of basic social services was devolved to the LGUs
in the areas of agricultural extension and research, social forestry, environmental
management and pollution control, primary health and hospital care, social
welfare services, infrastructure repair and maintenance, water supply and
communal irrigation, and land use planning (Reyes and Valencia, 2004).
While decentralization in theory should result in programs and servicesthat better address local needs, this requires sufficient capacity on the part of
LGUs in addition to supportive institutional arrangements. In general the
planning, budgeting, revenue generation and investment programming capacity
of LGUs is weak. Heavy reliance on the internal revenue allotment (IRA)70
makes LGUs reluctant to search for other financial resources for local
developments. LGUs rely on the IRA for over 55% of their budget revenue.
Local expenditure management and revenue collection capacity needs to be
strengthened. Currently over 50% of IRA is used for personnel services, andlocal revenue collection accounts for less than 10% of total expenditures. Unless
LGUs are able to significantly improve their own-source revenue effort and/or
tap nontraditional sources of financing, they will remain dependent on their
IRA to finance provincial development funds. The ability of the LGUs to increase
own-source revenue is hampered by the poor linkage between planning and
budgeting, weak tax administration, large allocations for personnel, and
constraints in the LGU credit/capital financing framework.
A final governance issue related to poverty reduction in the Philippinesis inconsistency. There has long been a tendency for the central Government
to introduce new poverty programs with every change in administration (this
is explored further in Chapter 7). This gives the impression of never-ending
transitions, transitions that waste time and scarce resources when institutional
and procedural duplications arise, often causing confusion among implementers
at the local level. In the partial devolution of authority like in the Philippines,
delivery of services in affected sectors becomes the joint responsibility of the
national government agencies and the LGUs. The efficient delivery of services
in poor areas is a central policy objective, but this can only be implemented
70 The IRA is the inter-government financing mechanism by which 40% of revenues collected by theNational Government are channeled to LGUs for development spending.

8/6/2019 Poverty in Philippines
http://slidepdf.com/reader/full/poverty-in-philippines 19/23
103Chapter 6: Causes of Poverty in the Philippines
effectively if coordination between national government agencies and local
government officials can be strengthened. Capacity building is key, as is the
development of local-level data to assist LGUs in their planning and programdevelopment, as mandated by the DILG (refer to the Chapter 4 discussion on
the poverty mapping and community-based monitoring systems). Developing
regular LGU-level information collection should be seen as an investment, not
a cost, since it will enhance transparency and improve the delivery and targeting
of services, and ultimately support good governance.
Conflict and PovertyConflict and PovertyConflict and PovertyConflict and PovertyConflict and Poverty
The causal relationship between conflict and poverty is bi-directional.
Conflict causes poverty, and poverty can be one of the causes of conflict.
Goodhand (2001) discusses that conflict is both a direct and indirect cause of
poverty. Direct impacts are deaths, disablement and displacement. Chronic
poverty is likely to increase as a result of loss of breadwinners, higher dependency
ratios, and so on. Indirect impacts affect far more people as they suffer the negative
effects of the disruption of basic services, the destruction of rural life and transport
systems, and general collapse of the state. APIS data reviewed in Chapter 4showed that in ARMM nearly two thirds of the poorest 40% of the population
have little to no education—a far higher proportion than anywhere else in the
Philippines. Conflict affects access to all forms of capital—human, financial,
social, natural, and physical— as summarized in Box 5.
Poverty as a cause of conflict is also indirect. Uneven development
processes lead to inequality, exclusion and poverty. This contributes to growing
grievances, especially when poverty coincides with ethnic, religious, language
or regional boundaries (as in the case of Mindanao). Underlying grievancescan explode into open conflict. Few people argue that poverty directly causes
conflict, but research points to the importance of extreme inequalities as a
source of grievance that can be exploited by leaders to mobilize followers and
to validate violent actions (Goodhand, 2001).
One of the first empirical studies of the links between conflict and poverty
in Mindanao was conducted by Malapit et al. (2003). They divided the 25
provinces of Mindanao into 13 conflict areas and 12 nonconflict areas. Their
key variables were the Human Development Index (HDI) and the Quality of
Life Index (QLI)71. They also included a number of variables relating to human
71 The QLI is a composite index of the number of births attended by a health professional, under-fivenutrition, and elementary cohort survival rate. The HDI is an index of life expectancy, literacy, andper capita GDP.

8/6/2019 Poverty in Philippines
http://slidepdf.com/reader/full/poverty-in-philippines 20/23
104 Poverty in the Philippines: Income, Assets and Access
capital and access to services—access to potable water and sanitary toilets,
elementary cohort survival rate, and so on. The results revealed that there
were significant differences for HDI and QLI between provinces in conflictand those that are not. Access to potable water and sanitation are 14% and
20% less, respectively, for people in conflict areas. Children in conflict areas
are 10% less likely to finish elementary school. Functional literacy is lower in
conflict areas as well. Contrary to these findings, income poverty levels did
not differ significantly in conflict and nonconflict areas of Mindanao. This was
explained by the fact that violent conflict is only one of the shocks that affect
Mindanao’s resources, and that all provinces share common risks in
agriculture, a sector that accounts for up to 50% of the regional economy.
The El Niño drought phenomenon of 1997–98, for example, had a large
negative impact on all of Mindanao. Since these shocks affected the whole of
the region, whether or not they were in conflict, the impact of conflict on
chronic income poverty may have been camouflaged by the transient income
poverty caused by the shock.
Box 5
Negative Impacts of Conflict on All ForNegative Impacts of Conflict on All ForNegative Impacts of Conflict on All ForNegative Impacts of Conflict on All ForNegative Impacts of Conflict on All Forms of Capitalms of Capitalms of Capitalms of Capitalms of Capital
Human capital: Conflict leads to deaths, disablement and displacement; declinein capacity of the state to provide health and education services; declining literacy,life expectancy, increased infant mortality rates and higher levels of stunting;higher dependency ratios; long term effects are a poorly educated and skilledworkforce and a future generation which has known nothing but violence
Financial capital: Conflict impacts negatively on financial institutions,investments, markets, rates of economic growth, and investment levels; market
decline, lack of credit, and outflow of capital are a result.
Social Capital: Conflict disrupts social relations and causes social dislocationand a decline in trust and reciprocity.
Natural capital: Conflict leads to a breakdown of customary rights and rulesof usage, lack of management and investment in natural resources, and increaseduse of marginal lands. Predatory behavior leads to resource depletion andenvironmental degradation.
Physical capital: Conflict causes destruction of and lack of investment ininfrastructure and services.
Source: Goodhand (2001)

8/6/2019 Poverty in Philippines
http://slidepdf.com/reader/full/poverty-in-philippines 21/23

8/6/2019 Poverty in Philippines
http://slidepdf.com/reader/full/poverty-in-philippines 22/23
106 Poverty in the Philippines: Income, Assets and Access
million PWD in 2005. In 2004 the National Council for the Welfare of Disabled
Persons was in the process of establishing a data resource center on disability
in the country, to include demographic data on persons with disabilities andsocial and economic dimensions of disability. As of October 2004 more than
300,000 PWD had registered. The expectation is to register 1 million PWD
nationwide by the end of 2004.
There have been some notable legislative achievements in promoting
the inclusion of disabled people. Republic Act 7277, also known as The Magna
Carta For Disabled Persons, was passed in 1992. It supports the rehabilitation,
development and provision of opportunities for PWD and their integration
into the mainstream of society. The Magna Carta creates a national mandate
for the elimination of discrimination against persons with disabilities to bringthem into the social and economic mainstream of Philippine society. The passage
of this law marked the beginning of an important attitude change from seeing
PWD as objects of charity handouts and social assistance to seeing disabled
people as partners in development. However, although the Magna Carta sets
in place the rights of persons with disabilities, implementation and enforcement
remains unfortunately weak. Violators of the law are rarely prosecuted.
Access is a key problem when buildings are not constructed according
to code. Access to education, access to health care, access to employment, andaccess to transportation are all severely limited for persons with disabilities.
But access questions go beyond the physical. For example, there are very few
schools in the Philippines that accept children with disabilities because of
both a lack of appropriate school facilities and a lack of appropriately trained
teachers. It is said that more than 90% of disabled people in the Philippines
are unable to complete basic schooling. The link to poverty here becomes
particularly clear, recalling the data on educational achievement and poverty
levels presented in the human capital discussion of Chapter 4.The recent decentralization in the delivery of basic services in the
Philippines means that heavy financial burdens and decision making in terms
of construction, repair and renovation of school buildings now rest with the
LGUs. Financial constraints are central to delays in modifying existing
educational buildings. An ADB study in 2002 found that while the Philippines
passed an accessibility law more than 20 years earlier, most of the provisions
of the law remained not enforced (ADB, 2002c). The introduction of barrier-
free features for existing schools, hospitals, public transport systems, buildings
and other infrastructure should be given priority attention.
8/6/2019 Poverty in Philippines
http://slidepdf.com/reader/full/poverty-in-philippines 23/23
107Chapter 6: Causes of Poverty in the Philippines
Economic participation remains out of reach for most PWD. More than
100,000 employable PWD are registered with the Department of Labor and
Employment (DOLE) but less than 10% of them are in wage employment.The Magna Carta provides that 5% of the contractual personnel of the national
government engaged in social development should be reserved for qualified
PWD. The law also encourages the private sector and LGUs to hire PWD. This
employment provision is far from being realized, for a number of reasons:
• Inadequate transportation: PWD (especially wheel chair users) are
restricted by commuting costs and mobility concerns in public utility
vehicles.
• Inaccessible workplace: Workplaces tend to be improperly designed,without ramps or accessible bathrooms.
• Poorly qualified PWD: Most PWD do not reach levels of education
that would qualify them for employment.
The issues facing disabled people are on the national agenda. The Arroyo
administration declared 2003–2012 as the Philippine Decade of Persons with
Disabilities. The NAPC has 14 representatives from the basic sectors, one of
which is a sectoral representative for persons with disabilities. The MTPDP2004–2010 calls for expanded capacity building programs for PWD, and sets
an ambitious target whereby disabled people will make up 10% of the national
government workforce (this target is up from 5% in the Magna Carta). These
are all positive developments that acknowledge the link between disability
and poverty. But much remains to be done, particularly on the physical
accessibility front. Education and job generation are key areas for intervention.
To break the vicious cycle of disability and poverty, the focus must be placed
on ability rather than disability.
Related Documents