Munich Personal RePEc Archive Poverty, Geography and Institutional Path Dependence Edinaldo Tebaldi and Ramesh Mohan Bryant University July 2008 Online at http://mpra.ub.uni-muenchen.de/10201/ MPRA Paper No. 10201, posted 27. August 2008 17:03 UTC

Welcome message from author
This document is posted to help you gain knowledge. Please leave a comment to let me know what you think about it! Share it to your friends and learn new things together.
Transcript

MPRAMunich Personal RePEc Archive
Poverty, Geography and InstitutionalPath Dependence
Edinaldo Tebaldi and Ramesh Mohan
Bryant University
July 2008
Online at http://mpra.ub.uni-muenchen.de/10201/MPRA Paper No. 10201, posted 27. August 2008 17:03 UTC

POVERTY, GEOGRAPHY AND INSTITUTIONAL
PATH DEPENDENCE
Edinaldo Tebaldi
Department of Economics
Bryant University
1150 Douglas Pike, Suite J-142
Smithfield, RI 02917 USA
Phone: (401) 232-6901 / Fax: (401) 232-6068
E-mail: [email protected]
and
Ramesh Mohan
Department of Economics
Bryant University
1150 Douglas Pike
Smithfield, RI 02917 USA
Phone: (401) 232-6379
E-mail: [email protected]
Abstract
Using seven alternative measures of the institutions, this study examines the impacts of the
quality of institutions on poverty rates in developing countries. The estimates obtained using the
instrumental variable method (2SLS) show that the quality of institutions is negatively related
with poverty rates and explain a significant portion of the variation in poverty rates across
countries. More precisely, the empirical results suggest that an economy with a robust system to
control corruption, market-friendly policies, a working judiciary system, and in which people
have freedom to exercise their citizenship will create the necessary conditions to promote
economic development and reduce poverty. The results suggest that pro-poor policies aimed at
reducing poverty should first consider improving the quality of institutions in developing
countries as a pre-requisite for economic development and poverty eradication.
JEL Classification: I32, O17, O43
Keywords: Poverty Trap, Institutions, Development

1
1. INTRODUCTION
A fundamental challenge for the economics profession lies in explaining poverty and
economic development. Why do about 2 billion people live on less than $2 per day? Why is
average income in the United States 70 times greater than the average income in Tanzania?
Differences in human capital, physical capital, and natural resource endowments have
traditionally occupied a central role in answering these questions and explaining economic
development. Lately, institutions and their impact on the economy have become focal points in
the economic growth literature (Barro and Sala-i-Martin, 1995; Knack and Keefer, 1995; Beck et
al., 2000; Henisz, 2000; Chong and Calderon, 2000a; Acemoglu, et al., 2001; Easterly and
Levine, 2003; Glaeser et al., 2004; Rodrik et al., 2004; Durham, 2004; Tebaldi and Elmslie,
2008). Various studies have shown that institutions do impact economic growth, which is a
necessary condition for poverty reduction (Ravallion and Chen, 2003; Kakwani and Pernia,
2000; Klasen, 2008; Dollar and Kraay, 2002; Enders and Hoover, 2003). Institutions also affect
the distribution of economic growth benefits across various levels of social and political groups
in a society. In fact, studies have shown that despite similar economic growth rates, poverty
reduction differ substantially among nations (Lopez, 2004). Therefore, poor institutions will not
only hinder economic growth, but also affect poverty incidence across countries. This may lead
to institutions driven poverty traps. Thus, poor institutional structure directly or indirectly leads
to poverty path dependence.
This article discusses the theoretical links between institutions and poverty and estimates
the impacts of the quality of institutions on poverty. This research contributes to the literature on
the subject in two respects. First, this paper is the first of its kind to use seven alternative
measures of institutions (Worldwide Governance Indicators) to examine the links between

2
poverty and institutions. Second, we introduce a new instrument (early human capital
accumulation) that helps us to circumvent the endogeneity problem that plagues most of the
poverty/institutions empirical research. The study attempt to answer questions like the following:
i) does the quality of institutions impact poverty rates in developing countries? ii) which set of
institutions is more conducive to reduce poverty?, and iii) do geographic-related variables have
both a direct and an indirect effect on poverty through current institutions?
The rest of the article is organized as follows: Section 2 discusses the theory and
conceptual framework linking poverty to quality of institutions. Section 3 outlines the empirical
model and the intrinsic challenges in conducting empirical evaluations on institutions and
reviews the difficulties in defining and measuring institutions. Section 4 discusses the empirical
results, and section 5 summarizes the paper’s findings.
2. LITERATURE REVIEW AND THEORETICAL FRAMEWORK
The availability of quantitative measures of the quality of institutions contributed to the
rise of a new front of empirical research. However, empirical studies on poverty and institutions
are still very limited. The major findings/studies examining the links between poverty and
institutions are discussed below.
Breton (2004), using the Mankiw, Romer and Weil’s augmented version of the Solow
model, and adding institutional variables (government integrity and government share of national
consumption), offer some justification as to why some nations remain poor, while others do not.
The author show that lower efficiency in supplying consumer goods and services (government
share of national consumption) reduces total factor productivity (TFP), thus lowers national
income. However, using British colony’s experience as a proxy for government integrity, Breton
shows that the causality runs more from government integrity to national income than the other
3
way around. In order to help the poorest nation, Sachs (2003) argues that institutions and
endowment (geography) play an equal role in devising development policies. Grindle (2004)
shows that good governance is a pre-requisite for poverty alleviation. The study argues that to
achieve good governance it is crucial: (i) institutions that establish sets of laws between political
and economic agents, (ii) establishments that administer public services, (iii) human capital that
staff government bureaucracies, and (iv) transparency and interface of authorities and the public.
Grindle reiterates that in order to achieve good governance, thorough knowledge of the
development of institutions and governmental ability or competence is imperative.
Chong and Calderon (2000b) offer empirical support of the link between institutional
quality and poverty. They contended that governance structure and operational cost of
institutional reform initially impose high cost on the society especially the poor. The authors
argue that the transaction cost of the reform would significantly amplify the poverty prior to
decreasing it gradually. Using 1960-1990 cross-country data, the study found that efficient
institutions reduce the level, rigor, and prevalence of poverty.
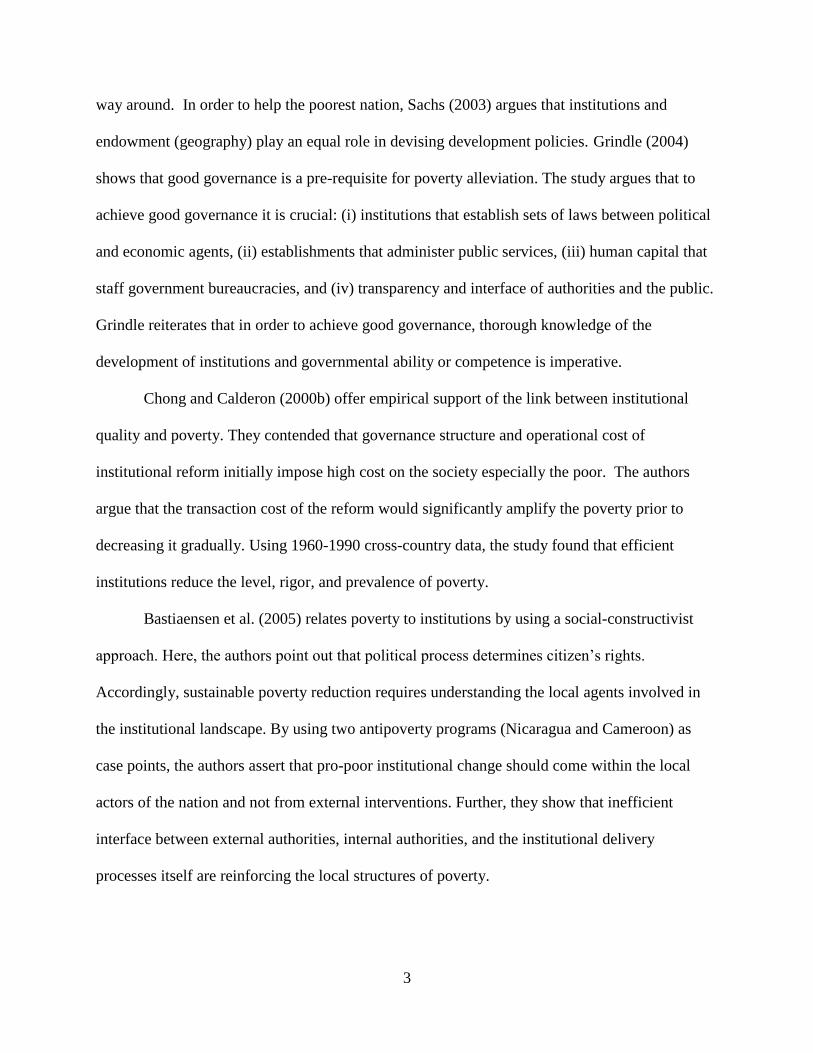
Bastiaensen et al. (2005) relates poverty to institutions by using a social-constructivist
approach. Here, the authors point out that political process determines citizen’s rights.
Accordingly, sustainable poverty reduction requires understanding the local agents involved in
the institutional landscape. By using two antipoverty programs (Nicaragua and Cameroon) as
case points, the authors assert that pro-poor institutional change should come within the local
actors of the nation and not from external interventions. Further, they show that inefficient
interface between external authorities, internal authorities, and the institutional delivery
processes itself are reinforcing the local structures of poverty.

4
On the theoretical side, there is a large literature examining poverty and institutions. For
the sake of simplicity, we focus our discussion on two major ways that institutions can influence
poverty. First, poor institutions create market inefficiency, where the market is unable to
generate proficient output for the society. Second, the poor structure of the institution itself could
be the basis for inefficiencies. Due to its resilience and path dependence, institutional failure
could lead to a poverty trap. Probable causes of poverty trap could be attributed to two
underpinning institutional related mechanisms: the formal and informal rules arguments.
The formal rule argument relies on the idea that a set of formal institutions govern
economic performance and resource allocation among economic agents. McGill (1995) points
out that institutions are essential to the development process, and development in turn is
perceived as a political process. Rodrik (2000) argues that a participatory democratic political
system is the foundation for building good institutions, thus high quality economic growth.
Moreover, formal institutional laws might be created not to serve the interest of social optimum,
but rather the private optimum. When authorities use their legal but discretionary power for
awarding legitimate or illegitimate rewards to their cronies, this might lead to economic
inefficiency (North, 1993). Inequality in the allotment of political power to the educated might
create inequity in income distribution, resulting in the uneducated being trapped in poverty
(Chong and Calderon, 2000b). One notable characteristic of the poor is lack of power and
influence created by formal institutions. Thus, institutions which are created to solve the
inefficient market outcomes may itself create market failure. Bastiaensen et al. (2005) pointed
out that poverty depends on how well people are represented in the political processes that
establish, guarantee, and contest people’s entitlements.

5
On the other hand, in many societies, numerous informal institutional customs and
ideology form the base of community. Indirectly, this leads to the institutional path dependence,
which could be a major reason for poverty incidence. In some cases, the inability to escape from
the surrounding societal institutional norms often lock in individuals to flocking behavior.
Sindzingre (2005) demonstrates that social institutions and norms have a vital role in affecting
poverty because institutions mediate the impacts of economic transformations (e.g. globalization)
and the distribution of economic outcomes. Sen (1981, 1999) argues that the effectiveness of
institutional arrangements depends primarily upon the “capabilities” and “entitlements” of the
social actors. In this case, institutions will determine how efficient and equitably resources are
allocated to the poor and how well the needy social actors are able to access their resource’s
share. Failure of either one of the above could lead to poverty incidence.
There are cases where poverty perseveres in the face of progressive economic growth in
some nations. In this case, the rationalization that we might put forward is the role of institutions
that indirectly discriminate against the poor. Malicious institutions (fraudulent governments,
commercial monopolies, local opportunistic oligarchs, manipulative loan sharks) are the root
cause of poverty.
Tebaldi and Mohan (2008) develop an institution augmented Solow model that
formalizes the idea that poor institutions (formal or informal) might cause poverty traps. Their
theoretical model suggests that poor institutions decrease the efficacy of technology and reduces
both labor and capital productivity. In particular, they argue that “poor institutional arrangements
(translated into corruption and poor enforcement of laws and contracts) decrease the returns to
investments and affect capital accumulation.” Figure 1 shows the institutions augmented Solow
steady state diagram modified to account for quality of institution considered by Tebaldi and

6
Mohan (2008). Figure 1 demonstrates that there are two steady states indicated by *
Pk and *
Rk .
The lower steady state *
Pk can be interpreted as the poverty trap; a country with poor quality of
institutions (T1) and low levels of capital. This country will grow until reaching *
Pk and stuck at
that point. On the other hand, a country with identical initial conditions (economic bequests and
saving rate), but endowed with better institutions (T2) will grow steadily reaching a high steady
state *
Rk . Therefore, this simple model suggests that poor institutions may create poverty traps
and the only way to escape is through improvements in quality of institutions. This result is
consistent with North (1990), which questioned the inability of societies to eradicate an eventual
inferior institutional framework that prevents countries to converge as predicted by neoclassical
theory.
<<Insert Figure 1 about here >>
3. EMPIRICAL METHODOLOGY
3.1 Empirical Model
We rely on the literature discussed above to develop empirical estimates of the impacts of
the quality of institutions on poverty and follow the empirical strategy proposed by Hall and
Jones (1999) and Acemoglu et al. (2001) to model the relationship between poverty and
institutions as:
tititi TP ,,10,ˆ (1)
where t represents time, i indexes countries, P denotes poverty rate, T̂ is an index that measures
the quality of institutions and v is random disturbance.
Because T is measured contemporaneously, it is endogenous. This undermines the
reliability of estimates obtained by Ordinary Least Squares (OLS). To circumvent this problem, a

7
set of instruments for institutions that are correlated with current institutions but uncorrelated
with poverty should be used. The empirical literature on institutions suggests that much of the
variation in current institutions can be explained by geography-related variables and historically
determined factors such as colonial status and origin of the legal system (Hall and Jones, 1999;
La Porta et al., 1999; McArthur and Sachs, 2001; Acemoglu et al., 2001; Acemoglu and Johnson,
2005). Figure 2 graphically summarizes these ideas and shows the link between colonization,
geography and human capital with current institutions, and the forward-link between the quality
of current institutions and poverty incidence.
<<Insert Figure 2 about here >>
Figure 2 suggests that early institutions were influenced by geography because the
colonization process endogenously acted in response to certain environmental surroundings, thus
creating institutions accustomed to the colony’s geography (Acemoglu et al., 2001). Denoon
(1983) and Acemoglu et al., (2001) argue that geographically disadvantaged settlement colonies
were subject to heavy burden of infectious diseases. This discouraged the creation of institutions
aimed at protecting private property. However, colonies with better geographical conditions were
able to engage in processes that replicated European-type settlements and social adaptation. This
ultimately helped develop better institutions and paved the way to initiate systems that protect
private property rights. Denoon (1983) further contended that many settler colonies’ early
institutions form the basis of the current modern institutions. In addition, Engerman and
Sokoloff (2003) strongly believe that unfavorable geography destructively impacts growth-
promoting institutional development.
La Porta et al. (1999) suggest that a country’s current institutional arrangements have
historical ties with the predetermined origin of the legal system. The authors divide the legal

8
systems into: British common law, French civil law, German civil law, Scandinavian civil law
and socialist (Soviet Union) law. The authors found that countries with French or socialist laws
show signs of inferior government operation and achievement. In general, countries with
socialist law provide less political, economic and social freedom. Comparatively, a majority of
the other legal systems have less domineering government and favor economic and social
freedom. Thus, the origin of legal systems based on colonial legacy distinguishes the role of the
current institutions in establishing regulatory systems, defending property rights, and fostering
political freedom.
Furthermore, the initial human capital endowment may have affected early institutions
which ultimately formed current institutions. Because current poverty is a function of existing
institutions, initial human capital could have an indirect effect on poverty via current institutions.
This proposition is motivated by the work of Bernard Mandeville (early 1700), who argues that
the development of institutions is an evolutionary process depending on generations of
accumulated knowledge (Rosenberg, 1963). In addition, a recent article by Glaeser et al. (2004)
also shows that human capital positively impacts institutions, “even over a relatively short
horizon of 5 years” (p. 296).
From an empirical standpoint, these conceptual ideas suggest that current institutions
should be modeled as follows:
iiiii RGHT 33,021ˆ (2)
where T̂ denotes institutions, 0H denotes the initial endowment of human capital, G is a vector of
geographical variables (e.g. mean temperature, absolute latitude, and coastal area), R is a vector
of “other” exogenous determinants of institutions (e.g., colonial status or legal origin) and is a
vector of random disturbances.

9
Equation 2 is very similar to the empirical specification for institutions found in La Porta
et al. (1999), McArthur and Sachs (2001) and Acemoglu et al. (2001). However, this study
proposes to add previously accumulated human capital as a determinant of current institutions.
More specifically, this equation states that the initial level of human capital is an important input
in the shaping of early institutional arrangements.
Equations 1 and 2 form a system of equations - where T and P are endogenous - which
links poverty to institutions. This specification implies that the origin of the legal system,
geographically related variables and the initial human capital endowment determine current
institutions, but are uncorrelated with current poverty rates. This setup may be contentious
because one could argue that these variables are directly correlated with poverty even after
controlling for institutions. This would imply that the system is not properly identified. However,
it seems to be reasonable to presuppose that the colonial legacy directly influences current
institutions, but has no direct effect on current poverty levels, so the colonial legacy variables
should not be correlated with the error term of equation 2. In other words, the effect from the
colonial legacy is felt through the impact on current institutions rather than directly influencing
current poverty. Additionally, as argued previously, the initial human capital endowment may
have affected early institutions, which ultimately shaped current institutions. Because current
poverty is a function of contemporary institutions this variable could have an indirect effect on
poverty via current institutions. Finally, geography-related variables may have a direct effect on
current institutions as well as a direct effect on poverty. Because this is an empirical question, it
is examined together with the estimation of the model. More specifically, we test if geography
has a direct effect on poverty, controlling for institutional quality, by re-specifying equation 1 as
follows:
10
tiiiti GTP ,210,ˆ (3)
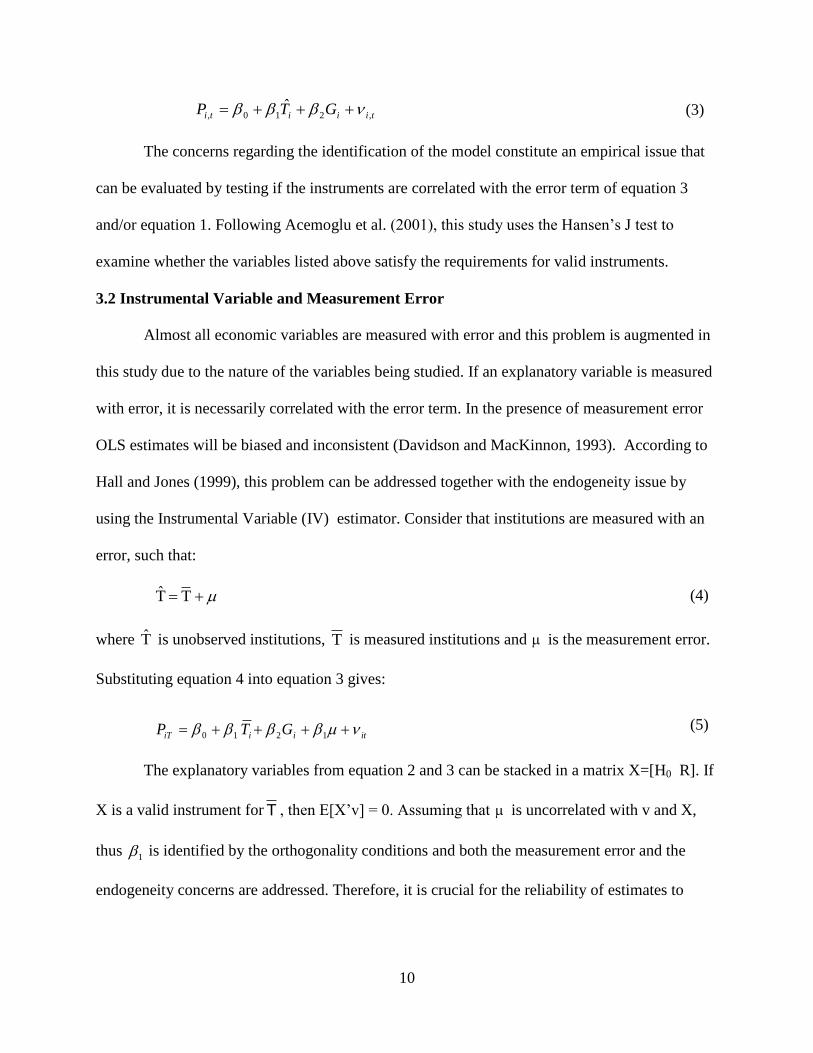
The concerns regarding the identification of the model constitute an empirical issue that
can be evaluated by testing if the instruments are correlated with the error term of equation 3
and/or equation 1. Following Acemoglu et al. (2001), this study uses the Hansen’s J test to
examine whether the variables listed above satisfy the requirements for valid instruments.
3.2 Instrumental Variable and Measurement Error
Almost all economic variables are measured with error and this problem is augmented in
this study due to the nature of the variables being studied. If an explanatory variable is measured
with error, it is necessarily correlated with the error term. In the presence of measurement error
OLS estimates will be biased and inconsistent (Davidson and MacKinnon, 1993). According to
Hall and Jones (1999), this problem can be addressed together with the endogeneity issue by
using the Instrumental Variable (IV) estimator. Consider that institutions are measured with an
error, such that:
TT̂ (4)
where T̂ is unobserved institutions, T is measured institutions and is the measurement error.
Substituting equation 4 into equation 3 gives:
itiiiT GTP 1210 (5)
The explanatory variables from equation 2 and 3 can be stacked in a matrix X=[H0 R]. If
X is a valid instrument for T , then E[X’v] = 0. Assuming that is uncorrelated with v and X,
thus 1 is identified by the orthogonality conditions and both the measurement error and the
endogeneity concerns are addressed. Therefore, it is crucial for the reliability of estimates to

11
select variables to instrument institutions that are uncorrelated with the error term of the second-
stage regressions.
3.3 Data
This study uses poverty data from the 2007 World Development Indicators (WDI). We
utilize a poverty measure that considers the percentage of the population living on less than
PPP$2 a day as the dependent variable. For several countries, the poverty statistics are not
available for all years, so we utilize the average poverty measures from 2000 to 2004. Table 1
lists the countries included in our analysis, which are mostly developing countries due to
restrictions in the poverty dataset. However, the WDI dataset will not report poverty rates (at the
PPP $2 threshold) for developed countries, limiting the number of countries that might be
included in the empirical analysis. As an alternative to WDI dataset, we also used poverty rates
(national poverty threshold) data from the CIA world factbook.
<<Insert Table 1 about here >>
The measures of quality of institutions were taken from McArthur and Sachs (2001) and
Kauffman et al. (2007).1 Expropriation Risk, a measure of risk of confiscation and forced
nationalization, is used to conform to other studies in the growth and institutions literature. It is
calculated as the average value for each country over the period 1985-1995 and ranges between 0
and 10. Higher scores representing better institutions, thus lower risk of confiscation or forced
nationalization. This variable is originally obtained from Political Risk Services, and taken as
reported in McArthur and Sachs (2001). Kauffman et al. (2007) provides six other measures of
institutions: Control of Corruption, Regulatory Quality, Rule of Law, Government Effectiveness,
1 Glaeser at al. (2004) argue that these measures of institutions (Risk of Expropriation, Control of Corruption, Rule
of Law and Regulatory Quality are actually “outcome” measures rather than “deep” measures of institutions.
Because this is a valid argument, we use instruments to account for the endogeneity of these variables (see
Acemoglu et al. 2005 for a detailed discussion on this issue).

12
Voice and Accountability, Political Stability and Absence of Violence. These variables range
from -2.5 to 2.5, with higher scores indicating better institutional arrangements. This study
utilizes an average index through the time periods of 1996, 1998, 2000, 2002, 2004, and 2005.2
The geographic variables are taken from McArthur and Sachs (2001) and La Porta et al.
(1999). We use i) mean temperature, which measures the 1987 mean annual temperature in
Celsius; ii) coastal land, which quantifies the proportion of land area within 100 km of the coast
and iii) latitude, which quantifies the absolute value of the latitude, is scaled to take values
between 0 and 1. The colonial legacy is taken from La Porta et al. (1999) and measured by a set
of dummy variables that identify the origin of a country’s legal system. Specifically, these
dummies identify if the origin of the legal system is English, French, German, Scandinavian, or
Socialist. We also take Ethnolinguistic fragmentation from La Porta et al. (1999).
The idea that the development of institutions is an evolutionary process depending on
previously accumulated knowledge is accounted for in the empirical model by including a
variable that measures human capital accumulation in the early 20th
century. This variable is
calculated as the number of students in school per square kilometer in 1920.
2 Six measures of institution (Worldwide Governance Indicators) based on Kauffman et al. (2007):
i) Regulatory Quality “includes measures of the incidence of market-unfriendly policies such as price controls or inadequate
bank supervision, as well as perceptions of the burdens imposed by excessive regulation in areas such as foreign trade and
business development”.
ii) Rule of Law includes “several indicators which measure the extent to which agents have confidence in and abide by the rules
of society. These include perceptions of the incidence of crime, the effectiveness and predictability of the judiciary and the
enforceability of contracts. Together, these indicators measure the success of a society in developing an environment in which
fair and predictable rules form the basis for economic and social interactions and importantly, the extent to which property rights
are protected”
iii) Control of Corruption “measures perceptions of corruption, conventionally defined as the exercise of public power for
private gain…. The presence of corruption is often a manifestation of a lack of respect of both the corrupter (typically a private
citizen or firm) and the corrupted (typically a public official or politician) for the rules which govern their interactions and hence
represents a failure of governance according to our definition”
iv) Voice and Accountability measures “the extent to which a country's citizens are able to participate in selecting their
government, as well as freedom of expression, freedom of association, and a free media.”
v) Political Stability and Absence of Violence measure “perceptions of the likelihood that the government will be destabilized or
overthrown by unconstitutional or violent means, including domestic violence and terrorism.”
vi) Government Effectiveness measures “the quality of public services, the quality of the civil service and the degree of its
independence from political pressures, the quality of policy formulation and implementation, and the credibility of the
government's commitment to such policies”

13
ii,0i,0 areahH (6)
where 0h denotes the number of students’ in school in 1920, area denotes the country land area,
and i indexes countries.
Data on students’ enrolled in primary and secondary schools in early 20th
century are
from Mitchell (2003a, 2003b, 2003c). Mitchell provides these statistics back to the eighteenth
century for only a few countries. A representative cross-country sample can be only collected
around 1920. Mitchell reports the number of children enrolled in primary and secondary schools
for 68 countries in 1920 and statistics for 52 countries around the 1930s. Therefore, combining
the actual 1920 data with estimates of the number of students enrolled in 1920 based upon the
1930 numbers allows one to get a sample comprised of 120 countries.3 The country area, which
is needed to calculate the schooling density variable, is from the United Nations and based upon
the current geopolitical arrangement. Countries that experienced changes in their boundaries,
such as the former USSR republics, Paraguay, Peru, Bolivia, Ivory Coast, Mali, Mauritania,
Algeria and Zaire were not included in the regression analysis.4
4. EMPIRICAL RESULTS
Figure 3 shows that poverty rate is strongly correlated with the quality of institutions. In
looking at the figures, one can see that developing countries with better institutions are also those
countries with lower poverty rates. However, the simple correlations shown in these figures do
not allow one to infer that better institutions actually reduce poverty rate due to eventual
endogeneity. It could be the case that poverty creates economic and social conditions that
prevent the development of good institutions, rather than the other way around.
3 We use the geometric growth rates in the estimations. For instance, if a country has data on enrollment between
1930 and 1940, the geometric growth rate between these periods is utilized to estimate enrollment back to 1920.
4 Some of the other countries were not included in our analysis either because of missing data or they did not exist in
the beginning of the 20th
century.

14
<<Insert Figure 3 about here >>
We address the eventual endogeneity issue by estimating a set of regressions that utilizes
the instrumental variable method (2SLS-IV) with robust standard errors. Table 2 reports the first-
stage regression (equation 2), Table 3 shows the second-stage estimates of equation 1, and Table
4 reports the second-stage estimates of equation 3.
Our empirical strategy to estimate the first-stage of the model (equation 2) closely
follows La Porta et al. (1999), Acemoglu (2001), Rodrik (2000) and Tebaldi and Elmslie (2008).
The results reported in Table 2 indicate that historical levels of human capital, geography, and
the origin of the legal system are important determinants of current institutions and explain about
60 percent of the variation in the alternative measures of institutions. More precisely, in all
regressions, while controlling for geographically related variables and legal origin, human capital
density in the early 20th century have a positive and statistically significant influence on all
measures of institutions (except Political Stability). This indicates that countries that
accumulated relatively more human capital in the early 20th
century turns out to have better
current institutions. In addition, as expected, socialist legal origin is associated with relatively
poor institutions. The regressions also suggest that the Scandinavian legal origin over performs
the common legal system (British). Overall, the French, German and British legal systems
perform comparably in terms of affects on current institutions. As pointed out earlier in section
3, La Porta et al (1999), however, found that countries with French or socialist laws show signs
of inferior institutional structure. Further, controlling for other covariates, we find that the
coefficient on ethnolinguistic fragmentation is not significant, which suggests that this variable
does not impact the quality of current institutions. This result too contradicts La Porta et al.

15
(1999); where they found that ethnolinguistically heterogenous countries show signs of mediocre
institutional performance.
<<Insert Table 2 about here >>
Table 3 reports the second-stage regressions of institutions on poverty and allows to
answer the question: does the quality of institutions impact poverty rates in developing
countries? Columns 1 through 7 of Table 3 show that controlling for endogeneity, the quality of
institutions is negatively related to poverty rates. More precisely, developing countries with
better institutional arrangements - measured by control of corruption, regulatory quality, rule of
law, government effectiveness, voice and accountability and political stability – have lower
poverty rates. These results are consistent with Chong and Calderon’s (2000b) study, which
found that efficient institutions reduce the level, rigor, and prevalence of poverty. The results are
also consistent with the theoretical literature discussed in section II.
<<Insert Table 3 about here >>
Does geography have a direct effect on poverty? The first set of regressions reported in
Table 3 only accounts for the indirect effect of geography on poverty through current
institutions, but it might be the case that geography has both indirect and direct effects on
poverty. Table 4 addresses this issue and reports a set of regressions that allows one to test if -
controlling for institutional quality - geography has a direct effect on poverty. We find mixed
results. Columns 1 through 4 of Table 4 show that geography (absolute latitude) has no direct
effect on poverty rates when we control for corruption, regulatory quality, rule of law, and
government effectiveness. This result suggests that all of the impacts of geography on poverty
are passed on through the affects of geography on the quality of current institutions measured by

16
these variables. However, column 5 of Table 4 suggests that geography might still play a role
when we control for voice and accountability.
<<Insert Table 4 about here >>
Columns 6 and 7 of Table 4 show that political stability and expropriation risk are no
longer significant when we control for the direct effect of geography on poverty rates. Two
possible explanations may support these results: First, political stability may be obtained through
political systems that do not promote the set of conditions needed to generate economic growth
and/or distribute the benefits of economic growth to all groups in the society. In particular, some
stable political systems are designed to protect the elites or their political cronies in detriment to
the needy population who might be deprived of basic needs. With respect to the insignificant
expropriation risk coefficient, one could argue that protecting property rights only is not
sufficient to put in place the forces and conditions needed to eliminate the deep-rooted conditions
that create and replicate poverty in developing countries. In addition, regardless of political
stability and protection of property rights, it might be the case that geographical conditions of a
society determine the yield and productivity of the agricultural sector, which a majority of poor
rely on. Overall, this interpretation of the results might actually help us to identify which set of
institutions is more conducive to reduce poverty rates because it suggests that Control of
Corruption, Regulatory Quality, Rule of Law, Government Effectiveness and Voice and
Accountability do impact and reduce poverty rates. Conversely, political stability and
expropriation risk seem to not affect poverty in developing countries. A comparison of the
coefficients reported in table 4 also suggest that Control of Corruption, Regulatory Quality, Rule
of Law and Government Effectiveness have much stronger effects on poverty rates than Voice
and Accountability.

17
A second possible explanation for the results discussed above is that the regressions on
risk of expropriation and political stability might violate some of the statistical properties needed
to properly estimate the model. For instance, if the model is not properly identified, then the
estimates will be biased and inconsistent. To examine the robustness of the estimates and
alleviate concerns with the validity of the instruments, this study follows Acemoglu et al. (2005)
and Alcala and Ciccone (2004) and utilizes the Hansen's J statistic (Hansen, 1982) to evaluate
the overidentifying restrictions in the IV regressions. The overidentification tests suggest that the
correlation between the instruments and the error term in models 1 through 5 of Tables 2 and 3 is
not significant. This result provides evidence that the regressions for control of corruption,
regulatory quality, rule of law, and government effectiveness are robust too. However, the
overidentification test does cast some doubt that the models for expropriation risk and political
stability (columns 6 and 7 of Tables 3 and 4) are correctly identified; so those results should be
interpreted with extra caution.
Further, we perform a set of alternative regression using different dataset. We examine
the reliability of the results above by estimating regressions of poverty rates measured using the
national poverty thresholds data from CIA world factbook for a larger sample of 89 countries
(compare to the PPP$2 a day measure of 53 countries in Table 4). Table 5 reports the results and
corroborates much of the findings above. However, one interesting point to note is that
expropriation risk and political stability turn out to be significant at the one percent and ten
percent levels respectively. The overidentification test for expropriation risk and political
stability (columns 6 and 7 of Tables 5) becomes significant too, indicating the models are
correctly identified.

18
In addition, we run regressions of poverty rates using Principal Component Analysis
(PCA) to extract the first eigenvalue of six measures of institutions used in this study. PCA
entails the calculation of the eigenvalue decomposition of a data covariance matrix after
centering the data on average for each attribute of institutions. The result of the first PCA is
presented in table 6. The analysis transforms multidimensional data to a new synchronized
system (weighted Institutions) such that the greatest variance moves to a point on the first
coordinate. The results indicate weighted institutions are highly negatively significant in
affecting poverty at the 1% level in both datasets, which substantiates previous results.
5. CONCLUSION
This study makes a systematic effort to provide a theoretical link between the role of
institutions and poverty. We further contribute to the extant literature by empirically analyzing
the links between poverty and institutions. Using seven alternative measures of institutions, we
assess empirically the cross-country impacts of the quality of institutions on poverty. The
estimates obtained using instrumental variable method (2SLS) demonstrates that the quality of
institutions is negatively related with poverty rates and explains a significant portion of the
variation in poverty across countries.
These results provide evidence that some institutions are more conducive to affect
poverty than others. More precisely, the empirical results suggest that an economy with a robust
system to control corruption, market-friendly policies, working judiciary system and in which
people have freedom to exercise their citizenship will create the necessary conditions to promote
economic growth and reduce poverty in developing countries.
This article suggests that a broad strategy that includes improvements in the quality of
institutions is needed to fight poverty. In particular, transfer and/or aid programs will only have

19
limited and short term effects on poverty if the fundamental poverty-causing factors; i.e. the
quality of institutions, were not addressed as part of the strategy to eradicate poverty. In this
sense, it would be helpful if international institutions such as the World Bank, United Nations,
and IMF could use their financial and political influences to promote strategies aimed at
improving institutions. In summary, in terms of policy implications of the study, this paper
suggests that pro-poor policies aimed at reducing poverty should first consider improving the
quality of institutions in developing countries as a pre-requisite for economic development and
poverty eradication.

20
BIBLIOGRAPHY
Acemoglu, D., Johnson, S. and Robinson, J. 2001. “The Colonial Origins of Comparative
Development: An Empirical Investigation,” American Economic Review, Vol. 91 (5), pp.
1369-1401.
Acemoglu, D., Johnson, S. and Robinson, J. 2005. “The Rise of Europe: Atlantic Trade,
Institutional Change, and Economic Growth,” American Economic Review, Vol. 95(3), pp.
546-579.
Alcala, F. and Ciccone, A. 2004. “Trade and Productivity”, Quarterly Journal of Economics,
119 (2), 613-46
Barro, R. and Sala-I-Martin, X. 1995. Economic Growth. The MIT Press.
Bastiaensen, J., De Herdt, T. and D’exelle, B. 2005. “Poverty Reduction as a Local Institutional
Process,” World Development Vol. 33 (6), pp. 979–993
Beck, T., Clarke, G., Groff, A., Keefer, P. and Walsh, P. 2000. “New Tools and New Tests in
Comparative Political Economy: The Database of Political Institutions,” World Bank Policy
Research Working Paper No. 2283.
Breton, T.R. 2004. “Can Institutions or Education Explain World Poverty? An Augmented
Solow Model Provides Some Insights.” Journal of Socio-Economics Vol. 33 pp. 45–69
Chong, A. and Calderón, C 2000a. “On the Causality and Feedback Between Institutional
Measures and Economic Growth.” Economics and Politics, Vol.12 (1) pp.69-81.
Chong, A. and Calderón, C. 2000b. “Institutional Quality and Poverty Measures in a Cross-
section of Countries,” Economics of Governance, Vol. 1 (2), pp. 123-135.
Davidson, R. and MacKinnon, J.G. 1993. Estimation and Inference in Econometrics. Oxford
University Press, New York
Denoon, D. 1983. Settler Capitalism: The Dynamics of Dependent Development in the Southern
Hemisphere. Oxford, UK: Clarendon Press.
Dollar, D. and Kraay, A. 2002. “Growth is Good for the Poor,” Journal of Economic Growth,
Vol. 7(3), pp. 195-225
Durham, J.B. 2004. “Economic Growth and Institutions: Some Sensitivity Analyses, 1961–
2000,” International Organization, Vol. 58 pp. 485-529.
Easterly, W. and Ross, R. 2003. “Tropics, Germs, and Crops: How Endowments Influence
Economic Development,” Journal of Monetary Economics, Vol. 50 (1), pp. 3-39.
Enders, W and Hoover, G.A. 2003. "The Effect of Robust Growth on Poverty: a Nonlinear
Analysis," Applied Economics, Vol. 35(9), pp. 1063-1071.

21
Engerman, S. L. and Sokoloff, K.L. 2003. “Institutions and Non-Institutional Explanations of
Economic Differences.” NBER Working Paper 9989.
Glaeser, E.L., La Porta, R., Lopez-de-Silane, F. and Shleifer, A. 2004. “Do Institutions Cause
Growth?” NBER Working Papers 10568.
Grindle, M.S. (2004). “Good Enough Governance: Poverty Reduction and Reform in Developing
Countries.” Governance Vol.17 (4), pp. 525–548.
Hall, R.E. and Jones, C.I. 1999. "Why Do Some Countries Produce So Much More Output per
Worker than Others? The Quarterly Journal of Economics, Vol. 114 (1) pp. 83-116
Henisz, W. (2000). “The Institutional Environment for Economic Growth,” Economics and
Politics, Vol.12 (1), pp. 1-31.
Kakwani, N and Pernia, E. 2000. “What is Pro-poor Growth,” Asian Development Review,
Vol.16 (1) pp. 1–22.
Kaufmann, D., Kraay, A., and Mastruzzi, M. 2007. “Governance Matters VI: Governance
Indicators for 1996-2006,” World Bank Policy Research Working Paper No. 4280.
Klasen, S. 2008. “Economic Growth and Poverty Reduction: Measurement Issues using Income
and Non-Income Indicators.” World Development, Vol. 36 (3) pp. 420-445.
Knack, Stephen and Philip Keefer 1995. “Institutions and Economic Performance: Cross-
Country Tests Using Alternative Institutional Measures,” Economics and Politics, Vol.7, pp.
207-27.
LaPorta, R., Lopez-de-Silanes, F., Shleifer, A. and Vishny, R. 1999. “The Quality of
Government,” Journa. of Law, Economics and Organization, Vol. 15(1) pp. 222-279
Lopez, H. 2004. “Pro-poor-Pro-growth: Is there a Trade Off?” The World Bank, Policy Research
Working Paper No. 3378.
McArthur, J.W. and Sachs, J.D. 2001. “Institutions and Geography: Comment on Acemoglu,
Johnson, and Robinson (2000)”, NBER Working Paper, 8114.
McGill, R. 1995. “Institutional Development a Review of the Concept.” International Journal of
Public Sector Management, Vol. 8(2) pp. 63-79.
Mitchell, B. R. 2003a. International Historical Statistics: Africa, Asia & Oceania, 1750-2001.
New York: Palgrave Macmillan, fourth Edition, p.1144.
Mitchell, B. R. 2003b. International Historical Statistics Europe 1754-2000: Europe, 1750-2000.
New York: Palgrave Macmillan, fifth Edition, p. 960.
Mitchell, B. R. 2003c. International Historical Statistics: The Americas 1750-2000. New York:
Palgrave Macmillan, fifth Edition, p. 856.

22
North, D.C. 1990. “Institutions, Institutional Change and Economic Performance.” New York,
Cambridge University Press, 1990.
North, D.C. 1993. “The New Institutional Economics and Development.” Economic History
9309002, EconWPA
Ravallion, M. and Chen, S. 2003. “Measuring Pro-poor Growth.” Economics Letters Vol.78, pp.
93–99.
Rodrik, D. 2000. “Institutions for High-Quality Growth: What they are and How to Acquire
Them.” Studies in Comparative International Development (SCID), Vol. 35 ( 3), pp. 3-31.
Rodrik, D., Subramanian, A., and Trebbi, F. 2004. “Institutions Rule: The Primacy of Institutions
Over Geography and Integration in Economic Development," Journal of Economic Growth,
Vol. 9 (2), pp. 131-165.
Rosenberg, N. 1963. “Mandeville and Laissez-Faire,” Journal of the History of Ideas, 24 (2):
183-196.
Sachs, J. D. 2003. “Institutions Don’t Rule: Direct Effects of Geography on Per Capita Income.”
NBER Working Paper No. 9490.
Sen, A. K. 1981. Poverty and Famines. An Essay on Entitlement and Deprivation, Oxford
University Press, Oxford.
Sindzingre, A. 2005. “Explaining Threshold Effects of Globalization on Poverty An Institutional
Perspective, UNU-WIDER Research Paper No. 2005/53 Helsinki, Finland.
Tebaldi, E. and Elmslie, B. 2008. Do Institutions Impact Innovation? MPRA Working paper No.
8757, available at: http://mpra.ub.uni-muenchen.de/8757/.
Tebaldi, E. and Mohan, R. 2008. Institutions Augmented Solow Model with Poverty Trap,
MPRA Working paper No.

23
Table 1: Selected Variables
Country Code Pov
WDI
Pov
CIA VA PS GE RL RQ CC Country Code
Pov
WDI
Pov
CIA VA PS GE RL RQ CC
Afghanistan AFG - 53.0 -1.51 -2.26 -1.25 -1.68 -2.12 -1.41 Libya LBY - 7.4 -1.75 -0.6 -1.04 -0.89 -1.84 -0.9 Angola AGO - 70.0 -1.3 -1.61 -1.34 -1.42 -1.4 -1.2 Sri Lanka LKA 41.6 22.0 -0.24 -1.43 -0.27 0.01 0.22 -0.23 Argentina ARG 18.2 23.4 0.37 -0.14 0.01 -0.34 -0.13 -0.43 Morocco MAR 14.3 -0.58 -0.32 -0.04 0.09 -0.01 0.02 Austria AUT - 5.9 1.25 1.08 1.77 1.88 1.43 1.97 Madagascar MDG 87.7 50.0 0.1 0.05 -0.46 -0.54 -0.21 -0.18 Burundi BDI - 68.0 -1.34 -2.09 -1.26 -1.1 -1.24 -0.97 Mexico MEX 18.5 13.8 0.1 -0.27 0.1 -0.38 0.48 -0.34 Belgium BEL - 15.2 1.32 0.79 1.68 1.46 1.17 1.41 Mali MLI 72.1 36.1 0.31 0.06 -0.49 -0.46 -0.19 -0.36 Benin BEN 73.7 37.4 0.38 0.32 -0.32 -0.43 -0.35 -0.55 Myanmar MMR - 70.0 -2.09 -1.28 -1.45 -1.48 -1.75 -1.4 Burkina Faso BFA 71.8 46.4 -0.36 -0.23 -0.55 -0.59 -0.29 -0.2 Mozambique MOZ 74.1 15.0 -0.18 -0.1 -0.46 -0.82 -0.52 -0.7 Bangladesh BGD 84.0 45.0 -0.48 -0.94 -0.65 -0.8 -0.73 -0.9 Mauritania MRT 63.1 40.0 -0.91 -0.02 -0.1 -0.54 -0.27 -0.16 Bulgaria BGR 9.5 14.1 0.46 0.19 -0.23 -0.15 0.42 -0.26 Mauritius MUS - 8.0 0.96 0.9 0.62 0.8 0.44 0.39 Bolivia BOL 43.2 60.0 0.1 -0.5 -0.45 -0.6 0.21 -0.76 Malawi MWI 62.9 53.0 -0.41 -0.08 -0.68 -0.42 -0.34 -0.76 Brazil BRA 22.1 31.0 0.37 -0.16 -0.08 -0.3 0.19 -0.07 Malaysia MYS - 5.1 -0.3 0.34 0.85 0.55 0.54 0.39 Canada CAN - 10.8 1.31 0.97 2.01 1.81 1.41 2.15 Niger NER - 63.0 -0.34 -0.34 -0.92 -0.91 -0.61 -0.85 Chile CHL 7.6 18.2 0.88 0.71 1.26 1.2 1.36 1.36 Nigeria NGA 92.4 70.0 -0.94 -1.63 -1.06 -1.37 -0.97 -1.24 China CHN 42.0 8.0 -1.54 -0.13 0.09 -0.41 -0.25 -0.4 Nicaragua NIC 79.9 48.0 -0.02 -0.25 -0.69 -0.77 -0.12 -0.56 Ivory Coast CIV 48.8 42.0 -1.14 -1.45 -0.79 -1.07 -0.48 -0.72 Netherlands NLD - 10.5 1.48 1.16 2.18 1.84 1.67 2.2 Cameroon CMR 50.6 48.0 -1.11 -0.7 -0.74 -1.08 -0.61 -1.09 Pakistan PAK 69.7 24.0 -1.16 -1.42 -0.55 -0.73 -0.66 -0.93 Colombia COL 20.2 49.2 -0.39 -1.87 -0.13 -0.73 0.11 -0.45 Panama PAN 17.7 37.0 0.51 0.18 -0.09 -0.06 0.56 -0.31 Costa Rica CRI 9.2 16.0 1.16 0.87 0.44 0.65 0.71 0.73 Peru PER 33.5 44.5 -0.21 -0.85 -0.32 -0.59 0.34 -0.28 Germany DEU - 11.0 1.34 0.9 1.71 1.78 1.36 1.92 Philippines PHL 45.2 30.0 0.16 -0.76 0 -0.46 0.16 -0.49 Dominican Republic DOM 14.1 42.2 0.18 -0.05 -0.45 -0.46 -0.03 -0.48 Poland POL 2.0 17.0 1.05 0.47 0.62 0.46 0.64 0.35 Algeria DZA - 25.0 -1.15 -1.95 -0.62 -0.74 -0.75 -0.59 Portugal PRT - 18.0 1.3 1.1 1.14 1.2 1.2 1.31 Ecuador ECU - 38.3 -0.05 -0.89 -0.92 -0.68 -0.39 -0.87 Paraguay PRY 31.1 32.0 -0.41 -0.76 -1.06 -0.96 -0.43 -1.08 Egypt EGY 43.9 20.0 -0.97 -0.61 -0.19 0.05 -0.28 -0.26 Romania ROM 16.7 25.0 0.3 0.12 -0.4 -0.28 -0.08 -0.33 Spain ESP - 19.8 1.11 0.45 1.62 1.2 1.23 1.38 Rwanda RWA 87.8 60.0 -1.41 -1.49 -0.75 -0.85 -0.82 -0.44 Ethiopia ETH 77.8 38.7 -0.98 -1.18 -0.66 -0.52 -0.93 -0.58 Sudan SDN - 40.0 -1.8 -2.26 -1.35 -1.43 -1.23 -1.18 France FRA - 6.2 1.21 0.58 1.6 1.4 1.02 1.47 Senegal SEN 56.2 54.0 -0.04 -0.54 -0.12 -0.26 -0.28 -0.38 United Kingdom GBR - 14.0 1.32 0.63 2.05 1.81 1.61 2.07 Sierra Leone SLE - 70.2 -0.98 -1.46 -1.2 -1.09 -1.08 -0.98 Ghana GHA - 28.5 0.01 -0.04 -0.13 -0.2 -0.1 -0.41 El Salvador SLV 39.9 30.7 0.14 -0.05 -0.3 -0.46 0.5 -0.42 Guinea GIN - 47.0 -1.18 -1.15 -0.79 -1.02 -0.53 -0.62 Syria SYR - 11.9 -1.67 -0.6 -0.94 -0.44 -0.98 -0.6 Guatemala GTM 31.1 56.2 -0.44 -0.9 -0.61 -0.91 0.1 -0.81 Chad TCD - 80.0 -1.01 -1.31 -0.75 -0.94 -0.67 -1.01 Honduras HND 39.8 50.7 -0.08 -0.38 -0.65 -0.83 -0.18 -0.79 Togo TGO - 32.0 -1.18 -0.63 -1.14 -1.02 -0.52 -0.77 Haiti HTI 78.0 80.0 -1.06 -1.29 -1.46 -1.53 -1.15 -1.32 Thailand THA 29.7 10.0 0.14 -0.05 0.3 0.19 0.34 -0.32 Hungary HUN 2.0 8.6 1.09 0.81 0.72 0.73 1 0.64 Trinidad And Tobago TTO - 17.0 0.59 0.19 0.47 0.18 0.66 0.1 Indonesia IDN 53.9 17.8 -0.69 -1.54 -0.41 -0.86 -0.35 -0.94 Tunisia TUN 6.6 7.4 -0.92 0.21 0.64 0.21 0.14 0.27 Ireland IRL - 7.0 1.36 1.15 1.69 1.65 1.54 1.73 Turkey TUR 14.5 20.0 -0.44 -0.98 -0.01 -0.02 0.26 -0.17 Israel ISR - 21.6 0.74 -1.12 1.11 0.9 0.89 1.08 Tanzania TZA 89.9 36.0 -0.43 -0.34 -0.55 -0.48 -0.29 -0.9 Jamaica JAM 15.1 14.8 0.56 -0.11 -0.18 -0.42 0.33 -0.43 Uganda UGA - 35.0 -0.72 -1.4 -0.38 -0.69 0.09 -0.8 Jordan JOR 7.0 14.2 -0.49 -0.19 0.27 0.37 0.27 0.17 Uruguay URY 4.8 27.4 0.89 0.64 0.56 0.46 0.59 0.64 Kenya KEN - 50.0 -0.54 -1.04 -0.74 -1 -0.32 -1.03 United States USA - 12.0 1.26 0.47 1.77 1.64 1.43 1.76 Cambodia KHM 89.8 35.0 -0.76 -0.75 -0.77 -0.98 -0.41 -1.01 Venezuela VEN 34.0 37.9 -0.27 -1 -0.91 -1.01 -0.68 -0.91 Korea, South KOR - 15.0 0.69 0.21 0.8 0.68 0.61 0.31 Vietnam VNM - 14.8 -1.54 0.28 -0.31 -0.61 -0.61 -0.73 Laos LAO 74.1 30.7 -1.53 -0.12 -0.69 -1.14 -1.26 -0.96 South Africa ZAF 34.1 50.0 0.79 -0.48 0.56 0.17 0.38 0.47 Lebanon LBN - 28.0 -0.65 -0.83 -0.27 -0.26 -0.06 -0.42 Zambia ZMB 90.8 86.0 -0.3 -0.29 -0.75 -0.55 -0.27 -0.84 Liberia LBR - 80.0 -1.3 -2.04 -1.7 -1.76 -1.9 -1.31 Zimbabwe ZWE - 68.0 -1.25 -1.32 -0.94 -1.05 -1.62 -0.9
Source: World Development Indicators 2007, CIA Fact Book, and Kauffman et al. (2007).

24
Table 2: The Determinants of Current Institutions
Explanatory Variables Dependent Variable
Control of
Corruption
Regulatory
Quality
Rule of
Law
Government
Effectiveness
Voice and
Accountability
Political
Stability
Expropriation
Risk
Coefficients
Legal Origin – Socialist -0.898*** -0.492 -0.785*** -0.709** -0.613* 0.254 -0.463
(0.26) (0.30) (0.25) (0.29) (0.32) (0.27) (0.53)
Legal Origin – French -0.284 -0.0766 -0.276 -0.284 -0.0130 0.0615 -0.286
(0.20) (0.20) (0.19) (0.20) (0.16) (0.20) (0.36)
Legal Origin – German 0.404 0.224 0.489* 0.381 0.299 0.679** 0.769**
(0.36) (0.25) (0.27) (0.30) (0.21) (0.28) (0.39)
Legal Origin – Scandinavian 0.741** 0.422 0.452* 0.430 0.496* 0.621** 0.622
(0.31) (0.30) (0.26) (0.28) (0.28) (0.28) (0.44)
Human Capital Density in the early 20th century 0.0798** 0.124*** 0.0969*** 0.0912** 0.142*** 0.0446 0.282***
(0.037) (0.043) (0.035) (0.040) (0.034) (0.035) (0.071)
Ethnolinguistic fragmentation. -0.167 0.0123 -0.000847 0.0435 0.269 0.0653 0.495
(0.28) (0.32) (0.29) (0.30) (0.29) (0.34) (0.73)
Absolute latitude 2.794*** 1.598*** 2.762*** 2.794*** 1.948*** 2.225*** 3.908***
(0.62) (0.61) (0.52) (0.61) (0.56) (0.51) (0.99)
Prop. land within 100 km of the sea coast 0.276 0.354 0.303 0.378 0.273 0.568** -0.293
(0.26) (0.25) (0.24) (0.25) (0.24) (0.26) (0.52)
Constant -0.519 -0.298 -0.611** -0.565* -0.564* -1.180*** 6.359***
(0.33) (0.35) (0.31) (0.33) (0.32) (0.33) (0.74)
Observations 107 107 107 107 107 107 97
R-squared 0.65 0.54 0.67 0.63 0.58 0.48 0.56
Notes: ***, **, and * denotes significance at the 1%, 5%, and 10% respectively. Standard errors are given in parentheses.
Common (British) Law is used as an omitted category.

25
Table 3: IV Regressions of Poverty Rates (PPP $2) on Institutions
COEFFICIENT Model 1 Model 2 Model 3 Model 4 Model 5 Model 6 Model 7
Control of Corruption 61.99***
(11.0)
Regulatory Quality -63.33***
(11.7)
Rule of Law -55.38***
(10.1)
Government Effectiveness -62.06***
(10.6)
Voice and Accountability -45.70***
(9.50)
Political Stability -41.46***
(11.7)
Expropriation Risk -15.68***
(3.82)
Constant 19.45*** 39.03*** 21.58*** 27.14*** 34.76*** 27.13*** 142.2***
(6.35) (3.17) (4.84) (4.89) (4.16) (5.03) (25.8)
Observations 53 53 53 53 53 53 48
Uncentered R-squared 0.744 0.823 0.789 0.793 0.696 0.670 0.804
Hansen J-statistic overidentification test 3.561 6.213 7.006 6.867 8.426 8.614 13.69
Hansen J – p-value 0.614 0.286 0.220 0.231 0.134 0.126 0.0177
Notes: ***, **, and * denotes significance at the 1%, 5%, and 10% respectively. Standard errors are given in parentheses.
The dependent variable in models 1-7 is the average poverty rates between 1999-2004; all regressions were ran with standard errors
robust to arbitrary heteroskedasticity. All IV first-stage regressions are estimated including the following set of variables: ln human
capital density in the early 20th century, dummies for the origin of the legal system, absolute latitude, proportion of land within 100
km of the seacoast, and ethnolinguistic fragmentation.

26
Table 4: IV Regressions of Poverty Rates (PPP $2) on Institutions and Geography
Variable Model 1 Model 2 Model 3 Model 4 Model 5 Model 6 Model 7
Control of Corruption -66.10***
(21.6)
Regulatory Quality -54.31***
(13.8)
Rule of Law -65.05***
(23.6)
Government Effectiveness -86.29**
(37.3)
Voice and Accountability -32.83***
(8.21)
Political Stability -21.41
(18.2)
Expropriation Risk 1.583
(7.84)
Absolute Latitude 11.45 -29.72 26.35 58.77 -62.32** -62.72 -106.1***
(47.4) (24.1) (52.3) (82.2) (25.4) (43.2) (40.8)
Constant 15.31 46.26*** 11.88 7.653 51.03*** 49.07*** 54.48
(20.0) (6.61) (21.5) (28.8) (6.66) (17.3) (42.8)
Observations 53 53 53 53 53 53 48
Uncentered R-squared 0.720 0.861 0.742 0.651 0.794 0.777 0.742
Hansen J-statistic overidentification test 3.226 5.263 5.904 3.774 6.945 11.22 8.804
Hansen J – p-value 0.521 0.261 0.206 0.437 0.139 0.0243 0.0662
Notes: ***, **, and * denotes significance at the 1%, 5%, and 10% respectively. Standard errors are given in parentheses.
The dependent variable in models 1-7 is the average poverty rates between 1999-2004; all regressions were ran with standard errors
robust to arbitrary heteroskedasticity. All IV first-stage regressions are estimated including the following set of variables: ln human
capital density in the early 20th century, dummies for the origin of the legal system, absolute latitude, proportion of land within 100
km of the seacoast, and ethnolinguistic fragmentation

27
Table 5: IV Regressions of Poverty Rates (National Poverty Threshold) on Institutions and Geography
Variable Model 1 Model 2 Model 3 Model 4 Model 5 Model 6 Model 7
Control of Corruption -11.22**
(4.64)
Regulatory Quality -11.72***
(4.31)
Rule of Law -10.93***
(4.18)
Government Effectiveness -11.88***
(4.46)
Voice and Accountability -9.489**
(3.90)
Political Stability -21.79***
(7.69)
Expropriation Risk -3.368*
(1.99)
Absolute Latitude -27.92 -40.22*** -29.41* -26.96 -43.52*** -9.041 -45.95***
(19.0) (14.1) (17.0) (18.3) (13.6) (24.0) (13.7)
Constant 38.41*** 43.07*** 38.49*** 39.04*** 42.87*** 27.08*** 67.32***
(5.82) (4.00) (5.36) (5.22) (4.35) (8.84) (11.0)
Observations 89 89 89 89 89 89 80
Uncentered R-squared 0.841 0.856 0.858 0.861 0.824 0.811 0.837
Hansen J-statistic overidentification test 6.396 4.118 6.408 6.432 4.442 2.493 8.140
Hansen J – p-value 0.270 0.532 0.269 0.266 0.488 0.778 0.149
Notes: ***, **, and * denotes significance at the 1%, 5%, and 10% respectively. Standard errors are given in parentheses.
The dependent variable in models 1-7 is the average poverty rates between 1999-2004; all regressions were ran with standard errors
robust to arbitrary heteroskedasticity. All IV first-stage regressions are estimated including the following set of variables: ln human
capital density in the early 20th century, dummies for the origin of the legal system, absolute latitude, proportion of land within 100
km of the seacoast, and ethnolinguistic fragmentation

28
Table 6: IV Regressions of Poverty Rates Using Principal Component-Weighted Institutions
Variables WDI dataset CIA dataset
Weighted Institutions -32.10*** -5.249***
(10.9) (1.89)
Absolute Latitude 36.24 -28.95*
(54.5) (17.3)
Constant 12.95 38.40***
(20.2) (5.25)
Observations 53 89
Uncentered R-squared 0.720 0.856
Hansen J-statistic overidentification test 2.359 5.204
Hansen J – p-value 0.670 0.391
Notes: ***, **, and * denotes significance at the 1%, 5%, and 10% respectively. Standard errors are given in parentheses.
The dependent variable in models 1-7 is the average poverty rates between 1999-2004; all regressions were ran with standard errors
robust to arbitrary heteroskedasticity. All IV first-stage regressions are estimated including the following set of variables: ln human
capital density in the early 20th century, dummies for the origin of the legal system, absolute latitude, proportion of land within 100
km of the seacoast, and ethnolinguistic fragmentation

29
Figure 1: Institutions and Poverty Traps
Source: Tebaldi and Mohan (2008).
Note: y denotes output per worker, k is capital per worker,
s is the savings rates, and T is an index denoting quality of institutions.
y
s
(n + )k
s
*
Rk *
Pk k

30
Figure 2: Institutions and Poverty
Colonization Geography
Human Capital
Early Institutions
Current Institutions Poverty
Colonization Geography
Human Capital
Early Institutions
Current Institutions

31
Figure 3: Poverty and Quality of Institutions
HTI
NGA
CMR
PRY
IDN
PAK
VEN
BGDTZAZMB
GTM
HNDBOL
MWI
CIV
MOZETHNIC
PHL
DOMCOLARGJAM
SLVCHN
SEN
MLI
IND
MEXROM
THA
PAN
PER
BGR
EGYLKA
BFA
MDG
TURBRA
MARJORTUN
POL
ZAF
URYHUNCRI CHL
020
40
60
80
10
0
Povert
y R
ate
at $2
PP
P -
Avera
ge
-2 -1.5 -1 -.5 0 .5 1 1.5 2Control of Corruption - Average
bandwidth = .8
HTI
NGA
ETHBGD
VEN
PAK
CMR
MOZ
CIV
PRY
IDN
MWI
IND
BFA
TZA
EGY
SEN
ZMB
CHN
MDG
MLI
HND
ARG
NIC
ROMDOMMAR
GTM
COL
TUN
PHL
BRA
BOLLKA
TURJOR
JAM
PERTHAZAF
BGR
MEX
SLV
PAN
URYPOLCRI
HUNCHL
020
40
60
80
10
0
Povert
y R
ate
at $2
PP
P -
Avera
ge
-2 -1.5 -1 -.5 0 .5 1 1.5 2Regulatory Quality - Average
bandwidth = .8
HTI
NGA
CMRCIV
VENPRYGTM
IDN
HND
MOZ
BGDNIC
COL
PAK
BOL
BFA
PER
ZMBMDG
ETH
TZA
DOM
SLV
MLI
PHL
JAM
MWI
CHN
MEXARGBRAROM
SEN
BGR
PANTUR
LKA
IND
EGY
MAR
ZAFTHA
TUNJORURYPOLCRI
HUNCHL
020
40
60
80
10
0
Povert
y R
ate
at $2
PP
P -
Avera
ge
-2 -1.5 -1 -.5 0 .5 1 1.5 2Rule of Law - Average
bandwidth = .8
HTI
NGA
PRYVEN
CIV
ZMB
CMR
NIC
MWI
ETHBGD
HND
GTM
BFAPAK
TZA
MLI
MDG
MOZ
BOL
DOM
IDN
ROM
PERSLVLKA
BGR
EGY
JAMCOL
IND
SEN
PANBRAMARTUR
PHL
ARG
CHN
MEX
JOR
THA
CRI
ZAF
URYPOLTUN
HUNCHL
020
40
60
80
10
0
Povert
y R
ate
at $2
PP
P -
Avera
ge
-2 -1.5 -1 -.5 0 .5 1 1.5 2Government Effectiveness - Average
bandwidth = .8
Source: Authors’ compilation

32
Figure 3: Poverty and Quality of Institutions (cont)
CHN
PAK
CIVCMR
HTIETH
EGY
NGA
TUN
IDN
MARJOR
BGD
GTM
TUR
TZA
MWI
PRY
COL
BFA
ZMB
VENLKA
PER
MOZ
HND
SEN
NIC
BOL
MDG
MEX
SLV
THA
PHL
DOM
IND
ROM
MLI
ARGBRA
BGR
PANJAM
ZAF
CHLURYPOLHUN
CRI
020
40
60
80
10
0
Povert
y R
ate
at $2
PP
P -
Avera
ge
-2 -1.5 -1 -.5 0 .5 1 1.5 2Voice and Accountability - Average
bandwidth = .8
COL
NGA
IDNCIVLKA
PAK
HTIETH
VEN
TUR
BGDIND
GTMPERPRY
PHLCMR
EGY
SEN
BOL
ZAFHND
TZA
MAR
ZMB
MEX
NIC
BFA
JOR
BRAARG
CHN
JAM
MOZ
MWI
DOM
SLV
THA
MDG
MLI
ROMPAN
BGRTUNPOLURY
CHLHUNCRI
020
40
60
80
10
0
Povert
y R
ate
at $2
PP
P -
Avera
ge
-2 -1.5 -1 -.5 0 .5 1 1.5 2Political Stability - Average
bandwidth = .8
HTIMLI BFA
MDG
SLV
GTM
NICBGD
HNDPHL
NGA
ETH
BOL
PAN
PER
SEN
PAK
LKA
DOM
CMR
TUN
MOZ
ARG
ZMBTZA
JOR
EGY
MWI
PRYZAF
CRI
CIV
JAM
URY
MAR
VEN
ROMCOLTURMEX
IDN
THA
POL
CHN
CHL
BRA
IND
BGRHUN0
20
40
60
80
10
0
Povert
y R
ate
at $2
PP
P -
Avera
ge
4 5 6 7 8 9Risk of Expropriation
bandwidth = .8
Source: Authors’ compilation
Related Documents