7 OECD 2000 OECD Economic Studies No. 30, 2000/I POVERTY DYNAMICS IN SIX OECD COUNTRIES Howard Oxley, Thai Thanh Dang and Pablo Antolín TABLE OF CONTENTS Introduction................................................................................................................................ 8 Main results............................................................................................................................ 9 Defining income and poverty and the data sources............................................................. 10 Definition of income and poverty ....................................................................................... 10 Data sources and issues ....................................................................................................... 11 The dynamics of poverty over a six-year period ................................................................... 12 Broad patterns of poverty dynamics .................................................................................. 12 Poverty dynamics before and after taxes and transfers ................................................... 18 The characteristics of the poor by length of spell ............................................................. 19 Factors associated with poverty transitions .......................................................................... 22 “Events” and transitions ....................................................................................................... 23 Which “events” have households experienced when they enter and exit poverty?.... 23 “Events” and the probability of transitions ....................................................................... 29 How long do people stay in poverty? .................................................................................... 36 Data and methodology ......................................................................................................... 36 What determines the length of time people stay in poverty? ........................................ 37 Re-entry into poverty............................................................................................................ 45 Conclusion .................................................................................................................................. 45 Bibliography............................................................................................................................... 51 All three authors contributed substantially to this study, with names in reverse alphabetical order. Pablo Antolín, Thai Thanh Dang and Howard Oxley are from the Economics Department of the OECD. Canadian data was prepared by Ross Finnie from Queens University and Roger Scerviour from Statistics Canada; Swedish data by Thomas Pettersson from the Swedish Ministry of Finance; and Dutch data by Trea Laske from the Dutch Ministry of Economic Affairs. Ross Finnie also provided numerous helpful suggestions and insightful comments concerning the project. This study benefited from helpful com- ments from Jorgen Elmeskov; Mike Feiner; Bob Ford; Stephen Jenkins; Flip de Kam; Mark Pearson, Paul Swaim and numerous members of the Economics Department at the OECD, participants of the UK Treasury Workshop on Persistent Poverty and Lifetime Inequality 17 and 18 November 1998, and partic- ipants at the 14th European Economic Association Annual Congress, 2-4 September 1999. Jackie Gardel and Muriel Duluc provided excellent secretarial support. The views are those of the authors and should not be attributed to the OECD.

Welcome message from author
This document is posted to help you gain knowledge. Please leave a comment to let me know what you think about it! Share it to your friends and learn new things together.
Transcript
7
OECD 2000
OECD Economic Studies No. 30, 2000/I
POVERTY DYNAMICS IN SIX OECD COUNTRIES
Howard Oxley, Thai Thanh Dang and Pablo Antolín
TABLE OF CONTENTS
Introduction................................................................................................................................ 8Main results............................................................................................................................ 9
Defining income and poverty and the data sources............................................................. 10Definition of income and poverty ....................................................................................... 10Data sources and issues ....................................................................................................... 11
The dynamics of poverty over a six-year period................................................................... 12Broad patterns of poverty dynamics .................................................................................. 12Poverty dynamics before and after taxes and transfers ................................................... 18The characteristics of the poor by length of spell............................................................. 19
Factors associated with poverty transitions .......................................................................... 22“Events” and transitions....................................................................................................... 23Which “events” have households experienced when they enter and exit poverty?.... 23“Events” and the probability of transitions ....................................................................... 29
How long do people stay in poverty? .................................................................................... 36Data and methodology......................................................................................................... 36What determines the length of time people stay in poverty? ........................................ 37Re-entry into poverty............................................................................................................ 45
Conclusion.................................................................................................................................. 45Bibliography............................................................................................................................... 51
All three authors contributed substantially to this study, with names in reverse alphabetical order.Pablo Antolín, Thai Thanh Dang and Howard Oxley are from the Economics Department of the OECD.Canadian data was prepared by Ross Finnie from Queens University and Roger Scerviour from StatisticsCanada; Swedish data by Thomas Pettersson from the Swedish Ministry of Finance; and Dutch data byTrea Laske from the Dutch Ministry of Economic Affairs. Ross Finnie also provided numerous helpfulsuggestions and insightful comments concerning the project. This study benefited from helpful com-ments from Jorgen Elmeskov; Mike Feiner; Bob Ford; Stephen Jenkins; Flip de Kam; Mark Pearson,Paul Swaim and numerous members of the Economics Department at the OECD, participants of the UKTreasury Workshop on Persistent Poverty and Lifetime Inequality 17 and 18 November 1998, and partic-ipants at the 14th European Economic Association Annual Congress, 2-4 September 1999. Jackie Gardeland Muriel Duluc provided excellent secretarial support. The views are those of the authors and shouldnot be attributed to the OECD.
8
OECD 2000
INTRODUCTION
Poverty rates are helpful indicators of the level of poverty in a country duringa specific period of time. However, they do not provide important informationabout the extent of mobility into and out of poverty or about the length of time peo-ple remain in poverty. Whether an individual suffers poverty over a long period oftime or a short period requires different policies responses. Such informationwould be then important for policy makers.
The present study complements and extends previous work on trends inincome distribution and poverty (Oxley et al., 1999) by examining more closely thedynamics of poverty. This study uses longitudinal data sets, which provideinformation on individual and household characteristics over time. It examines thefollowing subject areas for six OECD countries for which suitable longitudinal datawere available (Canada, Germany, the Netherlands, Sweden, the United Kingdomand the United States):
– Flows into and out of poverty and “events” most closely associated withthose transitions, such as getting or losing a job or experiencing divorce;
– Which groups make up the short and longer-term poor;
– Factors affecting the length of time individuals stay in poverty and the riskthat people fall back into poverty.
These issues are examined in two ways. First, tabulations give broad orders ofmagnitude of the flows into and out of poverty, the characteristics of the poor, the“events” associated with these transitions, the duration of poverty spells and theextent of subsequent re-entry into poverty. Second, econometric techniques allowa more precise evaluation of the factors associated with transitions, the duration ofspells and the probability of re-entry. However, while these analyses provide a use-ful characterisation of the nature of poverty, there is no attempt to model house-hold and individual behaviour which underlie transitions into and out of poverty.Thus, conclusions that purport to deal with structural relationships – between pov-erty programmes and transitions into or out of poverty, for example – need to bedrawn with great care. In addition, cross-country comparability of the data is lim-ited, providing another reason to exercise caution in interpreting the results.
The paper is organised as follows. A summary of the main results is presentedimmediately below. A number of issues concerning the definition of income, poverty
Poverty dynamics in six OECD countries
9
OECD 2000
and particular characteristics of the data sets are then briefly addressed. This is fol-lowed by an overview of the various factors affecting poverty transitions using somebroad indicators of poverty inflows, outflows and duration across countries. Thenext section looks in greater detail at the factors associated with poverty transi-tions, followed by an examination of duration and re-entry. Additional technicalmaterial is reported in Antolín, Dang and Oxley (1999), covering data sources, meth-odology and more detailed results.
Main results
Key results of this study are:
– Between 12 and just under 40 per cent of the population across the six coun-tries is touched by poverty over a six-year period, a much larger portion thanwould be suggested by the “static” poverty rates. Within this group, however,the majority has short spells in poverty. As spells lengthen, the probabilityof exit falls such that a small group of the population remains in poverty forlong periods of time with little chance of exit.
– The probability of exiting poverty falls with previous experiences in poverty.At the same time, there is a high probability of falling back into poverty. Thus,for the longer-term poor, low probability of exit and high probability ofre-entry tend to reinforce each other. People with six or more years in pov-erty (i.e. the longer-term poor) typically make up 2-6 per cent of the popula-tion. However, because of their long stays in poverty they represent aroundone-third of the total time all individuals spend in poverty (from 30 to justover 50 per cent if five or more years are considered).
– The tax and transfer system sharply reduces poverty rates, particularly asregards longer-term poverty. The difference in poverty rates pre- andpost-taxes-and-transfers is smallest in the United States and largest in Sweden.
– The characteristics of households experiencing shorter spells in povertytend to be different from those of the longer-term poor. A large share of thelonger-term poor would appear to be women, lone parents and elderly sin-gle individuals. A significant share of the longer-term poor are in paid work.
– Obtaining or losing employment is particularly important for transitions intoand out of poverty. Gaining employment is the main factor in reducing thelength of time spent in poverty. Some aspects of this are:
• A large share of transitions occurs when there are employment/earn-ings-related “events”, particularly in the case of exits from poverty. Theprobability of transiting into poverty is generally higher for employ-ment-related “events” than for family-related “events”.
OECD Economic Studies No. 30, 2000/I
10
OECD 2000
• Households with more than one worker are better protected from povertyand have shorter stays in poverty. Increased employment or hours workedby other household members is an important source of exit from povertyand households which get a second earner appear to shorten their povertyspells by more than households which obtain a first earner. Multi-ple-earner households may be capable of adjusting labour supply moreeasily to compensate for job loss or lower earnings of other householdmembers.
– Separations and divorce are usually the main cause of poverty entry thanmarriage is for poverty exit. The length of stay for female-headed lone-parenthouseholds is significantly longer than for other household groups. Employ-ment is usually the main channel for exit of lone-parent households frompoverty and acts to reduce the average length of stay significantly.
DEFINING INCOME AND POVERTY AND THE DATA SOURCES
Definition of income and poverty
Following the methodology in OECD (1997a), the focus of attention is the indi-vidual (including children), but the unit for calculating income is the household.Individuals are assumed to receive the equivalent disposable income of thehousehold to which they belong. Equivalent income is household disposableincome – i.e. market income and transfers from government less direct taxes andsocial security payments of all household members – divided by the square root ofthe number of individuals in the household. The division by a number less than thesize of the household is intended to take account of household economies of scale.This adjustment involves an important element of judgement but has been widelyused in other international comparative studies (see Atkinson, Rainwater andSmeeding (1994) for a justification for using this equivalent scale).
To assess the direct impact of the tax and transfer system, the transitions havealso been calculated, in some cases, using market income – i.e. disposable incomeplus taxes paid to government and less transfers received from government – butusing the poverty threshold calculated with household disposable income. The dif-ferences in transitions give some indication of the relative importance of marketincome and the tax and transfer system in exits from poverty. Indirect effects, suchas the impact of incentives arising from the tax and transfer system on householdbehaviour and, therefore, market income, could not be isolated.
The distribution of income is constructed by ranking individuals on the basisof their equivalent income. The poverty threshold was established at 50 per cent ofthe median equivalent disposable income, a threshold which, once again, has been
Poverty dynamics in six OECD countries
11
OECD 2000
widely used in international comparative studies. Poverty rates1 presented inOECD (1997a) indicated that using other definitions would significantly affect thelevel of poverty, but that the trends over time were broadly unchanged. However,where a large number of individuals are grouped in certain segments of the distri-bution, the pattern of poverty dynamics could be affected.2
Data sources and issues
The focus of this study is not the level of poverty, but the dynamics and persis-tence of poverty – i.e. the flows into and out of poverty and the time spent in pov-erty. Such work requires data sets that follow individuals through time (panels).Individuals are characterised in two ways: first, in terms of personal characteristics– for example, age, sex and education attainment – and, second, in terms of house-hold characteristics – for example, the income of other household members and theage and employment status of the head of household. Since each individual is followedover time, these data help to identify whether “events” – such as changes in employ-ment within the household – coincide with movements into or out of poverty. Moreover,the length of poverty spells can be determined and estimates made of the relationshipbetween the length of spell and individual or household characteristics.
Relatively few OECD countries have sufficiently developed data sets of thiskind. This gap is being rapidly filled in many countries – for example in Europe,through the Eurostat European Community Household panel – but available timespans are generally too short for the kind of analysis carried out here. For these rea-sons, the analysis in this study covers only six OECD countries –Canada, Germany,the Netherlands, Sweden, the United Kingdom and United States.
Several general points should be noted about these data. First, the time unitis the year, which may not be the most appropriate period for policy purposes(Blank, 1989; Ruggles, 1990; Census Bureau, 1998). Indeed, many countries baseaccess to social assistance benefits on previous monthly income. Thus, the povertyspells of those individuals facing poverty for a month or two, but with high enoughincome in the rest of the year to bring annual income above the poverty line, wouldbe missed (although one might be less concerned about such households). Ruggles(1990) estimates that using monthly rather than annual data could increases thenumber of poverty spells by 20-25 per cent in the United States.
Second, due to small sample sizes for those in poverty, in particular in Germany,some problems arise when the data are broken down by characteristic as smallersub-samples increase the size of sampling error.
Third, rates of entry into and out of poverty are cyclically sensitive(Huff Stevens, 1994; Gottschalk and Moffitt, 1994). While cyclical differences areexplicitly taken into account in the econometric analysis, this is not the case for thedescriptive presentation presented immediately below.
OECD Economic Studies No. 30, 2000/I
12
OECD 2000
The nature of the data sets differ between each of these six countries (see Antolín,Dang and Oxley, 1999, for more details). The following points are particularly importantin understanding and interpreting the results presented in this paper:
– Data for Germany, the United Kingdom3 and the United States were drawnfrom sample household surveys, whereas tax files were the main source forCanada, the Netherlands and Sweden. For Canada, a concept referred to as“census families” was used to define households.4 For Sweden, all individu-als 18 years old or older are considered as independent households (for taxpurposes) even though they may be living physically under the same roof.5
The data sets based on tax files have much larger sample sizes, but informa-tion on individual and household characteristics is more limited.6
– The data for the United Kingdom cover only six years: 1991 to 1996. To pre-serve comparability with other countries, the descriptive sections were lim-ited to the last six years of available data for all countries. Thus, in the nexttwo sections, data cover the last six-year period for all six countries. Esti-mates of duration make use of all available years (Canada: 1986-95; Germany:1984-96; Sweden: 1991-1996; the United Kingdom: 1991-96; and the UnitedStates: 1980-93).7
– Data for Germany and the United States were drawn from the “Panel Surveyof Income Dynamic – German Socio-Economic Panel”, PSID-GSOEP Equiva-lent file which has adjusted the German and US panels to make income vari-ables more comparable. They are available up to 1993 for the United States8
and to 1996 for Germany.
– Tax models have been used by national research teams to estimate taxes forGermany, the United Kingdom and the United States. However, for theUnited Kingdom, pre-tax data are used for the entire period.9, 10
– For Canada, the data are not consistent over time: social assistance benefitswere underestimated before 1992 because they were not taxable and hencenot included when filing for tax. This appears to have a significant effect onpoverty rates, even though those with no other revenue than social assis-tance would have incomes below the 50 per cent threshold.11
THE DYNAMICS OF POVERTY OVER A SIX-YEAR PERIOD
Broad patterns of poverty dynamics
The poverty rate indicates how many are poor at a point in time. However this“snapshot” masks considerable turnover among the poor and variation in the timethat the poor stay in poverty. This section presents a fuller picture of poverty pat-terns over time for both at the level of market income and disposable income.
Poverty dynamics in six OECD countries
13
OECD 2000
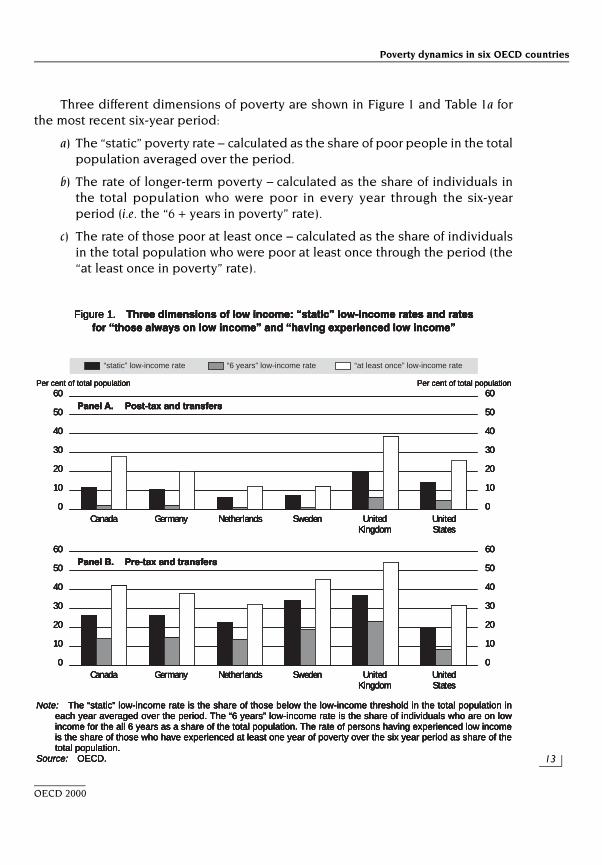
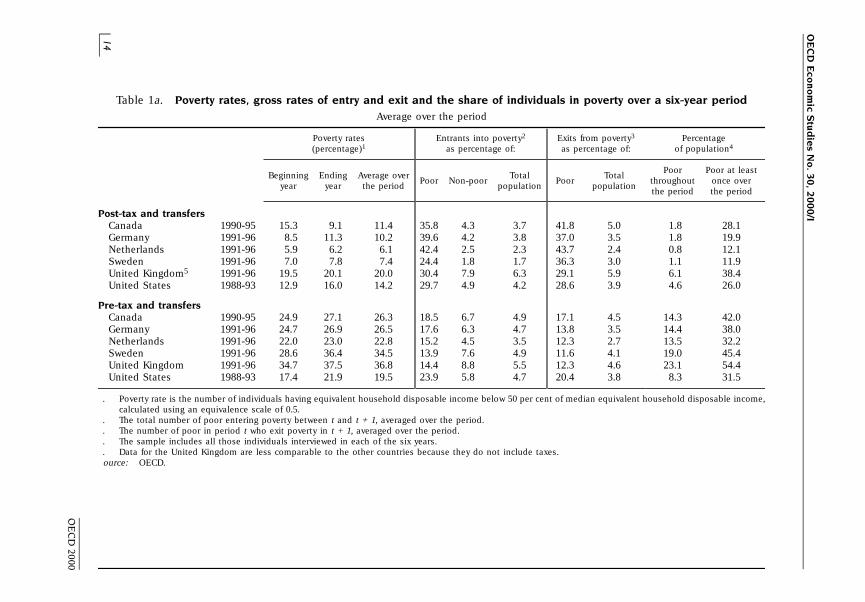
Three different dimensions of poverty are shown in Figure 1 and Table 1a forthe most recent six-year period:
a) The “static” poverty rate – calculated as the share of poor people in the totalpopulation averaged over the period.
b) The rate of longer-term poverty – calculated as the share of individuals inthe total population who were poor in every year through the six-yearperiod (i.e. the “6 + years in poverty” rate).
c) The rate of those poor at least once – calculated as the share of individualsin the total population who were poor at least once through the period (the“at least once in poverty” rate).
60
50
40
30
20
10
0
60
50
40
30
20
10
0
60
50
40
30
20
10
0
60
50
40
30
20
10
0
Figure 1. Three dimensions of low income: “static” low-income rates and ratesfor “those always on low income” and “having experienced low income”
“static” low-income rate
Per cent of total population Per cent of total population
Panel A. Post-tax and transfers
“6 years” low-income rate “at least once” low-income rate
Note: The “static” low-income rate is the share of those below the low-income threshold in the total population ineach year averaged over the period. The “6 years” low-income rate is the share of individuals who are on lowincome for the all 6 years as a share of the total population. The rate of persons having experienced low incomeis the share of those who have experienced at least one year of poverty over the six year period as share of thetotal population.
Source: OECD.
Canada Germany Netherlands Sweden UnitedKingdom
UnitedStates
Panel B. Pre-tax and transfers
Canada Germany Netherlands Sweden UnitedKingdom
UnitedStates
60
50
40
30
20
10
0
60
50
40
30
20
10
0
60
50
40
30
20
10
0
60
50
40
30
20
10
0
Figure 1. Three dimensions of low income: “static” low-income rates and ratesfor “those always on low income” and “having experienced low income”
“static” low-income rate
Per cent of total population Per cent of total population
Panel A. Post-tax and transfers
“6 years” low-income rate “at least once” low-income rate
Note: The “static” low-income rate is the share of those below the low-income threshold in the total population ineach year averaged over the period. The “6 years” low-income rate is the share of individuals who are on lowincome for the all 6 years as a share of the total population. The rate of persons having experienced low incomeis the share of those who have experienced at least one year of poverty over the six year period as share of thetotal population.
Source: OECD.
Canada Germany Netherlands Sweden UnitedKingdom
UnitedStates
Panel B. Pre-tax and transfers
Canada Germany Netherlands Sweden UnitedKingdom
UnitedStates
OE
CD
Eco
no
mic S
tud
ies N
o. 3
0, 2
00
0/I
14
OE
CD
2000
Table 1a. Poverty rates, gross rates of entry and exit and the share of individuals in poverty over a six-year periodAverage over the period
Poverty rates Entrants into poverty2 Exits from poverty3 Percentage(percentage)1 as percentage of: as percentage of: of population4
Poor Poor at leastBeginning Ending Average over Total Total
Poor Non-poor Poor throughout once overyear year the period population population
the period the period
Post-tax and transfersCanada 1990-95 15.3 9.1 11.4 35.8 4.3 3.7 41.8 5.0 1.8 28.1Germany 1991-96 8.5 11.3 10.2 39.6 4.2 3.8 37.0 3.5 1.8 19.9Netherlands 1991-96 5.9 6.2 6.1 42.4 2.5 2.3 43.7 2.4 0.8 12.1Sweden 1991-96 7.0 7.8 7.4 24.4 1.8 1.7 36.3 3.0 1.1 11.9United Kingdom5 1991-96 19.5 20.1 20.0 30.4 7.9 6.3 29.1 5.9 6.1 38.4United States 1988-93 12.9 16.0 14.2 29.7 4.9 4.2 28.6 3.9 4.6 26.0
Pre-tax and transfersCanada 1990-95 24.9 27.1 26.3 18.5 6.7 4.9 17.1 4.5 14.3 42.0Germany 1991-96 24.7 26.9 26.5 17.6 6.3 4.7 13.8 3.5 14.4 38.0Netherlands 1991-96 22.0 23.0 22.8 15.2 4.5 3.5 12.3 2.7 13.5 32.2Sweden 1991-96 28.6 36.4 34.5 13.9 7.6 4.9 11.6 4.1 19.0 45.4United Kingdom 1991-96 34.7 37.5 36.8 14.4 8.8 5.5 12.3 4.6 23.1 54.4United States 1988-93 17.4 21.9 19.5 23.9 5.8 4.7 20.4 3.8 8.3 31.5
. Poverty rate is the number of individuals having equivalent household disposable income below 50 per cent of median equivalent household disposable income,calculated using an equivalence scale of 0.5.
. The total number of poor entering poverty between t and t + 1, averaged over the period.
. The number of poor in period t who exit poverty in t + 1, averaged over the period.
. The sample includes all those individuals interviewed in each of the six years.
. Data for the United Kingdom are less comparable to the other countries because they do not include taxes.ource: OECD.
Po
verty d
yna
mics in
six OE
CD
cou
ntrie
s
15
OE
CD
2000
Table 1b. Total time over a six-year period that individuals spend in poverty1
Share of total years spent in poverty by individualsShare of individuals staying in poverty 1-5+ years2
with 1-5+ years in poverty3(percentage)
(percentage)
1 year 2 years 3 years 4 years 5+ years Average 1 year 2 years 3 years 4 years 5+ years
Post-tax and transfersCanada 1990-95 35.9 27.0 14.4 9.2 13.5 2.4 14.8 22.1 17.7 15.2 30.3Germany 1991-96 45.6 19.4 12.0 7.6 15.5 2.4 19.2 16.3 15.2 12.8 36.4Netherlands 1991-96 48.1 20.6 11.9 7.7 11.6 2.2 21.8 18.8 16.3 14.0 29.1Sweden 1991-96 41.1 21.9 13.0 8.7 15.3 2.4 16.8 17.9 16.0 14.2 35.0United Kingdom 1991-96 26.0 19.3 13.6 13.2 27.9 3.1 8.3 12.3 13.0 16.9 49.6United States 1989-93 33.0 18.5 11.2 10.1 27.3 3.0 11.1 12.4 11.2 13.5 51.8
Pre-tax and transfersCanada 1990-95 21.5 13.6 10.6 9.8 44.6 3.8 5.7 7.2 8.5 10.4 68.2Germany 1991-96 20.6 14.3 9.9 9.2 45.9 3.8 5.4 7.5 7.8 9.6 69.8Netherlands 1991-96 18.0 11.8 10.2 8.8 51.2 3.8 4.4 5.8 7.5 8.7 73.5Sweden 1991-96 14.6 11.6 10.6 10.8 52.5 4.2 3.5 5.5 7.6 10.4 73.0United Kingdom 1991-96 14.8 12.4 9.7 9.5 53.7 4.2 3.5 5.9 7.0 9.1 74.5United States 1989-93 27.9 15.1 11.5 8.8 36.7 3.4 8.3 8.9 10.2 10.5 62.1
. The sample used includes all those individuals interviewed in each of the six years who have experienced poverty (i.e. those included in the last column ofTable 1a).
. For example, 45.6 per cent of the poor in Germany suffered poverty for one year and 15.5 per cent for five years or more.
. The following steps were used to calculate the values in each column. First the values in each of the columns of the left hand panel were multiplied (weighted) bythe number of years spent in poverty shown in the heading (distinguishing between 5 years and 6+ years). A weight of 6 was given to groups which have six of moreyears in poverty, thus biasing downward the last column in the right-hand panel. Second, these weighted values were summed over all years to estimate the totalnumber of years spent in poverty by the total population. Third, the values in the columns of the right-hand panel are the results of the first step divided by thetotal calculated in the second step. The rows sum to 100.
ource: OECD.
OECD Economic Studies No. 30, 2000/I
16
OECD 2000
Looking first at the data on a post-tax-and-transfer basis, Figure 1 shows thatthe poverty situation is both better and worse than the static poverty rates suggest.On the one hand, the share of individuals who are poor throughout the period is low(in the range of 1 to 6 per cent of the population). On the other, the share of the pop-ulation that was in poverty at least once over the six-year period is large (between12 and 38 per cent of the population). Thus, while poverty is a short-term “event”for many, it is a much more widespread phenomenon than shown by static povertyrates. These data also suggest that there is considerable turnover amongst the poorand this is corroborated in the second and third panels of Table 1a. The overallentry and exit rates12 show that from just under 25 to just over 40 per cent of thepool of the poor turn over every year during the six-year period.13
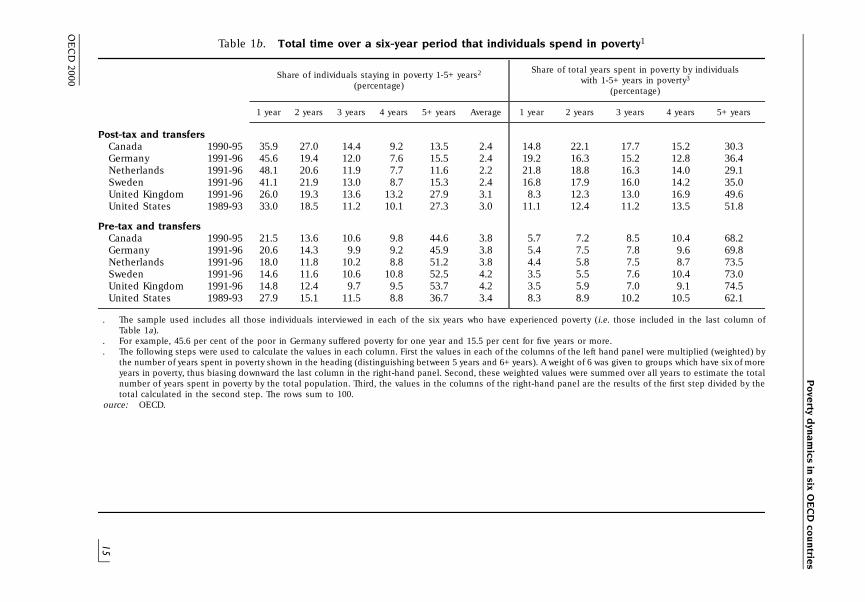
Against this background, Table 1b shows the distribution of total time spent inpoverty. The left-hand panel shows the share of individuals who, over the six-yearperiod considered, spent from one year to five or more years in poverty,14 includingrepeat spells in poverty. In Germany, the Netherlands and Sweden, over 40 percent remain poor only one year, which is higher than for Canada, the United Kingdomand the United States (26 to 36 per cent). The opposite is the case for those poorfor five or more periods who make up 27 to 28 per cent of those touched by povertyfor the latter two countries, compared with only around 15 per cent or below forGermany, the Netherlands and Sweden.
The right-hand panel shows the share of the total time spent in poverty by eachgroup. To obtain this measure, the shares in the columns in the left-hand side panelare weighted by the length of time each spends in poverty (one to six years) and,then, divided by the total number of years spent in poverty by the whole popula-tion (the sum of the weighted values). This measure takes into account the fact thatindividuals who have been in poverty longer, weigh more heavily in the total numberof person-years spent in poverty over the six-year “window”. The results show why thelonger-term poor are so important for policy – those with five or more years in povertyexperience as much as 50 per cent (the United Kingdom and the United States) of thetime spent in poverty over the six-year period, even though this group makes up amuch smaller portion of the overall population of the poor. This group tends to suffermore from poverty and – where they are entitled to support – may potentially absorba significantly larger share of the total spending on poverty alleviation.
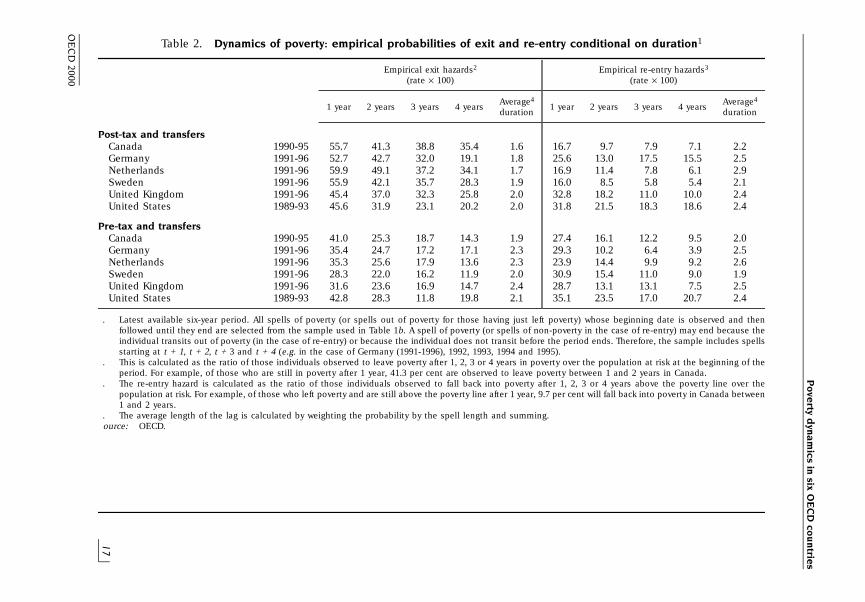
Table 2 examines the length of time individuals who fall into poverty mayexpect on average to remain there (left-hand panel) and how long they stay outof poverty once they exit (right-hand panel), again on both a pre- andpost-tax-and-transfer basis and for the same six-year “window”.15 Both panels showempirical hazard rates of, respectively, exit (left-hand panel) and re-entry (right-handpanel) – i.e. the probability of exit from (or re-entry into) poverty at a certain period,conditional on having been in (or out of) poverty until then. For example, the exit
Po
verty d
yna
mics in
six OE
CD
cou
ntrie
s
17
OE
CD
2000
Table 2. Dynamics of poverty: empirical probabilities of exit and re-entry conditional on duration1
Empirical exit hazards2 Empirical re-entry hazards3
(rate × 100) (rate × 100)
Average4 Average41 year 2 years 3 years 4 years 1 year 2 years 3 years 4 years
duration duration
Post-tax and transfersCanada 1990-95 55.7 41.3 38.8 35.4 1.6 16.7 9.7 7.9 7.1 2.2Germany 1991-96 52.7 42.7 32.0 19.1 1.8 25.6 13.0 17.5 15.5 2.5Netherlands 1991-96 59.9 49.1 37.2 34.1 1.7 16.9 11.4 7.8 6.1 2.9Sweden 1991-96 55.9 42.1 35.7 28.3 1.9 16.0 8.5 5.8 5.4 2.1United Kingdom 1991-96 45.4 37.0 32.3 25.8 2.0 32.8 18.2 11.0 10.0 2.4United States 1989-93 45.6 31.9 23.1 20.2 2.0 31.8 21.5 18.3 18.6 2.4
Pre-tax and transfersCanada 1990-95 41.0 25.3 18.7 14.3 1.9 27.4 16.1 12.2 9.5 2.0Germany 1991-96 35.4 24.7 17.2 17.1 2.3 29.3 10.2 6.4 3.9 2.5Netherlands 1991-96 35.3 25.6 17.9 13.6 2.3 23.9 14.4 9.9 9.2 2.6Sweden 1991-96 28.3 22.0 16.2 11.9 2.0 30.9 15.4 11.0 9.0 1.9United Kingdom 1991-96 31.6 23.6 16.9 14.7 2.4 28.7 13.1 13.1 7.5 2.5United States 1989-93 42.8 28.3 11.8 19.8 2.1 35.1 23.5 17.0 20.7 2.4
. Latest available six-year period. All spells of poverty (or spells out of poverty for those having just left poverty) whose beginning date is observed and thenfollowed until they end are selected from the sample used in Table 1b. A spell of poverty (or spells of non-poverty in the case of re-entry) may end because theindividual transits out of poverty (in the case of re-entry) or because the individual does not transit before the period ends. Therefore, the sample includes spellsstarting at t + 1, t + 2, t + 3 and t + 4 (e.g. in the case of Germany (1991-1996), 1992, 1993, 1994 and 1995).
. This is calculated as the ratio of those individuals observed to leave poverty after 1, 2, 3 or 4 years in poverty over the population at risk at the beginning of theperiod. For example, of those who are still in poverty after 1 year, 41.3 per cent are observed to leave poverty between 1 and 2 years in Canada.
. The re-entry hazard is calculated as the ratio of those individuals observed to fall back into poverty after 1, 2, 3 or 4 years above the poverty line over thepopulation at risk. For example, of those who left poverty and are still above the poverty line after 1 year, 9.7 per cent will fall back into poverty in Canada between1 and 2 years.
. The average length of the lag is calculated by weighting the probability by the spell length and summing.ource: OECD.
OECD Economic Studies No. 30, 2000/I
18
OECD 2000
hazard in the second period is the share of individuals exiting poverty as a fraction ofthose (remaining) poor at the end of the first period. A fall in these hazard rates indi-cates that the share of those who exit or re-enter declines with the length of time spentin or out of poverty – i.e. in the case of exit rates, people who remain have progressivelya more difficult time exiting poverty, the longer the poverty period lasts.16
Table 2 shows that the probability of leaving poverty one year after entry intopoverty is around 45 to 60 per cent when the post-tax-and-transfer data is used.This probability is much higher than for pre-tax-and-transfer data (left-hand panel).The right-hand panel shows that there is considerable re-entry into poverty. Theimportance of re-entry confirms recent research (Gottschalk and Moffitt, 1994; Jarvisand Jenkins, 1997; Huff Stevens, 1995; and Laroche, 1997) and signals considerablerecycling into and out of poverty.17 While cross-country comparisons are difficultbecause cyclical positions differ across the six countries, Canada, Germany, theNetherlands and Sweden stand out as having particularly high exit rates from pov-erty and lower re-entry probabilities (less so for Germany) over this period, whilethe opposite is the case for the United Kingdom and the United States. Finally, theprobability of exit (and re-entry) declines as the period lengthens.
Poverty dynamics before and after taxes and transfers
The tax and transfer system can affect poverty transitions in various ways:
– Transfer payments (or reduced taxes) will initially limit the fall into povertywhere net taxes and transfers are generous enough to keep the householdabove the poverty threshold – for example, when individuals receive agepensions on becoming retired or insurance benefits on falling unemployed.
– The tax and transfer system can also result in earlier exit of those havingfallen into poverty – for example, there may be delays before disability pen-sions are granted or older unemployed workers in poverty may receive anage pension large enough to bring them out of poverty on reachingretirement age.
– Finally, as pointed out in OECD (1997), the differences in the tax and transfersystems themselves may affect pre-tax-and-transfer income. For example,generous age-related pensions in Germany may have allowed individuals towithdraw permanently from the labour force, or unemployment benefits maylengthen the period of job search of those of working age.18
A comparison of the top and bottom panels of Tables 1a, 1b and 2 and Figure 1suggests that the tax-and-transfer system has a substantial impact on the level ofpoverty, the time spent in poverty and on the rate of exit from poverty.19 Theleft-hand panel of Table 1a confirms the results of OECD (1997) that taxes and trans-fers sharply reduce the pool of the poor in all six countries – defined in terms of thesame poverty threshold. Not surprisingly, the effect is smallest in the United States
Poverty dynamics in six OECD countries
19
OECD 2000
while, in Germany, the Netherlands and Sweden, the difference between poverty ratesbefore and after taxes and transfers is more than three times as large. A comparison ofthe top and bottom panels of Figure 1 shows the particularly marked effect of tax trans-fers on the long-term poor. Tax and transfers reduce the long-term poverty rate by12-13 percentage points in Germany, the Netherlands and Canada; the decline waslarger in the United Kingdom and Sweden and much smaller in the United States.
Comparing the pre- and post-tax-and-transfer data in Table 1b shows that, in allcountries, the share of those remaining in poverty over the longer term is smallerafter taxes and transfers. On a pre-tax-and-transfer basis, the share of total timespent below the poverty threshold over a longer period rises to between two-thirds and three-quarters of the total time all individuals spend on poverty(Table 1b, right panel). The rate at which individuals exit from poverty falls lesssharply when moving from a pre-tax-and-transfers to a post-tax-and-transferbasis (although, once again, this is less the case for the United States) (Table 2,bottom panel).
One interpretation of these results is that the tax and transfer system bothreduces poverty and shortens poverty stays as well. This effect could result from anincrease with the size of income-support programmes or from increased targeting – thereduction of poverty in Table 1a is as large in the United Kingdom as is in Sweden –possibly because targeting is likely to lead to greater behavioural response for agiven level of expenditure. However, changes in household behaviour in countrieswith more generous transfer systems could, in principle, also lead to an increase inthe degree of poverty and the length of poverty stays on a pre-tax and transferbasis, though there is limited evidence to support this hypothesis in the data pre-sented here. In any case, cross-country comparisons need to be treated with cau-tion, as cyclical differences have not been taken into account.
The characteristics of the poor by length of spell
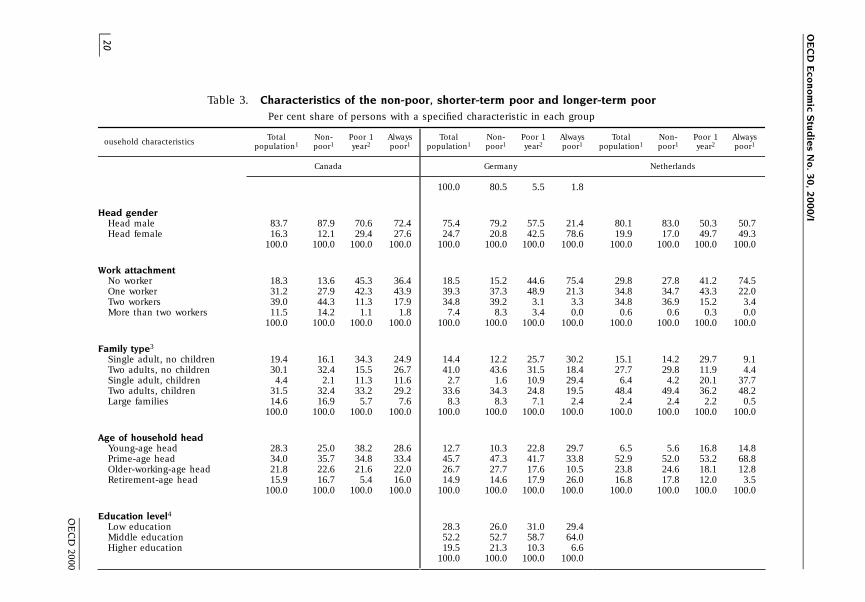
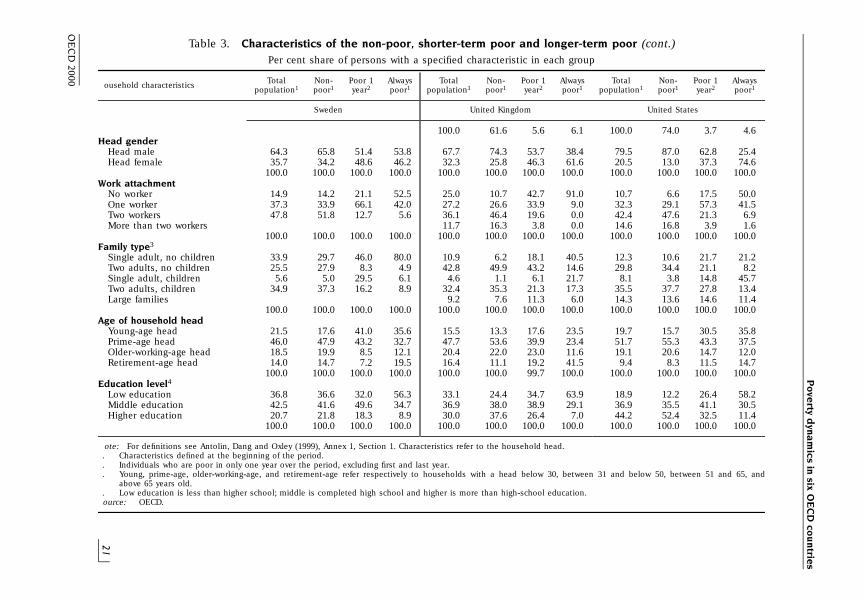
Variations in family and labour-market characteristics across the longer-termpoor, shorter-term poor and non-poor may provide some guidance in the formula-tion of anti-poverty policies. However, they do not imply that these differenceshave caused longer or shorter stays in poverty. Table 3 compares the share of indi-viduals with specific characteristics across four groups for all countries: the total andthe non-poor populations, the short-term poor (individuals experiencing onlyone year in poverty over the period) and the long-term poor (individuals who arepoor for at least six years).
Several broad patterns appear from Table 3 although they do not necessarilyapply to all countries in all cases:
– First, the following groups tend to be over-represented among thelonger-term poor: those living in female-headed households, in single-adult
OE
CD
Eco
no
mic S
tud
ies N
o. 3
0, 2
00
0/I
20
OE
CD
2000
Table 3. Characteristics of the non-poor, shorter-term poor and longer-term poorPer cent share of persons with a specified characteristic in each group
Total Non- Poor 1 Always Total Non- Poor 1 Always Total Non- Poor 1 Alwaysousehold characteristics
population1 poor1 year2 poor1 population1 poor1 year2 poor1 population1 poor1 year2 poor1
Canada Germany Netherlands
100.0 80.5 5.5 1.8
Head genderHead male 83.7 87.9 70.6 72.4 75.4 79.2 57.5 21.4 80.1 83.0 50.3 50.7Head female 16.3 12.1 29.4 27.6 24.7 20.8 42.5 78.6 19.9 17.0 49.7 49.3
100.0 100.0 100.0 100.0 100.0 100.0 100.0 100.0 100.0 100.0 100.0 100.0
Work attachmentNo worker 18.3 13.6 45.3 36.4 18.5 15.2 44.6 75.4 29.8 27.8 41.2 74.5One worker 31.2 27.9 42.3 43.9 39.3 37.3 48.9 21.3 34.8 34.7 43.3 22.0Two workers 39.0 44.3 11.3 17.9 34.8 39.2 3.1 3.3 34.8 36.9 15.2 3.4More than two workers 11.5 14.2 1.1 1.8 7.4 8.3 3.4 0.0 0.6 0.6 0.3 0.0
100.0 100.0 100.0 100.0 100.0 100.0 100.0 100.0 100.0 100.0 100.0 100.0
Family type3
Single adult, no children 19.4 16.1 34.3 24.9 14.4 12.2 25.7 30.2 15.1 14.2 29.7 9.1Two adults, no children 30.1 32.4 15.5 26.7 41.0 43.6 31.5 18.4 27.7 29.8 11.9 4.4Single adult, children 4.4 2.1 11.3 11.6 2.7 1.6 10.9 29.4 6.4 4.2 20.1 37.7Two adults, children 31.5 32.4 33.2 29.2 33.6 34.3 24.8 19.5 48.4 49.4 36.2 48.2Large families 14.6 16.9 5.7 7.6 8.3 8.3 7.1 2.4 2.4 2.4 2.2 0.5
100.0 100.0 100.0 100.0 100.0 100.0 100.0 100.0 100.0 100.0 100.0 100.0
Age of household headYoung-age head 28.3 25.0 38.2 28.6 12.7 10.3 22.8 29.7 6.5 5.6 16.8 14.8Prime-age head 34.0 35.7 34.8 33.4 45.7 47.3 41.7 33.8 52.9 52.0 53.2 68.8Older-working-age head 21.8 22.6 21.6 22.0 26.7 27.7 17.6 10.5 23.8 24.6 18.1 12.8Retirement-age head 15.9 16.7 5.4 16.0 14.9 14.6 17.9 26.0 16.8 17.8 12.0 3.5
100.0 100.0 100.0 100.0 100.0 100.0 100.0 100.0 100.0 100.0 100.0 100.0
Education level4Low education 28.3 26.0 31.0 29.4Middle education 52.2 52.7 58.7 64.0Higher education 19.5 21.3 10.3 6.6
100.0 100.0 100.0 100.0
Po
verty d
yna
mics in
six OE
CD
cou
ntrie
s
21
OE
CD
2000
Table 3. Characteristics of the non-poor, shorter-term poor and longer-term poor (cont.)Per cent share of persons with a specified characteristic in each group
Total Non- Poor 1 Always Total Non- Poor 1 Always Total Non- Poor 1 Alwaysousehold characteristics
population1 poor1 year2 poor1 population1 poor1 year2 poor1 population1 poor1 year2 poor1
Sweden United Kingdom United States
100.0 61.6 5.6 6.1 100.0 74.0 3.7 4.6Head gender
Head male 64.3 65.8 51.4 53.8 67.7 74.3 53.7 38.4 79.5 87.0 62.8 25.4Head female 35.7 34.2 48.6 46.2 32.3 25.8 46.3 61.6 20.5 13.0 37.3 74.6
100.0 100.0 100.0 100.0 100.0 100.0 100.0 100.0 100.0 100.0 100.0 100.0Work attachment
No worker 14.9 14.2 21.1 52.5 25.0 10.7 42.7 91.0 10.7 6.6 17.5 50.0One worker 37.3 33.9 66.1 42.0 27.2 26.6 33.9 9.0 32.3 29.1 57.3 41.5Two workers 47.8 51.8 12.7 5.6 36.1 46.4 19.6 0.0 42.4 47.6 21.3 6.9More than two workers 11.7 16.3 3.8 0.0 14.6 16.8 3.9 1.6
100.0 100.0 100.0 100.0 100.0 100.0 100.0 100.0 100.0 100.0 100.0 100.0Family type3
Single adult, no children 33.9 29.7 46.0 80.0 10.9 6.2 18.1 40.5 12.3 10.6 21.7 21.2Two adults, no children 25.5 27.9 8.3 4.9 42.8 49.9 43.2 14.6 29.8 34.4 21.1 8.2Single adult, children 5.6 5.0 29.5 6.1 4.6 1.1 6.1 21.7 8.1 3.8 14.8 45.7Two adults, children 34.9 37.3 16.2 8.9 32.4 35.3 21.3 17.3 35.5 37.7 27.8 13.4Large families 9.2 7.6 11.3 6.0 14.3 13.6 14.6 11.4
100.0 100.0 100.0 100.0 100.0 100.0 100.0 100.0 100.0 100.0 100.0 100.0Age of household head
Young-age head 21.5 17.6 41.0 35.6 15.5 13.3 17.6 23.5 19.7 15.7 30.5 35.8Prime-age head 46.0 47.9 43.2 32.7 47.7 53.6 39.9 23.4 51.7 55.3 43.3 37.5Older-working-age head 18.5 19.9 8.5 12.1 20.4 22.0 23.0 11.6 19.1 20.6 14.7 12.0Retirement-age head 14.0 14.7 7.2 19.5 16.4 11.1 19.2 41.5 9.4 8.3 11.5 14.7
100.0 100.0 100.0 100.0 100.0 100.0 99.7 100.0 100.0 100.0 100.0 100.0Education level4
Low education 36.8 36.6 32.0 56.3 33.1 24.4 34.7 63.9 18.9 12.2 26.4 58.2Middle education 42.5 41.6 49.6 34.7 36.9 38.0 38.9 29.1 36.9 35.5 41.1 30.5Higher education 20.7 21.8 18.3 8.9 30.0 37.6 26.4 7.0 44.2 52.4 32.5 11.4
100.0 100.0 100.0 100.0 100.0 100.0 100.0 100.0 100.0 100.0 100.0 100.0
ote: For definitions see Antolin, Dang and Oxley (1999), Annex 1, Section 1. Characteristics refer to the household head.. Characteristics defined at the beginning of the period.. Individuals who are poor in only one year over the period, excluding first and last year.. Young, prime-age, older-working-age, and retirement-age refer respectively to households with a head below 30, between 31 and below 50, between 51 and 65, and
above 65 years old.. Low education is less than higher school; middle is completed high school and higher is more than high-school education.ource: OECD.
OECD Economic Studies No. 30, 2000/I
22
OECD 2000
households with children (except in Sweden), in households headed by anindividual of retirement age (except in Canada and the Netherlands) or byan young individual (except in Canada),20 in households where the head haslower education (Germany excluded21), and in households where there isno worker (and also one worker in Canada, Sweden and the United States).The concentration of the longer-term poor among these groups probablyreflects the fact that many of these conditions, when they occur, tend to lastfor a long time: for example, in the United Kingdom, lone-parenthood lasts,on average, for around six years (McKay, 1998) and for, older people, incomeschange little over time, such that those in poverty tend to stay there for a longperiod (Census Bureau, 1998).
– Second, there are significant differences between the shorter and thelonger-term poor and, on some characteristics, the short-term poorappear to be closer to the non-poor than to the longer-term poor. In par-ticular, the short-term poor have a considerably larger share of house-holds with at least one earner and are less concentrated amonghouseholds which are headed by women, single adults, lone parents andthe less educated. Thus, they appear to come from a wider span of thepopulation.
– Finally, key characteristics of the longer-term poor tend to differ acrosscountries: in both Germany and the United States, women-headedhouseholds and lone parents appear particularly important. However, inthe United States around 50 percent of the longer-term poor belong tohouseholds with at least one worker, as compared with only around 25 percent in Germany.22 In Canada, over 60 per cent of the long term poorbelong to households with at least one worker. In the United Kingdom,key features are the concentration of the longer-term poor in non-workinghouseholds, female-headed households, among households headed byan elderly person and among single adults. Sweden does not seem tohave a strong concentration of long-term poverty on lone parents house-holds, and the Netherlands does not appear to have a long-term old-agepoverty problem.
FACTORS ASSOCIATED WITH POVERTY TRANSITIONS
This section examines whether transitions may be linked to certain “events”which can propel households into poverty or permit them to exit. An initial ques-tion regarding poverty transitions concerns the size of the income changes whentransitions occur. Small movements in the income of households clustered near thepoverty thresholds may lead to many transitions into and out of poverty, but these
Poverty dynamics in six OECD countries
23
OECD 2000
may not be economically or socially significant. Antolín, Dang and Oxley (1999)show that the number of poverty transitions which result from relatively smallchanges in income around the poverty line are very small.23
“Events” and transitions
Poverty transitions can result from changes in income and in householddemography and, very often, such “events” occur at the same time.24 For example,changes in household size (such as the arrival of a child) affect individual equiva-lent incomes because total household income is spread among more householdmembers. Alternatively, in the case of separations or divorce, economies of scaleare lost as two new households are set up even if the two adults do not change theirlabour-market status; and, in cases where the mother takes legal responsibility forthe children, the income of the original household is not always re-allocated in linewith the respective needs of the two new households. The material presented in thissection provides a clearer picture of factors which accompany transitions. But theresults do not purport to “explain” poverty transitions: changes in both income andhousehold size are, themselves, driven by a number of inter-related decisions abouthousehold labour supply, household formation and fertility, as well as government taxand transfer policies.25
Table 4 presents provides some broad indications about which income com-ponents are key to transitions. Transitions into and out of poverty are broken downaccording to the income component which showed the largest change at the timethe transition occurred.26 As can be seen, cases where the change in employmentincome was biggest make up the largest share of total transitions (except in theNetherlands), suggesting that labour-market developments are crucial for under-standing movements into and out of poverty. There is some difference across coun-tries in the importance of “public transfers” and “other market income” (whichincludes private pension income, capital income and private transfers). Caseswhere transfers contribute most to the total income change are more important inall countries but the United States. In Canada and the Netherlands, transfers are thesingle most important change. In the Netherlands, taxes contribute to a largerextent than in the other countries.
Which “events” have households experienced when they enter and exit poverty?
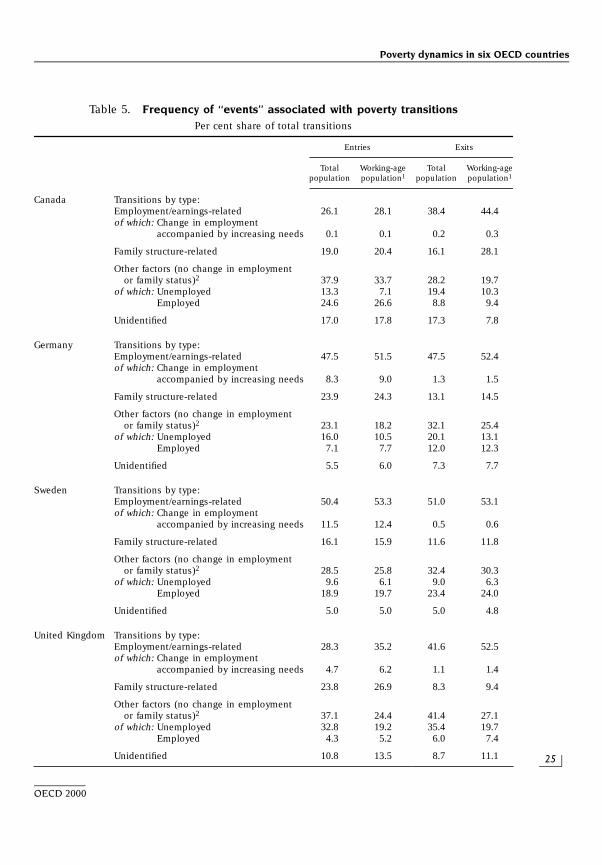
Table 5 explores in more detail the importance of changes in family structureand in the labour market which are associated with poverty transitions.27 For thepurposes of this analysis, the total number of transitions is broken down intothree broad categories. (Further detail on category definition is presented inAntolín, Dang and Oxley, 1999.)

OECD Economic Studies No. 30, 2000/I
24
OECD 2000
Table 4. Frequency of poverty-related events by income componentEvents as a per cent share of transitions into and out of poverty
United UnitedCanada Germany Netherlands Sweden
Kingdom States
Total population
Transitions into poverty: Income components with the largest change at time of transitionEarnings of head 25.6 54.3 22.8 50.3 45.0 56.7Earnings of spouse 16.7 11.5 9.5 5.2 12.5 9.2Other earnings 15.4 2.2 6.1 0.5 3.1 7.4Capital and other market income 9.0 9.9 12.2 13.8 4.9 14.5Transfers 28.5 21.4 23.6 24.0 34.1 7.8Taxes 4.8 0.1 20.3 3.9 . . 0.9Non-identified 0.0 0.4 5.6 2.4 0.4 3.6
Sub-total: earnings-related 57.7 68.1 38.4 55.9 60.5 73.2
Transitions out of poverty: Income components with the largest change at time of transitionEarnings of head 38.1 46.9 22.6 52.4 36.8 60.7Earnings of spouse 10.0 11.2 8.4 3.1 12.1 11.3Other earnings 5.9 2.9 9.1 0.4 5.1 6.6Capital and other market income 5.2 10.3 14.7 9.0 5.0 10.8Transfers 38.9 27.9 27.0 30.6 40.9 7.9Taxes 1.0 0.5 14.7 2.6 . . 1.4Non-identified 1.0 0.3 3.6 2.0 0.0 1.4
Sub-total: earnings-related 54.0 61.0 40.1 55.8 54.0 78.5
Working-age population1
Transitions into poverty: Income components with the largest change at time of transitionEarnings of head 22.1 59.5 24.4 53.4 54.5 63.0Earnings of spouse 18.4 12.0 9.8 5.5 15.2 10.1Other earnings 16.6 2.2 6.4 0.5 3.0 6.4Capital and other market income 9.0 8.5 10.0 11.5 1.4 9.5Transfers 29.3 17.5 24.3 24.0 25.7 7.8Taxes 4.6 0.2 19.3 2.7 . . 0.7Non-identified 0.0 0.2 5.9 2.4 0.3 2.6
Sub-total: earnings-related 57.0 73.7 40.6 59.4 72.7 79.4
Transitions out of poverty: Income components with the largest change at time of transitionEarnings of head 44.4 51.4 24.7 54.5 44.9 64.4Earnings of spouse 11.8 12.3 9.2 3.2 15.2 12.0Other earnings 6.0 3.2 9.6 0.4 5.6 6.2Capital and other market income 4.0 9.1 11.2 7.8 2.0 7.9Transfers 31.7 23.0 27.2 30.2 32.3 7.4Taxes 1.0 0.6 14.3 2.0 . . 1.2Non-identified 1.0 0.4 3.8 2.0 0.0 0.9
Sub-total: earnings-related 62.2 66.9 43.5 58.0 65.7 82.6
Note: The income changes were constrained to be of the same sign as the change in total income (except taxes). The change inthe components was then computed and the component with the largest change was identified with the transition.Covers most recent six-year period of available data.
1. Refers to individuals belonging to households with a working age head.Source: OECD.
Poverty dynamics in six OECD countries
25
OECD 2000
Table 5. Frequency of ‘‘events’’ associated with poverty transitionsPer cent share of total transitions
Entries Exits
Total Working-age Total Working-agepopulation population1 population population1
Canada Transitions by type:Employment/earnings-related 26.1 28.1 38.4 44.4of which: Change in employment
accompanied by increasing needs 0.1 0.1 0.2 0.3
Family structure-related 19.0 20.4 16.1 28.1
Other factors (no change in employmentor family status)2 37.9 33.7 28.2 19.7
of which: Unemployed 13.3 7.1 19.4 10.3 Employed 24.6 26.6 8.8 9.4
Unidentified 17.0 17.8 17.3 7.8
Germany Transitions by type:Employment/earnings-related 47.5 51.5 47.5 52.4of which: Change in employment
accompanied by increasing needs 8.3 9.0 1.3 1.5
Family structure-related 23.9 24.3 13.1 14.5
Other factors (no change in employmentor family status)2 23.1 18.2 32.1 25.4
of which: Unemployed 16.0 10.5 20.1 13.1 Employed 7.1 7.7 12.0 12.3
Unidentified 5.5 6.0 7.3 7.7
Sweden Transitions by type:Employment/earnings-related 50.4 53.3 51.0 53.1of which: Change in employment
accompanied by increasing needs 11.5 12.4 0.5 0.6
Family structure-related 16.1 15.9 11.6 11.8
Other factors (no change in employmentor family status)2 28.5 25.8 32.4 30.3
of which: Unemployed 9.6 6.1 9.0 6.3 Employed 18.9 19.7 23.4 24.0
Unidentified 5.0 5.0 5.0 4.8
United Kingdom Transitions by type:Employment/earnings-related 28.3 35.2 41.6 52.5of which: Change in employment
accompanied by increasing needs 4.7 6.2 1.1 1.4
Family structure-related 23.8 26.9 8.3 9.4
Other factors (no change in employmentor family status)2 37.1 24.4 41.4 27.1
of which: Unemployed 32.8 19.2 35.4 19.7 Employed 4.3 5.2 6.0 7.4
Unidentified 10.8 13.5 8.7 11.1
OECD Economic Studies No. 30, 2000/I
26
OECD 2000
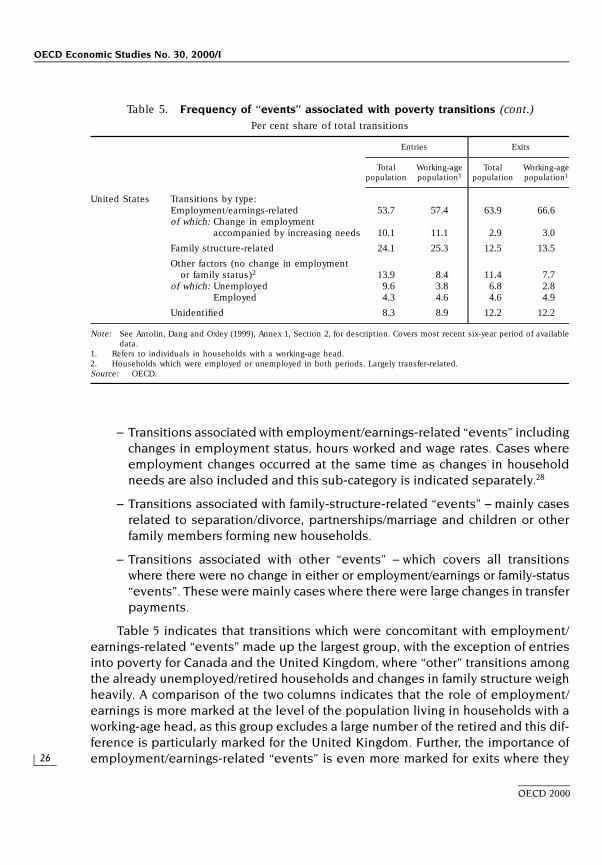
– Transitions associated with employment/earnings-related “events” includingchanges in employment status, hours worked and wage rates. Cases whereemployment changes occurred at the same time as changes in householdneeds are also included and this sub-category is indicated separately.28
– Transitions associated with family-structure-related “events” – mainly casesrelated to separation/divorce, partnerships/marriage and children or otherfamily members forming new households.
– Transitions associated with other “events” – which covers all transitionswhere there were no change in either or employment/earnings or family-status“events”. These were mainly cases where there were large changes in transferpayments.
Table 5 indicates that transitions which were concomitant with employment/earnings-related “events” made up the largest group, with the exception of entriesinto poverty for Canada and the United Kingdom, where “other” transitions amongthe already unemployed/retired households and changes in family structure weighheavily. A comparison of the two columns indicates that the role of employment/earnings is more marked at the level of the population living in households with aworking-age head, as this group excludes a large number of the retired and this dif-ference is particularly marked for the United Kingdom. Further, the importance ofemployment/earnings-related “events” is even more marked for exits where they
Table 5. Frequency of ‘‘events’’ associated with poverty transitions (cont.)Per cent share of total transitions
Entries Exits
Total Working-age Total Working-agepopulation population1 population population1
United States Transitions by type:Employment/earnings-related 53.7 57.4 63.9 66.6of which: Change in employment
accompanied by increasing needs 10.1 11.1 2.9 3.0
Family structure-related 24.1 25.3 12.5 13.5
Other factors (no change in employmentor family status)2 13.9 8.4 11.4 7.7
of which: Unemployed 9.6 3.8 6.8 2.8 Employed 4.3 4.6 4.6 4.9
Unidentified 8.3 8.9 12.2 12.2
Note: See Antolin, Dang and Oxley (1999), Annex 1, Section 2, for description. Covers most recent six-year period of availabledata.
1. Refers to individuals in households with a working-age head.2. Households which were employed or unemployed in both periods. Largely transfer-related.Source: OECD.
Poverty dynamics in six OECD countries
27
OECD 2000
make up around 50 per cent (Germany, Sweden, the United Kingdom) to over60 per cent (the United States) of all exits for those in households with a work-ing-age head. In contrast, family-status-related “events” are relatively moreimportant for entries than for exits. Finally, “other” transitions for the unem-ployed – which appear largely related to the transfer payments – are largest inthe United Kingdom and smallest in the United States. These differences mayreflect transfer systems – e.g. for United States, unemployment insurance cover-age is low and the duration of benefits short and, hence, there are few transi-tions where transfers make up the largest component of the total change inincome. Alternatively, it may reflect the fact that unemployment rates are lowerin the United States.
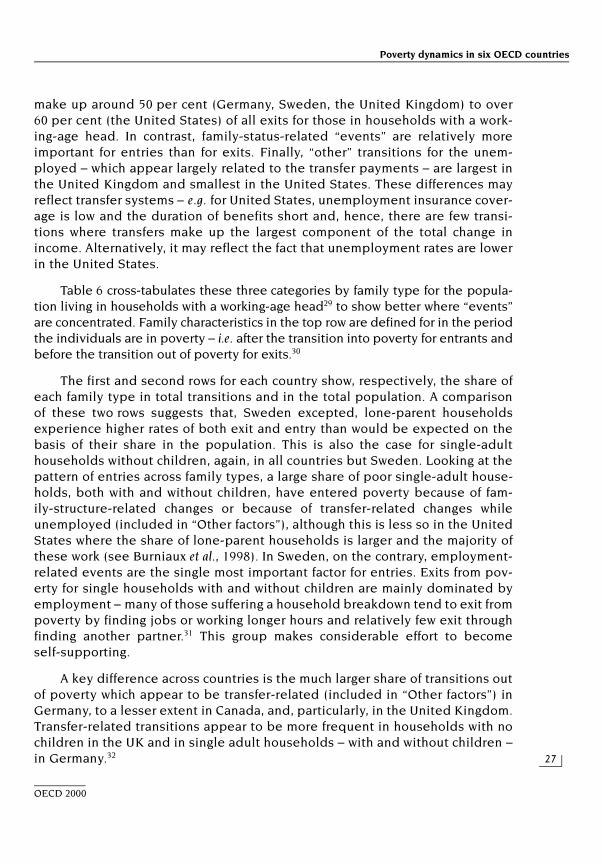
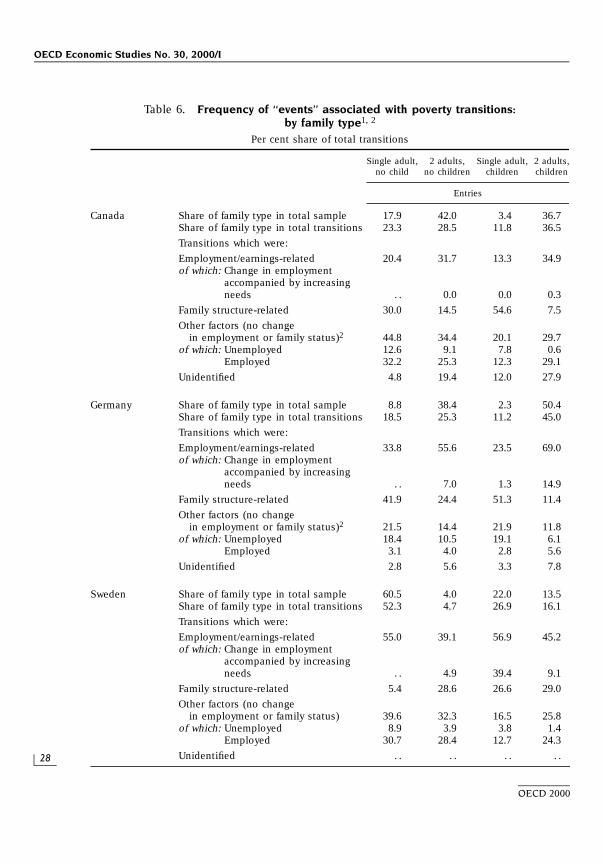
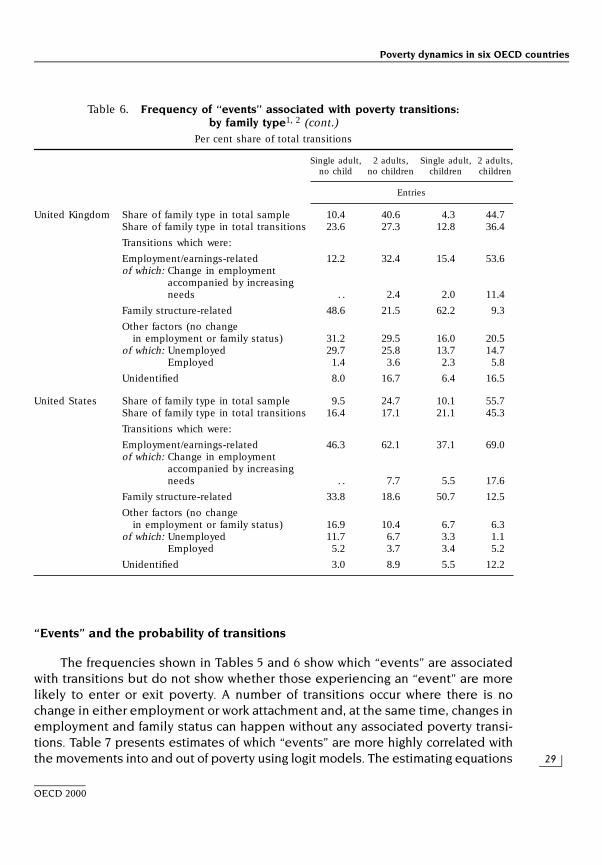
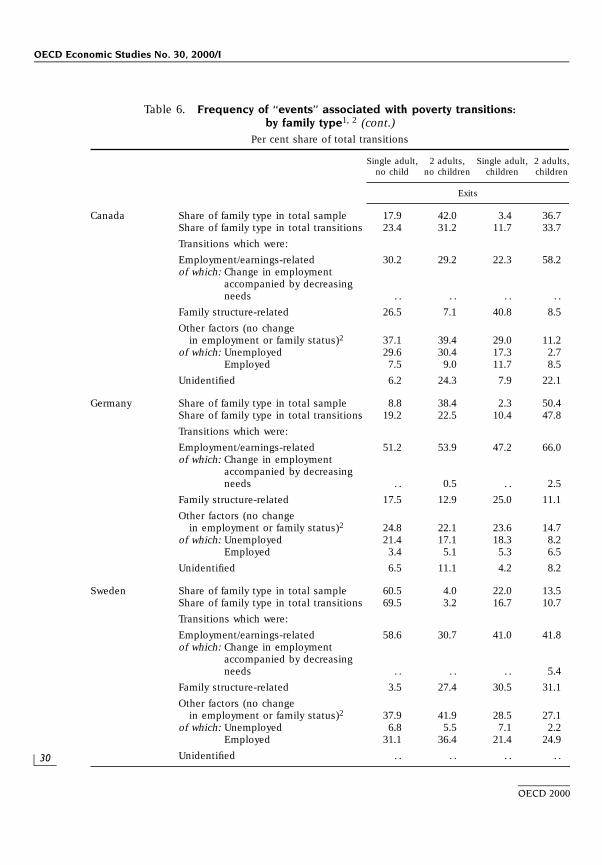
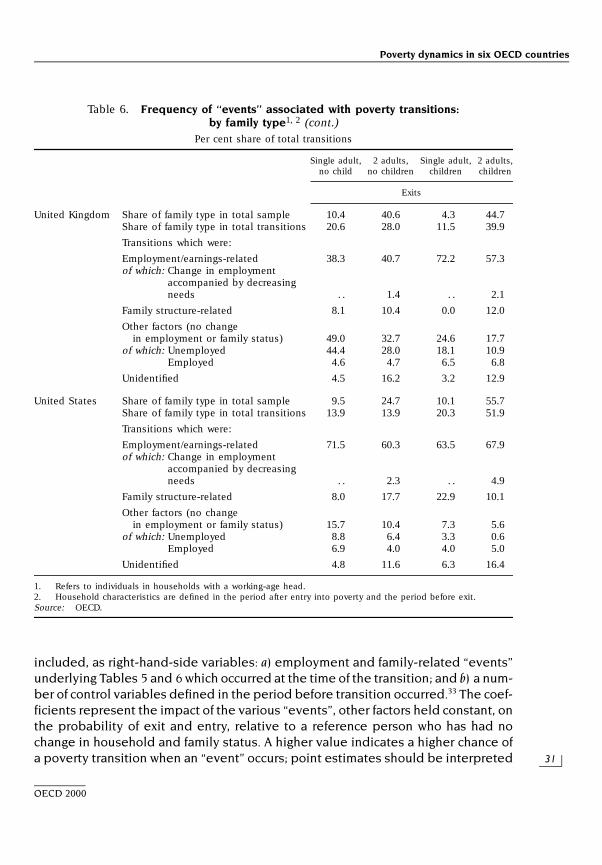
Table 6 cross-tabulates these three categories by family type for the popula-tion living in households with a working-age head29 to show better where “events”are concentrated. Family characteristics in the top row are defined for in the periodthe individuals are in poverty – i.e. after the transition into poverty for entrants andbefore the transition out of poverty for exits.30
The first and second rows for each country show, respectively, the share ofeach family type in total transitions and in the total population. A comparisonof these two rows suggests that, Sweden excepted, lone-parent householdsexperience higher rates of both exit and entry than would be expected on thebasis of their share in the population. This is also the case for single-adulthouseholds without children, again, in all countries but Sweden. Looking at thepattern of entries across family types, a large share of poor single-adult house-holds, both with and without children, have entered poverty because of fam-ily-structure-related changes or because of transfer-related changes whileunemployed (included in “Other factors”), although this is less so in the UnitedStates where the share of lone-parent households is larger and the majority ofthese work (see Burniaux et al., 1998). In Sweden, on the contrary, employment-related events are the single most important factor for entries. Exits from pov-erty for single households with and without children are mainly dominated byemployment – many of those suffering a household breakdown tend to exit frompoverty by finding jobs or working longer hours and relatively few exit throughfinding another partner.31 This group makes considerable effort to becomeself-supporting.
A key difference across countries is the much larger share of transitions outof poverty which appear to be transfer-related (included in “Other factors”) inGermany, to a lesser extent in Canada, and, particularly, in the United Kingdom.Transfer-related transitions appear to be more frequent in households with nochildren in the UK and in single adult households – with and without children –in Germany.32
OECD Economic Studies No. 30, 2000/I
28
OECD 2000
Table 6. Frequency of ‘‘events’’ associated with poverty transitions:by family type1, 2
Per cent share of total transitions
Single adult, 2 adults, Single adult, 2 adults,no child no children children children
Entries
Canada Share of family type in total sample 17.9 42.0 3.4 36.7Share of family type in total transitions 23.3 28.5 11.8 36.5
Transitions which were:
Employment/earnings-related 20.4 31.7 13.3 34.9of which: Change in employment
accompanied by increasingneeds . . 0.0 0.0 0.3
Family structure-related 30.0 14.5 54.6 7.5
Other factors (no changein employment or family status)2 44.8 34.4 20.1 29.7
of which: Unemployed 12.6 9.1 7.8 0.6 Employed 32.2 25.3 12.3 29.1
Unidentified 4.8 19.4 12.0 27.9
Germany Share of family type in total sample 8.8 38.4 2.3 50.4Share of family type in total transitions 18.5 25.3 11.2 45.0
Transitions which were:
Employment/earnings-related 33.8 55.6 23.5 69.0of which: Change in employment
accompanied by increasingneeds . . 7.0 1.3 14.9
Family structure-related 41.9 24.4 51.3 11.4
Other factors (no changein employment or family status)2 21.5 14.4 21.9 11.8
of which: Unemployed 18.4 10.5 19.1 6.1 Employed 3.1 4.0 2.8 5.6
Unidentified 2.8 5.6 3.3 7.8
Sweden Share of family type in total sample 60.5 4.0 22.0 13.5Share of family type in total transitions 52.3 4.7 26.9 16.1
Transitions which were:
Employment/earnings-related 55.0 39.1 56.9 45.2of which: Change in employment
accompanied by increasingneeds . . 4.9 39.4 9.1
Family structure-related 5.4 28.6 26.6 29.0
Other factors (no changein employment or family status) 39.6 32.3 16.5 25.8
of which: Unemployed 8.9 3.9 3.8 1.4 Employed 30.7 28.4 12.7 24.3
Unidentified . . . . . . . .
Poverty dynamics in six OECD countries
29
OECD 2000
“Events” and the probability of transitions
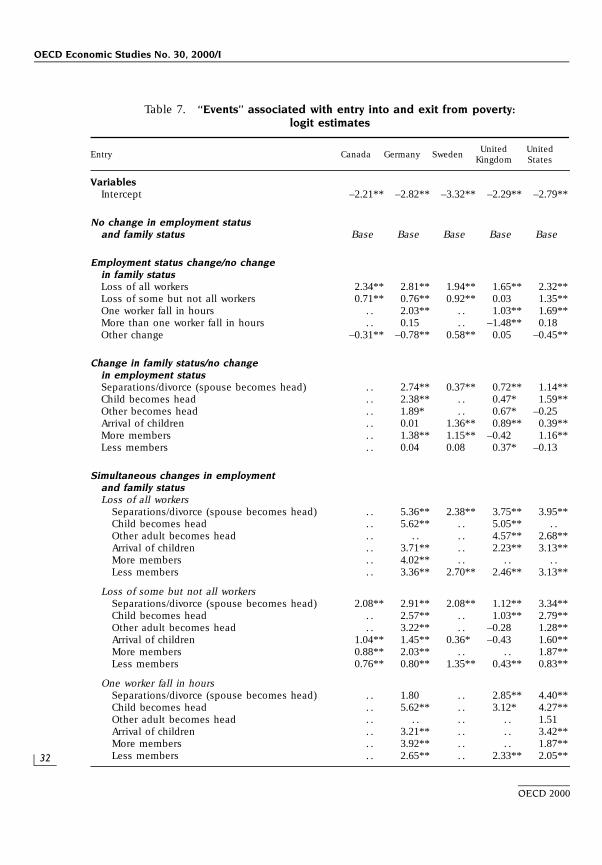
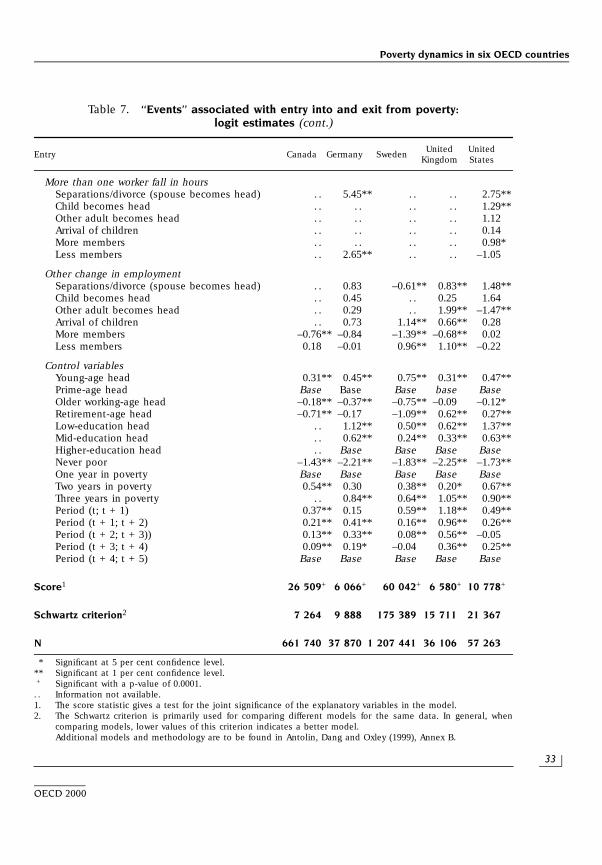
The frequencies shown in Tables 5 and 6 show which “events” are associatedwith transitions but do not show whether those experiencing an “event” are morelikely to enter or exit poverty. A number of transitions occur where there is nochange in either employment or work attachment and, at the same time, changes inemployment and family status can happen without any associated poverty transi-tions. Table 7 presents estimates of which “events” are more highly correlated withthe movements into and out of poverty using logit models. The estimating equations
Table 6. Frequency of ‘‘events’’ associated with poverty transitions:by family type1, 2 (cont.)
Per cent share of total transitions
Single adult, 2 adults, Single adult, 2 adults,no child no children children children
Entries
United Kingdom Share of family type in total sample 10.4 40.6 4.3 44.7Share of family type in total transitions 23.6 27.3 12.8 36.4
Transitions which were:
Employment/earnings-related 12.2 32.4 15.4 53.6of which: Change in employment
accompanied by increasingneeds . . 2.4 2.0 11.4
Family structure-related 48.6 21.5 62.2 9.3
Other factors (no changein employment or family status) 31.2 29.5 16.0 20.5
of which: Unemployed 29.7 25.8 13.7 14.7 Employed 1.4 3.6 2.3 5.8
Unidentified 8.0 16.7 6.4 16.5
United States Share of family type in total sample 9.5 24.7 10.1 55.7Share of family type in total transitions 16.4 17.1 21.1 45.3
Transitions which were:
Employment/earnings-related 46.3 62.1 37.1 69.0of which: Change in employment
accompanied by increasingneeds . . 7.7 5.5 17.6
Family structure-related 33.8 18.6 50.7 12.5
Other factors (no changein employment or family status) 16.9 10.4 6.7 6.3
of which: Unemployed 11.7 6.7 3.3 1.1 Employed 5.2 3.7 3.4 5.2
Unidentified 3.0 8.9 5.5 12.2
OECD Economic Studies No. 30, 2000/I
30
OECD 2000
Table 6. Frequency of ‘‘events’’ associated with poverty transitions:by family type1, 2 (cont.)
Per cent share of total transitions
Single adult, 2 adults, Single adult, 2 adults,no child no children children children
Exits
Canada Share of family type in total sample 17.9 42.0 3.4 36.7Share of family type in total transitions 23.4 31.2 11.7 33.7
Transitions which were:
Employment/earnings-related 30.2 29.2 22.3 58.2of which: Change in employment
accompanied by decreasingneeds . . . . . . . .
Family structure-related 26.5 7.1 40.8 8.5
Other factors (no changein employment or family status)2 37.1 39.4 29.0 11.2
of which: Unemployed 29.6 30.4 17.3 2.7 Employed 7.5 9.0 11.7 8.5
Unidentified 6.2 24.3 7.9 22.1
Germany Share of family type in total sample 8.8 38.4 2.3 50.4Share of family type in total transitions 19.2 22.5 10.4 47.8
Transitions which were:
Employment/earnings-related 51.2 53.9 47.2 66.0of which: Change in employment
accompanied by decreasingneeds . . 0.5 . . 2.5
Family structure-related 17.5 12.9 25.0 11.1
Other factors (no changein employment or family status)2 24.8 22.1 23.6 14.7
of which: Unemployed 21.4 17.1 18.3 8.2 Employed 3.4 5.1 5.3 6.5
Unidentified 6.5 11.1 4.2 8.2
Sweden Share of family type in total sample 60.5 4.0 22.0 13.5Share of family type in total transitions 69.5 3.2 16.7 10.7
Transitions which were:
Employment/earnings-related 58.6 30.7 41.0 41.8of which: Change in employment
accompanied by decreasingneeds . . . . . . 5.4
Family structure-related 3.5 27.4 30.5 31.1
Other factors (no changein employment or family status)2 37.9 41.9 28.5 27.1
of which: Unemployed 6.8 5.5 7.1 2.2 Employed 31.1 36.4 21.4 24.9
Unidentified . . . . . . . .
Poverty dynamics in six OECD countries
31
OECD 2000
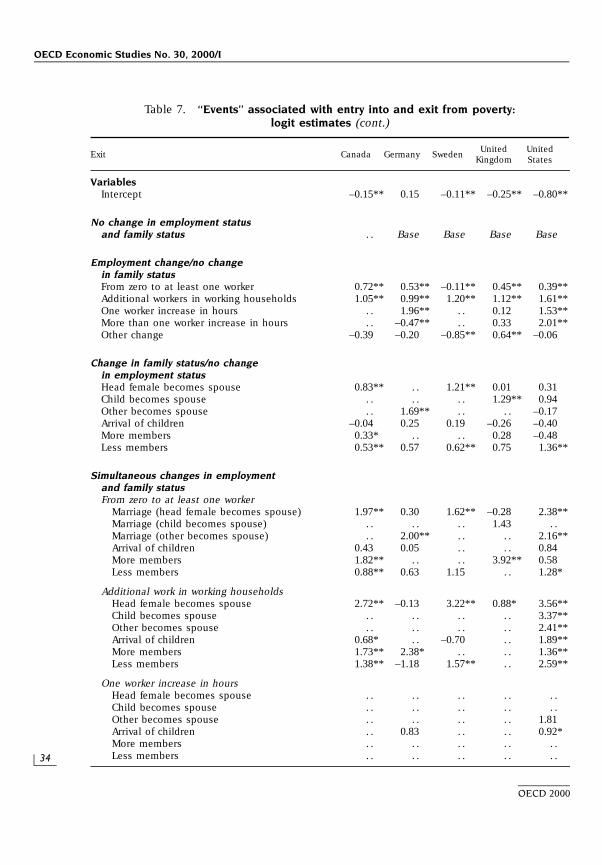
included, as right-hand-side variables: a) employment and family-related “events”underlying Tables 5 and 6 which occurred at the time of the transition; and b) a num-ber of control variables defined in the period before transition occurred.33 The coef-ficients represent the impact of the various “events”, other factors held constant, onthe probability of exit and entry, relative to a reference person who has had nochange in household and family status. A higher value indicates a higher chance ofa poverty transition when an “event” occurs; point estimates should be interpreted
Table 6. Frequency of ‘‘events’’ associated with poverty transitions:by family type1, 2 (cont.)
Per cent share of total transitions
Single adult, 2 adults, Single adult, 2 adults,no child no children children children
Exits
United Kingdom Share of family type in total sample 10.4 40.6 4.3 44.7Share of family type in total transitions 20.6 28.0 11.5 39.9
Transitions which were:
Employment/earnings-related 38.3 40.7 72.2 57.3of which: Change in employment
accompanied by decreasingneeds . . 1.4 . . 2.1
Family structure-related 8.1 10.4 0.0 12.0
Other factors (no changein employment or family status) 49.0 32.7 24.6 17.7
of which: Unemployed 44.4 28.0 18.1 10.9 Employed 4.6 4.7 6.5 6.8
Unidentified 4.5 16.2 3.2 12.9
United States Share of family type in total sample 9.5 24.7 10.1 55.7Share of family type in total transitions 13.9 13.9 20.3 51.9
Transitions which were:
Employment/earnings-related 71.5 60.3 63.5 67.9of which: Change in employment
accompanied by decreasingneeds . . 2.3 . . 4.9
Family structure-related 8.0 17.7 22.9 10.1
Other factors (no changein employment or family status) 15.7 10.4 7.3 5.6
of which: Unemployed 8.8 6.4 3.3 0.6 Employed 6.9 4.0 4.0 5.0
Unidentified 4.8 11.6 6.3 16.4
1. Refers to individuals in households with a working-age head.2. Household characteristics are defined in the period after entry into poverty and the period before exit.Source: OECD.
OECD Economic Studies No. 30, 2000/I
32
OECD 2000
Table 7. ‘‘Events’’ associated with entry into and exit from poverty:logit estimates
United UnitedEntry Canada Germany Sweden
Kingdom States
VariablesIntercept –2.21** –2.82** –3.32** –2.29** –2.79**
No change in employment statusand family status Base Base Base Base Base
Employment status change/no changein family statusLoss of all workers 2.34** 2.81** 1.94** 1.65** 2.32**Loss of some but not all workers 0.71** 0.76** 0.92** 0.03 1.35**One worker fall in hours . . 2.03** . . 1.03** 1.69**More than one worker fall in hours . . 0.15 . . –1.48** 0.18Other change –0.31** –0.78** 0.58** 0.05 –0.45**
Change in family status/no changein employment statusSeparations/divorce (spouse becomes head) . . 2.74** 0.37** 0.72** 1.14**Child becomes head . . 2.38** . . 0.47* 1.59**Other becomes head . . 1.89* . . 0.67* –0.25Arrival of children . . 0.01 1.36** 0.89** 0.39**More members . . 1.38** 1.15** –0.42 1.16**Less members . . 0.04 0.08 0.37* –0.13
Simultaneous changes in employmentand family statusLoss of all workers
Separations/divorce (spouse becomes head) . . 5.36** 2.38** 3.75** 3.95**Child becomes head . . 5.62** . . 5.05** . .Other adult becomes head . . . . . . 4.57** 2.68**Arrival of children . . 3.71** . . 2.23** 3.13**More members . . 4.02** . . . . . .Less members . . 3.36** 2.70** 2.46** 3.13**
Loss of some but not all workersSeparations/divorce (spouse becomes head) 2.08** 2.91** 2.08** 1.12** 3.34**Child becomes head . . 2.57** . . 1.03** 2.79**Other adult becomes head . . 3.22** . . –0.28 1.28**Arrival of children 1.04** 1.45** 0.36* –0.43 1.60**More members 0.88** 2.03** . . . . 1.87**Less members 0.76** 0.80** 1.35** 0.43** 0.83**
One worker fall in hoursSeparations/divorce (spouse becomes head) . . 1.80 . . 2.85** 4.40**Child becomes head . . 5.62** . . 3.12* 4.27**Other adult becomes head . . . . . . . . 1.51Arrival of children . . 3.21** . . . . 3.42**More members . . 3.92** . . . . 1.87**Less members . . 2.65** . . 2.33** 2.05**
Poverty dynamics in six OECD countries
33
OECD 2000
Table 7. ‘‘Events’’ associated with entry into and exit from poverty:logit estimates (cont.)
United UnitedEntry Canada Germany Sweden
Kingdom States
More than one worker fall in hoursSeparations/divorce (spouse becomes head) . . 5.45** . . . . 2.75**Child becomes head . . . . . . . . 1.29**Other adult becomes head . . . . . . . . 1.12Arrival of children . . . . . . . . 0.14More members . . . . . . . . 0.98*Less members . . 2.65** . . . . –1.05
Other change in employmentSeparations/divorce (spouse becomes head) . . 0.83 –0.61** 0.83** 1.48**Child becomes head . . 0.45 . . 0.25 1.64Other adult becomes head . . 0.29 . . 1.99** –1.47**Arrival of children . . 0.73 1.14** 0.66** 0.28More members –0.76** –0.84 –1.39** –0.68** 0.02Less members 0.18 –0.01 0.96** 1.10** –0.22
Control variablesYoung-age head 0.31** 0.45** 0.75** 0.31** 0.47**Prime-age head Base Base Base base BaseOlder working-age head –0.18** –0.37** –0.75** –0.09 –0.12*Retirement-age head –0.71** –0.17 –1.09** 0.62** 0.27**Low-education head . . 1.12** 0.50** 0.62** 1.37**Mid-education head . . 0.62** 0.24** 0.33** 0.63**Higher-education head . . Base Base Base BaseNever poor –1.43** –2.21** –1.83** –2.25** –1.73**One year in poverty Base Base Base Base BaseTwo years in poverty 0.54** 0.30 0.38** 0.20* 0.67**Three years in poverty . . 0.84** 0.64** 1.05** 0.90**Period (t; t + 1) 0.37** 0.15 0.59** 1.18** 0.49**Period (t + 1; t + 2) 0.21** 0.41** 0.16** 0.96** 0.26**Period (t + 2; t + 3)) 0.13** 0.33** 0.08** 0.56** –0.05Period (t + 3; t + 4) 0.09** 0.19* –0.04 0.36** 0.25**Period (t + 4; t + 5) Base Base Base Base Base
Score1 26 509+ 6 066+ 60 042+ 6 580+ 10 778+
Schwartz criterion2 7 264 9 888 175 389 15 711 21 367
N 661 740 37 870 1 207 441 36 106 57 263
* Significant at 5 per cent confidence level.** Significant at 1 per cent confidence level. + Significant with a p-value of 0.0001.. . Information not available.1. The score statistic gives a test for the joint significance of the explanatory variables in the model.2. The Schwartz criterion is primarily used for comparing different models for the same data. In general, when
comparing models, lower values of this criterion indicates a better model.Additional models and methodology are to be found in Antolin, Dang and Oxley (1999), Annex B.
OECD Economic Studies No. 30, 2000/I
34
OECD 2000
Table 7. ‘‘Events’’ associated with entry into and exit from poverty:logit estimates (cont.)
United UnitedExit Canada Germany Sweden
Kingdom States
VariablesIntercept –0.15** 0.15 –0.11** –0.25** –0.80**
No change in employment statusand family status . . Base Base Base Base
Employment change/no changein family statusFrom zero to at least one worker 0.72** 0.53** –0.11** 0.45** 0.39**Additional workers in working households 1.05** 0.99** 1.20** 1.12** 1.61**One worker increase in hours . . 1.96** . . 0.12 1.53**More than one worker increase in hours . . –0.47** . . 0.33 2.01**Other change –0.39 –0.20 –0.85** 0.64** –0.06
Change in family status/no changein employment statusHead female becomes spouse 0.83** . . 1.21** 0.01 0.31Child becomes spouse . . . . . . 1.29** 0.94Other becomes spouse . . 1.69** . . . . –0.17Arrival of children –0.04 0.25 0.19 –0.26 –0.40More members 0.33* . . . . 0.28 –0.48Less members 0.53** 0.57 0.62** 0.75 1.36**
Simultaneous changes in employmentand family statusFrom zero to at least one worker
Marriage (head female becomes spouse) 1.97** 0.30 1.62** –0.28 2.38**Marriage (child becomes spouse) . . . . . . 1.43 . .Marriage (other becomes spouse) . . 2.00** . . . . 2.16**Arrival of children 0.43 0.05 . . . . 0.84More members 1.82** . . . . 3.92** 0.58Less members 0.88** 0.63 1.15 . . 1.28*
Additional work in working householdsHead female becomes spouse 2.72** –0.13 3.22** 0.88* 3.56**Child becomes spouse . . . . . . . . 3.37**Other becomes spouse . . . . . . . . 2.41**Arrival of children 0.68* . . –0.70 . . 1.89**More members 1.73** 2.38* . . . . 1.36**Less members 1.38** –1.18 1.57** . . 2.59**
One worker increase in hoursHead female becomes spouse . . . . . . . . . .Child becomes spouse . . . . . . . . . .Other becomes spouse . . . . . . . . 1.81Arrival of children . . 0.83 . . . . 0.92*More members . . . . . . . . . .Less members . . . . . . . . . .
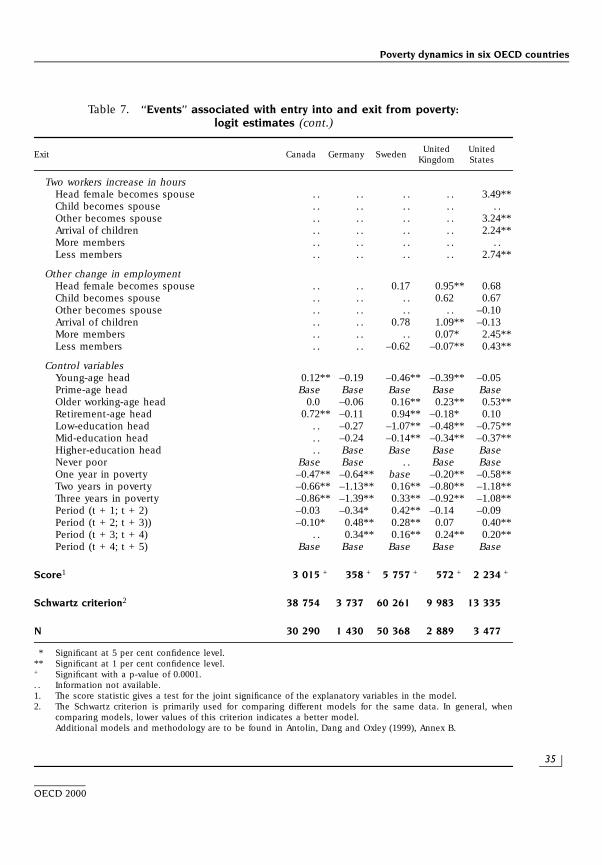
Poverty dynamics in six OECD countries
35
OECD 2000
Table 7. ‘‘Events’’ associated with entry into and exit from poverty:logit estimates (cont.)
United UnitedExit Canada Germany Sweden
Kingdom States
Two workers increase in hoursHead female becomes spouse . . . . . . . . 3.49**Child becomes spouse . . . . . . . . . .Other becomes spouse . . . . . . . . 3.24**Arrival of children . . . . . . . . 2.24**More members . . . . . . . . . .Less members . . . . . . . . 2.74**
Other change in employmentHead female becomes spouse . . . . 0.17 0.95** 0.68Child becomes spouse . . . . . . 0.62 0.67Other becomes spouse . . . . . . . . –0.10Arrival of children . . . . 0.78 1.09** –0.13More members . . . . . . 0.07* 2.45**Less members . . . . –0.62 –0.07** 0.43**
Control variablesYoung-age head 0.12** –0.19 –0.46** –0.39** –0.05Prime-age head Base Base Base Base BaseOlder working-age head 0.0 –0.06 0.16** 0.23** 0.53**Retirement-age head 0.72** –0.11 0.94** –0.18* 0.10Low-education head . . –0.27 –1.07** –0.48** –0.75**Mid-education head . . –0.24 –0.14** –0.34** –0.37**Higher-education head . . Base Base Base BaseNever poor Base Base . . Base BaseOne year in poverty –0.47** –0.64** base –0.20** –0.58**Two years in poverty –0.66** –1.13** 0.16** –0.80** –1.18**Three years in poverty –0.86** –1.39** 0.33** –0.92** –1.08**Period (t + 1; t + 2) –0.03 –0.34* 0.42** –0.14 –0.09Period (t + 2; t + 3)) –0.10* 0.48** 0.28** 0.07 0.40**Period (t + 3; t + 4) . . 0.34** 0.16** 0.24** 0.20**Period (t + 4; t + 5) Base Base Base Base Base
Score1 3 015 + 358 + 5 757 + 572 + 2 234 +
Schwartz criterion2 38 754 3 737 60 261 9 983 13 335
N 30 290 1 430 50 368 2 889 3 477
* Significant at 5 per cent confidence level.** Significant at 1 per cent confidence level.+ Significant with a p-value of 0.0001.. . Information not available.1. The score statistic gives a test for the joint significance of the explanatory variables in the model.2. The Schwartz criterion is primarily used for comparing different models for the same data. In general, when
comparing models, lower values of this criterion indicates a better model.Additional models and methodology are to be found in Antolin, Dang and Oxley (1999), Annex B.
OECD Economic Studies No. 30, 2000/I
36
OECD 2000
with some caution. The first two sets of coefficients concern cases where employ-ment-related and family-related “events” occurred singly; the remainder show resultsin cases where employment- and family-related “events” occurred at the same time.
The main conclusions from these estimates are:
– The employment-related change (no change in family-related “events”) mostlikely to lead to a transition into poverty is when the household loses allworkers though the risk of transition is also significant, if less important, inthe case of the loss of an additional worker or reduced hours.
– Family-related “events” (no change in employment status) generally entail alower probability of entry than for employment-related “events”.34 However,the probability of entry increases sharply for all categories of family-related“events” if there is also a loss of job or reduced hours. Put another way, therisk of poverty entry when an employment-related “event” occurs is lower ifthere is a stable household environment.
– As regards employment-related “events” and poverty exits, a second earneris generally associated with a higher probability of exit than the move fromno worker to one worker. This is consistent with results from the literaturewhich show that most individuals who lose jobs have lower earnings in theirnext job, in particular if they are displaced workers (Farber, 1993; Fallick,1996; Antolín, 1999), making it more difficult for households to move abovethe poverty threshold, particularly where there is a single earner. This alsoconfirms the results in OECD (1998) that getting a job is often only a first step– albeit an important one – towards poverty exit.
– The probability of exit from poverty through marriage is high in Canada, Swedenand the United States, but occur in relatively few cases.
HOW LONG DO PEOPLE STAY IN POVERTY?
An examination of transitions into and out of poverty leads, naturally, to therelated question of how long people stay in poverty. As argued previously, povertymay be even more serious when heavily concentrated on individuals who eitherexperience long periods of poverty or who cycle back and forth into and out of pov-erty, thereby spending more time in poverty than a single spell would suggest. Toshed some light on these issues, this section examines some main determinants ofpoverty duration as well as the probability of re-entry.
Data and methodology
For this part of the study, the full time period of the panel data sets (see thesecond section) were used (rather than the last six years) to create the sub-sample
Poverty dynamics in six OECD countries
37
OECD 2000
for estimation. The sub-sample was restricted to all poverty spells where the begin-ning date could be observed, thus excluding poverty spells in progress whoselength was unknown. Because all spells with an observed beginning date areincluded, an individual can have several spells. Each spell is followed over timeuntil it ends, which can occur because the individual moves out of poverty, becausethe individual drops out of the sample, or because the panel ends before the indi-vidual transits. Using multiple spells per individual allows previous spells to becontrolled for and, thus, a better understanding of poverty dynamics. For re-entry,the working sub-sample included all spells out of poverty where the beginning canbe observed, and these episodes were then pooled in a manner analogous tospells of poverty.
For each country, the exit (or re-entry) probabilities were estimated using alogit specification controlling for duration of the spell (or period out of poverty), cal-endar year, and individual and household characteristics.35 This permits the differ-ences in spell length to be associated with certain individual or householdcharacteristics: the estimated parameters indicate which groups have a higher orlower probability of exit (or re-entry) and, hence, a shorter or longer average dura-tion in (out of) poverty. The impact of previous spells of poverty on exit and re-entryrates was also examined, potentially correcting for some unobserved heterogeneity.
What determines the length of time people stay in poverty?
Two estimation approaches were used to measure the impact of the variousfactors on duration of poverty. First, the characteristics were defined at the time theindividual entered poverty, thus assuming that, either, these characteristics largelydetermine subsequent duration, or they did not change over the period. Thisapproach addresses the question of whether the probability of exit (or re-entry) isconditioned by factors existing at the time the poverty spells began. For example,if a person has a job but falls into poverty (e.g. through reduced wages or hoursworked), the poverty spell may be shorter than where an individual became poorwhile unemployed. Second, the characteristics were allowed to vary over time so as topick up the effects of changes – such as getting a job – on duration, thus supplementingthe information in the preceding section. Results from the two approaches are broadlysimilar but those presented in the tables are drawn from the second set of estimates.
The results shown in Tables 8, 9 and 10 are presented relative to the referenceperson, defined as a single, prime-age, male household head with high-school edu-cation, no dependant children and who was not working at the time the povertyspell began. These results were calculated using the logit equations for the dura-tion of poverty spells, which take into account previous poverty spells.36
Table 8 shows the hazard rates for poverty exit for the reference person. Theyshow that the estimated probability of leaving poverty falls as the spell lengthens,
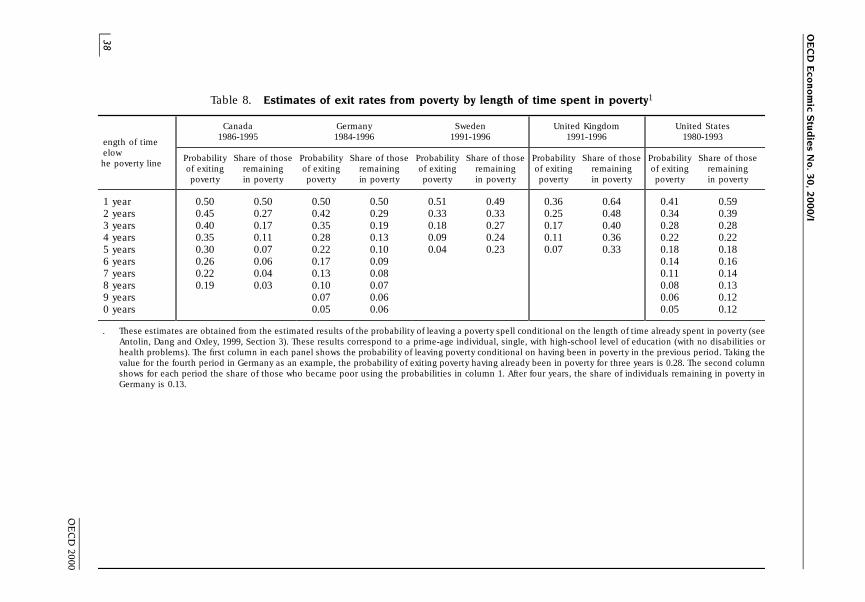
OE
CD
Eco
no
mic S
tud
ies N
o. 3
0, 2
00
0/I
38
OE
CD
2000
Table 8. Estimates of exit rates from poverty by length of time spent in poverty1
Canada Germany Sweden United Kingdom United States1986-1995 1984-1996 1991-1996 1991-1996 1980-1993
ength of time
Probability Share of those Probability Share of those Probability Share of those Probability Share of those Probability Share of thoseelow
of exiting remaining of exiting remaining of exiting remaining of exiting remaining of exiting remaininghe poverty line
poverty in poverty poverty in poverty poverty in poverty poverty in poverty poverty in poverty
1 year 0.50 0.50 0.50 0.50 0.51 0.49 0.36 0.64 0.41 0.592 years 0.45 0.27 0.42 0.29 0.33 0.33 0.25 0.48 0.34 0.393 years 0.40 0.17 0.35 0.19 0.18 0.27 0.17 0.40 0.28 0.284 years 0.35 0.11 0.28 0.13 0.09 0.24 0.11 0.36 0.22 0.225 years 0.30 0.07 0.22 0.10 0.04 0.23 0.07 0.33 0.18 0.186 years 0.26 0.06 0.17 0.09 0.14 0.167 years 0.22 0.04 0.13 0.08 0.11 0.148 years 0.19 0.03 0.10 0.07 0.08 0.139 years 0.07 0.06 0.06 0.120 years 0.05 0.06 0.05 0.12
. These estimates are obtained from the estimated results of the probability of leaving a poverty spell conditional on the length of time already spent in poverty (seeAntolin, Dang and Oxley, 1999, Section 3). These results correspond to a prime-age individual, single, with high-school level of education (with no disabilities orhealth problems). The first column in each panel shows the probability of leaving poverty conditional on having been in poverty in the previous period. Taking thevalue for the fourth period in Germany as an example, the probability of exiting poverty having already been in poverty for three years is 0.28. The second columnshows for each period the share of those who became poor using the probabilities in column 1. After four years, the share of individuals remaining in poverty inGermany is 0.13.
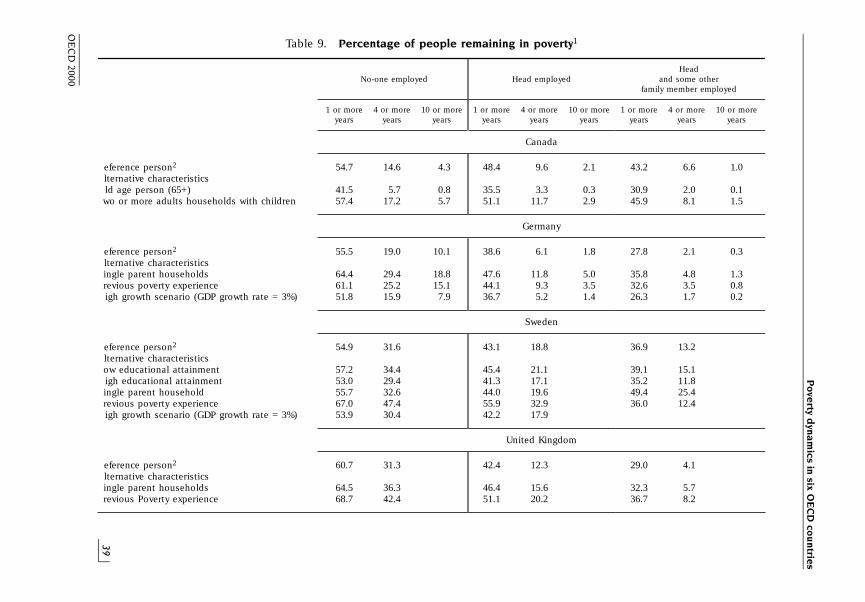
Po
verty d
yna
mics in
six OE
CD
cou
ntrie
s
39
OE
CD
2000
Table 9. Percentage of people remaining in poverty1
HeadNo-one employed Head employed and some other
family member employed
1 or more 4 or more 10 or more 1 or more 4 or more 10 or more 1 or more 4 or more 10 or moreyears years years years years years years years years
Canada
eference person2 54.7 14.6 4.3 48.4 9.6 2.1 43.2 6.6 1.0lternative characteristicsld age person (65+) 41.5 5.7 0.8 35.5 3.3 0.3 30.9 2.0 0.1wo or more adults households with children 57.4 17.2 5.7 51.1 11.7 2.9 45.9 8.1 1.5
Germany
eference person2 55.5 19.0 10.1 38.6 6.1 1.8 27.8 2.1 0.3lternative characteristicsingle parent households 64.4 29.4 18.8 47.6 11.8 5.0 35.8 4.8 1.3revious poverty experience 61.1 25.2 15.1 44.1 9.3 3.5 32.6 3.5 0.8igh growth scenario (GDP growth rate = 3%) 51.8 15.9 7.9 36.7 5.2 1.4 26.3 1.7 0.2
Sweden
eference person2 54.9 31.6 43.1 18.8 36.9 13.2lternative characteristicsow educational attainment 57.2 34.4 45.4 21.1 39.1 15.1igh educational attainment 53.0 29.4 41.3 17.1 35.2 11.8ingle parent household 55.7 32.6 44.0 19.6 49.4 25.4revious poverty experience 67.0 47.4 55.9 32.9 36.0 12.4igh growth scenario (GDP growth rate = 3%) 53.9 30.4 42.2 17.9
United Kingdom
eference person2 60.7 31.3 42.4 12.3 29.0 4.1lternative characteristicsingle parent households 64.5 36.3 46.4 15.6 32.3 5.7revious Poverty experience 68.7 42.4 51.1 20.2 36.7 8.2
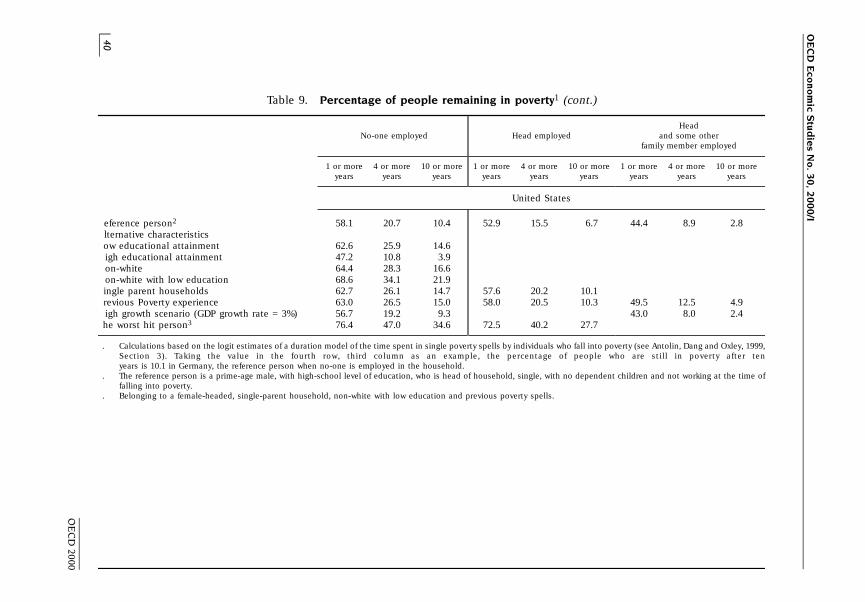
OE
CD
Eco
no
mic S
tud
ies N
o. 3
0, 2
00
0/I
40
OE
CD
2000
Table 9. Percentage of people remaining in poverty1 (cont.)
HeadNo-one employed Head employed and some other
family member employed
1 or more 4 or more 10 or more 1 or more 4 or more 10 or more 1 or more 4 or more 10 or moreyears years years years years years years years years
United States
eference person2 58.1 20.7 10.4 52.9 15.5 6.7 44.4 8.9 2.8lternative characteristicsow educational attainment 62.6 25.9 14.6igh educational attainment 47.2 10.8 3.9on-white 64.4 28.3 16.6on-white with low education 68.6 34.1 21.9ingle parent households 62.7 26.1 14.7 57.6 20.2 10.1revious Poverty experience 63.0 26.5 15.0 58.0 20.5 10.3 49.5 12.5 4.9igh growth scenario (GDP growth rate = 3%) 56.7 19.2 9.3 43.0 8.0 2.4he worst hit person3 76.4 47.0 34.6 72.5 40.2 27.7
. Calculations based on the logit estimates of a duration model of the time spent in single poverty spells by individuals who fall into poverty (see Antolin, Dang and Oxley, 1999,Section 3). Taking the value in the fourth row, third column as an example, the percentage of people who are still in poverty after tenyears is 10.1 in Germany, the reference person when no-one is employed in the household.
. The reference person is a prime-age male, with high-school level of education, who is head of household, single, with no dependent children and not working at the time offalling into poverty.
. Belonging to a female-headed, single-parent household, non-white with low education and previous poverty spells.
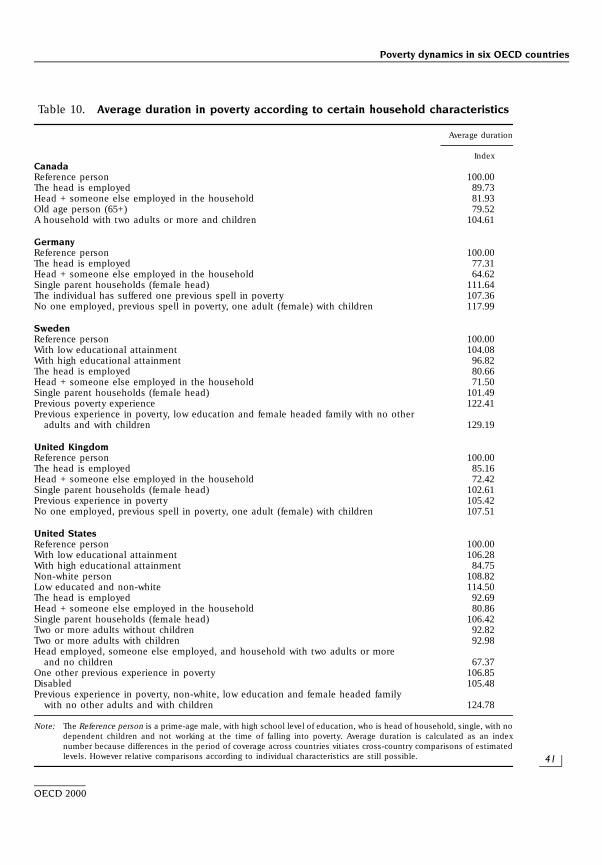
Poverty dynamics in six OECD countries
41
OECD 2000
Table 10. Average duration in poverty according to certain household characteristics
Average duration
IndexCanadaReference person 100.00The head is employed 89.73Head + someone else employed in the household 81.93Old age person (65+) 79.52A household with two adults or more and children 104.61
GermanyReference person 100.00The head is employed 77.31Head + someone else employed in the household 64.62Single parent households (female head) 111.64The individual has suffered one previous spell in poverty 107.36No one employed, previous spell in poverty, one adult (female) with children 117.99
SwedenReference person 100.00With low educational attainment 104.08With high educational attainment 96.82The head is employed 80.66Head + someone else employed in the household 71.50Single parent households (female head) 101.49Previous poverty experience 122.41Previous experience in poverty, low education and female headed family with no other
adults and with children 129.19
United KingdomReference person 100.00The head is employed 85.16Head + someone else employed in the household 72.42Single parent households (female head) 102.61Previous experience in poverty 105.42No one employed, previous spell in poverty, one adult (female) with children 107.51
United StatesReference person 100.00With low educational attainment 106.28With high educational attainment 84.75Non-white person 108.82Low educated and non-white 114.50The head is employed 92.69Head + someone else employed in the household 80.86Single parent households (female head) 106.42Two or more adults without children 92.82Two or more adults with children 92.98Head employed, someone else employed, and household with two adults or more
and no children 67.37One other previous experience in poverty 106.85Disabled 105.48Previous experience in poverty, non-white, low education and female headed family
with no other adults and with children 124.78
Note: The Reference person is a prime-age male, with high school level of education, who is head of household, single, with nodependent children and not working at the time of falling into poverty. Average duration is calculated as an indexnumber because differences in the period of coverage across countries vitiates cross-country comparisons of estimatedlevels. However relative comparisons according to individual characteristics are still possible.
OECD Economic Studies No. 30, 2000/I
42
OECD 2000
indicating that exit becomes more difficult the longer a person stays in poverty. Thiscould be due either to duration dependence because long periods in jobless pov-erty lead to changing attitudes towards work or erosion of human capital, or a sort-ing process where those best able to exit do so, leaving a pool of individuals withincreasingly “adverse” characteristics. While no explicit tests were carried out to tryand distinguish between these two alternatives, controlling for previous povertyspells may go some way towards correcting for unobserved heterogeneity.37
Because sample lengths differ across countries, durations are not directly compara-ble, in particular as regards Sweden and the United Kingdom.
To demonstrate the impact of the different characteristics of households onexpected poverty duration, Table 9 presents the percentage of people remainingin poverty after one year, four years and ten years (where data are available)according to different characteristics which are of key significance. In addition,Table 10 shows the changes in the average estimated duration for the reference personin each country for key characteristics. The results for average duration (Table 10) are inindex form because sample lengths differ across countries – 100 represents the averageestimated duration for the reference person in each country.
Table 9 shows, for the reference person (first line, left-hand panel) that morethan 50 per cent of those who fall into poverty and who do not obtain a job remainin poverty after one year, with around 10 per cent remaining in poverty for at leastten years for Germany and the United States. The impact of the labour-market sta-tus within the family on the length of time spent in poverty can be assessed by compar-ing the first panel with the middle and right-hand panels. Correspondingly, theimpact of different individual characteristics, family type, the cycle and previouspoverty experience are shown by comparing rows for individuals with that of the ref-erence person (line 1 for each country in the left-hand panel) with the other combi-nations of characteristics indicated in the column and row headings. The mainpolicy-relevant results are:
– Employment by the head of household and by a second wage-earner in thehousehold significantly reduces poverty persistence. The percentage of peo-ple remaining in poverty after a year falls by 5-6 percentage points in Canada,and the United States, 12 percentage points in Sweden and by about17-18 percentage points in the United Kingdom if the head becomesemployed. More substantial effects occur if a second member of the house-hold becomes employed. The index for average expected duration(Table 10) falls when the head and someone else become employed byaround 20 per cent for Canada and the United States, 36 per cent for Germany,29 per cent for Sweden and 28 per cent for the United Kingdom.
– Lone-parent households appear to have significantly longer spells whencompared with the reference person. However, when the head becomes
Poverty dynamics in six OECD countries
43
OECD 2000
employed in lone-parent households, the share experiencing longer-termpoverty falls sharply, again emphasising the importance of employment.38
Other results shown in Tables 9 and 1039 suggest, as well, that:
– Those having experienced previous poverty spells tend to suffer longerspells of poverty – except in Canada – possibly picking up some unob-served personal or household characteristics;
– Lone parents do remain longer in poverty than other family groups, exceptin Canada.
– While the impact of the economic cycle on poverty duration is statistically sig-nificant – indicating that the length of poverty spells is shorter for people whofell into poverty in periods of strong economic growth – the size of the effect(“high-growth scenario”) is quantitatively small over the period considered;40
– Those who are in poor health or disabled suffer longer spells of poverty, butthe evidence is only statistically significant for the United States;41
– There is only weak evidence that children and people in retirement tend tosuffer longer poverty spells in all four countries.42 In Canada and Sweden oldage people are more likely to have shorter spells than other age groups;
– Higher levels of education of the household head or of the individual short-ens the length of poverty spells, but the evidence is strong only for theUnited States;43
– Women, taken by themselves and after controlling for lone-parenthood, donot have longer spells;
– In the United States, non-white households tend to have significantly longerpoverty spells: average duration is 10 per cent higher for these groups;
– The results for Canada differ somewhat from the other countries. The impor-tance of employment in reducing poverty persistence is also clear in theCanadian case. But certain groups (lone parents and people with previouspoverty experiences) which are worst off in the other four countries are notso in Canada.
Three main conclusions can be drawn from the results presented in Tables 9and 10. First, despite differences in poverty rates across countries, factors associ-ated with longer or shorter poverty spells are quite similar across the four countries.Second, access to employment reduces significantly the length of poverty spellsand this impact strengthens with the increase in the number of workers in thehousehold. Finally, certain groups (single-headed households, people with previ-ous poverty experience, and in the United States, non-white and low-educatedgroups as well) suffer longer spells of poverty, even when they have access toemployment. The extent of this effect is illustrated for the United States in thelast line which shows the outcome when these various characteristics are combined:
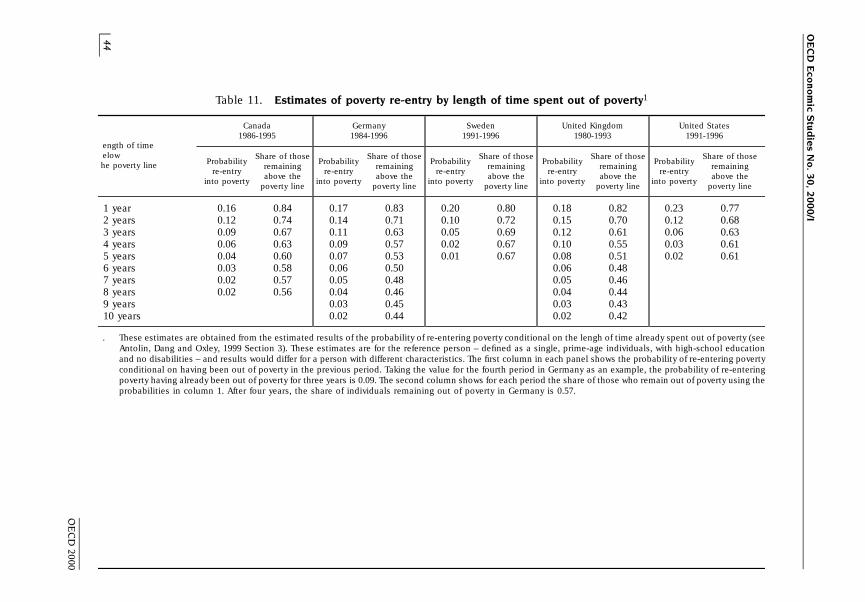
OE
CD
Eco
no
mic S
tud
ies N
o. 3
0, 2
00
0/I
44
OE
CD
2000
Table 11. Estimates of poverty re-entry by length of time spent out of poverty1
Canada Germany Sweden United Kingdom United States1986-1995 1984-1996 1991-1996 1980-1993 1991-1996
Share of those Share of those Share of those Share of those Share of thoseength of time
Probability Probability Probability Probability Probabilityremaining remaining remaining remaining remaining
elow
re-entry re-entry re-entry re-entry re-entryabove the above the above the above the above the
he poverty line
into poverty into poverty into poverty into poverty into povertypoverty line poverty line poverty line poverty line poverty line
1 year 0.16 0.84 0.17 0.83 0.20 0.80 0.18 0.82 0.23 0.772 years 0.12 0.74 0.14 0.71 0.10 0.72 0.15 0.70 0.12 0.683 years 0.09 0.67 0.11 0.63 0.05 0.69 0.12 0.61 0.06 0.634 years 0.06 0.63 0.09 0.57 0.02 0.67 0.10 0.55 0.03 0.615 years 0.04 0.60 0.07 0.53 0.01 0.67 0.08 0.51 0.02 0.616 years 0.03 0.58 0.06 0.50 0.06 0.487 years 0.02 0.57 0.05 0.48 0.05 0.468 years 0.02 0.56 0.04 0.46 0.04 0.449 years 0.03 0.45 0.03 0.4310 years 0.02 0.44 0.02 0.42
. These estimates are obtained from the estimated results of the probability of re-entering poverty conditional on the lengh of time already spent out of poverty (seeAntolin, Dang and Oxley, 1999 Section 3). These estimates are for the reference person – defined as a single, prime-age individuals, with high-school educationand no disabilities – and results would differ for a person with different characteristics. The first column in each panel shows the probability of re-entering povertyconditional on having been out of poverty in the previous period. Taking the value for the fourth period in Germany as an example, the probability of re-enteringpoverty having already been out of poverty for three years is 0.09. The second column shows for each period the share of those who remain out of poverty using theprobabilities in column 1. After four years, the share of individuals remaining out of poverty in Germany is 0.57.
Poverty dynamics in six OECD countries
45
OECD 2000
35 per cent of individuals belonging to a non-white, low-educated female-headedhousehold with previous poverty spells would remain in poverty after ten yearscompared with 10 per cent for the group represented by the reference person. If thelone parents were employed, the share of those remaining in poverty afterten years would fall to 28 per cent.
Re-entry into poverty
The preceding paragraphs have described how long people remain in poverty.But people may fall back into poverty after exiting, making the duration of singlespells a poor guide to assess total time spent in poverty. To measure the magnitudeof this effect, the risk of falling back into poverty, conditional on the time spentabove the poverty line, was also estimated using the same methods as for spells ofpoverty.
Table 11 shows the probability of returning to poverty, conditional on timespent above the poverty line (i.e. the hazard rate of re-entry) and the share of indi-viduals who remain above the poverty line (i.e. the survival rate). Thus, in Germany,for example, after one year out of poverty, around 17 per cent of those previouslypoor would be back into a new spell of poverty. Of those who remain out of povertyfor two years, 14 per cent would fall back into poverty during the next year. Takinga longer-term view, around 50 per cent of individuals would have been back intopoverty at least once over a ten-year period.
The factors that affect the length of time an individual will remain out of pov-erty are basically the same as those which explain the length of time an individualremains in poverty, but with the opposite sign.44 Therefore, an individual who hascharacteristics associated with long spells in poverty (those living in single-parenthouseholds, who have previous poverty spells, are low-educated (the UnitedStates) and who have low levels of employment) would face shorter spells out ofpoverty with a high risk of cycling back across the poverty threshold.
CONCLUSION
Panel data provide more complete information about poverty and permit afiner analysis of factors associated with entry and exit from poverty and the lengthof stay. One of the regularities of the results is that the factors that are important forpoverty dynamics seem much the same across countries (except for the greaterimportance of certain household and individual characteristics, such as educationand race, in the United States), even though static poverty rates can vary consider-ably. This limited evidence suggests that the underlying economic and policyforces driving poverty may have a great deal in common across countries, despite
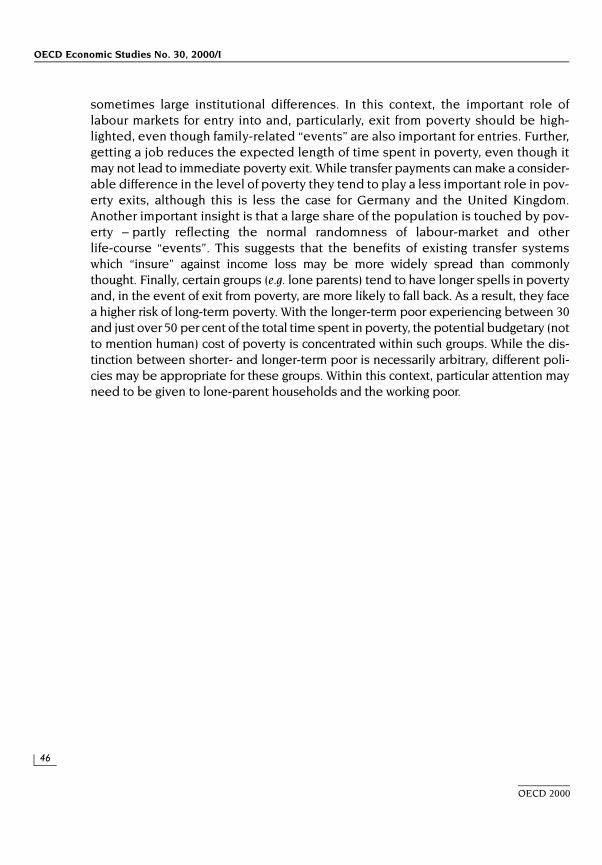
OECD Economic Studies No. 30, 2000/I
46
OECD 2000
sometimes large institutional differences. In this context, the important role oflabour markets for entry into and, particularly, exit from poverty should be high-lighted, even though family-related “events” are also important for entries. Further,getting a job reduces the expected length of time spent in poverty, even though itmay not lead to immediate poverty exit. While transfer payments can make a consider-able difference in the level of poverty they tend to play a less important role in pov-erty exits, although this is less the case for Germany and the United Kingdom.Another important insight is that a large share of the population is touched by pov-erty – partly reflecting the normal randomness of labour-market and otherlife-course “events”. This suggests that the benefits of existing transfer systemswhich “insure” against income loss may be more widely spread than commonlythought. Finally, certain groups (e.g. lone parents) tend to have longer spells in povertyand, in the event of exit from poverty, are more likely to fall back. As a result, they facea higher risk of long-term poverty. With the longer-term poor experiencing between 30and just over 50 per cent of the total time spent in poverty, the potential budgetary (notto mention human) cost of poverty is concentrated within such groups. While the dis-tinction between shorter- and longer-term poor is necessarily arbitrary, different poli-cies may be appropriate for these groups. Within this context, particular attention mayneed to be given to lone-parent households and the working poor.
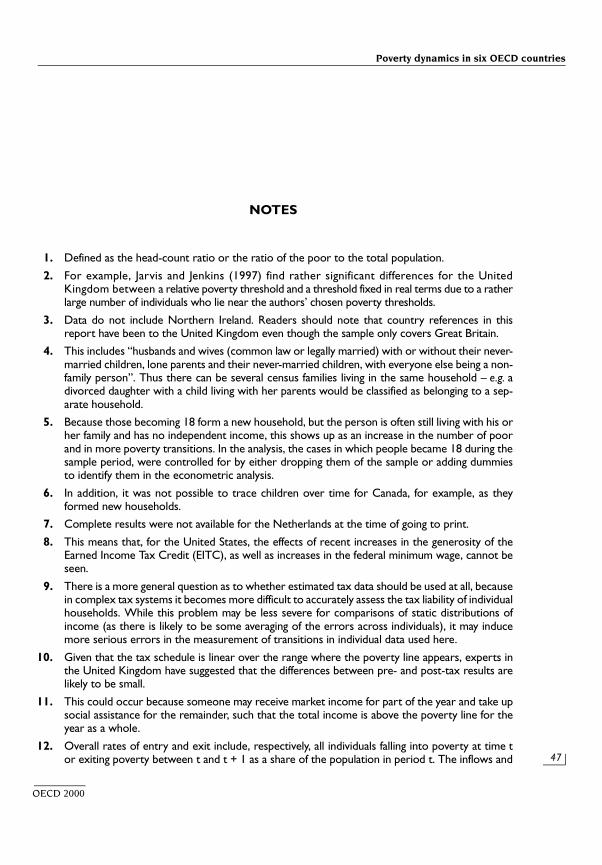
Poverty dynamics in six OECD countries
47
OECD 2000
NOTES
1. Defined as the head-count ratio or the ratio of the poor to the total population.
2. For example, Jarvis and Jenkins (1997) find rather significant differences for the UnitedKingdom between a relative poverty threshold and a threshold fixed in real terms due to a ratherlarge number of individuals who lie near the authors’ chosen poverty thresholds.
3. Data do not include Northern Ireland. Readers should note that country references in thisreport have been to the United Kingdom even though the sample only covers Great Britain.
4. This includes “husbands and wives (common law or legally married) with or without their never-married children, lone parents and their never-married children, with everyone else being a non-family person”. Thus there can be several census families living in the same household – e.g. adivorced daughter with a child living with her parents would be classified as belonging to a sep-arate household.
5. Because those becoming 18 form a new household, but the person is often still living with his orher family and has no independent income, this shows up as an increase in the number of poorand in more poverty transitions. In the analysis, the cases in which people became 18 during thesample period, were controlled for by either dropping them of the sample or adding dummiesto identify them in the econometric analysis.
6. In addition, it was not possible to trace children over time for Canada, for example, as theyformed new households.
7. Complete results were not available for the Netherlands at the time of going to print.
8. This means that, for the United States, the effects of recent increases in the generosity of theEarned Income Tax Credit (EITC), as well as increases in the federal minimum wage, cannot beseen.
9. There is a more general question as to whether estimated tax data should be used at all, becausein complex tax systems it becomes more difficult to accurately assess the tax liability of individualhouseholds. While this problem may be less severe for comparisons of static distributions ofincome (as there is likely to be some averaging of the errors across individuals), it may inducemore serious errors in the measurement of transitions in individual data used here.
10. Given that the tax schedule is linear over the range where the poverty line appears, experts inthe United Kingdom have suggested that the differences between pre- and post-tax results arelikely to be small.
11. This could occur because someone may receive market income for part of the year and take upsocial assistance for the remainder, such that the total income is above the poverty line for theyear as a whole.
12. Overall rates of entry and exit include, respectively, all individuals falling into poverty at time tor exiting poverty between t and t + 1 as a share of the population in period t. The inflows and
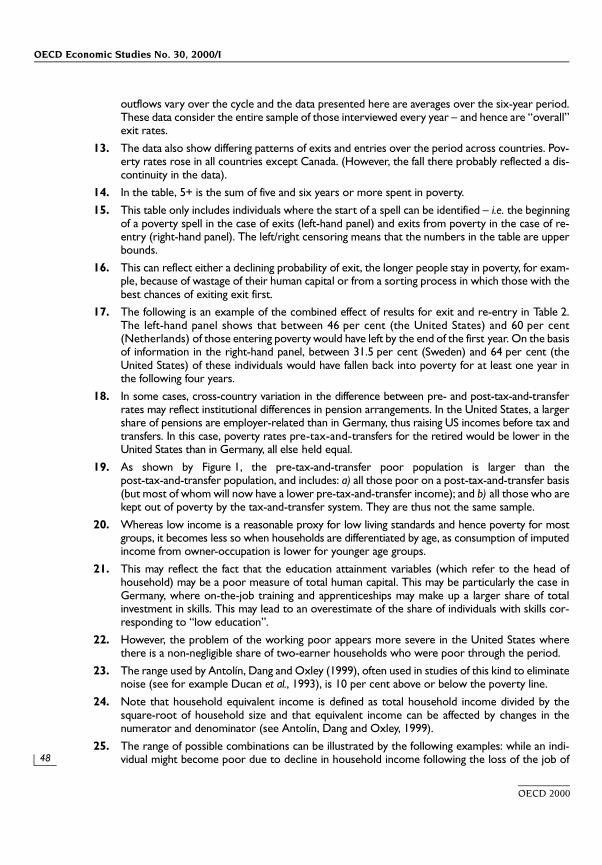
OECD Economic Studies No. 30, 2000/I
48
OECD 2000
outflows vary over the cycle and the data presented here are averages over the six-year period.These data consider the entire sample of those interviewed every year – and hence are “overall”exit rates.
13. The data also show differing patterns of exits and entries over the period across countries. Pov-erty rates rose in all countries except Canada. (However, the fall there probably reflected a dis-continuity in the data).
14. In the table, 5+ is the sum of five and six years or more spent in poverty.
15. This table only includes individuals where the start of a spell can be identified – i.e. the beginningof a poverty spell in the case of exits (left-hand panel) and exits from poverty in the case of re-entry (right-hand panel). The left/right censoring means that the numbers in the table are upperbounds.
16. This can reflect either a declining probability of exit, the longer people stay in poverty, for exam-ple, because of wastage of their human capital or from a sorting process in which those with thebest chances of exiting exit first.
17. The following is an example of the combined effect of results for exit and re-entry in Table 2.The left-hand panel shows that between 46 per cent (the United States) and 60 per cent(Netherlands) of those entering poverty would have left by the end of the first year. On the basisof information in the right-hand panel, between 31.5 per cent (Sweden) and 64 per cent (theUnited States) of these individuals would have fallen back into poverty for at least one year inthe following four years.
18. In some cases, cross-country variation in the difference between pre- and post-tax-and-transferrates may reflect institutional differences in pension arrangements. In the United States, a largershare of pensions are employer-related than in Germany, thus raising US incomes before tax andtransfers. In this case, poverty rates pre-tax-and-transfers for the retired would be lower in theUnited States than in Germany, all else held equal.
19. As shown by Figure 1, the pre-tax-and-transfer poor population is larger than thepost-tax-and-transfer population, and includes: a) all those poor on a post-tax-and-transfer basis(but most of whom will now have a lower pre-tax-and-transfer income); and b) all those who arekept out of poverty by the tax-and-transfer system. They are thus not the same sample.
20. Whereas low income is a reasonable proxy for low living standards and hence poverty for mostgroups, it becomes less so when households are differentiated by age, as consumption of imputedincome from owner-occupation is lower for younger age groups.
21. This may reflect the fact that the education attainment variables (which refer to the head ofhousehold) may be a poor measure of total human capital. This may be particularly the case inGermany, where on-the-job training and apprenticeships may make up a larger share of totalinvestment in skills. This may lead to an overestimate of the share of individuals with skills cor-responding to “low education”.
22. However, the problem of the working poor appears more severe in the United States wherethere is a non-negligible share of two-earner households who were poor through the period.
23. The range used by Antolín, Dang and Oxley (1999), often used in studies of this kind to eliminatenoise (see for example Ducan et al., 1993), is 10 per cent above or below the poverty line.
24. Note that household equivalent income is defined as total household income divided by thesquare-root of household size and that equivalent income can be affected by changes in thenumerator and denominator (see Antolín, Dang and Oxley, 1999).
25. The range of possible combinations can be illustrated by the following examples: while an indi-vidual might become poor due to decline in household income following the loss of the job of
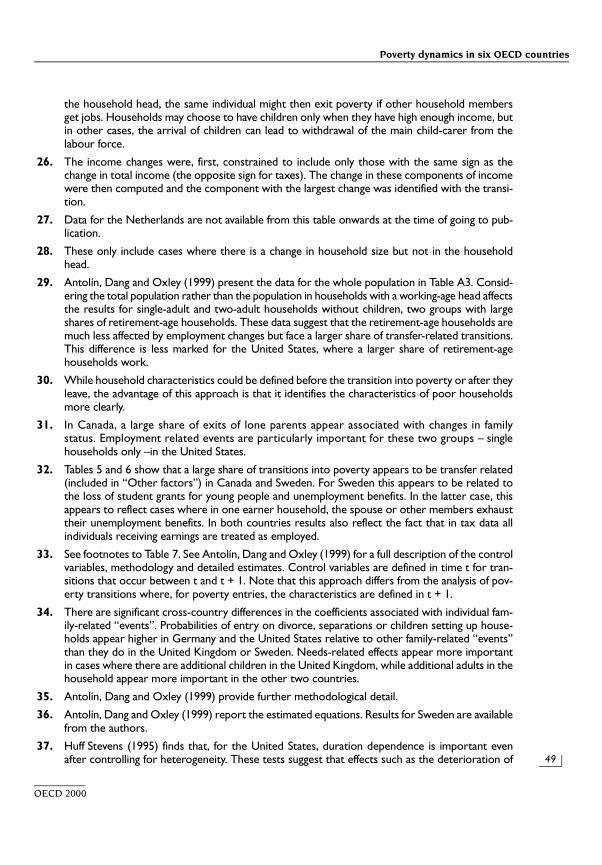
Poverty dynamics in six OECD countries
49
OECD 2000
the household head, the same individual might then exit poverty if other household membersget jobs. Households may choose to have children only when they have high enough income, butin other cases, the arrival of children can lead to withdrawal of the main child-carer from thelabour force.
26. The income changes were, first, constrained to include only those with the same sign as thechange in total income (the opposite sign for taxes). The change in these components of incomewere then computed and the component with the largest change was identified with the transi-tion.
27. Data for the Netherlands are not available from this table onwards at the time of going to pub-lication.
28. These only include cases where there is a change in household size but not in the householdhead.
29. Antolín, Dang and Oxley (1999) present the data for the whole population in Table A3. Consid-ering the total population rather than the population in households with a working-age head affectsthe results for single-adult and two-adult households without children, two groups with largeshares of retirement-age households. These data suggest that the retirement-age households aremuch less affected by employment changes but face a larger share of transfer-related transitions.This difference is less marked for the United States, where a larger share of retirement-agehouseholds work.
30. While household characteristics could be defined before the transition into poverty or after theyleave, the advantage of this approach is that it identifies the characteristics of poor householdsmore clearly.
31. In Canada, a large share of exits of lone parents appear associated with changes in familystatus. Employment related events are particularly important for these two groups – singlehouseholds only –in the United States.
32. Tables 5 and 6 show that a large share of transitions into poverty appears to be transfer related(included in “Other factors”) in Canada and Sweden. For Sweden this appears to be related tothe loss of student grants for young people and unemployment benefits. In the latter case, thisappears to reflect cases where in one earner household, the spouse or other members exhausttheir unemployment benefits. In both countries results also reflect the fact that in tax data allindividuals receiving earnings are treated as employed.
33. See footnotes to Table 7. See Antolín, Dang and Oxley (1999) for a full description of the controlvariables, methodology and detailed estimates. Control variables are defined in time t for tran-sitions that occur between t and t + 1. Note that this approach differs from the analysis of pov-erty transitions where, for poverty entries, the characteristics are defined in t + 1.
34. There are significant cross-country differences in the coefficients associated with individual fam-ily-related “events”. Probabilities of entry on divorce, separations or children setting up house-holds appear higher in Germany and the United States relative to other family-related “events”than they do in the United Kingdom or Sweden. Needs-related effects appear more importantin cases where there are additional children in the United Kingdom, while additional adults in thehousehold appear more important in the other two countries.
35. Antolín, Dang and Oxley (1999) provide further methodological detail.
36. Antolín, Dang and Oxley (1999) report the estimated equations. Results for Sweden are availablefrom the authors.
37. Huff Stevens (1995) finds that, for the United States, duration dependence is important evenafter controlling for heterogeneity. These tests suggest that effects such as the deterioration of
OECD Economic Studies No. 30, 2000/I
50
OECD 2000
human capital as the spell lengthens or changing attitudes to work or other effects may bepresent.
38. Canadian results do not show that people in lone parent households remain longer in povertythan other family groups. Social policies in Canada seem to target lone-parent households.
39. The estimated equations, reported in Antolín, Dang and Oxley (1999), point to all these results.40. The estimating equation included the growth rate of real GDP as a control variable. The impact
of the cycle was estimated by considering a 3 per cent growth rate and recalculating the valuesfor the individuals remaining in poverty.
41. Health variables are self-reporting evaluations which are always somewhat problematic. In thecase of the United States a variable controlling for whether the individual was disabled was used.
42. Bane and Ellwood (1986) suggest that children in poverty may also have difficulty in escaping pov-erty possibly because they tend to belong to larger families or, in a growing number of cases, tolone-parent households. Retired people, once they become poor, may also remain so for long peri-ods because they most often do not have the option of returning to work. The results do not pro-vide strong evidence supporting these hypotheses.
43. While the results point in this direction in Germany and the United Kingdom, they are not sta-tistically significant (see Antolín, Dang and Oxley, 1999).
44. However, the cycle does not seem to have any effect on the re-entry probability. Huff Stevens(1994) found the same for the United States. This may reflect that those who combine high levelsof re-entry and previous poverty spells are probably at the bottom of the employment ladder andare likely to find jobs only where there are extremely low levels of unemployment.
OECD Economic Studies No. 30, 2000/I
51
OECD 2000
BIBLIOGRAPHY
ANTOLIN, P. (1999),“Do displaced workers fare worse than other unemployed workers? A Euro-pean perspective”, OECD Economics Department Working Papers, forthcoming.
ANTOLIN, P., T.T. DANG and H. OXLEY (1999), “Poverty Dynamics in Four OECD Countries”,OECD Economics Department Working Papers No. 212.
ATKINSON, A.B., L. RAINWATER and T. SMEEDING (1995), Income Distribution in OECD Countries:The Evidence from the Luxembourg Income Study, OECD Social Policy Studies, No. 18.
BANE, M.J. and D. ELLWOOD (1986), “Slipping in and out of poverty: the dynamics of spells”, Jour-nal of Human Resources, pp. 1-23.
BANE, M.J. and D. ELLWOOD (1994), Welfare Realities, From Rhetoric to Reform, Harvard UniversityPress, Cambridge.
BLANK, R. (1989), “Analysing the length of welfare spells”, Journal of Public Economics, pp. 245-273.
BURNIAUX, J.M, T.T. DANG, D. FORE, M. FÖRSTER, M. MIRA D’ERCOLE and H. OXLEY (1998),“Income distribution and poverty in selected OECD countries” OECD Economics Department WorkingPapers.
CENSUS BUREAU (1998), “Dynamics of economic well-being, poverty 1993-94: Trap door? Revolv-ing door? Or both?” Current Population Reports, US Department of Commerce, July.
DUCAN, G. J., B. GUSTAFSSON, R. HAUSER, G. SCHMAUSS, H. MESSINGER, R. MUFFELS,B. NOLAN, and J-C RAY (1993), “Poverty dynamics in eight countries”, Population Economics.
FALLICK, B.C. (1996), “A review of the recent empirical literature on displaced workers”, Industrialand Labor Relations Review, 50(1), October, pp. 5-16.
FARBER, H.S. (1993), “The incidence and costs of job loss: 1982-91”, Brookings Papers on EconomicActivity: Microeconomics, No. 1, pp. 73-119.
GOTTSCHALK, P. and R. MOFFITT (1994),“Welfare dependence: concepts measures and trends”,American Economic Review, Vol. 84, No. 2, pp. 38-42.
HUFF STEVENS, A. (1994), “The dynamics of poverty spells; updating Bane and Ellwood”, AmericanEconomic Review, Vol. 84, No. 2, pp. 34-37.
HUFF STEVENS, A. (1995), “Climbing out of poverty, falling back in: measuring the persistenceof poverty over multiple spells”, National Bureau of Economic Research Working Paper,No. 5390.
JARVIS, S. and S. JENKINS (1997), “Low income dynamics in 1990s Britain”, Fiscal Studies, Vol. 18,No. 2, pp. 123-142.
JENKINS, S.P. (1995), “Easy estimation methods for discrete time duration models”, Oxford Bulletinof Economics and Statistics, 57(1), pp. 129-138.
OECD Economic Studies No. 30, 2000/I
52
OECD 2000
LANCASTER, T. (1990), “The econometric analysis of transition data”, Econometric SocietyMonographs 17, Cambridge University Press.
LAROCHE, M. (1997), “The persistence of low income spells in Canada, 1982-1993”, Department ofFinance, Economic and Fiscal Policy Branch Working Paper, No. 98.
MADDALA, G.S. (1997), Limited Dependent and Qualitative Variables in Econometrics, Cambridge Uni-versity Press, pp. 22-28.
MAURIN and CHAMBAZ (1996), “La persistance dans la pauvreté et son évolution : une évaluationsur données françaises”, Économie et Prévision, No. 122.
McKAY, S. (1998), “Exploring the dynamics of family change: lone parenthood in Great Britain”, inL. Leisering and R. Walker (eds.), The Dynamics of Modern Society, The Policy Press, University ofBristol.
MOFFITT, R. (1992), “Incentive effects of the US welfare system: a review”, The Journal of EconomicLiterature, Vol. 30, No. 1, March.
MOOD, M.A., F.A. GRAUBILL, and D.C. BOES (1974), Introduction to the Theory of Statistics,McGraw-Hill International Editions, series in Probability and Statistics.
OECD (1995), OECD Jobs Study, Paris.OECD (1997), Implementing the Jobs Strategy, Paris.OECD (1998), Employment Outlook, Paris.
OXLEY, H., J.M. BURNIAUX, T.T. DANG and M. MIRA D’ERCOLE (1999), “Income distribution andpoverty in selected OECD countries”, OECD Economic Studies, No. 29.
PINDYCK, R. and D. RUBINFELD (1981), Econometric Models and Economic Forecasts, MacGraw-Hill,pp. 273-315.
RUGGLES, P. (1990), Drawing the Line, Urban Institute Press, Washington, DC.
Related Documents