University of Pittsburgh Institute of Politics Health and Human Services Committee by Aaron Lauer with contributions from Moe Coleman and Karlie Haywood September 2016 POVERTY: BEYOND THE URBAN CORE brief policy

Welcome message from author
This document is posted to help you gain knowledge. Please leave a comment to let me know what you think about it! Share it to your friends and learn new things together.
Transcript

University of Pittsburgh Institute of Politics
Health and Human Services Committee by Aaron Lauer with contributions from Moe Coleman and Karlie Haywood September 2016
POVERTY:BEYOND THE URBAN CORE
briefpolicy
2 POVERTY: BEYOND THE URBAN CORE
TABLE OF CONTENTS
Letter from the Cochairs .....................................................3
Executive Summary .............................................................4
Poverty in the United States ................................................4
Poverty in Southwestern Pennsylvania ................................4
Challenges to Overcoming Poverty .....................................4
Education .......................................................................4
Housing .........................................................................4
Economic Inequality .......................................................5
Transportation ...............................................................5
Recommendations ..............................................................5
Education .......................................................................5
Housing .........................................................................5
Economic Inequality .......................................................5
Transportation ...............................................................5
Poverty in the United States ..............................................7
The Changing Face of American Poverty .............................7
The American Working Poor ...............................................8
Suburban Poverty ...............................................................8
Poverty in Southwestern Pennsylvania .............................9
Poverty within the City of Pittsburgh ..................................9
Suburban Poverty in Allegheny County .............................12
Rural Poverty ....................................................................14
Spotlight: Indiana County .............................................15
Challenges in Addressing Suburban Poverty..................16
Education .........................................................................16
Poverty among Students ..............................................16
Impact of Poverty on Students .....................................16
Unaffordability of Child Care ........................................19
Poverty and Education in Allegheny County .................19
Full Service Community Schools Working
to Address Community Poverty ....................................19
Housing ............................................................................19
Housing Affordability ...................................................19
Blight and Vacant Property ...........................................21
Economic Inequality .........................................................22
Increasing Income and Wealth Inequality .....................23
Shrinking Middle Class .................................................23
Loss of Economic Mobility ............................................23
Income and Wealth Gap
in Black and Hispanic Populations .................................23
Minimum Wage ...........................................................25
Gender Pay Inequity .....................................................25
Economic Mobility in the Pittsburgh Region .................26
Transportation ..................................................................26
Benefits of Transportation Mobility ..............................26
Burden of Transportation on Households
Living in Poverty ...........................................................26
Public Transportation in Allegheny County ...................26
Recommendations .............................................................28
Education .........................................................................28
Housing ............................................................................28
Economic Inequality .........................................................29
Transportation ..................................................................30
Appendix ............................................................................30
Measuring Income ............................................................30
Notes ...................................................................................32
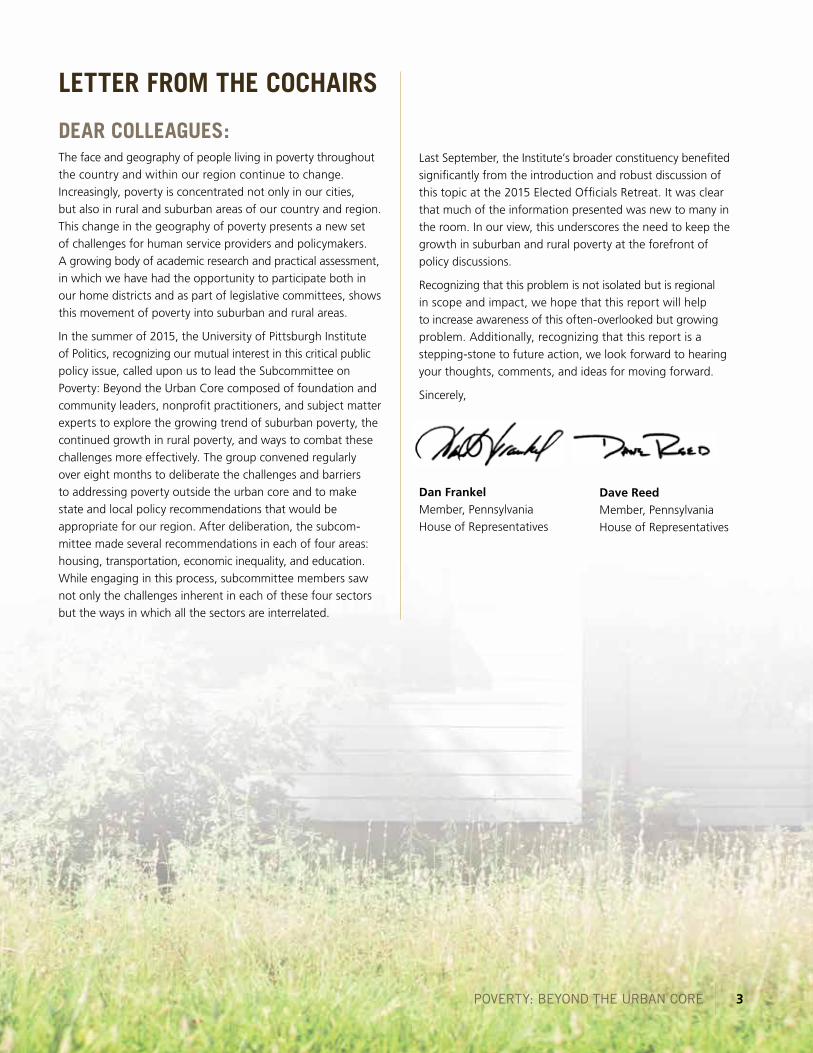
LETTER FROM THE COCHAIRS
DEAR COLLEAGUES:The face and geography of people living in poverty throughout
the country and within our region continue to change.
Increasingly, poverty is concentrated not only in our cities,
but also in rural and suburban areas of our country and region.
This change in the geography of poverty presents a new set
of challenges for human service providers and policymakers.
A growing body of academic research and practical assessment,
in which we have had the opportunity to participate both in
our home districts and as part of legislative committees, shows
this movement of poverty into suburban and rural areas.
In the summer of 2015, the University of Pittsburgh Institute
of Politics, recognizing our mutual interest in this critical public
policy issue, called upon us to lead the Subcommittee on
Poverty: Beyond the Urban Core composed of foundation and
community leaders, nonprofit practitioners, and subject matter
experts to explore the growing trend of suburban poverty, the
continued growth in rural poverty, and ways to combat these
challenges more effectively. The group convened regularly
over eight months to deliberate the challenges and barriers
to addressing poverty outside the urban core and to make
state and local policy recommendations that would be
appropriate for our region. After deliberation, the subcom-
mittee made several recommendations in each of four areas:
housing, transportation, economic inequality, and education.
While engaging in this process, subcommittee members saw
not only the challenges inherent in each of these four sectors
but the ways in which all the sectors are interrelated.
Last September, the Institute’s broader constituency benefited
significantly from the introduction and robust discussion of
this topic at the 2015 Elected Officials Retreat. It was clear
that much of the information presented was new to many in
the room. In our view, this underscores the need to keep the
growth in suburban and rural poverty at the forefront of
policy discussions.
Recognizing that this problem is not isolated but is regional
in scope and impact, we hope that this report will help
to increase awareness of this often-overlooked but growing
problem. Additionally, recognizing that this report is a
stepping-stone to future action, we look forward to hearing
your thoughts, comments, and ideas for moving forward.
Sincerely,
Dan Frankel Member, Pennsylvania
House of Representatives
Dave Reed
Member, Pennsylvania
House of Representatives
POVERTY: BEYOND THE URBAN CORE 3

4 POVERTY: BEYOND THE URBAN CORE
EXECUTIVE SUMMARY
POVERTY IN THE UNITED STATESSince President Lyndon B. Johnson began the War on Poverty
more than 50 years ago, public, private, and nonprofit entities
have implemented a range of programs and policies to revital-
ize struggling communities. Through programs such as social
security, millions of our country’s seniors have escaped the
grip of poverty. However, a countervailing trend has occurred
in the number of children in poverty. Additionally, poverty has
remained an intractable issue for American families and house-
holds headed by single, non-White mothers.
For the 10.6 million Americans constituting the working poor,
hard work and employment do not provide a route out of pov-
erty.1 The working poor population can take many forms but is
more likely to consist of individuals who are women, Hispanic
or Black, work part-time, have low levels of education, and
have children. The working poor population’s transition into
the middle class is difficult because of several factors, including
stagnant wages, unavoidable periods of unemployment, and
involuntary part-time employment.2
In recent decades, the United States has seen a structural shift
in poverty in its geography. Although traditionally viewed as
an urban issue, over the past decade poverty has been increas-
ingly concentrated in the suburbs. Poverty grew 64 percent
in American suburbs between 2000 and 2011.3 In fact, more
people in poverty now live in the suburbs (16.5 million) than
live in cities (13.4 million), which means about 55 percent of
the people living in poverty reside outside cities. 4
Reasons behind this trend include:
• stagnant wages,
• faster population growth in suburbs than in cities,
• low-wage workers becoming increasingly suburban,
• more affordable housing options available in
suburban communities,
• an increasing population of immigrants settling
in the suburbs, and
• the suburbs being affected first and hardest
by the Great Recession.
POVERTY IN SOUTHWESTERN PENNSYLVANIASouthwestern Pennsylvania is experiencing a shift of its more
than 740,000 living in poverty and near poverty away from its
urban core in Pittsburgh to the suburbs, a trend that is occurring
in suburban areas across the country.5 Sixty-one percent of the
people living in poverty in Allegheny County and 79 percent
of those living in poverty in the entire Pittsburgh metropolitan
statistical area reside in suburbs.6 Between 2002 and 2013,
Allegheny County experienced a 3 percent rise in poverty
occurring outside the City of Pittsburgh.7
Even with this shift, the City of Pittsburgh has almost 23 percent
of its residents living at the poverty level, and 43 percent of its
residents are living in near poverty.8 Poverty levels in the city
are still well above the poverty levels in the Pittsburgh region
(12.1 percent) and the commonwealth (13.3 percent). 9,10
Between 2010 and 2014, more than 14 percent of all house-
holds in rural Pennsylvania still had incomes that fell below the
poverty level.11 Moreover, in 2008, 19 percent of individuals
living in rural areas were classified as working poor.12
CHALLENGES TO OVERCOMING POVERTYEDUCATIONThe American public school system has provided a pathway
out of poverty for countless Americans. However, students
living in poverty are increasingly afforded fewer educational
opportunities in childhood than their wealthy peers. Living in
poverty has profound negative effects on children in a variety
of educational indicators, including enrollment in rigorous
courses, school engagement, GPA, test scores, and graduation
rates. These outcomes cause long-term harm for both the
children in poverty and their communities.
HOUSINGThe cost of housing is becoming an increasing burden for
families living in poverty. Housing represents the greatest
single household expense, and for families in the lowest
income quintile, it can represent more than 40 percent
of their household expenditures.13 In light of this burden,
when families lack affordable housing options or live in
neighborhoods experiencing rising housing costs, it can
often be difficult for them to maintain housing, forcing
households living in poverty to relocate. Housing instability
can have serious long-term consequences for children,
including increased high school dropout rates and lower
postsecondary educational attainment.14 By stabilizing
housing, regions can stabilize families and communities.
POVERTY: BEYOND THE URBAN CORE 5
ECONOMIC INEQUALITYThe American dream is based on the premise that all people,
even if they are from the humblest of beginnings, can at least
earn a comfortable living for themselves and their families
if they are only willing to work hard. Although this may
have been true for many families in postwar America, it is
increasingly no longer the case for Americans living in poverty
or often even for those in the middle class. Since the late
1980s, the American economy has experienced an increasing
concentration of income and wealth at the very top of society,
a shrinking middle class, a loss of economic mobility, and an
increasing divergence in the economic success of White and
Black individuals. Additionally, contributing to this problem
has been a federal and Pennsylvania minimum wage that has
been unchanged since 2009 and a gender pay gap that has
served as a major barrier for women to lift their families out
of poverty.
TRANSPORTATIONAccess to transportation is a fundamental component in
escaping poverty. Without adequate transportation, individuals
and families cannot access what is necessary to escape poverty,
such as employment, education, health care, and human
services. Transportation allows people to take advantage of
opportunities not only in their own communities but in the
broader regions in which they live.
RECOMMENDATIONSAlthough the issue of poverty can seem overwhelming and
intractable, the reality is that there are simple, concrete steps
that local governments, the Commonwealth, human service
provides, community leaders, and other stakeholders can take
to assist those who live in poverty in our region. By embracing
these solutions, we will not only provide hope to those who
live quiet lives of desperation but also enrich and expand our
region’s pool of human talent by unshackling our neighbors
who otherwise would be bound to lives of poverty.
EDUCATION1. Support and invest in wraparound, full-service community
school models for suburban areas with high poverty levels,
where schools are not only sources of academic program-
ming but also access points for comprehensive academic,
social, and health services.
2. Examine and evaluate the varying and disparate costs to
districts for students attending charter schools, especially
special education students.
3. Make teacher education programs for higher education
and continuing education more contextually and socially
informed with regard to supporting high need populations.
4. Promote our region as a destination city for progressive
educators and seek to attract the best and brightest teachers
from across the country.
HOUSING5. Improve data and information about housing markets,
especially in Allegheny County, to shape strategies around
housing development.
6. Establish better linkages among transportation, housing,
and employment opportunities in Allegheny County and
surrounding areas.
7. Develop better supportive housing options for residents
with disabilities.
8. Work to better retain existing affordable housing options
through the preservation and maintenance of existing
affordable housing.
ECONOMIC INEQUALITY9. Improve opportunities for upward mobility by eliminating
benefits cliffs.
10. Consider the positive impact of an increase to the
minimum wage in Pennsylvania.
11. Establish a Pennsylvania Earned Income Tax Credit that
would supplement the federal Earned Income Tax Credit.
12. Examine policies to address effectively the inequality in
earnings between genders.
13. Increase communication and sharing of data between
state level agencies and local governments and school
districts to enable increased evaluation and accountability
of human services programs.
14. Encourage the development of financial literacy programming
in the education and nonprofit sectors for individuals at
all income levels.
TRANSPORTATION15. Develop land use policies that promote transit-oriented
development and active transportation.
16. Complement the Port Authority’s system by expanding
microtransit throughout the county using the Heritage
Community Transportation model.
17. Expand suburban park and ride facilities in areas farther
from the county’s urban core.
18. Offer broader public transportation subsidies for riders
living in poverty.

6 POVERTY: BEYOND THE URBAN CORE
POVERTY: BEYOND THE URBAN CORE 7
POVERTY IN THE UNITED STATES“What does this poverty mean to those who endure it? It
means a daily struggle to secure the necessities for even a
meager existence. It means that the abundance, the comforts,
the opportunities they see all around them are beyond their
grasp. Worst of all, it means hopelessness for the young.”15
This is how President Lyndon B. Johnson characterized poverty
in 1964. To this day, poverty not only tears at the social fabric
that binds our society together, it fundamentally continues to
represent a terrible waste of limited human resources.
THE CHANGING FACE OF AMERICAN POVERTY Since President Johnson began the War on Poverty more
than 50 years ago, public, private, and nonprofit entities have
implemented a wide range of programs and policies designed
to revitalize struggling communities. Unfortunately, these
initiatives have had limited success in changing the rate of
individuals and families living in poverty. However, the United
States has seen a change during this time frame in which par-
ticular demographic groups are living in poverty.
Since the 1960s, the United States has seen a structural shift in
poverty away from the elderly population and to working-age
Americans. Between 1959 and 2015, the United States has
experienced a 16.5 percent increase in the number of individuals
between ages 18 and 64 who are living in poverty.16,17
This shift resulted in large part from the implementation
of government programs, particularly the expansion and
inflation indexing of social security benefits during the 1970s.
Following the inception of these programs, the rate of poverty
for Americans age 65 and older dropped steadily from 28.5
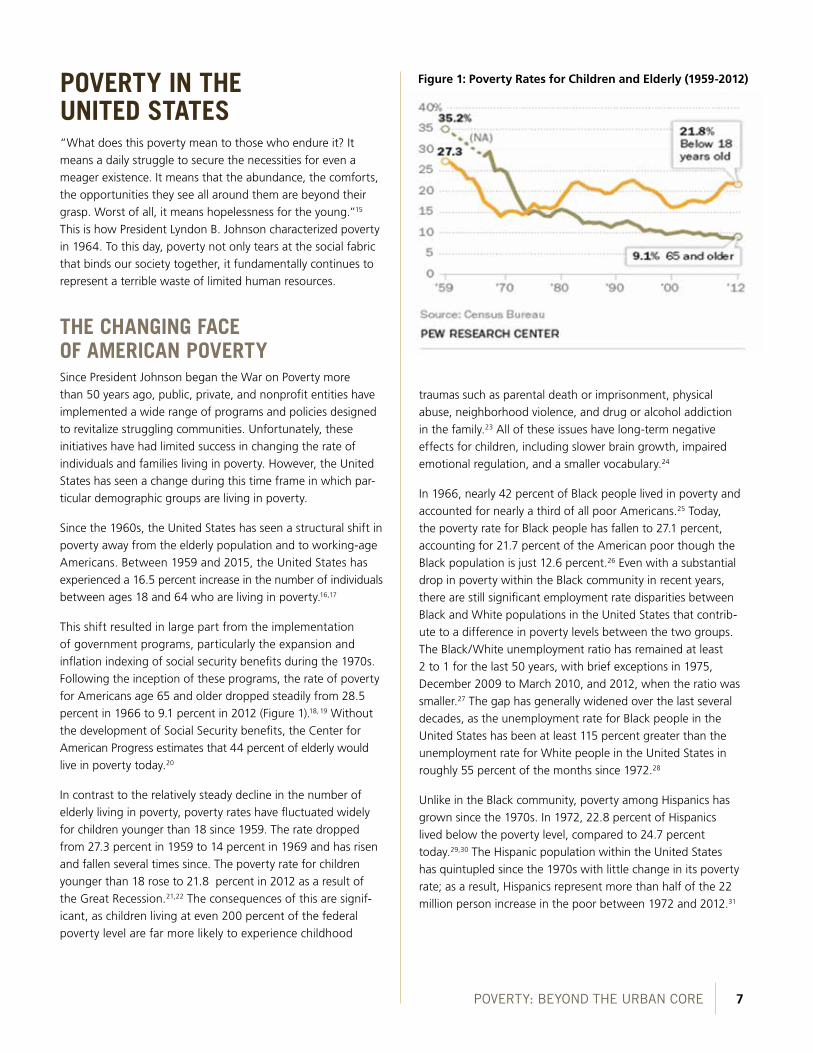
percent in 1966 to 9.1 percent in 2012 (Figure 1).18, 19 Without
the development of Social Security benefits, the Center for
American Progress estimates that 44 percent of elderly would
live in poverty today.20
In contrast to the relatively steady decline in the number of
elderly living in poverty, poverty rates have fluctuated widely
for children younger than 18 since 1959. The rate dropped
from 27.3 percent in 1959 to 14 percent in 1969 and has risen
and fallen several times since. The poverty rate for children
younger than 18 rose to 21.8 percent in 2012 as a result of
the Great Recession.21,22 The consequences of this are signif-
icant, as children living at even 200 percent of the federal
poverty level are far more likely to experience childhood
traumas such as parental death or imprisonment, physical
abuse, neighborhood violence, and drug or alcohol addiction
in the family.23 All of these issues have long-term negative
effects for children, including slower brain growth, impaired
emotional regulation, and a smaller vocabulary.24
In 1966, nearly 42 percent of Black people lived in poverty and
accounted for nearly a third of all poor Americans.25 Today,
the poverty rate for Black people has fallen to 27.1 percent,
accounting for 21.7 percent of the American poor though the
Black population is just 12.6 percent.26 Even with a substantial
drop in poverty within the Black community in recent years,
there are still significant employment rate disparities between
Black and White populations in the United States that contrib-
ute to a difference in poverty levels between the two groups.
The Black/White unemployment ratio has remained at least
2 to 1 for the last 50 years, with brief exceptions in 1975,
December 2009 to March 2010, and 2012, when the ratio was
smaller.27 The gap has generally widened over the last several
decades, as the unemployment rate for Black people in the
United States has been at least 115 percent greater than the
unemployment rate for White people in the United States in
roughly 55 percent of the months since 1972.28
Unlike in the Black community, poverty among Hispanics has
grown since the 1970s. In 1972, 22.8 percent of Hispanics
lived below the poverty level, compared to 24.7 percent
today.29,30 The Hispanic population within the United States
has quintupled since the 1970s with little change in its poverty
rate; as a result, Hispanics represent more than half of the 22
million person increase in the poor between 1972 and 2012.31
Figure 1: Poverty Rates for Children and Elderly (1959-2012)
8 POVERTY: BEYOND THE URBAN CORE
In the last five decades, the structure of families experiencing
poverty has changed. In 1973, more than half (51.4 percent)
of the families experiencing poverty were married-couple
families.32 Today, 50.3 percent of families experiencing poverty
are female headed and only 38.9 percent are headed by a
married couple.33 The growth in births to unmarried parents
since the 1970s is correlated with the educational backgrounds
of the mothers, although unmarried, college-educated women
have maintained a relatively low level of births. Women who
have only a high school diploma or less have about 40 percent
more unmarried births.34
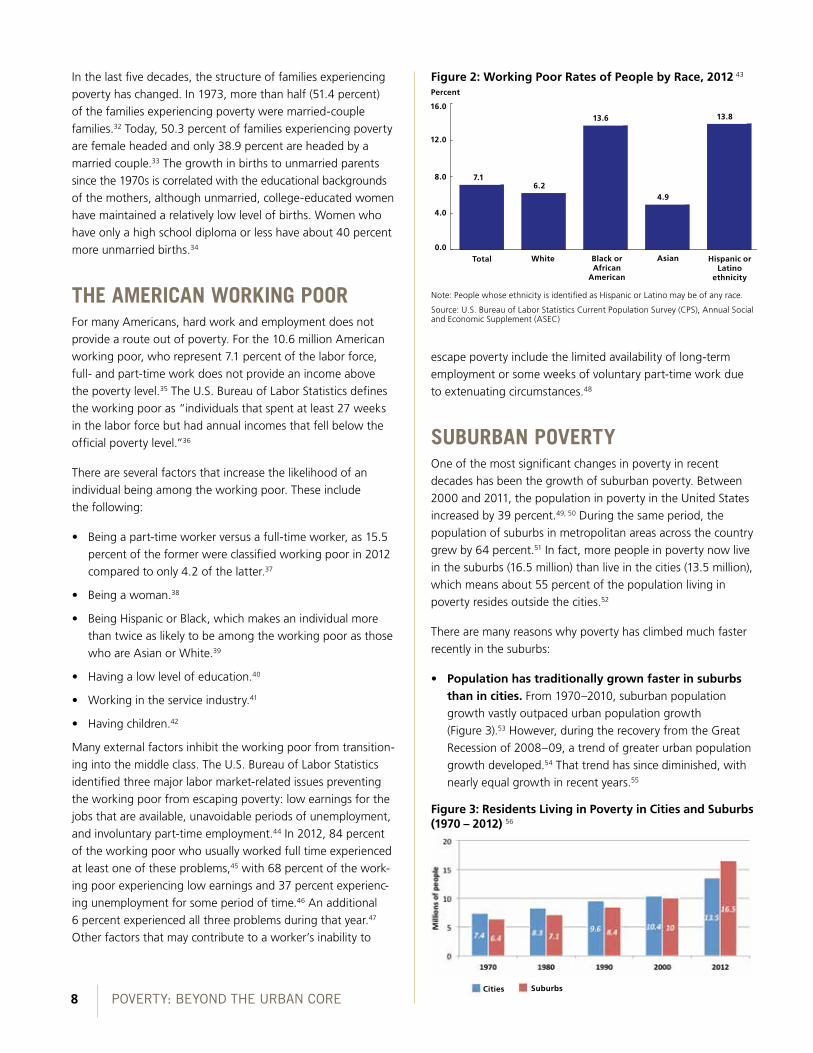
THE AMERICAN WORKING POORFor many Americans, hard work and employment does not
provide a route out of poverty. For the 10.6 million American
working poor, who represent 7.1 percent of the labor force,
full- and part-time work does not provide an income above
the poverty level.35 The U.S. Bureau of Labor Statistics defines
the working poor as “individuals that spent at least 27 weeks
in the labor force but had annual incomes that fell below the
official poverty level.”36
There are several factors that increase the likelihood of an
individual being among the working poor. These include
the following:
• Being a part-time worker versus a full-time worker, as 15.5
percent of the former were classified working poor in 2012
compared to only 4.2 of the latter.37
• Being a woman.38
• Being Hispanic or Black, which makes an individual more
than twice as likely to be among the working poor as those
who are Asian or White.39
• Having a low level of education.40
• Working in the service industry.41
• Having children.42
Many external factors inhibit the working poor from transition-
ing into the middle class. The U.S. Bureau of Labor Statistics
identified three major labor market-related issues preventing
the working poor from escaping poverty: low earnings for the
jobs that are available, unavoidable periods of unemployment,
and involuntary part-time employment.44 In 2012, 84 percent
of the working poor who usually worked full time experienced
at least one of these problems,45 with 68 percent of the work-
ing poor experiencing low earnings and 37 percent experienc-
ing unemployment for some period of time.46 An additional
6 percent experienced all three problems during that year.47
Other factors that may contribute to a worker’s inability to
escape poverty include the limited availability of long-term
employment or some weeks of voluntary part-time work due
to extenuating circumstances.48
SUBURBAN POVERTYOne of the most significant changes in poverty in recent
decades has been the growth of suburban poverty. Between
2000 and 2011, the population in poverty in the United States
increased by 39 percent.49, 50 During the same period, the
population of suburbs in metropolitan areas across the country
grew by 64 percent.51 In fact, more people in poverty now live
in the suburbs (16.5 million) than live in the cities (13.5 million),
which means about 55 percent of the population living in
poverty resides outside the cities.52
There are many reasons why poverty has climbed much faster
recently in the suburbs:
• Population has traditionally grown faster in suburbs than in cities. From 1970–2010, suburban population
growth vastly outpaced urban population growth
(Figure 3).53 However, during the recovery from the Great
Recession of 2008–09, a trend of greater urban population
growth developed.54 That trend has since diminished, with
nearly equal growth in recent years.55
Figure 3: Residents Living in Poverty in Cities and Suburbs (1970 – 2012) 56
Cities Suburbs
Note: People whose ethnicity is identified as Hispanic or Latino may be of any race. Source: U.S. Bureau of Labor Statistics Current Population Survey (CPS), Annual Social and Economic Supplement (ASEC)
Figure 2: Working Poor Rates of People by Race, 2012 43
4 BLS Reports March 2014 www.bls.gov
A P R O F I L E O F T H E W O R K I N G P O O R , 2 0 1 2
7.16.2
13.6
4.9
13.8
0.0
4.0
8.0
12.0
16.0
Total White Black or AfricanAmerican
Asian Hispanic or Latinoethnicity
Percent
Working-poor rates of people in the labor force for 27 weeks or more by race and Hispanic or Latino ethnicity, 2012
Note: People whose ethnicity is identified as Hispanic or Latino may be of any race.Source: U.S. Bureau of Labor Statistics, Current Population Survey (CPS), Annual Social and Economic Supplement (ASEC).
Chart 2
White Black or African
American
Total Asian Hispanic or Latino
ethnicity
7.16.2
13.6
4.9
13.8
Percent
16.0
12.0
8.0
4.0
0.0
POVERTY: BEYOND THE URBAN CORE 9
• Low-wage workers are increasingly suburban. Sixty-seven percent of workers in low-wage occupations
(where at least one-quarter of workers make less than
$10 per hour) live in the suburbs, as many low-wage
occupations are far more likely to be based in suburban
areas. 57 Sixty-three percent of workers employed in
building and ground cleaning and maintenance occupations
(2.3 million workers) and 71 percent of workers in sales and
related occupations (largest low-wage occupational sector
at 7.4 million workers) live in the suburbs.58
• In many cases, housing has become relatively more affordable in suburban municipalities. In 2008, nearly
half of all households with housing choice vouchers (which
subsidize housing for families, the elderly, and people with
disabilities living in poverty) in major metro areas were
living in suburban municipalities.59 Additionally, a recent
trend of Americans moving into the urban core has driven
up housing prices there, pricing many existing residents
out of urban areas and into the suburbs.
• Immigrants are increasingly settling in the suburbs. In the suburbs of 78 of the 97 largest metro areas, the
foreign-born populations grew faster than the overall
populations.60 For many smaller Northeastern and Mid-
western cities, the immigrant influx has helped to offset
the economic decline resulting from both of those regions’
aging populations.61
• The Great Recession affected suburbs first and hardest. The two industries most affected by the Great Recession—
construction and manufacturing—are far more likely to be
located in suburban rather than urban areas.62
POVERTY IN SOUTHWESTERN PENNSYLVANIASouthwestern Pennsylvania is experiencing many of the
same poverty trends that are occurring in regions across the
United States. The Pittsburgh region has persistent poverty
in the urban core and rural areas and growing poverty within
Pittsburgh’s suburban communities. Poverty levels in the city
are still well above poverty levels in the Pittsburgh region
(12.1 percent) and the commonwealth (13.3 percent).63,64
However, in the Pittsburgh region, as elsewhere, a greater
number of individuals in poverty live outside the urban core;
61 percent of poverty in Allegheny County occurs outside
the city. Further, 79 percent of poverty in the seven-county
Pittsburgh metropolitan statistical area exists outside the
Pittsburgh city limits.65 Pennsylvania’s rural areas are home
to high levels of poverty and working poor compared to the
commonwealth’s urban centers.
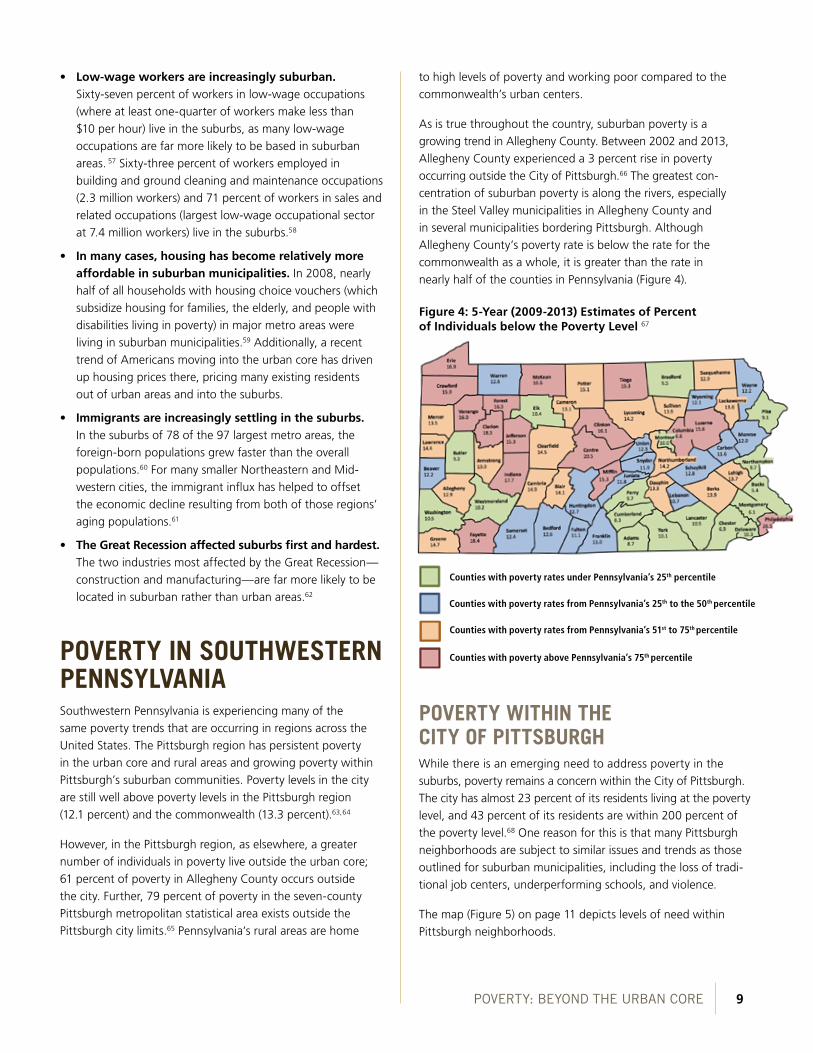
As is true throughout the country, suburban poverty is a
growing trend in Allegheny County. Between 2002 and 2013,
Allegheny County experienced a 3 percent rise in poverty
occurring outside the City of Pittsburgh.66 The greatest con-
centration of suburban poverty is along the rivers, especially
in the Steel Valley municipalities in Allegheny County and
in several municipalities bordering Pittsburgh. Although
Allegheny County’s poverty rate is below the rate for the
commonwealth as a whole, it is greater than the rate in
nearly half of the counties in Pennsylvania (Figure 4).
Figure 4: 5-Year (2009-2013) Estimates of Percent of Individuals below the Poverty Level 67
Counties with poverty above Pennsylvania’s 75th percentile
Counties with poverty rates under Pennsylvania’s 25th percentile
Counties with poverty rates from Pennsylvania’s 51st to 75th percentile
Counties with poverty rates from Pennsylvania’s 25th to the 50th percentile
POVERTY WITHIN THE CITY OF PITTSBURGHWhile there is an emerging need to address poverty in the
suburbs, poverty remains a concern within the City of Pittsburgh.
The city has almost 23 percent of its residents living at the poverty
level, and 43 percent of its residents are within 200 percent of
the poverty level.68 One reason for this is that many Pittsburgh
neighborhoods are subject to similar issues and trends as those
outlined for suburban municipalities, including the loss of tradi-
tional job centers, underperforming schools, and violence.
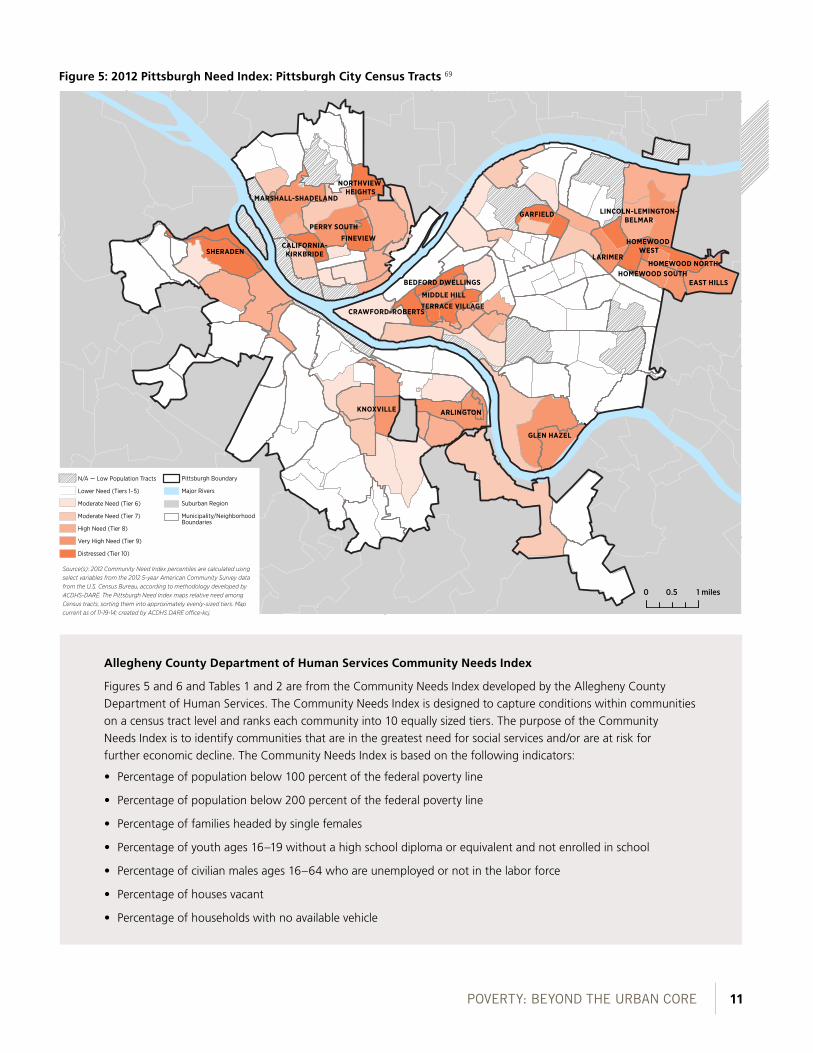
The map (Figure 5) on page 11 depicts levels of need within
Pittsburgh neighborhoods.

10 POVERTY: BEYOND THE URBAN CORE
POVERTY: BEYOND THE URBAN CORE 11
Figure 5: 2012 Pittsburgh Need Index: Pittsburgh City Census Tracts 69
Allegheny County Department of Human Services Community Needs Index
Figures 5 and 6 and Tables 1 and 2 are from the Community Needs Index developed by the Allegheny County
Department of Human Services. The Community Needs Index is designed to capture conditions within communities
on a census tract level and ranks each community into 10 equally sized tiers. The purpose of the Community
Needs Index is to identify communities that are in the greatest need for social services and/or are at risk for
further economic decline. The Community Needs Index is based on the following indicators:
• Percentage of population below 100 percent of the federal poverty line
• Percentage of population below 200 percent of the federal poverty line
• Percentage of families headed by single females
• Percentage of youth ages 16–19 without a high school diploma or equivalent and not enrolled in school
• Percentage of civilian males ages 16–64 who are unemployed or not in the labor force
• Percentage of houses vacant
• Percentage of households with no available vehicle
0 1 miles0.5
Pittsburgh Boundary
Major Rivers
Suburban Region
Municipality/Neighborhood Boundaries
N/A — Low Population Tracts
Lower Need (Tiers 1–5)
Moderate Need (Tier 6)
Moderate Need (Tier 7)
High Need (Tier 8)
Very High Need (Tier 9)
Distressed (Tier 10)
2012 PITTSBURGH NEED INDEX: CITY CENSUS TRACTS
Source(s): 2012 Community Need Index percentiles are calculated using select variables from the 2012 5-year American Community Survey data from the U.S. Census Bureau, according to methodology developed by ACDHS-DARE. The Pittsburgh Need Index maps relative need among Census tracts, sorting them into approximately evenly-sized tiers. Map current as of 11-19-14; created by ACDHS DARE o�ce-kcj.
PERRY SOUTH
MARSHALL-SHADELAND
NORTHVIEW HEIGHTS
SHERADENCALIFORNIA-
KIRKBRIDE
FINEVIEW
GARFIELD
BEDFORD DWELLINGS
MIDDLE HILLTERRACE VILLAGE
CRAWFORD-ROBERTS
KNOXVILLE ARLINGTON
GLEN HAZEL
LARIMER
LINCOLN-LEMINGTON-BELMAR
HOMEWOOD WEST
HOMEWOOD NORTH
EAST HILLSHOMEWOOD SOUTH
12 POVERTY: BEYOND THE URBAN CORE
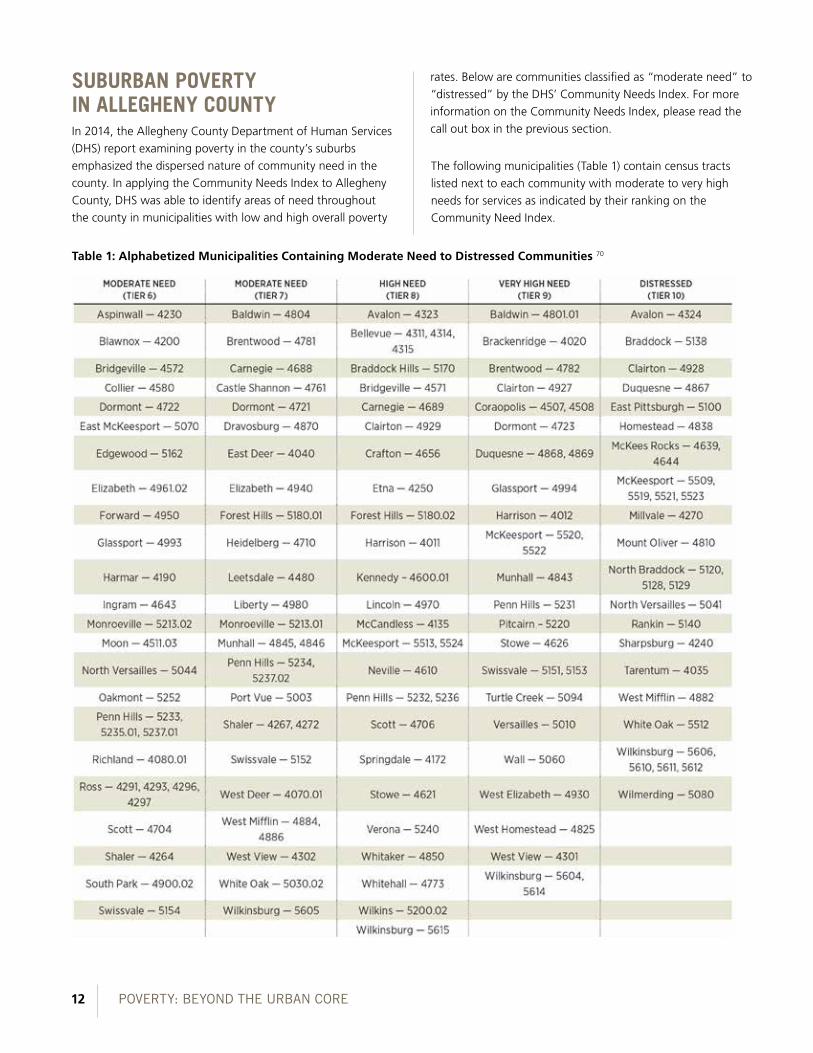
SUBURBAN POVERTY IN ALLEGHENY COUNTYIn 2014, the Allegheny County Department of Human Services
(DHS) report examining poverty in the county’s suburbs
emphasized the dispersed nature of community need in the
county. In applying the Community Needs Index to Allegheny
County, DHS was able to identify areas of need throughout
the county in municipalities with low and high overall poverty
Table 1: Alphabetized Municipalities Containing Moderate Need to Distressed Communities 70
rates. Below are communities classified as “moderate need” to
“distressed” by the DHS’ Community Needs Index. For more
information on the Community Needs Index, please read the
call out box in the previous section.
The following municipalities (Table 1) contain census tracts
listed next to each community with moderate to very high
needs for services as indicated by their ranking on the
Community Need Index.
POVERTY: BEYOND THE URBAN CORE 13
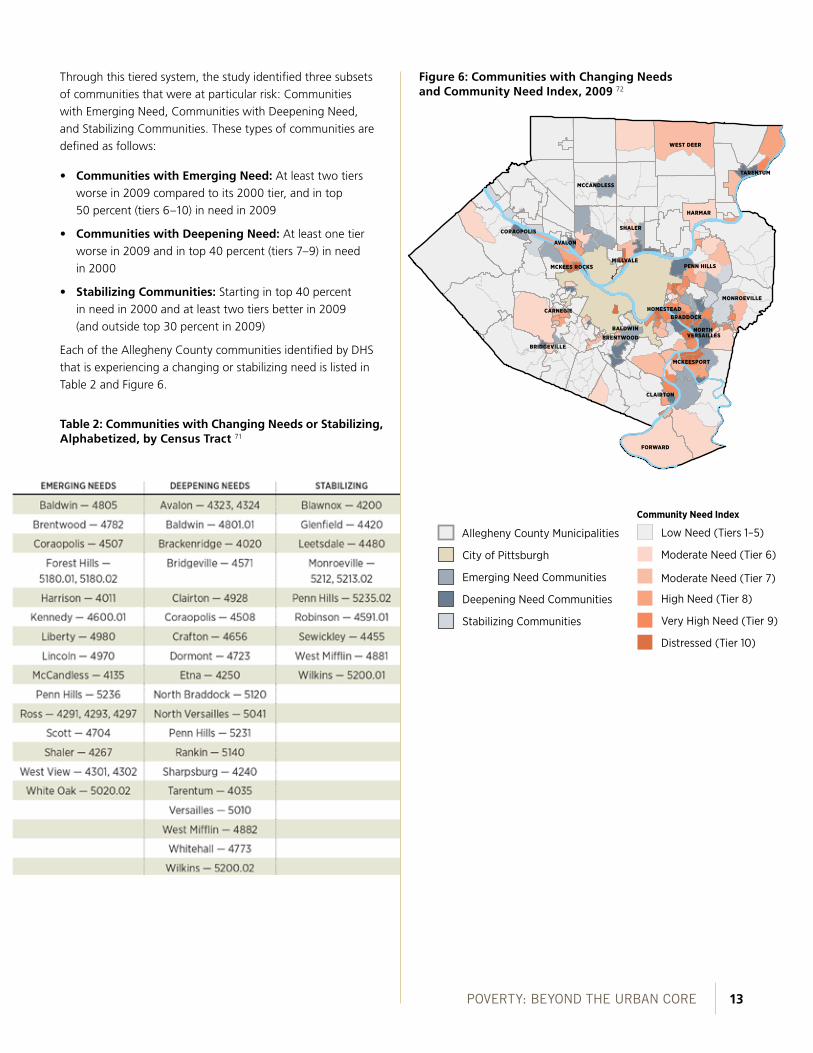
Through this tiered system, the study identified three subsets
of communities that were at particular risk: Communities
with Emerging Need, Communities with Deepening Need,
and Stabilizing Communities. These types of communities are
defined as follows:
• Communities with Emerging Need: At least two tiers
worse in 2009 compared to its 2000 tier, and in top
50 percent (tiers 6–10) in need in 2009
• Communities with Deepening Need: At least one tier
worse in 2009 and in top 40 percent (tiers 7–9) in need
in 2000
• Stabilizing Communities: Starting in top 40 percent
in need in 2000 and at least two tiers better in 2009
(and outside top 30 percent in 2009)
Each of the Allegheny County communities identified by DHS
that is experiencing a changing or stabilizing need is listed in
Table 2 and Figure 6.
Table 2: Communities with Changing Needs or Stabilizing, Alphabetized, by Census Tract 71
Figure 6: Communities with Changing Needs and Community Need Index, 2009 72
LEGEND
■ Allegheny County Municipalities
■ City of Pittsburgh
■ Emerging Need Communities
■ Deepening Need Communities
■ Stabilizing Communities
Community Need Index
■ Low Need (Tiers 1–5)
■ Moderate Need (Tier 6)
■ Moderate Need (Tier 7)
■ High Need (Tier 8)
■ Very High Need (Tier 9)
■ Distressed (Tier 10)
WEST DEER
TARENTUM
HARMAR
MCCANDLESS
PENN HILLS
MONROEVILLE
FORWARD
SHALERCORAOPOLIS
AVALON
MILLVALEMCKEES ROCKS
CARNEGIE
BRIDGEVILLEBRENTWOOD
BALDWIN
BRADDOCKHOMESTEAD
CLAIRTON
NORTH VERSAILLES
MCKEESPORT

14 POVERTY: BEYOND THE URBAN CORE
RURAL POVERTY In addition to poverty occurring within Pittsburgh and its
suburbs, rural poverty remains a persistent issue for both the
region and Pennsylvania as a whole. Between the years 1970
and 1990, the rural population in Pennsylvania increased by
10 percent.73a This growth occurred unevenly across rural
areas, with just five counties accountable for 73 percent of
the growth; 14 experienced a loss in population.74b However,
after 1990, even as Pennsylvania’s total population continued
to gradually increase, the population of rural areas began to
decline, falling by more than 26 percent over the next
20 years.75
Around the time that both the United States’ and Pennsylvania’s
rural populations began to decline, the number of well-paid
industrial jobs available for low-skilled workers began to disap-
pear, and poorly paid service jobs took their place.76 With this
change came challenges in individuals’ ability to be promoted
within a company; instead of moving up the ranks, low-skilled
workers often move between different firms, commonly finding
themselves stuck in low-wage, entry-level jobs with little
opportunity to advance.77
Compounding these conditions in rural communities was the
Personal Responsibility and Work Opportunity Reconciliation
Act (PRWORA) of 1996, under which the federal government
consolidated Aid to Families with Dependent Children (AFDC),
Emergency Assistance, and Job Opportunity and Basic Training
program, creating Temporary Aid for Needy Families (TANF).78
On the surface, PRWORA and the shift from AFDC’s entitle-
ment program to TANF’s time-limited, work-centered program
seemed beneficial; caseloads in human service agencies across
the country—and across Pennsylvania—declined.79 However,
looking past the number of caseloads and into the lives of the
individuals involved brought to light a different story.
By the year 2000, three years after Pennsylvania implemented
the new welfare policies, only 10 percent of rural residents in
Pennsylvania receiving TANF were working full time, with a
median wage of $6 per hour.80 As for those no longer receiving
TANF by 2000, 74 percent were working and 80 percent had
at some point held a paid position since they stopped receiving
TANF.81 In fact, more than half of the individuals formerly
receiving TANF reported that their lives were better since their
TANF assistance stopped; however, only 43 percent of those
former TANF recipients were working full-time jobs, with an
average income of $7.60 per hour.82 For this group of rural-
living workers, wages were stagnant, with half of the individuals
making less than $6.85 per hour, 55 percent of families still
living in poverty, and only 15 percent living with an income
of more than 150 percent of the poverty line.83 More than
half of those currently receiving TANF and those who had
transitioned off of TANF reported having faced problems such
as not being able to afford rent, adequate food, or basic utili-
ties.84 While the lives of those living in rural Pennsylvania who
made the transition off of TANF seemed to have improved,
they were still a ways off from true self-sufficiency.
Despite rural families’ experiencing negative effects from
welfare reform, these hardships demonstrate less the direct
effects of reform and more the continuing challenges within
rural communities. Inadequate transportation coupled with a
lack of work experience, skills, training, and available jobs will
bar anyone from achieving self-sufficiency,85 but these barriers
are even more prevalent and discouraging in rural areas. For
example, in rural Pennsylvania, simply finding jobs for TANF
recipients among the low-paying ones offered often does not
lead to better lives. Even offering job training can come with
mixed results if the companies within commuting distance
aren’t hiring people with those skills. Finding well-paying
careers in rural areas for individuals with opportunities for
advancement is difficult; partnering with local companies to
offer training programs specific to jobs already in existence
could help to alleviate these challenges.86
Because of the complexity of the challenges facing many rural
communities, solutions to overcoming them can be difficult
to come by. Between 2010 and 2014, 14.3 percent of all
households in rural Pennsylvania still had incomes that fell
below the poverty level; of their urban counterparts, 13.4
percent were in poverty.87 Additionally, 19 percent of indi-
viduals living in rural areas were classified as working poor
(employed individuals whose household income is less than
200 percent of poverty) compared to 14 percent of individuals
living in urban areas.88 In fact, between 2005 and 2008, the
number of individuals in rural Pennsylvania who were working
and earning incomes that still left them living in poverty
increased from 29 to 32 percent.89
Addressing the needs of rural communities also can be difficult
due to a lack of adequate funding for various support services,
such as food banks or job training. Often the presence of even
one philanthropic foundation can make a difference in a rural
community’s ability to assist its poorest residents,90 and yet
a The U.S. Census Bureau defines rural as all territory, population, and housing units located outside urbanized areas (50,000 people or more) and urban clusters (at least 2,500 people but fewer than 50,000).
b The Center for Rural Pennsylvania defines rural as counties with a population density at or below the statewide average. During the time of this data collection, Pennsylvania’s statewide population density was 274 people per square mile.

in order to survive, making any consequences—such as a loss
of a shift, the decrease in future hours, or even the total
loss of a job—disastrous.
The lack of transportation in Indiana County also affects
the rising population of people seeking services for drug
and alcohol addiction. This increase is not limited to Indiana
County, specific geographic regions, or demographics and
can be seen across Western Pennsylvania. While services like
the Medical Assistance Transportation Program can transport
people to appointments, not everyone who is willing to enter
into treatment is eligible for this service. Ensuring access to the
necessary services proves difficult in many areas, but in Indiana
County and other rural communities, where large stretches of
land span between many individuals and businesses, the issue
is made even worse.
Service providers in the county also can face barriers as a result
of state and federal government regulations. Many agencies
report that mandates and standards decided at higher levels
can cause unintended difficulties further down the line, as
regulations fall on the local agencies without being accompanied
by the funds necessary to make those changes. Strengthening
relationships between state and local entities could assist in
remedying this issue.
Pennsylvania State Representative Dave Reed, whose district
includes part of Indiana County, in collaboration with the
United Way of Indiana County, convened several meetings of
all human service agencies serving the county. During these
meetings, providers shared challenges and accomplishments
from their agencies and the populations they serve. The United
Way of Indiana County and Rep. Reed also collaborated on
a transportation summit, attempting to identify realistic
solutions to the transportations needs of the county.
The barriers in Indiana County, like many areas, are intricately
connected, and service providers recognize the need for a
more effective system aimed at assisting people in obtaining
self-sufficiency. Indiana County, through its Department of
Human Services, also initiated Project SHARE, a fast-growing
initiative centered on the idea of coordinated services that
includes numerous agencies and churches in Indiana County.
Each of the providers involved in Project SHARE has access to
a shared database, where basic information on the people it
serves is regularly updated. The shared database has become
a method for agencies to compile information and collaborate
with one another, as a smaller agency may be trying to provide
assistance to an individual, find it is unable to cover the entire
cost of what is needed, and request another Project SHARE
agency to make up the difference. The database also works
to deter abuse of services, as the agencies in Project SHARE
c The United States Department of Agriculture Economic Research Service (ERS) defines rural in several ways. Most commonly, the ERS researchers use a metro-nonmetro measurement of counties. Nonmetro counties can include open countryside, rural towns (population of 2,500 or fewer), and urban areas with populations anywhere from 2,500 to 49,999. Although this is the most common measurement used, ERS has different ways of classifying rural areas that are smaller in focus and are used to better understand economic and social diversity of nonmetro America as well as, at times, determine eligibility for federal programs in these areas. This discrepancy among respected institutions regarding how rural areas should be defined demonstrates the complexity of the situation and speaks to these ever-changing areas and the individuality of each community. As difficult as it is to find a single definition of rural, it can be argued that finding effective ways of remedying these areas’ hardships is more difficult still.
foundations nationwide still tend to focus the vast majority
of their donations on urban areas. From 2005 to 2010, only
5.5 percent of large foundation giving went to rural areas,
despite the fact that 19 percent of the national population
lives in these communities.91c In order to address this, the U.S.
Department of Agriculture recently urged foundations not
only to increase giving to rural areas but also to invest smartly
in them and partner in a plan focused on developing jobs and
addressing the root causes of hardship in rural American
communities in innovative ways.92
As the late rural sociologist Daryl Hobbs once said, “When
you’ve seen one rural community, you have seen one rural
community.” As each rural community comes with its own
unique history, people, and possibilities, rural poverty is not a
one-dimensional problem; the route to more promising rural
communities is more complex than a one-size-fits-all solution.
SPOTLIGHT: INDIANA COUNTYIn Indiana County, Pa., human service providers identify
challenges similar to those mentioned above facing their
residents. For example, many jobs available to Indiana County
residents are located within Indiana Borough, near Indiana
University of Pennsylvania, where housing costs have risen
due to the presence of the university. Additionally, many of
the jobs currently available are not jobs paying living wages.
Unable to afford the higher rents near the lower-wage
jobs, employees are forced to look elsewhere for affordable
housing, most of which is located in areas without public
transportation. This means that any disruption in their usual
transportation (e.g., a maintenance issue on their car) could
result in missed days at work and all of the potential conse-
quences that follow. Because many of these individuals have
little to no savings, they are dependent on each paycheck
POVERTY: BEYOND THE URBAN CORE 15
16 POVERTY: BEYOND THE URBAN CORE
can easily discover if an individual requesting assistance has
been receiving aid from multiple providers for the same or
similar issues.
Other initiatives by which Indiana County has demonstrated its
commitment to partnership in the provision of services include
the following:
• The Prepared Renter Program offers information to
renters about their rights and responsibilities as tenants.
• Landlord workshops offer information on fair housing,
the eviction process, lease details, renting to people with
disabilities, pest infestations, illegal activity, section 8
housing, and student housing.
• Financial literacy workshops are offered on a rotating
basis in partnership with five different banks. These work
shops are open to the public but geared toward people
in poverty.
• Veterans Gardens offers permanent housing for home
less veterans. During the process, a church parsonage
provides transition housing.
• Car maintenance workshops provide education on basic
car maintenance offered through tech centers.
Providing these services with the larger concerns of the county
in mind demonstrates the desire the service providers in
Indiana County to assist individuals in avoiding the snowball
effects of one unfortunate circumstance and ultimately aid
them in becoming self-sufficient.
CHALLENGES IN ADDRESSING SUBURBAN POVERTY The causes of poverty in the United States are complex,
multifaceted, and intertwined. There exists a real opportunity
to impact poverty regionally by addressing four underlying
challenges that serve to perpetuate it: housing, transportation,
and income inequality.
EDUCATIONIn advocating for the very first American public schools,
Horace Mann stated in 1848 that “Education, then, beyond
all other devices of human origin, is the great equalizer of
the conditions of men—the balance-wheel of the social
machinery.” The American public school system has provided
a pathway out of poverty for countless Americans. However,
students living in poverty are often increasingly afforded
fewer educational opportunities than their wealthy peers in
childhood. Within Pennsylvania, 40 percent of public school
students were classified as low income in 2013.93 In 2009–10,
a typical American low-income student attended a school
in which only 45 percent of students met state proficiency
standards, compared to 65 percent for middle-to-high-
income students.94
POVERTY AMONG STUDENTSFor the first time in modern history, the majority of students
attending American public schools live in poverty.95 In 2013,
40 states had at least 40 percent of students living in poverty.96
Students living in poverty are especially prevalent in the
South (Figure 7), where 13 of 16 states with the highest
percentage of students living in poverty reside.97 In Mississippi
and Louisiana, at least nine of every 10 school districts have
a majority of low-income students.98 Across the country,
students living in poverty are generally concentrated in urban
public schools, especially in the Northeastern United States.99
Income disparities between students have profound impact
on the outcomes of low-income students and in recent years,
these outcomes have become more dramatic. Some of these
disparities are outlined in the subsequent section.
IMPACT OF POVERTY ON STUDENTSIn addition to growing in number, students living in poverty
tend to have worse educational outcomes. This can have
long-term implications for their careers and economic mobility.
For instance, there is a 30–40 percent greater achievement
gap between high- and low-income families for children born
in 2001 than for children born 25 years ago.101 Additionally,
students in poverty are less likely to graduate from high school
and enroll in postsecondary education.102 Given the increasing
level of skill needed to be successful in the American workforce,
this can have long-term consequences for career opportunities
and earning potential. In 2012, only 52 percent of children in
the bottom fifth of the income distribution enrolled in post-
secondary education right out of high school, compared to
82 percent of students from the upper fifth of the income
distribution.103 Even once enrolled in college, low-income stu-
dents are less likely to graduate than their wealthier peers.104
Not only is failing to provide early educational opportunities
to students living in poverty detrimental to those students’
individual opportunities, it also negatively impacts the level
of human capital necessary to meet regional, state, and
national workforce needs.
POVERTY: BEYOND THE URBAN CORE 17

18 POVERTY: BEYOND THE URBAN CORE
Figure 8: Family Background Matters More than Eighth-grade Test Scores for College Graduation 105
Family SES Bottom Quartile
Family SES Top Quartile
Figure 7: Percent of Low Income Students in U.S. Public Schools (2013) 100
Research Bulletin
A New MajorityLow Income Students Now a Majority
In the Nation’s Public Schools
January, 2015
AK40%
HI51%
GA60%
AL58%
MS71%
LA65%TX
60%
NM68%
AZ50%
CA55%
OR49% ID
47%
MT42%
ND30%
MN38%
WI41%
IL50%
IN49%
OH39%
KY55%
WV52%
PA40%
NY48%
ME43%
MI47%
IA40%
SD40%
NE44%
WY38%
WA45%
NV51%
UT59% CO
42% KS48%
MO45%
AR61%
TN 58%OK61%
FL59%
SC58%
NC 53%
VA 39%
VT 36%
NJ 37%
DE 51%
RI 46%
CT 36%
NH 27%MA 37%
MD 43%
Data Source: U.S. Department of Education, National Center for Education Statistics, Common Core of Data
PERCENT OF LOW INCOME STUDENTS IN U.S. PUBLIC SCHOOLS 2013National Average: 51%
0.0 - 38
38 - 42
42 - 47
47 - 50
51 AND ABOVE
PERCENT OF STUDENTS
0-37
38-42
43-47
48-50
51 AND ABOVE

POVERTY: BEYOND THE URBAN CORE 19
UNAFFORDABILITY OF CHILD CAREEarly child care does more than simply enable parents to
work. Early professional child care has demonstrated long-
term impacts for children and society. Children who attended
preschool have higher levels of academic achievement, are
more likely to attend postsecondary education, and are less
likely to be involved in the criminal justice system.106 Even in
light of these benefits, the United States ranks 32nd among
39 countries in the Organisation for Economic Co-operation
and Development (OECD) in terms of child care enrollment
and has an enrollment rate 40 percent less than the average
of the rest of the OECD countries.107
Child care is a significant cost burden for many families. Among
single-parent, two-child families, child care costs can account
for 11.7 percent (New Orleans, La.) to 33.7 percent (Buffalo,
N.Y.) of the family budget.108 It is especially burdensome for
workers making the minimum wage, whose child care costs
can range from 30.6 to 80.9 percent of yearly earnings.109
A full-time minimum wage worker would require 62.9 percent
(South Dakota) to 183.5 percent (Washington, D.C.) of his
or her yearly salary to pay for two children in child care.110
Based on the U.S. Department of Health and Human Services
affordability threshold of 10 percent of a family’s yearly income,
only a handful of regions across the country, all of which are
in Louisiana, offer affordable child care for families with two
parents and two children on a modest living standard.111
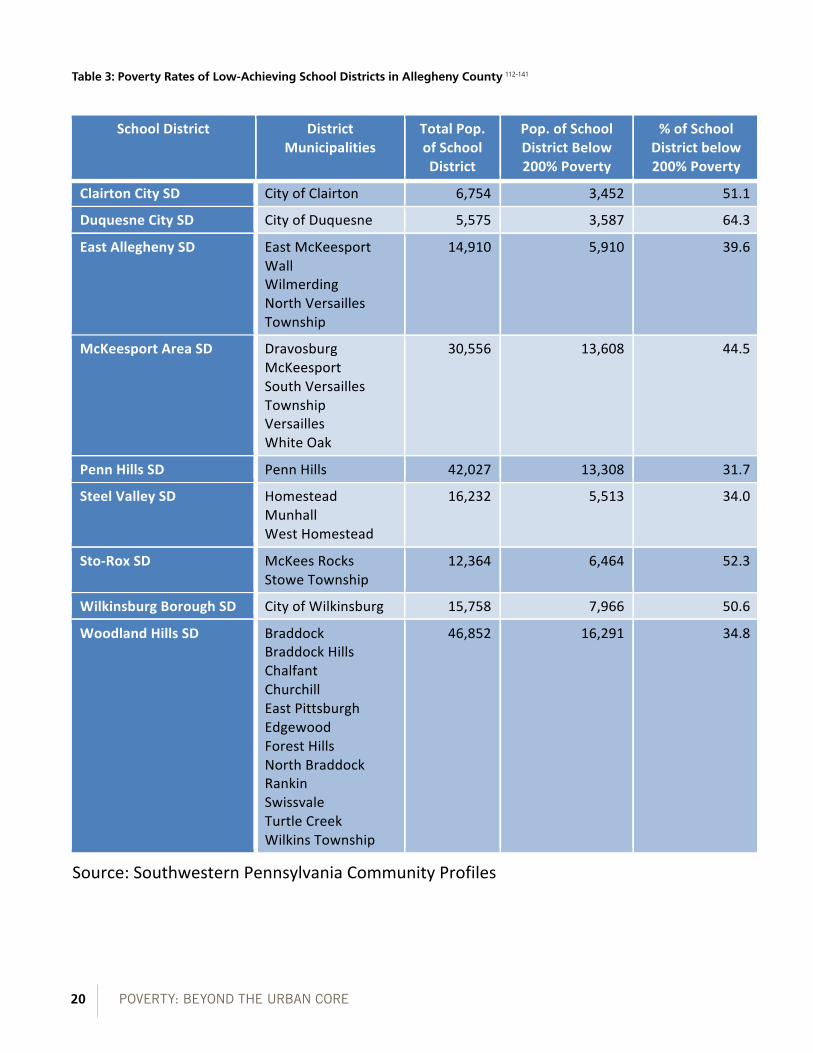
POVERTY AND EDUCATION IN ALLEGHENY COUNTYAlmost all underperforming schools in Allegheny County are
associated with municipalities with high poverty concentrations.
The Opportunity Scholarship Tax Credit Program provides
students attending low-achieving schools with tuition assistance
to attend another public or private school. The program defines
low-achieving schools as ranking in the bottom 15 percent of
combined math and reading scores on the Pennsylvania System
of School Assessment (PSSA) exams. Nearly all of these schools
in Allegheny County are located in municipalities with poverty
rates above the county average, which is 28.8 percent of
residents living at or below 200 percent of the poverty level.
These school districts, listed with their component municipalities,
for the 2012–13 school year are listed in Table 3.
This coupling of poor communities and low-performing
school districts results in reduced opportunities for residents
and eventually a functional separation from the labor force in
general.142 Neighborhoods with few employment opportunities
and a weak labor force also are associated with a greater like-
lihood of people turning to illegal activities for income, further
weakening the community.143
FULL-SERVICE COMMUNITY SCHOOLS WORKING TO ADDRESS COMMUNITY POVERTYFor areas with pervasive and persistent poverty, full-service
community schools, like the Harlem Children’s Zone in New
York, have demonstrated the ability to recognize and address
the effects poverty has on a child’s schooling. This community
schooling model looks holistically at a child’s life in poverty,
acknowledges the importance of collaborative solutions, and
organizes programs that serve both children in the classroom
and their families in the community. These programs can
include preparatory pre-K classes, tutoring support, and
recreational activities for students as well as child development
classes, financial literacy classes, and employment assistance
for families. In our region, the Homewood Children’s Village
is a good example of the provision of these comprehensive
services. It is important to recognize, however, the possible
issue of stigma, especially when attempting to implement
a community school model in a community with only a few
pockets of poverty. If students or families feel stigmatized for
using offered services, the likelihood of their continued use
of those services is reduced.
HOUSINGThe cost of housing is becoming an increasing burden for
people living in poverty. Housing represents the greatest single
household expense, and for families in the lowest income
quintile, it can represent more than 40 percent of their house-
hold expenditures.144 In light of this burden, when families
lack affordable housing options or live in neighborhoods
experiencing rising housing prices, it often can be difficult
for them to maintain stability in their housing circumstances,
forcing households living in poverty to relocate in order to find
affordable housing. Moving results in increased stress levels
and the breakdown of neighborhood social networks, both of
which can be especially hard on children. Children in unstable
housing situations tend to have worse academic and social
outcomes than their more stable peers.145 Housing instability
can have serious long-term consequences for children, such as
increased high school dropout rates and lower postsecondary
educational attainment.146 By stabilizing housing, regions are
able to stabilize families and communities.
HOUSING AFFORDABILITYThe housing wage is the estimated full-time hourly wage
needed to pay for a livable rental unit at U.S. Department
of Housing and Urban Development’s estimated Fair Market
Rent rate while spending no more than 30 percent of the
wage on housing.147,148 In 2015, the housing wage is $19.35
for a two-bedroom unit, more than 2.6 times the federal
minimum wage.149
20 POVERTY: BEYOND THE URBAN CORE
Table 3: Poverty Rates of Low-Achieving School Districts in Allegheny County 112-141
School District District Municipalities
Total Pop. of School District
Pop. of School District Below 200% Poverty
% of School District below 200% Poverty
Clairton City SD City of Clairton 6,754 3,452 51.1
Duquesne City SD City of Duquesne 5,575 3,587 64.3
East Allegheny SD East McKeesport Wall Wilmerding North Versailles Township
14,910 5,910 39.6
McKeesport Area SD Dravosburg McKeesport South Versailles Township Versailles White Oak
30,556 13,608 44.5
Penn Hills SD Penn Hills 42,027 13,308 31.7
Steel Valley SD Homestead Munhall West Homestead
16,232 5,513 34.0
Sto-‐Rox SD McKees Rocks Stowe Township
12,364 6,464 52.3
Wilkinsburg Borough SD City of Wilkinsburg 15,758 7,966 50.6
Woodland Hills SD Braddock Braddock Hills Chalfant Churchill East Pittsburgh Edgewood Forest Hills North Braddock Rankin Swissvale Turtle Creek Wilkins Township
46,852 16,291 34.8
Source: Southwestern Pennsylvania Community Profiles

POVERTY: BEYOND THE URBAN CORE 21
Accessing affordable housing is a challenge for many families
living in poverty. More than 80 percent of households with
incomes less than $15,000 lacked access to affordable housing
both as homeowners and renters.150 Additionally, approxi-
mately 75 percent of renters earning less than $29,999 do not
meet the requirements of affordable housing.151 In 2013, there
was a need for an additional 7.1 million affordable housing
units for extremely low-income households.152
Black and Hispanic households are far more likely to be
severely burdened by housing costs than White households,
often spending more than 30 percent of their income on
housing.154 Similarly, nearly 33 percent of single-parent
families are severely burdened compared to 10 percent
of married couples.155
Severely burdened households, as a result of having to spend
more of their income on housing, reduce spending on other
household needs. These households spend 70 percent less
on health care and 40 percent less on food than unburdened
families.156
AFFORDABLE HOUSING IN ALLEGHENY COUNTY
In recent years, Allegheny County’s housing market has expe-
rienced several trends, including the loss of affordable housing
units, an increase in the number of high-end units, and a satu-
ration of affordable housing geared toward senior citizens.
In 2015, Pennsylvania had the 20th-highest Fair Market Rent
of any state in the country. Pennsylvania has a housing wage
of $17.57 ($36,545 annually), which is below the national
housing wage of $19.35 ($40,240 annually).157 These costs
can be overwhelming to minimum-wage workers, who have
to work nearly 80 hours per week to afford a one-bedroom
rental unit at Fair Market Rent.158 Within Allegheny County,
the housing wage is even lower at $15.12 ($31,440).159 Even so,
these housing prices within Allegheny County have resulted in
almost a third of all households (153,545 households) spend-
ing more than 30 percent of their income on housing costs or
rent.160 In Allegheny County, about 75 percent of affordable
housing is naturally occurring, and only about 25 percent is
subsidized or regulated housing. This means that much of the
affordable housing within the county is subject to changes in
the market. For sections of the county, such as the East End of
Pittsburgh, these market pressures have resulted in significant
losses of affordable housing as market rent prices have far
exceeded what someone with a subsidy might be able to pay.
Additionally, much of the affordable rental housing within the
region is found within the City of Pittsburgh, the Mon Valley,
and eastern suburbs. This geographic distribution does not
necessarily match up with low-income employment oppor-
tunities within the county.
BLIGHT AND VACANT PROPERTYBlight has significant impacts on the communities in which it
exists through increases in crime and decreases in both prop-
erty values and associated revenue generated by properties
for local governments. Because of their dilapidated condition,
blighted properties impair the growth of a municipality, consti-
tute an economic or social liability, and pose a threat to public
safety.161 Vacant or abandoned properties are one of the main
causes of blight within communities. A study analyzing crime
data in Austin, Texas, found that blocks with open abandoned
buildings had crime rates twice as high as comparable blocks
without abandoned buildings.162 From 2010 to 2012, an esti-
mated 25,000 vacant residential structure fires were reported
annually within the United States.163 Although accounting for
only 7 percent of all residential building fires in those years,
vacant building fires resulted in an estimated 60 deaths, 225
injuries, and $777 million in property losses annually.164
Additionally, vacancy and abandonment are costly to local
governments because they lead to diminished property values.
Nationwide, the inability to collect property taxes on aban-
doned homes costs local governments and school districts
$3–6 billion in lost revenue annually.165 Vacant properties also
can depress property values for nearby homes within a com-
munity, again resulting in lost property taxes.166
Figure 9: Affordable and Available Units per 100 Renter Households with Incomes <30% Area Median Income (2013) 153
— 6 —
Housing Spotlight — March 2015
populations, ELI renters face a severe shortage of affordable housing.
The deficit of rental units affordable and available to ELI households ranged from 18,921 in the Honolulu, HI metropolitan area to 627,196 in the New York City-Newark-Jersey City, NY-NJ-PA metropolitan area (Appendix B). Of the 50 metropolitan areas, the Las Vegas-Henderson-Paradise metropolitan area in Nevada had the greatest need, with just 10 units affordable and available for every 100 ELI renter households, down from 12 units in 2012. However, no metropolitan area had a sufficient number of affordable rental units to serve all ELI households. The Boston-Cambridge-Newton, MA (47) and Louisville/Jefferson County, KY-IN (46) metropolitan areas had the greatest number of units available and affordable per 100 ELI renter households (Table 1).
There were 20 metropolitan areas where the shortage of units affordable and available increased from 2012 to 2013, with an average increase of 8.4%. The five metropolitan areas that experienced the biggest increase in this shortage were Richmond, VA (21%), Pittsburgh, PA (20%), Las Vegas-Henderson-Paradise, NV (17%), Washington-Arlington-Alexandria, DC-VA-MD-WV (17%), and New Orleans-Metairie, LA (14%). The remaining 30 metropolitan areas all experienced decreases in the shortage of affordable and available rental units to ELI households, with an average decrease of 7.6%. These decreases can likely be attributed to the rise in median family income from 2012 to 2013, which occurred in 40 of these metropolitan areas. This lifted many households out of the ELI category. The median family income increased by an average of $1,592 in these 40 metropolitan areas.
ME
NHMACT
NY
PA NJ
DEMD
VAWV
OHIN
MI
IL
WI
MN
IA
MO
AR
LATX
OK
KS
NE
ND
SD
MT
ID
WA
OR
CA
AK
HI
WY
COUT
NV
AZNM
NCTN
KY
SC
GAALMS
FL
RI
VT
FIGURE 3: UNITS AFFORDABLE AND AVAILABLE PER 100 RENTER HOUSEHOLDS WITH INCOMES OF NO MORE THAN 30% AMI, 2013
Source: NLIHC Tabulations of 2013 ACS PUMS data
Fewer than 25Between 25 and 35Between 35 and 43More than 43
Source: NLIHC Tabulations of 2013 ACS PUMS data
— 6 —
Housing Spotlight — March 2015
populations, ELI renters face a severe shortage of affordable housing.
The deficit of rental units affordable and available to ELI households ranged from 18,921 in the Honolulu, HI metropolitan area to 627,196 in the New York City-Newark-Jersey City, NY-NJ-PA metropolitan area (Appendix B). Of the 50 metropolitan areas, the Las Vegas-Henderson-Paradise metropolitan area in Nevada had the greatest need, with just 10 units affordable and available for every 100 ELI renter households, down from 12 units in 2012. However, no metropolitan area had a sufficient number of affordable rental units to serve all ELI households. The Boston-Cambridge-Newton, MA (47) and Louisville/Jefferson County, KY-IN (46) metropolitan areas had the greatest number of units available and affordable per 100 ELI renter households (Table 1).
There were 20 metropolitan areas where the shortage of units affordable and available increased from 2012 to 2013, with an average increase of 8.4%. The five metropolitan areas that experienced the biggest increase in this shortage were Richmond, VA (21%), Pittsburgh, PA (20%), Las Vegas-Henderson-Paradise, NV (17%), Washington-Arlington-Alexandria, DC-VA-MD-WV (17%), and New Orleans-Metairie, LA (14%). The remaining 30 metropolitan areas all experienced decreases in the shortage of affordable and available rental units to ELI households, with an average decrease of 7.6%. These decreases can likely be attributed to the rise in median family income from 2012 to 2013, which occurred in 40 of these metropolitan areas. This lifted many households out of the ELI category. The median family income increased by an average of $1,592 in these 40 metropolitan areas.
ME
NHMACT
NY
PA NJ
DEMD
VAWV
OHIN
MI
IL
WI
MN
IA
MO
AR
LATX
OK
KS
NE
ND
SD
MT
ID
WA
OR
CA
AK
HI
WY
COUT
NV
AZNM
NCTN
KY
SC
GAALMS
FL
RI
VT
FIGURE 3: UNITS AFFORDABLE AND AVAILABLE PER 100 RENTER HOUSEHOLDS WITH INCOMES OF NO MORE THAN 30% AMI, 2013
Source: NLIHC Tabulations of 2013 ACS PUMS data
Fewer than 25Between 25 and 35Between 35 and 43More than 43
— 6 —
Housing Spotlight — March 2015
populations, ELI renters face a severe shortage of affordable housing.
The deficit of rental units affordable and available to ELI households ranged from 18,921 in the Honolulu, HI metropolitan area to 627,196 in the New York City-Newark-Jersey City, NY-NJ-PA metropolitan area (Appendix B). Of the 50 metropolitan areas, the Las Vegas-Henderson-Paradise metropolitan area in Nevada had the greatest need, with just 10 units affordable and available for every 100 ELI renter households, down from 12 units in 2012. However, no metropolitan area had a sufficient number of affordable rental units to serve all ELI households. The Boston-Cambridge-Newton, MA (47) and Louisville/Jefferson County, KY-IN (46) metropolitan areas had the greatest number of units available and affordable per 100 ELI renter households (Table 1).
There were 20 metropolitan areas where the shortage of units affordable and available increased from 2012 to 2013, with an average increase of 8.4%. The five metropolitan areas that experienced the biggest increase in this shortage were Richmond, VA (21%), Pittsburgh, PA (20%), Las Vegas-Henderson-Paradise, NV (17%), Washington-Arlington-Alexandria, DC-VA-MD-WV (17%), and New Orleans-Metairie, LA (14%). The remaining 30 metropolitan areas all experienced decreases in the shortage of affordable and available rental units to ELI households, with an average decrease of 7.6%. These decreases can likely be attributed to the rise in median family income from 2012 to 2013, which occurred in 40 of these metropolitan areas. This lifted many households out of the ELI category. The median family income increased by an average of $1,592 in these 40 metropolitan areas.
ME
NHMACT
NY
PA NJ
DEMD
VAWV
OHIN
MI
IL
WI
MN
IA
MO
AR
LATX
OK
KS
NE
ND
SD
MT
ID
WA
OR
CA
AK
HI
WY
COUT
NV
AZNM
NCTN
KY
SC
GAALMS
FL
RI
VT
FIGURE 3: UNITS AFFORDABLE AND AVAILABLE PER 100 RENTER HOUSEHOLDS WITH INCOMES OF NO MORE THAN 30% AMI, 2013
Source: NLIHC Tabulations of 2013 ACS PUMS data
Fewer than 25Between 25 and 35Between 35 and 43More than 4335 to 43
44 or greater
24 and fewer
25 to 34
22 POVERTY: BEYOND THE URBAN CORE
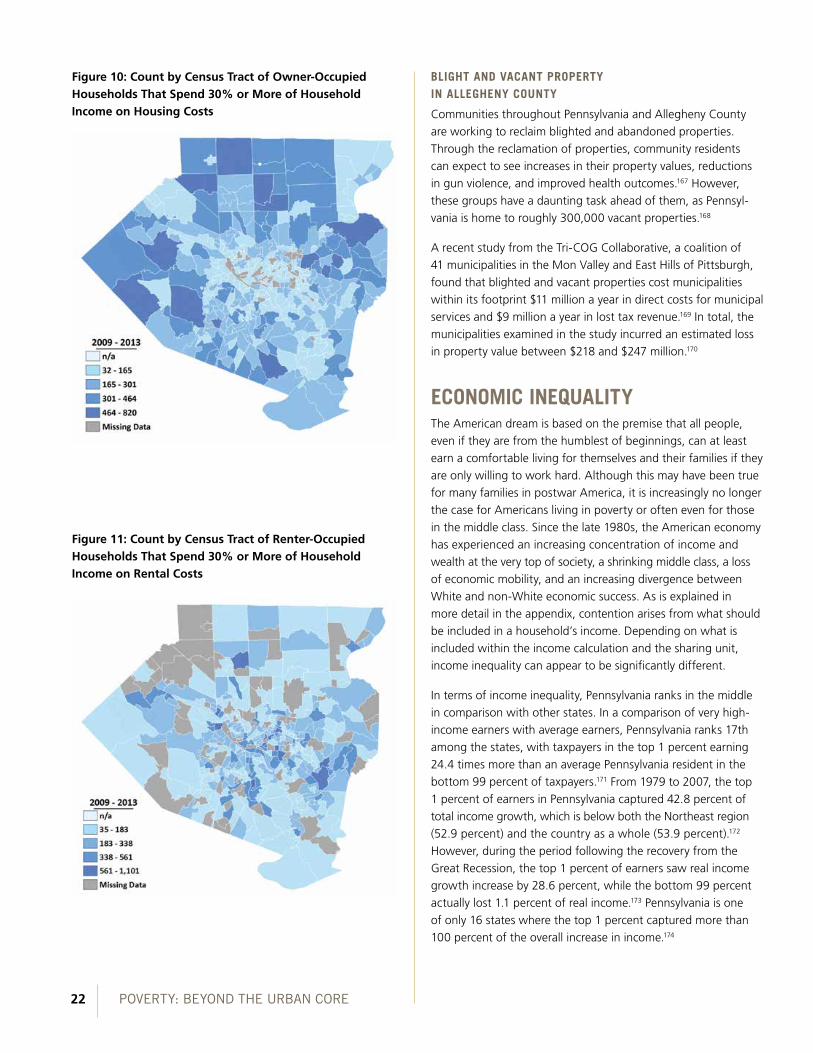
BLIGHT AND VACANT PROPERTY IN ALLEGHENY COUNTY
Communities throughout Pennsylvania and Allegheny County
are working to reclaim blighted and abandoned properties.
Through the reclamation of properties, community residents
can expect to see increases in their property values, reductions
in gun violence, and improved health outcomes.167 However,
these groups have a daunting task ahead of them, as Pennsyl-
vania is home to roughly 300,000 vacant properties.168
A recent study from the Tri-COG Collaborative, a coalition of
41 municipalities in the Mon Valley and East Hills of Pittsburgh,
found that blighted and vacant properties cost municipalities
within its footprint $11 million a year in direct costs for municipal
services and $9 million a year in lost tax revenue.169 In total, the
municipalities examined in the study incurred an estimated loss
in property value between $218 and $247 million.170
ECONOMIC INEQUALITYThe American dream is based on the premise that all people,
even if they are from the humblest of beginnings, can at least
earn a comfortable living for themselves and their families if they
are only willing to work hard. Although this may have been true
for many families in postwar America, it is increasingly no longer
the case for Americans living in poverty or often even for those
in the middle class. Since the late 1980s, the American economy
has experienced an increasing concentration of income and
wealth at the very top of society, a shrinking middle class, a loss
of economic mobility, and an increasing divergence between
White and non-White economic success. As is explained in
more detail in the appendix, contention arises from what should
be included in a household’s income. Depending on what is
included within the income calculation and the sharing unit,
income inequality can appear to be significantly different.
In terms of income inequality, Pennsylvania ranks in the middle
in comparison with other states. In a comparison of very high-
income earners with average earners, Pennsylvania ranks 17th
among the states, with taxpayers in the top 1 percent earning
24.4 times more than an average Pennsylvania resident in the
bottom 99 percent of taxpayers.171 From 1979 to 2007, the top
1 percent of earners in Pennsylvania captured 42.8 percent of
total income growth, which is below both the Northeast region
(52.9 percent) and the country as a whole (53.9 percent).172
However, during the period following the recovery from the
Great Recession, the top 1 percent of earners saw real income
growth increase by 28.6 percent, while the bottom 99 percent
actually lost 1.1 percent of real income.173 Pennsylvania is one
of only 16 states where the top 1 percent captured more than
100 percent of the overall increase in income.174
Figure 10: Count by Census Tract of Owner-Occupied Households That Spend 30% or More of Household Income on Housing Costs
Figure 11: Count by Census Tract of Renter-Occupied Households That Spend 30% or More of Household Income on Rental Costs

POVERTY: BEYOND THE URBAN CORE 23
INCREASING INCOME AND WEALTH INEQUALITYDuring the economic boom that followed the end of World
War II, all participants within the American economy, from
the working poor to the wealthy, saw improvement in their
economic conditions. From 1945 to 1975, income for the top
fifth of earners increased by about 2.5 percent. Meanwhile,
workers in the bottom fifth saw an even greater income
increase of about 3 percent.175 However, since that time,
economic prosperity has not been as equally shared. Between
1979 and 2012, the top fifth of earners in the United States
saw their average income increase by 42.6 percent. 176
However, the middle 60 percent of earners only grew their
income by 9.5 percent, and the incomes of the bottom fifth
of earners dropped by 2.7 percent.177
Income and wealth have only become more concentrated
in the wake of the Great Recession. By 2013, the wealthiest
and highest-earning 20 percent of American families owned
almost 89 percent of all wealth and earned nearly 62 percent
of all income.178
In 1963, households near the top (90th percentile) had nearly
six times more wealth than middle-class households (50th
percentile).179 By 2013, this wealth disparity had increased so
that the wealthiest Americans had nearly 12 times the wealth
of middle-class Americans.180
SHRINKING MIDDLE CLASSSymptomatic of the shifts in wealth and income is the decline
of the middle class. The middle class is made up of American
households whose incomes are between 25 percent higher
and 25 percent lower than the median income in the United
States. In 1979, middle-class working-age households repre-
sented more than half of all households. Since that time, the
number of Americans considered to be in the middle class has
steadily fallen, reaching 45.1 percent in 2012, with much of
the loss attributable to the shift of individuals into the lower
income and wealthier brackets.181
LOSS OF ECONOMIC MOBILITYIncreasingly, Americans are unable to overcome economic
challenges in childhood and increase their income and wealth
as adults. The Pew Charitable Trusts found that, when dividing
the American population by income and wealth, Americans
raised at both the top and bottom quintiles were likely to
remain there as adults. Forty-one percent of Americans raised
in the bottom income quintile remained in that quintile as
adults; only 35 percent were able to advance to at least the
middle quintile. 183
INCOME AND WEALTH GAP IN BLACK AND HISPANIC POPULATIONSIncome and wealth issues have impacted Black and Hispanic
populations more drastically than the general population
throughout the last 30 years. As seen in Figure 14 on the next
page, in 2013, the household wealth for White Americans
was nearly 13 times greater than that of Black Americans.184
Figure 12: Percent of Households Ages 25–64 Earning within 50 Percent of the Median Income 182
Note: Income measure includes both earned and unearned income.
Source: Authors’ analysis is based on Current Population Survey March data extracts produced by the Center for Economic Policy Research, Center for Economic Policy Research, “March CPS Data,” available at ceprdata.org/cps-uniform-data-extracts/march-cps-supplement/march-cps-data/ (last accessed November 2014.)
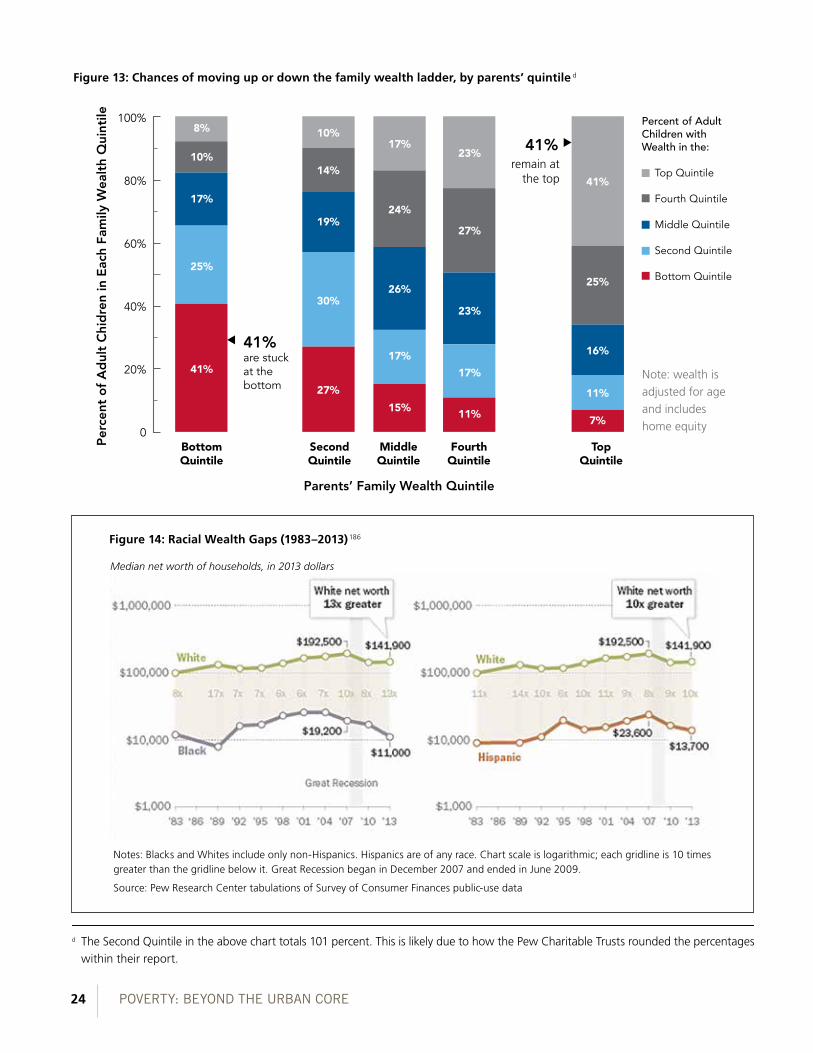
24 POVERTY: BEYOND THE URBAN CORE
d The Second Quintile in the above chart totals 101 percent. This is likely due to how the Pew Charitable Trusts rounded the percentages
within their report.
Figure 14: Racial Wealth Gaps (1983–2013) 186
Median net worth of households, in 2013 dollars
Notes: Blacks and Whites include only non-Hispanics. Hispanics are of any race. Chart scale is logarithmic; each gridline is 10 times greater than the gridline below it. Great Recession began in December 2007 and ended in June 2009. Source: Pew Research Center tabulations of Survey of Consumer Finances public-use data
Figure 13: Chances of moving up or down the family wealth ladder, by parents’ quintile d
Note: wealth is
adjusted for age
and includes
home equity
Pursuing The aMeriCan DreaM: eConoMiC MobiliTy aCross generaTions15
FAMILY WEALTH
Family Wealth is Sticky at the Top and Bottom of the Ladder Chances of moving up or down the family wealth ladder, by parents’ quintile
Figure 11
0
20%
40%
60%
80%
100%P
erce
nt o
f A
dul
t C
hid
ren
in E
ach
Fam
ily W
ealt
h Q
uint
ile
Bottom Quintile
Second Quintile
Middle Quintile
Fourth Quintile
Top Quintile
Percent of Adult Children with Wealth in the:
Top Quintile
Fourth Quintile
Middle Quintile
Second Quintile
Bottom Quintile
41%
25%
17%
10%
8%
27%
30%
19%
14%
10%
15%
17%
26%
24%
17%
11%
17%
23%
27%
23%
7%
11%
16%
25%
41%
41% are stuck at the bottom
41% are stuck
at the top
Parents’ Family Wealth Quintile
0
20
40
60
80
100
Relative wealth mobility reveals clear stickiness at the ends.
As with family income, the magnitude of absolute mobility gains and declines does not always translate into changing positions on the wealth ladder. Americans whose parents were at the top and bottom of the wealth ladder are likely to be at the top and bottom themselves. Forty-one percent of those raised in the bottom are stuck there as adults, and 66 percent never make it to the middle rung. Similarly, 41 percent of children whose parents were in the top of the wealth distribution remain there as adults, and 66 percent never fall to the middle or below.
Note: Wealth is adjusted for age and includes home equity.
remain at the top

POVERTY: BEYOND THE URBAN CORE 25
Since the Great Recession, that wealth gap has grown, as White
households, with more significant stock market investments,
have seen modest increases in household wealth while Black
and Hispanic households have seen continued decreases.185
The increasing lack of social mobility is even worse for the Black
population. Black people are far more likely than White people
to be raised at the bottom of the income and wealth ladder.187
They also have a more difficult time exceeding their parents’
income and wealth and are far more downwardly mobile.188
Fifty-five percent of Black individuals raised in the middle range
of the income distribution in the United States fall into the
bottom end of the distribution as adults.189 Similarly, more than
half of Black people in the United States raised at the bottom
of the wealth ladder remain there.190 As seen in Figure 15
below, White individuals have far greater intergenerational
upward mobility, high-income stickiness, and a lesser likelihood
of downward mobility than their Black peers.
MINIMUM WAGEThe minimum wage can be an important tool in increasing
the income and wealth of people living in poverty. In 2015,
2.6 million workers received at or below the federal minimum
wage, representing 3.3 percent of the hourly workforce.192
Pennsylvania’s 150,000 workers making at or below the
federal minimum wage represent 4.3 percent of the hourly
workforce.193 According to the United States Bureau of Labor
Statistics, there are no significant racial differences among
those paid the minimum wage; however, two-thirds of people
making the minimum wage are women.194
The federal minimum wage has not increased since 2009.
In response, 29 states and the District of Columbia implemented
a minimum wage above the federal minimum wage of $7.25
per hour.195 When increasing the minimum wage, most states
have done so for all workers within the state. However,
Oregon’s minimum wage increase in 2016 introduced a tiered
minimum wage based on the cost of living in various counties
across the state. The tiers include a high minimum wage in the
Portland metro area, the region of the state with the highest
cost of living, a moderate minimum wage for midsize counties,
and a lower minimum wage for rural areas.196 It is hoped that
through this tiered approach, any job loss impacts of increas-
ing the minimum wage will be reduced.
GENDER PAY INEQUITY According to the U.S. Census Bureau, the median yearly earn-
ings for women working full-time year-round jobs is $39,621
before deductions (e.g., taxes) and noncash benefits (e.g.,
food stamps), while for men, this earning is $50,383.197 In
other words, women can expect to earn only 79 cents for
every dollar earned by men. In Pennsylvania, women working
full-time year-round jobs earn 78 cents for every dollar
earned by men in a year.198 For minorities in the United States,
this inequality is even more pronounced, with black and
Hispanic women working full-time, year-round jobs earning
Figure 15: Intergenerational Economic Mobility by Race 191
Minority Economic Mobility
White
26% 21% 16% 15% 11%
27% 24%
20% 16% 14%
21%
22%
24% 21%
16%
16% 20%
22% 23%
22%
10% 13% 18% 25%
38%
African American
51%
36% 34% 27% 21%
21%
25% 21%
24%
18%
16%
20% 18%
17%
18%
9% 13%
19% 18%
19%
4% 7% 8% 14% 24%
Bottom Quintile
Second Quintile
Middle Quintile
Fourth Quintile
Top Quintile
Bottom Quintile
Second Quintile
Middle Quintile
Fourth Quintile
Top Quintile
Second Quintile
Middle Quintile
Fourth Quintile
Top Quintile
Bottom Quintile
Percent of Adult Children with Wealth in the:
Perc
ent o
f Adu
lt Ch
ildre
n in
Eac
h Fa
mily
’s W
ealth
Qui
ntile
Chances of Moving Up or Down the Family Wealth Ladder (by parent’s quintile)
1
26 POVERTY: BEYOND THE URBAN CORE
only 67 and 60 cents, respectively, for every dollar earned
by men in the workforce.199 This dissonance in earnings can
serve as a major barrier for women in lifting their families
out of poverty. This is especially true in Pennsylvania, where
female-headed households make up only 19.5 percent of
the total family households200 but 29.1 percent of the total
family households in poverty.201
ECONOMIC MOBILITY IN THE PITTSBURGH REGIONThe Pittsburgh region has one of the lowest levels of economic
segregation of any large metro area in the country, which is
directly linked to increased economic mobility.202 Low levels of
economic segregation allow for private and public investment
to be more evenly distributed across a region, and individuals
often have more options for employment close to home.
Another factor linked with economic mobility within regions
is low levels of education segregation. Where education seg-
regation is low, children have easier access to better schools,
and access to high-quality educational opportunities is key to
future economic success. Once again the Pittsburgh region
is well positioned, with the second lowest level of education
segregation of any large metro area in the country.203
TRANSPORTATIONAccess to transportation is a fundamental component in
escaping poverty. Without adequate access to transportation,
individuals and families cannot access what is necessary to
escape poverty, such as employment, education, health care,
and human services. Transportation allows people to take
advantage of opportunities not only in their own communities
but also in the broader regions in which they live. Nationwide,
a typical resident within a metro area only has access to 30
percent of employment opportunities within a 90 minute
commute.204 For households living in poverty, the expense of
transportation often limits access to these opportunities.205
In 2009, 11 percent of households in Allegheny County did not
have access to a vehicle.206 Across 23 suburban census tracts,
more than 30 percent of households did not have access to a
vehicle.207 The lack of transportation options in many areas of
the county makes it difficult for individuals and families living
in poverty to access needed social services like the food bank
and Special Supplemental Nutrition Program for Women,
Infants, and Children. Additionally, many communities experi-
encing poverty are less likely to be job-rich areas. This means
that residents living in areas of poverty are less able to take
advantage of employment opportunities found in other areas
of the region because of an inability to get to the jobs.
BENEFITS OF TRANSPORTATION MOBILITYBy improving transportation options, communities can become
less isolated and community income stratification can be
reduced. Metro areas that are compact with limited sprawl
tend to be associated with increased transportation options,
fewer household transportation expenses, and greater
economic mobility.208
A recent Harvard University study found that access to reliable
and efficient transportation has a greater influence on social
mobility than crime, elementary school test scores, or the
percentage of two-parent families in a community. Similar
linkages have been found in New York, N.Y., where house-
holds lacking adequate access to public transportation and/or
private cars had much lower household incomes and higher
levels of unemployment.209 Even a 10 percent increase in
transit service has been linked to individuals’ incomes in the
service areas increasing by $53–194 annually, a small but
often meaningful increase for families living in poverty.210
BURDEN OF TRANSPORTATION ON HOUSEHOLDS LIVING IN POVERTY Transportation costs are a significant burden for low-income
households and represent the second greatest expense after
housing.211 Individuals at or below the poverty level are about
three times more likely to use public transit than higher income
individuals.212 However, for many Americans, especially those
in suburban and rural areas, access to public transportation
can be difficult or nonexistent. In fact, 45 percent of American
households lack any access to public transportation, and millions
more have inadequate service levels.213
Furthermore, industries that require low- to middle-skilled
employees, where low-income individuals typically work, are
far less accessible within a 90-minute commute compared to
high-skill industries. For many metro residents living in poverty,
this can make finding work difficult.
Even residents living in suburban communities often have
difficulty taking advantage of the available opportunities given
the lack of public transportation in most suburban areas of
the country.
PUBLIC TRANSPORTATION IN ALLEGHENY COUNTYPublic transportation is an affordable option for connecting
many low-income individuals to the education, employment,
and human service opportunities in their communities and
the region. The primary public transportation provider for the
county is the Port Authority of Allegheny County. Additional
public transportation, especially within suburban communities,
is offered through several microtransit providers.

POVERTY: BEYOND THE URBAN CORE 27
PORT AUTHORITY
For many county residents, the leading way to address trans-
portation needs is through the Port Authority of Allegheny
County. In 2015, the Port Authority provided nearly 65 million
total rides with its bus, light rail, incline, and ACCESS para-
transit services. 214
However, in Allegheny County, the Port Authority is limited
in its ability to expand its service area given the limitations
of current state funding under Act 89 of 2013. Service areas
can only be expanded through savings from increased
efficiency in the Port Authority’s system. In recent years,
the Port Authority has been successful in increasing efficiency
to enable expanded service hours and a few route enhance-
ments. However, even with these changes, only 36 percent
of suburban communities have even limited access to public
transportation.215 For example, Penn Hills has access to only
two bus lines, one of which is dedicated to servicing only
downtown commuter traffic during the work week, and
even the more robust bus line reduces its routes during
the weekends.
MICROTRANSIT IN ALLEGHENY COUNTY
A complementary and important supplement to the Port
Authority’s system in Allegheny County has been two micro-
transit organizations: Heritage Community Transportation
and Airport Corridor Transportation Association (ACTA).
Both of these organizations provide first-mile bus service,
which expands available public transportation options within
suburban communities by using smaller buses to access routes
that are impassible for full-size buses or lack the demand to
fill a full-size bus. Heritage operates in 13 municipalities in the
Mon Valley and southern East Hills of Pittsburgh. The service
provides 3,000 registered riders with more than 820,000 rides
annually. Similar to the Port Authority, Heritage receives the
bulk of its funding through Act 89. The majority of Heritage’s
ridership is poor or near poor, with an average income of
$21,000; 63 percent of its riders earn less than $10,000 per
year. Given that much of Heritage’s ridership lives in poverty,
ride fares are kept low—25 cents for adults and 10 cents for
children or people with disabilities.
Heritage works in close partnership with the Port Authority
to increase mobility for Heritage’s 13 communities. Most
of Heritage’s service area includes places where the Port
Authority’s large buses cannot financially or physically operate.
In addition to enabling residents to move within the Heritage
transportation area, Heritage also serves as a feeder system
to the Port Authority’s routes that extend into Heritage’s
service area. It operates a fixed service route with stops that
intersect those of the Port Authority, facilitating transfer to
Port Authority routes.
ACTA operates in three communities to the west of Pittsburgh—
Robinson Township, Moon Township, and Findlay Township.
Rather than operating a fixed route with stops, ACTA supple-
ments the Port Authority’s service to the region primarily by
transporting employees to the various businesses within the
Robinson Town Centre retail complex.
BROOKINGS | May 201118
most qualified depends on a range of factors that vary significantly across metro areas.As described in the methodology, this report classifies major industries by the average educational
attainment of their workers. In the 100 largest metro areas, almost half of total jobs are in industries defined as high-skill, such as finance, business and legal services, and public administration. The remaining jobs include those in middle-skill industries (19 percent) like wholesale trade and manufac-turing, and low-skill sectors (33 percent) like construction, personal services, and hospitality. More than half of jobs in cities of the 100 largest metro areas are in high-skill industries, while more than half of suburban jobs are middle- or low-skill (Figure 8).61 Stated another way, across these metro areas, 43 percent of metropolitan high-skill industry jobs are in cities, and 69 percent of low-skill industry jobs are in suburbs. This reflects the greater “demand for density” among high-skill sectors, and the larger physical footprint of middle- and low-skill sectors like manufacturing and retail.62
Because transit generally provides better access to employment in cities than suburbs, metropolitan commuters can reach relatively more high-skill industry jobs via transit than other jobs. Across the 100 largest metro areas, the typical working-age person in neighborhoods served by transit can reach one-third of metro area jobs in high-skill industries within 90 minutes of travel time, compared to just over one-quarter of metro area jobs in middle- or low-skill industries (Figure 9).
This pattern holds across metropolitan areas in all census regions, but some regions exhibit more pronounced disparities than others. In Western metro areas, the typical commuter can access 31 per-cent of low-skill industry jobs, and 35 percent of high-skill industry jobs, within 90 minutes via transit. In the Midwest, commuters can reach a similar share of high-skill industry jobs (34 percent), but only 23 percent of low- and middle-skill industry jobs. disparities are also high, and access levels lower at every skill level, in the South, where the typical working-age person can reach only 29 percent of high-skill industry jobs and 22 percent of low-skill industry jobs via transit.
Among the 100 metro areas, 94 provide access to greater shares of their high-skill industry jobs via transit than their low- and middle-skill industry jobs. Las Vegas, McAllen, Colorado Springs, Virginia Beach, Palm Bay, and Tampa are the only exceptions, reflecting their above-average concentrations of low- and middle-skill jobs and the decentralization of those jobs across cities and suburbs. Metro areas in which transit and jobs are better aligned overall exhibit higher levels of job access across employment skill types. Metropolitan San Jose, Honolulu, Fresno, Salt Lake City, and Tucson, which rank among the top 10 metro areas for total share of metropolitan jobs accessible via transit, each place among the top 10 for job access at all three industry skill levels. In each of these metro areas,
Figure 8. Distribution of City and Suburban Jobs by Skill Type, 100 Metropolitan Areas
Source: Brookings Institution analysis 2010 Nielsen Business-Facts data
Figure 16: Distribution of City and Suburban Jobs by Skill Type (Top 100 Metropolitan Areas)

28 POVERTY: BEYOND THE URBAN CORE
RECOMMENDATIONSAlthough the issue of poverty can seem overwhelming and
intractable, the reality is that there are simple, concrete steps
that local governments, the Commonwealth, human service
provides, community leaders, and other stakeholders can take
to assist those who live in poverty in our region. By embracing
these solutions, we will not only provide hope to those who
live quiet lives of desperation but also enrich and expand our
region’s pool of human talent by unshackling our neighbors
who otherwise would be bound to lives of poverty. Although
each of the recommendations listed below pertains to a specific
area, there needs to be greater recognition from policymakers
and community leaders that all of these recommendation areas
are interrelated. Together they form a pattern that needs to be
addressed in order to alleviate poverty in the region.
EDUCATIONSupport and invest in wraparound, full-service community school models for suburban areas with high poverty levels, where schools are not only sources of academic programming but also access points for comprehensive academic, social, and health services. Given the central place
schools serve within their communities, full-service community
schools provide an opportunity for service providers to access
children and families within their neighborhoods. This model
provides the opportunity to address the causes of inhibited
academic performance through counseling, health care delivery,
nutrition support, and parent job training. These schools not
only provide human services for the students, they also address
the needs of parents and the community. Implementation of
these types of initiatives may be more difficult in higher income
communities with small pockets of poverty.
Examine and evaluate the varying and disparate costs to districts for students attending charter schools, especially special education students. These costs can be especially
difficult for school districts in communities with lower property
values and high levels of poverty. In already struggling schools,
the cost of sending large numbers of students to charter
schools can exacerbate already low funding and make it even
more difficult to address the needs of the students remaining in
the district. Baseline funding for charter schools from the state
may help to alleviate the burden on the sending school districts.
Make teacher education programs for higher education and continuing education more contextually and socially informed with regard to supporting high-need populations. Social and contextual issues may require just as much attention
as traditional pedagogy in teacher education, specifically in
regard to the history of economic racial subordination in our
region and nationally, implicit biases and their implications for edu-
cators, the impacts of poverty and trauma on school readiness,
and structural inequalities in high-need education systems.
Promote our region as a destination city for progressive educators and seek to attract the best and brightest teachers from across the country. This requires our region
to be proactive in looking nationwide in our search and hiring
practices, actively recruiting high-potential candidates, and
further developing successful models like teaching residency
programs. Higher quality teachers and administrators can
increase student engagement and better prepare students
for postsecondary education and their careers.
HOUSINGImprove data and information about housing markets, especially in Allegheny County, to shape strategies for housing development. A key part of any policy assessment
is developing the necessary data to inform the decision-
making process. Unfortunately for many service organizations
and local governments interested in affordable housing within
the county, the available data lacks the timeliness and detail
that is needed for informed decision making. Given the popu-
lation stabilization and growth within the Pittsburgh region in
recent years, many communities in the county have experienced
housing demands not captured in data that is five years old. In
order to improve the decision-making capacity of these organi-
zations, an updated, accessible, and well-maintained data set,
including mapping, needs to be developed on the Allegheny
County housing market. This information should capture the
diverse demands of the many discrete housing markets within
the county and be made publicly available to service organiza-
tions and local governments.
Establish better linkages among transportation, housing, and employment opportunities in Allegheny County and surrounding areas. Both naturally occurring and subsi-
dized affordable housing are concentrated within the City of
Pittsburgh, eastern suburbs, and the Mon Valley. Low-income
jobs are spread fairly evenly throughout Allegheny County in
both the city and outlying municipalities. Given the mobility
issues for many residents living in poverty in the county,
especially those living in the suburbs, having access to employ-
ment opportunities can be difficult. In light of these geographic
issues, local governments and organizations should work toward
developing affordable housing and transportation options
within communities north and west of the city so residents
living in poverty can better access employment opportunities
in those areas.

POVERTY: BEYOND THE URBAN CORE 29
A key tool in developing these linkages will be multi-munic-
ipal planning, which allows local governments to work with
neighboring communities to plan residential and commercial
development and transportation projects with a regional
mind-set. Multi-municipal planning also allows municipalities
to better address issues that cross municipal boundaries, such
as affordable housing and transportation, given the larger
geographic scope of the planning process. This is especially
important in Allegheny County because of its fragmented
municipal structure.
Develop better supportive housing options for residents with disabilities. Within the county, recent affordable housing
demands have oversaturated the senior housing market,
leaving other vulnerable populations, such as those with
disabilities, still in need of affordable housing options. One
option to remedy this would be to repurpose existing subsi-
dized housing stock currently designated for senior citizens
to help meet the needs of disabled residents. Also, future
affordable housing developments should be more geared
toward disabled residents.
Work to better retain existing affordable housing options through the preservation and maintenance of existing affordable housing. During the Pittsburgh region’s
recent revitalization, increased demands for housing, especially
within the City of Pittsburgh, has resulted in the disappearance
of many affordable housing options. Given the significantly
higher cost to construct new affordable housing as compared
to preserving existing housing stock, this growth in demand
will continue to put additional stresses on affordable hous-
ing service providers to keep pace with affordable housing
demands in the county. As a result, local governments and
service organizations should work together to incentivize the
preservation and maintenance of existing affordable housing
as a more efficient means of addressing housing needs in
the county.
ECONOMIC INEQUALITYImprove opportunities for upward mobility by eliminating benefits cliffs. Currently, many state benefits programs
dissuade individuals and families from progressing to greater
levels of self-sufficiency because of what is known as the
benefits cliff. The cliff occurs when benefits stop abruptly
after what may be only a modest increase in the earnings
of a program participant, resulting in a net loss of income.
This perpetuates income inequality by limiting opportunities
for lower- and middle-income families to accept higher wages
and move forward in their careers. The commonwealth should
work to eliminate benefits cliffs in current and future programs
in an effort to encourage upward mobility.
Consider the positive impact of an increase to the mini-mum wage in Pennsylvania. The legislature should consider
the issue of whether the minimum wage should be a living
wage or a wage that reflects the economic worth of the labor
in Pennsylvania. This examination should include impacts
on employees receiving an increased wage, employees who
may already be at or just above that wage, employers’ costs,
incentives for advancement, and job creation and stability.
Additionally, this examination should include a careful analysis
of the potential effects of an increased minimum wage on
benefits programs as Pennsylvanians are moved past existing
benefits thresholds.
Establish a Pennsylvania Earned Income Tax Credit that would supplement the federal Earned Income Tax Credit. In establishing an Earned Income Tax Credit in Pennsylvania,
the legislature should balance the economic stimulus gener-
ated by the credit against the cost to the Pennsylvania budget.
Additionally, the costs and benefits associated with a lump
sum or periodic payment of the tax credit to individuals need
to be addressed.
Examine policies to address effectively the inequality in earnings between genders. Reducing the pay gap between
men and women is beneficial both to the economy as a whole
and to women and their families. In 2012, if women had
received equal pay, the U.S. economy would have produced an
additional $450 billion GDP.216 Additionally, equal pay would
cut the poverty rate for working women from 8.1 percent
to 3.9 percent.217 For single female-headed households this
change would be even more dramatic, cutting the poverty rate
from 28.7 percent to 15 percent if pay equity was achieved.218
Increase communication and sharing of data between state-level agencies and local governments and school districts to enable increased evaluation and accountabil-ity of human service programs. An important aspect of
addressing poverty and economic inequality is the develop-
ment and administration of effective and efficient government
programs. Without sufficient communication and sharing of
data between government agencies on all levels, program-
matic decision making is hindered by insufficient information
to gauge the outcomes of policy decisions. Through the devel-
opment of better communication mechanisms, state and local
agencies will be better able to diagnose issues facing the com-
munity and implement effective and efficient data-supported
solutions to address community needs.
Encourage the development of financial literacy pro-gramming in the education and nonprofit sectors for individuals at all income levels. Financial literacy is important
for individuals and families of all economic backgrounds.
30 POVERTY: BEYOND THE URBAN CORE
Through a sound understanding of basic financial skills, such
as balancing a checkbook, understanding interest rates, and
household budgeting, individuals and families can make finan-
cial decisions that provide them with a better cushion during
lean economic times or catastrophic life events. More robust
financial literacy programming could help to reduce income
inequality by preventing middle-class families from descending
into poverty as a result of catastrophic events and helping fami-
lies in poverty to develop greater financial stability.
TRANSPORTATION Develop land use policies that promote transit-oriented development and active transportation. As the South-
western Pennsylvania region continues its revitalization, local
governments need to better integrate development with the
transportation systems within their communities for both public
transportation and active transportation, like walking and
biking. This type of development would be designed to encour-
age use of and be concentrated around public transportation
and pedestrian and bike infrastructure. Future transit-oriented
development needs to emphasize affordable housing options
so that low-income public transportation users can utilize the
new development hubs within the county.
Complement the Port Authority of Allegheny County’s system by expanding microtransit throughout the county using the Heritage Community Transportation model. Heritage Community Transportation, in partnership with the
Port Authority, provides an invaluable service to residents living
in poverty in the Mon Valley and East Hills of Allegheny County.
Similar microtransit transportation organizations could provide
residents of other areas in the county with inexpensive access in
their communities and links to Port Authority public transpor-
tation. This would enable Allegheny County residents living in
poverty to have better access to employment, education, and
human services.
Expand suburban park and ride facilities in areas farther from the county’s urban core. Given the restrictions on
Act 89 funding for capital projects, park and rides offer the
Port Authority one option to increase public transportation
access and ridership within the county. The park and ride
facilities would provide low cost access for county residents to
Downtown and Oakland employment centers.
Offer broader public transportation subsidies for riders living in poverty. Access to inexpensive, reliable transporta-
tion is critical for county residents to participate in the regional
economy. Through targeted subsidies to the region’s most
vulnerable residents, more people will be able to participate
in the economic revitalization of the region and gain access
to county and local service providers.
APPENDIX
MEASURING INCOME Contention arises from what should be included in a house-
hold’s income. Depending on what is included within the
income calculation and the sharing unit, income inequality
can appear to be significantly different. Measuring income can
typically be done in one of four ways:
• Pretax, Pretransfer (Cash Market) Income distribution
of cash market income among tax units, demonstrating this
is typically how middle-class Americans are compensated
for their labor
• Pretax, Posttransfer Income includes cash market income
and income from welfare transfer programs, social insurance
programs, and other government-provided cash assistance.
This measurement does not include transfers directly
tied to the tax system and in-kind government transfers
such as Earned Income Tax Credits (EITC) or Medicare/
Medicaid insurance.
• Posttax, Posttransfer Income includes all of the income
categories from pretax, posttransfer income as well as tax
credits and liabilities.
• Posttax, Posttransfer Income Plus Health Insurance
income measurement includes all of the income categories
of posttax, posttransfer income and also incorporates the
ex ante value of employer contributions to employee health
premiums and Medicaid/Medicare. This income measure
ment attempts to better assess the overall economic
resources available to individuals.
In addition to how income is measured, another important
issue in determining income inequality is the size and type of
the sharing unit being measured. A sharing unit is a group
of people who share resources within a household. Depending
on the situation, that could include a single individual, a family,
or roommates. Ultimately, referring to a sharing unit could
mean any of the following:
• Tax Unit Sharing Unit: This type of unit only includes
single tax units. Typically, this consists of an adult, his
or her spouse, and any dependent children.
• Household Sharing Unit: This unit incorporates nontradi
tional multiple tax units into one household sharing unit.
These units can include cohabiters, roommates who share
expenses, children who move back in with their parents,
or older parents who live with their adult children.
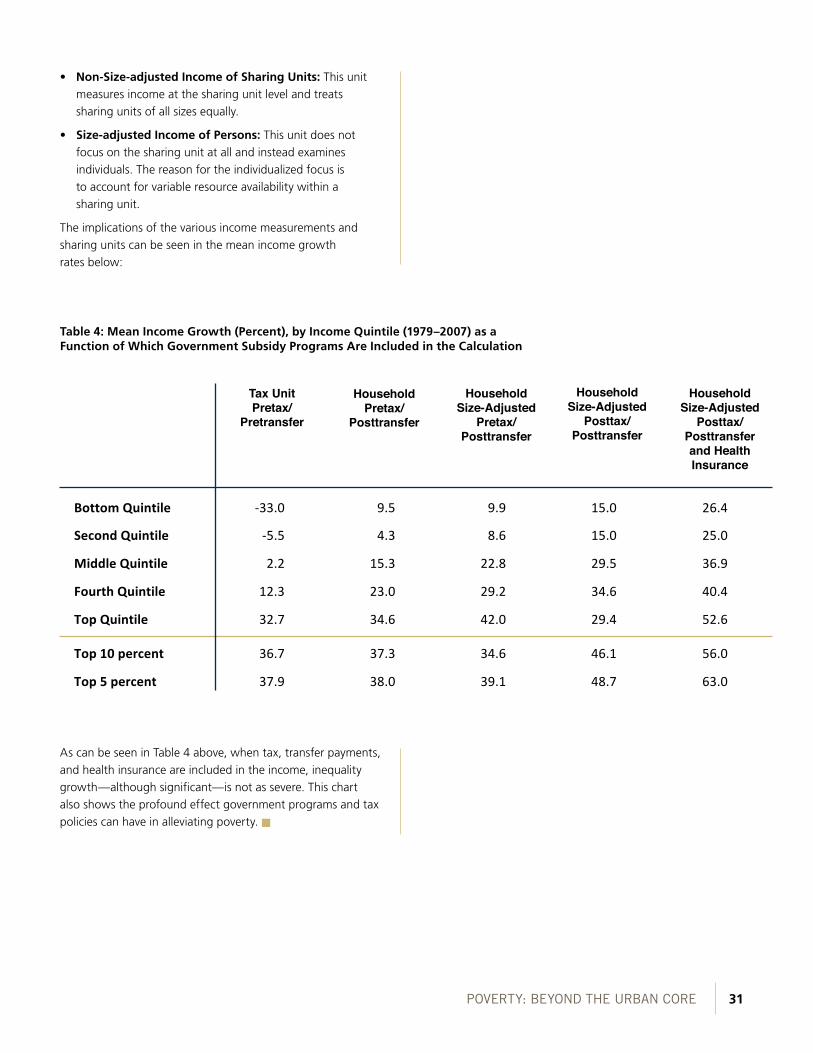
POVERTY: BEYOND THE URBAN CORE 31
• Non-Size-adjusted Income of Sharing Units: This unit
measures income at the sharing unit level and treats
sharing units of all sizes equally.
• Size-adjusted Income of Persons: This unit does not
focus on the sharing unit at all and instead examines
individuals. The reason for the individualized focus is
to account for variable resource availability within a
sharing unit.
The implications of the various income measurements and
sharing units can be seen in the mean income growth
rates below:
As can be seen in Table 4 above, when tax, transfer payments,
and health insurance are included in the income, inequality
growth—although significant—is not as severe. This chart
also shows the profound effect government programs and tax
policies can have in alleviating poverty. n
Table 4: Mean Income Growth (Percent), by Income Quintile (1979–2007) as a Function of Which Government Subsidy Programs Are Included in the Calculation
Tax Unit Pre-‐Tax/Pre-‐Transfer
Household Pre-‐Tax/Post-‐Transfer
Household Size-‐Adjusted Pre-‐Tax/Post-‐Transfer
Household Size-‐Adjusted Post-‐Tax/Post-‐Transfer
Household Size-‐Adjusted Post-‐Tax/Post-‐Transfer + Health Insurance
Bottom Quintile -‐33.0 9.5 9.9 15.0 26.4
Second Quintile -‐5.5 4.3 8.6 15.0 25.0
Middle Quintile 2.2 15.3 22.8 29.5 36.9
Fourth Quintile 12.3 23.0 29.2 34.6 40.4
Top Quintile 32.7 34.6 42.0 29.4 52.6
Top 10 percent 36.7 37.3 34.6 46.1 56.0
Top 5 percent 37.9 38.0 39.1 48.7 63.0
HouseholdSize-Adjusted
Posttax/ Posttransfer and Health Insurance
HouseholdSize-Adjusted
Posttax/ Posttransfer
HouseholdSize-Adjusted
Pretax/ Posttransfer
HouseholdPretax/
Posttransfer
Tax UnitPretax/
Pretransfer
Tax Unit Pre-‐Tax/Pre-‐Transfer
Household Pre-‐Tax/Post-‐Transfer
Household Size-‐Adjusted Pre-‐Tax/Post-‐Transfer
Household Size-‐Adjusted Post-‐Tax/Post-‐Transfer
Household Size-‐Adjusted Post-‐Tax/Post-‐Transfer + Health Insurance
Bottom Quintile -‐33.0 9.5 9.9 15.0 26.4
Second Quintile -‐5.5 4.3 8.6 15.0 25.0
Middle Quintile 2.2 15.3 22.8 29.5 36.9
Fourth Quintile 12.3 23.0 29.2 34.6 40.4
Top Quintile 32.7 34.6 42.0 29.4 52.6
Top 10 percent 36.7 37.3 34.6 46.1 56.0
Top 5 percent 37.9 38.0 39.1 48.7 63.0

32 POVERTY: BEYOND THE URBAN CORE
NOTES1. U.S. Bureau of Labor Statistics, A Profile of the Working
Poor, 2012 (Washington, DC: U.S. Bureau of Labor Statistics,
2014), 2.
2. Ibid, 5.
3. Elizabeth Kneebone and Alan Berube, Confronting
Suburban Poverty in America (Washington, DC: Brookings
Institution Press, 2013).
4. Alana Semuels, “Suburbs and the New American Poverty,”
The Atlantic, January 7, 2015, http://www.theatlantic.com/
business/archive/2015/01/suburbs-and-the-new-american-pov-
erty/384259.
5. “Southwestern Pennsylvania Community Profiles,” accessed
August 3, 2016, https://profiles.ucsur.pitt.edu.
6. Mary Niederberger, “Pittsburgh Suburbs Suffering Poverty
at High Rate,” Pittsburgh Post-Gazette, November 17, 2013,
http://www.post-gazette.com/local/region/2013/11/18/
Suburbs-suffering-at-high-rate/stories/201311180136 (accessed
August 3, 2016).
7. “Southwestern Pennsylvania Community Profiles: Allegheny
County,” accessed August 3, 2016, https://profiles.ucsur.pitt.
edu/profiles/county/42003/overview.
8. “Southwestern Pennsylvania Community Profiles: Pittsburgh
City,” accessed August 3, 2016, https://profiles.ucsur.pitt.edu/
profiles/county-subdivision/4200361000/overview.
9. Pittsburgh Today, Pittsburgh Today and Tomorrow 2014:
Regional Annual Report (Pittsburgh, PA: Pittsburgh Today,
2014).
10. “U.S. Census Bureau American FactFinder: Selected
Economic Characteristics: 2009–2013 American Community
Survey 5-Year Estimates,” accessed August 4, 2016, http://fact-
finder.census.gov/faces/tableservices/jsf/pages/productview.
xhtml?pid=ACS _13_5YR_DP03&prodType=table.
11. “U.S. Department of Agriculture Economic Research
Service, State Fact Sheets: Pennsylvania,” accessed August 3,
2016, http://www.ers.usda.gov/data-products/state-fact-
sheets/state-data.aspx?StateFIPS=42&StateName=Pennsyl-
vania#.UeQfCo21Fgw.
12. Center for Rural Pennsylvania, Rural by the Numbers:
A Look at Pennsylvania’s Rural Population (Harrisburg, PA:
Center for Rural Pennsylvania, 2008), 4.
13. Pew Charitable Trusts, The Precarious State of Family
Balance Sheets (Philadelphia, PA: Pew Charitable Trusts, 2015), 6.
14. Heather Sandstrom and Sandra Huerta, The Negative
Effects of Instability on Child Development: A Research
Synthesis (Washington, DC: Urban Institute, 2013), 31–32.
15. “The American Presidency Project, Lyndon B. Johnson,
219 - Special Message to the Congress Proposing a
Nationwide War on the Sources of Poverty,” accessed August
3, 2016, http://www.presidency.ucsb.edu/ws/?pid=26109.
16. Drew DeSilver, “Who’s Poor in America? 50 Years into
the ‘War on Poverty,’ a Data Portrait,” Pew Research Center,
January 13, 2014, http://www.pewresearch.org /fact-
tank/2014/01/13/whos-poor-in-america-50-years-into-the-
war-on-poverty-a-data -portrait (accessed June 23, 2015).
17. “U.S. Census Bureau American FactFinder,” accessed June
23, 2015, http://factfinder.census.gov/faces/nav/jsf/pages/
index.xhtml.
18. Drew DeSilver, “Who’s Poor in America? 50 Years into
the ‘War on Poverty,’ a Data Portrait,” Pew Research Center,
January 13, 2014, http://www.pewresearch.org /fact-
tank/2014/01/13/whos-poor-in-america-50-years-into-the-
war-on-poverty-a-data-portrait (accessed June 23, 2015).
19. “U.S. Census Bureau American FactFinder,” accessed June
23, 2015, http://factfinder.census.gov/faces/nav/jsf/pages/
index.xhtml.
20. Alexandra Cawthorne, Elderly Poverty: The Challenge
Before Us (Washington, DC: Center for American Progress,
2008), 1.
21. Drew DeSilver, “Who’s Poor in America? 50 Years into
the ‘War on Poverty,’ a Data Portrait,” Pew Research Center,
January 13, 2014, http://www.pewresearch.org /fact-
tank/2014/01/13/whos-poor-in-america-50-years-into-the-
war-on-poverty-a-data-portrait (accessed June 23, 2015).
22. “U.S. Census Bureau American FactFinder,” accessed June
23, 2015, http://factfinder.census.gov/faces/nav/jsf/pages/
index.xhtml.
23. Robert D. Putnam, Our Kids: The American Dream in Crisis
(New York: Simon & Schuster, 2015), 114.
24. Ibid, 116.
25. Drew DeSilver, “Who’s Poor in America? 50 Years into
the ‘War on Poverty,’ a Data Portrait,” Pew Research Center,
January 13, 2014, http://www.pewresearch.org /fact-
tank/2014/01/13/whos-poor-in-america-50-years-into-the-
war-on-poverty-a-data-portrait (accessed June 23, 2015).
26. “U.S. Census Bureau American FactFinder,” accessed June
23, 2015, http://factfinder.census.gov/faces/nav/jsf/pages/
index.xhtml.
POVERTY: BEYOND THE URBAN CORE 33
27. William Julius Wilson, The Truly Disadvantaged: The
Inner City, the Underclass, and Public Policy, Second Edition
(Chicago: University of Chicago Press, 2012), 252.
28. Philip Bump, “Black Unemployment Is Always Much Worse
than White Unemployment. But the Gap Depends on Where
You Live,” The Fix (blog), September 6, 2014, http://www.
washingtonpost.com/blogs/the-fix/wp/2014/09/06/black-
unemployment-is-always-much-worse-than-white-unemploy-
ment-but-the-gap-depends-on-where-you-live.
29. Drew DeSilver, “Who’s Poor in America? 50 Years into
the ‘War on Poverty,’ a Data Portrait,” Pew Research Center,
January 13, 2014, http://www.pewresearch.org /fact-
tank/2014/01/13/whos-poor-in-america-50-years-into-the-
war-on-poverty-a-data-portrait (accessed June 23, 2015).
30. “U.S. Census Bureau American FactFinder,” accessed June
23, 2016, http://factfinder.census.gov/faces/nav/jsf/pages/
index.xhtml.
31. Drew DeSilver, “Who’s Poor in America? 50 Years into
the ‘War on Poverty,’ a Data Portrait,” Pew Research Center,
January 13, 2014, http://www.pewresearch.org /fact-
tank/2014/01/13/whos-poor-in-america-50-years-into-the-
war-on-poverty-a-data-portrait (accessed June 23, 2015).
32. Ibid.
33. Ibid.
34. Robert D. Putnam, Our Kids: The American Dream in Crisis
(New York: Simon & Schuster, 2015), 66.
35. U.S. Bureau of Labor Statistics, A Profile of the Working
Poor, 2012 (Washington, DC: U.S. Bureau of Labor Statistics,
2014), 2.
36. Ibid, 1.
37. Ibid, 1.
38. Ibid, 1
39. Ibid, 1.
40. Ibid, 1–2.
41. Ibid, 1–2.
42. Ibid, 2.
43. Ibid, 4.
44. Ibid, 5.
45. Ibid, 5.
46. Ibid, 5–6.
47. Ibid, 6.
48. Ibid, 6.
49. Alemayehu Bishaw, Poverty: 2000 to 2012: American
Community Survey Briefs (Washington, DC: U.S. Census
Bureau, 2013), 2.
50. “Income, Poverty and Health Insurance Coverage in the
United States: 2011,” accessed August 3, 2016, https://www.
census.gov/newsroom/releases/archives /income_wealth/cb12-
172.html.
51. Elizabeth Kneebone and Alan Berube, Confronting
Suburban Poverty in America (Washington, DC: Brookings
Institution Press, 2013).
52. Alana Semuels, “Suburbs and the New American Poverty,”
The Atlantic, January 7, 2015, http://www.theatlantic.com/
business/archive/2015/01/suburbs-and-the-new-american-
poverty/384259.
53. Mark Mather, Kelvin Pollard, and Linda A. Jacobsen,
Reports on America: First Results from the 2010 Census
(Washington, DC: Population Reference Bureau, 2011), 15.
54. William H. Frey, “New Census Data: Selective City
Slowdowns and the City-Suburb Growth Gap,” The Avenue
(blog), May 21, 2015, http://www.brookings.edu/the
-avenue/posts/2015/05/21-new-census-data-city-slowdowns-
city-suburb-growth-gap-frey.
55. Alana Semuels, “Suburbs and the New American Poverty,”
The Atlantic, January 7, 2015, http://www.theatlantic.com/
business/archive/2015/01/suburbs-and-the-new-american-
poverty/384259//.
56. Mark Mather, Kelvin Pollard, and Linda A. Jacobsen,
Reports on America: First Results from the 2010 Census
(Washington, DC: Population Reference Bureau, 2011), 15.
57. Jane R. Williams and Alan Berube, “The Metropolitan
Geography of Low-Wage Work,” The Avenue (blog), http://
www.brookings.edu/blogs/the-avenue/posts/2014/02 /10-
metropolitan-geography-low-wage-work-williams-berube.
58. Ibid.
59. Alan Berube, All Cities Are Not Created Unequal
(Washington, DC: Brookings Institution, 2014).
60. Jill H. Wilson and Nicole Prchal Svajlenka, Immigrants
Continue to Disperse, with Fastest Growth in the Suburbs
(Washington, DC: Brookings Institution, 2014).
61. Janie Boschma, “America’s Immigrants Are Moving to the
Suburbs,” National Journal, December 11, 2014, http://www.
nationaljournal.com/next-america/economic -empowerment/
americas-immigrants-are-moving-suburbs (accessed August 3,
2016).
34 POVERTY: BEYOND THE URBAN CORE
62. Elizabeth Kneebone, Job Sprawl Revisited: The Changing
Geography of Metropolitan Employment (Washington, DC:
Brookings Institution, 2009).
63. Pittsburgh Today, Pittsburgh Today and Tomorrow 2014:
Regional Annual Report (Pittsburgh, PA: Pittsburgh Today,
2014).
64. “U.S. Census Bureau American FactFinder, Selected
Economic Characteristics, 2009–2013 American Community
Survey 5-Year Estimates,” accessed August 4, 2016, http://fact-
finder.census.gov/faces/tableservices/jsf/pages/productview.
xhtml?pid=ACS _13_5YR_DP03&prodType=table.
65. Mary Niederberger, “Pittsburgh Suburbs Suffering Poverty
at High Rate,” Pittsburgh Post-Gazette, November 17, 2013,
http://www.postgazette.com/local/region /2013/11/18/
Suburbs-suffering-at-high-rate/stories/201311180136 (accessed
August 3, 2016).
66. “Southwestern Pennsylvania Community Profiles,
Allegheny County,” accessed August 3, 2016, https://profiles.
ucsur.pitt.edu/profiles/county/42003/overview.
67. “U.S. Census Bureau American FactFinder,” accessed
August 3, 2016, http://factfinder.census.gov/faces/nav/jsf/
pages/index.xhtml.
68. “Southwestern Pennsylvania Community Profiles,
Pittsburgh City,” accessed August 3, 2016, https://profiles.
ucsur.pitt.edu/profiles/county-subdivision /4200361000/
overview.
69. Allegheny County Department of Human Services, “2012
Pittsburgh Need Index: Pittsburgh City Census Tracts.”
70. Megan Good, Kathryn Collins, and Erin Dalton, Suburban
Poverty: Assessing Community Need Outside the Central City
(Pittsburgh, PA: Allegheny County Department of Human
Services, 2014), 11.
71. Ibid, 16.
72. Ibid, 3.
73. “Table 1. Urban and Rural Population: 1900 to 1990,”
accessed August 3, 2016, http://www.census.gov/population/
www/censusdata/files/urpop0090.txt.
74. Center for Rural Pennsylvania, A 60-Year Perspective on
Pennsylvania’s Rural Population (Harrisburg, PA: Center for
Rural Pennsylvania, 2009).
75. “U.S. Census Bureau American FactFinder, Urban and
Rural, 2010 Census Summary File 1,” accessed August 3, 2016,
http://factfinder.census.gov/faces /tableservices/jsf/pages /
productview.xhtml?pid=DEC_10_SF1_P2&prodType=table.
76. Kathleen Pickering and others, Welfare Reform in
Persistent Rural Poverty: Dreams, Disenchantments, and
Diversity (University Park, PA: Penn State University Press,
2006), 49.
77. Ibid, 49.
78. Ibid, 20.
79. C. Nielsen Brasher and others, Welfare Reform: The
Experience of Rural Pennsylvania (Shippensburg, PA: Center
for Applied Research and Policy Analysis of Shippensburg
University of Pennsylvania, 2002), 4.
80. Ibid, 6.
81. Ibid, 7.
82. Ibid, 7, 9.
83. Ibid, 8.
84. Ibid, 9.
85. Ibid, 9.
86. Ibid, 14.
87. “U.S. Department of Agriculture Economic Research
Service, State Fact Sheets: Pennsylvania,” accessed August
3, 2016, http://www.ers.usda.gov/data-products/state-fact-
sheets/state-data.aspx?StateFIPS=42&StateName=Pennsylva-
nia#.UeQfCo21Fgw.
88. Center for Rural Pennsylvania, Rural by the Numbers:
A Look at Pennsylvania’s Rural Population (Harrisburg, PA:
Center for Rural Pennsylvania, 2008), 4.
89. Ibid, 3.
90. Nancy M. Pindus, Implementing Welfare Reform in Rural
Communities (Washington, DC: Urban Institute, 2001), 9.
91. John Pender, “Foundation Giving to Rural Areas in the
United States Is Disproportionately Low,” Amber Waves,
August 3, 2015, http://www.ers.usda.gov/amber-waves/2015-
august/foundation-giving-to-rural-areas-in-the-united-states-
is-disproportionately-low.aspx#.Vh6c9MtxPct (accessed
August 3, 2016).
92. “Secretary Vilsack Urges Philanthropists to Seek
Partnerships, Smart Investments to Maximize Impact in Rural
America,” last modified July 27, 2001, accessed August 3,
2016, http://www.usda.gov/wps/portal/usda/usdahome?con-
tentidonly=true&contentid =2011/07/0323.xml.
93. Steve Suitts, Pamela Barba, and Katherine Dunn, A New
Majority: Low Income Students Now a Majority in the Nation’s
Public Schools (Atlanta, GA: Southern Education Foundation,
2015), 5.
POVERTY: BEYOND THE URBAN CORE 35
94. Elizabeth Kneebone and Alan Berube, Confronting
Suburban Poverty in America (Washington, DC: Brookings
Institution Press, 2013).
95. Steve Suitts, Pamela Barba, and Katherine Dunn, A New
Majority: Low Income Students Now a Majority in the Nation’s
Public Schools (Atlanta, GA: Southern Education Foundation,
2015), 2.
96. Ibid, 2.
97. Ibid, 3.
98. Ibid, 6.
99. Ibid, 6.
100. Ibid, 1.
101. Sean F. Reardon, “The Widening Academic Achievement
Gap between the Rich and the Poor: New Evidence and
Possible Explanations,” in Whither Opportunity? Rising
Inequality, Schools, and Children’s Life Changes, ed. Greg
J. Duncan and Richard J. Murnane (New York: Russell Sage
Foundation, 2011), 4.
102. Executive Office of the President, Increasing College
Opportunity for Low-Income Students: Promising Models
and a Call to Action (Washington, DC: Executive Office of the
President, 2014), 12.
103. Ibid, 12.
104. Ibid, 14.
105. Robert D. Putnam, Our Kids: The American Dream in
Crisis (New York: Simon & Schuster, 2015), 190.
106. Child Care Aware of America, Parents and the High Cost
of Child Care: 2014 Report (Arlington, VA: Child Care Aware of
America, 2014), 9–10.
107. Robert D. Putnam, Our Kids: The American Dream in
Crisis (New York: Simon & Schuster, 2015), 249.
108. Elise Gould and Tanyell Cooke, “High Quality Child
Care Is Out of Reach for Working Families,” Economic Policy
Institute Issue Brief 404 (2015), 4.
109. Ibid, 6.
110. Ibid, 5.
111. Ibid, 6.
112. “Southwestern Pennsylvania Community Profiles, Clairton
City,” accessed August 3, 2016, https://profiles.ucsur.pitt.edu/
profiles/county-subdivision/4200313704/overview.
113. “Southwestern Pennsylvania Community Profiles,
Duquesne City,” accessed August 3, 2016, https://profiles.
ucsur.pitt.edu/profiles/county-subdivision /4200320432/overview.
114. “Southwestern Pennsylvania Community Profiles, East
McKeesport Borough,” accessed August 3, 2016, https://pro-
files.ucsur.pitt.edu/profiles/county-subdivision /4200321444/
overview.
115. “Southwestern Pennsylvania Community Profiles, Wall
Borough,” accessed August 3, 2016, https://profiles.ucsur.pitt.
edu/profiles/county-subdivision /4200380600/overview.
116. “Southwestern Pennsylvania Community Profiles,
Wilmerding Borough,” accessed August 3, 2016, https://pro-
files.ucsur.pitt.edu/profiles/county-subdivision /4200385496/
overview.
117. “Southwestern Pennsylvania Community Profiles, North
Versailles Township,” accessed August 3, 2016, https://profiles.
ucsur.pitt.edu/profiles/county-subdivision /4200355488/
overview.
118. “Southwestern Pennsylvania Community Profiles,
Dravosburg Township,” accessed August 3, 2016, https://pro-
files.ucsur.pitt.edu/profiles/county-subdivision /4200319856/
overview.
119. “Southwestern Pennsylvania Community Profiles,
McKeesport City,” accessed August 3, 2016, https://profiles.
ucsur.pitt.edu/profiles/county-subdivision /4200346256/
overview.
120. “Southwestern Pennsylvania Community Profiles, South
Versailles Township,” accessed August 3, 2016, https://profiles.
ucsur.pitt.edu/profiles/county-subdivision /4200372568/
overview.
121. “Southwestern Pennsylvania Community Profiles,
Versailles Borough,” accessed August 3, 2016, https://profiles.
ucsur.pitt.edu/profiles/county-subdivision /4200380040/
overview.
122. “Southwestern Pennsylvania Community Profiles, White
Oak Borough,” accessed August 3, 2016, https://profiles.ucsur.
pitt.edu/profiles/county-subdivision /4200384704/overview.
123. “Southwestern Pennsylvania Community Profiles, Penn
Hills Township,” accessed August 3, 2016, https://profiles.
ucsur.pitt.edu/profiles/county-subdivision /4200359032/
overview.
124. “Southwestern Pennsylvania Community Profiles,
Homestead Borough,” accessed August 3, 2016, https://pro-
files.ucsur.pitt.edu/profiles/county-subdivision /4200335424/
overview.
125. “Southwestern Pennsylvania Community Profiles,
Munhall Borough,” accessed August 3, 2016, https://profiles.
ucsur.pitt.edu/profiles/county-subdivision /4200352320/
overview.
36 POVERTY: BEYOND THE URBAN CORE
126. “Southwestern Pennsylvania Community Profiles, West
Homestead Borough,” accessed August 3, 2016, https://pro-
files.ucsur.pitt.edu/profiles/county-subdivision /4200383200/
overview.
127. “Southwestern Pennsylvania Community Profiles, McKees
Rocks Borough,” accessed August 3, 2016, https://profiles.
ucsur.pitt.edu/profiles/county-subdivision /4200346264/
overview.
128. “Southwestern Pennsylvania Community Profiles, Stowe
Township,” accessed August 3, 2016, https://profiles.ucsur.pitt.
edu/profiles/county-subdivision /4200374648/overview.
129. “Southwestern Pennsylvania Community Profiles,
Wilkinsburg Borough,” accessed August 3, 2016, https://pro-
files.ucsur.pitt.edu/profiles/county-subdivision /4200385188/
overview.
130. “Southwestern Pennsylvania Community Profiles,
Braddock Borough,” accessed August 3, 2016, https://profiles.
ucsur.pitt.edu/profiles/county-subdivision /4200307992/
overview.
131. “Southwestern Pennsylvania Community Profiles,
Braddock Hills Borough,” accessed August 3, 2016, https://pro-
files.ucsur.pitt.edu/profiles/county-subdivision /4200308008/
overview.
132. “Southwestern Pennsylvania Community Profiles,
Chalfant Borough,” accessed August 3, 2016, https://profiles.
ucsur.pitt.edu/profiles/county-subdivision /4200312496/
overview.
133. “Southwestern Pennsylvania Community Profiles,
Churchill Borough,” accessed August 3, 2016, https://profiles.
ucsur.pitt.edu/profiles/county-subdivision /4200313608/
overview.
134. “Southwestern Pennsylvania Community Profiles, East
Pittsburgh Borough,” accessed August 3, 2016, https://profiles.
ucsur.pitt.edu/profiles/county-subdivision /4200321712/
overview.
135. “Southwestern Pennsylvania Community Profiles,
Edgewood Borough,” accessed August 3, 2016, https://pro-
files.ucsur.pitt.edu/profiles/county-subdivision /4200322520/
overview.
136. “Southwestern Pennsylvania Community Profiles, Forest
Hills Borough,” accessed August 3, 2016, https://profiles.ucsur.
pitt.edu/profiles/county-subdivision /4200326592/overview.
137. “Southwestern Pennsylvania Community Profiles, North
Braddock Borough,” accessed August 3, 2016, https://profiles.
ucsur.pitt.edu/profiles/county-subdivision /4200354816/
overview.
138. “Southwestern Pennsylvania Community Profiles, Rankin
Borough,” accessed August 3, 2016, https://profiles.ucsur.pitt.
edu/profiles/county-subdivision /4200363408/overview.
139. “Southwestern Pennsylvania Community Profiles,
Swissvale Borough,” accessed August 3, 2016, https://profiles.
ucsur.pitt.edu/profiles/county-subdivision /4200375816/
overview.
140. “Southwestern Pennsylvania Community Profiles, Turtle
Creek Borough,” accessed August 3, 2016, https://profiles.
ucsur.pitt.edu/profiles/county-subdivision /4200377912/
overview.
141. “Southwestern Pennsylvania Community Profiles, Wilkins
Township,” accessed August 3, 2016, https://profiles.ucsur.pitt.
edu/profiles/county-subdivision /4200385184/overview.
142. William Julius Wilson, The Truly Disadvantaged: The Inner
City, the Underclass and Public Policy, Second Edition (Chicago:
University of Chicago Press, 2012), 258.
143. Ibid, 258.
144. Pew Charitable Trusts, The Precarious State of Family
Balance Sheets (Philadelphia, PA: Pew Charitable Trusts, 2015), 6.
145. Heather Sandstrom and Sandra Huerta, The Negative
Effects of Instability on Child Development: A Research
Synthesis (Washington, DC: Urban Institute, 2013), 28.
146. Ibid, 31–32.
147. “Affordable Housing,” accessed August 3, 2016, http://
portal.hud.gov /hudportal/HUD?src=/program_offices/comm_
planning/affordablehousing.
148. National Low Income Housing Coalition, Out of Reach
2015 (Washington, DC: National Low Income Housing
Coalition, 2015), 1.
149. Ibid, 1.
150. Joint Center for Housing Studies of Harvard University,
The State of the Nation’s Housing 2015 (Cambridge, MA: Joint
Center for Housing Studies of Harvard University, 2015), 31.
151. Ibid, 30.
152. National Low Income Housing Coalition, “Affordable
Housing Is Nowhere to Be Found for Millions,” Housing
Spotlight 5, no. 1 (2015): 4.
153. Ibid, 6.
154. Joint Center for Housing Studies of Harvard University,
The State of the Nation’s Housing 2015 (Cambridge, MA: Joint
Center for Housing Studies of Harvard University, 2015), 30.
155. Ibid, 30.
156. Ibid, 31.
POVERTY: BEYOND THE URBAN CORE 37
157. National Low Income Housing Coalition, Out of Reach
2015 (Washington, DC: National Low Income Housing
Coalition, 2015), 183.
158. Ibid, 13.
159. Ibid, 184.
160. “Southwestern Pennsylvania Community Profiles,
Allegheny County,” accessed August 3, 2016, https://profiles.
ucsur.pitt.edu/profiles/county/42003/overview.
161. Diana Lind, “Eminent Domain: Can We Define Blighted?”
Next City, November 30, 2009, https://nextcity.org/daily/entry/
eminent-domain-can-we-define-blighted (accessed August 3,
2016).
162. National Vacant Properties Campaign, Vacant Properties:
The True Costs to Communities (Washington, DC: Center for
Community Progress, 2005), 3.
163. U.S. Fire Administration, “Vacant Residential Building Fires
(2010–2012),” Topical Fire Report Series 15, no. 11 (2015), 1.
164. Ibid, 1.
165. National Vacant Properties Campaign, Vacant Properties:
The True Costs to Communities (Washington, DC: Center for
Community Progress, 2005), 7.
166. Stephan Whitaker and Thomas J. Fitzpatrick IV,
“Deconstructing Distressed-Property Spillovers: The Effects of
Vacant, Tax-Delinquent, and Foreclosed Properties in Housing
Submarkets,” Journal of Housing Economics 22, no. 2 (2013),
79–91.
167. Eugenia Garvin and others, “More than Just an Eyesore:
Local Insights and Solutions on Vacant Land and Urban
Health,” Journal of Urban Health: Bulletin of the New York
Academy of Medicine 90, no. 3, 412–426.
168. Housing Alliance of Pennsylvania, From Blight to Bright:
A Comprehensive Toolkit for Pennsylvania (Harrisburg, PA:
Housing Alliance of Pennsylvania, 2014), 2.
169. Tri-COG Collaborative, Financial Impact of Blight on the
Tri-COG Communities (Monroeville, PA: Tri-COG Collaborative,
2013), 4.
170. Ibid, 36.
171. Estelle Sommeiller and Mark Price, The Increasingly
Unequal States of America: Income Inequality by State, 1917
to 2012 (Washington, DC: Economic Analysis and Research
Network, 2014), 9.
172. Ibid, 13–14.
173. Ibid, 6.
174. Ibid, 7.
175. Robert D. Putnam, Our Kids: The American Dream in
Crisis (New York: Simon & Schuster, 2015), 34.
176. Keith Miller and David Madland, “As Income Inequality
Rises, America’s Middle Class Shrinks,” Center for American
Progress, December 18, 2014, https://www.americanprogress.
org/issues/economy/news/2014/12/18/101790/as-income-in-
equality-rises-americas-middle-class-shrinks (accessed August
3, 2016).
177. Ibid.
178. Drew DeSilver, “The Many Ways to Measure Economy
Inequality,” Pew Research Center, September 22, 2016,
http://www.pewresearch.org/fact-tank/2015/09/22/the-ma-
ny-ways-to-measure-economic-inequality (accessed August 3,
2016).
179. Signe-Mary McKernan and others, “Nine Charts about
Wealth Inequality in America,” Urban Institute, February 2015,
http://datatools.urban.org/Features/wealth-inequality-charts
(accessed August 3, 2016).
180. Ibid.
181. Keith Miller and David Madland, “As Income Inequality
Rises, America’s Middle Class Shrinks,” Center for American
Progress, December 18, 2014, https://www.americanprogress.
org/issues/economy/news/2014/12/18/101790/as-income-
inequality-rises-americas-middle-class-shrinks (accessed
August 3, 2016).
182. Ibid.
183. The Pew Charitable Trusts. “Pursuing the American
Dream: Economic Mobility Across Generations.” Economic
Mobility Project, July 2012, 6.
184. Rakesh Kochhar and Richard Fry, “Wealth Inequality
Has Widened along Racial, Ethnic Lines since End of Great
Recession,” Pew Research Center, December 12, 2014, http://
www.pewresearch.org/fact-tank/2014/12/12/racial-wealth-
gaps-great-recession (accessed August 3, 2016).
185. Ibid.
186. Ibid.
187. Pew Charitable Trusts, Pursuing the American Dream:
Economic Mobility Across Generations (Philadelphia, PA:
Pew Charitable Trusts, 2012), 18.
188. Ibid, 19.
189. Bhashkar Mazumder, “Black-White Differences in
Intergenerational Economic Mobility in the United States,”
Economic Perspectives 38 (2014), 14.
190. Ibid.
191. Ibid.
38 POVERTY: BEYOND THE URBAN CORE
192. U.S. Bureau of Labor Statistics, “Characteristics of
Minimum Wage Workers, 2015,” BLS Reports 1061 (2016),
Table 1.
193. Ibid, Table 3.
194. Ibid, Table 1.
195. “National Conference of State Legislators, State Minimum
Wages | 2016 Minimum Wage by State,” accessed August 3,
2016, http://www.ncsl.org/research/labor-and-employment/
state-minimum-wage-chart.aspx.
196. “Oregon State Legislature, Oregon Legislative
Information, 2016 Regular Session, SB 1532 A,” accessed
August 3, 2016, https://olis.leg.state.or.us/liz/2016R1/Measures
/Overview/SB1532.
197. “Current Population Survey (CPS), Annual Social and
Economic (ASEC) Supplement, 2014 Person Income Table of
Contents,” accessed August 3, 2016, http://www.census.gov/
hhes/www/cpstables/032015/perinc/pinc05_000.htm.
198. “U.S. Census Bureau American FactFinder, Earnings
in the Past 12 Months (in 2014 Inflation-Adjusted Dollars),
2010–2014 American Community Survey 5-Year Estimates,”
accessed August 3, 2016, http://factfinder.census.gov/faces/
tableservices /jsf/pages/productview.xhtml?pid=ACS_14_5YR_
S2001&prodType=table.
199. “Current Population Survey (CPS), Annual Social and
Economic (ASEC) Supplement, 2014 Person Income Table of
Contents,” accessed August 3, 2016, http://www.census.gov/
hhes/www/cpstables/032015/perinc/pinc05_000.htm.
200. “U.S. Census Bureau American FactFinder, Household
Type by Relatives and Nonrelatives for Population in
Households, 2010–2014 American Community Survey 5-Year
Estimates,” accessed August 3, 2016, http://factfinder.
census.gov/faces /tableservices/jsf/pages/productview.xhtm-
l?pid=ACS_14_5YR_B11002&prodType =table.
201. “U.S. Census Bureau American FactFinder, Selected
Economic Characteristics, 2010–2014 American Community
Survey 5-Year Estimates,” accessed August 3, 2016, http://fact-
finder.census.gov/faces/tableservices/jsf/pages/productview.
xhtml?pid =ACS_14_5YR_DP03&prodType=table.
202. Patrick Sharkey and Bryan Graham, Mobility and the
Metropolis: How Communities Factor into Economic Mobility
(Philadelphia, PA: Pew Charitable Trusts, 2013), 8–9.
203. Richard Florida and Charlotta Mellander, Segregated City:
The Geography of Economic Segregation in America’s Metros
(Toronto, ON: Martin Prosperity Institute, 2015), 34.
204. Adie Tomer and others, Missed Opportunity: Transit and
Jobs in Metropolitan America (Washington, DC: Brookings
Institution, 2011), 12.
205. Federal Highway Administration, FHWA NHTS Brief:
Mobility Challenges for Households in Poverty (Washington,
DC: Federal Highway Administration, 2014), 2.
206. Megan Good, Kathryn Collins, and Erin Dalton, Suburban
Poverty: Assessing Community Need Outside the Central City
(Pittsburgh, PA: Allegheny County Department of Human
Services, 2014), 17.
207. Ibid, 17.
208. Smart Growth America, Measuring Sprawl 2014
(Washington, DC: Smart Growth America, 2014), 9–10.
209. Sarah M. Kaufman and others, Mobility, Economic
Opportunity and New York City Neighborhoods (New York:
New York University Robert F. Wagner Graduate School of
Public Service Rudin Center for Transportation Policy and
Management, 2015), 26–27.
210. Daniel G. Chatman and Robert B. Noland, “Transit
Service, Physical Agglomeration and Productivity in US
Metropolitan Areas,” Urban Studies 51, no. 5 (2014): 917–937.
211. Bureau of Labor Statistics, “Table 1101. Quintiles of
Income before taxes: Annual expenditures means, shares,
standard errors, and coefficients of variation, Consumer
Expenditure Survey, 2014.” Consumer Expenditure Survey,
2014. http://www.bls.gov/cex/2014/combined/quintile.pdf.
212. Federal Highway Administration, FHWA NHTS Brief:
Mobility Challenges for Households in Poverty (Washington,
DC: Federal Highway Administration, 2014), 1.
213. “2013 Report Card for America’s Infrastructure,”
accessed August 3, 2016, http://www.infrastructurereportcard.
org/a/#p/transit/overview.
214. Port Authority of Allegheny County, “Port Authority of
Allegheny County: December 2015.”
215. Megan Good, Kathryn Collins, and Erin Dalton, Suburban
Poverty: Assessing Community Need Outside the Central City
(Pittsburgh, PA: Allegheny County Department of Human
Services, 2014), 17.
216. Heidi Hartmann, Jeffrey Hayes, and Jennifer Clark, How
Equal Pay for Working Women Would Reduce Poverty and
Grow the American Economy (Washington, DC: Institute for
Women’s Policy Research, 2014), 2.
217. Ibid, 2.
218. Ibid, 3.

POVERTY: BEYOND THE URBAN CORE 39

Institute of Politics710 Alumni Hall4227 Fifth AvenuePittsburgh, PA 15260
Tel 412-624-1837Fax 412-624-1141
Web iop.pitt.edu
POLICY BRIEF
EDITOR Terry Miller
MANAGING EDITOR Briana Mihok
TECHNICAL EDITOR Kim Maltempo
INSTITUTE OF POLITICS
DIRECTOR Terry Miller
CHAIR Mark A. Nordenberg
SENIOR POLICY STRATEGIST Briana Mihok
POLICY ANALYST Aaron Lauer
POLICY STRATEGIST INTERN Karlie Haywood
EXECUTIVE ASSISTANT Tracy Papillon
DIRECTOR EMERITUS Moe Coleman
COMMUNICATIONS SERVICES
COMMUNICATIONS MANAGER Jolie Williamson
ART DIRECTOR Rainey Opperman-Dermond
PRODUCTION MANAGER Chuck Dinsmore
EDITORIAL ASSISTANT Sarah Jordan Rosenson
All Institute of Politics publications are available online.
Printed on Rolland Enviro100 Print, which contains 100% post-consumer fibre, is manufactured in Canada using renewable biogas energy and is certified EcoLogo, Processed Chlorine Free and FSC® Certified Recycled.
The University of Pittsburgh is an affirmative action, equal opportunity institution. Published in cooperation with the Department of Communications Services. DCS108620-0916
Related Documents