A Poverty Assessment of the Small Enterprise Foundation on behalf of the Consultative Group to Assist the Poorest Final Report by Catherine van de Ruit, with Julian May, and Benjamin Roberts Poverty and Population Studies Programme University of Natal April 2001 Contact details: Phone 27 31 260 3032 Fax 27 31 260 2359 Email: [email protected]

Welcome message from author
This document is posted to help you gain knowledge. Please leave a comment to let me know what you think about it! Share it to your friends and learn new things together.
Transcript

A Poverty Assessment
of the Small Enterprise Foundation on behalf of the Consultative Group to Assist the Poorest
Final Report
by
Catherine van de Ruit, with Julian May, and Benjamin Roberts
Poverty and Population Studies Programme University of Natal
April 2001
Contact details:
Phone 27 31 260 3032 Fax 27 31 260 2359 Email: [email protected]

2
Acknowledgements It was a privilege to have been invited by the Consultative Group to Assist the Poorest and the Small Enterprise Foundation to undertake this poverty assessment. It was a pleasure to work with an organisations committed to Poverty Alleviation through the provision of micro-finance. This project was a collaborative effort between the Consultative Group to Assist the Poorest, the Small Enterprise Foundation, the School of Development Studies and the Nkuzi Development Association. We wish to think the staff of the Small Enterprise Foundation for co-operating with the study. Thanks go to the Nkuzi Development Association for bringing their skills and in-depth knowledge of the Northern Province to bear on this study. We also wish to thank those who participated in the study. This project offered a unique opportunity to test the effectiveness of principal component analysis. In addition we were able to compare the performance of principal component analysis with the participatory wealth ranking method used by the Small Enterprise Foundation. In this regard we wish to thank Syed Hashemi, Carla Henry and John de Wit for their energy and time taken to share the mechanisms of these research instruments. We hope to use these techniques in other areas of our work. The manual developed by CGAP was a particularly useful resource.
April 2001

3
Executive summary Introduction
This is a report of the findings of a poverty assessment conducted for the Consultative Group to Assist the Poorest (CGAP), an international service provider to micro-finance institutions, and the Small Enterprise Foundation (SEF), a micro-finance institution (MFI) operating in the Northern Province of South Africa. The poverty assessment is a simple, low-cost operational tool designed to assess the poverty status of clients supported by micro-loans compared to a representative sample of non-clients. This poverty assessment conducted in SEF was an experiment to test the applicability of this instrument to conditions in South Africa. CGAP is a consortium of 27 bilateral and multilateral donor agencies with the mission to improve the capacity of micro-finance institutions to deliver flexible financial services to the very poor on a sustainable basis. CGAP is concerned with the dual objectives of financial and institutional sustainability of micro financial institutions and poverty alleviation through micro finance. CGAP have developed a series of appraisal and monitoring tools which test a MFI’s level of sustainability, organisational health and poverty outreach. SEF is a non-profit organisation, based in the Northern Province of South Africa. SEF has a mission directed towards poverty alleviation through the provision of micro-finance services. SEF has two programmes, the most established of which is the Micro-Credit Programme (MCP). In 1996, SEF introduced a poverty targeted micro-credit programme, the Tshomisano Credit Programme (TCP) that uses a participatory wealth ranking methodology (PWR) to facilitate targeting. As such, assessing the poverty targeting of SEF offers a unique opportunity to compare the depth of poverty outreach between these two programmes as well as the effectiveness of the two methodologies for identifying the poor. Methodology The assessment is a rapid quantitative research method that uses key indicators as proxy measures of poverty. This approach is an assessment tool rather than a targeting tool. The methodology has been standardised to all allow for international comparisons to be made, and to provide donors with an opportunity to make informed decisions about funding allocations on the basis of the MFIs depth of poverty outreach. The poverty assessment is an instrument to measure the levels of well-being of clients entering the Small Enterprise Foundation’s micro-credit programmes. The sampling method required that only new clients entering either of the micro-credit programmes be included in the survey. In total 500 households were interviewed, 201 clients and 299 non-clients. The survey team used the standard questionnaire located in the CGAP Poverty Assessment Manual (CGAP, 2000). It was important to retain the essence of the questionnaire to allow for international comparisons to be made. Some amendments were made to the questionnaire in order to suit local conditions.

4
The method of Principle Components Analysis (PCA) was used to assess the relative poverty of clients in comparison to non-clients. Each household was assigned a score and ranked according to levels of well-being. The sample was divided according to clients and non-clients and then divided into three poverty groups. A small, qualitative in-depth household study was conducted as a background study. The study explored characteristics of poverty not easily captured in cross-sectional quantitative surveys The report sought to address four issues
1. Explore the depth of poverty outreach of SEF's membership in relation to a representative sample of non-SEF clients
2. Compare the poverty profiles of the TCP, the targeted micro-credit programme and MCP, the non-targeted micro-credit programme.
3. Explore the levels of well-being of SEF’s clients in relation to regional and national poverty data.
4. Provide critical input about the applicability of this instrument to conditions in South Africa.
1. Depth of poverty outreach
A comparison of the average poverty scores between clients and non-clients in each of the programmes produced striking results. Figure 1 below shows the distribution of poverty scores of clients and non-clients in each of the programmes. Figure 1: The distribution of poverty scores of clients and non-clients in the Tshomisano Credit Programme and Micro Credit Programme
164135 11190N =
Type of programme
MCPTCP
Pove
rty in
dex
4
3
2
1
0
-1
-2
-3
Status
Client
Non client
Clients in TCP are poorer than non-clients in the TCP area of operation. In contrast clients in MCP are better off than non-clients in TCP areas of operation. Both clients and non-clients in the targeted credit programme, TCP, have on average lower scores than the clients and non-clients in MCP, the non-targeted programme. The poverty scores for TCP clients and non-clients alike are concentrated on the lower end of the

5
scale while the scores for both clients and non-client are concentrated at the upper end of the scale. The results suggest that SEF practices geographic targeting as well as targeting through the PWR method.
2. Comparison between the poverty targeted scheme, TCP and the non targeted scheme, MCP
Once each household was assigned a score, the sample population was divided into three poverty groups. Non-clients were evenly dispersed into three terciles, the first group being the poorest, the second group the less poor and the third group the least poor. The clients were then classified into the groups according to the range assigned to the non-clients. Figure 2 below shows the poverty profiles for each of SEF’s programmes. Figure 2: A comparison between clients and non-clients in each of the programmes N =500
0%
10%
20%
30%
40%
50%
60%
Poorest Less poor Least poor
Non clientTCP clientMCP client
There is a striking contrast between the poverty profiles of these two programmes. The clients in the poverty targeted programme are overwhelmingly situated in the poorest category, while the majority of clients in the non poverty targeted scheme are found in the least poor category. The majority of TCP clients (52 %) are located in the poorest category, as opposed to 9% in the least poor category. The remaining 39% are in the less poor category. In comparison, 15% of MCP clients fell in the poorest category, and 35% are in the less poor group with 50% in the least poor group. The TCP poverty profiles indicate that SEF is reaching the poorest people and point to the success of the targeting mechanism (PWR) in encouraging poorer people to join the programme. MCP in contrast appears to be reaching people who are better off.

6
3. National and regional poverty ratios
South Africa is in some respects a middle-income country, with well-developed infrastructure, telecommunications and financial systems. However there are enormous differences within the country by location and by race. It is also a country with one of the highest levels of inequality in the world (May, 2000). Apartheid served to exclude the majority of South Africans from economic, social and political resources. Many of these inequalities remain in spite of the political transition and six years of reform and transformation. Perhaps not surprisingly, as a relatively remote area, the Northern Province emerges as one of the poorest provinces in South Africa. Moreover, two of the three communities in which the CGAP/SEF study was undertaken are among the poorest in that province. It can therefore be concluded that most of the operational area of SEF ranks considerably below the national average of South Africa in terms of the level and severity of poverty.
4. Robustness of the CGAP instrument
The poverty assessment instrument has been found to be effective. The poverty scores derived from the participatory wealth ranking were compared with the CGAP instrument. Three quarters of those defined as poor by the poverty assessment were also defined as poor by the PWR. The CGAP instrument thus compared favourably with the Participatory Wealth Ranking even though these two research methods have different foci, the CGAP instrument being a method of assessment and the PWR a targeting instrument. Furthermore these research methods derived definitions of poverty from different research processes and also set different thresholds for relative poverty. The poverty assessment tool was found to be a robust proxy for more money metric measures of poverty in South Africa, and it was implemented efficiently and at low cost, by local independent research consultants. Conclusions The Northern Province is one of the poorest provinces in South Africa. Two of the three survey areas were found to be in the poorest regions within the Northern Province. SEF clients are therefore located in some of the poorest areas in South Africa. The poverty targeted programme, TCP, showed a significantly greater depth of poverty outreach. In contrast, the non-targeted scheme, MCP, showed limited poverty out reach. The results of this study confirm that poverty alleviation programmes need to be accompanied by a targeting strategy and a programme structure appropriate to the needs of the poor. A poverty targeting strategy appears to be a central component in ensuring that the most vulnerable people are drawn into a poverty alleviation programme.

7
Table of Contents
i. Acknowledgments ii. Executive summary
1. INTRODUCTION 10
1.1 STRUCTURE OF THE REPORT 12
2. THE SMALL ENTERPRISE FOUNDATION 12
3. METHODOLOGY 13
3.1 SAMPLE FRAME 13 3.2 QUESTIONNAIRE 15 3.3 TRIANGULATION 15 3.4 DATA ANALYSIS 15 3.4.1 Correlations 15 3.4.2 Benchmark indicator robustness 16 3.4.3 Principal Components Analysis (PCA) 17 3.5 LIMITATIONS OF THE DATA AND INTERPRETATION OF RESULTS 18
4. PERSPECTIVES ON POVERTY IN THE NORTHERN PROVINCE 18
5. RESULTS OF THE POVERTY ASSESSMENT 20
5.1 OVERVIEW OF THE SAMPLE 20 5.1.1 Household data 20 5.1.2 Basic need satisfaction 21 5.1.3 Control and ownership over assets 21 5.2 THE POVERTY INDEX 22 5.3 ANALYSIS OF POVERTY GROUPS 25 5.4 DISCUSSION 29
6. NATIONAL AND REGIONAL POVERTY RATIOS 30
6.1 NATIONAL POVERTY RATIOS 30 6.2 PROVINCIAL POVERTY RATIOS 33 6.3 DISTRICT LEVEL POVERTY RATIOS 38
7. CONCLUSION 40
8. REFERENCES 42
9. APPENDICES 44
9.1 APPENDIX 1: MAP OF THE SURVEY AREA 44 9.2 APPENDIX 2: SURVEY QUESTIONNAIRE 45 9.3 APPENDIX 3: ANALYSIS OF BENCHMARK ROBUSTNESS 51 9.4 APPENDIX 4: THE RANGE OF INDICATORS CONSIDERED IN THE PRINCIPLE COMPONENTS ANALYSIS 54 9.5 APPENDIX 5: INDEPENDENT MEANS TESTS BETWEEN CLIENTS AND NON-CLIENTS FOR A SELECTED RANGE OF INDICATORS 55

8
List of tables TABLE 1: SAMPLE DISTRIBUTION ACROSS BRANCHES 14 TABLE 2: BIVARIATE CORRELATIONS USING “PER PERSON EXPENDITURE ON CLOTHING
AND FOOTWEAR” AS THE BENCHMARK 16 TABLE 3: LIST OF THE VARIABLES INCLUDED IN THE FINAL PRINCIPAL COMPONENTS
MODEL 17 TABLE 4: CHARACTERISTICS OF THE SAMPLE 20 TABLE 5: POVERTY PROFILES OF SEF CLIENTS COMPARED TO NON-CLIENTS 26 TABLE 6: MATCH BETWEEN THE CGAP POVERTY ASSESSMENT AND THE
PARTICIPATORY WEALTH RANKING 29 TABLE 7: MOST RECENT POVERTY ESTIMATES 31 TABLE 8: POVERTY RISK BY SETTLEMENT TYPE 32
TABLE 9: POVERTY RISK BY POPULATION GROUP 32 TABLE 10: PROVINCIAL DISTRIBUTION OF POVERTY (1993) 33 TABLE 11: COMPARISON OF SOCIAL INDICATORS FROM SELECTED MIDDLE-INCOME
COUNTRIES 34 TABLE 12: COMPARISON OF HUMAN DEVELOPMENT INDEX FOR SELECTED COUNTRIES,
RACE AND PROVINCE 35 TABLE 13: RATIO OF HUMAN DEVELOPMENT INDEX TO NATIONAL LEVELS AND TO
COUNTRIES OF MIDDLE HUMAN DEVELOPMENT 36 TABLE 14: OFFICIAL POVERTY STATISTICS (1996) 38 TABLE 15: HEADCOUNT RATIO OF SURVEYED MAGISTERIAL DISTRICTS 39 TABLE 16: BIVARIATE CORRELATION BETWEEN MONTHLY EXPENDITURE PER ADULT
EQUIVALENT AND THE BENCHMARK INDICATOR 51 List of Figures FIGURE 1: HISTOGRAM OF THE POVERTY INDEX 22 FIGURE 2: CUMULATIVE FREQUENCY DISTRIBUTIONS OF POVERTY SCORES BETWEEN
CLIENTS AND NON-CLIENTS IN TSHOMISANO CREDIT PROGRAMME 23 FIGURE 3: CUMULATIVE FREQUENCY DISTRIBUTIONS OF POVERTY SCORES BETWEEN
CLIENTS AND NON-CLIENTS IN MICRO CREDIT PROGRAMME 23 FIGURE 4: THE DISTRIBUTION OF POVERTY SCORES OF CLIENTS AND NON-CLIENTS IN THE
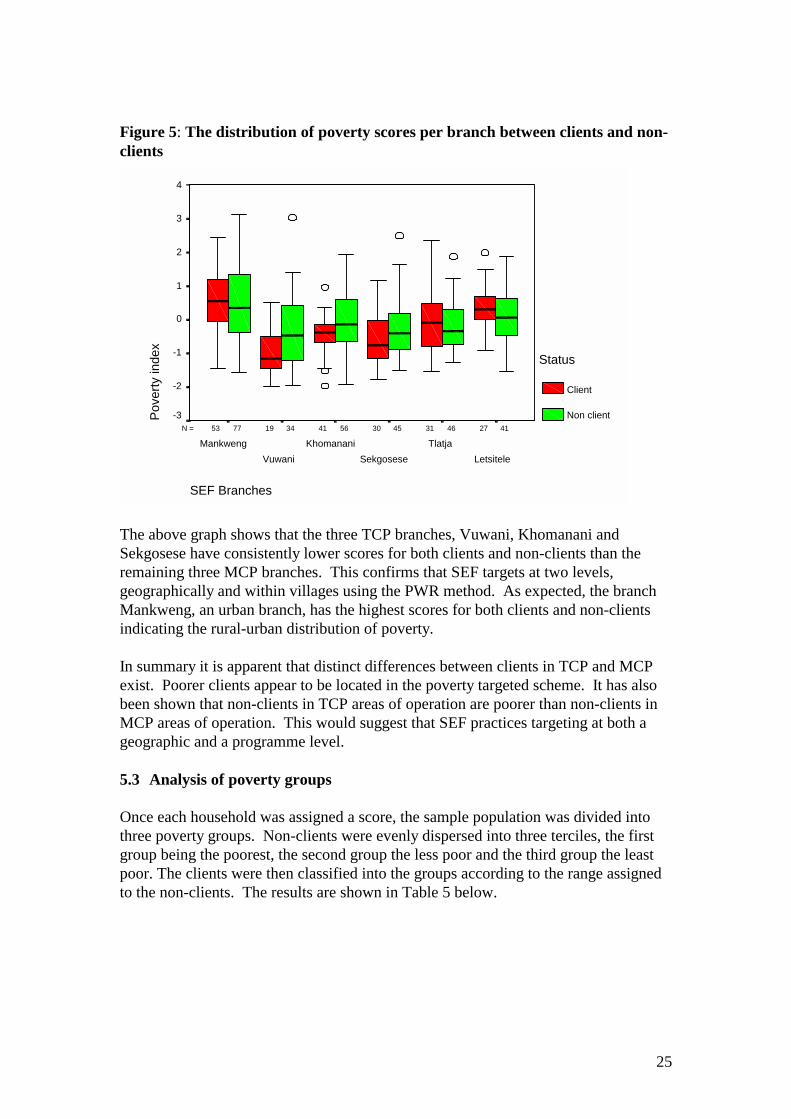
TSHOMISANO CREDIT PROGRAMME AND MICRO CREDIT PROGRAMME 24 FIGURE 5: THE DISTRIBUTION OF POVERTY SCORES PER BRANCH BETWEEN CLIENTS AND
NON-CLIENTS 25 FIGURE 6: A COMPARISON BETWEEN CLIENTS AND NON-CLIENTS IN EACH OF THE
MICRO-CREDIT PROGRAMMES 26 FIGURE 7: CUMULATIVE FREQUENCY DISTRIBUTIONS FOR POOR AND NON-POOR
COHORTS (DEFINED USING TOTAL HOUSEHOLD EXPENDITURE PER CAPITA) 37 FIGURE 8: PERCENT BREAKDOWN BY POVERTY TERCILE, NORTHERN PROVINCE AND THE
REST OF SOUTH AFRICA 37 FIGURE 9: CUMULATIVE FREQUENCY DISTRIBUTIONS FOR TWO COHORTS 52 FIGURE 10: CUMULATIVE FREQUENCY DISTRIBUTIONS USING SALDRU (1998) DATA
FOR AFRICAN HOUSEHOLDS IN THE NORTHERN PROVINCE 52

9
FIGURE 11: CUMULATIVE FREQUENCY DISTRIBUTIONS USING KWAZULU-NATAL INCOME DYNAMICS STUDY (1998) DATA 53
List of acronyms CFD Cumulative Frequency Distribution CGAP Consultative Group to Assist the Poorest HDI Human Development Index IES Income and Expenditure Survey KIDS Kwazulu-Natal Income Dynamics Study LSMS Living Standards Measurement Study MCP Micro-Credit Programme MFI Micro-Finance Institution OHS October Household Survey PCA Principle Components Analysis PSLSD Project for Statistics and Living Standards on Development PWR Participatory Wealth Ranking SALDRU South African Labour and Development Research Unit SEF Small Enterprise Foundation TCP Tshomisano Credit Programme

10
1. Introduction
This is a report of the findings of a poverty assessment conducted for the Consultative Group to Assist the Poorest (CGAP), an international service provider to micro-finance institutions 1, and the Small Enterprise Foundation (SEF), a micro-finance institution (MFI) operating in the Northern Province of South Africa. CGAP is a consortium of 27 bilateral and multilateral donor agencies. It has a mission to improve the capacity of micro-finance institutions to deliver flexible financial services to the very poor on a sustainable basis. It has devised a series of management and operational tools, known as the appraisal format, to improve the financial sustainability of micro-finance organisations. This poverty assessment tool measures the depth of poverty outreach amongst MFIs, and will provide transparency on the depth of poverty outreach of MFIs. This instrument will compliment the appraisal format. The poverty assessment conducted in SEF was an experiment to test the applicability of this instrument to conditions in South Africa. SEF has a mission directed towards poverty alleviation through the provision of micro-finance services and the poverty assessment set out to measure the depth of poverty outreach amongst SEF clients. Furthermore, SEF has two programmes, the most established of which is the Micro-Credit Programme (MCP). In 1996, SEF introduced a poverty targeted micro-credit programme, the Tshomisano Credit Programme (TCP) that uses a participatory wealth ranking methodology to facilitate targeting. As such, assessing the poverty targeting of SEF offers a unique opportunity to compare the depth of poverty outreach between these two programmes as well as the effectiveness of the two methodologies for identifying the poor. The poverty assessment is a simple, low-cost operational tool designed to assess the poverty status of clients supported by micro-loans compared to a representative sample of non-clients. The assessment is a rapid quantitative research method that uses key indicators as proxy measures of poverty. The method of Principle Components Analysis (PCA) is used to assess the relative poverty of clients in comparison to non-clients. This approach is an assessment tool rather than a targeting tool but could be used as a baseline study in a future impact assessment. The methodology has been standardised to all allow for international comparisons to be made, and to provide donors with an opportunity to make informed decisions about funding allocations on the basis of the MFIs depth of poverty outreach. The Poverty and Population Studies Programme of the University of Natal was contracted to manage the survey. The Poverty and Population Studies Programme has conducted extensive work in the area of poverty assessments both in South Africa and in other developing countries. This programme was selected to undertake the study on
1 CGAP supports the micro-finance sector through direct funding, disseminating information, networking and supplying management tools and methods. CGAP is concerned with the dual objectives of financial and institutional sustainability of micro financial institutions and poverty alleviation through micro finance. CGAP have developed a series of appraisal and monitoring tools which test a MFI’s level of sustainability, organisational health and poverty outreach

11
the basis of its expertise in this area and its ability to provide critical insight into the applicability of this method to the South African context.

12
The report aims to address four issues:
• Present the poverty profiles of the SEF's membership in relation to a representative sample of non-SEF clients. The poverty profiles are derived from an index, which attaches scores to each of the households. The sample was then divided into three categories ranging from poorest to least poor.
• Compare the poverty profiles of the TCP, the targeted micro-credit programme and MCP, the non-targeted micro-credit programme. A central purpose of this assessment was to measure whether or not the poverty targeting mechanism, Participatory Wealth Ranking, used in the TCP programme was effective in tracing the poorest.
• Explore the levels of well-being of SEF’s clients in relation to regional and national poverty data.
• Provide critical input about the applicability of this instrument to conditions in South Africa.
1.1 Structure of the report The second section of the report deals with the Small Enterprise Foundation, its mission and programme structure. The third section provides an overview of the survey methodology and a summary of the statistical procedures used in the data analysis. The fourth section provides contextual information about the Northern Province. The main body of the report, section 5, covers the results of the study. Poverty profiles for the organisation as a whole and for each of the credit programmes are presented. The final section compares the results of the study to poverty levels in the Northern Province and the rest of South Africa. 2. The Small Enterprise Foundation The Small Enterprise Foundation (SEF) is a non-profit organisation, based in the Northern Province of South Africa (see appendix 1 for a map of South Africa). SEF offers micro-loans to women. Its mission is to work toward poverty alleviation through the creation of a:
Supportive environment where credit and savings services foster, sustainable income generation, job creation and social empowerment. (SEF, www.sef.co.za: 18-11-1999)
SEF began its operations in 1992. It employs a group lending methodology modelled on the Grameen Bank. Loans sizes range from R500 to R10 0002. Effective interest rates based on a declining balance, range from 46% to 66% (SEF, 2000: 16). The loan repayment period for first loans are 5 months paid on a fortnightly basis. In addition SEF facilitates group savings through the use of the Post Office savings scheme. SEF is funded by USAID, and the Ford Foundation. It also has loan agreements with Khula Enterprise Ltd and the Hivos/Triodos Fund. In June 2000, SEF had a membership base of 11 214 clients (SEF, 2000: 10-11). SEF has two separate 2 R7.80 was equivalent to $1 at the time of the study

13
programmes, the Micro Credit Programme (MCP) a non-targeted micro-credit programme which consists of 8492 members, and the Tshomisano Credit programme (TCP), a poverty targeted programme which consists of 2722 members (SEF, 2000: 10-11). These programmes operate in different geographic regions within the Northern Province. The majority of SEF clients are women (97%), many of whom operate small enterprises from their homes. Many of SEF clients are involved in retail activities including hawking, selling new and used clothes and running small tuck-shops. A portion of the clients (18%) are involved in manufacturing activities. The sizes of the loans and short repayment schedules were expected to encourage poorer women to join the programme. In practice SEF found that the programme was dominated by non-poor people who were entering the programme in the hopes of gaining larger loans at a later stage (SEF, 1998: 4). SEF realised that the micro-credit programme would not attract poorer women unless they introduced a targeting mechanism. In 1997 SEF initiated the Tshomisano credit programme (TCP). This poverty-targeted programme encouraged unemployed women to join, and start businesses. The solidarity group lending approach was adopted for the programme. Loan sizes for the first loan ranged from R300 to R600. Loans sizes increase per round, although clients have to demonstrate increased capacity in their businesses. Most TCP clients are inexperienced at running and managing small businesses and thus TCP field staff dedicate time to support clients in their businesses. SEF employs the Participatory Wealth Ranking (PWR) method as a targeting tool and SEF fieldworkers, skilled in the PWR method, facilitate the process. PWR is a community-driven process whereby members of a village define conditions of poverty in their village and rank community members according to these conditions. At least three separate reference groups, made up of a small number of community members, are involved in ranking all villagers. This allows the facilitator to measure the consistency of the process and avoid bias. Those ranked poorest by the participants are eligible for membership into TCP. 3. Methodology The survey took place from November to December 2000. The survey team, Nkuzi Development Association, a non-government organisation based in the Northern Province, was selected on the basis of its knowledge of the Northern Province. The research team consisted of 10 members incorporating the three dominant languages in the Northern Province: Northern Sotho, Venda, and Tshonga/Shangaan. Fieldworker training emphasised understanding the questionnaire in these 3 languages. In total 500 households were interviewed, 201 clients and 299 non-clients. This ratio of 2 clients to 3 non-clients allowed for greater diversity in the non-client sample and the number therefore needed to be greater to capture these differences. 3.1 Sample frame The poverty assessment is an instrument to measure the levels of well-being of clients entering the Small Enterprise Foundation’s micro-credit programmes. The sampling

14
method required that only new clients entering either of the micro-credit programmes be included in the survey. This would mitigate against the impact that credit was likely to have on clients’ lives. The Equal Proportion Sampling (EPS) method was used. Each of the credit programmes operated in different geographic regions within the Northern Province. Each programme has 5 branches (10 in total). Random sampling took place at the branch level for each of the two programmes, 6 of the 10 branches were randomly selected. The number of clients selected for the survey were in proportion to the total number of new clients per branch. The actual proportion of new clients entering the TCP and MCP programmes was uneven; there were more new clients in MCP than TCP. To compensate for the uneven distribution TCP new clients comprised 45% of the sample, and MCP clients made up the remaining 55% of clients sampled. Once the branches had been randomly selected, sub branches or centres were randomly selected. Lists of new clients in those centres were provided by SEF. The non-clients were selected from the same villages where the clients resided. It was a two-phase approach which first required that the field team identify the boundaries of any given settlement and randomly select quadrants within which to conduct the interviews, and secondly the survey team conducted a random walk, and visited houses at specific intervals depending on the density of the settlement. Table 1 below shows the distribution of clients and non-clients in each of the branches
Table 1: Sample distribution across branches
Branch Client Non - Client MCP
Mankweng 53 77 Tlatja 31 46
Letsitele 27 41 Sub total 111 164
TCP
Vuwani 19 34 Khomanani 41 56 Sekgosese 30 45 Sub total 90 135
Total 201 299 n=500 Of the six branches which were selected, five of the six were located in rural areas. Mankweng, a former township near Pietersburg, the capital of the Northern Province,

15
is largely an urban branch3. Vuwani and Khomanani are located in the former homeland of Venda while Tlatja, Sekgosese and Letsitele were in the homeland of Gazankulu. 3.2 Questionnaire The survey team used the standard questionnaire located in the CGAP Poverty Assessment Manual (CGAP, 2000). It was important to retain the essence of the questionnaire to allow for international comparisons to be made. Some amendments were made to the questionnaire in order to suit local conditions (see appendix 2). Adaptations included consideration of local definitions of poverty and measurement methodologies tested by SEF. Every attempt was made to draw upon local knowledge in order to gain a better understanding of the area. Changes to the standard questionnaire related to a) land ownership, b) local food preferences and c) questions about income transfers. a) Land ownership is an issue in South Africa where the majority of African people reside on communally owned land. Land assets were therefore not seen to be an appropriate measure of poverty and were excluded from the questionnaire. b) The main staple food in the Northern Province was pap which is derived from maize meal. Luxury foods were meat and rice as rice is not a staple in the Northern Province and is only eaten as an accompaniment to a bigger meal. c) Questions of household access to state transfers were included as these are important sources of household income. 3.3 Triangulation A small, qualitative in-depth household study was conducted as a background study. The study explored characteristics of poverty not easily captured in cross-sectional quantitative surveys. In total 14 households which participated in the poverty assessment, were revisited. The interviews covered aspects of social exclusion, class relations, and the impact of economic shocks on household livelihoods. 3.4 Data analysis A statistical package, SPSS, was used to analyse the data. The analyst constructed the poverty index through Principal Component Analysis. Each household was assigned a score and ranked according to levels of well-being. The sample was divided according to clients and non-clients and then divided into three poverty groups. Poverty profiles for the organisation as whole as well as the two credit programmes were constructed. 3.4.1 Correlations The poverty index consists of a set of variables which best describe levels of well-being. This model uses proxy variables which replace data on income and expenditure. Only one question on household consumption is included in the
3 However some areas within Mankweng are a distance from commercial activity and have limited access to resources and infrastructure and are thus more rural in character.

16
questionnaire: per person expenditure on clothing and footwear. This variable is used as a benchmark indicator. A series of correlations were conducted to measure the strength of the associations between the benchmark indicator and other indicators. Table 2 below presents a limited number of indicators which showed significant associations with the benchmark indicator.
Table 2: Bivariate correlations using “Per Person Expenditure on Clothing and Footwear” as the benchmark
Indicator ** Type of cooking fuel used ** No of days rice served ** Assets per person ** Percent of adults who attended high school ** Type of roofing material used ** Percent of adults who attended primary school ** Value of appliances ** Percent of adults who can write ** Type of exterior walls ** Type of latrine ** Percent of adults who have a grade 12 ** Percent salaried workers ** Percent completed tertiary education ** Number of days chicken served ** Structural condition of house ** Unemployment dependency ratio ** No of days household went without food ** Percent of adults who never attended school
** Correlation is significant at the 0.01 level (2-tailed) There were over 40 variables which were associated with the benchmark indicator. The indicators listed in table 2 above have significant relationships to the benchmark indicator. They consist of a wide range of characteristics of poverty, from the quality and quantity of food consumed, the quality of housing and access to infrastructure and services, the ownership of household assets and demographic data including education and employment levels. These indicators were then incorporated in the principal components model. The benchmark indicator was used during the screening process to identify a common correlation. During the later stages of the analysis this indicator was treaded no differently to other variables. 3.4.2 Benchmark indicator robustness An important issue that was explored in some depth and which should be raised at this juncture concerns whether the benchmark indicator selected for the CGAP Northern Province study, clothing and footwear expenditure per capita, represents a suitable proxy for a total expenditure measure. In attempting to provide evidence supporting the robustness of clothing expenditure as a suitable proxy, use has been made of two South African datasets that contain comprehensive expenditure modules, namely the Project for Statistics on Living Standards and Development undertaken by the South African Labour and Development Research Unit (SALDRU, 1993) at the University

17
of Cape Town and the KwaZulu-Natal Income Dynamics Study (KIDS, 1998), a collaborative venture between the International Food Policy Research Institute and the Universities of Natal and Wisconsin-Madison. The SALDRU study was the first fully representative household income and living standards survey in South Africa, whereas the KIDS was a longitudinal household survey that re-interviewed a subset of households from the SALDRU study, namely those in the KwaZulu-Natal province. Both are predicated upon the World Bank’s Living Standards Measurement Study (LSMS) Survey4. Appendix 3 provides analytical detail of this process. From the analysis, it would seem that clothing and footwear expenditure does serve as an adequate proxy for total household expenditure measure. Not only does correlation analysis reveal there to be a significant relationship between the two indicators, but poverty dominance tests using cumulative frequency distributions of the benchmark indicator yield poverty rankings that are wholly consistent with the poverty categorisations derived using the poverty line based on the (individualised) total household expenditure measure. 3.4.3 Principal Components Analysis (PCA) This assessment used the PCA model to construct a poverty index. The main principles in constructing the model were to include variables which drew upon a variety of definitions of poverty. During the trial phase of the model, only non-clients were used, as they were the representative control group. The model was constantly refined, and variables which did not impact on the model were excluded (see appendix 4 for an example of one of the initial runs of the model). Successive changes were made to improve the robustness of the instrument. Table 3 below shows the final selection of indicators used in the model.
Table 3: List of the variables included in the final principal components model
Indicator Component 1 Family structure
Per person expenditure on clothing and footwear .573 Percent of adults in a household who can write .485 Percent of households which have salaried workers .446 Percent of adults within households who have attended high school
.360
Food consumption
Number of days rice served .486 Number of days chicken served .416 Number of months in the past year the household did not have enough to eat
-.385
Housing
Type of cooking fuel used .685
4 For more detail on these studies, reference should be made to Klasen (1997) and May et al (1999).

18
Type of external walls .644 Structural conditions of the main house .643 Type of roofing material used .619 Assets
Value of furniture aggregated per person .690 Value of appliances and electronics aggregate per person .619 The final selection for the model consisted of 14 variables which covered the broad themes of the assessment: food consumption, quality of housing, demographic data and household assets. One indicator ;“type of latrine owned by the household” made an impact on the model however it was excluded as it potentially introduced an urban bias. 3.5 Limitations of the data and interpretation of results The poverty assessment is a once-off cross-sectional study that measures poverty levels of clients being recruited into the programme, it does not capture the dynamic quality of poor people’s lives. Economic crisis, the coping strategies adopted, and the potential to move out of poverty cannot be factored into the analysis. Furthermore the poverty assessment measures poverty at a household level. Intra-household inequalities are not taken into account. Women and children are often allocated fewer resources within a household, and these subtle but important distinctions are excluded from the analysis. If such dimensions were included in the study, the trade-off would be increased project costs, it would require a greater level of expertise and it would extend the time-frames of the study. The strength of the poverty assessment instrument lies in its ability to discern the relative differences in poverty levels between clients and non-clients. The indicators used in this assessment have been fine tuned to track the difference between the chronically poor whose lives are a constant struggle, the transitory poor who may fall in and out conditions of economic strife and finally those who are not poor. National and regional poverty lines have been included to situate the relative poverty profiles in the context of absolute poverty levels in South Africa. 4. Perspectives on poverty in the Northern Province The Northern Province lies to the north east of South Africa and borders on Zimbabwe and Mozambique. The Northern Province is a rural province where most economic activity is focused on farming, and industrial activity is limited to small mining operations. The province has tourism potential, however this has not been well developed. African people comprise 97% of the population (Stats SA, 2000), the majority of whom reside in the three former rural “Homelands”: Lebowa, Gazankulu and Venda5
5 The homelands were established by the apartheid regime, they were intended to be independent entities. The system forced African people off their land holdings and onto communal spaces administered by traditional authorities. Homelands were not well serviced with basic amenities, social

19
(Institute of Race Relations, 1992). For many residents of the Northern Province settlement patterns, economic and social exclusion and inequality have not shifted dramatically. The lasting effect for rural dwellers is inadequate access to resources, poor infrastructure and social amenities and limited economic opportunities. As will be shown later, the Northern Province is one of the poorest provinces in South Africa. The majority of residents in the Northern Province reside in rural areas. Rural livelihoods are characterised by insecurity and uncertainty. Unemployment is high and breadwinners are forced to find work further a field. Many households rely on remittances from migrants working in urban centres in South Africa. Another important source of income for households is state transfers including the state pension and the state maintenance grant. In March 2000 the Northern province sustained enormous flood damage. Many households and communities were displaced. Homes were damaged or destroyed and crops failed. Of the 14 households interviewed in the qualitative study 11 households experienced negative consequences as a result of the floods. Homes were damaged to the point where many families are now living in one room. Crops failed and respondents indicated that there had been food shortages. Households adopted a variety of coping strategies. Some respondents drew on savings to repair damaged structures, others relied on assistance from relatives or neighbours while others have still not been able to recover from the floods. South Africa has one of the fastest growing HIV/AIDS epidemics in the world (UNDP, 1998: 24). The antenatal clinic survey places the national HIV prevalence rate for pregnant women at 23 % (Health Systems Trust, 1999: 303). According to the same clinic survey, the HIV prevalence rate for the Northern Province is 11%, however a worrying factor has been the rapid increase in infection rates from 8% in 1997 to 11% in 1998, an increase of 40% (Health Systems Trust, 1999: 303). This was borne out it in the qualitative survey where respondents reported increasing deaths in their communities, and many interviewees attend up to 5 funerals a month. However none of the interviewees indicated that there had been AIDS related deaths or illness of immediate family members. Funeral insurance is becoming a central component of a household survival strategy. Relatively well off individuals were able to secure insurance policies with formal insurance companies, while poorer people had to develop informal community schemes. Only the very poorest appear to be without any provision. In summary the Northern Province is one of the poorest areas of South Africa. The legacy of apartheid and the limited economic opportunities available in this area has meant that breadwinners are forced to seek economic opportunities elsewhere. Rural households face uncertain livelihoods. The floods in March 2000 led to extra economic hardship. Another factor has been the rapid increase of HIV/AIDS. SEF is working in one of the most economically depressed areas of South Africa and its operations are based mainly in areas formerly known as homelands, and therefore it is likely to be working with poorer people.
services or economic opportunities. The homelands were established in rural areas a distance away from major commercial centres.

20
5. Results of the poverty assessment The poverty assessment is a relative measure of poverty. Its purpose is to distinguish levels of well-being between SEF clients and non SEF clients. The first sub-section provides an overview of the sample as a whole. Section 5.2 assesses the scores derived from the poverty index overall and then compares the scores of clients and non-clients in each of the sections. Section 5.3 presents the poverty profiles, comparing the levels of poverty between clients and non-clients. This is followed by poverty profiles for both TCP and MCP comparing the difference in poverty between clients in the targeted programme, TCP, and clients in the non-targeted programme, MCP. 5.1 Overview of the sample The sample consisted of 500 households made up of 2768 individuals. Approximately 370 households are located in rural areas. There were 201 SEF client households and 299 non SEF client households which were interviewed. Summary information covering household demographics, levels of basic needs satisfaction, and control over assets as shown in Table 4 below, is discussed.
Table 4: Characteristics of the sample
Indicators Mean
Size of household 5 members
Female headed households 44%
Per person expenditure on clothes and shoes R 251
Per person value of assets R 1665
Number of days in the past month that the household did not have enough to eat
6 days
Number of months in the past year when the household did not have enough to eat
3 months
5.1.1 Household data A household was defined as the group of individuals who live under the same roof for more than 15 days a month and regularly shared meals and expenses. On average households consisted of 5 members, the largest recorded household had 23 members. Almost half of the households (44%) were de jure and de facto female headed households. This is higher than the national average of 35% (PSLSD, cited in May, 2000: 34). The average per person expenditure on clothing and footwear, for the past year, was R251. This is widely dispersed, 6% did not spend any money on clothing

21
and footwear, and 28% of the sample spent less than R100 on clothing and footwear. The highest recorded per-capita expenditure on clothing was R 2875. 5.1.2 Basic need satisfaction Food security was an issue for most households. Respondents were first asked whether they had had enough to eat in the past month (September 2000) and then, second, whether there had been enough food over the past 12 months. The majority of households (51%) experienced up to 6 days during the past month when they did not have enough to eat and 5 % of the sample indicated that they were hungry continually for most of the month. In contrast 15% of the sample did not experience any food shortages for the month. Over the longer term food shortages appear to be seasonal, the majority of families experienced between 1 and 3 months of food insecurity. However 16% of households experienced more than 5 months of food scarcity in the past 12 months. On the other extreme, 14% of the sample did not encounter any food shortages during the past year. There were distinctions between the quality of services in the rural and urban areas. Only 5% of the sample had their own flush toilet, and 96% of these households were located in Mankweng, the urban branch. The majority of households (73%) had their own pit latrine and the remaining 22% of households either shared a pit latrine or have no access to any toilet facilities. The majority of homes were electrified (55%). In terms of access to drinking water 49% of the sample relied on communal stand pipes, while 30% had a yard connection and 6% of households had tap connections in their own homes, although a greater share (95%) was located in Mankweng. However the remaining 15% of respondents had to fetch water from rivers or purchase water from a water kiosk. 5.1.3 Control and ownership over assets The use of assets is an important survival strategy. Productive assets such as livestock and transportation enhance economic opportunities, while the values of non-productive assets such as appliances and furniture provide information about a household’s economic status. Respondents were asked to list the quantity of assets owned by the household and the resale value of their assets. Values of all household assets were aggregated and then divided by the number of household members. The most popular assets were poultry, televisions, radios, and bedroom suites. The sample was widely dispersed in terms of asset ownership. On average per person value of assets was R1665. Less than 1% of households did not own any assets. The highest value for assets per person was R48 450. In summary there are great disparities between households in terms of access to services, food security, and ownership of assets. This suggests extremes in wealth. Rural - urban inequalities explain some of the diversity, as the urban areas have access to better services and infrastructure. Urban dwellers are more likely to have access to economic opportunities and thus enjoy higher living standards. In an attempt to explain the differences within the sample comparisons between clients and non-clients were made. Independent means tests for each of the indicators were conducted. The

22
results showed that there was no significant difference in the means between each of these groups for all of the indicators (see appendix 5 for the results of these tests). This would suggest that clients and non-clients share similar demographic patterns and levels of well-being. The next section will begin to explore these dynamics in greater depth. 5.2 The poverty index The poverty index, derived from PCA, assigned scores for each household. They were then ranked according to these scores. The highest scores reflected the least poor households while lowest scores indicated the poorest households. Figure 1 below shows the degree of dispersion of the sample across the index.
Figure 1: Histogram of the poverty index
Poverty index
3.002.50
2.001.50
1.00.500.00
-.50-1.00
-1.50-2.00
60
50
40
30
20
10
0
Std. Dev = 1.00 Mean = 0.00N = 500.00
The lowest score was –2, indicating the household with the lowest levels of well-being. The highest score, the household with the highest levels of well-being, was 3.13. Most of the sample was concentrated between –1 and 1. There was a degree of variance at the higher end of the scale suggesting that there were households at the top end of the scale substantially better off than the rest of the sample. The longer tail on the right suggests larger extremes in the direction of wealthier households, than found within poorer households. Figures 2 and 3 below present cumulative frequency distributions of poverty scores graphed for clients and non-clients in each of SEF’s programmes.

23
Figure 2: Cumulative frequency distributions of poverty scores between clients and non-clients in Tshomisano Credit Programme
Poverty index
1.40783
.86230
.58099
.29573
.14641
-.04176
-.13752
-.19929
-.35761
-.47300
-.58348
-.67828
-.82626
-1.02855
-1.11468
-1.23654
-1.36815
-1.53537
-2.00341
Cum
ulat
ive
Perc
ent
120
100
80
60
40
20
0
Status
Client
Non-client
The graph plots the poverty scores along the x axis from lowest (poorest) to highest (least poor). Both the graphs reflect substantial differences between clients and non-clients for each of the programmes. The results for the poverty targeted scheme, TCP, show that clients are consistently poorer than non-clients. In figure 3 below, MCP clients are better off than the non-clients although at the upper and lower ends of the scale, both groups share similar scores.
Figure 3: Cumulative frequency distributions of poverty scores between clients and non-clients in Micro Credit Programme
Poverty index
2.41523
1.87826
1.48514
1.15774
.99929
.80883
.58251
.43620
.29935
.19995
.08367
.00848
-.10958
-.30662
-.39929
-.52211
-.71215
-.85558
-1.19453
-1.58247
Cum
ulat
ive
Perc
ent
120
100
80
60
40
20
0
Status
Client
Non-client

24
A comparison of the average poverty scores between clients and non-clients in each of the programmes produced striking results. Figure 4 below shows the distribution of poverty scores of clients and non-clients in each of the programmes.
Figure 4: The distribution of poverty scores of clients and non-clients in the Tshomisano Credit Programme and Micro Credit Programme
164135 11190N =
Type of programme
MCPTCP
Pove
rty in
dex
4
3
2
1
0
-1
-2
-3
Status
Client
Non client
Both clients and non-clients in the targeted credit programme, TCP, have on average lower scores than the clients and non-clients in MCP, the non targeted programme. The poverty scores for TCP clients and non-clients alike are concentrated on the lower end of the scale while the scores for both clients and non-client are concentrated at the upper end of the scale. The mean score for clients in TCP, shown by the dark line, was -.6 while the average score for MCP clients was .4. The difference between means was statistically significant at the 99% level. The average scores for non-clients in each of the programmes were also found to be significantly different. Non-clients located in TCP areas of operation had a mean score of -.2 while non-clients located in MCP areas of operation had a mean score of .2. These differences were also statistically significant at the 99% level. The results suggest that SEF practices geographic targeting as well as targeting through the PWR method. The differences between clients and non-clients also emerge within the two programmes. The client group in TCP has a lower poverty score than the non-client group located in TCP. The reverse is true for MCP where the client group has a higher poverty score than the non-client group. Figure 5 below provides a breakdown of poverty scores between clients and non-clients in each of the branches.
25
Figure 5: The distribution of poverty scores per branch between clients and non-clients
414645563477 273130411953N =
SEF Branches
LetsiteleTlatja
SekgoseseKhomanani
VuwaniMankweng
Pove
rty in
dex
4
3
2
1
0
-1
-2
-3
Status
Client
Non client
The above graph shows that the three TCP branches, Vuwani, Khomanani and Sekgosese have consistently lower scores for both clients and non-clients than the remaining three MCP branches. This confirms that SEF targets at two levels, geographically and within villages using the PWR method. As expected, the branch Mankweng, an urban branch, has the highest scores for both clients and non-clients indicating the rural-urban distribution of poverty. In summary it is apparent that distinct differences between clients in TCP and MCP exist. Poorer clients appear to be located in the poverty targeted scheme. It has also been shown that non-clients in TCP areas of operation are poorer than non-clients in MCP areas of operation. This would suggest that SEF practices targeting at both a geographic and a programme level. 5.3 Analysis of poverty groups Once each household was assigned a score, the sample population was divided into three poverty groups. Non-clients were evenly dispersed into three terciles, the first group being the poorest, the second group the less poor and the third group the least poor. The clients were then classified into the groups according to the range assigned to the non-clients. The results are shown in Table 5 below.

26
Table 5: Poverty profiles of SEF clients compared to non-clients Poverty group Percent of SEF clients in
each category Percent of non-SEF clients in each category
Poorest 32 33 Less poor 37 33 Least poor 31 33 n =500 There were as many clients in the poorest category (32%) as there were clients in the least poor category (31%). A slightly larger proportion of clients (37%) fell into the middle category. The distribution of clients follows that of the non-clients. This would suggest that the client profile over all is fairly representative of the broader community. The combined data hides the contrasting results of the two SEF programmes. A significantly different picture emerges once the data is disaggregated according to the two programmes. Figure 6 below presents the poverty profiles of each of the micro-credit programmes.
Figure 6: A comparison between clients and non-clients in each of the micro-credit programmes
0%
10%
20%
30%
40%
50%
60%
Poorest Less poor Least poor
Non clientTCP clientMCP client
n =500 There is a striking contrast between the poverty profiles of these two programmes and the community in which they are found. The majority of TCP clients (52 %) is located in the poorest category, as opposed to 9% in the least poor category. The remaining 39% are in the less poor category. In comparison, 15% of MCP clients fell in the poorest category, and 35% are in the less poor group with 50% are in the least poor group. The TCP poverty profiles indicate that SEF is reaching the poorest people. MCP in contrast appears to be reaching people who are better off.

27
Closer scrutiny of the client profiles in each of the credit programmes show that SEF attracts a diverse selection of clients which might account for these differences in the programmes. Cross-tabulations and means tests were conducted comparing clients from the two credit schemes. Statistically significant differences between the clients emerged in relation to levels of education, food security, clothing expenditure, and asset ownership. A greater proportion of TCP client households (23%) never attended school as opposed to MCP client households (11%). In contrast 42% of MCP client households consisted of members who have gained a grade 11 pass and higher while only 30% of TCP client households attained these levels. There is also a higher proportion of adult literacy in MCP client households (91%) than TCP client households (79%). TCP clients suffered greater levels of food insecurity, 40% of TCP clients are likely to subsist on just plain maize meal (pap), an inferior food6, for 4 or more days a week. In contrast, 14% of MCP clients subsist on plain pap. The average yearly per-capita expenditure on clothing and footwear for TCP clients was R112, while for MCP it was R362. Similarly the per-capita value of assets for TCP client households was R677, whereas MCP clients had per-capita asset values of R2728. These comparisons indicate that MCP client households have secured better education, they enjoy food security and a greater command over their resources. TCP client households had poorer education and literacy levels and poor food security. Limited asset ownership amongst TCP client households, indicate fewer resources to maximise economic opportunities and a more vulnerable position in times of crisis. These results were borne out by the qualitative study which drew on other dimensions of poverty including survival strategies, social exclusion, and class inequalities. Many of the narratives consisted of periods of economic security and then other periods of hardship and vulnerability. Levels of well-being were uneven and dynamic. Of the seven clients interviewed in the qualitative study, the TCP clients (5 cases) appeared to be the most vulnerable. All of the TCP clients interviewed were the sole breadwinners in their families’ and the enterprise supported by SEF loans was the only source of income. Respondents spoke of instability and uncertainty about their livelihoods. As one woman put it:
“My business goes up and down, some months I lose out. There have been times when I had to borrow sugar and other ingredients from my neighbour to brew my beer. Other months I benefit from the business and I am able to buy food. I will return for another loan from Tshomisano as I am the only one who can support this family”
Most TCP clients were inexperienced entrepreneurs, operating businesses that had narrow profit margins and high levels of competition. Another client, who sold Mopane worms7, and has subsequently been forced out of this market, pointed to
6 Maize meal was counted as an inferior food for a meal if it was not accompanied with other food products such as meat or vegetables 7 A delicacy in the Northern Province

28
problems of seasonality, the variability in stock quality and the high levels of competition as reasons for her loss. Another important issue was the experience of marginalisation. Three respondents explained their situation:
• It is ploughing season. It costs R200 to hire a tractor to plough the fields, we cannot afford to pay this so we will work for the tractor owner for two weeks in repayment.
• There is a difference between rich and poor. The poor have to work for the rich ones. We cannot find employment so we work for people in this area. It is not possible to ask for help from a rich person, you can only ask for a job. A rich person will never lend you money because he knows you have no job.
• I do not belong to a church group, as I am afraid that people will think I am a bad woman because I make traditional beer. They do not understand that the beer is for my customers. I do not drink it myself.
The lack of economic opportunities forced these respondents into unsatisfactory situations of having to work for richer members of the community, and led to heightened perceptions of inequality. The last respondent indicated that at the first opportunity she would shift away from brewing beer to a more socially acceptable enterprise. Two clients belonging to the MCP scheme were interviewed, the number was too small to draw general conclusions. However the narratives told by these respondents appear to coincide with data emerging from the poverty assessment. In contrast to the TCP clients, these two MCP clients appeared far more experienced at managing their businesses. They operate in lucrative markets and appear to enjoy stable profits, the first selling old and new clothes and the second operating a small tuck shop. Neither of these clients had incurred any difficulties with their loan repayments. These women were able to secure income from a variety of sources and had strong social networks for support. Both of these clients have been able to purchase refrigerators which they use to sell soft drink and meat. These assets however were purchased on credit through hire purchase agreements at prominent furniture chain stores. One woman was behind on her repayment for this asset. The findings of the qualitative study would suggest that TCP clients are far more vulnerable than MCP clients, and they have thus far experienced fewer returns on their businesses than the two MCP clients. In contrast MCP clients were operating in more profitable markets and had greater economic opportunities at their disposal. The study however also showed that MCP clients take greater risks. They also had access to other sources of credit, as in the case of the one client who might be falling into debt. While MCP clients may enjoy better standards of living than TCP clients, they too appear to be vulnerable to crisis and easily drawn into conditions of poverty.

29
5.4 Discussion The purpose of the poverty assessment was to measure the depth of poverty outreach for SEF’s entire operation. The poverty assessment was a relative poverty measure between SEF clients and a representative non-client control group. SEF has a mission specifically directed toward poverty alleviation through the provision of micro-finance. The results showed overall that there was an equal proportion of poor clients as there were non-poor clients. However, closer scrutiny of the two credit schemes, revealed noticeable differences. TCP, the poverty targeted scheme, almost exclusively attracts poorer clients. MCP, a non-targeted micro-credit programme, attracts a greater proportion of non-poor clients and is arguably meeting economic growth rather than poverty alleviation objectives. Further, clients in TCP and MCP have entirely different needs and bring different kinds of resources and experiences to the two programmes. One of the key findings of this study, as reflected in figure 6, is that the demand for credit is as great amongst the poor as it is for the non-poor. The MCP results undermine the position that small loans sizes, and high transaction costs associated with group lending will discourage non-poor people from entering these programmes. MCP is dominated by clients willing to endure these costs in the hopes of gaining larger loans at a later stage. Imbalances in the formal financial sector in South Africa have meant that the demand for credit out weights the current supply of micro-finance services. Poorer people are able to access consumption cash loans and hire purchase agreements with relative ease. Paradoxically few people are able to open savings bank accounts. SEF is playing an important role not only in providing credit, at a lower cost than the cash loan industry, but also in linking people to the formal banking sector through the savings scheme at the post office. The results for TCP, point to the success of the targeting mechanism in encouraging poorer people to join the programme. The poverty scores derived from the participatory wealth ranking were compared with the CGAP instrument. There was a significant overlap between the two results. Table 6 below shows the match between these two research methods. PWR scores were obtained for 199 of the 225 TCP households.
Table 6: Match between the CGAP Poverty Assessment and the Participatory Wealth Ranking
Percent of households considered poor by the CGAP instrument and poor by the PWR
74% 118
Percent of households considered poor by the CGAP instrument and non-poor by the PWR
26% 43
Total 100 161 Percent of households considered non-poor by CGAP and non-poor by the PWR
48% 18
Percent of households considered non-poor by CGAP and poor by the PWR
52% 20
Total 100 38 n =199

30
There was a substantial overlap in the results, the two methodologies show the strongest relationship where they agree on the poorest. Three quarters of those defined as poor by the poverty assessment were also defined as poor by the PWR. Almost half of the cases classified as non-poor by the CGAP instrument were also classified as such by the PWR. Overall 68% of the cases were matched by the two research methods. These results were statistically significant at the 95% level. Mismatches occurred in defining both the poor (26%) and the non-poor (52%), and overall 32% of the scores were misclassified with the CGAP instrument tending to classify more households as being poor than the PWR. Most of the disparities between the PWR and CGAP scores occur at the wealthier end which is excusable as neither of these instruments are fine tuned to measurement at the wealthier end. Furthermore these research methods derived definitions of poverty from different research processes and also set different thresholds for relative poverty. Nonetheless, the participatory wealth ranking method has been shown as a reliable and effective mechanism for locating the poor and encouraging poorer women to join the programme. SEF is currently facing some difficult decisions. Client diversity, and the costs of maintaining two separate micro-credit programmes, is becoming an increasing burden for the organisation (SEF, 2000: 11). In the future SEF has decided to model expansion on the TCP format. There will be a greater investment in lower income clients and less emphasis will be placed on clients showing economic growth potential (SEF, 2000: 12). 6. National and regional poverty ratios This section examines the extent, distribution and nature of poverty in South Africa generally, and the Northern Province specifically. The objectives of the section are to: • Enable a comparison of South Africa with other developing countries in terms of
the extent and nature of poverty; • Assess the extent to which the Northern Province in which SEF operates
represents a relatively poor province compared to the other provinces in South African; and finally,
• Assess the extent to which the communities surveyed are relatively poor compared
to other areas in the Northern Province. 6.1 National poverty ratios An important adjunct of apartheid was the absence of credible and comprehensive data on which policies, such as poverty reduction strategies, can be grounded. The previous regime had little interest in collecting information of this nature and often even suppressed data that described conditions in the former "homeland" areas, such as Venda, Gazankulu and Lebowa in the Northern Province. However, since 1993, considerable effort has been made to correct this situation, and a variety of data gathered during the post-apartheid period are available to the current study. The

31
analysis in this section makes use of the October Household Survey (OHS) of 1995 and 1997, the Income and Expenditure Survey (IES) of 1995, and the national data from the 1993 Project for Statistics on Living Standards and Development undertaken by the South African Labour and Development Research Unit (SALDRU) at the University of Cape Town. Data from international agencies has been included where possible, although in almost all cases, this data draws on one of the above sources. The World Development Report of 2000 uses the 1993 SALDRU study in a table providing data on poverty in the developing world. This report shows that 11.5 percent of the South African population live on less than $1 per day, with a poverty gap of 1.8, while 35.8 percent of the population live on less than $2 per day (World Bank, 2000:64). South Africa can thus be compared to countries such as Bolivia (11.3 percent), Colombia (11.0 percent) or Cote d’Ivoire (12.3 percent) in terms of the $1 per day measure of poverty. However, South Africa has yet to develop its own national poverty line despite the proliferation of poverty studies during the 1990’s. During the apartheid years, a number of institutions calculated alternative minimum incomes for subsistence, some of which were commissioned by the mining industry for use in wage negotiations. The most recent analysis of poverty by Statistics South Africa, the official data collection agency of the South African government, uses a measure that is based up a legal minimum income required to qualify for certain subsidies such as housing or services grants. The result is some disagreement as to the extent and distribution of poverty. The table below provides recent estimates of poverty using a variety of different poverty thresholds.
Table 7: Most Recent Poverty Estimates
Type of Poverty Line Amount/ month cut-off (Rand)
% of pop below
poverty line *Population cut-off at 40th percentile of households ranked by adult equiv. exp.
R297.29 53.2
*50 percent of national per capita exp. R201.82 53.2 *Min.& supplemental living levels per capita (Bureau of Market Research, UNISA)
• Supplemental Living Level (SLL) R220.10 56.7 • Minimum Living Level (MLL) R164.20 44.7 *Per adult equiv. h'hold subsistence level (HSL) (Institute for Development Planning Research, UPE)
R251.10 45.7
#Income poverty line per adult equiv. (HSL adapted for urban and rural areas)
R237.00 52.1%
#Basic needs indicator (lowest rank on composite scale of housing, sanitation, water and energy)
21.9%
#Nutritional poverty line (Calories per adult equivalent)
1815 Cal 44.6%
#Nutritional poverty line (Calories per adult equivalent)
2100 Cal 56.7%

32
* Source: Leibbrandt & Woolard (1999) (IES) # Source: Carter and May (1999) (SALDRU) The data in this table shows that approximately half of South Africa’s population can be categorised as being poor in terms of a range of national money-metric poverty lines that are based upon the expenditure required for a minimum food-basket required for subsistence. A similar result is found using a nutritional poverty line based upon food intake with both high and low thresholds. A basic needs indicator shows that 22 percent of households live in conditions that can be described as rudimentary or rustic. South African measures of poverty based on a minimum acceptable standard of living thus portray poverty as being more severe that the rather arbitrary international rule of thumb would imply. While the extent of poverty in South Africa as whole shows little variation between different poverty lines or across different data, the distribution of poverty differs significantly according to the spatial location, race, age and gender of the population. Turning first to a spatial description, the next table shows the proportion of individuals according to settlement type who live in poor households. Approximately 50 percent of all households in rural areas are poor and 68.1 percent of people living in rural households live in poverty. This can be contrasted with the incidence of poverty in the urban and metropolitan areas, where only 39.1 percent and 17.2 percent of the population respectively are living in poor households.
Table 8: Poverty Risk by Settlement Type
Settlement Type % of People in Poverty
% of H’holds in Poverty
Poverty Share (People) %
1993 South Africa (Non-Urban)
68.1 50.3 76.0
1993 South Africa (Towns)
39.1 26.9 15.5
1993 South Africa, Metropolitan Areas
17.2 10.6 8.5
1993 South Africa All Areas
49.9 32.9
n = 8769 households: Source: SALDRU The risk of being in poverty is not only higher in rural areas than elsewhere in South Africa, but also, most of the poor live in rural settlements. Although only approximately 53 percent of the population are located in rural areas in South Africa, the poverty share of these areas is more than 76 %. In other words, more than three quarters of the poor in South Africa live in rural areas. The incidence of poverty is also unevenly distributed across the different population groups in South Africa. The next table shows the proportion of individuals living in poverty by population group.
Table 9: Poverty Risk by Population Group
Population Group
% of People in Poverty
% of H’holds in Poverty
Poverty Share %

33
Africans 60.9 43.6 95.4 Coloured 28.2 21.7 4.4 Indian 2.0 1.1 0.1 Whites 0.7 0.3 0.2 n = 8769 households: Source: SALDRU Not surprisingly, Africans are disproportionately represented among the poor. More than three fifths (60.9 percent) of all Africans are poor, compared to only 0.7 percent of all whites. Furthermore, 95 percent of the poor are African, although Africans comprise some 72 percent of the total population. In light of the high incidence of poverty in rural areas in South Africa, it is also not surprising that rural Africans are over-represented in the poverty orderings. Over half (52.1 percent) of all African households in rural areas are poor, and 69.6 percent of all rural Africans spend an average income that is below the rural Household Subsistence Level. The poverty share of rural African population thus accounts for 71 percent of poor households in South Africa. In summary, international comparisons place South Africa as a middle-income country with poverty levels approximating 11% of the population. These comparisons hide the entrenched inequalities that exist within the country. Within South Africa a range of poverty indicators suggest that the extent of poverty is as great as 50% of the population. The distribution of poverty amongst South African is skewed and differs according to spatial location, race, age and gender. Rural areas appear to hold deeper pockets of chronic poverty, and Africans are disproportionately represented amongst the poor. 6.2 Provincial poverty ratios The provincial distribution of poverty is shown in the following table which also includes an estimate of the poverty gap (the amount required to lift all people to the poverty threshold) and the poverty gap expressed as a ratio of the provincial Gross Geographic Product.
Table 10: Provincial Distribution of Poverty (1993)
Province % H’holds living in poverty
% Ind. Living in poverty
Poverty gap
R million
Poverty Gap as a %
of GGP Western Cape 14.1 17.9 529 1.0 North West 15.4 21.1 1551 7.3 Gauteng 29.7 41.0 917 0.6 Mpumulanga 33.8 45.1 968 3.1 KwaZulu-Natal 36.1 47.1 1159 2.0 Northern Cape 38.2 48.0 257 3.2 Eastern Cape 40.4 50.0 3303 11.4 Free State 56.8 64.0 3716 15.7 Northern Province 61.9 69.3 2948 21.4 Source: DBSA, (1998:211): May, (2000): Source: SALDRU

34
These data show that the Northern Province was categorised as being the poorest province in South Africa in 1993 with 62 percent of households being categorised as being poor, and 69 percent of individuals being categorised in the same way. It is especially noteworthy that an annual transfer of some R2.9 billion would be required to eliminate poverty in the North Province, equal to over 20 percent of the value of all economic output in that province. This may be compared to the situation in Gauteng or the Western Cape in which 1 percent or less of GGP would be required. The implication is that not only are a greater proportion of households poor in the Northern Province, but local economic activity is inadequate in comparison to the needs of the province. Aggregated statistics such as the headcount ratio used above, conceal the highly differentiated experiences of South Africans in terms of human development. An approach that can be used to place South Africa’s poverty and social deprivation in an international context is to compare human development indicators in South Africa with countries with similar income levels. These indicators are useful both for inter-country and inter-regional comparisons, as well as being a way to chart long-term trends. As the next table shows, South Africa fares poorly when compared with other countries ranked as middle-income in terms of their per capita Gross National Product (World Bank, 1996).
Table 11: Comparison of Social Indicators from selected middle-income countries
Social Indicator Poland Thailand Venezuela Botswana Brazil South Africa
Malaysia
GNP per capita US$ (1994) 2 410 2 410 2 760 2 800 2 970 3 040 3 480
Life expectancy 72 69 71 68 67 64 71
Infant mortality rate 15 36 32 34 56 49 12
Adult illiteracy rate N/A 6 9 30 17 18 17
Total fertility rate 1,8 2,0 3,2 4,5 2,8 3,9 3,4
The table shows the inadequacy of using per capita GNP as the sole indicator of development. All the countries to the left of South Africa in the table have lower per capita GNP than South Africa, yet generally they perform better on indicators such as life expectancy, infant mortality and adult illiteracy. The United Nations Development Programme (UNDP) has constructed a composite index based on social indicators that has been named the Human Development Index (HDI) that tries to bring together these different dimensions of poverty. The index claims to measure the outcomes of development (health, knowledge and expanded choice) rather than inputs (health services, schools and income). In developing the HDI, the UNDP followed the principle that the goal of development should be to enable people to live long, informed and comfortable lives. The HDI was devised to determine how nations compare when these factors are taken into consideration. The

35
index is thus a composite of three factors: longevity (as measured by life expectancy at birth); educational attainment (as measured by a combination of adult literacy and enrolment rates); and standard of living (as measured by real GDP per capita). The HDI indicates the relative position of a country (or region or group) on an HDI scale between 0 and 1. Countries with an HDI below 0,5 are considered to have a low level of human development, those with an HDI between 0,5 and 0,8 a medium level and those of 0,8 and above a high level of human development. Table 12 below shows the HDI for South Africa and it’s nine provinces and four population groups in relation to selected countries.
Table 12: Comparison of Human Development Index for Selected Countries, Race and Province
Selected countries (1992) * HDI Province (1991) #
Race (1991)
Canada Singapore Venezuela
0,932 0,901 0,836 0,826 0,820 0,818
Western Cape Gauteng
Whites Indians
Malaysia Brazil Peru Paraguay South Africa Botswana China Egypt Swaziland
0,794 0,756 0.709 0,698 0,694 0,679 0,677 0,670 0,663 0,657 0,644 0,602 0,551 0,543 0,513 0,507 0,500
Northern Cape Mpumalanga Free State KwaZulu-Natal North-West Eastern Cape
Coloureds Africans
Zimbabwe Namibia
0,474 0,470 0,425
N. Province
Source: * UNDP (1994) # CSS Statistical Release P0015, 8 May 1995. At the time of the above analysis, South Africa ranked 86th amongst countries for which the HDI had been measured. The Western Cape and Gauteng are considered to show a high level of human development, similar to that of Venezuela or Singapore. The Northern Province, on the other hand, has a low HDI, comparable with that of
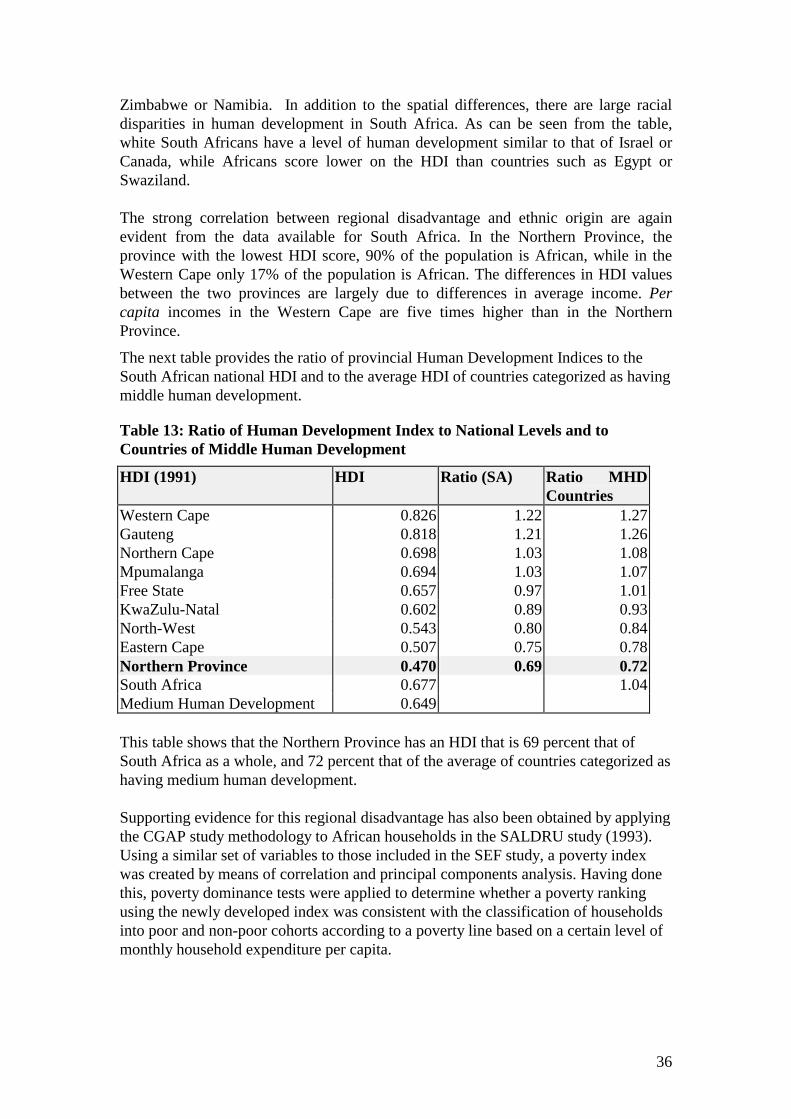
36
Zimbabwe or Namibia. In addition to the spatial differences, there are large racial disparities in human development in South Africa. As can be seen from the table, white South Africans have a level of human development similar to that of Israel or Canada, while Africans score lower on the HDI than countries such as Egypt or Swaziland. The strong correlation between regional disadvantage and ethnic origin are again evident from the data available for South Africa. In the Northern Province, the province with the lowest HDI score, 90% of the population is African, while in the Western Cape only 17% of the population is African. The differences in HDI values between the two provinces are largely due to differences in average income. Per capita incomes in the Western Cape are five times higher than in the Northern Province.
The next table provides the ratio of provincial Human Development Indices to the South African national HDI and to the average HDI of countries categorized as having middle human development.
Table 13: Ratio of Human Development Index to National Levels and to Countries of Middle Human Development
HDI (1991) HDI Ratio (SA) Ratio MHD Countries
Western Cape 0.826 1.22 1.27 Gauteng 0.818 1.21 1.26 Northern Cape 0.698 1.03 1.08 Mpumalanga 0.694 1.03 1.07 Free State 0.657 0.97 1.01 KwaZulu-Natal 0.602 0.89 0.93 North-West 0.543 0.80 0.84 Eastern Cape 0.507 0.75 0.78 Northern Province 0.470 0.69 0.72 South Africa 0.677 1.04 Medium Human Development 0.649 This table shows that the Northern Province has an HDI that is 69 percent that of South Africa as a whole, and 72 percent that of the average of countries categorized as having medium human development. Supporting evidence for this regional disadvantage has also been obtained by applying the CGAP study methodology to African households in the SALDRU study (1993). Using a similar set of variables to those included in the SEF study, a poverty index was created by means of correlation and principal components analysis. Having done this, poverty dominance tests were applied to determine whether a poverty ranking using the newly developed index was consistent with the classification of households into poor and non-poor cohorts according to a poverty line based on a certain level of monthly household expenditure per capita.

37
Figure 7: Cumulative Frequency Distributions for Poor and Non-Poor cohorts (defined using total household expenditure per capita)
Poverty index
1.79384
1.09950
.34719
-.00469
-.17800
-.29167
-.38304
-.44291
-.50031
-.54625
-.57577
-.61241
-.64012
-.67543
-.76034
-.83203
-.89166
-.94618
-1.03305
-1.25901
Cum
ulat
ive
Perc
ent
120
100
80
60
40
20
0
poverty
Non-poor
Poor
The above figure demonstrates, the “poverty curve” for African households classified as poor in the SALDRU study is always above and never crosses the “poverty-curve” for non-poor households. This signifies that poor African households are unambiguously poorer than non-poor households when the cumulative frequency distribution for the poverty index is plotted for both poverty groupings. As such, the poverty index appears to be, at least upon preliminary investigation, a robust proxy for the more conventionally applied money metric measure of poverty in South Africa (monthly household expenditure per capita).
Figure 8: Percent breakdown by poverty tercile, Northern province and the Rest of South Africa
POVGROUP
highestmiddlelowest
Perc
ent
60
50
40
30
20
10
0
Northern Province
Rest of South Africa
With regard to understanding how the level of poverty among African households in the Northern Province compares to that of African households in the rest of the

38
country, the relative poverty tercile approach used in the CGAP analysis was applied to the SALDRU case study. Figure 8 reveals that the pattern of poverty for the Northern Province sub-sample deviates substantially from African households in the other eight provinces. Since a disproportionate percentage of households in the Northern Province fall into the first tercile or poorest poverty category, it may be concluded that African households tend to be poorer relative to the rest of the country. This lends credence to other previously mentioned empirical research concerning the regional concentration of poverty in South Africa in general and the Northern Province in particular. In summary the Northern Province is one of the most disadvantaged provinces in South Africa. HDI rankings assigned to each of the nine provinces place the Northern Province on the lowest human development ranking, equivalent to levels of human development found in Zimbabwe and Namibia. When the CGAP poverty assessment was applied to the Saldru data, it emerged that African households in the Northern Province sub sample were poorer than African households in the eight other provinces in South Africa. 6.3 District level poverty Ratios Finally, recent data from Statistics South Africa has made it possible to compare poverty levels at a district or area level. As this data is based upon a model developed by Statistics South Africa in collaboration with the World Bank, the national imputations must first be shown as the methodology produces a somewhat different national poverty profile.
Table 14: Official Poverty Statistics (1996)
Province Imputed Headcount
Ratio
Imputed Mean
Monthly Exp. (Rand)
Ratio of Mean
National Expenditure
Ratio of H'hold
Infrastructure Index
Ratio of H'hold
Circumstances Index
Gauteng 12% R4270 1.53 0.67 0.91 Western Cape 12% R3816 1.37 0.48 0.49 Mpumalanga 25% R2394 0.86 0.94 0.89 KwaZulu-Natal 26% R2579 0.92 1.32 1.68 Northern Cape 35% R2396 0.86 0.36 0.42 North West 37% R2137 0.77 1.18 0.83 Northern Province 38% R1855 0.67 1.58 1.45 Eastern Cape 48% R1702 0.61 1.67 1.69 Free State 48% R1819 0.65 0.81 0.64 South Africa 28.5% R2789 1.00 1.00 1.00 Source: Statistics South Africa (2000:26, 76), based on 1995 IES and 1996 Population Census According to this data, Northern Province is no longer the poorest province, and has moved to the third poorest, at least in terms of the headcount ratio. To some extent, this change is due to the different methodologies used by Statistics South Africa in this calculation in which income in kind is under-estimated. Specifically, this means

39
that incomes in the Free State are likely to be understated as many of the large number of farm-workers in this province receive payment in food, shelter and services. Nonetheless, it is noteworthy that after the Free State, the Northern Province scores the lowest on a Household Infrastructure Index based on access to essential services while mean expenditure in this province is 67 percent of the national average. Moreover, the Northern District Council into which all of the study sites are located is the 10th poorest district council of the 45 district councils in South Africa, with 5 of the poorer councils located in the Eastern Cape. The final table provides the headcount ratios, mean expenditure and ratio of national expenditure of the three Magisterial Districts in which the SEF/CGAP survey was undertaken. This data is again taken from the Statistics South Africa/World Bank modelling exercise.
Table 15: Headcount Ratio of Surveyed Magisterial Districts
District Imputed Headcount
Ratio
Imputed Mean Monthly Exp.
(Rand)
Ratio of Mean National
Expenditure
Ratio of Mean N. Province Expenditure
Letaba 44% R2805 1.03 1.51 Vuwani 43% R1520 0.54 0.82 Pietersburg 14% R7577 2.71 4.08 Somewhat surprising, these data show that the two of the three magisterial districts have mean monthly expenditures are higher than the mean for South Africa as a whole, and much higher than the mean for the Northern Province. Despite this, Letaba and Vuwani rank as the 3rd and 6th poorest magisterial districts of the 31 magisterial districts in the Northern Province, while Pietersburg, as the capital, is the least poor district. To a large extent, these contradictory statistics reveal the stark inequalities that characterise South Africa. These are particularly evident in settlements such as Pietersburg in which an affluent, mostly white population, reside alongside a poor, mostly black population. This section has shown that although South Africa is in some respects a middle-income country, with well-developed infrastructure, telecommunications and financial systems, there are enormous differences within the country by location and by race. It is also a country with one of the highest levels of inequality in the world (May, 2000). Apartheid served to exclude the majority of South Africans from economic, social and political resources. Many of these inequalities remain in spite of the political transition and six years of reform and transformation. Perhaps not surprisingly, as a relatively remote area largely made up by the former “Homeland” of Venda, the Northern Province emerges as one of the poorest provinces in South Africa. Moreover, two of the three communities in which the CGAP/SEF study was undertaken are among the poorest in that province. It can therefore be concluded that most of the operational area of SEF ranks considerably below the national average of South Africa in terms of the level and severity of poverty. In the case of Pietersburg, the situation is complicated by the specific history of South Africa, and the available data does not support this contention. However, in view of the other data presented in

40
this section, there seems good reason to anticipate that the African population of this district are relatively poor. 7. Conclusion The purpose of the poverty assessment tool was to measure poverty levels between SEF clients and a representative non-client group. CGAP wished to test whether SEF’s mission: poverty alleviation through the provision of micro-finance services was being carried out in practice. The SEF has two specific micro-credit schemes, TCP and MCP. A central component of this study was to compare the depth of poverty outreach of these two micro-credit programmes. TCP has adopted participatory wealth ranking as a poverty-targeting instrument. The poverty assessment sought to measure the effectiveness of this method. The poverty assessment methodology divided the sample into three poverty groups. The initial results combining both the targeted and the non-targeted micro-credit programmes showed that there were as many poor clients entering the programme, as there were non-poor clients. Means tests comparing clients and non-clients indicated that the differences between these two groups were not significant, and would indicate that aggregating the results gives a distorted impression about SEF’s level of poverty outreach. Once the sample was divided between the two credit schemes, distinctions in the depth of poverty outreach emerged. The poverty targeted programme, TCP, showed a significantly greater depth of poverty outreach. In contrast, the non-targeted scheme, MCP, showed limited poverty out reach. Therefore no final assessment of SEF should combine the results of the two programmes as it gives a distorted impression of SEF’s operations. In future expansion, SEF intends to model the new schemes closely upon the TCP approach. This will bring the whole organisation under an integrated poverty alleviation focus. National and regional poverty ratios showed that the Northern Province is one of the poorest provinces in South Africa, and therefore SEF is working in some of the poorest areas in the country. The poverty ratios indicated that both clients and non-clients have living standards well below provincial and national poverty lines. However, the poverty assessment found that within the sample, clients’ and non-clients’ well-being ranged from chronic levels of poverty through to levels of relative security. The results of this study have been noteworthy on two counts. The first is that poverty alleviation programmes need to be accompanied by a targeting strategy and a programme structure appropriate to the needs of the very poor. A poverty targeting strategy appears to be a central component in ensuring that the most vulnerable people are drawn into a poverty alleviation programme. The second related point is that small loan sizes did not deter the non-poor from joining MCP.

41
The poverty assessment instrument has been found to be effective. It compared favourably with the Participatory Wealth Ranking even though these two research methods have different foci, the CGAP instrument being a method of assessment and the PWR a targeting instrument. The CGAP instrument was capable of comparing differences within programmes as a subset of the whole assessment. Finally the poverty assessment tool was found to be a robust proxy for more money metric measures of poverty in South Africa, and it was implemented efficiently and at low cost, by local independent research consultants.

42
8. References Carter, M. and May J. 1999 ‘Poverty, Livelihood and Class in Rural South Africa’.
World Development, Vol.27, No.1, pp.1-20. Consultative Group to Assist the Poorest. 2000 Assessing the Relative Poverty of
Micro-finance Clients: A CGAP Operational Tool Development Bank of Southern Africa (DBSA). 1998 Development Report 1998:
Infrastructure – A foundation for development. Midrand: DBSA. Gibbon, D, Simanowitz A, and Nkuna B, 1999 Cost Effective Targeting: Two
Tools to Identify the Poor PACT Publications Health Systems Trust. 1999 South African Health Review. Durban Klasen S. 1997 Poverty, inequality and deprivation in South Africa: An analysis of
the 1993 SALDRU survey. Social Indicators Research 41(1-3), Leibbrandt M. and Woolard I. 1999 ‘A comparison of poverty in South Africa’s
nine provinces’ Development Southern Africa. Vol.16, No.1, pp.37-54. May J (ed). 2000 Poverty and Inequality in South Africa: Meeting the
Challenge. London. Zed Books May J, Woolard I, and Klasen S. 2000 Poverty and Inequality in South Africa:
Meeting the Challenge. London. Zed Books May J., Carter M.R., Haddad L., and Maluccio J. 1999 ‘KwaZulu-Natal Income
Dynamics Study (KIDS) 1993-1998: A longitudinal household data set for South African policy analysis’ CSDS Working Paper No. 21. University of Natal: Durban
Roberts B. 2000 ‘Chronic and Transitory Poverty in Post-Apartheid South Africa: Evidence from KwaZulu-Natal.’ Journal of Poverty, forthcoming.
Small Enterprise Foundation. 2000 Annual report Small Enterprise Foundation. 1999 Internet home page http://www.sef.co.za/ Simanowitz , A. 2000 “Targeting the Poor-comparing visual and participatory
methods” Small Enterprise Development, Volume 11 Number 1. IT Publications. London
South African Institute of Race Relations. 1992 Race Relations Survey. Johannesburg
Statistics South Africa. 2000. Measuring Poverty in South Africa. Pretoria Statistics South Africa. 2000. Stats in brief. Pretoria United Nations Development Programme. 1998 HIV/AIDS and Human
Development in South Africa. Pretoria. Amabhuku Publications United Nations Development Programme. 1998 Maldives Vulnerability and
Poverty Assessment (VPA). Ministry of Planning and National Development and United Nations Development Programme, Malè, Republic of Maldives.
World Bank. 2000 World Development Report 2000/2001: Attacking Poverty. Oxford. Oxford University Press.

43

44
9. Appendices 9.1 Appendix 1: Map of the survey area Map of South Africa
Map of the Northern Province

45
9.2 Appendix 2: Survey questionnaire
Assessing Living Standards of Households International Food Policy Research Institute
A study sponsored by the Consultative Group to Assist the Poorest (CGAP)
Household code:
Section A Household Identification
A1. Date (mm/dd/yyyy): __/__/____
A2. Branch
A3. Fieldworker name:
A4. Centre name:
A5.Group name:
A6. Village:
A7. Household chosen as (1) client of SEF, or (2) non client of MFI?
A8. Is household from replacement list? (0) No (1) Yes
A9. If yes, the original household was (1) not found or (2) unwilling to answer, or (3) client status was wrongly classified:
A10. Name of respondent:
Name of the respondent:
Address of the household:
A11. Interviewer code:
A12. Date checked by supervisor (mm/dd/yyyy): ___/___/____
A13. Supervisor signature: _______________________________

46
Section B. Family Structure B1. Adult members of household (aged 15 and above)
1 ID
code
2 Name
3 Status of the head of the HHa
4 Relatio
n to head of
HHb
5 Sexc
6 Age
7 Max.
grade of school-
ing passedd
8 Can
writee 9
Main occupa-
tion, current yearf
10 Current mem-ber of SEF
11 Amount of loan
borrowed from SEF
12 Monthly welfare
paymentg
13 Clothes/Footwear expenses for the last 12 months in Randsh
1 2 3 4 5 6 7 8 9 10 11 12
12. a(1) single; (2) married, with the spouse permanently present in the household; (3) married with the spouse migrant; (4) widow or widower; (5) divorced or separated; (6) living mostly away from home but contributing regularly to household.
13. b (1) head of the household; (2) spouse; (3) son or daughter; (4) father or mother; (5) grandchild; (6) grandparents; (7) other relative; (8) other non relative. 14. c(1) male; (2) female. 15. dRaw data grade 1 - 12. 13 equals tertiary education, technikon, university or technical college 16. e(0) no; (1) yes. 17. f(1) self-employed in agriculture; (2) self-employed in non-farm enterprise; (3) student; (4) casual worker; (5) salaried worker; (6) domestic worker; (7)
unemployed, looking for a job; (8) unwilling to work (9) retired; (10) not able to work (handicapped). 18. g (0) none (1) State pension or disability grant (2) Private pension (3) Child maintenance grant (4) Unemployed Insurance Fund (UIF) 19. hIn order to get an accurate recall the clothes and footwear expenses for each adult are preferably asked in the presence of the spouse of the head of the
household. If the clothes were sewn at home, provide costs of all materials (thread, fabric, buttons, needles).

47
B2. Children members of household (from 0 to 14 years)
1 ID code
2 Name
3 Age
4 Clothing and footwear
expenses for the last 12 months
1 2 3 4 5 6 7 8 9 10 11 12 13 14 15
4. aClothes and footwear expenses are asked for once those for adults have been recorded, and in the presence of the spouse of the head of the household. In case of ready-to-wear clothing and footwear items, include full price. In other cases, include cost of fabric, cloth as well as tailoring and stitching charges
Ensure that you prompt households about expenditure on school uniforms for each child

48
Section C. Food-Related Indicators (Both the head of the household and his or her spouse should be present when answering for this section.)
C1. Did any special event occur in the last two days (for example, family event, funeral, wedding, visitor)?
(0) No (1) Yes
C2. If no, how many freshly cooked meals were served to the household members during the last 2 days?
C3. If yes, how many freshly cooked meals were served to the household members during the 2 days preceding the special event?
C4. Were there any special events in the last seven days (for example, family event, funeral, wedding, visitor)? (0) No (1) Yes
(If “Yes,” the “last seven days” in C5 and C6 should refer to the week preceding the special event.)
C5. During the last seven days, for how many days were the following foods served in a main meal eaten by the household?
Quality food Number of days served
Chicken Beef Rice
C6. During the last seven days, for how many days did a main meal consist of just plain pap?
C7. During the last 30 days, for how many days did your household not have enough to eat? No of days.
C 8. During the last 12 months, for how many months did your household have at least one day without enough to eat? No of months
C9. How long will your current supplies of these staples last? Answer in weeks.
Staple Weeks stocked mielie meal sugar cooking oil
C10. If your household earnings increased by R 50.00 a month, how much of that would you spend on purchasing additional food? Answer from R 0 to R50
(Note: Does not include alcohol and tobacco.)

49
Section D. Dwelling-Related Indicators (Information should be collected about the dwelling in which the family currently resides.)
D1. How many rooms does the dwelling have? (Include detached rooms in same compound if same household.)
D2.How many new rooms are being built on this site?
D3. What type of roofing material is used in main house? (1) Plastic sheets, or wood (2) Thatch (3) Iron sheets (4) Tiles
D4. What type of exterior walls does the main house have? (1) Plastic sheets, or branches and twigs (2) Mud walls and wattle and daub (3) Iron sheets (4) Timber (5) Blocks (6) Brick
D5. What type of flooring does the main house have? (1) Mud or dung (2) Rough Cement (3) cement with additional covering?
D6. Rate the condition of the main house on a scale of 1 to 5 , where 1 is seriously dilapidated and 5 is very good condition.?
D7. What is the electricity supply? (1) No connection (2) Shared connection (3) Own connection (4) Generator/solar panel ?
D8. What type of cooking fuel source is used primarily? (1) Dung (2) Wood (3) Paraffin (4) Coal (5) Gas (6) Electricity?
D9. What is the source of drinking water? (1) Rainwater, dam, pond, lake, river or spring (2) Buy water (3) Public borehole/hand pump (4)Shared communal stand pipe (5) Borehole/hand pump in residence (6)tap in yard (7) Tap inside the house?
D10. What type of toilet facility is available? (1) Bush, veld, or no facility (2) Shared toilet (3) Own pit toilet (4) Own VIP latrine (5) Own flush toilet?

50
E. Other Asset-Based Indicators E1. Size of land available for residential use including an attached garden_____________ (metres)
Size of land available for ploughing fields _____________ (hectares) note 1 soccer field is ½ a hectare
E2. Number and value of selected assets owned by household. (Ask household to identify any assets purchased with SEF and eliminate these from the table below.)
Asset type and code Number owned Resale value at current market price Total Amount
Livestock 1. Cattle 2. Adult sheep, goats, and pigs 3.Adult poultry 4. Horses and donkeys Transportation 5. Cars/bakkie 6. Motorcycles 7. Bicycles 8. Other vehicles ( taxi, truck) 9. Carts Appliances and electronics 10. Televisions 11. Hi Fi 12. Refrigerators/Freezer 13. Electric or gas cookers 14. Sewing machine 15. Radios 16. Cell phone Furniture 17. Bedroom Suite 18. Lounge Suite

51
9.3 Appendix 3: Analysis of benchmark robustness Several bivariate correlations that were conducted between the benchmark indicator and monthly household expenditure per adult equivalent. These are presented in Table 16 below. The correlation coefficient between the aforementioned variables for all African households in the SALDRU sample is strong at 0.604 and highly significant at p = 0.01. A similar result was found by focusing explicitly on the 930 African households in the Northern Province sub-sample of the SALDRU study. In this instance, the correlation coefficient shows at a slight increase (0.671) while remaining significant at p = 0.01.
Table 16: Bivariate correlation between monthly expenditure per adult equivalent and the benchmark indicator
Correlation Coefficients
Monthly expenditure by adult equivalence
All African households in the Saldru sample (1993): Pearson Correlation 0.604 Sig. (2-tailed) 0.000**
Clothing and footwear expenditure by adult equivalence N 6483 African households in Northern Province sub-sample (1993):
Pearson Correlation 0.671 Sig. (2-tailed) 0.000**
Clothing and footwear expenditure by adult equivalence N 927 ** Correlation is significant at the 0.01 level (2-tailed). Therefore, preliminary results suggest that clothing and footwear expenditure is reasonably strongly associated with total household expenditure. Further evidence supporting the robustness of clothing and footwear expenditure as a suitable proxy was obtained by applying the poverty dominance approach, in particular cumulative frequency distributions, to both the SALDRU and KIDS datasets. The cumulative frequency distributions (CFD) in Figure 9 can be used to demonstrate and discuss what is termed the first-order dominance criterion. This criterion stipulates that if the CFD for one cohort lies above the CFD of another cohort, then the poverty headcount is higher for the former cohort at all levels of the welfare measure, including the unknown poverty line. Therefore, in the example provided in Figure 9, cohort B is unambiguously poorer than cohort A, since the CFD for cohort B remains consistently above the CFD for cohort A.

Figure 9: Cumulative frequency distributions for two cohorts Tin1wp
FA
Shnhw
Source: UNDP (1998)
52
he poverty incidence curves in Figure 10 reveals that households classified as poor the Saldru study, using a household expenditure per adult equivalent of R237 (in
993 Rands) as the cut-off point, are unambiguously poorer than non-poor households hen the cumulative frequency distribution for clothing and footwear expenditure is lotted for both poverty groupings.
igure 10: Cumulative Frequency Distributions using SALDRU (1998) data for frican households in the Northern Province
imilarly, from Figure 11 it is obvious that the incidence of poverty is unambiguously igher among chronically poor households compared to both transitorily poor and ever-poor households. Moreover, poverty is higher among transitorily poor ouseholds compared to never-poor households. This is consistent with what one ould expect, since the three poverty groupings are defined on the basis of this

53
ordering, i.e. chronically poor households are poorer than transitorily poor households, which in turn are worse off than never poor households8.
Figure 11: Cumulative Frequency Distributions using Kwazulu-Natal Income Dynamics Study (1998) data
Clothing expenditure per adult equivalent
469.24
299.42
214.04
170.74
143.07
123.45
106.26
96.3285.53
75.9867.96
59.6953.97
46.7641.72
35.9029.13
23.8016.73
.00
Cum
ulat
ive
Perc
ent
120
100
80
60
40
20
0
poverty status (orig
Chronically poor
households
Transitorily poor
households
Never poor
households
8 Reference should be made to Roberts (2001) for more detail on these three poverty groups.

54
9.4 Appendix 4: The range of indicators considered in the principle components analysis
Component Matrix
Indicator Score Type of cooking fuel used .643 Structural condition of house .584 Per person expenditure on clothes an shoes .576 Type of roofing material used .534 Assets per person .529 Value of appliances .522 Type of exterior walls .519 Type of latrine .502 Percent of adults who can write .496 Percent of adults who attended high school .492 No of days rice served .478 Percent of adults who have a matric .474 Percent salaried workers .437 Number of days chicken served .431 Percent of adults who attended primary school .398 No days beef served .389 Percent completed tertiary education .374 Value of radios .247 Supply of cooking oil .228 Unemployment dependency ratio -.196 Percent of adults who never attended school -.339 No of months in past year household without food -.470 Did a meal just consist of plain pap? -.475 No of days household went without food -.541

55
9.5 Appendix 5: Independent means tests between clients and non-clients for a selected range of indicators T-Test
Group Statistics
201 5.6517 2.4916 .1757299 5.4582 2.2045 .1275
StatusClientNon client
FAMSIZEN Mean Std. Deviation
Std. ErrorMean
Independent Samples Test
1.430 .232 .913 498 .362 .1935 .2120 -.2229 .6100
.891392.865 .373 .1935 .2171 -.2333 .6204
Equal varianassumedEqual variannot assume
FAMSIF Sig.
Levene's Test forquality of Variance
t df ig. (2-tailedMean
DifferenceStd. ErrorDifferenceLower Upper
95% ConfidenceInterval of the
Difference
t-test for Equality of Means
T-Test
Group Statistics
201 250.5007 347.6996 24.5248299 251.1888 300.7779 17.3944
StatusClientNon client
Per person expenditureon clothes and shoes
N Mean Std. DeviationStd. Error
Mean
Independent Samples Test
.178 .673 -.024 498 .981 -.6881 29.2287 58.1149 56.7387
-.023 386.234 .982 -.6881 30.0672 59.8039 58.4277
Equal varianassumedEqual variannot assumed
Per person expeon clothes and sh
F Sig.
Levene's Test forquality of Variance
t df ig. (2-tailedMean
DifferenceStd. ErrorDifference Lower Upper
95% ConfidenceInterval of the
Difference
t-test for Equality of Means

56
T-Test
Group Statistics
195 .8792 .1768 1.266E-02293 .8781 .1739 1.016E-02
StatusClientNon client
Percent of householdadults who can write
N Mean Std. DeviationStd. Error
Mean
Independent Samples Test
.098 .754 .074 486 .941 193E-03 618E-02 06E-02 99E-02
.073 411.041 .941 193E-03 624E-02 07E-02 11E-02
Equal varianassumedEqual variannot assumed
Percent of housadults who can w
F Sig.
Levene's Test forquality of Variance
t df ig. (2-tailedMean
DifferenceStd. ErrorDifference Lower Upper
95% ConfidenceInterval of the
Difference
t-test for Equality of Means
T-Test
Group Statistics
201 2534.5522 3640.2032 256.7601299 2233.8542 3687.2458 213.2389
StatusClientNon client
Apliance valuesaggregated per person
N Mean Std. DeviationStd. Error
Mean
Independent Samples Test
.091 .763 .899 498 .369 00.6980 34.6040 56.7115 58.1075
.901 432.840 .368 00.6980 33.7613 55.2964 56.6924
Equal varianassumedEqual variannot assumed
Apliance valuesaggregated per p
F Sig.
Levene's Test forquality of Variance
t df ig. (2-tailedMean
DifferenceStd. ErrorDifference Lower Upper
95% ConfidenceInterval of the
Difference
t-test for Equality of Means

57
T-Test
Group Statistics
201 1810.4515 4730.2044 333.6429299 1562.4951 2793.0203 161.5245
StatusClientNon client
per person assetsgained by totasset data
N Mean Std. DeviationStd. Error
Mean
Independent Samples Test
2.072 .151 .736 498 .462 47.9564 37.0390 14.2372 10.1500
.669 293.902 .504 47.9564 70.6855 81.5781 77.4909
Equal varianassumedEqual variannot assumed
per person assetgained by totass
F Sig.
Levene's Test forquality of Variance
t df ig. (2-tailedMean
DifferenceStd. ErrorDifference Lower Upper
95% ConfidenceInterval of the
Difference
t-test for Equality of Means
T-Test
Group Statistics
201 .4776 .5007 3.532E-02
299 .4181 .4941 2.857E-02
StatusClient
Non client
Female head ofhouseholdsrecoded missing 0
N Mean Std. DeviationStd. Error
Mean
Independent Samples Test
4.499 .034 1.314 498 .189955E-02531E-02 95E-02 .1486
1.311 25.208 .191955E-02543E-02 97E-02 .1488
Equal variaassumedEqual varianot assume
Female headhouseholdsrecoded miss
F Sig.
Levene's Test foruality of Varianc
t df ig. (2-tailedMean
DifferenceStd. ErrorDifferenceLower Upper
95% ConfidenceInterval of the
Difference
t-test for Equality of Means
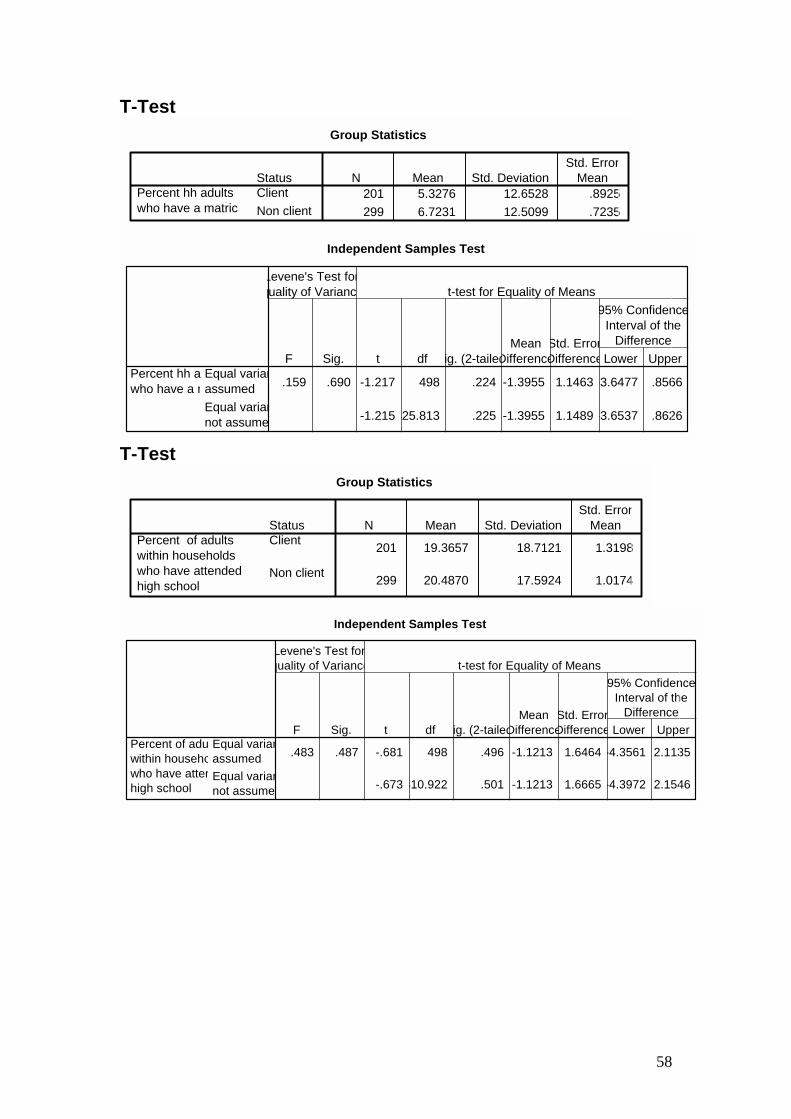
58
T-Test Group Statistics
201 5.3276 12.6528 .8925299 6.7231 12.5099 .7235
StatusClientNon client
Percent hh adultswho have a matric
N Mean Std. DeviationStd. Error
Mean
Independent Samples Test
.159 .690 -1.217 498 .224 -1.3955 1.1463 -3.6477 .8566
-1.215425.813 .225 -1.3955 1.1489 -3.6537 .8626
Equal varianassumedEqual variannot assume
Percent hh awho have a m
F Sig.
Levene's Test forquality of Variance
t df ig. (2-tailedMean
DifferenceStd. ErrorDifferenceLower Upper
95% ConfidenceInterval of the
Difference
t-test for Equality of Means
T-Test
Group Statistics
201 19.3657 18.7121 1.3198
299 20.4870 17.5924 1.0174
StatusClient
Non client
Percent of adultswithin householdswho have attendedhigh school
N Mean Std. DeviationStd. Error
Mean
Independent Samples Test
.483 .487 -.681 498 .496 -1.1213 1.6464 -4.3561 2.1135
-.673410.922 .501 -1.1213 1.6665 -4.3972 2.1546
Equal varianassumedEqual variannot assumed
Percent of aduwithin househowho have attenhigh school
F Sig.
Levene's Test forquality of Variance
t df ig. (2-tailedMean
DifferenceStd. ErrorDifference Lower Upper
95% ConfidenceInterval of the
Difference
t-test for Equality of Means
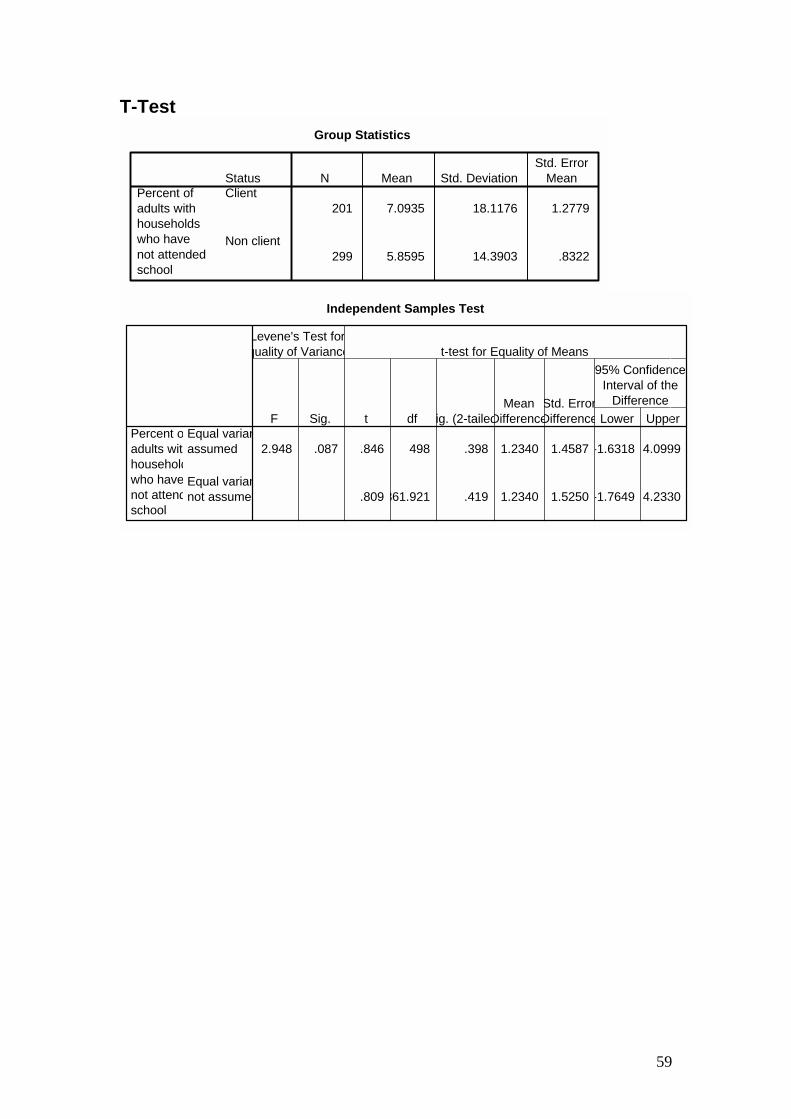
59
T-Test Group Statistics
201 7.0935 18.1176 1.2779
299 5.8595 14.3903 .8322
StatusClient
Non client
Percent ofadults withhouseholdswho havenot attendedschool
N Mean Std. DeviationStd. Error
Mean
Independent Samples Test
2.948 .087 .846 498 .398 1.2340 1.4587 -1.6318 4.0999
.809361.921 .419 1.2340 1.5250 -1.7649 4.2330
Equal varianassumed
Equal variannot assumed
Percent oadults withouseholdwho havenot attendschool
F Sig.
Levene's Test forquality of Variance
t df ig. (2-tailedMean
DifferenceStd. ErrorDifference Lower Upper
95% ConfidenceInterval of the
Difference
t-test for Equality of Means
Related Documents