Poverty and Economic Change in Kalahandi, Orissa: The Unfinished Agenda and New Challenges Sunil Kumar Mishra * Abstract Poverty rips the very social fabric of a society. Its victims are apparently divested of some universally accepted human quality of life. This paper analyses the incidence of poverty in the backward district of Kalahandi, Orissa. It focuses on the economic structure and socio-economic conditions of the people to identify the probable reasons for chronic poverty in the district. The paper argues that to reap the benefits of large deposits of raw material and human resources, development of the non-agricultural sector through proper planning is a prerequisite. Collectivity among the members of the co-operative societies and other decentralized institutions would help in harnessing the benefits. The possibilities of such collective actions for rural development are explored. Introduction Poverty in Kalahandi 1 is paradoxical in nature. The district is rich in natural resources like forests and minerals, and has a large labour force. The landholding size is larger than the average size of landholdings in Punjab; it receives more rain than Punjab, and the cropped area in the district is the highest in Orissa (Mahapatra et al. 2001). Yet, people here are trapped in a vicious circle of poverty. Kalahandi is well known for its backwardness, hunger, starvation deaths and all other social maladies. The district came into prominence in the national and international developmental discourse in the 1980s when the people of the lower strata faced serious economic and social deprivation and were driven to eat inedible roots and grasses. Kalahandi has a high concentration of Scheduled Caste (SC) and Scheduled Tribe (ST) populations. About 93 per cent of its population live in rural areas where the level of poverty is very high. A major challenge for development officials has been that of finding ways to reduce the chronic poverty among the people. To analyse the problem the state economy should be decomposed into a district and village economy. While discussing the economic structure of Kalahandi, we need to analyse * Doctoral Fellow (Economics), G. B. Pant Social Science Institute, Jhusi, Allahabad - 211 019. E-mail: [email protected] I am extremely grateful to Dr. B. Majumder, Prof. U. Kalpagam of G. B. Pant Social Science Institute for their valuable comments, criticisms and guidance in preparing this paper. However, the general disclaimer is applicable here.

Welcome message from author
This document is posted to help you gain knowledge. Please leave a comment to let me know what you think about it! Share it to your friends and learn new things together.
Transcript
Poverty and Economic Change in Kalahandi, Orissa:The Unfinished Agenda and New Challenges
Sunil Kumar Mishra *
Abstract
Poverty rips the very social fabric of a society. Its victims are apparently
divested of some universally accepted human quality of life. This paper
analyses the incidence of poverty in the backward district of Kalahandi,
Orissa. It focuses on the economic structure and socio-economic
conditions of the people to identify the probable reasons for chronic
poverty in the district. The paper argues that to reap the benefits of
large deposits of raw material and human resources, development of the
non-agricultural sector through proper planning is a prerequisite.
Collectivity among the members of the co-operative societies and other
decentralized institutions would help in harnessing the benefits. The
possibilities of such collective actions for rural development are explored.
Introduction
Poverty in Kalahandi1 is paradoxical in nature. The district is rich in naturalresources like forests and minerals, and has a large labour force. The landholding
size is larger than the average size of landholdings in Punjab; it receives more rainthan Punjab, and the cropped area in the district is the highest in Orissa (Mahapatraet al. 2001). Yet, people here are trapped in a vicious circle of poverty. Kalahandi iswell known for its backwardness, hunger, starvation deaths and all other socialmaladies. The district came into prominence in the national and international
developmental discourse in the 1980s when the people of the lower strata facedserious economic and social deprivation and were driven to eat inedible roots andgrasses. Kalahandi has a high concentration of Scheduled Caste (SC) and ScheduledTribe (ST) populations. About 93 per cent of its population live in rural areas wherethe level of poverty is very high. A major challenge for development officials has
been that of finding ways to reduce the chronic poverty among the people. Toanalyse the problem the state economy should be decomposed into a district andvillage economy.
While discussing the economic structure of Kalahandi, we need to analyse
* Doctoral Fellow (Economics), G. B. Pant Social Science Institute, Jhusi, Allahabad- 211 019. E-mail: [email protected] am extremely grateful to Dr. B. Majumder, Prof. U. Kalpagam of G. B. Pant SocialScience Institute for their valuable comments, criticisms and guidance in preparing thispaper. However, the general disclaimer is applicable here.

its economic changes from 1960 to 1991. The basic elements of an economy areeconomic structure (aspects of ownership and control of resources), economic
activity (pattern of utilisation of resources) and economic performance (measure ofwhat the economy results in). Economic change reflects change in the three aspectsof the economy and the interaction among them (Kurien et al. 1979). Economicdevelopment is not possible without the productive use of the rural population. InKalahandi district, the agricultural sector is traditional and backward and is a sourceof livelihood for a large number of people. It is relevant to consider how the excessrural population can be absorbed into other productive occupations. This paperargues that absolute poverty among the rural people may be substantially reducedby encouraging the development of the non-agricultural sector along with that ofthe agricultural sector through special emphasis on rural industries.
In what follows, this paper outlines the poverty scenario in Kalahandidistrict. It then discusses socio-economic change and the livelihood pattern of thepeople in the district. This helps to identify the reasons for its persistent economicbackwardness. Next, it analyses the basic causes of underdevelopment of the non-agricultural sector and examines its prospects in the district, and then analyses the
role of decentralised institutions in the development of the district. Finally, thepaper discusses the anti-poverty programmes and rural development scheme inKalahandi, and concludes with some policy implications.
Poverty in Kalahandi District
The District Rural Development Agency (DRDA) conducts a survey everyfive years at the block level with a view to providing benefits to families livingBelow Poverty Line (BPL), under various anti-poverty programmes implementedeither by the state government or the central government.
Table 1 shows that the percentage of rural families below the poverty linein the State in 1992 was 78.70. Not only is the poverty level in the State very high,but also a stark inter-district disparity in poverty levels exists. The table shows theseverity of poverty in 13 districts of the state. Districts like Kalahandi (86.65),Koraput (87.20), Mourbhanj (90.77), and Phulbani (89.99) show a very high level of
poverty in comparison with other developed districts like Balasore (67.32), Sambalpur(67.37), and Cuttack (70.81). Kalahandi district has as many as 1,94,140 familiesliving below the poverty line out of a total of 2,52,726 families as per the 1999 BPLfamily census. This constitutes 77 per cent of the total number of rural families(NABARD 2000–01). Table 2 shows rural families below the poverty line in variousblocks of the district as they appear in the 1992 and 1997 surveys.
246 Journal of Social and Economic Development July - Dec. 2001
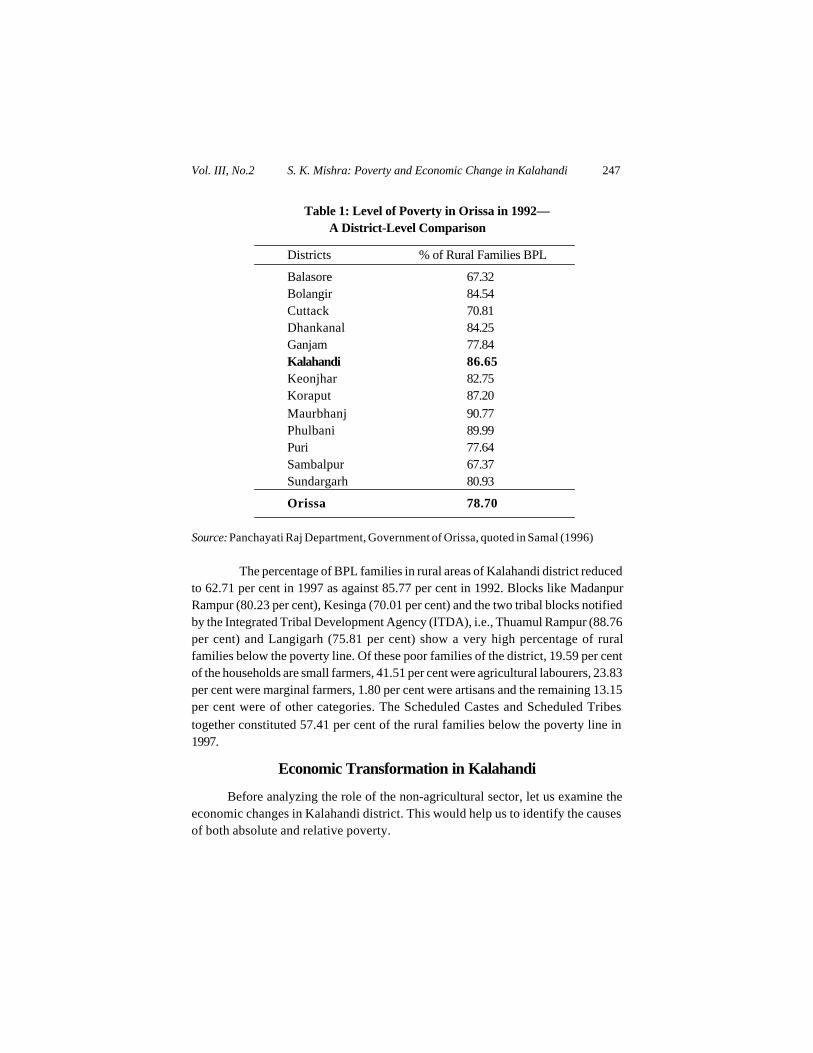
Table 1: Level of Poverty in Orissa in 1992—A District-Level Comparison
Districts % of Rural Families BPL
Balasore 67.32Bolangir 84.54Cuttack 70.81Dhankanal 84.25Ganjam 77.84Kalahandi 86.65Keonjhar 82.75Koraput 87.20
Maurbhanj 90.77Phulbani 89.99Puri 77.64Sambalpur 67.37Sundargarh 80.93
Orissa 78.70
Source: Panchayati Raj Department, Government of Orissa, quoted in Samal (1996)
The percentage of BPL families in rural areas of Kalahandi district reducedto 62.71 per cent in 1997 as against 85.77 per cent in 1992. Blocks like MadanpurRampur (80.23 per cent), Kesinga (70.01 per cent) and the two tribal blocks notifiedby the Integrated Tribal Development Agency (ITDA), i.e., Thuamul Rampur (88.76per cent) and Langigarh (75.81 per cent) show a very high percentage of ruralfamilies below the poverty line. Of these poor families of the district, 19.59 per centof the households are small farmers, 41.51 per cent were agricultural labourers, 23.83per cent were marginal farmers, 1.80 per cent were artisans and the remaining 13.15per cent were of other categories. The Scheduled Castes and Scheduled Tribes
together constituted 57.41 per cent of the rural families below the poverty line in1997.
Economic Transformation in Kalahandi
Before analyzing the role of the non-agricultural sector, let us examine theeconomic changes in Kalahandi district. This would help us to identify the causesof both absolute and relative poverty.
Vol. III, No.2 S. K. Mishra: Poverty and Economic Change in Kalahandi 247

Tab
le 2
: Rur
al F
amili
es b
elow
Pov
erty
Lin
e in
Kal
ahan
di D
istr
ict a
cros
s B
lock
s an
d So
cio-
Eco
nom
ic G
roup
s,19
92 a
nd
199
7
Blo
cks
% o
f B
PL
% o
f B
PL
Out
of t
he B
PL
fam
ilie
s (r
ural
)
Out
of t
he B
PL
fam
ilie
s (r
ural
)
fam
ilies
fam
ilies
in
199
7 su
rvey
, per
cent
age
of
in 1
997
surv
ey, p
erce
ntag
e of
(rur
al) i
n(r
ural
) in
SCST
Smal
lM
argi
nal
Rur
alA
gric
ultu
ral
1992
1997
farm
ers
farm
ers
artis
ans
lab
oure
rs
Bh.
Pat
na75
.56
55.6
825
.41
40.9
815
.49
25.3
91.
8139
.56
Kis
inga
86.0
870
.01
24.5
427
.78
11.8
328
.51
1.73
48.5
7
Kar
lam
unda
84.8
549
.51
23.8
317
.90
20.1
731
.60
1.87
41.7
3
M. R
ampu
r86
.55
80.2
320
.64
43.3
721
.92
27.5
21.
5744
.44
Nar
la83
.88
54.8
914
.34
18.7
610
.06
19.0
60.
8320
.81
Lan
giga
rh87
.05
75.8
128
.37
46.3
719
.53
17.2
60.
8744
.15
Th.
Ram
pur
93.8
188
.76
29.1
455
.35
19.8
521
.04
1.47
40.1
2
Dha
ram
garh
86.2
264
.26
23.8
419
.51
24.7
030
.95
1.66
36.2
3
Juna
garh
95.4
061
.38
22.0
219
.36
16.4
814
.38
2.95
40.0
0
Kal
ampu
r87
.45
51.7
717
.26
27.4
816
.03
8.44
2.20
57.1
3
Jaip
atna
85.3
466
.59
23.1
938
.70
18.3
018
.04
1.90
47.0
0
Kok
sara
90.9
738
.48
22.6
735
.00
29.0
922
.37
1.86
39.3
4
Gol
amun
da88
.43
62.7
721
.21
32.7
220
.83
26.4
62.
0342
.33
Tot
al85
.77
62.7
123
.39
34.0
219
.59
23.9
51.
8041
.51
Not
e: T
he ru
ral f
amil
ies
belo
w th
e po
vert
y li
ne a
re c
alcu
late
d by
the
DR
DA
on
the
basi
s of
the
tota
l inc
ome
of th
e fa
mil
y fa
llin
g
belo
w R
s.11
,000
a y
ear.
The
blo
cks
refe
r to
Kal
ahan
di d
istr
ict a
s di
vide
d in
199
3.
Sour
ce:
Dis
tric
t Rur
al D
evel
opm
ent A
genc
y, K
alah
andi
, Ori
ssa.
248 Journal of Social and Economic Development July - Dec. 2001

Land Distribution Pattern in the District
The land distribution pattern in the district is highly skewed. Table 3
shows the changes in the pattern of distribution of operational holdings between1970–71 and 1990–91. The average land area operated in the district has declinedfrom 3.97 hectares (ha.) in 1970–71 to 1.94 ha. in 1990–91. More then 50 per cent ofthe households owning less than 3 hectares of land operated 20 per cent of the totalland area in 1970–71, whereas the corresponding figures for 1990–91 were 82.09 percent and 49.78 per cent respectively. The figure for the operational holdings of thehighest class (more than 10 ha. of land) shows that 4.69 per cent of all the holdersoperated 21.92 per cent of the total land area. The corresponding figures for 1990–91 were 1.10 and 8.24 per cent respectively. The concentration ratio2 shows a smallervariation from 0.452 and 0.444. This reflects a high concentration of land area. Theinter-class concentration ratio (ICC) 3 shows concentration of land for all classes oflandholding. It is noticed that the ICC of all the size classes has gone up in both theperiods. But the absolute increase of the upper size class is higher than that of thelower classes. Here the ICC of the top group, i.e., those owning land above 20 ha.,interpreted as the upper size class, had 870 per cent of what they would have been
entitled to had the distribution been equal in 1970–71. This figure increased to 1,320in 1990–91, which indicates that the concentration of land area has increased.
Table 3: Operational Holdings of Land in Kalahandi District, 1971 and 1991
Size class % of households % of area operated avg. area operated ICC
(hectare) ’70–71 ’90–91 ’70–71 ’90–91 ’70-71 ’90–91 ’70–71 ’90–91
Less than 1 17.40 39.94 2.76 11.70 0.63 0.56 15.90 29.31
1–3 37.48 42.14 17.84 38.08 1.89 1.75 47.59 90.35
3–5 14.97 10.71 14.30 21.42 3.79 3.88 95.51 199.86
5–10 25.42 6.08 43.99 20.53 6.87 6.56 173.02 337.71
10–20 3.66 0.99 12.10 6.73 13.10 13.21 329.81 680.34
Greater
than 20 1.03 0.11 8.99 1.51 34.54 25.65 869.35 1320.34
Total 100 100 100 100 3.97 1.94
Source: Calculated from District Statistical Abstract for Kalahandi District, Bhubaneswar,and Directorate of Economics and Statistics 1970–71, 1990–91.
The heavy concentration of land implies that the land reform policy in thedistrict has not been effectively implemented in respect of both the ceiling onlandholdings and the consolidation of landholdings. With about 80 per cent of thepeople in the district being dependent on agriculture, such polarization of
Vol. III, No.2 S. K. Mishra: Poverty and Economic Change in Kalahandi 249
landholding affects the small, marginal and landless people very badly, draggingthem into the vicious circle of poverty. This often forces them to opt for informal
credit, which is being exploited heavily. In such a scenario, we often find aninterlinkage in the land, labour, and money markets, which may be dyadic or triadic.In a dyadic interlinkage individuals interact pair-wise (the terms and conditions ofone agent depend on those of others) while in a triadic interlinkage more then twoagents are involved in the contract. Such models enhance the understanding ofexploitation in the agrarian market (Basu 1990). Again, the poor often resort to‘distress sale’ of land and (industrial or agricultural) products. This interlinkagemay lead to exploitation of the poor, which Bhaduri terms ‘forced commerce.’ In hiswords, ‘The fact that the small peasant usually sells when prices are low and buyswhen prices are high runs quite contrary to the textbook wisdom on price responseand strongly indicates a pattern of involuntary involvement in the market under thecompulsion of indebtedness through consumption loan. This in essence is themechanism of “forced commercialization” of a poor peasant economy in the grip ofmerchant’s and usurer’s capital’ (Bhaduri 1983). Some new institutional economistsopine that the interlinkage saves transaction and contract enforcement costs. But
‘...the isolated rural economic communities and its dense social network often dictatea kind of captive interlinking of transaction among the same small numbers ofeconomic agents with virtually “all or nothing” choices for the weaker partners’(Bardhan 1989). The people are in a ‘no man’s land’, where they cannot afford towait to profit from a healthy market situation. The distress sale is either due tomedical problems in the family, or unemployment or high rates of interest on informalloans.
Land Productivity in Kalahandi
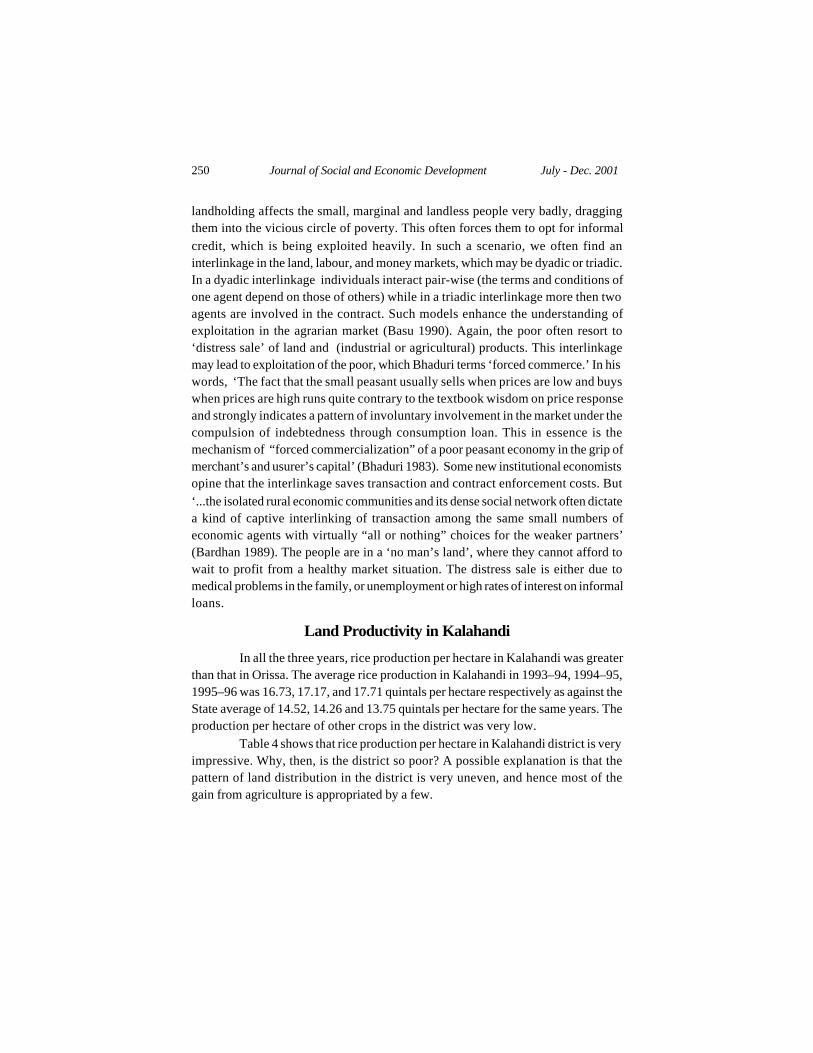
In all the three years, rice production per hectare in Kalahandi was greaterthan that in Orissa. The average rice production in Kalahandi in 1993–94, 1994–95,1995–96 was 16.73, 17.17, and 17.71 quintals per hectare respectively as against theState average of 14.52, 14.26 and 13.75 quintals per hectare for the same years. Theproduction per hectare of other crops in the district was very low.
Table 4 shows that rice production per hectare in Kalahandi district is veryimpressive. Why, then, is the district so poor? A possible explanation is that thepattern of land distribution in the district is very uneven, and hence most of thegain from agriculture is appropriated by a few.
250 Journal of Social and Economic Development July - Dec. 2001
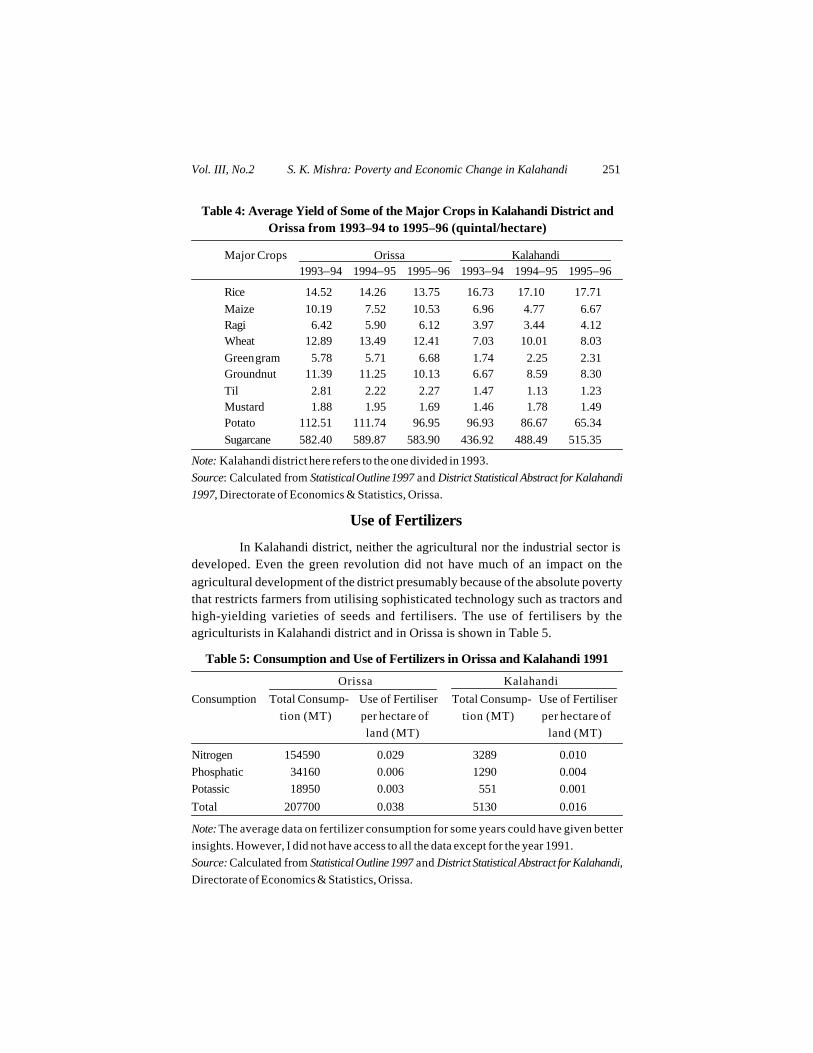
Table 4: Average Yield of Some of the Major Crops in Kalahandi District andOrissa from 1993–94 to 1995–96 (quintal/hectare)
Major Crops Orissa Kalahandi1993–94 1994–95 1995–96 1993–94 1994–95 1995–96
Rice 14.52 14.26 13.75 16.73 17.10 17.71
Maize 10.19 7.52 10.53 6.96 4.77 6.67Ragi 6.42 5.90 6.12 3.97 3.44 4.12Wheat 12.89 13.49 12.41 7.03 10.01 8.03
Green gram 5.78 5.71 6.68 1.74 2.25 2.31Groundnut 11.39 11.25 10.13 6.67 8.59 8.30
Til 2.81 2.22 2.27 1.47 1.13 1.23Mustard 1.88 1.95 1.69 1.46 1.78 1.49Potato 112.51 111.74 96.95 96.93 86.67 65.34
Sugarcane 582.40 589.87 583.90 436.92 488.49 515.35
Note: Kalahandi district here refers to the one divided in 1993.
Source: Calculated from Statistical Outline 1997 and District Statistical Abstract for Kalahandi1997, Directorate of Economics & Statistics, Orissa.
Use of Fertilizers
In Kalahandi district, neither the agricultural nor the industrial sector isdeveloped. Even the green revolution did not have much of an impact on the
agricultural development of the district presumably because of the absolute povertythat restricts farmers from utilising sophisticated technology such as tractors andhigh-yielding varieties of seeds and fertilisers. The use of fertilisers by theagriculturists in Kalahandi district and in Orissa is shown in Table 5.
Table 5: Consumption and Use of Fertilizers in Orissa and Kalahandi 1991
Orissa Kalahandi
Consumption Total Consump- Use of Fertiliser Total Consump- Use of Fertiliser
tion (MT) per hectare of tion (MT) per hectare of
land (MT) land (MT)
Nitrogen 154590 0.029 3289 0.010
Phosphatic 34160 0.006 1290 0.004
Potassic 18950 0.003 551 0.001
Total 207700 0.038 5130 0.016
Note: The average data on fertilizer consumption for some years could have given better
insights. However, I did not have access to all the data except for the year 1991.
Source: Calculated from Statistical Outline 1997 and District Statistical Abstract for Kalahandi,Directorate of Economics & Statistics, Orissa.
Vol. III, No.2 S. K. Mishra: Poverty and Economic Change in Kalahandi 251
From the table, it is clear that the use of fertiliser per hectare of land in
Kalahandi district is as low as 0.016 million tonnes in comparison with that in Orissastate (0.038 million tonnes).
Classification of Main Workers in Kalahandi District
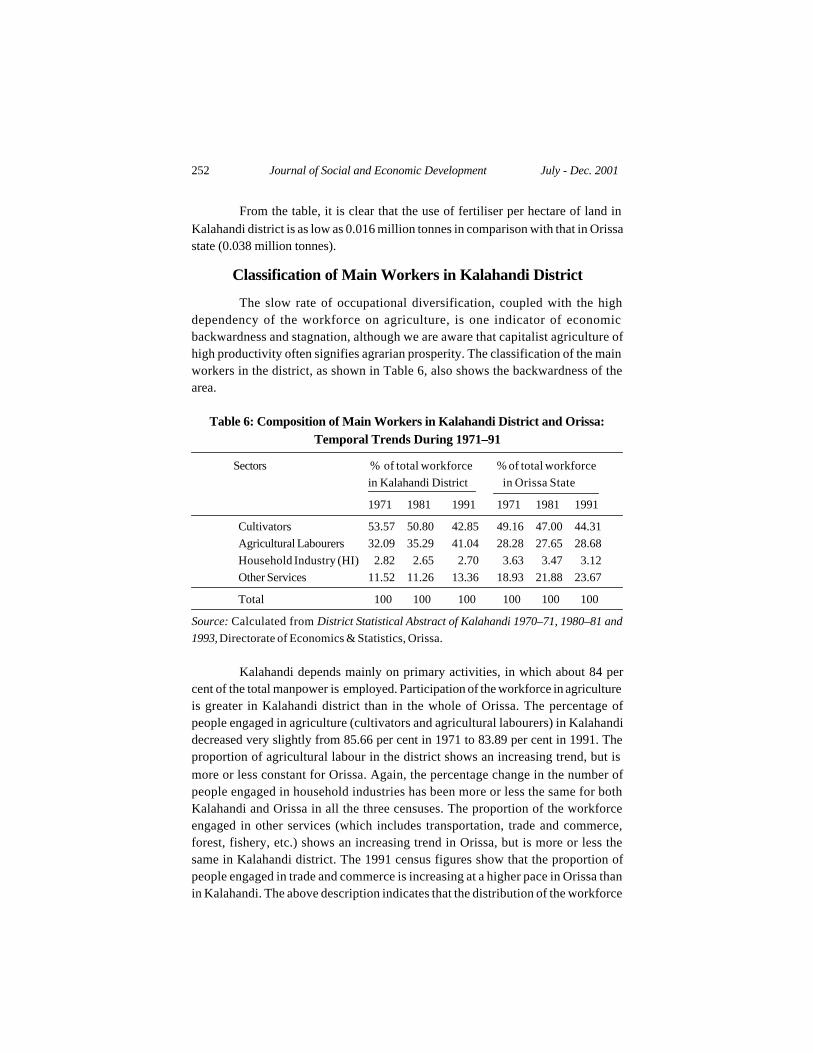
The slow rate of occupational diversification, coupled with the highdependency of the workforce on agriculture, is one indicator of economicbackwardness and stagnation, although we are aware that capitalist agriculture ofhigh productivity often signifies agrarian prosperity. The classification of the mainworkers in the district, as shown in Table 6, also shows the backwardness of thearea.
Table 6: Composition of Main Workers in Kalahandi District and Orissa:Temporal Trends During 1971–91
Sectors % of total workforce % of total workforce
in Kalahandi District in Orissa State
1971 1981 1991 1971 1981 1991
Cultivators 53.57 50.80 42.85 49.16 47.00 44.31
Agricultural Labourers 32.09 35.29 41.04 28.28 27.65 28.68
Household Industry (HI) 2.82 2.65 2.70 3.63 3.47 3.12
Other Services 11.52 11.26 13.36 18.93 21.88 23.67
Total 100 100 100 100 100 100
Source: Calculated from District Statistical Abstract of Kalahandi 1970–71, 1980–81 and1993, Directorate of Economics & Statistics, Orissa.
Kalahandi depends mainly on primary activities, in which about 84 percent of the total manpower is employed. Participation of the workforce in agricultureis greater in Kalahandi district than in the whole of Orissa. The percentage ofpeople engaged in agriculture (cultivators and agricultural labourers) in Kalahandidecreased very slightly from 85.66 per cent in 1971 to 83.89 per cent in 1991. Theproportion of agricultural labour in the district shows an increasing trend, but is
more or less constant for Orissa. Again, the percentage change in the number ofpeople engaged in household industries has been more or less the same for bothKalahandi and Orissa in all the three censuses. The proportion of the workforceengaged in other services (which includes transportation, trade and commerce,forest, fishery, etc.) shows an increasing trend in Orissa, but is more or less thesame in Kalahandi district. The 1991 census figures show that the proportion ofpeople engaged in trade and commerce is increasing at a higher pace in Orissa thanin Kalahandi. The above description indicates that the distribution of the workforce
252 Journal of Social and Economic Development July - Dec. 2001

in various economic activities is highly uneven. Industrial development in Kalahandidistrict is very low. Only 3.98 per cent of the workers are engaged in the industrial
sector as against the state’s average of 8.94 per cent. Trade and commerce engages3.48 per cent of the workers, while the state average is 5.37 per cent. Transportationand communication activities employ only 0.68 per cent of the workforce in thedistrict against 1.74 per cent in the state (Orissa Statistical Abstract 1991). Thehigh dependence of the workforce on the primary sector and the absence ofurbanisation and alternative job opportunities have forced the workers to migrate.
Urbanization and Migration
Much of the literature on development after the 1980s emphasises theenhancement of non-agricultural employment in the urban fringes or what is calledthe ‘rurban areas’. Urbanization provides employment for the rural worker. Thesmall towns or large cities provide the marketing opportunity and product
competition for rural non-agricultural ‘exports’ and encourage the rural areas tomeet non-local demand. Again, better communication and transportation facilitieshave enabled the workers of adjacent rural villages to shift their activities withoutchanging their residence (Basant et al. 1998). The operation of economies of scalelowers the cost, bringing about improvement in efficiency with which rural labourand financial markets are equipped to channelise various remunerative activities.This helps in the viable utilisation of rural resources and rural markets (Haggbladeet al. 1989). Urbanisation in Kalahandi can be judged from the percentage of urbanpopulation to the total population, which was 4.85, 6.04 and 6.51 in the 1971, 1981,and 1991 censuses respectively, as against 8.41, 11.79, and 12.73 per cent in Orissafor the same years. The SC and ST accounted for more than 50 per cent of the entirepopulation, but the rate of urbanisation of these categories is much lower than thatin the state and country. In the 1981 census, the rate of urbanisation of SC was 5.97per cent as against 9.40 per cent in Orissa and 16 per cent in India. In respect of ST,the corresponding figures were 1.35 per cent as against 4.61 per cent and 6.20 per
cent respectively (Nayak et al. 1991). The total urban population of 1,04,163 isspread over five towns, i.e., Bhawanipatna, Khariar Road, Kesanga, Kharier andJunagarh. Bhawanipatna is a Class II town whereas the remaining are Class IVtowns. The data on Kalahandi show that lack of urbanisation forces the workers tomigrate to other villages and cities in search of jobs. The following table showsrelated figures in these five urban towns in the 1991 census.
Vol. III, No.2 S. K. Mishra: Poverty and Economic Change in Kalahandi 253
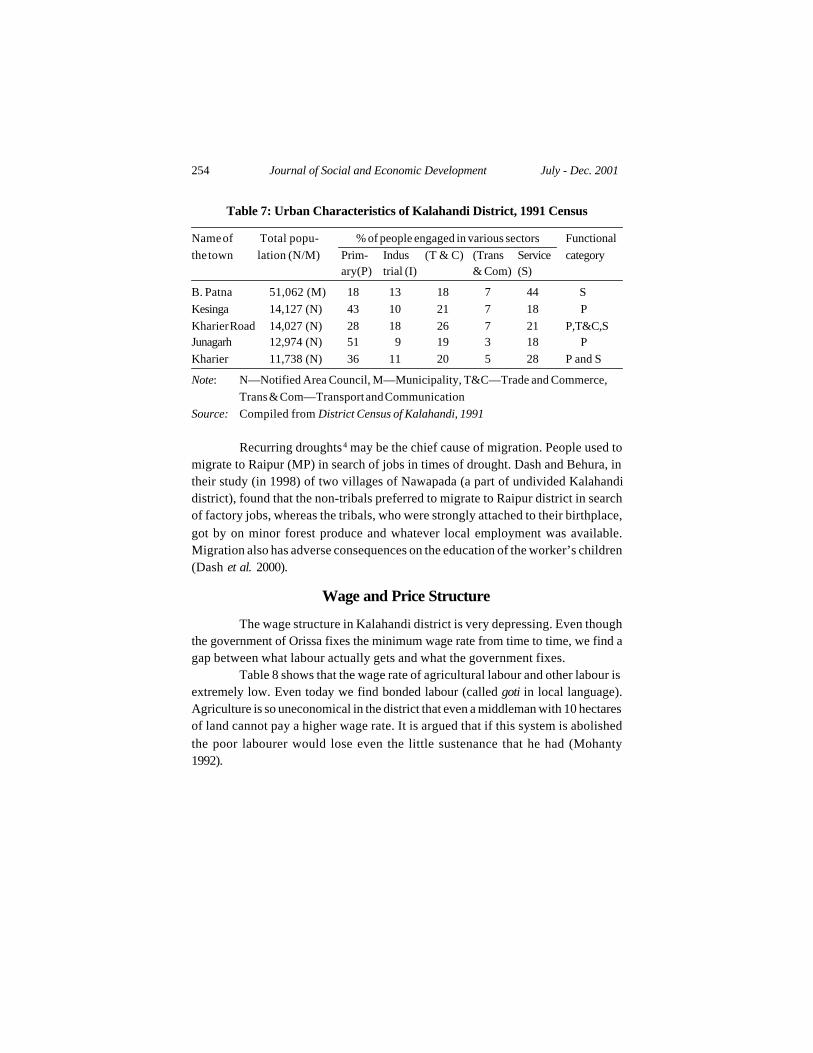
Table 7: Urban Characteristics of Kalahandi District, 1991 Census
Name of Total popu- % of people engaged in various sectors Functional
the town lation (N/M) Prim- Indus (T & C) (Trans Service categoryary(P) trial (I) & Com) (S)
B. Patna 51,062 (M) 18 13 18 7 44 S
Kesinga 14,127 (N) 43 10 21 7 18 P
Kharier Road 14,027 (N) 28 18 26 7 21 P,T&C,SJunagarh 12,974 (N) 51 9 19 3 18 P
Kharier 11,738 (N) 36 11 20 5 28 P and S
Note: N—Notified Area Council, M—Municipality, T&C—Trade and Commerce,
Trans & Com—Transport and Communication
Source: Compiled from District Census of Kalahandi, 1991
Recurring droughts4 may be the chief cause of migration. People used tomigrate to Raipur (MP) in search of jobs in times of drought. Dash and Behura, intheir study (in 1998) of two villages of Nawapada (a part of undivided Kalahandidistrict), found that the non-tribals preferred to migrate to Raipur district in searchof factory jobs, whereas the tribals, who were strongly attached to their birthplace,
got by on minor forest produce and whatever local employment was available.Migration also has adverse consequences on the education of the worker’s children(Dash et al. 2000).
Wage and Price Structure
The wage structure in Kalahandi district is very depressing. Even thoughthe government of Orissa fixes the minimum wage rate from time to time, we find agap between what labour actually gets and what the government fixes.
Table 8 shows that the wage rate of agricultural labour and other labour isextremely low. Even today we find bonded labour (called goti in local language).Agriculture is so uneconomical in the district that even a middleman with 10 hectaresof land cannot pay a higher wage rate. It is argued that if this system is abolished
the poor labourer would lose even the little sustenance that he had (Mohanty1992).
254 Journal of Social and Economic Development July - Dec. 2001
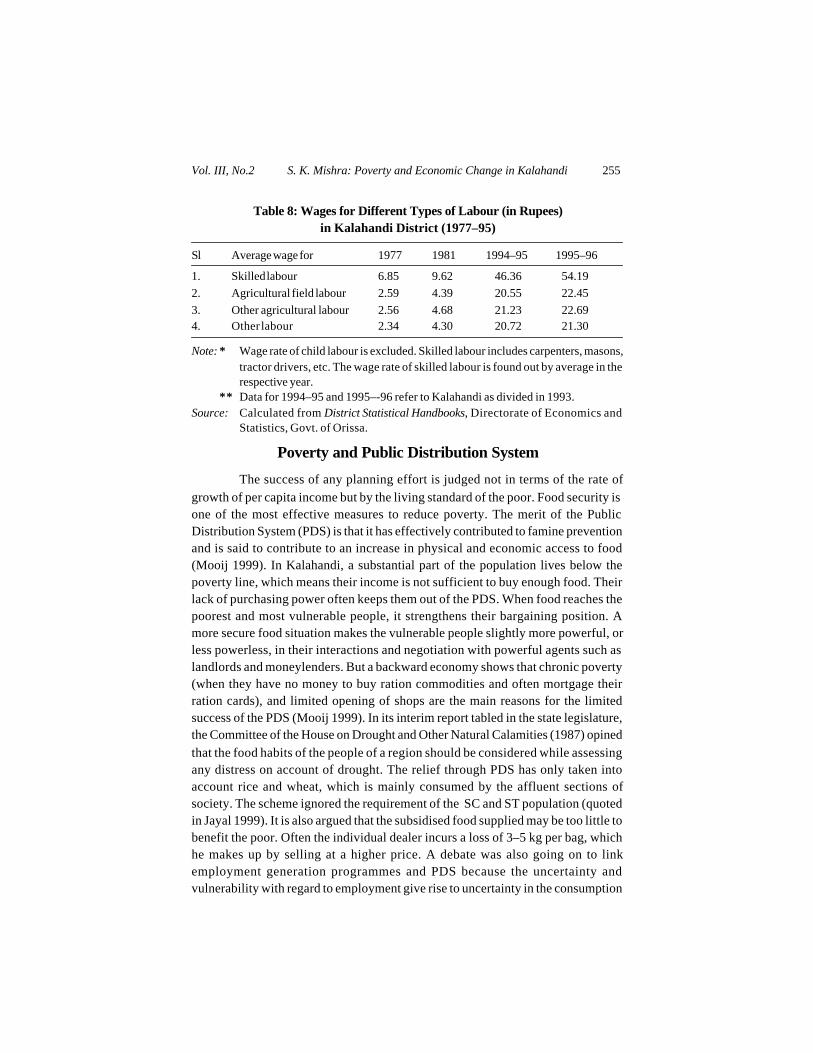
Table 8: Wages for Different Types of Labour (in Rupees)in Kalahandi District (1977–95)
Sl Average wage for 1977 1981 1994–95 1995–96
1. Skilled labour 6.85 9.62 46.36 54.19
2. Agricultural field labour 2.59 4.39 20.55 22.45
3. Other agricultural labour 2.56 4.68 21.23 22.694. Other labour 2.34 4.30 20.72 21.30
Note: * Wage rate of child labour is excluded. Skilled labour includes carpenters, masons,tractor drivers, etc. The wage rate of skilled labour is found out by average in therespective year.
** Data for 1994–95 and 1995–-96 refer to Kalahandi as divided in 1993.Source: Calculated from District Statistical Handbooks, Directorate of Economics and
Statistics, Govt. of Orissa.
Poverty and Public Distribution System
The success of any planning effort is judged not in terms of the rate of
growth of per capita income but by the living standard of the poor. Food security isone of the most effective measures to reduce poverty. The merit of the PublicDistribution System (PDS) is that it has effectively contributed to famine preventionand is said to contribute to an increase in physical and economic access to food(Mooij 1999). In Kalahandi, a substantial part of the population lives below thepoverty line, which means their income is not sufficient to buy enough food. Theirlack of purchasing power often keeps them out of the PDS. When food reaches thepoorest and most vulnerable people, it strengthens their bargaining position. Amore secure food situation makes the vulnerable people slightly more powerful, orless powerless, in their interactions and negotiation with powerful agents such aslandlords and moneylenders. But a backward economy shows that chronic poverty(when they have no money to buy ration commodities and often mortgage theirration cards), and limited opening of shops are the main reasons for the limitedsuccess of the PDS (Mooij 1999). In its interim report tabled in the state legislature,the Committee of the House on Drought and Other Natural Calamities (1987) opined
that the food habits of the people of a region should be considered while assessingany distress on account of drought. The relief through PDS has only taken intoaccount rice and wheat, which is mainly consumed by the affluent sections ofsociety. The scheme ignored the requirement of the SC and ST population (quotedin Jayal 1999). It is also argued that the subsidised food supplied may be too little tobenefit the poor. Often the individual dealer incurs a loss of 3–5 kg per bag, whichhe makes up by selling at a higher price. A debate was also going on to linkemployment generation programmes and PDS because the uncertainty andvulnerability with regard to employment give rise to uncertainty in the consumption
Vol. III, No.2 S. K. Mishra: Poverty and Economic Change in Kalahandi 255

level, leading to food insecurity (Coondoo et al. 2000). In such a case the PDS andEmployment Generation Programmes can overcome the food deficiencies of the
poor in Kalahandi.
Development of Non-Agricultural Sector
There are two valid hypotheses for the development of a backward areathrough the development of the non-agriculture sector. These are:(a) Development of the non-agricultural sector through agricultural development.(b) Encouragement of the non-agricultural sector, given the state of agriculture in
terms of production, productivity, employment, etc. This can promote thedevelopment potential of the district, and boost the agricultural sector.
Development of rural industry requires physical and human infrastructure,which the Kalahandi district lacks.
It was observed in Kalahandi that credit is provided by the Artisan IndustrialMultipurpose Co-operative Society (AIMCS) without any collateral security. The
AIMCS is a failure in the district because of heavy default. In such a scenario,according to the DIC officials, it is very difficult to provide loans on non-collateralsecurity deposit basis. After 1995, the department did not provide loans to thepeople owing to non-rotation of the loan amount. But the question is whether ornot providing funds is the solution to the problem.
Appropriate technology, which is vital for industrial development, islacking in Kalahandi. Such technology should develop according to the tastes andpreferences of customers belonging to different regions. For instance, the Banarasisaree is made for different regions in India in accordance with the tastes andpreferences of the people of that region. The design of Banarasi sarees for Bengalisis quite different from that for Oriyas.
The literacy rate in the district is 36.08 per cent, out of which the ST and SCpopulations account for 28.20 per cent and 18.54 per cent respectively. Thecorresponding figures for Orissa are 49.09, 36.78 and 22.31 per cent respectively.The percentage of main workers to the total population in the district is 37.50, out of
which male literacy is 59.80 per cent and female literacy is 15.20 per cent respectively.The illiteracy rate in the district was observed to be 67.50 per cent for main workers.Out of this, 60.70 per cent of the total male main workers were illiterate. Illiteracyamong female main workers was 94.60 per cent. The comparisons of illiteracybetween the male and female main workers show that illiteracy among female workersis extremely high. Hence, one can question the extent to which the ideal of ‘women’sempowerment’ is valid without upgrading their technical skill and impartingeducation. High illiteracy often forces people to accept low-paying jobs. Anothercharacteristic of the district is that female participation in non-agricultural activitiesin rural areas is very low as compared with that in urban areas. Again, the percentageof women’s participation in the rural workforce (both in agriculture and non-
256 Journal of Social and Economic Development July - Dec. 2001
agriculture sectors) is higher than that of the urban areas. For economic developmentand enhancement of the livelihood pattern of the people below the poverty line,literacy is a necessary prerequisite. In Orissa, 50.60 per cent of the main workers are
illiterate, which is constituted by 42.50 per cent male workers and 87.20 per centfemale workers. It would be well to cite the example of Taiwan. In 1930, the Japanesecolonial government took the initiative to introduce literacy in Taiwan. As a result,the rural labour force became largely literate, contributing positively towards ruralindustrialization (Ho 1979, p. 94) and income generating capacity of the worker.
Role of Institutions in Reducing Poverty
The question that arises is, how to harmonise the interests of variousagents of a backward economy like Kalahandi through the institutional mechanism?The immediate answer is the effective role of decentralised institutions (local self-government, forming of co-operative societies, NGOs and self-help groups). A fineexample of the successful venture of co-operative societies is Gujarat Co-operativeMilk Marketing Federation, Anand, where the members of the society are involvedsolely in milk production and selling through a comprehensive plan. Other examplesof successful co-operative societies are the IRULA Snake Catchers’ Co-operative
Society (Tamil Nadu), Mahila Grihya Udyog, Rajasthan. The success of a co-operativesociety depends on the appropriate system of management training, skilldevelopment, availability of raw materials, finances, and equipment (Durgaprasad1995). In Kalahandi district, some co-operative societies are working successfully.Sometimes, owing to the negligence and irresponsibility of the bureaucracy and thefinancial institutions, the societies do not play their role. In an interview with somemembers of co-operative societies in the district, it was found that the basic problemis transaction cost due to delay in getting the loan. The interval between applyingfor and receiving the loan was very long, often forcing loan-seekers to borrow fromthe informal credit markets at an interest rate of 7–10 per cent per month during thepeak fair season. They spend a part of the loan on food and raw materials. Peopleare also forced to bribe the officials (bank and administrative) either directly orthrough middlemen. A fixed commission is charged at two levels, i.e. co-operativesecretary and Industrial Promotion Officer. In the co-operative society one memberhad sanctioned a loan of Rs.12,000 from IRDP, out of which Rs.2,000 was deducted.
Out of the Rs.2,000, the co-operative secretary and the Industrial Promotion Officergot a 50:50 share. But when a middleman is involved, the basis of commission is45:45:10 (10 per cent for the middleman). The Rs.10,000 that the member receivedwas spent on repaying debts and on food. From the above example it is clear that inany market season of handicraft products, hardly anything was invested in thetrade. Timely sanction of loans is imperative because artisans generally need moneyduring peak fair seasons like Dasahara Puja and Ratha Yatra. Delays in getting
Vol. III, No.2 S. K. Mishra: Poverty and Economic Change in Kalahandi 257

loans could result in spending the money on food and other articles, which woulddrive them back to the informal credit market.
Decentralized institutions like local self-government and non-governmentorganizations are found to play a very important role especially in backward ruraleconomic development. Local representatives are more open to public scrutinythan the national or state government, and are more responsible and accountable tothe community and individuals whom they are supposed to serve. These institutionsshould play an effective role, particularly in the various programmes and policiesimplemented for rural development. Again, an effective role for decentralisedinstitutions should be to enable the ‘have nots’ (SC, ST and women) to participatein the decentralised model of development on an equal footing with the ‘haves’.Much emphasis is placed on the role of local self-government in the 73rd amendmentof the Constitution.
On the other hand, NGOs have a major role to play in mobilising the poorand in protecting their rights and providing them with the latest information.Sometimes, NGOs are alleged to be more corrupt than the bureaucracy. The mainreason for this is that the NGOs lack continuity and work in isolation, and often at
cross-purposes (Samal 1998). Sometimes, the local institutions are dominated byvested interests, which do not allow the poor to be benefited. Hence the necessityof structural change in rural society to enable the poor to be in a position ofdominance in local-level institutions (Samal 1998). A constructive and supportiverole of local self-government and non-governmental organisations (NGOs) isabsolutely necessary. In the words of Raja Chelliah ‘...the ongoing poverty alleviationprogrammes would have to be strengthened and made more efficient and costeffective by enlisting the participation of panchayati raj institutions and NGOs.’(Chelliah et al. 1999).
Anti-Poverty Programmes and Rural Development in Kalahandi
The state and central governments have launched various anti- povertyprogrammes aimed at providing wage employment and self-employment for thepoor. Various organisations like Khadi and Village Industries Commission (KVIC),
Coir Board, and the Handlooms Boards deal with the development of the non-agricultural sector. The central and state governments have implemented variousanti-poverty programmes in rural areas. Examples of these are the Integrated RuralDevelopment Programme (IRDP), Training for the Rural Youth for Self-Employment(TRYSEM), Jawahar Rojagar Yojana (JRY), and Employment Assurance Scheme(EAS) Tool Kits Programmes. The IRDP and TRYSEM programmes are aimed atpromoting self-employment, and JRY is for creation of supplementary wageemployment. Kalahandi district, as a backward area, receives large funds for suchprogrammes. The two tribal blocks in the district, i.e., Th. Rampur and Langigarh,
258 Journal of Social and Economic Development July - Dec. 2001

receive huge assistance for the socio-economic development of the tribal people indevelopment of agriculture, rural industries, basic social and economic infrastructure,etc. The total expenditure on various anti-poverty programmes in the district during1989–1999 is given below.
Table 9: Physical & Financial Achievement of Various Anti-PovertyProgrammes in Kalahandi 1989–2000
Years Total Fund Expenditure % of fund Phy. Target Achieve- Target Achieve-
available incurred (in unutilized (in no.) ment (in mandays ment (in
(in lakhs) lakhs) no.) (in lakh) (lakh)
1989–90 1787.360 1352.460 24.34 12486 9717 0.00 0.00
1990–91 1953.030 1207.040 38.2 7357 6245 0.00 0.00
1991–92 1761.970 1524.200 13.5 7004 5420 0.00 0.00
1992–93 1935.300 1380.750 28.66 7671 5306 0.00 0.00
1993–94 3174.200 2557.320 19.44 11461 8041 0.00 0.00
1994–95 3949.245 3012.320 23.73 13330 7690 0.00 60.204
1995–96 3703.235 2925.810 21 10734 11154 52.300 44.330
1996–97 3828.455 2651.210 30.37 10043 10184 44.890 31.860
1997–98 3692.545 2692.490 27.09 8990 14067 29.310 29.540
1998–99 3730.640 2496.080 33.1 10896 9626 30.110 25.890
1999–
2000 2402.640 785.140 2745 3589 30.110 8.480
Note: Data after 1992–93 refers to Kalahandi as divided in 1993.
Source: Calculated from the data available in DRDA, Kalahandi, Orissa.
Despite the huge expenditure on anti-poverty programmes in the district,poverty is still rampant. Table 9, which depicts the total expenditure on povertyalleviation programmes from 1989–90 to 1999–2000, shows that a substantial amountof money remained unutilized. In 1996–97, 1997–98, and 1998–99, a balance of1,177.245, 1,000.055, 1,234.560 lakh rupees respectively remained unutilised in thedistrict. We find that except in 1997–98, there was a large gap between the mandaystargeted and the achievement since 1995–96. According to Column 4, which showsthe percentage of funds unutilised for various anti-poverty programmes, in 1990–91,1996–97 and 1998–99, non-utilisation of funds was very high. The probablereasons include institutional failure, corruption, low level of economic infrastructure,lack of awareness and/or interest among the people, bureaucratic apathy and lackof proper accountability. No doubt these anti-poverty programmes have a bearingon poverty reduction, especially in the rural areas, but lack of co-ordination hamperstheir effectiveness. The weak linkage between TRYSEM and IRDP is one such
instance. The fourth round of IRDP concurrent evaluation revealed that only 3.88
Vol. III, No.2 S. K. Mishra: Poverty and Economic Change in Kalahandi 259

per cent of IRDP beneficiaries received training under TRYSEM (GOI 1998–99).Further, TRYSEM trainees are not provided with the basic instruments from the toolkits scheme. In such a situation, the lack of co-ordination of various programmes
affects rural industrial development. Another major consideration that is overlookedis market viability. The basic reasons for non-implementation of the programmesare:(a) wrong selection of the target group,(b) market viability is not considered,(c) negligence on the part of bureaucratic and bank officials,(d) misuse of funds by those who take loans from formal institutions,(e) submission of clearance certificates - If someone defaults on a loan his childcannot avail of a loan from the formal institutions even if he is a skilled or semi-skilled worker.
Conclusions and Policy Implications
Eradication of poverty in Kalahandi is a daunting challenge for policymakers and planners. This is reflected in the fact that 62.53 per cent of the rural
families in the district were below the poverty line in 1997. Four major factorsaccount for the severity of poverty. First, more than 85 per cent of the total workforceis engaged in agricultural and allied activities, of which 46 per cent are agriculturallabourers. Second, infrastructure (physical, social and economic) is underdeveloped.Third, the traditional cottage and rural industries are neglected, leading to themigration of artisans from the secondary to the primary sector, a case of reversediversification. Fourth, there is an institutional failure in the district. The institutionsinclude the central, state and local government, NGOs, and co-operative societies.
The slow rate of occupational diversification, coupled with a highworkforce dependency on the agricultural sector, is one indicator of economicbackwardness and stagnation. The identification of the main workers in the districtshows the backwardness of the area. Hence the task is to shift the workforce fromthe agricultural sector to the non-agricultural sector. A labour-intensive path forthe non-agricultural sector should be chosen in the beginning with a dynamicity ofthe transformation curve, which assures a positive relation between the average
income and total employment.The first step towards overcoming agricultural backwardness is the
development and revival of the irrigation system. Often, the coexistence of drought,poverty and agricultural backwardness in the district is observed as a curse ofnature. We also find a curious duality in the government’s approach. On the onehand, the state government and district administration denied the food crisis anddrought; on the other hand, the state government pressed the central governmentfor a larger relief fund. Often, the discourse of hunger is shifted to the discourse ofdrought, shifting the blame from the state to nature (Jayal 1999). But rainfall in the
260 Journal of Social and Economic Development July - Dec. 2001
district is not low. It receives more rainfall than Punjab. The difficulty is in watermanagement. At independence the district had an extensive traditional irrigation
network of ponds, wells, tanks, etc., managed by the local institutions like ‘jalsabha’. With the advent of planning, the traditional sources of irrigation were takenover by the government. This was the beginning of mismanagement, which took itstoll on agricultural growth. There is a need for planners and policy makers to formulatean effective strategy to revive the traditional source of irrigation so as to providenot only water and therefore increasing agricultural productivity, but also productiveemployment for the poor of Kalahandi. The revival of the micro watershed willprovide irrigation facilities for about 80 per cent of the total cropped areas. It willalso create productive employment for about 30,000 poor people at a cost of Rs.50,000million within ten years. The district gets approximately Rs.100 crore every year forirrigation and watershed development from different national and internationalagencies (Mahapatra 2001). Agricultural development through technologicaldevelopment, improving irrigation systems, supply of high-yielding variety of seeds,formal credit for cultivators, improving the infrastructural facilities, strengtheningmarketing societies and an effective implementation of land reforms is absolutely
necessary.The second major public investment needed is rural electrification. Even
after fifty years of planning, about 50 per cent of the villages have not been electrified.The question remains about the number of households that have electricityconnection in these electrified villages. Development of the power sector is crucialto agricultural and industrial development. Because of the absence ofindustrialisation in the district, a large percentage of electricity (39.70) is in thedomestic sector compared with the state average of electricity consumption fordomestic use (21.50), whereas the percentage for industrial use in the district is verylow (28.86) compared with the state average (57.37) in 1995 (Statistical Abstract,Orissa, 1997). Though many villages have been electrified, continuous power supplyis not ensured and energisation is very expensive.
The non-farm sector can play a major role in the development of the district.The district is very famous in traditional industries like handloom (Bhawanipatna),pottery (Jampader), stone carving (Bhawanipatna Koksara, Boden), woodcarving
(Dharmagarh), paper flower making (Rampur), horn work (Langigarh), paddy craft(Kesenga), Solapith work (Junagarh, etc.). The revival of the traditional industrywill not only sustain the poor but will also check migration in the district. Themarketing societies need a boost. The government should provide artisans withproper marketing facilities for their products. Since handicrafts in the local marketare costly, the government should provide marketing facilities for their products atthe national and international levels. This would help producers to get rid of themiddleman. It is vital to revive the marketing societies in the district, which work asa link between the artisans and the market. Kalahandi has 13 AIMCS centres for
Vol. III, No.2 S. K. Mishra: Poverty and Economic Change in Kalahandi 261

promotion of rural artisan activities. Kalahandi GMCS (under handicraft department)and District Supply Marketing Society (under ORMAS) provide marketing support
for the artisans. The Tribal Development Co-operative Society provides procurementand marketing facilities for some of the forest and other products like siali leaves(used for leaf plate making) and broom grass. Training facilities should be providedfor weavers in design development, tie and dye, and upgradation of skills. TheHandloom Weavers Co-operative Society, which provides forward and backwardlinkages to the weavers, has remained defunct. Alternative arrangements should bemade for supply of raw materials and provision of market support for the weavers.The credit system for the development of rural industries should be properly targeted,and steps taken against official harassment. This would reduce the high transactioncost incurred by the people.
Food security should be assured in the district. The local staple food(used mostly by the tribals) like jawar and bajra should be taken into account inassessing the performance of PDS. The procurement system needs to bestrengthened. It is found that almost fifty per cent of the produce (agricultural,rural, industrial or minor forest produce) is sold before government institutions
start procuring. The case of mahua, the main forest product in the district, isillustrative. Fair returns on the product enhance the income of the rural poor of thedistrict. Since the Forest Corporation is not properly organised, people sell theproduct at prices as low as Rs.1–1.50 per kg, whereas the rate fixed by the governmentis Rs.3 per kg.
The total forest area of Kalahandi district reduced largely afterindependence. Commercialization of forests has deprived the tribals of the districtof the minor forest produce, which is an important source of their livelihood. Acomprehensive plan is necessary to enhance the forest area and plant trees that areeconomically rewarding and environment-friendly. A linkage with the rural industrialsector should be formed. The forest policy should make provision for artisans,especially those directly dependent on forest products, to get raw materials withoutany problems. According to the social forestry scheme implemented by SwedishInternational Development Agency (SIDA) in Orissa, land would be allotted tosome of the artisans, who would collectively develop the forest, from which they
can use raw materials for promotion of their rural industries. This can ensure rawmaterial supply for the artisans and extension and development of the forest.Sustainable development of forests and an increase in the livelihood and income ofthe artisans go hand in hand.
Profitability of agriculture is also marked by improved productivity,diversification and value addition. There is a critical need to develop storage facilitieslike rural godowns, cold storage, and indigenous storage structures like oniongodowns. This will not only reduce post-harvest losses but also extend the shelf-life. Potato production in the district is 1,512 million tonnes (MT), whereas the
262 Journal of Social and Economic Development July - Dec. 2001
demand is 16,075 MT per annum (NABARD 2000–01). The shortfall is met throughimports from other states for which the people pay a higher price. Even though this
product fetches a good profit, lack of storage facilities keeps farmers from expandingproduction. Onion is a major crop grown in the district (9,963 MT per annum)(NABARD 2000–01). It is sold at a very low price during harvest for want of storagefacilities. The procurement agents take away these products at a low price and thepeople in the district purchase them at a higher price during the off-season from thestorage agents who store them in other district headquarters.
The service and business sector activities like transport, retail trade/ smallbusiness, educational loans, housing, and consumption loans need to be developed.These are mainly demand-based and vital in sustaining development activity in thedistrict. There is a critical need to develop the transport sector to facilitate movementof local products and local people.
Appropriate technology should be developed in accordance with the tastesand preferences of the consumers. Through various poverty-alleviation programmesor through rural industrial development by various boards like KVIC, Coir Board,Handicraft Board, etc. the latest techniques should be imparted to the youth.
Programmes like TRYSEM have made good progress, but their limitation is that it isvery difficult for the unskilled to be trained in a period of 10–20 days. Besides this,the trade in which they are being trained may not have any market prospects. Apartfrom training they should also be provided with credit facilities.
Several NGOs are operating in the district, mainly in the areas of education,health, and awareness. In the past, the NABARD-assisted NGO ‘Gram Vikash’worked towards providing marketing support for oilseeds by the tribals in ThuamulRampur block, who are exploited by middlemen. Credit provided by KalahandiAnchalik Gramya Bank through the NGOs/SHGs is very satisfactory, and theirrecovery under the programme is 100 per cent. The formation of SHGs is imperativebecause the poor who have no access to formal credit can secure such accessthrough the group approach. This ensures 100 per cent recovery, assesses the realcredit need of the poor, ensures proper utilisation of loans, operational flexibility,and allows the maximum freedom to the groups and their members. For banks too,the SHG approach is a cost-effective credit delivery channel offering a high degree
of safety, less risk, and prompt recovery.Above all, it is important to create awareness in the district, because the
government depends on the co-operation of the people. Collectivity among themembers of decentralised institutions is necessary. A collective system can functionwell only if a system of monitoring and sanctions for violating the common law is inplace (Nathen et al. 1997).
Vol. III, No.2 S. K. Mishra: Poverty and Economic Change in Kalahandi 263
Notes
1. In 1993, the Kalahandi district was bifurcated into Kalahandi and Newapada districts.
In this paper, I have used the data on undivided Kalahandi due to the non-availability of
data for divided Kalahandi. Hence, data on undivided Kalahandi is for both Kalahandi
and Newapada districts. However, this will not disturb the analysis because Newapada
is more backward and poverty-ridden than divided Kalahandi.
2. The concentration ratio is calculated using the formula
1- Σ(Pk –P
k-1 ) (Q
k + Q
k-1 )
C. R. = --------------------------------
10000
Qi/Q
3. Inter-Class Concentration Ratio = ------- X 100
Pi/P
Pk & P
k-1 — Cumulative percentage of households of the particular group k and its
previous group k-1 respectively.
Qk & Q
k-1 — Cumulative percentage of area owned of the particular group k and its
previous group k-1 respectively.
Qi — Total land area of a particular i th group and Q is the total land area of all the
groups taken together.
Pi — Total number of persons holding the land of the i th group and P is the total
number of households, taking all the groups together.
4. Kalahandi district is badly affected by drought, and partial crop failure is a general
phenomenon. The drought of 1884, 1885, and 1886 led to a severe food scarcity. The
district faced the same situation in 1919, and again in 1922–1923, 1925–1926, 1929–
30, 1954–55, 1965–66, 1986–87, 1987–88 and 1988-89 (Dash et al. 2000).
References
Bardhan, P. (1989). A Note on Interlinked Rural Economic Arrangements. In Pranab Bardhan
(ed.) The Economic Theory of Agrarian Institutions. Clarendon Press, Oxford.
Basant, R., and B. L. Kumar (1998). Rural Non-Agricultural Employment in India and
Gujarat: A Review of Secondary Data. In R. Basant and R. Parthasarathy (ed).
Non- Agricultural Employment in Rural India. Delhi: Rawat Publishers.
Basu, K. (1990). Agrarian Structure and Economic Underdevelopment. Switzerland: Harwood
Academic Publishers.
Bhaduri, A. (1983). The Economic Structure of Backward Agriculture. London: Academic
Press Inc. Ltd.
Census Handbook of Kalahandi District (1991).
Chelliah, R. J. (1999). Income-Poverty and Beyond, Human Development in India. In Raja J.
Chellaiah and R. Sudarshan (ed.), New Delhi: N. D. Publishers, Social Science
Press.
264 Journal of Social and Economic Development July - Dec. 2001
Coondoo, D., A. Majumder, and K. Bhattacharya (2000). Employment, Level of Living and
Utilization of PDS. In N. Krishnaji and T. N. Krishnan (ed.), Public Support forFood Security: Public Distribution in India. New Delhi: Oxford University Press.
Dash, J., and N. K. Behura (2000). Crisis Management: Lessons From the Past — A Case
Study of Drought Situation. Man In India, 1&2(80).
District Rural Development Agency. Report of Rural Families BPL in Kalahandi District(1992&1997), Kalahandi.
Durgaprasad, P. (1995). Paradigm for Action and Development Alternatives: The Case of
Rural Industrialisation in India. Man and Development, 17(3).
Government of India. Annual Report, Ministry of Rural Areas and Employment (1998–99).
Government of Orissa, Directorate of Economics and Statistics. District Statistical Abstractof Kalahandi District, (1993 & 1995).
Government of Orissa, Directorate of Economics and Statistics. Statistical Outline of Orissa(1997), Bhubaneswar.
Haggblade, S., P. Hazell, and J. Brown (1989). Farm-Non Farm Linkage in Rural Sub-
Saharan Africa. World Development, 17(8).
Ho, P. S. Samuel (1979). Decentralised Industrialisation and Rural Development Problems:
Evidence from Taiwan. Economic Development and Cultural Change, 28(1).
Jayal, N. G. (1999). Democracy and the State: Welfare, Secularism and Development inContemporary India. New Delhi: Oxford University Press.
Kurien, C. T., and J. James (1979). Economic Change in Tamilnadu: 1960–1970. Bombay:
Allied Publishers.
Mahapatra, R., and R. Panda (2001). The Myth of Kalahandi: A Resources-Rich Region
Reels under a Government-Induced Drought. Down To Earth, March 31.
Mohanty, M. (1992). Kalahandi Awaits. Mainstream, April 18.
Mooij, J. (1999). Food Policy and Indian State: The Public Distribution System in SouthIndia. New Delhi: Oxford University Press.
NABARD. Potential-Linked Credit Plan of Kalahandi District (2000–01). Bhubaneswar.
Nathen, D., and G. Kelkar (1997). Collective Village in Chinese Market-I. Economic andPolitical Weekly, 32(97).
Nayak, P. K., and A. Mahajan (1991). Human Encounter with Drought. New Delhi: Reliance
Publishing House.
Samal, K. C. (1996). Features and Determinants of Rural Non-Farm Sector in India andOrissa: A Survey. Occasional Paper, Bhubaneshwar: Nabakrushna Choudhury
Centre for Development Studies.
Samal, K. C. (1998). Poverty Alleviation after Liberalisation: A Tribal Block in Orissa.
Economic and Political Weekly, 23(28).
Vol. III, No.2 S. K. Mishra: Poverty and Economic Change in Kalahandi 265
Related Documents


