1 Final Report Cache la Poudre River Post-Fire Sediment & Aquatic Insect Monitoring Daniel W. Baker, PhD PE Research Scientist Dept. of Civil and Environmental Engineering Colorado State University Fort Collins, CO 80524

Welcome message from author
This document is posted to help you gain knowledge. Please leave a comment to let me know what you think about it! Share it to your friends and learn new things together.
Transcript

1
Final Report
Cache la Poudre River Post-Fire Sediment & Aquatic Insect Monitoring
Daniel W. Baker, PhD PE
Research Scientist
Dept. of Civil and Environmental Engineering
Colorado State University
Fort Collins, CO 80524
Final Report: Cache la Poudre River Post-Fire Sediment & Aquatic Insect Monitoring
2
Table of Contents
Abstract ........................................................................................................................................... 3 Background: .................................................................................................................................... 3
History of the Poudre River ........................................................................................................ 3 Fires and watersheds ................................................................................................................... 3 Effects of Fine Sediment ............................................................................................................. 4 Precipitation and Climate ............................................................................................................ 6 The Role of Moderate to High Flows ......................................................................................... 6 Project Objectives ....................................................................................................................... 8
Methods........................................................................................................................................... 9 Monitoring Sites ......................................................................................................................... 9 Temporal Sampling Design ...................................................................................................... 10 Field Protocol ............................................................................................................................ 10
Results and Discussion ................................................................................................................. 11 Sediment Conditions ................................................................................................................. 11 Channel Geometry .................................................................................................................... 13 Macroinvertebrates ................................................................................................................... 15 Discussion of Appropriate Field Methods for the Poudre River .............................................. 17
The Poudre River as a “Wadeable Stream” .......................................................................... 17 Signal-to-Noise Ratio............................................................................................................ 17
Supplemental Benefits .............................................................................................................. 20 Conclusions ................................................................................................................................... 20 Acknowledgements ....................................................................................................................... 21 Appendix A: Macroinvertebrate Data ........................................................................................... 22 Appendix B: Field Protocol .......................................................................................................... 27
Introduction ............................................................................................................................... 27 Layout cross section and reach ................................................................................................. 27 Sketches and photos .................................................................................................................. 27
Field Sketch .......................................................................................................................... 27 Faces Mapping ...................................................................................................................... 28 Photo Points .......................................................................................................................... 28
Survey Channel Geometry ........................................................................................................ 29 Naming conventions ............................................................................................................. 29 Cross Section ........................................................................................................................ 30 Longitudinal Profile .............................................................................................................. 31
Bed Sediment Analysis ............................................................................................................. 31 Fines grid count..................................................................................................................... 31 Embeddedness....................................................................................................................... 32 Pebble Count ......................................................................................................................... 33
Macroinvertebrate Community – Hess Samples ...................................................................... 34 Supplies checklist ..................................................................................................................... 36
Bibliography ................................................................................................................................. 37
Final Report: Cache la Poudre River Post-Fire Sediment & Aquatic Insect Monitoring
3
ABSTRACT
The High Park and Hewlett Gulch fires of 2012 burned over 66,000 acres (around 10%) of the
Cache la Poudre River watershed. To gain a better understanding of the impacts of these fires on
the main stem of the Poudre River, the City of Fort Collins, Colorado Parks & Wildlife (CPW),
and Colorado State University (CSU) partnered from 2012-2013 to monitor the effects to the
physical and biotic integrity of the river in an effort to (1) bolster scientific understanding, (2)
more clearly communicate with the public, and (3) provide data for more informed management
decisions. As such, this study was conceived to examine the condition of bed sediments, the
channel form, and aquatic insect communities through a coordinated quarterly sampling program
at seven sites. In the end, the combined effects of the 2012 fires and September 2013 flood had
numerous local impacts, but their overall effect was dampened by substantial peak flows flushing
fire-released sediments through the system and the inherent resilience of the Poudre River
ecosystem.
BACKGROUND:
History of the Poudre River
The rivers along the Front Range of Colorado have long been hard-working rivers. They provide
fresh drinking water to residents, irrigation for farmers, and recreational opportunities, all while
supporting the best aquatic and riparian ecosystem possible. The Poudre River has two distinct
zones of human influence, the canyon portion and Front Range portion. The canyon portion has
only moderate amounts of flow alteration in the forms of trans-basin augmentation from the
western slope and reservoir storage. The main floodplain influence to the Poudre in the canyon
portion is the highway CO-14. Built in the 1920’s, the roadway decreases an already limited
floodplain in the narrow sections of canyon, but has little influence in sections with a wider
floodplain. The Front Range portion (starting at the canyon mouth) is characterized by a
historically meandering/braided planform and cottonwood dominated riparian forests.
Development in the last 150 years has decreased the river sinuosity, largely pushed the river into
single thread, disconnected or eliminated much of the riparian forest, and altered the flow regime
due to flow diversion. Given these changes, the current ecosystem is likely to be less resilient to
impacts, such as floods and fires, than its historic form. Additionally, added pressure comes from
societal demands of clean water for drinking and minimal flood impacts.
Fires and watersheds
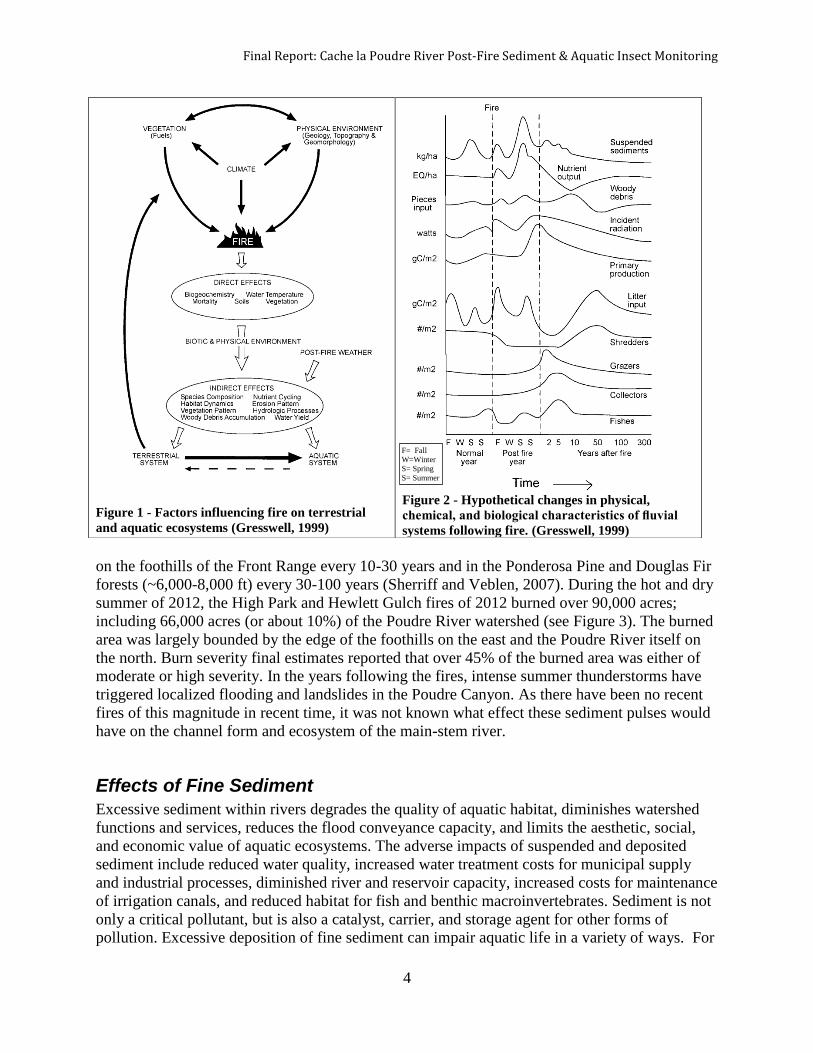
The direct effect of fires is to eliminate or reduce the vegetation in the burned area. Furthermore,
in severely burned areas, soil minerals heated to high temperatures become hydrophobic. These
combined effects subsequently alter erosion patterns, evapotranspiration, and peak runoff values
from a watershed. The increased sediment and water runoff is then passed to stream and river
systems. While the effects of fires do vary according to the unique properties of each individual
ecosystem, a number of conceptual models have been developed to highlight the potential
changes to a riverine ecosystem. Two examples can be found in Figure 1 and Figure 2.
Below the high-elevation alpine zone, the landscape of the Poudre Watershed takes on a much
more xeric character, with native vegetation ranging from sagebrush grasslands and shrubs to
ponderosa pine and Rocky Mountain Douglas fir forest. Prior to settlement, fires have occurred
Final Report: Cache la Poudre River Post-Fire Sediment & Aquatic Insect Monitoring
4
on the foothills of the Front Range every 10-30 years and in the Ponderosa Pine and Douglas Fir
forests (~6,000-8,000 ft) every 30-100 years (Sherriff and Veblen, 2007). During the hot and dry
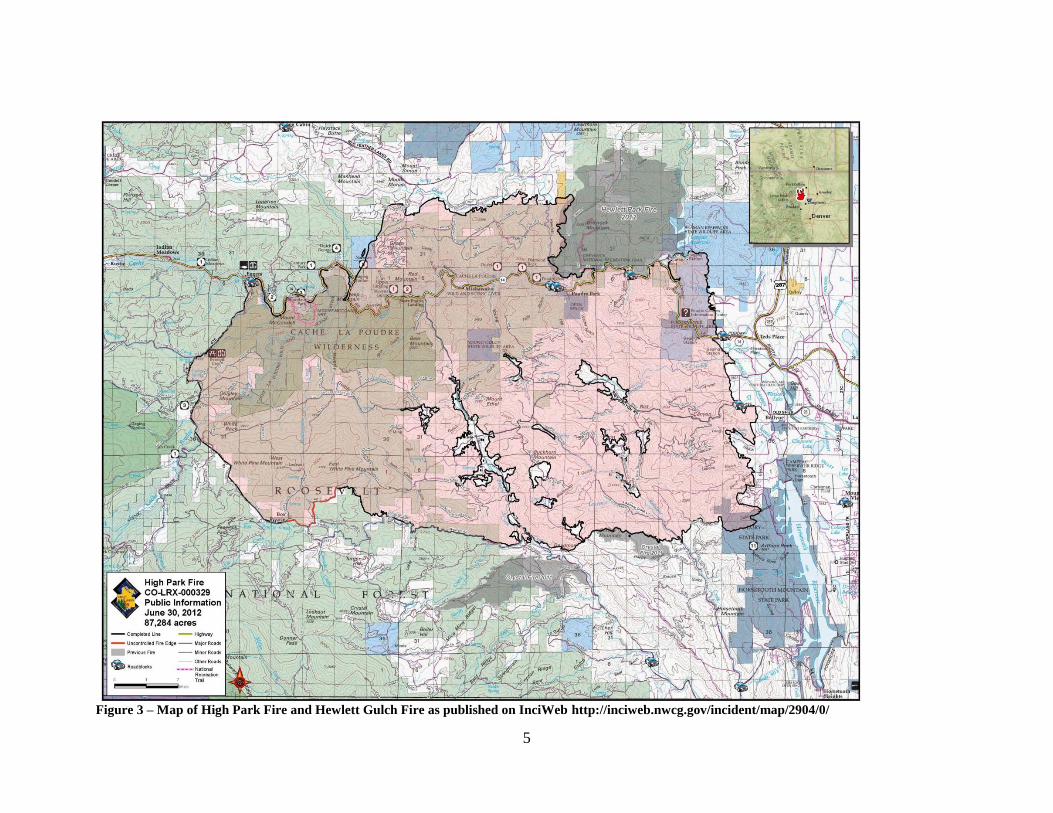
summer of 2012, the High Park and Hewlett Gulch fires of 2012 burned over 90,000 acres;
including 66,000 acres (or about 10%) of the Poudre River watershed (see Figure 3). The burned
area was largely bounded by the edge of the foothills on the east and the Poudre River itself on
the north. Burn severity final estimates reported that over 45% of the burned area was either of
moderate or high severity. In the years following the fires, intense summer thunderstorms have
triggered localized flooding and landslides in the Poudre Canyon. As there have been no recent
fires of this magnitude in recent time, it was not known what effect these sediment pulses would
have on the channel form and ecosystem of the main-stem river.
Effects of Fine Sediment
Excessive sediment within rivers degrades the quality of aquatic habitat, diminishes watershed
functions and services, reduces the flood conveyance capacity, and limits the aesthetic, social,
and economic value of aquatic ecosystems. The adverse impacts of suspended and deposited
sediment include reduced water quality, increased water treatment costs for municipal supply
and industrial processes, diminished river and reservoir capacity, increased costs for maintenance
of irrigation canals, and reduced habitat for fish and benthic macroinvertebrates. Sediment is not
only a critical pollutant, but is also a catalyst, carrier, and storage agent for other forms of
pollution. Excessive deposition of fine sediment can impair aquatic life in a variety of ways. For
Figure 1 - Factors influencing fire on terrestrial
and aquatic ecosystems (Gresswell, 1999)
Figure 2 - Hypothetical changes in physical,
chemical, and biological characteristics of fluvial
systems following fire. (Gresswell, 1999)
F= Fall
W=Winter
S= Spring
S= Summer
5
Figure 3 – Map of High Park Fire and Hewlett Gulch Fire as published on InciWeb http://inciweb.nwcg.gov/incident/map/2904/0/
6
example aquatic insects such as mayflies and stoneflies depend on clean interstitial spaces
between gravels and cobbles in the river bed to carry out their life cycles (Waters, 1995), and
sediment infilling of critical habitat like pools and gravel spawning beds decreases the survival
rate of fish and fish embryos (Chapman, 1988; Suttle et al., 2004).These effects can also
propagate out of the channel to the riparian ecosystem as birds and other animals depend on
aquatic insects as a food source. Combined with the reduction in flushing flows vegetation
encroachment on the new nutrient rich sediments may further exacerbate flooding potential.
Precipitation and Climate
The climate of the Poudre Watershed varies with elevation. The upper portion of the basin,
bounded on the West by the Continental Divide, receives averages over 150 inches of snow per
winter and around 40 inches of precipitation annually. Whereas the Front Range area around Fort
Collins receives around 45 inches of snow per winter and about 15 inches of precipitation
annually.
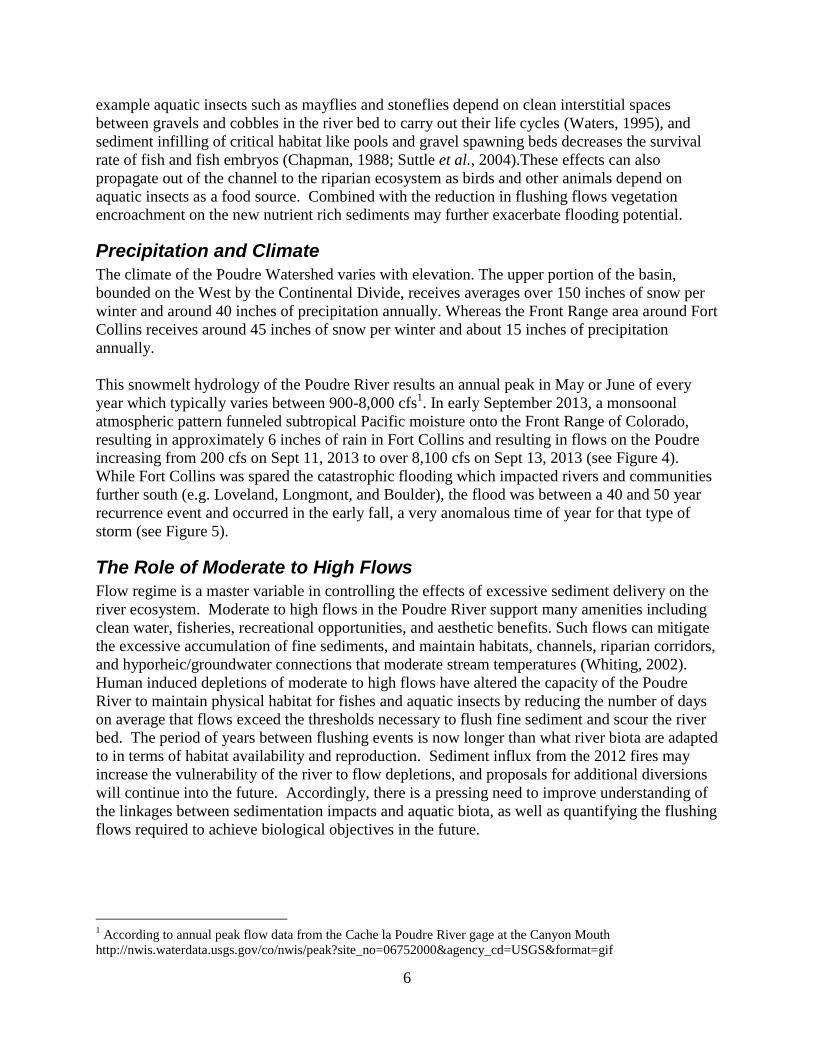
This snowmelt hydrology of the Poudre River results an annual peak in May or June of every
year which typically varies between 900-8,000 cfs1. In early September 2013, a monsoonal
atmospheric pattern funneled subtropical Pacific moisture onto the Front Range of Colorado,
resulting in approximately 6 inches of rain in Fort Collins and resulting in flows on the Poudre
increasing from 200 cfs on Sept 11, 2013 to over 8,100 cfs on Sept 13, 2013 (see Figure 4).
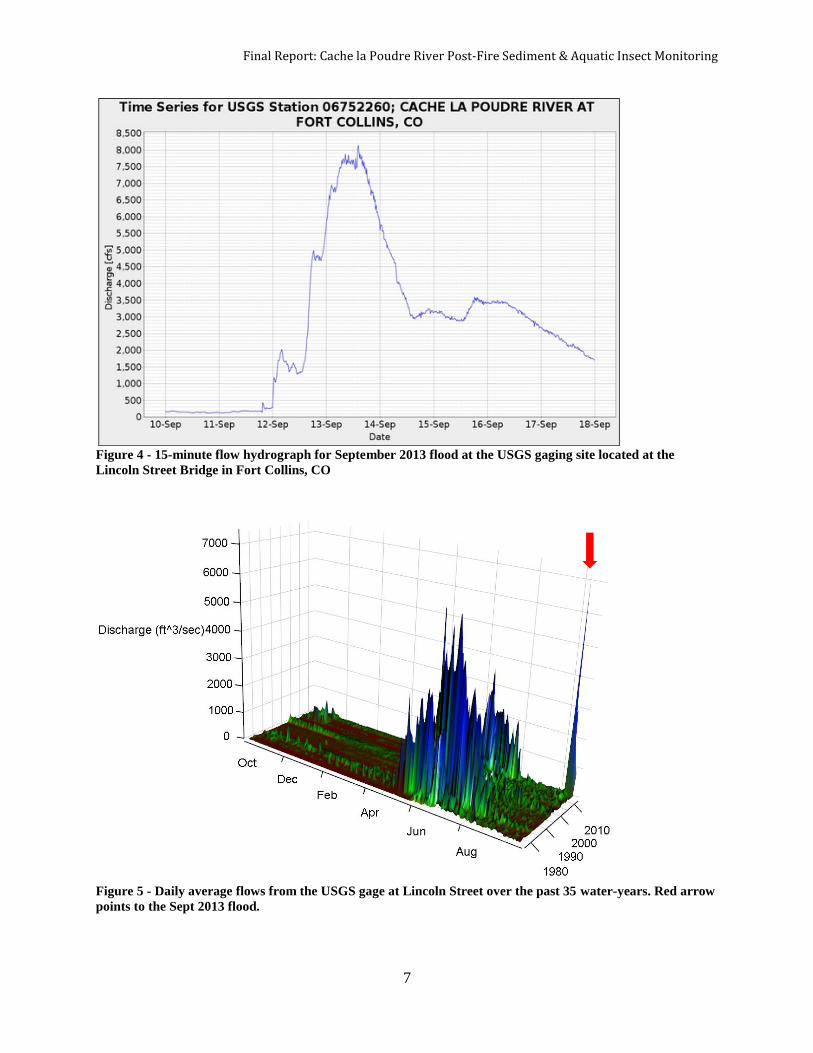
While Fort Collins was spared the catastrophic flooding which impacted rivers and communities
further south (e.g. Loveland, Longmont, and Boulder), the flood was between a 40 and 50 year
recurrence event and occurred in the early fall, a very anomalous time of year for that type of
storm (see Figure 5).
The Role of Moderate to High Flows
Flow regime is a master variable in controlling the effects of excessive sediment delivery on the
river ecosystem. Moderate to high flows in the Poudre River support many amenities including
clean water, fisheries, recreational opportunities, and aesthetic benefits. Such flows can mitigate
the excessive accumulation of fine sediments, and maintain habitats, channels, riparian corridors,
and hyporheic/groundwater connections that moderate stream temperatures (Whiting, 2002).
Human induced depletions of moderate to high flows have altered the capacity of the Poudre
River to maintain physical habitat for fishes and aquatic insects by reducing the number of days
on average that flows exceed the thresholds necessary to flush fine sediment and scour the river
bed. The period of years between flushing events is now longer than what river biota are adapted
to in terms of habitat availability and reproduction. Sediment influx from the 2012 fires may
increase the vulnerability of the river to flow depletions, and proposals for additional diversions
will continue into the future. Accordingly, there is a pressing need to improve understanding of
the linkages between sedimentation impacts and aquatic biota, as well as quantifying the flushing
flows required to achieve biological objectives in the future.
1 According to annual peak flow data from the Cache la Poudre River gage at the Canyon Mouth
http://nwis.waterdata.usgs.gov/co/nwis/peak?site_no=06752000&agency_cd=USGS&format=gif
Final Report: Cache la Poudre River Post-Fire Sediment & Aquatic Insect Monitoring
7
Figure 4 - 15-minute flow hydrograph for September 2013 flood at the USGS gaging site located at the
Lincoln Street Bridge in Fort Collins, CO
Figure 5 - Daily average flows from the USGS gage at Lincoln Street over the past 35 water-years. Red arrow
points to the Sept 2013 flood.

Final Report: Cache la Poudre River Post-Fire Sediment & Aquatic Insect Monitoring
8
Project Objectives
Fires and floods have unique impacts to river ecosystems, yet their effects interact. The canyon
portion of the Poudre River is a steep, high-energy, system relatively unimpacted by flow
extraction. As such, it was hypothesized that the main stem of the Poudre in this reach would not
be significantly impacted by the 2012 Fires and 2013 floods. However, the lowerenergy and
more highly-altered reach through Fort Collins could be more severely impacted. As such, this
study was conceived to examine the condition of bed sediments, the channel form, and aquatic
insect communities through a coordinated quarterly sampling program at seven sites.
With this background in mind, the project objectives were to:
1. Quantify surface and bulk accumulation of fine sediment along a gradient of sediment
input, flow alteration, and geomorphic setting.
2. Link response of aquatic insects to fine sediment accumulation in the substrate through
coordinated sampling.
3. Quantify the fine sediment removal and habitat improvement achieved by flushing flows
of different magnitudes and durations of moderate to high flow.
4. Complement other post-fire studies including those investigating local salmonid
populations, water quality, and high resolution remote sensing data of the burned areas.
5. Inform the public of the current and evolving conditions of the Cache La Poudre River
ecosystem
Final Report: Cache la Poudre River Post-Fire Sediment & Aquatic Insect Monitoring
9
METHODS
Monitoring Sites
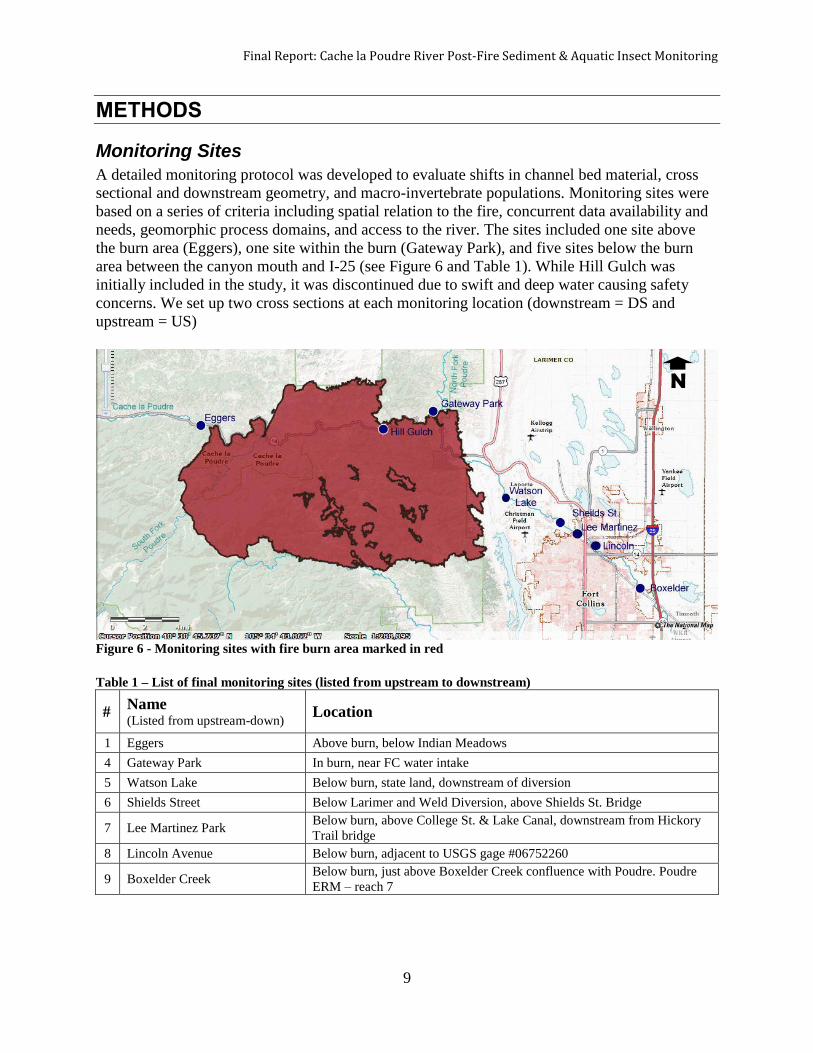
A detailed monitoring protocol was developed to evaluate shifts in channel bed material, cross
sectional and downstream geometry, and macro-invertebrate populations. Monitoring sites were
based on a series of criteria including spatial relation to the fire, concurrent data availability and
needs, geomorphic process domains, and access to the river. The sites included one site above
the burn area (Eggers), one site within the burn (Gateway Park), and five sites below the burn
area between the canyon mouth and I-25 (see Figure 6 and Table 1). While Hill Gulch was
initially included in the study, it was discontinued due to swift and deep water causing safety
concerns. We set up two cross sections at each monitoring location (downstream = DS and
upstream = US)
Figure 6 - Monitoring sites with fire burn area marked in red
Table 1 – List of final monitoring sites (listed from upstream to downstream)
# Name (Listed from upstream-down)
Location
1 Eggers Above burn, below Indian Meadows
4 Gateway Park In burn, near FC water intake
5 Watson Lake Below burn, state land, downstream of diversion
6 Shields Street Below Larimer and Weld Diversion, above Shields St. Bridge
7 Lee Martinez Park Below burn, above College St. & Lake Canal, downstream from Hickory
Trail bridge
8 Lincoln Avenue Below burn, adjacent to USGS gage #06752260
9 Boxelder Creek Below burn, just above Boxelder Creek confluence with Poudre. Poudre
ERM – reach 7
N
Final Report: Cache la Poudre River Post-Fire Sediment & Aquatic Insect Monitoring
10
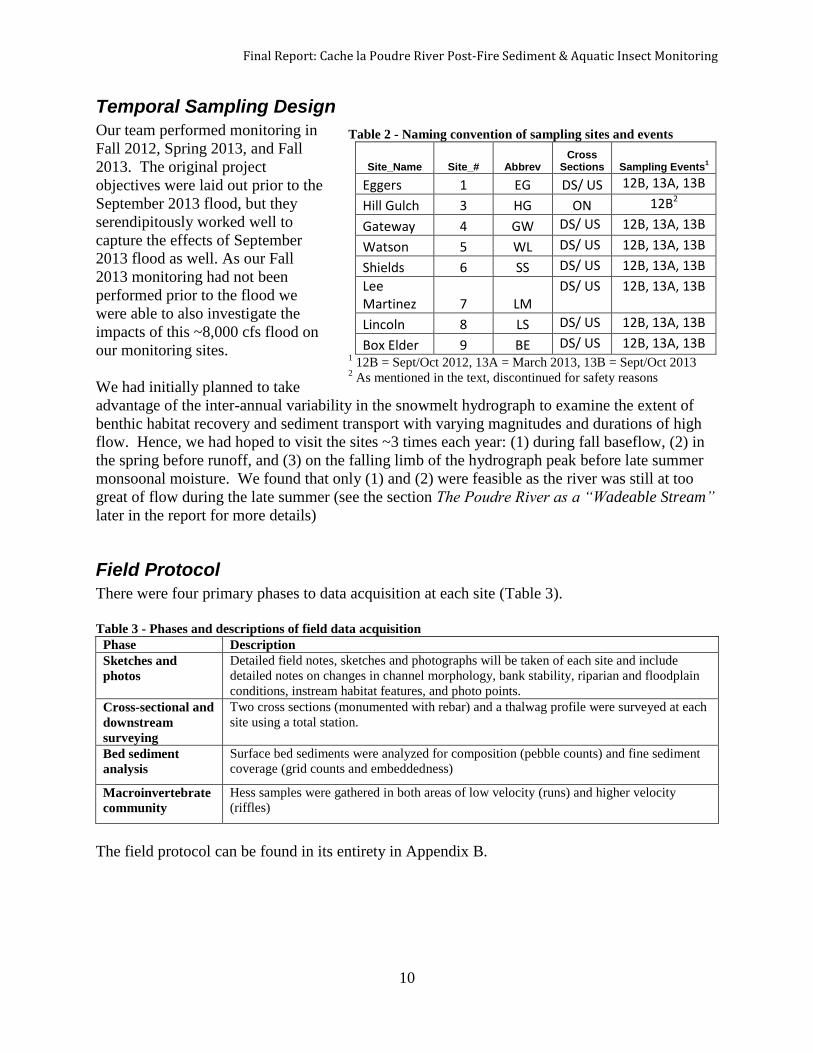
Temporal Sampling Design
Our team performed monitoring in
Fall 2012, Spring 2013, and Fall
2013. The original project
objectives were laid out prior to the
September 2013 flood, but they
serendipitously worked well to
capture the effects of September
2013 flood as well. As our Fall
2013 monitoring had not been
performed prior to the flood we
were able to also investigate the
impacts of this ~8,000 cfs flood on
our monitoring sites.
We had initially planned to take
advantage of the inter-annual variability in the snowmelt hydrograph to examine the extent of
benthic habitat recovery and sediment transport with varying magnitudes and durations of high
flow. Hence, we had hoped to visit the sites ~3 times each year: (1) during fall baseflow, (2) in
the spring before runoff, and (3) on the falling limb of the hydrograph peak before late summer
monsoonal moisture. We found that only (1) and (2) were feasible as the river was still at too
great of flow during the late summer (see the section The Poudre River as a “Wadeable Stream”
later in the report for more details)
Field Protocol
There were four primary phases to data acquisition at each site (Table 3).
Table 3 - Phases and descriptions of field data acquisition
Phase Description
Sketches and
photos
Detailed field notes, sketches and photographs will be taken of each site and include
detailed notes on changes in channel morphology, bank stability, riparian and floodplain
conditions, instream habitat features, and photo points.
Cross-sectional and
downstream
surveying
Two cross sections (monumented with rebar) and a thalwag profile were surveyed at each
site using a total station.
Bed sediment
analysis
Surface bed sediments were analyzed for composition (pebble counts) and fine sediment
coverage (grid counts and embeddedness)
Macroinvertebrate
community
Hess samples were gathered in both areas of low velocity (runs) and higher velocity
(riffles)
The field protocol can be found in its entirety in Appendix B.
Table 2 - Naming convention of sampling sites and events
Site_Name Site_# Abbrev Cross
Sections Sampling Events1
Eggers 1 EG DS/ US 12B, 13A, 13B
Hill Gulch 3 HG ON 12B2
Gateway 4 GW DS/ US 12B, 13A, 13B
Watson 5 WL DS/ US 12B, 13A, 13B
Shields 6 SS DS/ US 12B, 13A, 13B
Lee Martinez 7 LM
DS/ US 12B, 13A, 13B
Lincoln 8 LS DS/ US 12B, 13A, 13B
Box Elder 9 BE DS/ US 12B, 13A, 13B 1 12B = Sept/Oct 2012, 13A = March 2013, 13B = Sept/Oct 2013
2 As mentioned in the text, discontinued for safety reasons
Final Report: Cache la Poudre River Post-Fire Sediment & Aquatic Insect Monitoring
11
RESULTS AND DISCUSSION
Sediment Conditions
The Poudre River is an alluvial
river; as such, the material that
makes up the bed of the river is
the same material that is
transported from the upstream
watershed. In the canyon, the bed
is comprised of gravel, cobbles
and many large-angular boulders
which have fallen from the
adjacent canyon walls. As the
Poudre flows onto the Front
Range, the median sediment size
gradually decreases until near I-
25 there are only a handful of
cobbles and mainly gravel and
finer material.
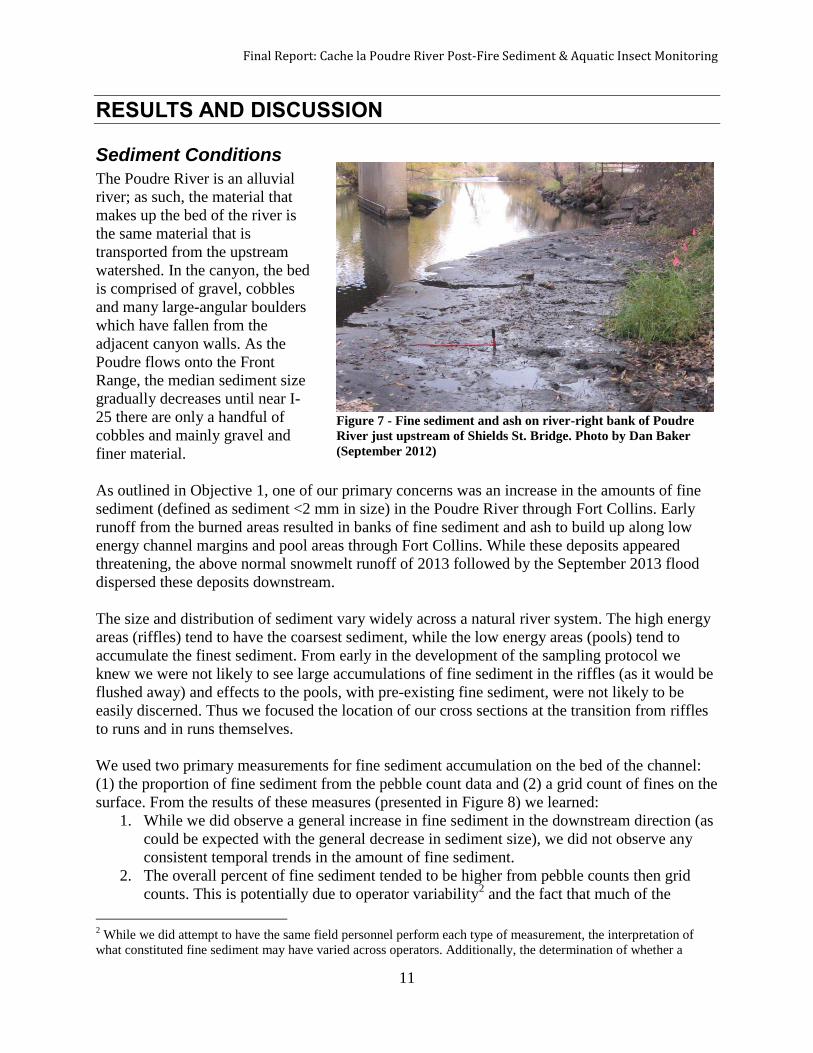
As outlined in Objective 1, one of our primary concerns was an increase in the amounts of fine
sediment (defined as sediment <2 mm in size) in the Poudre River through Fort Collins. Early
runoff from the burned areas resulted in banks of fine sediment and ash to build up along low
energy channel margins and pool areas through Fort Collins. While these deposits appeared
threatening, the above normal snowmelt runoff of 2013 followed by the September 2013 flood
dispersed these deposits downstream.
The size and distribution of sediment vary widely across a natural river system. The high energy
areas (riffles) tend to have the coarsest sediment, while the low energy areas (pools) tend to
accumulate the finest sediment. From early in the development of the sampling protocol we
knew we were not likely to see large accumulations of fine sediment in the riffles (as it would be
flushed away) and effects to the pools, with pre-existing fine sediment, were not likely to be
easily discerned. Thus we focused the location of our cross sections at the transition from riffles
to runs and in runs themselves.
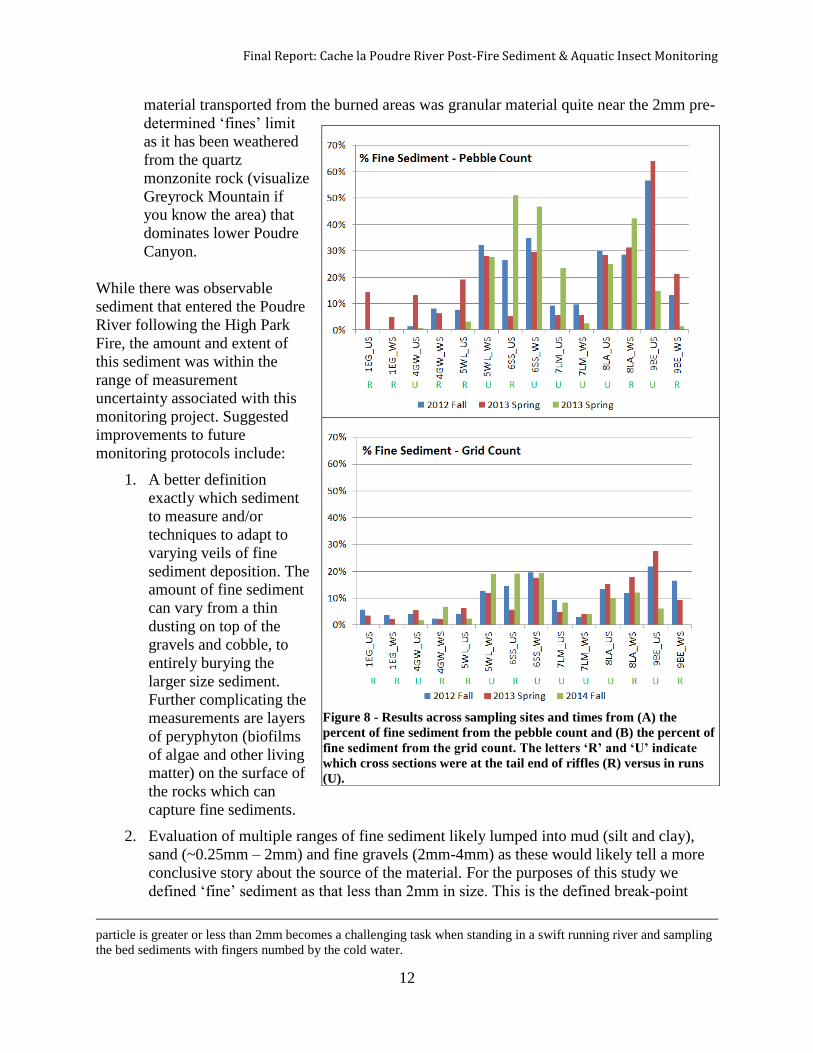
We used two primary measurements for fine sediment accumulation on the bed of the channel:
(1) the proportion of fine sediment from the pebble count data and (2) a grid count of fines on the
surface. From the results of these measures (presented in Figure 8) we learned:
1. While we did observe a general increase in fine sediment in the downstream direction (as
could be expected with the general decrease in sediment size), we did not observe any
consistent temporal trends in the amount of fine sediment.
2. The overall percent of fine sediment tended to be higher from pebble counts then grid
counts. This is potentially due to operator variability2 and the fact that much of the
2 While we did attempt to have the same field personnel perform each type of measurement, the interpretation of
what constituted fine sediment may have varied across operators. Additionally, the determination of whether a
Figure 7 - Fine sediment and ash on river-right bank of Poudre
River just upstream of Shields St. Bridge. Photo by Dan Baker
(September 2012)
Final Report: Cache la Poudre River Post-Fire Sediment & Aquatic Insect Monitoring
12
material transported from the burned areas was granular material quite near the 2mm pre-
determined ‘fines’ limit
as it has been weathered
from the quartz
monzonite rock (visualize
Greyrock Mountain if
you know the area) that
dominates lower Poudre
Canyon.
While there was observable
sediment that entered the Poudre
River following the High Park
Fire, the amount and extent of
this sediment was within the
range of measurement
uncertainty associated with this
monitoring project. Suggested
improvements to future
monitoring protocols include:
1. A better definition
exactly which sediment
to measure and/or
techniques to adapt to
varying veils of fine
sediment deposition. The
amount of fine sediment
can vary from a thin
dusting on top of the
gravels and cobble, to
entirely burying the
larger size sediment.
Further complicating the
measurements are layers
of peryphyton (biofilms
of algae and other living
matter) on the surface of
the rocks which can
capture fine sediments.
2. Evaluation of multiple ranges of fine sediment likely lumped into mud (silt and clay),
sand (~0.25mm – 2mm) and fine gravels (2mm-4mm) as these would likely tell a more
conclusive story about the source of the material. For the purposes of this study we
defined ‘fine’ sediment as that less than 2mm in size. This is the defined break-point
particle is greater or less than 2mm becomes a challenging task when standing in a swift running river and sampling
the bed sediments with fingers numbed by the cold water.
Figure 8 - Results across sampling sites and times from (A) the
percent of fine sediment from the pebble count and (B) the percent of
fine sediment from the grid count. The letters ‘R’ and ‘U’ indicate
which cross sections were at the tail end of riffles (R) versus in runs
(U).
Final Report: Cache la Poudre River Post-Fire Sediment & Aquatic Insect Monitoring
13
between gravel and sand and is a logical division both because excessive sediment
smaller than 2mm has commonly been shown to negatively affect insects (Wood and
Armitage, 1997) and measuring the size of sediment smaller than 2mm must be done
using bulk samplers as a gravelometer can only measure down to 2mm. The challenge
this poised in monitoring the Poudre River is that after the flushing of the initial ash
deposits, much of the new sediment we observed in the river following the 2012 fires
and September 2013 flood tended to be around this 2mm size limit.
3. Further improvements to measuring ‘embeddedness’. We attempted to measure the
degree of embeddedness, but in the end found the techniques to be either too subjective
or too difficult to replicate to report our finding. Clearly embeddedness is one of the key
impacts to the benthic habitat, but the multiple techniques used to measure it (Sennatt et
al., 2006) are all quite subjective or difficult to replicate between visits.
4. A sieve-based analysis of the channel surface would (in theory) do a good job of
quantifying the extent of the various sediment types, but taking bulk samples in flowing
water is inherently challenging (e.g. it is difficult to now wash the fines downstream
when sediments are disturbed).
Channel Geometry
The channel geometry measurements (i.e. cross sectional and longitudinal surveys) indicated no
major change to the geometry of the river bed at any of our monitoring locations. This was due
to two primary factors:
1. First (and foremost) there was little change to the cross sectional and longitudinal river
bed following the 2012 Fires and September 2013 flood and
2. Any apparent change that was measured could be attributed to the signal-to-noise ratio of
surveying in a cobble bed river (see discussion on this topic in next section).
While there were not major shifts in channel geometry the following items are worth noting:
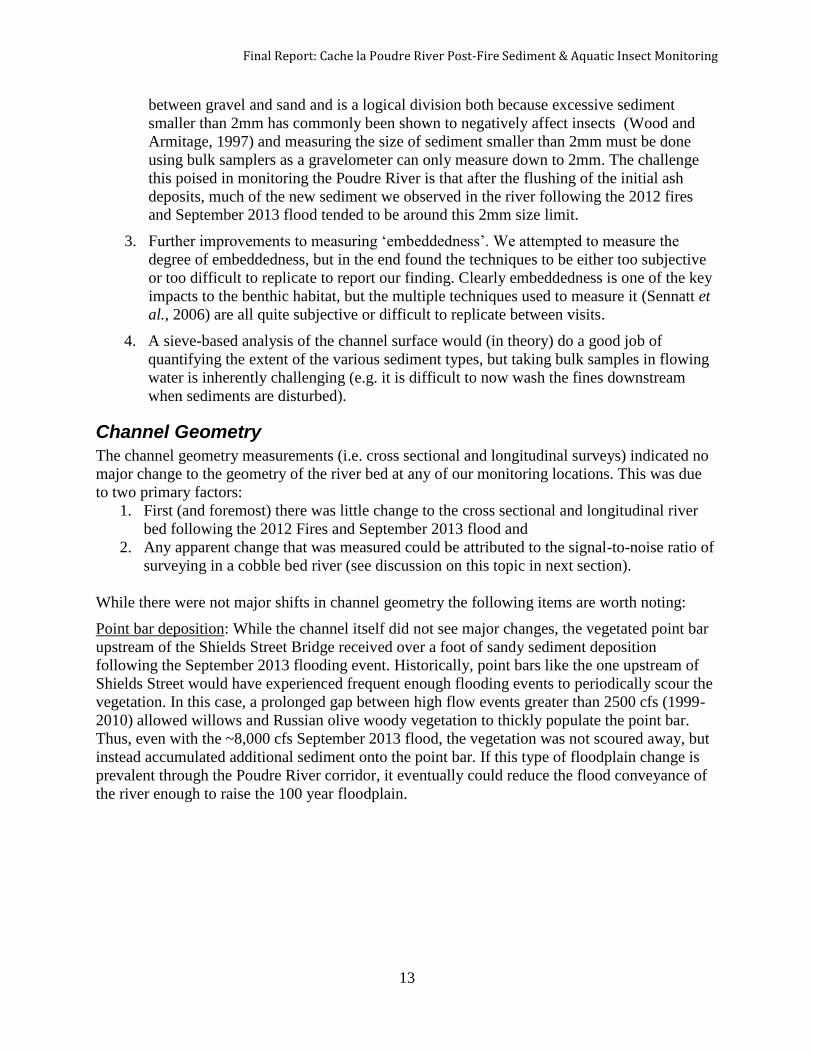
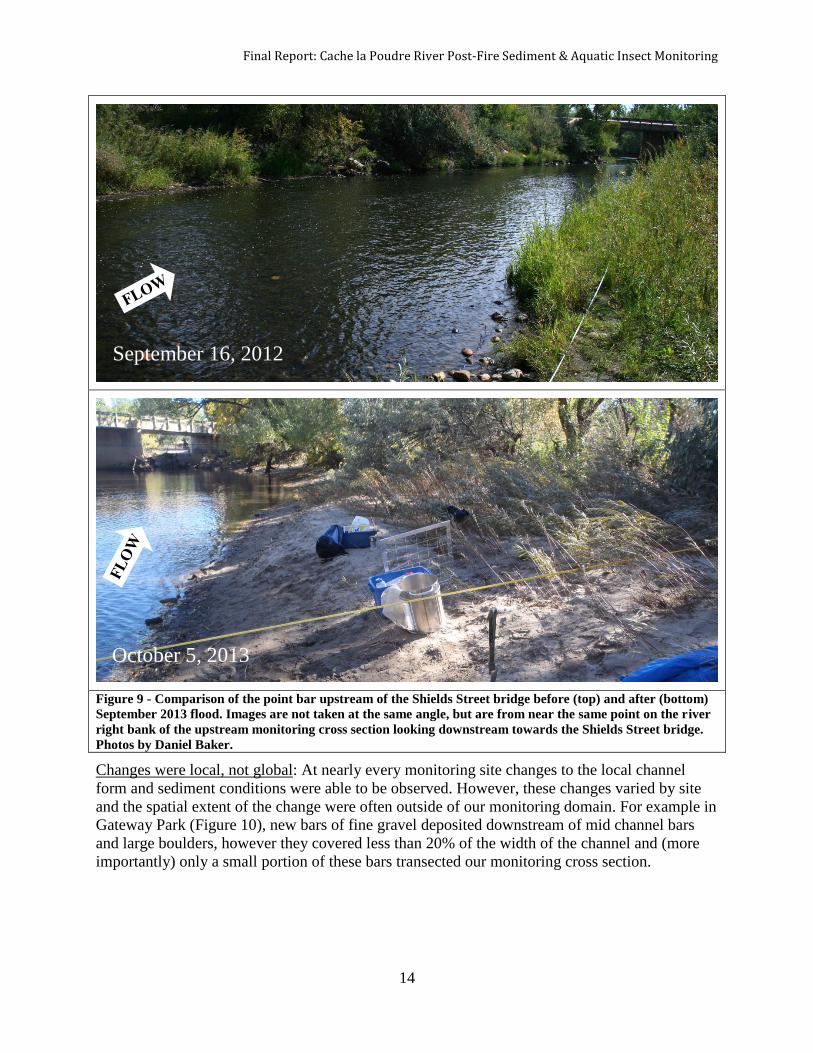
Point bar deposition: While the channel itself did not see major changes, the vegetated point bar
upstream of the Shields Street Bridge received over a foot of sandy sediment deposition
following the September 2013 flooding event. Historically, point bars like the one upstream of
Shields Street would have experienced frequent enough flooding events to periodically scour the
vegetation. In this case, a prolonged gap between high flow events greater than 2500 cfs (1999-
2010) allowed willows and Russian olive woody vegetation to thickly populate the point bar.
Thus, even with the ~8,000 cfs September 2013 flood, the vegetation was not scoured away, but
instead accumulated additional sediment onto the point bar. If this type of floodplain change is
prevalent through the Poudre River corridor, it eventually could reduce the flood conveyance of
the river enough to raise the 100 year floodplain.
Final Report: Cache la Poudre River Post-Fire Sediment & Aquatic Insect Monitoring
14
Figure 9 - Comparison of the point bar upstream of the Shields Street bridge before (top) and after (bottom)
September 2013 flood. Images are not taken at the same angle, but are from near the same point on the river
right bank of the upstream monitoring cross section looking downstream towards the Shields Street bridge.
Photos by Daniel Baker.
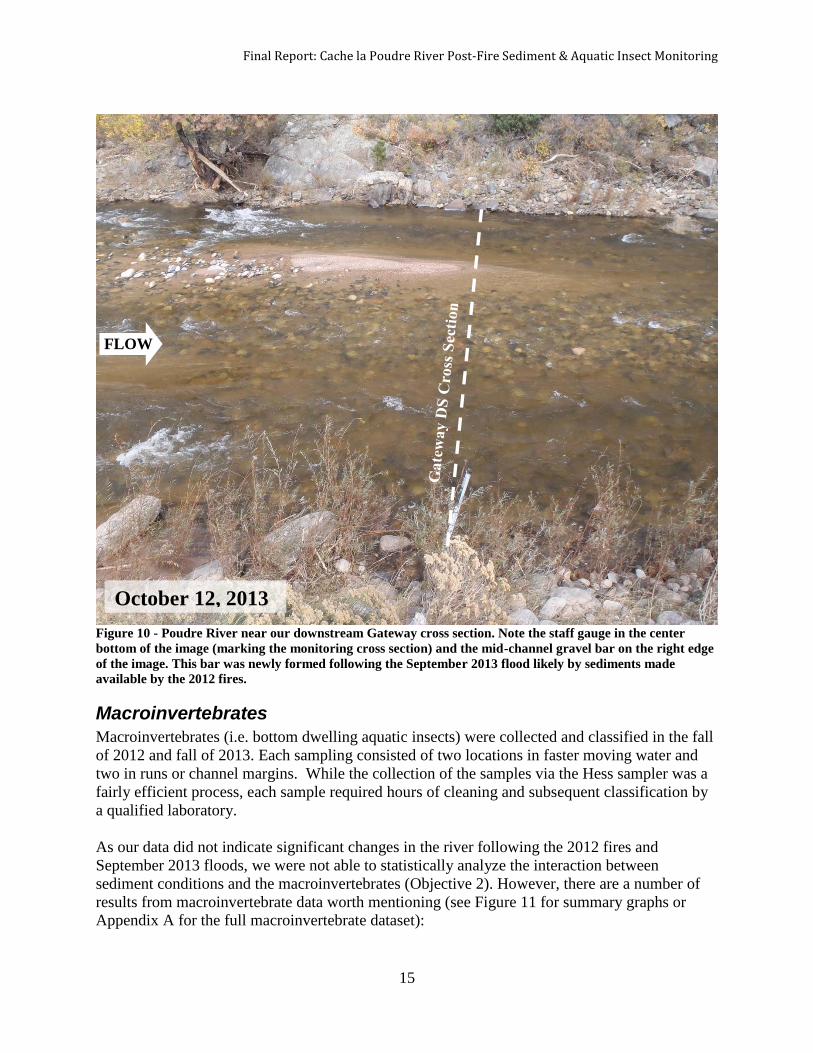
Changes were local, not global: At nearly every monitoring site changes to the local channel
form and sediment conditions were able to be observed. However, these changes varied by site
and the spatial extent of the change were often outside of our monitoring domain. For example in
Gateway Park (Figure 10), new bars of fine gravel deposited downstream of mid channel bars
and large boulders, however they covered less than 20% of the width of the channel and (more
importantly) only a small portion of these bars transected our monitoring cross section.
September 16, 2012
October 5, 2013
Final Report: Cache la Poudre River Post-Fire Sediment & Aquatic Insect Monitoring
15
Figure 10 - Poudre River near our downstream Gateway cross section. Note the staff gauge in the center
bottom of the image (marking the monitoring cross section) and the mid-channel gravel bar on the right edge
of the image. This bar was newly formed following the September 2013 flood likely by sediments made
available by the 2012 fires.
Macroinvertebrates
Macroinvertebrates (i.e. bottom dwelling aquatic insects) were collected and classified in the fall
of 2012 and fall of 2013. Each sampling consisted of two locations in faster moving water and
two in runs or channel margins. While the collection of the samples via the Hess sampler was a
fairly efficient process, each sample required hours of cleaning and subsequent classification by
a qualified laboratory.
As our data did not indicate significant changes in the river following the 2012 fires and
September 2013 floods, we were not able to statistically analyze the interaction between
sediment conditions and the macroinvertebrates (Objective 2). However, there are a number of
results from macroinvertebrate data worth mentioning (see Figure 11 for summary graphs or
Appendix A for the full macroinvertebrate dataset):
October 12, 2013
FLOW
Final Report: Cache la Poudre River Post-Fire Sediment & Aquatic Insect Monitoring
16
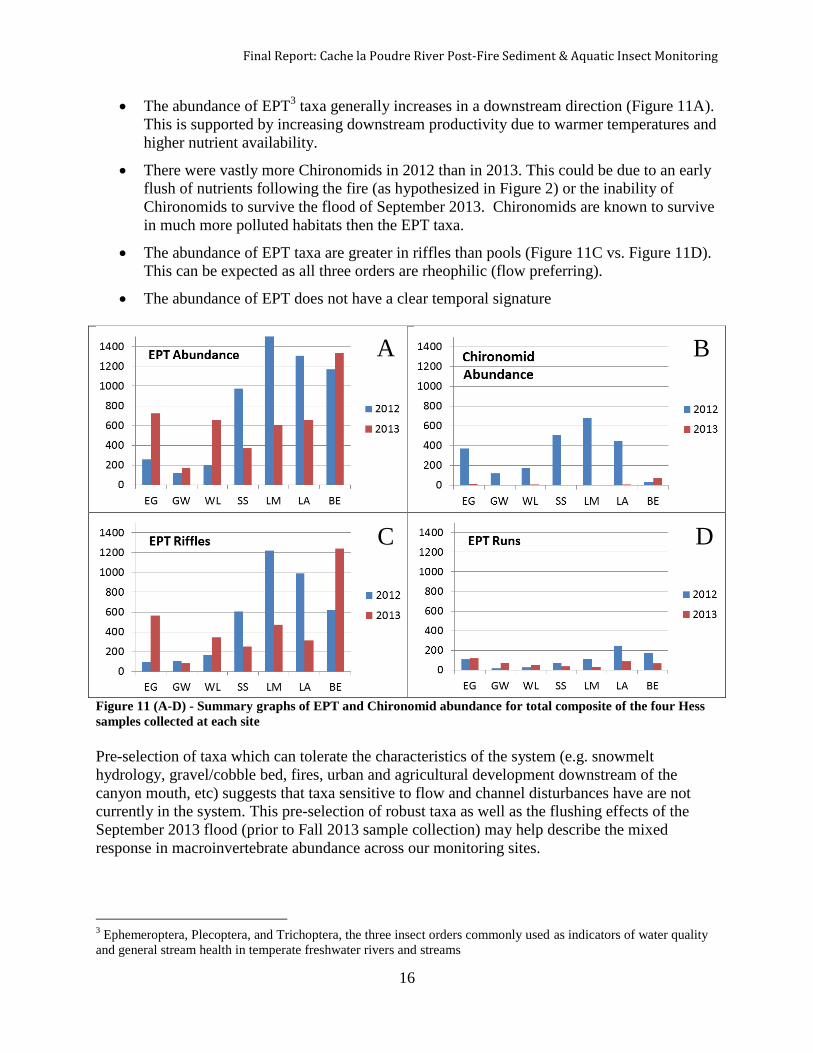
The abundance of EPT3 taxa generally increases in a downstream direction (Figure 11A).
This is supported by increasing downstream productivity due to warmer temperatures and
higher nutrient availability.
There were vastly more Chironomids in 2012 than in 2013. This could be due to an early
flush of nutrients following the fire (as hypothesized in Figure 2) or the inability of
Chironomids to survive the flood of September 2013. Chironomids are known to survive
in much more polluted habitats then the EPT taxa.
The abundance of EPT taxa are greater in riffles than pools (Figure 11C vs. Figure 11D).
This can be expected as all three orders are rheophilic (flow preferring).
The abundance of EPT does not have a clear temporal signature
Figure 11 (A-D) - Summary graphs of EPT and Chironomid abundance for total composite of the four Hess
samples collected at each site
Pre-selection of taxa which can tolerate the characteristics of the system (e.g. snowmelt
hydrology, gravel/cobble bed, fires, urban and agricultural development downstream of the
canyon mouth, etc) suggests that taxa sensitive to flow and channel disturbances have are not
currently in the system. This pre-selection of robust taxa as well as the flushing effects of the
September 2013 flood (prior to Fall 2013 sample collection) may help describe the mixed
response in macroinvertebrate abundance across our monitoring sites.
3 Ephemeroptera, Plecoptera, and Trichoptera, the three insect orders commonly used as indicators of water quality
and general stream health in temperate freshwater rivers and streams
A
D C
B
Final Report: Cache la Poudre River Post-Fire Sediment & Aquatic Insect Monitoring
17
Discussion of Appropriate Field Methods for the Poudre River
Beyond learning about the effects of the fires and floods, we also learned a great deal about what
field methods are appropriate for the use in a cobble-bed river like the Poudre.
The Poudre River as a “Wadeable Stream”
There is a primary division in hydrometry4 between wadeable and non-wadeable streams.
Wadeable streams are those “shallow enough to be sampled using methods that involve wading
into the water”5. Those that are non-wadeable are too deep and require field personnel to take
measurements from bridges, boats, and/or the banks. Wadeable assessments have the advantages
that the operator gets to sample materials directly. Hence, sediment is sampled with your hands,
directly from the bed (as opposed to requiring a sampler suspended form a rod or cables). The
operator also tends to be able to see what they are sampling, improving sampling quality and
consistency. Ignoring the effects of flow velocity, some would argue that the depth limit between
wadeable and non-wadeable is the depth before ones waders overtop. While this may be true for
surveying, I would argue that for sediment sampling the depth limit is the length of one’s arm.
The ability to sample any deeper would require a snorkel, mask, and full wetsuit.
At base flow, the Poudre River has some sections which are wadeable and some which are not.
The riffles tend to be shallower (and faster) and the pools are often 5-10 feet deep. At high flow,
the Poudre River is highly dangerous (if not impossible) to wade, yet the water is too swift to
easily navigate a boat for sampling.
For this project we elected to choose wadeable field techniques and employ them in the riffles
and runs of the river. The major limiting factor in this plan is that to safely wade in the river, the
river needs to be running around 150 cfs or less. A quick look at the historic record of the mouth
of canyon gage reveals that while it the daily-average flow has been less than 150 cfs for about a
third of the days in the record, this is most common from early September through the first week
in April. Hence we ended up taking one round of monitoring in the fall (Sept-early Oct) and the
other in the spring (March). While these two sampling times where nearly 6 months apart, they
were separated by the long winter baseflow period, where we would not expect to see much
change to channel geometry or sediment.
Signal-to-Noise Ratio
The sampling methodology was designed using a wide array of techniques designed to
accurately assess the physical and biotic characteristics of natural river systems. Using the data
gathered from the methodology, we then hoped to be able to assess our project objectives.
However, many of our conclusions fell into a category of not having ample resolution to indicate
changes to the Poudre River. For the health of the Poudre River ecosystem, it is safe to say that
this was largely a good thing, but I also wanted to dig a bit deeper to help future projects learn
from the experience of this monitoring effort.
4 Defined as the principles, methods, and instruments for measuring water quantity and water quality in natural
aquatic systems 5 http://water.epa.gov/type/rsl/monitoring/streamsurvey/web_qa_06.cfm
Final Report: Cache la Poudre River Post-Fire Sediment & Aquatic Insect Monitoring
18
For example, the cross-sectional and longitudinal-profile survey data was designed to measure
changes in channel geometry. As mentioned previously, we were not able to measure significant
changes in channel geometry at our monitoring sites.
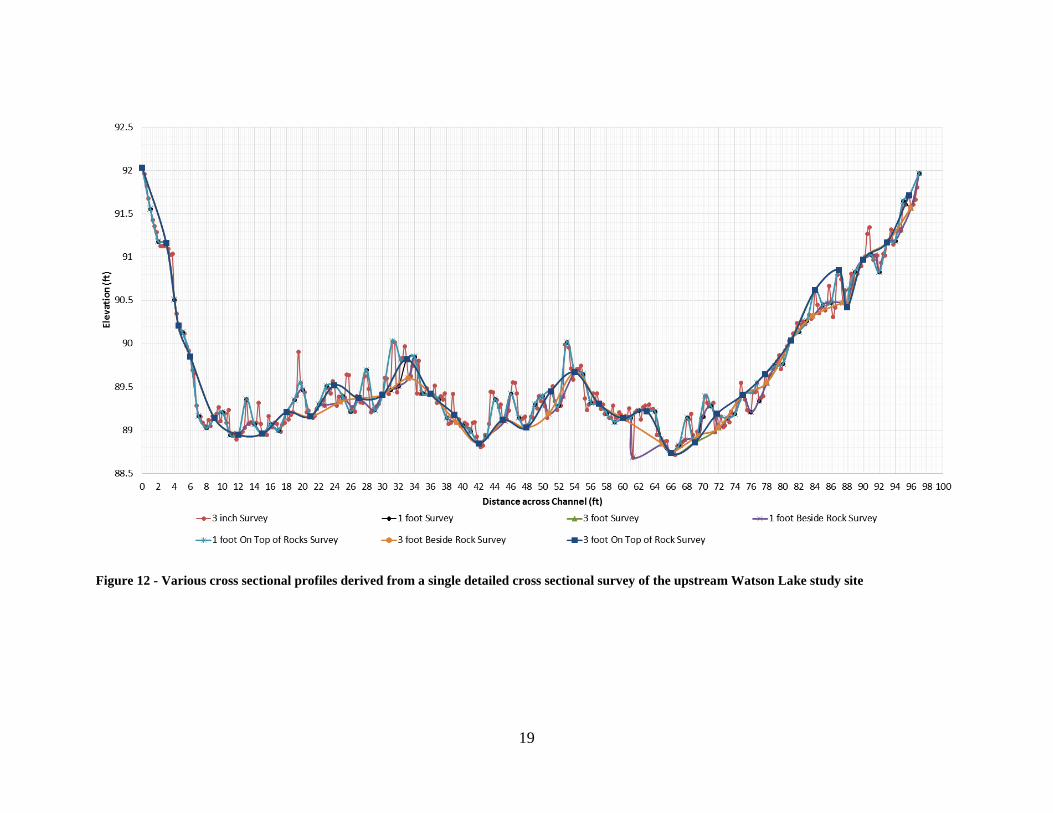
To identify the lower limits of our surveying resolution, we designed a supplemental experiment
to measure how the subtle differences in field protocol (and execution) could influence the data.
Hence, we surveyed the upstream cross section of the Watson Lake site at a high-spatial-
resolution 3 inch increment across the entire channel. Then, we filtered this data to evaluate the
impact of survey methodology (e.g. spacing increments, top of rocks, between rocks).
Comparing cross-sections from this data (Figure 12) nearly a 150 mm (~6 in) discrepancy in the
bed elevation at any given point across the stream (Figure 12). This coincides with the size of the
cobbles in the stream. The median sediment size (d50) at this cross section was measured to be
86mm and the d84 (one standard deviation above the mean) 197mm. While we had a notion when
designing the sampling methodology that channel surveys only detect changes larger than the
typical sediment size, this data further reinforces that notion.
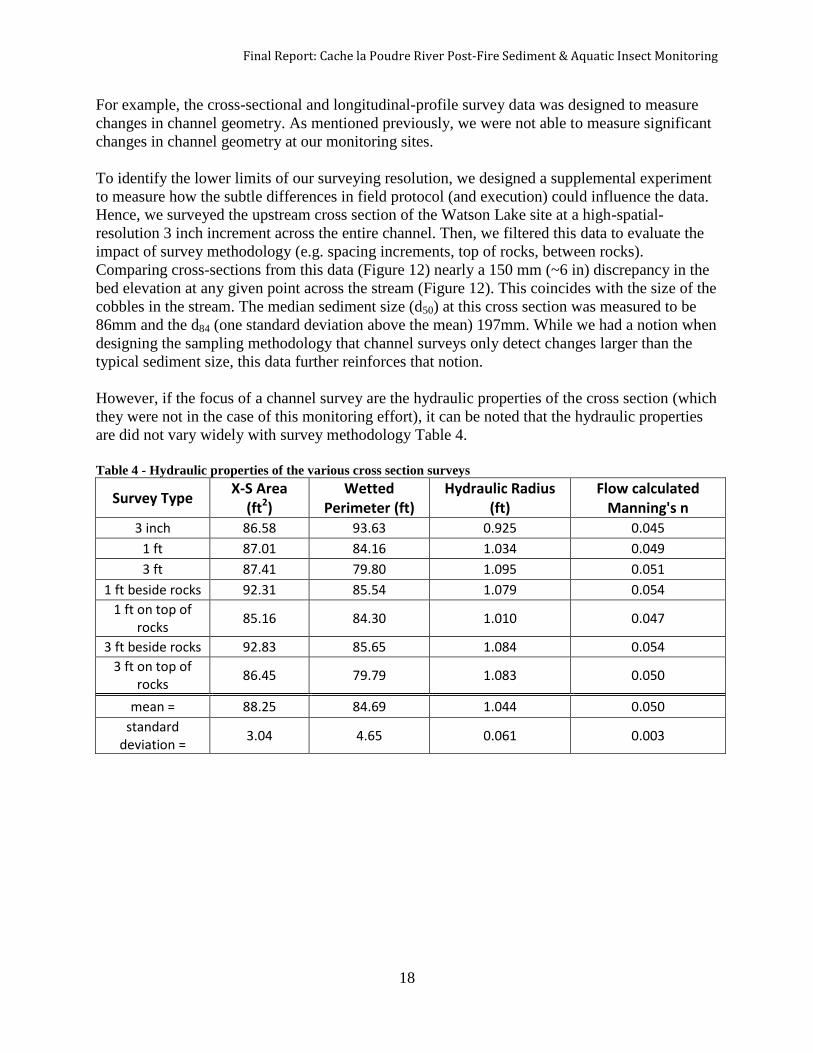
However, if the focus of a channel survey are the hydraulic properties of the cross section (which
they were not in the case of this monitoring effort), it can be noted that the hydraulic properties
are did not vary widely with survey methodology Table 4.
Table 4 - Hydraulic properties of the various cross section surveys
Survey Type X-S Area
(ft2) Wetted
Perimeter (ft) Hydraulic Radius
(ft) Flow calculated
Manning's n 3 inch 86.58 93.63 0.925 0.045
1 ft 87.01 84.16 1.034 0.049
3 ft 87.41 79.80 1.095 0.051
1 ft beside rocks 92.31 85.54 1.079 0.054
1 ft on top of rocks
85.16 84.30 1.010 0.047
3 ft beside rocks 92.83 85.65 1.084 0.054
3 ft on top of rocks
86.45 79.79 1.083 0.050
mean = 88.25 84.69 1.044 0.050
standard deviation =
3.04 4.65 0.061 0.003
19
Figure 12 - Various cross sectional profiles derived from a single detailed cross sectional survey of the upstream Watson Lake study site
20
Supplemental Benefits
Beyond the central motivation to determine the multi-year effects of the 2012 fires and
September 2013 flood on the Poudre River, other benefits were gained as well, including:
Over 300 hours of paid field and laboratory work for Colorado State University
undergraduate and graduate students.
Baseline data and field methods evaluation will help inform future monitoring and studies
on the Poudre River through Fort Collins. For example, Dr. Baker is currently utilizing
the lessons learned in this effort to help develop a River Health Assessment Framework
for the Poudre River along with staff from the City of Fort Collins.
CONCLUSIONS
While, we know that ash and fine sediment moved through the Poudre River following the 2012
fires, the above average peak flows in September 2013 and May-June 2014 quickly moved this
excess sediment through our monitoring sites. This is not to downplay the degradation to gullies
and small streams within the burned areas of the 2012 fires, which in many cases were scoured
down to bedrock and will take many years to recover. Additionally, the main channel of the river
was tempered from substantial impacts by a multitude of factors including:
Spatial scale – The 2012 fires greatly altered the hydrology and landscape of the
watersheds they burned. However, this only accounted for about 10% of the Poudre
watershed upstream of the canyon mouth. Thus, when comparing the impacts of localized
thunderstorms to small basins which were near 100% burned6, the comparison to the
main stem of the river is like comparing apples to oranges.
Armored channel boundary – The gravel and cobbles on the bed of the Poudre River
are not often mobilized and thus have evolved into a highly armored channel boundary
(this is a condition where most of the smaller sand and gravels are washed away from the
river bottom and only the largest rocks remain locked tightly on the surface. Armored
channel boundaries are difficult to break up.
September 2013 flood duration – While the magnitude of the September 2013 flood
was ample to create channel change, its duration was only a few days long. As sediment
mobility and subsequent channel movement are a stochastic process, the longer the
channel is exposed to high shear stress levels, the greater the possibility that the armored
layer will begin to move.
Ecosystem resilience – The ability of the Poudre River to come withstand the combined
effects of the 2012 fires and September 2013 flood point to the inherent resilience of this
ecosystem. This level of resilience is not to be taken for granted. Management decisions
must continually consider their effect on resilience to guarantee the Poudre River can
withstand future events like those of the last three years.
6 See news stories (1) http://archive.coloradoan.com/article/20130427/NEWS01/304270019/Poudre-Canyon-faces-
mudslides-rockfalls-from-spring-runoff and (2) http://www.9news.com/news/article/278027/0/Four-mud-rock-
slides-halt-Poudre-Canyon-travel
Final Report: Cache la Poudre River Post-Fire Sediment & Aquatic Insect Monitoring
21
ACKNOWLEDGEMENTS
I would like to personally thank the groups who funded this monitoring effort:
City of Fort Collins Natural Areas
City of Fort Collins Utilities (Water and Stormwater)
Colorado Parks and Wildlife
Bohemian Foundation
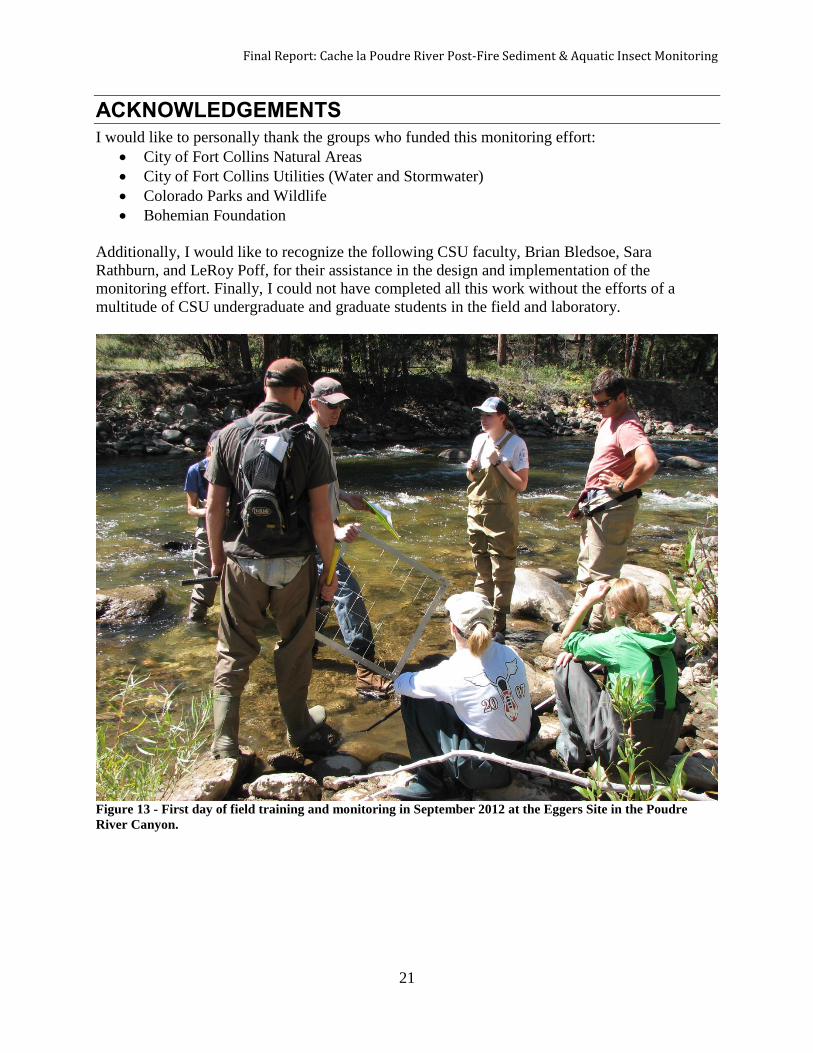
Additionally, I would like to recognize the following CSU faculty, Brian Bledsoe, Sara
Rathburn, and LeRoy Poff, for their assistance in the design and implementation of the
monitoring effort. Finally, I could not have completed all this work without the efforts of a
multitude of CSU undergraduate and graduate students in the field and laboratory.
Figure 13 - First day of field training and monitoring in September 2012 at the Eggers Site in the Poudre
River Canyon.

Final Report: Cache la Poudre River Post-Fire Sediment & Aquatic Insect Monitoring
22
APPENDIX A: MACROINVERTEBRATE DATA
23
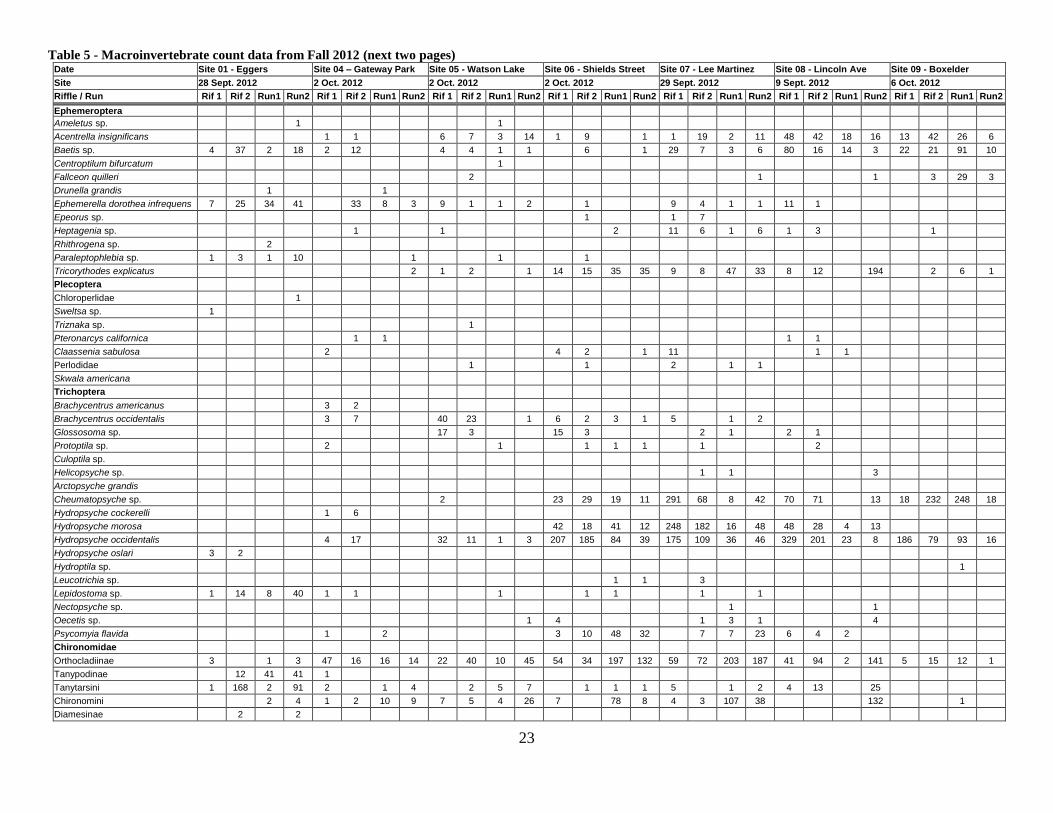
Table 5 - Macroinvertebrate count data from Fall 2012 (next two pages) Date Site 01 - Eggers Site 04 – Gateway Park Site 05 - Watson Lake Site 06 - Shields Street Site 07 - Lee Martinez Site 08 - Lincoln Ave Site 09 - Boxelder
Site 28 Sept. 2012 2 Oct. 2012 2 Oct. 2012 2 Oct. 2012 29 Sept. 2012 9 Sept. 2012 6 Oct. 2012
Riffle / Run Rif 1 Rif 2 Run1 Run2 Rif 1 Rif 2 Run1 Run2 Rif 1 Rif 2 Run1 Run2 Rif 1 Rif 2 Run1 Run2 Rif 1 Rif 2 Run1 Run2 Rif 1 Rif 2 Run1 Run2 Rif 1 Rif 2 Run1 Run2
Ephemeroptera
Ameletus sp. 1 1
Acentrella insignificans 1 1 6 7 3 14 1 9 1 1 19 2 11 48 42 18 16 13 42 26 6
Baetis sp. 4 37 2 18 2 12 4 4 1 1 6 1 29 7 3 6 80 16 14 3 22 21 91 10
Centroptilum bifurcatum 1
Fallceon quilleri 2 1 1 3 29 3
Drunella grandis 1 1
Ephemerella dorothea infrequens 7 25 34 41 33 8 3 9 1 1 2 1 9 4 1 1 11 1
Epeorus sp. 1 1 7
Heptagenia sp. 1 1 2 11 6 1 6 1 3 1
Rhithrogena sp. 2
Paraleptophlebia sp. 1 3 1 10 1 1 1
Tricorythodes explicatus 2 1 2 1 14 15 35 35 9 8 47 33 8 12 194 2 6 1
Plecoptera
Chloroperlidae 1
Sweltsa sp. 1
Triznaka sp. 1
Pteronarcys californica 1 1 1 1
Claassenia sabulosa 2 4 2 1 11 1 1
Perlodidae 1 1 2 1 1
Skwala americana
Trichoptera
Brachycentrus americanus 3 2
Brachycentrus occidentalis 3 7 40 23 1 6 2 3 1 5 1 2
Glossosoma sp. 17 3 15 3 2 1 2 1
Protoptila sp. 2 1 1 1 1 1 2
Culoptila sp.
Helicopsyche sp. 1 1 3
Arctopsyche grandis
Cheumatopsyche sp. 2 23 29 19 11 291 68 8 42 70 71 13 18 232 248 18
Hydropsyche cockerelli 1 6
Hydropsyche morosa 42 18 41 12 248 182 16 48 48 28 4 13
Hydropsyche occidentalis 4 17 32 11 1 3 207 185 84 39 175 109 36 46 329 201 23 8 186 79 93 16
Hydropsyche oslari 3 2
Hydroptila sp. 1
Leucotrichia sp. 1 1 3
Lepidostoma sp. 1 14 8 40 1 1 1 1 1 1 1
Nectopsyche sp. 1 1
Oecetis sp. 1 4 1 3 1 4
Psycomyia flavida 1 2 3 10 48 32 7 7 23 6 4 2
Chironomidae
Orthocladiinae 3 1 3 47 16 16 14 22 40 10 45 54 34 197 132 59 72 203 187 41 94 2 141 5 15 12 1
Tanypodinae 12 41 41 1
Tanytarsini 1 168 2 91 2 1 4 2 5 7 1 1 1 5 1 2 4 13 25
Chironomini 2 4 1 2 10 9 7 5 4 26 7 78 8 4 3 107 38 132 1
Diamesinae 2 2
Final Report: Cache la Poudre River Post-Fire Sediment & Aquatic Insect Monitoring
24
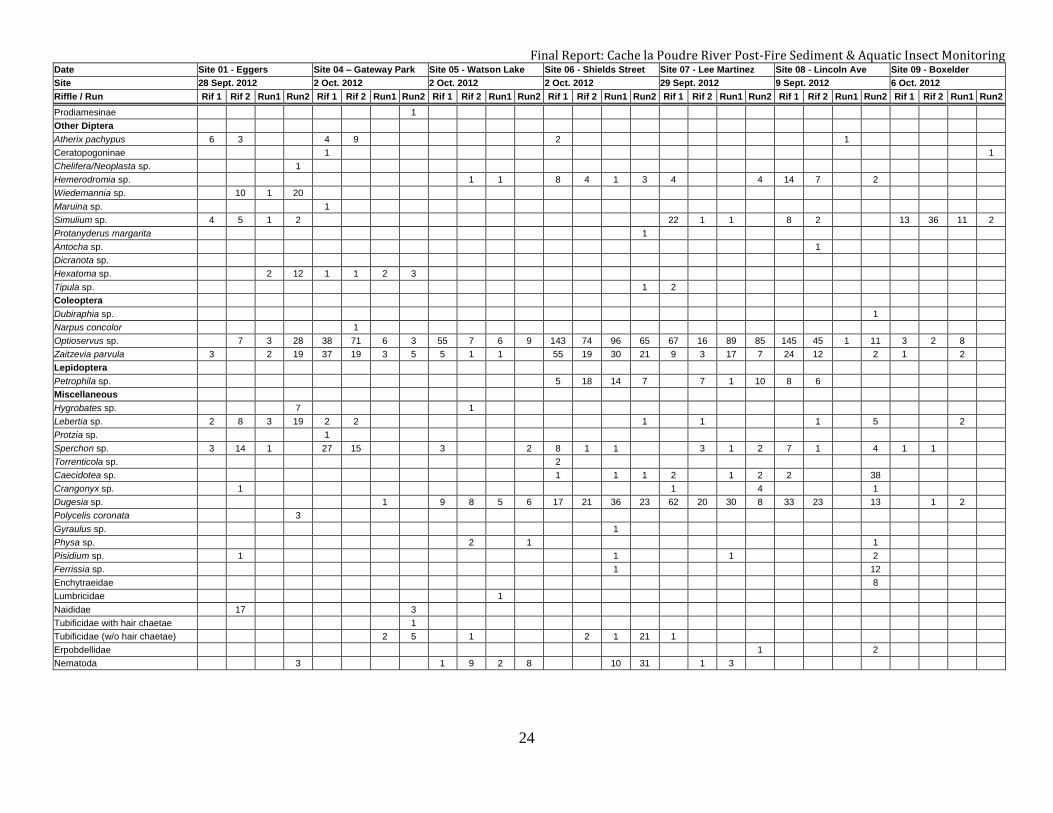
Date Site 01 - Eggers Site 04 – Gateway Park Site 05 - Watson Lake Site 06 - Shields Street Site 07 - Lee Martinez Site 08 - Lincoln Ave Site 09 - Boxelder
Site 28 Sept. 2012 2 Oct. 2012 2 Oct. 2012 2 Oct. 2012 29 Sept. 2012 9 Sept. 2012 6 Oct. 2012
Riffle / Run Rif 1 Rif 2 Run1 Run2 Rif 1 Rif 2 Run1 Run2 Rif 1 Rif 2 Run1 Run2 Rif 1 Rif 2 Run1 Run2 Rif 1 Rif 2 Run1 Run2 Rif 1 Rif 2 Run1 Run2 Rif 1 Rif 2 Run1 Run2
Prodiamesinae 1
Other Diptera
Atherix pachypus 6 3 4 9 2 1
Ceratopogoninae 1 1
Chelifera/Neoplasta sp. 1
Hemerodromia sp. 1 1 8 4 1 3 4 4 14 7 2
Wiedemannia sp. 10 1 20
Maruina sp. 1
Simulium sp. 4 5 1 2 22 1 1 8 2 13 36 11 2
Protanyderus margarita 1
Antocha sp. 1
Dicranota sp.
Hexatoma sp. 2 12 1 1 2 3
Tipula sp. 1 2
Coleoptera
Dubiraphia sp. 1
Narpus concolor 1
Optioservus sp. 7 3 28 38 71 6 3 55 7 6 9 143 74 96 65 67 16 89 85 145 45 1 11 3 2 8
Zaitzevia parvula 3 2 19 37 19 3 5 5 1 1 55 19 30 21 9 3 17 7 24 12 2 1 2
Lepidoptera
Petrophila sp. 5 18 14 7 7 1 10 8 6
Miscellaneous
Hygrobates sp. 7 1
Lebertia sp. 2 8 3 19 2 2 1 1 1 5 2
Protzia sp. 1
Sperchon sp. 3 14 1 27 15 3 2 8 1 1 3 1 2 7 1 4 1 1
Torrenticola sp. 2
Caecidotea sp. 1 1 1 2 1 2 2 38
Crangonyx sp. 1 1 4 1
Dugesia sp. 1 9 8 5 6 17 21 36 23 62 20 30 8 33 23 13 1 2
Polycelis coronata 3
Gyraulus sp. 1
Physa sp. 2 1 1
Pisidium sp. 1 1 1 2
Ferrissia sp. 1 12
Enchytraeidae 8
Lumbricidae 1
Naididae 17 3
Tubificidae with hair chaetae 1
Tubificidae (w/o hair chaetae) 2 5 1 2 1 21 1
Erpobdellidae 1 2
Nematoda 3 1 9 2 8 10 31 1 3
Final Report: Cache la Poudre River Post-Fire Sediment & Aquatic Insect Monitoring
25
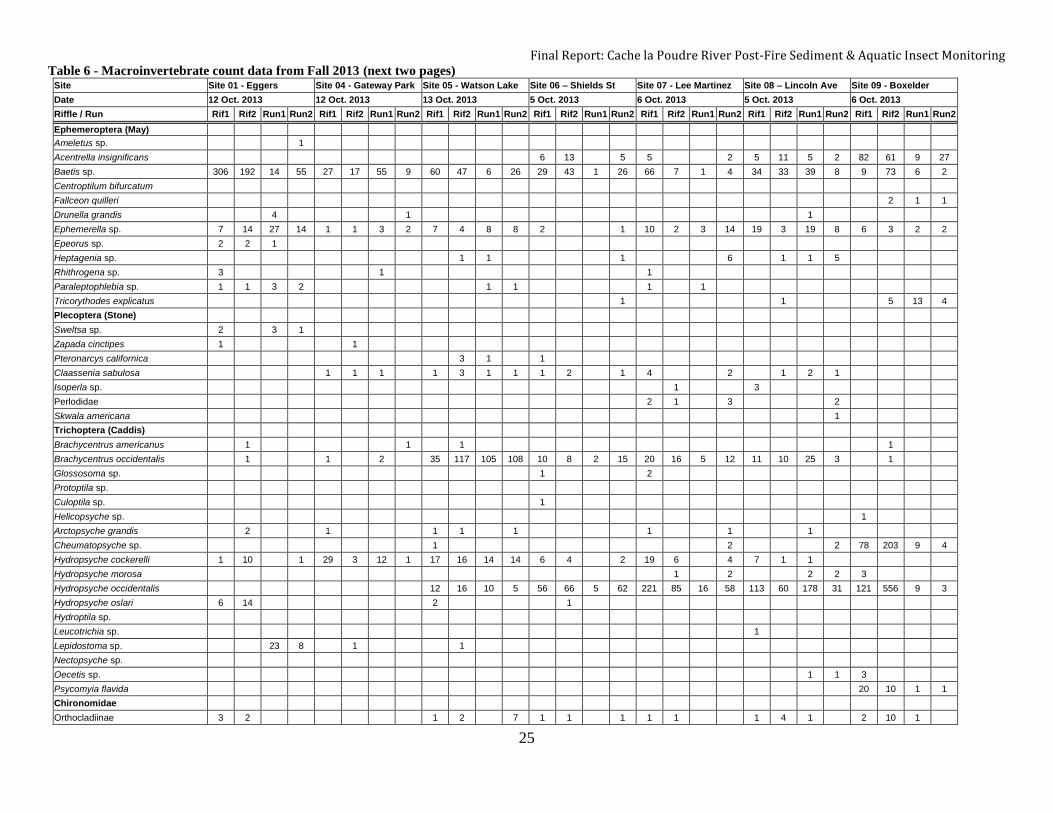
Table 6 - Macroinvertebrate count data from Fall 2013 (next two pages) Site Site 01 - Eggers Site 04 - Gateway Park Site 05 - Watson Lake Site 06 – Shields St Site 07 - Lee Martinez Site 08 – Lincoln Ave Site 09 - Boxelder
Date 12 Oct. 2013 12 Oct. 2013 13 Oct. 2013 5 Oct. 2013 6 Oct. 2013 5 Oct. 2013 6 Oct. 2013
Riffle / Run Rif1 Rif2 Run1 Run2 Rif1 Rif2 Run1 Run2 Rif1 Rif2 Run1 Run2 Rif1 Rif2 Run1 Run2 Rif1 Rif2 Run1 Run2 Rif1 Rif2 Run1 Run2 Rif1 Rif2 Run1 Run2
Ephemeroptera (May)
Ameletus sp. 1
Acentrella insignificans 6 13 5 5 2 5 11 5 2 82 61 9 27
Baetis sp. 306 192 14 55 27 17 55 9 60 47 6 26 29 43 1 26 66 7 1 4 34 33 39 8 9 73 6 2
Centroptilum bifurcatum
Fallceon quilleri 2 1 1
Drunella grandis 4 1 1
Ephemerella sp. 7 14 27 14 1 1 3 2 7 4 8 8 2 1 10 2 3 14 19 3 19 8 6 3 2 2
Epeorus sp. 2 2 1
Heptagenia sp. 1 1 1 6 1 1 5
Rhithrogena sp. 3 1 1
Paraleptophlebia sp. 1 1 3 2 1 1 1 1
Tricorythodes explicatus 1 1 5 13 4
Plecoptera (Stone)
Sweltsa sp. 2 3 1
Zapada cinctipes 1 1
Pteronarcys californica 3 1 1
Claassenia sabulosa 1 1 1 1 3 1 1 1 2 1 4 2 1 2 1
Isoperla sp. 1 3
Perlodidae 2 1 3 2
Skwala americana 1
Trichoptera (Caddis)
Brachycentrus americanus 1 1 1 1
Brachycentrus occidentalis 1 1 2 35 117 105 108 10 8 2 15 20 16 5 12 11 10 25 3 1
Glossosoma sp. 1 2
Protoptila sp.
Culoptila sp. 1
Helicopsyche sp. 1
Arctopsyche grandis 2 1 1 1 1 1 1 1
Cheumatopsyche sp. 1 2 2 78 203 9 4
Hydropsyche cockerelli 1 10 1 29 3 12 1 17 16 14 14 6 4 2 19 6 4 7 1 1
Hydropsyche morosa 1 2 2 2 3
Hydropsyche occidentalis 12 16 10 5 56 66 5 62 221 85 16 58 113 60 178 31 121 556 9 3
Hydropsyche oslari 6 14 2 1
Hydroptila sp.
Leucotrichia sp. 1
Lepidostoma sp. 23 8 1 1
Nectopsyche sp.
Oecetis sp. 1 1 3
Psycomyia flavida 20 10 1 1
Chironomidae
Orthocladiinae 3 2 1 2 7 1 1 1 1 1 1 4 1 2 10 1
Final Report: Cache la Poudre River Post-Fire Sediment & Aquatic Insect Monitoring
26
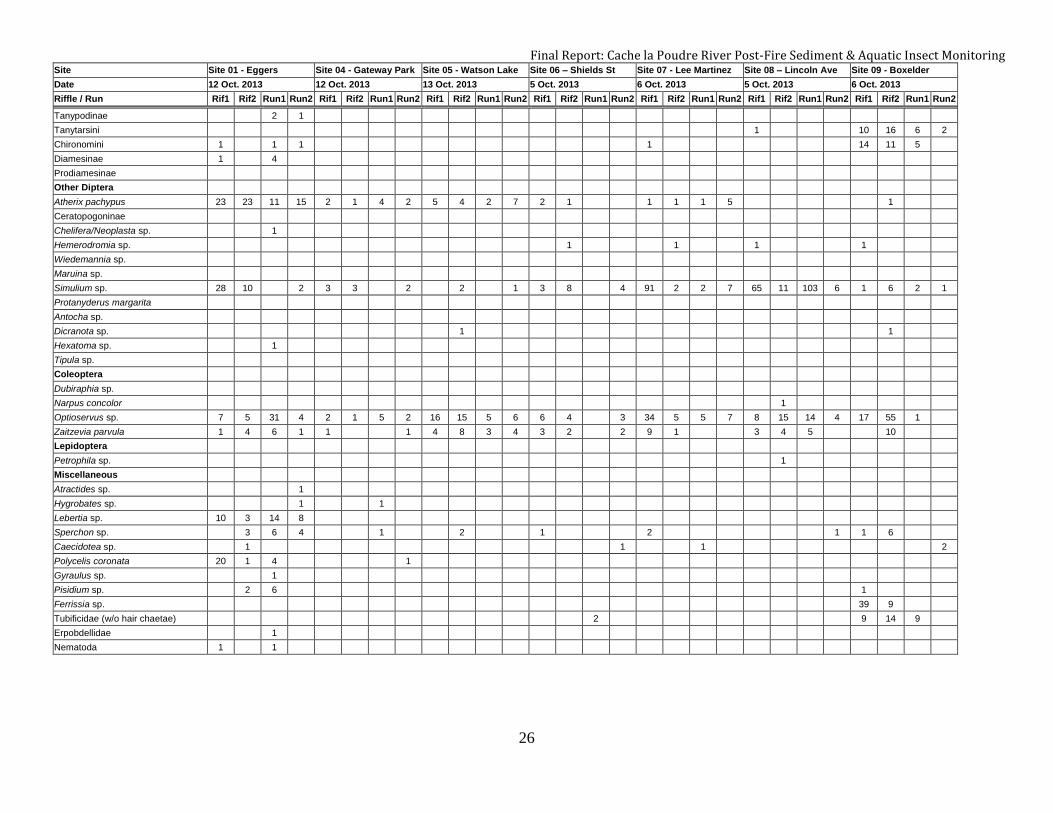
Site Site 01 - Eggers Site 04 - Gateway Park Site 05 - Watson Lake Site 06 – Shields St Site 07 - Lee Martinez Site 08 – Lincoln Ave Site 09 - Boxelder
Date 12 Oct. 2013 12 Oct. 2013 13 Oct. 2013 5 Oct. 2013 6 Oct. 2013 5 Oct. 2013 6 Oct. 2013
Riffle / Run Rif1 Rif2 Run1 Run2 Rif1 Rif2 Run1 Run2 Rif1 Rif2 Run1 Run2 Rif1 Rif2 Run1 Run2 Rif1 Rif2 Run1 Run2 Rif1 Rif2 Run1 Run2 Rif1 Rif2 Run1 Run2
Tanypodinae 2 1
Tanytarsini 1 10 16 6 2
Chironomini 1 1 1 1 14 11 5
Diamesinae 1 4
Prodiamesinae
Other Diptera
Atherix pachypus 23 23 11 15 2 1 4 2 5 4 2 7 2 1 1 1 1 5 1
Ceratopogoninae
Chelifera/Neoplasta sp. 1
Hemerodromia sp. 1 1 1 1
Wiedemannia sp.
Maruina sp.
Simulium sp. 28 10 2 3 3 2 2 1 3 8 4 91 2 2 7 65 11 103 6 1 6 2 1
Protanyderus margarita
Antocha sp.
Dicranota sp. 1 1
Hexatoma sp. 1
Tipula sp.
Coleoptera
Dubiraphia sp.
Narpus concolor 1
Optioservus sp. 7 5 31 4 2 1 5 2 16 15 5 6 6 4 3 34 5 5 7 8 15 14 4 17 55 1
Zaitzevia parvula 1 4 6 1 1 1 4 8 3 4 3 2 2 9 1 3 4 5 10
Lepidoptera
Petrophila sp. 1
Miscellaneous
Atractides sp. 1
Hygrobates sp. 1 1
Lebertia sp. 10 3 14 8
Sperchon sp. 3 6 4 1 2 1 2 1 1 6
Caecidotea sp. 1 1 1 2
Polycelis coronata 20 1 4 1
Gyraulus sp. 1
Pisidium sp. 2 6 1
Ferrissia sp. 39 9
Tubificidae (w/o hair chaetae) 2 9 14 9
Erpobdellidae 1
Nematoda 1 1
27
APPENDIX B: FIELD PROTOCOL
Introduction
The methods outlined below are derived from a variety of sources. Please reference (Harrelson
et al., 1994) for a general overview of field techniques and/or (Bunte and Abt, 2001) for
questions specifically related to quantifying sediment. Though there is no consensus on the use
of English or metric units in the United States, for the purpose of minimal conversions (and unity
among field hands) please record all measurements in metric units where possible.
Layout cross section and reach
Two permanent rebar control points should be established near bankfull on the left bank (Left
bank as you look downstream = zero on the tape) and right bank of the cross section. The
latitude and longitude of each control point should be recorded via GPS and if possible these
control points should be referenced to a known benchmark location. Each reach will consist of
the river channel 2 bankfull widths above and below the monumented cross section. Mark the
limit of the reach on each bank with pin flags and measure and record the lineal distance to each
on the field sheet. Transects will be run perpendicular to the flow direction at each site.
Sketches and photos
Detailed field notes, sketches and photographs will be taken of each site and include detailed
notes on changes in channel morphology, bank stability, riparian and floodplain conditions,
instream habitat features, and photo points.
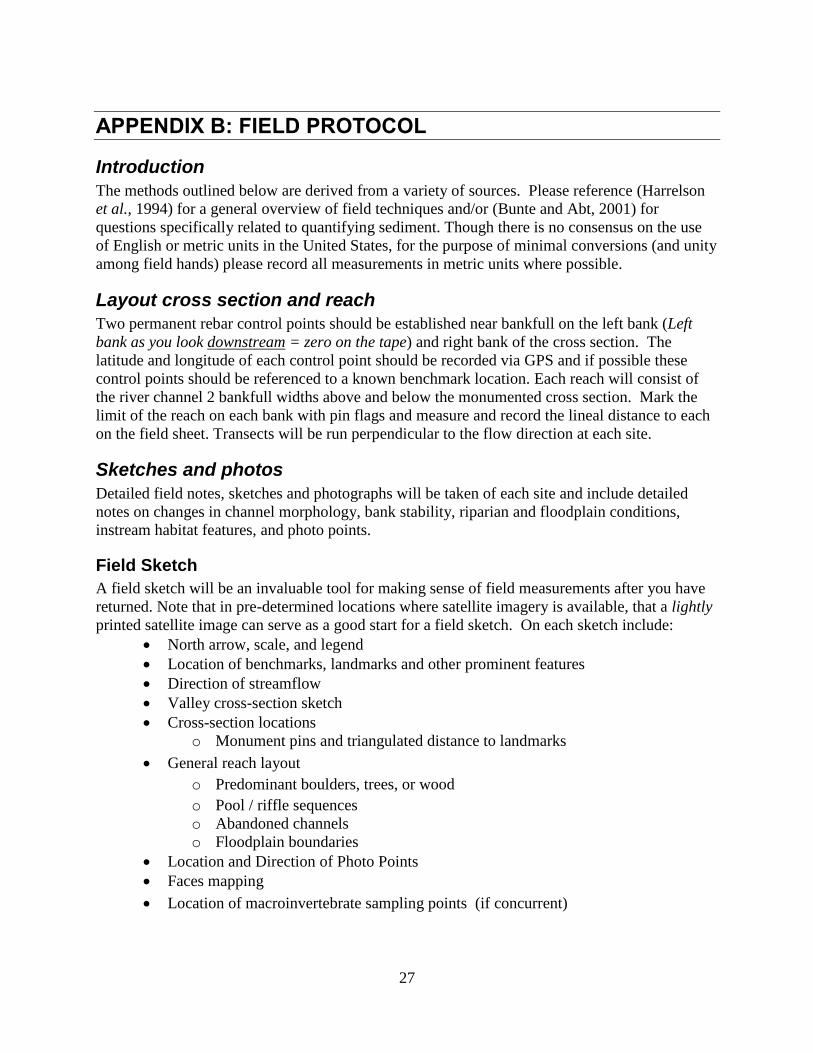
Field Sketch
A field sketch will be an invaluable tool for making sense of field measurements after you have
returned. Note that in pre-determined locations where satellite imagery is available, that a lightly
printed satellite image can serve as a good start for a field sketch. On each sketch include:
North arrow, scale, and legend
Location of benchmarks, landmarks and other prominent features
Direction of streamflow
Valley cross-section sketch
Cross-section locations
o Monument pins and triangulated distance to landmarks
General reach layout
o Predominant boulders, trees, or wood
o Pool / riffle sequences
o Abandoned channels
o Floodplain boundaries
Location and Direction of Photo Points
Faces mapping
Location of macroinvertebrate sampling points (if concurrent)
Final Report: Cache la Poudre River Post-Fire Sediment & Aquatic Insect Monitoring
28
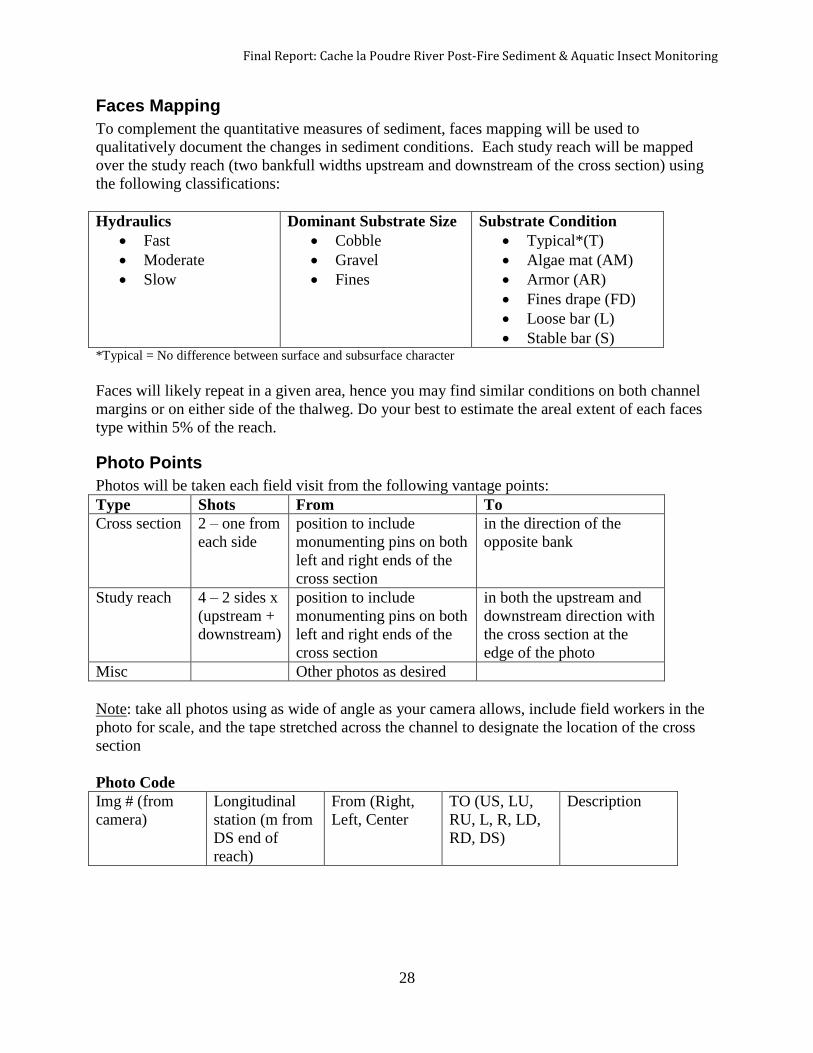
Faces Mapping
To complement the quantitative measures of sediment, faces mapping will be used to
qualitatively document the changes in sediment conditions. Each study reach will be mapped
over the study reach (two bankfull widths upstream and downstream of the cross section) using
the following classifications:
Hydraulics
Fast
Moderate
Slow
Dominant Substrate Size
Cobble
Gravel
Fines
Substrate Condition
Typical*(T)
Algae mat (AM)
Armor (AR)
Fines drape (FD)
Loose bar (L)
Stable bar (S) *Typical = No difference between surface and subsurface character
Faces will likely repeat in a given area, hence you may find similar conditions on both channel
margins or on either side of the thalweg. Do your best to estimate the areal extent of each faces
type within 5% of the reach.
Photo Points
Photos will be taken each field visit from the following vantage points:
Type Shots From To
Cross section 2 – one from
each side
position to include
monumenting pins on both
left and right ends of the
cross section
in the direction of the
opposite bank
Study reach 4 – 2 sides x
(upstream +
downstream)
position to include
monumenting pins on both
left and right ends of the
cross section
in both the upstream and
downstream direction with
the cross section at the
edge of the photo
Misc Other photos as desired
Note: take all photos using as wide of angle as your camera allows, include field workers in the
photo for scale, and the tape stretched across the channel to designate the location of the cross
section
Photo Code
Img # (from
camera)
Longitudinal
station (m from
DS end of
reach)
From (Right,
Left, Center
TO (US, LU,
RU, L, R, LD,
RD, DS)
Description
Final Report: Cache la Poudre River Post-Fire Sediment & Aquatic Insect Monitoring
29
Survey Channel Geometry
Channel geometry is the continuously adjusting balance between the water in a stream and its
watershed. The multitudes of geometric adjustments provide one of the more challenging
aspects of riverine engineering. Data acquisition of channel geometry can be quite time
consuming, but is vital to the characterization of a stream. In this study we will focus on two
main geometric groups; cross sectional geometry and downstream geometry.
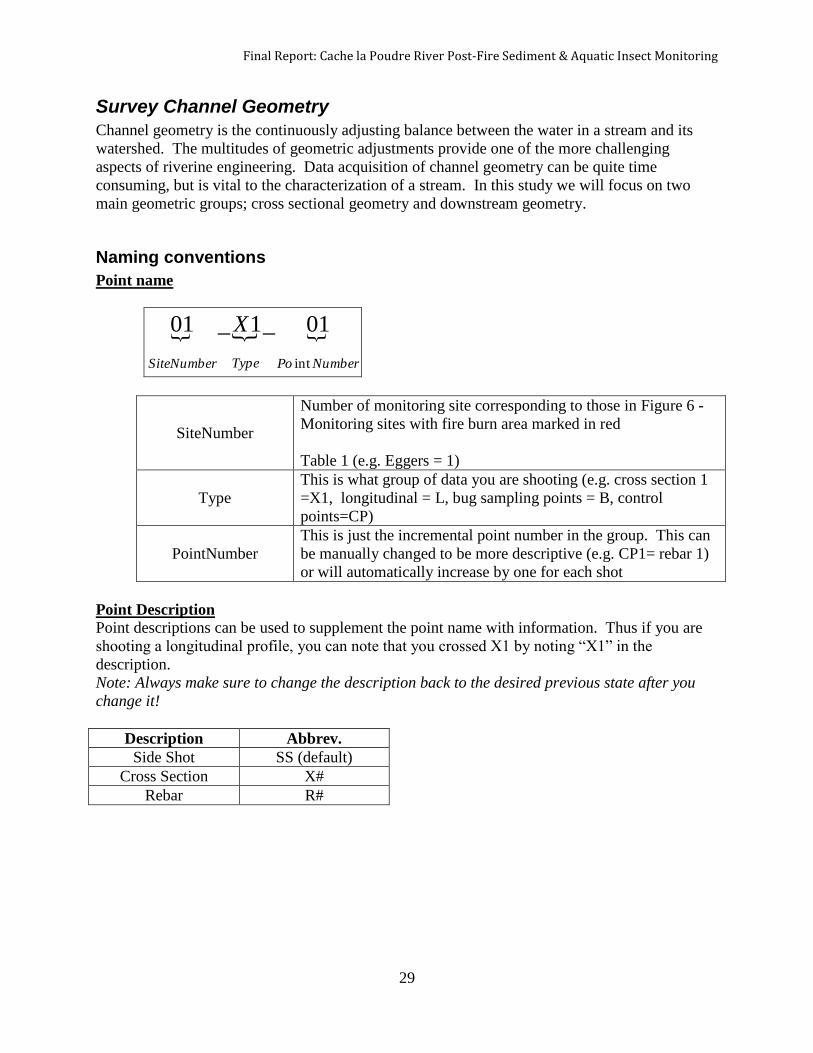
Naming conventions
Point name
NumberPoTypeSiteNumber
X
int
01_1_01
SiteNumber
Number of monitoring site corresponding to those in Figure 6 -
Monitoring sites with fire burn area marked in red
Table 1 (e.g. Eggers = 1)
Type
This is what group of data you are shooting (e.g. cross section 1
=X1, longitudinal = L, bug sampling points = B, control
points=CP)
PointNumber
This is just the incremental point number in the group. This can
be manually changed to be more descriptive (e.g. CP1= rebar 1)
or will automatically increase by one for each shot
Point Description
Point descriptions can be used to supplement the point name with information. Thus if you are
shooting a longitudinal profile, you can note that you crossed X1 by noting “X1” in the
description.
Note: Always make sure to change the description back to the desired previous state after you
change it!
Description Abbrev.
Side Shot SS (default)
Cross Section X#
Rebar R#
Final Report: Cache la Poudre River Post-Fire Sediment & Aquatic Insect Monitoring
30
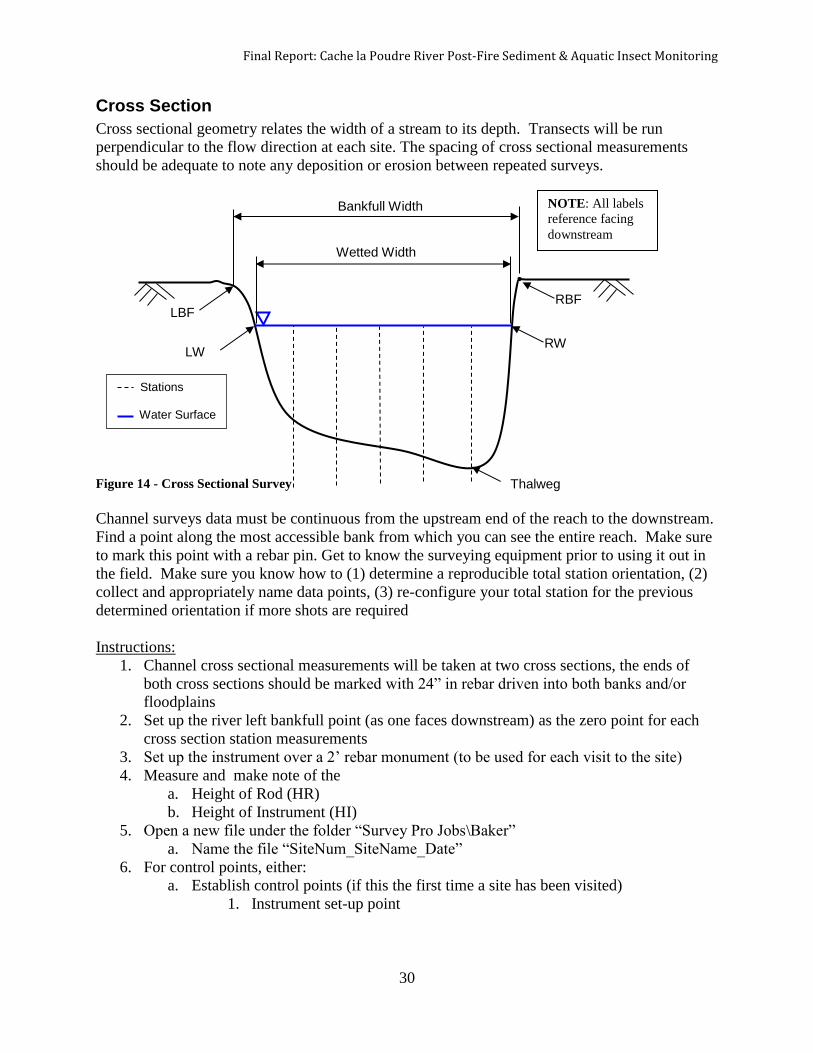
Cross Section
Cross sectional geometry relates the width of a stream to its depth. Transects will be run
perpendicular to the flow direction at each site. The spacing of cross sectional measurements
should be adequate to note any deposition or erosion between repeated surveys.
Figure 14 - Cross Sectional Survey
Channel surveys data must be continuous from the upstream end of the reach to the downstream.
Find a point along the most accessible bank from which you can see the entire reach. Make sure
to mark this point with a rebar pin. Get to know the surveying equipment prior to using it out in
the field. Make sure you know how to (1) determine a reproducible total station orientation, (2)
collect and appropriately name data points, (3) re-configure your total station for the previous
determined orientation if more shots are required
Instructions:
1. Channel cross sectional measurements will be taken at two cross sections, the ends of
both cross sections should be marked with 24” in rebar driven into both banks and/or
floodplains
2. Set up the river left bankfull point (as one faces downstream) as the zero point for each
cross section station measurements
3. Set up the instrument over a 2’ rebar monument (to be used for each visit to the site)
4. Measure and make note of the
a. Height of Rod (HR)
b. Height of Instrument (HI)
5. Open a new file under the folder “Survey Pro Jobs\Baker”
a. Name the file “SiteNum_SiteName_Date”
6. For control points, either:
a. Establish control points (if this the first time a site has been visited)
1. Instrument set-up point
Stations Water Surface
Bankfull Width
Thalweg
RW
RBF
LW
LBF
NOTE: All labels
reference facing
downstream
Wetted Width
Final Report: Cache la Poudre River Post-Fire Sediment & Aquatic Insect Monitoring
31
2. An external control point located on bedrock or non moving object
(bridge, concrete building, etc) estimate and note bearing to external
control point.
b. Set up control point file (e.g. 01_ Eggers_CP.job)
1. Survey top of each rebar within view (CP1, CP2, etc)\
c. OR open control point file
1. File => E. Import Control
d. Then Save As standard surveying file (01_Eggers_09-08-12.job)
7. Cross sectional measurements will consist of the following:
a. Measurements every 1m or less across the selected cross sections
b. Points at or above bankfull elevation
c. Bankfull stations (LB, RB) (if known)
d. Wetted width stations and elevation (LW, RW)
e. Elevation of bed, water surface, and distance to bankfull level (and station value)
for a minimum of 10 stations across channel (not to exceed 1.0 m in spacing)
Longitudinal Profile
In addition to the cross sectional surveys, we will perform a detailed survey of the thalweg of the
channel for a distance of approximately 4 bankfull widths encompassing both cross sections.
Instructions:
1. Survey thalweg and water surface elevation along entire sampling reach with a total
station
2. Record the thalweg elevation and water depth every 2 m OR at breaks in thalweg profile
slope (whichever is closer),
3. Start at the downstream end and work your way up labeling each point (01_L1_01,
01_L1_02, etc)
4. Make a note of cross sections by adding the letter X to the description (e.g. )
Bed Sediment Analysis
Bed sediment size will be classified in three different ways, (1) using a grid count of surface
fines, (2) a pebble count, and (3) embeddedness.
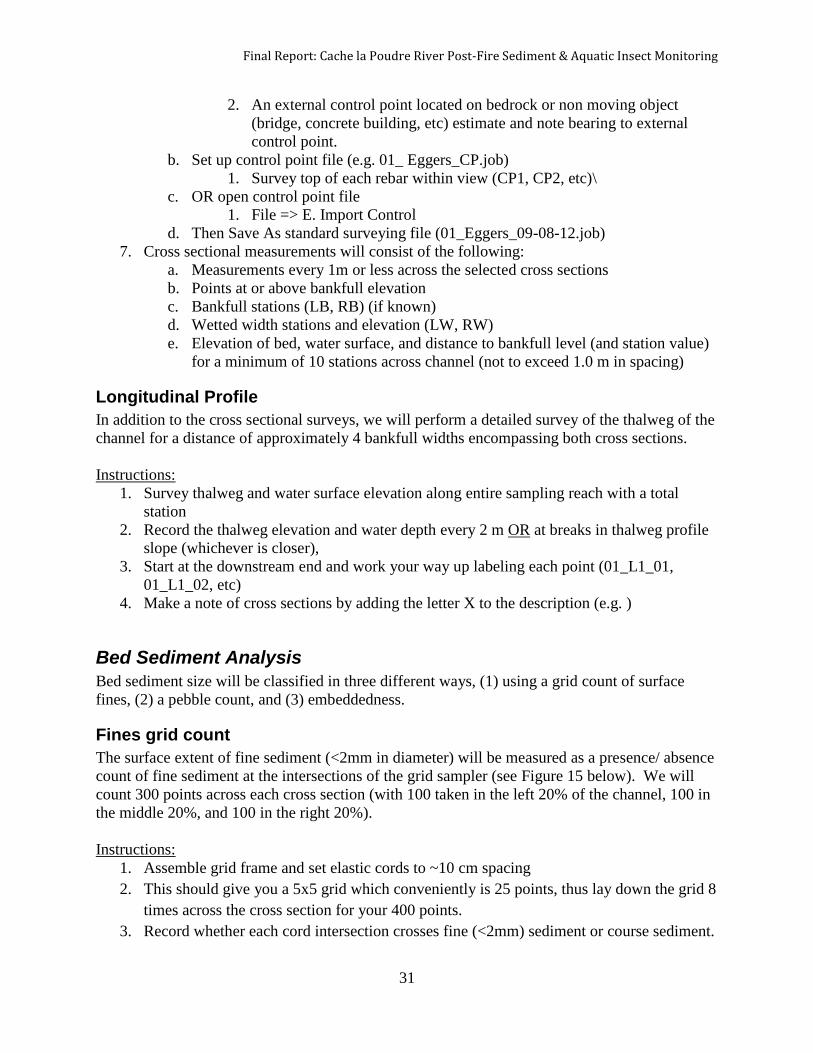
Fines grid count
The surface extent of fine sediment (<2mm in diameter) will be measured as a presence/ absence
count of fine sediment at the intersections of the grid sampler (see Figure 15 below). We will
count 300 points across each cross section (with 100 taken in the left 20% of the channel, 100 in
the middle 20%, and 100 in the right 20%).
Instructions:
1. Assemble grid frame and set elastic cords to ~10 cm spacing
2. This should give you a 5x5 grid which conveniently is 25 points, thus lay down the grid 8
times across the cross section for your 400 points.
3. Record whether each cord intersection crosses fine (<2mm) sediment or course sediment.
Final Report: Cache la Poudre River Post-Fire Sediment & Aquatic Insect Monitoring
32
4. This measurement focuses on what is on the surface of the bed, thus if there is any
thickness layer of fines over larger clasts, count that point as ‘fines’. Only count ‘not
fines’ when the particle on the surface is >2mm.
Figure 15 - Sampling frame and grid set to compute surface fines. If the white is representative of fine
particles (and the gray is gravel and cobbles) then I count a total of 10 grid points crossing fines out of 25
total, or 40% fines.
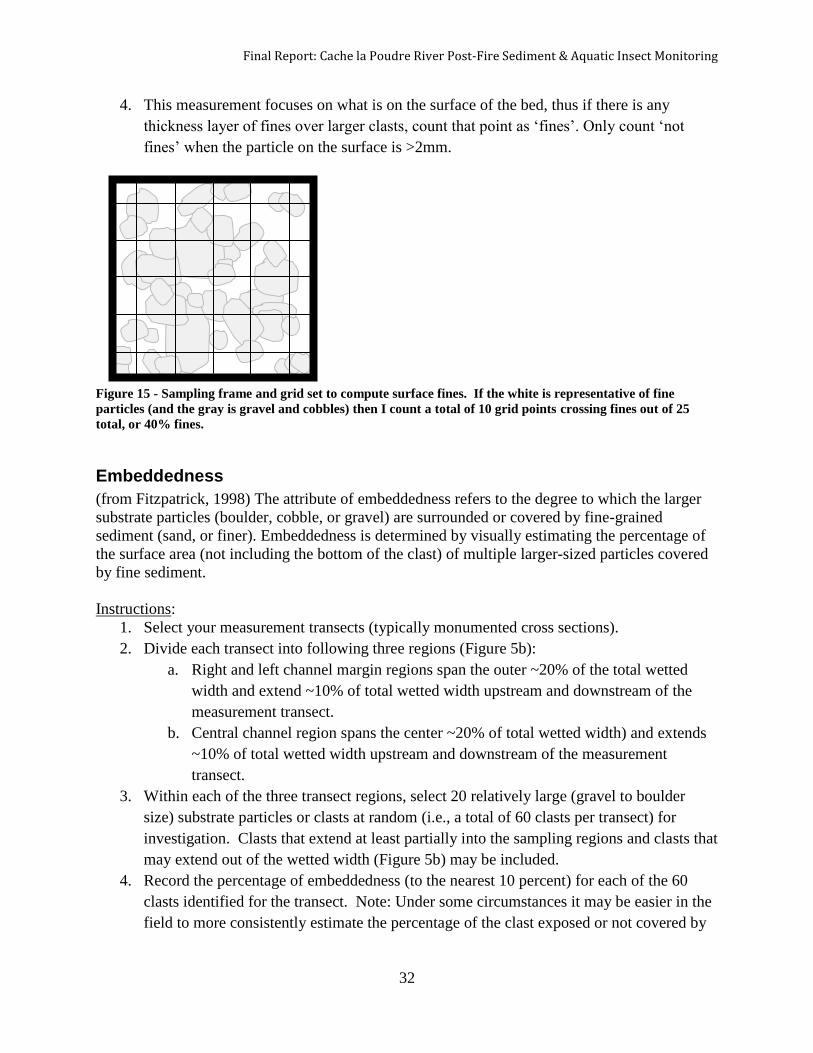
Embeddedness
(from Fitzpatrick, 1998) The attribute of embeddedness refers to the degree to which the larger
substrate particles (boulder, cobble, or gravel) are surrounded or covered by fine-grained
sediment (sand, or finer). Embeddedness is determined by visually estimating the percentage of
the surface area (not including the bottom of the clast) of multiple larger-sized particles covered
by fine sediment.
Instructions:
1. Select your measurement transects (typically monumented cross sections).
2. Divide each transect into following three regions (Figure 5b):
a. Right and left channel margin regions span the outer ~20% of the total wetted
width and extend ~10% of total wetted width upstream and downstream of the
measurement transect.
b. Central channel region spans the center ~20% of total wetted width) and extends
~10% of total wetted width upstream and downstream of the measurement
transect.
3. Within each of the three transect regions, select 20 relatively large (gravel to boulder
size) substrate particles or clasts at random (i.e., a total of 60 clasts per transect) for
investigation. Clasts that extend at least partially into the sampling regions and clasts that
may extend out of the wetted width (Figure 5b) may be included.
4. Record the percentage of embeddedness (to the nearest 10 percent) for each of the 60
clasts identified for the transect. Note: Under some circumstances it may be easier in the
field to more consistently estimate the percentage of the clast exposed or not covered by
Final Report: Cache la Poudre River Post-Fire Sediment & Aquatic Insect Monitoring
33
fine sediment and later covert these to percentages of embeddedness (% of embeddedness
= 1 - % exposed).
5. Calculate and record the average percentage of embeddedness for each of the three
regions and for the transect as a whole.
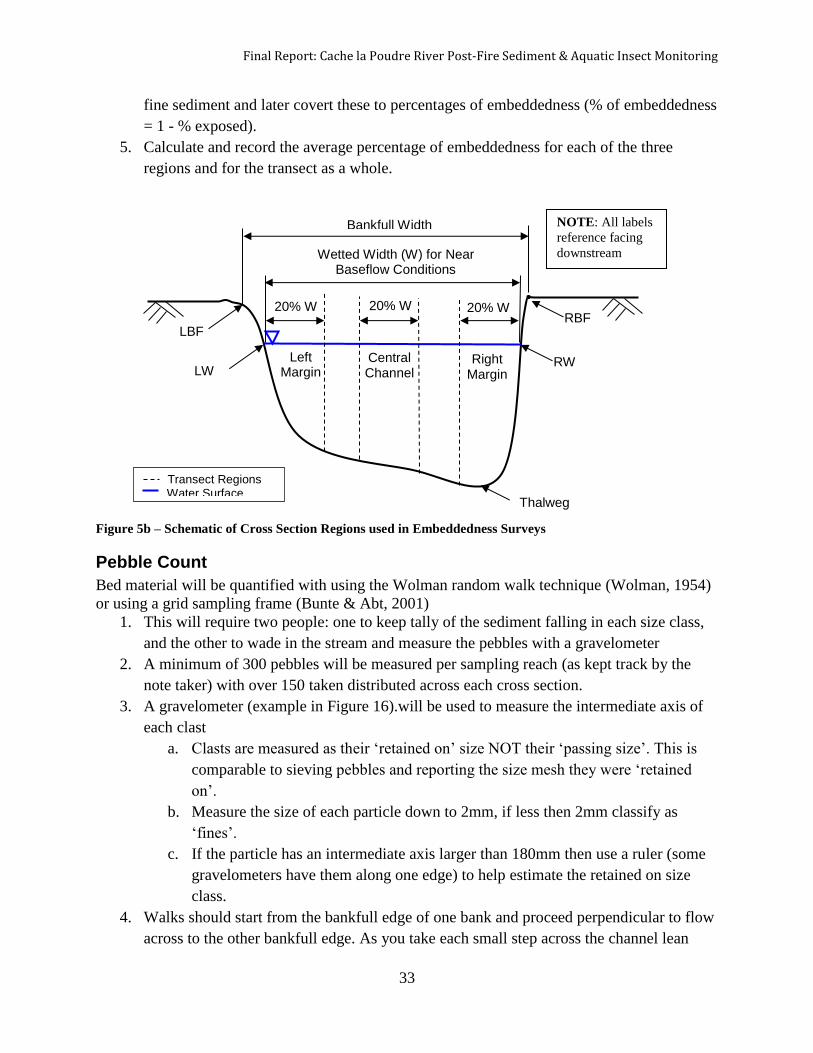
Figure 5b – Schematic of Cross Section Regions used in Embeddedness Surveys
Pebble Count
Bed material will be quantified with using the Wolman random walk technique (Wolman, 1954)
or using a grid sampling frame (Bunte & Abt, 2001)
1. This will require two people: one to keep tally of the sediment falling in each size class,
and the other to wade in the stream and measure the pebbles with a gravelometer
2. A minimum of 300 pebbles will be measured per sampling reach (as kept track by the
note taker) with over 150 taken distributed across each cross section.
3. A gravelometer (example in Figure 16).will be used to measure the intermediate axis of
each clast
a. Clasts are measured as their ‘retained on’ size NOT their ‘passing size’. This is
comparable to sieving pebbles and reporting the size mesh they were ‘retained
on’.
b. Measure the size of each particle down to 2mm, if less then 2mm classify as
‘fines’.
c. If the particle has an intermediate axis larger than 180mm then use a ruler (some
gravelometers have them along one edge) to help estimate the retained on size
class.
4. Walks should start from the bankfull edge of one bank and proceed perpendicular to flow
across to the other bankfull edge. As you take each small step across the channel lean
Transect Regions Water Surface
Wetted Width (W) for Near Baseflow Conditions
Right Margin
Left Margin
Bankfull Width
Thalweg
RW
RBF
LW
LBF
NOTE: All labels
reference facing
downstream
20% W 20% W 20% W
Central Channel

Final Report: Cache la Poudre River Post-Fire Sediment & Aquatic Insect Monitoring
34
down and with your eyes averted and index finger extended, measure the intermediate
axis of the first stone you touch
5. You may have to duck under bank-top vegetation or reach down through brush to get an
accurate count.
6. If large boulders are encountered that would typically fall under subsequent steps, do not
double count them, this practice produces serial correlation and bias towards large
particles.
Figure 16 – Gravelometer. Note the ruler
markings on the top edge for use on clasts larger
than 180mm.
Figure 17 - Intermediate axis of pebble
Macroinvertebrate Community – Hess Samples
Choose four sites for Hess samples. Two sites should be focused in riffle habitat, and two sites
should be focused in run habitat. Sites should all be focused in a section were substrate is not too
large and must be shallow enough so that Hess is not submerged, yet deep enough so that an
adequate amount of water is flowing through the sampler.
For Each Hess Sample:
Place the Hess in the desired location (avoiding any large/embedded rocks that will
disrupt a good seal)
Once the Hess is in place, rearrange any cobble that may be disrupting a seal with the
bottom. If there are multiple larger stones that are ½ way inside the sampler and ½ way
out, then move one rock in, and one rock out, etc. Try to “dig” the sampler into the
stream bed, forming a tight seal
- Using a Hess sampler with a 500 micron net, sample the chosen habitat for ~ 5-10
minutes
Disturb substrate 8-10 cm deep with “claw”
- Pick up cobble and rocks and use finger or brush to scrape rocks free of detritus,
biofilm, and macroinvertebrates letting this material collect in the Hess. Remove
Final Report: Cache la Poudre River Post-Fire Sediment & Aquatic Insect Monitoring
35
any large or obvious macroinvertebrates with fingers or forceps and release them
into the sampler.
- After any large, semi-embedded rocks are removed, then be sure to claw the
substrate around and underneath where the rock was laying.
- After ~ 5-10 minutes of scrubbing and clawing, remove Hess, careful to keep the
net facing opposite the direction of flow. Rinse all material along the side of the
net into collection container
Move to shore and detach collection container from Hess net and rinse matter into a sieve
or tray. Be sure to rinse the screen of the container, and the net into the sieve. Give the
net a good looking over for any clinging macroinvertebrates and remove with forceps,
then place into sieve.
Carefully pick the large pieces of detritus out of the sieve/tray, rinse off into sieve, and
discard.
May need to use tray to separate and discard very fine sand and gravel from the rest of
sample, then return to sieve.
The remaining sample can be rinsed down into “corner” of sieve and rinsed (with
ethanol) through a funnel into plastic Nalgene sample jar.
- The sample is then saturated in 95% ethanol.
- Samples will be labeled on the inside AND the outside with Project, Site, Date,
and Habitat & Series
Final Report: Cache la Poudre River Post-Fire Sediment & Aquatic Insect Monitoring
36
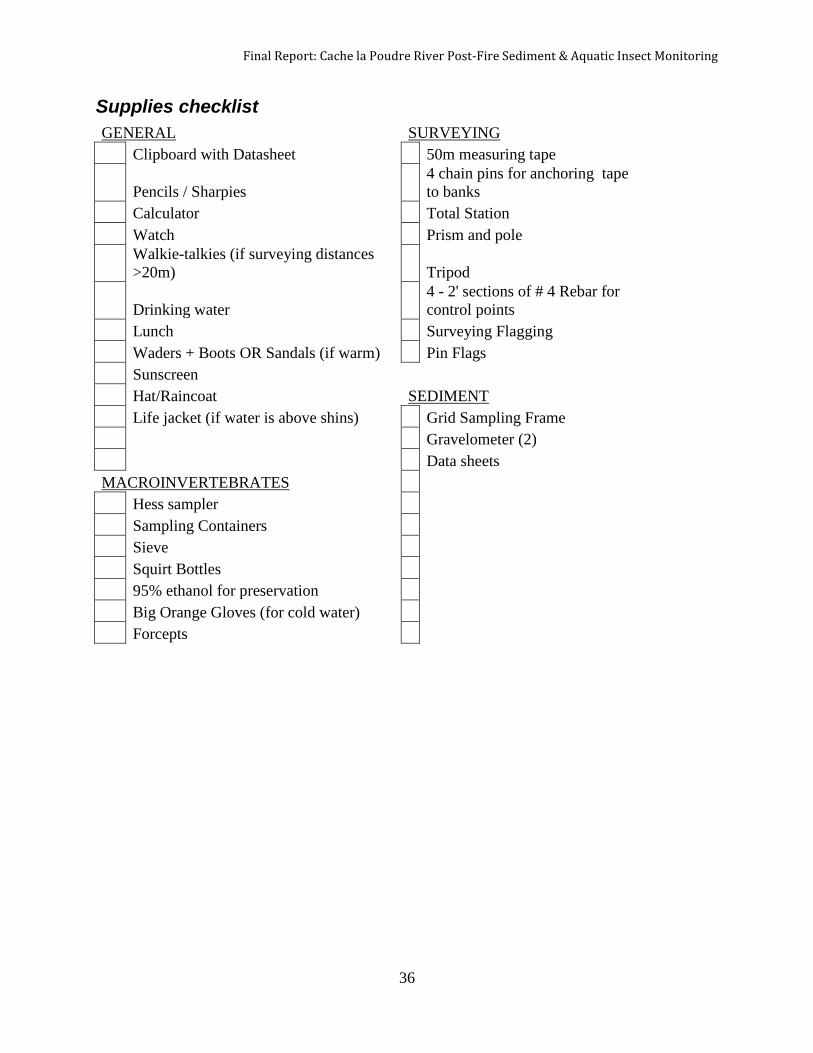
Supplies checklist
GENERAL SURVEYING
Clipboard with Datasheet 50m measuring tape
Pencils / Sharpies
4 chain pins for anchoring tape
to banks
Calculator Total Station
Watch Prism and pole
Walkie-talkies (if surveying distances
>20m) Tripod
Drinking water
4 - 2' sections of # 4 Rebar for
control points
Lunch Surveying Flagging
Waders + Boots OR Sandals (if warm) Pin Flags
Sunscreen
Hat/Raincoat SEDIMENT
Life jacket (if water is above shins) Grid Sampling Frame
Gravelometer (2)
Data sheets
MACROINVERTEBRATES
Hess sampler
Sampling Containers
Sieve
Squirt Bottles
95% ethanol for preservation
Big Orange Gloves (for cold water)
Forcepts
Final Report: Cache la Poudre River Post-Fire Sediment & Aquatic Insect Monitoring
37
BIBLIOGRAPHY
Bunte, K. and S. R. Abt (2001) Sampling surface and subsurface particle-size distributions in
wadable gravel- and cobble-bed streams for analyses in sediment transport, hydraulics,
and streambed monitoring. RMRS-GTR-74, U.S. Department of Agriculture, Forest
Service 450 pp.
Chapman, D. W. (1988) Critical review of variables used to define effects of fines in redds of
large salmonids. Transactions of the American Fisheries Society, 117(1), 1-21 pp.
Fitzpatrick, F. A. (1998) Revised methods for characterizing stream habitat in the National
Water-Quality Assessment Program. Water-Resources Investigations Report 98-4052,
U.S. Geological Survey, Washington, DC.
Gresswell, R. E. (1999) Fire and aquatic ecosystems in forested biomes of North America.
Transactions of the American fisheries society, 128(2), 193-221 pp.
Harrelson, C. C., C. L. Rawlins and J. P. Potyondy (1994) Stream channel reference sites: An
illustrated guide to field technique. General Technical Report RM-245, U.S. Department
of Agriculture, Forest Service, Rocky Mountain Forest and Range Experiment Station,
Fort Collins, CO. 61 pp.
Sennatt, K. M., N. L. Salant, C. E. Renshaw and F. J. Magilligan (2006) Assessment of methods
for measuring embeddedness: Application to sedimentation in flow regulated streams.
JAWRA Journal of the American Water Resources Association, 42(6), 1671-82 pp.
doi:10.1111/j.1752-1688.2006.tb06028.x.
Sherriff, R. L. and T. T. Veblen (2007) A spatially-explicit reconstruction of historical fire
occurrence in the ponderosa pine zone of the Colorado Front Range. Ecosystems, 10(2),
311-23 pp.
Suttle, K. B., M. E. Power, J. M. Levine and C. McNeely (2004) How fine sediment in riverbeds
impairs growth and survival of juvenile salmonids. Ecological Applications, 14(4), 969-
74 pp.
Waters, T. F. (1995) Sediment in streams - Sources, biological effects, and control. Vol
Monograph 7 American Fisheries Society. ISBN:
Whiting, P. J. (2002) Streamflow necessary for environmental maintenance. Annual Review of
Earth and Planetary Sciences, 30(1), 181-206 pp.
Wolman, M. G. (1954) A method of sampling coarse river-bed material. Transactions, American
Geophysical Union, 35(6), 951-6 pp.
Wood, P. J. and P. D. Armitage (1997) Biological effects of fine sediment in the lotic
environment. Environmental Management, 21(2), 203-17 pp.
Related Documents