Potential Use of Remote Sensing Techniques for Exploration of Iron Deposits in Western Sahara and Southwest of Algeria Andrea Ciampalini, 1,2 Francesca Garfagnoli, 1 Chiara DelVentisette, 1 and Sandro Moretti 1 Received 4 December 2012; accepted 9 May 2013 At present, Western Sahara is politically one of the most sensitive areas of the World. Its economic development could be achieved through the exploitation of mineral resources that can be found in the almost unexplored area administrated by the Saharawi Arab Democratic Republic. In this paper, we describe applications of known and cost-effective remote sensing techniques to detect and map areas containing mineral deposits, through the enhancement of Landsat ETM+ imageries. Several image processing techniques (false color composite, band ratioing, and principal component analysis) were used to highlight the presence of iron deposits. Two test areas were selected, one in Western Sahara and another one in Algeria. The occurrence of iron deposits in these test areas was assured using literature data for the Algerian test site and through a field campaign for the Western Sahara. There is good agreement between the ground truth data and the results obtained by the enhancements of the satellite images. Landsat images can be downloaded free of charge and their enhance- ments does not need expensive hardware or software tools. Therefore this technology could be transferred to the Saharawi technicians, enabling them to explore and manage the mineral resources of their own country independently. KEY WORDS: Mineral detection, iron exploitation, Western Sahara, developing country. INTRODUCTION Western Sahara is a rich country in terms of natural resources, the most important and abundant of which is represented by phosphate deposits extracted in the Bou Craa mines. The Bou Craa phosphate deposits played a large economic role in the Moroccan invasion of Western Sahara. An independent Western Sahara could be one of the biggest (the second after Morocco) exporters of phosphate of the world. Moreover, Western Sahara is characterized by the presence of other types of natural resources of interest for the Moroccan government. For instance, the Western Sahara coasts are particularly rich in fish. Over the last few years, the Moroccan government has invested about US$90 million in an ambitious plan to develop the fishing industry (Shelley 2006). Furthermore, the Moroccan state oil industry started investigating the presence of oil and gas offshore Western Sahara, after the recent discovery of this kind of resources offshore Mauritania (Brownfield and Charpentier 2006; Davison 2005; Sachse et al. 2011). The Moroc- can government invested at least US$ 1 billion in infrastructures since 1976 to favor the exploitation of the natural resources located in the controlled part of Western Sahara (Shelley 2006). Since the beginning of the war against Morocco, a consistent part of the Saharawis took refuge in the Tindouf province (South Algeria), creating several refugee camps. Western Sahara is presently divided into two parts by a wall (Moroccan wall), more than 2,700 km long. This wall is a defense line, which 1 Department of Earth Sciences, University of Firenze, Via La Pira 4, 50121, Florence, Italy. 2 To whom correspondence should be addressed; e-mail: andrea.ciampalini@unifi.it ȑ 2013 International Association for Mathematical Geology Natural Resources Research (ȑ 2013) DOI: 10.1007/s11053-013-9209-5

Welcome message from author
This document is posted to help you gain knowledge. Please leave a comment to let me know what you think about it! Share it to your friends and learn new things together.
Transcript
Potential Use of Remote Sensing Techniques for Explorationof Iron Deposits in Western Sahara and Southwest of Algeria
Andrea Ciampalini,1,2 Francesca Garfagnoli,1 Chiara DelVentisette,1 and Sandro Moretti1
Received 4 December 2012; accepted 9 May 2013
At present, Western Sahara is politically one of the most sensitive areas of the World. Itseconomic development could be achieved through the exploitation of mineral resources thatcan be found in the almost unexplored area administrated by the Saharawi Arab DemocraticRepublic. In this paper, we describe applications of known and cost-effective remote sensingtechniques to detect and map areas containing mineral deposits, through the enhancement ofLandsat ETM+ imageries. Several image processing techniques (false color composite, bandratioing, and principal component analysis) were used to highlight the presence of irondeposits. Two test areas were selected, one in Western Sahara and another one in Algeria.The occurrence of iron deposits in these test areas was assured using literature data for theAlgerian test site and through a field campaign for the Western Sahara. There is goodagreement between the ground truth data and the results obtained by the enhancements ofthe satellite images. Landsat images can be downloaded free of charge and their enhance-ments does not need expensive hardware or software tools. Therefore this technology couldbe transferred to the Saharawi technicians, enabling them to explore and manage themineral resources of their own country independently.
KEY WORDS: Mineral detection, iron exploitation, Western Sahara, developing country.
INTRODUCTION
Western Sahara is a rich country in terms ofnatural resources, the most important and abundantof which is represented by phosphate depositsextracted in the Bou Craa mines. The Bou Craaphosphate deposits played a large economic role inthe Moroccan invasion of Western Sahara. Anindependent Western Sahara could be one of thebiggest (the second after Morocco) exporters ofphosphate of the world. Moreover, Western Saharais characterized by the presence of other types ofnatural resources of interest for the Moroccangovernment. For instance, the Western Sahara
coasts are particularly rich in fish. Over the last fewyears, the Moroccan government has invested aboutUS$90 million in an ambitious plan to develop thefishing industry (Shelley 2006). Furthermore, theMoroccan state oil industry started investigatingthe presence of oil and gas offshore Western Sahara,after the recent discovery of this kind of resourcesoffshore Mauritania (Brownfield and Charpentier2006; Davison 2005; Sachse et al. 2011). The Moroc-can government invested at least US$ 1 billion ininfrastructures since 1976 to favor the exploitation ofthe natural resources located in the controlled part ofWestern Sahara (Shelley 2006).
Since the beginning of the war against Morocco,a consistent part of the Saharawis took refuge in theTindouf province (South Algeria), creating severalrefugee camps. Western Sahara is presently dividedinto two parts by a wall (Moroccan wall), more than2,700 km long. This wall is a defense line, which
1Department of Earth Sciences, University of Firenze, Via La Pira
4, 50121, Florence, Italy.2To whom correspondence should be addressed; e-mail:
� 2013 International Association for Mathematical Geology
Natural Resources Research (� 2013)
DOI: 10.1007/s11053-013-9209-5
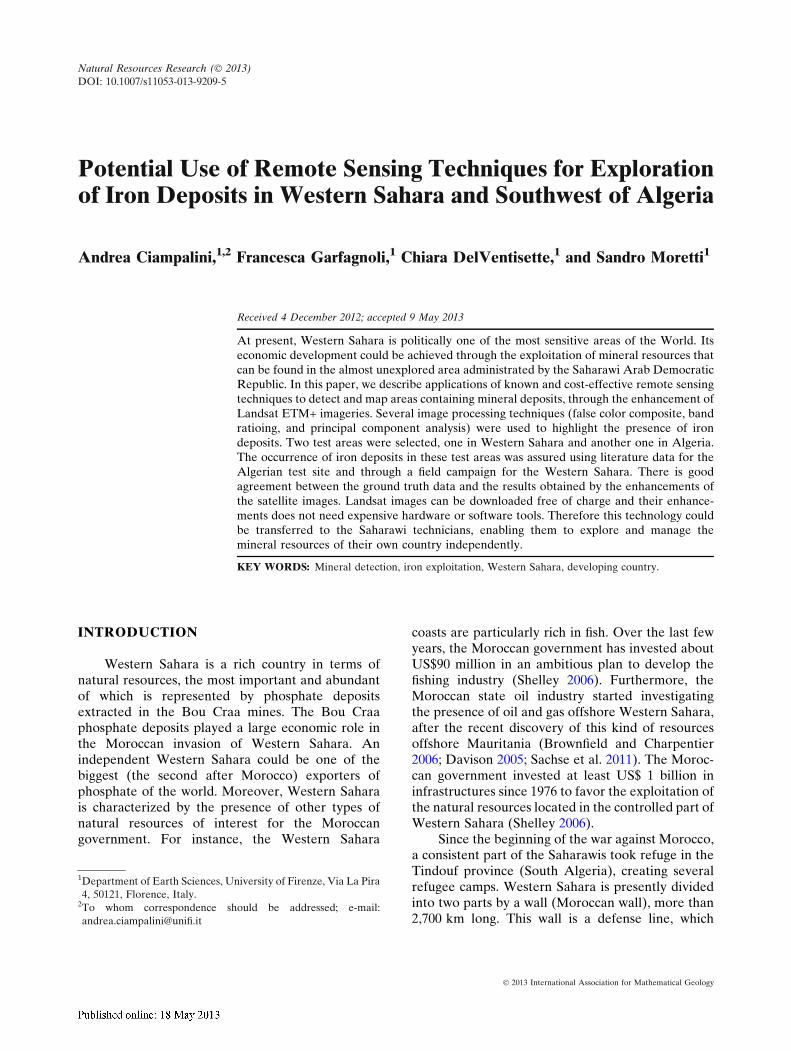
divides the Moroccan-occupied area in the central towestern part from the liberated territories in the east-ern part (Fig. 1) (Pazzanita 1994). The liberated terri-tories of Western Sahara (Fig. 1), which are currentlygoverned by the authorities of the self-proclaimedSahrawi Arab Democratic Republic (SADR), are al-most uninhabited and the people living there dependon pastoral nomadism (Alvarez Gila 2011). Tifarity,where about 70 persons live, is the most importantsettlement in these territories. The SADR governmentis planning an urban development of Tifarity torepopulate the liberated territories. The repopulationof the liberated territories requires support from stronghumanitarian aid, but the emancipation of the Saha-rawis can be facilitated by the exploitation of naturalresources present in the almost unexplored areaadministrated by the SADR government.
Even if most of the natural resources of Wes-tern Sahara, like the Bou Craa phosphate deposits,are located in the Moroccan-occupied areas, theliberated territories are also endowed with irondeposits (Guerrak 1991). Iron is one of the leastexpensive and most widely used metals, but therequirements of metals over the next 50 years isforecasted to be five times their global production(Skinner 2000). For this reason, the iron depositslocated to the north of Tifarity could represent aninteresting resource of iron and constitute an ele-ment of economic development.
Remote sensing is an inexpensive and rapidmethod, which can be used for the detection ofmineral resources, especially in arid environments
(Kaufmann 1988; Kenea and Haenisch 1996; Kenea1997; Sabins 1999; Liu 2000; Rokos et al. 2000;Rajesh 2008; Dogan 2008, 2009; Ranjbar et al. 2011;Honarmand et al. 2012). In this paper, we show anexample of how the application of Landsat ETM+imagery could represent a cheap opportunity fordeveloping countries, such as Western Sahara, toincrease knowledge about their territories in termsof available and exploitable mineral resources. Weperformed image enhancements using the ENVIimage processing software version 4.7 but some freesoftware such as TNTmips or ILWISS can be suc-cessfully used to further reduce costs. The retrievalof natural resources, however, is usually expensiveand it is hard for the Saharawi government to sup-port it.
GEOLOGICAL SETTING
The study area (Figs. 1, 2) is characterized by aPalaeozoic sedimentary sequence, outcroppingalong the flanks of the 800-km-long WSW–ENEoriented Tindouf Basin, filled with Cambrian toQuaternary deposits (Villeneuve 2005). Along itssouthern flank, the Tindouf succession overlaps theReguibat Shield (Guerrak 1988), formed byArchaean terrains older than 3.5 Ga, which representthe northern extension of the West Africa Craton(Potrel et al. 1996).
The Tindouf Basin is a broad, asymmetric, E–Wtrending polyhistory foreland basin. Its Palaeozoic
Figure 1. Location of the study areas.
Ciampalini, Garfagnoli, Del Ventisette, and Moretti
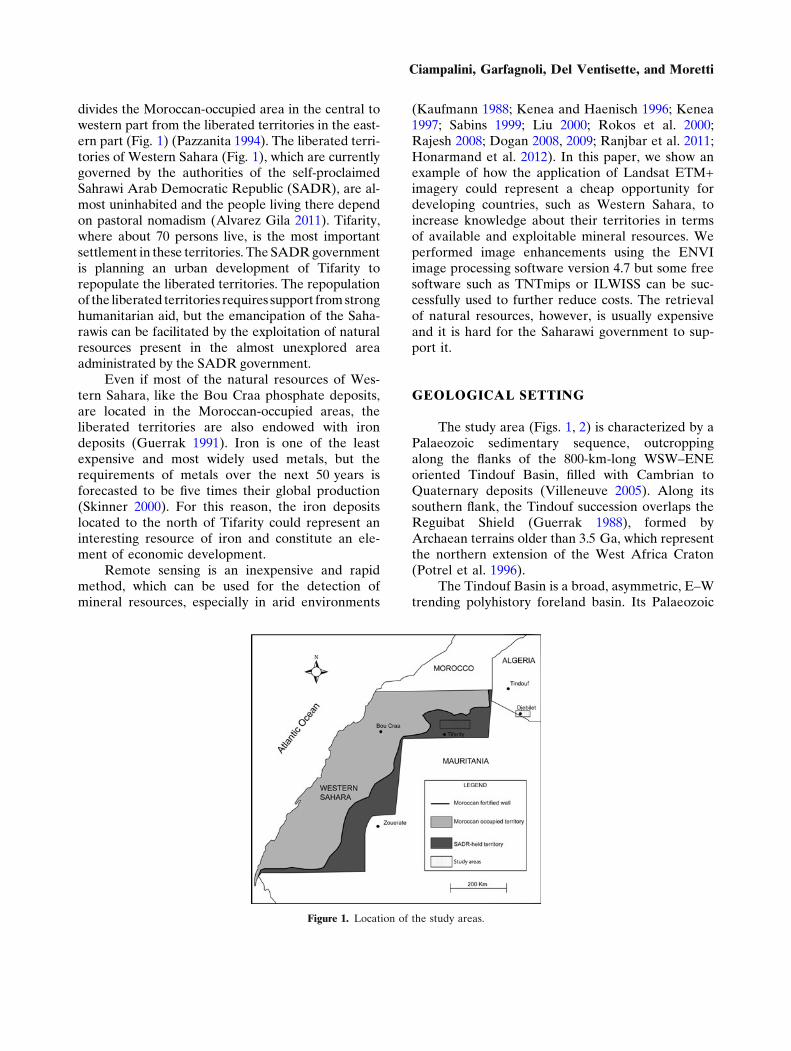
history involved pericratonic sedimentation on theborders of a large epicontinental sea. During Silu-rian to Devonian, a thick sequence of marine shales,sandstones, and limestones accumulated. In partic-ular, Lower Devonian deposits are characterized byooid-bearing ironstones located at the top of coars-ening upwards sequences (Ciampalini et al. 2012a,and references therein). In Lower Carboniferous,neritic and barrier facies sandstones were depositedin the northern extremities of the basin. These weresucceeded, in mid-Carboniferous, by a southeasterlyprograding fluvio-deltaic complex. Late Paleozoicsedimentation was the result of gentle uplift andconcomitant erosion of the Anti-Atlas region, result-ing in folding and cannibalism of earlier sedimentsand low-grade metamorphic rocks. The Hercynianstructures were reactivated during the transpressionaland compressional Alpine movements.
The stratigraphy and location of the majoroolitic iron deposits (hematite–chamosite–siderite-bearing formations with an oolitic texture and len-ticular beds) in Algeria are well-known (Guerrak1988, 1991; Guerrak and Chauvel 1985; Lubesederet al. 2009) and new field and remote sensing datafrom Western Sahara (about 350 km to the west ofthe Algerian test site), confirming the occurrence ofiron-bearing sandstones, were recently published(Ciampalini et al. 2012a, b). Two types of oolitic
iron-bearing sandstone deposits (OISs) were recog-nized by Guerrak (1988) near Djebilet (Algeria)within the (Pragian) sequence: (1) extensive irondeposits (EXID-OIS), covering tens to severalhundreds square kilometers but only a few meters inthickness and (2) local iron deposits (LOID-OIS)measuring about 30 m in thickness but of restrictedlateral extension. The LOID-OIS, containing morethan 10,000 million tonnes of ironstone reserves(1,500 million tonnes in the Silurian deposits and9,200 million tonnes in the Devonian deposits), areeconomically more important than the EXID-OIS.
From a mineralogical point of view, the irondeposits consist of magnetite, hematite, goethite,maghemite, chamosite, siderite, and pyrite (Guerrak1988). The source of iron contained within theDevonian deposits was probably located southwardof the study area, in the uplifted and relatively closeReguibat Shield. The mobilization of iron was likelymade possible by a change in the oxidation–reduc-tion conditions during the post-Silurian uplift phase(Guerrak 1991; Rajesh 2008), with consequentbleaching of the Precambrian rocks and precipita-tion of iron in deltaic depositional systems of theTindouf Basin to form iron-rich, originally chamo-sitic, ooids. The presence of abundant chamosite(iron silicate) indicates a low Eh environment,implying that intra-sedimentary processes of accre-
Figure 2. Geological sketch map of the study area (redrawn after Saadi et al. 1985).
Potential Use of Remote Sensing Techniques
tion developed around scattered grains dippedwithin iron-rich (chamosite) mud in calm waters(James and Van Houten 1979). These coated grainswere reworked and broken in agitated waters andwere partially oxidized, enabling the transformationof chamosite into hematite and of the latter intogoethite (Guerrak 1988).
MINERAL RESOURCES FOR STRATEGICPLANNING
The exploitation of natural resources is neededfor human existence and to contribute to the eco-nomic growth, especially in developing countries(Tilton 2000; Lambert 2001; Richard 2005; Upad-hyay et al. 2010). A mining project is usually com-posed of four fundamental steps:
� collection of data and information about thegeology of a selected area;
� detection and location of occurrence of min-eral targets (exploration), with delineation oftheir boundaries;
� determination of quality and quantity ofselected mineral targets (geological evalua-tion phase); and
� definition of extractable volume at a certainprofit (economic evaluation phase).
Therefore, from the early phases of civilization tothe modern society, mineral exploration can be con-sidered as the first step in economic development.Several factors influence the mineral supply system:geological, technical, economic and political issuesand constraints. Regional mineral exploration repre-sents the most important phase from a strategic pointof view, because it allows a better knowledge of thegeological properties of a country, using minerals asthe base for the identification of potential ore reserves(Snow and Mackenzie 1981). Exploration is often themost risky phase, as the investment could not becompensated by the economic return of a discovery.Thus, inexpensive methods of exploration are neededto reduce the failure of mineral deposits discovery,especially for developing countries. The governmentof Western Sahara needs low-cost methods of explo-ration, which can be easily taught to Saharawi tech-nicians, in order to improve the potentiality of theircountry in terms of mineral resources.
The work described in this paper is focused onprospection and exploration, with the attempt to
present a low-cost methodology—based on remotesensing techniques—for developing countries todetect and delineate iron deposits exposed on theEarth�s surface. This stage of the project requires basicgeological information of the area, but the study areais poorly known from a geological point of view. Themost accurate information about Western Sahara isrepresented by the 1:1,000,000 scale geological map ofMorocco (Saadi et al. 1985) (Fig. 2). Further geolog-ical information was inferred through correlation withthe same sedimentary sequence cropping out in thesouth of Algeria (Djebilet), where three iron districtsare present (Guerrak 1988). Then, a photo-lithologi-cal mapping of Western Sahara, based on enhance-ment of Landsat ETM+ imagery, was used to definethe extent of the sedimentary unit, cropping out inAlgeria and Western Sahara, which hosts the Algerianiron deposits near Djebilet (Ciampalini et al. 2012b).
METHODS AND RESULTS
Satellite and airborne multispectral or hyper-spectral sensors have been extensively used to eval-uate various features of land, sea, and atmosphere(Marzano and Visconti 2003; Barale and Gade 2008;Van der Meer et al. 2012). Remote sensing tech-niques are cheaper than field methods for the detec-tion and delineation of exploitable mineral resources,such as iron deposits exposed on the Earth�s surface,and they can be used to rapidly cover large areas. Theavailable sensors are characterized by different res-olution, accessibility and costs. Among them, multi-spectral sensors such as the Thematic Mapper (TM)and the Enhanced Thematic Mapper plus (ETM+),installed on the Landsat satellites, provide thecheapest images that can be used for mineral explo-ration because they are free. Landsat TM/ETM+ datahave been widely used to map iron-rich deposits suchas in Iran (Tangestani and Moore 2000), Sudan(Elsayed Zeinelabdein and Albiely 2008), Egypt(Ramadan and Kotny 2004), Australia (Rajesh 2008)and Canada (Daneshfar et al. 2006).
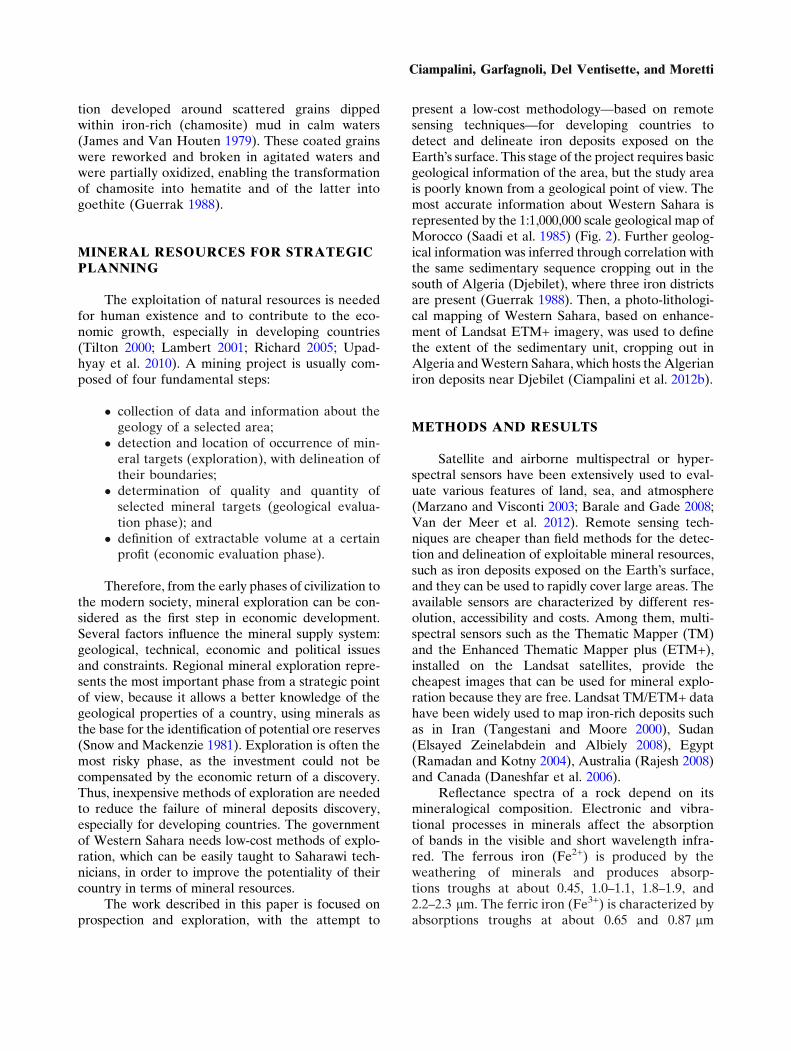
Reflectance spectra of a rock depend on itsmineralogical composition. Electronic and vibra-tional processes in minerals affect the absorptionof bands in the visible and short wavelength infra-red. The ferrous iron (Fe2+) is produced by theweathering of minerals and produces absorp-tions troughs at about 0.45, 1.0–1.1, 1.8–1.9, and2.2–2.3 lm. The ferric iron (Fe3+) is characterized byabsorptions troughs at about 0.65 and 0.87 lm
Ciampalini, Garfagnoli, Del Ventisette, and Moretti
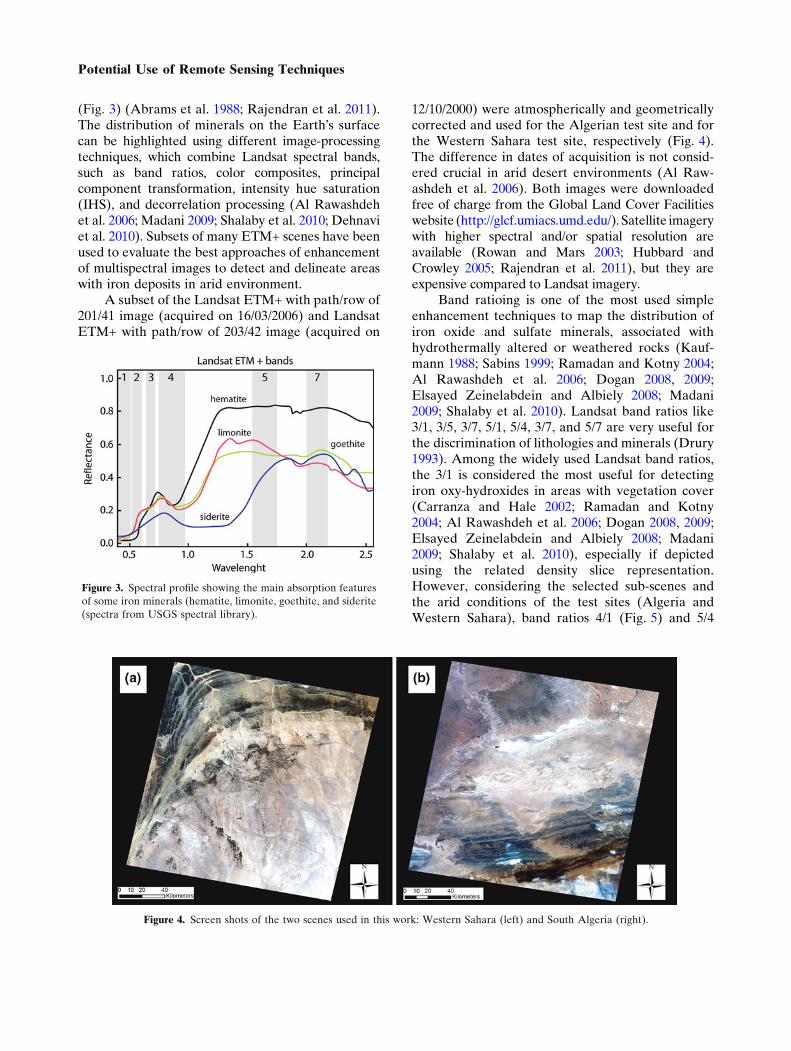
(Fig. 3) (Abrams et al. 1988; Rajendran et al. 2011).The distribution of minerals on the Earth�s surfacecan be highlighted using different image-processingtechniques, which combine Landsat spectral bands,such as band ratios, color composites, principalcomponent transformation, intensity hue saturation(IHS), and decorrelation processing (Al Rawashdehet al. 2006; Madani 2009; Shalaby et al. 2010; Dehnaviet al. 2010). Subsets of many ETM+ scenes have beenused to evaluate the best approaches of enhancementof multispectral images to detect and delineate areaswith iron deposits in arid environment.
A subset of the Landsat ETM+ with path/row of201/41 image (acquired on 16/03/2006) and LandsatETM+ with path/row of 203/42 image (acquired on
12/10/2000) were atmospherically and geometricallycorrected and used for the Algerian test site and forthe Western Sahara test site, respectively (Fig. 4).The difference in dates of acquisition is not consid-ered crucial in arid desert environments (Al Raw-ashdeh et al. 2006). Both images were downloadedfree of charge from the Global Land Cover Facilitieswebsite (http://glcf.umiacs.umd.edu/). Satellite imagerywith higher spectral and/or spatial resolution areavailable (Rowan and Mars 2003; Hubbard andCrowley 2005; Rajendran et al. 2011), but they areexpensive compared to Landsat imagery.
Band ratioing is one of the most used simpleenhancement techniques to map the distribution ofiron oxide and sulfate minerals, associated withhydrothermally altered or weathered rocks (Kauf-mann 1988; Sabins 1999; Ramadan and Kotny 2004;Al Rawashdeh et al. 2006; Dogan 2008, 2009;Elsayed Zeinelabdein and Albiely 2008; Madani2009; Shalaby et al. 2010). Landsat band ratios like3/1, 3/5, 3/7, 5/1, 5/4, 3/7, and 5/7 are very useful forthe discrimination of lithologies and minerals (Drury1993). Among the widely used Landsat band ratios,the 3/1 is considered the most useful for detectingiron oxy-hydroxides in areas with vegetation cover(Carranza and Hale 2002; Ramadan and Kotny2004; Al Rawashdeh et al. 2006; Dogan 2008, 2009;Elsayed Zeinelabdein and Albiely 2008; Madani2009; Shalaby et al. 2010), especially if depictedusing the related density slice representation.However, considering the selected sub-scenes andthe arid conditions of the test sites (Algeria andWestern Sahara), band ratios 4/1 (Fig. 5) and 5/4
Figure 3. Spectral profile showing the main absorption features
of some iron minerals (hematite, limonite, goethite, and siderite
(spectra from USGS spectral library).
Figure 4. Screen shots of the two scenes used in this work: Western Sahara (left) and South Algeria (right).
Potential Use of Remote Sensing Techniques
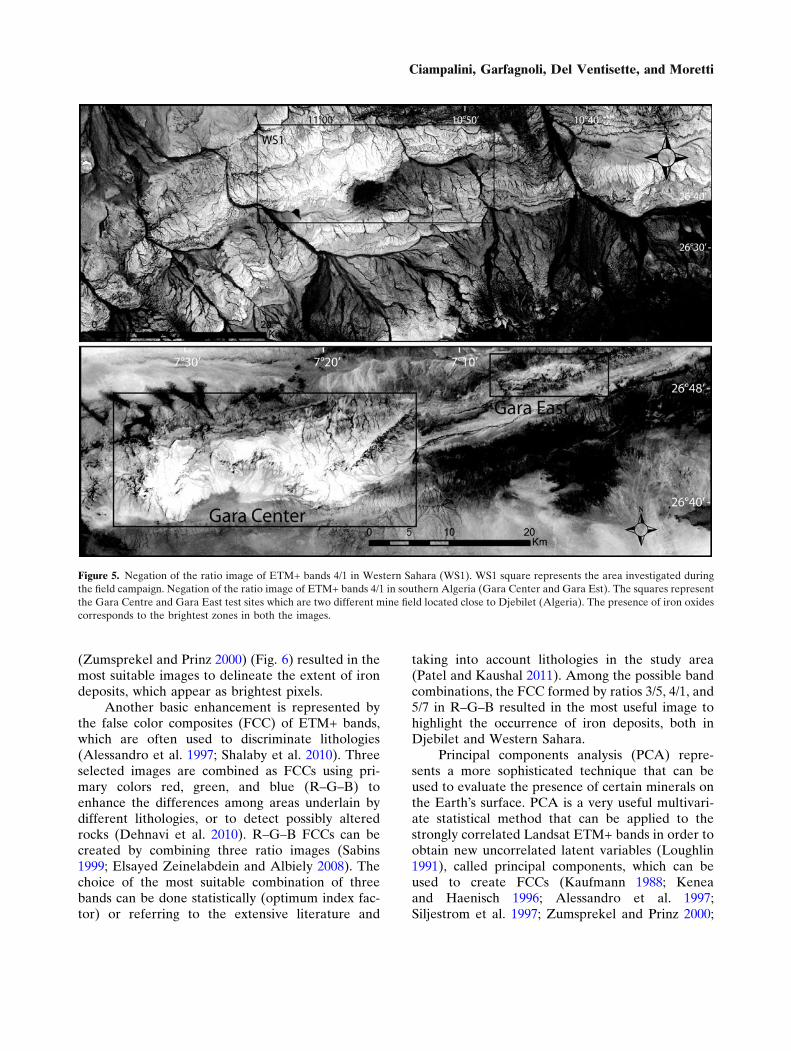
(Zumsprekel and Prinz 2000) (Fig. 6) resulted in themost suitable images to delineate the extent of irondeposits, which appear as brightest pixels.
Another basic enhancement is represented bythe false color composites (FCC) of ETM+ bands,which are often used to discriminate lithologies(Alessandro et al. 1997; Shalaby et al. 2010). Threeselected images are combined as FCCs using pri-mary colors red, green, and blue (R–G–B) toenhance the differences among areas underlain bydifferent lithologies, or to detect possibly alteredrocks (Dehnavi et al. 2010). R–G–B FCCs can becreated by combining three ratio images (Sabins1999; Elsayed Zeinelabdein and Albiely 2008). Thechoice of the most suitable combination of threebands can be done statistically (optimum index fac-tor) or referring to the extensive literature and
taking into account lithologies in the study area(Patel and Kaushal 2011). Among the possible bandcombinations, the FCC formed by ratios 3/5, 4/1, and5/7 in R–G–B resulted in the most useful image tohighlight the occurrence of iron deposits, both inDjebilet and Western Sahara.
Principal components analysis (PCA) repre-sents a more sophisticated technique that can beused to evaluate the presence of certain minerals onthe Earth�s surface. PCA is a very useful multivari-ate statistical method that can be applied to thestrongly correlated Landsat ETM+ bands in order toobtain new uncorrelated latent variables (Loughlin1991), called principal components, which can beused to create FCCs (Kaufmann 1988; Keneaand Haenisch 1996; Alessandro et al. 1997;Siljestrom et al. 1997; Zumsprekel and Prinz 2000;
Figure 5. Negation of the ratio image of ETM+ bands 4/1 in Western Sahara (WS1). WS1 square represents the area investigated during
the field campaign. Negation of the ratio image of ETM+ bands 4/1 in southern Algeria (Gara Center and Gara Est). The squares represent
the Gara Centre and Gara East test sites which are two different mine field located close to Djebilet (Algeria). The presence of iron oxides
corresponds to the brightest zones in both the images.
Ciampalini, Garfagnoli, Del Ventisette, and Moretti
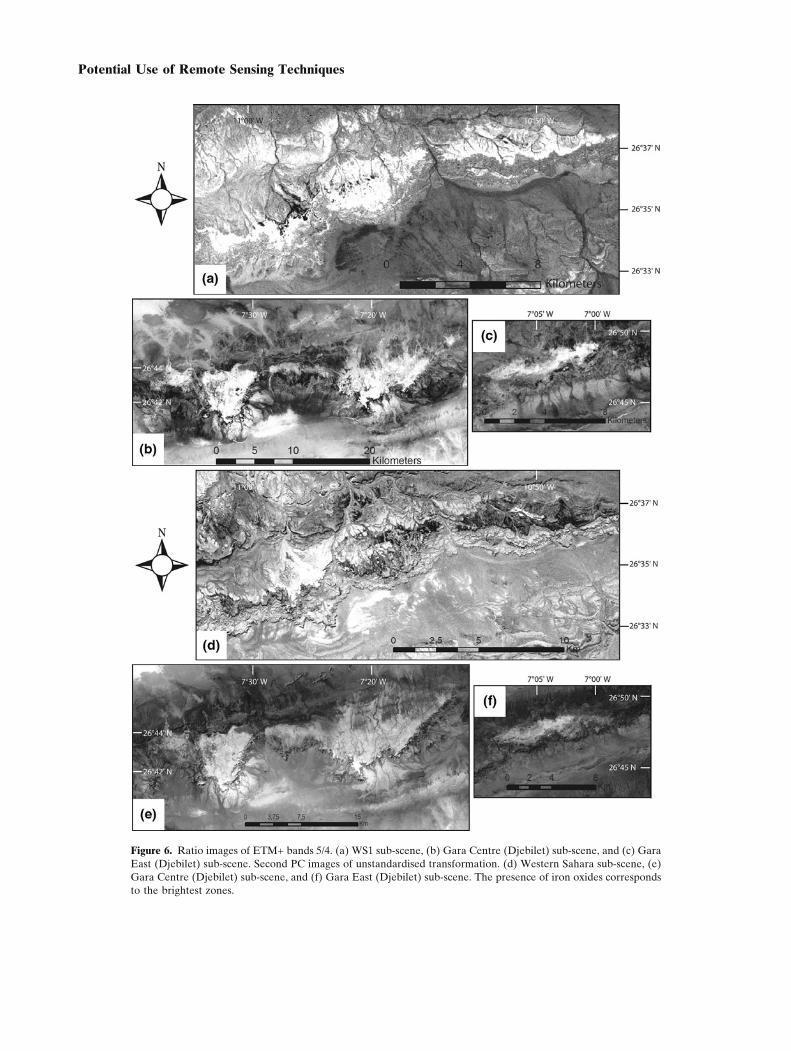
Figure 6. Ratio images of ETM+ bands 5/4. (a) WS1 sub-scene, (b) Gara Centre (Djebilet) sub-scene, and (c) Gara
East (Djebilet) sub-scene. Second PC images of unstandardised transformation. (d) Western Sahara sub-scene, (e)
Gara Centre (Djebilet) sub-scene, and (f) Gara East (Djebilet) sub-scene. The presence of iron oxides corresponds
to the brightest zones.
Potential Use of Remote Sensing Techniques
Al Rawashdeh et al. 2006). FCCs derived from PCAare considered effective for detecting areas con-taining by iron deposits (Loughlin 1991). Three dif-ferent approaches can be used to perform PCA: (1)unstandardized PCA, using the covariance matrix(Kaufmann 1988; Loughlin 1991; Kenea and Hae-nisch 1996; Alessandro et al. 1997; Zumsprekel andPrinz 2000; Al Rawashdeh et al. 2006; Aydal et al.2007); (2) standardized PCA, using the correlationmatrix (Kenea and Haenisch 1996); and (3) selectivePCA, using selected number of bands out of the sixavailable Landsat spectral bands (Loughlin 1991).Using the first approach, the second principalcomponents image (Fig. 6) highlights the extent ofiron deposits and the most useful FCC is representedby the PC4, PC3, PC2 in R–G–B, which allowshighlighting the iron deposits in the Djebilet testsite, whereas the most appropriate FCC for theWestern Sahara sub-scene is represented by thePC3, PC2, PC4 in R–G–B, which is generally suit-able for detection of iron oxides (Loughlin 1991).Using the standardized PCA, the FCC formed byPC4, PC2 and PC3 in R–G–B resulted in the mostuseful image to delimit the iron deposits in both thestudy areas. Bands 1, 3, 4, and 5 were chosen to mapiron ore deposits using the selective PCA becausethey are the most suitable to detect iron oxides,which exhibit strong absorption in ETM+ Landsatband 1 and high reflectance in bands 3 and 4(Loughlin 1991). The SWIR part of the spectrumwas not considered to investigate the presence ofiron oxides because it has been proved that VNIRbands of the Landsat ETM+ system represent abetter spectral range for mapping the surficial dis-tribution of iron minerals (Fraser 1991). PC1 in theSPCA represents albedo and topographic shadowing(Loughlin 1991). Band ratios 3/1 and 4/5 have theirmaximum contrasts in PC3 (Table 1), but visualinspection of this PC seems not to be useful tohighlight the presence of iron deposits. The mostuseful band ratio for mapping the iron deposits is 4/1, portraying them as bright pixels in the PC2 image
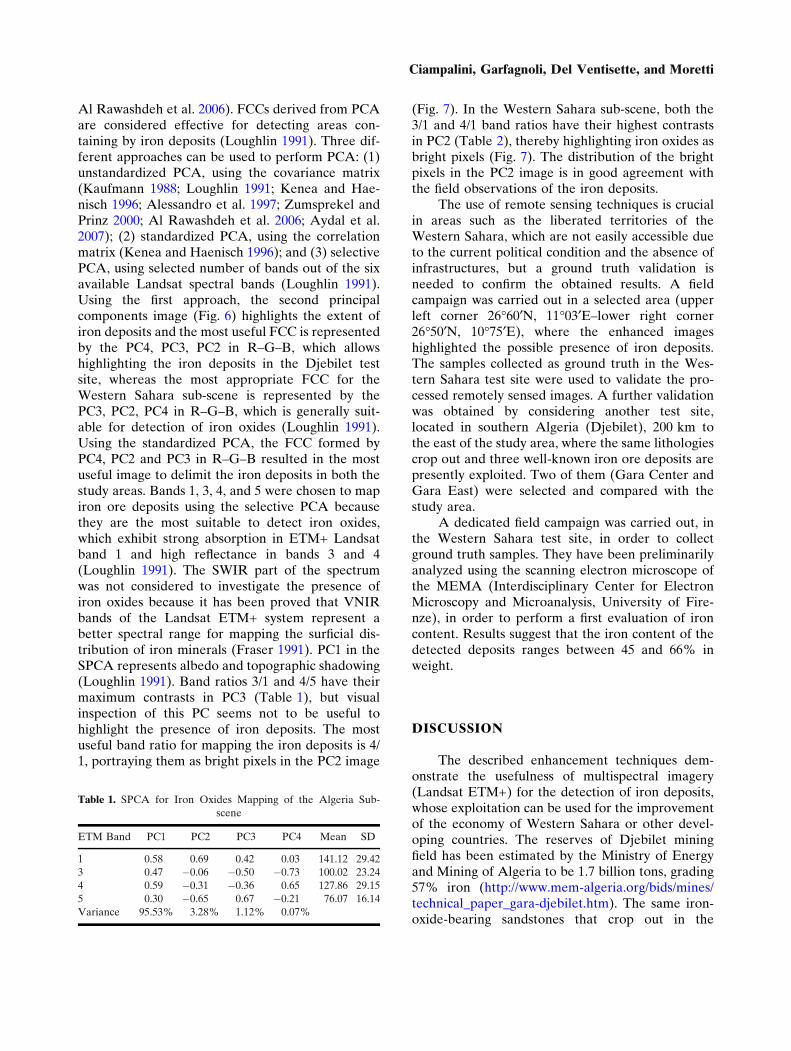
(Fig. 7). In the Western Sahara sub-scene, both the3/1 and 4/1 band ratios have their highest contrastsin PC2 (Table 2), thereby highlighting iron oxides asbright pixels (Fig. 7). The distribution of the brightpixels in the PC2 image is in good agreement withthe field observations of the iron deposits.
The use of remote sensing techniques is crucialin areas such as the liberated territories of theWestern Sahara, which are not easily accessible dueto the current political condition and the absence ofinfrastructures, but a ground truth validation isneeded to confirm the obtained results. A fieldcampaign was carried out in a selected area (upperleft corner 26�60¢N, 11�03¢E–lower right corner26�50¢N, 10�75¢E), where the enhanced imageshighlighted the possible presence of iron deposits.The samples collected as ground truth in the Wes-tern Sahara test site were used to validate the pro-cessed remotely sensed images. A further validationwas obtained by considering another test site,located in southern Algeria (Djebilet), 200 km tothe east of the study area, where the same lithologiescrop out and three well-known iron ore deposits arepresently exploited. Two of them (Gara Center andGara East) were selected and compared with thestudy area.
A dedicated field campaign was carried out, inthe Western Sahara test site, in order to collectground truth samples. They have been preliminarilyanalyzed using the scanning electron microscope ofthe MEMA (Interdisciplinary Center for ElectronMicroscopy and Microanalysis, University of Fire-nze), in order to perform a first evaluation of ironcontent. Results suggest that the iron content of thedetected deposits ranges between 45 and 66% inweight.
DISCUSSION
The described enhancement techniques dem-onstrate the usefulness of multispectral imagery(Landsat ETM+) for the detection of iron deposits,whose exploitation can be used for the improvementof the economy of Western Sahara or other devel-oping countries. The reserves of Djebilet miningfield has been estimated by the Ministry of Energyand Mining of Algeria to be 1.7 billion tons, grading57% iron (http://www.mem-algeria.org/bids/mines/technical_paper_gara-djebilet.htm). The same iron-oxide-bearing sandstones that crop out in the
Table 1. SPCA for Iron Oxides Mapping of the Algeria Sub-
scene
ETM Band PC1 PC2 PC3 PC4 Mean SD
1 0.58 0.69 0.42 0.03 141.12 29.42
3 0.47 �0.06 �0.50 �0.73 100.02 23.24
4 0.59 �0.31 �0.36 0.65 127.86 29.15
5 0.30 �0.65 0.67 �0.21 76.07 16.14
Variance 95.53% 3.28% 1.12% 0.07%
Ciampalini, Garfagnoli, Del Ventisette, and Moretti
Djebilet mining field also crop out in the test sitelocated in Western Sahara and their spectral fea-tures are very similar, probably due the comparableiron content between the two iron deposits. Theoccurrence of an analogous geological frameworkbetween the two test sites was confirmed through adedicated field campaign, assuring the existence ofiron-oxide-rich sandstones, representing a new pos-sible exploitable mining field in Western Sahara.
The application of an inexpensive remotesensing tool—Landsat ETM+ imagery—allowedidentification of an area of about 72 km2 in the lib-erated territories of the Western Sahara, which mayrepresent a possible new mining district. Enhance-
ment of Landsat ETM+ images involves simpleprocedures, which could easily be performed bytrained Saharawi technicians. Thus, this methodol-ogy could represent a very fast, cheap, and simplepreliminary way to investigate the potentialities oftheir own country, in terms of natural resources. Inthe event of positive results, as in this case, moresophisticated and accurate deposit studies can beplanned.
The development of the mining industry in theliberated territories of Western Sahara can lead tothe construction or expansion of an infrastructurenet, which is totally non-existent today. Infrastruc-tures are indispensible for a developing country,especially for Western Sahara, for the mobility ofboth people and goods. In particular, the exploitationof iron deposits can be considered economic if theextracted materials can be exported due to the pres-ence of roads, ports, and/or airports. Iron-ore relatedindustries can be also developed in this area. Severalproblems can be ascribed to the mining activity: it isfinancially expensive (substantial amount of funds),environmentally invasive (Lahiri-Dutt 2004) andsocially intrusive, but if it is successfully managed, the
Table 2. SPCA for Iron Oxides Mapping of the Western Sahara
Sub-scene
ETM Band PC1 PC2 PC3 PC4 Mean SD
1 0.65 0.76 0.07 �0.01 146.75 24.63
3 0.58 �0.46 �0.45 �0.50 95.38 22.00
4 0.47 �0.41 0.19 0.76 79.76 17.80
5 0.15 �0.21 0.87 �0.42 57.41 5.91
Variance 97.17% 2.43% 0.27% 0.13%
Figure 7. Second PC images of Selective Principal Component Analysis using bands 1, 3, 4, and 5. The presence of
iron oxides corresponds to the brightest zones. (a) Western Sahara sub-scene, (b) Gara Centre sub-scene, and (c)
Gara East sub-scene.
Potential Use of Remote Sensing Techniques
conversion of mineral endowment can lead to ageneral improvement of the national wealth, socialaspirations and to the reduction of environmentalproblems. However, although the liberated territo-ries of Western Sahara are rich in mineral resourcesas shown in this paper, their political situation and thecomplete lack of infrastructures are deterrents forprivate investments.
CONCLUSIONS
Remote sensing methods allow the rapidand low cost mapping of surface geological andmineralogical features. In this study, variousenhancements of Landsat ETM+ imagery (i.e., bandratios, false color composites, and principal compo-nent analysis) were used to detect and map irondeposits hosted in Devonian sedimentary rocks intwo test sites (South Algeria and Western Sahara).The first test site is located near the mining districtof Djebilet. The second test site is located inWestern Sahara, north to Tifarity and it was thetarget of a field campaign. Among the enhance-ment methods used, band ratio 4/1 resulted in themost effective image, especially if depicted with therelated density slicing as shown for both theAlgeria and the Western Sahara sub-scenes. Goodresults were obtained using false color composite 3/5, 4/1, and 5/7 in red, green, and blue, respectively.The usefulness of the bands 1 and 4 was confirmedby the use of principal component analysis to mapiron deposits hosted in sedimentary rocks in thetest sites. This analysis suggests that the PC2 is themost informative PC image because it contains thehighest contrast between band 1 and band 4.Among the available Landsat ETM+ bands, 1, 3, 4,and 5 were selected to test the selective principalcomponent analysis as the most appropriateenhancement method for iron oxide mapping. Theeigenvalue loadings confirms that the PC image,containing information regarding the maximumcontrast between band 1 and band 4, is the mostsuitable for detecting iron oxides in the studieddata subsets for the test sites.
This work demonstrates the usefulness of theenhancement of Landsat ETM+ imagery for thedetection of areas containing iron deposits. Thismethodology can be profitably applied to widerregions in Western Sahara and can provide inter-esting perspectives on the possibility of detectingnew exploitable iron deposits in arid environments.
The cost-effective procedure described above can beeasily used by Saharawi technicians to improve theknowledge of their territories in terms of mineralresources.
ACKNOWLEDGMENTS
This research was financed by Autostrade perL�Italia S.p.a. The authors are grateful to the staff ofthe SADR Government and to Fiorella Bendonifrom NGO Ban Slout Larbi for providing generalsupport during the field work. We are very gratefulto H.M Rajesh, to an anonymous reviewer and tothe Editor-in-Chief J. Carranza for making manyhelpful suggestions that improved the manuscript.
REFERENCES
Abrams, M. J., Rothery, D. A., & Pontual, A. (1988). Mapping inthe Oman ophiolite using enhanced Landsat ThematicMapper images. Tectonophysics, 151, 387–401.
Al Rawashdeh, S., Saleh, B., & Hamzah, M. (2006). The use ofremote sensing technology in geological investigation andmineral detection in El Azraq-Jordan. Cybergeo: EuropeanJournal of Geography, Systemes, Modellisation, Geostatis-tiques. doi:10.4000/cybergeo.2856. http://cybergeo.revues.org/2856.
Alessandro, V., Pieruccini, U., Pranzini, E., Righini, G., &Salvestrini, L. (1997). Elaborazione ed interpretazione diimmagini Landsat TM per la discriminazione litologica inun area marginale dello ‘‘Zaire Craton’’ in Angola. RivistaItaliana di Telerilevamento., 9, 43–52.
Alvarez Gila, O. (2011). Western Sahara: Migration, exile andenvironment. International Migration, 49, 146–163.
Aydal, D., Arda, E., & Dumanliar, O. (2007). Application of theCrosta technique for alteration mapping of granitoidic rocksusing ETM+ data: Case study from eastern Tauride belt (SETurkey). International Journal of Remote Sensing, 28, 3895–3913.
Barale, V., & Gade, M. (Eds.). (2008). Remote sensing of theEuropean Seas. Heidelberg: Springer.
Brownfield, M. E., & Charpentier, R. R. (2006). Geology and totalpetroleum systems of the Gulf of Guinea Province of WestAfrica. U.S. Geological Survey Bulletin. 2207-C.
Carranza, E. J. M., & Hale, M. (2002). Mineral imaging withLandsat Thematic Mapper data for hydrothermal alterationmapping in heavily vegetated terrane. International Journalof Remote Sensing, 23(22), 4827–4852.
Ciampalini, A., Garfagnoli, F., Antonielli, B., Del Ventisette, C.,& Moretti, S. (2012a). Photo-lithological map of the southernflank of the Tindouf Basin (Western Sahara). Journal ofMaps, 8(4), 453–464.
Ciampalini, A., Garfagnoli, F., Antonielli, B., Moretti, S., &Righini, G. (2012b). Remote sensing techniques usingLandsat ETM+ applied to the detection of iron ore depositsin Western Africa. Arabian Journal of Geosciences,. doi:10.1007/s12517-012-0725-0.
Daneshfar, B., Desrochers, A., & Budkewitsch, P. (2006). Min-eral-potential mapping for MVT deposits with limited data
Ciampalini, Garfagnoli, Del Ventisette, and Moretti
sets using landsat data and geological evidence in the BordenBasin, Northern Baffin Island, Nanuvut, Canada. NaturalResources Research, 15(3), 129–149.
Davison, I. (2005). Central Atlantic margin basins of North WestAfrica; Geology and hydrocarbon potential (Morocco toGuinea). Journal of African Earth Sciences, 43, 254–274.
Dehnavi, A. G., Sarikhani, R., & Nagaraju, D. (2010). Imageprocessing and analysis of mapping alteration zones in envi-ronmental research, East of Kurdistan, Iran. World AppliedSciences Journal, 11, 278–283.
Dogan, H. M. (2008). Applications of remote sensing and Geo-graphic Information Systems to assess ferrous minerals andiron oxide of Tokat province in Turkey. International Journalof Remote Sensing, 29, 221–233.
Dogan, H. M. (2009). Mineral composite assessment of KelkitRiver Basin in Turkey by means of remote sensing. Journalof Earth System Science, 118, 701–710.
Drury, S. A. (1993). Image interpretation in geology (2nd ed.).London: Chapman & Hall.
Elsayed Zeinelabdein, K. A., & Albiely, A. I. (2008). Ratio imageprocessing techniques: a prospecting tool for mineral depos-its, Red Sea Hills, NE Sudan. International Archives ofPhotogrammetry, Remote Sensing and Spatial InformationSciences, 37, 1295–1298.
Fraser, S. J. (1991). Discrimination and identification of ferric oxi-des using satellite Thematic Mapper data: A Newman casestudy. International Journal of Remote Sensing, 12(3), 635–641.
Guerrak, S. (1988). Geology of the Early Devonian oolitic ironore of the Gara Djebilet field, Saharan Platform, Algeria. OreGeology Review, 3, 333–358.
Guerrak, S. (1991). Paleozoic patterns of oolitic ironstone sedi-mentation in the Sahara. Journal of African Earth Sciences,12, 31–39.
Guerrak, S., & Chauvel, J. J. (1985). Les mineralisations ferriferesdu Sahara Algerien. Le gisement de fer oolithique de Mec-heri Abdelaziz (basin de Tindouf). Mineralium Deposita, 20,249–259.
Honarmand, M., Ranjbar, H., & Shahabpour, B. (2012). Appli-cation of principal component analysis and spectral anglemapper in the mapping of hydrothermal alteration in theJebal-Barez area, southeastern Iran. Resource Geology,62(2), 119–139.
Hubbard, B., & Crowley, J. K. (2005). Mineral mapping on theChilean–Bolivian Altiplano using co-orbital ALI, ASTERand Hyperion imagery: Data dimensionality issues andsolutions. Remote Sensing of Environment, 99, 173–186.
James, H. L., & Van Houten, F. B. (1979). Miocene goethitic andchamositic oolite: Northeastern Colombia. Sedimentology,26, 125–133.
Kaufmann, H. (1988). Mineral exploration along the Aqaba-Levant Structure by use of TM-data. Concepts, processingand results. International Journal of Remote Sensing, 9, 1639–1658.
Kenea, N. H. (1997). Improved geological mapping using LandsatTM data, Southern Red Sea Hills, Sudan: PC and IHS dec-orrelation stretching. International Journal of Remote Sens-ing, 18, 1233–1244.
Kenea, N. H., & Haenisch, H. (1996). Principal componentanalyses for lithologic and alteration mappings: Examplesfrom the Red Sea Hills, Sudan. International Archives ofPhotogrammetry, Remote Sensing and Spatial InformationSciences, 31, 271–275.
Lahiri-Dutt, K. (2004). Informality in mineral resources man-agement in Asia: Raising questions relating to communityeconomies and sustainable development. Natural ResourcesForum, 28, 123–132.
Lambert, I. B. (2001). Mining and sustainable development:Considerations for minerals supply. Natural Resources For-um, 25, 275–284.
Liu, J. G. (2000). Evaluation of Landsat-7 ETM+ panchromaticband for image fusion with multispectral bands. NaturalResources Research, 9, 269–276.
Loughlin, W. P. (1991). Principal component analysis for alter-ation mapping. Photogrammetric Engineering & RemoteSensing, 57, 1163–1169.
Lubeseder, S., Redfern, J., & Boutib, L. (2009). Mixed siliciclas-tic–carbonate shelf sedimentation—Lower Devonian sequencesof the SWAnti-Atlas, Morocco. Sedimentary Geology, 215,13–32.
Madani, A. A. (2009). Utilization of Landsat ETM+ data formapping gossans and iron rich zones exposed at Bahrah area,Western Arabian Shield, Saudi Arabia. Journal of KingAbdulaziz University: Earth Sciences, 20, 25–49.
Marzano, F. S., & Visconti, G. (Eds.). (2003). Remote sensing ofatmosphere and ocean from space: Models, instruments andtechniques. New York: Springer.
Patel, N., & Kaushal, B. (2011). Classification of features selectedthrough Optimum Index Factor (OIF) for improving classi-fication accuracy. Journal of Forestry Research, 22, 99–105.
Pazzanita, A. G. (1994). Morocco versus Polisario: A politicalinterpretation. The Journal of Modern African Studies, 32(2),265–278.
Potrel, A., Pecaut, J., Fanning, C. M., Auvray, B., Burg, J. P., &Caruba, C. (1996). Old terranes (3.5 Ga) in the West AfricanCraton, Mauritania. Journal of Geological Society of London,153, 507–510.
Rajendran, S., Thirunavukkarasu, A., Balamurugan, G., &Shankar, K. (2011). Discrimination of iron ore deposits ofgranulite terrain of Southern Peninsular India using ASTERdata. Journal of Asian Earth Sciences, 41, 99–106.
Rajesh, H. M. (2008). Mapping Proterozoic unconformity-relateduranium deposits in the Rockhole area, Northern Territory,Australia using Landsat ETM+. Ore Geology Reviews, 33,382–396.
Ramadan, T. M., & Kotny, A. (2004). Mineralogical and struc-tural characterization of alteration zones detected by orbitalremote sensing at Shalatein District, SE Desert, Egypt.Journal of African Earth Sciences, 40, 89–99.
Ranjbar, H., Masoumi, F., & Carranza, E. J. M. (2011). Evalua-tion of geophysics and spaceborne multispectral data foralteration mapping in the Sar Chesmeh mining area, Iran.International Journal of Remote Sensing, 32, 3309–3327.
Richard, J. P. (2005). Challenges for sustainable mineral resourcesdevelopment in the 21st Century. Resources Geology, 55(2),131–137.
Rokos, D., Argialas, D., Mavrantza, R., St. Seymour, K.,Vamvoukakis, C., Lamera, S., et al. (2000). Structuralanalysis for gold mineralization using remote sensing andgeochemical techniques in a GIS environment: Island ofLesvos, Hellas. Natural Resources Research, 9, 277–293.
Rowan, L. C., & Mars, J. C. (2003). Lithologic mapping in theMountain Pass, California area using Advanced SpaceborneThermal Emission and Reflection Radiometer (ASTER)data. Remote Sensing of Environment, 84, 350–366.
Saadi, M., Hilali, E. A., Bensaıd, M., Boudda, A., & Dahmani, M.(1985). Carte Geologique du Maroc, echelle 1/1000000, Edi-tion du Service Geologique du Maroc, Notes et Memoires n�260.
Sabins, F. F. (1999). Remote sensing for mineral exploration. OreGeology Reviews, 14, 157–183.
Sachse, V. F., Littke, R., Heim, S., Kluth, O., Schober, J., Boutib, L.,et al. (2011). Petroleum source rocks of the Tafaya Basin andadjacent areas, Morocco. Organic Geochemistry, 42, 209–227.
Shalaby, M. H., Bishta, A. Z., Roz, M. E., & Zalaky, M. A. (2010).Integration of geologic and remote sensing studies for thediscovery of uranium mineralization in some granite plutons,Eastern Desert, Egypt. Journal of King Abdulaziz University:Earth Sciences, 21, 1–25.
Potential Use of Remote Sensing Techniques
Shelley, T. (2006). What future for Africa�s last colony?. London:Zed Books.
Siljestrom, P. A., Moreno, A., Vikgren, K., & Caceres, L. M. (1997).Technical note: The application of selective principal compo-nent analysis (SPCA) to Thematic Mapper (TM) image for therecognition of geomorphologic features configuration. Interna-tional Journal of Remote Sensing, 18, 3843–3852.
Skinner, B. J. (2000). Keynote presentation on 31st InternationalGeological Congress, Rio de Janeiro. August 2000.
Snow, G., & Mackenzie, B. W. (1981). The environment ofexploration: Economic, organizational and social constraints.In B. J. Skinner (Ed.), Economic Geology: Seventy-fifthanniversary volume (pp. 871–896). Littleton: Society of Eco-nomic Geologists.
Tangestani, M. H., & Moore, F. (2000). Iron oxides and hydroxylenhancement using the Crosta method: A case study from theZagros Belt, Fars Province, Iran. International Journal ofApplied Earth Observation and Geoinformation, 2, 140–146.
Tilton, J. E. (2000). Mining and public policy: An alternative view.Natural Resources Forum, 24, 49–52.
Upadhyay, R. K., Venkatesh, A. S., & Roy, S. (2010). Mineral-ogical characteristics of iron ores in Joda and Khondbondareas in Eastern India with implications on beneficiation.Resources Geology, 60, 203–211.
Van der Meer, F. D., van der Werf, H. M. A., van Ruitenbeek, F.J. A., Hecker, C. A., Bakker, W. H., Noomen, M. F., et al.(2012). Multi- and hyperspectral geologic remote sensing: Areview. International Journal of Applied Earth Observationand Geoinformation, 14, 112–128.
Villeneuve, M. (2005). Paleozoic basins in West Africa andMauritanide thrust belt. Journal of African Earth Sciences,43, 166–195.
Zumsprekel, H., & Prinz, T. (2000). Computer-enhanced multi-spectral remote sensing data: A useful tool for the geologicalmapping of Archean terrains in (semi)arid environments.Computer & Geosciences, 26, 87–100.
Ciampalini, Garfagnoli, Del Ventisette, and Moretti
Related Documents